Tarrant County Food Desert Project Nutrition Environment Assessment Report Prepared by Ann Salyer‐Caldwell, MPH, RD, LD Associate Director Jing Chen, MPH, CPH Project Manager, Statistician Michelle S. Markham, MS GIS Analyst Tarrant County Public Health, Fort Worth, TX September 30, 2013 Acknowledgements Special thanks to Tarrant County Medical Reserve Corps for volunteering in data collection for this project; and special thanks to Christina Thi, Obesity Prevention Coordinator, and Marianna Gomez, Monitoring and Evaluation Specialist from Texas Department of State Health Services for their review of the document.

Welcome message from author
This document is posted to help you gain knowledge. Please leave a comment to let me know what you think about it! Share it to your friends and learn new things together.
Transcript

Tarrant County Food Desert Project Nutrition Environment Assessment Report
Prepared by Ann Salyer‐Caldwell, MPH, RD, LD
Associate Director
Jing Chen, MPH, CPH
Project Manager, Statistician
Michelle S. Markham, MS
GIS Analyst
Tarrant County Public Health, Fort Worth, TX
September 30, 2013
Acknowledgements Special thanks to Tarrant County Medical Reserve Corps for volunteering in data collection for this
project; and special thanks to Christina Thi, Obesity Prevention Coordinator, and Marianna Gomez,
Monitoring and Evaluation Specialist from Texas Department of State Health Services for their review of
the document.
2
Contents
1. INTRODUCTION ‐‐‐‐‐‐‐‐‐‐‐‐‐‐‐‐‐‐‐‐‐‐‐‐‐‐‐‐‐‐‐‐‐‐‐‐‐‐‐‐‐‐‐‐‐‐‐‐‐‐‐‐‐‐‐‐‐‐‐‐‐‐‐‐‐‐‐‐‐‐‐‐‐‐‐‐‐‐‐‐‐‐‐‐‐‐‐‐‐‐‐‐‐‐‐‐‐‐‐‐‐3
2. METHODS ‐‐‐‐‐‐‐‐‐‐‐‐‐‐‐‐‐‐‐‐‐‐‐‐‐‐‐‐‐‐‐‐‐‐‐‐‐‐‐‐‐‐‐‐‐‐‐‐‐‐‐‐‐‐‐‐‐‐‐‐‐‐‐‐‐‐‐‐‐‐‐‐‐‐‐‐‐‐‐‐‐‐‐‐‐‐‐‐‐‐‐‐‐‐‐‐‐‐‐‐‐‐‐‐‐‐‐‐‐5
2.1 GIS and Mapping Access ‐‐‐‐‐‐‐‐‐‐‐‐‐‐‐‐‐‐‐‐‐‐‐‐‐‐‐‐‐‐‐‐‐‐‐‐‐‐‐‐‐‐‐‐‐‐‐‐‐‐‐‐‐‐‐‐‐‐‐‐‐‐‐‐‐‐‐‐‐‐‐‐‐‐‐‐‐‐‐‐‐‐‐5
2.2 Samples: All Grocery and Convenience Stores within ZIP Codes Determined as Food
Deserts ‐‐‐‐‐‐‐‐‐‐‐‐‐‐‐‐‐‐‐‐‐‐‐‐‐‐‐‐‐‐‐‐‐‐‐‐‐‐‐‐‐‐‐‐‐‐‐‐‐‐‐‐‐‐‐‐‐‐‐‐‐‐‐‐‐‐‐‐‐‐‐‐‐‐‐‐‐‐‐‐‐‐‐‐‐‐‐‐‐‐‐‐‐‐‐‐‐‐‐‐‐‐‐‐‐‐5
2.3 Survey Methods ‐‐‐‐‐‐‐‐‐‐‐‐‐‐‐‐‐‐‐‐‐‐‐‐‐‐‐‐‐‐‐‐‐‐‐‐‐‐‐‐‐‐‐‐‐‐‐‐‐‐‐‐‐‐‐‐‐‐‐‐‐‐‐‐‐‐‐‐‐‐‐‐‐‐‐‐‐‐‐‐‐‐‐‐‐‐‐‐‐‐‐‐‐‐6
2.3.1 TxNEA‐S Survey Tool ‐‐‐‐‐‐‐‐‐‐‐‐‐‐‐‐‐‐‐‐‐‐‐‐‐‐‐‐‐‐‐‐‐‐‐‐‐‐‐‐‐‐‐‐‐‐‐‐‐‐‐‐‐‐‐‐‐‐‐‐‐‐‐‐‐‐‐‐‐‐‐‐‐‐‐‐‐‐6
2.3.2 Survey Administration and Analysis ‐‐‐‐‐‐‐‐‐‐‐‐‐‐‐‐‐‐‐‐‐‐‐‐‐‐‐‐‐‐‐‐‐‐‐‐‐‐‐‐‐‐‐‐‐‐‐‐‐‐‐‐‐‐‐‐‐‐6
2.3.3 Survey Analysis ‐‐‐‐‐‐‐‐‐‐‐‐‐‐‐‐‐‐‐‐‐‐‐‐‐‐‐‐‐‐‐‐‐‐‐‐‐‐‐‐‐‐‐‐‐‐‐‐‐‐‐‐‐‐‐‐‐‐‐‐‐‐‐‐‐‐‐‐‐‐‐‐‐‐‐‐‐‐‐‐‐‐6‐7
3. RESULTS ‐‐‐‐‐‐‐‐‐‐‐‐‐‐‐‐‐‐‐‐‐‐‐‐‐‐‐‐‐‐‐‐‐‐‐‐‐‐‐‐‐‐‐‐‐‐‐‐‐‐‐‐‐‐‐‐‐‐‐‐‐‐‐‐‐‐‐‐‐‐‐‐‐‐‐‐‐‐‐‐‐‐‐‐‐‐‐‐‐‐‐‐‐‐‐‐‐‐‐‐‐‐‐‐‐‐‐8‐36
3.1 Overview ‐‐‐‐‐‐‐‐‐‐‐‐‐‐‐‐‐‐‐‐‐‐‐‐‐‐‐‐‐‐‐‐‐‐‐‐‐‐‐‐‐‐‐‐‐‐‐‐‐‐‐‐‐‐‐‐‐‐‐‐‐‐‐‐‐‐‐‐‐‐‐‐‐‐‐‐‐‐‐‐‐‐‐‐‐‐‐‐‐‐‐‐‐‐‐‐‐‐‐‐‐‐8
3.1.1 Number of Stores Surveyed ‐‐‐‐‐‐‐‐‐‐‐‐‐‐‐‐‐‐‐‐‐‐‐‐‐‐‐‐‐‐‐‐‐‐‐‐‐‐‐‐‐‐‐‐‐‐‐‐‐‐‐‐‐‐‐‐‐‐‐‐‐‐‐‐‐‐‐‐8
3.1.2 Convenience Store Percentage in Each ZIP Code ‐‐‐‐‐‐‐‐‐‐‐‐‐‐‐‐‐‐‐‐‐‐‐‐‐‐‐‐‐‐‐‐‐‐‐‐‐‐‐‐‐‐8
3.2 Food Availability ‐‐‐‐‐‐‐‐‐‐‐‐‐‐‐‐‐‐‐‐‐‐‐‐‐‐‐‐‐‐‐‐‐‐‐‐‐‐‐‐‐‐‐‐‐‐‐‐‐‐‐‐‐‐‐‐‐‐‐‐‐‐‐‐‐‐‐‐‐‐‐‐‐‐‐‐‐‐‐‐‐‐‐‐‐‐‐‐9‐30
3.2.1 Percentage of Stores with at Least One Item Available Within Each Category ‐‐‐9
3.2.2 Average Number of Available items in the 11 ZIP Codes ‐‐‐‐‐‐‐‐‐‐‐‐‐‐‐‐‐‐‐‐‐‐‐‐‐10‐ 11
3.2.3 Food Availability in each of the 14 Food Categories ‐‐‐‐‐‐‐‐‐‐‐‐‐‐‐‐‐‐‐‐‐‐‐‐‐‐‐‐‐‐‐11‐17
3.2.4 Compare Availability of Each Item in Grocery Stores with
Convenience Stores ‐‐‐‐‐‐‐‐‐‐‐‐‐‐‐‐‐‐‐‐‐‐‐‐‐‐‐‐‐‐‐‐‐‐‐‐‐‐‐‐‐‐‐‐‐‐‐‐‐‐‐‐‐‐‐‐‐‐‐‐‐‐‐‐‐‐‐‐‐‐‐‐18‐ 30
3.3 Price Assessment—Item Prices: Grocery Stores VS. Convenience Stores ‐‐‐‐‐‐‐‐‐‐‐‐‐‐30‐36
4. CONCLUSIONS ‐‐‐‐‐‐‐‐‐‐‐‐‐‐‐‐‐‐‐‐‐‐‐‐‐‐‐‐‐‐‐‐‐‐‐‐‐‐‐‐‐‐‐‐‐‐‐‐‐‐‐‐‐‐‐‐‐‐‐‐‐‐‐‐‐‐‐‐‐‐‐‐‐‐‐‐‐‐‐‐‐‐‐‐‐‐‐‐‐‐‐‐‐‐‐‐‐‐‐‐‐37
5. LIMITATIONS ‐‐‐‐‐‐‐‐‐‐‐‐‐‐‐‐‐‐‐‐‐‐‐‐‐‐‐‐‐‐‐‐‐‐‐‐‐‐‐‐‐‐‐‐‐‐‐‐‐‐‐‐‐‐‐‐‐‐‐‐‐‐‐‐‐‐‐‐‐‐‐‐‐‐‐‐‐‐‐‐‐‐‐‐‐‐‐‐‐‐‐‐‐‐‐‐‐‐‐‐‐‐‐38
6. RECOMMENDATIONS ‐‐‐‐‐‐‐‐‐‐‐‐‐‐‐‐‐‐‐‐‐‐‐‐‐‐‐‐‐‐‐‐‐‐‐‐‐‐‐‐‐‐‐‐‐‐‐‐‐‐‐‐‐‐‐‐‐‐‐‐‐‐‐‐‐‐‐‐‐‐‐‐‐‐‐‐‐‐‐‐‐‐‐‐‐‐‐‐‐‐‐‐38
7. REFERENCES ‐‐‐‐‐‐‐‐‐‐‐‐‐‐‐‐‐‐‐‐‐‐‐‐‐‐‐‐‐‐‐‐‐‐‐‐‐‐‐‐‐‐‐‐‐‐‐‐‐‐‐‐‐‐‐‐‐‐‐‐‐‐‐‐‐‐‐‐‐‐‐‐‐‐‐‐‐‐‐‐‐‐‐‐‐‐‐‐‐‐‐‐‐‐‐‐‐‐‐‐‐‐‐‐39

3
1. INTRODUCTION
Food Desert Food desert is defined as urban neighborhoods and rural towns without ready access to fresh,
healthy, and affordable food.1 Food deserts are usually found in impoverished areas where
there is a lack of grocery stores, farmers’ markets, and healthy food providers. Instead, food
deserts are heavy on convenience stores and quickie marts that provide mostly processed
food that are high in calories and low in nutrients. These foods are known contributors to the
nation’s obesity epidemic. 2 The United States Department of Agriculture Economic Research
Service has outlined a map that identifies census tracts that are food deserts. USDA, Treasury
and Department of Health and Human Services have defined a food desert as a census tract
with a substantial share of residents who live in low‐income areas that have low levels of
access to a grocery store or healthy, affordable food retail outlet. Using the census tract as a
unit of analysis for identifying food deserts, USDA, Treasury and HHS will give funding priority
to projects and interventions that establish healthy retail outlets in defined food deserts.
Census tracts qualify as food deserts if they meet low‐income and low‐access thresholds:
1. They qualify as "low‐income communities", based on having: a) a poverty rate of 20% or
greater, OR b) a median family income at or below 80% of the area median family income;
AND
2. They qualify as "low‐access communities", based on the determination that at least 500
persons and/or at least 33% of the census tract's population live more than one mile from a
supermarket or large grocery store (10 miles, in the case of non‐metropolitan census tracts).1
Tarrant County Public Health aims to increase access to affordable fruits and vegetables in
the workplace and to reduce barriers for low‐income families shopping at farmers markets. 2
Tarrant County Public Health received funding from the Texas Department of State Health
Services (DSHS) to perform a local assessment of areas of Tarrant County that were identified
as “food deserts”. Texas Nutrition Environment Assessment in Stores (TxNEA‐S) surveys were
conducted in grocery and convenience stores in 11 ZIP codes across Tarrant County. By doing
this, complete local data on healthful food availability, cost and quality for these areas were
obtained, which will show needs by grocery stores, convenience stores, or small retailer with
regard to healthy food.
The findings will be shared with decision makers in hopes that policy and environmental
changes can be made to increase availability of healthy, affordable and nutritious foods in the
food deserts. This information will also be shared with the Tarrant County Food Policy Council
whose role is to advocate for access to healthy foods for all residents of the county.
4
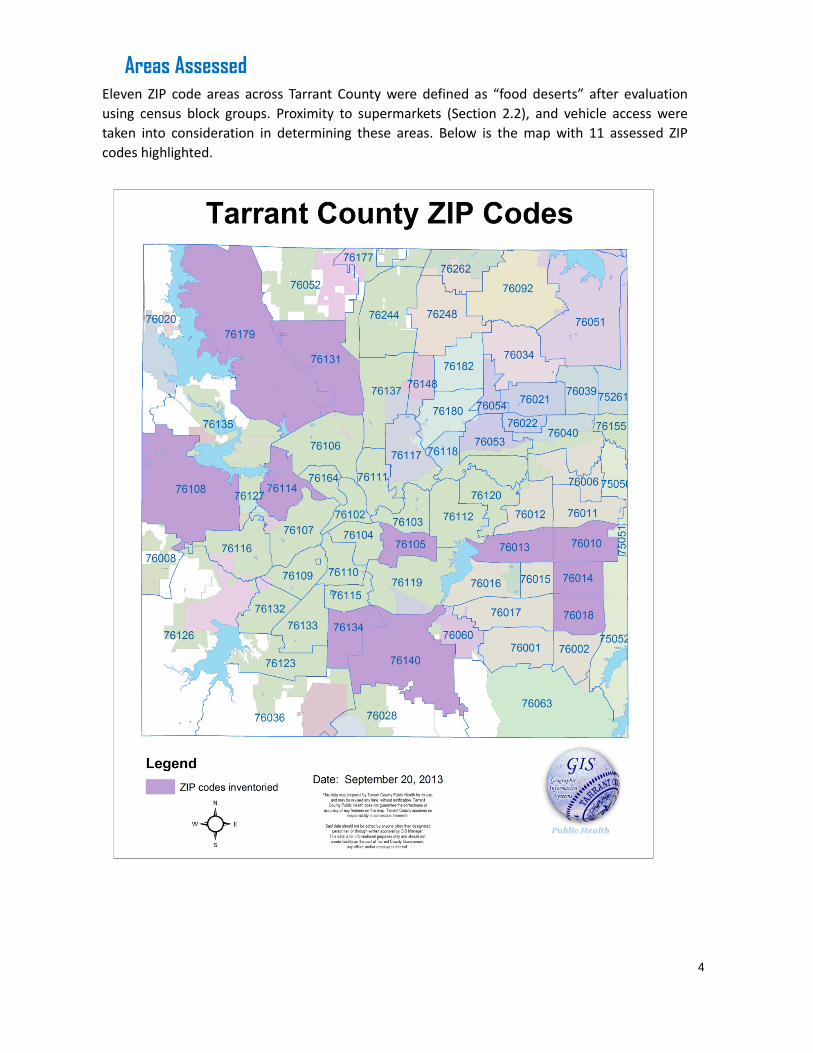
Areas Assessed Eleven ZIP code areas across Tarrant County were defined as “food deserts” after evaluation
using census block groups. Proximity to supermarkets (Section 2.2), and vehicle access were
taken into consideration in determining these areas. Below is the map with 11 assessed ZIP
codes highlighted.

5
2. Methods
2.1 GIS and Mapping Access For the purposes of this study, full service grocery stores were defined as those retail food
establishments providing dry, canned and frozen foods, fresh produce, meat and dairy.3 The
stores could be part of a chain or independent, and any size as long as the preceding
criteria were met.
Store information was retrieved from health permit data from Tarrant County Public Health
and the cities of Arlington, Fort Worth, Grand Prairie, Euless and North Richland Hills, and
was geo‐coded by address and then located and matched to aerial photographs of the
actual buildings, and then stored in a geo‐database for analysis.
Walking and driving distance and time were determined for each area of analysis. Distance
to more than one store from different companies or owners was determined as a proxy for
variety, to add depth to the characterization.4,5,6 Distance values were determined based on
shortest path street distance from each block group centroid (polygon center) to a store,
rather than Euclidean distance. This method has been chosen because Euclidean distance
does not take into account physical barriers, such as bodies of water; rather, it is merely the
straight line distant between two points. In addition, using this method allowed for the
calculation of drive time as well. Time values were based on speed limit attribute data in
the street centerline file. The distance analysis was performed in ArcGIS 10 using the
Network Analyst extension.
2.2 Samples: All Grocery and Convenience Stores within ZIP Codes
Determined as “Food Deserts" The 11 inventoried ZIP codes were chosen based on the number of blocks within that ZIP
code that were further than three miles away for both the first and third grocery store in
the urban areas and further than five miles in the outer, less populated ZIP codes. The
exception to this was areas that had a high number of census block groups whose residents
use some other means than driving alone to work, such as carpooling or using public
transportation. In these instances, the cutoff for inclusion drops to greater than one mile
distance for the majority of census blocks in that ZIP code, 76010 for example.

6
2.3 Survey Methods
2.3.1 Texas Nutrition Environment Assessment in Stores (TxNEA-S)
Survey Tool The TxNEA‐S tool was adapted from Nutrition Environments Measures Survey in Stores tool
(NEMS‐S) by DSHS to include foods culturally appropriate for Texas communities.
TxNEA is a tool that assesses particular components of the nutrition environment. These
components include the availability, cost, and quality of foods recommended by the Dietary
Guidelines for Americans. It contains 14 different categories of food, with a total of 134
items. 7
2.3.2 Survey Administration The surveys were administered by Tarrant County Medical Reserve Corps volunteers and
temporary employees from May 21st to September 9th, 2013. The Medical Reserve Corps
surveyed the first three ZIP codes 76114, 76140, 76014, and the remaining eight ZIP codes
were assessed by five temporary employees of Tarrant County Public Health.
Before collecting data using TxNEA, training on how to assess stores, (including obtaining
permission prior to assessment, usage of the survey itself, and calculating and comparing
prices for the same item), was conducted. Training materials were obtained from DSHS and
a one‐page key points tool was developed for the team to refer to while in store conducting
the assessment.
Surveys administered were returned to the program manager on a daily basis and entered
by the data entry team into the Microsoft Excel database and then imported into SAS
statistical software for analysis. Due to the large amount of variables in the database, a new
Excel database, with variable names corresponding to the item number and category
number in the survey, was set up and used during this project to help better perform data
entry and data analysis.
2.3.3 Survey Analysis Percentage of convenience stores and grocery stores were calculated within each ZIP code
area, and chi‐square tests were performed to test the significance between the convenience
store percentage and the grocery store percentage.
For all convenience stores and grocery stores surveyed the following results are presented:
Percentage of stores with at least one item available
Average number (and percentage) of available food within each of the 14 food
categories for all 11 ZIP codes
Percentage of stores carrying 0, 1, 2, 3‐5, > 5 items in each of the 14 food
7
categories
Percentage of stores carrying each item
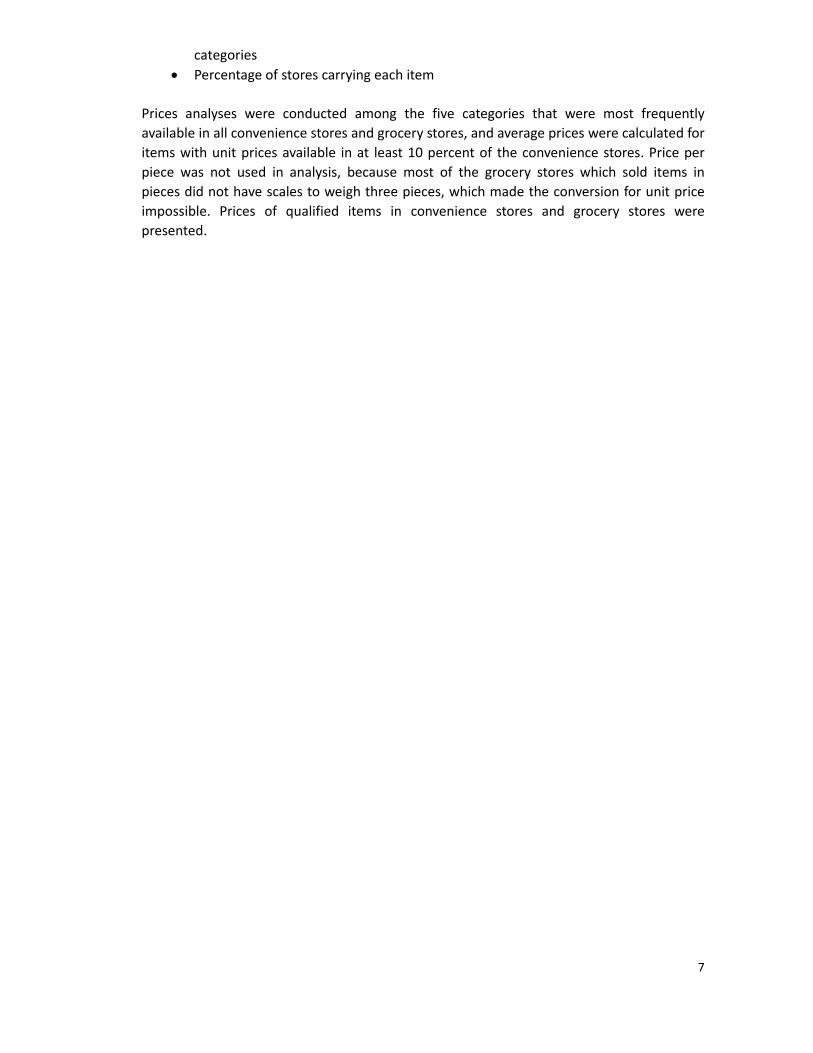
Prices analyses were conducted among the five categories that were most frequently
available in all convenience stores and grocery stores, and average prices were calculated for
items with unit prices available in at least 10 percent of the convenience stores. Price per
piece was not used in analysis, because most of the grocery stores which sold items in
pieces did not have scales to weigh three pieces, which made the conversion for unit price
impossible. Prices of qualified items in convenience stores and grocery stores were
presented.

8
3. RESULTS
3.1 Overview ounce
3.1.1 Number of Stores Surveyed In the 11 ZIP codes, 23 of 26 grocery stores and 119 of 139 convenience stores were
assessed.
3.1.2 Convenience Store Percentage VS. Grocery Store percentage in
Each ZIP Code This study focused on only grocery and convenience stores, and their percentages in these
areas added up to 100 percent.
In the 11 ZIP codes, the average percentage of convenience stores out of all grocery and convenience stores was 86 percent, with a range from 70% to 100%. The difference
between convenience stores and grocery stores was statistically significant (p< 0.01).
ZIP codes 76014, 76131, 76134, 76140 had no grocery stores.
ZIP code 76179 had the lowest percentage of convenience stores at 70 %
Note: Percentage of convenience stores and grocery stores were complimentary
73
81
10093
80 81
89
100 100 100
70
27
19
0
7
20 19
11
0 0 0
30
0
10
20
30
40
50
60
70
80
90
100
76010 76013 76014 76018 76105 76108 76114 76131 76134 76140 76179
ConvenienceStore
Grocery Store
85%: Averagepercentage of grocery stores in surveyed areas
Figure 3.1.1 Percentage of convenience stores VS. grocery stores in 11 ZIP code areas, Tarrant County, 2013
9
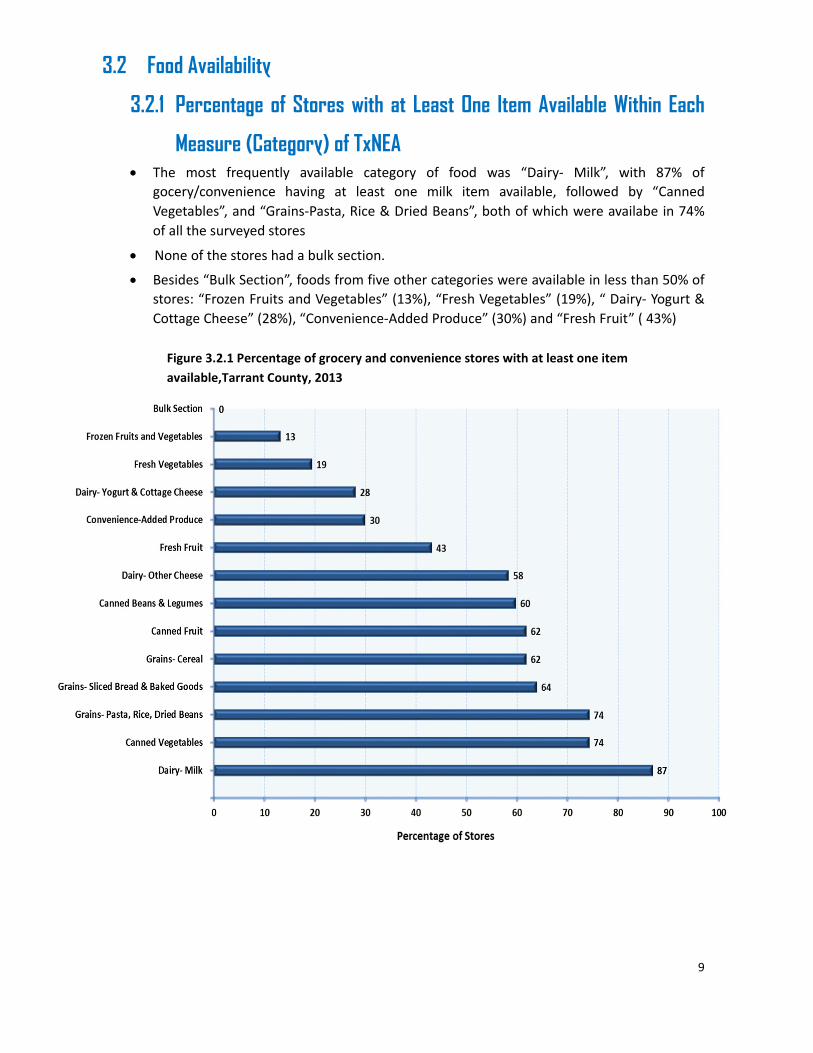
3.2 Food Availability
3.2.1 Percentage of Stores with at Least One Item Available Within Each
Measure (Category) of TxNEA The most frequently available category of food was “Dairy‐ Milk”, with 87% of
gocery/convenience having at least one milk item available, followed by “Canned
Vegetables”, and “Grains‐Pasta, Rice & Dried Beans”, both of which were availabe in 74%
of all the surveyed stores
None of the stores had a bulk section.
Besides “Bulk Section”, foods from five other categories were available in less than 50% of
stores: “Frozen Fruits and Vegetables” (13%), “Fresh Vegetables” (19%), “ Dairy‐ Yogurt &
Cottage Cheese” (28%), “Convenience‐Added Produce” (30%) and “Fresh Fruit” ( 43%)
Figure 3.2.1 Percentage of grocery and convenience stores with at least one item
available,Tarrant County, 2013

10
3.2.2 Average Number of Available Items in Each ZIP Code Overall, the average number of available items in each ZIP code was less than half the
number of items listed in the survey
ZIP code 76179 had the highest availability with 42 of 134 items (31%)
ZIP code 76134 had the lowest availability with 15 of 134 items (11%) , followed by ZIP
code 76014, with 18 out of 134 items (13%)
The “Canned Vegetables” section had the largest percentage of available items, ranging from 40%
to 80% throughout the 11 ZIP codes.
Food Category
(number of items
in survey)
Average Number of Available Items
(%)
76010 76013 76014 76018 76105 76108 76114 76131 76134 76140 76179
1.Fresh Fruit
(n=16)
2
(13)
3
(19)
1
(6)
2
(13)
2
(13)
3
(19)
4
(25)
0
1
(6)
1
(6)
5
(31)
2.Fresh Vegetables
(n= 14)
3
(21)
3
(21)
0
1
(7)
3
(21)
3
(21)
2
(14)
0
0
1
(7)
4
(29)
3.Convenience‐Added
Produce
(n= 4)
1
(25)
1
(25)
1
(25)
1
(25)
1
(25)
1
(25)
1
(25)
0
0
0
1
(25)
4. Dairy‐ Milk
(n= 18)
5
(28)
4
(22)
4
(22)
6
(33)
3
(17)
5
(28)
4
(22)
4
(22)
4
(22)
3
(17)
6
(33)
5.Dairy‐ Yogurt &
Cottage Cheese
(n= 4)
1
(25)
0
0
0
1
(25)
1
(25)
1
(25)
0
1
(25)
0
1
(25)
6.Dairy‐ Other Cheese
(n= 8)
2
(25)
1
(13)
1
(13)
1
(13)
1
(13)
1
(13)
1
(13)
2
(25)
1
(13)
1
(13)
3
(38)
7. Canned Fruit
(n= 10)
2
(20)
2
(20)
3
(30)
1
(10)
3
(30)
2
(20)
3
(30)
3
(30)
0
2
(20)
3
(30)
8. Canned Vegetables
(n= 5)
2
(40)
2
(40)
2
(40)
2
(40)
3
(60)
2
(40)
3
(60)
4
(80)
2
(40)
3
(60)
2
(40)
9.Canned Beans &
Legumes
(n= 9 )
2
(22)
2
(22)
0
1
(11)
2
(22)
2
(22)
3
(33)
3
(33)
1
(11)
3
(33)
3
(33)
10. Grains‐ Cereal
(n= 9)
3
(33)
2
(22)
1
(11)
2
(22)
3
(33)
3
(33)
2
(22)
0
1
(11)
3
(33)
4
(44)
11. Grains‐ Sliced
Bread & Baked
Goods(n= 9)
3
(33)
2
(22)
3
(33)
2
(22)
3
(33)
2
(22)
3
(33)
4
(44)
2
(22)
3
(33)
4
(44)
12.Grains‐ Pasta,
Rice, Dried Beans
2
(29)
2
(29)
2
(29)
1
(15)
3
(43)
3
(43)
3
(43)
2
(29)
2
(29)
3
(43)
3
(43)
Table 3.2.2 Average number of items available under each food category in 11 ZIP code areas,
Tarrant County, 2013

11
(n= 7)
13. Bulk Section
(n= 8) 0 0 0 0 0 0 0 0 0 0 0
14. Frozen Fruits and
Vegetables
(n= 13)
2
(15)
1
(8)
0
1
(8)
1
(8)
2
(15)
2
(15)
0
0
0
3
(23)
TOTAL
(N= 134)
30
(22)
25
(19)
18
(13)
21
(16)
29
(22)
30
(22)
32
(24)
22
(16)
15
(11)
23
(17)
42
(31)
Note: the top number is the average number of available items and the bottom number reflects the percentage (%) in each
category.
3.2.3 Food Availability in each of the 13 Available Food Categories
For 11 out of 13 food catagories, the largest percentage in each category reflects stores
that did not contains any items.
Two exceptions were “Dairy‐ Milk” and “ Canned Vegetables” , with 13% and 25%
stores having no item in each category, respectively.
“Bulk Section” was not available in any of the stores.
Fresh Fruits
> 5 items17%
3‐5 items6%
2 items10%
1 item10%
0 items57%
Figure 3.2.3 Percentage of stores holding 0, 1, 2, 3‐5, > 5 items in each food category, Tarrant
County, 2013
57% of the stores did not
have any fresh fruit
17% of all the stores had
more than five fruits
available
12
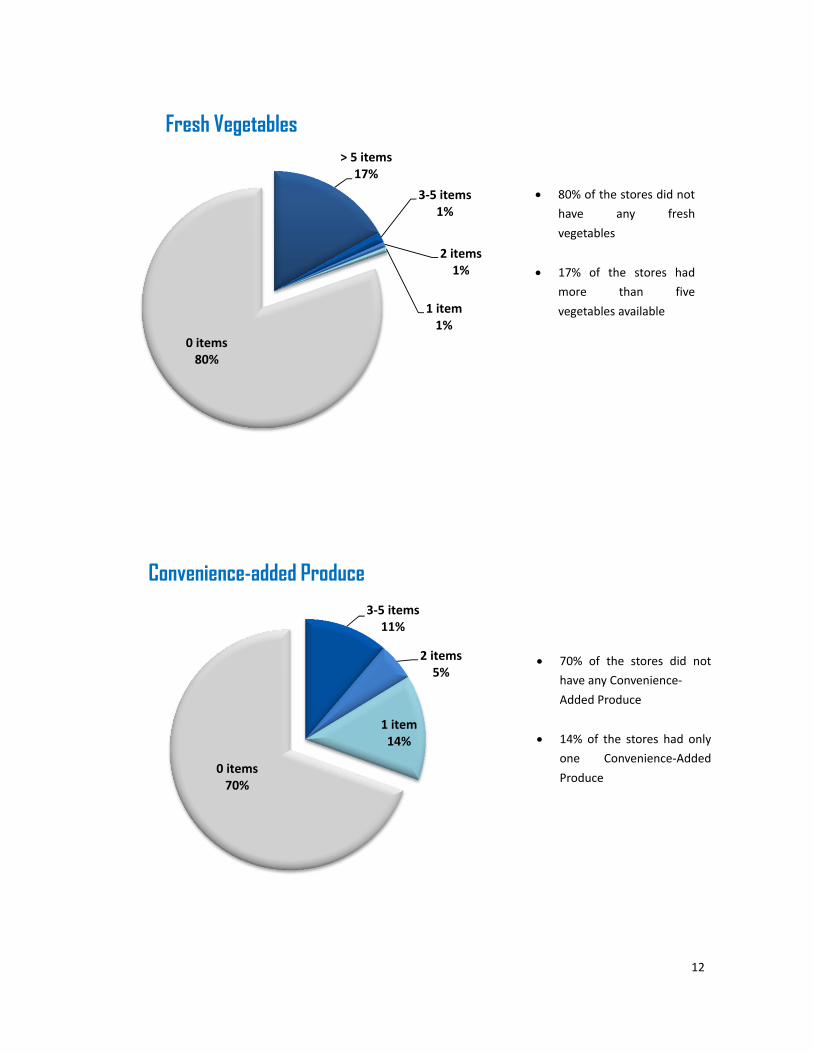
Fresh Vegetables
Convenience-added Produce
> 5 items 17%
3‐5 items1%
2 items1%
1 item1%
0 items80%
3‐5 items11%
2 items5%
1 item14%
0 items70%
80% of the stores did not
have any fresh
vegetables
17% of the stores had
more than five
vegetables available
70% of the stores did not
have any Convenience‐
Added Produce
14% of the stores had only
one Convenience‐Added
Produce
13
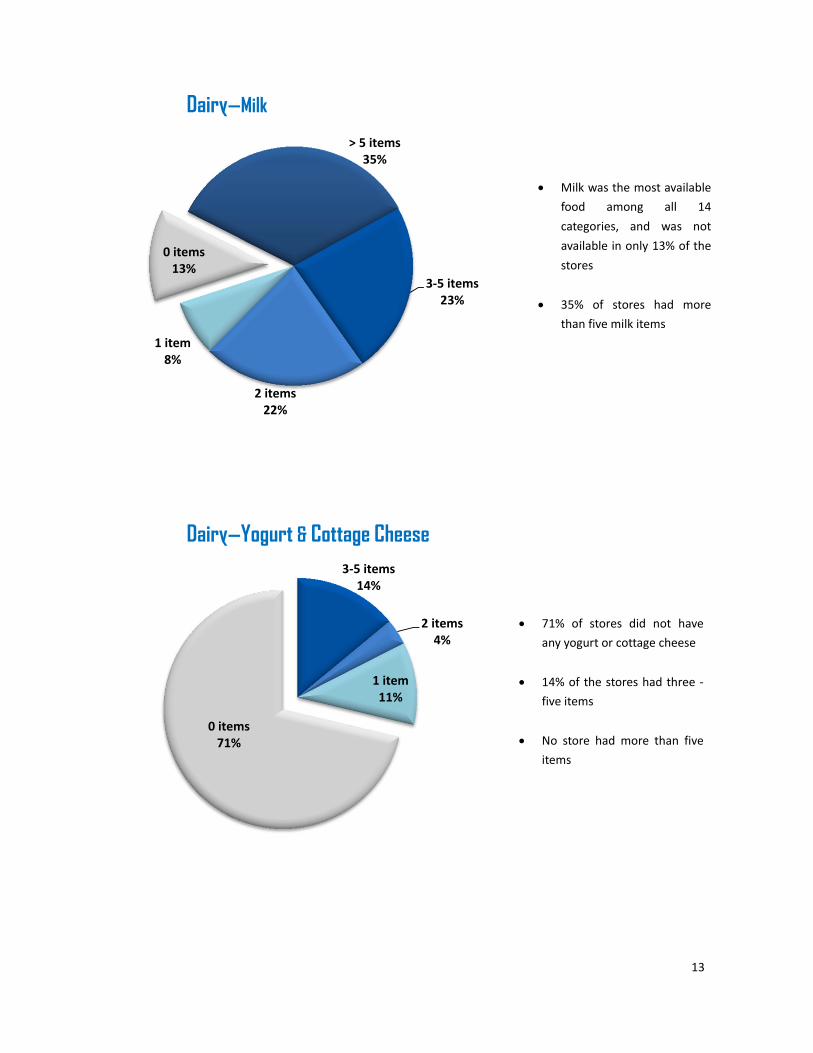
Dairy—Milk
Dairy—Yogurt & Cottage Cheese
> 5 items 35%
3‐5 items23%
2 items22%
1 item8%
0 items13%
3‐5 items14%
2 items4%
1 item11%
0 items71%
Milk was the most available
food among all 14
categories, and was not
available in only 13% of the
stores
35% of stores had more
than five milk items
71% of stores did not have
any yogurt or cottage cheese
14% of the stores had three ‐
five items
No store had more than five
items

14
Dairy—Other Cheese
Canned Fruit
> 5 items7%
3‐5 items13%
2 items17%
1 item22%
0 items41%
> 5 items14%
3‐5 items23%
2 items13%
1 item12%
0 items38%
41% of stores did not
have any cheese
22% of the stores had
only one type of cheese
38% of stores did not have
any canned fruit
23% of the stores had
three‐five types of canned
fruit
15
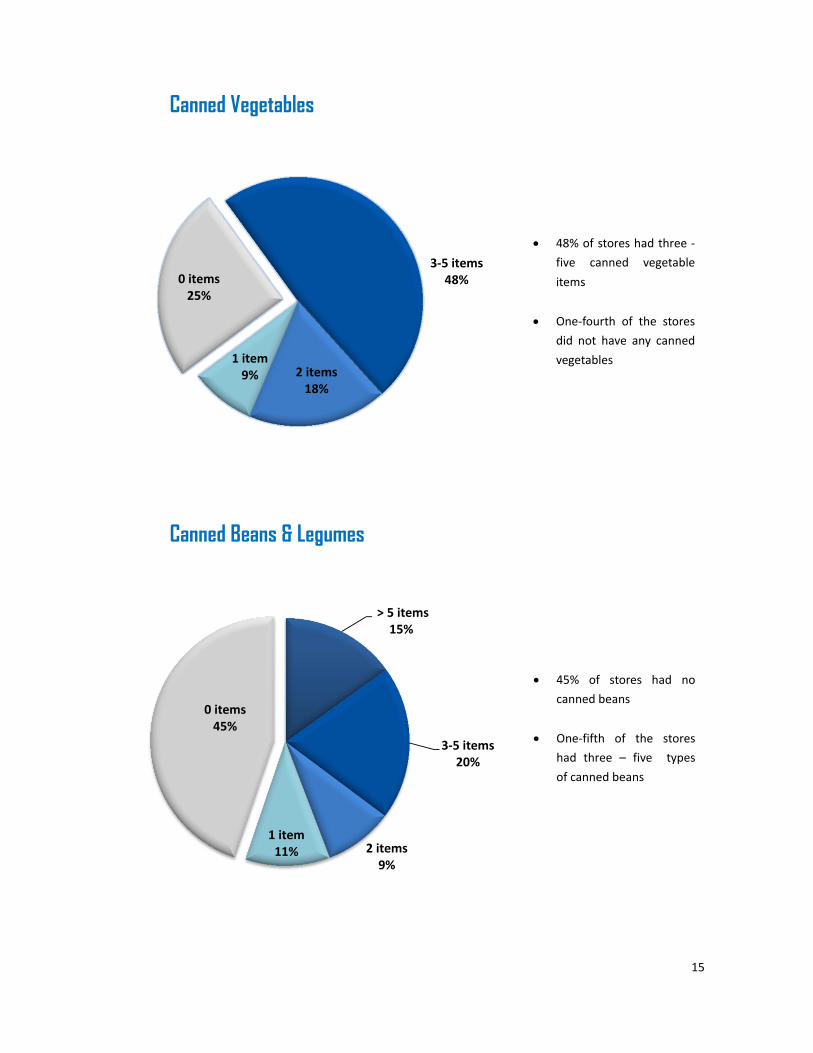
Canned Vegetables
Canned Beans & Legumes
3‐5 items48%
2 items18%
1 item9%
0 items25%
> 5 items 15%
3‐5 items20%
2 items9%
1 item11%
0 items45%
48% of stores had three ‐
five canned vegetable
items
One‐fourth of the stores
did not have any canned
vegetables
45% of stores had no
canned beans
One‐fifth of the stores
had three – five types
of canned beans

16
Grains—Cereal
Grains—Sliced Bread & Baked Goods
> 5 items 15%
3‐5 items21%
2 items17%
1 item15%
0 items32%
> 5 items 15%
3‐5 items27%
2 items9%
1 item14%
0 items35%
32% of the stores had no
cereal
One‐fifth of the stores
had three ‐ five types of
cereal
35% of the stores had no
bread or baked goods
About one fourth of the
stores had three ‐ five
types of bread & baked
goods
17
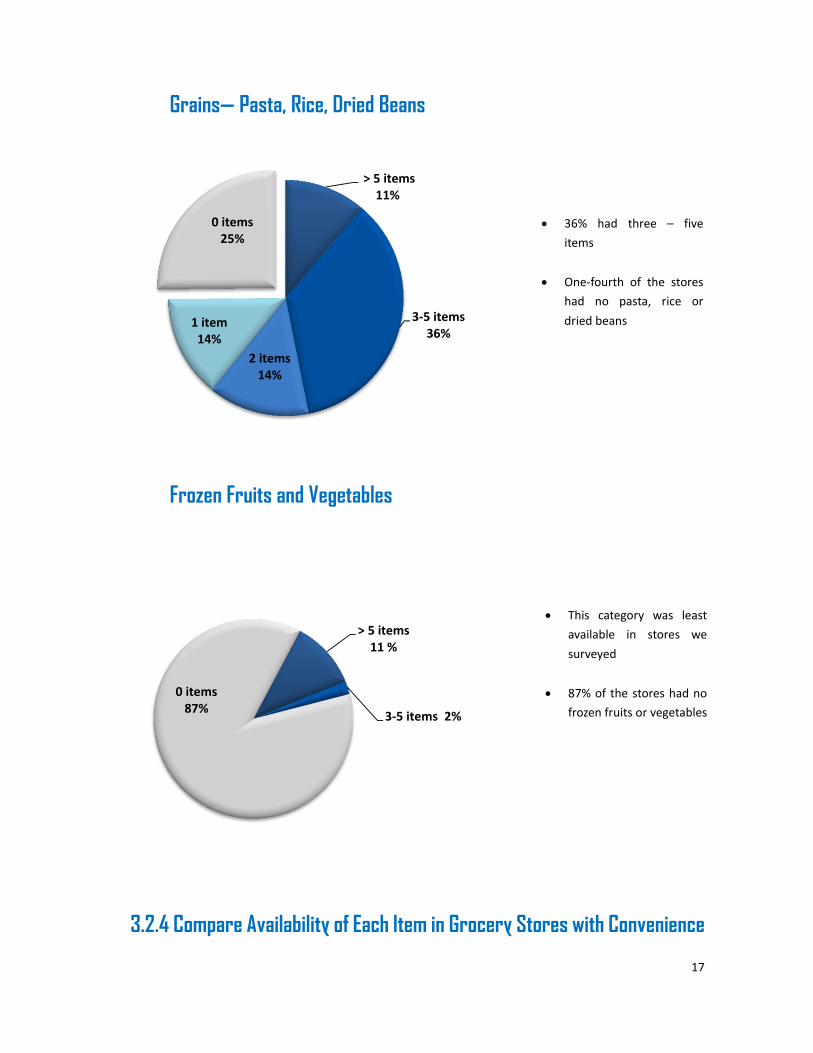
Grains— Pasta, Rice, Dried Beans
Frozen Fruits and Vegetables
3.2.4 Compare Availability of Each Item in Grocery Stores with Convenience
> 5 items11%
3‐5 items36%
2 items14%
1 item14%
0 items25%
> 5 items 11 %
3‐5 items 2%
0 items87%
36% had three – five
items
One‐fourth of the stores
had no pasta, rice or
dried beans
This category was least
available in stores we
surveyed
87% of the stores had no
frozen fruits or vegetables
18
Stores Overall, grocery stores had much higher availability for each item compared to
convenience stores
There were two exceptions in the Dairy‐Milk category: grocery and convenience stores
had similar availability rates for whole milk and 2% reduced fat milk
Most frequently available and least frequently available items were the same,
regardless of the type of stores
Fresh Fruits
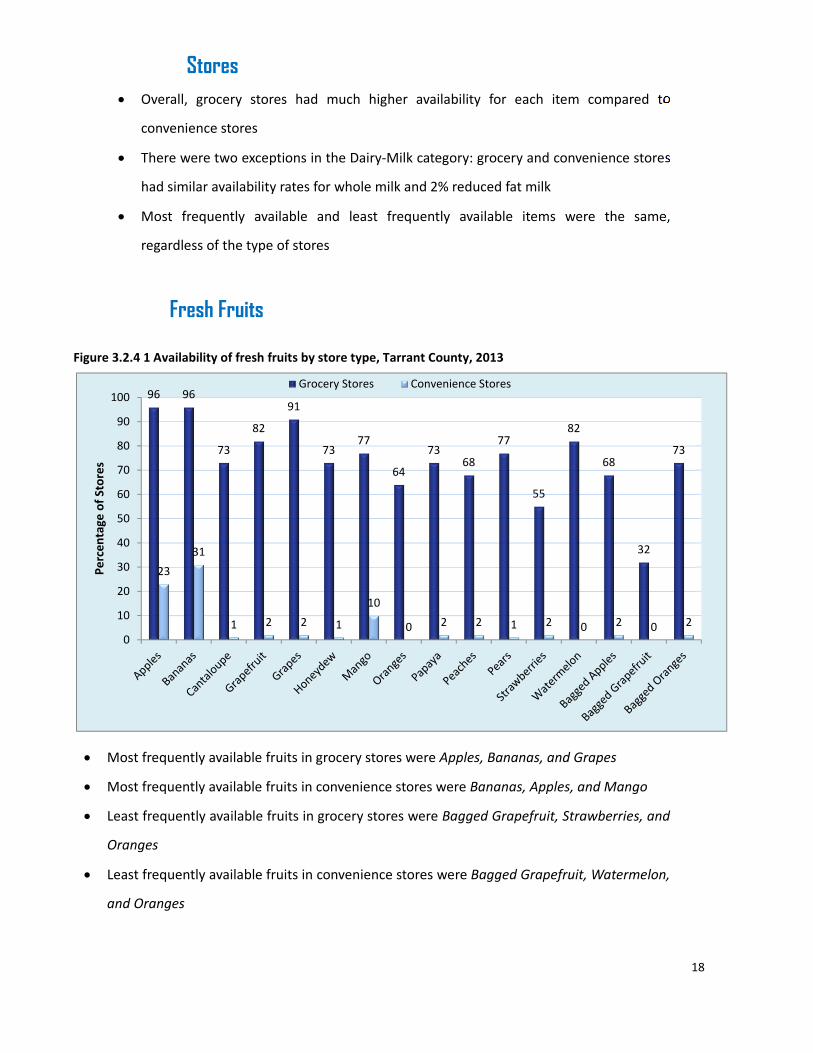
Figure 3.2.4 1 Availability of fresh fruits by store type, Tarrant County, 2013
Most frequently available fruits in grocery stores were Apples, Bananas, and Grapes
Most frequently available fruits in convenience stores were Bananas, Apples, and Mango
Least frequently available fruits in grocery stores were Bagged Grapefruit, Strawberries, and
Oranges
Least frequently available fruits in convenience stores were Bagged Grapefruit, Watermelon,
and Oranges
96 96
73
82
91
7377
64
7368
77
55
82
68
32
73
23
31
1 2 2 1
10
0 2 2 1 2 0 2 0 2
0
10
20
30
40
50
60
70
80
90
100
Percentage
of Stores
Grocery Stores Convenience Stores
19
Fresh Vegetables
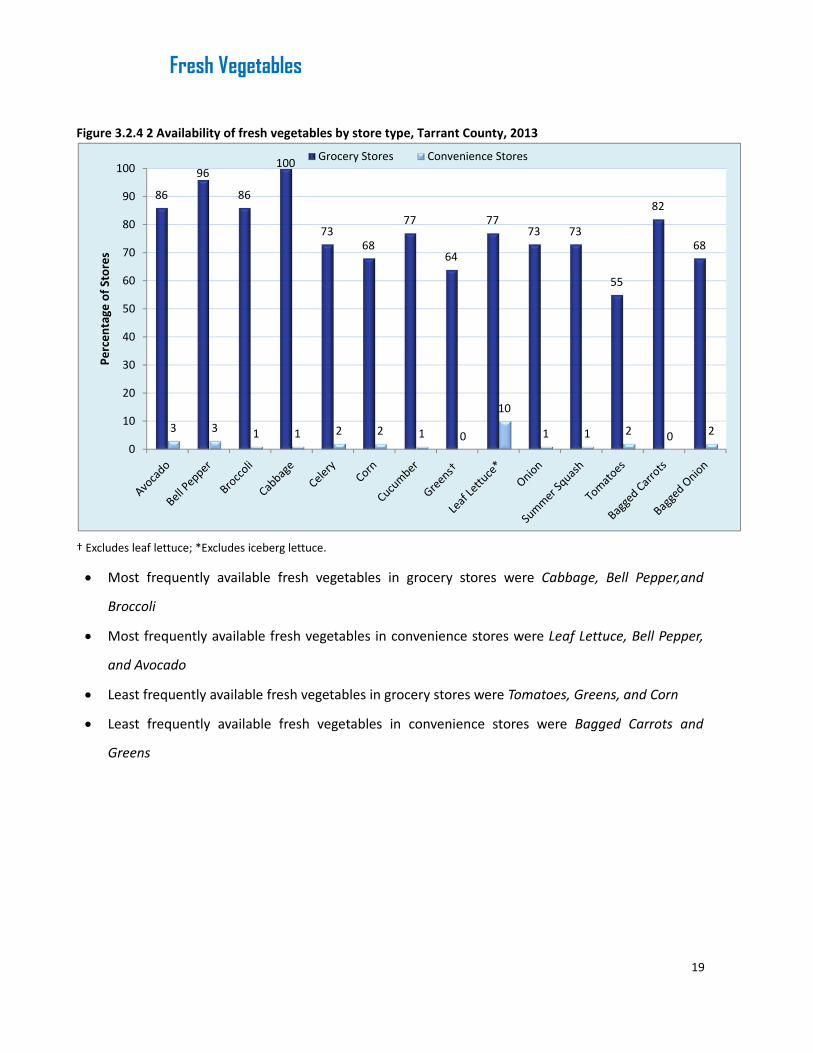
Figure 3.2.4 2 Availability of fresh vegetables by store type, Tarrant County, 2013
† Excludes leaf lettuce; *Excludes iceberg lettuce.
Most frequently available fresh vegetables in grocery stores were Cabbage, Bell Pepper,and
Broccoli
Most frequently available fresh vegetables in convenience stores were Leaf Lettuce, Bell Pepper,
and Avocado
Least frequently available fresh vegetables in grocery stores were Tomatoes, Greens, and Corn
Least frequently available fresh vegetables in convenience stores were Bagged Carrots and
Greens
86
96
86
100
7368
77
64
7773 73
55
82
68
3 3 1 1 2 2 1 0
10
1 1 2 0 2
0
10
20
30
40
50
60
70
80
90
100
Percentage
of Stores
Grocery Stores Convenience Stores

20
Convenience-Added Produce
Figure 3.2.4 3 Availability of convenience‐added produce by store type, Tarrant County, 2013
Most frequently available item in grocery stores was Baby Carrots
Most frequently available item in convenience stores was Ready‐to‐eat Cut‐up Fruit
Least frequently available item in grocery stores was Cut‐up Vegetables
Least frequently available item in convenience stores was Baby Carrots
91
73
55
68
3 5 3
17
0
10
20
30
40
50
60
70
80
90
100
Baby Carrots Bagged/Box/BulkLettuce/Salad
Cut‐up Vegetables Ready‐to‐eat Cut‐upFruit
Percen
tage
of Stores
Grocery Stores Convenience Stores
21
Dairy-Milk
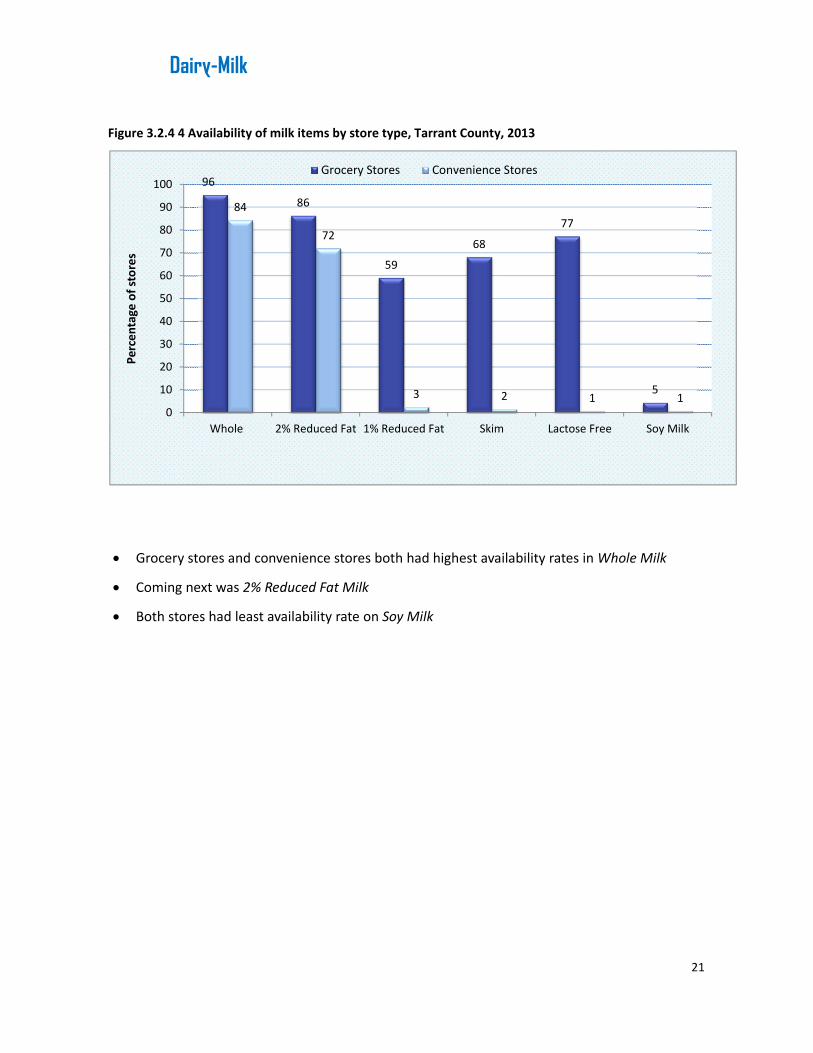
Figure 3.2.4 4 Availability of milk items by store type, Tarrant County, 2013
Grocery stores and convenience stores both had highest availability rates in Whole Milk
Coming next was 2% Reduced Fat Milk
Both stores had least availability rate on Soy Milk
96
86
59
68
77
5
84
72
3 2 1 10
10
20
30
40
50
60
70
80
90
100
Whole 2% Reduced Fat 1% Reduced Fat Skim Lactose Free Soy Milk
Grocery Stores Convenience Stores
Percentage of stores
22
Dairy-Yogurt & Cottage Cheese
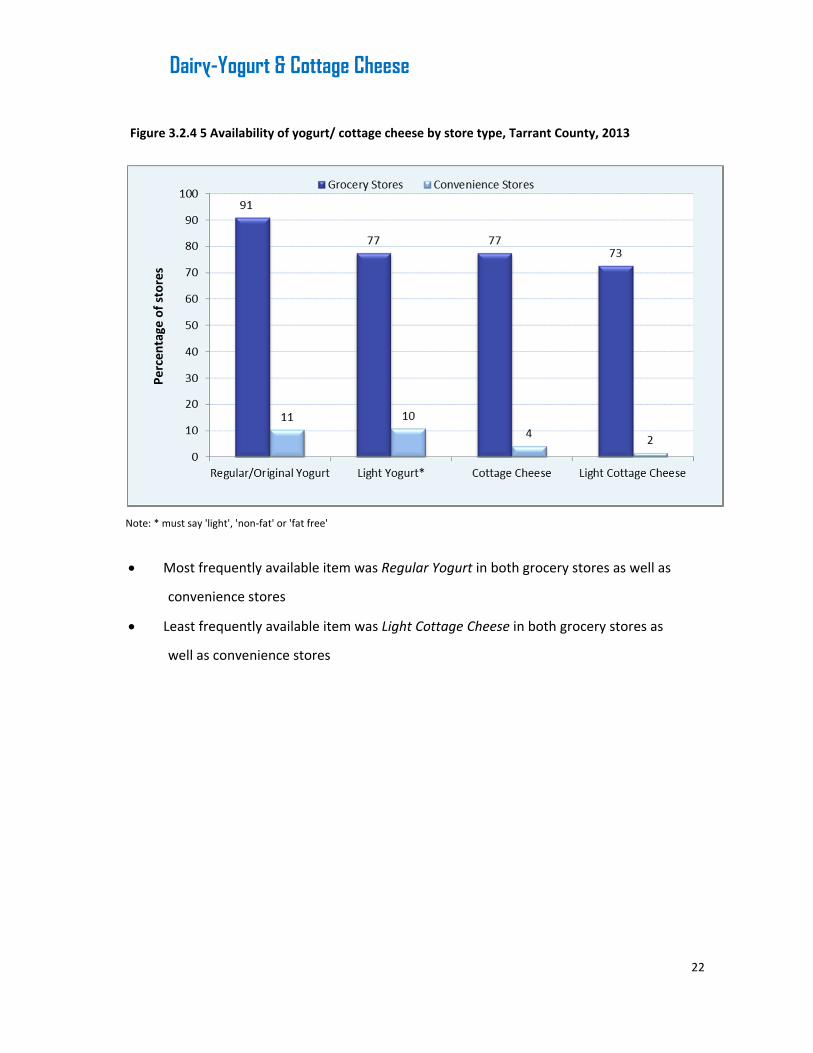
Figure 3.2.4 5 Availability of yogurt/ cottage cheese by store type, Tarrant County, 2013
Note: * must say 'light', 'non‐fat' or 'fat free'
Most frequently available item was Regular Yogurt in both grocery stores as well as
convenience stores
Least frequently available item was Light Cottage Cheese in both grocery stores as
well as convenience stores
Percen
tage
of stores
23
Dairy-Other Cheese
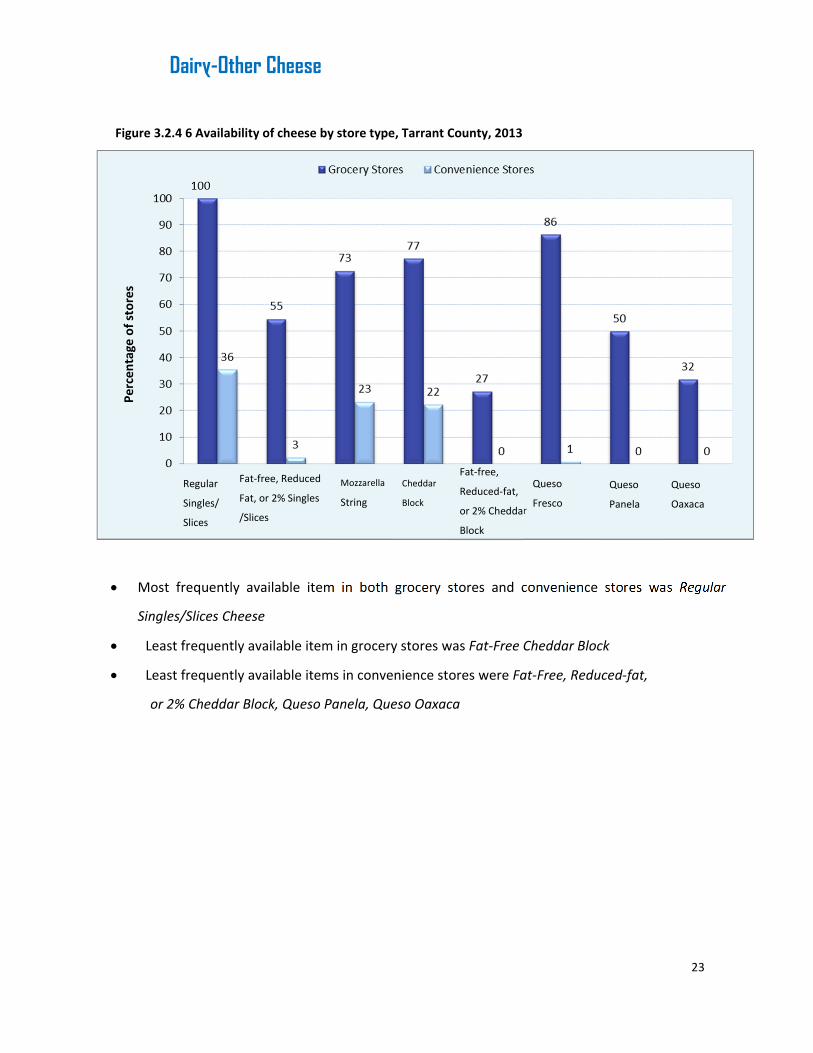
Figure 3.2.4 6 Availability of cheese by store type, Tarrant County, 2013
Most frequently available item in both grocery stores and convenience stores was Regular
Singles/Slices Cheese
Least frequently available item in grocery stores was Fat‐Free Cheddar Block
Least frequently available items in convenience stores were Fat‐Free, Reduced‐fat,
or 2% Cheddar Block, Queso Panela, Queso Oaxaca
Regular
Singles/
Slices
Fat‐free, Reduced
Fat, or 2% Singles
/Slices
Mozzarella
String
Cheddar
Block
Fat‐free,
Reduced‐fat,
or 2% Cheddar
Block
Queso
Fresco
Queso
Panela
Queso
Oaxaca
Percentage
of stores

24
Canned Fruits
Figure 3.2.4 7 Availability of canned fruits by store type, Tarrant County, 2013
Most frequently available items in grocery stores were Mixed fruit in regular/heavy syrup,
Peaches in regular/Heavy syrup, and Pineapple in light syrup
Most frequently available items in convenience stores were also Mixed fruit in regular/
heavy syrup, Peaches in regular/heavy syrup, and Pineapple in heavy syrup
Least frequently available item in grocery stores was Mandarin Oranges in regular syrup
Least frequently available items in convenience stores was Peaches in light syrup
77
14
73
82
68
82
59
7782
55
118 10
36
12
24
3
13 12
22
0
10
20
30
40
50
60
70
80
90
100
Percentage
of Stores
Grocery Stores Convenience Stores

25
Canned Vegetables
Figure 3.2.4 8 Availability of canned vegetables by store type, Tarrant County, 2013
All canned vegetables were highly available, ranging from 96‐100% of grocery stores.
Most frequently available items in grocery stores were Corn and Mixed Vegetables
Most frequently available items in convenience stores were Corn and Green Beans
Least frequently available items in convenience stores was Tomatoes
10096 96 96
100
56 56
28 26 28
0
10
20
30
40
50
60
70
80
90
100
Corn Green Beans Green Peas Tomatoes Mixed Vegetables
Percentage
of Stores
Grocery Stores Convenience Stores
26
Canned Beans & Legumes
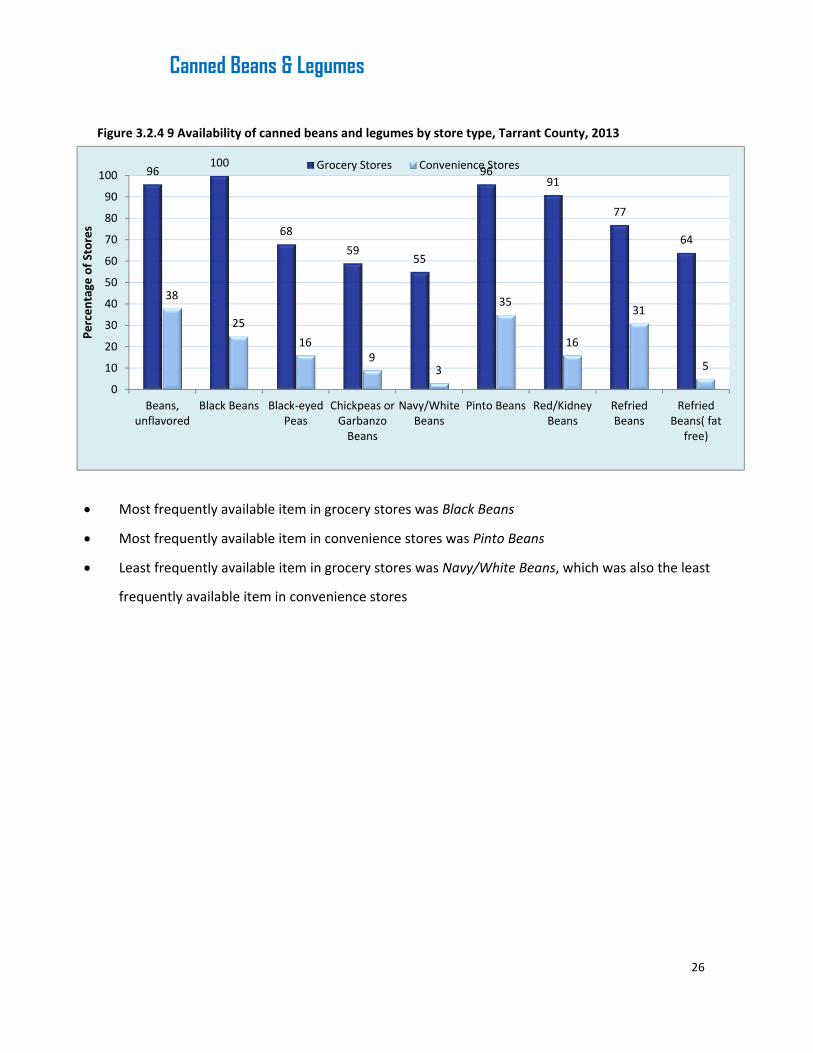
Figure 3.2.4 9 Availability of canned beans and legumes by store type, Tarrant County, 2013
Most frequently available item in grocery stores was Black Beans
Most frequently available item in convenience stores was Pinto Beans
Least frequently available item in grocery stores was Navy/White Beans, which was also the least
frequently available item in convenience stores
96100
68
5955
9691
77
64
38
25
169
3
35
16
31
5
0
10
20
30
40
50
60
70
80
90
100
Beans,unflavored
Black Beans Black‐eyedPeas
Chickpeas orGarbanzoBeans
Navy/WhiteBeans
Pinto Beans Red/KidneyBeans
RefriedBeans
RefriedBeans( fat
free)
Percentage of Stores
Grocery Stores Convenience Stores
27
Grains-Cereal
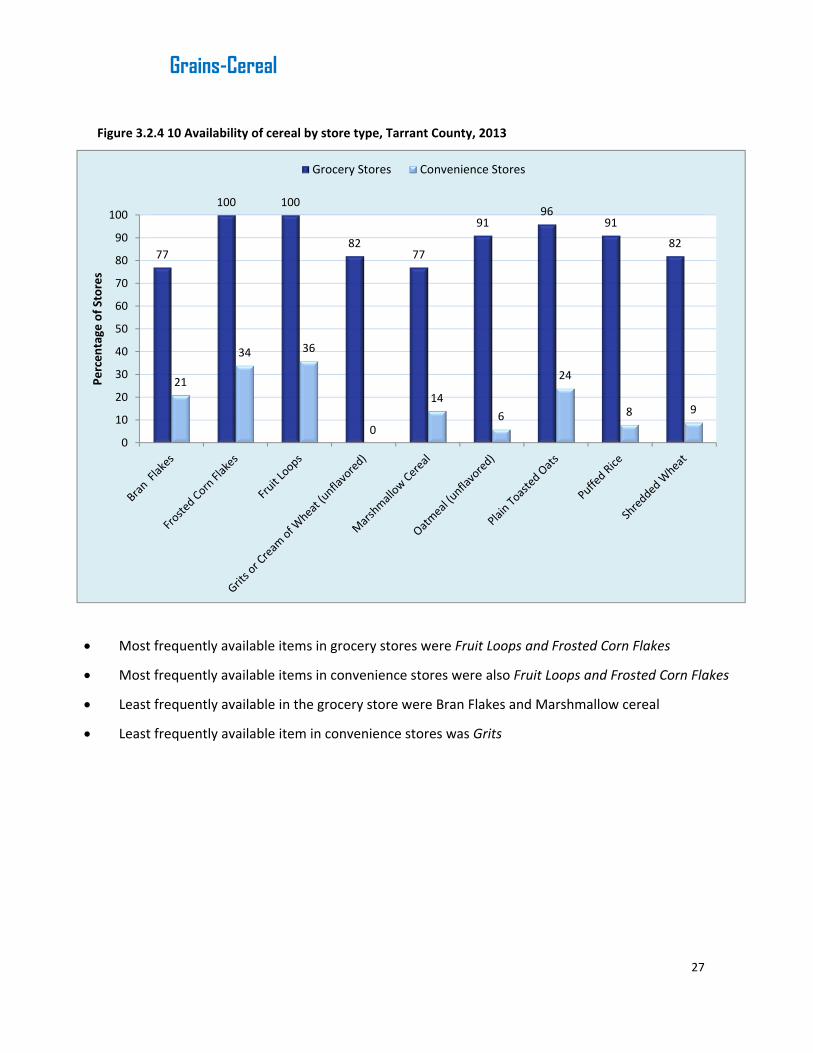
Figure 3.2.4 10 Availability of cereal by store type, Tarrant County, 2013
Most frequently available items in grocery stores were Fruit Loops and Frosted Corn Flakes
Most frequently available items in convenience stores were also Fruit Loops and Frosted Corn Flakes
Least frequently available in the grocery store were Bran Flakes and Marshmallow cereal
Least frequently available item in convenience stores was Grits
77
100 100
8277
9196
91
82
21
34 36
0
14
6
24
8 9
0
10
20
30
40
50
60
70
80
90
100
Percentage
of Stores
Grocery Stores Convenience Stores
28
Grains-Sliced Bread & Baked Goods
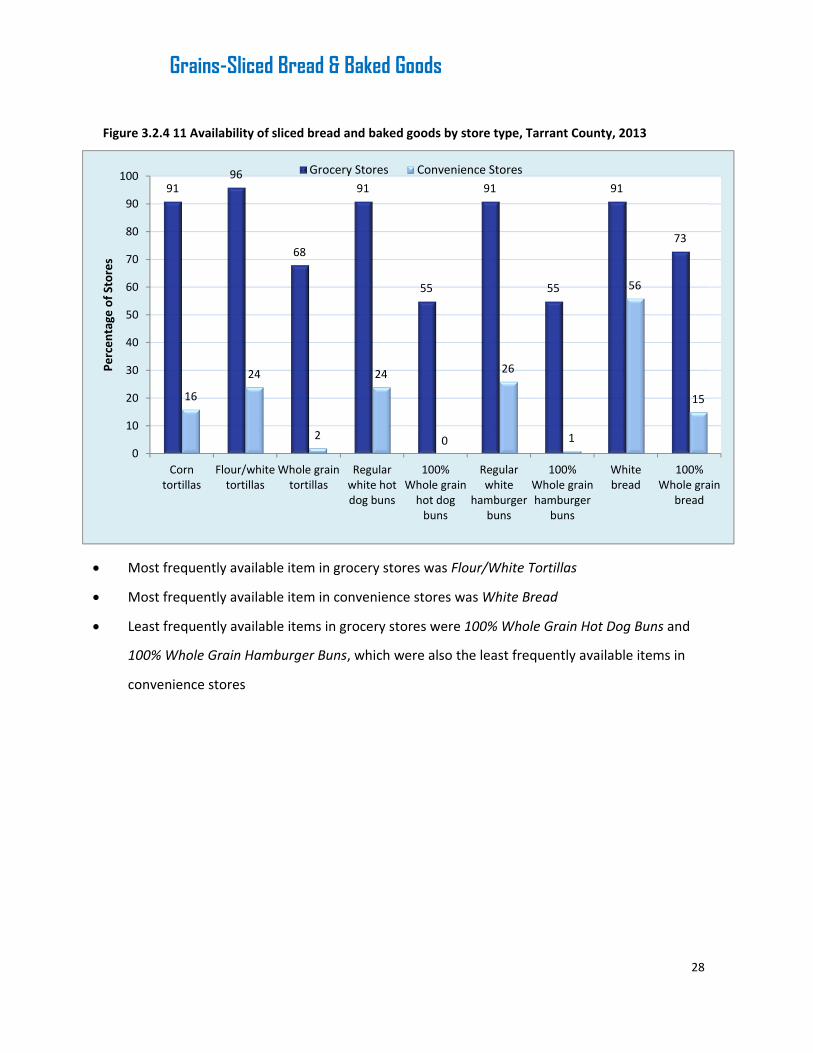
Figure 3.2.4 11 Availability of sliced bread and baked goods by store type, Tarrant County, 2013
Most frequently available item in grocery stores was Flour/White Tortillas
Most frequently available item in convenience stores was White Bread
Least frequently available items in grocery stores were 100% Whole Grain Hot Dog Buns and
100% Whole Grain Hamburger Buns, which were also the least frequently available items in
convenience stores
9196
68
91
55
91
55
91
73
16
24
2
24
0
26
1
56
15
0
10
20
30
40
50
60
70
80
90
100
Corntortillas
Flour/whitetortillas
Whole graintortillas
Regularwhite hotdog buns
100%Whole grainhot dogbuns
Regularwhite
hamburgerbuns
100%Whole grainhamburger
buns
Whitebread
100%Whole grain
bread
Percentage
of Stores
Grocery Stores Convenience Stores

29
Grains-Pasta, Rice, & Dried Beans
Figure 3.2.4 12 Availability of pasta, rice, dried beans by store type, Tarrant County, 2013
Most frequently available items in grocery stores were Regular/White Rice, and Dried Beans
Most frequently available item in convenience stores was Regular Pasta
Least frequently available items in grocery stores were Whole Grain Pasta and Whole Grain
Flour, which were also the least frequently available items in convenience stores
96
64
86
10096
64
100
55
5 7
4441
6
30
0
10
20
30
40
50
60
70
80
90
100
Percentage
of Stores
Grocery Stores Convenience Stores

30
Frozen Fruits & Vegetables
Figure 3.2.4 14 Availability of frozen fruit and vegetable by store type, Tarrant County, 2013
Most frequently available frozen items in grocery stores were Green Beans and Green Peas
Least frequently available frozen items in grocery stores was Mango
Almost no convenience stores had any frozen fruits and vegetables
73
59
36
64
73
59
73
59
7377 77
59
76
0 1 0 0 0 0 0 0 0 1 0 0 1
0
10
20
30
40
50
60
70
80
90
100
Percentage
of Stores
Grocery Stores Convenience Stores

31
3.3 Price Assessment—Items’ Prices: Grocery Stores VS. Convenience Stores Twenty‐three items were chosen and their average prices in grocery stores and convenience
stores were calculated separately. Items were chosen based on their availability in both
grocery and convenience stores, and those items were from the five most frequently available
categories, which were “Dairy‐Milk”, “Canned Vegetables”, “Grains‐Pasta, Rice, Dried Beans”,
“Grains‐Sliced Bread & Baked Goods”, and “Grains‐Cereal”, and average prices were calculated
for items with unit prices available in at least 10% of the convenience stores. Price per piece
were not used in analysis, because most of the grocery stores which sold items in pieces did
not have scales to weigh three pieces, which made the conversion for unit price impossible.
Prices of qualified items in convenience stores and grocery stores are presented below by
each category.
Items available in both convenience and grocery stores cost approximately twice as much in
convenience stores.
Items from “Dairy‐Milk” category cost about 1.5 times more in a convenience store than in a
grocery store.
Categories below were listed in the order of their availability frequency.

32
Dairy-Milk
Figure 3.3.1 Price of milk by store type, Tarrant County, 2013
Overall, milk was 30% more expensive in convenience stores compared to grocery
stores.
$2.77 $2.80$2.52
$3.65 $3.74 $3.62
$0.00
$0.50
$1.00
$1.50
$2.00
$2.50
$3.00
$3.50
$4.00
Whole Milk in Gallon 2% Milk in Gallon 1% Milk in Gallon
Price in
U.S. D
ollars
Grocery Stores Convenience Stores
33
Grains-Pasta, Rice, & Dried Beans
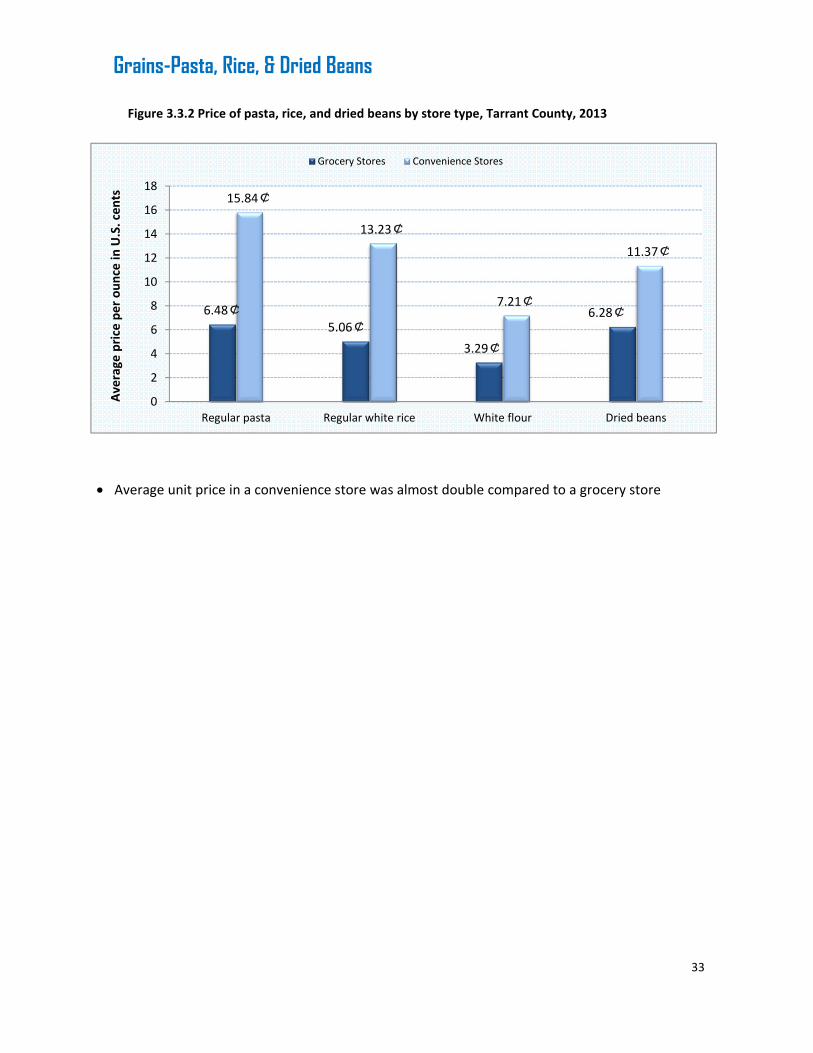
Figure 3.3.2 Price of pasta, rice, and dried beans by store type, Tarrant County, 2013
Average unit price in a convenience store was almost double compared to a grocery store
6.48¢5.06¢
3.29¢
6.28¢
15.84¢
13.23¢
7.21¢
11.37¢
0
2
4
6
8
10
12
14
16
18
Regular pasta Regular white rice White flour Dried beans
Average price per ounce in
U.S. cents
Grocery Stores Convenience Stores
34
Canned Vegetables
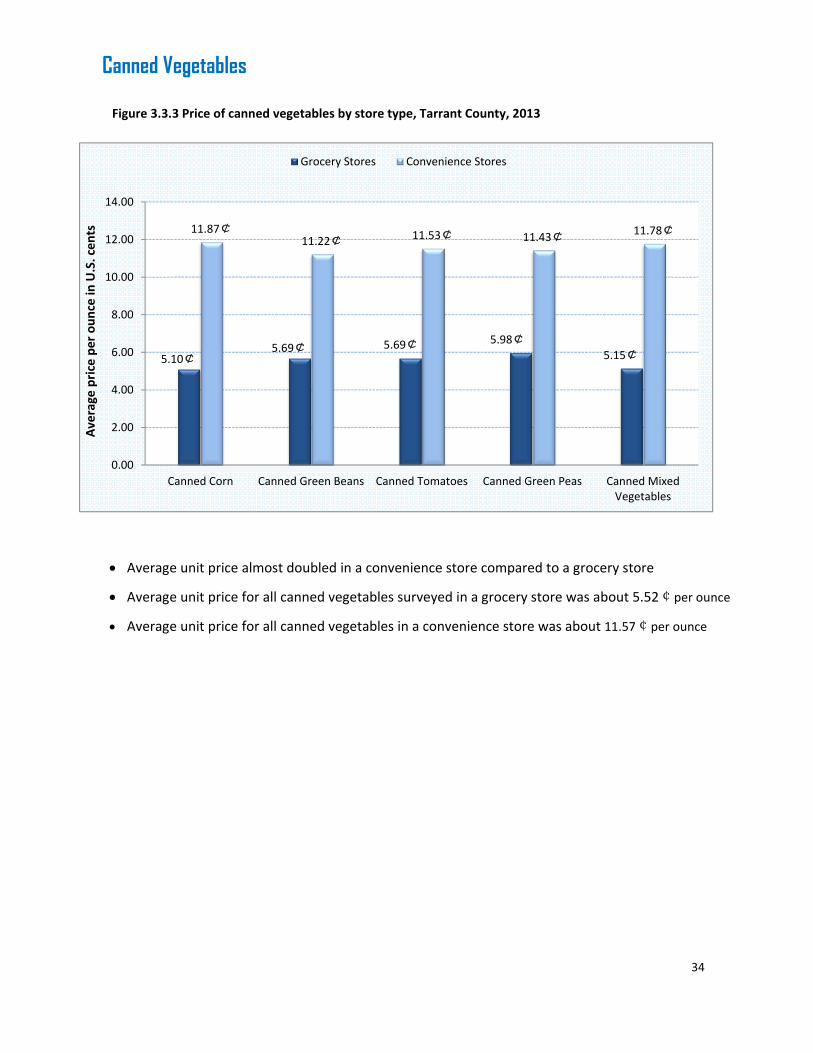
Figure 3.3.3 Price of canned vegetables by store type, Tarrant County, 2013
Average unit price almost doubled in a convenience store compared to a grocery store
Average unit price for all canned vegetables surveyed in a grocery store was about 5.52¢per ounce
Average unit price for all canned vegetables in a convenience store was about 11.57¢per ounce
5.10¢5.69¢ 5.69¢ 5.98¢
5.15¢
11.87¢11.22¢ 11.53¢ 11.43¢
11.78¢
0.00
2.00
4.00
6.00
8.00
10.00
12.00
14.00
Canned Corn Canned Green Beans Canned Tomatoes Canned Green Peas Canned MixedVegetables
Average
price per ounce in
U.S. cents
Grocery Stores Convenience Stores
35
Grains-Sliced Bread & Baked Goods
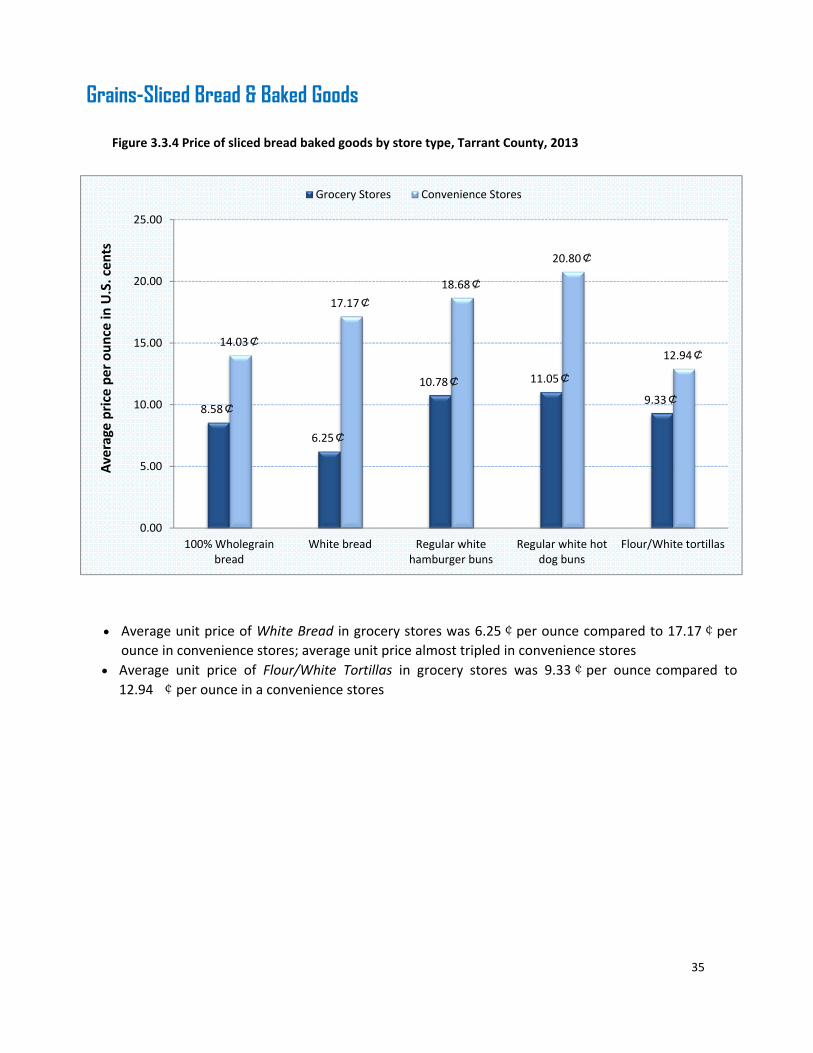
Figure 3.3.4 Price of sliced bread baked goods by store type, Tarrant County, 2013
Average unit price of White Bread in grocery stores was 6.25¢per ounce compared to 17.17¢per
ounce in convenience stores; average unit price almost tripled in convenience stores
Average unit price of Flour/White Tortillas in grocery stores was 9.33¢per ounce compared to
12.94 ¢per ounce in a convenience stores
8.58¢
6.25¢
10.78¢ 11.05¢
9.33¢
14.03¢
17.17¢
18.68¢
20.80¢
12.94¢
0.00
5.00
10.00
15.00
20.00
25.00
100% Wholegrainbread
White bread Regular whitehamburger buns
Regular white hotdog buns
Flour/White tortillas
Average price per ounce in
U.S. cents
Grocery Stores Convenience Stores

36
Grains-Cereal
Figure 3.3.5 Price cereals by store type, Tarrant County, 2013
Average unit price of Oatmeal (unflavored), Bran Flakes, Frosted Corn Flakes, Fruit Loop, and
Marshmallow Cereal more than doubled in a convenience stores compared to a grocery
stores
Average unit price of Cheerios in convenience stores was almost twice as much as in a
grocery stores
8.88¢
23.50¢
13.27¢
16.24¢17.86¢
20.68¢
38.85¢ 38.85¢
48.51¢49.80¢
0.00
10.00
20.00
30.00
40.00
50.00
60.00
Oatmeal(unflavored) Cheerios Bran Flakes Fruit Loops Marshmallow Cereal
Average price per ounce in
U.S. cen
ts
Grocery Stores Convenience Stores

37
4. CONCLUSIONS The 11 ZIP codes defined as food deserts had more convenience stores, which did not
stock a variety of healthy foods such as fresh fruits and fresh vegetables (convenience
stores 86% versus grocery stores 14%, p < 0.01). In fact, both fresh fruits and fresh
vegetables were among the five least available foods in those areas.
Milk was the most available food among all the 14 categories, and only 13% of all stores
did not have any milk item. The other four most frequently available food categories were
“Canned Vegetables”, “Grains‐Pasta, Rice, Dried Beans”, “Grains‐Sliced Bread & Baked
Goods”, and “Grains‐Cereal”, with 87%, 74%, 74%, 64%, 62% of stores having at least one
item available respectively. Least frequently available category was “Bulk Section” which
none of the 142 stores had, followed by “Frozen‐Fruits and Vegetables”, with only 13% of
all stores having at least one item available in stores, and “ Fresh Vegetables”, which had
19% of the stores with at least one item.
Overall, ZIP code 76179 had the highest food availability with 42 of 134 items available
(31%) (Table 3.2.2). It also had the highest percentage of grocery stores among all 11 ZIP
codes (30%) (Figure 3.1.1). ZIP code 76134 had the lowest food availability with 15 of 134
items available (11%), and it had no grocery stores.
Four ZIP codes did not have any grocery stores (76104, 76131, 76134, 76140), and these
four ZIP codes were the areas with the least availability of healthy food (Table 3.3.2).
Grocery stores had much higher availability for each item compared to convenience
stores, and most frequently available and least frequently available items were the same
regardless of the type of stores in these areas.
Items available in convenience stores cost about two times the amount of those in
grocery stores. Two possible reasons for the price differences may include: 1) large
grocery stores provided store brand items at lower prices and 2) the frequent higher
prices for healthy foods.

38
5. LIMITATIONS Most convenience stores with some fruits or vegetables available, sold them by
piece, however, they did not have scales in the stores. Without the weight being
available, price per piece could not be converted to unit price which is comparable
to grocery stores. Therefore, this study did not include them in price comparison.
However, according to the price differences seen in this study in items with unit
prices available, if converting piece price to unit price was possible, it is likely that
the differences would still exist.
Price comparisons were made between local convenience stores and local grocery
stores. Prices of available items were not compared with references outside those
areas.
6. RECOMMENDATIONS Continue data collection and analysis on food availability, price, and quality:
Assessment can be done throughout the year, to track the changes in
availability and price
Obtain data from similar projects done outside the evaluated areas or state
level or national level data for comparison
Local government and community organizations could help increase the
availability of healthy foods within or near the identified food deserts:
Encourage small, local food retailers to provide affordable healthy food
items with possible tax incentives
Work with Farmer’s Markets or produce trucks to bring healthy food into the
community regularly
Expand mobile food pantries
Increase awareness about food deserts and healthy eating, so consumers demand
increased availability of healthy foods.
Report findings could be utilized by the Tarrant County Food Policy Council to
formulate action steps in addressing improved access to healthy foods.

39
7. REFERENCES
1. http://apps.ams.usda.gov/fooddeserts/foodDeserts.aspx
2. http://health.howstuffworks.com/wellness/food‐nutrition/facts/usda‐releases‐food‐desert‐lo
cator.htm
3. http://www.dads.state.tx.us/services/agingtexaswell/initiatives/issuebriefs/nutritionbrief.pdf
4. Apparicio, Philippe, Marie‐Soleil Cloutier, and Richard Shearmur. 2007. “The Case of
Montreal’s Missing Food Deserts: Evaluation of Accessibility to Food Supermarkets.”
International Journal of Health Geographics 6 (1): 4.
5. Apparicio, Philippe, Mohamed Abdelmajid, Mylene Riva, and Richard Shearmur. 2008.
“Comparing Alternative Approaches to Measuring the Geographical Accessibility of Urban
Health Services: Distance Types and Aggregation‐error Issues.” International Journal of Health
Geographics 7 (1): 7. doi:10.1186/1476‐072X‐7‐7.
6. Ver Ploeg, Michele, Vince Breneman, Tracey Farrigan, Karen Hamrick, David Hopkins, Phil
Kaufman, Biing‐Hwan Lin, et al. 2009. “Access to Affordable and Nutritious Food‐ Measuring
and Understanding Food Deserts and Their Consequences: A Report to Congress”.
Administrative Publication No. AP‐036.
7. Christian T Gloria and Mary A Steinhardt “Texas nutrition environment assessment of retail
food stores (TxNEA‐S): development and evaluation.” Public Health Nutrition: 13(11), 1764–
1772 doi:10.1017/S1368980010001588.
Related Documents