TARIQ GLASS INDUSTRIES LIMITED CORPORATE BRIEFING SESSION - 2020

Welcome message from author
This document is posted to help you gain knowledge. Please leave a comment to let me know what you think about it! Share it to your friends and learn new things together.
Transcript

TARIQ GLASS INDUSTRIES LIMITED
CORPORATE BRIEFING SESSION - 2020

The Company is principally engaged in the manufacture and sale of Glass
Containers, Tableware Glass, Float glass & Opal Glass Dinnerware.
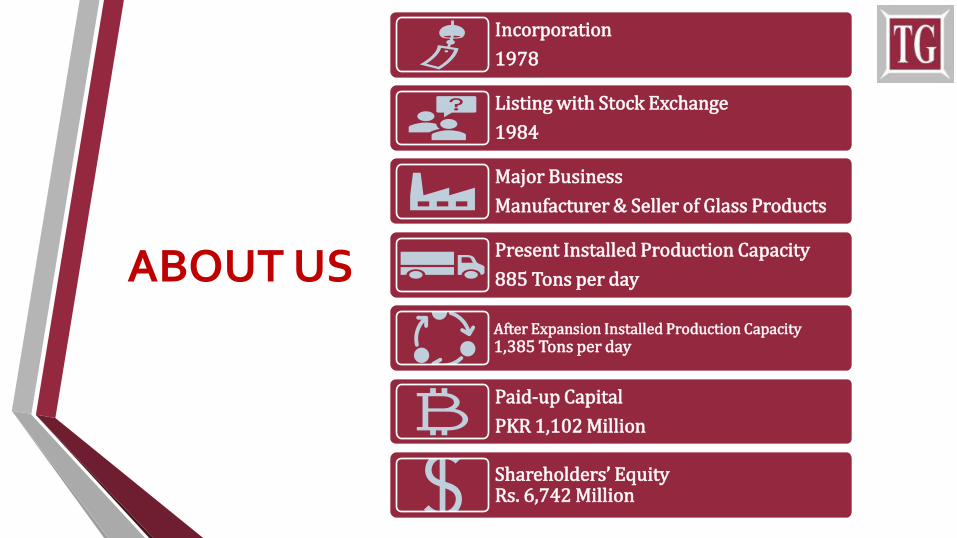
ABOUT US
Incorporation
1978
Listing with Stock Exchange
1984
Major Business
Manufacturer & Seller of Glass Products
Present Installed Production Capacity
885 Tons per day
After Expansion Installed Production Capacity1,385 Tons per day
Paid-up Capital
PKR 1,102 Million
Shareholders’ Equity Rs. 6,742 Million

MR. MANSOOR IRFANIChairman
MR. OMER BAIGCEO / Managing Director
MR. MOHAMMAD BAIGExecutive Director
MS. RUBINA NAYYARNon-Executive Director
MR. FAIZ MUHAMMADIndependent Director
MR. TAJAMMAL HUSSAIN
Independent Director
BOARD OF DIRECTORS
MR. SAAD IQBALNon-Executive Director
OUR BRANDS
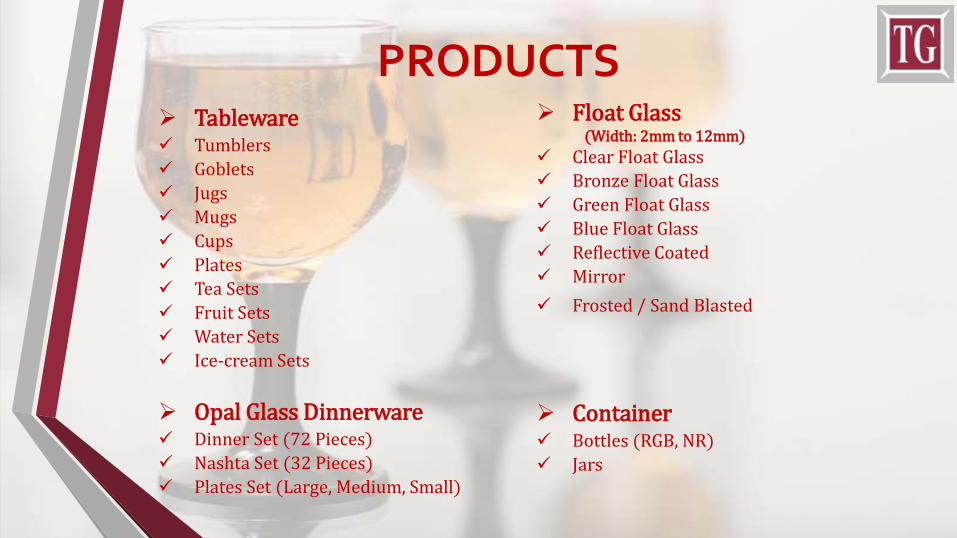
PRODUCTS➢ Tableware✓ Tumblers
✓ Goblets
✓ Jugs
✓ Mugs
✓ Cups
✓ Plates
✓ Tea Sets
✓ Fruit Sets
✓ Water Sets
✓ Ice-cream Sets
➢ Opal Glass Dinnerware✓ Dinner Set (72 Pieces)
✓ Nashta Set (32 Pieces)
✓ Plates Set (Large, Medium, Small)
➢ Float Glass(Width: 2mm to 12mm)
✓ Clear Float Glass
✓ Bronze Float Glass
✓ Green Float Glass
✓ Blue Float Glass
✓ Reflective Coated
✓ Mirror
✓ Frosted / Sand Blasted
➢ Container✓ Bottles (RGB, NR)
✓ Jars
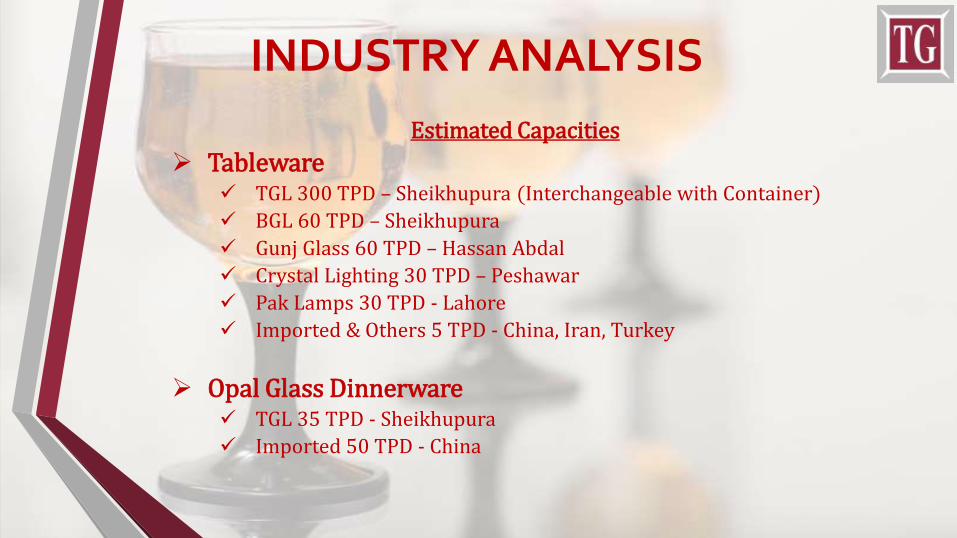
Estimated Capacities
➢ Tableware✓ TGL 300 TPD – Sheikhupura (Interchangeable with Container)
✓ BGL 60 TPD – Sheikhupura
✓ Gunj Glass 60 TPD – Hassan Abdal
✓ Crystal Lighting 30 TPD – Peshawar
✓ Pak Lamps 30 TPD - Lahore
✓ Imported & Others 5 TPD - China, Iran, Turkey
➢ Opal Glass Dinnerware✓ TGL 35 TPD - Sheikhupura
✓ Imported 50 TPD - China
INDUSTRY ANALYSIS

Estimated Capacities
➢ Float Glass✓ TGL (Current) 550 TPD - Sheikhupura
✓ TGL (After Expansion) 1050 TPD - Sheikhupura
✓ Ghani 1000 TPD – Sheikhupura
✓ Imported 5 TPD – Saint Gobbin, Guardian, Pilkington,
Rider, Other Chinese Brands
➢ Container✓ TGL 70 TPD – Sheikhupura (Interchangeable with Tableware)
✓ Ghani 250 TPD – Hattar & Karachi
✓ Murree Brewery 110 TPD – Hassan Abdal
INDUSTRY ANALYSIS
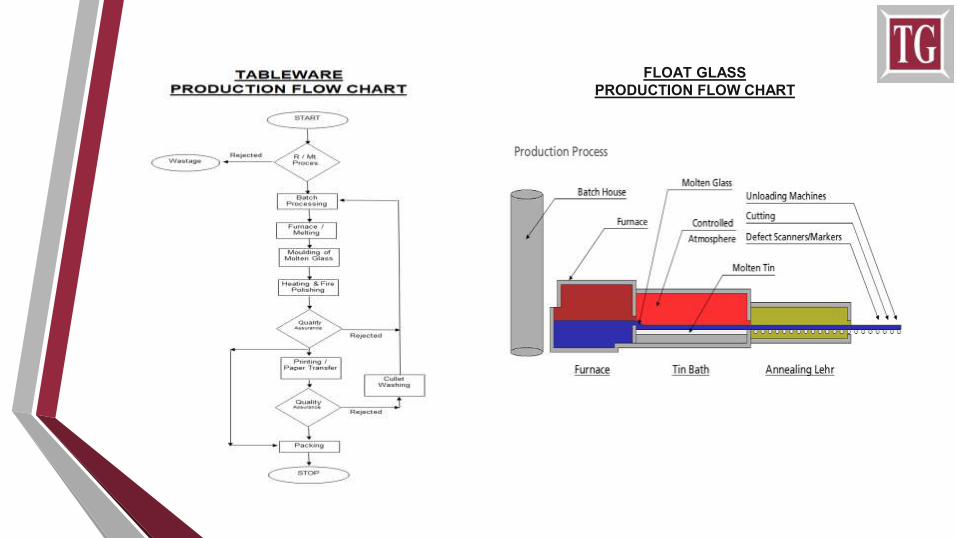
FLOAT GLASS
PRODUCTION FLOW CHART

KEY FINANCIALINDICATORS

Production Capacity
168,263 183,486 188,451 214,538 193,487
55,546 68,294 64,967 53,044 54,904
2016 2017 2018 2019 2020
Production Capacity (in Metric Tons)
Packed Capacity Cullet
213,101 223,809 251,780 253,418 267,582

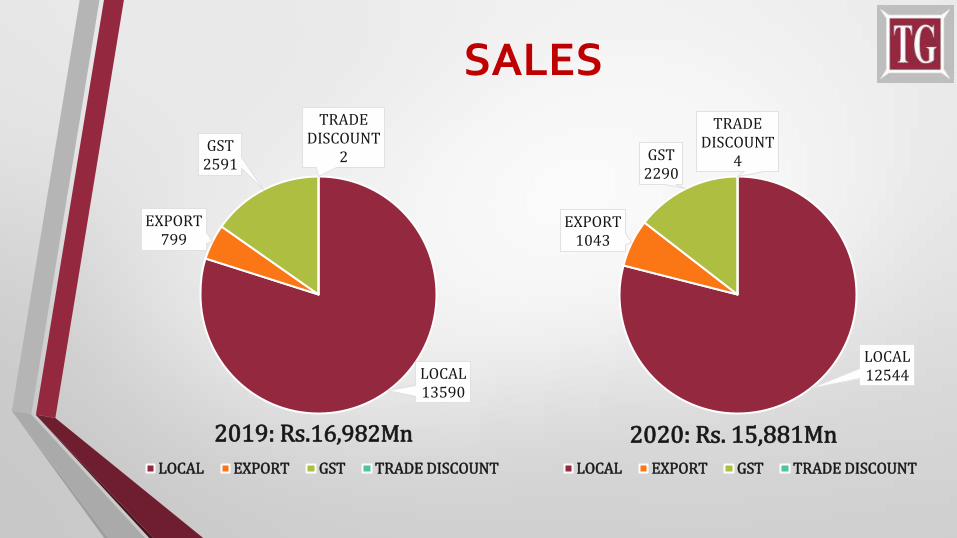
SALES
74279170
11552
1359012544
649
733
749
7991043
1380
1680
2106
25912290
152
10
1
2
4
0
2000
4000
6000
8000
10000
12000
14000
16000
18000
2016 2017 2018 2019 2020
(Amt. in Million Rs.)
Local Export GST Trade Discount
9,607
11,592
14,263
16,98215,881
SALES
LOCAL13590
EXPORT799
GST2591
TRADE DISCOUNT
2
2019: Rs.16,982Mn
LOCAL EXPORT GST TRADE DISCOUNT
LOCAL12544
EXPORT1043
GST2290
TRADE DISCOUNT
4
2020: Rs. 15,881MnLOCAL EXPORT GST TRADE DISCOUNT
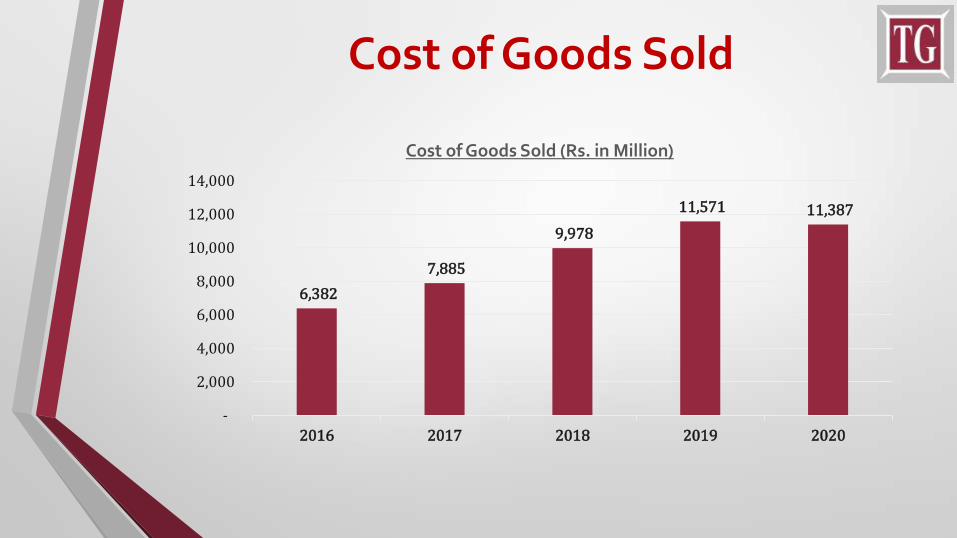
Cost of Goods Sold
6,382
7,885
9,978
11,571 11,387
-
2,000
4,000
6,000
8,000
10,000
12,000
14,000
2016 2017 2018 2019 2020
Cost of Goods Sold (Rs. in Million)
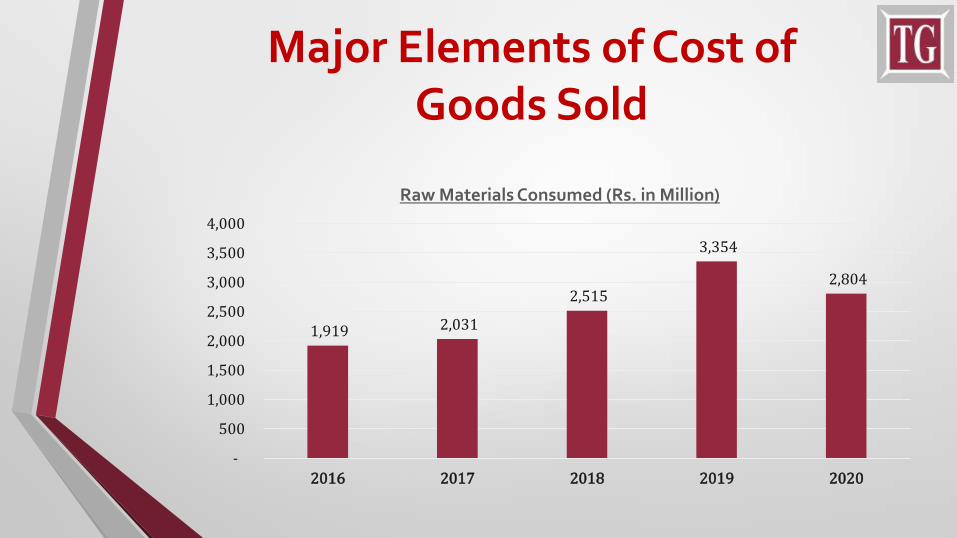
Major Elements of Cost of Goods Sold
1,919 2,031
2,515
3,354
2,804
-
500
1,000
1,500
2,000
2,500
3,000
3,500
4,000
2016 2017 2018 2019 2020
Raw Materials Consumed (Rs. in Million)

2,058
2,697
3,478
4,711 4,699
-
500
1,000
1,500
2,000
2,500
3,000
3,500
4,000
4,500
5,000
2016 2017 2018 2019 2020
Fuel and Power (Rs. in Million)
Major Elements of Cost of Goods Sold

502.8
677.6 751.5
964.8 1,046.0
-
200.0
400.0
600.0
800.0
1,000.0
1,200.0
2016 2017 2018 2019 2020
Packing Material (Rs. in Million)
Major Elements of Cost of Goods Sold

Administrative Expenses
148
177
213238
272
0
50
100
150
200
250
300
2016 2017 2018 2019 2020
Administrative Expenses (Rs. in Million)
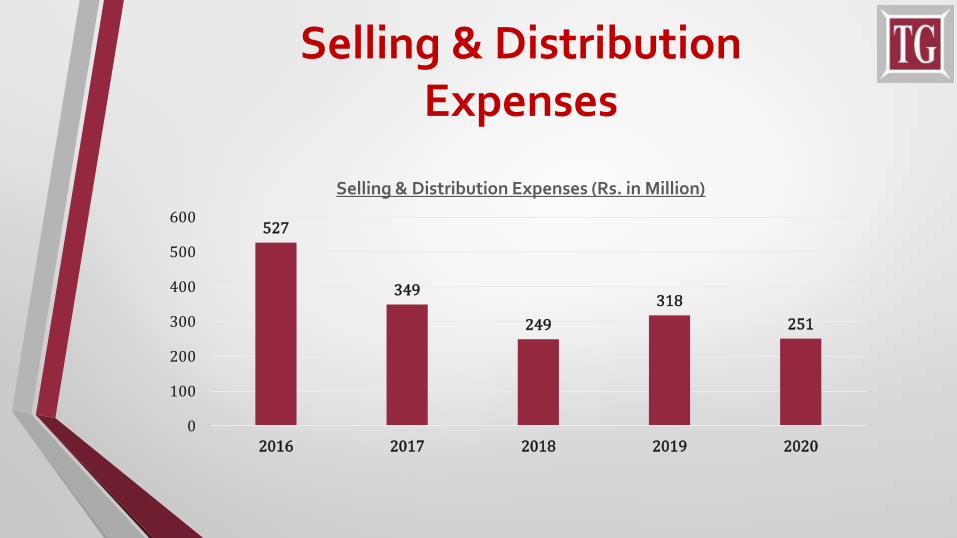
Selling & Distribution Expenses
527
349
249
318
251
0
100
200
300
400
500
600
2016 2017 2018 2019 2020
Selling & Distribution Expenses (Rs. in Million)

Finance Cost
336
249
153
310
568
0
100
200
300
400
500
600
2016 2017 2018 2019 2020
(Amt. in Million)

Financial Performance
6.07
7.678.92
9.20
5.61
0
2
4
6
8
10
2016 2017 2018 2019 2020
Net Profit Margin (%)
Net Profit
20.98 20.38 18.89 19.5916.19
0
10
20
30
2016 2017 2018 2019 2020
Gross Profit Margin (%) Gross Profit Ratio

Financial Performance
20.81
8.23 10.47
29.81
56.98
-
10.00
20.00
30.00
40.00
50.00
60.00
2016 2017 2018 2019 2020
Percentage of Debt to EquityDebt

20.81 8.23 10.47
29.81
56.98
79.19 91.77 89.53
70.19
43.02
0%
10%
20%
30%
40%
50%
60%
70%
80%
90%
100%
2016 2017 2018 2019 2020
Debt to Equity (%)
Debt Equity
Financial Performance

1.11 1.10 1.311.00 1.01
1 1 11 1
2016 2017 2018 2019 2020
Current Ratio
Current Liabilities
Current Assets
Financial Performance

73.9
110.7 107.1
76.5864.52
2016 2017 2018 2019 2020
Market Price Per Share (Amt. in Rs.)
35.84 40.6647.85
55.7161.18
2016 2017 2018 2019 2020
Book Value Per Share (Amt. in Rs.)
Financial Performance

4.45
6.89
9.96
12.01
6.91
2016 2017 2018 2019 2020
Earnings Per Share (Rupees)
EPS
Financial Performance

2.70
4.15
6.00
4.00
- -
1.00
2.00
3.00
4.00
5.00
6.00
7.00
2016 2017 2018 2019 2020
Dividend per Share (Rs.)
Dividend Per Share
Financial Performance
50%INTERMBONUSSHARES
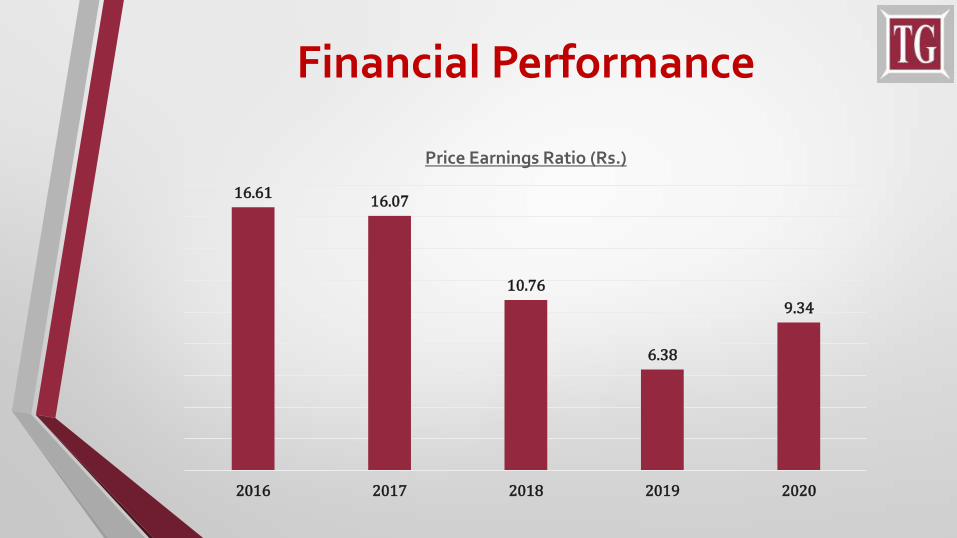
16.6116.07
10.76
6.38
9.34
2016 2017 2018 2019 2020
Price Earnings Ratio (Rs.)
Financial Performance

17.35
25.3723.76
19.03
14.65
0
5
10
15
20
25
30
2016 2017 2018 2019 2020
Return on Capital Employed (%)
Return on Capital Employed
Financial Performance
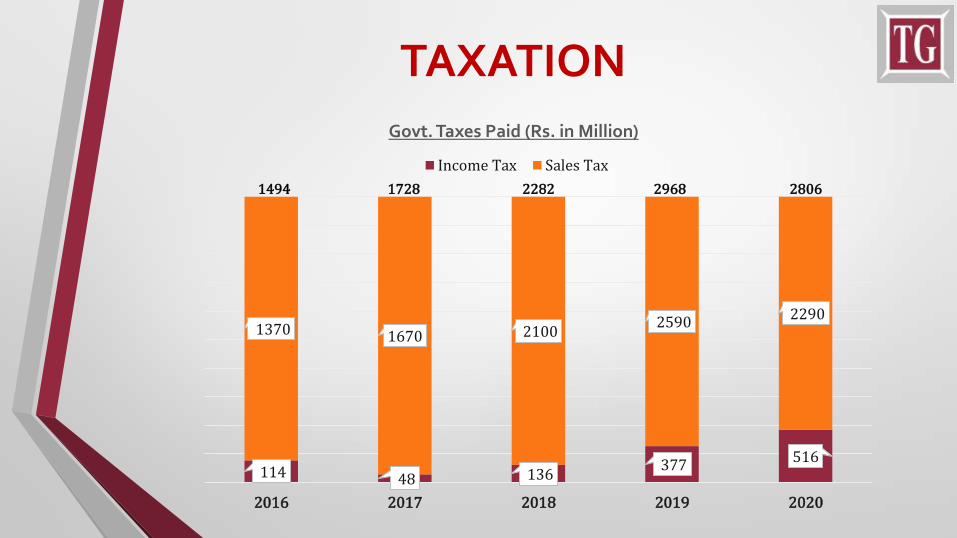
114 48 136377
516
1370 1670 21002590
2290
2016 2017 2018 2019 2020
Govt. Taxes Paid (Rs. in Million)
Income Tax Sales Tax
1494 1728 2282 2968 2806
TAXATION

757814
914992 1006
0
200
400
600
800
1000
1200
2016 2017 2018 2019 2020
No. of Employees
Number of Employees

FUTURE OUTLOOK

FUTURE OUTLOOK➢ Pak Economy is contracting, GDP Growth is in negative for the first time after 1952 (As per SBP’s
Annual Report)
➢ Industrial Sector Output declined by 2.6% for the FY20 in contrast to 2.3% of FY19 (As per SBP,
it’s first time in the history that industrial sector has contracted in a row for two years)
➢ Power tariff is increasing, gas shutdowns are expected in winter, Double digit inflation may
continue – all this will result in increased cost of production.
➢ SBP has estimated GDP Growth of 1.5% to 2.5% for the current fiscal year FY 2020-2021.
➢ Competition is going to be stiff in Tableware Market as new entrants are likely to penetrate e.g.,
Deli Glass (with a capacity of 120 Tons / Day) and existing market players who also are doubling
their production capacities like BGL, Gunj Glass and Crystal Glass.

➢ Insha Allah Company will Maintain its leading position in Tableware Market as the Company is
focusing on new articles, varieties and designs of Tableware Products.
➢ TGL is successfully completing the expansion project of Float Glass Plant Unit-2, the erection &
installation is almost 95% complete & Chinese experts will soon arrive for the final inspection
and heating of the furnace.
➢ The Company’s existing production line of float glass (Float Glass Plant Unit–1 with a capacity
of 550 tons per day) is in operation since 22 March 2013, its furnace will complete its useful
campaign life by June-2021 and will be closed for major repair / rebuild. This furnace will take
5 to 6 months for the rebuild. The Tableware Furnace No. 2 and Furnace No 3 with a capacity of
150 tons per day each will be due for major repair in October-2021 and March-2022, the
rebuild time of these furnaces is around 4 months each. These capital intensive BMRs require
Rs. 1.5 billion approximately in the future.


Thank You
Related Documents


