TARIFF MODEL FOR SMALL WATER UTILITIES Regulated by the NATIONAL WATER RESOURCES BOARD USER’S MANUAL Revised September 2008

Welcome message from author
This document is posted to help you gain knowledge. Please leave a comment to let me know what you think about it! Share it to your friends and learn new things together.
Transcript

TARIFF MODEL
FOR
SMALL WATER UTILITIES Regulated by the
NATIONAL WATER RESOURCES BOARD
USER’S MANUAL
Revised September 2008

ABBREVIATIONS AND ACRONYMS
CAPEX Capital Expenditures CPC Certificate of Public Convenience Cu. m., m3 Cubic Meters EPA Extraordinary Price Adjustments EV Equivalent Volume KPI Key Performance Indicators lps Liters per Second MB Megabytes MWCI Manila Water Company, Inc. MWSI Maynilad Water Services, Inc NRW Non-Revenue Water NSO National Statistics Office NWRB National Water Resources Board OPEX Operating Expenses PEISER Property and Equipment in Service Entitled to Return PIP Performance Improvement Plan RAM Random Access Memory ROI Return on Investments VAT Value-Added Tax

TABLE OF CONTENTS
1 WHAT IS THE NWRB TARIFF MODEL?..........................................................................................1 2 SOFTWARE AND HARDWARE REQUIREMENTS..........................................................................1 3 HOW TO USE THE MODEL............................................................................................................2
3.1 ORGANIZATION OF THE MODEL ................................................................................................2 3.2 INITIAL REQUEST FOR TARIFF APPROVAL.....................................................................................3 3.3 SUBSEQUENT REQUEST FOR TARIFF APPROVAL............................................................................6 3.4 EXTRAORDINARY PRICE ADJUSTMENTS ......................................................................................8
4 DOCUMENTS NEEDED ...............................................................................................................10 4.1 APPLICATION FOR INITIAL CPC AND APPROVAL OF TARIFF ......................................................10 4.2 APPLICATION FOR RENEWAL OF CPC AND APPROVAL OF TARIFF ............................................10
5 OUTPUT SHEETS...........................................................................................................................11 5.1 REPORTS SHEET ......................................................................................................................11 5.2 EVALUATION SHEET ................................................................................................................16 5.3 HIGHLIGHTS...........................................................................................................................18
6 INPUT SHEETS ..............................................................................................................................21 6.1 OPENING SHEET ....................................................................................................................21 6.2 ASSUMPTIONS SHEET ..............................................................................................................23 6.3 PERFORMANCE IMPROVEMENT PLAN (PIP) SHEET....................................................................29
7 COMPUTATION SHEETS .............................................................................................................32 7.1 SUPPLY & DEMAND SHEET......................................................................................................32 7.2 OPEX SHEET .........................................................................................................................33 7.3 BORROWINGS SHEET..............................................................................................................35 7.4 MOVEMENTS SHEET................................................................................................................36 7.5 COOP SHEET.........................................................................................................................36 7.6 CONSUMPTION SHEET ............................................................................................................37 7.7 TARIFF COMPUTATION SHEET ..................................................................................................39 7.8 DISALLOWANCES SHEET .........................................................................................................39
8 CPX SHEETS.................................................................................................................................41 8.1 INPUT SHEETS .........................................................................................................................42
8.1.1 CPX Depn Table Sheet ............................................................................................................................. 42 8.1.2 CPX Inv Constant Sheet ........................................................................................................................... 42 8.1.3 CPX Begin Sheet ........................................................................................................................................ 43 8.1.4 CPX Inv No Return Constant Sheet......................................................................................................... 43
8.2 COMPUTATION SHEETS ...........................................................................................................43 8.2.1 CPX Inv Current Sheet .............................................................................................................................. 43 8.2.2 CPX Inv No Return Current Sheet............................................................................................................ 44 8.2.3 CPX ROI Inv Sheet...................................................................................................................................... 44 8.2.4 CPX ROI Cum. Assets Sheet ..................................................................................................................... 44 8.2.5 CPX ROI Depn Sheet................................................................................................................................. 44 8.2.6 CPX ROI Accum Depn Sheet .................................................................................................................. 44 8.2.7 CPX ROI NBV Sheet ................................................................................................................................... 44

LIST OF FIGURES
FIGURE 3-1 MAP OF THE TARIFF MODEL ......................................................................................................2
LIST OF TABLES
TABLE 3-1 RETURN ON INVESTMENTS EVALUATION - PAST AND PROJECTED YEARS..........................................9 TABLE 5-1 LEVELS OF SERVICE...................................................................................................................11 TABLE 5-2 KEY PERFORMANCE INDICATORS ..............................................................................................12 TABLE 5-3 INCOME STATEMENT .................................................................................................................12 TABLE 5-4 FLOW OF FUNDS STATEMENT .....................................................................................................13 TABLE 5-5 BALANCE SHEET .......................................................................................................................14 TABLE 5-6 RECOMMENDED TARIFF RATES ..................................................................................................15 TABLE 5-7 RETURN ON INVESTMENTS EVALUATION – PROJECTED YEARS.......................................................17 TABLE 5-8 HIGHLIGHTS SHEET....................................................................................................................20 TABLE 6-1 INCOME STATEMENT INPUT SHEET...............................................................................................22 TABLE 6-2 BALANCE SHEET INPUT SHEET.....................................................................................................23 TABLE 6-3 INFLATION ASSUMPTION............................................................................................................24 TABLE 6-4 AVERAGE INCOME OF LOW-INCOME HOUSEHOLD ....................................................................24 TABLE 6-5 BALANCE SHEET ASSUMPTIONS .................................................................................................25 TABLE 6-6 INCOME STATEMENT ASSUMPTIONS ...........................................................................................27 TABLE 6-7 SUPPLY AND DEMAND ASSUMPTIONS ........................................................................................29 TABLE 6-8 PIP SHEET ................................................................................................................................31 TABLE 7-1 SUPPLY AND DEMAND SECTION ................................................................................................32 TABLE 7-2 REVENUES SECTION ..................................................................................................................32 TABLE 7-3 BORROWINGS SHEET ................................................................................................................36 TABLE 7-4 CONNECTIONS AND CONSUMPTION INPUT................................................................................37 TABLE 7-5 INCREMENT FACTOR INPUT..........................................................ERROR! BOOKMARK NOT DEFINED. TABLE 8-1 CPX BEGIN SHEET INPUTS .........................................................................................................45

National Water Resources Board Tariff Model For Private Water Utilities User’s Manual
1
1 What is the NWRB Tariff Model? The NWRB Tariff Model is a spreadsheet-based financial management model specially designed for private water utilities regulated by the National Water Resources Board (NWRB)1. It helps water utilities in setting their water tariff to charge to customers. The Tariff Model calculates the required revenue requirements using the modified return on investments (ROI) methodology. It generates reports required to be submitted to NWRB for a request for tariff approval, such as the proposed tariff structure, Income Statement and Balance Sheet, among others. The model is also a tool for NWRB to regulate water utilities applying for the approval of their water rates. The model is also a financial projection model that can show how the water utility will perform in the next five years, based on assumptions that were inputted into the model. It is a useful tool in assessing the performance of the water utility and it can be used for what-if scenarios that would be very helpful in making decisions. The objective of this User’s Manual is to help water utilities use the Tariff Model to come up with proposed tariff rates for approval by NWRB. It does not intend, and should not be considered, as a text for specific rate setting methodology.
2 Software and Hardware Requirements The Tariff Model is an Excel file composed of several sheets that are linked together. It was developed in Microsoft Excel (2002). The model requires a personal computer (PC) which should have the following hardware:
Floppy drive that can read the 3.5” high-density (1.4 MB) diskette or CD-ROM drive Hard drive Color monitor RAM of around 3 MB to open the files, in addition to the RAM for the system
requirements and software program
1 This Tariff Model was developed by IDP Consult, Inc. in 2005 under ADB TA 6123-REG: Pilot and Demonstration Activity – Rationalizing Tariffs for Private Water Utilities under the National Water Resources Board. This September 2008 version of the model reflects improvements after being tested in the NWRB-regulated water utilities participating in the Small Water Utilities Improvement and Financing Project (SWIF) of the Water and Sanitation Program of the World Bank.
National Water Resources Board Tariff Model For Private Water Utilities User’s Manual
2
3 How to Use the Model
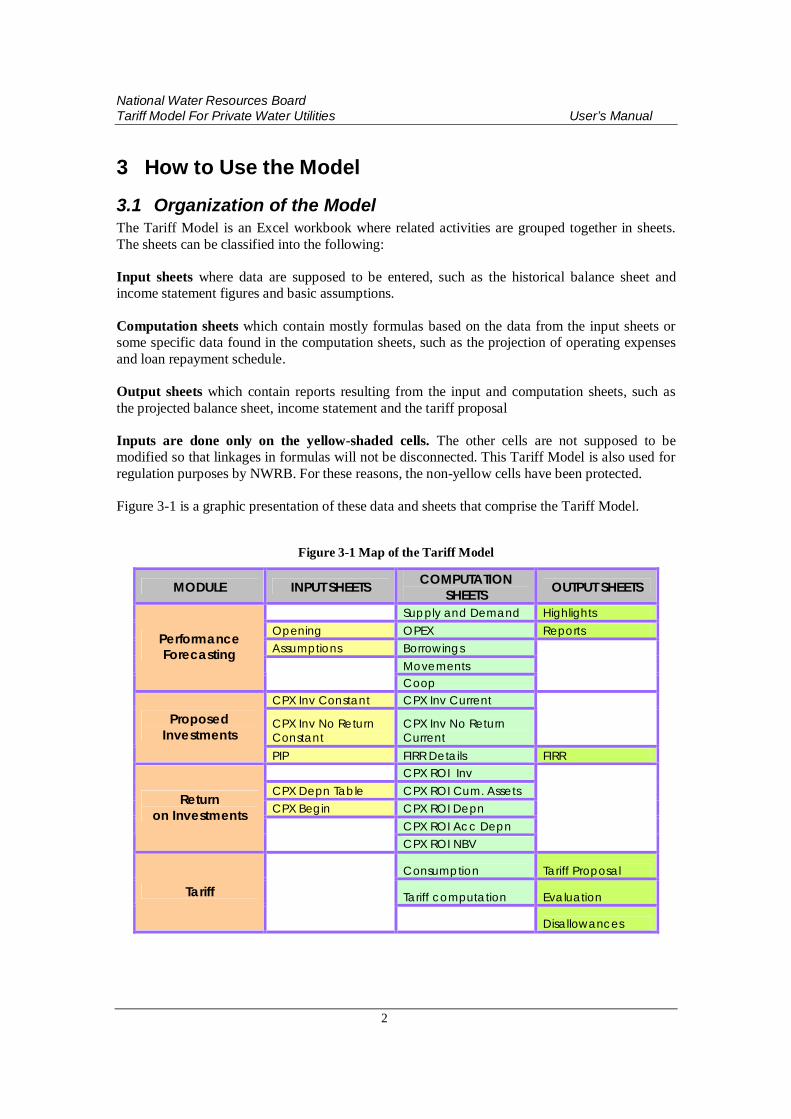
3.1 Organization of the Model The Tariff Model is an Excel workbook where related activities are grouped together in sheets. The sheets can be classified into the following: Input sheets where data are supposed to be entered, such as the historical balance sheet and income statement figures and basic assumptions. Computation sheets which contain mostly formulas based on the data from the input sheets or some specific data found in the computation sheets, such as the projection of operating expenses and loan repayment schedule. Output sheets which contain reports resulting from the input and computation sheets, such as the projected balance sheet, income statement and the tariff proposal Inputs are done only on the yellow-shaded cells. The other cells are not supposed to be modified so that linkages in formulas will not be disconnected. This Tariff Model is also used for regulation purposes by NWRB. For these reasons, the non-yellow cells have been protected. Figure 3-1 is a graphic presentation of these data and sheets that comprise the Tariff Model.
Figure 3-1 Map of the Tariff Model
MODULE INPUT SHEETS COMPUTATION SHEETS OUTPUT SHEETS
Supply and Demand Highlights Opening OPEX Reports Assumptions Borrowings
Movements
Performance Forecasting
Coop CPX Inv Constant CPX Inv Current
CPX Inv No Return Constant
CPX Inv No Return Current
Proposed Investments
PIP FIRR Details FIRR CPX ROI Inv CPX Depn Table CPX ROI Cum. Assets CPX Begin CPX ROI Depn
CPX ROI Acc Depn
Return on Investments
CPX ROI NBV
Consumption Tariff Proposal
Tariff computation Evaluation Tariff
Disallowances

National Water Resources Board Tariff Model For Private Water Utilities User’s Manual
3
3.2 Initial Request for Tariff Approval This section applies to a water utility requesting for approval of its water tariffs from NWRB for the first time. The documents required are enumerated in Section 4.1 below. The following are the procedures in coming up with the proposed water tariffs to be submitted for approval. A. Input all required data in the yellow cells.
1. Go to the Opening sheet and input the audited income statement and balance sheet accounts for the last two years in the yellow cells (see also discussions in Section 6.1).
2. Go to the Assumptions sheet and input the assumptions and other data required for the projections in the yellow cells (see also discussions in Section 6.2).
3. Go to the other sheets and fill up the applicable yellow cells for the following data:
a. Highlights sheet (see Section 5.4) Installed production capacity in lps % NRW New connections Number of employees Collection period, in days
b. Performance Improvement Plan (PIP) sheet (see Section 6.3) Capital investments by year of disbursement Operating expenses by year of disbursement
c. Supply & Demand sheet (see Section 7.1) New connection fees - rate increase Other operating revenues - % of total operating revenues
d. OPEX sheet (see Section 7.2) Management fees
e. Borrowings sheet (see Section 7.3) Additions to outstanding loans Amortization of outstanding loans Interest expense of outstanding loans Terms of new loan
f. Movements (see Section 7.4) Fixed assets excluding land – disposal/retirement of assets Other current liabilities – additions, payments Other liabilities – increase / decrease Capital reserves – increase / decrease
g. Coop Sheet (see Section – 7.5) Percent of new connections becoming members of the Cooperative Par value of each share Percentage of initial payment Amount of monthly payment Payment period, in number of months Number of members with fully paid shares Amount of monthly capital build-up paid by members
h. Consumption Sheet (see Section 7.6) Number of connections

National Water Resources Board Tariff Model For Private Water Utilities User’s Manual
4
Average monthly consumption Increment factor
i. Tariff Computation (see Section 7.7) Increment factor for Public Tap
j. CPX Begin Table (see Section 8.1.2) Acquisition date of assets Acquistion cost of assets Funding source of the asset Classification of asset for purposes of identifying Property and Equipment
Entitled to Return (PEER) k. CAPEX Inv Constant (see Section 8.1.3)
Existing assets acquired during the last 5 years Capital investments during the next five years
l. CAPEX Inv No Return (see Section 8.1.4) Existing assets not entitled to return Capital investments during the next five years not entitled to return
B. Evaluate results.
1. Go to the Evaluation sheet. Set the required ROI in the line “Maximum Allowable Rate of Return” under Year 1. NWRB allows a maximum ROI of 12%. The water utility may set an ROI lower than 12% if this is what it prefers (see also discussions in Section 5.3).
2. Go to the Highlights sheet (see also discussions in Section 5.4).
a. The line “Average Tariff/m3 to yield 12% ROI” shows the maximum tariff that may be implemented at 12% ROI for each of the five years, and their average under the column of Average, Years 1-5.
b. If the water utility wants to use these rates, place the average for years 1-5 in the yellow cell in the next line, “Average Tariff/m3 for implementation”. The water utility may opt not to use this maximum average tariff for its own reasons, and input its desired average tariff to be implemented in the yellow cell instead.
c. Check the line “Additional Equity Needed”.
This line represents funds shortage. It is assumed that whatever shortage appears in funding requirements will be covered by additional equity investments. This line should have a “0” balance, unless the water utility intentionally wants to add equity for the funds shortage.
The water utility has several options in eliminating the financing gap, as discussed below. All the options below should be based on the water utility’s Business Plan for the next five years, or the Business Plan should be revised if the results in the Tariff Model show that the Business Plan is not giving satisfactory results.

National Water Resources Board Tariff Model For Private Water Utilities User’s Manual
5
Fine-tune Assumptions
The water utility may return to the assumptions it initially made. Significant assumptions that have a major impact on the operations of a water utility have been grouped in the upper portion of the Highlights sheet, so that the user does need to go back and forth among the different sheets. These are :
% Non-revenue water Installed production capacity New connections to be added every year Number of employees Collection period
While changing the above variables, check that there is no water shortage shown in the line “Water Surplus/Shortage”, and that the percent population served does not exceed 100% as shown in the line “% Population Served”. Check also that the water utility is satisfied with the resulting personnel ratio, net income ratio, operating ratio and average operating cost per cubic meter sold. Modify Capital Investments The water utility may modify its capital investments by adjusting the timing to a year that can afford the costs. It may also modify the cost of the capital investments.
Borrowings and Donations
If the water utility does not intend to add equity investments, it may obtain funds in the form of additional capital, notes or loans payable, and donations from the following sources:
Affiliated company Shareholders Banks and other third parties
For water cooperatives, capital contributions of members may also be tapped as fund sources for investments.
Do iterations of the above until the water utility is satisfied with the results as shown in the Highlights sheet. To see the overall impact on the utility performance, review the Evaluation sheet and the reports in the Reports sheet.
d. Copy the value under the average for years 1-5 to the yellow cell on Year 1 in the line “average tariff/m3 for implementation” to update the ROI calculation. The resulting average annual return on investments should not exceed 12%. This is done as follows:
Copy the value by using these commands (do not just copy the contents of the cell, as this will have a different result) -
Click the cell to be copied. Edit / copy

National Water Resources Board Tariff Model For Private Water Utilities User’s Manual
6
Click the location where the cell will be copied. Edit / paste special / values
Press F4 at least five times (to repeat the last command, which was to copy the value of a cell), or until Excel has completed recalculating.
3. Go to the Tariff Computation sheet to fine-tune the proposed tariff (see also discussions
in Section 7.6). Adjust the increment factor until:
The minimum charge affordability is met; The gap between the required revenue requirements and the revenues
generated by the tariff is down to a minimum; and The water utility is satisfied with the resulting water rates to be proposed.
This can be reviewed in the Tariff Proposal sheet.
3.3 Subsequent Request for Tariff Approval This section applies to a water utility which is requesting for a subsequent approval of its water tariffs from NWRB. The documents required are enumerated in Section 4.2 below. The procedures are similar to those for an initial request for tariff approval enumerated in Section 3.2 above. The following are the procedures. A. Input all required data.
1. Go to the Opening sheet and input the audited income statement and balance sheet accounts for the last five years (see also discussions in Section 6.1).
2. Go to CPX Begin sheet. Input the details of the property and equipment in service for the end of Year -4 (the beginning year of the old tariff period). See Section 8.1.2 for more detailed discussion on how to do this, and Table 8-1 for the contents of this sheet.
3. Follow the same procedures as in Section 3.2.A.
B. Evaluate results.
Procedures for evaluating results for the next five years are the same as those in Section 3.2.B, except that the Depreciation Reserve Fund is now an available source of funding.
The Depreciation Reserve Fund is required to be maintained by all CPC grantees. The amount of depreciation expense is supposed to be deposited to this fund. This fund may only be used for capital investments, rehabilitation, repairs and maintenance of existing assets. This fund becomes an additional source of funds to the water utility which was not yet available to an initial CPC applicant.
The following are the additional procedures for evaluating performance during the past five years.
1. Review past performance.
For a subsequent tariff application, the water utility’s performance in the last five years is evaluated against the approved targets. Variances may either be allowed or disallowed.

National Water Resources Board Tariff Model For Private Water Utilities User’s Manual
7
a. Capital Expenditures
It may happen that capital expenditures were not implemented according to schedule which may affect the revenues generated. In such a case, the actual implementation should be inputted in the CPX Inv Constant sheet by inputting the actual amount invested under the corresponding year. Variances in capital expenditures affect the computation of the net book value of property and equipment that will be the basis of the ROI.
b. Operating Expense
Operating expenses are audited to check that they were incurred prudently and efficiently. Disallowed excessive and unauthorized expenses are inputted in the Evaluation Sheet for the past years, in the section that computes the working capital. They affect the working capital and operating expenses that form part of the revenue requirements.
The Tariff Model has special computations for the evaluation of power and chemical costs arising from the variance in the unit costs of their target and actual costs. These variances are computed in the Disallowances sheet. See detailed discussion on this in Section 7.7.
c. Non-Revenue Water
When a water utility does not meet the approved target NRW percentage, it is penalized or rewarded, but after being given a flexibility of +10% of the approved target percentage. The adjustment comes in the form of its effect on power and chemical costs incurred or saved on the extra or lesser volume of water it needed to produce to be able to meet its production requirements. These are computed in the Disallowances sheet. See details on how this is done in the discussion of the Disallowances sheet, Section 7.7.
The penalty on the above becomes an adjustment to operating expenses and working capital for the past years.
d. Tariff Implementation
The actual tariff implemented may have been in accordance with the approved average tariff. But due to variances in the implementation against the projections, allowances or disallowances may occur. One example is capital investments that were not implemented on time, resulting to number of connections not met, and consequently water revenues not generated as projected. These allowances/disallowances are discussed in detail in the discussion of the Disallowances sheet, Section 7.7.
Variances related to the adjusted tariff are brought forward to the next five-year period as an adjustment to revenue requirements for that period.

National Water Resources Board Tariff Model For Private Water Utilities User’s Manual
8
2. Compute adjusted revenue requirements.
a. For the past five-year period, the revenue requirements become adjusted after reflecting the allowances/disallowances discussed in (1) above.
b. For the next five years, the revenue requirements are adjusted by the tariff implementation adjustments discussed in (1) (d) above.
c. Do iterations of refining the results in the Highlights sheet, as discussed in Section 3.2.B above, until the water utility is satisfied with the results. For the bigger picture, the Evaluation sheet and the reports in the Reports sheet may also be reviewed.
d. In the Highlights sheet, copy the amount under the average for years 1-5 to the yellow cell under Year 1 in the line “average tariff/m3 for implementation” to update the ROI calculation. The resulting average annual return on investments may exceed 12% due to the adjustments from the previous five-year period. This average tariff for implementation will now be the basis for the water rates proposal.
3. Fine-tune the tariff proposal by adjusting the increment factor in the Tariff Computation sheet (see also discussions in Section 7.6).
Adjust the increment factor until:
The minimum charge affordability is met; and The water utility is satisfied with the resulting water rates to be proposed.
This can be viewed in the Tariff Proposal sheet.
See Table 3-1 for the full display of the Evaluation sheet including the review of the past five-year period.
3.4 Extraordinary Price Adjustments Extraordinary price adjustments (EPA) are allowed within the five-year validity of water tariffs should there be unforeseen events that occurred significantly affecting the operations of the water utility. An example that warrants this kind of adjustment is a drastic increase in power costs. In such cases, the existing five-year validity period is retained. This is done in the Tariff Model as follows:
a. Change the projected data with actual data for years that have already elapsed in the five-year validity of the existing tariffs.
b. Update assumptions affected for the remaining projected years in the Assumptions sheet.
Evaluation of the ROI and tariff remains the same as in Section 3.2.

National Water Resources Board Tariff Model For Private Water Utilities User’s Manual
9
Table 3-1 Return on Investments Evaluation - Past and Projected Years 2004 2005 2006 2007 2008 Average 2009 2010 2011 2012 2013 Total
Year-4 Year-3 Year-2 Year-1 Year 0 Year 1 Year 2 Year 3 Year 4 Year 5 Years 1-5
Property & Equipment, beg - 5,394,337 5,452,390 8,652,619 9,228,293 10,967,147 16,418,930 20,791,422 26,279,084 30,804,091
New Investments 5,394,337 58,053 3,200,229 575,674 1,738,855 5,451,782 4,372,492 5,487,662 4,525,007 2,081,047
Property and Equipment in Service Entitled to Return, end5,394,337 5,452,390 8,652,619 9,228,293 10,967,147 16,418,930 20,791,422 26,279,084 30,804,091 32,885,138
Less: Accumulated Depreciation 2,076,884 2,252,585 2,445,691 2,780,455 3,191,243 (3,951,038) (5,511,372) (7,572,726) (10,138,125) (13,104,019)
Net Book Value 7,471,221 7,704,975 11,098,310 12,008,748 14,158,391 12,467,891 15,280,050 18,706,358 20,665,966 19,781,119
Add: Working CapitalOperating Expenses excluding depreciation 1,925,799 2,102,719 2,129,911 2,917,963 2,769,453 3,516,022 4,385,612 5,342,902 6,492,997 7,500,919
Allowed (Disallowed) Expenses
Personnel and Management Fees
Power #DIV/0! (9,616) (14,720) (18,765) (16,935)
Chemicals #DIV/0! - (15,975) (22,735) (18,653)
Repairs and Maintenance
Bulk Water Purchases
Bad Debts
General and Administrative Expenses - - - - -
NRW-related Adjustment #DIV/0! - - - -
Adjusted Operating Expenses #DIV/0! 2,093,103 2,099,216 2,876,464 2,733,865 3,516,022 4,385,612 5,342,902 6,492,997 7,500,919
2-Months Average Cash Operating Expenses #DIV/0! 348,850 349,869 479,411 455,644 586,004 730,935 890,484 1,082,166 1,250,153
Total Invested Capital Entitled to Return - 8,053,826 11,448,179 12,488,159 14,614,035 9,320,840 13,053,895 16,010,986 19,596,841 21,748,132 21,031,273 18,288,225
Maximum Allowable Rate of Return 12.0% 12.0% 12.0% 12.0% 12.0% 12.00% 12.00% 12.00% 12.00% 12.00%
Maximum Allowable Net Income - 966,459 1,373,781 1,498,579 1,753,684 1,566,467 1,921,318 2,351,621 2,609,776 2,523,753
Maximum Allowable Net Income - 966,459 1,373,781 1,498,579 1,753,684 1,566,467 1,921,318 2,351,621 2,609,776 2,523,753
Operating Expenses #DIV/0! 2,093,103 2,099,216 2,876,464 2,733,865 3,516,022 4,385,612 5,342,902 6,492,997 7,500,919
Depreciation - 175,701 193,106 334,764 410,788 759,795 1,565,426 2,086,354 2,565,399 2,976,600
Revenue Requirement - 3,235,263 3,666,104 4,709,807 4,898,337 16,509,511 5,842,285 7,872,356 9,780,877 11,668,172 13,001,272 48,164,962
Volume Sold, m3 - 494,254 515,385 531,645 503,184 2,044,468 575,256 728,640 835,824 989,472 1,118,568 4,247,760
Required Average Tariff (Php/cum) #DIV/0! 6.55 7.11 8.86 9.73 8.08 8.09 7.90 9.20 8.97 9.17 8.76
Tariff Adjustment - -
Non-Water Revenues 1,282,922 2,342,087 1,990,743 2,726,055 2,621,386 10,963,194
Total Operating Revenues 6,320,999 8,723,497 9,310,868 11,391,824 12,417,775 48,164,962
% Non-Water Revenues / Total Oper. Rev. 20% 27% 21% 24% 21% 23%
Adjusted Revenue Requirement 5,842,285 7,872,356 9,780,877 11,668,172 13,001,272 48,164,962
Adjusted Required Average Tariff 8.09 7.90 9.20 8.97 9.17 8.76
Average Return on Investments
Net Income (Loss) Before Tax, net 147,843 427,549 1,276,288 510,310 381,346 548,667 2,045,182 2,772,459 1,881,612 2,333,428 1,940,255 2,194,587
Average Water Revenues/m3 Sold - - - 7.08 7.08 7.88 8.76 8.76 8.76 8.76 8.76 Rate of Return #DIV/0! 5.3% 11.1% 4.1% 2.6% 5.9% 15.7% 17.3% 9.6% 10.7% 9.2% 12.0%

National Water Resources Board Tariff Model For Private Water Utilities User’s Manual
10
4 Documents Needed At the time of filing of the application for a tariff approval or tariff increase approval, two sets of documents are required, as enumerated below. The use of these documents will be specifically mentioned in the sections for the sheets where they will need to be inputted.
4.1 Application for Initial CPC and Approval of Tariff The following documents, also required to be submitted for an initial application for a CPC and approval of tariff, would be needed by the Tariff Model:
1. Latest audited financial statements for the last two years 2. Actual Balance Sheet showing balance sheet items for water operations for the last two
years2. If a complete Balance Sheet cannot be prepared, the following accounts pertaining to the water operations for the last two years must be provided. The net effect of these accounts will be assumed to be the capital for the water operations.
a. Accounts Receivable – Water Supply b. Materials Inventory c. Property and Equipment In Service, at cost d. Accumulated Depreciation e. Customers’ Deposits
3. Itemized list of assets entitled to return as of the end of the last historical year. This should support the Property and Equipment in Service referred to in Item 2 (c) above.
4. Actual Income Statement showing income statement items for water operations for the last two years 3
5. Business Plan for the next five years 6. Projected financial statements for water operations for five years, with the following:
a. Income Statement b. Balance Sheet c. Assumptions
7. Itemized list of new investments for the next five years 8. Proposed schedule of water rates 9. Levels of service agreed with consumers commensurate with proposed rates
4.2 Application for Renewal of CPC and Approval of Tariff The CPC has to be renewed every five years, at the same time that subsequent tariffs have to be reviewed. At this time, the following requirements for submission will be used by the Tariff Model:
1. Annual Reports for the last five years 2. Latest audited financial statements for the last five years 3. Actual Balance Sheet showing balance sheet items for water operations for the last five
years4. If a complete Balance Sheet cannot be prepared, the following accounts pertaining to the water operations for the last five years must be provided. The net effect of these accounts will be assumed to be the capital for the water operations.
a. Accounts Receivable – Water Supply b. Materials Inventory
2 These reports are required for water utilities that have business ventures other than its water operations. 3 Ibid. 4 Ibid.

National Water Resources Board Tariff Model For Private Water Utilities User’s Manual
11
c. Property and Equipment In Service, at cost d. Accumulated Depreciation e. Customers’ Deposits
4. Itemized list of assets entitled to return as of the end of the last historical year. This should support the Property and Equipment in Service referred to in Item 3 (c) above.
5. Actual Income Statement showing income statement items for water operations for the last five years 5
6. Business Plan for the next five years 7. Projected financial statements for water operations for five years, with the following:
a. Income Statement b. Balance Sheet c. Assumptions
8. Itemized list of new investments for the next five years 9. Proposed schedule of water rates 10. Levels of Service agreed with consumers commensurate with proposed rates
5 Output Sheets The Tariff Model output sheets produce reports needed for the analysis of the results of the projections and the resulting tariff. They contain almost no inputs, and generate the reports based on data entered in yellow cells in the input sheets
5.1 Reports Sheet This sheet contains the following reports. They are ready to be printed to support the water utility’s request for tariff approval.
1 Key Performance Indicators Levels of Service The first part of this section of the Reports sheet is about Levels of Service. The levels of service discussed and agreed with customers in general include non-revenue water, service coverage, water pressure, continuity of service, water quality standards, and emergency provisions of water supply. It may also include response to complaints and requests for new connections and repair of disruptive mains. These agreements are converted into the technical data below and are considered by the Tariff Model in determining the proposed water rates. Table 5-1 shows what this part contains. Other year-columns have been hidden to have a readable size of the table.
Table 5-1 Levels of Service 2007 2008 2009 2010 2011 2012 2013
Actual Year 0 Year 1 Year 2 Year 3 Year 4 Year 5
LEVELS OF SERVICEProduction Capacity, m3/year 1,040,688 596,030 753,710 753,710 952,387 952,387 952,387 % Non-Revenue Water 12% 16% 15% 14% 12% 12% 12%Population Served 13,629 14,170 14,773 17,363 22,017 24,757 25,194 % Population Served 38% 101% 105% 122% 152% 169% 170%Number of Connections 2,621 2,725 2,841 3,339 4,234 4,761 4,845 Ave. Consumption/Conn./Month (m3) 14 12 14 18 20 22 22 Average Tariff (P/m3 sold) 7.02 7.02 8.45 8.45 8.45 8.45 8.45
5 Ibid.

National Water Resources Board Tariff Model For Private Water Utilities User’s Manual
12
Key Performance Indicators The second part of this sheet shows key performance indicators based on past and forecast performance of the water utility. These KPIs will be used by NWRB to develop benchmarks of performance of its clients. Table 5-2 shows the contents of this part.
Table 5-2 Key Performance Indicators 2007 2008 2009 2010 2011 2012 2013
Actual Year 0 Year 1 Year 2 Year 3 Year 4 Year 5
KEY PERFORMANCE INDICATORSAverage Monthly Water Bill (P/connection) 91.50 83.19 118.67 152.15 167.36 182.58 182.58 Net Income Ratio 10% -6% 17% 28% 31% 30% 20%Rate of Return on Investments -8% 6% 12% 14% 14% 10% 12%Rate of Return on Revenues 10% -6% 17% 28% 31% 30% 20%Operating Ratio 79% 94% 67% 51% 43% 46% 55%Average Operating Costs, P/m3 6.90 8.08 6.83 5.62 4.93 4.85 5.48 Collection Period, Days 185 120 90 60 30 30 30 Current Ratio 1.57 7.09 2.66 1.33 1.26 1.22 1.38 Personnel Ratio 238 248 219 223 249 251 231 Employees/1000 Connections 4.2 4.0 4.6 4.5 4.0 4.0 4.3 Average Annual Salary 177,506 186,382 195,701 205,486 215,760 226,548 237,875
2 Income Statement The Income Statement reflects the actual and forecast result of operations of the water utility based on inputs made in various other sheets. It only contains water operations regulated by NWRB. Table 5-3 shows how this appears in the Tariff Model.
Table 5-3 Income Statement 2007 2008 2009 2010 2011 2012 2013
Actual Year 0 Year 1 Year 2 Year 3 Year 4 Year 5
Operating RevenuesWater Revenues 2,877,983 2,720,326 4,045,827 6,096,181 8,503,250 10,430,878 10,614,913 New Connection Fees 97,378 156,000 184,440 831,411 1,553,971 951,620 157,749 Other Operating Revenues 587,279 448,429 666,929 1,004,917 1,401,708 1,719,465 1,749,802 Total Operating Revenues 3,562,640 3,324,754 4,897,196 7,932,509 11,458,929 13,101,963 12,522,464
Operating ExpensesPersonnel and Management Fees 1,952,568 2,050,197 2,544,108 3,082,285 3,667,919 4,304,410 4,995,381 Power 27,160 26,894 34,782 54,390 77,108 98,371 104,111 Chemicals 34,692 34,354 29,845 46,670 66,163 84,408 89,333 Repairs and Maintenance 39,433 67,207 68,344 124,547 219,993 371,557 419,994 Bulk Water Purchases - - - - - - - Bad Debts 50,000 27,203 40,458 60,962 85,033 104,309 106,149 Annual Water Charge 9,788 - - - - - - Supervision and Regulation Fees 43,723 35,252 33,887 57,600 96,677 155,973 169,382 Value-Added Tax - - - - - - - Franchise Tax - - - - - - - General and Administrative Expenses 671,400 890,039 518,822 626,457 743,584 870,882 999,076
Total Operating Expenses 2,828,765 3,131,147 3,270,246 4,052,910 4,956,475 5,989,909 6,883,426 Net Operating Income 733,875 193,608 1,626,950 3,879,599 6,502,454 7,112,054 5,639,038
Depreciation 420,165 413,805 418,155 577,767 837,349 1,230,026 1,351,010 Net Income / (Loss) before Non-Operating Inc/Exp 313,710 (220,197) 1,208,795 3,301,833 5,665,105 5,882,028 4,288,028
Non-Operating Income / (Expenses) 30,480 17,329 45,047 3,568 611 4,473 1,468 Net Income Before Interest 344,190 (202,868) 1,253,842 3,305,401 5,665,715 5,886,501 4,289,496
Interest Expense - - 418,000 1,074,333 2,060,667 2,002,000 1,789,333 Net Income / (Loss) before Tax 344,190 (202,868) 835,842 2,231,067 3,605,049 3,884,501 2,500,163
Provision for Income Tax - - - - - - -
Net Income / (Loss) after Tax 344,190 (202,868) 835,842 2,231,067 3,605,049 3,884,501 2,500,163

National Water Resources Board Tariff Model For Private Water Utilities User’s Manual
13
3 Flow of Funds Statement The Flow of Funds Statement shows funds from internal cash generation, changes in the Balance Sheet between the previous year and the current year, uses of the funds like debt service payments and capital investment requirements, and other sources of funds not coming from operations, such as loan proceeds, Depreciation Reserve Fund, donated funds, or additional equity contributions. The ending cash balance reflects the assumption given in the Assumptions sheet, based on how many months cash can cover operating expenses. Any cash surplus is deposited in a special time deposit account (termed as “purchase of deposits” in the table below). Should there be a cash deficit in any given year, funds from the special time deposit are first used (termed as “sale of deposits” in the statement below), before resorting to look for other fund sources. Table 5-4 shows how this appears in the Tariff Model.
Table 5-4 Flow of Funds Statement 2008 2009 2010 2011 2012 2013
Year 0 Year 1 Year 2 Year 3 Year 4 Year 5INTERNAL CASH GENERATIONNet Income / (Loss) after Tax (202,868) 835,842 2,231,067 3,605,049 3,884,501 2,500,163 Add: Depreciation 413,805 418,155 577,767 837,349 1,230,026 1,351,010 Add: Interest Expense - 418,000 1,074,333 2,060,667 2,002,000 1,789,333 Operating Cash Flow 210,936 1,671,997 3,883,167 6,503,064 7,116,527 5,640,506 Cash, Beginning Balance 160,048 463,127 517,324 538,298 665,325 811,907 Other Assets (Increase) Decrease - (418,155) (577,767) (837,349) (1,230,026) (1,351,010) Other Liabilities Increase (Decrease) - - - - - - Working Capital (Increase)/Decrease 847,945 (92,055) 47,701 358,353 (101,066) 51,304 CASH BEFORE DEBT SERVICE 1,218,929 1,624,915 3,870,426 6,562,367 6,450,760 5,152,707
DEBT SERVICE PAYMENTInterest Payments 1,398,272 418,000 1,074,333 2,060,667 2,002,000 1,789,333 Principal Repayments 1,700,233 33,333 666,666 1,766,666 1,766,666 1,966,666 Total Debt Service 3,098,505 451,333 1,741,000 3,827,333 3,768,666 3,756,000 CASH AFTER DEBT SERVICE (1,879,576) 1,173,582 2,129,426 2,735,034 2,682,094 1,396,708
CAPITAL INVESTMENT REQUIREMENTSAnnual Capital Investment 145,000 5,320,405 8,652,740 13,089,236 4,032,800 -
Cash, Ending Balance 463,127 517,324 538,298 665,325 811,907 980,933 FINANCING REQUIREMENTS (2,487,704) (4,664,147) (7,061,612) (11,019,527) (2,162,613) 415,774
OTHER FUND SOURCESDepreciation Reserve Fund - - 400,000 400,000 900,000 - Additional Capital Contribution - - - - - - Donations 3,065,172 - - - - - Outstanding Loans - - - - - - New Loans - 3,800,000 6,600,000 10,700,000 1,200,000 -
TOTAL OF OTHER FUND SOURCES 3,065,172 3,800,000 7,000,000 11,100,000 2,100,000 - CASH SURPLUS / (DEFICIT) 577,468 (864,147) (61,612) 80,473 (62,613) 415,774 If Cash Surplus: Purchase of Deposits 577,468 - - 80,473 - 415,774 If Cash Deficit: Sale of Deposits - 864,147 61,612 - 62,613 - Additional Equity Needed - - - - - -
Total Cash Raised - 864,147 61,612 - 62,613 -

National Water Resources Board Tariff Model For Private Water Utilities User’s Manual
14
4 Balance Sheet The Balance Sheet reflects the financial condition of the water utility at the end of each year. Only significant balance sheet accounts are shown separately. The other accounts are combined with the “Other” accounts. Table 5-5 shows how this appears in the Tariff Model.
Table 5-5 Balance Sheet 2008 2009 2010 2011 2012 2013
Year 0 Year 1 Year 2 Year 3 Year 4 Year 5
ASSETSPROPERTY AND EQUIPMENTLand 329,806 329,806 329,806 329,806 329,806 329,806 Property and Equipment excl. Land 13,793,485 13,938,485 19,258,890 27,911,631 41,000,867 45,033,667 Property and Equipment, At Cost 14,123,292 14,268,292 19,588,697 28,241,437 41,330,673 45,363,473 Less: Accumulated Depreciation (7,072,795) (7,490,950) (8,068,716) (8,906,065) (10,136,091) (11,487,101) Property and Equipment, Net Book Value 7,050,497 6,777,342 11,519,980 19,335,372 31,194,582 33,876,371
Works in Progress 145,000 5,320,405 8,652,740 13,089,236 4,032,800 -
Depreciation Reserve Fund - 418,155 595,921 1,033,270 1,363,296 2,714,306
CURRENT ASSETSCash on Hand and in Bank 463,127 517,324 538,298 665,325 811,907 980,933 Short-Term Deposits 938,481 74,334 12,722 93,195 30,583 446,357 Accounts Receivable - Water 894,354 997,601 1,002,112 698,897 857,332 872,459 Prepaid Expenses 255,119 265,462 328,105 400,393 483,748 557,036 Inventories 16,927 16,365 28,536 47,693 75,994 84,888 Other Current Assets 1,335,210 1,335,210 1,335,210 1,335,210 1,335,210 1,335,210 TOTAL CURRENT ASSETS 3,903,217 3,206,296 3,244,983 3,240,712 3,594,774 4,276,883
Other Assets 179,769 179,769 179,769 179,769 179,769 179,769
TOTAL ASSETS 11,278,483 15,901,966 24,193,394 36,878,359 40,365,220 41,047,329
LIABILITIES AND CAPITALCAPITALPaid-up Capital Stock / Proprietor's Account 3,343,505 3,343,505 3,343,505 3,343,505 3,343,505 3,343,505 Donated Capital 6,583,363 6,583,363 6,583,363 6,583,363 6,583,363 6,583,363 Capital Reserves - - - - - - Retained Earnings 636,493 433,624 1,269,467 3,500,534 7,105,583 10,990,084 Net Income (Loss) for the Year (202,868) 835,842 2,231,067 3,605,049 3,884,501 2,500,163 Total Capital 10,360,492 11,196,334 13,427,402 17,032,450 20,916,952 23,417,114
LIABILITIESLong-Term Liabilities 367,334 3,500,668 8,334,001 17,267,335 16,500,669 14,534,002
CURRENT LIABILITIESAccounts Payable 517,324 538,298 665,325 811,907 980,933 1,129,546 Taxes Payable - - - - - - Interest Payable - - - - - - Other Current Liabilities - - - - - - Due to Affiliated Company - - - - - - Notes Payable - - - - - - Current Portion of Long-Term Liabilities 33,333 666,666 1,766,666 1,766,666 1,966,666 1,966,666 TOTAL CURRENT LIABILITIES 550,657 1,204,964 2,431,991 2,578,573 2,947,600 3,096,213
Customers' Deposits - - - - - - Other Liabilities - - - - - -
Total Liabilities 917,991 4,705,632 10,765,992 19,845,908 19,448,268 17,630,215
TOTAL LIABILITIES AND CAPITAL 11,278,483 15,901,966 24,193,394 36,878,359 40,365,220 41,047,329 - - - - - -
National Water Resources Board Tariff Model For Private Water Utilities User’s Manual
15
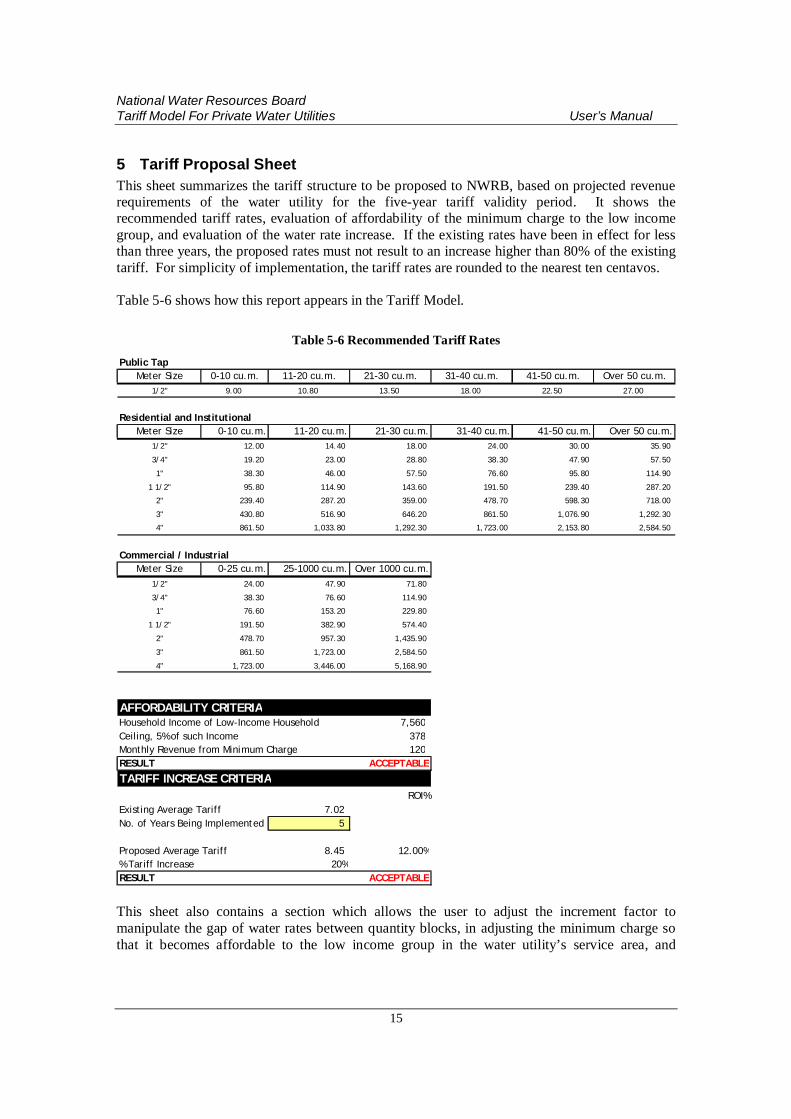
5 Tariff Proposal Sheet This sheet summarizes the tariff structure to be proposed to NWRB, based on projected revenue requirements of the water utility for the five-year tariff validity period. It shows the recommended tariff rates, evaluation of affordability of the minimum charge to the low income group, and evaluation of the water rate increase. If the existing rates have been in effect for less than three years, the proposed rates must not result to an increase higher than 80% of the existing tariff. For simplicity of implementation, the tariff rates are rounded to the nearest ten centavos. Table 5-6 shows how this report appears in the Tariff Model.
Table 5-6 Recommended Tariff Rates Public Tap
Meter Size 0-10 cu.m. 11-20 cu.m. 21-30 cu.m. 31-40 cu.m. 41-50 cu.m. Over 50 cu.m.1/2" 9.00 10.80 13.50 18.00 22.50 27.00
Residential and InstitutionalMeter Size 0-10 cu.m. 11-20 cu.m. 21-30 cu.m. 31-40 cu.m. 41-50 cu.m. Over 50 cu.m.
1/2" 12.00 14.40 18.00 24.00 30.00 35.90
3/4" 19.20 23.00 28.80 38.30 47.90 57.50
1" 38.30 46.00 57.50 76.60 95.80 114.90
1 1/2" 95.80 114.90 143.60 191.50 239.40 287.20
2" 239.40 287.20 359.00 478.70 598.30 718.00
3" 430.80 516.90 646.20 861.50 1,076.90 1,292.30
4" 861.50 1,033.80 1,292.30 1,723.00 2,153.80 2,584.50
Commercial / IndustrialMeter Size 0-25 cu.m. 25-1000 cu.m. Over 1000 cu.m.
1/2" 24.00 47.90 71.80
3/4" 38.30 76.60 114.90
1" 76.60 153.20 229.80
1 1/2" 191.50 382.90 574.40
2" 478.70 957.30 1,435.90
3" 861.50 1,723.00 2,584.50
4" 1,723.00 3,446.00 5,168.90
AFFORDABILITY CRITERIAHousehold Income of Low-Income Household 7,560 Ceiling, 5% of such Income 378 Monthly Revenue from Minimum Charge 120 RESULT ACCEPTABLE
TARIFF INCREASE CRITERIAROI%
Existing Average Tariff 7.02 No. of Years Being Implemented 5
Proposed Average Tariff 8.45 12.00%% Tariff Increase 20%RESULT ACCEPTABLE
This sheet also contains a section which allows the user to adjust the increment factor to manipulate the gap of water rates between quantity blocks, in adjusting the minimum charge so that it becomes affordable to the low income group in the water utility’s service area, and

National Water Resources Board Tariff Model For Private Water Utilities User’s Manual
16
narrowing the gap between annual water revenues to be collected and the annual revenue requirements. This section is shown in Table 5-7 below.
The increment factor can be any set of numbers that increases as the quantity block goes up. To promote water conservation, the increment factor may go up steeper after the quantity block where the average monthly consumption belongs to. Since this is inputted by the user, it may be adjusted accordingly until the desired water rates are achieved.
Other discussions on the tariff computation are found in Section 7.6 Consumption Sheet and Section 7.7 Tariff Computation Sheet.
Table 5-7. Incremental Factor
Incremental Factor
0-10 cu.m. 11-20 cu.m. 21-30 cu.m. 31-40 cu.m. 41-50 cu.m. Over 50 cu.m.
Public Tap 0.75
Residential/Institutional 1.00 1.20 1.50 2.00 2.50 3.00
Commercial / Industrial 1.00 2.00 3.00
Resulting RevenuesTotal Revenues 10,006,200
Desired Revenues 9,982,612
Difference 23,588 0%
5.2 Evaluation Sheet This sheet is a computation sheet that determines the required average tariff for the projected five years, starting with the maximum allowable return on investments (ROI) of 12%. It also allows the water utility to change the ROI rate to the rate it wants to implement, as long as this rate does not exceed 12%6. This is done by changing the rate in the yellow cell of the line “Maximum Allowable Rate of Return”. Aside from this input, all the other data in this sheet come from various other sheets. This sheet shows how the average tariff is computed for each of the five projection years and their average. Should the water utility opt for a lesser tariff than the suggested tariff at 12% ROI, this sheet also shows the resulting ROI the water utility would achieve. Since it is not practical to increase or decrease water rates from year to year, the water utility is allowed to use the average tariff for the five years. The calculation of this average tariff is shown below. Refer also to Table 5-8 on how this Evaluation Sheet appears in the Tariff Model.
6 The ROI may exceed 12% when the requested tariff rates are for subsequent approval by NWRB. For justifiable reasons, NWRB may allow the water utility to be compensated for not being able to attain its approved ROI during the previous tariff period. The compensation may result to an ROI above 12% in the next tariff period.

National Water Resources Board Tariff Model For Private Water Utilities User’s Manual
17
Table 5-8 Return on Investments Evaluation – Projected Years 2009 2010 2011 2012 2013 Total
Year 1 Year 2 Year 3 Year 4 Year 5 Years 1-5Property & Equipment, beg 14,268,292 19,588,697 28,241,437 41,330,673 45,363,473
New Investments 5,320,405 8,652,740 13,089,236 4,032,800 -
Property and Equipment in Service Entitled to Return, end19,588,697 28,241,437 41,330,673 45,363,473 45,363,473
Less: Accumulated Depreciation (2,699,424) (3,409,201) (4,500,152) (6,046,703) (7,716,493)
Net Book Value 16,889,272 24,832,236 36,830,521 39,316,769 37,646,979
Add: Working CapitalOperating Expenses excluding depreciation 3,270,246 4,052,910 4,956,475 5,989,909 6,883,426
2-Months Average Cash Operating Expenses 545,041 675,485 826,079 998,318 1,147,238
Total Invested Capital Entitled to Return 17,434,313 25,507,721 37,656,600 40,315,087 38,794,217 31,941,588
Maximum Allowable Rate of Return 12.00% 12.00% 12.00% 12.00% 12.00%
Maximum Allowable Net Income 2,092,118 3,060,927 4,518,792 4,837,810 4,655,306
Maximum Allowable Net Income 2,092,118 3,060,927 4,518,792 4,837,810 4,655,306
Operating Expenses 3,270,246 4,052,910 4,956,475 5,989,909 6,883,426
Depreciation 578,073 709,777 1,090,951 1,546,551 1,669,790
Revenue Requirement 5,940,437 7,823,613 10,566,219 12,374,271 13,208,522 49,913,061
Volume Sold, m3 478,652 721,224 1,005,998 1,234,051 1,255,824 4,695,749
Required Average Tariff (Php/cum) 10.25 8.34 7.79 7.98 8.92 8.45 Average Return on InvestmentsNet Income (Loss) Before Tax, net 1,048,877 3,169,823 5,411,502 5,565,503 3,969,248 3,832,991
Average Water Revenues/m3 Sold 8.45 8.45 8.45 8.45 8.45 Rate of Return 6.0% 12.4% 14.4% 13.8% 10.2% 12.0%
A. Compute the Total Invested Capital Entitled to Return
1. Compute the Net Book Value of assets in service entitled to return. = Property and equipment in service entitled to return (PEISER), beginning + New capital investments during the year = PEISER, end - Accumulated Depreciation = Net Book Value of PEISER
2. Compute 2-months working capital. = Operating expenses (OPEX) for the year, excluding depreciation / 12 months to get average monthly OPEX X 2 months
3. Total Invested Capital Entitled to Return = Net Book Value of PEISER (A-1 above) + 2 months working capital (A-2 above)
B. Compute the Revenue Requirements.
1. Compute the Allowable Net Income = Total Invested Capital Entitled to Return (A-3 above)
X Allowable rate of return

National Water Resources Board Tariff Model For Private Water Utilities User’s Manual
18
2. Revenue Requirements = Allowable Net Income (B-1 above) + Operating Expenses (same OPEX as used in A-2 above) + Depreciation of all assets in service C. Compute the Required Average Tariff
= Revenue Requirements (B-2) / Volume Sold
D. Compute the Average Tariff for the next five years.
1. Get the sum of all the Revenue Requirements for Years 1-5. 2. Get the sum of all Volume Sold for Years 1-5. 3. Average Tariff for Years 1-5
= Sum of Revenue Requirements / Sum of Volume Sold
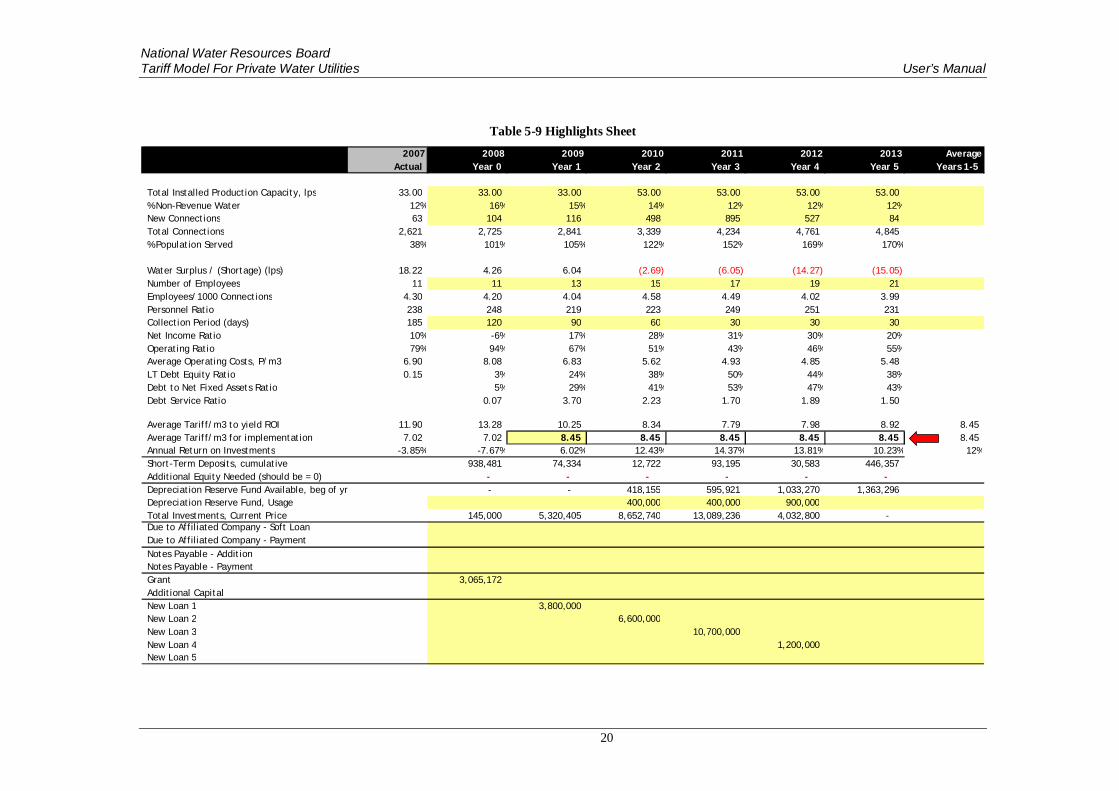
5.3 Highlights The Highlights sheet contains significant variables that can be manipulated to fine-tune the results under one sheet. It makes iterations of combination of variables convenient because as variables are changed, important results are immediately displayed on the same sheet. These significant variables are in yellow cells, meaning they may be changed directly in this sheet. These are: 1. Total installed production capacity in lps 2. % non-revenue water 3. New connections 4. Number of employees 5. Collection period Check the following critical lines: 1. Average Tariff/m3 line The contents of the average tariff for years 1-5 must be copied to the yellow cell in year 1. If the water utility would like to take full advantage of the maximum allowable net income to yield 12%, then the average tariff for years 1-5 must be copied to the yellow cell under “average tariff/m3 for implementation” in year 1. Otherwise, the user may input in the yellow cell the average tariff that it deems proper, as long as the resulting average return on investments during years 1-5 does not exceed 12%7. 2. Additional Equity Needed line The cells in this line should be equal to zero. If this shows any amount, this will be considered as additional equity contribution. But if the water utility does not intend to add equity, it must look for other fund sources. These can be through a soft loan from an affiliated company (if available), tapping the Depreciation Reserve Fund (only if the shortage is due to investment
7 Ibid

National Water Resources Board Tariff Model For Private Water Utilities User’s Manual
19
requirements), obtaining a short-term loan, finding grants or donations for capital investments, or securing a long-term loan.
3. Short-Term Deposits, Cumulative This line shows the cumulative balance of short-term deposits at the end of the year. It may be allowed to accumulate funds for future significant investment requirements. Otherwise, it should not accumulate excessive balances. If it does, funds from other sources may be decreased to use up the excessive short-term deposit balance. 4. Depreciation Reserve Fund, Usage The amount of Depreciation Reserve Funds that may be used should not exceed the total investments for the year. It is also sensible to leave something in the fund for unforeseen events that may arise in the succeeding years. 5. Annual Return on Investments, average for Years 1-5 This should not exceed 12%8. In case there is a problem in any of these critical lines, the variables must be changed accordingly until all the problems are eliminated. Table 5-9 shows how this Highlights sheet appears in the Tariff Model.
8 Ibid
National Water Resources Board Tariff Model For Private Water Utilities User’s Manual
20
Table 5-9 Highlights Sheet 2007 2008 2009 2010 2011 2012 2013 Average
Actual Year 0 Year 1 Year 2 Year 3 Year 4 Year 5 Years 1-5
Total Installed Production Capacity, lps 33.00 33.00 33.00 53.00 53.00 53.00 53.00 % Non-Revenue Water 12% 16% 15% 14% 12% 12% 12%New Connections 63 104 116 498 895 527 84 Total Connections 2,621 2,725 2,841 3,339 4,234 4,761 4,845 % Population Served 38% 101% 105% 122% 152% 169% 170%
Water Surplus / (Shortage) (lps) 18.22 4.26 6.04 (2.69) (6.05) (14.27) (15.05)Number of Employees 11 11 13 15 17 19 21 Employees/1000 Connections 4.30 4.20 4.04 4.58 4.49 4.02 3.99 Personnel Ratio 238 248 219 223 249 251 231 Collection Period (days) 185 120 90 60 30 30 30 Net Income Ratio 10% -6% 17% 28% 31% 30% 20%Operating Ratio 79% 94% 67% 51% 43% 46% 55%Average Operating Costs, P/m3 6.90 8.08 6.83 5.62 4.93 4.85 5.48 LT Debt Equity Ratio 0.15 3% 24% 38% 50% 44% 38%Debt to Net Fixed Assets Ratio 5% 29% 41% 53% 47% 43%Debt Service Ratio 0.07 3.70 2.23 1.70 1.89 1.50
Average Tariff/m3 to yield ROI 11.90 13.28 10.25 8.34 7.79 7.98 8.92 8.45 Average Tariff/m3 for implementation 7.02 7.02 8.45 8.45 8.45 8.45 8.45 8.45 Annual Return on Investments -3.85% -7.67% 6.02% 12.43% 14.37% 13.81% 10.23% 12%Short-Term Deposits, cumulative 938,481 74,334 12,722 93,195 30,583 446,357 Additional Equity Needed (should be = 0) - - - - - - Depreciation Reserve Fund Available, beg of yr - - 418,155 595,921 1,033,270 1,363,296 Depreciation Reserve Fund, Usage 400,000 400,000 900,000 Total Investments, Current Price 145,000 5,320,405 8,652,740 13,089,236 4,032,800 - Due to Affiliated Company - Soft LoanDue to Affiliated Company - PaymentNotes Payable - AdditionNotes Payable - PaymentGrant 3,065,172 Additional CapitalNew Loan 1 3,800,000 New Loan 2 6,600,000 New Loan 3 10,700,000 New Loan 4 1,200,000 New Loan 5

National Water Resources Board Tariff Model For Private Water Utilities User’s Manual
21
6 Input Sheets Input sheets are where data are entered into the Tariff Model. Data should be entered in yellow cells only. The other cells are protected to prevent accidental inputs into these cells that may disconnect the linkages necessary to produce the reports generated in this Model.
6.1 Opening Sheet This sheet is where encoding of input data starts. For water utilities that have other lines of business other than water supply services, encode only those accounts for water utility operations regulated by NWRB. This implies that the audited Income Statement may not be copied exactly into the Tariff Model. Encode following data:
1 Name of the water utility
2 Case number of the application with NWRB These two data are picked up as headings of all the sheets in the Tariff Model, as well as in the reports that are generated, so that there is no need to copy these headings to other sheets.
3 Last historical year This is the year of the latest historical data available. This year is picked up in the column headings of other sheets.
4 Earliest historical year This is the year of the earliest historical data available. This year is used especially in the CPX sheets.
5 Income Statement The following are the source documents required in encoding the Income Statement: Audited Income Statement
- for the last two years (for the initial tariff application), or - for the last five years (for subsequent tariff applications)
Note that the accounts appearing in the water utility’s Income Statement may need to be reclassified to conform to the classification in the sheet. This is required for uniformity of account classification among water utilities and to streamline projections of OPEX accounts. Income Statement accounts not appearing on the sheet may be lumped together under the account “Other General and Administrative Expenses. Table 6-1 shows the Income Statement portion of the Opening sheet as well as the other inputs mentioned above.

National Water Resources Board Tariff Model For Private Water Utilities User’s Manual
22
Table 6-1 Income Statement Input Sheet
Matubig Water UtilityCase No.
LAST HISTORICAL YEAR: 2007EARLIEST HISTORICAL YEAR 2004
OPENING BALANCES
2003 2004 2005 2006 2007INCOME STATEMENTOperating Revenues
Water Revenues 3,002,713 3,059,296 3,247,759 2,877,983 New Connection Fees 62,477 81,312 79,953 97,378 Other Operating Revenues 29,636 7,831 12,482 587,279 Total Operating Revenues - 3,094,825 3,148,439 3,340,193 3,562,640
Operating ExpensesPersonnel 1,735,841 1,884,167 2,002,229 1,952,568 Management FeesPower 11,995 13,635 10,000 27,160 Chemicals 35,082 25,007 29,571 34,692 Repairs and Maintenance 6,809 22,472 20,125 39,433 Bulk Water PurchasesBad Debts 5,000 30,000 50,000 Annual Water Charge 9,788 Supervision and Regulation Fees 44,745 43,525 45,331 43,723 Value-Added TaxFranchise TaxOther General and Administrative Expenses 355,798 311,567 386,136 671,400
Depreciation 350,000 350,000 400,000 420,165 Interest Expense 59,550 23,600 Provision for Income TaxNon-Operating Income/(Expenses) 30,480 NET INCOME / (LOSS) - 495,005 469,466 416,802 344,190
6 Balance Sheet The following are the source documents required in encoding the Balance Sheet: Audited Balance Sheet
- for the last two years (for the initial tariff application), or - for the last five years (for subsequent tariff applications)
Like the Income Statement, Balance Sheet accounts have been standardized so that the Tariff Model may be used by almost any water utility. Only Balance Sheet accounts that are directly linked to water operations are shown individually. Other insignificant accounts may be grouped together with the “Other” accounts. For water utilities that have other lines of business other than water supply services, where the Balance Sheet accounts reflect the financial condition of all these lines of business, the following accounts pertaining to water operations MUST still be provided, so as to enable the Tariff Model to project a Balance Sheet for the utility:
1. Accounts Receivable – Water Supply 2. Materials Inventory

National Water Resources Board Tariff Model For Private Water Utilities User’s Manual
23
3. Property and Equipment In Service, at cost 4. Accumulated Depreciation 5. Customers’ Deposits
The net effect of these accounts will be assumed as capital or equity (and to be encoded as such in the Opening sheet) for the water operations.
The Balance Sheet for every year should be balanced.
Table 6-2 shows the Balance Sheet portion of the Opening sheet.
Table 6-2 Balance Sheet Input Sheet BALANCE SHEETLand 323,326 323,326 329,806 Property and Equipment in Service 11,684,660 12,351,917 13,065,574 13,793,485 Accumulated Depreciation (3,580,576) (3,930,576) (4,220,176) (6,658,990) Works in ProgressDepreciation Reserve FundOther Assets 146,474 128,474 165,549 179,769 Cash on Hand and in Bank 88,310 239,215 193,563 160,048 Short-Term Deposit 338,228 344,197 344,197 361,013 Accounts Receivable - Water 1,392,374 1,458,624 1,451,539 1,461,952 Prepaid ExpensesInventories 123,625 100,415 83,649 35,068 Other Current Assets 1,072,511 1,346,365 1,499,031 1,335,210 TOTAL ASSETS - 11,265,606 12,361,958 12,906,252 10,997,360 Paid-up Capital Stock / Proprietor's Account 2,325,675 3,032,668 3,335,798 3,343,505 Donated Capital 5,128,912 5,508,559 5,508,559 3,518,191 Capital ReservesRetained Earnings 49,594 179,768 777,976 292,302 Net Income (Loss) for the Year - 495,005 469,466 416,802 344,190 Long-Term Liabilities 1,364,072 1,364,072 1,364,072 1,364,072 Customers' DepositsOther LiabilitiesAccounts Payable 179,226 217,809 Taxes Payable - 6,631 Interest Payable 506,037 506,037 506,037 1,398,272 Other Current Liabilities 465,306 385,334 35,741 Due to General Fund 194,177 Notes PayableCurrent Portion of Long-Term Liabilities 736,828 736,828 736,828 736,828 TOTAL LIABILITIES AND CAPITAL - 11,265,606 12,361,958 12,906,252 10,997,360
- - - - -
6.2 Assumptions Sheet The Assumptions sheet contains projection parameters that will be used by the Tariff Model. These are:
1 Inflation Inflation is used in escalating some OPEX and capital investments at constant prices to convert them to current prices. This is the inflation projected by the Bangko Sentral ng Pilipinas and used by the National Economic and Development Authority in its Medium-Term Philippine Development Plan. Table 6-3 shows how this appears in the Assumptions Sheet.

National Water Resources Board Tariff Model For Private Water Utilities User’s Manual
24
Table 6-3 Inflation Assumption
2007 2008 2009 2010 2011 2012 2013Actual
INFLATIONCost Escalation Rates 0.0% 0.0% 6.0% 5.0% 4.0% 4.0% 4.0%Cost Escalation Factor 1.00 1.00 1.06 1.11 1.16 1.20 1.25
Projected
2 Average Income of Low-Income Household This assumption is used in determining the affordability of the minimum charge to a low-income household. The minimum charge should not exceed 5% of its household income. The average income of a low-income household varies from one locality to another. This is available from a publication of the National Statistics Office that is prepared every five years. The last issuance was in year 2000. The 2000 income is escalated by a rate suggested in the NSO publication to arrive at the household income for any given year. Table 6-4 shows how this appears in the Assumptions Sheet.
Table 6-4 Average Income of Low-Income Household 2007 2008 2009 2010 2011 2012 2013Actual
AVERAGE INCOME OF LOW-INCOME HOUSEHOLDCost Escalation Rates 8% 8% 8% 8% 8% 8% 8%Cost Escalation Factor 1.26 1.00 1.08 1.17 1.26 1.36 1.47 Household Income 7,000 7,000 7,560 8,165 8,818 9,523 10,285
Projected
Balance Sheet Accounts Assumptions
3 Cash Position The cash position assumption determines the ending cash balance to appear in the Balance Sheet. It is projected as the number of months of operating expenses that cash can cover. The industry standard for this ratio is two to three months of OPEX.
4 Collection Period The assumption of collection period determines the ending balance of accounts receivable from water sales in the Balance Sheet. It also affects the cash position. The shorter this collection period, the better, because there will be a higher cash balance for the water utility. The assumption is represented as number of days a water bill gets paid and becomes converted to cash. It is computed as follows:
= Accounts Receivable from Water Sales Water Revenues / 365 days
This is not inputted in this sheet, but in the Highlights sheet. This indicator is considered critical as it affects the liquidity of the water utility. It may need to be changed to improve the projection results.

National Water Resources Board Tariff Model For Private Water Utilities User’s Manual
25
5 Prepaid Expenses The prepaid expenses assumption determines the ending balance of prepaid expenses in the Balance Sheet. The assumption is represented as the equivalent number of days of operating expenses.
6 Inventory Management The inventory management assumption determines the ending balance of materials inventory. It is represented by the number of months of direct costs (chemicals and maintenance materials).
7 Accounts Payable The accounts payable assumption determines the ending balance of accounts payable in the Balance Sheet. The assumption is represented as number of months of operating expenses.
8 Notes Payable This assumption computes the interest rate on notes payable. The assumption is represented as a percentage per annum. Table 6-5 shows how these Balance Sheet assumptions appear in the Assumptions Sheet.
Table 6-5 Balance Sheet Assumptions 2007 2008 2009 2010 2011 2012 2013Actual
BALANCE SHEET ACCOUNTSCash Position 0.8 2.0 2.0 2.0 2.0 2.0 2.0Collection Period (days) 288 180 150 120 90 90 90Prepaid Expenses 1 30 30 30 30 30 30Inventory Management 40 2 2 2 2 2 2Accounts Payable 0.00 2.0 2.0 2.0 2.0 2.0 2.0Notes Payable
Projected
Income Statement Accounts Assumptions
9 Interest Earned This assumption determines the interest income to be earned from the Special Time Deposit which is a repository of cash in excess of the cash requirement, as defined in paragraph 3-Cash Position above. The assumption is the going special time deposit rate in the market.
10 Number of Employees This assumption affects the amount of Personnel costs of the water utility. The assumption is the projected number of employees at year-end.
11 Personnel Cost This assumption is another determinant of Personnel cost. This represents the escalation for salaries. It may be pegged to general inflation. If the water utility has specific plans of a general increase in salaries other than inflation, this is the place where this general increase should be encoded.
12 Management Fees This assumption determines the amount of management fees to appear in the Income Statement, if the water utility has a management contract. The escalation factor depends on the terms of the management contract.
National Water Resources Board Tariff Model For Private Water Utilities User’s Manual
26
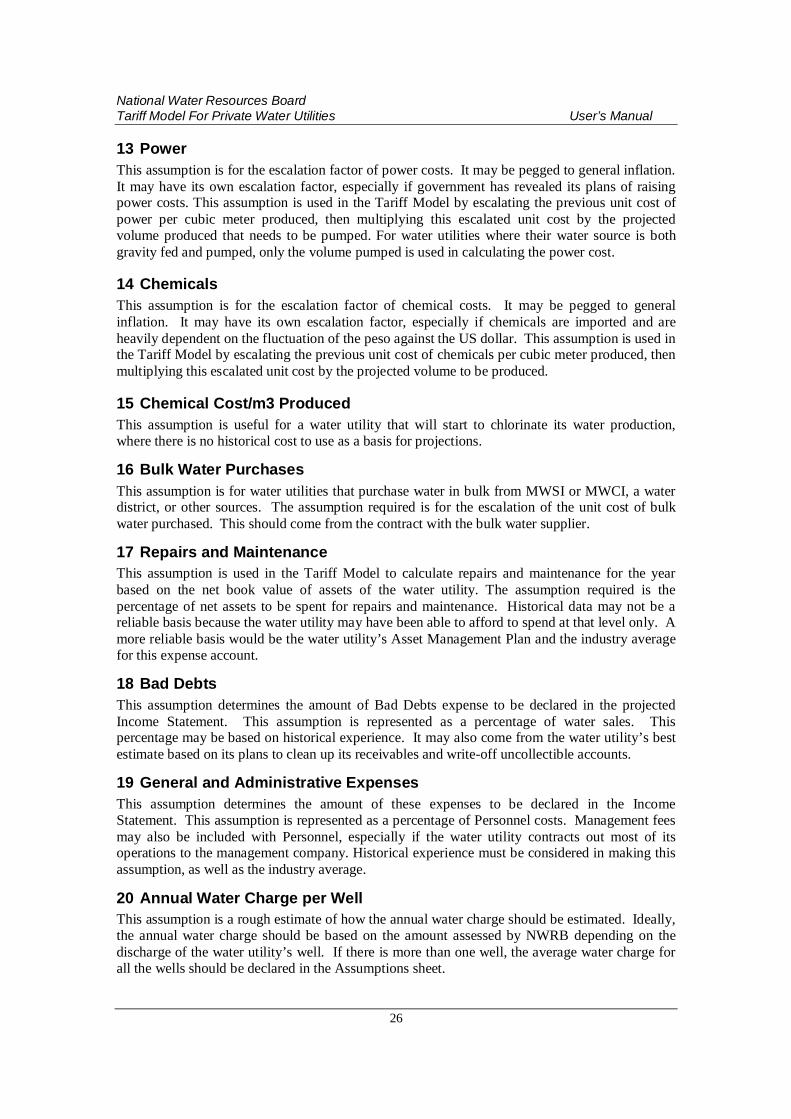
13 Power This assumption is for the escalation factor of power costs. It may be pegged to general inflation. It may have its own escalation factor, especially if government has revealed its plans of raising power costs. This assumption is used in the Tariff Model by escalating the previous unit cost of power per cubic meter produced, then multiplying this escalated unit cost by the projected volume produced that needs to be pumped. For water utilities where their water source is both gravity fed and pumped, only the volume pumped is used in calculating the power cost.
14 Chemicals This assumption is for the escalation factor of chemical costs. It may be pegged to general inflation. It may have its own escalation factor, especially if chemicals are imported and are heavily dependent on the fluctuation of the peso against the US dollar. This assumption is used in the Tariff Model by escalating the previous unit cost of chemicals per cubic meter produced, then multiplying this escalated unit cost by the projected volume to be produced.
15 Chemical Cost/m3 Produced This assumption is useful for a water utility that will start to chlorinate its water production, where there is no historical cost to use as a basis for projections.
16 Bulk Water Purchases This assumption is for water utilities that purchase water in bulk from MWSI or MWCI, a water district, or other sources. The assumption required is for the escalation of the unit cost of bulk water purchased. This should come from the contract with the bulk water supplier.
17 Repairs and Maintenance This assumption is used in the Tariff Model to calculate repairs and maintenance for the year based on the net book value of assets of the water utility. The assumption required is the percentage of net assets to be spent for repairs and maintenance. Historical data may not be a reliable basis because the water utility may have been able to afford to spend at that level only. A more reliable basis would be the water utility’s Asset Management Plan and the industry average for this expense account.
18 Bad Debts This assumption determines the amount of Bad Debts expense to be declared in the projected Income Statement. This assumption is represented as a percentage of water sales. This percentage may be based on historical experience. It may also come from the water utility’s best estimate based on its plans to clean up its receivables and write-off uncollectible accounts.
19 General and Administrative Expenses This assumption determines the amount of these expenses to be declared in the Income Statement. This assumption is represented as a percentage of Personnel costs. Management fees may also be included with Personnel, especially if the water utility contracts out most of its operations to the management company. Historical experience must be considered in making this assumption, as well as the industry average.
20 Annual Water Charge per Well This assumption is a rough estimate of how the annual water charge should be estimated. Ideally, the annual water charge should be based on the amount assessed by NWRB depending on the discharge of the water utility’s well. If there is more than one well, the average water charge for all the wells should be declared in the Assumptions sheet.
National Water Resources Board Tariff Model For Private Water Utilities User’s Manual
27
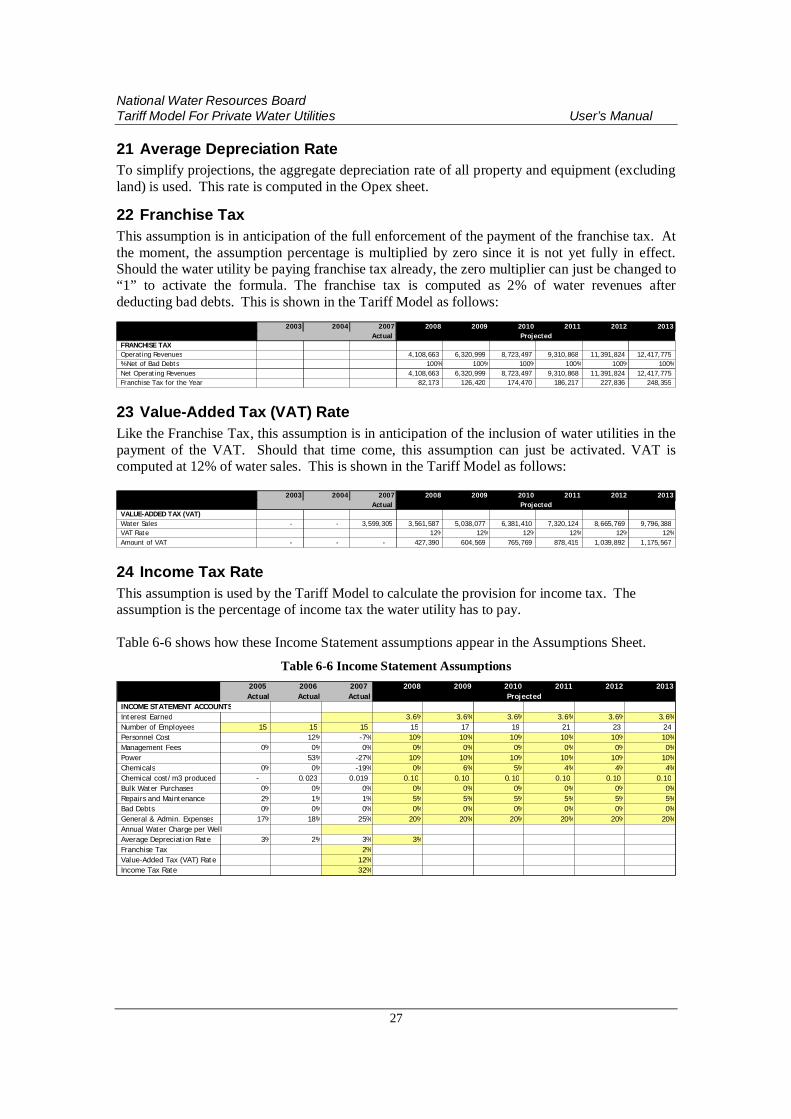
21 Average Depreciation Rate To simplify projections, the aggregate depreciation rate of all property and equipment (excluding land) is used. This rate is computed in the Opex sheet.
22 Franchise Tax This assumption is in anticipation of the full enforcement of the payment of the franchise tax. At the moment, the assumption percentage is multiplied by zero since it is not yet fully in effect. Should the water utility be paying franchise tax already, the zero multiplier can just be changed to “1” to activate the formula. The franchise tax is computed as 2% of water revenues after deducting bad debts. This is shown in the Tariff Model as follows:
2003 2004 2007 2008 2009 2010 2011 2012 2013
FRANCHISE TAXOperating Revenues 4,108,663 6,320,999 8,723,497 9,310,868 11,391,824 12,417,775 % Net of Bad Debts 100% 100% 100% 100% 100% 100%Net Operating Revenues 4,108,663 6,320,999 8,723,497 9,310,868 11,391,824 12,417,775 Franchise Tax for the Year 82,173 126,420 174,470 186,217 227,836 248,355
Actual Projected
23 Value-Added Tax (VAT) Rate Like the Franchise Tax, this assumption is in anticipation of the inclusion of water utilities in the payment of the VAT. Should that time come, this assumption can just be activated. VAT is computed at 12% of water sales. This is shown in the Tariff Model as follows:
2003 2004 2007 2008 2009 2010 2011 2012 2013
VALUE-ADDED TAX (VAT)Water Sales - - 3,599,305 3,561,587 5,038,077 6,381,410 7,320,124 8,665,769 9,796,388 VAT Rate 12% 12% 12% 12% 12% 12%Amount of VAT - - - 427,390 604,569 765,769 878,415 1,039,892 1,175,567
Actual Projected
24 Income Tax Rate This assumption is used by the Tariff Model to calculate the provision for income tax. The assumption is the percentage of income tax the water utility has to pay. Table 6-6 shows how these Income Statement assumptions appear in the Assumptions Sheet.
Table 6-6 Income Statement Assumptions 2005 2006 2007 2008 2009 2010 2011 2012 2013Actual Actual Actual
INCOME STATEMENT ACCOUNTSInterest Earned 3.6% 3.6% 3.6% 3.6% 3.6% 3.6%Number of Employees 15 15 15 15 17 19 21 23 24 Personnel Cost 12% -7% 10% 10% 10% 10% 10% 10%Management Fees 0% 0% 0% 0% 0% 0% 0% 0% 0%Power 53% -27% 10% 10% 10% 10% 10% 10%Chemicals 0% 0% -19% 0% 6% 5% 4% 4% 4%Chemical cost/m3 produced - 0.023 0.019 0.10 0.10 0.10 0.10 0.10 0.10 Bulk Water Purchases 0% 0% 0% 0% 0% 0% 0% 0% 0%Repairs and Maintenance 2% 1% 1% 5% 5% 5% 5% 5% 5%Bad Debts 0% 0% 0% 0% 0% 0% 0% 0% 0%General & Admin. Expenses 17% 18% 25% 20% 20% 20% 20% 20% 20%Annual Water Charge per WellAverage Depreciation Rate 3% 2% 3% 3%Franchise Tax 2%Value-Added Tax (VAT) Rate 12%Income Tax Rate 32%
Projected

National Water Resources Board Tariff Model For Private Water Utilities User’s Manual
28
Supply and Demand Assumptions
25 Total Number of Deepwells This assumption determines the amount of annual water charges to be projected. It also gives an indication of increased production capacity. This assumption should be based on the water utility’s Business Plan. Should there be an increase in the number of wells, there should be a corresponding investment for it.
26 Installed Production Capacity, lps This assumption determines the sufficiency of the water utility’s own production to meet production requirements. It is used in checking whether there will be a water shortage or surplus. This assumption is measured in liters per second (lps). It should also be based on the water utility’s Business Plan. Should there be an increase in the total installed capacity, there should also be a corresponding investment for it.
27 Volume Produced The volume produced for the last historical year is required to be inputted here. It is used in calculating non-revenue water and the basis for future production. This data comes from the water utility’s production data for the whole year, expressed in cubic meters. Only the figure for the last historical year is required.
28 Bulk Water Purchases If the water utility supplements its water production with bulk water purchases, the volume of such purchases for a year, in cubic meters, is required to be inputted here.
29 Volume Sold The total volume sold is used to calculate actual non-revenue water and actual average monthly consumption per connection. The total volume billed or sold for the last historical year is required to be inputted here. This figure should tally with the annual consumption in the Tariff Computation sheet.
30 % Non-Revenue Water The non-revenue water percentage for the historical year is computed based on the volume produced including treated water purchases, and volume sold. For the projection years, this is a target. It is inputted in the Highlights sheet where it may be changed to improve results of projections. This is therefore a non-input cell. % NRW is computed as follows:
= Volume Produced and Treated Water Purchased – Volume Sold Volume Produced and Treated Water Purchased
31 New Connections The number of new connections added during the last historical year is inputted here. Subsequent increases in connections are inputted in the Highlights sheet where they may be changed to improve results of projections.

National Water Resources Board Tariff Model For Private Water Utilities User’s Manual
29
32 Total Connections Only the total number of connections at the end of the last historical is inputted. The total connections for the subsequent years are calculated by adding new connections made during the year.
33 Average Consumption per Connection per Month This assumption for the last historical is computed. For the subsequent years, this assumption may be the same as the previous year. It may be different based on the Business Plan, depending on additional water sources to be tapped, plans to increase service hours, or for other justified reasons. This assumption is expressed in cubic meters. Average consumption per connection per month is computed as follows:
= Total Volume Sold / Total Connections / 12 Months
34 Average Persons per Household This assumption is used to calculate demand and population coverage. This assumption may come from a survey of households in the water utility’s service area, or from census data for the locality of the water utility.
35 Population in Service Area This assumption is used to determine service coverage. This data may come from census data for the locality of the water utility, or more specific data available, such as the total number of households within the subdivision served by the water utility. Table 6-7 shows how these supply and demand assumptions appear in the Assumptions Sheet.
Table 6-7 Supply and Demand Assumptions 2007 2008 2009 2010 2011 2012 2013Actual
SUPPLY AND DEMANDTotal No. of Deepwells/Springs 3 3 3 3 3 3 3 Total Installed Production Capacity, lps33.00 18.90 23.90 23.90 30.20 30.20 30.20 Volume Produced, m3/year 466,091 Bulk Water Purchases, m3/yearVolume Sold, m3/year 410,160 % Non-Revenue Water 12% 16% 15% 14% 12% 12% 12%New Connections 63 104 116 498 895 527 84 Total Connections 2,621 2,725 2,841 3,339 4,234 4,761 4,845 Ave. Consumption/Conn./Mo. (m3) 13.20 11.86 14.04 18.00 19.80 21.60 21.60 Average Persons per Household 5.2 5.2 5.2 5.2 5.2 5.2 5.2 Population in Service Area 35,708 13,966 14,126 14,289 14,453 14,619 14,786 Growth Rate 1.15% 1.15% 1.15% 1.15% 1.15% 1.15%
Projected
6.3 Performance Improvement Plan (PIP) Sheet The PIP sheet is a copy of the Disbursement Schedule from the Performance Improvement Plan developed by the utility. Since the PIP may vary from one water utility to another, this sheet is not protected to allow the user to copy the PIP manually into this sheet. This sheet contains two major sections.

National Water Resources Board Tariff Model For Private Water Utilities User’s Manual
30
1. The upper section contains the Performance Improvement Plan classified according to major works or activities, with the cost distributed over the years that they will be implemented.
2. The lower section is the Summary of the PIP classified according to capital expenditures
and recurring costs.
The user is encouraged to prepare the Summary portion to ensure that all the PIP investments and expenses are included in the financial projections.
a. The Capital Expenditures portion classifies the investments according to the asset classification found in the CPX Depn Table sheet. These capital expenditures are copied to the CPX Inv Constant sheet to the corresponding asset classification. If there are capital investments that are funded by grants or donations, these should be copied also to the CPX Inv No Return Constant sheet.
b. The Recurring Costs portion is for the parts of the PIP that are not capital
investments. They are copied to the Opex Sheet, specifically to the General and Administrative Expenses section.
As a check that all the PIP investments and expenses have been considered, the grand total of the upper portion of the PIP should tally with the Summary portion. The sum of the capital expenditures portion for per year should be equal with the sum of the investments for the corresponding year in the CPS Inv No Return Constant sheet. The sum of the recurring costs portion per year should tally with amount in the General and Administrative Expenses for the corresponding year. An illustration of this PIP sheet can be seen in Table 6-8 below.

National Water Resources Board Tariff Model For Private Water Utilities User’s Manual
31
Table 6-8 PIP Sheet
Cashflow Projection* (Php)
Total Prep Year Year 1 Year 2 Year 3 Year 4 Year 52008 2009 2010 2011 2012 2013
Physical ImprovementsExisting System Improvement
Laterals in Poblacion area (90-110mm x 3,595 m) 2,958,000 2,958,000 -
Service Area and Facilities Expansion - Service Area Expansion: Brgys Mapawa, Coronobe & New Albay -
New Spring Box with Filtration Plant at B. Silang 1,000,000 1,000,000 Transmission line from B Silang springbox to Poblacion Junction 7,948,500 3,974,250 3,974,250 Transmission line from Poblacion Junctn to Mapawa 3,300,000 3,300,000 Transmission line from Poblacion Junctn to Coronobe 3,300,000 3,300,000 Transmission line from Poblacion Junctn to New Albay 3,300,000 3,300,000 Transmission line from Ipil-ipil to Mauswagon 1,650,000 1,650,000 Transmission line from Bagong Silang to New Panay 3,300,000 3,300,000
Production Flowmeters 150,000 100,000 50,000 Service Vehicle 500,000 500,000
- TOTAL, PHYSICAL IMPROVEMENTS 27,406,500 - 4,974,250 7,774,250 11,308,000 3,350,000 -
Institutional / Organizational / ManagementSystem & Network Analysis 400,000 400,000 - - - - Survey of transmission pipeline: profile & site topo 50,000 50,000 - - - - Staff capacity building - technical, billing & collection 50,000 10,000 10,000 10,000 10,000 10,000 Automation of Billing and Accounting System 100,000 100,000 Asset Management Plan (Computer and software) 20,000 20,000 Customer Relation (laptop and LCD projector) 90,000 45,000 45,000 - - -
- 710,000 625,000 55,000 10,000 10,000 10,000 -
28,116,500 625,000 5,029,250 7,784,250 11,318,000 3,360,000 - * Note all costs estimates are given in constant price. 1,250,000 10,058,500 15,568,500 22,636,000 6,720,000
TO PIP IN FINPRO
Capital ExpendituresSpring box with filtration plant 1,000,000 - 1,000,000 - - - - Production Flowmeters 100,000 - - - 100,000 - Production Flowmeters 50,000 50,000 Service Vehicle 500,000 - - 500,000 - - - Asbestos Pipes 3,974,250 3,974,250 - - Asbestos Pipes 3,974,250 3,974,250 Asbestos Pipes 3,300,000 - 3,300,000 - - Asbestos Pipes 3,300,000 - - 3,300,000 - Asbestos Pipes 3,300,000 - - 3,300,000 - Asbestos Pipes 1,650,000 - - 1,650,000 - Asbestos Pipes 3,300,000 - - - 3,300,000 Asbestos Pipes 2,958,000 - - 2,958,000 - Automation of Billing and Accounting System 100,000 100,000 Customer Relation (laptop and LCD projector) 90,000 45,000 45,000 - - -
- Total Capital Expenditures 27,596,500 145,000 5,019,250 7,774,250 11,308,000 3,350,000 -
Recurring CostsSystem & Network Analysis 400,000 400,000 - - - - Survey of transmission pipeline: profile & site topo 50,000 50,000 - - - - Staff capacity building - technical, billing & collection 50,000 10,000 10,000 10,000 10,000 10,000 Asset Management Plan 20,000 20,000
- Total Recurring Costs 520,000 480,000 10,000 10,000 10,000 10,000 -
Total Performance Improvement Plan 28,116,500 625,000 5,029,250 7,784,250 11,318,000 3,360,000 -
ANNUAL TOTALS
TOTAL INSTITUTIONAL, COMMERCIAL AND FINANCIAL IMPROVEMENTS
Activity

National Water Resources Board Tariff Model For Private Water Utilities User’s Manual
32
7 Computation Sheets Computation sheets are those that contain mostly formulas with a few input cells. These are the computation sheets:
7.1 Supply & Demand Sheet The supply and demand sections of this sheet are all computations, with no yellow or input cells. The supply section shows whether there is a water surplus or shortage, depending on the total production as against the total production requirement. The demand section shows the volume that can be sold, based on the number of connections and average consumption. Table 7-1 shows how this appears in the Tariff Model.
Table 7-1 Supply and Demand Section 2007 2008 2009 2010 2011 2012 2013
Actual
SUPPLYInstalled Production Capacity, lps 33.00 33.00 33.00 53.00 53.00 53.00 53.00 Production Capacity (m3/year) 1,040,688 1,040,688 1,040,688 1,671,408 1,671,408 1,671,408 1,671,408 % Non-Revenue Water 12% 16% 15% 14% 12% 12% 12%Production Requirement (m3/year) 466,091 461,537 563,120 838,633 1,143,180 1,402,331 1,427,073 Bulk Water Purchases (m3/year) - - - - - - - Total Own Production and Water Purchases (m3.yr) 1,040,688 1,040,688 1,040,688 1,671,408 1,671,408 1,671,408 1,671,408
Water Surplus / (Shortage) (m3/year) 574,597 579,151 477,568 832,775 528,228 269,077 244,335Water Surplus / (Shortage) (lps) 18.22 18.36 15.14 26.41 16.75 8.53 7.75
DEMANDNew Connections 63 104 116 498 895 527 84 Total Connections 2,621 2,725 2,841 3,339 4,234 4,761 4,845 Average Persons per Household 5.2 5.2 5.2 5.2 5.2 5.2 5.2 Population Served 13,629 14,170 14,773 17,363 22,017 24,757 25,194 Population in Service Area 35,708 13,966 14,126 14,289 14,453 14,619 14,786 % Population Served 38% 101% 105% 122% 152% 169% 170%Ave. Consumption/Conn./Month (m3) 13.98 11.86 14.04 18.00 19.80 21.60 21.60 Volume Sold (m3/year) 410,160 387,691 478,652 721,224 1,005,998 1,234,051 1,255,824
Projected
The revenue section shows how water revenues are computed and projected, as well as new connections, other operating revenues and non-revenue income. Inputs required in this section are the rate increase for new connection fees and the percentage of other operational revenues as against total operating revenues. This section is shown in the Tariff Model as in Table 7-2.
Table 7-2 Revenues Section 2007 2008 2009 2010 2011 2012 2013
Actual
REVENUES
Water TariffEffective Proposed Tariff (P/m3) 7.02 7.02 8.45 8.45 8.45 8.45 8.45 Tariff Rate Increases 0% 20% 0% 0% 0% 0%
Water RevenuesTotal Proposed Water Revenues (Pesos) 2,877,983 2,720,326 4,045,827 6,096,181 8,503,250 10,430,878 10,614,913
New Connection FeesConnection Fee per Unit (Pesos) 1,500 1,500 1,590 1,670 1,736 1,806 1,878 Rate Increase (%) 0% 6% 5% 4% 4% 4%Total Connection Fees (Pesos) 97,378 156,000 184,440 831,411 1,553,971 951,620 157,749
Other Operating Revenues% of Total Operating Revenues 16% 16% 16% 16% 16% 16% 16%Total Operating Revenues (Pesos) 587,279 448,429 666,929 1,004,917 1,401,708 1,719,465 1,749,802
Non-Operating IncomeInterest Rate on Time Deposit 5% 5% 5% 5% 5% 5%Short-Term Deposit Balance, Previous Year 361,013 938,481 74,334 12,722 93,195 30,583 Interest Income on Time Deposit 30,480 17,329 45,047 3,568 611 4,473 1,468
Projected

National Water Resources Board Tariff Model For Private Water Utilities User’s Manual
33
7.2 OPEX Sheet This sheet computes the projected operating expenses for the Income Statement. Details of computations follow.
1 Personnel Personnel cost computation starts with the personnel cost per employee per year. This is multiplied by the escalation factor declared in the Assumptions sheet to get the current unit personnel cost. This is then multiplied by the number of employees declared in the Highlights sheet to get the total personnel cost for the year. This section of the OPEX sheet also shows the employees per 1000 connections ratio and the connections per employee ratio that can be used to benchmark the water utility’s performance with that of the previous year or with the performance of similar water utilities. This section in the OPEX sheet is shown below.
2007 2008 2009 2010 2011 2012 2013
PERSONNELNumber of Employees 11 11 13 15 17 19 21Employees / 1000 Connections 4.2 4.0 4.6 4.5 4.0 4.0 4.3 Connections/employee 238 248 219 223 249 251 231 Escalation Factor for Personnel -2% 5% 5% 5% 5% 5% 5%Cost / Employee / Year 177,506 186,382 195,701 205,486 215,760 226,548 237,875 Personnel Cost 1,952,568 2,050,197 2,544,108 3,082,285 3,667,919 4,304,410 4,995,381
Actual Projected
2 Management Fees If the water utility has an existing management contract, or plans to enter into one during the next five years, or plans to terminate its contract within the next five years, this is the section where these are to be reflected. This expense account is computed be multiplying the amount of fees of the previous year with the declared annual rate increase in the Assumptions sheet. If there are no management fees yet, then the initial amount of the fees may be inputted in the Management Fees line. The amount for the succeeding years will be determined by the annual rate increase. This section in the OPEX sheet is shown below.
2007 2008 2009 2010 2011 2012 2013
MANAGEMENT FEESAnnual Rate Increase 0% 0% 0% 0% 0% 0% 0%Management Fees - 180,000 180,000 180,000 180,000 180,000 180,000
Actual Projected
3 Power Power cost is projected by first calculating the historical unit power cost per cubic meter produced. Then the escalation factor (as declared in the Assumptions sheet) is applied to it to get the current power cost per m3 produced. Then this current unit cost is multiplied by the projected volume to be produced calculated in the Supply and Demand sheet. If the water utility only pumps a portion of its production, the percentage pumped will be inputted to arrive at the volume pumped. This section in the OPEX sheet is shown below.
2007 2008 2009 2010 2011 2012 2013
POWEREscalation Factor for Power 159% 0% 6% 5% 4% 4% 4%Total Volume Produced 461,537 563,120 838,633 1,143,180 1,402,331 1,427,073 % Volume Pumped 100% 100% 100% 100% 100% 100%Volume Pumped, m3/yr 461,537 563,120 838,633 1,143,180 1,402,331 1,427,073 Power Cost (Peso / m3 produced) 0.06 0.06 0.06 0.06 0.07 0.07 0.07 Power Cost, Total (Pesos) 27,160 26,894 34,782 54,390 77,108 98,371 104,111
Actual Projected

National Water Resources Board Tariff Model For Private Water Utilities User’s Manual
34
4 Chemicals Chemical cost is computed like power cost. The current chemical cost is multiplied by the projected volume to be produced to get the total Chemical cost for the year. This section in the OPEX sheet is shown below.
2007 2008 2009 2010 2011 2012 2013
CHEMICALSEscalation Factor for Chemicals 12% 1.00 1.06 1.11 1.16 1.20 1.25 Chemical Cost (Peso / m3 produced) 0.074 0.07 0.05 0.05 0.05 0.05 0.05 Chemical Cost Factor 0.07 0.05 0.06 0.06 0.06 0.06 Chemical Cost, Total (Pesos) 34,692 34,354 29,845 46,670 66,163 84,408 89,333
Actual Projected
5 Bulk Water Purchases This account applies to water utilities that purchase bulk water to augment its own production to be able to serve its production requirements. This is calculated by multiplying the volume to be purchased (determined in the Supply and Demand sheet) by the escalated cost of bulk water per m3. The escalation factor is declared in the Assumptions sheet. This section in the OPEX sheet is shown below.
2007 2008 2009 2010 2011 2012 2013
BULK WATER PURCHASESEscalation Factor for Bulk Water Purchases 0% 0% 0% 0% 0% 0% 0%Cost/m3 purchased 5.00 5.00 5.00 5.00 5.00 5.00 5.00 Bulk Water Purchases - 2,500,000 2,500,000 2,500,000 2,500,000 2,500,000 2,500,000
Actual Projected
6 Repairs and Maintenance This account is calculated by multiplying the net book value of assets by the declared maintenance cost as a percentage of net assets in the Assumptions sheet. It is then inflated in the Income Statement part of the Reports sheet. This section in the OPEX sheet is shown below.
2007 2008 2009 2010 2011 2012 2013
REPAIRS AND MAINTENANCEMaintenance of Net Assets (%) 1% 1% 1% 1% 1% 1% 1%Net Assets Allocated 7,134,495 6,720,690 6,447,536 11,190,174 19,005,566 30,864,776 33,546,565 Maintenance Expenses (Pesos) 39,433 67,207 64,475 111,902 190,056 308,648 335,466
Actual Projected
7 Bad Debts Bad debts expense is calculated by multiplying water revenues by the bad debts percentage declared in the Assumptions sheet. This section in the OPEX sheet is shown below.
2007 2008 2009 2010 2011 2012 2013
BAD DEBTS% of Water Revenues 2% 1% 1% 1% 1% 1% 1%Bad Debts (Pesos) 50,000 27,203 40,458 60,962 85,033 104,309 106,149
Actual Projected
8 Annual Water Charge This is computed by multiplying the number of deep wells by the water charge per well as declared in the Assumptions sheet. This section in the OPEX sheet is shown below.
2007 2008 2009 2010 2011 2012 2013
ANNUAL WATER CHARGENumber of Deepwells 1 1 1 1 1 1 1 Water Charge per Well 947 947 947 947 947 947 947 Annual Water Charge (Pesos) 947 947 947 947 947 947 947
Actual Projected
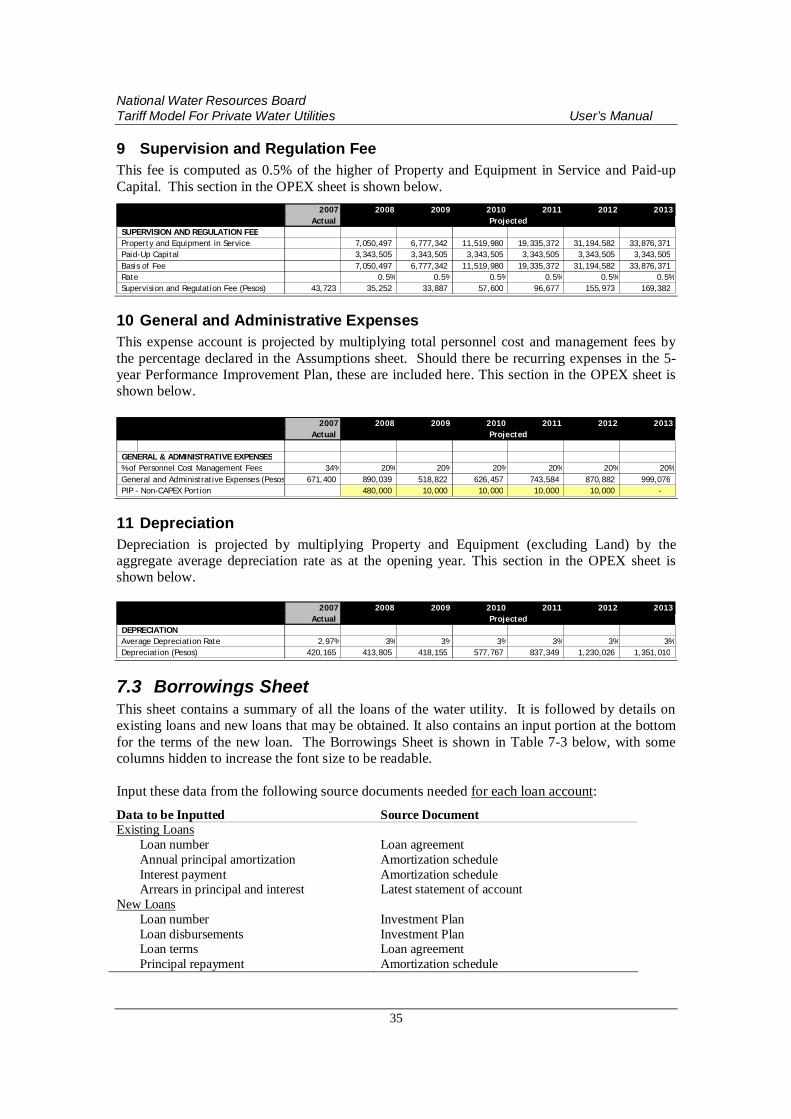
National Water Resources Board Tariff Model For Private Water Utilities User’s Manual
35
9 Supervision and Regulation Fee This fee is computed as 0.5% of the higher of Property and Equipment in Service and Paid-up Capital. This section in the OPEX sheet is shown below.
2007 2008 2009 2010 2011 2012 2013
SUPERVISION AND REGULATION FEEProperty and Equipment in Service 7,050,497 6,777,342 11,519,980 19,335,372 31,194,582 33,876,371 Paid-Up Capital 3,343,505 3,343,505 3,343,505 3,343,505 3,343,505 3,343,505 Basis of Fee 7,050,497 6,777,342 11,519,980 19,335,372 31,194,582 33,876,371 Rate 0.5% 0.5% 0.5% 0.5% 0.5% 0.5%Supervision and Regulation Fee (Pesos) 43,723 35,252 33,887 57,600 96,677 155,973 169,382
Actual Projected
10 General and Administrative Expenses This expense account is projected by multiplying total personnel cost and management fees by the percentage declared in the Assumptions sheet. Should there be recurring expenses in the 5-year Performance Improvement Plan, these are included here. This section in the OPEX sheet is shown below.
2007 2008 2009 2010 2011 2012 2013
GENERAL & ADMINISTRATIVE EXPENSES% of Personnel Cost Management Fees 34% 20% 20% 20% 20% 20% 20%General and Administrative Expenses (Pesos) 671,400 890,039 518,822 626,457 743,584 870,882 999,076 PIP - Non-CAPEX Portion 480,000 10,000 10,000 10,000 10,000 -
Actual Projected
11 Depreciation Depreciation is projected by multiplying Property and Equipment (excluding Land) by the aggregate average depreciation rate as at the opening year. This section in the OPEX sheet is shown below.
2007 2008 2009 2010 2011 2012 2013
DEPRECIATIONAverage Depreciation Rate 2.97% 3% 3% 3% 3% 3% 3%Depreciation (Pesos) 420,165 413,805 418,155 577,767 837,349 1,230,026 1,351,010
Actual Projected
7.3 Borrowings Sheet This sheet contains a summary of all the loans of the water utility. It is followed by details on existing loans and new loans that may be obtained. It also contains an input portion at the bottom for the terms of the new loan. The Borrowings Sheet is shown in Table 7-3 below, with some columns hidden to increase the font size to be readable. Input these data from the following source documents needed for each loan account: Data to be Inputted Source Document Existing Loans
Loan number Annual principal amortization Interest payment Arrears in principal and interest
Loan agreement Amortization schedule Amortization schedule Latest statement of account
New Loans Loan number Loan disbursements Loan terms Principal repayment
Investment Plan Investment Plan Loan agreement Amortization schedule
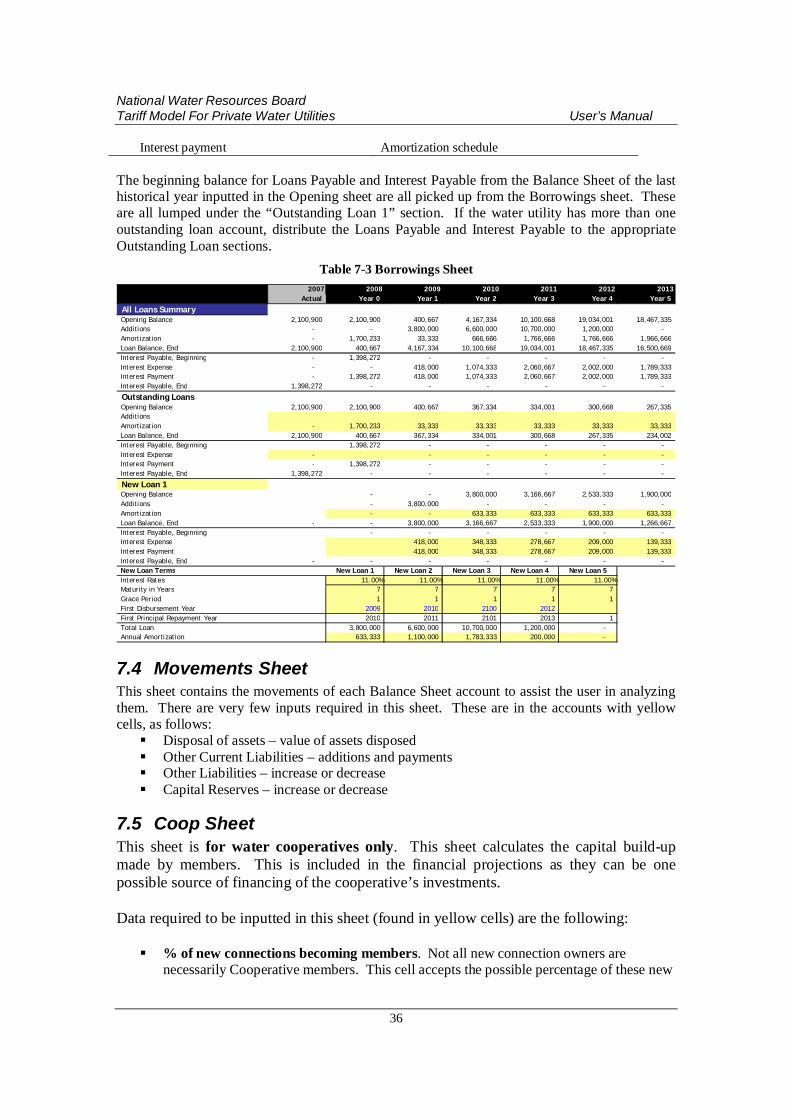
National Water Resources Board Tariff Model For Private Water Utilities User’s Manual
36
Interest payment Amortization schedule The beginning balance for Loans Payable and Interest Payable from the Balance Sheet of the last historical year inputted in the Opening sheet are all picked up from the Borrowings sheet. These are all lumped under the “Outstanding Loan 1” section. If the water utility has more than one outstanding loan account, distribute the Loans Payable and Interest Payable to the appropriate Outstanding Loan sections.
Table 7-3 Borrowings Sheet 2007 2008 2009 2010 2011 2012 2013
Actual Year 0 Year 1 Year 2 Year 3 Year 4 Year 5
All Loans SummaryOpening Balance 2,100,900 2,100,900 400,667 4,167,334 10,100,668 19,034,001 18,467,335 Additions - - 3,800,000 6,600,000 10,700,000 1,200,000 - Amortization - 1,700,233 33,333 666,666 1,766,666 1,766,666 1,966,666 Loan Balance, End 2,100,900 400,667 4,167,334 10,100,668 19,034,001 18,467,335 16,500,669 Interest Payable, Beginning - 1,398,272 - - - - - Interest Expense - - 418,000 1,074,333 2,060,667 2,002,000 1,789,333 Interest Payment - 1,398,272 418,000 1,074,333 2,060,667 2,002,000 1,789,333 Interest Payable, End 1,398,272 - - - - - -
Outstanding LoansOpening Balance 2,100,900 2,100,900 400,667 367,334 334,001 300,668 267,335 AdditionsAmortization - 1,700,233 33,333 33,333 33,333 33,333 33,333 Loan Balance, End 2,100,900 400,667 367,334 334,001 300,668 267,335 234,002 Interest Payable, Beginning 1,398,272 - - - - - Interest Expense - - - - - - Interest Payment - 1,398,272 - - - - - Interest Payable, End 1,398,272 - - - - - -
New Loan 1Opening Balance - - 3,800,000 3,166,667 2,533,333 1,900,000 Additions - 3,800,000 - - - - Amortization - - 633,333 633,333 633,333 633,333 Loan Balance, End - - 3,800,000 3,166,667 2,533,333 1,900,000 1,266,667 Interest Payable, Beginning - - - - - - Interest Expense 418,000 348,333 278,667 209,000 139,333 Interest Payment 418,000 348,333 278,667 209,000 139,333 Interest Payable, End - - - - - - - New Loan Terms New Loan 1 New Loan 2 New Loan 3 New Loan 4 New Loan 5Interest Rates 11.00% 11.00% 11.00% 11.00% 11.00%Maturity in Years 7 7 7 7 7Grace Period 1 1 1 1 1First Disbursement Year 2009 2010 2100 2012First Principal Repayment Year 2010 2011 2101 2013 1Total Loan 3,800,000 6,600,000 10,700,000 1,200,000 - Annual Amortization 633,333 1,100,000 1,783,333 200,000 -
7.4 Movements Sheet This sheet contains the movements of each Balance Sheet account to assist the user in analyzing them. There are very few inputs required in this sheet. These are in the accounts with yellow cells, as follows: Disposal of assets – value of assets disposed Other Current Liabilities – additions and payments Other Liabilities – increase or decrease Capital Reserves – increase or decrease
7.5 Coop Sheet This sheet is for water cooperatives only. This sheet calculates the capital build-up made by members. This is included in the financial projections as they can be one possible source of financing of the cooperative’s investments. Data required to be inputted in this sheet (found in yellow cells) are the following: % of new connections becoming members. Not all new connection owners are
necessarily Cooperative members. This cell accepts the possible percentage of these new

National Water Resources Board Tariff Model For Private Water Utilities User’s Manual
37
connection owners who will become Cooperative members and who will be paying for their shares.
Par value of share. This is the total amount per share to be paid by the new connection owners who become members.
% initial payment. This is the agreed percentage of the total share value that the new member has to pay up front.
Monthly payment. This is the monthly installment for the balance of the share after deducting the initial payment.
Payment period. This is the number of monthly installments to be made to fully pay the balance of the share of the new member.
Number of members with fully paid shares. These are assumptions required for the last historical year (actual) and for the first two projection years (estimates)
Monthly capital build-up. This is the amount to be paid monthly by a member for its capital build-up.
7.6 Consumption Sheet This sheet calculates the equivalent volume (EV) sold which is used in the Tariff Computation sheet to get the cost per equivalent volume. The EV is the volume billed where the meter size factor has been applied. More detailed discussion on the EV is given below. Data required to be inputted in this sheet are the following:
1 Number of Connections Distribute the number of connections by consumer category and meter size. See format in Table 7-4 below. Use the latest historical data.
Table 7-4 Connections and Consumption Input
Consumer Category Meter SizeNumber of
ConnectionsAve. Monthly
Consumption-m 3
1/2"3/4"
1"1 1/2"
2"3"4"
1/2"3/4"
1"1 1/2"
2"3"4"
1/2"3/4"
1"1 1/2"
2"3"4"
Public Taps
Residential / Institutional
Commercial / Industrial
2 Average Monthly Consumption Assign the average monthly consumption for each of the consumer category by meter size. See the format in Table 7-4. Use the latest historical data. However, if average monthly consumption will change because of system improvements, use the projected average monthly consumption as a basis in distributing them into consumer category and meter size.

National Water Resources Board Tariff Model For Private Water Utilities User’s Manual
38
3 Additional Connection Meter Size and Meter Size Factor This portion is only for commercial and industrial connections. This is used when the water utility has connection sizes not listed in the Model. The meter size and meter size factor will thus have to be added, in addition to their corresponding number of connections and average monthly consumption as discussed above.
Equivalent Volume These are the steps done by the Tariff Model in computing the EV.
a. Compute total annual consumption.
This step spreads the annual consumption and connections in to the proper consumer categories. It is done for all the consumer categories.
= Number of connections X Average monthly consumption in cu. m. X 12 months
b. Compute the equivalent consumption per quantity block for all consumer categories.
= Consumption per month in cu. m. X Number of connections X Meter size factor X 12 months
The meter size factors are based on industry standard, and are already provided by the Tariff Model. The meter size factor for commercial and industrial consumers are twice that of the residential consumers. This factor adds a premium on the consumption for the additional cost of providing for a bigger meter and for the convenience given to the consumer in meeting its water needs. This is why the result of these computations is called “equivalent” consumption.
c. Compute the EV.
= Equivalent consumption, annual X Increment factor
d. Compute the cost per EV
= Desired water sales (from Evaluation sheet) / Total EV
This cost/EV is used in calculating the water tariff per consumption category.

National Water Resources Board Tariff Model For Private Water Utilities User’s Manual
39
7.7 Tariff Computation Sheet This sheet calculates the proposed tariff based on the revenue requirements calculated in the Evaluation sheet. Results of calculations are summarized in the Tariff Proposal sheet discussed in Section 5 and the sample table shown in Table 5-6. There are no manual inputs in this sheet. These are the major activities in this sheet:
1 Computation of Water Revenues This section computes the tariff for each consumer category. The resulting tariffs are rounded to the nearest peso to simplify implementation. It then proceeds to compute the total water revenues to be generated by the tariff rates. The total water revenues generated by the resulting water tariffs should be as close as possible to the revenue requirements computed in the Evaluation sheet. The increment factor may be adjusted in the Computation sheet to narrow down this gap. These are the steps done by the Tariff Model to get the total water revenues:
a. Compute the tariff rate per consumer category.
= Cost/EV X Increment factor for the quantity block
b. Compute the water revenues per consumer category, per meter size and quantity
block. = Tariff rate (computed in (a) above) X Average monthly consumption for the quantity block, meter size and
consumer category X 12 months
2 Affordability Test Now that the water tariffs have been determined, the Tariff Model proceeds to evaluate the affordability of the minimum charge for residential consumers to a low-income household. Based on industry standards, a water bill for a lifeline consumption should not exceed 5% of the household income of a low-income household in the service area of the water utility. Lifeline consumption is the least volume of water used by a household for basic needs, like drinking, cooking, bathing and washing. In the absence of a study determining this lifeline consumption for the water utility, a consumption of ten cu. m. may be used. This is done in the Tariff Model by comparing the minimum charge for residential consumers against 5% of the household income of a low-income household. Should the result be excessive, the user may adjust the increment factor in the Consumption sheet until the result becomes acceptable.
7.8 Disallowances Sheet The Disallowances Sheet is used when the water utility is applying for a subsequent set of tariffs for the next five years. The water utility’s performance for the last five years is evaluated. Disallowances or allowances during the past are forwarded to the projected five years, influencing the revenue requirements, and subsequently the tariffs for the next five years.

National Water Resources Board Tariff Model For Private Water Utilities User’s Manual
40
This sheet covers only disallowances related to power and chemicals, and the effect on these expenses of not attaining the target non-revenue water. Adjustments related to capital investments are dealt with in the CPX Inv Constant sheet. Adjustments related to the result of the audit of operating expenses, including non-prudent expenses, are dealt with by inputting the allowance / disallowance in the Evaluation sheet. Input these data in this sheet:
Year 1 Year 2 Year 3 Year 4 Year 5Target NRW%Projected Volume ProducedProjected Volume to be SoldTarget Power unit costTarget Chemicals unit cost
These data come from the projections for the last tariff application. The volume produced and sold should be annual, in cubic meters. The unit cost for power and chemicals should be in peso/cubic meter produced. Three major activities are done in this sheet.
1 Non-Revenue Water This section determines the allowance/disallowance resulting from the water utility’s not attaining the target NRW. The NRW attained by the water utility is compared with the target NRW. For a variance of plus/minus 10% of the target, the water utility is not penalized. Disallowance / allowance starts after considering this +10% flexibility. If a water utility attained a higher NRW than targeted, it is presumed that the water utility produced a higher volume to be able to meet its production requirements, and consequently, incurred higher power and chemical costs. These are the steps done by the Tariff Model to reflect the disallowance/allowance arising from non-attainment of the non-revenue water target.
a. Compute the adjusted target NRW %. 1) Compute the variance between the target NRW and the NRW attained. 2) Compute 10% of the target NRW%. 3) The penalty is the variance computed in (1) minus the 10% of NRW target
computed in (2). If the variance is less than the 10% NRW, there is no penalty.
4) Adjusted target NRW = Target NRW% + Penalty % computed in (3) above
b. Compute the should-be production volume based on the target NRW as adjusted, based on the actual volume sold. = Actual volume sold / (1 – adjusted target NRW) as computed in (a) above
c. Compute the excess production.

National Water Resources Board Tariff Model For Private Water Utilities User’s Manual
41
= Should-be production volume computed in (b) above – Actual production volume
d. Compute the allowance (if the result is positive) or disallowance (if the result is
negative) on power and chemical costs incurred in relation to the excess production. = Target unit cost of power or chemicals X Excess production computed in (c) above
The allowance / disallowance based on the above case go to adjustments on the revenue requirements for the next tariff period.
2 Significant Variances in Unit Cost of Power and Chemicals This section of the Disallowances sheet computes the allowance / disallowance arising from significant variances of unit costs of actual power and chemical costs against the projection. The allowance / disallowance based on the above case go to adjustments on the operating expenses for the year affected. They affect the allowable operating expenses that become part of the revenue requirements of the actual years. This is computed in the Tariff Model as follows:
a. Compute the difference between the projected and actual unit cost per volume produced for either power or chemicals.
b. The allowance/disallowance
= Difference in unit cost X Should-be production volume computed in (1b) under the Non-Revenue
Water section above
3 Tariff Adjustment This section of the Disallowance sheet computes the adjustment to the revenue requirements arising from the difference between the approved average tariff for the five-year period and the actual average tariff recomputed based on actual implementation. This is illustrated below.
2000 2001 2002 2003 2004 ALLOWED /Actual Actual Actual Actual Year 0 (DISALLOWED)
TARIFF ADJUSTMENTShould Have Been Average Tariff 6.30 6.30 6.30 6.30 6.30 Actual Average Tariff Billed 6.67 6.53 6.40 6.52 6.52 Under / (Over) billed (0.37) (0.23) (0.09) (0.21) (0.22) Actual Volume Sold, m3 149,801 157,685 165,984 174,720 174,720 Tariff Adjustment (54,917) (36,118) (15,658) (37,420) (37,609) (181,721)
The total tariff adjustment for the past five years are deducted or added to the calculated revenue requirements in the Evaluation sheet to get the tariff that should be implemented for the next five years.
8 CPX Sheets The CPX sheets contain information related to property and equipment. These sheets aid in the computation of the allowable depreciation of property and equipment in service entitled to return. This allowable depreciation becomes part of the revenue requirements in computing the return on investments.

National Water Resources Board Tariff Model For Private Water Utilities User’s Manual
42
8.1 Input Sheets The following sheets are where data related to assets and capital investments are entered. The depreciation table can also be considered an input sheet since it is referred to by the other sheets when calculating depreciation.
8.1.1 CPX Depn Table Sheet This sheet contains the valid useful life and corresponding depreciation rates for specific types of assets based on NWRB’s Board Resolution. Assets that cannot be classified in NWRB’s table can be added here together with their corresponding useful lifves and depreciation rates.
8.1.2 CPX Inv Constant Sheet This sheet contains groupings of all assets of the utility based on NWRB’s recommended groupings found in the CPX Depn Table sheet, as well as distribution of the costs of these assets by acquisition year.
There are two sets of assets that are entered in this sheet:
1. Existing assets
All assets acquired on or before the declared “earliest historical year” are entered under this “earliest historical year”. Assets acquired thereafter should be entered under the corresponding year.
2. Capital investments for the projected tariff period
This part consists of the capital investments of the water utility for the next five years which are stated in constant prices. Data to be inputted in this sheet come from the list of new investments required to be submitted by the applicant water utility, as enumerated in Section 4.
Steps to enter the data are as follows:
a. Type the name of the asset based on the asset descriptions in the CPX Depn Table sheet. See Section 8.1.1 for assets not yet listed in the CPX Depn Table sheet.
Make one entry for each acquisition year.
b. Copy the depreciation rate for that asset from the CPX Depn Table sheet
c. Input the amount of the asset or investment under the appropriate year that the asset was acquired or the investment is to be made.
d. Check that the total assets/investments per year entered in this sheet tallies with those in the water utility’s balance sheet (for existing assets) and the capital investment plan.
For example, if a submersible pump was acquired in 2005, and another in 2006, enter “Submersible Pump” in one line and write “2005” for its acquisition year. In another line, enter another “Submersible Pump” in and write “2006” for its acquisition year.

National Water Resources Board Tariff Model For Private Water Utilities User’s Manual
43
8.1.3 CPX Begin Sheet CPX Begin sheet screens assets that are entitled to return at the beginning of the old tariff period so that their annual depreciation, accumulated depreciation and net book value can be computed. The accumulated depreciation of each asset line becomes the beginning balance of the asset in the CPX ROI Acc Depn sheet.
CPX Begin sheet picks up from the CPX Inv Constant sheet all the assets of the water utility as of the earliest historical year for initial tariff applications with NWRB, or the first year of the old tariff period (or Year – 4) for subsequent tariff applications. Each of the assets is described by their useful life, acquisition date and amount. Their total should tally with the total assets in the Balance Sheet for the earliest historical year.
The classification of assets by funding source is entered in this sheet. This classification should determine if they are entitled to return or not.
In general, all assets are entitled to return, except:
a. Assets not in service, such as those that have outlived their useful life and are no longer used in water operations
b. Assets donated or funded by grants
Data to be inputted in this sheet come from the itemized list of assets entitled to return required to be submitted by the applicant water utility, as enumerated in Section 4. It is recommended that this itemized list be in the format as shown in Table 8-1.
8.1.4 CPX Inv No Return Constant Sheet This sheet contains capital investments that are not entitled to return. These are required to be inputted in this sheet in their acquisition costs. The cost of these assets are deducted from those in the CPX Begin sheet, then converted to current costs in the CPX Inv No Return Current sheet to arrive at the assets entitled to return, appearing in the CPX ROI Inv sheet. Having no negative amounts in the ROI Inv sheet is an indication that there is no error in placing an amount in the wrong line or year.
8.2 Computation Sheets Computation sheets contain data that need to be encoded, in combination with cells that are purely formulas. There are no manual inputs required in these sheets. All the computations are done through formulas in the Model.
8.2.1 CPX Inv Current Sheet No inputs are required in this sheet. This sheet converts the cost of the capital investments from constant price to current price by applying the corresponding inflation rates. This is done as follows:
= Contents of CPX Inv Constant X Inflation

National Water Resources Board Tariff Model For Private Water Utilities User’s Manual
44
8.2.2 CPX Inv No Return Current Sheet No inputs are required in this sheet. This sheet converts the cost of assets from the CPX Inv No Return sheet to current prices as follows:
= Contents of CPX Inv No Return Constant X Inflation
8.2.3 CPX ROI Inv Sheet No inputs are required in this sheet. This sheet contains capital investments entitled to return. The Tariff Model computes this as follows:
= Contents of CPX Inv Current – Contents of CPX Inv No Return Current
8.2.4 CPX ROI Cum. Assets Sheet No inputs are required in this sheet. This sheet computes the accumulated balance of assets entitled to return by adding investments entitled to return for the year to the previous year’s balance, as follows: = Balance of the asset in the previous year + Amount of the asset in the CPX ROI Inv sheet
8.2.5 CPX ROI Depn Sheet No inputs are required in this sheet. This sheet computes the depreciation of each asset line. This is done as follows: = Cost of the asset in the CPX ROI Total Assets sheet X Depreciation rate of the asset from the CPX Depn Table sheet
8.2.6 CPX ROI Accum Depn Sheet No inputs are required in this sheet. This sheet computes the accumulated depreciation of each asset line. This is done as follows: = Previous year’s accumulated depreciation + Depreciation computed in the CPX ROI Depn sheet
8.2.7 CPX ROI NBV Sheet No inputs are required in this sheet. This sheet computes the net book value of each asset line. This is done as follows: = Cost of the asset from the CPX ROI Acc. Assets sheet
– Accumulated depreciation of the asset from the CPX ROI Acc Depn sheet

National Water Resources Board Tariff Model For Private Water Utilities User’s Manual
45
Table 8-1 CPX Begin Sheet Inputs Acquisition 2004 Donations/ Other Not Annual Accumulated Net
Date Balance Sheet Grant Sources Entitled Entitled Depreciation Depreciation Book Value
Land 323,326 323,326.10 - 323,326.10 323,326 - -
DEEPWELLS AND PUMPHOUSESSpring box with filtration plant - - - - - - - Production Flowmeters - - - - - - - Production Flowmeters - - - - - - - Concrete reservoir 40 2004 395,430 395,430.17 - 395,430.17 9,886 - 395,430 Concrete reservoir 40 2006 - - - - - - - Concrete reservoir 40 2007 - - - - - - - Asbestos and plastic pipes 30 2004 9,807,568 9,807,568.38 - 9,807,568.38 326,919 - 9,807,568 Asbestos and plastic pipes 30 2005 - - - - - - - Asbestos and plastic pipes 30 2006 - - - - - - - Asbestos and plastic pipes 30 2007 - - - - - - - Asbestos and plastic pipes 30 2009 - - - - - - - Asbestos and plastic pipes 30 2010 - - - - - - - Asbestos and plastic pipes 30 2011 - - - - - - - Asbestos and plastic pipes 30 2012 - - - - - - -
- - - - - - - - Building 40 2004 342,647 342,646.88 - 342,646.88 8,566 - 342,647 Building 40 2005 - - - - - - - Building 40 2006 - - - - - - - Building 40 2007 - - - - - - - Chlorinating equipment 10 2004 285,770 285,769.80 - 285,769.80 28,577 - 285,770 Office Furniture and Fixtures 80,071 80,070.55 - 80,070.55 - - 80,071
- - - - - - - - Office Equipment 5 2004 46,649 46,648.60 - 46,648.60 9,330 - 46,649 Office Equipment 5 2007 - - - - - - -
- - - - - - - - Tools and equipment 5 2004 24,585 24,585.15 - 24,585.15 4,917 - 24,585
- - - - - - - - Computer equipment 3 2004 93,550 93,550.00 - 93,550.00 31,183 - 93,550 Computer equipment 3 2005 - - - - - - -
- - - - - - - - Communication Equipment 5 2004 115,745 115,744.50 - 115,744.50 23,149 - 115,745 Communication Equipment 5 2008 - - - - - - - Communication Equipment 5 2009 - - - - - - - Service Vehicle 5 2004 160,260 160,260.00 - 160,260.00 32,052 - 160,260 Service Vehicle 5 2010 - - - - - - -
- - - - - - - - Billing and Accounting System 5 2008 - - - - - - -
- - - - - - - - Other Fixed Assets 5 2004 9,060 9,059.98 - 9,059.98 1,812 - 9,060
- - - - - - - - TOTAL 11,684,660.11 - 11,684,660.11 - 11,684,660.11 476,391 - 11,684,660
Per Balance Sheet 11,684,660.11
Difference -
DescriptionUseful Life In
Years
Related Documents