Tariff Elimination and the Wage Gap in an Industrial Specific Factors Model* Henry Thompson and John FrancisAbstract A specific factors model of 458 US manufacturing industries simulates the effects of eliminating manufac- turing tariffs on unskilled and skilled wages. The model assumes constant elasticity substitution, industry-specific capital inputs, and mobile unskilled and skilled labor.Tariff elimination slightly lowers both unskilled and skilled wages, and increases the skilled wage gap. Industry outputs and capital returns absorb the negative impact of the falling tariffs with losses concentrated in more highly protected industries and most industries enjoying small positive outcomes. 1. Introduction The effect of falling tariffs on wages and the skilled wage gap in developed countries remains a topic of interest. The Stolper–Samuelson (1941) theorem predicts lost pro- tection would lower wages in labor-scarce countries and income redistribution would be required to raise all real factor incomes. The present paper examines the potential impact on the skilled wage gap of a hypothetical trade liberalization event, the com- plete elimination of all US manufacturing tariffs. The paper specifies a specific factors model with 458 manufacturing industries, mobile unskilled and skilled labor, and spe- cific industrial capital. There is evidence of a decline in the middle of the US income distribution coinci- dental with declining tariffs over recent decades. The wage of US high school relative to college graduates fell by 19% between 1973 and 2003 as pointed out by Autor et al. (2005). Feenstra and Hanson (1995) estimate increased trade volumes account for a third of the decline in US production relative to nonproduction wages during the 1980s. Wood (1994), Slaughter (1998), Feenstra and Hanson (1999), Baldwin and Cain (2000), and Leamer (2000) also uncover large wage effects due to increased trade volumes. Dasgupta and Osang (2007) uncover an empirical link between US manufacturing prices and the wage gap over the years 1958 to 1996, closer to the theory based on price changes. Technology rather than trade is seen as the predominant cause of the increased wage gap by Lawrence and Slaughter (1993), Sachs and Shatz (1994), Berman et al. (1998), Haskel and Slaughter (2002, 2003), and Tokarick (2005). Dasgupta and Osang (2007) also separate a technology effect on the wage gap and separate effects of changing capital and labor endowments, consistent with theory. There seems to be some consensus that falling US tariffs have accounted for some of the increased wage gap but the weight of the impact remains an issue.The policy issue * Thompson: Economics, Comer Hall,Auburn University,Alabama,AL 36849, USA.Tel: (334) 844-2910; Fax: (334) 844-5639; E-mail: [email protected]. Francis: Department of Economics and Finance, College of Business, Louisiana Tech University, PO Box 10318, Ruston, LA 71272, USA. Tel: (318) 257-2917; Fax: (318) 257-4253; E-mail: [email protected]. Thanks for suggestions go to Henry Kinnucan and two referees of this journal. Review of International Economics, 17(3), 447–460, 2009 DOI:10.1111/j.1467-9396.2008.00786.x © 2009 The Authors Journal compilation © 2009 Blackwell Publishing Ltd, 9600 Garsington Road, Oxford, OX4 2DQ, UK and 350 Main St, Malden, MA, 02148, USA

Welcome message from author
This document is posted to help you gain knowledge. Please leave a comment to let me know what you think about it! Share it to your friends and learn new things together.
Transcript
Tariff Elimination and the Wage Gap in anIndustrial Specific Factors Model*
Henry Thompson and John Francisroie_786 447..460
AbstractA specific factors model of 458 US manufacturing industries simulates the effects of eliminating manufac-turing tariffs on unskilled and skilled wages. The model assumes constant elasticity substitution,industry-specific capital inputs, and mobile unskilled and skilled labor. Tariff elimination slightly lowers bothunskilled and skilled wages, and increases the skilled wage gap. Industry outputs and capital returnsabsorb the negative impact of the falling tariffs with losses concentrated in more highly protected industriesand most industries enjoying small positive outcomes.
1. Introduction
The effect of falling tariffs on wages and the skilled wage gap in developed countriesremains a topic of interest. The Stolper–Samuelson (1941) theorem predicts lost pro-tection would lower wages in labor-scarce countries and income redistribution wouldbe required to raise all real factor incomes. The present paper examines the potentialimpact on the skilled wage gap of a hypothetical trade liberalization event, the com-plete elimination of all US manufacturing tariffs. The paper specifies a specific factorsmodel with 458 manufacturing industries, mobile unskilled and skilled labor, and spe-cific industrial capital.
There is evidence of a decline in the middle of the US income distribution coinci-dental with declining tariffs over recent decades. The wage of US high school relativeto college graduates fell by 19% between 1973 and 2003 as pointed out by Autor et al.(2005). Feenstra and Hanson (1995) estimate increased trade volumes account for athird of the decline in US production relative to nonproduction wages during the 1980s.Wood (1994), Slaughter (1998), Feenstra and Hanson (1999), Baldwin and Cain (2000),and Leamer (2000) also uncover large wage effects due to increased trade volumes.Dasgupta and Osang (2007) uncover an empirical link between US manufacturingprices and the wage gap over the years 1958 to 1996, closer to the theory based on pricechanges.
Technology rather than trade is seen as the predominant cause of the increased wagegap by Lawrence and Slaughter (1993), Sachs and Shatz (1994), Berman et al. (1998),Haskel and Slaughter (2002, 2003), and Tokarick (2005). Dasgupta and Osang (2007)also separate a technology effect on the wage gap and separate effects of changingcapital and labor endowments, consistent with theory.
There seems to be some consensus that falling US tariffs have accounted for some ofthe increased wage gap but the weight of the impact remains an issue. The policy issue
* Thompson: Economics, Comer Hall,Auburn University,Alabama,AL 36849, USA.Tel: (334) 844-2910; Fax:(334) 844-5639; E-mail: [email protected]. Francis: Department of Economics and Finance, College ofBusiness, Louisiana Tech University, PO Box 10318, Ruston, LA 71272, USA. Tel: (318) 257-2917; Fax:(318) 257-4253; E-mail: [email protected]. Thanks for suggestions go to Henry Kinnucan and two refereesof this journal.
Review of International Economics, 17(3), 447–460, 2009DOI:10.1111/j.1467-9396.2008.00786.x
© 2009 The AuthorsJournal compilation © 2009 Blackwell Publishing Ltd, 9600 Garsington Road, Oxford, OX4 2DQ, UK and 350 Main St, Malden, MA, 02148, USA
is critical as the US moves forward in various free-trade agreements. For example,Batra (1992, 1994) and Batra and Slotje (1993) believe discriminatory tariffs againsthigh-technology imports from Japan during the 1980s would have supported the USwage, while Marjit (1994) and Rassekh (1994) disagree.
Trade liberalization events may provide evidence on the wage effects of free trade.NAFTA has been the largest single event but has had little impact on the US labormarket. Hinojosa-Ojeda et al. (2000) estimate that between 1990 and 1997 there were37,000 jobs lost per month in the US due to NAFTA but meanwhile the economycreated over five times that many jobs. Burfisher et al. (2001) conclude the small effectsof NAFTA should be no surprise since US trade with Mexico is relatively small andprices of traded products in the US have not changed.
In the present applied specific factors model, hypothetical price changes due to thetrade liberalization event of eliminated manufacturing tariffs lead to comparative staticadjustments in the unskilled wage and skilled wage. Adjustments in industrial outputsand capital returns are also derived. The industrial data separate two types of labor,production (unskilled), and non-production (mostly skilled), and both types of laborare assumed mobile between industries. Immobile capital is specific to its industry andthe specific factors model is often characterized as the short run. The present model ismuch more disaggregated than other specifications in the literature such as Thompson(1994, 1996) or Thompson and Toledo (2001).
Tariff elimination slightly lowers both the wage and the skilled wage, and increasesthe relative skilled wage. Mobility of the two types of labor is the key to the small wageeffects. In contrast, there are substantial adjustments in industrial capital return inhighly protected industries. Most industries enjoy small gains, absorbing both types oflabor from the industries that lose protection. Long-run adjustments due to alteredinvestment incentives would be larger and are projected, and wage effects of the actualtariff decline between 1974 and 1996 are calculated.
2. The Industrial Specific Factors Model
Neoclassical production in each of the N industries requires inputs of mobile unskilledand skilled labor along with that particular industry-specific capital. Behavioralassumptions of the model are full employment and competitive pricing. Full employ-ment of each of the N + 2 factors is written
v a xi ij jj
= ∑ , (1)
where vi is the endowment of factor i, aij the cost-minimizing amount of factor i used toproduce a unit of good j, and xj the output of industry j.
Competitive pricing implies
p a wj ij ii
= ∑ , (2)
where pj is the price of good j, and wi is the price of factor i. Each industry is assumeda price taker in its international market, difficult to verify at the present level ofaggregation (Broadwoven Fabrics, Luggage, Blowers and Fans, Fabricated Pipe, etc.)but Thompson (2004) shows that the basic results of the model are not much affectedby parametric relaxation of competitive pricing or full employment.
448 Henry Thompson and John Francis
© 2009 The AuthorsJournal compilation © Blackwell Publishing Ltd. 2009
Totally differentiate (1) and introduce substitution elasticities to find
ˆ ˆ ˆ ,v x wi ij jj
ik kk
= +∑ ∑λ σ (3)
where the circumflex (“ˆ”) represents percentage change, lij is the industry j share offactor i employment, and sij the elasticity of demand for factor i with respect to theprice of factor k.
Totally differentiate (2) and use the cost-minimizing envelope result to find
ˆ ˆ ,p wj ij ij
= ∑θ (4)
where q ij is the share of factor i in the revenue of good j. Output price changes in (4) area weighted average of factor price changes in the Jones (1965) magnification effect.
Equations (3) and (4) are combined into
σ λθ′
⎛⎝⎜
⎞⎠⎟
⎛⎝⎜
⎞⎠⎟ = ⎛
⎝⎜⎞⎠⎟0
ˆ
ˆ
ˆ
ˆ,
w
x
v
p(5)
where x is the N = 458 vector of output changes, w is the M = N + 2 = 460 vector offactor price changes, v = 0 is the M vector of zero endowment changes, p is the N vectorof output price changes, s is the M ¥ M matrix of factor substitution elasticities, l is theM ¥ N matrix of industry shares, q � is the N ¥ M matrix of factor shares, and 0 is anN ¥ N null matrix.
The comparative static w/p elasticities of interest are derived inverting (5). A vectorp of price changes from tariff elimination is multiplied by this derived w/p matrix to findthe endogenous w vector of factor price adjustments.
International manufacturing prices are held constant with the assumption that theUS is a price taker in international markets. A number of the highly protected indus-tries are in apparel, making this assumption reasonable. For industries with tariffs closeto the average of 2.9% (Blowers and Fans, Hardware, etc.) tariff elimination might raiseworld prices but the effect would seem to be small.
3. Factor Shares and Industry Shares in the Industrial Specific Factors Model
The system matrix on the left-hand side of (5) is constructed from the ManufacturingIndustry Productivity Database of the National Bureau of Economic Research(NBER).The dataset provides production data by industry SIC code, most recently for1996. Asbestos Products SIC 3292 has no value-added and is dropped from the sampleleaving 458 industries.
The present model focuses on manufacturing, not services or agriculture where thereis no similar breakdown of labor. The dataset provides total payments to productionand total labor with production labor a proxy for unskilled labor. The nonproduction(skilled) labor bill is derived as the residual from the total labor bill. Professionals andtechnical workers are the predominant groups in this residual category.The numbers ofworkers are similarly separated and average wages for the two groups are derived.
The capital payment is the residual of value-added after the total labor bill.The meanof the capital share is 0.64 and its standard deviation 0.11, and it ranges from 0.95 to0.15. Some part of this large variation is due to energy inputs, implicitly included inresidual capital. The mean energy share in more aggregated manufacturing data is 0.12and the standard deviation about the same size. The present simulations effectively
TARIFF ELIMINATION AND THE WAGE GAP 449
© 2009 The AuthorsJournal compilation © Blackwell Publishing Ltd. 2009
assume capital and energy are perfect complements. The wage effects of tariff elim-ination would be somewhat smaller with perfectly mobile energy input betweenindustries.
The mean wage of production labor across industries is $26,200 with a standarddeviation of $8200 due at least in part to cost-of-living differences.The wage distributionacross industries is near normal with a low kurtosis of 0.67 and slight right skew of 0.78.
The mean skilled wage is two-thirds higher at $43,700. Its standard deviation of $8600is much smaller relative to its mean.There is clustering around the mean with a kurtosisof 1.21 and a negligible skew of -0.13. The suggestion is that skilled labor is moremobile across industries.
The q matrix of factor shares is the factor payment relative to industry value-added.The working assumption is that mobility of unskilled labor implies equal unskilledwages across industries, and the same assumption holds for skilled labor. Competitiveproduct markets and constant returns imply factor shares sum to one for each product.
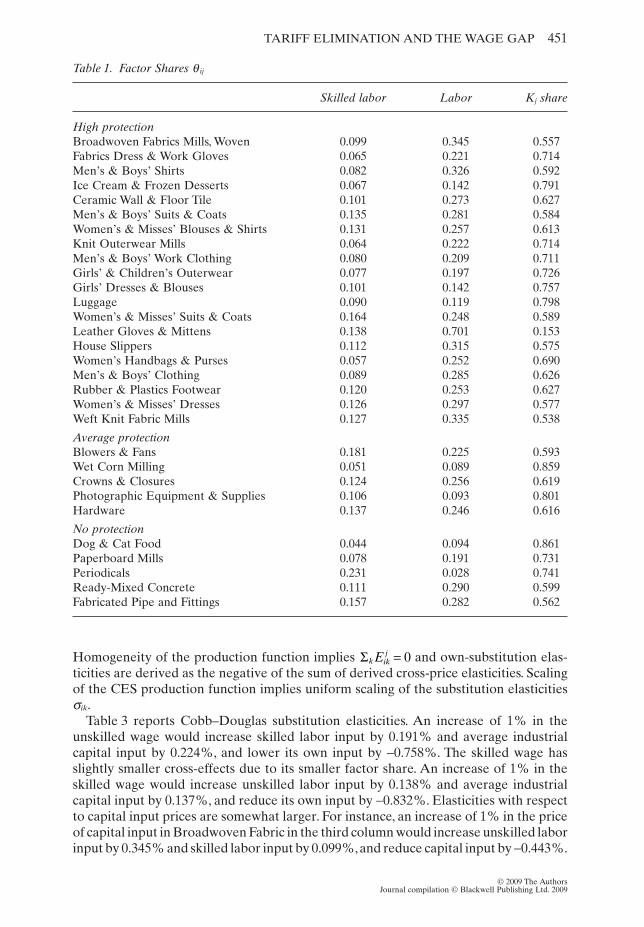
Table 1 shows rows of the q matrix for a select 30 industries that include 20 industrieswith the highest tariffs, five industries with tariffs closest to the average, and a selectionof five of the 22 industries with no tariffs. Table 1 also contains the correspondingindustry-specific residual capital shares.
Table 2 shows the industry share matrix, each element lij calculated dividing theemployment of factor i in industry j by the total quantity of the factor. As an example,skilled labor employment in Broadwoven Fabrics SIC 2231 is 1700 and its skilled laborindustry share is 0.0003 = 1700 � 5,159,700, the total skilled labor employment in all458 industries. Table 2 shows rows of the l matrix for the selected industries. Eachspecific capital industry share equals one.
4. Factor Substitution in the Industrial Specific Factors Model
The partial cross-price elasticity of the input of factor i with respect to the price offactor k in industry j is
E a wikj
ij k= ˆ ˆ . (6)
Given the first-order envelope theorem of cost minimization, Sato and Koizumi (1973)show that
E a w Sikj
ij k kj ikj= =ˆ ˆ ,θ (7)
where Sikj is the Allen partial elasticity of substitution. With Cobb–Douglas production
implies Sikj = 1 and constant elasticity of substitution (CES) production makes Sik
j apositive constant. Estimated cross-price elasticities Sik
j in the applied production litera-ture are typically between 0.5 and 1, and the present simulations examine thissensitivity.
Each element sik of the factor substitution matrix is the weighted elasticity of factori input with respect to the price of factor k in the economy:
σ λ λ θik kj ikj
jij kj ik
j
j
E S= =∑ ∑ , (8)
as developed by Jones and Scheinkman (1977). Cobb–Douglas production implies thesubstitution elasticity is a sum of industry and factor shares:
σ λ θik ij kjj
= ∑ . (9)
450 Henry Thompson and John Francis
© 2009 The AuthorsJournal compilation © Blackwell Publishing Ltd. 2009
Homogeneity of the production function implies Σk ikjE = 0 and own-substitution elas-
ticities are derived as the negative of the sum of derived cross-price elasticities. Scalingof the CES production function implies uniform scaling of the substitution elasticitiessik.
Table 3 reports Cobb–Douglas substitution elasticities. An increase of 1% in theunskilled wage would increase skilled labor input by 0.191% and average industrialcapital input by 0.224%, and lower its own input by -0.758%. The skilled wage hasslightly smaller cross-effects due to its smaller factor share. An increase of 1% in theskilled wage would increase unskilled labor input by 0.138% and average industrialcapital input by 0.137%, and reduce its own input by -0.832%. Elasticities with respectto capital input prices are somewhat larger. For instance, an increase of 1% in the priceof capital input in Broadwoven Fabric in the third column would increase unskilled laborinput by 0.345% and skilled labor input by 0.099%,and reduce capital input by -0.443%.
Table 1. Factor Shares q ij
Skilled labor Labor Kj share
High protectionBroadwoven Fabrics Mills, Woven 0.099 0.345 0.557Fabrics Dress & Work Gloves 0.065 0.221 0.714Men’s & Boys’ Shirts 0.082 0.326 0.592Ice Cream & Frozen Desserts 0.067 0.142 0.791Ceramic Wall & Floor Tile 0.101 0.273 0.627Men’s & Boys’ Suits & Coats 0.135 0.281 0.584Women’s & Misses’ Blouses & Shirts 0.131 0.257 0.613Knit Outerwear Mills 0.064 0.222 0.714Men’s & Boys’ Work Clothing 0.080 0.209 0.711Girls’ & Children’s Outerwear 0.077 0.197 0.726Girls’ Dresses & Blouses 0.101 0.142 0.757Luggage 0.090 0.119 0.798Women’s & Misses’ Suits & Coats 0.164 0.248 0.589Leather Gloves & Mittens 0.138 0.701 0.153House Slippers 0.112 0.315 0.575Women’s Handbags & Purses 0.057 0.252 0.690Men’s & Boys’ Clothing 0.089 0.285 0.626Rubber & Plastics Footwear 0.120 0.253 0.627Women’s & Misses’ Dresses 0.126 0.297 0.577Weft Knit Fabric Mills 0.127 0.335 0.538
Average protectionBlowers & Fans 0.181 0.225 0.593Wet Corn Milling 0.051 0.089 0.859Crowns & Closures 0.124 0.256 0.619Photographic Equipment & Supplies 0.106 0.093 0.801Hardware 0.137 0.246 0.616
No protectionDog & Cat Food 0.044 0.094 0.861Paperboard Mills 0.078 0.191 0.731Periodicals 0.231 0.028 0.741Ready-Mixed Concrete 0.111 0.290 0.599Fabricated Pipe and Fittings 0.157 0.282 0.562
TARIFF ELIMINATION AND THE WAGE GAP 451
© 2009 The AuthorsJournal compilation © Blackwell Publishing Ltd. 2009
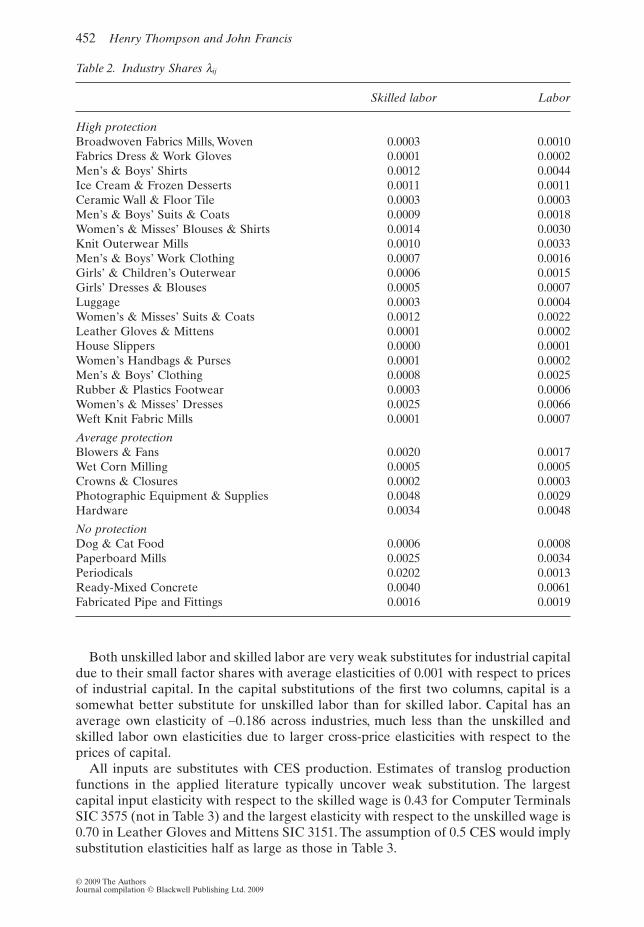
Both unskilled labor and skilled labor are very weak substitutes for industrial capitaldue to their small factor shares with average elasticities of 0.001 with respect to pricesof industrial capital. In the capital substitutions of the first two columns, capital is asomewhat better substitute for unskilled labor than for skilled labor. Capital has anaverage own elasticity of -0.186 across industries, much less than the unskilled andskilled labor own elasticities due to larger cross-price elasticities with respect to theprices of capital.
All inputs are substitutes with CES production. Estimates of translog productionfunctions in the applied literature typically uncover weak substitution. The largestcapital input elasticity with respect to the skilled wage is 0.43 for Computer TerminalsSIC 3575 (not in Table 3) and the largest elasticity with respect to the unskilled wage is0.70 in Leather Gloves and Mittens SIC 3151. The assumption of 0.5 CES would implysubstitution elasticities half as large as those in Table 3.
Table 2. Industry Shares lij
Skilled labor Labor
High protectionBroadwoven Fabrics Mills, Woven 0.0003 0.0010Fabrics Dress & Work Gloves 0.0001 0.0002Men’s & Boys’ Shirts 0.0012 0.0044Ice Cream & Frozen Desserts 0.0011 0.0011Ceramic Wall & Floor Tile 0.0003 0.0003Men’s & Boys’ Suits & Coats 0.0009 0.0018Women’s & Misses’ Blouses & Shirts 0.0014 0.0030Knit Outerwear Mills 0.0010 0.0033Men’s & Boys’ Work Clothing 0.0007 0.0016Girls’ & Children’s Outerwear 0.0006 0.0015Girls’ Dresses & Blouses 0.0005 0.0007Luggage 0.0003 0.0004Women’s & Misses’ Suits & Coats 0.0012 0.0022Leather Gloves & Mittens 0.0001 0.0002House Slippers 0.0000 0.0001Women’s Handbags & Purses 0.0001 0.0002Men’s & Boys’ Clothing 0.0008 0.0025Rubber & Plastics Footwear 0.0003 0.0006Women’s & Misses’ Dresses 0.0025 0.0066Weft Knit Fabric Mills 0.0001 0.0007
Average protectionBlowers & Fans 0.0020 0.0017Wet Corn Milling 0.0005 0.0005Crowns & Closures 0.0002 0.0003Photographic Equipment & Supplies 0.0048 0.0029Hardware 0.0034 0.0048
No protectionDog & Cat Food 0.0006 0.0008Paperboard Mills 0.0025 0.0034Periodicals 0.0202 0.0013Ready-Mixed Concrete 0.0040 0.0061Fabricated Pipe and Fittings 0.0016 0.0019
452 Henry Thompson and John Francis
© 2009 The AuthorsJournal compilation © Blackwell Publishing Ltd. 2009

Matrices of substitution, factor shares, and industry shares are combined to constructthe 918 ¥ 918 system matrix on the left-hand side of (5). Matrix dimensions are s460¥460,l460¥458, ′ ×θ458 460, and 0458¥458.
5. Tariff Elimination and Price Changes in the Industrial SpecificFactors Model
Tariff elimination would decrease prices in the vector p in (5) to world levels with largerindustrial tariffs implying larger price declines. Data on tariff levels by SIC code fromFeenstra et al. (2002) include derived duties and customs value, and the present tariffrates are derived as total customs duties divided by declared customs value.
Table 3. Substitution Elasticities sik
wS wU wK
Skilled Labor -0.832 0.191 0.001 meanLabor 0.138 -0.758 0.001 mean
High protectionBroadwoven Fabrics Mills, Woven 0.099 0.345 -0.443Fabrics Dress & Work Gloves 0.065 0.220 -0.286Men’s & Boys’ Shirts 0.082 0.326 -0.408Ice Cream & Frozen Desserts 0.066 0.142 -0.209Ceramic Wall & Floor Tile 0.101 0.273 -0.373Men’s & Boys’ Suits & Coats 0.135 0.281 -0.417Women’s & Misses’ Blouses & Shirts 0.131 0.257 -0.388Knit Outerwear Mills 0.064 0.222 -0.360Men’s & Boys’ Work Clothing 0.080 0.209 -0.289Girls’ & Children’s Outerwear 0.077 0.197 -0.274Girls’ Dresses & Blouses 0.101 0.142 -0.243Luggage 0.090 0.112 -0.202Women’s & Misses’ Suits & Coats 0.164 0.248 -0.412Leather Gloves & Mittens 0.137 0.710 -0.842House Slippers 0.111 0.315 -0.425Women’s Handbags & Purses 0.057 0.253 -0.310Men’s & Boys’ Clothing 0.089 0.285 -0.374Rubber & Plastics Footwear 0.119 0.253 -0.373Women’s & Misses’ Dresses 0.126 0.297 -0.423Weft Knit Fabric Mills 0.127 0.335 -0.462
Average protectionBlowers & Fans 0.181 0.225 -0.406Wet Corn Milling 0.051 0.089 -0.141Crowns & Closures 0.124 0.258 -0.382Photographic Equipment & Supplies 0.106 0.093 -0.199Hardware 0.137 0.246 -0.383
No protectionDog & Cat Food 0.044 0.095 -0.139Paperboard Mills 0.078 0.191 -0.269Periodicals 0.231 0.028 -0.259Ready-Mixed Concrete 0.111 0.290 -0.401Fabricated Pipe and Fittings 0.157 0.282 -0.439Industrial means 0.137 0.224 -0.186
TARIFF ELIMINATION AND THE WAGE GAP 453
© 2009 The AuthorsJournal compilation © Blackwell Publishing Ltd. 2009
Data are constructed from harmonized tariff codes but there is no unique one-to-onemapping between tariff and SIC codes. Some tariff products map to alternate categor-ies. For instance, SIC 2013 is listed as having no trade data because it is included in SIC2011. For 64 of these “missing” industries there is a unique alternate SIC code.The sametariff rates would apply to both industries and then is assigned to the missing industry.Some other industries map to more than a single SIC category and a weighted averageof the appropriate duties is calculated. A few remaining categories do not map to anyalternate SIC and these industries are assumed to have no trade and zero tariffs.
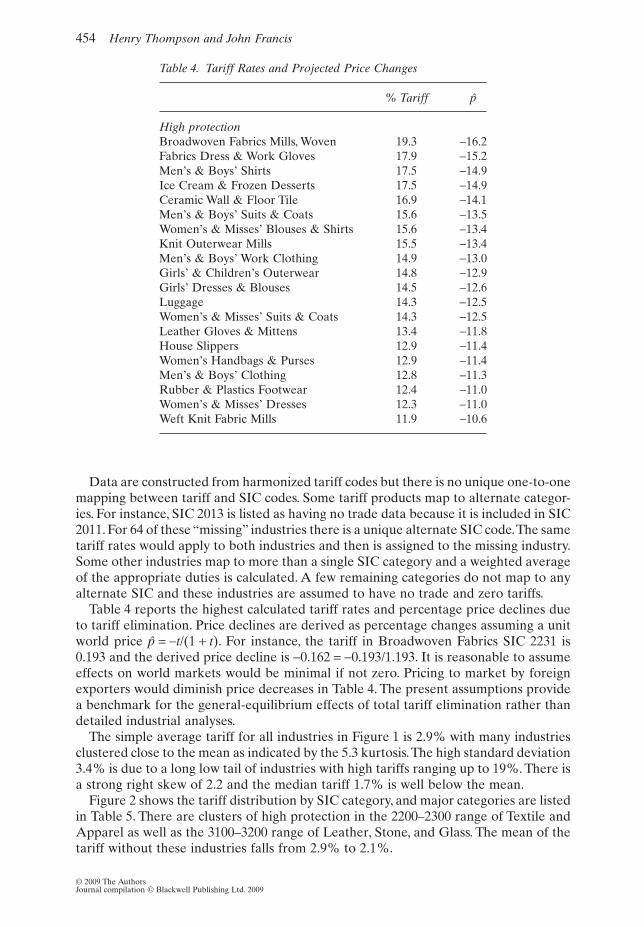
Table 4 reports the highest calculated tariff rates and percentage price declines dueto tariff elimination. Price declines are derived as percentage changes assuming a unitworld price p = -t/(1 + t). For instance, the tariff in Broadwoven Fabrics SIC 2231 is0.193 and the derived price decline is -0.162 = -0.193/1.193. It is reasonable to assumeeffects on world markets would be minimal if not zero. Pricing to market by foreignexporters would diminish price decreases in Table 4. The present assumptions providea benchmark for the general-equilibrium effects of total tariff elimination rather thandetailed industrial analyses.
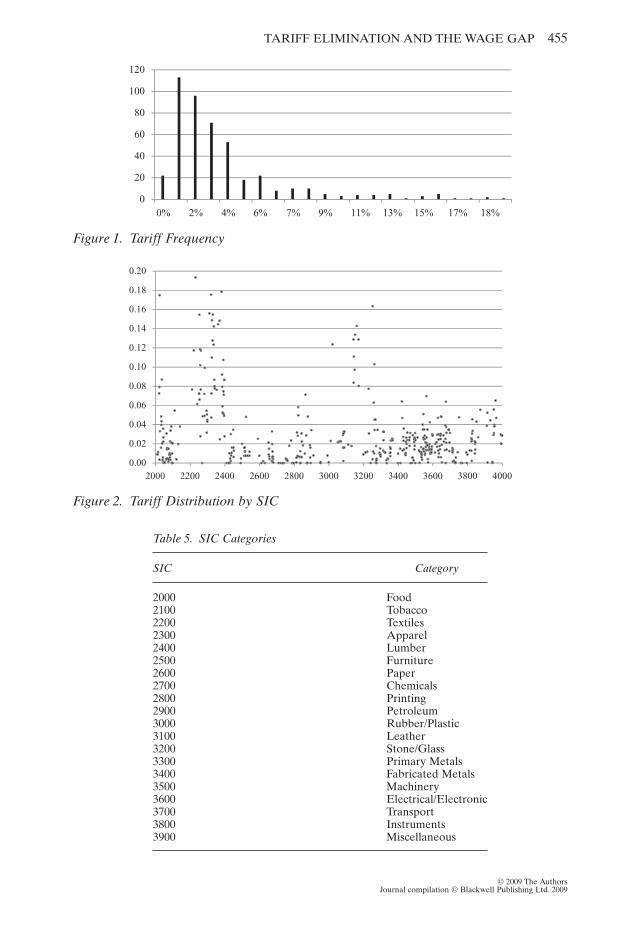
The simple average tariff for all industries in Figure 1 is 2.9% with many industriesclustered close to the mean as indicated by the 5.3 kurtosis.The high standard deviation3.4% is due to a long low tail of industries with high tariffs ranging up to 19%. There isa strong right skew of 2.2 and the median tariff 1.7% is well below the mean.
Figure 2 shows the tariff distribution by SIC category, and major categories are listedin Table 5. There are clusters of high protection in the 2200–2300 range of Textile andApparel as well as the 3100–3200 range of Leather, Stone, and Glass. The mean of thetariff without these industries falls from 2.9% to 2.1%.
Table 4. Tariff Rates and Projected Price Changes
% Tariff p
High protectionBroadwoven Fabrics Mills, Woven 19.3 -16.2Fabrics Dress & Work Gloves 17.9 -15.2Men’s & Boys’ Shirts 17.5 -14.9Ice Cream & Frozen Desserts 17.5 -14.9Ceramic Wall & Floor Tile 16.9 -14.1Men’s & Boys’ Suits & Coats 15.6 -13.5Women’s & Misses’ Blouses & Shirts 15.6 -13.4Knit Outerwear Mills 15.5 -13.4Men’s & Boys’ Work Clothing 14.9 -13.0Girls’ & Children’s Outerwear 14.8 -12.9Girls’ Dresses & Blouses 14.5 -12.6Luggage 14.3 -12.5Women’s & Misses’ Suits & Coats 14.3 -12.5Leather Gloves & Mittens 13.4 -11.8House Slippers 12.9 -11.4Women’s Handbags & Purses 12.9 -11.4Men’s & Boys’ Clothing 12.8 -11.3Rubber & Plastics Footwear 12.4 -11.0Women’s & Misses’ Dresses 12.3 -11.0Weft Knit Fabric Mills 11.9 -10.6
454 Henry Thompson and John Francis
© 2009 The AuthorsJournal compilation © Blackwell Publishing Ltd. 2009
0
20
40
60
80
100
120
0% 18%17%15%13%11%9%7%6%4%2%
Figure 1. Tariff Frequency
0.00
0.02
0.04
0.06
0.08
0.10
0.12
0.14
0.16
0.18
0.20
2000 4000380036003400320030002800260024002200
Figure 2. Tariff Distribution by SIC
Table 5. SIC Categories
SIC Category
2000 Food2100 Tobacco2200 Textiles2300 Apparel2400 Lumber2500 Furniture2600 Paper2700 Chemicals2800 Printing2900 Petroleum3000 Rubber/Plastic3100 Leather3200 Stone/Glass3300 Primary Metals3400 Fabricated Metals3500 Machinery3600 Electrical/Electronic3700 Transport3800 Instruments3900 Miscellaneous
TARIFF ELIMINATION AND THE WAGE GAP 455
© 2009 The AuthorsJournal compilation © Blackwell Publishing Ltd. 2009
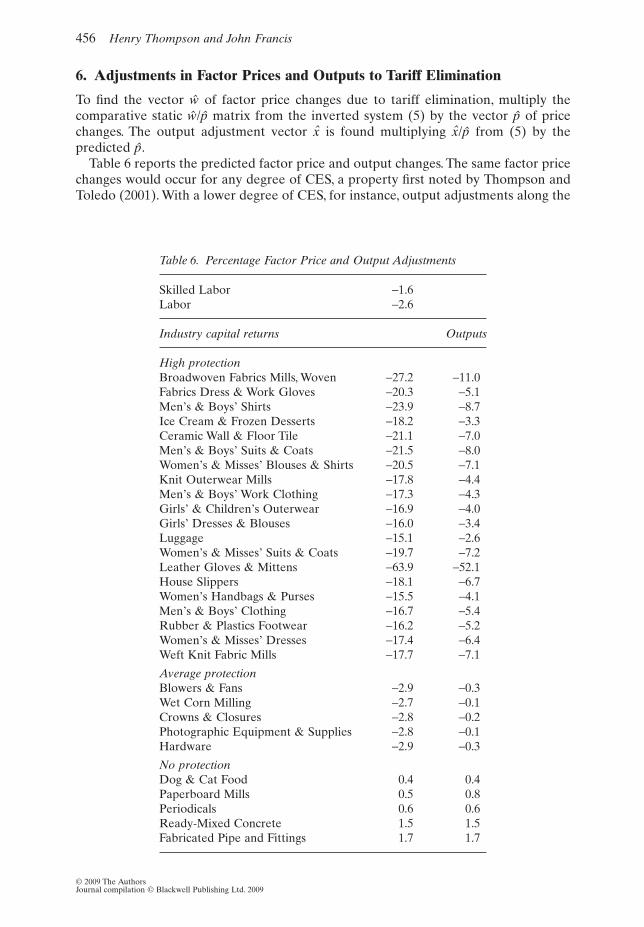
6. Adjustments in Factor Prices and Outputs to Tariff Elimination
To find the vector w of factor price changes due to tariff elimination, multiply thecomparative static w/p matrix from the inverted system (5) by the vector p of pricechanges. The output adjustment vector x is found multiplying x/p from (5) by thepredicted p.
Table 6 reports the predicted factor price and output changes. The same factor pricechanges would occur for any degree of CES, a property first noted by Thompson andToledo (2001). With a lower degree of CES, for instance, output adjustments along the
Table 6. Percentage Factor Price and Output Adjustments
Skilled Labor -1.6Labor -2.6
Industry capital returns Outputs
High protectionBroadwoven Fabrics Mills, Woven -27.2 -11.0Fabrics Dress & Work Gloves -20.3 -5.1Men’s & Boys’ Shirts -23.9 -8.7Ice Cream & Frozen Desserts -18.2 -3.3Ceramic Wall & Floor Tile -21.1 -7.0Men’s & Boys’ Suits & Coats -21.5 -8.0Women’s & Misses’ Blouses & Shirts -20.5 -7.1Knit Outerwear Mills -17.8 -4.4Men’s & Boys’ Work Clothing -17.3 -4.3Girls’ & Children’s Outerwear -16.9 -4.0Girls’ Dresses & Blouses -16.0 -3.4Luggage -15.1 -2.6Women’s & Misses’ Suits & Coats -19.7 -7.2Leather Gloves & Mittens -63.9 -52.1House Slippers -18.1 -6.7Women’s Handbags & Purses -15.5 -4.1Men’s & Boys’ Clothing -16.7 -5.4Rubber & Plastics Footwear -16.2 -5.2Women’s & Misses’ Dresses -17.4 -6.4Weft Knit Fabric Mills -17.7 -7.1
Average protectionBlowers & Fans -2.9 -0.3Wet Corn Milling -2.7 -0.1Crowns & Closures -2.8 -0.2Photographic Equipment & Supplies -2.8 -0.1Hardware -2.9 -0.3
No protectionDog & Cat Food 0.4 0.4Paperboard Mills 0.5 0.8Periodicals 0.6 0.6Ready-Mixed Concrete 1.5 1.5Fabricated Pipe and Fittings 1.7 1.7
456 Henry Thompson and John Francis
© 2009 The AuthorsJournal compilation © Blackwell Publishing Ltd. 2009
production frontier diminish but factor price adjustments along the contract curve areidentical. If CES = 0.5 factor price changes are identical and output changes half aslarge in absolute value as those in Table 6.
Tariff elimination lowers the unskilled wage by 2.6% and the skilled wage by 1.6%,resulting in an increase of 1% in the relative skilled wage. The average unskilled wagewould fall from $26,200 to $25,519 and the skilled wage from $43,700 to $43,001, bothabout $700. The difference between skilled and unskilled wages falls slightly from$17,500 to $17,482. The modest adjustments in the unskilled and skilled wage are dueto the moderating effects of mobility across industries.
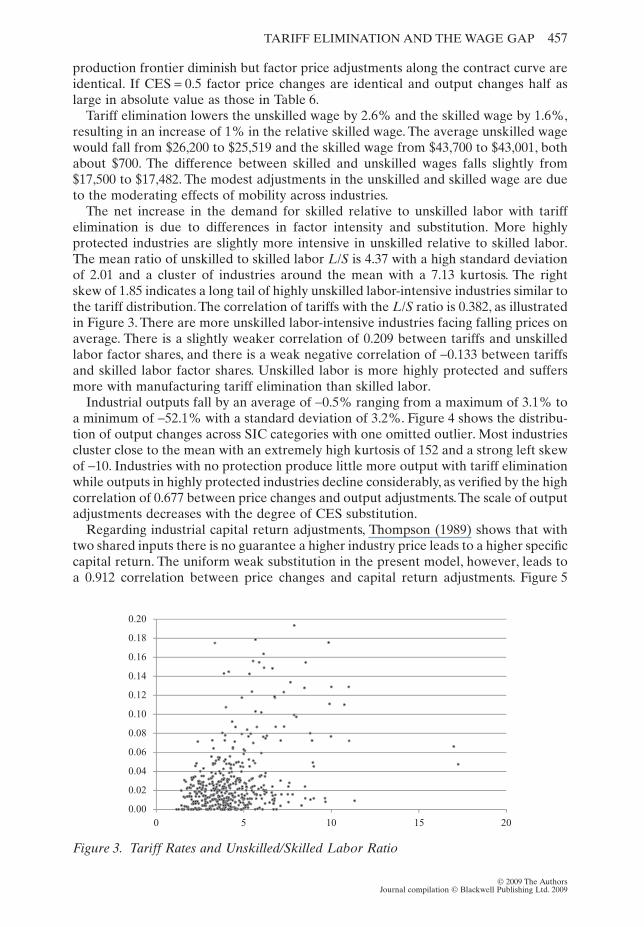
The net increase in the demand for skilled relative to unskilled labor with tariffelimination is due to differences in factor intensity and substitution. More highlyprotected industries are slightly more intensive in unskilled relative to skilled labor.The mean ratio of unskilled to skilled labor L/S is 4.37 with a high standard deviationof 2.01 and a cluster of industries around the mean with a 7.13 kurtosis. The rightskew of 1.85 indicates a long tail of highly unskilled labor-intensive industries similar tothe tariff distribution. The correlation of tariffs with the L/S ratio is 0.382, as illustratedin Figure 3. There are more unskilled labor-intensive industries facing falling prices onaverage. There is a slightly weaker correlation of 0.209 between tariffs and unskilledlabor factor shares, and there is a weak negative correlation of -0.133 between tariffsand skilled labor factor shares. Unskilled labor is more highly protected and suffersmore with manufacturing tariff elimination than skilled labor.
Industrial outputs fall by an average of -0.5% ranging from a maximum of 3.1% toa minimum of -52.1% with a standard deviation of 3.2%. Figure 4 shows the distribu-tion of output changes across SIC categories with one omitted outlier. Most industriescluster close to the mean with an extremely high kurtosis of 152 and a strong left skewof -10. Industries with no protection produce little more output with tariff eliminationwhile outputs in highly protected industries decline considerably, as verified by the highcorrelation of 0.677 between price changes and output adjustments.The scale of outputadjustments decreases with the degree of CES substitution.
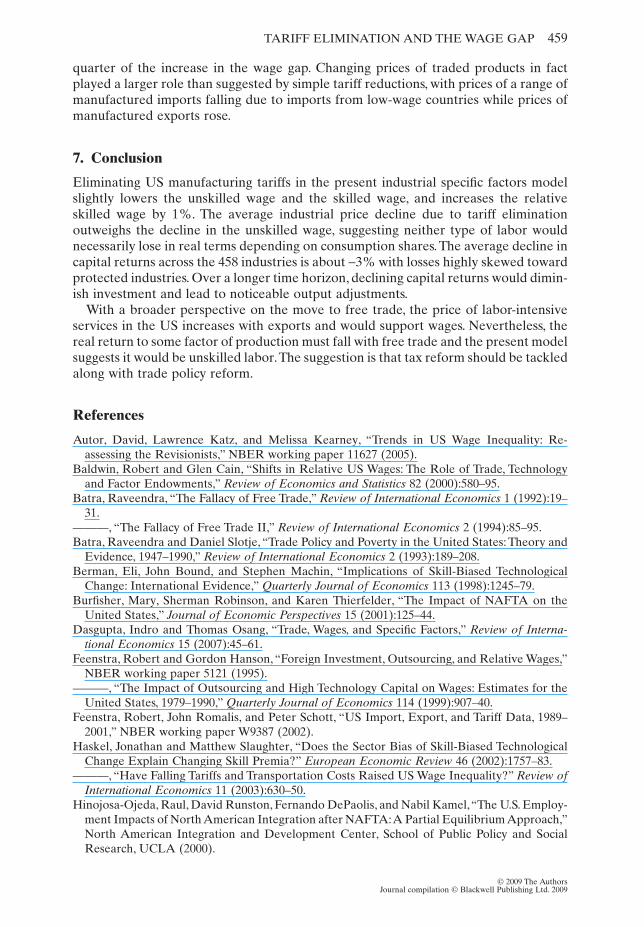
Regarding industrial capital return adjustments, Thompson (1989) shows that withtwo shared inputs there is no guarantee a higher industry price leads to a higher specificcapital return. The uniform weak substitution in the present model, however, leads toa 0.912 correlation between price changes and capital return adjustments. Figure 5
0.00
0.02
0.04
0.06
0.08
0.10
0.12
0.14
0.16
0.18
0.20
0 5 10 15 20
Figure 3. Tariff Rates and Unskilled/Skilled Labor Ratio
TARIFF ELIMINATION AND THE WAGE GAP 457
© 2009 The AuthorsJournal compilation © Blackwell Publishing Ltd. 2009
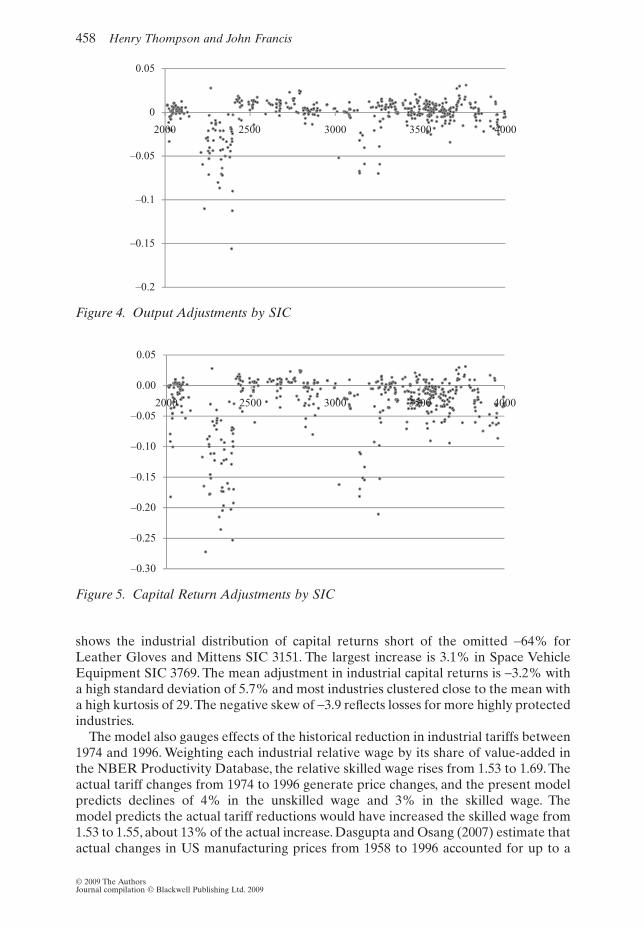
shows the industrial distribution of capital returns short of the omitted -64% forLeather Gloves and Mittens SIC 3151. The largest increase is 3.1% in Space VehicleEquipment SIC 3769. The mean adjustment in industrial capital returns is -3.2% witha high standard deviation of 5.7% and most industries clustered close to the mean witha high kurtosis of 29.The negative skew of -3.9 reflects losses for more highly protectedindustries.
The model also gauges effects of the historical reduction in industrial tariffs between1974 and 1996. Weighting each industrial relative wage by its share of value-added inthe NBER Productivity Database, the relative skilled wage rises from 1.53 to 1.69. Theactual tariff changes from 1974 to 1996 generate price changes, and the present modelpredicts declines of 4% in the unskilled wage and 3% in the skilled wage. Themodel predicts the actual tariff reductions would have increased the skilled wage from1.53 to 1.55, about 13% of the actual increase. Dasgupta and Osang (2007) estimate thatactual changes in US manufacturing prices from 1958 to 1996 accounted for up to a
–0.2
–0.15
–0.1
–0.05
0
0.05
2000 2500 3000 3500 4000
Figure 4. Output Adjustments by SIC
–0.30
–0.25
–0.20
–0.15
–0.10
–0.05
0.00
0.05
2000 2500 3000 3500 4000
Figure 5. Capital Return Adjustments by SIC
458 Henry Thompson and John Francis
© 2009 The AuthorsJournal compilation © Blackwell Publishing Ltd. 2009
quarter of the increase in the wage gap. Changing prices of traded products in factplayed a larger role than suggested by simple tariff reductions, with prices of a range ofmanufactured imports falling due to imports from low-wage countries while prices ofmanufactured exports rose.
7. Conclusion
Eliminating US manufacturing tariffs in the present industrial specific factors modelslightly lowers the unskilled wage and the skilled wage, and increases the relativeskilled wage by 1%. The average industrial price decline due to tariff eliminationoutweighs the decline in the unskilled wage, suggesting neither type of labor wouldnecessarily lose in real terms depending on consumption shares.The average decline incapital returns across the 458 industries is about -3% with losses highly skewed towardprotected industries. Over a longer time horizon, declining capital returns would dimin-ish investment and lead to noticeable output adjustments.
With a broader perspective on the move to free trade, the price of labor-intensiveservices in the US increases with exports and would support wages. Nevertheless, thereal return to some factor of production must fall with free trade and the present modelsuggests it would be unskilled labor.The suggestion is that tax reform should be tackledalong with trade policy reform.
References
Autor, David, Lawrence Katz, and Melissa Kearney, “Trends in US Wage Inequality: Re-assessing the Revisionists,” NBER working paper 11627 (2005).
Baldwin, Robert and Glen Cain, “Shifts in Relative US Wages: The Role of Trade, Technologyand Factor Endowments,” Review of Economics and Statistics 82 (2000):580–95.
Batra, Raveendra, “The Fallacy of Free Trade,” Review of International Economics 1 (1992):19–31.
———, “The Fallacy of Free Trade II,” Review of International Economics 2 (1994):85–95.Batra, Raveendra and Daniel Slotje, “Trade Policy and Poverty in the United States: Theory and
Evidence, 1947–1990,” Review of International Economics 2 (1993):189–208.Berman, Eli, John Bound, and Stephen Machin, “Implications of Skill-Biased Technological
Change: International Evidence,” Quarterly Journal of Economics 113 (1998):1245–79.Burfisher, Mary, Sherman Robinson, and Karen Thierfelder, “The Impact of NAFTA on the
United States,” Journal of Economic Perspectives 15 (2001):125–44.Dasgupta, Indro and Thomas Osang, “Trade, Wages, and Specific Factors,” Review of Interna-
tional Economics 15 (2007):45–61.Feenstra, Robert and Gordon Hanson, “Foreign Investment, Outsourcing, and Relative Wages,”
NBER working paper 5121 (1995).———, “The Impact of Outsourcing and High Technology Capital on Wages: Estimates for the
United States, 1979–1990,” Quarterly Journal of Economics 114 (1999):907–40.Feenstra, Robert, John Romalis, and Peter Schott, “US Import, Export, and Tariff Data, 1989–
2001,” NBER working paper W9387 (2002).Haskel, Jonathan and Matthew Slaughter, “Does the Sector Bias of Skill-Biased Technological
Change Explain Changing Skill Premia?” European Economic Review 46 (2002):1757–83.———, “Have Falling Tariffs and Transportation Costs Raised US Wage Inequality?” Review of
International Economics 11 (2003):630–50.Hinojosa-Ojeda, Raul, David Runston, Fernando DePaolis, and Nabil Kamel,“The U.S. Employ-
ment Impacts of North American Integration after NAFTA:A Partial Equilibrium Approach,”North American Integration and Development Center, School of Public Policy and SocialResearch, UCLA (2000).
TARIFF ELIMINATION AND THE WAGE GAP 459
© 2009 The AuthorsJournal compilation © Blackwell Publishing Ltd. 2009
Jones, Ron, “The Structure of Simple General Equilibrium Models,” Journal of PoliticalEconomy 73 (1965):57–72.
Jones, Ron and José Scheinkman, “The Relevance of the Two-Sector Production Model in TradeTheory,” Journal of Political Economy 85 (1977):909–35.
Lawrence, Robert and Matthew Slaughter, “International Trade and American Wages in the1980’s: Giant Sucking Sound or Small Hiccup?”, Brookings Papers on Economic Activity,Microeconomics 2 (1993):161–210.
Leamer, Edward, “What’s the Use of Factor Contents?” Journal of International Economics 50(2000):17–49.
Marjit, Sugata, “The Fallacy of Free Trade: Comment,” Review of International Economics 2(1994):74–75.
Rassekh, Farhad, “An Evaluation of Batra’s ‘Fallacy of Free Trade’,” Review of InternationalEconomics 6 (1994):76–84.
Sachs, Jeffery and Howard Shatz, “Trade and Jobs in U.S. Manufacturing,” Brookings Papers onEconomic Activity 1 (1994):1–84.
Sato, Ryuzo and Tetsuroni Koizumi, “On the Elasticities of Substitution and Complementarity,”Oxford Economic Papers 25 (1973):44–56.
Slaughter, Matthew,“International Trade and Labour-Market Outcomes: Results, Questions, andPolicy Options,” Economic Journal 108 (1998):1452–62.
Stolper, Wolfgang and Paul Samuelson, “Protection and Real Wages,” Review of EconomicStudies 9 (1941):58–73.
Thompson, Henry, “Do Tariffs Protect Specific Factors?” Canadian Journal of Economics 22(1989):406–12.
———, “An Investigation into the Quantitative Properties of the Specific Factors Model ofInternational Trade,” Japan and the World Economy 6 (1994):378–88.
———, “NAFTA and Industrial Adjustment: A Specific Factors Model of Production inAlabama,” Growth and Change 27 (1996):3–28.
———, “Robustness of the Stolper–Samuelson Price Link,” Handbook of International Trade,Vol. 1, Oxford: Blackwell (2004).
Thompson, Henry and Hugo Toledo, “Bolivia and South American Free Trade,” InternationalTrade Journal 15 (2001):113–26.
Tokarick, Stephen, “Quantifying the Impact of Trade on Wages: The Role of Nontraded Goods,”Review of International Economics 13 (2005):841–60.
Wood, Adrian, North–South Trade, Employment and Inequality: Changing Fortunes in a Skill-Driven World, Oxford: Clarendon Press (1994).
460 Henry Thompson and John Francis
© 2009 The AuthorsJournal compilation © Blackwell Publishing Ltd. 2009
Related Documents