Target-to-background enhancement in multispectral endoscopy with background autofluorescence mitigation for quantitative molecular imaging Chenying Yang Vivian W. Hou Emily J. Girard Leonard Y. Nelson Eric J. Seibel Downloaded From: http://biomedicaloptics.spiedigitallibrary.org/ on 10/23/2014 Terms of Use: http://spiedl.org/terms

Welcome message from author
This document is posted to help you gain knowledge. Please leave a comment to let me know what you think about it! Share it to your friends and learn new things together.
Transcript
Target-to-background enhancement inmultispectral endoscopy withbackground autofluorescencemitigation for quantitative molecularimaging
Chenying YangVivian W. HouEmily J. GirardLeonard Y. NelsonEric J. Seibel
Downloaded From: http://biomedicaloptics.spiedigitallibrary.org/ on 10/23/2014 Terms of Use: http://spiedl.org/terms
Target-to-background enhancement in multispectralendoscopy with background autofluorescencemitigation for quantitative molecular imaging
Chenying Yang,a Vivian W. Hou,b Emily J. Girard,c Leonard Y. Nelson,d and Eric J. Seibeld,*aUniversity of Washington, Department of Bioengineering, Seattle, Washington 98195, United StatesbUniversity of Washington, Department of Biology, Seattle, Washington 98195, United StatescFred Hutchinson Cancer Research Center, Clinical Research Division, Seattle, Washington 98109, United StatesdUniversity of Washington, Department of Mechanical Engineering, Seattle, Washington 98195, United States
Abstract. Fluorescence molecular imaging with exogenous probes improves specificity for the detection ofdiseased tissues by targeting unambiguous molecular signatures. Additionally, increased diagnostic sensitivityis expected with the application of multiple molecular probes. We developed a real-time multispectral fluores-cence-reflectance scanning fiber endoscope (SFE) for wide-field molecular imaging of fluorescent dye-labeledmolecular probes at nanomolar detection levels. Concurrent multichannel imaging with the wide-field SFE alsoallows for real-time mitigation of the background autofluorescence (AF) signal, especially when fluorescein,a U.S. Food and Drug Administration approved dye, is used as the target fluorophore. Quantitative tissueAF was measured for the ex vivo porcine esophagus and murine brain tissues across the visible and near-infrared spectra. AF signals were then transferred to the unit of targeted fluorophore concentration to evaluatethe SFE detection sensitivity for sodium fluorescein and cyanine. Next, we demonstrated a real-time AFmitigation algorithm on a tissue phantom, which featured molecular probe targeted cells of high-grade dysplasiaon a substrate containing AF species. The target-to-background ratio was enhanced by more than one order ofmagnitude when applying the real-time AF mitigation algorithm. Furthermore, a quantitative estimate of thefluorescein photodegradation (photobleaching) rate was evaluated and shown to be insignificant under theillumination conditions of SFE. In summary, the multichannel laser-based flexible SFE has demonstratedthe capability to provide sufficient detection sensitivity, image contrast, and quantitative target intensity informa-tion for detecting small precancerous lesions in vivo. © 2014 Society of Photo-Optical Instrumentation Engineers (SPIE) [DOI: 10
.1117/1.JBO.19.7.076014]
Keywords: fluorescence; molecular diagnostic imaging; wide-field fluorescence imaging; flexible endoscopy; scanning fiber endo-scope; multispectral imaging; autofluorescence; target-to-background ratio; fluorescein; cancer detection; real-time imaging; contrastenhancement.
Paper 140141R received Mar. 4, 2014; revised manuscript received Jun. 18, 2014; accepted for publication Jun. 25, 2014; publishedonline Jul. 15, 2014.
1 IntroductionOptical molecular endoscopic imaging with the administrationof exogenous fluorophore probes has become an area of greatinterest in many clinical diagnostic and surgical applications.1–6
Numerous endoscopic applications for tracking exogenous tar-geted fluorescence are under investigation, such as detection anddiagnosis of early cancerous lesions in Barrett’s esophagus,7
navigation and demarcation of tumor margins during brain sur-gery,8,9 and detection of early neoplasia in oral tissue,10 lung,11
bladder,12 and smaller gastrointestinal (GI) ducts.13 Moreover,translational studies for first-in-human application of fluores-cence molecular targets have been demonstrated in colonicdysplasia detection as well as surgical guidance for ovariancancer.14,15 Compared to other optical contrast imaging tech-niques such as narrow band imaging and autofluorescence (AF)imaging, fluorescence molecular imaging with exogenousprobes improves specificity for the detection of diseased tissuesby targeting specific molecular entities such as overexpressedcell surface proteins at the cellular level.1,2 Meanwhile, dueto the heterogeneity of the disease molecular profile across
individual patients, diagnostic sensitivity is expected to increasewith the application of multiple molecular specific targetingusing a panel of fluorescence probes.16,17
Many cancers are treatable by ablation or resection ifdetected at a very early stage. The problem in conventionalwhite-light imaging is the lack of disease-specific opticalsignatures to localize and visualize the precancerous lesion.18
Detection is further hindered by the diffuse and patchy natureof the lesions, which are often composed of distributed clustersof cells.16,19 This leads to one of the major challenges for theclinical realization of fluorescence molecular imaging, whichis the requirement for high detection sensitivity in vivo to locatesuspect tissue areas.20,21 The sensitivity required for identifyingsmall and sparse early cancerous lesions in routine endoscopicsurveillance and the delineation of residue malignant cancercells during surgical operations are critical in reducing tumoroccurrence and increasing the survival rate. Thus, increasingcontrast in real-time intraoperative imaging has become a criti-cal factor in the design and quality assurance of a fluorescencemolecular imaging approach for translation to clinical diagnosisand therapy.
*Address all correspondence to: Eric J. Seibel, [email protected] 0091-3286/2014/$25.00 © 2014 SPIE
Journal of Biomedical Optics 076014-1 July 2014 • Vol. 19(7)
Journal of Biomedical Optics 19(7), 076014 (July 2014)
Downloaded From: http://biomedicaloptics.spiedigitallibrary.org/ on 10/23/2014 Terms of Use: http://spiedl.org/terms
Detection sensitivity of an exogenous fluorophore probe islimited by three major factors: first, the characteristics of themolecular probe, such as probe-tissue binding affinity, nonspe-cific binding and diffusion coefficient, as well as characteristicsof the fluorophore, such as quantum efficiency, absorption coef-ficient, fluorescence wavelength, and photodegradation (alsoknown as photobleaching) rates.22–26 Second, the device perfor-mance and its detection sensitivity must be designed for eachmolecular target.21 Last, the tissue AF background that degradesimage contrast must be addressed.20
For sensitive and specific early cancer targeting in clinicalapplications, many fluorescent molecular probes are currentlyunder development.3,27,28 These molecular probes target bio-markers indicative of early disease stages using antibodies orpeptides, and are conjugated with a fluorescent indicator dyeor nanoparticle. One of the best fluorophores for this purposeis fluorescein. In many respects this dye is preferable to thenear-infrared (NIR) dyes under development due to its statusas a U.S. Food and Drug Administration (FDA)-approveddye with high molar absorptivity, fluorescence quantum yield>90%, good water solubility, and an overall lower pricewhen compared to NIR dyes.25,29 Meanwhile, a significantlyincreased photostability and pH-independent quantum yieldof fluorescein derivatives have been reported in recent publica-tions.30,31 Methylene blue and indocyanine green (ICG) arered-NIR dyes that are FDA approved for clinical use andtake advantage of deeper light penetration at a red-NIR illumi-nation of 650 and 760 nm, respectively.32 However, fluoresceindye is not widely used even for surface imaging applications,largely because it suffers from a low target-to-backgroundratio (T/B), which is caused by a high degree of tissue back-ground AF that overlaps the dye emission in the green spectralrange.
It has been reported that the tissue AF often masks exog-enous molecular probe fluorescence signal and, thus, limits theactual detection T/B in vivo.15,33–37 Other than fluorescein,a targeting probe sensitive to cellular glucose metabolism,2-(N-(7-nitrobenz-2-oxa-1,3-diazol-4-yl)amino)-2-deoxyglucose(2-NBDG), a fluorescent analog to 2-deoxy-2 ((18)F) fluoro-D-glucose, which is routinely used in positron emission tomogra-phy for molecular imaging, has been shown as a promisingcandidate in optical molecular imaging translatable from benchto bed.10,38 However, 2-NBDG also suffers from a significantmasking effect from the background AF in the green spectralregion.39,40
Recently, efforts have been directed at the advancement ofmolecular imaging devices by improving the fluorescencedetection sensitivity of the imaging device through evaluationsbased on in vitro imaging of low concentrations of the targetingprobe.41,42 However, in in vivo clinical applications, the tissuebackground AF signal can exceed the device’s detection sensi-tivity measured from the in vitro method, which renders mean-ingless the engineering efforts to increase a device’s detectionsensitivity limit. Therefore, any device will be limited to the AFbackground unless an approach to mitigate the AF can be imple-mented on the device. Meanwhile, understanding the quantita-tive spectroscopic characteristics of the targeted tissue’s AFbackground is essential to the success of a viable fluorescencemolecular imaging device. In the current study, we developan approach to mitigate the AF background problem and applythis improvement to a high-sensitivity, ultrathin, and flexiblemultispectral fluorescence endoscopic device.
For two specific fluorescence-guided clinical applications—endoscopic early cancer detection in Barrett’s esophagus, andsurgical brain tumor demarcation and resection—ex vivo por-cine esophagus and wild-type murine brain tissue were usedto study the levels of background tissue AF. The porcineesophagus was chosen because its morphology, histology, andbiochemistry are similar to that of humans and, therefore,it represents a good model for the human esophagus tissue.43
Likewise, the wild-type mouse (nu/nu) was used as the healthycontrol of a patient-derived tumor xenograft mouse model ofbrain tumors. AF signals from the two types of tissue were quan-titatively compared ex vivo with a gold standard quantitativeimaging device and transferred into a physical standard basedon the exogenous molecular probe fluorophore concentration,defined as the autofluorescence equivalent concentration (AEC).The detection sensitivity of the multispectral fluorescenceendoscope was then evaluated in visible and NIR spectrausing both AEC and low-concentration low-volume fluorophoredilutions. Furthermore, based on quantitative evaluation oftarget tissue AF, a real-time AF mitigation algorithm was imple-mented which significantly increased the T/B for a fluoresceinconjugated molecular probe and 2-NGDB in a wide-fieldfluorescence imaging endoscope by 44- to 56-fold. Together,nanomolar sensitivity combined with a T/B ratio >80 wasachieved with the newly developed multispectral ultrathin andflexible scanning fiber endoscope (SFE), and was demonstratedin an in vitro study using molecular targets of high-grade dys-plasia and esophageal adenocarcinoma on a tissue phantom.
2 Materials and Methods
2.1 Multispectral SFE System
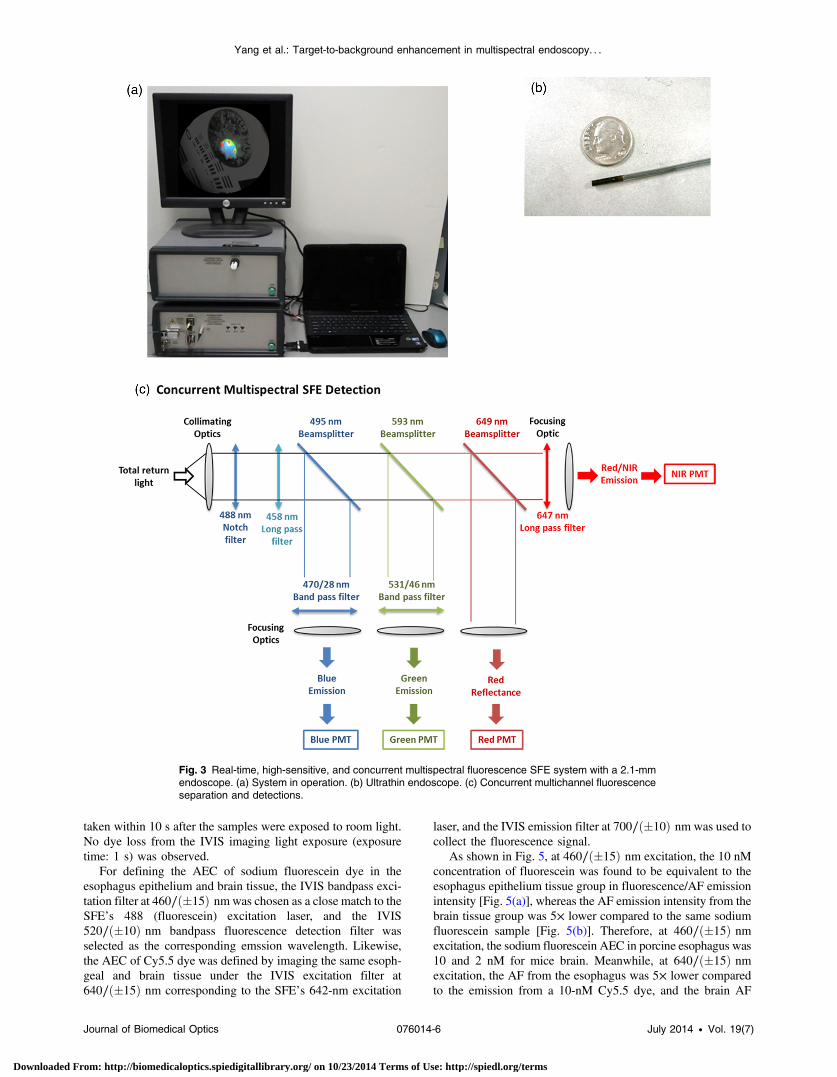
The new multispectral SFE system was specifically designedand engineered for wide-field, high-resolution, and real-timefluorescence molecular imaging and navigation.44 Comparedto a conventional endoscopic passive imaging system usingdiffuse white-light illumination, the multispectral SFE incorpo-rates three low-power diode lasers: 448, 488, and 642 nm(FiberTec™, Blue Sky Research, Milpitas, California) thatcan be jointly or selectively launched at the base station andsent to the distal end of SFE via a single-mode optical fiberusing a custom optical fiber combiner (Wave DivisionMultiplexer, Oz Optics, Ottawa, Ontario, Canada). In the currentstudy, a 448-nm wavelength was used for the excitation ofbackground AF, a 488-nm wavelength was used for the excita-tion of the fluorescein dye and 2-NBDG molecule, and, finally,a 642-nm wavelength was used for the excitation of the Cy5.5dye. The resulting multilaser beam is scanned in a spiral patternby a piezoelectric transducer and is focused onto the targetsurface by a lens assembly. Fluorescence, or diffuse reflectedlight, is then collected by a concentric ring of high numericalaperture optical fibers, which surround the single-modebeam delivery fiber and lens assembly. The collected light isseparated into four wavelength bands (blue, green, red fluores-cence and red reflectance, respectively) by three dichroic beamsplitters (FF495-Di03-35x35 495 nm BrightLine® DichroicBeamsplitter, FF593-Di03-35x35 593 nm BrightLine®Dichroic Beamsplitter, and FF649-Di01-35x35 649 nmBrightLine® Dichroic Beamsplitter, Semrock Inc., Rochester,New York). Unwanted laser light is rejected by passing eachwavelength band through a high optical density bandpass
Journal of Biomedical Optics 076014-2 July 2014 • Vol. 19(7)
Yang et al.: Target-to-background enhancement in multispectral endoscopy. . .
Downloaded From: http://biomedicaloptics.spiedigitallibrary.org/ on 10/23/2014 Terms of Use: http://spiedl.org/terms
(FF01-470/28-25470/28 BrightLine® Bandpass Filter, or FF01-531/46-25531/46 BrightLine® Bandpass Filter, SemrockInc.) or long-pass filter (BLP01-647R-25647 nm EdgeBasic™best-value long-pass edge filter, Semrock Inc.) positioned infront of a high-gain photomultiplier tube (PMT, HamamatsuR9880U series, Hamamatsu Photonics, Hamamatsu City,Japan). Custom-designed software maps the synchronizeddetection signals as points in the spiral scan pattern of the sin-gle-mode fiber, which are then converted to the two-dimensionalpixel position on the RGB digital display—red, green, and bluefor fluorescence images and gray scale for reflectance. Theresulting images are in spatial registration since all of the exci-tation lasers simultaneously sample the same target location.
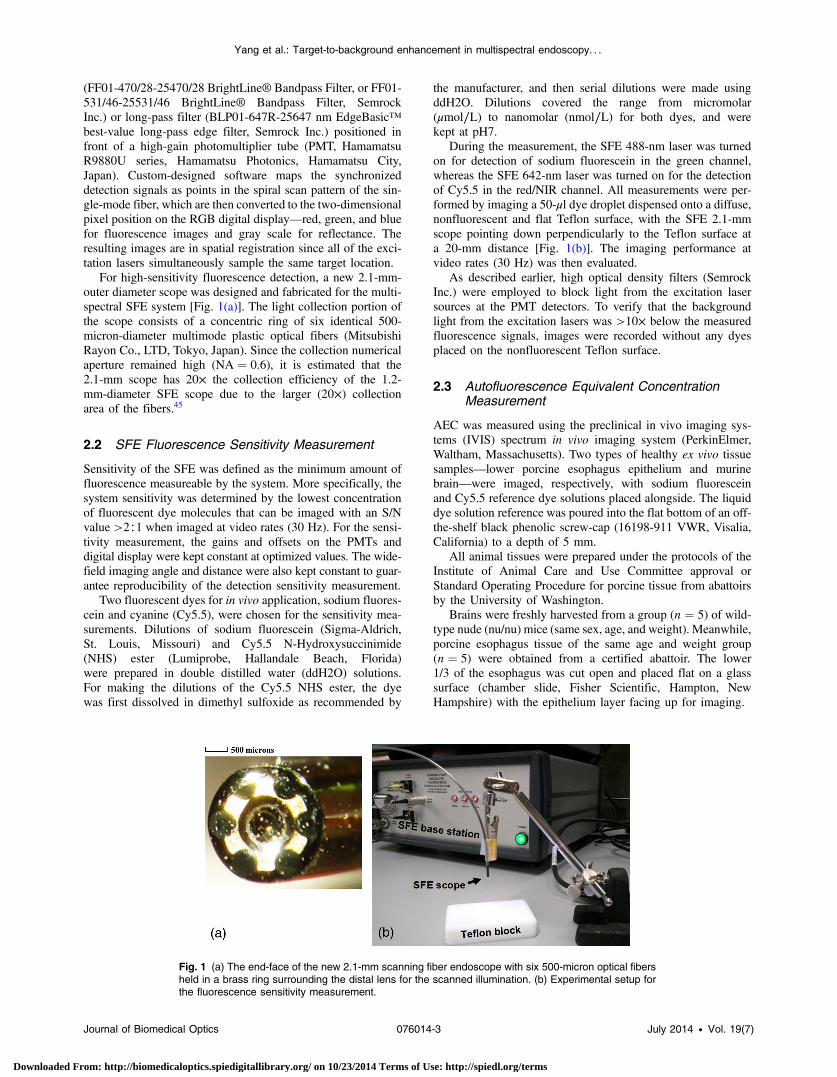
For high-sensitivity fluorescence detection, a new 2.1-mm-outer diameter scope was designed and fabricated for the multi-spectral SFE system [Fig. 1(a)]. The light collection portion ofthe scope consists of a concentric ring of six identical 500-micron-diameter multimode plastic optical fibers (MitsubishiRayon Co., LTD, Tokyo, Japan). Since the collection numericalaperture remained high (NA ¼ 0.6), it is estimated that the2.1-mm scope has 20× the collection efficiency of the 1.2-mm-diameter SFE scope due to the larger (20×) collectionarea of the fibers.45
2.2 SFE Fluorescence Sensitivity Measurement
Sensitivity of the SFE was defined as the minimum amount offluorescence measureable by the system. More specifically, thesystem sensitivity was determined by the lowest concentrationof fluorescent dye molecules that can be imaged with an S/Nvalue >2∶1 when imaged at video rates (30 Hz). For the sensi-tivity measurement, the gains and offsets on the PMTs anddigital display were kept constant at optimized values. The wide-field imaging angle and distance were also kept constant to guar-antee reproducibility of the detection sensitivity measurement.
Two fluorescent dyes for in vivo application, sodium fluores-cein and cyanine (Cy5.5), were chosen for the sensitivity mea-surements. Dilutions of sodium fluorescein (Sigma-Aldrich,St. Louis, Missouri) and Cy5.5 N-Hydroxysuccinimide(NHS) ester (Lumiprobe, Hallandale Beach, Florida)were prepared in double distilled water (ddH2O) solutions.For making the dilutions of the Cy5.5 NHS ester, the dyewas first dissolved in dimethyl sulfoxide as recommended by
the manufacturer, and then serial dilutions were made usingddH2O. Dilutions covered the range from micromolar(μmol∕L) to nanomolar (nmol∕L) for both dyes, and werekept at pH7.
During the measurement, the SFE 488-nm laser was turnedon for detection of sodium fluorescein in the green channel,whereas the SFE 642-nm laser was turned on for the detectionof Cy5.5 in the red/NIR channel. All measurements were per-formed by imaging a 50-μl dye droplet dispensed onto a diffuse,nonfluorescent and flat Teflon surface, with the SFE 2.1-mmscope pointing down perpendicularly to the Teflon surface ata 20-mm distance [Fig. 1(b)]. The imaging performance atvideo rates (30 Hz) was then evaluated.
As described earlier, high optical density filters (SemrockInc.) were employed to block light from the excitation lasersources at the PMT detectors. To verify that the backgroundlight from the excitation lasers was >10× below the measuredfluorescence signals, images were recorded without any dyesplaced on the nonfluorescent Teflon surface.
2.3 Autofluorescence Equivalent ConcentrationMeasurement
AEC was measured using the preclinical in vivo imaging sys-tems (IVIS) spectrum in vivo imaging system (PerkinElmer,Waltham, Massachusetts). Two types of healthy ex vivo tissuesamples—lower porcine esophagus epithelium and murinebrain—were imaged, respectively, with sodium fluoresceinand Cy5.5 reference dye solutions placed alongside. The liquiddye solution reference was poured into the flat bottom of an off-the-shelf black phenolic screw-cap (16198-911 VWR, Visalia,California) to a depth of 5 mm.
All animal tissues were prepared under the protocols of theInstitute of Animal Care and Use Committee approval orStandard Operating Procedure for porcine tissue from abattoirsby the University of Washington.
Brains were freshly harvested from a group (n ¼ 5) of wild-type nude (nu/nu) mice (same sex, age, and weight). Meanwhile,porcine esophagus tissue of the same age and weight group(n ¼ 5) were obtained from a certified abattoir. The lower1/3 of the esophagus was cut open and placed flat on a glasssurface (chamber slide, Fisher Scientific, Hampton, NewHampshire) with the epithelium layer facing up for imaging.
Fig. 1 (a) The end-face of the new 2.1-mm scanning fiber endoscope with six 500-micron optical fibersheld in a brass ring surrounding the distal lens for the scanned illumination. (b) Experimental setup forthe fluorescence sensitivity measurement.
Journal of Biomedical Optics 076014-3 July 2014 • Vol. 19(7)
Yang et al.: Target-to-background enhancement in multispectral endoscopy. . .
Downloaded From: http://biomedicaloptics.spiedigitallibrary.org/ on 10/23/2014 Terms of Use: http://spiedl.org/terms
To get a full assessment of the AF excitation-emission profileof the tissues, a wide range of excitation (430 to 745 nm) andemission (500 to 840 nm) filter combinations were employedwith the IVIS spectrum (Perkin-Elmer, Norwalk, Connecticut)fluorescence imaging system. During the imaging process, sys-tem settings, such as exposure time, f number, and field of view,were kept constant. The IVIS quantitative unit of the fluorescenceemission intensity is defined as the number of photons per secondper centimeter squared per steradian (p∕s∕cm2∕sr). Quantitativefluorescence emission intensities were analyzed off-line onthe recorded images and averaged across the same tissuetype group.
2.4 Orthotopic Mouse Brain Tumor Models
Orthotopic xenograft models were created by implanting1 × 105 tumor cells in suspension through a 1-mm burr holein the right parietal bone above the cerebellum ∼2 mm posteriorto the bregma and 3 mm beneath the dura. This study usedpediatric patient derived medulloblastoma model MED-211FH.Tumor cells came from donor mice bearing symptomatic intra-cranial tumors and were transplanted directly into male andfemale the NOD scid gamma (NSG) mice. Tumors were allowedto grow until mice presented with clinical symptoms of tumorburden, such as head tilt and cranial bulge (35 days for theMED-211FH model). At the first onset of clinical tumor burden,mice were given 100-μl intravenous tail-vein injections of20 μM chlorotoxin conjugated to Cy5.5 (Tumor Paint™,Blaze Biosciences, Seattle, Washington) and imaged in theNIR spectrum as previously described.8 It was reported in pre-vious publications8,46 that specific binding of Tumor Paint™ tocancer cells is facilitated by matrix metalloproteinase-2. Brainswere harvested after euthanasia via CO2 inhalations, imaged,and then fixed in 10% neutral buffered formalin. All micewere maintained in accordance with the National Institute ofHealth (NIH) Guide for the Care and Use of ExperimentalAnimals with approval from the Fred HutchinsonCancer Research Center Institutional Animal Care and UseCommittee (IR#1457).
2.5 Multispectral Molecular Imaging ofEx Vivo Mice Brain
SFE fluorescence molecular imaging was performed on the exvivo mice brain within 1 h after they were harvested. Imagesof the same brain using the IVIS spectrum system immediatelyafter harvesting were used as a reference. Images of the bulk flu-orescently labeled tumor margin from both imaging systems werecompared. To guarantee a fair comparison of molecular probe dis-tribution, experimental settings, such as the excitation and emis-sion wavelength on both imaging systems, as well as imagingangle and exposure time, were kept as closely matched as pos-sible. Three types of control brains—wild-type mice alone, wild-type mice with Tumor Paint™ injection, and MED-211FH micewith no injection—were also imaged. After the imagings wereperformed, brains were fixed in 10% neutral buffered formalin;then tissue blocks were embedded in paraffin, cut into 4-μmsections, and stained with hematoxylin and eosin (H&E) usingstandard methods. Slides were scanned on an AperioScanScopeAT (Leica Biosystems, Buffalo Grove, Illinois).
2.6 Barrett’s Esophagus Tissue Phantom Model
Details of the biological phantom design and development canbe found in Ref. 47. Briefly, bovine collagen (Sigma Aldrich)was digested using collagenase (Life Technologies, Carlsbad,California) and reconstituted into a solid gel to serve as theAF background. Rat tail collagen gels (Life Technologies)were seeded with CP-D (American Type Culture Collection,Manassas, Virginia), a high-grade dysplasia (HGD) Barrett’sesophagus (BE) cell line. Cultures were fixed in methanol.Overexpression of epidermal growth factor receptor (EGFR),receptor tyrosine-protein kinase erbB-2 (ERBB2), and METor MNNG HOS transforming gene (C-MET) were identifiedthrough indirect immunofluorescence (IF) staining. IF stainingwas performed using goat Alexa Fluor 488 (Life Technologies)conjugated antibodies to target anti-ERBB2, anti-EGFR, andanti-C-MET. The seeded gels were laid upon the solid collagenbackground for imaging.
2.7 Multispectral Molecular Endoscopic Imagingwith AF Mitigation
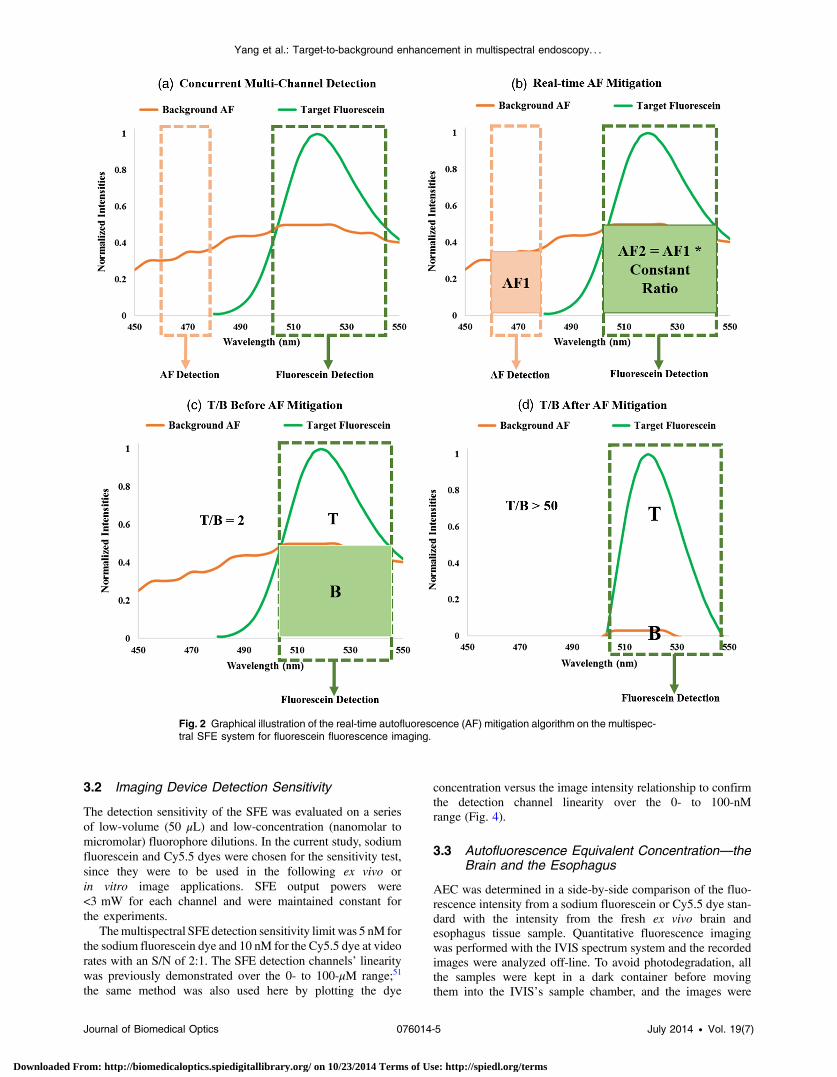
Multispectral SFE imaging of the BE tissue phantom was per-formed with an AF mitigation algorithm running in real time toachieve a high T/B as well as to eliminate bleed-through specu-lar reflections. A graphical illustration of the algorithm is shownin Fig. 2. Since higher laser powers were desired for the in vitrotesting, the multispectral fluorescence was excited using aCoherent OBIS Galaxy system with fiber pigtail (FP) lasers48
at 445, 488, and 642 nm, which proved to have plug-and-play simplicity across the spectrum with the single-mode opticalfiber coupling to the SFE.49 The implementation employs simul-taneous excitation by two closely spaced laser wavelengths:488 nm as the targeting beam and 445 nm as the AF referencebeam. Fluorescence in the blue channel is dedicated to the AFemission, whereas the green channel contains a mixture of fluo-rescein and AF background emission. Based on the AF signalfrom the concurrent blue channel and a precalibrated ratio, theAF component in the green channel background AF is sub-tracted in real time within the SFE operating system software.As a result, an increase in fluorescein T/B is achieved.
3 Results
3.1 Multispectral Scanning Fiber EndoscopeSystem
The new multispectral SFE [shown in Figs. 3(a), 3(b), and 3(c)]was custom-fabricated for the purpose of fluorescence molecu-lar endoscopy. Under standard operating conditions, the videoimaging system has a 30-Hz refresh rate, with an 80-deg field ofview, 50-microns image resolution, and a depth of focus from2 to 50 mm. Three fluorescence channels and one reflectancechannel are simultaneously processed to create spatially coregis-tered blue, green, and red fluorescence images and a gray-scalereflectance background image. All of the images are inherentlycoincident by virtue of the simultaneous laser scanning and lightcollection design of SFE. Concurrently, wide-filed and high-resolution imaging was demonstrated on all channels for themultispectral SFE, with an intraoperative navigation featurederived from the gray-scale reflectance background. The systemalso operates with quantitative fluorescence imaging to guidebiopsies based on a previously published distance compensationalgorithm.50
Journal of Biomedical Optics 076014-4 July 2014 • Vol. 19(7)
Yang et al.: Target-to-background enhancement in multispectral endoscopy. . .
Downloaded From: http://biomedicaloptics.spiedigitallibrary.org/ on 10/23/2014 Terms of Use: http://spiedl.org/terms
3.2 Imaging Device Detection Sensitivity
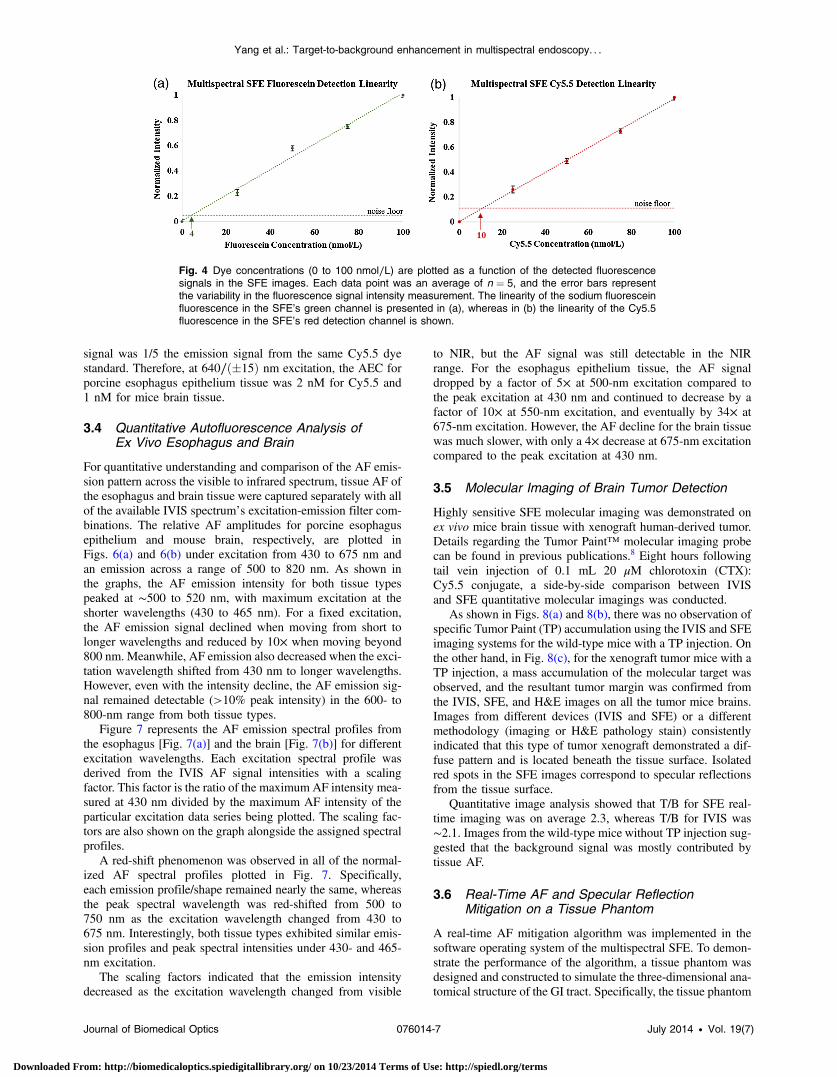
The detection sensitivity of the SFE was evaluated on a seriesof low-volume (50 μL) and low-concentration (nanomolar tomicromolar) fluorophore dilutions. In the current study, sodiumfluorescein and Cy5.5 dyes were chosen for the sensitivity test,since they were to be used in the following ex vivo orin vitro image applications. SFE output powers were<3 mW for each channel and were maintained constant forthe experiments.
Themultispectral SFE detection sensitivity limit was 5 nM forthe sodium fluorescein dye and 10 nM for the Cy5.5 dye at videorates with an S/N of 2:1. The SFE detection channels’ linearitywas previously demonstrated over the 0- to 100-μM range;51
the same method was also used here by plotting the dye
concentration versus the image intensity relationship to confirmthe detection channel linearity over the 0- to 100-nMrange (Fig. 4).
3.3 Autofluorescence Equivalent Concentration—theBrain and the Esophagus
AEC was determined in a side-by-side comparison of the fluo-rescence intensity from a sodium fluorescein or Cy5.5 dye stan-dard with the intensity from the fresh ex vivo brain andesophagus tissue sample. Quantitative fluorescence imagingwas performed with the IVIS spectrum system and the recordedimages were analyzed off-line. To avoid photodegradation, allthe samples were kept in a dark container before movingthem into the IVIS’s sample chamber, and the images were
Fig. 2 Graphical illustration of the real-time autofluorescence (AF) mitigation algorithm on the multispec-tral SFE system for fluorescein fluorescence imaging.
Journal of Biomedical Optics 076014-5 July 2014 • Vol. 19(7)
Yang et al.: Target-to-background enhancement in multispectral endoscopy. . .
Downloaded From: http://biomedicaloptics.spiedigitallibrary.org/ on 10/23/2014 Terms of Use: http://spiedl.org/terms
taken within 10 s after the samples were exposed to room light.No dye loss from the IVIS imaging light exposure (exposuretime: 1 s) was observed.
For defining the AEC of sodium fluorescein dye in theesophagus epithelium and brain tissue, the IVIS bandpass exci-tation filter at 460∕ð�15Þ nmwas chosen as a close match to theSFE’s 488 (fluorescein) excitation laser, and the IVIS520∕ð�10Þ nm bandpass fluorescence detection filter wasselected as the corresponding emssion wavelength. Likewise,the AEC of Cy5.5 dye was defined by imaging the same esoph-geal and brain tissue under the IVIS excitation filter at640∕ð�15Þ nm corresponding to the SFE’s 642-nm excitation
laser, and the IVIS emission filter at 700∕ð�10Þ nm was used tocollect the fluorescence signal.
As shown in Fig. 5, at 460∕ð�15Þ nm excitation, the 10 nMconcentration of fluorescein was found to be equivalent to theesophagus epithelium tissue group in fluorescence/AF emissionintensity [Fig. 5(a)], whereas the AF emission intensity from thebrain tissue group was 5× lower compared to the same sodiumfluorescein sample [Fig. 5(b)]. Therefore, at 460∕ð�15Þ nmexcitation, the sodium fluorescein AEC in porcine esophagus was10 and 2 nM for mice brain. Meanwhile, at 640∕ð�15Þ nmexcitation, the AF from the esophagus was 5× lower comparedto the emission from a 10-nM Cy5.5 dye, and the brain AF
Fig. 3 Real-time, high-sensitive, and concurrent multispectral fluorescence SFE system with a 2.1-mmendoscope. (a) System in operation. (b) Ultrathin endoscope. (c) Concurrent multichannel fluorescenceseparation and detections.
Journal of Biomedical Optics 076014-6 July 2014 • Vol. 19(7)
Yang et al.: Target-to-background enhancement in multispectral endoscopy. . .
Downloaded From: http://biomedicaloptics.spiedigitallibrary.org/ on 10/23/2014 Terms of Use: http://spiedl.org/terms
signal was 1/5 the emission signal from the same Cy5.5 dyestandard. Therefore, at 640∕ð�15Þ nm excitation, the AEC forporcine esophagus epithelium tissue was 2 nM for Cy5.5 and1 nM for mice brain tissue.
3.4 Quantitative Autofluorescence Analysis ofEx Vivo Esophagus and Brain
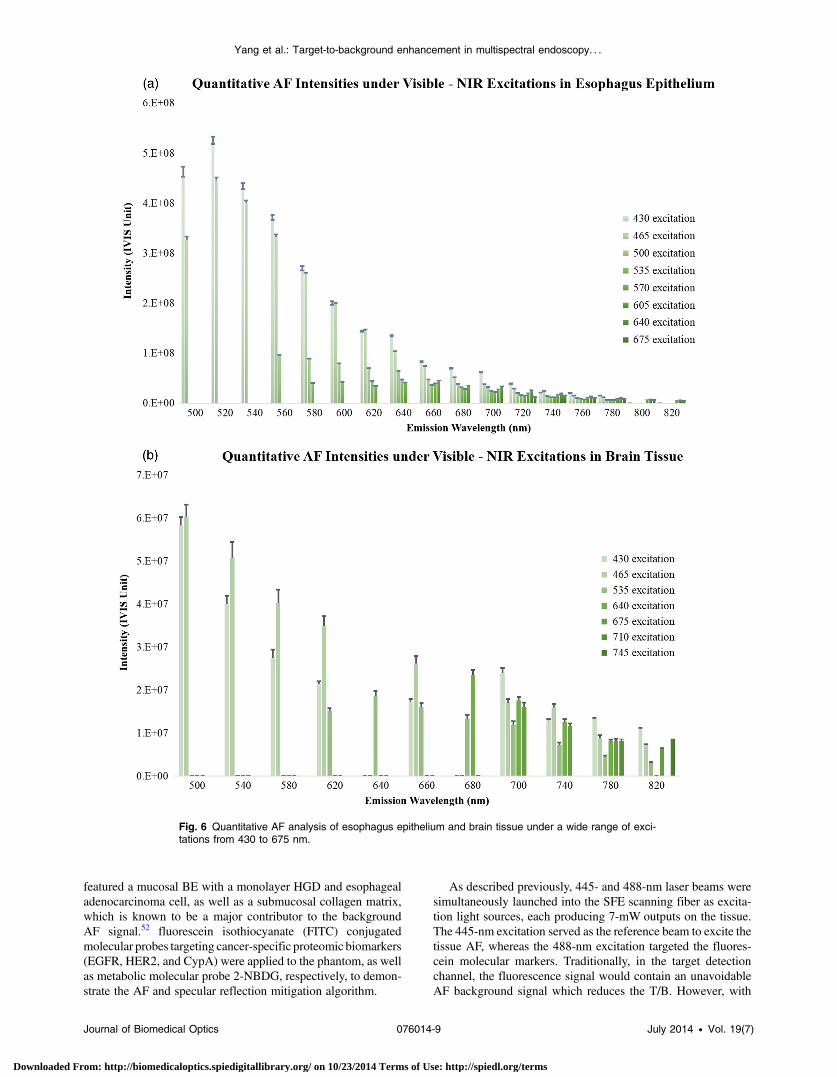
For quantitative understanding and comparison of the AF emis-sion pattern across the visible to infrared spectrum, tissue AF ofthe esophagus and brain tissue were captured separately with allof the available IVIS spectrum’s excitation-emission filter com-binations. The relative AF amplitudes for porcine esophagusepithelium and mouse brain, respectively, are plotted inFigs. 6(a) and 6(b) under excitation from 430 to 675 nm andan emission across a range of 500 to 820 nm. As shown inthe graphs, the AF emission intensity for both tissue typespeaked at ∼500 to 520 nm, with maximum excitation at theshorter wavelengths (430 to 465 nm). For a fixed excitation,the AF emission signal declined when moving from short tolonger wavelengths and reduced by 10× when moving beyond800 nm. Meanwhile, AF emission also decreased when the exci-tation wavelength shifted from 430 nm to longer wavelengths.However, even with the intensity decline, the AF emission sig-nal remained detectable (>10% peak intensity) in the 600- to800-nm range from both tissue types.
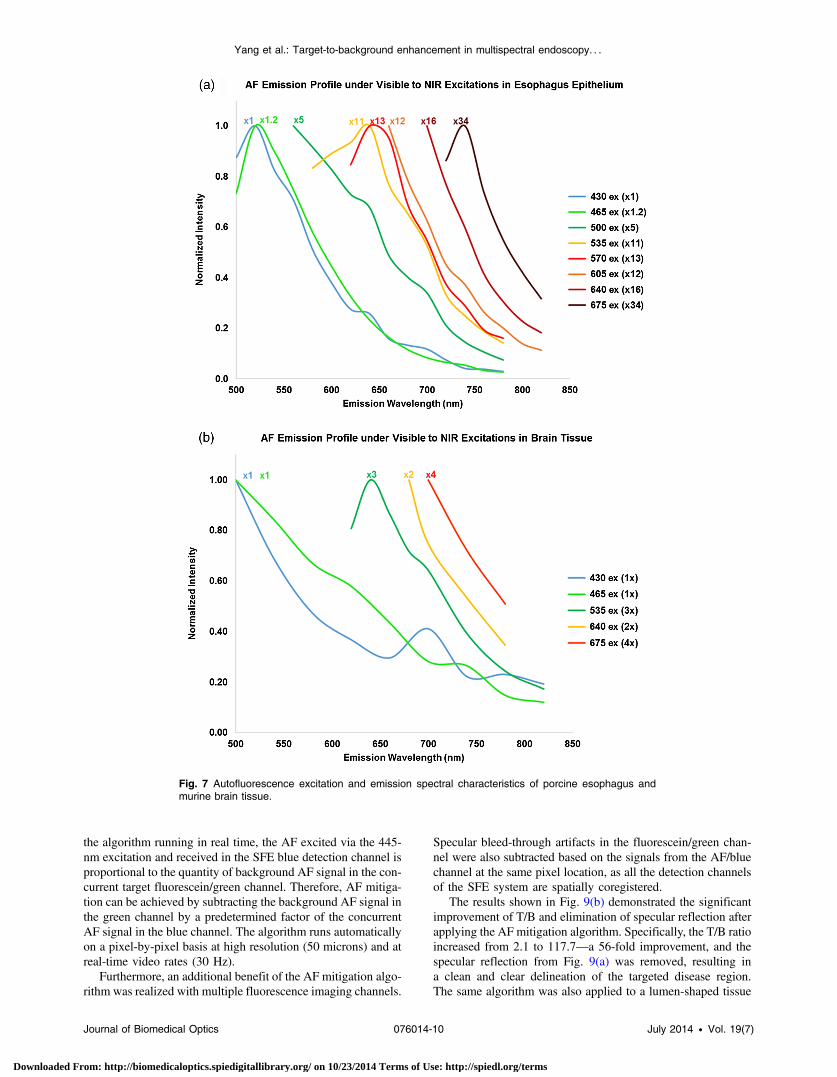
Figure 7 represents the AF emission spectral profiles fromthe esophagus [Fig. 7(a)] and the brain [Fig. 7(b)] for differentexcitation wavelengths. Each excitation spectral profile wasderived from the IVIS AF signal intensities with a scalingfactor. This factor is the ratio of the maximum AF intensity mea-sured at 430 nm divided by the maximum AF intensity of theparticular excitation data series being plotted. The scaling fac-tors are also shown on the graph alongside the assigned spectralprofiles.
A red-shift phenomenon was observed in all of the normal-ized AF spectral profiles plotted in Fig. 7. Specifically,each emission profile/shape remained nearly the same, whereasthe peak spectral wavelength was red-shifted from 500 to750 nm as the excitation wavelength changed from 430 to675 nm. Interestingly, both tissue types exhibited similar emis-sion profiles and peak spectral intensities under 430- and 465-nm excitation.
The scaling factors indicated that the emission intensitydecreased as the excitation wavelength changed from visible
to NIR, but the AF signal was still detectable in the NIRrange. For the esophagus epithelium tissue, the AF signaldropped by a factor of 5× at 500-nm excitation compared tothe peak excitation at 430 nm and continued to decrease by afactor of 10× at 550-nm excitation, and eventually by 34× at675-nm excitation. However, the AF decline for the brain tissuewas much slower, with only a 4× decrease at 675-nm excitationcompared to the peak excitation at 430 nm.
3.5 Molecular Imaging of Brain Tumor Detection
Highly sensitive SFE molecular imaging was demonstrated onex vivo mice brain tissue with xenograft human-derived tumor.Details regarding the Tumor Paint™ molecular imaging probecan be found in previous publications.8 Eight hours followingtail vein injection of 0.1 mL 20 μM chlorotoxin (CTX):Cy5.5 conjugate, a side-by-side comparison between IVISand SFE quantitative molecular imagings was conducted.
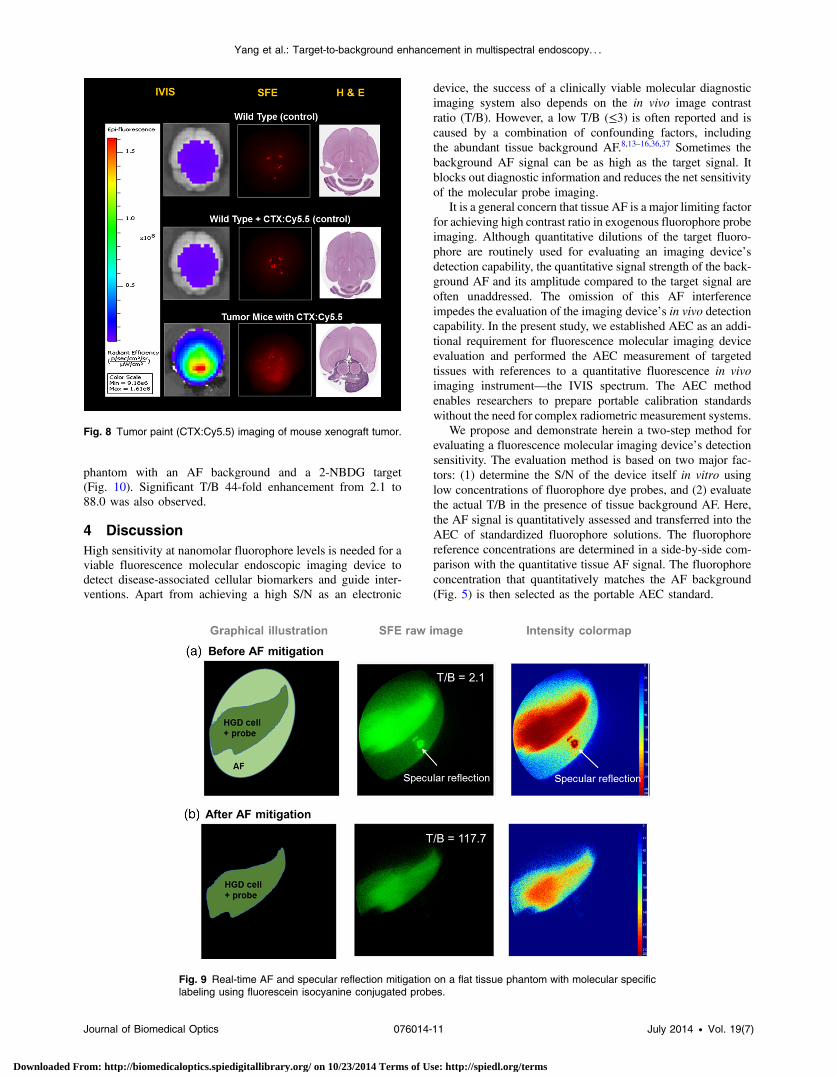
As shown in Figs. 8(a) and 8(b), there was no observation ofspecific Tumor Paint (TP) accumulation using the IVIS and SFEimaging systems for the wild-type mice with a TP injection. Onthe other hand, in Fig. 8(c), for the xenograft tumor mice with aTP injection, a mass accumulation of the molecular target wasobserved, and the resultant tumor margin was confirmed fromthe IVIS, SFE, and H&E images on all the tumor mice brains.Images from different devices (IVIS and SFE) or a differentmethodology (imaging or H&E pathology stain) consistentlyindicated that this type of tumor xenograft demonstrated a dif-fuse pattern and is located beneath the tissue surface. Isolatedred spots in the SFE images correspond to specular reflectionsfrom the tissue surface.
Quantitative image analysis showed that T/B for SFE real-time imaging was on average 2.3, whereas T/B for IVIS was∼2.1. Images from the wild-type mice without TP injection sug-gested that the background signal was mostly contributed bytissue AF.
3.6 Real-Time AF and Specular ReflectionMitigation on a Tissue Phantom
A real-time AF mitigation algorithm was implemented in thesoftware operating system of the multispectral SFE. To demon-strate the performance of the algorithm, a tissue phantom wasdesigned and constructed to simulate the three-dimensional ana-tomical structure of the GI tract. Specifically, the tissue phantom
Fig. 4 Dye concentrations (0 to 100 nmol∕L) are plotted as a function of the detected fluorescencesignals in the SFE images. Each data point was an average of n ¼ 5, and the error bars representthe variability in the fluorescence signal intensity measurement. The linearity of the sodium fluoresceinfluorescence in the SFE’s green channel is presented in (a), whereas in (b) the linearity of the Cy5.5fluorescence in the SFE’s red detection channel is shown.
Journal of Biomedical Optics 076014-7 July 2014 • Vol. 19(7)
Yang et al.: Target-to-background enhancement in multispectral endoscopy. . .
Downloaded From: http://biomedicaloptics.spiedigitallibrary.org/ on 10/23/2014 Terms of Use: http://spiedl.org/terms
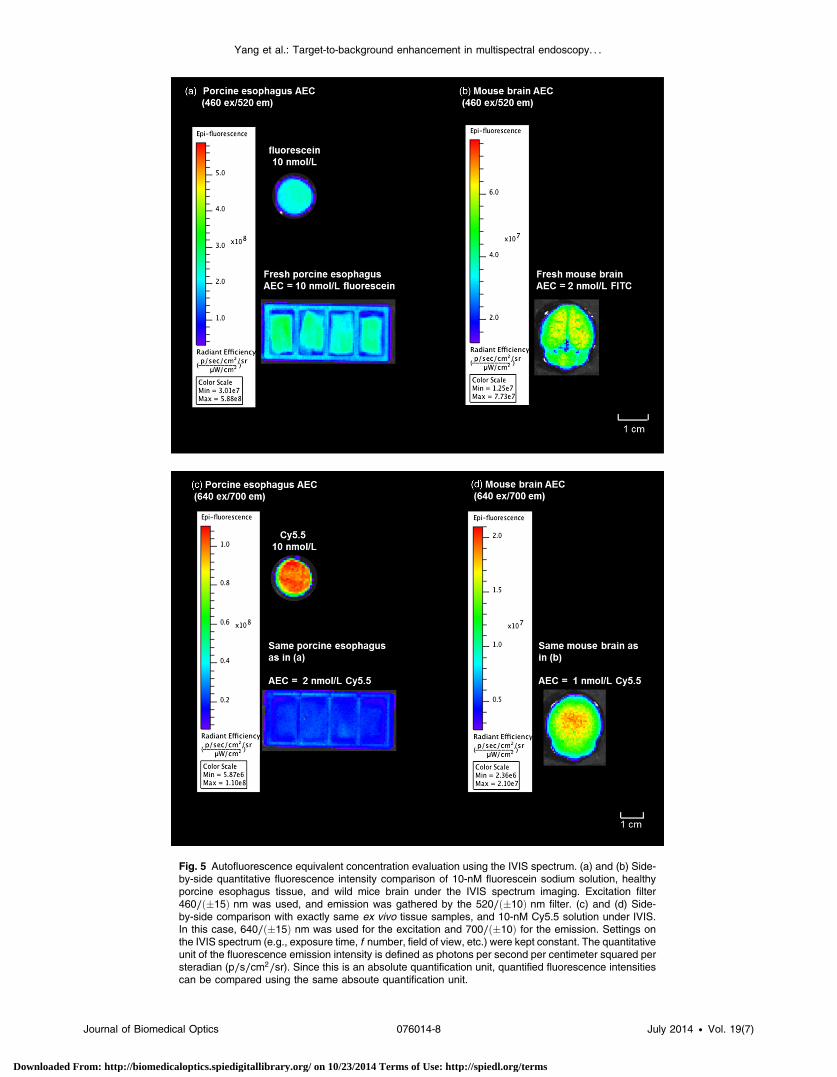
Fig. 5 Autofluorescence equivalent concentration evaluation using the IVIS spectrum. (a) and (b) Side-by-side quantitative fluorescence intensity comparison of 10-nM fluorescein sodium solution, healthyporcine esophagus tissue, and wild mice brain under the IVIS spectrum imaging. Excitation filter460∕ð�15Þ nm was used, and emission was gathered by the 520∕ð�10Þ nm filter. (c) and (d) Side-by-side comparison with exactly same ex vivo tissue samples, and 10-nM Cy5.5 solution under IVIS.In this case, 640∕ð�15Þ nm was used for the excitation and 700∕ð�10Þ for the emission. Settings onthe IVIS spectrum (e.g., exposure time, f number, field of view, etc.) were kept constant. The quantitativeunit of the fluorescence emission intensity is defined as photons per second per centimeter squared persteradian (p∕s∕cm2∕sr). Since this is an absolute quantification unit, quantified fluorescence intensitiescan be compared using the same absoute quantification unit.
Journal of Biomedical Optics 076014-8 July 2014 • Vol. 19(7)
Yang et al.: Target-to-background enhancement in multispectral endoscopy. . .
Downloaded From: http://biomedicaloptics.spiedigitallibrary.org/ on 10/23/2014 Terms of Use: http://spiedl.org/terms
featured a mucosal BE with a monolayer HGD and esophagealadenocarcinoma cell, as well as a submucosal collagen matrix,which is known to be a major contributor to the backgroundAF signal.52 fluorescein isothiocyanate (FITC) conjugatedmolecular probes targeting cancer-specific proteomic biomarkers(EGFR, HER2, and CypA) were applied to the phantom, as wellas metabolic molecular probe 2-NBDG, respectively, to demon-strate the AF and specular reflection mitigation algorithm.
As described previously, 445- and 488-nm laser beams weresimultaneously launched into the SFE scanning fiber as excita-tion light sources, each producing 7-mW outputs on the tissue.The 445-nm excitation served as the reference beam to excite thetissue AF, whereas the 488-nm excitation targeted the fluores-cein molecular markers. Traditionally, in the target detectionchannel, the fluorescence signal would contain an unavoidableAF background signal which reduces the T/B. However, with
Fig. 6 Quantitative AF analysis of esophagus epithelium and brain tissue under a wide range of exci-tations from 430 to 675 nm.
Journal of Biomedical Optics 076014-9 July 2014 • Vol. 19(7)
Yang et al.: Target-to-background enhancement in multispectral endoscopy. . .
Downloaded From: http://biomedicaloptics.spiedigitallibrary.org/ on 10/23/2014 Terms of Use: http://spiedl.org/terms
the algorithm running in real time, the AF excited via the 445-nm excitation and received in the SFE blue detection channel isproportional to the quantity of background AF signal in the con-current target fluorescein/green channel. Therefore, AF mitiga-tion can be achieved by subtracting the background AF signal inthe green channel by a predetermined factor of the concurrentAF signal in the blue channel. The algorithm runs automaticallyon a pixel-by-pixel basis at high resolution (50 microns) and atreal-time video rates (30 Hz).
Furthermore, an additional benefit of the AF mitigation algo-rithm was realized with multiple fluorescence imaging channels.
Specular bleed-through artifacts in the fluorescein/green chan-nel were also subtracted based on the signals from the AF/bluechannel at the same pixel location, as all the detection channelsof the SFE system are spatially coregistered.
The results shown in Fig. 9(b) demonstrated the significantimprovement of T/B and elimination of specular reflection afterapplying the AF mitigation algorithm. Specifically, the T/B ratioincreased from 2.1 to 117.7—a 56-fold improvement, and thespecular reflection from Fig. 9(a) was removed, resulting ina clean and clear delineation of the targeted disease region.The same algorithm was also applied to a lumen-shaped tissue
Fig. 7 Autofluorescence excitation and emission spectral characteristics of porcine esophagus andmurine brain tissue.
Journal of Biomedical Optics 076014-10 July 2014 • Vol. 19(7)
Yang et al.: Target-to-background enhancement in multispectral endoscopy. . .
Downloaded From: http://biomedicaloptics.spiedigitallibrary.org/ on 10/23/2014 Terms of Use: http://spiedl.org/terms
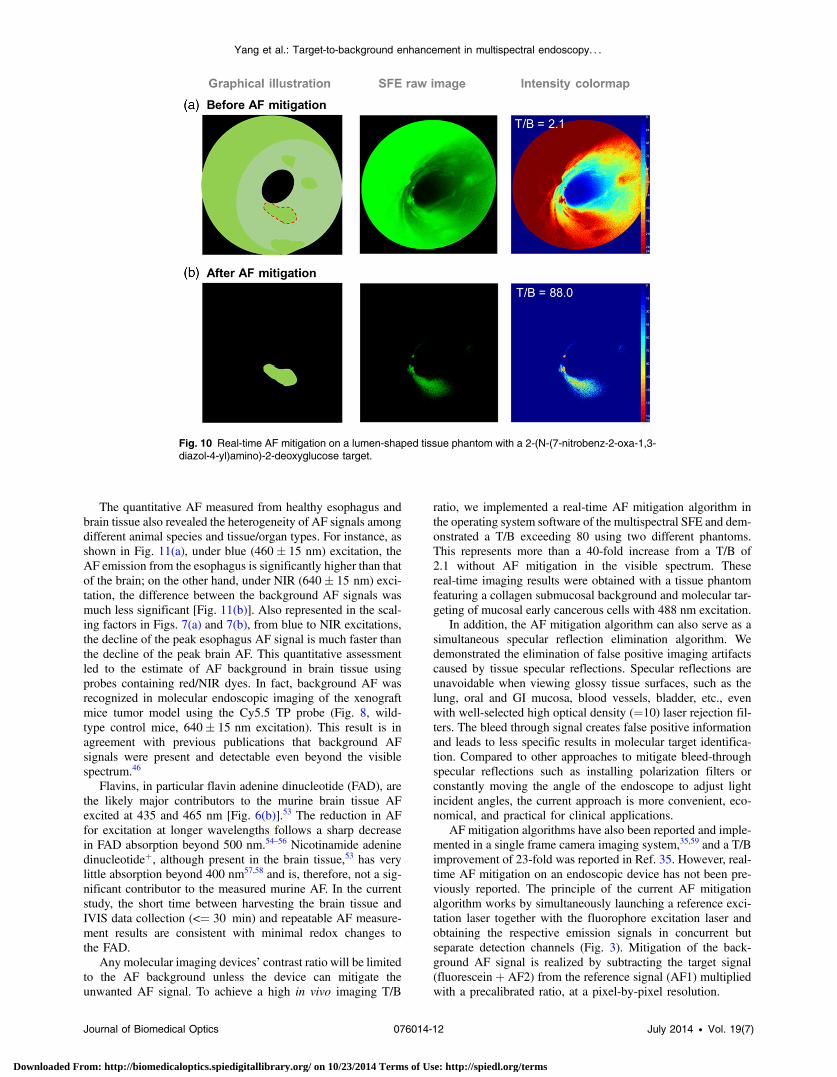
phantom with an AF background and a 2-NBDG target(Fig. 10). Significant T/B 44-fold enhancement from 2.1 to88.0 was also observed.
4 DiscussionHigh sensitivity at nanomolar fluorophore levels is needed for aviable fluorescence molecular endoscopic imaging device todetect disease-associated cellular biomarkers and guide inter-ventions. Apart from achieving a high S/N as an electronic
device, the success of a clinically viable molecular diagnosticimaging system also depends on the in vivo image contrastratio (T/B). However, a low T/B (≤3) is often reported and iscaused by a combination of confounding factors, includingthe abundant tissue background AF.8,13–16,36,37 Sometimes thebackground AF signal can be as high as the target signal. Itblocks out diagnostic information and reduces the net sensitivityof the molecular probe imaging.
It is a general concern that tissue AF is a major limiting factorfor achieving high contrast ratio in exogenous fluorophore probeimaging. Although quantitative dilutions of the target fluoro-phore are routinely used for evaluating an imaging device’sdetection capability, the quantitative signal strength of the back-ground AF and its amplitude compared to the target signal areoften unaddressed. The omission of this AF interferenceimpedes the evaluation of the imaging device’s in vivo detectioncapability. In the present study, we established AEC as an addi-tional requirement for fluorescence molecular imaging deviceevaluation and performed the AEC measurement of targetedtissues with references to a quantitative fluorescence in vivoimaging instrument—the IVIS spectrum. The AEC methodenables researchers to prepare portable calibration standardswithout the need for complex radiometric measurement systems.
We propose and demonstrate herein a two-step method forevaluating a fluorescence molecular imaging device’s detectionsensitivity. The evaluation method is based on two major fac-tors: (1) determine the S/N of the device itself in vitro usinglow concentrations of fluorophore dye probes, and (2) evaluatethe actual T/B in the presence of tissue background AF. Here,the AF signal is quantitatively assessed and transferred into theAEC of standardized fluorophore solutions. The fluorophorereference concentrations are determined in a side-by-side com-parison with the quantitative tissue AF signal. The fluorophoreconcentration that quantitatively matches the AF background(Fig. 5) is then selected as the portable AEC standard.
Fig. 8 Tumor paint (CTX:Cy5.5) imaging of mouse xenograft tumor.
Fig. 9 Real-time AF and specular reflection mitigation on a flat tissue phantom with molecular specificlabeling using fluorescein isocyanine conjugated probes.
Journal of Biomedical Optics 076014-11 July 2014 • Vol. 19(7)
Yang et al.: Target-to-background enhancement in multispectral endoscopy. . .
Downloaded From: http://biomedicaloptics.spiedigitallibrary.org/ on 10/23/2014 Terms of Use: http://spiedl.org/terms
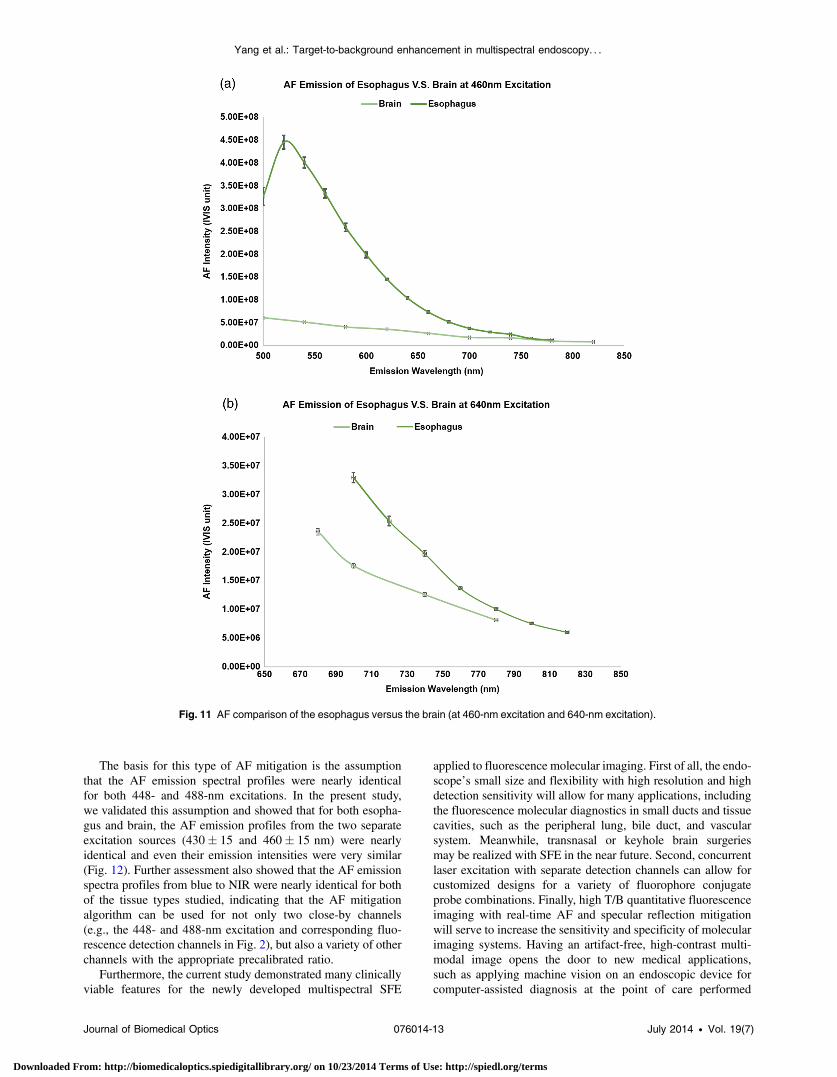
The quantitative AF measured from healthy esophagus andbrain tissue also revealed the heterogeneity of AF signals amongdifferent animal species and tissue/organ types. For instance, asshown in Fig. 11(a), under blue (460� 15 nm) excitation, theAF emission from the esophagus is significantly higher than thatof the brain; on the other hand, under NIR (640� 15 nm) exci-tation, the difference between the background AF signals wasmuch less significant [Fig. 11(b)]. Also represented in the scal-ing factors in Figs. 7(a) and 7(b), from blue to NIR excitations,the decline of the peak esophagus AF signal is much faster thanthe decline of the peak brain AF. This quantitative assessmentled to the estimate of AF background in brain tissue usingprobes containing red/NIR dyes. In fact, background AF wasrecognized in molecular endoscopic imaging of the xenograftmice tumor model using the Cy5.5 TP probe (Fig. 8, wild-type control mice, 640� 15 nm excitation). This result is inagreement with previous publications that background AFsignals were present and detectable even beyond the visiblespectrum.46
Flavins, in particular flavin adenine dinucleotide (FAD), arethe likely major contributors to the murine brain tissue AFexcited at 435 and 465 nm [Fig. 6(b)].53 The reduction in AFfor excitation at longer wavelengths follows a sharp decreasein FAD absorption beyond 500 nm.54–56 Nicotinamide adeninedinucleotideþ, although present in the brain tissue,53 has verylittle absorption beyond 400 nm57,58 and is, therefore, not a sig-nificant contributor to the measured murine AF. In the currentstudy, the short time between harvesting the brain tissue andIVIS data collection (<¼ 30 min) and repeatable AF measure-ment results are consistent with minimal redox changes tothe FAD.
Any molecular imaging devices’ contrast ratio will be limitedto the AF background unless the device can mitigate theunwanted AF signal. To achieve a high in vivo imaging T/B
ratio, we implemented a real-time AF mitigation algorithm inthe operating system software of the multispectral SFE and dem-onstrated a T/B exceeding 80 using two different phantoms.This represents more than a 40-fold increase from a T/B of2.1 without AF mitigation in the visible spectrum. Thesereal-time imaging results were obtained with a tissue phantomfeaturing a collagen submucosal background and molecular tar-geting of mucosal early cancerous cells with 488 nm excitation.
In addition, the AF mitigation algorithm can also serve as asimultaneous specular reflection elimination algorithm. Wedemonstrated the elimination of false positive imaging artifactscaused by tissue specular reflections. Specular reflections areunavoidable when viewing glossy tissue surfaces, such as thelung, oral and GI mucosa, blood vessels, bladder, etc., evenwith well-selected high optical density (¼10) laser rejection fil-ters. The bleed through signal creates false positive informationand leads to less specific results in molecular target identifica-tion. Compared to other approaches to mitigate bleed-throughspecular reflections such as installing polarization filters orconstantly moving the angle of the endoscope to adjust lightincident angles, the current approach is more convenient, eco-nomical, and practical for clinical applications.
AF mitigation algorithms have also been reported and imple-mented in a single frame camera imaging system,35,59 and a T/Bimprovement of 23-fold was reported in Ref. 35. However, real-time AF mitigation on an endoscopic device has not been pre-viously reported. The principle of the current AF mitigationalgorithm works by simultaneously launching a reference exci-tation laser together with the fluorophore excitation laser andobtaining the respective emission signals in concurrent butseparate detection channels (Fig. 3). Mitigation of the back-ground AF signal is realized by subtracting the target signal(fluoresceinþ AF2) from the reference signal (AF1) multipliedwith a precalibrated ratio, at a pixel-by-pixel resolution.
Fig. 10 Real-time AF mitigation on a lumen-shaped tissue phantom with a 2-(N-(7-nitrobenz-2-oxa-1,3-diazol-4-yl)amino)-2-deoxyglucose target.
Journal of Biomedical Optics 076014-12 July 2014 • Vol. 19(7)
Yang et al.: Target-to-background enhancement in multispectral endoscopy. . .
Downloaded From: http://biomedicaloptics.spiedigitallibrary.org/ on 10/23/2014 Terms of Use: http://spiedl.org/terms
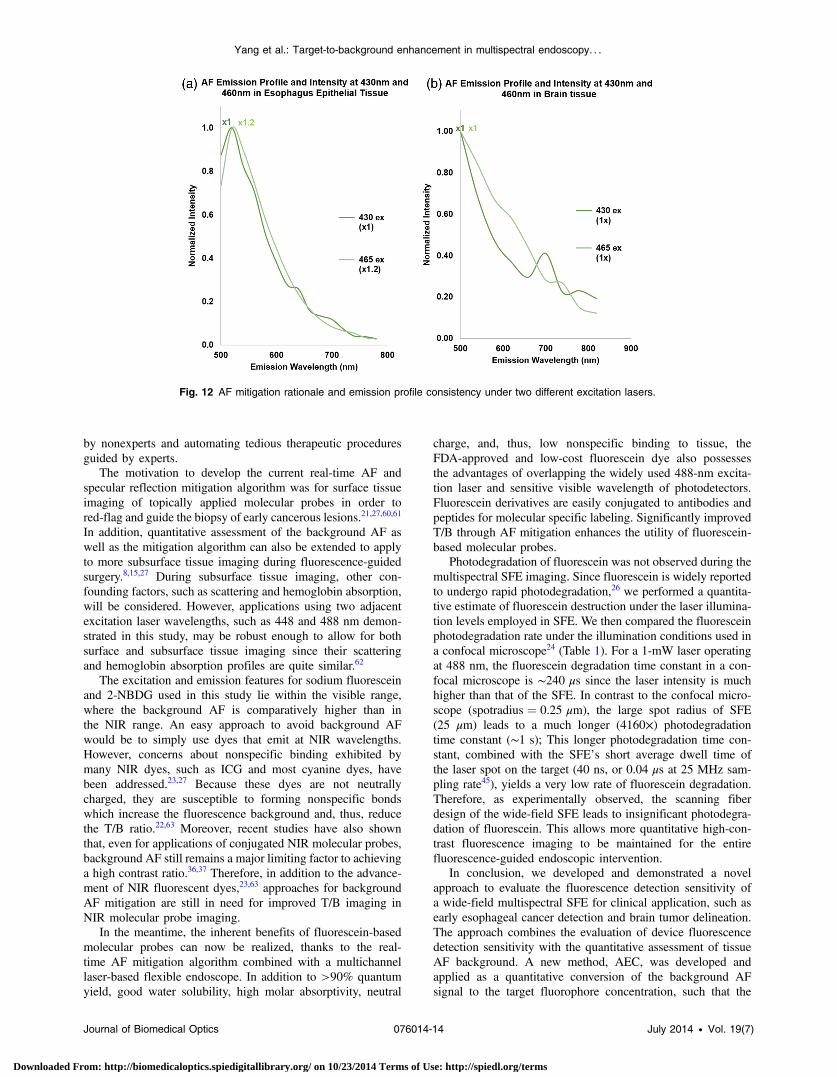
The basis for this type of AF mitigation is the assumptionthat the AF emission spectral profiles were nearly identicalfor both 448- and 488-nm excitations. In the present study,we validated this assumption and showed that for both esopha-gus and brain, the AF emission profiles from the two separateexcitation sources (430� 15 and 460� 15 nm) were nearlyidentical and even their emission intensities were very similar(Fig. 12). Further assessment also showed that the AF emissionspectra profiles from blue to NIR were nearly identical for bothof the tissue types studied, indicating that the AF mitigationalgorithm can be used for not only two close-by channels(e.g., the 448- and 488-nm excitation and corresponding fluo-rescence detection channels in Fig. 2), but also a variety of otherchannels with the appropriate precalibrated ratio.
Furthermore, the current study demonstrated many clinicallyviable features for the newly developed multispectral SFE
applied to fluorescence molecular imaging. First of all, the endo-scope’s small size and flexibility with high resolution and highdetection sensitivity will allow for many applications, includingthe fluorescence molecular diagnostics in small ducts and tissuecavities, such as the peripheral lung, bile duct, and vascularsystem. Meanwhile, transnasal or keyhole brain surgeriesmay be realized with SFE in the near future. Second, concurrentlaser excitation with separate detection channels can allow forcustomized designs for a variety of fluorophore conjugateprobe combinations. Finally, high T/B quantitative fluorescenceimaging with real-time AF and specular reflection mitigationwill serve to increase the sensitivity and specificity of molecularimaging systems. Having an artifact-free, high-contrast multi-modal image opens the door to new medical applications,such as applying machine vision on an endoscopic device forcomputer-assisted diagnosis at the point of care performed
Fig. 11 AF comparison of the esophagus versus the brain (at 460-nm excitation and 640-nm excitation).
Journal of Biomedical Optics 076014-13 July 2014 • Vol. 19(7)
Yang et al.: Target-to-background enhancement in multispectral endoscopy. . .
Downloaded From: http://biomedicaloptics.spiedigitallibrary.org/ on 10/23/2014 Terms of Use: http://spiedl.org/terms
by nonexperts and automating tedious therapeutic proceduresguided by experts.
The motivation to develop the current real-time AF andspecular reflection mitigation algorithm was for surface tissueimaging of topically applied molecular probes in order tored-flag and guide the biopsy of early cancerous lesions.21,27,60,61
In addition, quantitative assessment of the background AF aswell as the mitigation algorithm can also be extended to applyto more subsurface tissue imaging during fluorescence-guidedsurgery.8,15,27 During subsurface tissue imaging, other con-founding factors, such as scattering and hemoglobin absorption,will be considered. However, applications using two adjacentexcitation laser wavelengths, such as 448 and 488 nm demon-strated in this study, may be robust enough to allow for bothsurface and subsurface tissue imaging since their scatteringand hemoglobin absorption profiles are quite similar.62
The excitation and emission features for sodium fluoresceinand 2-NBDG used in this study lie within the visible range,where the background AF is comparatively higher than inthe NIR range. An easy approach to avoid background AFwould be to simply use dyes that emit at NIR wavelengths.However, concerns about nonspecific binding exhibited bymany NIR dyes, such as ICG and most cyanine dyes, havebeen addressed.23,27 Because these dyes are not neutrallycharged, they are susceptible to forming nonspecific bondswhich increase the fluorescence background and, thus, reducethe T/B ratio.22,63 Moreover, recent studies have also shownthat, even for applications of conjugated NIR molecular probes,background AF still remains a major limiting factor to achievinga high contrast ratio.36,37 Therefore, in addition to the advance-ment of NIR fluorescent dyes,23,63 approaches for backgroundAF mitigation are still in need for improved T/B imaging inNIR molecular probe imaging.
In the meantime, the inherent benefits of fluorescein-basedmolecular probes can now be realized, thanks to the real-time AF mitigation algorithm combined with a multichannellaser-based flexible endoscope. In addition to >90% quantumyield, good water solubility, high molar absorptivity, neutral
charge, and, thus, low nonspecific binding to tissue, theFDA-approved and low-cost fluorescein dye also possessesthe advantages of overlapping the widely used 488-nm excita-tion laser and sensitive visible wavelength of photodetectors.Fluorescein derivatives are easily conjugated to antibodies andpeptides for molecular specific labeling. Significantly improvedT/B through AF mitigation enhances the utility of fluorescein-based molecular probes.
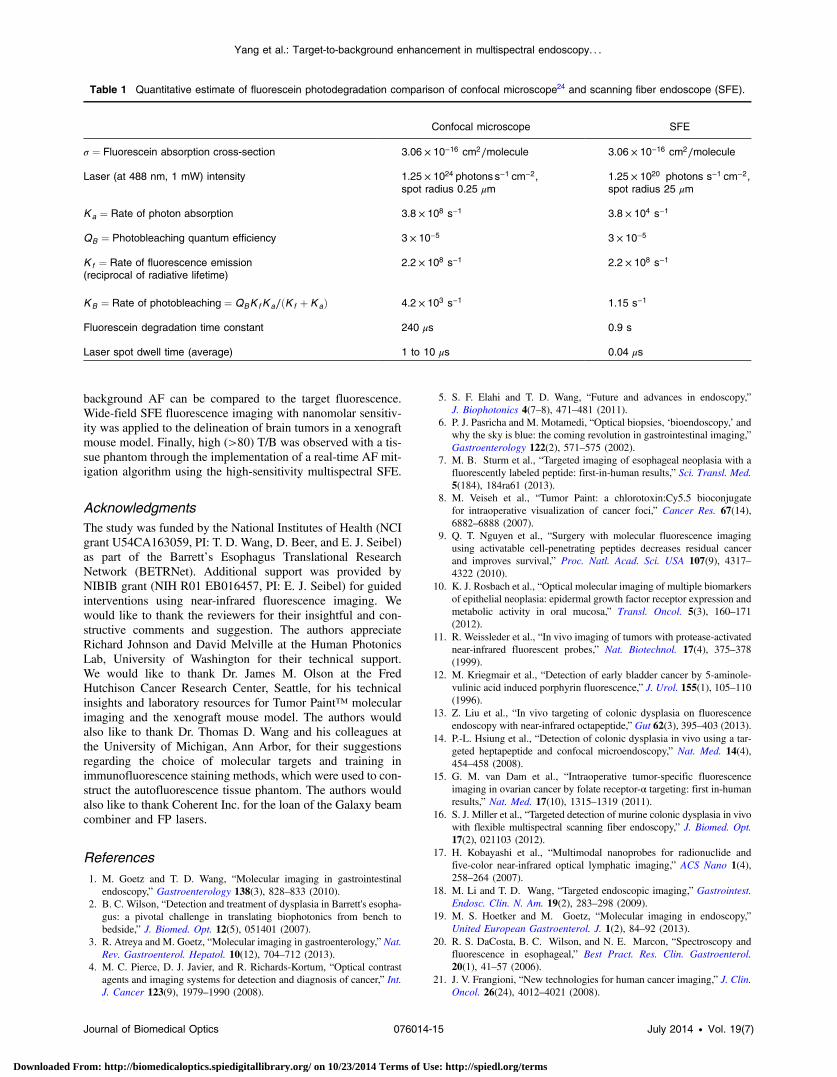
Photodegradation of fluorescein was not observed during themultispectral SFE imaging. Since fluorescein is widely reportedto undergo rapid photodegradation,26 we performed a quantita-tive estimate of fluorescein destruction under the laser illumina-tion levels employed in SFE. We then compared the fluoresceinphotodegradation rate under the illumination conditions used ina confocal microscope24 (Table 1). For a 1-mW laser operatingat 488 nm, the fluorescein degradation time constant in a con-focal microscope is ∼240 μs since the laser intensity is muchhigher than that of the SFE. In contrast to the confocal micro-scope (spotradius ¼ 0.25 μm), the large spot radius of SFE(25 μm) leads to a much longer (4160×) photodegradationtime constant (∼1 s); This longer photodegradation time con-stant, combined with the SFE’s short average dwell time ofthe laser spot on the target (40 ns, or 0.04 μs at 25 MHz sam-pling rate45), yields a very low rate of fluorescein degradation.Therefore, as experimentally observed, the scanning fiberdesign of the wide-field SFE leads to insignificant photodegra-dation of fluorescein. This allows more quantitative high-con-trast fluorescence imaging to be maintained for the entirefluorescence-guided endoscopic intervention.
In conclusion, we developed and demonstrated a novelapproach to evaluate the fluorescence detection sensitivity ofa wide-field multispectral SFE for clinical application, such asearly esophageal cancer detection and brain tumor delineation.The approach combines the evaluation of device fluorescencedetection sensitivity with the quantitative assessment of tissueAF background. A new method, AEC, was developed andapplied as a quantitative conversion of the background AFsignal to the target fluorophore concentration, such that the
Fig. 12 AF mitigation rationale and emission profile consistency under two different excitation lasers.
Journal of Biomedical Optics 076014-14 July 2014 • Vol. 19(7)
Yang et al.: Target-to-background enhancement in multispectral endoscopy. . .
Downloaded From: http://biomedicaloptics.spiedigitallibrary.org/ on 10/23/2014 Terms of Use: http://spiedl.org/terms
background AF can be compared to the target fluorescence.Wide-field SFE fluorescence imaging with nanomolar sensitiv-ity was applied to the delineation of brain tumors in a xenograftmouse model. Finally, high (>80) T/B was observed with a tis-sue phantom through the implementation of a real-time AF mit-igation algorithm using the high-sensitivity multispectral SFE.
AcknowledgmentsThe study was funded by the National Institutes of Health (NCIgrant U54CA163059, PI: T. D. Wang, D. Beer, and E. J. Seibel)as part of the Barrett’s Esophagus Translational ResearchNetwork (BETRNet). Additional support was provided byNIBIB grant (NIH R01 EB016457, PI: E. J. Seibel) for guidedinterventions using near-infrared fluorescence imaging. Wewould like to thank the reviewers for their insightful and con-structive comments and suggestion. The authors appreciateRichard Johnson and David Melville at the Human PhotonicsLab, University of Washington for their technical support.We would like to thank Dr. James M. Olson at the FredHutchison Cancer Research Center, Seattle, for his technicalinsights and laboratory resources for Tumor Paint™ molecularimaging and the xenograft mouse model. The authors wouldalso like to thank Dr. Thomas D. Wang and his colleagues atthe University of Michigan, Ann Arbor, for their suggestionsregarding the choice of molecular targets and training inimmunofluorescence staining methods, which were used to con-struct the autofluorescence tissue phantom. The authors wouldalso like to thank Coherent Inc. for the loan of the Galaxy beamcombiner and FP lasers.
References1. M. Goetz and T. D. Wang, “Molecular imaging in gastrointestinal
endoscopy,” Gastroenterology 138(3), 828–833 (2010).2. B. C. Wilson, “Detection and treatment of dysplasia in Barrett's esopha-
gus: a pivotal challenge in translating biophotonics from bench tobedside,” J. Biomed. Opt. 12(5), 051401 (2007).
3. R. Atreya and M. Goetz, “Molecular imaging in gastroenterology,” Nat.Rev. Gastroenterol. Hepatol. 10(12), 704–712 (2013).
4. M. C. Pierce, D. J. Javier, and R. Richards-Kortum, “Optical contrastagents and imaging systems for detection and diagnosis of cancer,” Int.J. Cancer 123(9), 1979–1990 (2008).
5. S. F. Elahi and T. D. Wang, “Future and advances in endoscopy,”J. Biophotonics 4(7–8), 471–481 (2011).
6. P. J. Pasricha and M. Motamedi, “Optical biopsies, ‘bioendoscopy,’ andwhy the sky is blue: the coming revolution in gastrointestinal imaging,”Gastroenterology 122(2), 571–575 (2002).
7. M. B. Sturm et al., “Targeted imaging of esophageal neoplasia with afluorescently labeled peptide: first-in-human results,” Sci. Transl. Med.5(184), 184ra61 (2013).
8. M. Veiseh et al., “Tumor Paint: a chlorotoxin:Cy5.5 bioconjugatefor intraoperative visualization of cancer foci,” Cancer Res. 67(14),6882–6888 (2007).
9. Q. T. Nguyen et al., “Surgery with molecular fluorescence imagingusing activatable cell-penetrating peptides decreases residual cancerand improves survival,” Proc. Natl. Acad. Sci. USA 107(9), 4317–4322 (2010).
10. K. J. Rosbach et al., “Optical molecular imaging of multiple biomarkersof epithelial neoplasia: epidermal growth factor receptor expression andmetabolic activity in oral mucosa,” Transl. Oncol. 5(3), 160–171(2012).
11. R. Weissleder et al., “In vivo imaging of tumors with protease-activatednear-infrared fluorescent probes,” Nat. Biotechnol. 17(4), 375–378(1999).
12. M. Kriegmair et al., “Detection of early bladder cancer by 5-aminole-vulinic acid induced porphyrin fluorescence,” J. Urol. 155(1), 105–110(1996).
13. Z. Liu et al., “In vivo targeting of colonic dysplasia on fluorescenceendoscopy with near-infrared octapeptide,” Gut 62(3), 395–403 (2013).
14. P.-L. Hsiung et al., “Detection of colonic dysplasia in vivo using a tar-geted heptapeptide and confocal microendoscopy,” Nat. Med. 14(4),454–458 (2008).
15. G. M. van Dam et al., “Intraoperative tumor-specific fluorescenceimaging in ovarian cancer by folate receptor-α targeting: first in-humanresults,” Nat. Med. 17(10), 1315–1319 (2011).
16. S. J. Miller et al., “Targeted detection of murine colonic dysplasia in vivowith flexible multispectral scanning fiber endoscopy,” J. Biomed. Opt.17(2), 021103 (2012).
17. H. Kobayashi et al., “Multimodal nanoprobes for radionuclide andfive-color near-infrared optical lymphatic imaging,” ACS Nano 1(4),258–264 (2007).
18. M. Li and T. D. Wang, “Targeted endoscopic imaging,” Gastrointest.Endosc. Clin. N. Am. 19(2), 283–298 (2009).
19. M. S. Hoetker and M. Goetz, “Molecular imaging in endoscopy,”United European Gastroenterol. J. 1(2), 84–92 (2013).
20. R. S. DaCosta, B. C. Wilson, and N. E. Marcon, “Spectroscopy andfluorescence in esophageal,” Best Pract. Res. Clin. Gastroenterol.20(1), 41–57 (2006).
21. J. V. Frangioni, “New technologies for human cancer imaging,” J. Clin.Oncol. 26(24), 4012–4021 (2008).
Table 1 Quantitative estimate of fluorescein photodegradation comparison of confocal microscope24 and scanning fiber endoscope (SFE).
Confocal microscope SFE
σ ¼ Fluorescein absorption cross-section 3.06 × 10⁻¹⁶ cm2∕molecule 3.06 × 10⁻¹⁶ cm2∕molecule
Laser (at 488 nm, 1 mW) intensity 1.25 × 1024 photons s−1 cm−2,spot radius 0.25 μm
1.25 × 10²⁰ photons s−1 cm−2,spot radius 25 μm
Ka ¼ Rate of photon absorption 3.8 × 10⁸ s−1 3.8 × 10⁴ s−1
QB ¼ Photobleaching quantum efficiency 3 × 10⁻⁵ 3 × 10⁻⁵
K f ¼ Rate of fluorescence emission(reciprocal of radiative lifetime)
2.2 × 10⁸ s−1 2.2 × 10⁸ s−1
KB ¼ Rate of photobleaching ¼ QBK f K a∕ðK f þ KaÞ 4.2 × 10³ s−1 1.15 s−1
Fluorescein degradation time constant 240 μs 0.9 s
Laser spot dwell time (average) 1 to 10 μs 0.04 μs
Journal of Biomedical Optics 076014-15 July 2014 • Vol. 19(7)
Yang et al.: Target-to-background enhancement in multispectral endoscopy. . .
Downloaded From: http://biomedicaloptics.spiedigitallibrary.org/ on 10/23/2014 Terms of Use: http://spiedl.org/terms
22. J. T. C. Liu et al., “Quantifying cell-surface biomarker expression inthick tissues with ratiometric three-dimensional microscopy,”Biophys. J. 96(6), 2405–2414 (2009).
23. H. S. Choi et al., “Targeted zwitterionic near-infrared fluorophores forimproved optical imaging,” Nat. Biotechnol. 31(2), 148–153 (2013).
24. R. Y. Tsien, L. Ernst, and A. Waggoner, “Fluorophores for confocalmicroscopy: photophysics and photochemistry,” in Handbook ofBiological Confocal Microscopy, J. B. Pawley, Ed., pp. 338–352,Springer, New York, NY (2006).
25. M. S. T. Goncalves, “Fluorescent labeling of biomolecules with organicprobes,” Chem. Rev. 109(1), 190–212 (2009).
26. R. Y. Tsien, “Fluorescent indicators of ion concentrations,” in Methodsin Cell Biology, L. Wilson and P. Tran, Eds., Vol. 30, pp. 127–156,Academic Press, Waltham, Massachusetts (1989).
27. Q. T. Nguyen and R. Y. Tsien, “Fluorescence-guided surgery withlive molecular navigation—a new live cutting edge,” Nat. Rev. 13(9),653–662 (2013).
28. R. Weissleder and M. J. Pittet, “Imaging in the era of molecular oncol-ogy,” Nature 452(7187), 580–589 (2008).
29. R. Alford et al., “Toxicity of organic fluorophores used in molecularimaging: literature review,” Mol. Imaging 8(6), 341–354 (2009).
30. J. Gao, P. Wang, and R. W. Giese, “Xanthamide fluorescent dyes,”Anal. Chem. 74(24), 6397–6401 (2002).
31. O. N. Burchak et al., “Fluorescein-based amino acids for solid phasesynthesis of fluorogenic protease substrates,” Bioorg. Med. Chem.14(8), 2559–2568 (2006).
32. V. Venugopal et al., “Design and characterization of an optimized simul-taneous color and near-infrared fluorescence rigid endoscopic imagingsystem,” J. Biomed. Opt. 18(12), 126018 (2013).
33. A. Bogaards, H. Sterenborg, and B. C. Wilson, “In vivo quantificationof fluorescent molecular markers in real-time: a review to evaluate theperformance of five existing methods,” Photodiagnosis Photodyn. Ther.4(3), 170–178 (2007).
34. R. Baumgartner et al., “A fluorescence imaging device for endoscopicdetection of early stage cancer—instrumental and experimental studies,”Photochem. Photobiol. 46(5), 759–763 (1987).
35. T. Troy et al., “Quantitative comparison of the sensitivity of detection offluorescent and bioluminescent reporters in animal models,” Mol.Imaging 3(1), 9–23 (2004).
36. P. B. Garcia-Allende et al., “Towards clinically translatable NIR fluo-rescence molecular guidance for colonoscopy,” Biomed. Opt. Express5(1), 78–92 (2014).
37. F. Fantoni et al., “Background fluorescence reduction and absorptioncorrection for fluorescence reflectance imaging,” Proc. SPIE 8935,89350Z (2014).
38. R. A. Sheth, L. Josephson, and U. Mahmood, “Evaluation and clin-ically relevant applications of a fluorescent imaging analog to fluoro-deoxyglucose positron emission tomography,” J. Biomed. Opt. 14(6),064014 (2009).
39. N. Thekkek et al., “Pre-clinical evaluation of fluorescent deoxyglucoseas a topical contrast agent for the detection of Barrett’s-associated neo-plasia during confocal imaging,” Technol. Cancer Res. Treat. 10(5),431–441 (2011).
40. N. Nitin et al., “Molecular imaging of glucose uptake in oral neoplasiafollowing topical application of fluorescently labeled deoxy-glucose,”Int. J. Cancer 124(11), 2634–2642 (2009).
41. Y. Liu et al., “Near-infrared fluorescence goggle system with comple-mentary metal–oxide–semiconductor imaging sensor and see-throughdisplay,” J. Biomed. Opt. 18(10), 101303 (2013).
42. J. Glatz et al., “Concurrent video-rate color and near-infrared fluores-cence laparoscopy,” J. Biomed. Opt. 18(10), 101302 (2013).
43. C. Azzi et al., “Permeation and reservoir formation of 4-(methylnitro-samino)-1-(3-pyridyl)-1-butanone (NNK) and benzo[a]pyrene (B[a]P)across porcine esophageal tissue in the presence of ethanol and men-thol,” Carcinogenesis 27(1), 137–145 (2005).
44. C. Yang et al., “Scanning fiber endoscope with multiple fluorescence-reflectance imaging channels for guiding biopsy,” Proc. SPIE 8936,89360R (2014).
45. C. M. Lee et al., “Scanning fiber endoscopy with highly flexible, 1 mmcatheterscopes for wide-field, full-color imaging,” J. Biophotonics3(5–6), 385–407 (2010).
46. M. R. Stroud, S. J. Hansen, and J. M. Olson, “In vivo bio-imagingusing chlorotoxin-based conjugates,” Curr. Pharm. Des. 17(38),4362–4371 (2011).
47. V. W. Hou et al., “The development of a simplified epithelial tissuephantom for the evaluation of an autofluorescence mitigation algo-rithm,” Proc. SPIE 8945, 894506 (2014).
48. Coherent Inc., “OBIS Galaxy—laser beam combiner,” 2014, http://www.coherent.com/products/?2080/OBIS-Galaxy (14 February 2014).
49. C. Yang et al., “Multispectral scanning fiber endoscope with concurrentautofluorescence background mitigation for improved target-to-back-ground ratio,” Proc. SPIE 8927, 89270I (2014).
50. C. Yang et al., “Color-matched and fluorescence-labeled esophagusphantom and its applications,” J. Biomed. Opt. 18(2), 026020 (2013).
51. C. Yang et al., “Mitigating fluorescence spectral overlap in wide-fieldendoscopic imaging,” J. Biomed. Opt. 18(8), 086012 (2013).
52. M. A. Kara et al., “Characterization of tissue autofluorescence in Barrett’sesophagus by confocal fluorescence microscopy,” Dis. Esophagus 20(2),141–150 (2007).
53. S. R. Rantelhardt et al., “Imaging of brain and brain tumor specimens bytime-resolved multiphoton excitation microscopy ex vivo,” NeuroOncol. 9(2), 103–112 (2007).
54. S. K. Chapman and G. A. Reid, “UV-visible spectroscopy as a tool tostudy flavoproteins,” in Flavoprotein Protocols, S. K. Chapman and G.A. Reid, Eds., pp. 1–7, Humana Press Inc., Totowa, New Jersey (1999).
55. J. A. Lewis and J. C. Escalante-Semerena, “The FAD-dependenttricarballylate dehydrogenase (TcuA) enzyme of Salmonella entericaconverts tricarballylate into cis-aconitate,” J. Bacteriol. 188(15),5479–5486 (2006).
56. S. Prahl, “Riboflavin,” 5 May 2012, http://omlc.ogi.edu/spectra/PhotochemCAD/html/004.html (11 June 2014).
57. R. S. DaCosta, H. Andersson, and B. C. Wilson, “Molecular fluores-cence excitation–emission matrices relevant to tissue spectroscopy,”Photochem. Photobiol. 78(4), 384–392 (2003).
58. H. D. Vishwasrao et al., “Conformational dependence of intracellularNADH on metabolic state revealed by associated fluorescenceanisotropy,” J. Biol. Chem. 280(26), 25119–25126 (2005).
59. C. H. van de Lest et al., “Elimination of autofluorescence in immuno-fluorescence microscopy with digital image processing,” J. Histochem.Cytochem. 43(7), 727–730 (1995).
60. M. Zellweger et al., “Absolute autofluorescence spectra of humanhealthy, metaplastic, and early cancerous bronchial tissue in vivo,”Appl. Opt. 40(22), 3784–3791 (2001).
61. H. Chung et al., “Evaluation of surface and build-up region dose forintensity-modulated radiation therapy in head and neck cancer,”Med. Phys. 32(8), 2682–2689 (2005).
62. S. Prahl, “Optical absorption of hemoglobin,” 15 December 1999,http://omlc.ogi.edu/spectra/hemoglobin/ (30 January 2014).
63. H. S. Choi et al., “Synthesis and in vivo fate of zwitterionic near-infraredfluorophores,” Angew. Chem. Int. Ed. Engl. 50(28), 6258–6263 (2011).
Biographies of the authors are not available.
Journal of Biomedical Optics 076014-16 July 2014 • Vol. 19(7)
Yang et al.: Target-to-background enhancement in multispectral endoscopy. . .
Downloaded From: http://biomedicaloptics.spiedigitallibrary.org/ on 10/23/2014 Terms of Use: http://spiedl.org/terms
Related Documents