PHYSICAL REVIEW E 89, 013102 (2014) Target charging in short-pulse-laser–plasma experiments J.-L. Dubois, 1 F. Lubrano-Lavaderci, 1 D. Raffestin, 1 J. Ribolzi, 1 J. Gazave, 1 A. Compant La Fontaine, 2 E. d’Humi` eres, 3 S. Hulin, 3 Ph. Nicola¨ ı, 3 A. Poy´ e, 3 and V. T. Tikhonchuk 3 , * 1 CEA/DAM/CESTA, BP 12, Le Barp 33405, France 2 CEA/DAM/DIF, F-91297 Arpajon, France 3 Centre Lasers Intenses et Applications, University Bordeaux, CNRS, CEA, Talence 33405, France (Received 2 October 2013; published 13 January 2014) Interaction of high-intensity laser pulses with solid targets results in generation of large quantities of energetic electrons that are the origin of various effects such as intense x-ray emission, ion acceleration, and so on. Some of these electrons are escaping the target, leaving behind a significant positive electric charge and creating a strong electromagnetic pulse long after the end of the laser pulse. We propose here a detailed model of the target electric polarization induced by a short and intense laser pulse and an escaping electron bunch. A specially designed experiment provides direct measurements of the target polarization and the discharge current in the function of the laser energy, pulse duration, and target size. Large-scale numerical simulations describe the energetic electron generation and their emission from the target. The model, experiment, and numerical simulations demonstrate that the hot-electron ejection may continue long after the laser pulse ends, enhancing significantly the polarization charge. DOI: 10.1103/PhysRevE.89.013102 PACS number(s): 52.38.Kd, 41.75.Jv, 52.57.Kk I. INTRODUCTION Interaction of high-energy and high-power laser pulses with solid targets is accompanied with the generation of a significant number of energetic electrons, producing many secondary effects. The intense x-ray emission [1], ion acceleration [2,3], and many other effects [4] have been intensively studied and have been used in many applications. However, there is a domain related to the laser electron acceleration, which has not been fully described yet. This is the generation of intense electromagnetic pulses during and after the laser pulse spanning a very broad frequency range from a fraction of a terahertz to a megahertz. No single physical mechanism can explain this phenomenon, which has long attracted the attention of many researchers. In particular, the low-frequency part of the emission spectra in the GHz range has been measured in many experimental facilities, especially in the case of multiterawatt laser pulses of a picosecond duration [5]. Such fields may exist in the experimental chamber for a time of the order of microseconds after the laser pulse and may be dangerous for the operation equipment and diagnostics. The mechanisms of generation of electric and magnetic fields in this frequency domain are not well known. It is accepted that the fields are generated during the interaction of the laser pulse with the target and increase with the ejected charge [6–8], but the exact mechanism is not yet defined. It could be related either to the electric current carried out by escaping electrons or with the charge accumulated on the target. The experimental data indicate that the signal strength and the temporal profile depend on the target material and geometry [9], on the shape and the place of the metallic elements of the chamber, as well as on the laser pulse intensity and duration. In particular, the electromagnetic pulses generated with intense picosecond pulses have a much higher amplitude than the * [email protected] ones generated from nanosecond pulses of a much higher energy [10]. In this paper, we present the theoretical model describing the source of electromagnetic emission, which is the target polarization induced by the escaping energetic electrons cre- ated in the interaction of intense picosecond or subpicosecond laser pulses with solid targets. This model is verified in a specially designed experiment where the target return current is directly measured. The experimental data are compared with a series of numerical simulations describing the generation and emission of energetic electrons from the target. It is shown that the target charging proceeds long after the end of the laser pulse. The charged zone at the target surface expands with the hot-electron velocity, thus increasing the target capacity and facilitating the escaping of electrons. Thus, the target lateral size could have a significant impact on the overall polarization effect. The model of charge accumulation is presented in Sec. II for the case of intense picosecond laser pulses and massive targets. It predicts the target charge value in function of the effective energy of hot electrons generated by the laser pulse and the target characteristics. The theoretical predictions are verified in a specially designed experiment, where the accumulated charge has been measured in function of the target size and the laser pulse duration and energy. The experimental results are presented in Sec. III. The experimental data are modeled in a series of numerical simulations, which are discussed in Sec. IV. The three-dimensional particle-in-cell code describes the hot-electron production in the laser focal spot. The subsequent propagation of the energetic electrons and their ejection from the target is modeled with a Monte Carlo code. Finally, the propagation of the ejected electrons in the interaction chamber is described with an electromagnetic particle code. These multiscale extensive numerical simula- tions demonstrate a good agreement with the experimental data and confirm the basic model assumptions. The conclusions and the model predictions for several high-intensity laser installations are presented in Sec. V. A combination of the theoretical model, numerical simulations, and the experiment 1539-3755/2014/89(1)/013102(15) 013102-1 ©2014 American Physical Society

Welcome message from author
This document is posted to help you gain knowledge. Please leave a comment to let me know what you think about it! Share it to your friends and learn new things together.
Transcript

PHYSICAL REVIEW E 89, 013102 (2014)
Target charging in short-pulse-laser–plasma experiments
J.-L. Dubois,1 F. Lubrano-Lavaderci,1 D. Raffestin,1 J. Ribolzi,1 J. Gazave,1 A. Compant La Fontaine,2 E. d’Humieres,3
S. Hulin,3 Ph. Nicolaı,3 A. Poye,3 and V. T. Tikhonchuk3,*
1CEA/DAM/CESTA, BP 12, Le Barp 33405, France2CEA/DAM/DIF, F-91297 Arpajon, France
3Centre Lasers Intenses et Applications, University Bordeaux, CNRS, CEA, Talence 33405, France(Received 2 October 2013; published 13 January 2014)
Interaction of high-intensity laser pulses with solid targets results in generation of large quantities of energeticelectrons that are the origin of various effects such as intense x-ray emission, ion acceleration, and so on. Some ofthese electrons are escaping the target, leaving behind a significant positive electric charge and creating a strongelectromagnetic pulse long after the end of the laser pulse. We propose here a detailed model of the target electricpolarization induced by a short and intense laser pulse and an escaping electron bunch. A specially designedexperiment provides direct measurements of the target polarization and the discharge current in the function ofthe laser energy, pulse duration, and target size. Large-scale numerical simulations describe the energetic electrongeneration and their emission from the target. The model, experiment, and numerical simulations demonstratethat the hot-electron ejection may continue long after the laser pulse ends, enhancing significantly the polarizationcharge.
DOI: 10.1103/PhysRevE.89.013102 PACS number(s): 52.38.Kd, 41.75.Jv, 52.57.Kk
I. INTRODUCTION
Interaction of high-energy and high-power laser pulses withsolid targets is accompanied with the generation of a significantnumber of energetic electrons, producing many secondaryeffects. The intense x-ray emission [1], ion acceleration [2,3],and many other effects [4] have been intensively studiedand have been used in many applications. However, thereis a domain related to the laser electron acceleration, whichhas not been fully described yet. This is the generation ofintense electromagnetic pulses during and after the laser pulsespanning a very broad frequency range from a fraction ofa terahertz to a megahertz. No single physical mechanismcan explain this phenomenon, which has long attracted theattention of many researchers. In particular, the low-frequencypart of the emission spectra in the GHz range has beenmeasured in many experimental facilities, especially in thecase of multiterawatt laser pulses of a picosecond duration [5].Such fields may exist in the experimental chamber for a timeof the order of microseconds after the laser pulse and may bedangerous for the operation equipment and diagnostics. Themechanisms of generation of electric and magnetic fields inthis frequency domain are not well known. It is accepted thatthe fields are generated during the interaction of the laser pulsewith the target and increase with the ejected charge [6–8], butthe exact mechanism is not yet defined. It could be relatedeither to the electric current carried out by escaping electronsor with the charge accumulated on the target. The experimentaldata indicate that the signal strength and the temporal profiledepend on the target material and geometry [9], on theshape and the place of the metallic elements of the chamber,as well as on the laser pulse intensity and duration. Inparticular, the electromagnetic pulses generated with intensepicosecond pulses have a much higher amplitude than the
ones generated from nanosecond pulses of a much higherenergy [10].
In this paper, we present the theoretical model describingthe source of electromagnetic emission, which is the targetpolarization induced by the escaping energetic electrons cre-ated in the interaction of intense picosecond or subpicosecondlaser pulses with solid targets. This model is verified in aspecially designed experiment where the target return currentis directly measured. The experimental data are compared witha series of numerical simulations describing the generationand emission of energetic electrons from the target. It isshown that the target charging proceeds long after the endof the laser pulse. The charged zone at the target surfaceexpands with the hot-electron velocity, thus increasing thetarget capacity and facilitating the escaping of electrons. Thus,the target lateral size could have a significant impact on theoverall polarization effect. The model of charge accumulationis presented in Sec. II for the case of intense picosecond laserpulses and massive targets. It predicts the target charge value infunction of the effective energy of hot electrons generated bythe laser pulse and the target characteristics. The theoreticalpredictions are verified in a specially designed experiment,where the accumulated charge has been measured in functionof the target size and the laser pulse duration and energy. Theexperimental results are presented in Sec. III. The experimentaldata are modeled in a series of numerical simulations, whichare discussed in Sec. IV. The three-dimensional particle-in-cellcode describes the hot-electron production in the laser focalspot. The subsequent propagation of the energetic electronsand their ejection from the target is modeled with a MonteCarlo code. Finally, the propagation of the ejected electrons inthe interaction chamber is described with an electromagneticparticle code. These multiscale extensive numerical simula-tions demonstrate a good agreement with the experimental dataand confirm the basic model assumptions. The conclusionsand the model predictions for several high-intensity laserinstallations are presented in Sec. V. A combination of thetheoretical model, numerical simulations, and the experiment
1539-3755/2014/89(1)/013102(15) 013102-1 ©2014 American Physical Society

J.-L. DUBOIS et al. PHYSICAL REVIEW E 89, 013102 (2014)
FIG. 1. (Color online) Scheme of the target charge and the electric field in the case of short-pulse interaction with a thick solid target. Hotelectrons are created in the laser focal spot (red zone). They are spreading in the target over the distance comparable to the mean free path (grayzone). Some of the electrons are escaping in vacuum, creating a spatial charge and preventing the electrons with the energies smaller than thetarget potential from escaping. The electrons with the energies higher than the surface potential can escape from the target, thus creating a netpositive charge at the surface.
provides a consistent explanation of target polarization andformation of the electromagnetic signal after the end of thelaser pulse.
II. A SIMPLIFIED MODEL OF CHARGE ACCUMULATIONON THE TARGET IN LASER-PLASMA INTERACTION
The energetic electrons ejected from the target are identifiedas the dominant source creating an electromagnetic radiationduring and after the end of the laser pulse [6,7]. However,the exact mechanism of the electromagnetic pulse (EMP)generation is not yet identified. It could be related withthe current associated with fast electrons escaping from thetarget [5] or with a discharge current to a positively chargedtarget. It is thus important to understand the processes leadingto the target polarization and to develop a model providing anestimate of the accumulated target charge. The scheme of thetarget charging is presented in Fig. 1 for the case where thetarget size is larger than the hot-electron mean free path.
For the laser pulses of a picosecond duration, one canneglect the charge neutralization by the electrons coming fromthe target support elements. Then the target charging processcan be described by the following steps:
(i) The laser pulse deposits its energy at the target surface.It is partially converted into the hot electrons with theconversion efficiency ηabs.
(ii) The electrons accelerated in the backward directionare ejected from the target in vacuum, thus creating a potentialdrop � in the Debye layer at the target surface. This potentialconfines the major part of escaping electrons and returns themback to the target.
(iii) The hot electrons accelerated in the forward directionexpand outside the laser focal spot. The diffusion is dominatedby the elastic collisions with ions. The collisions with the target
thermal (or bind) electrons define the hot-electron coolingtime.
(iv) The deficit of the electrons in the laser spot iscompensated with the return current of cold electrons, so thetarget remains electrically neutral.
(v) Some of scattered hot electrons are ejected from thetarget as long as their temperature remains sufficiently high.The most energetic electrons escape from the Debye layer,thus producing a net positive charge on the target. The coolingprocess defines the maximal time of the target charging.
The goal of this section is to develop a sufficiently simplequantitative model of the target charging that is capable ofpredicting the net residual charge and the charging time ofa thick target irradiated by a short intense laser pulse. Itwill be shown that the target-charging process takes a fewpicoseconds. It is much shorter than the discharge currenttime, which is defined by the impedance of the whole targetsupport ensemble. It is typically in the nanosecond time scale,as shown in Sec. III A.
A. Distribution function of hot electrons
We assume in the model that the distribution function of hotelectrons created in the laser focal spot at the target surface isdescribed by an isotropic relativistic Maxwell-Juttner function,
fh(ε) = (nh/4πAhm
3ec
3)
exp(−ε/Th),
depending on the electron energy ε = √m2
ec4 + p2c2 − mec
2.Here p is the electron momentum, nh is the hot-electrondensity, me is the electron mass, c is speed of light,
Ah(Th) = (mec)−3∫
dp p2 exp(−ε/Th)
= (Th/mec2) emec
2/ThK2(mec2/Th)
013102-2

TARGET CHARGING IN SHORT PULSE LASER-PLASMA . . . PHYSICAL REVIEW E 89, 013102 (2014)
is the normalization constant, and K2 is the modifiedBessel function of the second kind. The function Ah variesas
√π/2 (Th/mec
2)3/2 in the nonrelativistic limit, Th �mec
2, and as 2 (Th/mec2)3 in the the ultrarelativistic limit,
Th � mec2.
The exponential hot-electron distribution in energy hasbeen observed in many experiments and numerical simulationsfor laser intensities above 1016–1017 W/cm2. The angulardistribution of laser-created hot electrons could be anisotropic,but this is not the crucial element of the model. As we willdemonstrate below, the electron ejection takes place in a timescale that is longer than the electron collision time in the targetwhen the electrons are already isotropic.
The temperature of hot electrons Th created by intenselaser pulses on a surface of a solid target depends on manyparameters, such as the laser polarization, the incident angle,and so on. However, the major parameter is the square of thedimensionless laser amplitude a0, which is proportional tothe product of the laser pulse intensity Ilas and the square ofthe laser wavelength λlas. This dependence has been evaluatedin many experiments. As a rough estimate, it can be describedeither by the empirical Beg’s law [11,12] if the laser intensityis below 1018–1019 W/cm2 or by the ponderomotive scalingfor higher intensities. In the model we use the followinginterpolation:
Th0 � mec2 max
{0.47 a
2/30 ,
√1 + a2
0 − 1}, (1)
where a0 = 0.85 × 10⁻⁹λlasI1/2las , Ilas is in W/cm2, and λlas is
in microns. In the domain of interest, for the laser intensitiesof the order of 1017–1019 W/cm2 the parameter a0 varies inthe range from 0.3 to 3, and the electron temperature Th from0.1 to 1.1 MeV.
The total number of hot electrons Nh0 can be related to thelaser pulse energy by the energy conservation,
Nh0 = ηabsElas/〈εe〉, (2)
where the parameter ηabs characterizes the laser energyabsorption and
〈εe〉 = 4π
nh
∫dp p2ε fh
= mec2
[3
Th
mec2+ K1(mec
2/Th)
K2(mec2/Th)− 1
]
is the average hot-electron energy. The ratio of 〈εe〉 to Th is3/2 in the nonrelativistic limit and it increases to 3 in the limitof ultrarelativistic temperatures.
The efficiency of laser energy conversion into hot electronsdepends on the details of the acceleration process. A simpleempirical scaling ηabs ∝ I 0.266
las was proposed in Ref. [13] basedon the interpolation of the results of experiments and numericalsimulations. However, the proportionality coefficient stronglydepends on particular experimental conditions, on the targetmaterial, and on the laser prepulse. For this reason, weconsider below ηabs as an empirical parameter. According tothe numerical simulations discussed in Sec. IV, the absorptionefficiency is ∼40% in the Eclipse experiment discussed in thenext section.
B. Collisions of hot electrons
The hot electrons accelerated in the laser focal spot expandin the target. The collisions between hot electrons can beneglected, but they are scattered elastically in the collisionswith target ions and lose their energy in the collisions withcold electrons. The electron stopping length depends on theelectron energy and the target density [14]. The electron rangeRs is defined as a distance where the electrons are losing asignificant part of their energy. A convenient interpolationfor the electron range Rs was proposed in Ref. [15] asfollows:
ρtRs � 0.276 AtZ−8/9t ε5/3
e (1 + 0.978εe)5/3
× (1 + 1.957εe)−4/3 g/cm2, (3)
where the electron energy εe is in MeV, ρt is the target density,At the target atomic mass, and Zt is the atomic number. Thisexpression agrees very well with the experimental data for abroad range of target materials and for the electron energies upto a few MeV. The electron diffusion length due to the elasticscattering on ions can be expressed as Rdif = Rs/(1 + g),where the factor g = 0.187 Z
2/3t [15] is the effective ratio of
the electron-ion to electron-electron collision rates.A significant part of the laser-accelerated electrons prop-
agate inside the target. However, there is a finite probabilitythat the electrons are scattered in a collision with ions at alarge angle and are ejected from the target. The probabilityof electron backscattering rB and the characteristic angle ofejection θB are defined by the factor g as follows:
tan θB = 2.2 g (1 + g)/(1 + 2g − 0.21g2),
rB = sin2(θB/2). (4)
In particular, for a copper target used in our experiment,g = 1.76, θB = 70◦, and rB = 0.33.
It is important to make a difference between the collisionlength (3) corresponding to a monoenergetic electron beamand the mean stopping length 〈Rs〉 averaged over the electrondistribution function,
〈Rs〉 = 4π
nh
∫dp p2Rs(ε) fh.
For the case of a Maxwellian electron distribution, the meanelectron stopping length is approximately 4 times larger thanthe stopping length of an electron having the energy equal tothe temperature.
C. Temporal evolution of hot electrons
A generic laser pulse with a Gaussian temporal and spatialshape is approximated in the model with steplike distributions.The laser pulse is assumed to have the same energy at aconstant intensity Ilas over the time tlas and over the circularspot of a radius Rlas. Moreover, we consider the followingsimplified model for the temporal evolution of the hot-electrondensity and temperature. The total number of electrons inthe cloud Nh increases linearly during the laser pulse andremains constant after that, while the hot-electron temperature
013102-3

J.-L. DUBOIS et al. PHYSICAL REVIEW E 89, 013102 (2014)
(a)
(b) (c)( )
)( )()(
)(
FIG. 2. (Color online) Temporal dependence of the radius of the hot-electron cloud Rp (a), the hot-electron temperature Th (b), and thedensity, nh/nc, (c) for the cases corresponding to the Eclipse laser experiment: the laser spot diameter Dlas = 7.5 μm, λlas = 0.8 μm, a coppertarget; red lines (1): Elas = 0.1 J, tlas = 50 fs; green lines (2): Elas = 0.1 J, tlas = 400 fs; violet lines (3): Elas = 0.03 J, tlas = 50 fs. The laserenergy absorption is 40% in all cases.
Th remains approximately constant during the laser pulse,while it decreases after that. These assumptions are not toorestrictive as we are interested in the total number of ejectedelectrons but not their temporal evolution.
The temperature and density evolution are defined by thetime dependence of the radius of electron cloud Rp. Theelectron diffusion length 〈Rdif〉 = 〈Rs〉/(1 + g) was intro-duced in the previous subsection. The temporal evolution ofthe electron cloud radius can be described by the diffusionequation,
dR2p
/dt = 〈Rdif〉vh, (5)
with the average electron velocity, vh, defined as follows:
vh = 4π
nh
∫dp p2v fh = 2 T 2
h
m2ec
3Ah
(1 + Th
mec2
).
The diffusion model for the electron cloud applies after atleast one electron-ion collision time. So we assume that for thetimes shorter than tei = 〈Rdif〉/vh the electrons are expandingfreely with the velocity vh, and Eq. (5) applies for t > tei withthe initial condition Rp(t = tei) = Rlas + 〈Rdif〉. Therefore thetime dependence of the characteristic radius of electron cloudreads
Rp(t) ={
Rlas + vht if 0 < t < tei,√(Rlas + vhtei)2 + 〈Rdif〉vh(t − tei) if tei < t < tcool + tee.
(6)
These expressions are valid as long as the electron temperatureremains constant. The electron cooling is due to the electron-electron collisions. The corresponding time can be estimated astee = 〈Rs〉/vh = tei(1 + g). Then the equation for the electrontemperature evolution for t > tee reads
dTh/dt = −Th/tee. (7)
In the collisional model proposed in Ref. [15], see Sec. II B, theelectron stopping power depends on the electron temperaturein the power 5/3 in the nonrelativistic limit. Correspondingly,tee ∝ T
7/6h and the electron temperature decreases with time
as (1 − t/tcool)6/7, where tcool = (6/7)tee with tee evaluated atthe initial hot-electron temperature. In the strongly relativisticcase the electron stopping power is proportional to the squareof temperature and, correspondingly, the electron temperaturedecreases with time as (1 − t/tcool)1/2 where tcool = (3/5)tee.In the model, we integrated Eqs. (5) and (7) for t > tei(1 + g)numerically and defined tcool as the time where the elec-tron temperature drops by a factor of 100 from its initialvalue.
The volume of the electron cloud can be represented asa cylinder of radius Rp and the height xp = Rp − Rlas. Thetotal hot-electron number increases linearly during the laserpulse, and then it stays constant. Correspondingly, the time
dependence of the hot-electron density can be described asfollows:
nh = Nh0
πR2p(Rp − Rlas)
{t/tlas if 0 < t < tlas,
1 if tlas < t.(8)
Examples of temporal evolution of the hot-electron tem-perature, density, and the radius of the hot-electron cloud areshown in Fig. 2 for the parameters of the experiment discussedin the next section. The electron cooling time in this casevaries from 0.5 to 1 ps, so the hot electrons stay in the targeta long time after the end of the laser pulse. The radius ofelectron cloud increases almost linearly with time attainingthe values from 80 to 300 μm. These distances are compatiblewith the experimental observations [16] and the numericalsimulations [17], showing a fast spreading of hot electronsand the corresponding Kα emission from the target. Thehot-electron density is of the order of the critical densitync = 1.1 × 10²¹/λ2
las cm−3 during the laser pulse. However,it decreases dramatically by 3–5 orders of magnitude duringthe time of hot-electron expansion and cooling.
The assumption of a homogeneous electron density andtemperature within the cloud is certainly rather crude, but itis justified by the simplicity of the model and the comparisonpresented in Sec. IV B, with the results detailed in numerical
013102-4

TARGET CHARGING IN SHORT PULSE LASER-PLASMA . . . PHYSICAL REVIEW E 89, 013102 (2014)
simulations, which are in good agreement with the modelpredictions.
D. Electric potential of the charged zone
The electric potential � at the target surface is created bythe electrons that are escaping from the target but repelledback by the space charge. In the simplest case of a mono-energetic electron distribution, fh ∝ δ(ε − ε0), the potentialjump is equal to ε0/e and the electrons are stopped at thedistance ∼(ε0ε0/e
2nh)1/2, where ε0 is the vacuum dielectricpermittivity and e is the elementary charge. Thus escapingelectrons create a virtual cathode. No electrons escape fromthis layer.
In the case of a Maxwellian electron energy distributionthe characteristic thickness of the sheath layer is definedby the Debye length of hot electrons λDh � (ε0Th/e
2nh)1/2.According to the one-dimensional model [18–20] recalledin the appendix, the electron density decreases inverselyproportional to the square of the distance from the target,Eq. (A4), and the electrostatic potential decreases logarithmi-cally e�(x) � −2 Th ln(
√e + x/λDh
√2). This expression is
valid for a steep target density profile with the characteristicscale smaller than λDh. It may not be appropriate for pulseswith a low contrast or of a duration longer than a few ps.
The potential jump is limited in a more realistic casewhere the hot electrons are distributed within a disk ofa radius Rp. Then the potential is limited at a distancexmax ∼ Rp, and the minimum potential can be estimatedas e�min � −2 Th ln(xmax/λDh
√2). In order to account for
a possible difference between xmax and Rp in our simpli-fied model, we defined the minimum potential as e�min =−2 Th ln(c0Rp/λDh
√2) with the fitting coefficient c0 = 1.0,
which we chose from the comparison of the model with thenumerical simulations and the experiment.
The knowledge of the electrostatic potential and the hot-electron parameters allows us to calculate the current ofescaping electrons.
E. Ejection of hot electrons
The electrons with the energies ε > −e�min escape fromthe target, leaving behind a net positive charge, Q. The currentdensity of escaping electrons, jh, can be written as
jh = −e
∫d�dε p2 cos θ fh
= − enh sin2 θB
4 Ah(mec)3
∫ ∞
−e�min
p2dε e−ε/Th , (9)
where θ is the polar angle with respect to the normal totarget surface. The integral over the solid angle is takenover the angles of the electron ejection, θ < θB . The integralover the energies is taken over ε > −e�min, corresponding tothe escaping electrons. We assume that the potential �min ishomogeneous within the radius Rp, and it increases linearly tozero in the ring of the thickness of 2 λDh.
Performing the integration over the electron energiesand over the radius of the electron cloud in Eq. (9), wefind the total polarization current J . It can be written as
follows:
Jh = eπR2pnhc sin2 θB
2 Ah(Th)
(Th
mec2
)2
×{[(
1 + e|�min|Th
)(1 + Th
mec2
)+ e2�2
min
2Thmec2
]
× e−e|�min|/Th + 4λDhTh
e|�min|Rp
(1 + Th
mec2
)}. (10)
This is the basic expression in our model. It provides the valueof instantaneous current of escaping electrons. By integratingit over the time we calculate the charge accumulated on thetarget Q = ∫
Jhdt .The expression (10) can be further simplified while ne-
glecting the contribution from the Debye edge. In that case,the potential jump logarithmically depends on the size of theelectron cloud and the approximate expression for the currentreads
J � ec sin2 θB
4 c20reAh(Th)
(Th
mec2
)3[(1 + 2 ln
c0Rp
λDh
√2
)(1 + Th
mec2
)
+ 2 Th
mec2ln2 c0Rp
λDh
√2
], (11)
where re = e2/4πε0mec2 is the electron classical radius. It is
important to note that the escaping charge depends essentiallyon the hot-electron temperature and on the electron coolingtime. In contrast, the dependence on the density of hotelectrons is much weaker. The charge depends logarithmicallyon the hot-electron density and the radius of the electroncloud. In particular, in the case of nonrelativistic electrontemperatures Th � mec
2, the logarithmic term in the squarebrackets is of the order of 3–4. Therefore, the chargingcurrent depends essentially on the hot-electron temperature.According to Beg’s law (1), it depends on the laser intensityin the power 1/3. Consequently, the charging current in theweakly relativistic case is approximately proportional to thesquare root of the laser intensity. It is linearly proportional toTh0, and thus proportional to the square root of laser intensity inthe strongly relativistic limit, where the ponderomotive scalingapplies.
The charging current is approximately constant during thelaser pulse and then it gradually decreases as the hot electronscool down. The charging time is effectively the sum of thelaser pulse duration and the electron cooling time, the latterbeing of the order of a few picoseconds. The charging time iseffectively defined by the pulse duration for the case of ps laserpulses, and it is defined by the cooling time for the fs pulses.These dependencies are illustrated in Fig. 3 for the parametersof the experiment on the Eclipse laser presented in Sec. III.
Figure 3(a) shows the evolution of the potential jump inthe Debye sheath. It decreases with time because of electroncooling and expansion. However, it remains all times higherthan the hot-electron temperature shown in Fig. 2(b). Thecurrent of the escaping electrons is in the range of a fewkiloamperes in the conditions of this experiment. It decreaseswith time as the electron density decreases.
According to Fig. 3, the target charge accumulation time isdefined by the laser pulse duration in the case of a long pulse,
013102-5

J.-L. DUBOIS et al. PHYSICAL REVIEW E 89, 013102 (2014)
(a) (b) (c)
)( )( )
)()()(
(
FIG. 3. (Color online) Temporal dependence of the potential drop in the Debye sheath �min (a), the current of escaping electrons Jh (b),and the target net charge Q (c) for the cases corresponding to the Eclipse laser experiment: Dlas = 7.5 μm, λlas = 0.8 μm, a copper target;red lines (1): Elas = 0.1 J, tlas = 50 fs; green lines (2): Elas = 0.1 J, tlas = 400 fs; violet lines (3): Elas = 0.03 J, tlas = 50 fs. The laser energyabsorption is 40% in all cases.
and it is defined by the electron cooling time in the case of shortpulses. The target charge increases approximately linearly withthe laser pulse energy for a constant pulse duration, while itgradually decreases if the laser pulse duration increases for aconstant pulse energy. A weaker dependence on the laser pulseduration is explained by a more intense charging current in thecase of a longer laser pulse as the electron cooling is postponed[see Fig. 3(b)]. The charge of escaped electrons is of the orderof a few nC, which corresponds to ∼10% of the total numberof hot electrons generated in a laser target interaction.
One should make a difference among the total charge of hotelectrons, Qtot = eNh0, the net charge of escaping electrons,Q, and the electric charge of electrons trapped in the sheathlayer, Qtr. The latter creates the potential barrier, which ishigher than the average electron energy, since Rp � λDh.Therefore, the major part of the electrons is stopped thereand only a small number of suprathermal electrons mayescape. Thus, we suppose in our model that Q � Qtot. Theescaping electrons do not affect the value of �min too much,and the detailed structure of the potential barrier is notimportant for the calculation of the polarization current. Thetrapped charge can be estimated as Qtr � πR2
pσs , where thesurface charge σs = ε0Es is related to the surface electric fieldEs = −d�/dx = √
2/e Th/eλDh.It is instructive to compare the net accumulated charge
with the space charge in the sheath layer. For example, inthe case of a short laser pulse presented with red lines inFig. 3, the Debye length increases from a few microns duringthe laser pulse to about 90 μm at the time when electrontemperature decreases. The electric field at the target surfacedecreases rapidly from ∼500 kV/μm to about 2 kV/μm at thecooling time. The corresponding surface charge density σs =ε0Es decreases also by two orders of magnitude. However, thetotal charge in the Debye sheath increases up to ∼10 nC atthe time of 1.5 ps and then it decreases again as the electronsare cooling down. It is comparable with the net target chargeof 15 nC, but it is much smaller than the total charge of hotelectrons, which is of the order of 70 nC.
The charging process is slowed down in the materials witha higher electron stopping power. For example, for the sameconditions, the charge on a copper target is approximately 2times smaller than that on an aluminum one. The present modeldescribes massive targets, but it can be readily extended to thinfoils by taking into account the recirculation effect similarlyto Ref. [21].
III. TARGET POLARIZATION EXPERIMENT
A. Experimental setup
The present model is compared with a dedicated experimenton the Eclipse laser system available at CELIA. It delivers amaximum of 100 mJ on target for a pulse duration as shortas 50 fs at the wavelength of 800 nm. The temporal contrastmeasured by a third-order autocorellator is 10−7 during the 2 nspreceding the main pulse. A f# = 5 off-axis parabola is usedto focus a linearly polarized laser beam at normal incidenceon a target. The resulting focal spot presents a Gaussian shapeprofile of 7.5 μm full width at half maximum (FWHM), as canbe seen in Fig. 4(a). The high stability of a 10-Hz repetitionrate laser system [shot to shot fluctuations are 2% root meansquare (rms) in energy and 2% rms in duration] allows us tomeasure the target charge with good accuracy. In the resultspresented below each data point is averaged over five lasershots.
The model presented in Sec. II is valid for thick targetswhere the target thickness d is much larger than the range Rs ,Eq. (3), of electrons in the material: d � Rs . For this reasonwe used d = 3 mm thick copper targets, which is much largerthan the 1-mm range corresponding to 1-MeV electrons in asolid copper. We have reproduced the experiment for threedisk targets with diameters of 5, 10, and 15 mm. Each targetwas connected to the inner conductor of a coaxial cable by astraight brass wire of 0.5 mm radius. The distance betweenthe copper disk center and the target holder plate, where thecoaxial cable was fixed, was 5 cm whatever the target diameter.The target holder plate itself was connected to the ground butinsulated from the coaxial cable.
This experimental setup is presented in Fig. 4(b). Aftereach shot, electrons escaping from the target are propagatingfreely in vacuum up to the metallic experimental chamber walls50 cm away. After the electron cooling the target exhibitsa positive charge equal to the charge of escaped electrons.The specific design of the target holder allows us to measurethe neutralization current of the target by connecting thecoaxial cable to a Lecroy Wavemaster 8620A oscilloscopeof 6-GHz bandwidth. To protect the oscilloscope from a highvoltage, an attenuation of 60 dB was used. A typical form ofthe discharge current is presented in Fig. 5(a). The transferfunction of the cable and the flange set was characterizedafter the experiment. The modulus of the attenuation functionis displayed in Fig. 5(b). This attenuation was used to
013102-6

TARGET CHARGING IN SHORT PULSE LASER-PLASMA . . . PHYSICAL REVIEW E 89, 013102 (2014)
(b)(a)
FIG. 4. (Color online) (a) Averaged laser focal spot lineout from the focal spot image (inset). (b) Scheme of the experimental setup.
correct the raw data. As the characteristic does not show anydispersion, no phase correction was applied. To account forthe oscilloscope response, the following transfer function wasused:
ascope(ν) = asignal(ν) (1 + i ν/νcut)−1, (12)
where νcut = 6 GHz is the cutoff frequency.
B. Experimental results
A typical form of discharge current is displayed in Fig. 5(a).It corresponds to a shot onto a 10-mm-diameter target withan incoming energy of 80 mJ and a 50-fs pulse duration.The red solid line shows the data after processing. There isa minor difference from the raw data shown in black dots. Thecurrent waveform consists of one strong bipolar pulse withan amplitude of 40–50 A and a period of 1 ns followed by asecond pulse of a smaller amplitude. These two pulsations wererather reproducible with small fluctuations. In some shots, atthe time of 2.7 ns after the laser pulse, an overshoot of anamplitude of a few amperes was observed, as can be seen inthe inset of Fig. 5(a). Its origin could be related to a reflectedelectromagnetic signal. After the laser shot, the target acts asan antenna. It may receive the electromagnetic signal induced
by the current discharge and reflected from the chamber walls.The total charge was calculated by integration of the currentover time. To avoid biasing the charge estimate, the currentwas integrated up to 2.7 ns, as represented by the red area inFig. 5(a).
The dependence of the target charge was studied in functionof three parameters: the target diameter, the laser pulseduration, and the laser pulse energy. The measured total chargeand the maximum current amplitude are shown in Figs. 6 and 7.In the first scan, the laser pulse duration was set to 50 fs andthe laser pulse energy was varied from 10 to 100 mJ. In thesecond scan, the laser energy was kept constant at 80 mJ onthe target, whereas the duration was tuned in the range from50 to 550 fs.
The experimental points can be interpolated with simplelinear functions. The total charge increases with the laserenergy, independently of the target size. In contrast, themaximum current increases linearly with the laser energy butdecreases with the target diameter. It can be readily understoodas the larger target has a larger electric capacity and thus alarger discharge time. It is important to notice that, accordingto our measurements, the charge and the maximum currentdepend essentially on the laser energy and much less on thelaser intensity. According to Fig. 7, the total target charge
(b)(a)
FIG. 5. (Color online) (a) Typical form of the discharge current (in A) as a function of time for 80 mJ on target laser pulse of a 50-fsduration. The points (·) are the raw data and the solid (red) line is the corrected signal. The shaded (orange) area represents the target chargeobtained by integration of the current over time limited to 2.7 ns. (b) Attenuation function of the coaxial cable (in dB) in the frequency rangefrom 0.1 to 10 GHz.
013102-7

J.-L. DUBOIS et al. PHYSICAL REVIEW E 89, 013102 (2014)
(b)(a)
FIG. 6. (Color online) Dependence of the target charge [(a), in nC] and of the maximum current amplitude [(b), in A] as a function of thelaser energy on target in the range from 10 to 100 mJ. The laser pulse duration is 50 fs and the target size is 5 mm (circles, red), 10 mm (opensquares, blue), and 15 mm (triangles, black).
and the maximum current depend weakly on the laser pulseduration in the considered range from 50 to 550 fs.
According to the theoretical model presented in Sec. II,such behavior can be explained as follows. The scaling lawsof Eq. (1) predict the hot temperature increase from 120to 280 keV, while the laser energy increases from 10 to100 mJ for the laser pulse duration of 50 fs. According tonumerical solution of Eqs. (5), (7), and (10), the target chargeincreases from 2 nC at the minimum energy to approximately15 nC at the maximum energy, which is in good agreementwith the observations. The radius of the laser-heated zoneRp increases with time up to 300 μm at the time ∼2 ps,which is much smaller than the minimum target size, seeFig. 2(a). Therefore, the independence on the polarizationcharge of the target size is in agreement with the theoreticalmodel.
The model predicts the charging current amplitude up to10–15 kA, which is much higher than the measured rechargecurrent of 50 A maximum. This is also in agreement with themajor hypothesis of the model, which neglects the rechargingprocess. The characteristic recharging time of a few ns is
defined by the target size and the support assembly, whichis a product of the capacity and the impedance of the electriccircuit. The electric capacity of the copper disk is proportionalto the disk size, while the wire impedance is a constant. Thisexplains the decrease of the maximum current with the increaseof the target size.
The second series of measurements of the charge depen-dence on pulse duration has been conducted at a constant laserpulse energy, ∼0.1 J. According to the analysis of Sec. II E,the number of ejected electrons depends on the ratio betweenthe laser pulse duration and the hot-electron cooling time.These two quantities become equal for the pulse duration ofabout 0.4 ps. Correspondingly, for shorter pulse durations, theelectron cooling time is longer and the ejected charge is larger.Oppositely, for a longer pulse duration the cooling time isshort and the electrons are ejected essentially during the laserpulse. The ejected charge increases then with the laser pulseduration. Consequently, the ejected charge attains its minimumof ∼7 nC when tlas = 0.4 ps. This non-monotonous behaviorcould be a reason for the observed very weak dependence ofthe ejected charge on the laser pulse duration.
(b)(a)
FIG. 7. (Color online) Dependence of the target charge [(a), in nC] and the maximum current amplitude [(b), in A] as a function of thelaser pulse duration in the range from 50 to 500 fs. The laser pulse energy is 80 mJ and the target size is 5 mm (circles, red), 10 mm (opensquares, blue), and 15 mm (triangles, black).
013102-8

TARGET CHARGING IN SHORT PULSE LASER-PLASMA . . . PHYSICAL REVIEW E 89, 013102 (2014)
IV. NUMERICAL SIMULATIONSOF THE TARGET CHARGING
The Eclipse experiment was simulated with a suite of nu-merical codes that describe the dominant physical effects. Asthe real target size and the characteristic time are much largerthan any code would accept, the simulation was conducted infour subsequent steps. First, the effect of laser prepulse on thesolid target was simulated with the radiation hydrodynamiccode CHIVAS [22,23]. It describes the plasma formation andits expansion from the solid target surface. Then the mainlaser pulse interaction with plasma and hot-electron generationwere simulated in detail with the three-dimensional relativisticparticle-in-cell (PIC) code CALDER [24,25]. These data weretransferred in the Monte Carlo N -particle transport code(MCNP) [26] in order to model the propagation of hot electronsin the solid target and their collisions. Finally, the escape ofelectrons from the target and their propagation to the chamberelements was simulated with another PIC code, SOPHIE [27],that accounts for the target chamber geometry. Because of alarge amount of required computing time, the simulations wereconducted for a single set of parameters corresponding to thehighest laser pulse energy and the shortest pulse duration.
A. Simulation of the electron source term
The prepulse of the laser Eclipse forms a preplasma thatdefines the interaction condition for the main laser pulse. Thelaser pulse arrives on the target at normal incidence. The pre-plasma conditions were computed with the one-dimensionalradiative hydrodynamic code CHIVAS [22,23] assuming thelaser prepulse intensity 2 × 10¹¹ W/cm2 (corresponding tothe intensity contrast of 107) and a duration of 2 ns. Thelongitudinal plasma density profile along the axis x normal tothe target at the moment of the main pulse arrival was approx-imated by an exponential function, ne(x) = nc exp(−x/Lp),with Lp = 3.4 μm and the position x = 0 at the front targetsurface.
The main laser pulse interaction with the preplasma ismodeled with the PIC code CALDER 3D [24,25] in a three-dimensional geometry. Hot electrons with energies up to a fewMeV were produced by various physical processes that aredescribed in the literature [28,29]. The most important amongthem is the ponderomotive or j × B acceleration [30–33].As the CALDER simulation box is much smaller than the hot-electron mean free path, the collisions of the laser acceleratedelectrons were accounted for separately at the subsequentsimulation step.
The main laser pulse at the wavelength λlas = 0.8 μm waslinearly polarized along the y axis, with the energy at the target80 mJ, the intensity at 2 × 10¹⁸ W/cm2, the peak normalizedlaser vector potential a0 = 0.98, the spot size diameter at thehalf maximum of 8 μm, and the pulse duration at the halfmaximum tlas = 50 fs. In CALDER simulations, the temporaland radial laser profiles are assumed to be Gaussian functions.The simulations were run with a mesh size �x = �y = �z =λlas/30, 5 macroparticles per cell were used for electronsand 1 macroparticle per cell was used for ions. The CALDER
simulation box dimensions were 30 μm in the longitudinal (x)direction and 25 × 25 μm2 in the transverse (y,z) plane. The
laser pulse was injected from the left side of the simulation box.It propagates 4 μm in the vacuum and then 21 μm through theexponential density profile, increasing from 0.006 to 2.86 nc.The plasma density profile was terminated with a plateau of5 μm thickness at the density 2.86 nc.
During the simulation, the energy conservation was con-trolled by comparing the total kinetic energy gained bythe plasma particles with the total Poynting flux integral.The difference was less than 3%. The boundary conditionsfor the fields are periodic at the transverse boundaries andabsorbing at the longitudinal boundaries. For the particles,the boundaries are absorbing, provided that the total electriccharge in the domain remains zero; otherwise particles arereinjected at the thermal velocity in order to keep the totalcharge equal to zero. CALDER simulations were performed with600 processors during 50 h on the Tera100 Bull supercomputerat the CEA/DIF.
The characteristics of each macroparticle (position, velocitycomponents, and weight) related to the accelerated electronscomputed with CALDER were transferred in the Monte Carlocode MCNP 3D [26], which accounts for the collision pro-cesses of energetic electrons in the solid target in the three-dimensional geometry. They include the elastic collisions withthe target electrons and ions and also the photon production inthe Bremsstrahlung process. The latter process is not importanthere because of a very small photon conversion efficiency.About 2 × 10⁹ macroparticles were used. The simulation tookabout 17 h of the computing time on a standard monoprocessorworkstation. The minimal energy considered in the CALDER
and MCNP simulations was 50 keV in order to limit thecomputing time. The interaction was simulated during 500 fs,which is comparable but shorter than the electron cooling timeshown in Fig. 2(b).
The scheme of the CALDER-MCNP 3D simulation is repre-sented in Fig. 8(a). The electrons emitted from the CALDER
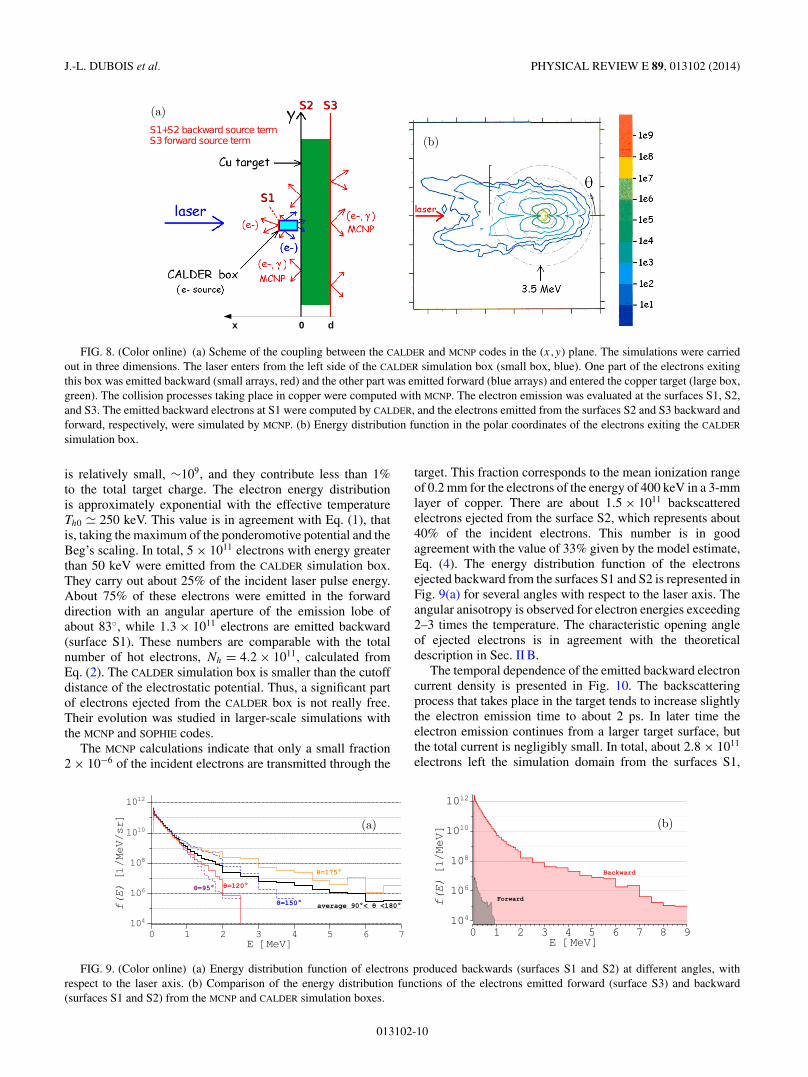
simulation box forward and backward with respect to the laserdirection were considered separately. Those emitted backwardfrom the surface S1 (red arrays) do not interact with the target,while those emitted in the forward direction (blue arrays)interact with the solid target. The collision processes that takeplace in the target were computed with the MCNP code. Thecharacteristics of electrons emitted from the backside of thetarget (surface S3) and the front side of the target (surface S2)calculated with the MCNP are discussed below. They presentthe output of this CALDER-MCNP simulation. The electronsource term thus consists of the combined contributions ofthe electrons emitted and computed with CALDER (surface S1)and with MCNP (surfaces S2 and S3).
During the interaction of the main laser pulse with theshort preplasma, 58% of the laser energy was reflected fromthe target. The preplasma thickness increases with time asthe laser pulse propagates through. Thus, the reflected pulseinteracts with a longer plasma and produces more energeticelectrons (with the energies up to ∼9 MeV) in the backwarddirection compared to the forward accelerated electrons (theenergy cutoff of ∼3.5 MeV) [24]. This can be seen in Fig. 8(b),where the distribution function of the electrons emittedfrom the CALDER box is presented in the polar coordinates(px , p⊥). As the laser pulse is weakly relativistic, the numberof these relativistic electrons with the energies above 3.5 MeV
013102-9
J.-L. DUBOIS et al. PHYSICAL REVIEW E 89, 013102 (2014)
(a)
(b)
FIG. 8. (Color online) (a) Scheme of the coupling between the CALDER and MCNP codes in the (x,y) plane. The simulations were carriedout in three dimensions. The laser enters from the left side of the CALDER simulation box (small box, blue). One part of the electrons exitingthis box was emitted backward (small arrays, red) and the other part was emitted forward (blue arrays) and entered the copper target (large box,green). The collision processes taking place in copper were computed with MCNP. The electron emission was evaluated at the surfaces S1, S2,and S3. The emitted backward electrons at S1 were computed by CALDER, and the electrons emitted from the surfaces S2 and S3 backward andforward, respectively, were simulated by MCNP. (b) Energy distribution function in the polar coordinates of the electrons exiting the CALDER
simulation box.
is relatively small, ∼109, and they contribute less than 1%to the total target charge. The electron energy distributionis approximately exponential with the effective temperatureTh0 � 250 keV. This value is in agreement with Eq. (1), thatis, taking the maximum of the ponderomotive potential and theBeg’s scaling. In total, 5 × 10¹¹ electrons with energy greaterthan 50 keV were emitted from the CALDER simulation box.They carry out about 25% of the incident laser pulse energy.About 75% of these electrons were emitted in the forwarddirection with an angular aperture of the emission lobe ofabout 83◦, while 1.3 × 10¹¹ electrons are emitted backward(surface S1). These numbers are comparable with the totalnumber of hot electrons, Nh = 4.2 × 10¹¹, calculated fromEq. (2). The CALDER simulation box is smaller than the cutoffdistance of the electrostatic potential. Thus, a significant partof electrons ejected from the CALDER box is not really free.Their evolution was studied in larger-scale simulations withthe MCNP and SOPHIE codes.
The MCNP calculations indicate that only a small fraction2 × 10−6 of the incident electrons are transmitted through the
target. This fraction corresponds to the mean ionization rangeof 0.2 mm for the electrons of the energy of 400 keV in a 3-mmlayer of copper. There are about 1.5 × 10¹¹ backscatteredelectrons ejected from the surface S2, which represents about40% of the incident electrons. This number is in goodagreement with the value of 33% given by the model estimate,Eq. (4). The energy distribution function of the electronsejected backward from the surfaces S1 and S2 is represented inFig. 9(a) for several angles with respect to the laser axis. Theangular anisotropy is observed for electron energies exceeding2–3 times the temperature. The characteristic opening angleof ejected electrons is in agreement with the theoreticaldescription in Sec. II B.
The temporal dependence of the emitted backward electroncurrent density is presented in Fig. 10. The backscatteringprocess that takes place in the target tends to increase slightlythe electron emission time to about 2 ps. In later time theelectron emission continues from a larger target surface, butthe total current is negligibly small. In total, about 2.8 × 10¹¹
electrons left the simulation domain from the surfaces S1,
(a) (b)
FIG. 9. (Color online) (a) Energy distribution function of electrons produced backwards (surfaces S1 and S2) at different angles, withrespect to the laser axis. (b) Comparison of the energy distribution functions of the electrons emitted forward (surface S3) and backward(surfaces S1 and S2) from the MCNP and CALDER simulation boxes.
013102-10

TARGET CHARGING IN SHORT PULSE LASER-PLASMA . . . PHYSICAL REVIEW E 89, 013102 (2014)
FIG. 10. (Color online) Time dependence of the current densityof electrons emitted backwards (surface S2) at different distancesfrom the laser axis obtained in the MCNP simulation.
S2, and S3. That represents a charge of 44 nC. The energydistribution of electrons transmitted in the forward direction(surface S3) and ejected backward from the surfaces S1 andS2 is presented in Fig. 9(b). The Bremsstrahlung emission isrelatively small in this case. It produces an on-axis dose ofabout 1.8 μrad (or 18 nGy) at the distance of 1 m in air.
This numerical simulation in the MCNP code gives a 4 timesbigger ejected charge than predicted by the model presentedin Sec. II. According to Fig. 3(b), for the laser pulse energyof 0.1 J, at a time of 0.5 ps, the current is about 7.5 kA, theelectron cloud radius is 120 μm, and the current density isabout 2 × 10⁷ A/cm2. This is of the same order as shown inFig. 10, although the current is more peaked in the simulationas the hot-electron density is inhomogeneous in the expandingcloud. However, the net target charge calculated in the modeland with the code are of the same order.
B. Simulation of the escaping charge
The electric fields created by escaping electrons are notaccounted for in the MCNP code. The simulations of CALDER
and MCNP alone are not sufficient for a correct estimate of theelectron charge escaped from the target. The large electrostatic
fields, produced on the target surface by the escaping electrons,were taken into account with the three-dimensional codeSOPHIE [27]. It is specially designed for calculation of thesystem generated electromagnetic pulse (SGEMP) in laser-target interactions. This is a PIC finite difference in timedomain (FDTD) code that solves the Maxwell’s equationsfor the fields and the Vlasov’s equations for the particles invacuum in a volume limited by conducting or dielectric walls.The code works with billions of macroparticles tracked onbillions of grid points with a prescribed boundary conditions.
The spectral, angular, temporal, and radial distribution ofelectrons leaving the solid target in the CALDER-MCNP boxeswas taken as the input into the SOPHIE code. Only the electronsemitted in the backward direction are considered due to thevery small fraction of transmitted electrons (2 × 10⁻⁶).The target is assumed to be a perfect electrical conductor. Thesimulation domain was limited to a few millimeters around thetarget in order to perform a discretization with a micron-sizegrid. The absorbing conditions CPML [34] were imposed onthe fields and the electrons at the external boundaries of thesimulation volume. It has a cylindrical shape with a height of2 mm and a radius of 2.5, 5, and 7.5 mm. The grid size wasvaried from 1 to 5 μm.
The profile of the electric potential distribution along theaxis x perpendicular to the target surface is represented inFig. 11(a). During the first picosecond, the potential increases,while the potential drop is localized at the target surface.The potential barrier forms after 1 ps, and it achieves themaximum of about 180 kV at the distance of 150 μm fromthe surface. The potential rising time of 2.5 ps is comparablewith the characteristic duration of hot-electron emission (2 ps)and the time of crossing the simulation volume. The electrondynamics in the sheath layer explains the delay of the potentialevolution compared to the model prediction shown in Fig. 3(a).Moreover, the comparison of the absolute value of the potentialis not appropriate, because the model does not account forthe sheath dynamics and the simulation does not accountfor the hot-electron distribution inside the target. Nevertheless,there is an agreement in the emission spot radius of 300 μmand the cooling time of 2.5 ps.
−0.7 −0.6 −0.5 −0.4 −0.3 −0.2 −0.1 0 0.
(a)
1−180
−160
−140
−120
−100
−80
−60
−40
−20
0
0 5 10 15 20 25 30 3510
0
101
102
103
104
105
(b)
FIG. 11. (Color online) (a) Potential distribution at the front side of the target during the hot-electron emission at the time moments of 1,1.1, 1.5, 2.5, 3.5, and 4.5 ps. The calculations with the code SOPHIE for the laser energy of 80 mJ and the pulse duration of 50 fs. (b) Timedependence of the electric current of escaping electrons collected at a distance of 1 mm from the target. Three simulations with the targets radii2.5, 5, and 7.5 mm are shown. The dashed line shows the electric current extracted from the CALDER-MCNP boxes considered as a source term.
013102-11

J.-L. DUBOIS et al. PHYSICAL REVIEW E 89, 013102 (2014)
0 0.5 1 1.5 2 2.5 3 3.510
−10
10−9
10−8
10−7
10−6
10−5
0 5 10 15 20 25 300
2
4
6
8
10
12
14
16(a) (b)
FIG. 12. (Color online) Surface charge density distribution over the front side of the target simulated with the SOPHIE code. The targetradius is 5 mm, the pulse energy is 80 mJ, and the pulse duration is 50 fs. (b) Time dependence of the net surface charge obtained by integrationof the surface charge density.
The electrons, which have escaped from the target, werecollected at the boundary at the distance of 1 mm parallelto the target surface. This distance is sufficiently large forcounting the electrons that have indeed escaped and will notbe repelled back to the target. The electron current in functionof time is presented in Fig. 11(b). Three simulations with thetargets radii 2.5, 5, and 7.5 mm were performed with almostidentical results. Thus, the escaped current does not dependon the size of the target for the considered conditions. Thisconfirms the experimental observation that the accumulatedcharge does not depend on the target radius.
The potential at the target surface decreases with time after4.5 ps because of the cooling of hot electrons. The delayof 3.5 ps is the time of propagation of the 1-mm distancefrom the target to the recording surface. The electron currentachieves the maximum of about 1 kA at the time of 7 ps. Thetime delay of the maximum of electron emission of 3.5 psis comparable with the electron cooling time of 1.5 ps inthe model presented in Sec. II. As shown with the dashedcurve in Fig. 11(b), almost all electrons are emitted in 2–3 ps.
The integration over the time gives an escaping charge of10 nC. That represents one fourth of the emitted electrons, andit agrees rather well with the target charge measured in theexperiment.
The current emission time of 7 ps is rather short to beaffected by the boundary effect of the expansion of the positivecharge over the target surface. As it is shown in Fig. 12(a),the radius of the positively charged zone increases with timealmost linearly. The characteristic velocity is comparablewith the hot-electron mean velocity. The essential charge islocalized inside a radius of about 0.3 mm, corresponding tothe emission surface defined by the electron range in the target,which is comparable with the electron cloud radius shown inFig. 2(a) and with the mean hot-electron path 〈Rs〉 � 300 μmfor the hot-electron temperature of 270 keV in a copper target.Thus, the accumulated charge should not depend on the targetsize for targets larger than 1 mm. That implies that the chargeaccumulated on targets with radius smaller than 0.5 mm couldbe less than the one calculated here. This charge builds upduring the emission time of 3–5 ps [see Fig. 12(b)]. It rises to
0 1 2 3 4 5−40
−20
0
20
40
60
80(a) (b)
FIG. 13. (Color online) (a) Simulation of the current at the bottom of the target assembly in the Eclipse chamber. Calculation with theSOPHIE code: the target radius is 5 mm, the laser pulse energy 80 mJ, and the pulse duration 50 fs. The current is collected at an effective 50-�resistance. (b) Comparison of the current wave form between the simulations and the experimental data.
013102-12

TARGET CHARGING IN SHORT PULSE LASER-PLASMA . . . PHYSICAL REVIEW E 89, 013102 (2014)
14 nC and then decreases to an asymptotic value ∼10.5 nC asthe charged zone continues to expand. The maximum chargedensity of 8 μC/cm2 shown in Fig. 12(a) corresponds to theelectric field at the target surface ∼100 MV/cm. This chargedensity multiplied by the emission surface ∼πR2
p ∼ 0.1 mm2
gives the total charge of 10 nC. These values are also in goodagreement with the model.
We computed also with the SOPHIE code the rechargeelectric current measured at the bottom of our target assembly.The simulation handles the target in a simplified geometryof the Eclipse chamber of the total volume 1 m3. The gridsize in that case is 1 mm. A connection of the target to thecable is simulated by a 50-� resistance between the stick andthe pedestal, as shown in Fig. 13(a). As we cannot mesh thewhole domain inside the chamber (more than 1 m) with asufficient discretization of the space charge on the target, therecharge current was calculated with the SOPHIE code usingthe target charge evaluated during the electron emission phaseshown in Fig. 12(b). The initial emission spectrum (the sourceterm in Fig. 9) is filtered by the potential barrier (180-keVcutoff). The comparison of the calculated current wave formwith the experimental results in Fig. 13(b) shows a very goodagreement.
V. CONCLUSIONS
A model of target polarization due to the hot-electronejection from the laser irradiated spot is presented. Thecharge is accumulated as the electrons heated in laser plasmainteraction are leaving the target. The ejection time variesfrom a few ps for the case of subpicosecond laser pulses to afew tens of ps for longer picosecond laser pulses. This timeis defined by the cooling time of hot electrons in Coulombcollisions with the target electrons and ions. Therefore, theaccumulated charge depends on the target material, and itdecreases as the target density increases. The effective sizeof the charged zone is much larger than the laser focal spot.It is a few times larger than the hot-electron mean free pathin the target. Therefore, the targets with a size smaller than〈Rs〉 accumulate smaller charge, while it is independent ofthe size for larger targets. The accumulated charge dependsstrongly on the hot-electron energy and thus on the laserintensity.
The target charge is measured experimentally by measuringthe discharge current through the coaxial cable connecting thetarget to the ground. The duration of the discharge currentis of the order of a few ns. It is defined by the impedanceof the target assembly and the target support. It is muchlonger than the charging time, which does not exceed a fewps for our experimental conditions. That fact confirms themajor hypothesis of the model, which neglects the dischargecurrent from the target support. The observed dependenceof the accumulated charge on the laser pulse energy andduration can be explained qualitatively with the model andwith the numerical simulations. However, some quantitativedifferences need further analysis.
The experiment has been modeled in a series of numericalsimulations that describe the laser-target interaction and hot-electron production, the electron spreading in the target,and the electron propagation through the vacuum chamber
to the conducting boundaries. Although the overall size ofthe simulation box (about a few millimeters) is smallerthan the real experimental chamber, the major quantitativecharacteristics of the charging process are successfully de-scribed. The hot electrons contain a significant part of thelaser pulse energy (25–50% depending on the interactionconditions) and the dominant part has an almost isotropicenergy distribution with the exponential energy distribution.The characteristic electron temperature for the chosen laserintensity agrees well with the ponderomotive and Beg’s scalinglaws. The electron ejection from the target continues forabout 1–2 ps, which is much longer than the laser pulseduration. The duration of the electron emission is defined bythe process of hot-electron cooling in the electron-electroncollisions. The electron emission process is inhibited by theformation of a potential barrier (of a virtual cathode) that repelselectrons and suppresses the emission process. The potentialbarrier amplitude is comparable to the hot-electron initialtemperature.
The model of the target polarization successfully explainsalso the data from the experiments with the picosecondlaser pulses with the energies of hundreds of joules. Themodel predictions for several other experiments with higherlaser-pulse energies are presented in Table I. In the experimentswith the Titan and Omega EP lasers at the energy levelof a few hundred joules and a picosecond pulse duration,the estimated charge is of a few μC. These numbers arein a reasonable agreement with the measured data and thesimulation results [5–7], however, as the Omega EP pulseduration is rather long, our hypothesis of a steep targetdensity profile might not be appropriate. Nevertheless, acomparison with the available measurements shows that themodel accounts for the major effects that define the targetpolarization in high-intensity laser-plasma experiments. Itprovides us with an estimate for the polarization effect in thefuture experiments with the Petal laser system [35], which willdeliver a power of 2 PW at the intensity of ∼1020 W/cm2. It isexpected that in the interaction with a copper target the chargecould be about 20 μC, and the hot electrons may spread overa few cm from the laser spot. The charging time of 200 psis already comparable with the discharge time. This time canbe exagerated in our simple model, which does not accountfor collective energy losses of hot electrons. That effect canbe significant at high laser pulse intensities if the hot-electroncurrent density exceeds 1012 A/cm2 [36].
The model of charge polarization suggests methods ofcontrol of the charging process by choosing the target material,the size, and the support. The charging process also shedsthe light on the emission of electromagnetic signal fromthe target. Two distinct sources of electromagnetic emissioncan be readily identified. The first one is related to thecharging process. The electromagnetic pulse is emitted bythe bunch of electrons ejected from the target. The electronbunch duration of a few ps corresponds to the frequencyrange of the order of a THz or a few tenths of a THz.The second pulse of a ns duration and in the frequencyrange below a few GHz is due to the discharge currentthrough the target support. The detailed characteristics ofthis second electromagnetic pulse depend on the target andchamber geometry.
013102-13

J.-L. DUBOIS et al. PHYSICAL REVIEW E 89, 013102 (2014)
TABLE I. Thick target polarization characteristics for several sets of experimental parameters. The laser-to-electron conversion efficiencyis 40%, c0 = 1.0.
Facility
Parameter Eclipse 1 Eclipse 2 Eclipse 3 Titan Omega EP Petal
Wavelength, λlas, μm 0.8 0.8 0.8 1.05 1.05 1.05Pulse duration FWHM, tlas, ps 0.05 0.40 0.05 2.0 9.0 0.5Pulse energy, Elas, J 0.1 0.1 0.03 200 950 1000Focal spot FWHM, μm 7.5 7.5 7.5 20 25 50Laser int., Ilas, 1018 W/cm2 2.95 0.37 0.88 20.7 14 66Laser amplitude, a0 1.17 0.41 0.64 4.1 3.3 7.3
Target material Copper Copper Copper Aluminum Tantalum CopperElectron temperature Th0, keV 276 133 179 1630 1280 3250Maximum potential |�min|, kV 1650 820 1000 9800 8800 20000Total charge of electrons, Qtot 68 nC 159 nC 34 nC 18 μC 110 μC 43 μCCooling time, tcool, ps 1.07 0.38 0.57 62 9.6 84e-i collision time, tei , ps 0.58 0.19 0.29 57 4.2 59Radius of electron dist. Rp , mm 0.30 0.08 0.13 30 3.1 37Target charge–model, Q 15.7 nC 3.9 nC 5.2 nC 6.0 μC 3.7 μC 21 μCTarget charge–simulation, Q 10.0 nC 1.2 μCMax. current, Jh, kA 16 6.1 8.5 120 170 300
ACKNOWLEDGMENTS
This work is partly supported by the EURATOM withinthe “Keep-in-Touch” activities and the Aquitaine RegionalCouncil. We acknowledge the financial support from theFrench National Research Agency (ANR) in the frame of“the Investments for the future” Programme IdEx Bordeaux-LAPHIA (ANR-10-IDEX-03-02).
APPENDIX: ONE-DIMENSIONAL MODELOF THE ELECTRON DEBYE SHEATH
Following Ref. [18], we consider a semi-infinite stationaryplasma with cold ions having a steplike density profile,
ni(x) ={n0 if x < 0,
0 if x > 0.(A1)
The electrons having the temperature T are distributed nearthe plasma boundary according to the Boltzmann law, ne =n0exp(e�/T ), in the self-consistent electrostatic potential �.The latter is defined by the Poisson equation
ε0d2�
dx2= en0
{exp(e�/T ) − 1 if x < 0,
exp(e�/T ) if x > 0.(A2)
It has to be solved with the asymptotic condition � → 0 atx → −∞, corresponding to the plasma neutrality far fromthe boundary, and d�/dx → 0 at x → ∞, correspondingto the zero electric field far from the plasma and requiringthe continuity of the potential and its first derivative at theboundary x = 0.
It is convenient to introduce the dimensionless potentialφ = e�/T and to normalize the coordinate x = ξλD by theDebye length λD = (ε0T/e2n0)1/2. Then the first integral of thePoisson equation (A2) outside the plasma reads (φ′)2 = 2 eφ .
The choice of the integration constant corresponds to the factthat φ and φ′ are negative, and φ diverges at infinity, φ → ∞at x → ∞. Integrating once more this equation, we find thepotential outside the plasma,
φ(x > 0) = −2 ln(b0 + ξ/√
2). (A3)
The integration constant b0 will be defined from the potentialcontinuity at the boundary.
The first integral of the Poisson equation (A2) insidethe plasma reads (φ′)2 = 2(eφ − φ − 1). The choice of theconstant corresponds to the boundary condition at x → −∞.Equating the potential derivatives at the boundary for the innerand outer solutions, we find readily the value of the potential,φ(0) = −1, and then the value of the integration constantb0 = √
e follows from Eq. (A3).In the dimensional units the expressions for the electric
potential and plasma density outside the plasma, x > 0, readas follows:
e�(x > 0) = −2 T ln(√
e + x/λD
√2),
ne = n0(√
e + x/λD
√2)−2. (A4)
One can obtain also the expression for the electric field atthe boundary Es = (2/e)1/2T/eλD , which corresponds to thecharge surface density σs = ε0Es = (2ε0n0T/e)1/2.
The electron density distribution at the plasma surface hasbeen calculated in the paper by Crow et al. [18] and Carronand Longmire [19]. However, Carron and Longmire did notaccount for the field penetration inside the plasma. Therefore,their solution with b0 = 1 does not account for the plasmacharge neutrality.
013102-14

TARGET CHARGING IN SHORT PULSE LASER-PLASMA . . . PHYSICAL REVIEW E 89, 013102 (2014)
[1] A. G. MacPhee, K. U. Akli, F. N. Beg, C. D. Chen, H. Chen,R. Clarke, D. S. Hey, R. R. Freeman, A. J. Kemp, M. H. Key,J. A. King, S. Le Pape, A. Link, T. Y. Ma, H. Nakamura, D. T.Offermann, V. M. Ovchinnikov, P. K. Patel, T. W. Phillips, R. B.Stephens, R. Town, Y. Y. Tsui, M. S. Wei, L. D. Van Woerkom,and A. J. Mackinnon, Rev. Sci. Instrum. 79, 10F302 (2008).
[2] S. J. Gitomer, R. D. Jones, F. Begay, A. W. Ehler, J. F. Kephart,and R. Kristal, Phys. Fluids 29, 2679 (1986).
[3] A. Macchi, M. Borghesi, and M. Passoni, Rev. Mod. Phys. 85,751 (2013).
[4] P. Gibbon, Short Pulse Laser Interactions with Matter (ImperialCollege Press, London 2005).
[5] M. J. Mead, D. Neely, J. Gauoin, R. Heathcote, and P. Patel,Rev. Sci. Instrum. 75, 4225 (2004).
[6] C. G. Brown Jr., A. Throop, D. Eder, and J. Kimbrough, J. Phys.Conf. Ser. 112, 032025 (2008).
[7] D. C. Eder, A. Throop, C. G. Brown Jr., J. Kimbrough, M. L.Stowell, D. A. White, P. Song, N. Back, A. MacPhee, H. Chen,W. DeHope, Y. Ping, B. Maddox, J. Lister, G. Pratt, T. Ma,Y. Tsui, M. Perkins, D. O’Brien, and P. Patel, Lawrence Liver-more National Laboratory Report LLNL-TR-411183 (2009).
[8] F. S. Felber, Appl. Phys. Lett. 86, 252501 (2005).[9] Chen et al., Phys. Plasmas 19, 113116 (2012).
[10] C. G. Brown Jr., E. Bond, T. Clancy, S. Dangi, D. Eder,W. Ferguson, J. Kimbrough, and A. Throop, J. Phys. Conf. Ser.244, 032001 (2010).
[11] F. N. Beg, A. R. Bell, A. E. Dangor, C. N. Danson, A. P.Fews, M. E. Glinsky, B. A. Hammel, P. Lee, P. A. Norreys, andM. Tatarakis, Phys. Plasmas 4, 447 (1997).
[12] M. G. Haines, M. S. Wei, F. N. Beg, and R. B. Stephens,Phys. Rev. Lett. 102, 045008 (2009).
[13] R. P. J. Town, C. Chen, L. A. Cottrill, M. H. Key, W. L. Kruer,A. B. Langdon, B. F. Lasinski, R. A. Snavely, C. H. Still,M. Tabak, D. R. Welch, and S. C. Wilks, Nucl. Instrum. &Methods A 544, 61 (2005).
[14] J. D. Jackson, Classical Electrodynamics (Wiley, New York,1975).
[15] K. Kanaya and S. Okayama, J. Phys. D: Appl. Phys. 5, 43(1972).
[16] H. Chen, R. Shepherd, H. K. Chung, A. Kemp, S. B. Hansen,S. C. Wilks, Y. Ping, K. Widmann, K. B. Fournier, G. Dyer,A. Faenov, T. Pikuz, and P. Beiersdorfer, Phys. Rev. E 76, 056402(2007).
[17] V. M. Ovchinnikov, G. E. Kemp, D. W. Schumacher, R. R.Freeman, and L. D. Van Woerkom, Phys. Plasmas 18, 072704(2011).
[18] J. E. Crow, P. L. Auer, and J. E. Allen, J. Plasma Phys. 14, 65(1975).
[19] N. J. Carron and C. L. Longmire, IEEE Trans. Nucl. Sci. 23,1986 (1976).
[20] M. Passoni, V. T. Tikhonchuk, M. Lontano, and V. Yu.Bychenkov, Phys. Rev. E 69, 026411 (2004).
[21] J. Myatt, W. Theobald, J. A. Delettrez, C. Stoeckl, M. Storm,T. C. Sangster, A. V. Maximov, and R. W. Short, Phys. Plasmas14, 056301 (2007).
[22] S. Jacquemot and A. Decoster, Laser Part. Beams 9, 517(1991).
[23] C. Courtois, A. Compant La Fontaine, O. Landoas, G. Lidove,V. Meot, P. Morel, R. Nuter, E. Lefebvre, A. Boscheron,J. Grenier, M. M. Aleonard, M. Gerbaux, F. Gobet, F. Hannachi,G. Malka, J. N. Scheurer, and M. Tarisien, Phys. Plasmas 16,013105 (2009).
[24] E. Lefebvre, N. Cochet, S. Fritzler, V. Malka, M. M. Aleonard,J. F. Chemin, S. Darbon, L. Disdier, J. Faure, A. Fedotoff,O. Landoas, G. Malka, V. Meot, P. Morel, M. Rabec LeGloahec, A. Rouyer, Ch. Rubbelynck, V. Tikhonchuk,R. Wrobel, P. Audebert, and C. Rousseaux, Nucl. Fusion 43,629 (2003).
[25] A. Compant La Fontaine, C. Courtois, and E. Lefebvre,Phys. Plasmas 19, 023104 (2012).
[26] M. L. Fensin, J. S. Hendricks, and S. Anghaie, J. Nucl. Sci.Technol. 170, 68 (2010).
[27] O. Cessenat, arXiv:1301.4539; CHOCS - Revue scientifiqueet technique de la Direction des applications militaires, N 44,p. 25 (2013).
[28] A. Pukhov, Rep. Prog. Phys. 66, 47 (2003).[29] M. I. K. Santala, E. Clark, I. Watts, F. N. Beg, M. Tatarakis,
M. Zepf, K. Krushelnick, A. E. Dangor, T. McCanny, I. Spencer,R. P. Singhal, K. W. D. Ledingham, S. C. Wilks, A. C. Machacek,J. S. Wark, R. Allott, R. J. Clarke, and P. A. Norreys, Phys. Rev.Lett. 84, 1459 (2000).
[30] W. L. Kruer and K. Estabrook, Phys. Fluids 28, 430 (1985).[31] G. Malka and J. L. Miquel, Phys. Rev. Lett. 77, 75 (1996).[32] S. C. Wilks, W. L. Kruer, M. Tabak, and A. B. Langdon,
Phys. Rev. Lett. 69, 1383 (1992).[33] A. Pukhov and J. Meyer-ter-Vehn, Phys. Plasmas 5, 1880
(1998).[34] G. Liu and S. Gedney, Microwave Opt. Technol. Lett. 25, 8
(2000).[35] http://petal.aquitaine.fr/[36] B. Vauzour, J. J. Santos, A. Debayle, S. Hulin, H.-P. Schlenvoigt,
X. Vaisseau, D. Batani, S. D. Baton, J. J. Honrubia, Ph. Nicolaı,F. N. Beg, R. Benocci, S. Chawla, M. Coury, F. Dorchies,C. Fourment, E. d’Humieres, L. C. Jarrot, P. McKenna, Y. J.Rhee, V. T. Tikhonchuk, L. Volpe, and V. Yahia, Phys. Rev. Lett.109, 255002 (2012).
013102-15
Related Documents


