TAP Research Summary Examining the Evidence for the Impact of TAP: The System for Teacher and Student Advancement March 2016

Welcome message from author
This document is posted to help you gain knowledge. Please leave a comment to let me know what you think about it! Share it to your friends and learn new things together.
Transcript

TAP Research Summary
Examining the Evidence for the Impact of TAP: The System for Teacher and Student Advancement
March 2016

National Institute for Excellence in Teaching
2
TAP Research Summary
Table of Contents
NIET Mission .......................................................................................................................................................... 4 TAP: The System for Teacher and Student Advancement Description ................................................................ 4 Educator Effectiveness Best Practices Center Description ................................................................................... 5
NIET Initiative Comparisons and Results ................................................................................................................ 5 TAP System Evaluation Methods Compared to Traditional Evaluation Methods ................................................ 5 TAP Teachers Demonstrate Consistent Improvement across Time ..................................................................... 7
TAP Impact in Schools and Districts ....................................................................................................................... 8
Results from Prior Selected Studies of TAP’s Impact .............................................................................................. 8
Results from New Selected Studies of TAP’s Impact ............................................................................................ 10 Orangeburg Consolidated School District Three, South Carolina ...................................................................... 10 Student Achievement Gaps in Indiana ............................................................................................................... 12 Measurement Stability of TAP Rubric and Alignment with Value-Added .......................................................... 13
National TAP Attitude Survey - 2015 .................................................................................................................... 15 Teacher Results -2015 TAP Attitude Survey ....................................................................................................... 15 Principal Results -2015 TAP Attitude Survey ...................................................................................................... 18
Upcoming Projects ............................................................................................................................................... 19 Facilitating Dialogues – Voices from Teachers and Administrators ................................................................... 19 Connecting Teacher Preparation to Teacher Practice through University-District Partnerships ....................... 19
Conclusion ........................................................................................................................................................... 20
Acknowledgements ............................................................................................................................................. 21
About the Authors ............................................................................................................................................... 21
References ........................................................................................................................................................... 22
National Institute for Excellence in Teaching
3
Table of Figures
Figure 1. Traditional teacher evaluation scores.................................................................................................... 6 Figure 2. Observational ratings of teachers in TAP schools. ................................................................................. 6 Figure 3. Teacher instructional improvement across time. .................................................................................. 7 Figure 4. Student achievement growth by TAP System status. ............................................................................ 8 Figure 5. OGB3 teacher effectiveness, by year ................................................................................................... 11 Figure 6. Changes in achievement gaps, compared with propensity score matched controls. ......................... 13 Figure 7. Classroom observation instrument correlations with value-added measures .................................... 14 Figure 8. Level of reported collegiality from teachers in TAP schools nationwide. ............................................ 15 Figure 9. Level of reported support for multiple career paths from teachers nationwide. ............................... 16 Figure 10. Level of reported support for applied professional growth from teachers nationwide. ................... 17 Figure 11. Level of reported support for instructionally focused accountability from teachers nationwide. ... 17 Figure 12. Level of reported support for performance-based compensation from teachers nationwide. ........ 18 Figure 13. Principal survey results on TAP outcomes in their schools ................................................................ 18 Figure 14. “The implementation of TAP has helped retain effective teachers at my school.” ........................... 19
Table of Tables
Table 1. Percent of OGB3 students meeting or exceeding EOC standard, relative to comparable schools from South Carolina report card ................................................................................................................................. 11 Table 2. Percent of OGB3 students meeting or exceeding assessment standard, relative to comparison schools ................................................................................................................................................................ 12 Table 3. Correlations of SKR across school years ................................................................................................ 13
National Institute for Excellence in Teaching
4
Researchers at NIET and elsewhere have studied the effectiveness of TAP: The System for Teacher and Student Advancement (TAP) in raising student achievement, improving the quality of instruction, and increasing the ability of high-need schools to recruit, retain and support effective teachers. This document describes some of the most recent results that have emerged from the research on the TAP System to date. Data collection and analysis efforts are ongoing, and the findings described here will be updated periodically as information becomes available.
NIET Mission
Recognizing that an effective teacher is the most important school-based factor impacting student achievement (Darling-Hammond, 2006; Goldhaber, 2002; Hanushek, 2013; Headden, 2014; Rivkin, Hanushek, & Kain, 2005; Simon & Johnson, 2013; TNTP, 2012), NIET is committed to ensuring a highly skilled, strongly motivated, and competitively compensated teacher for every classroom in America. NIET supports states, districts and schools in recruiting, developing, supporting, and retaining high-quality human capital in order to raise achievement levels for all students (National Institute for Excellence in Teaching, 2015). NIET provides both on-site and online support across multiple aspects of educator effectiveness through educator evaluation, professional development and teacher leadership. This support is delivered both on-site and online through the comprehensive TAP™: The System for Teacher and Student Advancement (TAP) and customizable Educator Effectiveness Best Practices Center (BPC). As of the 2015-16 school year, NIET initiatives are impacting over 200,000 educators and more than 2.5 million students.
TAP: The System for Teacher and Student Advancement Description
Introduced in 1999, “the TAP System has grown significantly as a comprehensive educator evaluation and support model for increasing educator effectiveness” (National Institute for Excellence in Teaching, 2015, p. 4). The TAP System creates multiple career paths for teachers, provides ongoing applied professional development using a rigorous rubric of evaluation, and provides performance-based compensation to teachers and administrators. Each of these core elements is discussed below. For more information, visit www.niet.org.
Multiple career paths. In TAP schools, skilled teachers have the opportunity to serve as master and mentor teachers, receiving additional compensation for providing high levels of support to career teachers and increasing instructional effectiveness across the faculty. Master and mentor teachers form a leadership team, along with administrators, to deliver school-based professional support and conduct evaluations with a high level of expertise.
Ongoing applied professional growth. Led by master and mentor teachers, TAP teachers participate in weekly meetings where they examine student data, engage in collaborative planning, and learn instructional strategies that have been field-tested in their own schools. Teachers benefit from a national TAP database of instructional strategies and their colleagues' experiences. Professional development continues in the classroom as master teachers model lessons, observe classroom instruction, and support teachers’ pedagogical improvement.
Instructionally focused accountability. TAP teachers are observed in classroom instruction several times a year by multiple trained observers, including principals and master and mentor teachers, using rubrics for several dimensions of instructional effectiveness. Evaluators are trained and certified, and leadership teams monitor the reliability and consistency of evaluations in their schools. These classroom evaluations are complemented by analyzing student achievement growth, rounding out a multi-measure system of teacher evaluation.
National Institute for Excellence in Teaching
5
Evaluation results are used as formative feedback in one-on-one mentoring sessions, and guide planning for individualized professional development.
Performance-based compensation. TAP teachers have the opportunity to earn annual bonuses based on their observed skills, knowledge, and responsibilities, their students’ average achievement growth, and school-wide achievement growth. Master and mentor teachers receive additional compensation based on their added roles and responsibilities, and principals can earn additional compensation based on school-wide achievement growth and other measures of effectiveness.
Educator Effectiveness Best Practices Center Description
The NIET Educator Effectiveness Best Practices Center provides innovative services, support, and solutions to schools, districts, and states to improve educator effectiveness. Based on more than a decade of experience in schools across the country, NIET works with its partners to redesign educator evaluation, deliver effective professional development, implement performance-based compensation systems, and train teacher leaders in schools. The BPC offers a network of expert trainers and access to a range of innovative Web-based resources and tools. For more information, visit www.niet.org/best-practices-center/services/.
NIET Initiative Comparisons and Results
Since 1999, the TAP System of comprehensive educator effectiveness has operated across multiple states in hundreds of schools. TAP has grown steadily in the number of schools participating, the majority of which are high-needs schools (over 90% of participating schools). In addition to schools and districts implementing the full TAP System, a number of states, districts, and schools are using TAP System core elements – in particular, the online portal which houses hundreds of hours of effective teaching across subjects and grade levels, the TAP teacher observational rubric, and the certification and recertification process for educator evaluators.
TAP System Evaluation Methods Compared to Traditional Evaluation Methods To improve the quality of classroom instruction, the quality of each teacher’s instruction must be assessed. Traditional school systems have not been successful at measuring and assessing classroom instruction. The New Teacher Project (TNTP) published a revealing report in 2009 showing that schools fail to evaluate their teachers in any meaningful way (Weisberg, Sexton, Mulhern, & Keeling, 2009). As TNTP reported, most teachers were rated at the very highest levels (replicated as Figure 1 below), despite the fact that most schools were not performing at these highest levels on achievement indicators. A 2014 report from the National Council on Teacher Quality (NCTQ, 2014) indicated that while improvements in educator evaluation have occurred since the 2009 report, still many of the same problems persist. Given that differences in teacher effectiveness represent the single most important school-related factor affecting student learning, accurately measuring differences in teacher performance is critical to the improvement of teaching and learning.

National Institute for Excellence in Teaching
6
Figure 1. Traditional teacher evaluation scores.1
In contrast to traditional evaluation methods noted above in Figure 1, the TAP System has developed a comprehensive approach to teacher evaluation and incentives that depends on multiple measures of both teaching practice and teaching outcomes. This system provides differentiated feedback for teacher improvement, in contrast to the often found inflated ratings found in evaluation systems (see Figure 2).
Note: Teacher Skills, Knowledge, and Responsibilities distribution of TAP evaluations using 1-5 scale in
half-point increments. Figure based on 13,891 teachers and approximately 55,564 observations, 2013-14.
Figure 2. Observational ratings of teachers in TAP schools.
1 Teacher evaluations in five urban school districts, based on data taken from http://widgeteffect.org/downloads/TheWidgetEffect.pdf. Scores on 3-point and 4-point scales have been interpolated to a 5-point scale using a cumulative probability density function based on reported data.
0%
10%
20%
30%
40%
50%
60%
70%
Lowest Ratings Middle Ratings Highest Ratings
Percent of Teachers
Teacher Evaluation Rating
National Institute for Excellence in Teaching
7
The above ratings are based only on the classroom evaluation component of the TAP System, before considering student learning growth measures. Teachers are observed several times a year by multiple trained and certified raters who consider 19 areas of effective instructional practice. These observers use a multi-dimensional, research-based set of standards and rubrics that are fair, transparent, and curriculum-independent. Results are provided immediately as feedback to the teacher in post-observation mentoring sessions. The scores from all observations of these 19 classroom indicators are combined with seven responsibility indicators at the end of the school year to create an overall Skills, Knowledge, and Responsibilities (SKR) score for each teacher. On a scale of 1.0 to 5.0, 1 represents unsatisfactory performance on a certain standard, 3 represents proficiency on that standard, and 5 represents exemplary performance on that standard. Teachers earn scores in increments of 0.5.
TAP Teachers Demonstrate Consistent Improvement across Time
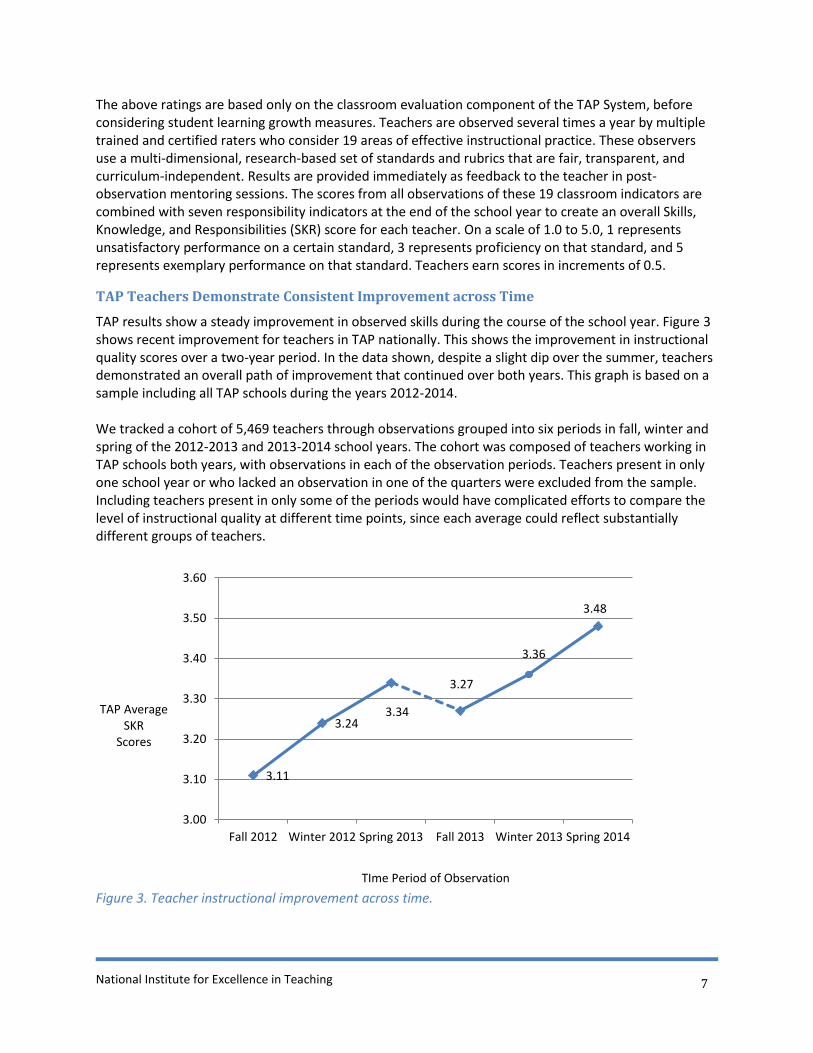
TAP results show a steady improvement in observed skills during the course of the school year. Figure 3 shows recent improvement for teachers in TAP nationally. This shows the improvement in instructional quality scores over a two-year period. In the data shown, despite a slight dip over the summer, teachers demonstrated an overall path of improvement that continued over both years. This graph is based on a sample including all TAP schools during the years 2012-2014. We tracked a cohort of 5,469 teachers through observations grouped into six periods in fall, winter and spring of the 2012-2013 and 2013-2014 school years. The cohort was composed of teachers working in TAP schools both years, with observations in each of the observation periods. Teachers present in only one school year or who lacked an observation in one of the quarters were excluded from the sample. Including teachers present in only some of the periods would have complicated efforts to compare the level of instructional quality at different time points, since each average could reflect substantially different groups of teachers.
Figure 3. Teacher instructional improvement across time.
3.11
3.243.34
3.27
3.36
3.48
3.00
3.10
3.20
3.30
3.40
3.50
3.60
Fall 2012 Winter 2012 Spring 2013 Fall 2013 Winter 2013 Spring 2014
TAP Average SKR
Scores
TIme Period of Observation
National Institute for Excellence in Teaching
8
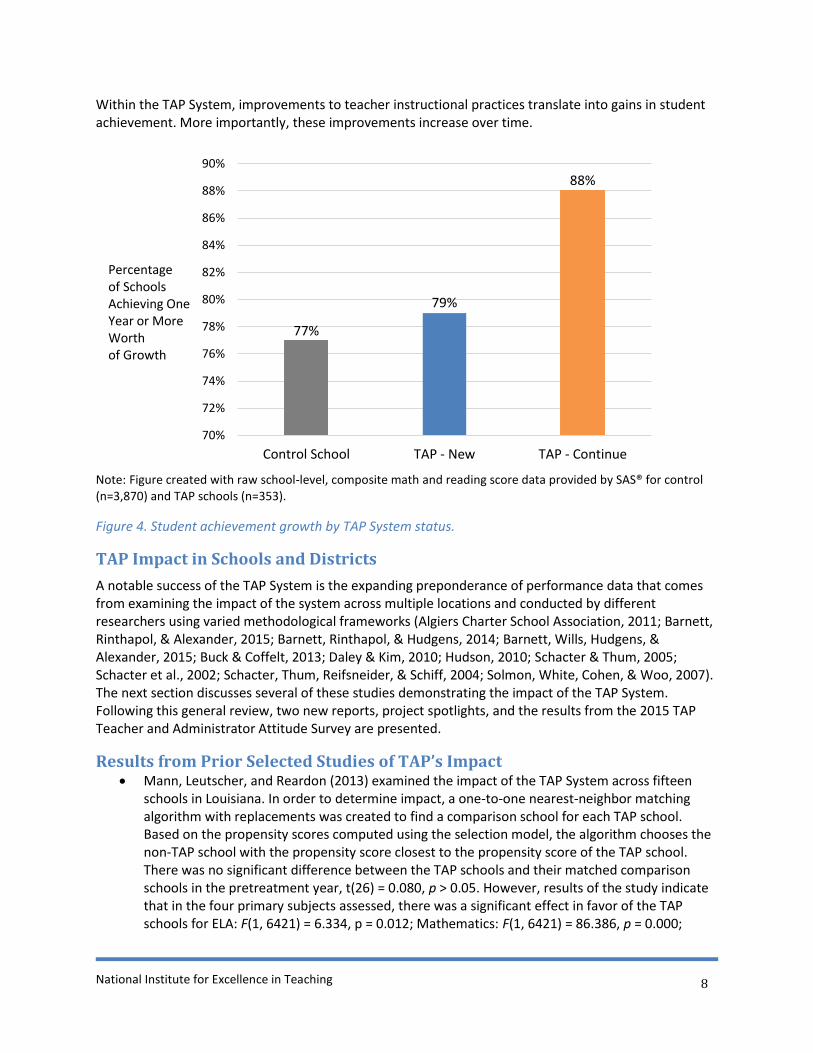
Within the TAP System, improvements to teacher instructional practices translate into gains in student achievement. More importantly, these improvements increase over time.
Note: Figure created with raw school-level, composite math and reading score data provided by SAS® for control (n=3,870) and TAP schools (n=353).
Figure 4. Student achievement growth by TAP System status.
TAP Impact in Schools and Districts
A notable success of the TAP System is the expanding preponderance of performance data that comes from examining the impact of the system across multiple locations and conducted by different researchers using varied methodological frameworks (Algiers Charter School Association, 2011; Barnett, Rinthapol, & Alexander, 2015; Barnett, Rinthapol, & Hudgens, 2014; Barnett, Wills, Hudgens, & Alexander, 2015; Buck & Coffelt, 2013; Daley & Kim, 2010; Hudson, 2010; Schacter & Thum, 2005; Schacter et al., 2002; Schacter, Thum, Reifsneider, & Schiff, 2004; Solmon, White, Cohen, & Woo, 2007). The next section discusses several of these studies demonstrating the impact of the TAP System. Following this general review, two new reports, project spotlights, and the results from the 2015 TAP Teacher and Administrator Attitude Survey are presented.
Results from Prior Selected Studies of TAP’s Impact Mann, Leutscher, and Reardon (2013) examined the impact of the TAP System across fifteen
schools in Louisiana. In order to determine impact, a one-to-one nearest-neighbor matching algorithm with replacements was created to find a comparison school for each TAP school. Based on the propensity scores computed using the selection model, the algorithm chooses the non-TAP school with the propensity score closest to the propensity score of the TAP school. There was no significant difference between the TAP schools and their matched comparison schools in the pretreatment year, t(26) = 0.080, p > 0.05. However, results of the study indicate that in the four primary subjects assessed, there was a significant effect in favor of the TAP schools for ELA: F(1, 6421) = 6.334, p = 0.012; Mathematics: F(1, 6421) = 86.386, p = 0.000;
77%
79%
88%
70%
72%
74%
76%
78%
80%
82%
84%
86%
88%
90%
Control School TAP - New TAP - Continue
Percentage of Schools Achieving One Year or More Worth of Growth
National Institute for Excellence in Teaching
9
Science: F(1, 7084) = 31.792, p = 0.000; and Social Studies: F(1, 7085) = 87.411, p = 0.000]. Further, the study examined the impact of the TAP System across time to find that the TAP schools significantly outperform comparison schools, F(1, 24) = 5.30, p = 0.031. The study also found that 92% of teachers reported that the TAP System made a positive difference on student achievement in their school and 91% reported that the AYP status was improved as a result of the TAP System.
In 2010, Hudson examined the effect of the TAP System on student achievement across 151 schools in 11 states. Hudson used a statistical control matching method to ensure that the TAP schools and the comparison schools were equivalent prior to the intervention being implemented. Hudson also used a differences-in-differences approach to further account for any differences between the groups and to ensure that the evaluation was able to isolate the impact of the program. Results of the study indicate that students in TAP schools outperformed students in comparison schools by approximately 0.15 standard deviations in mathematics, and smaller effects but in favor of the TAP schools in reading. Hudson explains these findings in context to other education interventions by noting that “the estimated effect of TAP on mathematics achievement is more than twice as large [as class size reduction effects]” (p. 28).
In 2007, Solmon et al. analyzed the impacts of the TAP System in terms of value-added gain scores across 650 classrooms in six states, including 61 TAP schools and 285 control schools. Researchers analyzed the student achievement gains at two levels of comparison—teacher-to-teacher and school-to-school. To evaluate TAP teachers (and similarly in evaluating TAP schools), researchers calculated the effect of each teacher on student progress as assessed by the difference between the actual average scores of the teacher’s students and the expected average scores of those students (as derived from previous scores). Through this process, researchers created a statistical control group for the TAP teachers based on performance. Results of the study indicate that in every state more TAP teachers demonstrated statistically significant at or above average amount of student achievement growth than control group teachers. Further, TAP schools outperformed their controls in 57% of the categories in math and in 67% of the categories in reading.
In their 2002 study, Schacter et al. analyzed the growth in achievement of students (n=3,319) whose schools implemented the TAP System compared to the growth of achievement of students (n=7,055) from matched comparison schools. The schools were matched on achievement (percentile rank in Reading, Mathematics, and Language), school size, percent of students eligible for free lunch, school configuration, and location. A statewide cluster analysis was conducted to match the schools. Beyond the matched comparisons, the results in achievement were based on a multi-level value-added model utilizing prior test scores as covariates. Results of the analysis revealed that TAP schools made significantly higher improvements in student achievement gains. Further, this study found that those schools that implemented the TAP System with higher fidelity more significantly outperformed comparison schools.
In their 2004 follow-up study, Schacter et al. examined the impact of the TAP System across 11 schools. The same cluster level analysis with multi-level multivariate analyses were employed using all available covariates to compare growth between the TAP and control schools. Results from the study indicate that 65% of the TAP schools outperformed their matched controls in

National Institute for Excellence in Teaching
10
reading, language, and mathematics achievement, with the magnitude of change ranging from 6% to 46%. The teacher satisfaction component of this study indicated strong support for the four core principles of the TAP System.
In 2014, Barnett, Wills, & Kirby evaluated the impact of the TAP System across 66 schools in Louisiana using two rigorous analytic strategies. First, the authors employed a linear regression to compare 2012-13 Assessment Index (AI) performance of the 66 TAP schools and non-TAP schools statewide, controlling for prior (2010-11) achievement, percentage of students receiving free or reduced-price lunch, school configuration, school size (number of students), and percentage of English language learners. Controlling for the covariates, implementation of the TAP System showed a significant positive effect on 2012-13 achievement: the 66 TAP schools scored 3.7 points higher on average than non-TAP schools (p < .01). Second, the authors compared the 66 TAP schools with a propensity score matched group of non-TAP schools. The average 2012-13 AI for TAP schools (64.45) was 5.47 points greater than the average for the matched controls (58.98).
In their 2014 study, Barnett and Hudgens drew upon a sample of 12,095 teacher-level records, representing 413 schools in 10 states, to examine teacher retention rates in schools that implemented the TAP System during the 2010-11, 2011-12, and 2012-13 school years. Counter to national trends, the authors found that TAP System schools retain 14% more teachers than similar high-needs comparison schools and 10% more than the national average. Furthermore, the results indicate teachers retained in TAP schools become more effective over time as measured by observational and value-added scores.
Following a consistent pattern of multiple researchers investigating TAP in multiple locations using multiple methods, three new reports are highlighted and summarized below demonstrating TAP’s positive impact on schools, teachers, and student achievement.
Results from New Selected Studies of TAP’s Impact
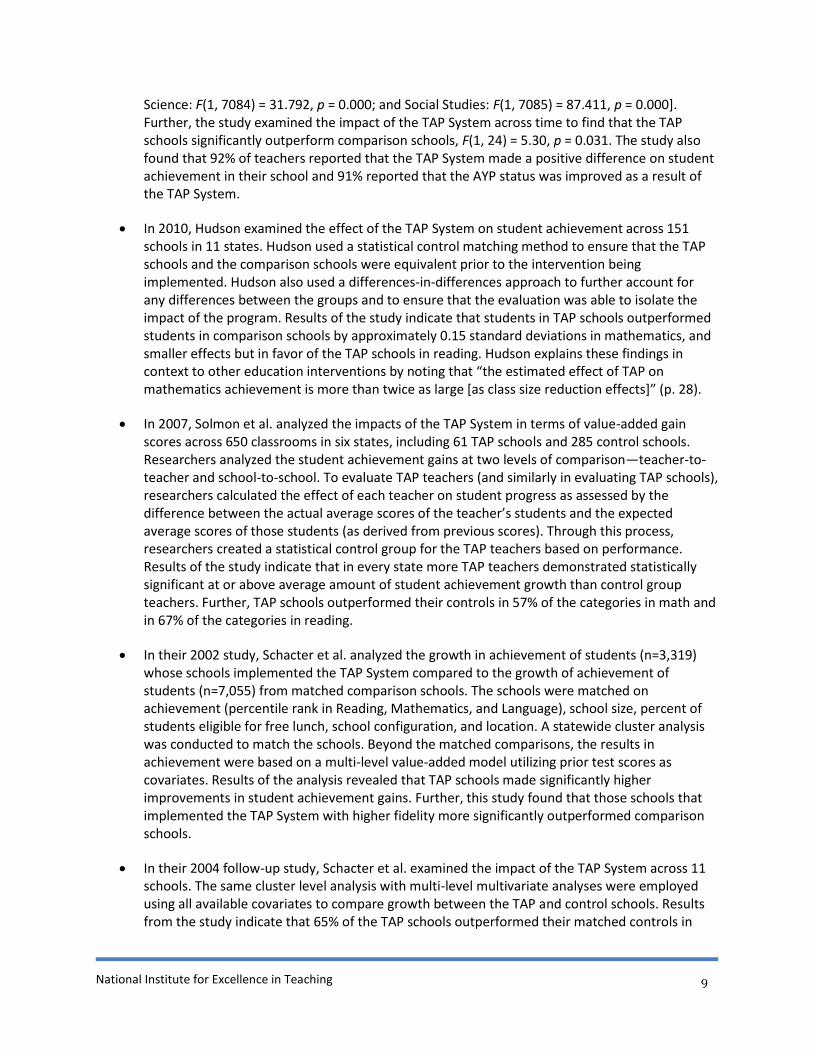
Orangeburg Consolidated School District Three, South Carolina NIET partnered with Orangeburg Consolidated School District 3 (OGB3) to implement TAP district-wide beginning in the 2012-13 school year. Located in the southeastern part of South Carolina, this district serves approximately 3,000 students. OGB3 includes four elementary schools, one middle school, and one high school and averages 79% of students eligible for free or reduced lunch. The majority of students are African American. Barnett, Wills, & Hudgens (2016) examined the impact of TAP implementation on teacher effectiveness and student achievement in OGB3. The authors drew from the teacher observation (Skills, Knowledge, and Responsibility, or SKR) scores and classroom value-added scores as measures of teacher effectiveness. To be considered effective, career teachers must have received an SKR score of 2.5 or higher, mentor teachers must have received an SKR score of 3.5 or higher, and master teachers must have earned an SKR score of 4.0 or higher. For classroom value-added, TAP teachers must obtain a score of 3 or higher, which corresponds to at least one year’s expected growth of their students. Overall effectiveness signifies teachers who met both SKR and classroom value-added thresholds for being measured as effective. Figure 5 shows that the second year of TAP implementation saw an increase in the percentage of teachers deemed effective.
National Institute for Excellence in Teaching
11
Figure 5. OGB3 teacher effectiveness, by year
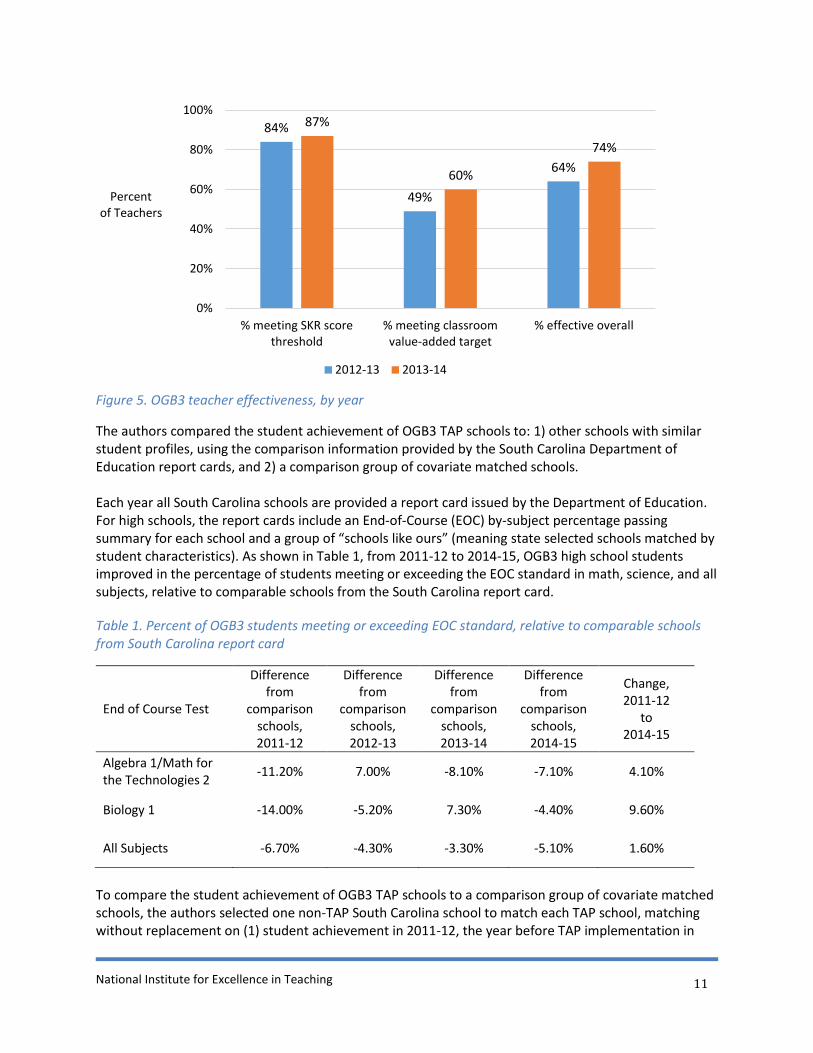
The authors compared the student achievement of OGB3 TAP schools to: 1) other schools with similar student profiles, using the comparison information provided by the South Carolina Department of Education report cards, and 2) a comparison group of covariate matched schools. Each year all South Carolina schools are provided a report card issued by the Department of Education. For high schools, the report cards include an End-of-Course (EOC) by-subject percentage passing summary for each school and a group of “schools like ours” (meaning state selected schools matched by student characteristics). As shown in Table 1, from 2011-12 to 2014-15, OGB3 high school students improved in the percentage of students meeting or exceeding the EOC standard in math, science, and all subjects, relative to comparable schools from the South Carolina report card.
Table 1. Percent of OGB3 students meeting or exceeding EOC standard, relative to comparable schools from South Carolina report card
End of Course Test
Difference from
comparison schools, 2011-12
Difference from
comparison schools, 2012-13
Difference from
comparison schools, 2013-14
Difference from
comparison schools, 2014-15
Change, 2011-12
to 2014-15
Algebra 1/Math for the Technologies 2
-11.20% 7.00% -8.10% -7.10% 4.10%
Biology 1 -14.00% -5.20% 7.30% -4.40% 9.60%
All Subjects -6.70% -4.30% -3.30% -5.10% 1.60%
To compare the student achievement of OGB3 TAP schools to a comparison group of covariate matched schools, the authors selected one non-TAP South Carolina school to match each TAP school, matching without replacement on (1) student achievement in 2011-12, the year before TAP implementation in
84%
49%
64%
87%
60%
74%
0%
20%
40%
60%
80%
100%
% meeting SKR scorethreshold
% meeting classroomvalue-added target
% effective overall
Percent of Teachers
2012-13 2013-14
National Institute for Excellence in Teaching
12
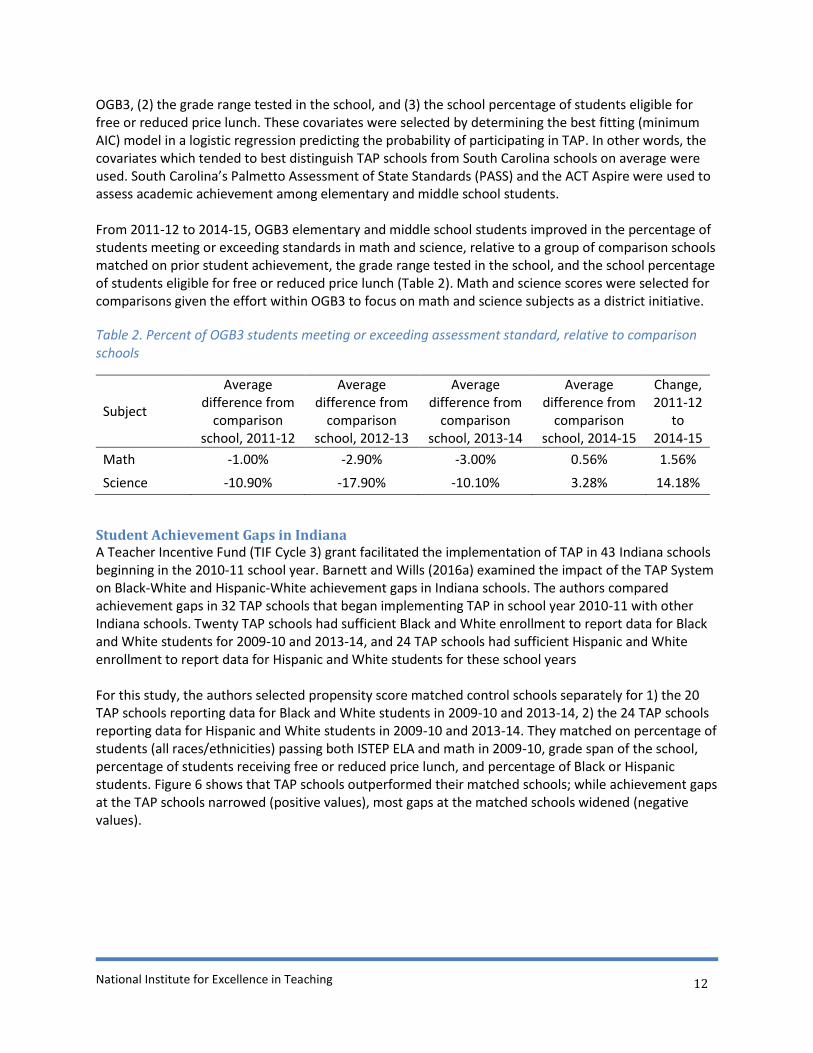
OGB3, (2) the grade range tested in the school, and (3) the school percentage of students eligible for free or reduced price lunch. These covariates were selected by determining the best fitting (minimum AIC) model in a logistic regression predicting the probability of participating in TAP. In other words, the covariates which tended to best distinguish TAP schools from South Carolina schools on average were used. South Carolina’s Palmetto Assessment of State Standards (PASS) and the ACT Aspire were used to assess academic achievement among elementary and middle school students. From 2011-12 to 2014-15, OGB3 elementary and middle school students improved in the percentage of students meeting or exceeding standards in math and science, relative to a group of comparison schools matched on prior student achievement, the grade range tested in the school, and the school percentage of students eligible for free or reduced price lunch (Table 2). Math and science scores were selected for comparisons given the effort within OGB3 to focus on math and science subjects as a district initiative.
Table 2. Percent of OGB3 students meeting or exceeding assessment standard, relative to comparison schools
Subject
Average difference from
comparison school, 2011-12
Average difference from
comparison school, 2012-13
Average difference from
comparison school, 2013-14
Average difference from
comparison school, 2014-15
Change, 2011-12
to 2014-15
Math -1.00% -2.90% -3.00% 0.56% 1.56% Science -10.90% -17.90% -10.10% 3.28% 14.18%
Student Achievement Gaps in Indiana A Teacher Incentive Fund (TIF Cycle 3) grant facilitated the implementation of TAP in 43 Indiana schools beginning in the 2010-11 school year. Barnett and Wills (2016a) examined the impact of the TAP System on Black-White and Hispanic-White achievement gaps in Indiana schools. The authors compared achievement gaps in 32 TAP schools that began implementing TAP in school year 2010-11 with other Indiana schools. Twenty TAP schools had sufficient Black and White enrollment to report data for Black and White students for 2009-10 and 2013-14, and 24 TAP schools had sufficient Hispanic and White enrollment to report data for Hispanic and White students for these school years For this study, the authors selected propensity score matched control schools separately for 1) the 20 TAP schools reporting data for Black and White students in 2009-10 and 2013-14, 2) the 24 TAP schools reporting data for Hispanic and White students in 2009-10 and 2013-14. They matched on percentage of students (all races/ethnicities) passing both ISTEP ELA and math in 2009-10, grade span of the school, percentage of students receiving free or reduced price lunch, and percentage of Black or Hispanic students. Figure 6 shows that TAP schools outperformed their matched schools; while achievement gaps at the TAP schools narrowed (positive values), most gaps at the matched schools widened (negative values).

National Institute for Excellence in Teaching
13
Figure 6. Changes in achievement gaps, compared with propensity score matched controls.
Measurement Stability of TAP Rubric and Alignment with Value-Added
TAP System schools use multiple measures of performance during the school year to provide feedback for teachers over the course of the year, as well as a summative rating at the end of the year. Teachers are observed multiple times a year (3-4 times) by multiple certified raters (i.e. school principal, master teacher, mentor teacher) on 19 indicators of instructional practice. Observation scores are combined through a weighted average with additional responsibility indicators to create an overall Skills, Knowledge, and Responsibilities (SKR) score for each teacher. Teachers also receive student growth scores (i.e. value-added scores) based on state standardized assessments, district-selected tests (i.e. Galileo, NWEA MAP), or student learning objectives (rigorous locally created grade and subject based assessments).
Barnett and Wills (2016b) investigated the stability over time of classroom observation scores from the TAP System rubric, as well as the relationships between TAP observational scores and value-added measures. The correlations between average SKR scores in the 2010-11, 2011-12, and 2012-13 school years were highly significant and large, approaching 0.7 for consecutive school years (Table 3). Table 3. Correlations of SKR across school years
2012 SKR 2013 SKR 2011 SKR Pearson Correlation .696* .551*
N 2482 2482
2012 SKR Pearson Correlation .683*
N 2482
* correlations are significant at p < .01.
The authors also examined correlations between average SKR scores and classroom value-added scores in the 2010-11, 2011-12, and 2012-13 school years. The Pearson correlations were highly significant and
4.2%3.5%
4.3%
3.4%
-2.6%
-1.0%
3.1%
-1.6%
-3.0%
-2.0%
-1.0%
0.0%
1.0%
2.0%
3.0%
4.0%
5.0%
ELA, Black-White Math, Black-White ELA, Hispanic-White
Math, Hispanic-White
Gap change, 2010-2014
TAP schools Matched controls

National Institute for Excellence in Teaching
14
increased each school year. To further examine these comparisons, polychoric correlations were also calculated which resulted in a similar, and somewhat larger, pattern of increasing each school year.
To put these findings into context, the researchers examined the reported correlations across other observational measures used in large-scale research studies (e.g. Chaplin, Gill, Thompkins, & Miller, 2014; Grossman, Cohen, Ronfeldt, & Brown, 2014). Figure 7 displays the reported correlation coefficients between four different observation rubrics, as well as the TAP rubric and classroom value-added scores. As illustrated in Figure 7, these correlations exceed or match the range reported in recent literature – evidence that the TAP observation rubric measures aspects of teacher practice that contribute to improved student test performance.
Figure 7. Classroom observation instrument correlations with value-added measures
The explanation for the strong stability of the TAP observational rubric across domains, across sites, and across years likely stems from the requirements for the evaluators themselves and the validity of the TAP rubric. Within the TAP System, observers are certified through a rigorous training process, having to pass a rigorous, video-based annual certification examination. Observers also receive tailored and targeted professional development at TAP Summer Institute meetings, which are multi-day trainings dedicated to developing and reinforcing the elements of the TAP System in each school. Further, leadership teams monitor the consistency of evaluations in each location to ensure scores are accurate. Evaluators are also trained in providing feedback to teachers on their practice during post-conferences, to better ensure all teachers receive high quality, timely support as they work to improve their classroom instruction. These processes within the implementation of the TAP System directly address a number of the challenges discussed previously in the literature related to score inflation referenced widely as “The Widget Effect” (Weisberg, Sexton, Mulhern, & Keeling, 2009).
0.00
0.05
0.10
0.15
0.20
0.25
0.30
Frameworkfor Teaching
CLASS PLATO MQI TAP Rubric
Strength of Relationship
Between Teacher Value-Added Score and Observational
Instrument
Observational Instruments:Classroom Assessment Scoring System (CLASS)
Protocol for Language Arts Teaching Observation (PLATO)Mathematical Quality of Instruction (MQI)

National Institute for Excellence in Teaching
15
Beyond the instrument and the internal controls for consistency, the TAP System also requires teachers to be observed multiple times per year using both announced and unannounced observations, a process recommended most recently by Archer, Kerr, and Pianta (2014), yet uncommon in most educator evaluation systems. The strong relationship of TAP SKR scores with classroom value-added measures is evidence of the stability of the TAP rubric. Using a large-scale, multi-state sample as well as multiple and rigorous analytic approaches, this study finds a consistent pattern of stable scores for teachers using the TAP SKR observational instrument.
National TAP Attitude Survey - 2015
Teacher Results -2015 TAP Attitude Survey
Critics of performance measures and incentives for teachers often indicate such policies will result in competitiveness and a loss of collegiality among teachers. Notwithstanding, we find evidence of a high degree of collegiality in TAP schools. In the 2015 TAP national survey of teacher attitudes, 93% of teachers in TAP schools agree with statements reporting a high level of collegiality in their schools, and over 70% report strong agreement. This evidence for collegiality has been remarkably high over the last decade, as shown in Figure 82, which indicates that TAP System schools consistently have a collaborative and collegial environment.
(n=8,794 teachers, 2015 NIET Teacher Survey)
Figure 8. Level of reported collegiality from teachers in TAP schools nationwide.
2 The five dimensions represented in this and the next figures are constructed from multiple teacher survey items using factor analysis. Most items in the survey are based on a 5-point Likert scale indicating agreement (1=Not at All and 5=Very Much). For reporting purposes on collegiality and the four TAP elements, the results are presented as Moderate (weighted average of 3 on the items for that factor) and Strong (weighted average of 4 or 5 on the items for that factor).
93%
90%
0% 20% 40% 60% 80% 100%
2015
2005
Percentage
Teacher Collegiality
Moderate Support Strong Support
National Institute for Excellence in Teaching
16
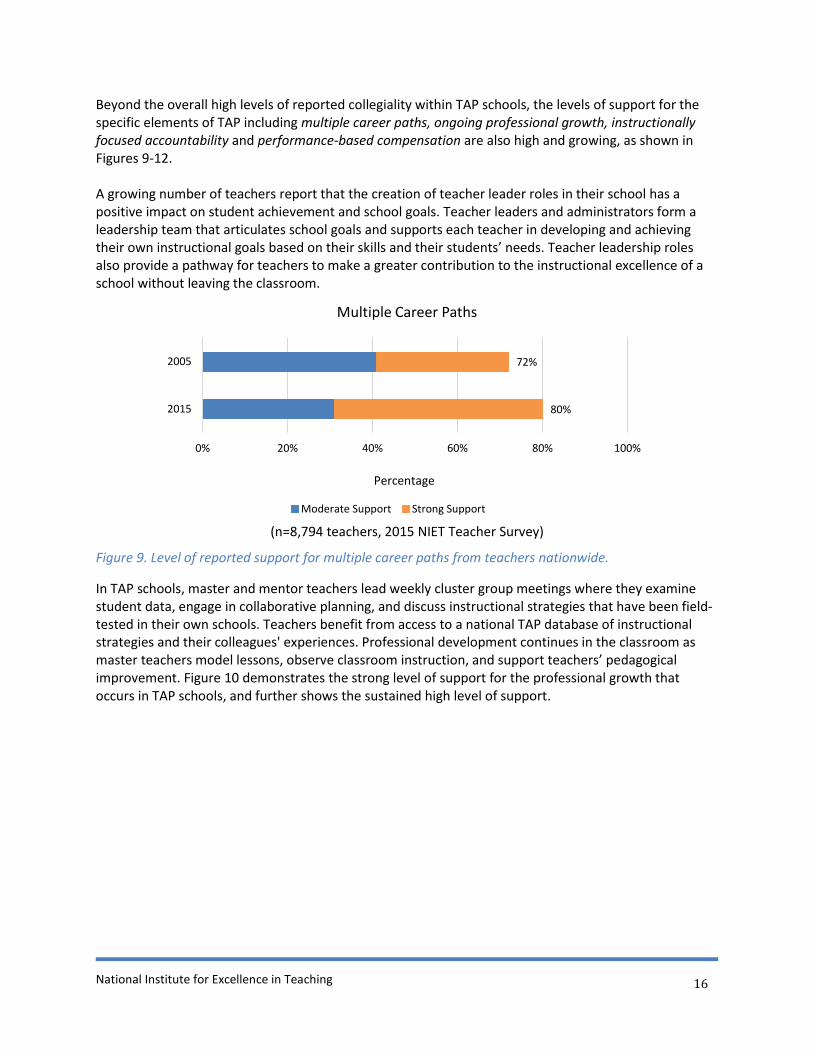
Beyond the overall high levels of reported collegiality within TAP schools, the levels of support for the specific elements of TAP including multiple career paths, ongoing professional growth, instructionally focused accountability and performance-based compensation are also high and growing, as shown in Figures 9-12. A growing number of teachers report that the creation of teacher leader roles in their school has a positive impact on student achievement and school goals. Teacher leaders and administrators form a leadership team that articulates school goals and supports each teacher in developing and achieving their own instructional goals based on their skills and their students’ needs. Teacher leadership roles also provide a pathway for teachers to make a greater contribution to the instructional excellence of a school without leaving the classroom.
(n=8,794 teachers, 2015 NIET Teacher Survey)
Figure 9. Level of reported support for multiple career paths from teachers nationwide.
In TAP schools, master and mentor teachers lead weekly cluster group meetings where they examine student data, engage in collaborative planning, and discuss instructional strategies that have been field-tested in their own schools. Teachers benefit from access to a national TAP database of instructional strategies and their colleagues' experiences. Professional development continues in the classroom as master teachers model lessons, observe classroom instruction, and support teachers’ pedagogical improvement. Figure 10 demonstrates the strong level of support for the professional growth that occurs in TAP schools, and further shows the sustained high level of support.
80%
72%
0% 20% 40% 60% 80% 100%
2015
2005
Percentage
Multiple Career Paths
Moderate Support Strong Support

National Institute for Excellence in Teaching
17
(n=8,794 teachers, 2015 NIET Teacher Survey)
Figure 10. Level of reported support for applied professional growth from teachers nationwide.
TAP teachers are observed in classroom instruction multiple times a year by multiple trained observers, including principals and master and mentor teachers, using rubrics measuring indicators of instructional effectiveness. Evaluators are trained and certified, and leadership teams monitor the reliability and consistency of evaluations in their schools. These classroom evaluations are complemented by analyzing student achievement growth, rounding out a multi-measure system of teacher evaluation. Evaluation results are used as formative feedback in one-on-one mentoring sessions, and guide planning for cluster group meetings. Figure 11 illustrates the strong level of support reported by TAP teachers across the nation.
(n=8,794 teachers, 2015 NIET Teacher Survey)
Figure 11. Level of reported support for instructionally focused accountability from teachers nationwide.
TAP teachers have the opportunity to earn annual bonuses based on their observed skills, knowledge and responsibilities, their students’ average achievement growth, and school-wide achievement growth. Master and mentor teachers receive additional compensation based on their added roles and responsibilities, and principals can earn additional compensation based on school-wide achievement growth and other measures of effectiveness. Figure 12 demonstrates the level of support for the
88%
87%
0% 20% 40% 60% 80% 100%
2015
2005
Percentage
Ongoing Applied Professional Growth
Moderate Support Strong Support
91%
78%
0% 20% 40% 60% 80% 100%
2015
2005
Percentage
Instructionally Focused Accountability
Moderate Support Strong Support
National Institute for Excellence in Teaching
18
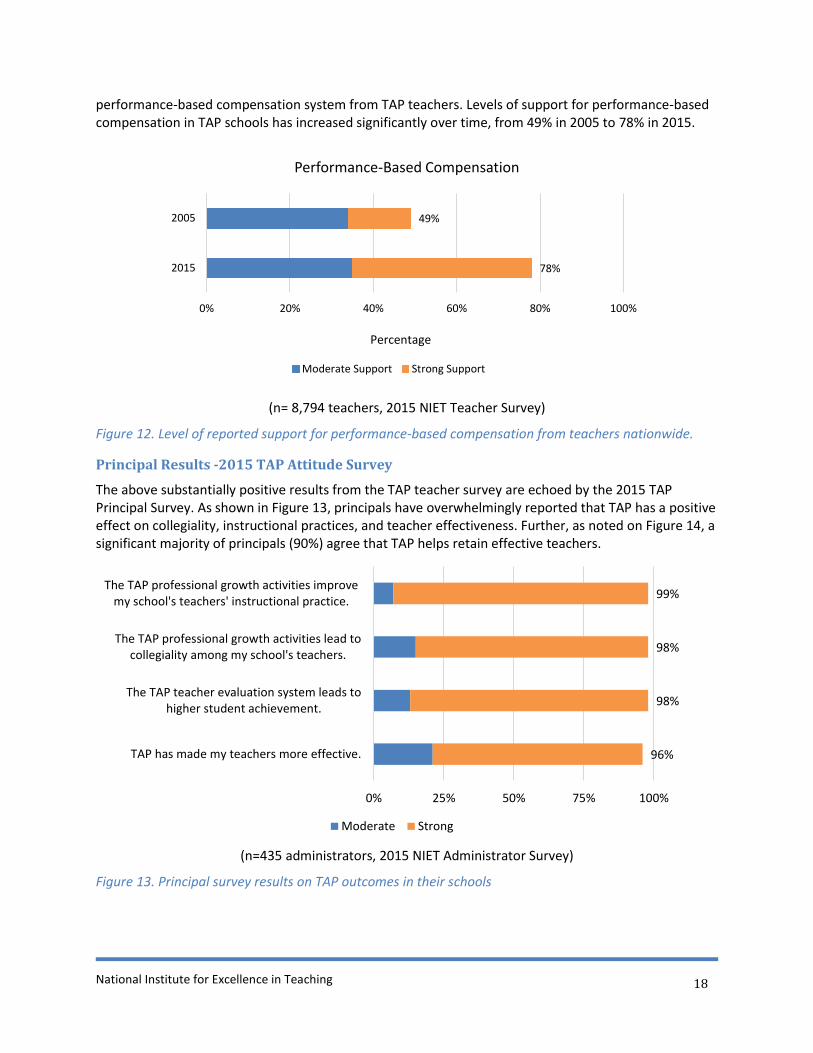
performance-based compensation system from TAP teachers. Levels of support for performance-based compensation in TAP schools has increased significantly over time, from 49% in 2005 to 78% in 2015.
(n= 8,794 teachers, 2015 NIET Teacher Survey)
Figure 12. Level of reported support for performance-based compensation from teachers nationwide.
Principal Results -2015 TAP Attitude Survey
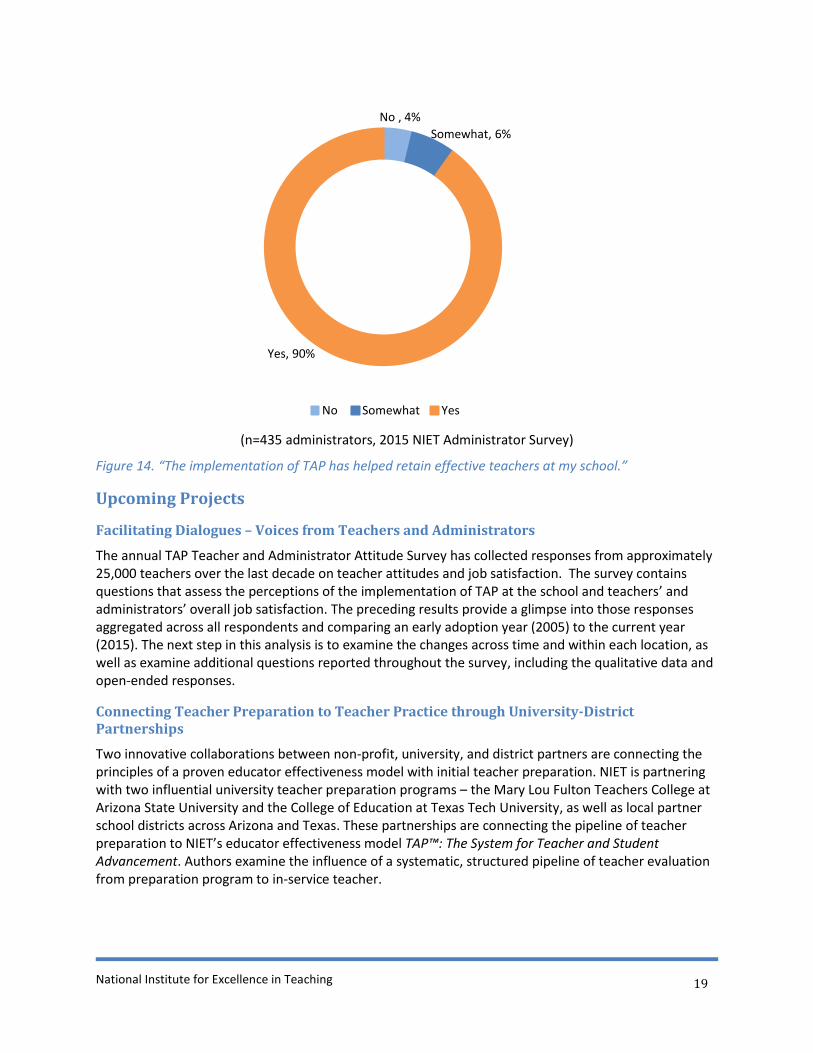
The above substantially positive results from the TAP teacher survey are echoed by the 2015 TAP Principal Survey. As shown in Figure 13, principals have overwhelmingly reported that TAP has a positive effect on collegiality, instructional practices, and teacher effectiveness. Further, as noted on Figure 14, a significant majority of principals (90%) agree that TAP helps retain effective teachers.
(n=435 administrators, 2015 NIET Administrator Survey)
Figure 13. Principal survey results on TAP outcomes in their schools
78%
49%
0% 20% 40% 60% 80% 100%
2015
2005
Percentage
Performance-Based Compensation
Moderate Support Strong Support
96%
98%
98%
99%
0% 25% 50% 75% 100%
TAP has made my teachers more effective.
The TAP teacher evaluation system leads tohigher student achievement.
The TAP professional growth activities lead tocollegiality among my school's teachers.
The TAP professional growth activities improvemy school's teachers' instructional practice.
Moderate Strong
National Institute for Excellence in Teaching
19
(n=435 administrators, 2015 NIET Administrator Survey)
Figure 14. “The implementation of TAP has helped retain effective teachers at my school.”
Upcoming Projects
Facilitating Dialogues – Voices from Teachers and Administrators
The annual TAP Teacher and Administrator Attitude Survey has collected responses from approximately 25,000 teachers over the last decade on teacher attitudes and job satisfaction. The survey contains questions that assess the perceptions of the implementation of TAP at the school and teachers’ and administrators’ overall job satisfaction. The preceding results provide a glimpse into those responses aggregated across all respondents and comparing an early adoption year (2005) to the current year (2015). The next step in this analysis is to examine the changes across time and within each location, as well as examine additional questions reported throughout the survey, including the qualitative data and open-ended responses.
Connecting Teacher Preparation to Teacher Practice through University-District Partnerships
Two innovative collaborations between non-profit, university, and district partners are connecting the principles of a proven educator effectiveness model with initial teacher preparation. NIET is partnering with two influential university teacher preparation programs – the Mary Lou Fulton Teachers College at Arizona State University and the College of Education at Texas Tech University, as well as local partner school districts across Arizona and Texas. These partnerships are connecting the pipeline of teacher preparation to NIET’s educator effectiveness model TAP™: The System for Teacher and Student Advancement. Authors examine the influence of a systematic, structured pipeline of teacher evaluation from preparation program to in-service teacher.
No , 4%
Somewhat, 6%
Yes, 90%
No Somewhat Yes
National Institute for Excellence in Teaching
20
Conclusion
The TAP System stands out because of its more than a decade-long track record of growth and success in raising student achievement in high-need schools. The research evidence also reveals several key reasons for TAP’s positive impact: an evaluation system capable of differentiating teacher performance levels and providing detailed feedback for improvement, ongoing professional growth in classroom practice using student and teacher data to guide improvement, recruitment and retention of effective teachers, and the creation of a challenging, rewarding, and collegial environment focused on high-quality instruction and student learning.

National Institute for Excellence in Teaching
21
Acknowledgements The authors gratefully acknowledge the input and information provided by TAP System partner schools, including the willingness of administrators and teachers to respond to NIET’s surveys and participate in focus group meetings. We are also indebted to the work of all of the NIET project directors and members who work with partnering schools each day. Suggested citation: Barnett, J. H., Hudgens, T. M., & Alexander, J. L. (2016). TAP research summary spring 2016: Examining the evidence and impact of TAP: The system for teacher and student advancement. Santa Monica, CA: National Institute for Excellence in Teaching.
About the Authors Joshua H. Barnett, Ph.D., serves as senior vice president of research and evaluation at National Institute for Excellence in Teaching. He leads NIET’s research agenda and production of evidentiary support for all initiatives and grant programs; in addition, he directs all external evaluation projects and research services. Prior to joining NIET, he worked at multiple universities as a researcher and professor teaching courses in research methods, statistics, and education program evaluation. Barnett earned his Ph.D. in education evaluation and policy from the University of Arkansas. Tanée M. Hudgens, Ph.D., is a senior research associate at NIET. She earned her Ph.D. in developmental psychology with a concentration in quantitative psychology from the University of North Carolina at Chapel Hill. Prior to joining NIET, she evaluated the quality of instruction and care provided to preschoolers, as well as the recruitment, retention, and development of the early childhood care and education workforce across Los Angeles. Jessica L. Alexander, is a senior research assistant at NIET. Prior to joining the research and evaluation team, she assisted NIET’s operations as a support services specialist. She has a bachelor’s degree in sociology from the University of California, Los Angeles where she was actively involved in several programs supporting underserved youth, including Mentorship and UniCamp.
National Institute for Excellence in Teaching
22
References
Algiers Charter School Association. (2011). Annual report 2011. New Orleans, LA: Author. Retrieved from http://tapsystem.niet.org/publications/algiers_charter_schools_association_annual_report_2011.pdf
Archer, J., Kerr, K. A., & Pianta, R. C. (2014). Why measure effective teaching. In T. J. Kane, K. A., Kerr, & R. C. Pianta (Eds.), Designing teacher evaluation systems: New guidance from the Measures of Effective Teaching project (pp. 1-5). San Francisco, CA: Jossey-Bass.
Barnett, J. H., & Hudgens, T. (2014). Staying power: The impact of the TAP System on retaining teachers
nationwide. Santa Monica, CA: National Institute for Excellence in Teaching. Retrieved from http://www.niet.org/assets/Publications/staying-power-tap-system-teacher-retention.pdf?processed=1
Barnett, J. H., Rinthapol, N., & Alexander, J. (2015). Real perspectives on tough issues: Teacher attitudes about teaching. Paper presented at the annual meeting of the American Educational Research Association. Chicago, IL.
Barnett, J. H., Rinthapol, N., & Hudgens, T. (2014). TAP research summary: Examining the evidence and impact of TAP: The system for teacher and student achievement. Santa Monica, CA: National Institute for Excellence in Teaching.
Barnett, J. H. & Wills, K. C. (2016a). Narrowing the gap: Achievement gaps in Indiana TAP schools. Paper presented at the annual meeting of the American Educational Research Association. Washington, DC.
Barnett, J. H. & Wills, K. C. (2016b). Measuring and assessing classroom instruction: Properties of TAP observational rubric scores. Paper presented at the annual meeting of the American Educational Research Association. Washington, DC.
Barnett, J. H., Wills, K. C., & Hudgens, T. M. (2016). Impact evaluation of the TAP system in Orangeburg school district 3 (SC). Paper presented at the annual meeting of the American Educational Research Association. Washington, DC.
Barnett, J. H., Wills, K. C., Hudgens, T. M., & Alexander, J. L. (2015). TAP research summary: Examining the evidence and impact of TAP: The system for teacher and student achievement. Santa Monica, CA: National Institute for Excellence in Teaching.
Barnett, J. H., Wills, K. C., & Kirby, P. C. (2014). Comprehensive educator effectiveness models that work: Impact of the TAP system on student achievement in Louisiana. Santa Monica, CA: National Institute for Excellence in Teaching. Retrieved from http://www.niet.org/assets/Publications/louisiana-tap-student-achievement.pdf?processed=1
Buck, B., & Coffelt, C. (2013, August 15). Leadership program good for all teachers: TAP leaders provide support for colleagues, create collaborative team. Des Moines Register. Retrieved from http://www.iowahouserepublicans.com/op-ed-leadership-program-good-for-all-teachers
National Institute for Excellence in Teaching
23
Chaplin, D., Gill, B., Thompkins, A., & Miller, H. (2014). Professional practice, student surveys, and value-added: Multiple measures of teacher effectiveness in the Pittsburgh Public Schools (REL 2014–024). Washington, DC: U.S. Department of Education, Institute of Education Sciences, National Center for Education Evaluation and Regional Assistance, Regional Educational Laboratory Mid-Atlantic. Retrieved from http://ies.ed.gov/ncee/edlabs.
Daley, G., & Kim, L. (2010). A teacher evaluation system that works (NIET Working Paper). Santa Monica, CA: National Institute for Excellence in Teaching. Retrieved from http://tapsystem.niet.org/publications/wp_eval.pdf
Darling-Hammond, L. (2006). Assessing teacher education: The usefulness of multiple measures for assessing program outcomes. Journal of Teacher Education, 57(2), 120-138. doi:10.1177/0022487105283796
Goldhaber, D. (2002). The mystery of good teaching. Education Next, 1, 50-55. Retrieved from http://educationnext.org/the-mystery-of-good-teaching/
Grossman, P., Cohen, J., Ronfeldt, M., & Brown, L. (2014). The test matters: The relationship between classroom observation scores and teacher value added on multiple types of assessment. Educational Researcher 43, 293-303. doi: 10.3102/0013189X14544542
Hanushek, E. (2013). Why educators’ wages must be revamped now. Education Week, 32(20), 28-29, 31. Retrieved from http://www.edweek.org/ew/articles/2013/02/06/20hanushek_ep.h32.html
Headden, S. (2014). Beginners in the classroom. What the changing demographics of teaching mean for schools, students, and society. Stanford, CA: Carnegie Foundation for the Advancement of Teaching.
Hudson, S. (2010). The effects of performance-based teacher pay on student achievement. Discussion Paper for the Stanford Institute for Economic Policy Research, Stanford University. Retrieved from http://www-siepr.stanford.edu/repec/sip/09-023.pdf
Mann, D., Leutscher, T., & Reardon, R. M. (2013). The system for teacher and student advancement: An evaluation of achievement and engagement in Louisiana. Santa Monica, CA: National Institute for Excellence in Teaching. Retrieved from http://tapsystem.niet.org/publications/interactive-louisiana-student-achievement.pdf
National Council on Teacher Quality (NCTQ). (2014). 2013 State teacher policy yearbook: National summary. Washington, DC: Author. Retrieved from http://www.nctq.org/dmsView/2013_State_Teacher_Policy_Yearbook_National_Summary_NCTQ_Report
National Institute for Excellence in Teaching. (2015). TAP in focus. Santa Monica, CA: Author. Retrieved from http://www.niet.org/assets/Publications/tap-in-focus-2015.pdf?processed=1
Rivkin, S., Hanushek, E. A. & Kain, J. (2005) Teachers, schools, and academic achievement. Econometrica, 73(2), 417-458. http://dx.doi.org/10.1111/j.1468-0262.2005.00584.x

National Institute for Excellence in Teaching
24
Schacter, J., & Thum, Y. M. (2005). TAPping into high quality teachers: Preliminary results from the Teacher Advancement Program comprehensive school reform. School Effectiveness & School Improvement, 16(3), 327–353. doi:10.1080/13803610500146202
Schacter, J., Schiff, T., Thum, Y. M., Fagnano, C., Bendotti, M., Solmon, L., … Milken, L. (2002). The impact of the teacher advancement program on student achievement, teacher attitudes, and job satisfaction. Santa Monica, CA: Milken Family Foundation.
Schacter, J., Thum, Y. M., Reifsneider, D., & Schiff, T. (2004). The teacher advancement program report two: Year three results from Arizona and year one results from South Carolina TAP schools. Santa Monica, CA: Milken Family foundation.
Simon, N. S., & Johnson, S. M. (2013). Teacher turnover in high-poverty schools: What we know and can do. (Working Paper: Project on the Next Generation of Teachers). Cambridge, MA: Harvard Graduate School of Education.
Solmon, L. C., White, J. T., Cohen. D., & Woo, D. (2007). The effectiveness of the teacher advancement program. Santa Monica, CA: National Institute for Excellence in Teaching. Retrieved from http://tapsystem.niet.org/pubs/effective_tap07_full.pdf
The New Teachers Project (TNTP). (2012). The irreplaceables: Understanding the real retention crisis in America’s urban schools. Retrieved from http://tntp.org/assets/documents/TNTP_Irreplaceables_2012.pdf
Weisberg, D., Sexton, S., Mulhern, J., & Keeling, D. (2009). The Widget Effect: Our national failure to acknowledge and act on differences in teacher effectiveness. Brooklyn, NY: The New Teachers Project (TNTP). Retrieved from http://tntp.org/publications/view/evaluation-and-development/the-widget-effect-failure-to-act-on-differences-in-teacher-effectiveness
Related Documents