TANF PARTICIPATION AND EMPLOYMENT IN SIPP (2004-2007) SEHSD Working Paper #2010-09 Shelley Irving* U.S. Census Bureau SEHSD For presentation at the 2010 Annual Meeting of the American Sociological Assocation, August 14-17, 2010, Atlanta, Georgia. *This paper is released to inform interested parties of research and to encourage discussion. The views expressed or technical issues are those of the author and not necessarily those of the U.S. Census Bureau.

Welcome message from author
This document is posted to help you gain knowledge. Please leave a comment to let me know what you think about it! Share it to your friends and learn new things together.
Transcript

TANF PARTICIPATION AND EMPLOYMENT IN SIPP (2004-2007)
SEHSD Working Paper #2010-09
Shelley Irving*
U.S. Census Bureau
SEHSD
For presentation at the 2010 Annual Meeting of the American Sociological Assocation,
August 14-17, 2010, Atlanta, Georgia.
*This paper is released to inform interested parties of research and to encourage discussion. The
views expressed or technical issues are those of the author and not necessarily those of the U.S.
Census Bureau.

Irving 2
TANF PARTICIPATION AND EMPLOYMENT IN SIPP (2004-2007)
Abstract
This paper examines trends in TANF receipt and employment among women ages 18 to 64
annually from 2004 to 2007 using the 2004 Panel of the Survey of Income and Program
Participation (SIPP). Results from this paper show that there was no significant change in the
number of recipient women ages 18 to 64, the TANF participation rate for this group, or the
characteristics of TANF-recipient women between 2004 and 2007. TANF women were less
likely to work full-time and more likely to be unemployed or not in the labor force than non-
TANF women and never married, non-TANF women, and their reasons for not working differ
from those of non-recipient women. Employed TANF-recipient women are similar to their
counterparts with no labor force attachment, except in terms of income to poverty ratios. Finally,
former recipients are more likely to be employed and less likely to be in poverty than current
recipients.

Irving 3
TANF PARTICIPATION AND EMPLOYMENT IN SIPP (2004-2007)
The federal Welfare Reform Act of 1996 (the Personal Responsibility and Work
Opportunity Reconciliation ACT, or PRWORA) replaced Aid to Families with Dependent
Children (AFDC) with Temporary Assistance for Needy Families (TANF). The new program
abolished the entitlement status of welfare, imposed stronger work-related requirements,
introduced lifetime limits on welfare receipt, and tied federal funding levels to states’ success in
moving welfare recipients to work. This dramatic overhaul of the welfare system in 1996 was
followed by unprecedented caseload declines and increased work participation among TANF
recipients.1
When PRWORA was passed, there were fears that the most disadvantaged welfare
recipients would remain on TANF – as the least disadvantaged left welfare for work – making it
more difficult for states to transition their remaining welfare recipients into the labor force and
meet federally mandated work participation rates. While there is little evidence to suggest that
the remaining welfare recipients were any more disadvantaged than in years past, the rate of
caseload decline slowed and work participation rates among TANF recipients fell post-2000.2
Despite these trends, Congress passed the Deficit Reduction Act of 2005 (DRA, or more
commonly referred to as TANF Reauthorization), which requires states to place even greater
numbers of TANF recipients in the labor force – largely through changes in the structure of
federal TANF work requirements. Under the 1996 law, states were required to have a certain
percentage of families engaged in work activities (as defined by federal rules) or face financial
1 See U.S. Department of Health and Human Service, (2009), Temporary Assistance for Needy Families Program
(TANF), Eighth Annual Report to Congress. Washington, DC. 2 See Acs, Gregory and Pamela Loprest, (2007), TANF Caseload Composition and Leavers Synthesis Report, The
Urban Institute: Washington, DC. Also, see The Urban Institute, (2006), A Decade of Welfare Reform: Facts and
Figures, Assessing the New Federalism, Washington, DC.

Irving 4
penalties. However, for each one percentage point decline in the state’s caseload since 1995,
states were granted a one percentage point credit toward their work participation requirement.3
For example, in 2002, the work participation rate standard before the application of the caseload
reduction credit was 50 percent for all families and 90 percent for two-parent families. This
means that if a state saw no declines to its caseload, it would have to have 50 percent of all
families and 90 percent of two-parent families participating in work activities. Yet, the adjusted
standard for all families across the 50 states and the District of Columbia averaged just 6.2
percent because of caseload declines in every state.4 However, TANF Reauthorization altered
the caseload reduction credit by basing adjustments to the work participation requirements on
caseload declines since 2005. Accordingly, most states would be required to have a higher
proportion of recipient families engaged in the labor market because of slowed caseload declines
since 2005.
Using data from the Survey of Income and Program Participation (SIPP) 2004 panel – a
household survey representative of the civilian noninstitutionalized population living in the
United States, which followed the same individuals over a period of 48 months from October
2003 to December 20075 – this paper describes select demographic and well-being
characteristics of TANF-recipient women ages 18 to 64 during the 2004 to 2007 period. In some
places, TANF-recipient women ages 18 to 64 are compared to all non-recipient women and
never married, non-recipient women ages 18 to 64 who are in families with children. The period
under investigation includes the years leading up to and following the 2005 TANF
3 See Zedlewski, Sheila, (2002), 40 Hour Work Rule: Implications for Families and Children, The Urban Institute:
Washington, DC. 4 See http://www.acf.hhs.gov/programs/ofa/particip/2002/table01a.htm.
5 This is the reference period in calendar months covered by SIPP 2004 panel. For more details on the interview
procedures, interview waves, and rotation groups, see the SIPP User’s Guide at
www.sipp.census.gov/sipp/usrguide/sipp2004.pdf.

Irving 5
Reauthorization legislation, which could have had an impact on the TANF population in several
ways, such as fewer people on TANF, a more disadvantaged TANF population, or higher rates of
employment among TANF-recipient adults.
The current paper has six major sections preceded by a brief overview of the TANF data
in the SIPP 2004 panel. The first section presents TANF participation rates for women ages 18
to 64 over the survey period (2004 to 2007). The second section describes select socioeconomic
characteristics (e.g., educational attainment, poverty status, and marital status) of TANF-
recipient women during each calendar year of the survey period. The third section compares the
rates of employment and non-employment of TANF-recipient, non-TANF recipient, and never
married, non-TANF recipient women ages 18 to 64 from 2004 to 2007. The fourth section
examines the reasons for not working and for working only part-time for TANF, non-TANF, and
never married, non-TANF recipient women between 2004 and 2007. The fifth section compares
the characteristics of TANF-recipient women ages 18 to 64 who were working to those who
were not working between 2004 and 2007. The final section compares current and former
TANF-recipient women ages 18 to 64 across selected demographic and socioeconomic
characteristics.
DATA ON WELFARE PARTICIPATION
Along with the detailed information on respondents’ demographic (e.g., sex, race,
ethnicity, age, and educational attainment), work (e.g., employment status, income, and disability
status), and family (e.g., marital status) characteristics, SIPP also collects data on respondents’
participation in government transfer programs in its core questionnaire. Data collected from
TANF recipients and their families included their monthly program coverage, benefit amount,

Irving 6
program transitions, and welfare recipiency history during the 2004-2007 time period.6 In this
analysis, respondents are identified as TANF recipients by reporting that they are covered under
cash assistance welfare payments, and does not include, for example, the receipt of childcare
subsidies, child support, or the Earned Income Tax Credit (EITC).
Unless otherwise specified, analyses in this paper are presented by calendar year (2004 to
2007), and results for each calendar year are based on the full sample of respondents for whom
data are obtained (either reported or imputed) for every month of the calendar year. Since TANF
receipt status is reported monthly, respondents may be considered TANF recipients in some
months of a year but not others. Calendar year estimates are produced by averaging results
across all months in the year.
Due to budget cuts, the sample size was cut by one-half after wave 7. While the sample
remains nationally representative (when the proper weights are applied) after this drop in sample
size, the calculation of standard errors is impacted. Standard errors are considerably larger in
calendar years 2006 and 2007 compared to earlier years. Accordingly, it is more difficult to
ascertain statistically significant differences between the estimates for two or more groups in
2006 and 2007.
The sample is weighted to produce national and state-level estimates.7 The estimates in
this report (which may be shown in text and tables) are based on responses from a sample of the
population and may differ from the actual values because of sampling variability or other factors.
As a result, apparent differences between the estimates for two or more groups may not be
statistically significant. All comparative statements have undergone statistical testing and are
6 Also visit http://www.sipp.census.gov/sipp/dews.html for updates on Census’ recent reengineering efforts on SIPP.
7 See “Using Sampling Weights on SIPP Files” in SIPP Users’ Guide: 2004, 8-1.

Irving 7
significant at the 90-percent confidence level unless otherwise noted. Standard errors are
corrected to account for SIPP’s complex sampling design.
TANF PARTICIPATION BETWEEN 2004 AND 2007
There were well-documented, unprecedented declines in TANF caseloads just prior to
and immediately following the Welfare Reform Act of 1996. After 2000, caseloads continued to
fall, but the rate of decline was considerably slowed.8 Table 1 shows the number of female
TANF recipients ages 18 to 64 as a percentage of all women ages 18 to 64. Between 2004 and
2007, an average of 760,000 women ages 18 to 64 received TANF, or approximately 0.8 percent
of all women in that age range. There was no significant change in the number of female TANF
recipients ages 18 to 64 or the program participation rate for this group between 2004 and 2007.
CHARACTERISTICS OF TANF RECIPIENTS
This section discusses several dimensions of female welfare recipients’ demographic and
well-being characteristics for each year between 2004 and 2007 to examine the composition of
TANF women and determine whether any changes occurred during this time. Table 1 shows that
the racial composition of TANF women remained similar between 2004 and 2007.9 An average
of 55 percent of TANF women ages 18 to 64 were white (35 percent were non-Hispanic white),
35 percent were black, 3 percent were Asian, 7 percent were some other race, and 24 percent of
recipients reported being Hispanic.
[Table 1 about here]
8 See U.S. Department of Health and Human Service, (2009), Temporary Assistance for Needy Families Program
(TANF), Eighth Annual Report to Congress. Washington, DC. 9 There was a significant decline in the estimates for percent white between 2004 and 2005.

Irving 8
Approximately two-thirds of TANF-recipient women were in poverty – measured as a
ratio of family income over the poverty threshold – each year between 2004 and 2007; yet, there
was considerable variation in income to poverty ratios. 10
On average across the 2004 to 2007
time span, Table 1 shows that about 25 percent of TANF women had family income to poverty
ratios between 0.50 and 0.99, about 28 percent had ratios between 0.25 and 0.49, and about 14
percent had ratios below 0.25.11
Table 1 also shows that TANF was not the only source of
assistance for many recipients. When TANF replaced AFDC, it also ended the automatic
Medicaid coverage provided to families via cash welfare rolls.12
Nonetheless, an average of 96
percent of TANF women continued to be covered by Medicaid between 2004 and 2007.
However, the percent of TANF women receiving Medicaid fell from 98.5 percent in 2005 to 93.1
percent in 2007. A majority of TANF-recipient women also received Food Stamps (an average
of 90 percent between 2004 and 2007). 13
Far fewer TANF women (about 11 percent) received
WIC during this time, which is expected given the limitations on WIC receipt.14
Table 1 shows that most TANF-recipient women ages 18 to 64 were never married (about
51 percent) between 2004 and 2007, while about 21 percent were married and about 28 percent
were widowed, divorced, or separated. There was no significant change in the marital status of
adult TANF recipients across this time period. There were also no dramatic change in the
10
For details of poverty definition and thresholds, visit U.S. Census Website at
www.census.gov/hhes/poverty/threshld.html. 11
The estimates for income to poverty ratios of 0.50 to 0.99 and ratios of 0.25 to 0.49 were not statistically different
in any year. The estimates for income to poverty ratios of 0.50 to 0.99 and ratios below 0.25 were not statistically
different in 2006. 12
See Committee on Ways and Means. (2004). Green Book, Washington, DC: U.S. Government Printing Office: 7-
11. 13
On October 1, 2008, the federal Food Stamp Program was renamed the Supplemental Nutrition Assistance
Program (SNAP). 14
Women, Infants, and Children (WIC) provides supplemental foods, health care referrals, and nutrition education
to low-income pregnant women and to infants and children up to age 5. For more information on this program, visit
the Food and Nutrition Service website at www.fsn.usda.gov/wic.

Irving 9
educational attainment of TANF recipients, ages 18 and older, from 2004 to 2007. About 27
percent of adult TANF recipients lacked a high school degree, while about 41 percent had a high
school diploma, or equivalent, and about 32 percent had at least some college.
EMPLOYMENT AMONG TANF PARTICIPANT ADULTS
Table 2 examines the employment status of TANF-recipient women ages 18 to 64 and
compares them to (1) non-recipient women and (2) never married, non-recipient women ages 18
to 64 who were in families with children. Respondents who reported working at least 35 hours
in each week of the month are considered to be working full-time, while those who reported
working less than 35 hours one or more weeks of the month are considered working part-time.
All respondent who were not employed during the month are placed into one of two categories:
unemployed or not in labor force. Unemployment refers to those who are on layoff from a job or
are currently looking for work. Non-employed respondents who are neither laid-off from a job
nor looking for work are considered not in the labor force.
TANF recipient women ages 18 to 64 were less likely to be employed (about 23 percent)
than women not receiving TANF benefits (about 68 percent) and never married, non-recipient
women (about 64 percent) each year between 2004 and 2007.15
These differences in
employment were most pronounced for full-time employment, with an average of 6 percent of
TANF recipients working full-time between 2004 and 2007, compared to an average of 46
percent of non-recipient women and an average of 37 percent of never married, non-recipient
women.16
Conversely, TANF-recipient women were more likely than non-TANF women and
15
In 2007, the employment rate of non-TANF women was significantly higher than the rate for never married, non-
recipient women. In all other years, the differences were not statistically significant. 16
Non-TANF women had significantly higher rates of full-time employment compared to never married, non-
recipient women each year between 2004 and 2007.

Irving 10
never married, non-TANF women to be unemployed (an average of 12 percent, 3 percent, and 5
percent, respectively) and not in the labor force (an average of 65 percent, 28 percent, and 31
percent, respectively) between 2004 and 2007. 17
[Table 2 about here]
REASONS FOR NOT WORKING AND FOR WORKING PART-TIME
Given the differences in employment status between TANF, non-TANF, and never
married, non-TANF women, it is worth exploring whether there are differences in their reasons
for not working and for working part-time. Table 3 shows the reported reasons for not working
for TANF-recipient women, non-recipient women, and never married, non-recipient women who
were not employed between 2004 and 2007. During this time, TANF recipient women were less
likely than non-TANF women to say they were not working because they were pregnant or
caring for a child (an average of 36 percent compared to 62 percent, respectively), but more
likely to report this as a reason for non-work than never married, non-TANF women (an average
of 24 percent).18
About one-third of TANF recipients not in the labor force reported not working
because of health-related reasons, which was significantly higher than the rate of all non-TANF
women (an average of 12 percent) and never married, non-TANF women (an average of 14
17
Between 2004 and 2006, the unemployment rate of never married, non-TANF women was higher than that for
non-TANF women. This difference was not statistically significant in 2007. In 2007, never married, non-TANF
women were significantly more likely to report being not in the labor force than non-TANF women as a whole. The
differences were not statistically significant in the other years. 18
In 2006, the difference between TANF women and never married, non-TANF women was not statistically
significant. In all years, a significantly higher proportion of non-TANF women compared to never married, non-
TANF women reported not working because they were pregnant or caring for a child.

Irving 11
percent).19
TANF-recipient women were less likely than never married, non-TANF women to
report not working because of school attendance (an average of 19 percent compared to 48
percent, respectively).20
Finally, between 2004 and 2007, TANF-recipient women were
significantly less likely than non-TANF women to report not working because they had no
interest in working (an average of 1 percent compared to 3 percent, respectively).
[Table 3 about here]
Table 4 shows the reported reasons for working part-time for those TANF, non-TANF,
and never married, non-TANF women who were employed part-time between 2004 and 2007.
TANF women were less likely than non-recipient women to report working only part-time
because they wanted to work part-time in 2004 and 2005 (an average of 15 percent compared to
31 percent, respectively). However, in 2004 and 2005, about 19 percent of recipient women
worked part-time because they could not find full-time employment, compared to about 6.5
percent of all non-recipient women. Finally, TANF women were less likely than never married,
non-TANF women to report school attendance as a reason for working part-time between 2004
and 2007 (an average of 14 percent compared to 37 percent, respectively).21
[Table 4 about here]
19
The difference between non-TANF women and never married, non-TANF women was statistically significant in
2005. In all other years, the differences were not statistically significant. 20
In 2007, TANF women were significantly more likely than non-TANF women to report not working because of
school attendance. The differences were not significant in any other year. In all years, never married, non-TANF
women were more likely than non-TANF women to report not working because of school attendance. 21
The difference between TANF women and never married, non-TANF women was not statistically significant in
2006.

Irving 12
WORKING TANF RECIPIENTS VERSUS NON-WORKING TANF RECIPIENTS
Among TANF-recipient women, it is likely that those who work are different in some
ways from those who do not work. For example, those who are working may have higher
educational attainment and lower poverty rates than those who are not working. Table 5 shows
selected characteristics of TANF women ages 18 to 64 for 2004 through 2007 by employment
status. Employed TANF recipients (part-time and full-time) are compared to recipients with no
attachment to the labor force (unemployed and not in the labor force). Of those in the labor
force, an average 28 percent were working full-time and 73 percent were working part-time, and
of those not in the labor force, an average of 16 percent were unemployed 84 percent were not
working, not looking for work, not laid-off between 2004 and 2007.22
[Table 5 about here]
The characteristics of employed adult TANF recipients are not significantly different
from those of non-employed recipients in terms of race and Hispanic origin, other public
assistance receipt, and marital status. These two groups of TANF recipients do differ, however,
in terms of poverty status and educational attainment levels. Employed TANF recipients were
less likely to be in poverty than TANF recipients with no attachment to the labor force. On
average, between 2004 and 2007, 49 percent of employed TANF women had family income to
poverty ratios below 1.00 compared to 71 percent of TANF women who were not employed.23
Furthermore, an average of 4 percent of employed TANF women had income to poverty ratios
22
In each year, employed TANF recipients were significantly more likely to be working part-time than full-time,
and non-employed TANF recipients were significantly more likely to be not in the labor force than unemployed. 23
The difference was not statistically significant in 2006.

Irving 13
below 0.25, compared to an average of 17 percent of those who were not employed during this
time period. Finally, in 2004 and 2007, TANF women who were not employed were
significantly more likely to lack a high school degree than their employed counterparts (about 29
percent and 11 percent, respectively).24
FORMER AND CURRENT TANF RECIPIENTS
The Wave 1 topical module in the 2004 SIPP asked respondents whether they had ever
been authorized to receive AFDC or TANF. Respondents not receiving TANF at the time of the
interview who reported that had previous authorization to receive welfare are considered former
recipients for this analysis. Those receiving TANF at the time of the January 2004 interview are
considered current recipients, regardless of any previous welfare receipt. The characteristics of
all current TANF recipient women ages 18 to 64 are compared to those of former recipient
women ages 18 to 64 in Table 6. Current recipients look considerably different than former
recipients in many regards. Compared to former TANF recipients, current recipients were more
likely to be black, Asian, Hispanic, in poverty (at all levels), never married, unemployed, and not
in the labor force and to have less than a high school degree. In contrast, former TANF
recipients were more likely than current recipients to be white, non-Hispanic white, married,
widowed, divorced, or separated, and employed full-time and to have some college experience.
Finally, Table 6 shows that most former recipients have been on TANF one time before (86.4
percent), while 7.7 percent have received it twice, and 5.9 percent three or more times.
[Table 6 about here]
24
The estimates were not significantly different in 2005 and 2006.

Irving 14
DISCUSSION
The TANF Reauthorization legislation of 2005 placed added pressures on states to move
TANF participants either off the program or into employment. Yet, this study finds that there
was no significant change in TANF participation or in the employment status of TANF recipient
women ages 18 to 64 between 2004 and 2007. It should be noted, however, that results in this
study are at the national-level and do not examine state-specific trends. Some states may have
had more success than others in moving TANF recipients off the program or into employment
during this time period. In general, though, many states may face difficulty meeting federally-
mandated work participation requirements.
As expected, employment levels among TANF women were far below those of non-
TANF women and never married, non-TANF women, and unemployment and disengagement
from the labor force exceeded that of non-recipient women and never married, non-recipient
women. TANF recipients often face barriers to employment, which include physical and mental
health problems, domestic violence, low educational attainment, few job skills, inadequate
access to transportation, and perceived workplace discrimination. In fact, it is not unusual for
recipients to experience multiple barriers to employment, and the more barriers a woman faces,
the less likely she is to enter the labor force.25
Accordingly, a multifaceted approach is needed to
improve the labor force outcomes of TANF recipients.
There was no significant change in poverty rates among TANF-recipient women between
2004 and 2007, with about two-thirds falling below 100 percent of the income to poverty ratio.
25
See Danziger, Sandra et al., (2000), “Barriers to the Employment of Welfare Recipients” pps. 245-276 in
Prosperity for All?: The Economic Boom and African Americans, edited by Robert Cherry and William M. Rodgers
III, Russell Sage Foundation, New York.
Irving 15
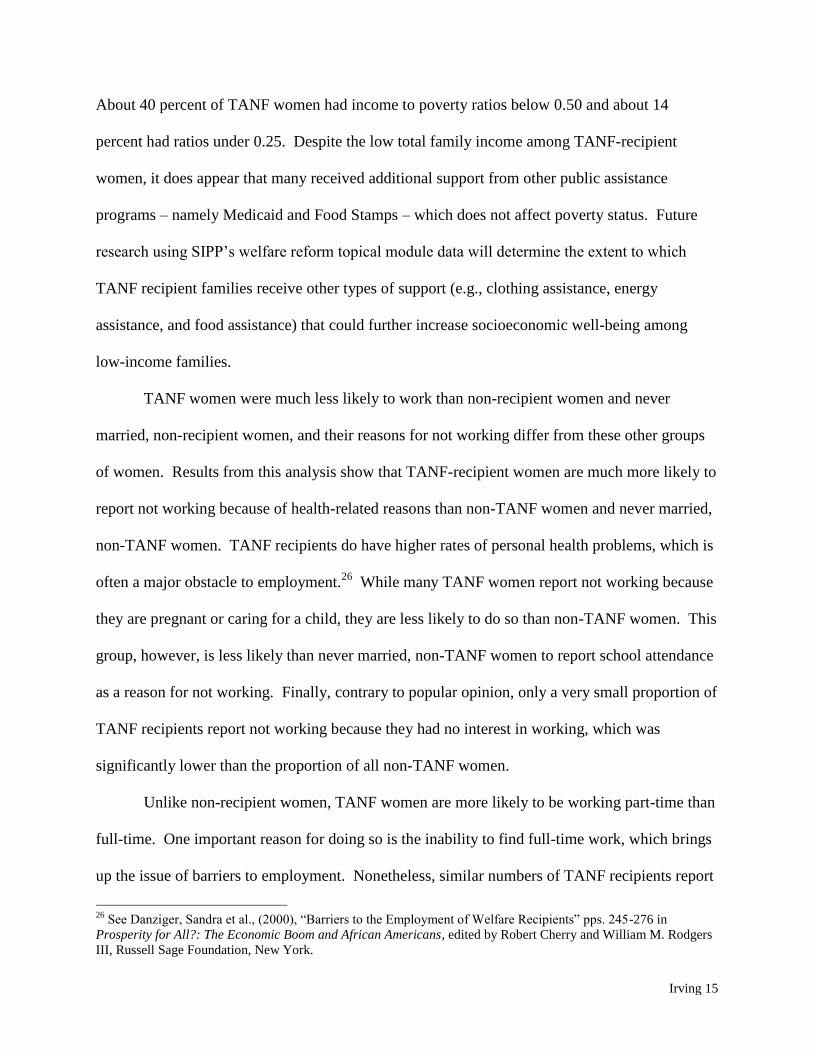
About 40 percent of TANF women had income to poverty ratios below 0.50 and about 14
percent had ratios under 0.25. Despite the low total family income among TANF-recipient
women, it does appear that many received additional support from other public assistance
programs – namely Medicaid and Food Stamps – which does not affect poverty status. Future
research using SIPP’s welfare reform topical module data will determine the extent to which
TANF recipient families receive other types of support (e.g., clothing assistance, energy
assistance, and food assistance) that could further increase socioeconomic well-being among
low-income families.
TANF women were much less likely to work than non-recipient women and never
married, non-recipient women, and their reasons for not working differ from these other groups
of women. Results from this analysis show that TANF-recipient women are much more likely to
report not working because of health-related reasons than non-TANF women and never married,
non-TANF women. TANF recipients do have higher rates of personal health problems, which is
often a major obstacle to employment.26
While many TANF women report not working because
they are pregnant or caring for a child, they are less likely to do so than non-TANF women. This
group, however, is less likely than never married, non-TANF women to report school attendance
as a reason for not working. Finally, contrary to popular opinion, only a very small proportion of
TANF recipients report not working because they had no interest in working, which was
significantly lower than the proportion of all non-TANF women.
Unlike non-recipient women, TANF women are more likely to be working part-time than
full-time. One important reason for doing so is the inability to find full-time work, which brings
up the issue of barriers to employment. Nonetheless, similar numbers of TANF recipients report
26
See Danziger, Sandra et al., (2000), “Barriers to the Employment of Welfare Recipients” pps. 245-276 in
Prosperity for All?: The Economic Boom and African Americans, edited by Robert Cherry and William M. Rodgers
III, Russell Sage Foundation, New York.

Irving 16
that they work only part-time because they wanted to. While this response could be attributed to
an unwillingness to work, it may indicate that part-time work helps recipients strike a balance
between earning income and caring for their children.
A comparison of TANF women who work to those who do not work shows few
differences between the two groups, except in terms of income to poverty ratios. When a TANF-
recipient woman is employed, her family is much less likely to be in poverty than if she were not
employed. Furthermore, TANF women who work are much less likely to have family income to
poverty ratios below 0.25 compared to TANF women who do not work. Yet, employment is no
guarantee that a family will rise out of poverty, as about one-half of employed TANF women
have income levels below the poverty threshold.
Finally, this analysis shows the difference between current and former TANF recipients.
While this analysis is unable to determine the reasons that current recipients differ from former
recipients, there is some room for speculation. One possibility is that the more advantaged
TANF recipients are the ones more likely to exit TANF, while the most disadvantaged remain on
the program. The differences in educational attainment may point to this explanation, as former
recipients are more likely to have some college experience and less likely to lack a high school
diploma than current recipients. Alternatively, leaving TANF for employment may facilitate
upward mobility. The higher employment rates among former recipients may suggest that this
group left welfare for work, which in turn led to higher family income and lower poverty rates
compared to those remaining on TANF.

Irving 17
Table 1. Selected Characteristics of TANF-Recipient Women Ages 18 to 64, 2004 to 2007
(Numbers in thousands)
2004 Average 2005 Average 2006 Average 2007 Average
TOTAL
90-Percent C.I. (+/-
)
TOTAL
90-Percent C.I. (+/-
)
TOTAL
90-Percent C.I. (+/-
)
TOTAL
90-Percent C.I. (+/-
)
TANF-recipient women (18-64) 756 97 740 104 731 150 812 162
As percent of total U.S. population
0.8 0.1 0.8 0.1 0.8 0.2 0.9 0.2
Race and Hispanic Origin
White 50.5 6.4 60.1 6.9 54.3 10.3 55.9 9.9
White, non-Hispanic 35.2 6.1 37.4 6.8 33.2 9.7 32.5 9.4
Black 40.3 6.3 31.8 6.5 34.2 9.8 34.9 9.5
Asian 3.4 2.3 2.6 2.3 3.2 3.6 2.0 2.8
Other race 5.8 3.0 5.4 3.2 8.3 5.7 7.1 5.1
Hispanic, of any race 20.2 5.2 26.6 6.2 23.8 8.8 25.3 8.7
Income to Poverty Ratio
Below Poverty Line 67.8 6.0 65.5 6.7 65.9 9.8 65.6 9.5
Between .50 and .99 23.5 5.4 27.1 6.2 24.4 8.8 23.6 8.5
Between .25 and .49 28.1 5.8 24.3 6.0 27.6 9.2 31.1 9.3
Below .25 16.2 4.7 14.2 4.9 13.9 7.1 10.9 6.2
Other Public Assistance
Medicaid 96.6 2.3 98.5 1.7 96.3 3.9 93.1 5.1
Food Stamps 90.2 3.8 90.1 4.2 92.6 5.4 87.2 6.7
WIC 12.6 4.3 11.0 4.4 9.0 5.9 10.9 6.2
Marital Status
Married 23.1 5.4 19.4 5.6 18.8 8.1 20.8 8.1
Widowed/divorced/separated 27.0 5.7 29.0 6.4 32.8 9.7 25.1 8.7
Never married 49.9 6.4 51.6 7.0 48.4 10.3 54.1 10.0
Educational Attainment
Less than high school diploma 28.5 5.8 25.5 6.1 24.9 8.9 22.1 8.3
High school diploma/equivalent 34.5 6.1 43.2 7.0 44.1 10.2 44.0 9.9
Some college or above 37.1 6.2 31.3 6.5 31.0 9.5 33.9 9.5
* Details may not add to total due to rounding.
Source: U.S. Census Bureau, Survey of Income and Program Participation, 2004 Panel.
For information on confidentiality protection, sampling and nonsampling error see http://www.census.gov/sipp/source.html.

Irving 18
Table 2. Employment Status of Women Ages 18 to 64 by TANF Status and Marital Status, 2004 to 2007
(Numbers in thousands)
TANF women
90-Percent C.I. (+/-)
Non-TANF women
1
90-Percent C.I. (+/-)
Never married,
non-TANF women
1
90-Percent C.I. (+/-)
2004 756 43,059 8,401
Employed 25.0 5.6 69.0 0.8 67.1 1.8
Full-time 8.4 3.6 46.4 0.8 39.2 1.9
Part-time 16.6 4.8 22.5 0.7 27.9 1.7
Unemployed 12.0 4.2 4.0 0.3 5.7 0.9 Not in Labor Force 63.0 6.2 27.0 0.8 27.2 1.7
2005 740 43,740 9,064
Employed 24.1 6.0 69.1 0.8 67.2 1.9
Full-time 8.2 3.9 46.8 0.9 39.6 2.0
Part-time 15.9 5.1 22.3 0.8 27.6 1.8
Unemployed 12.0 4.6 3.1 0.3 5.7 0.9 Not in Labor Force 63.9 6.8 27.8 0.8 27.1 1.8
2006 731 44,069 9,419
Employed 20.3 8.3 69.8 1.2 67.9 2.7
Full-time 3.2 3.6 46.7 1.3 40.6 2.8
Part-time 17.2 7.8 23.1 1.1 27.3 2.6
Unemployed 11.6 6.6 2.3 0.4 4.7 1.2 Not in Labor Force 68.1 9.6 27.8 1.2 27.4 2.6
2007 812 39,762 8,392
Employed 20.6 8.1 65.7 1.4 51.9 3.1
Full-time 5.6 4.6 44.0 1.4 29.5 2.8
Part-time 15.1 7.2 21.7 1.2 22.4 2.6
Unemployed 13.8 6.9 4.0 0.6 5.3 1.4 Not in Labor Force 65.6 9.5 30.3 1.3 42.8 3.1
* Details may not add to total due to rounding.
1Unrelated individuals and women who do not belong to families with children are not included in this table.
Source: U.S. Census Bureau, Survey of Income and Program Participation, 2004 Panel. For information on confidentiality protection, sampling and nonsampling error see http://www.census.gov/sipp/source.html.

Irving 19
Table 3. Reasons for Not Working of Women Ages 18 to 64 by TANF Status and Marital Status, 2004 to 2007
(Numbers in thousands)
TANF women Non-TANF
women1
Never married, non-TANF women
1
TOTAL
90-Percent C.I. (+/-
)
TOTAL
90-Percent C.I. (+/-
)
TOTAL
90-Percent C.I. (+/-
)
2004 512 12,097 2,345
Pregnancy/childrearing 36.7 7.5 64.1 1.5 27.5 3.3
Health-related 34.9 7.4 12.9 1.1 14.6 2.6
School 15.8 5.7 10.5 1.0 40.0 3.6
Unable to find work/layoff 8.9 4.4 4.9 0.7 11.2 2.3
No interest in working 1.0 1.5 3.1 0.6 2.7 1.2
Retired 0.8 1.4 2.4 0.5 0.7 0.6
Other 1.9 2.1 2.1 0.5 3.4 1.3
2005 524 12,169 2,508
Pregnancy/childrearing 41.9 8.2 63.6 1.7 26.2 3.4
Health-related 37.7 8.1 13.7 1.2 17.0 2.9
School 11.8 5.4 11.3 1.1 40.9 3.8
Unable to find work/layoff 5.8 3.9 4.4 0.7 10.9 2.4
No interest in working 1.1 1.8 3.2 0.6 2.6 1.2
Retired 0.5 1.2 2.3 0.5 0.3 0.4
Other 1.1 1.7 1.4 0.4 2.0 1.1
2006 545 12,037 2,576
Pregnancy/childrearing 36.7 11.5 63.5 2.4 26.8 4.9
Health-related 40.9 11.7 14.2 1.8 17.6 4.2
School 11.5 7.6 11.8 1.6 42.6 5.4
Unable to find work/layoff 6.4 5.8 3.8 1.0 8.0 3.0
No interest in working 0.8 2.2 3.4 0.9 1.8 1.5
Retired 1.0 2.4 1.7 0.7 0.6 0.9
Other 2.6 3.8 1.7 0.7 2.5 1.7
2007 597 12,448 3,652
Pregnancy/childrearing 30.4 10.7 58.4 2.5 14.8 3.3
Health-related 22.8 9.8 8.8 1.4 7.8 2.5
School 36.0 11.2 23.4 2.2 68.3 4.4
Unable to find work/layoff 7.4 6.1 4.2 1.0 6.0 2.2
No interest in working 0.4 1.4 2.5 0.8 1.7 1.2
Retired 0.0 0.0 0.6 0.4 0.0 0.0
Other 3.0 4.0 2.0 0.7 1.5 1.1
* Details may not add to total due to rounding. 1
Unrelated individuals and women who do not belong to families with children are not included in this table.
Source: U.S. Census Bureau, Survey of Income and Program Participation, 2004 Panel. For information on confidentiality protection, sampling and nonsampling error see http://www.census.gov/sipp/source.html.

Irving 20
Table 4. Reasons for Working Part-time of Women Ages 18 to 64 by TANF Status and Marital Status, 2004 to 2007
(Numbers in thousands)
TANF women Non-TANF
women1
Never married, non-TANF women
1
TOTAL
90-Percent C.I. (+/-
)
TOTAL
90-Percent C.I. (+/-
)
TOTAL
90-Percent C.I. (+/-
)
2004 165
12,943
2,972
Wanted to work part-time 18.1 10.6 29.3 1.4 16.8 2.4
Could not find full-time job 16.8 10.3 6.5 0.8 11.7 2.1
Health-related 8.1 7.5 4.6 0.6 3.7 1.2
School 11.8 8.8 9.9 0.9 34.5 3.1
Taking care of a child 10.0 8.3 15.9 1.1 7.0 1.7
Slack work/material shortage 13.3 9.3 8.5 0.9 9.0 1.8
Full-time workweek is less than 35 hours 13.5 9.4 9.1 0.9 8.0 1.8
Other 8.4 7.6 16.3 1.1 9.3 1.9
2005 145
12,805
3,125
Wanted to work part-time 11.4 10.1 32.0 1.6 19.0 2.7
Could not find full-time job 20.5 12.8 6.5 0.8 10.9 2.1
Health-related 11.9 10.3 4.5 0.7 3.7 1.3
School 12.0 10.3 10.5 1.0 36.4 3.3
Taking care of a child 22.3 13.2 15.4 1.2 5.9 1.6
Slack work/material shortage 7.3 8.3 7.7 0.9 8.6 1.9
Full-time workweek is less than 35 hours 5.0 6.9 7.9 0.9 6.8 1.7
Other 9.6 9.3 15.5 1.2 8.8 1.9
2006 151
13,298
3,268
Wanted to work part-time 17.0 17.0 33.5 2.3 20.1 3.9
Could not find full-time job 11.1 14.2 6.7 1.2 10.4 3.0
Health-related 19.0 17.7 4.2 1.0 2.6 1.5
School 18.9 17.7 10.5 1.5 35.4 4.7
Taking care of a child 8.5 12.6 14.9 1.7 6.3 2.4
Slack work/material shortage 7.4 11.9 7.6 1.3 9.1 2.8
Full-time workweek is less than 35 hours 10.3 13.7 7.9 1.3 7.4 2.6
Other 7.9 12.2 14.7 1.7 8.7 2.7
2007 165
11,473
2,393
Wanted to work part-time 15.6 16.1 28.9 2.4 18.2 4.5
Could not find full-time job 13.1 15.0 6.4 1.3 9.6 3.4
Health-related 16.8 16.6 4.0 1.0 2.3 1.8
School 11.6 14.2 10.6 1.6 40.3 5.7
Taking care of a child 7.8 11.9 16.9 2.0 7.3 3.0
Slack work/material shortage 18.0 17.0 7.6 1.4 6.6 2.9
Full-time workweek is less than 35 hours 8.5 12.4 8.5 1.5 6.9 3.0
Other 8.6 12.5 17.1 2.0 8.7 3.3
* Details may not add to total due to rounding.
1Unrelated individuals and women who do not belong to families with children are not included in this table.
Source: U.S. Census Bureau, Survey of Income and Program Participation, 2004 Panel.

Irving 21
For information on confidentiality protection, sampling and nonsampling error see http://www.census.gov/sipp/source.html.

Table 5. Selected Characteristics of Working-age Female TANF Recipients in 2004 and 2007, by Employment Status (Numbers in thousands)
2004 2005 2006 2007
Employed Not employed Employed Not employed Employed Not employed Employed Not employed
TOTAL 90-
Percent C.I. (+/-)
TOTAL 90-
Percent C.I. (+/-)
TOTAL 90-
Percent C.I. (+/-)
TOTAL 90-
Percent C.I. (+/-)
TOTAL 90-
Percent C.I. (+/-)
TOTAL 90-
Percent C.I. (+/-)
TOTAL 90-
Percent C.I. (+/-)
TOTAL 90-
Percent C.I. (+/-)
Female TANF recipients (18-64) 189 567 179 561 149 583 168
645
Employment status
Employed full-time 33.5 12.1
34.1 13.6
15.5 16.6
26.9 19.526
Employed part-time 66.5 12.1
65.9 13.6
84.5 16.6
73.1 19.526
Unemployed
16.0 5.4 15.8 5.9 14.5 8.1
17.3 8.5
Not in labor force
84.0 5.4 84.2 5.9 85.5 8.1
82.7 8.5
Race and Hispanic Origin
White 41.9 12.7 53.4 7.4 55.0 14.2 61.7 7.8 31.4 21.2 60.1 11.3 47.7 22.0 58.1 11.1
Non-Hispanic White 30.3 11.8 36.8 7.1 39.9 14.0 36.6 7.8 29.9 20.9 34.1 10.9 32.1 20.5 32.6 10.5
Black 47.2 12.8 38.0 7.2 32.6 13.4 31.6 7.5 49.6 22.9 30.3 10.6 37.4 21.3 34.3 10.7
Asian 2.4 3.9 3.7 2.8 3.8 5.5 2.3 2.4 8.6 12.8 1.8 3.1 0.6 3.3 2.4 3.4
Other race 8.5 7.2 4.9 3.2 8.6 8.0 4.4 3.3 10.4 13.9 7.8 6.2 14.3 15.4 5.2 5.0
Hispanic (of any race) 17.4 9.7 21.2 6.1 20.1 11.5 28.7 7.3 4.7 9.7 28.6 10.4 19.1 17.3 26.9 10.0
Income to Poverty Ratio
Below poverty line 50.5 12.8 73.5 6.5 49.3 14.3 70.7 7.3 52.1 22.8 69.4 10.6 42.2 21.7 71.7 10.1
Between .50 and .99 28.9 11.6 21.7 6.1 29.2 13.0 26.4 7.1 28.2 20.6 23.4 9.8 26.7 19.5 22.8 9.4
Between .25 and .49 15.4 9.3 32.3 6.9 17.0 10.7 26.6 7.1 20.2 18.3 29.6 10.5 14.4 15.5 35.5 10.7
Below .25 6.3 6.2 19.5 5.9 3.2 5.0 17.7 6.2 3.7 8.6 16.4 8.6 1.1 4.6 13.5 7.7
Other Public Assistance
Food Stamps 87.2 8.6 91.2 4.2 86.7 9.7 91.2 4.6 89.7 13.9 93.3 5.8 86.0 15.3 87.5 7.4
WIC 16.9 9.6 11.2 4.7 11.4 9.1 10.9 5.0 13.4 15.6 7.9 6.2 12.0 14.3 10.7 6.9
Medicaid 95.2 5.5 97.0 2.5 96.2 5.5 99.3 1.4 94.3 10.6 96.9 4.0 94.0 10.4 92.9 5.8
Marital Status
Married 20.8 10.4 23.9 6.3 24.3 12.3 17.8 6.2 20.0 18.3 18.5 9.0 20.6 17.8 20.8 9.1
Widowed/divorced/separated 26.5 11.3 27.1 6.6 28.7 12.9 29.0 7.3 31.1 21.2 33.3 10.9 40.9 21.6 21.0 9.1
Never married 52.7 12.8 49.0 7.4 46.9 14.3 53.1 8.1 49.0 22.9 48.2 11.5 38.5 10.9 58.2 11.1
Educational Attainment
Less than high school diploma 16.5 9.5 32.5 6.9 20.8 11.6 27.0 7.2 19.6 18.1 26.2 10.2 5.8 10.3 26.4 9.9
High school diploma/equivalent 36.9 12.4 33.6 7.0 40.5 14.0 44.1 8.0 33.7 21.6 46.8 11.5 45.6 21.9 43.5 11.1
Some college or above 46.5 12.8 33.9 7.0 38.7 13.9 28.9 7.3 46.8 22.8 27.0 10.3 48.6 22.0 30.1 10.3
* Details may not add to total due to rounding.
1Unrelated individuals and women who do not belong to families with children are not included in this table.
Source: U.S. Census Bureau, Survey of Income and Program Participation, 2004 Panel.
For information on confidentiality protection, sampling and nonsampling error see http://www.census.gov/sipp/source.html.

Table 6. Selected Characteristics of Former and Current TANF Recipients: January 2004
(Numbers in thousands)
January 2004
Current TANF recipients Former TANF recipients
TOTAL 90-Percent
C.I. (+/-) TOTAL
90-Percent C.I. (+/-)
Recipients 18 and over 730 6,502
Race and Hispanic Origin
White 51.8 6.5 65.1 2.1
Non-Hispanic White 33.9 6.2 53.5 2.2
Black 40.1 6.4 28.8 2.0
Asian 2.6 2.1 0.4 0.3
Other race 5.5 3.0 5.8 1.0
Hispanic (of any race) 22.4 5.4 13.3 1.5
Income to Poverty Ratio
Below Poverty Line 74.8 5.5 27.7 2.0
Between .50 and .99 23.6 5.4 15.9 1.6
Between .25 and .49 32.9 5.9 4.7 0.9
Below .25 18.3 4.9 7.0 1.1
Marital Status
Married 26.0 5.5 38.8 2.1
Widowed/divorced/separated 26.5 5.6 37.4 2.1
Never married 47.5 6.3 23.8 1.9
Educational Attainment
Less than high school diploma 37.0 6.1 16.7 1.6
High school diploma/equivalent 29.9 5.8 25.7 1.9
Some college or above 33.2 5.9 57.6 2.2
Employment status
Full-time employment 7.0 3.2 47.6 2.2
Part-time employment 18.4 4.9 20.0 1.7
Unemployed 12.4 4.2 4.6 0.9
Not in labor force 62.3 6.1 27.8 2.0
Times on TANF
Once 86.4 1.5
Twice 7.7 1.2
Three or more times 5.9 1.0
* Details may not add to total due to rounding. 1All TANF recipients ages 18 to 64 and former TANF recipients ages 18 to 64 are included in this
table.
Source: U.S. Census Bureau, Survey of Income and Program Participation, 2004 Panel. For information on confidentiality protection, sampling and nonsampling error see http://www.census.gov/sipp/source.html.
Related Documents