bank bjb “Tandamata Untuk Negeri” 1Q 2019 Company Report

Welcome message from author
This document is posted to help you gain knowledge. Please leave a comment to let me know what you think about it! Share it to your friends and learn new things together.
Transcript

bank bjb“Tandamata Untuk Negeri”
1Q 2019 Company Report
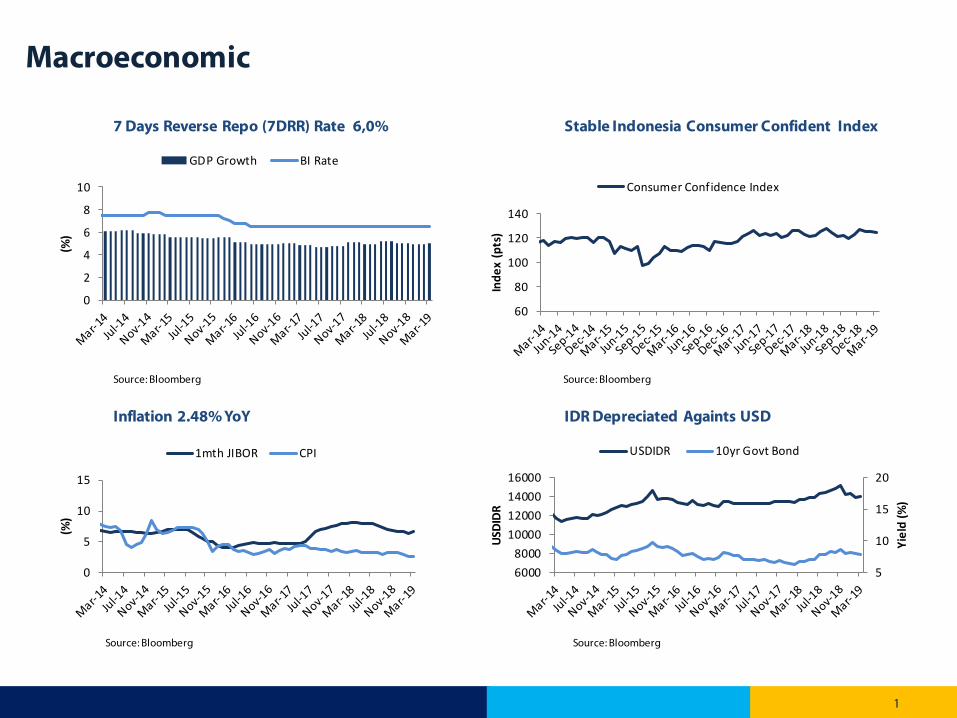
Macroeconomic
Source: Bloomberg Source: Bloomberg
Source: Bloomberg Source: Bloomberg
Stable Indonesia Consumer Confident Index 7 Days Reverse Repo (7DRR) Rate 6,0%
IDR Depreciated Againts USDInflation 2.48% YoY
0
2
4
6
8
10
(%)
GDP Growth BI Rate
60
80
100
120
140
Inde
x (p
ts)
Consumer Confidence Index
0
5
10
15
(%)
1mth JIBOR CPI
5
10
15
20
60008000
10000120001400016000
Yiel
d (%
)
USDI
DR
USDIDR 10yr Govt Bond
1
Feb ’18 Feb ’19 YoY (%)
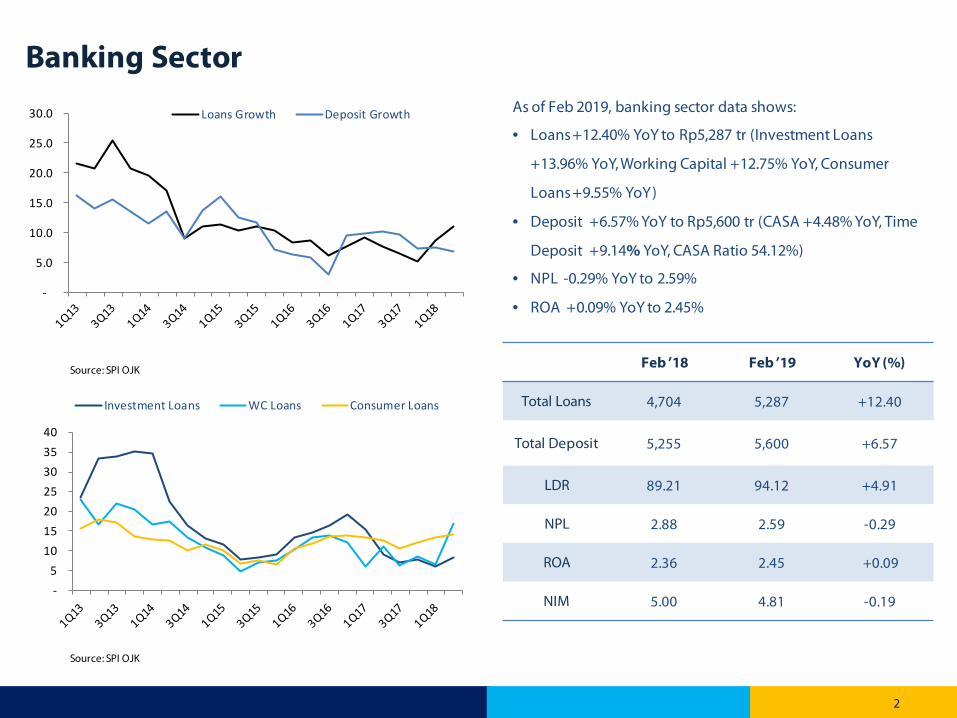
Total Loans 4,704 5,287 +12.40
Total Deposit 5,255 5,600 +6.57
LDR 89.21 94.12 +4.91
NPL 2.88 2.59 -0.29
ROA 2.36 2.45 +0.09
NIM 5.00 4.81 -0.19
As of Feb 2019, banking sector data shows:
• Loans +12.40% YoY to Rp5,287 tr (Investment Loans
+13.96% YoY, Working Capital +12.75% YoY, Consumer
Loans+9.55% YoY)
• Deposit +6.57% YoY to Rp5,600 tr (CASA +4.48% YoY, Time
Deposit +9.14% YoY, CASA Ratio 54.12%)
• NPL -0.29% YoY to 2.59%
• ROA +0.09% YoY to 2.45%
Source: SPI OJK
Source: SPI OJK
-
5.0
10.0
15.0
20.0
25.0
30.0 Loans Growth Deposit Growth
- 5
10 15 20 25 30 35 40
Investment Loans WC Loans Consumer Loans
Banking Sector
2
3
1Q 2019 Performance
Consolidated

Result Summary
4
• Net Interest Income at Rp 1.5 tr (-2.0% YoY)• PPOP at Rp 627 bn (-6.3% YoY)• LLP at Rp 62 bn (+3.7% YoY)• Net Income at Rp 421 bn (-9.1% YoY)
Income Statement
• Total Loansat Rp 75.8 tr (+6.2% YoY)• Total Financing at Rp 4.8 tr (-4.1% YoY)• Total Deposits at Rp 90.2 tr (-2.8% YoY)• Total Asset at Rp 117.7 tr (+0.8% YoY)
Balance Sheet
• NIM at 5.9% (-11 bps YoY)• ROA (Net) at 1.5% (-12 bps YoY)• ROE (Net) at 12.4% (-474 bps YoY)• NPL (Gross) at 1.68% (+6 bps YoY)
Ratios(bank only)
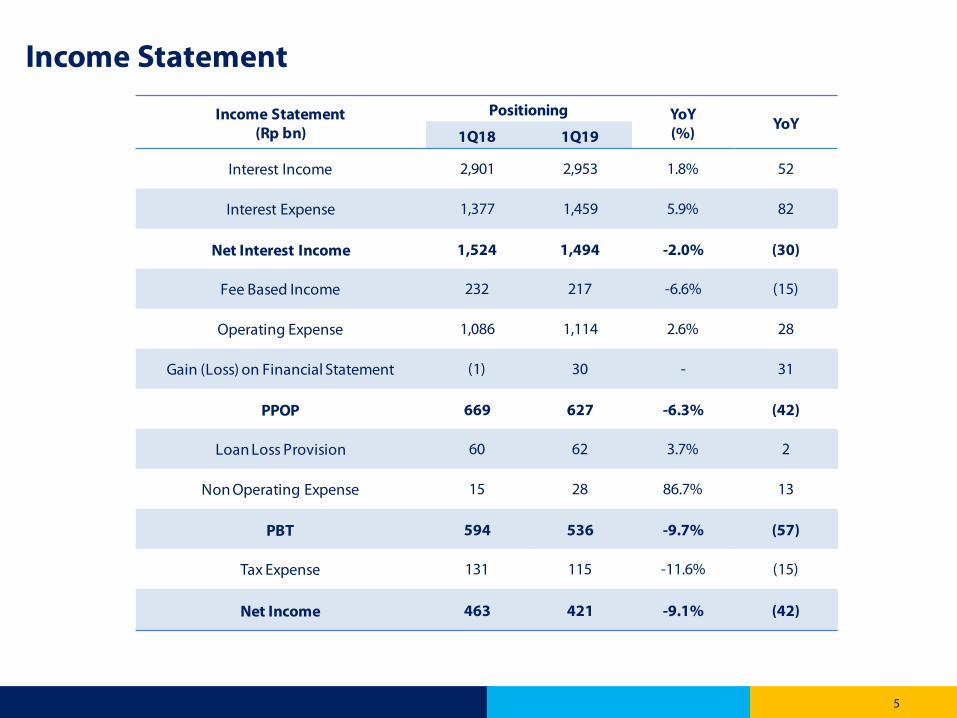
Income Statement
5
Income Statement (Rp bn)
Positioning YoY(%) YoY
1Q18 1Q19
Interest Income 2,901 2,953 1.8% 52
Interest Expense 1,377 1,459 5.9% 82
Net Interest Income 1,524 1,494 -2.0% (30)
Fee Based Income 232 217 -6.6% (15)
Operating Expense 1,086 1,114 2.6% 28
Gain (Loss) on Financial Statement (1) 30 - 31
PPOP 669 627 -6.3% (42)
Loan Loss Provision 60 62 3.7% 2
Non Operating Expense 15 28 86.7% 13
PBT 594 536 -9.7% (57)
Tax Expense 131 115 -11.6% (15)
Net Income 463 421 -9.1% (42)

Balance Sheet
6
Balance Sheet(Rp bn)
1Q18 2Q18 3Q18 4Q18 1Q19 YoY(%)
Cash 1,560 2,108 1,575 2,929 1,754 12.4%
Current Account with BI 6,645 5,834 4,474 9,981 4,675 -29.6%
Secondary Reserves 27,978 23,840 23,601 22,568 25,824 -7.7%
Loans - net 70,804 71,751 74,096 74,703 75,113 6.1%
Financing - net 4,064 3,971 4,170 4,503 4,657 14.6%
Fixed Asset - net 2,929 2,954 3,022 3,271 3,244 10.8%
Other Asset 2,831 2,977 3,147 2,235 2,490 -12.0%
Total Asset 116,811 113,435 114,084 120,191 117,756 0.8%
Total Third Party Fund 92,792 88,829 89,467 87,003 90,160 -2.8%
Debt Securities Issued 2,488 1,493 3,243 4,237 4,238 70.3%
Fund Borrowings 10,123 9,687 7,868 11,034 9,540 -5.8%
Repo - 450 - 3,853 - -
Others 1,717 1,844 1,930 2,779 2,113 23.1%
Total Liabilities 107,120 102,303 102,508 108,906 106,050 -1.0%
Total Equity 9,691 11,132 11,577 11,285 11,706 20.8%

Key Ratios (bank only)
7
Key Ratios 1Q18 2Q18 3Q18 4Q18 1Q19
Profitability
ROA (net) 1.6 1.6 1.6 1.4 1.5
ROE (net) 17.2 16.0 15.5 13.1 12.4
Cost Ratios
Cost to Income Ratio 62.7 63.8 63.7 66.3 66.3
Expenses Ratio 80.2 80.4 80.7 84.2 82.2
Yield
Asset Yield 10.9 11.1 11.3 11.3 11.2
Cost of Fund 4.9 4.8 4.9 5.0 5.5
NIM 6.0 6.3 6.5 6.4 5.9
LDR 81.6 86.4 88.3 91.9 88.9
Asset Quality
Special Mention Loans 2.9 3.4 3.1 2.6 3.1
Gross NPL 1.62 1.61 1.58 1.65 1.68
Net NPL 0.94 1.03 1.05 0.90 0.93
Coverage Ratio 46.9 41.5 39.1 50.8 51.2
Provision/Total Loans 0.8 0.7 0.6 0.8 0.9
Capital
CAR 17.3 17.4 17.5 18.6 18.6
1Q 2019 PerformanceBank Only Details
8

Target vs. Realization
(%) Target 1Q18 2Q18 3Q18 4Q18 1Q19
LoansGrowth 10% - 11% 13.2 5.9 5.2 6.1 6.2
Deposit Growth 9% - 10% 11.3 5.2 -2.8 0.7 -2.5
ROA (net) 1.5% - 2% 1.6 1.6 1.6 1.4 1.5
ROE (net) 15% - 20% 17.2 16.0 15.5 13.1 12.4
NIM 6% - 6.5% 6.0 6.3 6.5 6.4 5.9
Cost of Fund 5% - 5.5% 4.9 4.8 4.9 5.0 5.5
Cost to Income Ratio 60% - 70% 62.7 63.8 63.7 66.3 66.3
Gross NPL 1.5% - 2% 1.62 1.61 1.58 1.65 1.68
CASA Ratio 47% - 52% 46.3 51.2 51.8 47.1 48.8
9

Loans Breakdown
Segment (Rp bn) 1Q18 1Q19
YoY(%)
Consumer 47,885 52,898 10.5%
Micro 4,972 5,524 11.1%
Commercial 12,641 11,045 -12.6%
Mortgage 5,509 5,944 7.9%
Total Gross Loans 71,008 75,411 6.2%
Currency(Rp bn) 1Q18 1Q19
YoY(%)
IDR 70,646 75,239 6.5%
Forex 362 172 -52.5%
45.1 46.2 46.8 47.1 47.9 48.7 49.1 51.5 52.9
3.8 4.4 4.6 4.7 5.0 5.2 5.3 5.5 5.5
9.2 12.4
14.0 13.6 12.6 12.4 14.1 12.2 11.0
4.7
4.9 5.1 5.3 5.5 5.6
5.7 5.8 5.9
0
10
20
30
40
50
60
70
80
(Rp
tr)
Consumer Micro Commercial Mortgage
10

Consumer Loans
Key Indicators 1Q18 1Q19YoY(%)
Loans Outstanding 47,885 52,898 10.5%
Net ExpansionYtD
(Rp bn)805 1,418 76.2%
Avg. Loans Outstanding
(Rp mn)114 121 6.4%
No of Account 420,102 436,316 3.9%
Interest Rate 11.00% - 15.50% eff. p.a
Asset Quality(%) 1Q18 1Q19 YoY
Special Mention 1.9 1.9 -
NPL 0.3 0.2 -0.1
36.6 36.9 37.1 37.0 37.3 37.8 37.8 38.5 39.1
8.5 9.3 9.7 10.1 10.6 10.9 11.3 12.9 13.8
0.0
0.1
0.2
0.3
0.4
0.5
0.6
0.7
0.8
0.9
1.0
0
10
20
30
40
50
60
(%)
(Rp
tr)
Civil Servant Loans (LHS) Pensioner Loans (LHS)
NPL (RHS)
11
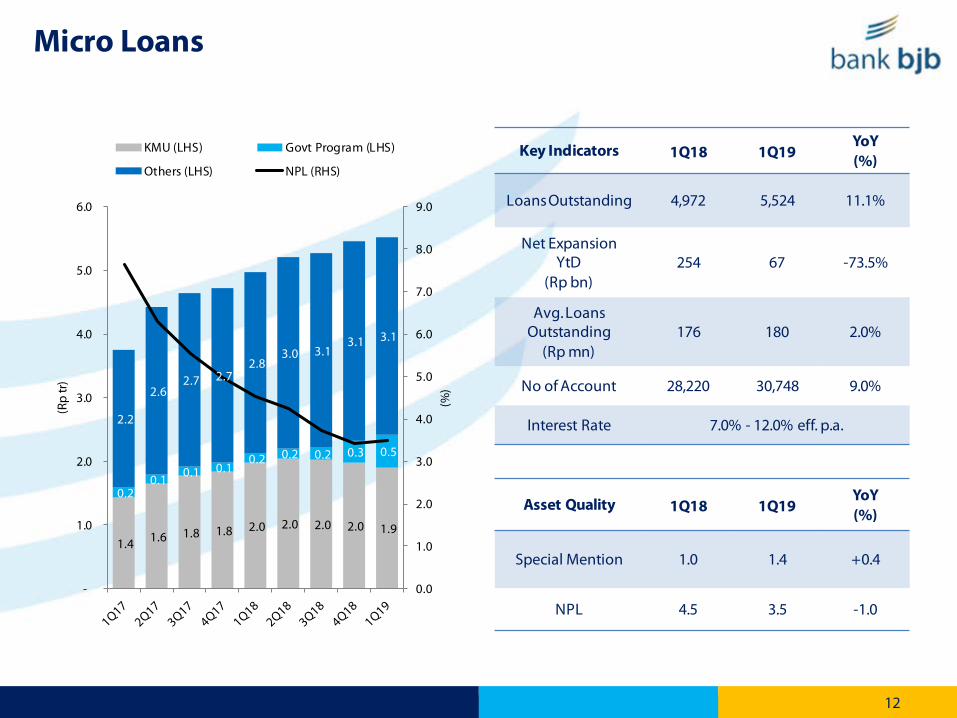
Micro Loans
Asset Quality 1Q18 1Q19YoY(%)
Special Mention 1.0 1.4 +0.4
NPL 4.5 3.5 -1.0
Key Indicators 1Q18 1Q19YoY(%)
Loans Outstanding 4,972 5,524 11.1%
Net ExpansionYtD
(Rp bn)254 67 -73.5%
Avg. Loans Outstanding
(Rp mn)176 180 2.0%
No of Account 28,220 30,748 9.0%
Interest Rate 7.0% - 12.0% eff. p.a.
1.4 1.6 1.8 1.8 2.0 2.0 2.0 2.0 1.9
0.2 0.1 0.1 0.1
0.2 0.2 0.2 0.3 0.5
2.2
2.6 2.7 2.7
2.8 3.0 3.1
3.1 3.1
0.0
1.0
2.0
3.0
4.0
5.0
6.0
7.0
8.0
9.0
-
1.0
2.0
3.0
4.0
5.0
6.0
(%)
(Rp
tr)
KMU (LHS) Govt Program (LHS)
Others (LHS) NPL (RHS)
12
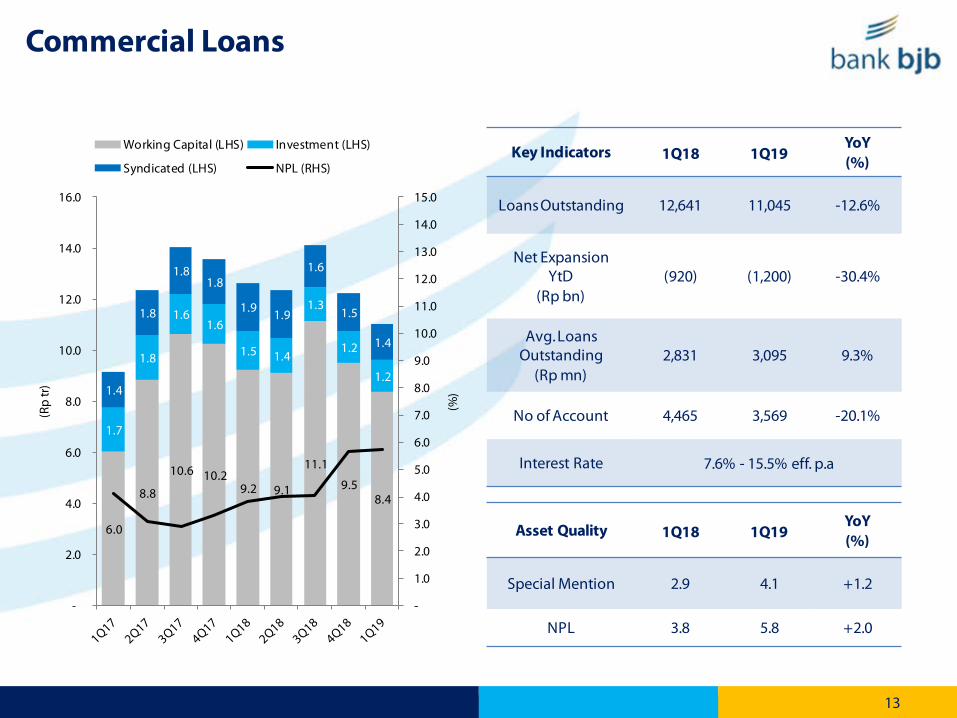
Commercial Loans
Key Indicators 1Q18 1Q19YoY(%)
Loans Outstanding 12,641 11,045 -12.6%
Net ExpansionYtD
(Rp bn)(920) (1,200) -30.4%
Avg. Loans Outstanding
(Rp mn)2,831 3,095 9.3%
No of Account 4,465 3,569 -20.1%
Interest Rate 7.6% - 15.5% eff. p.a
Asset Quality 1Q18 1Q19YoY(%)
Special Mention 2.9 4.1 +1.2
NPL 3.8 5.8 +2.0
6.0
8.8
10.6 10.2 9.2 9.1
11.1
9.5 8.4
1.7
1.8
1.6 1.6
1.5 1.4
1.3
1.2
1.2 1.4
1.8
1.8 1.8
1.9 1.9
1.6
1.5
1.4
-
1.0
2.0
3.0
4.0
5.0
6.0
7.0
8.0
9.0
10.0
11.0
12.0
13.0
14.0
15.0
-
2.0
4.0
6.0
8.0
10.0
12.0
14.0
16.0
(%)
(Rp
tr)
Working Capital (LHS) Investment (LHS)
Syndicated (LHS) NPL (RHS)
13
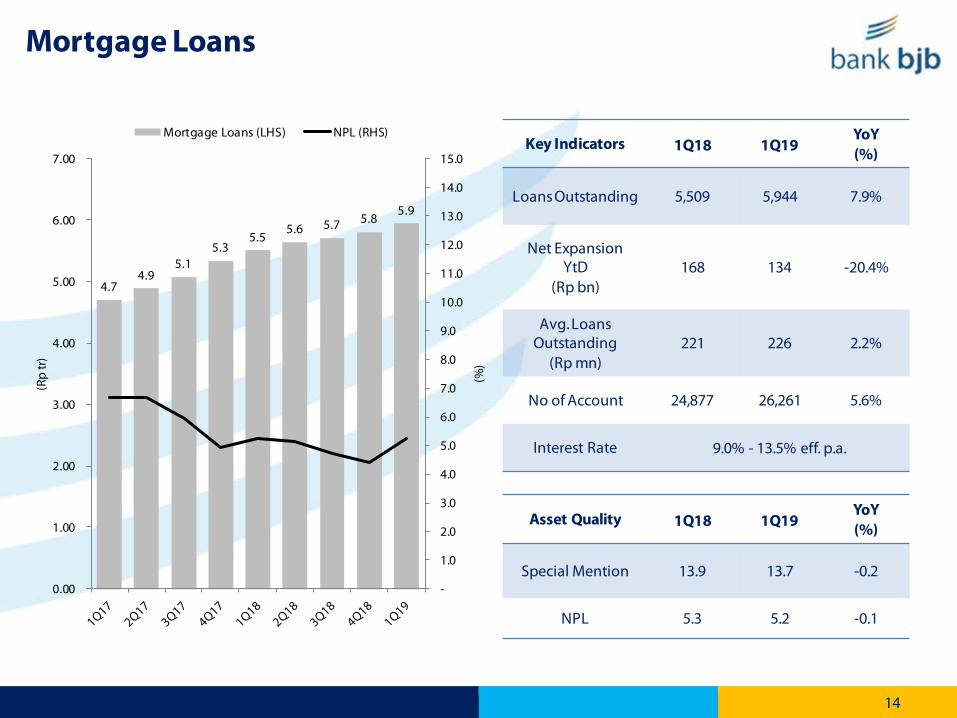
Mortgage Loans
Key Indicators 1Q18 1Q19YoY(%)
Loans Outstanding 5,509 5,944 7.9%
Net ExpansionYtD
(Rp bn)168 134 -20.4%
Avg. Loans Outstanding
(Rp mn)221 226 2.2%
No of Account 24,877 26,261 5.6%
Interest Rate 9.0% - 13.5% eff. p.a.
Asset Quality 1Q18 1Q19YoY(%)
Special Mention 13.9 13.7 -0.2
NPL 5.3 5.2 -0.1
4.7 4.9
5.1 5.3
5.5 5.6 5.7 5.8
5.9
-
1.0
2.0
3.0
4.0
5.0
6.0
7.0
8.0
9.0
10.0
11.0
12.0
13.0
14.0
15.0
0.00
1.00
2.00
3.00
4.00
5.00
6.00
7.00
(%)
(Rp
tr)
Mortgage Loans (LHS) NPL (RHS)
14
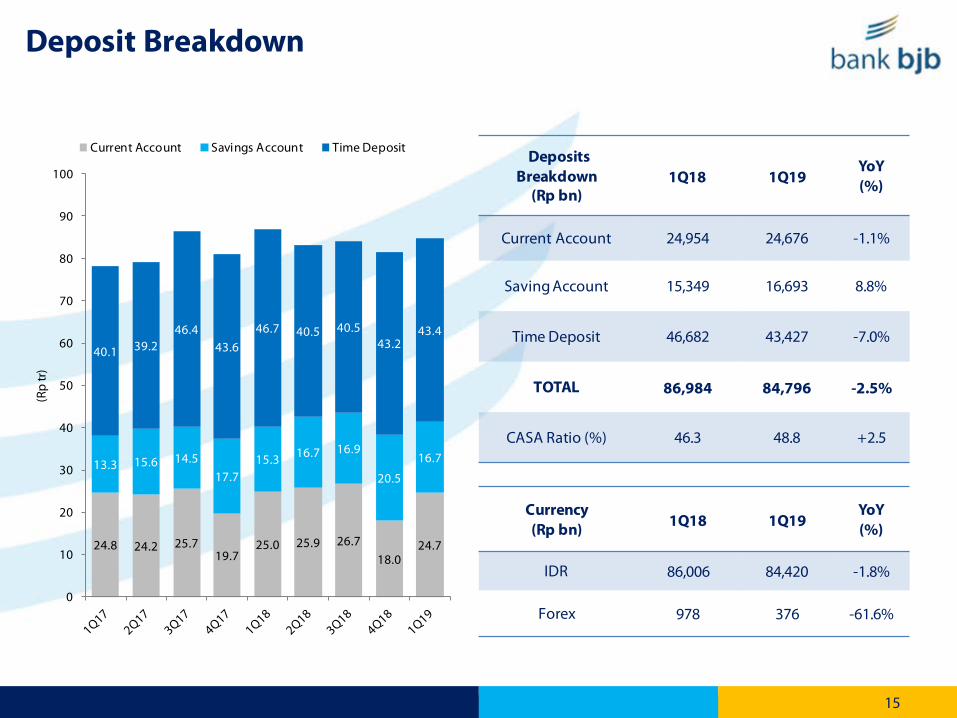
Deposit Breakdown
Deposits Breakdown
(Rp bn)1Q18 1Q19
YoY(%)
Current Account 24,954 24,676 -1.1%
Saving Account 15,349 16,693 8.8%
Time Deposit 46,682 43,427 -7.0%
TOTAL 86,984 84,796 -2.5%
CASA Ratio (%) 46.3 48.8 +2.5
Currency(Rp bn) 1Q18 1Q19
YoY(%)
IDR 86,006 84,420 -1.8%
Forex 978 376 -61.6%
24.8 24.2 25.719.7
25.0 25.9 26.718.0
24.7
13.3 15.6 14.517.7
15.3 16.7 16.9
20.5
16.7
40.1 39.246.4
43.646.7 40.5 40.5
43.243.4
0
10
20
30
40
50
60
70
80
90
100
(Rp
tr)
Current Account Savings Account Time Deposit
15
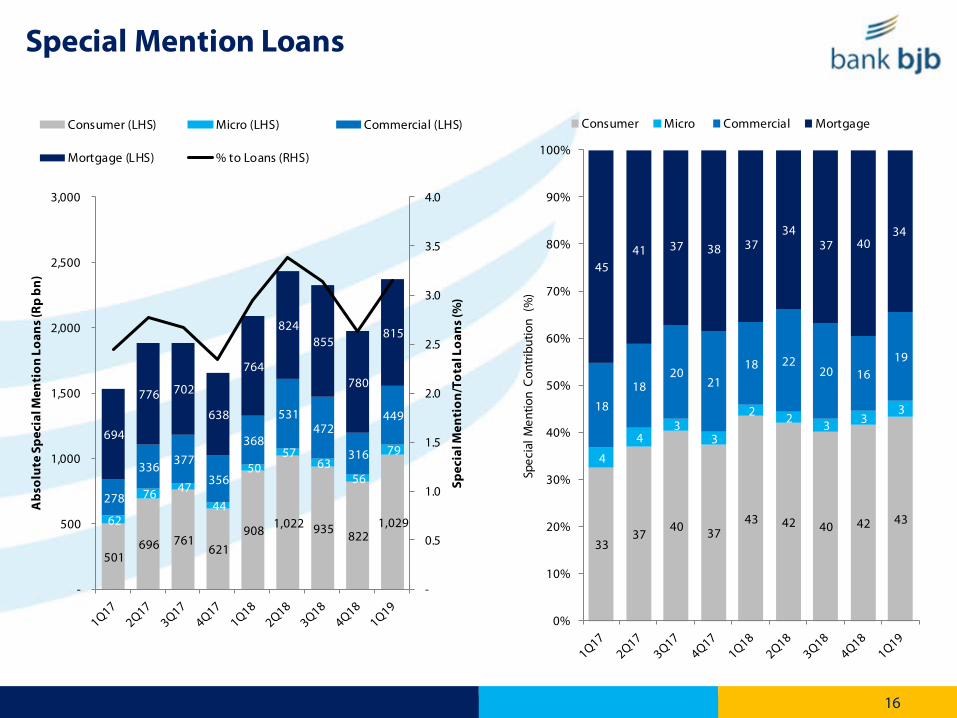
Special Mention Loans
501 696 761
621 908 1,022 935 822
1,029 62
76 47 44
50 57
63 56
79
278
336 377
356
368
531 472
316
449 694
776 702
638
764
824 855
780
815
-
0.5
1.0
1.5
2.0
2.5
3.0
3.5
4.0
-
500
1,000
1,500
2,000
2,500
3,000
Spec
ial M
enti
on/T
otal
Loa
ns (%
)
Abs
olut
e Sp
ecia
l Men
tion
Loa
ns (R
p bn
)
Consumer (LHS) Micro (LHS) Commercial (LHS)
Mortgage (LHS) % to Loans (RHS)
33 37
40 37 43 42 40 42 43
4
4 3
3
2 2 3 3 3 18
18 20
21 18 22
20 16 19
45 41 37 38 37
34 37 40
34
0%
10%
20%
30%
40%
50%
60%
70%
80%
90%
100%
Spec
ial M
entio
n C
ontr
ibut
ion
(%)
Consumer Micro Commercial Mortgage
16
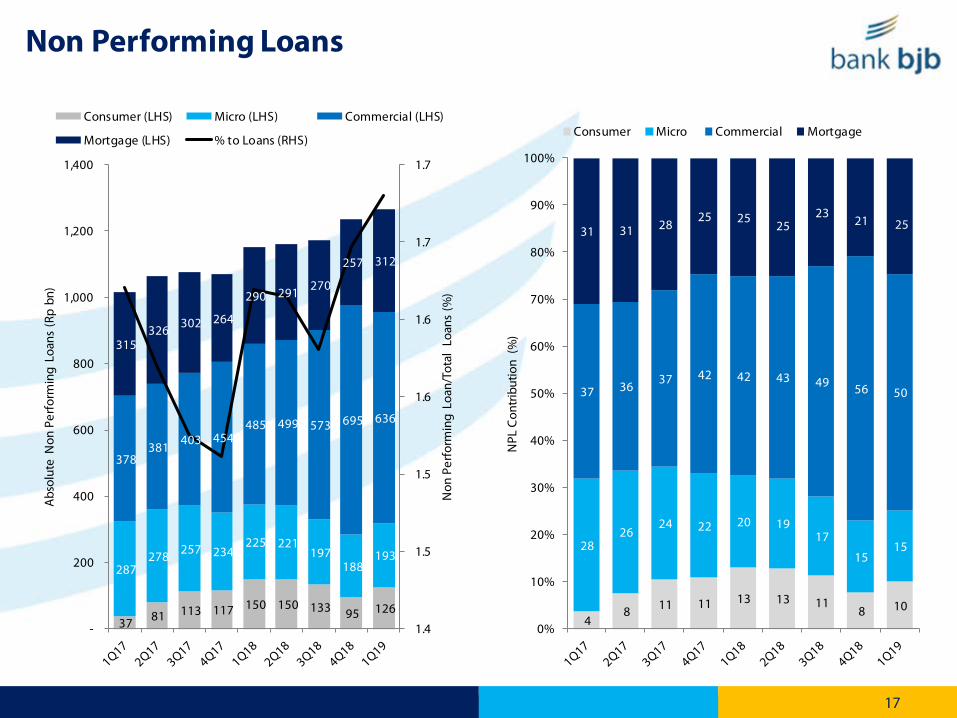
Non Performing Loans
37 81 113 117 150 150 133 95 126
287 278 257 234
225 221 197
188 193
378 381 403 454
485 499 573 695 636
315 326 302 264
290 291 270
257 312
1.4
1.5
1.5
1.6
1.6
1.7
1.7
-
200
400
600
800
1,000
1,200
1,400
Non
Per
form
ing
Loan
/Tot
al L
oans
(%
)
Abs
olut
e N
on P
erfo
rmin
g Lo
ans
(Rp
bn)
Consumer (LHS) Micro (LHS) Commercial (LHS)
Mortgage (LHS) % to Loans (RHS)
4 8 11 11 13 13 11
8 10
28 26
24 22 20 19 17
15 15
37 36 37 42 42 43 49 56 50
31 31 28 25 25
25 23
21 25
0%
10%
20%
30%
40%
50%
60%
70%
80%
90%
100%
NPL
Con
trib
utio
n (%
)
Consumer Micro Commercial Mortgage
17

Yield Analysis
Asset Yield(%) 1Q18 1Q19
Placement to Bank Indonesia 2.9 2.5
Interbank Placement 2.5 4.1
Securities 5.2 7.6
Loans Yield 13.8 13.1
Cost of Fund(%) 1Q18 1Q19
Interbank Liabilities 1.1 1.3
Debt Securities Issued 2.2 2.3
Deposits From Customers 4.6 5.0
Current Account 1.7 1.7
Time Deposit 6.7 7.7
Savings Account 1.7 1.7
Loans received 6.3 8.3
Current Account
25.4%
Savings Account
17.2%
Time Deposit44.8%
Interbank Lending
9.2% Bonds3.3%
Placement to BI 5.9%
Interbank Placement
3.1%
Marketable Securities
15.4%
Loans 74.1%
Others 1.6%
18

Capital Adequacy
Risk Weighted Asset (RWA) 1Q18 1Q19
YoY(%)
Total RWA 54,712 59,611 9.0%
Credit Risk 43,517 45,676 5.0%
Operational Risk 10,267 12,934 26.0%
Market Risk 928 1,001 7.9%
RWA/Total Asset 49.4% 53.1% +3.7%
tier-1 7,941 9,567 20.5%
tier -2 1,539 1,506 -2.1%
Total Capital 9,480 11,073 16.8%
Tier-1 CAR 14.5% 16.0% +1.5%
Total CAR 17.3% 18.6% +1.3%
CAR Analysis RiskWeighting
Addition to RWA/
Rp1tr Net Expansion
Net Impact to CAR
(%)
Consumer Loans 50% Rp 500bn 0.15
Micro Loans 75% Rp 750bn 0.23
Commercial Loans 100% Rp 1tr 0.31
Mortgage Loans 40% Rp 400bn 0.12
•Total Capital Rp 11.1 tr ( +Rp 16.8% YoY)
• Total CAR at 18.6% (+125 bps YoY)
19

Consumer Loan Details
20

Civil Servant Loans
Key Indicators 1Q18 1Q19YoY(%)
Loans Outstanding 37,328 39,051 4.6%
Net ExpansionYtD
(Rp bn)331 518 56.2%
Avg. Loans Outstanding(Rp mn) 110 114 3.5%
No of Account 339,755 343,406 1.1%
Median Interest Rate 11.00%-15.75% eff. p.a
AssetQuality 1Q18 1Q19 YoY
SpecialMention 2.2 2.3 +0.1
NPL 0.3 0.3 -
36.6
36.9
37.1
37.0
37.3
37.8
37.8
38.5
39.1
0.0
0.1
0.2
0.3
0.4
0.5
0
5
10
15
20
25
30
35
40
45
(%)
(Rp
tr)
Civil Servant Loans (LHS) NPL (RHS)
21

Pensioner Loans
Key Indicators 1Q18 1Q19YoY(%)
Loans Outstanding 10,558 13,847 31.2%
Net ExpansionYtD
(Rp bn)473 901 90.2%
Avg. Loans Outstanding
(Rp mn)131 149 13.4%
No of Account 80,347 92,910 15.6%
Median Interest Rate 11.00%-15.50% eff. p.a
AssetQuality 1Q18 1Q19 YoY
SpecialMention 0.8 0.8 -
NPL 0.3 0.1 -0.2
8.5 9.3
9.7 10.1
10.6 10.9
11.3 12.9
13.8
0.0
0.1
0.2
0.3
0
2
4
6
8
10
12
14
16
(%)
(Rp
tr)
Pensioner Loans (LHS) NPL (RHS)
22

Sharia Business Performance1Q 2019 bank bjb Sharia
23
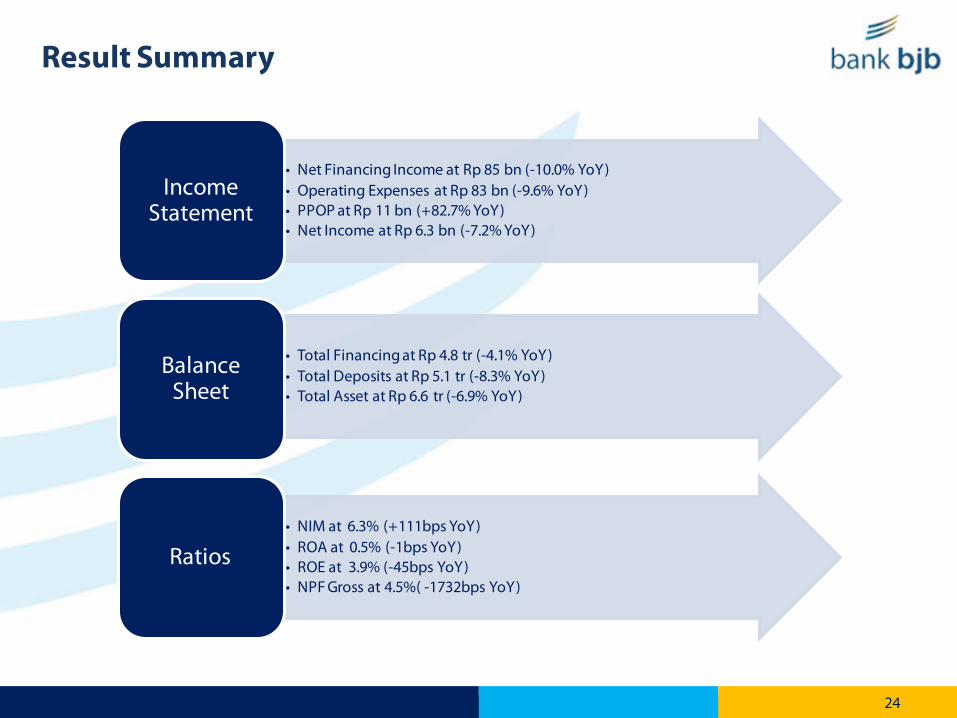
Result Summary
• Net Financing Income at Rp 85 bn (-10.0% YoY)• Operating Expenses at Rp 83 bn (-9.6% YoY)• PPOP at Rp 11 bn (+82.7% YoY)• Net Income at Rp 6.3 bn (-7.2% YoY)
Income Statement
• Total Financing at Rp 4.8 tr (-4.1% YoY)• Total Deposits at Rp 5.1 tr (-8.3% YoY)• Total Asset at Rp 6.6 tr (-6.9% YoY)
Balance Sheet
• NIM at 6.3% (+111bps YoY)• ROA at 0.5% (-1bps YoY)• ROE at 3.9% (-45bps YoY)• NPF Gross at 4.5%( -1732bps YoY)
Ratios
24

Income Statement
Income Statement(Rp mn) 1Q18 1Q19
YoY(%)
Financing Income 180,924 163,758 -9.5%
Financing Expense 86,867 79,131 -8.9%
Net Financing Income 94,057 84,627 -10.0%
Other Operating Income 3,955 9,536 141.1%
Operating Expense 92,034 83,241 -9.6%
PPOP 5,978 10,922 82.7%
Loan Loss Provision 1,289 (2,663) 306.5%
Non Operating Income (Expense) 2,050 131 -93.6%
Income (loss) Before Tax 9,317 8,391 -9.9%
Tax Expense 2,533 2,098 -17.2%
Net Income (Loss) 6,784 6,293 -7.2%
25
Balance Sheet
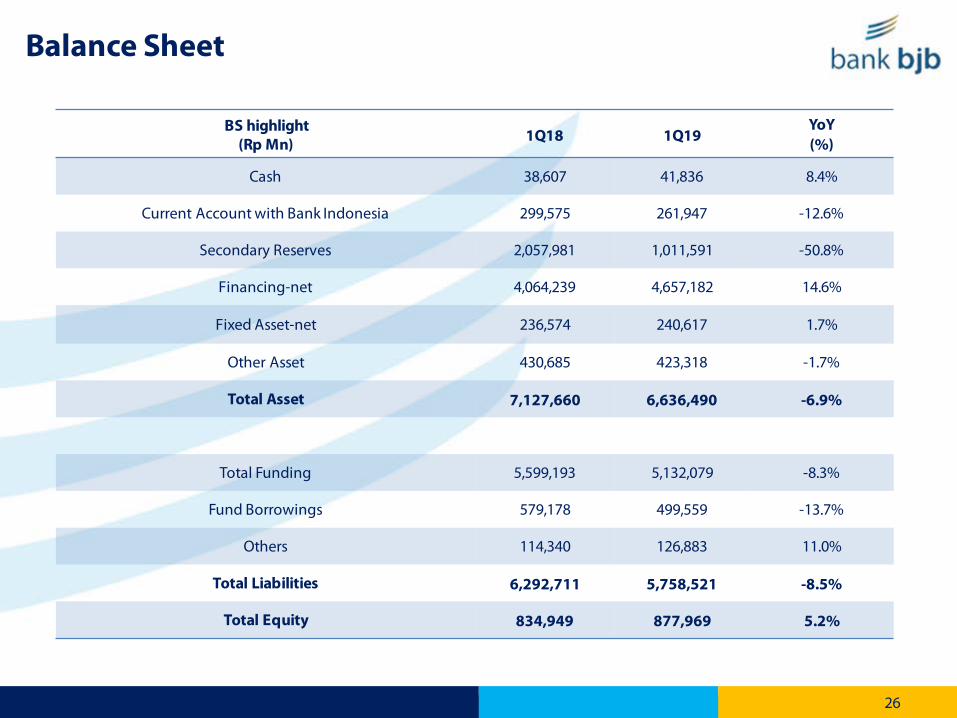
BS highlight(Rp Mn) 1Q18 1Q19
YoY(%)
Cash 38,607 41,836 8.4%
Current Account with Bank Indonesia 299,575 261,947 -12.6%
Secondary Reserves 2,057,981 1,011,591 -50.8%
Financing-net 4,064,239 4,657,182 14.6%
Fixed Asset-net 236,574 240,617 1.7%
Other Asset 430,685 423,318 -1.7%
Total Asset 7,127,660 6,636,490 -6.9%
Total Funding 5,599,193 5,132,079 -8.3%
Fund Borrowings 579,178 499,559 -13.7%
Others 114,340 126,883 11.0%
Total Liabilities 6,292,711 5,758,521 -8.5%
Total Equity 834,949 877,969 5.2%
26
Key Ratios
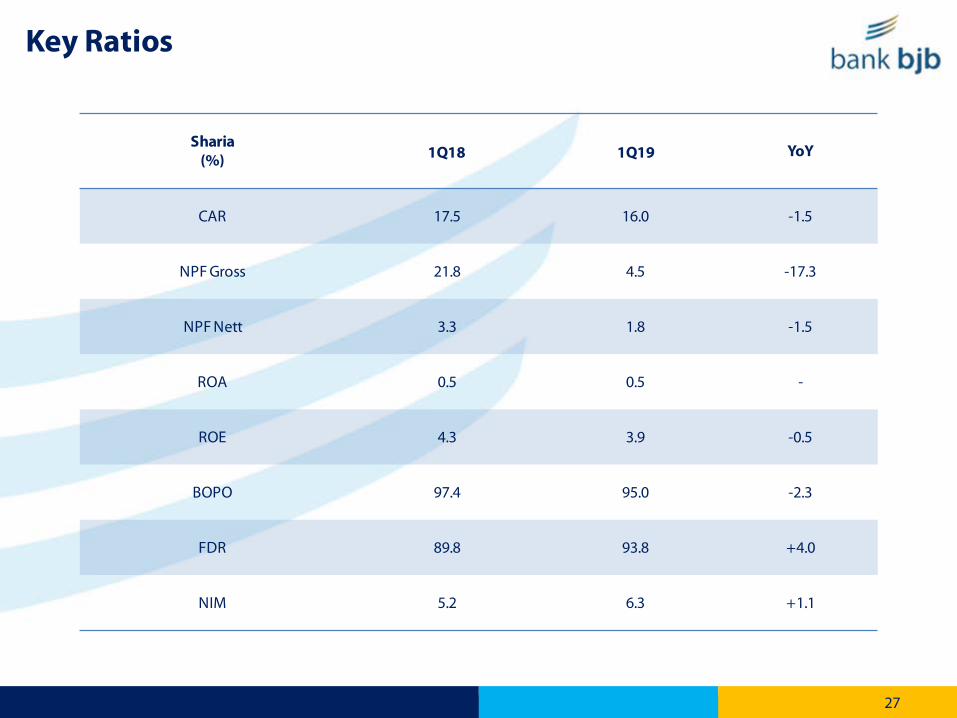
Sharia(%) 1Q18 1Q19 YoY
CAR 17.5 16.0 -1.5
NPF Gross 21.8 4.5 -17.3
NPF Nett 3.3 1.8 -1.5
ROA 0.5 0.5 -
ROE 4.3 3.9 -0.5
BOPO 97.4 95.0 -2.3
FDR 89.8 93.8 +4.0
NIM 5.2 6.3 +1.1
27
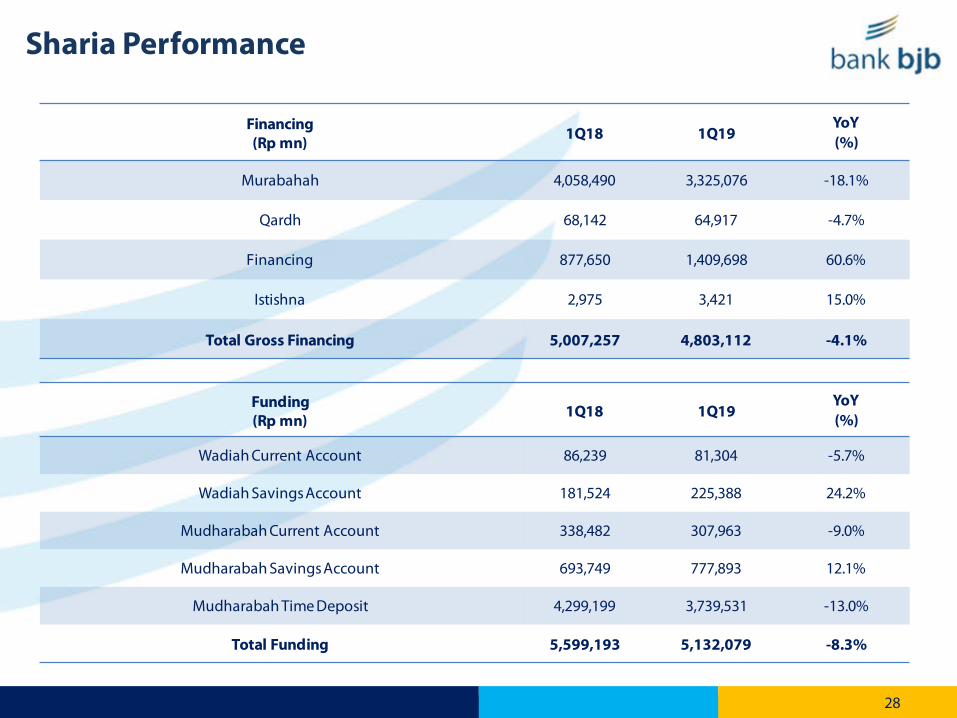
Sharia Performance
Financing(Rp mn) 1Q18 1Q19
YoY(%)
Murabahah 4,058,490 3,325,076 -18.1%
Qardh 68,142 64,917 -4.7%
Financing 877,650 1,409,698 60.6%
Istishna 2,975 3,421 15.0%
Total Gross Financing 5,007,257 4,803,112 -4.1%
Funding(Rp mn) 1Q18 1Q19
YoY(%)
Wadiah Current Account 86,239 81,304 -5.7%
Wadiah Savings Account 181,524 225,388 24.2%
Mudharabah Current Account 338,482 307,963 -9.0%
Mudharabah Savings Account 693,749 777,893 12.1%
Mudharabah Time Deposit 4,299,199 3,739,531 -13.0%
Total Funding 5,599,193 5,132,079 -8.3%
28
Company Profile
bank bjb
29
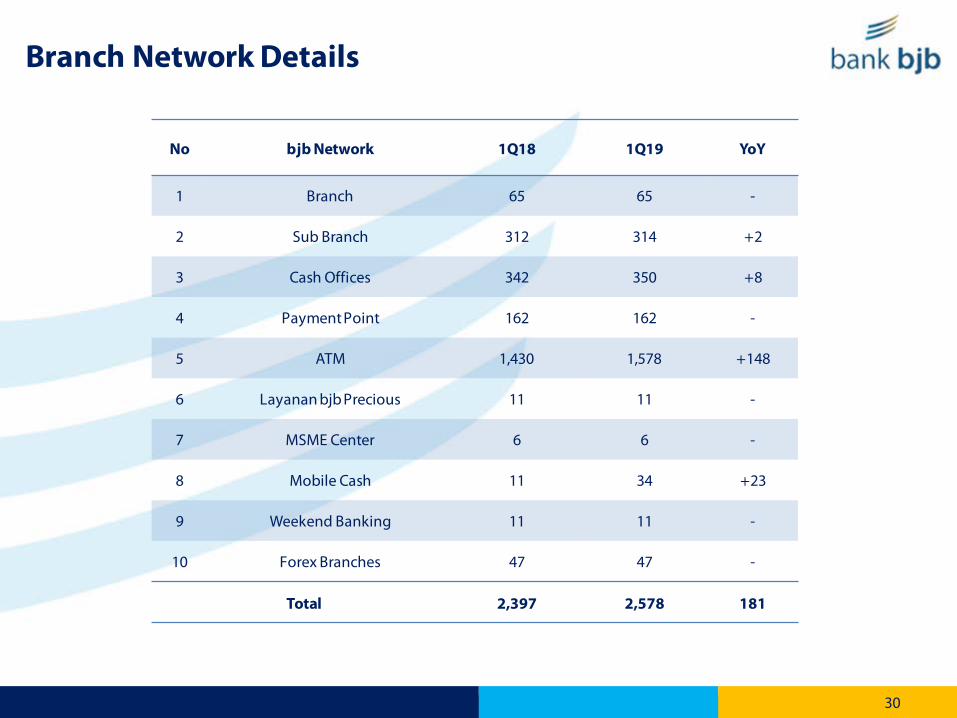
Branch Network Details
No bjb Network 1Q18 1Q19 YoY
1 Branch 65 65 -
2 Sub Branch 312 314 +2
3 Cash Offices 342 350 +8
4 Payment Point 162 162 -
5 ATM 1,430 1,578 +148
6 Layanan bjb Precious 11 11 -
7 MSME Center 6 6 -
8 Mobile Cash 11 34 +23
9 Weekend Banking 11 11 -
10 Forex Branches 47 47 -
Total 2,397 2,578 181
30

Human Capital
Age Breakdown
Educational BreakdownLevel 1Q18 1Q19 YoY
Board of Commissioners 5 2 -3
Directors 6 4 -2
Top Management 37 37 -
Middle Management 367 384 +17
First Line Management 1,793 1,812 +19
Staff 5,468 5,478 +10
Employee in Pension Preparation 21 16 -5
Total Permanent 7,697 7,733 +36
SDM 601 686 +85
Umum - - -
Total Non Permanent 601 686 +85
Total 8,298 8,419 +121
Up To Bachelor Degree92.7%
Master of Doctorare
7.3%
18-3053.4%
31-4038.2% 41-50
6.7%>501.7%
31

Distribution Network
Total bjb employees7,733
Total bjb customers4,613,714
BantenDeposits 10.6 TrLoans 10.6 TrMicro Loans 492 bnProfit 192 bn986,435 Customers8 Branch Offices28 Sub Branches57 Cash Offices36 Payment Point289 ATM Unit808 Employees
West JavaDeposits 47.8 TrLoans 47.2 TrMicro Loans 2.6TrProfit West Java 936 bnLoss Head Oficce 751 bn3,447,089 Customers35 Branch Offices125 Sub Branch280 Cash Offices124 Payment Point1042 ATM Unit5,840 Employees
OthersDeposits 3.3 TrLoans 8.1 TrMicro Loans 1.7 TrProfit 68 bn75,294 Customers13 Branch Offices12 Sub Branch Offices
7 Cash Offices1 Payment Point
129 ATM Unit470 Employees
JakartaDeposits 23.1 TrLoans 9.4 TrMicro Loans 750 bnProfit 78 bn104,896 Customers9 Branch Offices149 Sub Branches6 Cash Offices1 Payment Point118 ATM Unit 609 Employees
32
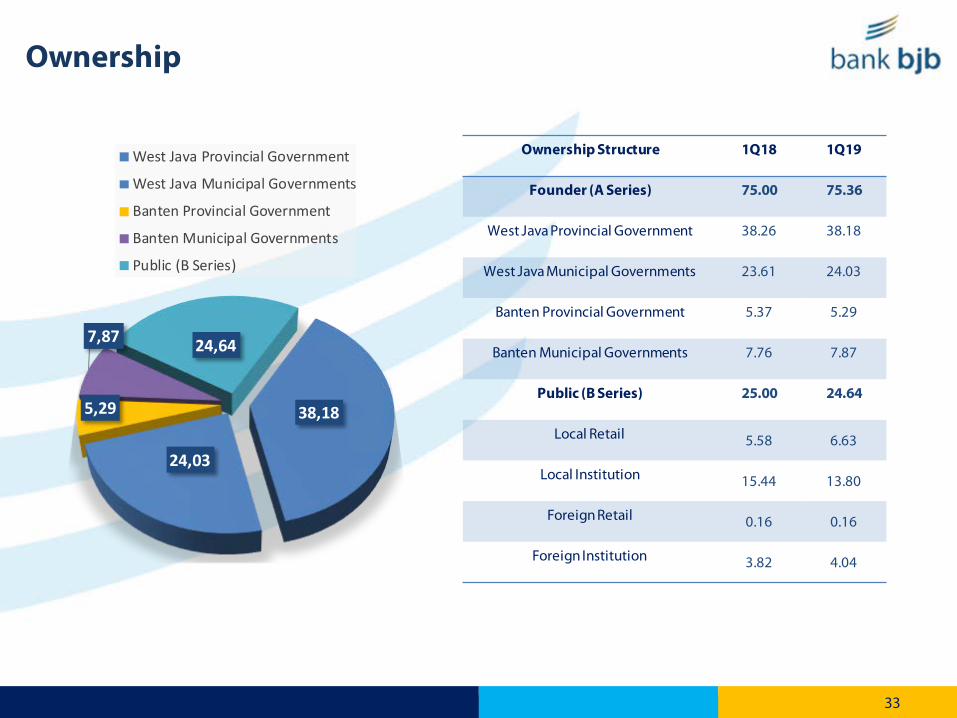
Ownership
Ownership Structure 1Q18 1Q19
Founder (A Series) 75.00 75.36
West Java Provincial Government 38.26 38.18
West Java Municipal Governments 23.61 24.03
Banten Provincial Government 5.37 5.29
Banten Municipal Governments 7.76 7.87
Public (B Series) 25.00 24.64
Local Retail 5.58 6.63
Local Institution 15.44 13.80
Foreign Retail 0.16 0.16
Foreign Institution 3.82 4.04
33
38,18
24,03
5,29
7,87 24,64
West Java Provincial Government
West Java Municipal Governments
Banten Provincial Government
Banten Municipal Governments
Public (B Series)
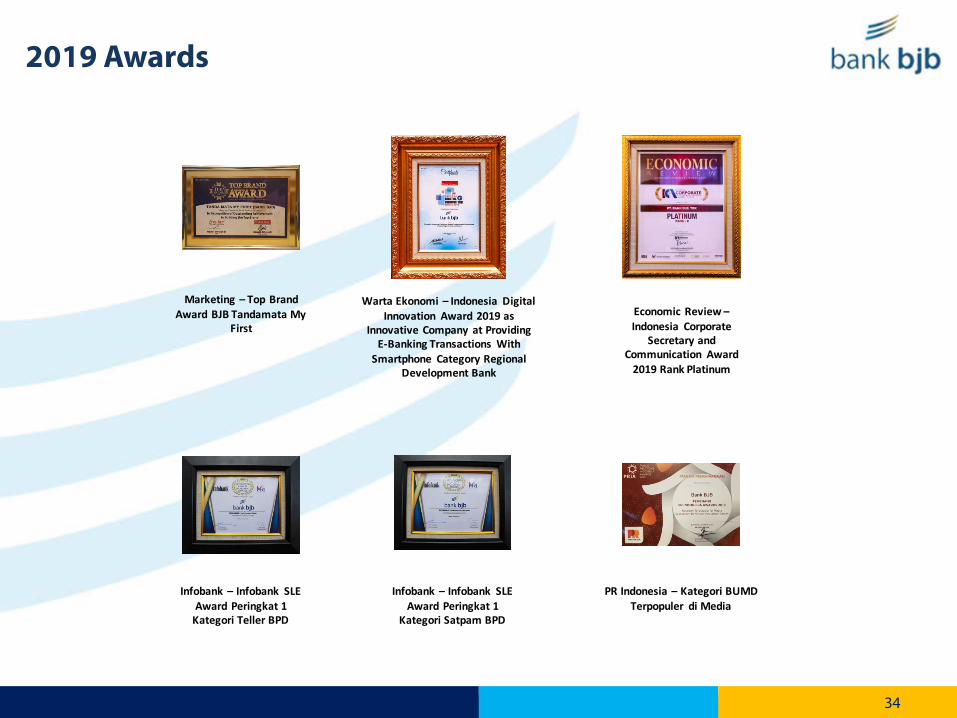
Economic Review –Indonesia Corporate
Secretary and Communication Award
2019 Rank Platinum
Marketing – Top Brand Award BJB Tandamata My
First
Warta Ekonomi – Indonesia Digital Innovation Award 2019 as
Innovative Company at Providing E-Banking Transactions With
Smartphone Category Regional Development Bank
Infobank – Infobank SLE Award Peringkat 1
Kategori Satpam BPD
PR Indonesia – Kategori BUMD Terpopuler di Media
Infobank – Infobank SLE Award Peringkat 1
Kategori Teller BPD
2019 Awards
34
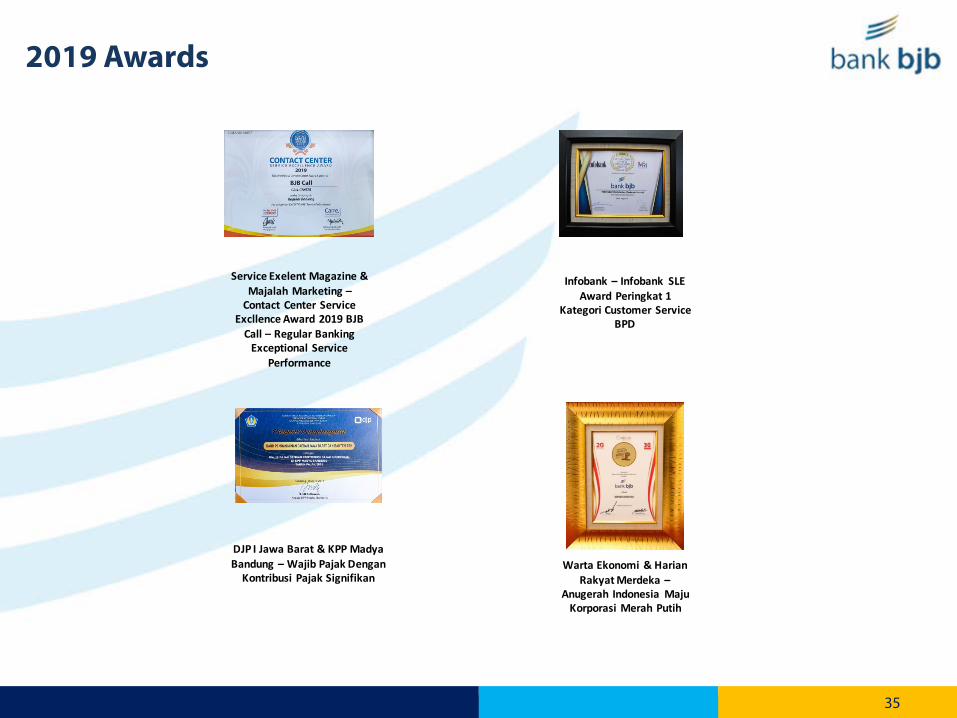
Service Exelent Magazine & Majalah Marketing –
Contact Center Service Excllence Award 2019 BJB
Call – Regular Banking Exceptional Service
Performance
DJP I Jawa Barat & KPP Madya Bandung – Wajib Pajak Dengan
Kontribusi Pajak Signifikan
2019 Awards
Infobank – Infobank SLE Award Peringkat 1
Kategori Customer Service BPD
Warta Ekonomi & HarianRakyat Merdeka –
Anugerah Indonesia MajuKorporasi Merah Putih
35
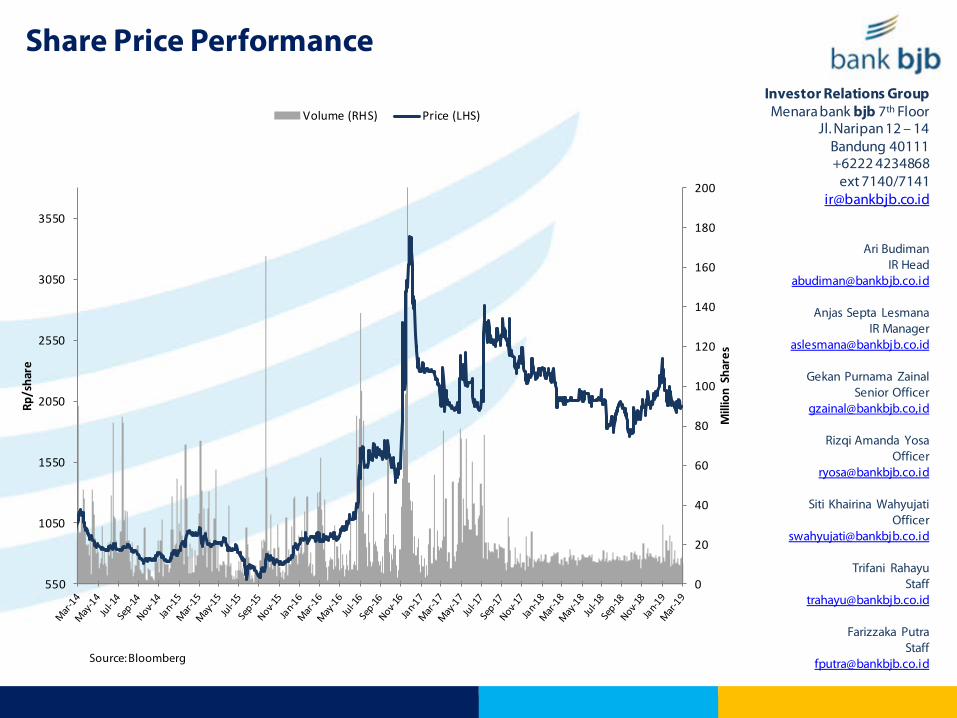
Share Price PerformanceInvestor Relations GroupMenara bank bjb 7th Floor
Jl. Naripan 12 – 14Bandung 40111+6222 4234868
ext 7140/[email protected]
Ari BudimanIR Head
Anjas Septa LesmanaIR Manager
Gekan Purnama ZainalSenior Officer
Rizqi Amanda YosaOfficer
Siti Khairina WahyujatiOfficer
Trifani RahayuStaff
Farizzaka PutraStaff
[email protected]: Bloomberg
0
20
40
60
80
100
120
140
160
180
200
550
1050
1550
2050
2550
3050
3550
Mill
ion
Shar
es
Rp/s
hare
Volume (RHS) Price (LHS)
Menara bank bjbJl. Naripan 12 – 147th FloorBandung 40111Telp. +6222 4234868
Disclaimer : This report has been prepared by PT Bank Pembangunan Daerah Jawa Barat & Banten, Tbk. (bank bjb) independently and is circulatedfor the purpose of general information only. It is not intended to the specific person who may receive this report. The information in this report hasbeen obtained from source which we deem reliable. No warranty (expressed or implied) is made to the accuracy or completeness of the information.All opinions and estimations included in this report constitute our judgment as of this date and are subject to change without prior notice. Wedisclaim any responsibility or liability without prior notice of bank bjb and/or their respective employees and/or agents whatsoever arising whichmay be brought against or suffered by any person as a result of acting in reliance upon the whole or any part of the contents of this report andneither bank bjb and/or its affiliated companies and/or their respective employees and/or agents accepts liability for any errors, omissions, negligentor otherwise, in this report and any inaccuracy herein or omission here from which might otherwise arise.
Related Documents