LSE ‘Europe in Question’ Discussion Paper Series Taming Global Finance in an Age of Capital? Wage-Setting Institutions' Mitigating Effects on Housing Bubbles Alison Johnston and Aidan Regan LEQS Paper No. 87/2015 February 2015 LEQS is generously supported by the LSE Annual Fund

Welcome message from author
This document is posted to help you gain knowledge. Please leave a comment to let me know what you think about it! Share it to your friends and learn new things together.
Transcript
LSE ‘Europe in Question’ Discussion Paper Series
Taming Global Finance in an Age of Capital? Wage-Setting Institutions' Mitigating Effects on Housing Bubbles Alison Johnston and Aidan Regan
LEQS Paper No. 87/2015
February 2015
LEQS is generously supported by the LSE Annual Fund
All views expressed in this paper are those of the author(s) and do not necessarily represent the views of the editors or the LSE. © Alison Johnston and Aidan Regan
Editorial Board Dr Joan Costa-i-Font
Dr Vassilis Monastiriotis
Dr Sara Hagemann
Dr Katjana Gattermann
Ms Sonja Avlijas
Taming Global Finance in an Age of Capital?
Wage-Setting Institutions' Mitigating Effects
on Housing Bubbles
Alison Johnston* and Aidan Regan**
Abstract
Analyses in international political economy (IPE) identify interest rate convergence, magnified in the process of European monetary integration, and financial market liberalization as causal factors behind the rise of house prices. Despite these common credit supply shocks, developed economies experienced heterogeneous trends in housing inflation throughout the 1990s and 2000s. Turning towards demand determinants of housing prices, we focus on whether wage-setting institutions blunt financial liberalization’s impact on housing inflation via their restraining effect on incomes. Employing both a panel regression analysis and a structured comparison of housing developments in Ireland and the Netherlands, we uncover two findings. First, income growth is a more important predictor of housing bubbles across OECD economies than financial variables (although income’s impact on house prices is severely mitigated for the United States). Second, countries with coordinated labor market institutions that grant political coalitions in the export sector veto powers over non-tradable sector interests, realize more restrained income growth and, in turn, are less prone to housing bubbles.
Keywords: housing prices, wage setting institutions, financial liberalization, Ireland, the Netherlands
* Deparment of Political Science, Oregon State University Email: [email protected] **School of Political Science and International Relations and Dublin
European Institute, University College Dublin Email: [email protected]
Taming Global Finance in an Age of Capital?
Table of Contents Abstract Introduction 1 The political economy of housing bubbles: Financial liberalisation’s destabilizing effects? 4 Rethinking housing bubbles via a demand-centred perspective: The role of wage-setting institutions 12 An institutional model of housing bubbles in the OECD: Empirical evidence 19 Primed for housing bubbles: A comparison of Ireland and the Netherlands 31 Conclusion 42
References 44 Appendix A 48
Acknowledgements We thank Greg Fuller, Bob Hancké, Todd Pugatch and Elizabeth Schroeder for their helpful comments. Any errors lie solely with the authors.
Alison Johnston and Aidan Regan
1
Taming Global Finance in an Age of Capital?
Wage-Setting Institutions' Mitigating Effects
on Housing Bubbles
Introduction
The 2006 United States (US) subprime mortgage crisis and subsequent 2008
global financial crisis demonstrated the devastating effects of housing and
asset price bubbles on national economies. In addition to their destabilizing
effects on the political economy at large, implosions of housing bubbles also
have important equity implications. Sudden declines in housing value can
display regressive effects if disproportionate shares of poor households have
a substantial proportion of their wealth stored in (subprime based) mortgages
(Mian and Sufi, 2014). Likewise, Schwartz (2009) and Ansell (2014) have
shown that the rise and fall of house prices has political effects on individual
policy preferences toward the welfare state, redistribution, and government
policymaking.
Within the comparative and international political economy (IPE) literature,
interest rate convergence, especially in the run up to the creation of European
Monetary Union (EMU), and the mortgage-backed securitization associated
with global financial liberalization, are generally cited as key instigators of
housing bubbles within developed economies (Mosley & Singer 2009;
Schwartz 2009; Deeg and O’Sullivan 2009; Kindleberger and Aliber, 2011;
Rajan 2011; Helleiner 2011). These two developments reduced the costs of
Taming Global Finance in an Age of Capital?
2
borrowing and increased the volume of debt instruments, introducing
inflationary pressures in housing markets.
Global financial liberalization and general reductions in nominal interest rates
have important effects on households’ demand for borrowing. However,
accounts of these general trends, which tend to rely heavily on the US case1,
fall short in explaining the wide variation in housing inflation within the
OECD. Financial liberalization and reductions in nominal interest rates
impacted all advanced political economies since the end of the 1970s. Despite
this, housing bubbles emerged with noticeable irregularity, particularly in
Europe. Some countries (Ireland, Spain, and the UK) witnessed considerable
increases in housing prices during the 1990s and the 2000s, while others
(Germany and Austria) witnessed average declines in nominal and/or real
housing prices (OECD, 2012a; Bank of International Settlements, 2014).
In this paper, we argue that a demand-side comparative political economy
approach can better account for the rise of housing bubbles than supply-side
international political economy (IPE) approaches. We provide a sectoral
class-based institutional argument behind the heterogeneous rise of housing
bubbles within the OECD since the 1980s: countries that possessed labor
market institutions that allotted the exposed sector, directly or indirectly via
the state, agenda setting or veto powers in national wage-setting (i.e. export-
led political coalitions) rather than the sheltered sector (i.e. domestic-led
political coalitions), realized more moderated income growth, which in turn
mitigated households’ demand for mortgages and national housing price
growth.
1 It is important to note that our dependent variable is housing prices not household debt. The USA had a subprime mortgage debt crisis that was associated with rising income inequality and financial products of securitization. Aggregate house price increases, however, were not that different from the OECD average.
Alison Johnston and Aidan Regan
3
Using an ordinary least squares (OLS) and instrumental variable (IV) panel
analysis of 17 OECD countries between 1980 and 2007, and a structured
comparison of Ireland and the Netherlands, we uncover two findings. First,
(lagged) real income growth exhibits a much larger effect on housing inflation
than (lagged) real interest rate reductions, while other domestic credit
variables (expansions in domestic credit and capital account openness) as well
as domestic political factors (government partisanship and central bank
independence) display no significant association with housing prices. This
income effect is eliminated for the US when we introduce country-interaction
effects but remains robust for other liberal economies, including the United
Kingdom. Second, countries that possess labor market institutions that
enhance the bargaining power and interests of the exposed sector vis-à-vis
unions in non-tradable sectors2 in national wage-setting, realized smaller
increases in housing prices than countries where non-tradable sector unions
exerted greater political influence on the bargaining process.
Our results suggest that not only may domestic labor market institutions that
govern income growth continue to trump the influence of broader
international financial trends in the determination of housing bubbles within
countries, but also that these institutions (and their underlying sectoral-class
based coalitions) may play an important role in mitigating the worst effects of
international financial liberalization on macroeconomic outcomes, especially
outside the US. Whilst we agree with Ansell (2014) that the contemporary
macroeconomic importance of asset-markets, particularly housing, has so far
been neglected in comparative study of social and economic policy
preferences, we disagree that labor market institutions, and the underlying
sectoral-class based interests that shape these, are unrelated to the political
2 In this paper, we use the terms exposed and tradable sectors, and sheltered and non-tradable sectors, interchangeably.
Taming Global Finance in an Age of Capital?
4
economy of home ownership when looking at a wider sample of developed
economies.
The political economy of housing bubbles: Financial
liberalization’s destabilizing effects?
In the IPE literature on financial liberalization, many have identified a link
between the loosening of international capital controls, mortgage
securitization, the supply of (housing) credit, and the presence of asset
bubbles (Rajan 2010; Helleiner 2011; Kindleberger 2008; Mosley & Singer
2009). Moreover, the harmonization of financial market rules among
developed countries reduced regulatory uncertainty among foreign lenders,
providing further incentives for lenders to increase credit supply (Jones,
2014). Access to steady international capital flows (funded by new
“innovative” financial products) provide governments and households with
greater capacity to borrow due to higher credit volume. Such access is not
without its consequences. As credit becomes more available, increases in
housing and asset prices can transform into prolonged bubbles, which inflate
the “true” value of assets. Capital inflow “bonanzas”, which are highly
conducive towards a rapid increase in household debt, are therefore
associated with higher likelihoods of systemic economic crisis during periods
of “sudden stops” (Reinhart and Reinhart, 2008).
Within the OECD, the increase in capital mobility also aligned with
reductions in nominal interest rates, which made credit cheaper, particularly in
Alison Johnston and Aidan Regan
5
Western Europe.3 In what now constitutes the nineteen economies of the
Eurozone, the drive towards a single currency facilitated a radical shift
towards a low inflation, capital-friendly regime. This began with the
European Monetary System’s (EMS) fixed Exchange Rate Mechanism (ERM),
and was then extended in the 1990s, with the nominal Maastricht criteria for
EMU membership. Under the EMS, several European countries committed
themselves to fixed exchange rates, which prompted them to initiate difficult
wage and price adjustments in order achieve exchange rate convergence
(Johnston, 2012; Johnston and Regan, 2014). Such adjustments, at least among
countries that made a credible commitment to the ERM (removing capital
controls in the process) resulted in reduced exchange rate volatility, and
subsequently interest rate convergence and nominal interest rate reductions.
With the introduction of a common currency, exchange rate risk between
European member-states was completely eliminated and, due to the
undervaluation of default risk prior to the 2008 financial crisis, the average
maximum spread in nominal interest rates on long-term government debt
between 2000 and 2008 was 0.8% for the EMU12 (EU Commission AMECO
Database, 2014). Greater availability of credit and the reduced cost of
borrowing that came with European monetary integration established an
environment highly conducive towards increased private and public
borrowing, which, through cross-national capital flows, became intimately
connected to the liberalization of mortgage backed securities originating in
the US (Schwartz 2009).
3 Under the interest rate parity condition, foreign and domestic interest rates equalize in the presence of capital mobility only if the expected future exchange is roughly equivalent to the current exchange rate (and if default risks are similar). This did not materialize in Latin American and East Asia, where exchange rates were volatile, and default risk was heterogeneous, but it did materialize in developed economies due to the rise of inflation targeting central banks, and in the case of the Western European economies, the European Monetary System’s fixed exchange rate regime.
Taming Global Finance in an Age of Capital?
6
In addition to these global financialization trends, recent CPE scholarship
notes that differences in cross-national approaches to credit expansion further
exacerbated some countries’ exposure to asset/housing price bubbles. Duca et
al (2010) and Fuller (2015) outline that countries with permissive credit
regulatory frameworks were more exposed to debt accumulation and in turn,
asset bubbles. This argument has been further expanded in the welfare-state
literature. Schwartz (2012), Schelkle (2012) and Trumbell (2012), note that
politicians’ support for credit policies promoting home-ownership served as a
substitute for the welfare state and caused some countries, particularly Anglo-
Saxon economies, to be overexposed to the 2008 financial crisis.
Rethinking the supply-side bias of IPE and CPE accounts of housing
bubbles
Despite the importance of international credit expansion, these trends alone
fail to fully account for the heterogeneity in housing bubbles among OECD
economies. Financial liberalization and reductions in nominal interest rates
affected all advanced market economies in the 1980s and 1990s. The level of
capital account openness, if proxied by Chinn and Ito’s (2006) liberalization
index, was identical for EMU’s original (1999) entrants by 1993, with Spain
fully liberalizing its capital markets by 1994 (Karcher and Steinberg, 2012).4
Likewise, all countries (including Germany) witnessed reductions in nominal
interest rates between 1990 and 2000. Despite these commonalities, housing
price inflation since 1990 was remarkably heterogeneous. For some countries
(Ireland and Spain) destabilizing housing bubbles arose. In other countries,
house prices increased but did not transform into bubbles (Netherlands and
4 Canada, Japan, the UK, and the US removed capital controls at the start of the 1980s, while Australia did so by 1985, Denmark by 1988, and Sweden by 1993 (Karcher and Steinberg, 2012).
Alison Johnston and Aidan Regan
7
Denmark). Finally, in others (Germany, Austria, and Japan), nominal and real
housing prices were relatively stagnant.
Of course, one could argue that the timing of financial liberalization was not
so homogenous across OECD economies, which varied somewhat throughout
the 1980s and 1990s. Countries that removed capital controls and committed
themselves to monetary integration and hard currency regimes later
witnessed more sudden reductions in nominal interest rates. Consequently,
they may have been more prone to rapid asset price bubbles and irrational
exuberance than countries that undertook these adjustment processes earlier.
This argument, however, is not empirically validated when looking at the
relationship between interest rate reductions and housing price growth.
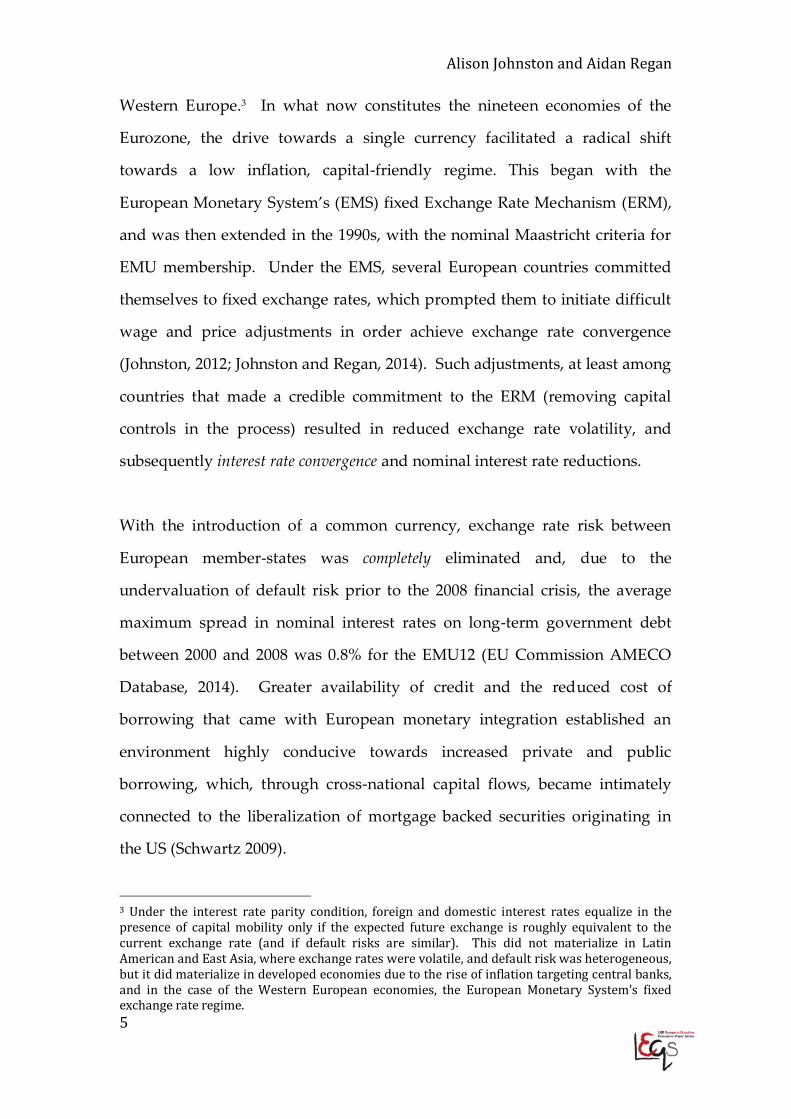
Figure 1 presents simple bivariate comparisons of differences in nominal/real
interest rates, and percentage increases in nominal/real housing prices
between 1990 and 2007 for 17 OECD economies.5 Reductions in nominal
interest rates fail to correspond consistently with increases in nominal house
prices. Spain, for example, witnessed a decline in nominal interest rates by
over 10% between 1990 and 2007 and an increase in nominal housing prices
by over 270%. On the other hand, Ireland and the Netherlands witnessed
much smaller declines in their nominal interest rates (5.8% and 4.6%,
respectively), but had more pronounced housing price increases (450% and
300%, respectively). As will be highlighted in the case studies, much of the
Dutch housing bubble occurred in the 1990s, while Dutch housing prices flat-
lined in the 2000s. Similar inconsistencies arise when looking at real data:
though countries like Japan, Germany, Sweden and US had similar reductions
5 These include Austria, Belgium, Canada, Denmark, Finland, France, Germany, Great Britain, Ireland, Italy, Japan, the Netherlands, Norway, Portugal, Spain, Sweden, and the United States.
Taming Global Finance in an Age of Capital?
8
in real interest rates between 1990 and 2007, changes in housing prices were
markedly different.
Figure 1: Changes in Housing Prices (as a percentage of 1990 values) and differences in interest rates, 1990-2007
Housing price data from the OECD (2012a) except for Austria and Portugal whose housing price data stems from the Bank of International Settlements (2014); Nominal and real interest rate (using the GDP deflator) from the EU Commission’s AMECO database (2014).
In regards to CPE accounts that focus on national regulations governing
credit supply, changes in mortgage lending regulatory practices also fail to
fully explain the heterogeneity in housing prices across the OECD. Figure 2
provides simple bivariate comparisons examining the relationship between
2009 tax relief on debt financing of homeownership (higher values indicate a
greater subsidy wedge between the market interest rate and the interest rate
households pay after the tax subsidy) and nominal housing price increases
between 2000 and 2007.6 Similar to the interest rate data, tax relief does a poor
job at explaining housing bubbles before the 2008 financial crisis. Countries
with more prominent increases in nominal housing prices (the UK and
6 The OECD (2011), lacked time series data on tax relief, so the 2009 level was compared with housing price changes between 2000 and 2007
USA
JPN
DEU
FRAITA
GBR
CAN
BEL
DNK
ESP
FIN
IRL
NLD
NOR
SWE
AUT
PORT
USA
JPNDEU
FRA
ITA
GBR
CAN
BEL
DNK
ESP
FIN
IRL
NLDNOR
SWE
AUTPORT0
200
400
600
-10 -5 0 -10 -5 0
Nominal Data Real Data
Cha
nge
in H
ousi
ng P
rices
(199
0-20
07)
Difference in Interest Rates (1990-2007)
Alison Johnston and Aidan Regan
9
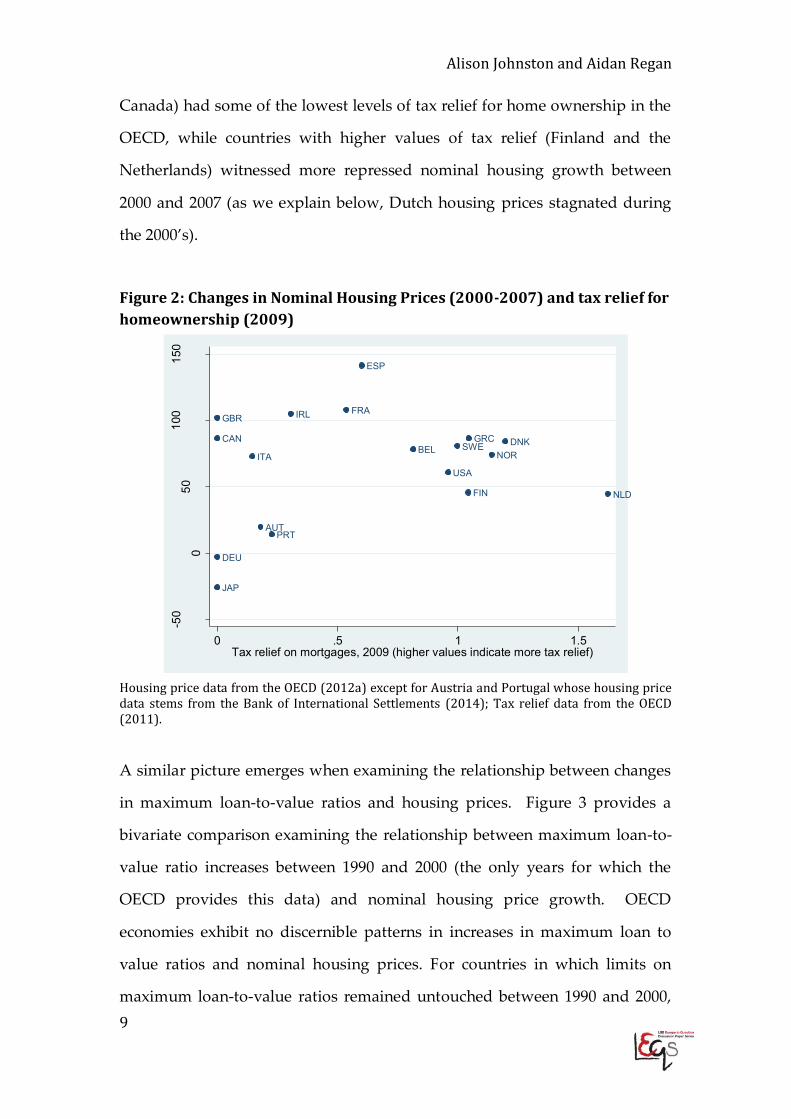
Canada) had some of the lowest levels of tax relief for home ownership in the
OECD, while countries with higher values of tax relief (Finland and the
Netherlands) witnessed more repressed nominal housing growth between
2000 and 2007 (as we explain below, Dutch housing prices stagnated during
the 2000’s).
Figure 2: Changes in Nominal Housing Prices (2000-2007) and tax relief for homeownership (2009)
Housing price data from the OECD (2012a) except for Austria and Portugal whose housing price data stems from the Bank of International Settlements (2014); Tax relief data from the OECD (2011).
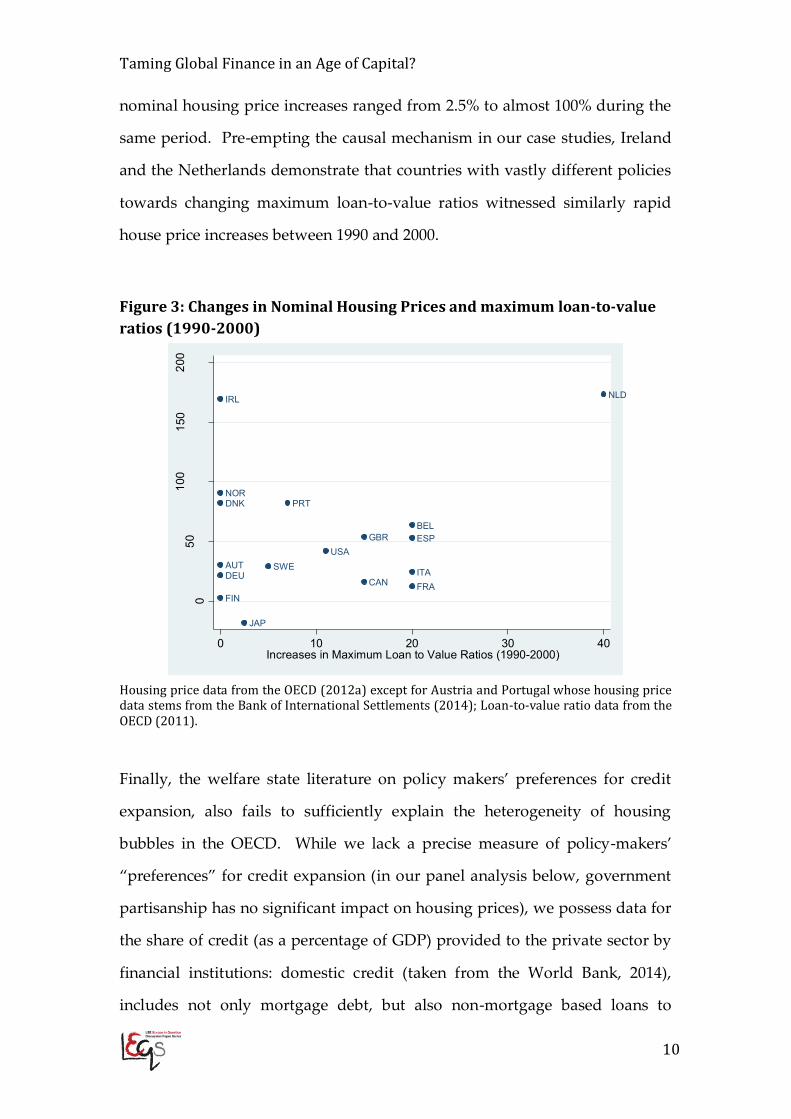
A similar picture emerges when examining the relationship between changes
in maximum loan-to-value ratios and housing prices. Figure 3 provides a
bivariate comparison examining the relationship between maximum loan-to-
value ratio increases between 1990 and 2000 (the only years for which the
OECD provides this data) and nominal housing price growth. OECD
economies exhibit no discernible patterns in increases in maximum loan to
value ratios and nominal housing prices. For countries in which limits on
maximum loan-to-value ratios remained untouched between 1990 and 2000,
NLD
DNKNOR
GRC
FIN
SWE
USA
BEL
ESP
FRAIRL
PRTAUT
ITA
JAP
DEU
CAN
GBR
-50
050
100
150
Cha
nge
in H
ousi
ng P
rices
(200
0-20
07)
0 .5 1 1.5Tax relief on mortgages, 2009 (higher values indicate more tax relief)
Taming Global Finance in an Age of Capital?
10
nominal housing price increases ranged from 2.5% to almost 100% during the
same period. Pre-empting the causal mechanism in our case studies, Ireland
and the Netherlands demonstrate that countries with vastly different policies
towards changing maximum loan-to-value ratios witnessed similarly rapid
house price increases between 1990 and 2000.
Figure 3: Changes in Nominal Housing Prices and maximum loan-to-value ratios (1990-2000)
Housing price data from the OECD (2012a) except for Austria and Portugal whose housing price data stems from the Bank of International Settlements (2014); Loan-to-value ratio data from the OECD (2011).
Finally, the welfare state literature on policy makers’ preferences for credit
expansion, also fails to sufficiently explain the heterogeneity of housing
bubbles in the OECD. While we lack a precise measure of policy-makers’
“preferences” for credit expansion (in our panel analysis below, government
partisanship has no significant impact on housing prices), we possess data for
the share of credit (as a percentage of GDP) provided to the private sector by
financial institutions: domestic credit (taken from the World Bank, 2014),
includes not only mortgage debt, but also non-mortgage based loans to
NLD
DNKNOR
FIN
SWEUSA
BELESP
FRA
IRL
PRT
AUTITA
JAP
DEUCAN
GBR
050
100
150
200
Cha
nge
in H
ousi
ng P
rices
(199
0-20
00)
0 10 20 30 40Increases in Maximum Loan to Value Ratios (1990-2000)
Alison Johnston and Aidan Regan
11
households and firms, purchases of non-equity securities, and trade credits
and other accounts receivable that establish a claim for repayment. Countries
who prioritize credit expansion should witness greater increases in their
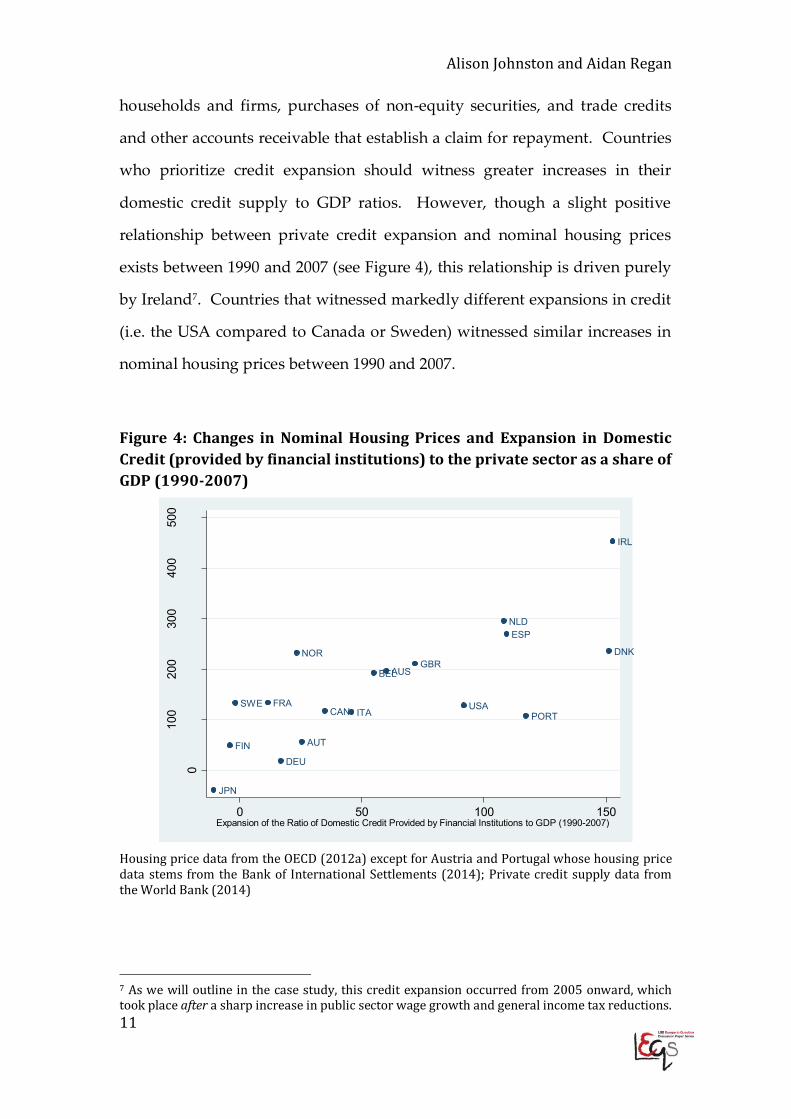
domestic credit supply to GDP ratios. However, though a slight positive
relationship between private credit expansion and nominal housing prices
exists between 1990 and 2007 (see Figure 4), this relationship is driven purely
by Ireland7. Countries that witnessed markedly different expansions in credit
(i.e. the USA compared to Canada or Sweden) witnessed similar increases in
nominal housing prices between 1990 and 2007.
Figure 4: Changes in Nominal Housing Prices and Expansion in Domestic Credit (provided by financial institutions) to the private sector as a share of GDP (1990-2007)
Housing price data from the OECD (2012a) except for Austria and Portugal whose housing price data stems from the Bank of International Settlements (2014); Private credit supply data from the World Bank (2014)
7 As we will outline in the case study, this credit expansion occurred from 2005 onward, which took place after a sharp increase in public sector wage growth and general income tax reductions.
USA
JPN
DEU
FRAITA
GBR
CAN
AUSBEL
DNK
ESP
FIN
IRL
NLD
NOR
SWE
AUT
PORT
0
100
200
300
400
500
CH
ange
in H
ousi
ng P
rices
(199
0-20
07)
0 50 100 150Expansion of the Ratio of Domestic Credit Provided by Financial Institutions to GDP (1990-2007)
Taming Global Finance in an Age of Capital?
12
Rethinking housing bubbles via a demand-centred
perspective: The role of wage-setting institutions
One feature that links the comparative and international political economy
literatures on housing markets is their supply-side centrism. While demand
booms in the presence of cheap credit are acknowledged, there has not been a
systematic explanation for why these booms fail to emerge everywhere,
especially outside of the US case, which has dominated recent study on
housing debt. Microeconomic literature has identified a strong causal link
between (permanent or stable) household income and mortgage demand
(Ortalo-Magné and Rady, 2006; Davidoff, 2006). Yet few look at more
systematic institutional factors that might explain why income growth is more
persistent in some countries but not in others, and the extent to which this
fuels the pro-cyclical impact of a generalised low interest-rate credit shock.
Recent (liberal) welfare state research (Trumbull, 2012) suggests that income
growth and credit expansion may be substitutes (i.e. credit-for-welfare).
Mitigated income growth requires households to take on more debt to
maintain a given level of spending; hence, low income growth corresponds
with higher demand for credit, and ultimately housing prices (in the US, this
was further exacerbated by the permissiveness and prominence of subprime
mortgages). Though income stagnation overlapped with credit booms in the
US (and the UK), this country, whose credit regulatory policies are heavily lax
(see Fuller, 2015), may be a unique case, and does not adequately represent
housing demand dynamics across other developed economies. It is equally
possible that income (which is one of the most important determinants of
whether a household can take out a mortgage) and credit serve as complements
rather than substitutes, as in the USA. Higher incomes enable households to
Alison Johnston and Aidan Regan
13
take on more mortgage debt, as their loan-value to income ratio declines,
placing upward pressures on housing prices.
We draw upon labor market research in comparative political economy to
examine whether income growth amplifies mortgage-credit demand and
housing prices in the OECD at large. We analyze the impact of domestic
institutions that govern wage-setting on housing prices through their
determination of income growth. Labor market institutions have been
frequently linked to wage moderation (Soskice, 1990; Hall and Soskice, 2001;
Iversen & Soskice 2010; Johnston and Regan, 2014), and in turn inflation.
Classical political economy literature highlights that encompassing,
centralized and/or coordinated collective bargaining at the national level
reduces the collective action problem among unions to push for higher wage
increases, leading to persistent wage moderation.
Given that labor market institutions impact inflation, we suggest that such
political dynamics may also constrain housing bubbles through their impact
on housing demand. Coordinated wage setting institutions may have bubble-
mitigation effects for two reasons. First, repressed income growth that stems
from these institutions reduce domestic demand for all goods, including debt
instruments required for purchasing major durable goods (i.e. home
mortgages). Second, since collective bargaining institutions can be relatively
sticky (i.e. not subject to frequent change), they may influence households’
future expectations of income growth. If wage coordination mechanisms
consistently deliver slow income growth in the past, households may expect
that these institutions will continue to deliver wage moderation in the future,
and adjust their demand for mortgages accordingly.
Taming Global Finance in an Age of Capital?
14
Recent political economy literature outlines the importance of sectoral
dynamics when examining the influence of labor market institutions on policy
preferences (Rehm & Wren 2014). Others have examined how sectoral
coalitions influence aggregate wages and prices (Brandl, 2012; Johnston et al,
2014). National demand is determined by income growth in two different
types of sectors: tradable (export-oriented) and non-tradable (domestic–
oriented). Wage-setters in the former have the incentive to restrain wage
growth, because employers are less able to pass wage increases onto prices
due to competitiveness constraints. If unions price wages too high, employers
are more likely to respond with employment shedding rather than price
mark-ups. Wage-setters in the non-tradable sector, however, do not possess
similar incentives as employers have greater leeway to pass on wage increases
to prices (in the public sector, such wage increases can be passed onto/funded
by taxes or borrowing). The conflicting incentives of these different sectoral-
class interests have important consequences for domestic inflation, yet the
possible influence of these sectoral differences on asset-prices remains largely
unexplored.
Despite the fact that differences in sectoral-class interests exist within all
political economies, some countries possess domestic labor market
institutions that better contain the influence of the non-tradable sector in
shaping aggregate wage outcomes. These countries have coordinated wage-
setting institutions that grant the export-sector, either directly or indirectly via
state intervention, veto powers in the determination of national wages.
Because export-based coalitions have the incentive to limit aggregate wage
growth in sheltered sectors for competitiveness reasons, coordinated collective
bargaining institutions that grant them the upper hand in wage negotiations
make it easier for these interests to enforce their wage moderation preferences
on the economy at large. Such institutions frequently underpin export-led
Alison Johnston and Aidan Regan
15
growth regimes but have generally been overlooked in IPE research on the
macroeconomic roots of the international financial crisis.
Building on previous work on sectoral-class politics (Brandl, 2012; Johnston et
al, 2014), we suggest that there are three coordinated wage-setting regimes
that grant greater agenda setting and veto powers to the export sector,
thereby enhancing their political bargaining power vis-à-vis sheltered sector
unions. These include: multi-employer pattern bargaining regimes where
exposed sector firms act as trend-setters (Germany and Austria); state imposed
coordination regimes that grant the government unilateral power to deliver
(public sector) pay outcomes in line with export-sector preferences (France
and Belgium), and; state-led wage pacts where the social partners bargain in
the state’s shadow of hierarchy. These pacts grant the state the unilateral capacity
to establish productivity-based wage ceilings (or, in times of crisis, wage
freezes) if unions and employers fail to negotiate wage restraint (Finland and
the Netherlands).
x In pattern bargaining regimes, sectoral-class interests in the export
sector (the metalworking sector for Germany and Austria) establish
wage-settlements first. These then serve as the upper limit for all
subsequent sectoral wage agreements in the wider economy. The
political strength of the export (manufacturing) sector in Germany and
Austria stems from the prominence of this sectoral-class coalition in
shaping their national export-led growth regime, which has been
sustained in the face of globalization due to their value-added
production niches (Hall and Soskice, 2001).
Taming Global Finance in an Age of Capital?
16
x State imposed coordination regimes allot the state a unilateral role in
monitoring wage inflation in line with exposed-sector interests. In
France, such coordination stems from the state’s use of the collective
agreements of large exporting firms, which then act as non-negotiable
benchmarks for the public sector (Hancké, 2002). In Belgium, the
state’s imposing role occurs through legislative statutory acts, which
grant the government the capacity to intervene and cap wage growth if
labor costs exceeds that of the average of Belgium’s three largest
trading partners (France, Germany and the Netherlands).
x The state’s role in monitoring wage developments in the interest of the
export-sector also exists in countries with state-led wage pacts. These
tripartite pacts grant the government the statutory means to control
wage increases but are usually a temporary feature of collective
bargaining. They do not result in direct unilateral state intervention, but
rather indirect state action via its threats to intervene unilaterally if
wage restraint is not delivered. In the Netherlands, such wage pacts
are used reactively in response to sudden increases in inflation and
their terms involve either national wage ceilings or wage freezes,
which are subject to legislative decrees if they are not met.
Other wage-setting regimes fail to grant veto powers to the export sector,
thereby weakening its agenda setting power vis-à-vis the non-tradable sector.
These include: peak bargaining regimes where both exposed and sheltered
sector unions/employers are united under a confederal umbrella (Italy, Spain
and Portugal); uncoordinated market-oriented regimes where individual
wage-setters bargain independently with employers (the US and UK), and;
non-state-led wage pacts where wage pacts are concluded between union and
Alison Johnston and Aidan Regan
17
employer confederations but the state lacks the power to ensure collective
compliance (Ireland).
x In peak bargaining regimes, union confederations are unable to unify
sectoral conflicts among competing affiliates. If the public sector holds
greater membership in these umbrella organizations than the export
sector, peak bargaining can be more prone to inflation. Sheltered sector
dominated peak bargaining regimes differ to exposed sector
dominated peak bargaining regimes where the export sector continues
to exert influence in the peak confederation, due to its higher
membership representation. In Denmark, for example, the
manufacturing sector’s dominance within the LO has been maintained
by the formation of the CO-Metal export cartel since 1992.
x Uncoordinated market-oriented regimes are, politically, more sector-
neutral. Individual firms set wage growth on par with productivity
developments, which for the non-tradable sector is usually lower than
the export sector. However, such regimes do not have the capacity to
deliver the degree of national wage suppression that exist in collective
bargaining regimes, as fragmentation inhibits employers’ capacity to
coordinate and moderate wage growth in all sheltered sectors.
Additionally, these regimes have the capacity to be wage inflationary if
income inequality leads to disproportionate wage increases at the upper
end of the earnings distribution. In the US and UK, these above-
productivity wage increases are common in high-skilled services such
as finance and legal services.
Taming Global Finance in an Age of Capital?
18
x These coordination problems are also present in non-state-led wage
pacts (Ireland prior to the crisis). These pacts are delivered by peak-
level confederations and their conclusion and enforcement relies upon
the collective compliance of affiliates. However, unlike state-led wage
pacts, the state has little capacity to ensure that concluded wage levels
stay within or below agreed limits. In Ireland, where the dynamic
multinational sector is non-unionized and hence relatively absent in
the Irish Congress of Trade Unions (ICTU), these regular wage pacts
rest largely on the preferences of public sector unions (Culpepper and
Regan, 2014).
Appendix A provides the complete list of these wage-setting regimes and
countries’ classifications within them between 1980 and 2007. Our theoretical
model rests on examining how these six wage coordination institutions (and
their underlying sectoral-class interests) influence housing prices via income
growth. We hypothesize that wage-setting regimes that limit income growth
in non-tradable sectors (pattern bargaining, state-imposed coordination and
state-led wage pacts) are more prone towards moderated income growth.
Such repressed income growth reduces the demand for mortgage credit,
which in turn limits the demand for housing, mitigating the possibility that
house price increases turn into housing bubbles. Wage setting regimes that fail
to moderate wage growth in the sheltered sectors (peak level bargaining non-
state-led wage pacts, and to a lesser extent uncoordinated regimes) are more
prone towards inflationary income growth. Such growth increases the
demand for mortgage credit, which increases the demand for housing,
placing upward pressures on housing prices.
Alison Johnston and Aidan Regan
19
An institutional model of housing bubbles in the OECD:
Empirical evidence
Variables and Estimator
We employ a panel analysis of 17 OECD8 economies from 1980 to 2007 to test
whether income is more impactful in explaining housing price growth than
financial factors. Our baseline model stems from Aizenman and Jinjarak
(2009), who examine the influence of current account balances on housing
prices. The authors use a (one year) distributive lag model to examine
determinants of real-estate valuations for 43 countries between 1990 and 2005.
Aizenman and Jinjarak’s model includes only lagged independent variables,
rather than present value independent variables, because real-estate is a
substantial investment for households, who must incur significant debt
burdens to purchase these assets. Therefore, changes in housing purchases
that result from changes in income and interest rates are likely subject to
greater delays than for other goods and financial assets.
The authors’ final model includes only one year lags of the independent
variable, although they acknowledge that the effects of current account
balances persist up to five years. Below, we also present results for a two year
distributive lag model (all independent variables are two years removed from
the present value of the dependent variable), and the results are largely
similar, except for population growth which becomes significant. The impact
of all our independent variables become insignificant within the third year lag
8 These countries include Australia, Austria, Belgium, Canada, Denmark, Finland, France, Germany, Ireland, Italy, Japan, the Netherlands, Portugal, Spain, Sweden, the United Kingdom and the United States.
Taming Global Finance in an Age of Capital?
20
(results shown in an online appendix). Our baseline model can be
summarized as follows:
𝐻𝑃 , = 𝛽 + 𝛽 𝑦 , + 𝛽 𝑝𝑜𝑝 , + 𝛽 ∑𝑋 , + 𝛽 ∑𝑌 , + 𝛽 ∑𝑍 + 𝜀 .
All of our variables, except for the capital account openness index, central
bank independence (CBI), and government partisanship, are differenced, as
panels exhibit either consistently increasing or decreasing trends, rather than
stochastic processes required by time series. 𝐻𝑃 , is real housing price growth
(percentage change9 from the previous year) in country i in year t. 𝑦 , is per
capita real income growth (percentage change from the previous year) in
country i in year t-1. 𝑝𝑜𝑝 , , a rough proxy of housing stock demand, is
population growth (percentage change from the previous year) in country i in
year t-1. Real housing price data (private dwellings) stem from OECD
(2012a), except for Austria and Portugal (OECD data missing), whose
residential property price data came from the Bank of International
Settlements (2014). Population and real income growth data stem from the
OECD (2014).
∑𝑋 , is a vector of lagged financial variables. This includes the lagged real
interest rate (differenced from the previous year), the lagged ratio of domestic
credit provided by financial institutions to the private sector as a ratio of GDP
(a proxy for financial depth, this ratio is also differenced from the previous
year), and the lagged capital account openness index (a proxy of financial
liberalization) for country i in year t-1. The capital account index measures
capital and current account restrictions, requirements to surrender export
proceeds, and the presence of multiple exchange rates: higher values indicate
greater capital account openness. Real interest rate data stems from the EU’s 9 Percentage changes are expressed from 0-100 rather 0-1.
Alison Johnston and Aidan Regan
21
AMECO Database (2014), domestic credit ratios from the World Bank (2014),
and the capital account openness index stems from Karcher and Steinberg’s
(2012) revised measure of the Chinn-Ito (2006) index.
∑𝑌, is a vector of lagged domestic political controls. We include
partisanship, the lagged proportion of cabinet seats occupied by right
parties10, because right parties, given their capital/business leanings, may be
more prone towards passing mortgage-credit-friendly policies than left
parties. We also include the lagged CBI index as a rough proxy for the
inflation aversion of the domestic central bank. The presence of a
supranational central bank (the European Central Bank) within our panel
poses some problems for comparing EMU to non-EMU countries: the ECB
does not have the same inflation monitoring power for individual Eurozone
countries as national central banks do. Therefore, we weight the CBI index by
the proportion of national GDP to the central bank’s jurisdiction.11 For
countries with their own central banks, this weight equals 1 (national GDP is
the central bank’s jurisdiction). For EMU countries, this weight equals the
ratio of national output to the Eurozone’s output. Partisanship data stems
from Swank (2006), while the CBI index stems from Cukierman (1992), with
updated data from Polillo and Gullién (2005). EMU country’s output weights
to Eurozone GDP are calculated using data from the EU AMECO Database
(2014).
∑𝑍 is a vector of (n-1) year dummies to control for omitted time shocks.
Optimally, our analysis would include measures of national policies towards
mortgage debt accumulation (mortgage tax subsidies, maximum loan to value
10 Our results remain unchanged if we use the proportion of legislative seats occupied by right parties. 11 Our results remain unchanged if we do not weight the CBI index.
Taming Global Finance in an Age of Capital?
22
ratios, etc.). However this data is not available on a consistent time series
basis. OECD (2011) possesses cross-sectional data on mortgage tax subsidies
for 2009 only and maximum loan-to-value ratios for 1990 and 2000 only.
Therefore, we omitted these variables from our regressions, although we
incorporate them into our case study analysis, where we tease out the causal
mechanism. Finally, all independent variables, but not our dependent
variable, are standardized making it possible to compare the impact
magnitudes of the independent variables on housing price growth (beta
coefficients are interpreted as “a one standard deviation change in X leads to a
𝛽% change in housing prices”).
We begin our analysis with a standard OLS estimator with country clustered
standard errors to control for contemporaneous correlation and panel
heteroskedasticity.12 A distributive lag model should blunt the likelihood of
reverse causality between housing price and income growth: present housing
prices should not influence past income growth. However, if housing price
shocks linger for more than one period, endogeneity between these two
variables may continue to exist. Therefore, we use instrumental variable
regression (IV or two stage least squares, 2SLS), using lagged (n-1)
coordination regime dummies (pattern bargaining, state-imposed
coordination, state-led wage pacts, no coordination, and peak-level
bargaining,13 with non-state-led wage pacts as the omitted baseline category)
as instruments for lagged income growth.14 Because we select non-state-led
wage pacts as the baseline category, identified by some as the regime that best
12 A Wooldridge test for auto-correlation (F-statistic of 66.60, p-value=0.000) and an LR test of panel heteroskedasticity (Chi-squared statistic of 71.51, p-value=0.000) for Model I in Table 1 suggest that both first order serial correlation and panel heteroskedasticity are present in the baseline model. 13 Our results below remain consistent when we differentiate between sheltered vs exposed sector dominated peak-level bargaining. 14 We also estimated our baseline model with the Arellano–Bond (1991) general method of moments estimator. Though this estimator is more appropriate for panels where cross-sectional units outnumber time units, it produced results similar to those in Tables 1 and 2.
Alison Johnston and Aidan Regan
23
enhances the sheltered sector’s political bargaining power (Brandl, 2012;
Johnston et al, 2014), it is possible that all our coordination regime dummies
will be significantly negative in the first stage. Our coordination regime data
for 1980-2003 and 2004-2007 stem from Brandl (2012) and Johnston et al
(2014), respectively.
In order to act as suitable instruments, our coordination dummies must be
relevant (significantly correlated with income growth), and exogenous (not
correlated with the error term in the second stage regression). First stage
results assessing the influence of coordination regimes on real income growth
are jointly significant, validating the first requirement. We present the joint F-
test of significance, and in all models, the F-statistic exceeds 10, the threshold
which distinguishes between weakly significant (<10) and strongly significant
(>10) instruments (Stock and Yogo, 2005). Though we assume that wage
coordination regimes’ influence on housing prices operates solely through
their effect on income growth, it is impossible to be completely sure that our
instruments are fully exogenous as one cannot formally test this. However,
given the inclusion of various controls, we account for omitted variables that
may cause our instruments to be endogenous to housing price growth,
increasing the probability of their exogeneity. Export-friendly coordination
regimes may be more typical of governments with greater inflation aversion
or resistance towards credit expansion, both of which have important
implications for housing prices. However, the CBI index proxies as a
country’s central bank’s aversion to inflation. Additionally, by including
cabinet right-party share and the expansion of the ratio of domestic credit
provision to GDP in our models, we also control for possible partisan
determinants of inflation/credit expansion, highlighted in the CPE literature.
Taming Global Finance in an Age of Capital?
24
Finally, both our OLS and IV estimators include random effects rather than
country-specific effects. While these dummies control for omitted time-
invariant country effects (although such omitted variables are more pressing
for level effects, rather than differenced/growth-rate effects, which our models
estimate), their incorporation into the IV/2SLS analysis is problematic for the
coordination regime dummies, as well as for the CBI index. Some countries
(Canada, the UK and the US) exhibit no change in their coordination regimes
over the entire period, meaning that their country dummies would be
perfectly correlated with their coordination regimes (see Plümper et al, 2005,
for a general critique on the use of fixed effects when incorporating
institutional controls).15 This is substantiated in our regression output: in our
IV/2SLS regressions, the inclusion of country dummies rendered the
coordination regime dummies insignificant in the first stage (results available
in an online appendix).
However, realizing that income growth and mortgage credit demand may
serve as substitutes rather than complements for credit-permissive liberal
market economies16 (the UK and US) where mortgage securitization was
central to their growth regimes (Hay 2009), we introduce US and UK country
dummy interactions with lagged income growth in the OLS model to
determine if income’s effect on housing prices for these economies is different
to the wider OECD sample.
15 If we incorporate a full list of (n-1) country dummies within our OLS estimator, which does not incorporate the coordination regime dummies, our results in Table 1 remain unchanged (results available in an online appendix). 16 Canada and Australia are stark contrasts to credit-permissive liberal-market economies. The former’s financial sector was resilient to the 2008 financial crisis, given its higher (pre-crisis) capital requirements and greater leverage restrictions. Due to tighter regulations (Canadian banks cannot offer mortgages with less than 5% down), only 3% of Canadian mortgages were subprime in 2005, compared to 15% in the US (Haltom, 2013). Australia also weathered the 2008 financial crisis well, given its banking sector’s cautious approach to home lending and limited, little history with subprime lending. Australian banks were encouraged by government policy to avoid risky loans (Hill, 2012).
Alison Johnston and Aidan Regan
25
Results
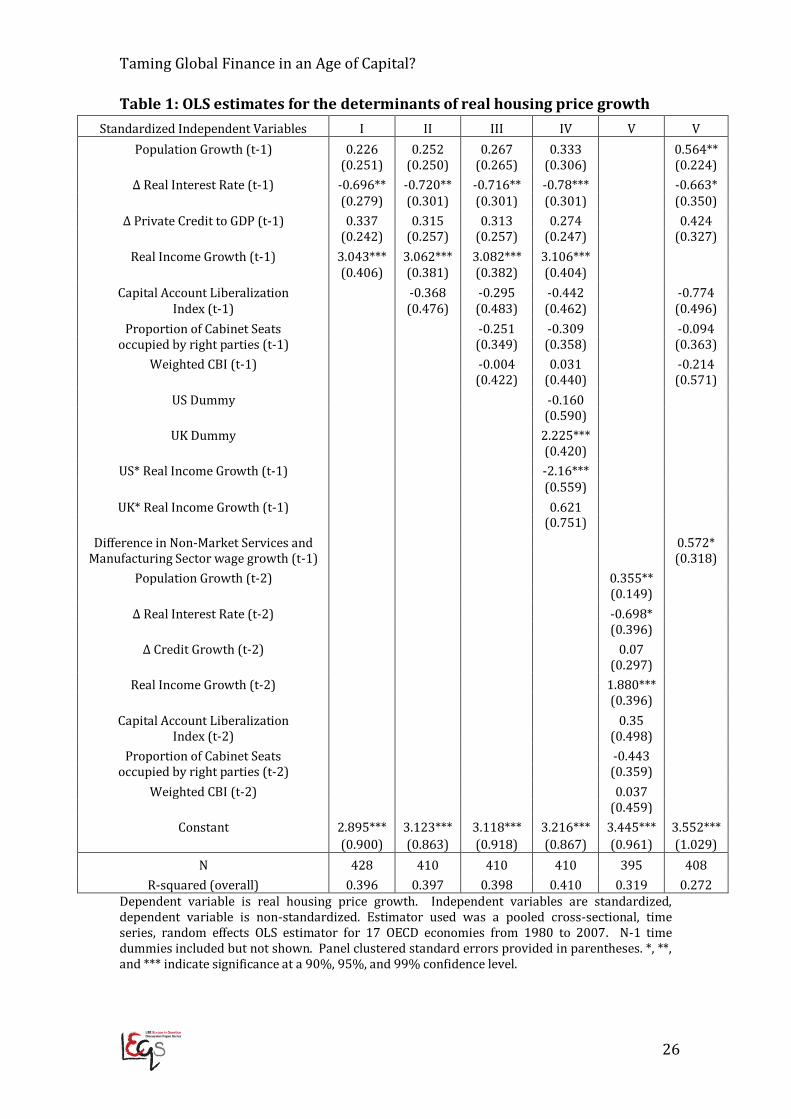
Table 1 presents our results for the OLS estimator. Our baseline model
(Model I, Table 1) excludes the capital account openness index, as this
variable is largely absent for Belgium, which would exclude it from our
sample. Model II in Table 1 includes the capital account openness index.
Model III, Table 1, includes our domestic political controls. Model IV
presents results for the US and UK country dummy interactions with lagged
income growth. Model V presents results for a two year, rather than one year,
lag of the independent variables. Model VI presents an alternative measure of
income growth that examines the extent to which wage growth in the
sheltered non-market services sector (a weighted composite of public
administration and defence, education, and health/social work) exceeds wage
growth in the manufacturing sector (data stemming from EU KLEMS, 2010).
Coordination regimes that grant the export sector or the state greater political
leverage in wage bargaining tend to exhibit smaller or negative values in
wage growth differentials between the non-market services and
manufacturing sector, while those that grant unions in the non-tradable
sectors greater bargaining power tend to exhibit larger differentials.
Therefore, if this variable is high (non-market services wage growth outpaces
that in the manufacturing sector), housing price growth, driven by sheltered
sector wage inflation, should increase.
Taming Global Finance in an Age of Capital?
26
Table 1: OLS estimates for the determinants of real housing price growth Standardized Independent Variables I II III IV V V
Population Growth (t-1) 0.226 0.252 0.267 0.333 0.564** (0.251) (0.250) (0.265) (0.306) (0.224)
Δ Real Interest Rate (t-1) -0.696** -0.720** -0.716** -0.78*** -0.663* (0.279) (0.301) (0.301) (0.301) (0.350)
Δ Private Credit to GDP (t-1) 0.337 0.315 0.313 0.274 0.424 (0.242) (0.257) (0.257) (0.247) (0.327)
Real Income Growth (t-1) 3.043*** 3.062*** 3.082*** 3.106*** (0.406) (0.381) (0.382) (0.404)
Capital Account Liberalization -0.368 -0.295 -0.442 -0.774 Index (t-1) (0.476) (0.483) (0.462) (0.496)
Proportion of Cabinet Seats -0.251 -0.309 -0.094 occupied by right parties (t-1) (0.349) (0.358) (0.363)
Weighted CBI (t-1) -0.004 0.031 -0.214 (0.422) (0.440) (0.571)
US Dummy -0.160 (0.590)
UK Dummy 2.225*** (0.420)
US* Real Income Growth (t-1) -2.16*** (0.559)
UK* Real Income Growth (t-1) 0.621 (0.751)
Difference in Non-Market Services and 0.572* Manufacturing Sector wage growth (t-1) (0.318)
Population Growth (t-2) 0.355** (0.149)
Δ Real Interest Rate (t-2) -0.698* (0.396)
Δ Credit Growth (t-2) 0.07 (0.297)
Real Income Growth (t-2) 1.880*** (0.396)
Capital Account Liberalization 0.35 Index (t-2) (0.498)
Proportion of Cabinet Seats -0.443 occupied by right parties (t-2) (0.359)
Weighted CBI (t-2) 0.037 (0.459)
Constant 2.895*** 3.123*** 3.118*** 3.216*** 3.445*** 3.552*** (0.900) (0.863) (0.918) (0.867) (0.961) (1.029) N 428 410 410 410 395 408
R-squared (overall) 0.396 0.397 0.398 0.410 0.319 0.272 Dependent variable is real housing price growth. Independent variables are standardized, dependent variable is non-standardized. Estimator used was a pooled cross-sectional, time series, random effects OLS estimator for 17 OECD economies from 1980 to 2007. N-1 time dummies included but not shown. Panel clustered standard errors provided in parentheses. *, **, and *** indicate significance at a 90%, 95%, and 99% confidence level.
Alison Johnston and Aidan Regan
27
Only two variables, real income growth and real interest rate reductions, are
consistently significant within our OLS estimates, regardless of the lag
structure used. Both exhibit the anticipated relationships (lagged income
growth is positively associated with housing price growth, while lagged real
interest rates reductions are associated with housing price increases). Income
growth’s beta coefficient, however, exhibits a much larger magnitude than
changes in the real interest rate: a one-standard deviation increase in lagged real
income growth is associated with an annual 3% increase in real housing
prices, while a one standard deviation decrease in real interest rates is
associated with a 0.7% annual housing price increase. Income’s magnitude
declines when using a two year lag structure, yet its impact is still more than
double that of real interest rate movements.
When examining specific income effects for the UK and US (Model IV), the
former does not exhibit a discernable difference from other OECD economies
in the impact of lagged income growth on housing prices (given its
insignificant interaction term). However, the US country dummy’s
interaction term is significantly negative, and largely cancels out the
significantly positive (hierarchal) effect of lagged income growth. This result
lends credence to the suggestion that income and (mortgage) credit serve as
substitutes in the US, but complements throughout the rest of the OECD
(including the UK).
When income growth is conceptualized in terms of sectoral wage differentials
(i.e. the scale of sheltered sector wage push compared to that in
manufacturing), the anticipated relationship was also significant: a one
standard deviation increase in the lagged gap between sheltered and
manufacturing sector wage growth, indicating sheltered sector wage push, is
Taming Global Finance in an Age of Capital?
28
associated with a 0.57% annual increase in housing prices. Our other financial
variables, credit expansion and the capital account openness index, and
domestic political controls displayed no significant relationship with housing
price growth.17 Lagged population growth corresponds with housing price
growth in only two of the five models (its relationship is most significant in a
second year lag structure).
According to results in Table 1, lagged income growth demonstrates a much
stronger relationship with housing price growth than lagged real interest rate
movements. However, income’s impact may be upwardly biased (increases
in housing prices place upward pressure on income growth, which in turn
fuels housing prices). Table 2 presents our IV/2SLS regression results, which
attempts to control for this. Model I is the baseline model without the capital
account openness index. Model II includes the capital account openness
index. Model III includes domestic political controls. In Model IV, Table 2, we
further lag our coordination dummies: two year lags of the coordination
regime dummies serve as the instruments for the one year lag of real income
growth. We do this in order to determine whether incorporating for
coordination regimes’ potentially lagged effects on income growth influences
income growth’s beta coefficient in the second stage.
17 It is unlikely that this is due to imperfect multicollinearity as all independent variables display insignificant or small and weakly significant (pair-wise correlations of less than 0.15) with each other.
Alison Johnston and Aidan Regan
29
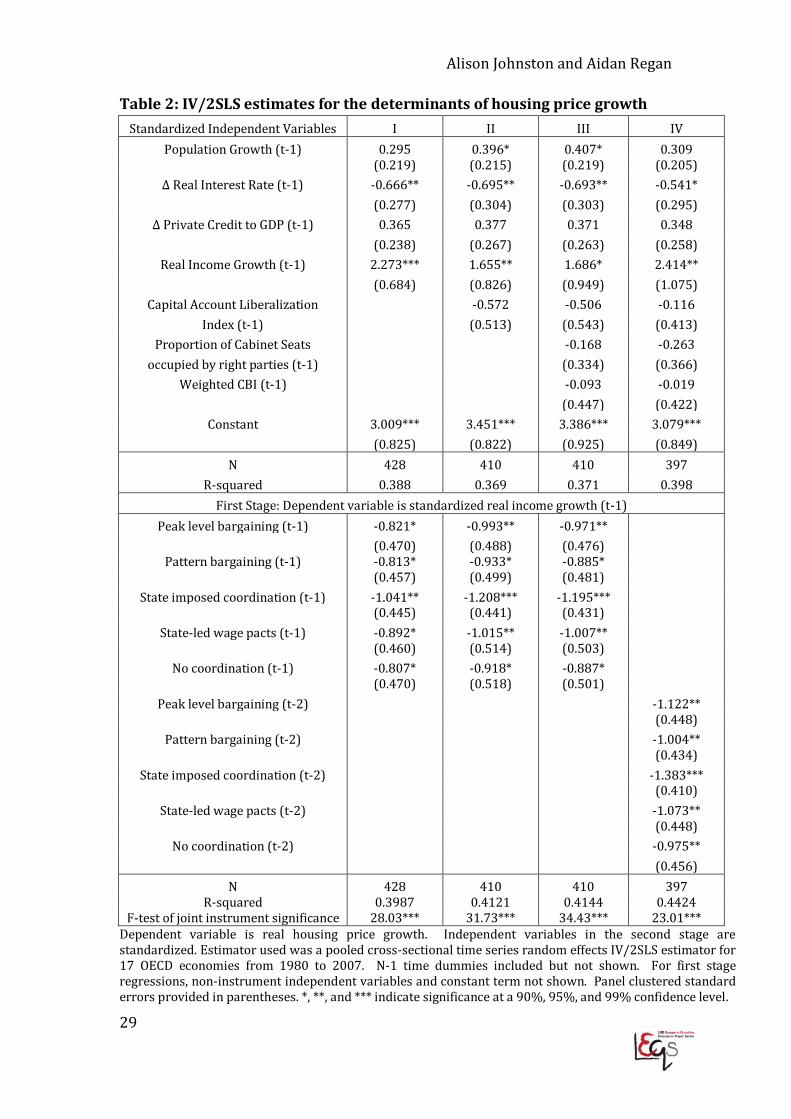
Table 2: IV/2SLS estimates for the determinants of housing price growth Standardized Independent Variables I II III IV
Population Growth (t-1) 0.295 0.396* 0.407* 0.309 (0.219) (0.215) (0.219) (0.205)
Δ Real Interest Rate (t-1) -0.666** -0.695** -0.693** -0.541* (0.277) (0.304) (0.303) (0.295)
Δ Private Credit to GDP (t-1) 0.365 0.377 0.371 0.348 (0.238) (0.267) (0.263) (0.258)
Real Income Growth (t-1) 2.273*** 1.655** 1.686* 2.414** (0.684) (0.826) (0.949) (1.075)
Capital Account Liberalization -0.572 -0.506 -0.116 Index (t-1) (0.513) (0.543) (0.413)
Proportion of Cabinet Seats -0.168 -0.263 occupied by right parties (t-1) (0.334) (0.366)
Weighted CBI (t-1) -0.093 -0.019 (0.447) (0.422)
Constant 3.009*** 3.451*** 3.386*** 3.079*** (0.825) (0.822) (0.925) (0.849)
N 428 410 410 397 R-squared 0.388 0.369 0.371 0.398
First Stage: Dependent variable is standardized real income growth (t-1) Peak level bargaining (t-1) -0.821* -0.993** -0.971**
(0.470) (0.488) (0.476) Pattern bargaining (t-1) -0.813* -0.933* -0.885*
(0.457) (0.499) (0.481) State imposed coordination (t-1) -1.041** -1.208*** -1.195***
(0.445) (0.441) (0.431) State-led wage pacts (t-1) -0.892* -1.015** -1.007**
(0.460) (0.514) (0.503)
No coordination (t-1) -0.807* -0.918* -0.887* (0.470) (0.518) (0.501)
Peak level bargaining (t-2) -1.122**
(0.448)
Pattern bargaining (t-2) -1.004**
(0.434)
State imposed coordination (t-2) -1.383***
(0.410)
State-led wage pacts (t-2) -1.073**
(0.448)
No coordination (t-2) -0.975**
(0.456)
N 428 410 410 397 R-squared 0.3987 0.4121 0.4144 0.4424
F-test of joint instrument significance 28.03*** 31.73*** 34.43*** 23.01*** Dependent variable is real housing price growth. Independent variables in the second stage are standardized. Estimator used was a pooled cross-sectional time series random effects IV/2SLS estimator for 17 OECD economies from 1980 to 2007. N-1 time dummies included but not shown. For first stage regressions, non-instrument independent variables and constant term not shown. Panel clustered standard errors provided in parentheses. *, **, and *** indicate significance at a 90%, 95%, and 99% confidence level.
Taming Global Finance in an Age of Capital?
30
Table 2, first stage estimates conform largely to our hypotheses. Pattern
bargaining, state imposed coordination, and state-led wage pacts exhibited
lower annual real wage growth, on average, than the baseline category (non-
state-led wage pacts). The other two coordination regimes also exhibited
significantly (although for uncoordinated regimes, weakly significant) lower
annual wage growth than non-state-led wage pacts: note that these wage
pacts impose the least constraints on sheltered sector unions. When
distinguishing between sheltered and export sector dominated peak
bargaining regimes, peak level bargaining’s negative coefficient was largely
driven by the latter.
The impact of lagged real income growth on changes in real housing prices is
reduced in the IV regressions. However, the magnitude of lagged income
growth’s impact remains substantial, and continues to exceed the predicted
effects of changes in lagged real interest rate. According to results in Table 2,
a one standard deviation increase in lagged real income is associated with a
1.6-2.4% annual increase in housing prices, while the impact of a lagged one
standard deviation decrease in real interest rates is associated with only a 0.6-
0.7% annual increase in housing prices. Similar to the OLS models, financial
and other domestic political variables displayed no significant association
with housing prices.
Results in Tables 1 and 2 provide robust empirical evidence of the primacy of
income growth’s influence on housing prices. Income exhibited the largest
impact on housing price growth of all variables examined, although its impact
was negligible for the US, even when attempting to correct for endogeneity
via instrumental variables. While the impact of changes in real interest rates
was also significant, its magnitude was nowhere near that of income growth.
Alison Johnston and Aidan Regan
31
Finally, variables measuring broader trends in financial liberalization and
financial depth displayed no significant effect. To better assess how these
wage-setting regimes, and their underlying sectoral class politics, influence
housing prices, we examine the causal mechanisms underlying the statistical
correlations through a paired case study analysis of Ireland and the
Netherlands.
Primed for housing bubbles: A comparison of Ireland and
the Netherlands
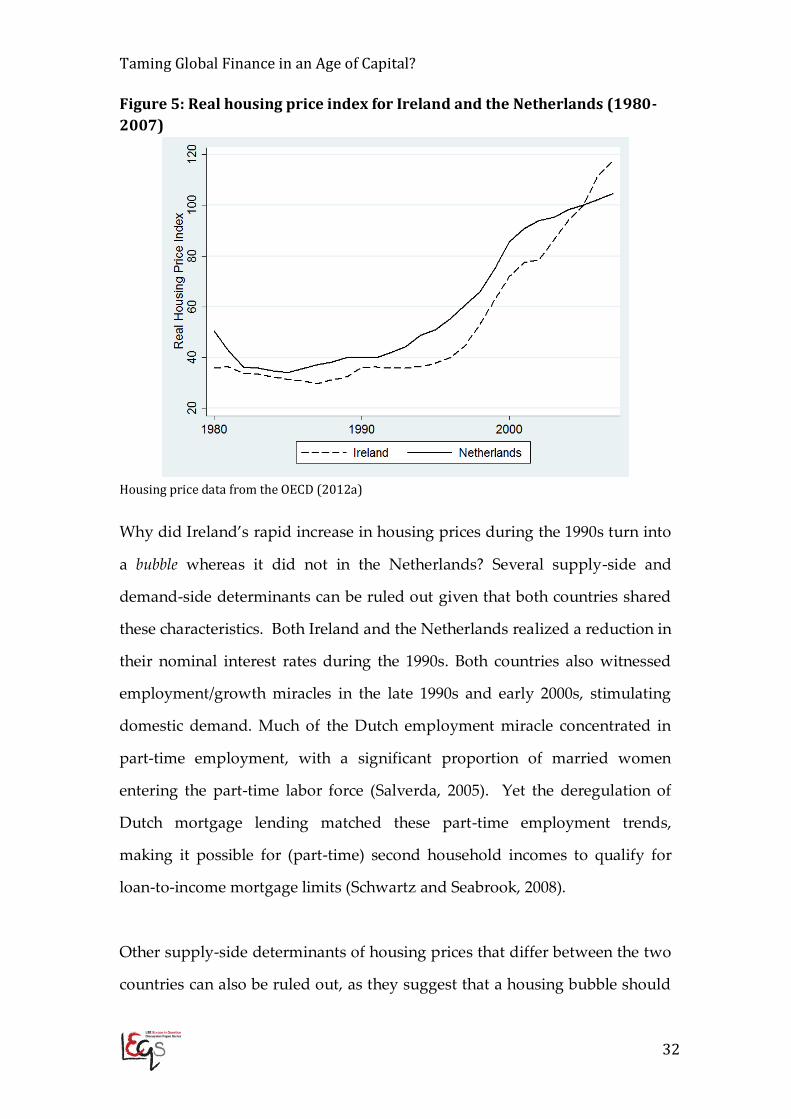
Ireland and the Netherlands provide a useful (method of difference) case
study design to examine the influence of wage-setting institutions on housing
bubbles. During the 1990s, both countries had similar trajectories in their
housing markets. Ireland and the Netherlands had the largest housing price
increases in nominal and real terms in the OECD. Between 1990 and 2000,
nominal/real housing prices increased by 173%/112% in the Netherlands and
170%/99% in Ireland (OECD, 2012). Yet while both countries experienced
significant housing prices growth during the 1990s, they experienced
divergent real-estate price trends during the (pre-financial crisis) 2000s. In
Ireland, housing price growth turned into a bubble between 2002 and 2007.
Nominal housing prices grew by 105%, the third highest in the OECD. The
Netherlands, on the other hand, witnessed a lull in housing price growth.
Between 2002 and 2007, nominal housing prices grew by only 45%, ranking
15th in the OECD housing price growth, whereas real housing price growth in
the Netherlands for the same period was roughly a third of Ireland’s (see
Figure 5).
Taming Global Finance in an Age of Capital?
32
Figure 5: Real housing price index for Ireland and the Netherlands (1980-2007)
Housing price data from the OECD (2012a) Why did Ireland’s rapid increase in housing prices during the 1990s turn into
a bubble whereas it did not in the Netherlands? Several supply-side and
demand-side determinants can be ruled out given that both countries shared
these characteristics. Both Ireland and the Netherlands realized a reduction in
their nominal interest rates during the 1990s. Both countries also witnessed
employment/growth miracles in the late 1990s and early 2000s, stimulating
domestic demand. Much of the Dutch employment miracle concentrated in
part-time employment, with a significant proportion of married women
entering the part-time labor force (Salverda, 2005). Yet the deregulation of
Dutch mortgage lending matched these part-time employment trends,
making it possible for (part-time) second household incomes to qualify for
loan-to-income mortgage limits (Schwartz and Seabrook, 2008).
Other supply-side determinants of housing prices that differ between the two
countries can also be ruled out, as they suggest that a housing bubble should
Alison Johnston and Aidan Regan
33
have emerged in the Netherlands rather than Ireland. First, the Netherlands
has one of the most generous housing credit markets in the OECD. In 2000,
the Netherlands had the highest maximum loan-to-value ratios in the OECD:
the maximum loan a buyer could take out in the Netherlands was 115% of the
home’s value, compared to a maximum limit of 90% in Ireland (Andrews,
Caldera Sánchez, and Johansson, 2011).18 Though maximum loan-to-value
ratios may not suitably gauge credit generosity, as such values are limited to a
country’s least risky homebuyers, similar dynamics emerge when examining
typical/average loan-to-value ratios. In 2002, the Dutch typical loan-to-value
ratio was 90%, growing to 115% by 2008, well above Ireland’s 66% ratio
(Schwartz and Seabrooke, 2008; Vandevyvere and Zenthӧfer, 2012).
The Netherlands also has the most generous tax relief on mortgage interest in
the OECD. In 2009, the gap between the market interest rate on (prime) home
loans and the after-tax debt financing costs of homeownership was just over
1.6%, compared to 0.3% in Ireland (OECD, 2011). Rent control is also stricter
in the Netherlands than in Ireland, due to the presence of a large rental sector
that is dominated by social housing (OECD, 2011). These restrictions should
favor substitution away from rental properties towards home-ownership.
Additionally, housing stock growth in the Netherlands was modest and kept
pace with population growth (Cunha, Lambrecht, and Pawlina, 2009). All of
these supply-side factors suggest that leading into the 2008 global financial
crisis, the Dutch housing market should have been more bubble prone than
Ireland’s. Yet after the early 2000s, Dutch housing prices flat-lined, while Irish
housing prices continued to grow.
18 High loan-to-value ratios should indicate that Dutch borrowers may be more prone towards default. However, unlike the US mortgage market, the passing on of credit risk through mortgage securitization was comparatively rare in the Netherlands, which explains why monitoring problems behind home finance have not been so severe in the country and why lending standards have not been loosened in the 2000s (Cunha, Lambrecht, and Pawlina, 2009).
Taming Global Finance in an Age of Capital?
34
One crucial difference between Ireland and the Netherlands that may explain
their diverging housing price dynamics (and mortgage-demand expansion) in
the mid-2000s was how wage-setting institutions influenced income dynamics
in both countries. Both Ireland and the Netherlands entered EMU with labor
market shortages, and these shortages placed upwards pressures on wages.
By 2001, both countries arrived at a price spiral juncture; Ireland possessed
the highest inflation rate in EMU, and the Netherlands possessed the third
highest (OECD, 2014). What differed between these two countries, which had
significant implications for income growth from 2002 onwards, and in turn
demand for housing prices, was the domestic political response to these
inflation dynamics.
In the Netherlands, the 2001 inflation rate of 4.2%, precipitated an acute sense
of crisis; the country prided itself on its low inflation rates and it had not
witnessed inflation higher than 4% since 1982 (OECD, 2014). Prompted by
government action, trade unions and employers immediately agreed to a
wage ceiling in late 2002, and wage freezes for 2004 and 2005 (Grünell, 2002;
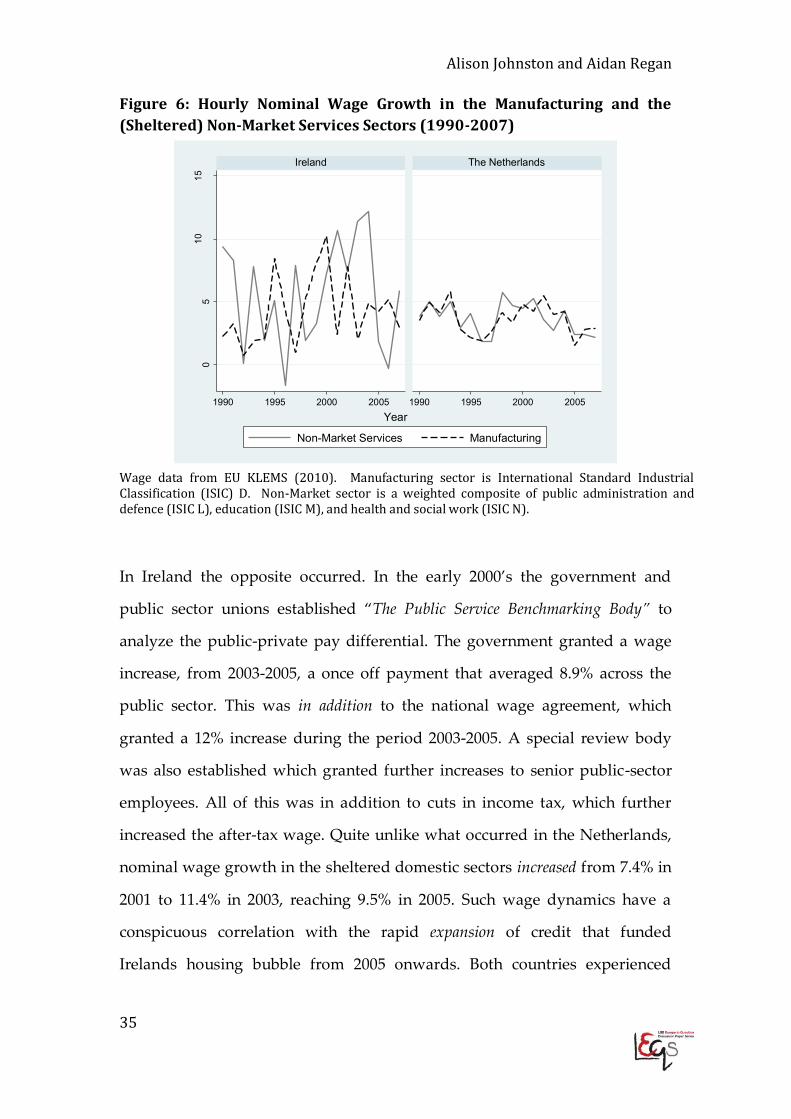
Van het Kaar, 2003). These wage pacts slowed income growth in the country
considerably, and nominal hourly wage growth in the non-market sheltered
sectors (public administration and defense, healthcare and social work, and
education) declined from 5.3% in 2001 to 1.7% by 2005, see Figure 6). Such
wage dynamics have conspicuous correlations with the lull in Dutch housing
price growth.
Alison Johnston and Aidan Regan
35
Figure 6: Hourly Nominal Wage Growth in the Manufacturing and the (Sheltered) Non-Market Services Sectors (1990-2007)
Wage data from EU KLEMS (2010). Manufacturing sector is International Standard Industrial Classification (ISIC) D. Non-Market sector is a weighted composite of public administration and defence (ISIC L), education (ISIC M), and health and social work (ISIC N).
In Ireland the opposite occurred. In the early 2000’s the government and
public sector unions established “The Public Service Benchmarking Body” to
analyze the public-private pay differential. The government granted a wage
increase, from 2003-2005, a once off payment that averaged 8.9% across the
public sector. This was in addition to the national wage agreement, which
granted a 12% increase during the period 2003-2005. A special review body
was also established which granted further increases to senior public-sector
employees. All of this was in addition to cuts in income tax, which further
increased the after-tax wage. Quite unlike what occurred in the Netherlands,
nominal wage growth in the sheltered domestic sectors increased from 7.4% in
2001 to 11.4% in 2003, reaching 9.5% in 2005. Such wage dynamics have a
conspicuous correlation with the rapid expansion of credit that funded
Irelands housing bubble from 2005 onwards. Both countries experienced
05
1015
Nom
inal
wag
e gr
owth
(per
cent
age
chan
ge fr
om p
revi
ous
year
)
1990 1995 2000 2005 1990 1995 2000 2005
Ireland The Netherlands
Non-Market Services Manufacturing
Year
Taming Global Finance in an Age of Capital?
36
credit expansion and rising inflation. The Dutch responded by imposing a
wage freeze. Ireland responded by expanding income growth.
Avoiding a bubble: Dutch corporatism’s success in income moderation
The Netherlands entered the 2000s with one of its largest spikes in nominal
and real housing prices. Though inflation was low, Dutch unions embarked
on a wage push that led to the doubling of inflation within a year. This wage
push was initiated by the public sector union Abva-Kabo, which represented
almost 30% of the Federation Dutch Labor Movement’s (FNV’s) membership
(Visser, 2000). In the 1980s and early 1990s, the Dutch government imposed
severe moderated wage growth in the public sector. In 1998, Abva-Kabo
declared that it would seek wage gains to compensate for these
developments, and entered the 1998 bargaining round with a 5% target. By
2001, Abva-Kabo successfully concluded agreements that were only 0.2%
below this benchmark. While FNV called for a moderate 3.5% nominal wage
growth target in 1998, Abva-Kabo encouraged its affiliates to push higher,
especially in the healthcare and education sectors where labor shortages were
acute.
By mid-2001, wage increases were notably high in the social care and welfare
sector, whose workers received annual wage increases of 7.5% and 5.25%
respectively (EIRR, 2001). Abva-Kabo’s wage push campaign did not confine
itself to the public sector. Given the union’s representative power within the
FNV, its leaders also successfully pressured the Confederal FNV leadership to
increase their general wage targets and abandon their traditional wage
formula of setting wage increases in line with inflation and productivity
developments (Van der Meer et al, 2005). Agreements concluded in 2001
Alison Johnston and Aidan Regan
37
provided for an average pay increase of 4.5% (higher than FNV’s 4% target),
and in services the average increase was 5.3% (Van het Kaar, 2001).
By 2001, it was apparent to Dutch employers that wage inflation was leading
the country to competitive decline. Abva-Kabo, and its counter-part in the
Federation of Christian Trade Unions (CNV), successfully used their
representative strength to dominate peak-level pay setting policies. The
critical turning point in Dutch collective bargaining came after the 2002
election. The election brought the return of a business-friendly center-right
coalition, led by Jan-Peter Balkenende’s Christian Democrats, into
government.19 Balkenende’s reformist agenda became a crucial negotiating
tool, and enabled government to persuade the FNV and CNV to agree to
nation-wide wage restraint. In November, 2002, a centrally agreed wage
ceiling of 2.5% was agreed upon by both FNV and CNV. In 2003,
Government again convinced the unions to produce a second national wage
pact, in return for several concessions on its social policy reform proposals. In
October, 2003, the Dutch social partners agreed to a two year wage freeze in
2004 and 2005.
These three incomes policies facilitated considerable downward adjustments
in Dutch wage growth. By 2001, Dutch nominal hourly wage growth was
5.3%, the highest level since 1982. After the imposition of the 2.5% nominal
wage ceiling in 2003, and wage freezes in 2004 and 2005, nominal hourly
wage growth declined to 1.68% in 2005, its lowest level since 1984 (EU
KLEMS, 2010). These national wage pacts overlapped with the slowing of
Dutch housing prices in the early 2000s (see Figure 5). While the Netherlands’
19 Balkenende’s first coalition, with the populist Pim Fortuyn List (LFP) party and the liberals (VVD) collapsed in November, 2002, due to internal conflicts within LFP. Elections in January, 2003 brought the return of CDA to government, with the VVD and the progressive liberals (D-66).
Taming Global Finance in an Age of Capital?
38
generous policies towards mortgage credit accumulation did not change
during the 2000s, the production of three national wage pacts led to a
prominent decline in income growth, reducing the capacity of households to
accumulate financial assets and to leverage housing wealth. In resorting back
to a coordinated bargaining framework, albeit temporarily, that reduced
income growth in its inflationary non-tradable sectors, the Dutch were able to
reduce households’ consumption on large durable assets, slowing housing
prices in the early 2000s.
Fuelling the bubble: Irish corporatism’s inability to moderate incomes
From the late 1980s to 1990’s Ireland instituted a centralized wage bargaining
regime aimed at generating national competitiveness via coordinated public
and private sector wage restraint (Regan 2012). Wage restraint, flexible labor
markets and low corporate taxes generated a distinct export led growth
model that became colloquially known as the “Celtic Tiger”. By 1999, in a
context of rapid economic and employment growth, public sector unions in
the health, administrative and educational sectors, in launched a wage push
campaign. Their wage drive gathered popular support after various teaching,
nursing and police officer strikes. They also gathered broad political support
from larger industrial and private-sector unions. All unions agreed that the
EMU was driving up domestic inflation and needed to be compensated with
wage increases.
In 1999 a centre-right coalition, led by a populist Fianna Fáil (FF) government,
negotiated a three-year wage pact called the Programme for Prosperity and
Fairness (PPF). This was the first wage-pact negotiated in the absence of
external exchange rate pressure, and based around a very generous national
Alison Johnston and Aidan Regan
39
tax-based incomes policy. PPF granted a 15.5% wage increase that averaged
5.5% per annum from 1999 to 2002. It also granted a once off ‘catch up’
increase of 3% to teachers and civil servants. In addition it “guaranteed” that
net take-home pay of all workers would increase by 25% after cuts in income
tax. But most controversially, the PPF established a “Public Service
Benchmarking Body” (PSBB), designed to review public sector pay and assess
whether there was a growing wage differential between the public and
private sector.
PPF was widely endorsed by the affiliates to the union confederation, ICTU.
But from 2000-2002, wage-drift became widespread. ICTU and Ireland’s major
employers’ associations, particularly in construction, were unable to
discipline affiliated wage-setters at company or sectoral level. Wage inflation
was at double-digit figures and public sector employees increasingly
maintained that despite the generous terms of the PPF they were being left
behind. In late 2002, and within this context, the PSBB reported its findings. It
agreed with the professional associations in the public sector (and the FF
government) that there was a growing pay differential, and recommended the
government grant an average 9-11% pay increase to all public sector workers
in addition to the PPF.
The PSBB covered 60% of the total public sector workforce. The first payment
was sanctioned in May 2003, with the final phase paid in May 2005. The cost
of PSBB was estimated at 1.1bn per annum or 3.5% of then net current
government expenditure. Remarkably the findings and methodology of the
report was never published (data was exempt from the provisions of the
Freedom of Information Act), and its conclusions have since been falsified. In
effect the PSBB was a political exercise by the FF government and the social
Taming Global Finance in an Age of Capital?
40
partners to end longstanding wage disputes within the public sector. The PPF
agreed to a cumulative increase of between 18% and 21% over three years,
whilst benchmarking added an additional 8.9%-25%.
In 2003 the government and social partners negotiated another national wage
pact called “Sustaining Progress” (SP). SP granted an additional 13% increase
to be paid within the 2003-2005 period. In the same year, a special review
body for higher-paid public sector employees granted additional increases to
senior civil servants, the judiciary, and government ministers. The outcome
of the two wage pacts, the PSBB, and the special review body was a
substantial increase in the public sector pay bill during the period 2001-2005,
particularly at the top of the income distribution. The public sector wage
premium, after controlling for all relevant characteristics such as age and
education, grew from 7.7% in 2001 (before PSBB was paid) to 23.5% in 2006
(Kelly et al 2008). All of this increase in income conspicuously overlaps with
the spike in house prices from 2003-2005 onwards. Rising household income
preceded the peak of the credit expansion boom, which funded the property
bubble.
Most analyses (see Kelly, 2009, for a definitive account) assume that bank
lending alone explains the housing price bubble. Rising wage income is
considered a symptom of this credit expansion. But this supply-side analysis
misses the importance of where demand for credit is coming from. The rapid
increase in public sector wages, particularly for high earners, preceded the 2005
credit boom. If credit expansion alone explains the house price bubble it
would imply that had the government intervened to restrict loan-to-value
ratios it could have been avoided. But the Dutch case contradicts this
possibility. From 2001-2005 private sector credit, as a ratio of GDP, was
actually higher in the Netherlands than in Ireland (World Bank, 2014). The
Alison Johnston and Aidan Regan
41
divergence in bank lending occurred after 2005. At the same time, from 2001-
2005, Irish house prices increased by over 45% whereas they stabilized at a
10% in the Netherlands. What differed between the two countries was not
credit supply but wage restraint. In line with our income and mortgage credit
as “complements” hypothesis, the lull in Dutch incomes corresponded with a
lull in Dutch housing prices during the 2000s, while Ireland’s income boom
corresponded with its housing bubble.
Income restraint was made possible in the Netherlands because of
coordinated wage-setting institutions that prioritized the sectoral-class
interests of an export-led political coalition. Social partners collectively
reduced income growth and tamed the demand for credit. The opposite
occurred in Ireland. Centralized wage setting became decoupled from the
export economy, which operated autonomously from the wage bargaining
process. Domestic banking interests dominated employer associations whilst
the construction industry was closely connected to the FF government.
Simultaneously, the trade union movement was dominated by the public
sector. The outcome was a centralized wage bargaining regime built around a
political coalition in the domestic non-tradable sectors, which failed to deliver
wage moderation, thereby helping to fuel a credit boom that fed the country’s
housing bubble.
Taming Global Finance in an Age of Capital?
42
Conclusion
Our results suggest that income growth, and the wage-setting institutions that
govern it, exhibit greater power in explaining housing price growth than
broader financial variables. While our interactive model indicates that
income growth’s impact on housing prices in the US is minimal, lagged
income growth is strongly correlated with housing price increases in other
OECD economies, suggesting that income and mortgage credit may be
complements. This is not to suggest the credit expansion does not matter, but
that mortgage demand is more amplified by the impact of an income shock.
In the midst of international trends, which have made mortgage debt
instruments more plentiful and cheaper, countries with wage setting
institutions led by the export sector, continued to experience moderated
housing price growth. Countries with wage setting institutions that were
shaped by non-tradable sectors, on the other hand, were more prone towards
the devastating housing bubbles outlined in the IPE literature.
Our results suggest that in an age of global finance, domestic sectoral-class
politics continue to exert an important influence on macroeconomic
outcomes. Financial liberalization and the international mobility of capital
have substantially increased the price elasticity of the supply of debt
instruments, granting significant power to banks in extending (mortgage)
credit. But contrary to these broader international financial trends, demand
for borrowing, which revolves around income growth, remains deeply
ingrained in domestic political economies. Most policy discussion in the
aftermath of the crises has focused on the role of the state in regulating credit
supply. Our research suggests that state intervention in shaping and
coordinating the outcomes of wage outcomes is also crucial, especially
Alison Johnston and Aidan Regan
43
outside of the US. Though capital mobility and financial liberalization have
worsened the exposure of domestic economies to financial volatility, wage
coordination regimes that are led by political coalitions in the export sector
may blunt some of the worst effects of these trends, thereby insulating these
countries from the external risks of globalized capital.
Taming Global Finance in an Age of Capital?
44
References Aizenman, J., and Jinjarak, Y. (2009). “Current account patterns and national real estate markets.”
Journal of Urban Economics, 66(2), 75-89.
Andrews, D., Caldera Sánchez, A., and Johansson, Å. (2011), “Housing Markets and Structural Policies in OECD Countries”, OECD Economics Department Working Papers, No. 836, OECD.
Ansell, B. (2014). “The Political Economy of Ownership: Housing Markets and the Welfare State”, American Political Science Review, 1-20.
Arellano, M. and Bond. S. (1991) “Some tests of specification for panel data: Monte Carlo evidence and an application to employment equations”. Review of Economic Studies 58: 277–29
Bank of International Settlements. (2014) “Residential Property Price Statistics”. http://www.bis.org/statistics/pp.htm Accessed January-July, 2014.
Brandl, B. (2012) "Successful Wage Concertation: The Economic Effects of Wage Pacts and their Alternatives". British Journal of Industrial Relations. 50(3): 482-501
Chinn, M.D. and Ito, H. (2006) ”What matters for financial development? Capital controls, institutions and interactions”, Journal of Development Economics. 81: 163-192.
Cukierman, A. (1992). Central Bank Strategy, Credibility and Independence. Cambridge, Massachusetts. MIT Press.
Culpepper, P.D., & Regan, A.(2014).”Why don’t governments need trade unions anymore? The death of social pacts in Ireland and Italy.” Socio-Economic Review, 12(4), 723-745.
Cunha, M.R., Lambrecht, B. and Pawlina, G. (2009) “Determinants of Outstanding Mortgage Loan to Value Ratios: Evidence from the Netherlands”. http://repositorio.ucp.pt/bitstream/10400.14/5368/1/Determinants%20of%20Outstanding%20Mortgage%202009.pdf
Davidoff, T. (2006) “Labor income, housing prices and homeownership”, Journal of Urban Economics. 59(2): 209-235.
Deeg, R., & O'ʹSullivan, M. (2009). “The political economy of global finance capital”, World Politics, 61(04), 731-763.
Duca, J., Muellbauer, J., and Murphy, A. (2010) “Housing markets and the financial crisis of 2007-2009: Lessons for the future”, Journal of Financial Stability. 6(4): 203-217.
European Commission's Directorate General for Economic and Financial Affairs, (2014). Annual macro-economic database (AMECO) Available at http://ec.europa.eu/economy_finance/ameco/user/serie/SelectSerie.cfm. Accessed January 2010 – February 2014.
EU KLEMS Database (2010). http://www.euklems.net. Groningen Growth and Development Centre. Accessed December 2009-April 2010.
European Industrial Relations Review (EIRR) (2001) “New report shows increase in wage inflation”, Issue 330, pg. 9
Fuller, G. (2015). “Who’s Borrowing?: Credit Encouragement vs Credit Mitigation in National Financial Systems” Forthcoming in Politics & Society.
Alison Johnston and Aidan Regan
45
Grünell, M. (2001) “Controversy over wage moderation”. European Industrial Relations Observatory Online. July 28th, 2001
Hall, P. and Soskice, D. (2001) “An introduction to the Varieties of Capitalism” in Hall and Soskice eds. Varieties of Capitalism: The Institutional Foundations of Comparative Advantage. Oxford University Press, Oxford
Halton, R. (2013) “Why was Canada exempt from the Financial Crisis?” Econ Focus (fourth quarter), The Federal Reserve of Richmond: 22-25. https://www.richmondfed.org/publications/research/econ_focus/2013/q4/pdf/feature2.pdf
Hay, C. (2009), “Good Inflation, Bad Inflation: The Housing Boom, Economic Growth and the Disaggregation of Inflationary Preferences in the UK and Ireland”. The British Journal of Politics & International Relations. 11: 461–478.
Hancké, B, (2002) Large firms and institutional change: Industrial renewal and economic restructuring in France, Oxford University Press, Oxford.
Helleiner, E. (2011). “Understanding the 2007-2008 global financial crisis: Lessons for scholars of international political economy”, Annual Review of Political Science, (14):67-87.
Hill, J. (2012) “Why Did Australia Fare So Well in the Global Financial Crisis?”, in Ferran, Moloney, Hill and Coffee eds. The Regulatory Aftermath of the Global Financial Crisis. Cambridge University Press: pg 203-300
Iversen, T., & Soskice, D. (2010). “Real exchange rates and competitiveness: the political economy of skill formation, wage compression, and electoral systems”, American Political Science Review, 104(03), 601-623.
Johnston, A. (2012) "European Economic and Monetary Union's Perverse Effects on Sectoral Wage Inflation: Negative Feedback Effects from Institutional Change?" European Union Politics. 13(3): 345-366
Johnston, A., Hancké, B., and Pant, S. (2014). “Comparative Institutional Advantage in Europe’s Sovereign Debt Crisis”. Comparative Political Studies. 47(13): 1771-1800
Johnston, A., and Regan, A. (2014) “European Integration and the Incompatibility of Different Varieties of Capitalism: Problems with Institutional Divergence in a Monetary Union” MPIfG Discussion Paper. Cologne: Max Planck Institute for the Study of Societies. http://www.mpifg.de/pu/mpifg_dp/dp14-15.pdf
Jones, E. (2014) “Forgotten Financial Union”, Conference paper presented at the 21st Conference of Europeanists, Washington DC, March 14-16, 2014.
Karcher, Sebastian and David A. Steinberg (2012) “Assessing the Causes of Capital Account Liberalization: How Measurement Matters”, International Studies Quarterly. 57(1): 128-137.
Kelly, E., McGuinness, S., & O'Connell, P. (2008). Benchmarking, social partnership and higher remuneration: Wage settling institutions and the public-private sector wage gap in Ireland (No. 270). ESRI working paper.
Kelly, M. (2009). The Irish credit bubble. University College Dublin, School of Economics.
Kindleberger, C. (2008) "Bubbles in history." The New Palgrave Dictionary of Economics: 583-584.
Kindleberger, C., and Aliber, R. (2011) Manias, Panics and Crashes: A History of Financial Crises, Palgrave Macmillan. Basingstoke, UK.
Taming Global Finance in an Age of Capital?
46
Mian, A. and Sufi, A. (2014) House of Debt: How They (and You) Caused the Great Recession, and How We Can Prevent it From Happening Again, The University of Chicago Press. Chicago.
Mosley, L., and Singer, D. (2009) “The Global Financial Crisis: Lessons and Opportunities for International Political Economy”, International Interactions 35(4): 420-429
OECD (2011) “Housing and the Economy: Policies for Renovation”, in OECD eds. Economic Policy Reforms 2011: Going for Growth. Paris, OECD.
OECD (2012a) “Housing Price Indices”, OECD. Data accessed from http://www.google.com/url?sa=t&rct=j&q=&esrc=s&frm=1&source=web&cd=3&ved=0CDoQFjAC&url=http%3A%2F%2Fwww.econ.queensu.ca%2Ffiles%2Fother%2FHouse_Price_indices%2520(OECD).xls&ei=R2JyU8zhFtL4oATr5YDoBg&usg=AFQjCNH3-kLXRE9dAPIlrqiL4X5kbnwq7Q&sig2=d11pmjtXW0iiwSuk0957_A&bvm=bv.66330100,d.cGU
OECD (2012b) “Household Debt”, OECD Factbook.
OECD (2014) Main Economic Indicators, OECD. http://stats.oecd.org/mei/
Ortalo-Magné, F. and Rady, S. (2006) “Housing Market Dynamic: On the contribution of income shocks and credit constraints”, Review of Economic Studies. 73(2): 459-485.
Plümper, T., Troeger, V., and Manow, P. (2005) "Panel data analysis in comparative politics: Linking method to theory", European Journal of Political Research. 44(2): 327-354.
Polillo, S and Guillén, M. “Globalization Pressures and the State: The Global Spread of Central Bank Independence.” American Journal of Sociology 110(6):1764-1802.
Rajan, R. (2011). Fault lines: How hidden fractures still threaten the world economy. Princeton University Press.
Regan, A (2012). The Rise and Fall of Social Partnership: The Political Economy of Institutional Change in European Varieties of Capitalism. Thesis, PhD in Public Policy, University College Dublin (UCD).
Rehm. P. and Wren, A. (2014) "The end of the consensus? Labour market developments and the politics of retrenchment." Socio-Economic Review 12(2): 409-435.
Reinhart, C. and Reinhart, V. (2008) “Capital Flow Bonanzas: An Encompassing View of the Past and Present”. NBER Working Paper No. 14321. http://www.nber.org/papers/w14321
Salverda, W. (2005) ‘The Dutch Model: Magic in a Flat Landscape?’, in U. Becker and H. M. Schwartz (eds.) Employment ‘Miracles’, Amsterdam: Amsterdam University Press, pp. 39–64.
Schelkle, W. (2012). “A crisis of what? Mortgage credit markets and the social policy of promoting homeownership in the United States and in Europe”, Politics & society, 40(1), 59-80.
Schwartz, H. (2009). Subprime nation. Cornell UP, Ithaca, NY.
Schwartz, H. (2012). “Housing, the Welfare State, and the Global Financial Crisis What is the Connection?”, Politics & Society, 40(1), 35-58.
Schwartz, H. and Seabrooke, L. (2008) “Varieties of Residential Capitalism in the International Political Economy: Old Welfare States and the New Politics of Housing”, Comparative European Politics. 6: 237-261.
Alison Johnston and Aidan Regan
47
Soskice, D. (1990). "Wage Determination: The Changing Role of Institutions in Advanced Industrialized Countries." Oxford Review of Economic Policy 6(4): 36-61.
Stock, J. H., & Yogo, M. (2005). “Testing for weak instruments in linear IV regression” Identification and inference for econometric models: Essays in honor of Thomas Rothenberg, 1.
Swank, D. (2006). “Electoral, Legislative, and Government Strength of Political Parties by Ideological Group in Capitalist Democracies, 1950-2006: A Dataset”. http://www.marquette.edu/polisci/documents/part19502006.xls
Traxler, F. and Brandl, B. (2010). "Collective Bargaining, Macroeconomic Performance, and the Sectoral Composition of Trade Unions". Industrial Relations. 49(1): 91-115
Trumbull, G. (2012). “Credit Access and Social Welfare The Rise of Consumer Lending in the United States and France”, Politics & Society, 40(1), 9-34.
Van de Meer, M., Visser, J., and Wilthagen, T. (2005). “Adaptive and Reflexive Governance: The Limits of Organized Decentralization”. European Journal of Industrial Relations. 11(3): 347-365.
Van het Kaar, R. (2001) “Tight Labour Market and inflation drive collective bargaining outcomes” EIRO April 28th, 2001.
Van het Kaar, R. (2003) “Pay freeze agreed for 2004-05” European Industrial Relations Observatory Online. October 29th, 2003
Vandevyvere, W and Zenthӧfer, A. (2012) “The housing market in the Netherlands”, European Economy Economic Papers Series, Working Paper No. 457.
Visser, J (2000) "The Netherlands" in Visser and Ebbinghaus eds Trade Unions in Western Europe Since 1945. Palgrave Macmillan
World Bank (2014) World Bank Open Data Database: Domestic Credit to Private Sector http://data.worldbank.org/indicator/FS.AST.PRVT.GD.ZS. Accessed January-June, 2014.
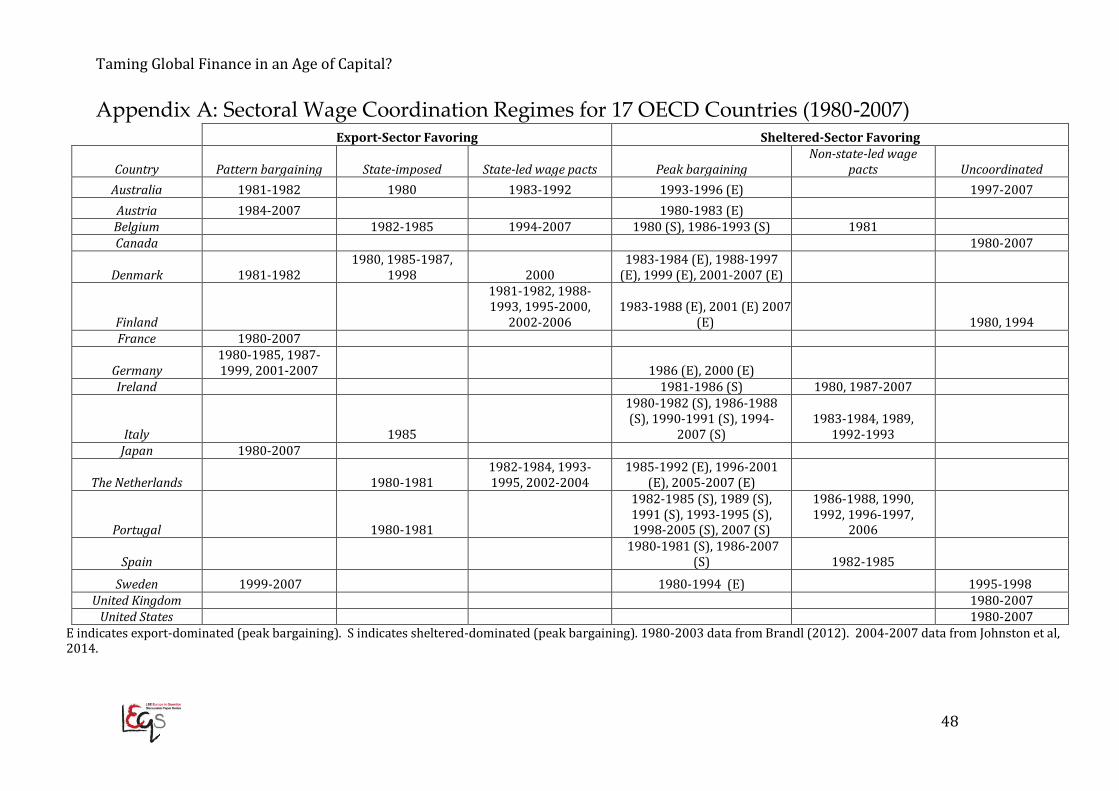
Taming Global Finance in an Age of Capital?
48
Appendix A: Sectoral Wage Coordination Regimes for 17 OECD Countries (1980-2007)
Export-Sector Favoring Sheltered-Sector Favoring
Country Pattern bargaining State-imposed State-led wage pacts Peak bargaining Non-state-led wage
pacts Uncoordinated Australia 1981-1982 1980 1983-1992 1993-1996 (E) 1997-2007 Austria 1984-2007 1980-1983 (E) Belgium 1982-1985 1994-2007 1980 (S), 1986-1993 (S) 1981 Canada 1980-2007
Denmark 1981-1982 1980, 1985-1987,
1998 2000 1983-1984 (E), 1988-1997
(E), 1999 (E), 2001-2007 (E)
Finland
1981-1982, 1988-1993, 1995-2000,
2002-2006 1983-1988 (E), 2001 (E) 2007
(E) 1980, 1994 France 1980-2007
Germany 1980-1985, 1987-1999, 2001-2007 1986 (E), 2000 (E)
Ireland 1981-1986 (S) 1980, 1987-2007
Italy 1985
1980-1982 (S), 1986-1988 (S), 1990-1991 (S), 1994-
2007 (S) 1983-1984, 1989,
1992-1993 Japan 1980-2007
The Netherlands 1980-1981 1982-1984, 1993-1995, 2002-2004
1985-1992 (E), 1996-2001 (E), 2005-2007 (E)
Portugal 1980-1981
1982-1985 (S), 1989 (S), 1991 (S), 1993-1995 (S), 1998-2005 (S), 2007 (S)
1986-1988, 1990, 1992, 1996-1997,
2006
Spain 1980-1981 (S), 1986-2007
(S) 1982-1985 Sweden 1999-2007
1980-1994 (E) 1995-1998
United Kingdom 1980-2007 United States 1980-2007
E indicates export-dominated (peak bargaining). S indicates sheltered-dominated (peak bargaining). 1980-2003 data from Brandl (2012). 2004-2007 data from Johnston et al, 2014.
49
Recent LEQS papers
D’Errico, Marco, Macchiarelli, Corrado & Serafini, Roberta. “Differently unequal. Zooming-in on the distributional dimensions on the crisis in euro area countries” LEQS Paper No. 86, January 2015
Crescenzi, Ricardo & Giua, Mara. “The EU Cohesion policy in context: regional growth and the
influence of agricultural and rural development policies” LEQS Paper No. 85, December 2014 Bartlett, Will. “Shut out? South East Europe and the EU’s New Industrial Policy” LEQS Paper No. 84,
December 2014 Guiso, Luigi, Sapienza, Paola & Zingales, Luigi. ‘’Monet’s Error?’’ LEQS Paper No. 83, November 2014 Costa-i-Font, Joan & Zigante, Valentina. ‘’The Choice Agenda’ in European Health Systems: The Role
of ‘Middle Class Demands’’ LEQS Paper No. 82, November 2014 Woodroof, David M. ‘Governing by Panic: the Politics of Eurozone Crisis’ LEQS Paper No. 81, October
2014 Monastiriotis, Vassilis, Kallioras, Dimitris & Petrakos, George. ‘The regional impact of EU association
agreements: lessons for the ENP from the CEE experience’ LEQS Paper No. 80, October 2014 Bugarič, Bojan. ‘Protecting Democracy and the Rule of Law in the European Union: The Hungarian
Challenge’ LEQS Paper No. 79, July 2014 Bertsou, Eri. ‘The 2014 EP Elections: A Victory for European Democracy? A Report on the LEQS Annual
Event 2014’ LEQS Paper No. 78, July 2014 Innerarity, Daniel. ‘Does Europe Need a Demos to Be Truly Democratic?’ LEQS Paper No. 77, July 2014 Hassel, Anke. ‘Adjustments in the Eurozone: Varieties of Capitalism and the Crisis in Southern Europe’
LEQS Paper No. 76, May 2014 Mabbett, Deborah & Schelkle, Waltraud. 'Searching under the lamp-post: the evolution of fiscal
surveillance' LEQS Paper No. 75, May 2014
Luthra, Renee, Platt, Lucinda & Salamońska, Justyna. ‘Migrant diversity, migration motivations and early integration: the case of Poles in Germany, the Netherlands, London and Dublin’ LEQS Paper No. 74, April 2014
Garcia Calvo, Angela. 'ʹIndustrial Upgrading in Mixed Market Economies: The Spanish Case’ LEQS Paper No. 73, March 2014
White, Jonathan. 'Politicizing Europe: The Challenge of Executive Discretion' LEQS Paper No. 72, February 2014
Esteve-González, Patricia & Theilen, Bernd. 'European Integration: Partisan Motives or Economic Benefits?' LEQS Paper No. 71, February 2014
Monastiriotis, Vassilis. 'Origin of FDI and domestic productivity spillovers: does European FDI have a 'productivity advantage' in the ENP countries?' LEQS Paper No. 70, January 2014
Ward-Warmedinger, Melanie & Macchiarelli, Corrado. 'Transitions in labour market status in the European Union' LEQS Paper No. 69, November 2013
Taming Global Finance in an Age of Capital?
48 50
LEQS European Institute London School of Economics Houghton Street WC2A 2AE London Email: [email protected] http://www2.lse.ac.uk/europeanInstitute/LEQS/Home.aspx
Related Documents