Tamar Field Development Project Environmental Impact Assessment Tamar-7, 8, 9 Drilling and completion; Tamar SW-1 completion Offshore Israel March 2016 Prepared for: Noble Energy Mediterranean Ltd Ackerstein Towers, Building D 12 Abba Eben Boulevard Herzliya Pituach, Israel 46725 Prepared by: CSA Ocean Sciences Inc. 8502 SW Kansas Avenue Stuart, Florida 34997

Welcome message from author
This document is posted to help you gain knowledge. Please leave a comment to let me know what you think about it! Share it to your friends and learn new things together.
Transcript

Tamar Field Development Project Environmental Impact Assessment
Tamar-7, 8, 9 Drilling and completion; Tamar SW-1 completion
Offshore Israel
March 2016
Prepared for:
Noble Energy Mediterranean Ltd Ackerstein Towers, Building D 12 Abba Eben Boulevard Herzliya Pituach, Israel 46725
Prepared by:
CSA Ocean Sciences Inc. 8502 SW Kansas Avenue Stuart, Florida 34997
TAMAR FIELD DEVELOPMENT PROJECT ENVIRONMENTAL IMPACT ASSESSMENT, VOLUME II
OFFSHORE ISRAEL
DOCUMENT NO. CSA-NOBLE-FL-16-2650-08-REP-01-FIN-REV04
VERSION DATE DESCRIPTION PREPARED BY: REVIEWED BY: APPROVED BY:
01 8/15/2014 Initial draft for review L. Reitsema B. Balcom, N. Phillips,
N. Kraft L. Reitsema
02 08/20/2014 Revised draft L. Reitsema C. Kelly, N. Kraft C. Kelly
03 11/10/2014 Final draft L. Reitsema N. Kraft L. Reitsema
FIN 01/14/2015 Revised final L. Reitsema N. Kraft L. Reitsema
FIN-REV 12/11/15 Revised final L. Reitsema K. Dunleavy L. Reitsema, C. Kelly
FIN-REV03 03/14/16
Revised final Version 3
L. Reitsema N/A C. Kelly
FIN-REV04 03/30/16
Revised final Version 4
L. Reitsema C. Kelly C. Kelly
The electronic PDF version of this document is the Controlled Master Copy at all times. A printed copy is considered to be uncontrolled and it is the holder’s responsibility to ensure that they have the current revision. Controlled copies are available on the Management System network site or on request from the Document Production team.

Tamar Field Development Project EIA ES-1 Noble Energy Mediterranean Ltd March 2016 CSA-Noble-FL-16-2650-08-REP-01-FIN-REV04
EXECUTIVE SUMMARY
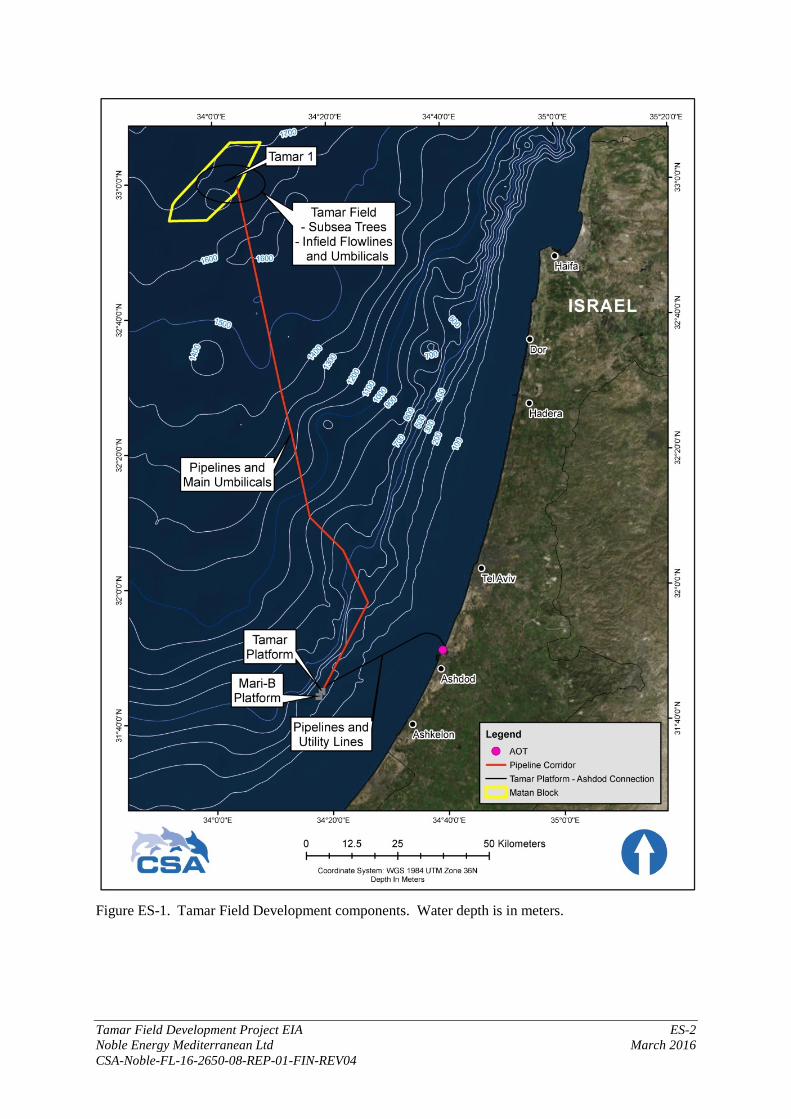
Noble Energy Mediterranean Ltd (Noble Energy) has prepared this Environmental Impact Assessment (EIA) for the Tamar Field Development Project, which includes the drilling of three wells and the installation of subsea infrastructure (i.e., umbilical lines, utility lines, pipelines). Noble Energy has been active in the Tamar Field since 2006 with initial drilling activities starting in 2008. To date, seven wells have been drilled in the field (Tamar-1 through Tamar-6 and Tamar SW-1). Of these, five wells, Tamar-2 through Tamar-6, are currently producing. A gas production and transportation system composed of subsea trees, infield flowlines and umbilicals, and pipelines currently link the Tamar Field to the Tamar Offshore Receiving and Processing Platform (Tamar Platform), located approximately 149 km south-southeast of the field (Figure ES-1).
The proposed Tamar Field Development Project includes the completion of the Tamar SW-1 well, the drilling of three additional wells in the Tamar Reservoir (Tamar-7, Tamar-8, and Tamar-9), and the installation of the infrastructure to tie these wells into the existing Tamar subsea equipment. The umbilical line, utility lines, and pipelines proposed for the Tamar Field Development Project are shown in Figure ES-2 along with the existing infrastructure and the Tamar Field.
For a limited time of a few hours during periods of peak market demand, the Tamar SW well may be added to the existing production system to increase the system capacity. During these limited periods, an increase in gas production of 4% to 5% is expected with a minor increase in discharges. Other than this peak period production, the Tamar SW is expected to be used as a backup well.
The Tamar Field is located in in the Tamar Lease, which is approximately 90 km west of Haifa in the Levantine Basin. The Tamar Lease covers approximately 250 km2, of which the Tamar Field covers approximately 100 km2. The proposed Tamar Field Development Project Application Area is located in the Tamar Field, which is at a water depth of 1,600 to 1,700 m and includes the Tamar SW-1 well area in the Tamar SW Reservoir, the area around the three wells to be drilled in the Tamar Reservoir, and the infrastructure (pipelines, umbilicals, fiber optic cables) from these wells to the existing infrastructure. This EIA examines activities and potential impacts within these areas of influence, including areas within 2 km of the proposed activities, as well as other areas that may be environmentally affected as a result of the potential transport of discharges or emissions.
This EIA presents a summary of the regional environment, including environmental studies that have been performed for the Tamar Field, and assesses the potential impacts that could result from the proposed Tamar Field Development Project. To present the most complete review of the conditions in the field and the potential impacts, the activities and studies completed in the Tamar Field to date are reviewed and the results of completed monitoring throughout the field are presented. The data provide the appropriate characterization of the environment to assess field-wide impacts that may occur as a result of the proposed completion, drilling, and installation activities. Mitigation measures to reduce or eliminate potential impacts are presented in this analysis.
Two surveys performed for Noble Energy provide important data regarding background conditions. These are referred to in this report as the Tamar Field and Pipeline Survey performed in March of 2013 and the Tamar Field Background Monitoring Survey performed in February 2014. The surveys provide background information on physicochemical conditions and the benthic community.
The EIA was prepared and organized in accordance with the Ministry of National Infrastructures, Energy and Water Resources (MNIEWR) and the Ministry of Environmental Protection (MoEP, formerly the Ministry of the Environment) “Framework Guidelines for the Preparation of Environmental Document Accompanying License for Exploration Purposes”.
Tamar Field Development Project EIA ES-2 Noble Energy Mediterranean Ltd March 2016 CSA-Noble-FL-16-2650-08-REP-01-FIN-REV04
Figure ES-1. Tamar Field Development components. Water depth is in meters.

Tamar Field Development Project EIA ES-3 Noble Energy Mediterranean Ltd March 2016 CSA-Noble-FL-16-2650-08-REP-01-FIN-REV04
Figure ES-2. Locations of existing and proposed wells and infrastructure in the Tamar Field
Development.

Tamar Field Development Project EIA ES-4 Noble Energy Mediterranean Ltd March 2016 CSA-Noble-FL-16-2650-08-REP-01-FIN-REV04
BASELINE ENVIRONMENT
The EIA presents detailed information on each proposed well and general regional information based on survey data and other available references.
The seafloor depth at the proposed Tamar-7 well location is 1,665 m below the sea surface. The well location is on the crest of a northwest-to-southeast trending, low-relief seafloor ridge. The relief of the seafloor ridge increases to the southeast and may be the result of deformation in the underlying evaporite section. A northeast-to-southwest trending seafloor strike-slip fault is located approximately 500 m west of the proposed location.
The seafloor depth at the proposed Tamar-8 well location is 1,667 m below the sea surface. The seafloor slopes less than 0.4° and is essentially flat. The well location is on a featureless, undulating abyssal plain, 550m south-southwest of a low-relief ridge. A northeast to southwest trending strike-slip fault intersects the seabed approximately400 m northwest of the proposed location.
The seafloor depth at the proposed Tamar-9 well location is 1,690 m below the sea surface. Like the Tamar-8 location, the seafloor slopes less than 0.4°. The well location is on a featureless, undulating abyssal plain. Seafloor sediments are expected to comprise clays and silts, becoming firmer with depth.
Seismic Activity
There has been one recorded earthquake within 25 km of the Tamar SW-1 drillsite since 1979; the magnitude of the earthquake was 4.0. There have been no strong (magnitude 5.6 or greater on the Richter scale) regional earthquakes recorded within 200 km of the Tamar SW-1 drillsite since 1983. The data suggest that historic earthquakes within the Tamar Field are extremely rare events; when they occur, their magnitude has been moderate to low (i.e., less than 5.6 on the Richter scale).
Winds
The wind regime is characterized by predominant westerly winds throughout most of the year (January through October) and varied winds in November and December. Winds generally are moderate in speed, with average monthly speeds of approximately 5 m s-1. Overall, strong seasonal variability is not evident in the wind data. Winter winds (December through February) have higher maximum speeds than the rest of the year; however, average winds are relatively comparable throughout the year.
Waves
Nearly all of the waves in the region are less than 1.5 m in height, and wave direction is nearly always due eastward at this location (mean of 116°T, standard deviation of 53°) because of the strong westerly winds.
Oceanographic Currents
The upper water column currents at the current meter location were dominated by episodes of strong flows, particularly in the winter. At 25 m depth, the maximum recorded current speed was 53.6 cm s-1, measured in January 2011. Mean current speeds at this depth were estimated to be as fast as 25 cm s-1. At 73 m depth, the maximum current speed was 49.1 cm s-1, measured in April 2011. Mean current speeds at this depth were estimated to be as fast as 22 cm s-1. At 121 m depth, the maximum current speed was 41.5 cm s-1. Mean currents were estimated to be as fast as 17 cm s-1. At 233 m depth, the maximum current speed was 25.8 cm s-1, measured in January 2011. The dominant flow direction at the near-surface was towards the south and west. Near-bottom currents do not appear to have a significant seasonal trend, with a maximum speed of only 8.7 cm s-1.

Tamar Field Development Project EIA ES-5 Noble Energy Mediterranean Ltd March 2016 CSA-Noble-FL-16-2650-08-REP-01-FIN-REV04
Hydrographic Information
Surveys determined that surface waters were cool and isothermal (~17°C to 18°C, depending on the season) to a depth of 100 m, then decreased to 15°C through the thermocline, and gradually stabilized to 14°C through the remainder of the water column to the seafloor. Salinity was recorded near the surface between 38.7 and 39.3 and gradually stabilized with increasing water depth to 38.8 at the seafloor. Turbidity was low (0.10 to 0.15 nephelometric turbidity units [NTU]) throughout the water column. The water column was well oxygenated at the surface (7.4 to 7.5 mg L-1) and gradually stabilized to between 5.7 and 6.0 mg L-1 throughout the water column to the seafloor. Fluorescence, an indicator of photosynthetic activity, peaked at a depth of approximately 100 to 175 m with a concentration of approximately 0.32 to 0.35 mg m-3, depending on the season.
Nature and Ecology
Phytoplankton in the study area are found primarily in the surface waters (0 to 150 m) where light levels are sufficient for growth; the euphotic zone, with maximum phytoplankton productivity, occurs in the surface mixed layer.
Zooplankton in the eastern Levantine Basin are extremely diverse, consisting of copepods and at least 21 other zooplankton taxa.
Within the Tamar Field, 667 individual infaunal organisms were collected during the 2013 and 2014 surveys. Infaunal abundance within the Tamar Field was patchy and ranged from 25 to 125 individuals per m2. Infaunal abundance and species richness were low. The dominant infauna within the region were worms, consisting primarily of the polychaete Notomastus sp.
More than 400 fish species from 130 families are known from the coast of Israel. Results of site-specific surveys in the Tamar Field indicate the presence of several demersal fish species. The most common fish species observed during the July 2012 Environmental Baseline Survey at the Tamar SW-1 drillsite were tripodfish (Bathypterois sp.) and halosaurs (Halosaurus sp.).
Six marine mammal species potentially occurring in the Application Area are listed by the International Union for Conservation of Nature (IUCN) as Critically Endangered (Mediterranean monk seal), Endangered (fin whale, sei whale, and north Atlantic right whale), or Vulnerable (sperm whale and common bottlenose dolphin). Of these, the common bottlenose dolphin is the most abundant in the region and the only species that is a regular resident of the Levantine Basin. The fin whale and sperm whale are visitors, and the sei whale and north Atlantic right whale are vagrants in the Mediterranean Sea and have not been reported in Israeli waters
The primary nesting grounds for the Mediterranean loggerhead turtle population are located along the shores of Greece, Cyprus, and Turkey; the Israeli coast has provided habitat for hundreds of sea turtle nests. Sea turtle nesting starts at the end of May for loggerhead turtles and in mid-June for green turtles, continuing until the end of July and mid-August, respectively.
At least 38 seabird species are native to Israeli waters. Because the Application Area is more than 100 km offshore, the avifauna is likely to consist mainly of pelagic seabirds – those that spend most of their lifecycle in the marine environment, often far offshore over the open ocean. Two seabirds, the Levantine Shearwater and the Dalmatian Pelican, are Vulnerable according to the IUCN Red List. There is no reported breeding for either species in Israel. Several pelagic seabird species are listed in Annex II of the Protocol Concerning Specially Protected Areas and Biological Diversity of the Mediterranean as Endangered or threatened avifauna of the Mediterranean region. Two of these, the Great White Pelican and the Little Tern, breed in Israel; their IUCN status is Least Concern.
Tamar Field Development Project EIA ES-6 Noble Energy Mediterranean Ltd March 2016 CSA-Noble-FL-16-2650-08-REP-01-FIN-REV04
According to the Strategic Environmental Survey prepared by Israel Oceanographic and Limnological Research (IOLR), the deep sea zone of the economic waters of Israel has a very low combined ecological vulnerability.
Seawater and Sediment Quality
Seawater Quality
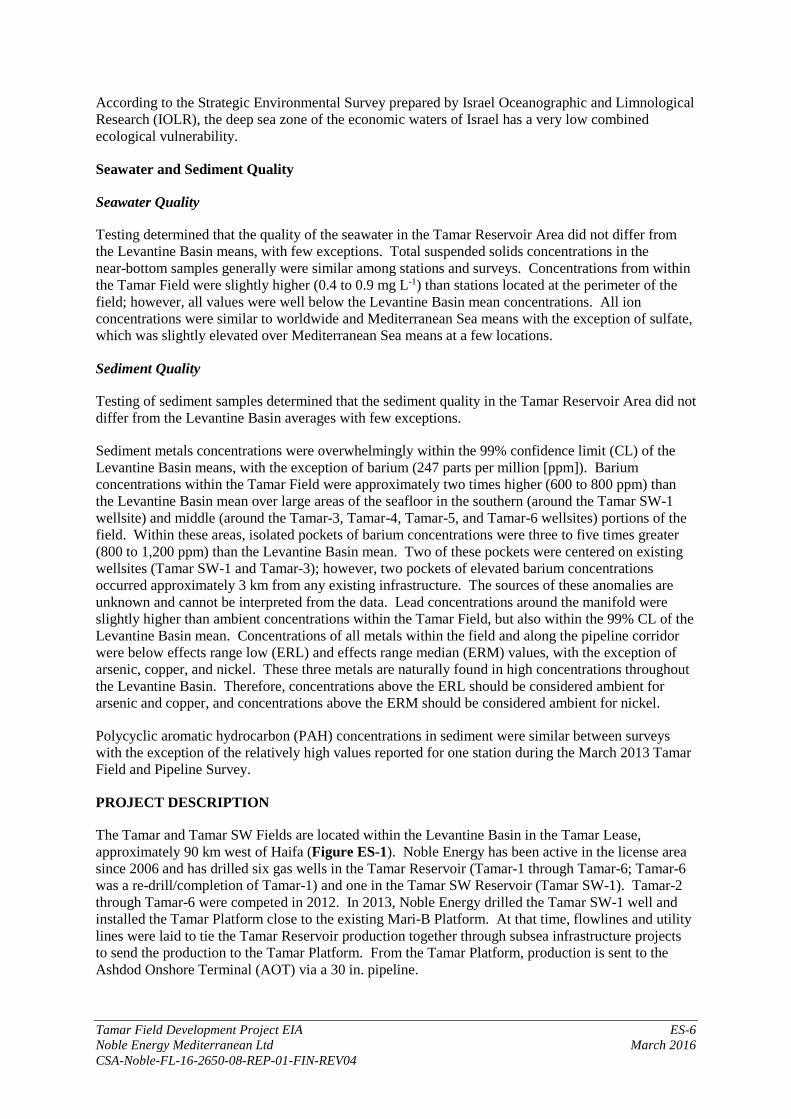
Testing determined that the quality of the seawater in the Tamar Reservoir Area did not differ from the Levantine Basin means, with few exceptions. Total suspended solids concentrations in the near-bottom samples generally were similar among stations and surveys. Concentrations from within the Tamar Field were slightly higher (0.4 to 0.9 mg L-1) than stations located at the perimeter of the field; however, all values were well below the Levantine Basin mean concentrations. All ion concentrations were similar to worldwide and Mediterranean Sea means with the exception of sulfate, which was slightly elevated over Mediterranean Sea means at a few locations.
Sediment Quality
Testing of sediment samples determined that the sediment quality in the Tamar Reservoir Area did not differ from the Levantine Basin averages with few exceptions.
Sediment metals concentrations were overwhelmingly within the 99% confidence limit (CL) of the Levantine Basin means, with the exception of barium (247 parts per million [ppm]). Barium concentrations within the Tamar Field were approximately two times higher (600 to 800 ppm) than the Levantine Basin mean over large areas of the seafloor in the southern (around the Tamar SW-1 wellsite) and middle (around the Tamar-3, Tamar-4, Tamar-5, and Tamar-6 wellsites) portions of the field. Within these areas, isolated pockets of barium concentrations were three to five times greater (800 to 1,200 ppm) than the Levantine Basin mean. Two of these pockets were centered on existing wellsites (Tamar SW-1 and Tamar-3); however, two pockets of elevated barium concentrations occurred approximately 3 km from any existing infrastructure. The sources of these anomalies are unknown and cannot be interpreted from the data. Lead concentrations around the manifold were slightly higher than ambient concentrations within the Tamar Field, but also within the 99% CL of the Levantine Basin mean. Concentrations of all metals within the field and along the pipeline corridor were below effects range low (ERL) and effects range median (ERM) values, with the exception of arsenic, copper, and nickel. These three metals are naturally found in high concentrations throughout the Levantine Basin. Therefore, concentrations above the ERL should be considered ambient for arsenic and copper, and concentrations above the ERM should be considered ambient for nickel.
Polycyclic aromatic hydrocarbon (PAH) concentrations in sediment were similar between surveys with the exception of the relatively high values reported for one station during the March 2013 Tamar Field and Pipeline Survey.
PROJECT DESCRIPTION
The Tamar and Tamar SW Fields are located within the Levantine Basin in the Tamar Lease, approximately 90 km west of Haifa (Figure ES-1). Noble Energy has been active in the license area since 2006 and has drilled six gas wells in the Tamar Reservoir (Tamar-1 through Tamar-6; Tamar-6 was a re-drill/completion of Tamar-1) and one in the Tamar SW Reservoir (Tamar SW-1). Tamar-2 through Tamar-6 were competed in 2012. In 2013, Noble Energy drilled the Tamar SW-1 well and installed the Tamar Platform close to the existing Mari-B Platform. At that time, flowlines and utility lines were laid to tie the Tamar Reservoir production together through subsea infrastructure projects to send the production to the Tamar Platform. From the Tamar Platform, production is sent to the Ashdod Onshore Terminal (AOT) via a 30 in. pipeline.

Tamar Field Development Project EIA ES-7 Noble Energy Mediterranean Ltd March 2016 CSA-Noble-FL-16-2650-08-REP-01-FIN-REV04
Proposed Activities – Tamar Lease Development Project
The proposed Tamar Field Development Project will include the following activities:
• Completion of the Tamar SW-1 well; • Drilling and completion of the Tamar-7, Tamar-8, and Tamar-9 wells; • Infield flowline (12¾ in.) from the Tamar SW-1 well to the Tamar-7 well location;Infield
flowline (16 in.) from the Tamar-7 well to the Tamar production manifold; • Jumper from Tamar-8 into the existing Tamar-3 flowline end termination (FLET) • Infield flowline from Tamar-9 to the Tamar-2 well location (flowline end termination);; • Jumper from Tamar SW-1 to flowline end termination (FLET) on 12 in. west end flowline, 8⅝ in.
outer diameter (OD); • Jumper from FLET on 12 in. east end flowline to 16 in. FLET/flowline west end, 10¾ in. OD; • Jumper from 16 in. FLET on east end 16 in. flowline to intermediate jumper structure (IJS), 10¾
in. OD; • Jumper from IJS to manifold, 10¾ in. OD; • Installation of an Expansion Subsea Distribution Assembly (ESDA); • Installation of electrical, hydraulic, flexible, and optical flying leads; and • Post-installation testing and pre-commissioning.
NON-ROUTINE EVENTS
Non-routine events have a very low probability of occurance. Three different non-routine events were evaluated for the Tamar Field activities for risk evaluation and to meet the requiremnts of the Ministry of National Infrastructures, Energy and Water Resources and the Ministry of Environmental Protection “Framework Guidelines for Preparation of Environmental Document Accompanying License for Exploration Purposes”. The three non-routine events evaluated were: 1) a continuous 30-day discharge of condensate with American Petroleum Institute (API) 35 at a rate of 3,369 bbl d-1 from the Tamar SW-1 exploration well occurring at a depth of approximately 1,650 m; 2) an instantaneous discharge of 16,500 bbl of diesel fuel from the drilling unit; and 3) the accidental loss of solid waste.
Trajectory modeling for the study was conducted for Noble Energy by Dr. Steve Brenner of Bar-Ilan University. Four time periods representative of various climatic conditions over the eastern Mediterranean were considered. The model analyzed the potential for spill weathering to estimate how much condensate and diesel fuel would remain on the sea surface at various times following a spill.
The results for the non-routine scenarios indicate that a condensate or diesel spill from the Tamar SW-1 exploration well would affect both offshore and coastal resources to varying extents depending on environmental conditions. Overall, coastal impacts to Israel are expected for approximately 117 km from just south of Tel Aviv to the Israel/Lebanon border for a condensate spill, and for approximately 60 km from Zichron Yaakov northward to the Israel/Lebanon border for a diesel spill.
EVALUATION OF ENVIRONMENTAL IMPACTS
Impact Assessment Methodology
Two factors are used to determine the significance of an impact: impact consequence and impact likelihood.
Impact consequence refers to an impact’s characteristics on a specific resource (e.g., air quality, water quality, benthic communities, etc.). Such determinations take into account resource-specific sensitivity to an impact, recovery capability, and spatial and temporal occurrence. Impact
Tamar Field Development Project EIA ES-8 Noble Energy Mediterranean Ltd March 2016 CSA-Noble-FL-16-2650-08-REP-01-FIN-REV04
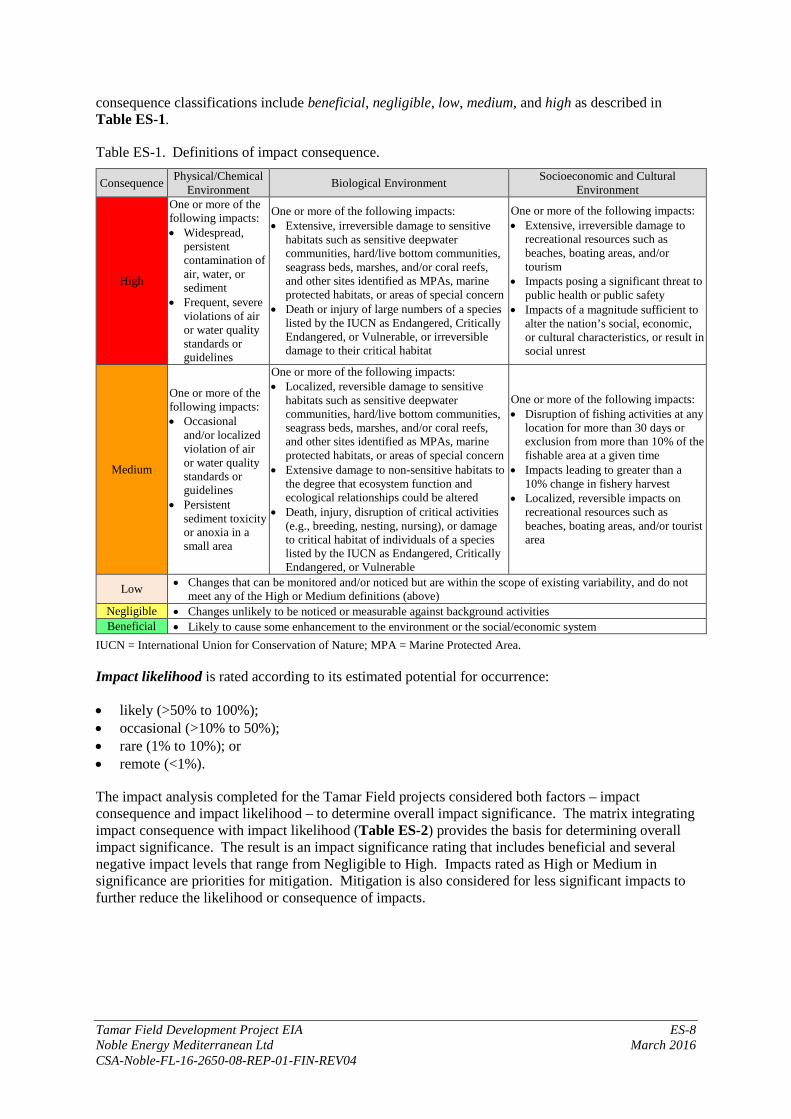
consequence classifications include beneficial, negligible, low, medium, and high as described in Table ES-1.
Table ES-1. Definitions of impact consequence.
Consequence Physical/Chemical Environment Biological Environment Socioeconomic and Cultural
Environment
High
One or more of the following impacts: • Widespread,
persistent contamination of air, water, or sediment
• Frequent, severe violations of air or water quality standards or guidelines
One or more of the following impacts: • Extensive, irreversible damage to sensitive
habitats such as sensitive deepwater communities, hard/live bottom communities, seagrass beds, marshes, and/or coral reefs, and other sites identified as MPAs, marine protected habitats, or areas of special concern
• Death or injury of large numbers of a species listed by the IUCN as Endangered, Critically Endangered, or Vulnerable, or irreversible damage to their critical habitat
One or more of the following impacts: • Extensive, irreversible damage to
recreational resources such as beaches, boating areas, and/or tourism
• Impacts posing a significant threat to public health or public safety
• Impacts of a magnitude sufficient to alter the nation’s social, economic, or cultural characteristics, or result in social unrest
Medium
One or more of the following impacts: • Occasional
and/or localized violation of air or water quality standards or guidelines
• Persistent sediment toxicity or anoxia in a small area
One or more of the following impacts: • Localized, reversible damage to sensitive
habitats such as sensitive deepwater communities, hard/live bottom communities, seagrass beds, marshes, and/or coral reefs, and other sites identified as MPAs, marine protected habitats, or areas of special concern
• Extensive damage to non-sensitive habitats to the degree that ecosystem function and ecological relationships could be altered
• Death, injury, disruption of critical activities (e.g., breeding, nesting, nursing), or damage to critical habitat of individuals of a species listed by the IUCN as Endangered, Critically Endangered, or Vulnerable
One or more of the following impacts: • Disruption of fishing activities at any
location for more than 30 days or exclusion from more than 10% of the fishable area at a given time
• Impacts leading to greater than a 10% change in fishery harvest
• Localized, reversible impacts on recreational resources such as beaches, boating areas, and/or tourist area
Low • Changes that can be monitored and/or noticed but are within the scope of existing variability, and do not meet any of the High or Medium definitions (above)
Negligible • Changes unlikely to be noticed or measurable against background activities Beneficial • Likely to cause some enhancement to the environment or the social/economic system
IUCN = International Union for Conservation of Nature; MPA = Marine Protected Area.
Impact likelihood is rated according to its estimated potential for occurrence:
• likely (>50% to 100%); • occasional (>10% to 50%); • rare (1% to 10%); or • remote (<1%).
The impact analysis completed for the Tamar Field projects considered both factors – impact consequence and impact likelihood – to determine overall impact significance. The matrix integrating impact consequence with impact likelihood (Table ES-2) provides the basis for determining overall impact significance. The result is an impact significance rating that includes beneficial and several negative impact levels that range from Negligible to High. Impacts rated as High or Medium in significance are priorities for mitigation. Mitigation is also considered for less significant impacts to further reduce the likelihood or consequence of impacts.

Tamar Field Development Project EIA ES-9 Noble Energy Mediterranean Ltd March 2016 CSA-Noble-FL-16-2650-08-REP-01-FIN-REV04
Table ES-2. Matrix combining impact consequence and impact likelihood to determine overall impact significance.
Likelihood vs. Consequence Decreasing Impact Consequence
Beneficial Negligible Low Medium High
Dec
reas
ing
Impa
ct
Like
lihoo
d
Likely Beneficial Negligible Low Medium High
Occasional Beneficial Negligible Low Medium High
Rare Beneficial Negligible Negligible Low High
Remote Beneficial Negligible Negligible Low Medium
A series of impact-producing factors (IPFs) was developed and evaluated against the environmental resources which have the potential to be impacted. Table ES-3 presents the results of the EIA evaluation, showing the IPFs in the left column and the environmental resources across the top. The table indicates the resultant impact significance for each identified potential impact as identified and discussed in the EIA.
Most of the evaluated impacts have an expected impact significance of negligible to low. Six of the potential impacts were ranked as medium impact significance. Four of these were expected to result from the worst case discharge, and two were from drilling activities. The potential worst case discharge impacts included impacts on water quality; plankton, fish, and fishery resources; benthic communities; and marine and coastal birds. The medium impact of a worst case discharge on benthic communities would only occur if the released material reached coastal waters; the impact would be expected to be low if the material remained in deep water. The two medium-rated potential impacts resulting from drilling included impacts on sediments/sediment quality and on benthic communities. No impacts were expected to be of high significance.
Table ES-3. Summary matrix of overall impact significance. If a potential impact ranges between two categories, the higher category is presented.
Project Activity/ Impact-Producing
Factor
Environmental Resource Physical/Chemical Biological Socioeconomic and Cultural
Air
Qua
lity
Sedi
men
ts/S
edim
ent Q
ualit
y
Wat
er Q
ualit
y
Plan
kton
, Fish
, an
d Fi
sher
y R
esou
rces
B
enth
ic
Com
mun
ities
M
arin
e M
amm
als a
nd
Sea
Turtl
es
Mar
ine
and
Coa
stal B
irds
Prot
ecte
d M
arin
e Sp
ecie
s and
H
abita
ts, M
arin
e H
abita
ts o
f In
tere
st, a
nd
Are
as o
f Spe
cial
Fish
ing
and
Mar
ine
Farm
ing
Ship
ping
and
M
ariti
me
Indu
stry
R
ecre
atio
n an
d A
esth
etic
s/Tou
rism
Arc
haeo
logi
cal
Res
ourc
es
NON-ROUTINE (ACCIDENTAL) EVENTS (4.3) Drilling Worst Case Gas Discharge *
Large Diesel Fuel Spill Solid Waste (Accidental Loss)
ROUTINE PROJECT-RELATED ACTIVITIES Drilling Activities Drillship Arrival, Departure, and Stationkeeping
Drilling (including release/discharge of drill muds and cuttings, flaring, and other well operations
Physical Presence Lights

Table ES-3. (Continued).
Tamar Field Development Project EIA ES-10 Noble Energy Mediterranean Ltd March 2016 CSA-Noble-FL-16-2650-08-REP-01-FIN-REV04
Project Activity/ Impact-Producing
Factor
Environmental Resource Physical/Chemical Biological Socioeconomic and Cultural
Air
Qua
lity
Sedi
men
ts/S
edim
ent Q
ualit
y
Wat
er Q
ualit
y
Plan
kton
, Fish
, an
d Fi
sher
y R
esou
rces
B
enth
ic
Com
mun
ities
M
arin
e M
amm
als a
nd
Sea
Turtl
es
Mar
ine
and
Coa
stal B
irds
Prot
ecte
d M
arin
e Sp
ecie
s and
H
abita
ts, M
arin
e H
abita
ts o
f In
tere
st, a
nd
Are
as o
f Spe
cial
Fish
ing
and
Mar
ine
Farm
ing
Ship
ping
and
M
ariti
me
Indu
stry
R
ecre
atio
n an
d A
esth
etic
s/Tou
rism
Arc
haeo
logi
cal
Res
ourc
es
Noise (including support vessels and aircrafts)
Routine (non-drilling related) Discharges
Solid Waste Infrastructure Installation and Operation (platform, pipelines, umbilicals) Installation Vessel Arrival, Operation, and Departure
Installation Activities Physical Presence Combustion Emissions Noise Solid Waste Support Vessel and Helicopter Traffic Support Vessel Traffic Helicopter Traffic
* The impact of a worst case discharge is expected to be low for offshore areas, and medium if the discharge reaches the shoreline. Key: Negligible Impact Low Impact Medium Impact

Tamar Field Development Project EIA i Noble Energy Mediterranean Ltd March 2016 CSA-Noble-FL-16-2650-08-REP-01-FIN-REV04
TABLE OF CONTENTS
Page EXECUTIVE SUMMARY ....................................................................................................... ES-1
LIST OF TABLES ....................................................................................................................... IV
LIST OF FIGURES ...................................................................................................................... X
LIST OF ACRONYMS AND ABBREVIATIONS ........................................................................... XVI
CHAPTER 1: DESCRIPTION OF THE CURRENT MARITIME ENVIRONMENT .............................1 1.1 GENERAL OVERVIEW ....................................................................................................... 1
1.1.1 Boundaries of Application and Area of Influence .................................................. 3 1.1.2 Maps and Orthophotos ............................................................................................ 3
1.2 BASELINE ENVIRONMENT ............................................................................................ 11 1.2.1 Geological, Seismic, and Sediment Characteristics .............................................. 11 1.2.2 Physical Oceanography ......................................................................................... 37 1.2.3 Nature and Ecology ............................................................................................... 49 1.2.4 Seawater and Sediment Quality ............................................................................ 70 1.2.5 Culture and Heritage Sites .................................................................................. 121 1.2.6 Meteorology and Air Quality .............................................................................. 121 1.2.7 Noise ................................................................................................................... 122 1.2.8 Marine Transportation System and Infrastructure .............................................. 122 1.2.9 Marine Farming ................................................................................................... 126
CHAPTER 2: REASONS FOR PREFERENCE OF THE LOCATION OF THE PROPOSED PLAN AND POSSIBLE ALTERNATIVES .............................................................................127 2.1 OVERVIEW AND APPLICATION RATIONALE .......................................................... 127 2.2 LOCATION ALTERNATIVES ........................................................................................ 127 2.3 TECHNOLOGICAL ALTERNATIVES ........................................................................... 129
2.3.1 Drilling Technology Alternatives ....................................................................... 130 2.3.2 Infrastructure and Pipeline Alternatives .............................................................. 131
2.4 ALTERNATIVES SUMMARY ........................................................................................ 133
CHAPTER 3: PROJECT DESCRIPTION ...................................................................................137 3.1 GENERAL OVERVIEW ................................................................................................... 137
3.1.1 Proposed Activities – Tamar Field Development Project ................................... 137 3.1.2 Existing Facilities ................................................................................................ 137
3.2 DESCRIPTION OF THE ACTIVITIES FOR THE EXISTING DEVELOPMENT AND FOR THE TAMAR FIELD DEVELOPMENT PROJECT ..................................... 139 3.2.1 Well Locations .................................................................................................... 139 3.2.2 Drilling Program ................................................................................................. 139 3.2.3 Proposed Pipelines and Infrastucture .................................................................. 164 3.2.4 Safe Practices ...................................................................................................... 168
3.3 NOISE HAZARDS ............................................................................................................ 176 3.4 AIR QUALITY .................................................................................................................. 178 3.5 HAZARDOUS MATERIALS ........................................................................................... 180 3.6 DISCHARGES .................................................................................................................. 180
3.6.1 Non-Drilling Discharges ..................................................................................... 181 3.6.2 Drilling Mud, Drill Cuttings, and Concrete Discharge ....................................... 189 3.6.3 Infrastructure Installation Discharges ................................................................. 195 3.6.4 Quality of Discharges .......................................................................................... 195
3.7 WASTE .............................................................................................................................. 201 3.8 ABANDONMENT/CLOSURE ......................................................................................... 202

TABLE OF CONTENTS (CONTINUED)
Page
Tamar Field Development Project EIA ii Noble Energy Mediterranean Ltd March 2016 CSA-Noble-FL-16-2650-08-REP-01-FIN-REV04
CHAPTER 4: EVALUATION OF ENVIRONMENTAL IMPACTS .................................................204 4.1 INTRODUCTION ............................................................................................................. 204
4.1.1 Impact Assessment Methodology ....................................................................... 204 4.1.2 Impact-Producing Factors ................................................................................... 205
4.2 FLOW BACK TESTS ....................................................................................................... 207 4.3 ENVIRONMENTAL IMPACTS OF NON-ROUTINE EVENTS .................................... 207
4.3.1 Drilling Worst Case Well Discharge (Gas) ......................................................... 208 4.3.2 Large Diesel Fuel Spill ....................................................................................... 220 4.3.3 Response Costs Associated with Potential Non-Routine Events ........................ 226 4.3.4 Solid Waste (Accidental Loss) ............................................................................ 227
4.4 LIGHT HAZARDS ............................................................................................................ 229 4.4.1 Sea Turtles........................................................................................................... 229 4.4.2 Marine and Coastal Birds .................................................................................... 229
4.5 NOISE IMPACTS ............................................................................................................. 230 4.5.1 Marine Mammals ................................................................................................ 231 4.5.2 Sea Turtles........................................................................................................... 233 4.5.3 Recreation and Aesthetics/Tourism .................................................................... 234
4.6 NATURE AND ECOLOGY IMPACTS ........................................................................... 234 4.6.1 Sediments and Sediment Quality ........................................................................ 234 4.6.2 Water Quality ...................................................................................................... 244 4.6.3 Plankton, Fish, and Fishery Resources ............................................................... 247 4.6.4 Benthic Communities .......................................................................................... 249 4.6.5 Marine Mammals and Sea Turtles ...................................................................... 251 4.6.6 Marine and Coastal Birds .................................................................................... 253 4.6.7 Protected Species/Habitats .................................................................................. 254
4.7 SHIPPING, MARITIME INDUSTRY, RECREATION, AESTHETICS/TOURISM, AND ARCHAEOLOGICAL RESOURCES ........................ 254 4.7.1 Shipping and Maritime Industry ......................................................................... 255 4.7.2 Recreation and Aesthetics/Tourism .................................................................... 255 4.7.3 Archaeological Resources ................................................................................... 256
4.8 AIR QUALITY .................................................................................................................. 256 4.8.1 Drilling (including release/discharge of drill muds and cuttings, flaring
and other well operations) and Combustion Emissions ..................................... 257 4.8.2 Support Vessel Traffic ........................................................................................ 257 4.8.3 Helicopter Traffic ................................................................................................ 257
4.9 WASTE .............................................................................................................................. 258 4.9.1 General Waste ..................................................................................................... 258 4.9.2 MOBM Cuttings ................................................................................................. 258
4.10 HAZARDOUS MATERIALS ........................................................................................... 259 4.11 SUMMARY OF POTENTIAL IMPACTS ........................................................................ 260 4.12 PREPARATION FOR EARTHQUAKES – EMERGENCY PROCEDURES ................. 261 4.13 FISHING AND MARINE FARMING .............................................................................. 261 4.14 SAFETY AND PROTECTION – SAFETY ZONE .......................................................... 262 4.15 ENVIRONMENTAL MONITORING AND CONTROL PROGRAM ............................ 262
4.15.1 Environmental Monitoring During Drilling and Installation Activity ................ 262 4.15.2 Toxicity Testing .................................................................................................. 265 4.15.3 Environmental Surveys ....................................................................................... 266
4.16 CLOSURE AND ABANDONMENT ............................................................................... 270
TABLE OF CONTENTS (CONTINUED)
Page
Tamar Field Development Project EIA iii Noble Energy Mediterranean Ltd March 2016 CSA-Noble-FL-16-2650-08-REP-01-FIN-REV04
CHAPTER 5: PROPOSAL FOR APPLICATION GUIDELINES (MITIGATION) ...........................271 5.1 OVERVIEW ...................................................................................................................... 271
5.1.1 Noble Energy Environmental Health and Safety Management .......................... 271 5.1.2 Environmental Policy .......................................................................................... 271
5.2 GUIDELINES AND PLANS ............................................................................................. 271 5.2.1 Drilling and Production Test Performance.......................................................... 271 5.2.2 Handling of Hazardous Materials ....................................................................... 272 5.2.3 Reduction and Prevention of Harm to Seafloor, Seawater, and the
Coastline Including Marine Ecology, Cultural and Heritage Sites, Fishing, and Marine Farming ............................................................................. 272
5.2.4 Preservation of Fauna and Flora, Including Pelagic Species .............................. 273 5.2.5 Discharge Monitoring Procedures ....................................................................... 274 5.2.6 Preventing/Reducing Light Hazards ................................................................... 274 5.2.7 Reducing Air Emissions ...................................................................................... 274 5.2.8 Measures for Preventing or Reducing Noise....................................................... 274 5.2.9 Drilling Mud and Cuttings .................................................................................. 275 5.2.10 Other Discharges ................................................................................................. 275 5.2.11 Safety and Protection Zones................................................................................ 275 5.2.12 Waste Treatment and Removal ........................................................................... 276 5.2.13 Emergency Procedures ........................................................................................ 276 5.2.14 Geological and Seismic Risks ............................................................................. 276 5.2.15 Periodical Reporting and Incident Notification .................................................. 276 5.2.16 Changes in Development Plan ............................................................................ 276 5.2.17 Wellsite Abandonment and Rehabilitation ......................................................... 277 5.2.18 Coordination Team and Reporting ...................................................................... 277 5.2.19 Periodical Reporting of Faults to the Petroleum Commissioner and of
Environmental Issues to the Ministry for Environmental Protection ................. 277
CHAPTER 6: LITERATURE CITED .........................................................................................278
APPENDICES ...........................................................................................................................295 Appendix A: Framework Guidelines for Preparation of Environmental Document
Accompanying License for Exploration Purposes ............................................ A-1 Appendix B: Cross-Reference Table for Compliance with Framework Guidelines ......... B-1 Appendix C: Side-Scan Sonar Targets .............................................................................. C-1 Appendix D: Representative Project Vessels and Helicopter Specifications ................... D-1 Appendix E: ESCAID 110 Fluid Specifications ............................................................... E-1 Appendix F: Safety Data Sheets ........................................................................................ F-1 Appendix G: Drilling Mud Treatment and Processing System ........................................ G-1 Appendix H: MUDMAP Model Description ................................................................... H-1 Appendix I: Tamar SW-1 Discharge Permit ...................................................................... I-1 Appendix J: Toxicity Testing Report ................................................................................. J-1
Tamar Field Development Project EIA iv Noble Energy Mediterranean Ltd March 2016 CSA-Noble-FL-16-2650-08-REP-01-FIN-REV04
LIST OF TABLES
Table Page
ES-1. Definitions of impact consequence. ............................................................................ ES-8
ES-2. Matrix combining impact consequence and impact likelihood to determine overall impact significance. ........................................................................................ ES-9
ES-3. Summary matrix of overall impact significance. If a potential impact ranges between two categories, the higher category is presented. ......................................... ES-9
1-1. Significant wave heights and their frequency of occurrence in the Levantine Basin during the period from July 2005 to February 2008. ............................................ 39
1-2. Taxonomic listing and total abundance distribution of major taxa and subgroups in infaunal samples collected from the Tamar Field (1,700 m water depth) (From: CSA Ocean Sciences Inc., 2014). ....................................................................... 52
1-3. Marine mammal species potentially occurring in the Application Area based on Kerem et al. (2012), ACCOBAMS (2012), and Notarbartolo di Sciara and Birkun (2010), and their International Union for Conservation of Nature (IUCN) status. ................................................................................................................. 66
1-4. Sea turtle species potentially occurring in the Application Area. ................................... 67
1-5. Seabird species occurring in Israeli waters (Adapted from: BirdLife International, 2014a). ...................................................................................................... 69
1-6. Shorebird species occurring in Israel that are on the Annex II list. ................................ 70
1-7. Station concentrations of total suspended solids (TSS) in seawater samples collected throughout the water column during the February 2014 Tamar Field Background Monitoring Survey (From: CSA Ocean Sciences Inc., 2014). ................... 71
1-8. Station concentrations of total suspended solids (TSS) in seawater samples collected from near-bottom water during the March 2013 Tamar Field and Pipeline Survey (From: CSA Ocean Sciences Inc., 2014). ............................................. 71
1-9. Mean concentrations (± standard deviation) of total suspended solids (TSS) in seawater samples collected during the March 2013 Tamar Field and Pipeline Survey and the February 2014 Tamar Field Background Monitoring Survey. Levantine Basin means are provided for comparison (From: CSA Ocean Sciences Inc., 2014). ....................................................................................................... 72
1-10. Station concentrations of total organic carbon (TOC), total nitrogen (TN), nitrite (NO2), nitrate (NO3), ammonium (NH4), total phosphorus (TP), and phosphate (PO4) in seawater samples collected throughout the water column during the February 2014 Tamar Field Background Monitoring Survey (From: CSA Ocean Sciences Inc., 2014). ....................................................................................................... 73
1-11. Station concentrations of total nitrogen (TN) and total phosphorus (TP) in seawater samples collected near the seafloor during the March 2013 Tamar Field and Pipeline Survey (From: CSA Ocean Sciences Inc., 2014). ............................. 73

LIST OF TABLES (CONTINUED)
Table Page
Tamar Field Development Project EIA v Noble Energy Mediterranean Ltd March 2016 CSA-Noble-FL-16-2650-08-REP-01-FIN-REV04
1-12. Mean concentrations (± standard deviation) of total organic carbon (TOC), total nitrogen (TN), nitrite (NO2), nitrate (NO3), total phosphorus (TP), and phosphate (PO4) in seawater samples collected during the March 2013 Tamar Field and Pipeline Survey and the February 2014 Tamar Field Background Monitoring Survey .......................................................................................................... 75
1-13. Major ion composition and ionic balance of seawater samples collected within the Tamar Field (From: CSA Ocean Sciences Inc., 2014).............................................. 77
1-14. Total metals concentrations (µg L-1) in seawater collected during the February 2014 Tamar Field Background Monitoring Survey, with the analytical laboratory’s (ALS Environmental) method detection limit (From: CSA Ocean Sciences Inc., 2014). ....................................................................................................... 80
1-15. Dissolved metals concentrations (µg L-1) in seawater collected during the February 2014 Tamar Field Background Monitoring Survey, with the analytical laboratory’s (ALS Environmental) method reporting limit (From: CSA Ocean Sciences Inc., 2014). ....................................................................................................... 81
1-16. Total metals concentrations (µg L-1) in seawater collected during the March 2013 Tamar Field and Pipeline Survey, with the analytical laboratory’s (Geological Survey of Israel) method reporting limit (From: CSA Ocean Sciences Inc., 2014). ....................................................................................................... 82
1-17. Mean (± standard deviation) metals concentrations (µg L-1) in seawater from the March 2013 Tamar Field and Pipeline Survey and February 2014 Tamar Field Background Monitoring Survey. .................................................................................... 83
1-18. Hydrocarbon concentrations in seawater from the February 2014 Tamar Field Background Monitoring Survey. .................................................................................... 86
1-19. Hydrocarbon concentrations in seawater from the March 2013 Tamar Field and Pipeline Survey. .............................................................................................................. 87
1-20. Mean (± standard deviation) hydrocarbon concentrations in seawater from the March 2013 Tamar Field and Pipeline Survey and February 2014 Tamar Field Background Monitoring Survey area. ............................................................................. 88
1-21. Radionuclide concentration for radium (Ra) 226, Ra 228, and combined concentrations in seawater samples collected during the February 2014 Tamar Field Background Monitoring Survey (From: CSA Ocean Sciences Inc., 2014). .......... 89
1-22. Radionuclide concentration for radium (Ra) 226, Ra 228, and combined concentrations in seawater samples collected during the March 2013 Tamar Field and Pipeline Survey (From: CSA Ocean Sciences Inc., 2014). ............................. 89
1-23. Mean (± standard deviation) and combined mean concentrations of radionuclides (radium [Ra] 226 and Ra 228) in seawater from the Tamar Field. .......... 90
1-24. Mean (± standard deviation) total metals concentrations (ppm) in sediments collected from within the Tamar Field. ........................................................................ 112

LIST OF TABLES (CONTINUED)
Table Page
Tamar Field Development Project EIA vi Noble Energy Mediterranean Ltd March 2016 CSA-Noble-FL-16-2650-08-REP-01-FIN-REV04
2-1. Summary of technical and environmental factors evaluated in the selection of drillsite locations. .......................................................................................................... 129
2-2. Summary of location and technological alternatives evaluated for the Tamar Field Development Project drilling and completion activities. .................................... 134
3-1. Overview of activities and dates for the Tamar Field. .................................................. 137
3-2. Existing Tamar well surface locations. ......................................................................... 140
3-3. Volumes of drilling materials used in drilling the Tamar SW-1 well. .......................... 145
3-4. The completion fluid product description for Tamar SW-1. ........................................ 158
3-5. Materials to be used for the Tamar SW-1 well completion program. ........................... 159
3-6. Selected physical, chemical, and environmental characteristics of ESCAID 110 mineral oil-based mud (MOBM) (From: Imperial Oil and ExxonMobil; see Appendix E). ................................................................................................................ 162
3-7. Blowout preventer (BOP) stack manufacture, size and working pressure comparison by rig. ........................................................................................................ 170
3-8. Estimated gas flow and carbon dioxide (CO2) emissions from the Tamar SW-1 flow test. ....................................................................................................................... 172
3-9. Well production parameters for well completions used for estimating emissions. ....... 172
3-10. Well flow back sampling matrix. .................................................................................. 173
3-11. Summary of representative noise source levels for oil and gas exploration-associated drilling operations, vessels, and aircraft (Adapted from: Richardson et al., 1995). .................................................................................................................. 177
3-12. Summary of maximum daily air emission estimates, by source, for the representative Tamar SW-1 well. ................................................................................. 179
3-13. Estimated carbon dioxide (CO2) emissions from the well flow tests. .......................... 179
3-14. Summary of maximum daily air emission estimates, by source, for the planned Tamar-7 to Tamar-9 wells. ........................................................................................... 180
3-15. Summary of non-drilling discharges from the ENSCO 5006 during drilling of the Tamar SW-1 exploratory well. ............................................................................... 181
3-16. Summary of non-drilling discharges expected for the Atwood Advantage. .................. 181
3-17. Discharge timing and flow characteristics of non-drilling discharges for the ENSCO 5006 during drilling of the Tamar SW-1 exploratory well. ............................ 185
3-18. Summary of non-drilling discharge timing and flow characteristics for the Atwood Advantage. ....................................................................................................... 186
3-19. Discharge volumes of non-drilling discharges from the Tamar SW-1 well. ................ 187

LIST OF TABLES (CONTINUED)
Table Page
Tamar Field Development Project EIA vii Noble Energy Mediterranean Ltd March 2016 CSA-Noble-FL-16-2650-08-REP-01-FIN-REV04
3-20. Rig process discharge reductions per well assuming 3.5-day reduction in estimated drilling time based on the use of the Atwood Advantage.............................. 187
3-21. Discharge port specifications and discharge rates. ....................................................... 188
3-22. Discharge timing and flow characteristics for drilling discharges for the ENSCO 5006 during drilling of the Tamar SW-1 well. ................................................ 190
3-23. Estimated weights of drilling mud additives used for well spudding (From: Tamar SW-1 well; Noble Energy, 2012). ......................................................... 191
3-24. Water-based mud discharges from the drilling unit (From: Tamar SW-1 well; Noble Energy, 2012). .................................................................................................... 192
3-25. Total estimated discharges per well from completion activities. .................................. 192
3-26. Cuttings volumes and weights, by section (From: Tamar SW-1 well; Noble Energy, 2012). .............................................................................................................. 193
3-27. Cuttings volumes to be discharged during the Tamar SW-1 completion. .................... 193
3-28. Estimated cuttings volumes using the mineral oil-based mud (MOBM) system.......... 194
3-29. Actual discharge amounts (kg) of chemicals used during the cementing for the Tamar SW-1 well. ......................................................................................................... 194
3-30. Results of analyses of Tamar SW-1 sanitary waste. ..................................................... 196
3-31. Results gray water testing from the Tamar SW-1 well. ................................................ 197
3-32. Results of organic waste discharge analyses for the Tamar SW-1 well. ...................... 197
3-33. Analytical results for organics and other parameters for the Tamar SW-1 drilling mud. ................................................................................................................. 198
3-34. Metal analysis results for the Tamar SW-1 drilling mud. ............................................. 198
3-35. Analytical results for barite samples used for Tamar SW-1. ........................................ 199
3-36. Cuttings analyses for the Tamar SW-1 well. ................................................................ 199
3-37. Results of analyses for radioactive substances in drilling muds and cuttings from the Tamar SW-1 well. .......................................................................................... 200
3-38. Hammermill treatment data from actual sections in United Kingdom North Sea, December 2012 to January 2013 (Data from: Noble Energy, 2014). ........................... 200
3-39. Summary of the Offshore Chemical Notification Scheme (OCNS) Chemical Hazard and Risk Management (CHARM) data for the proposed drilling mud system. .......................................................................................................................... 201
4-1. Definitions of impact consequence. .............................................................................. 204

LIST OF TABLES (CONTINUED)
Table Page
Tamar Field Development Project EIA viii Noble Energy Mediterranean Ltd March 2016 CSA-Noble-FL-16-2650-08-REP-01-FIN-REV04
4-2. Matrix combining impact consequence and likelihood to determine overall impact significance. ...................................................................................................... 205
4-3. Matrix of potential impacts (a priori). .......................................................................... 206
4-4. Trajectory and weathering model results for a continuous 30-day discharge of condensate at a rate of 3,369 bbl d-1 for the four environmental scenarios at the end of 30 days. .............................................................................................................. 209
4-5. Summary of designated protected marine or marine-terrestrial habitats along the Mediterranean coast of Israel, including those listed by the International Union for Conservation of Nature (IUCN). ............................................................................. 217
4-6. Trajectory and weathering model results for an instantaneous discharge of 16,500 bbl of diesel fuel from the drilling unit from the Tamar SW-1 Exploration Well for the four environmental scenarios at the end of 30 days. ............. 220
4-7. Spill response cost estimates in 1999 U.S. dollars for two worst case discharge scenarios. ...................................................................................................................... 227
4-8. Sound sources associated with the drilling program and calculated distances to the applicable exposure threshold for injury and behavioral response. ........................ 233
4-9. Areal extent and distance of water-based muds and cuttings seafloor deposition from a surface location for two scenarios (October to January and July to September) (From: RPS-ASA, 2013). .......................................................................... 235
4-10. Composition of drilling discharges used for modeling (WBM formulations based on Leviathan-5; data provided by Noble Energy). ............................................. 239
4-11. Water-based mud (WBM) cuttings settling velocities used for simulations (Brandsma and Smith, 1999). ..................................................................................... 239
4-12. Water-based mud (WBM) settling velocities used for simulations. ........................... 239
4-13. Thermomechanical cuttings cleaner-treated mineral oil-based mud (MOBM) cuttings settling velocities used in the modeling. ......................................................... 240
4-14. Maximum extent of thickness contours (by distance from release site) for each model scenario for the Leviathan-9 and 9 ST01 wells. ................................................ 242
4-15. Areal extent of seafloor deposition (by thickness interval) for each model scenario for the Leviathan-9 and 9 ST01 wells. ........................................................... 243
4-16. Estimated air pollutant emissions from vessels transporting mineral oil-based mud (MOBM) cuttings from an offshore wellsite to the Port of Haifa. ....................... 259
4-17. Estimated air pollutant emissions from trucks transporting mineral oil-based mud (MOBM) cuttings from the Port of Haifa to the Ramat Hovav landfill. .............. 259
4-18. Summary matrix of overall impact significance. .......................................................... 260

LIST OF TABLES (CONTINUED)
Table Page
Tamar Field Development Project EIA ix Noble Energy Mediterranean Ltd March 2016 CSA-Noble-FL-16-2650-08-REP-01-FIN-REV04
4-19. Monitoring criteria for the Tamar SW-1 well (from the Tamar SW-1 discharge permit)........................................................................................................................... 262
4-20. Frequency of discharge testing and analyses performed for the Tamar SW-1 well (from the Tamar SW-1 discharge permit). ............................................................ 263
4-21. Toxicity tests and testing schedule for drill muds and cuttings (From: USEPA, 2012). ............................................................................................................................ 266
4-22. Analytical parameters, primary laboratory, analysis methods, reporting units, and reporting limits of quantification for seawater samples to be collected during post-drill and area-wide monitoring surveys. .................................................... 268
4-23. Analytical parameters, analytical laboratory, analysis methods, reporting units, reporting/limits of quantification, and sediment quality guidelines (effects range low [ERL] and effects range median [ERM]; Buchman, 2008) for sediment samples to be collected during post-drill and area-wide monitoring surveys. .............. 269

Tamar Field Development Project EIA x Noble Energy Mediterranean Ltd March 2016 CSA-Noble-FL-16-2650-08-REP-01-FIN-REV04
LIST OF FIGURES
Figure Page
ES-1. Tamar Field Development components. ..................................................................... ES-2
ES-2. Locations of existing and proposed wells and infrastructure in the Tamar Field Development. .............................................................................................................. ES-3
1-1. Tamar Field Development components. ........................................................................... 2
1-2. Locations of existing and proposed wells and infrastructure in the Tamar Field Development. .................................................................................................................... 4
1-3. Location of the Tamar Field relative to regional maritime boundaries, submarine cables, mariculture sites, and shipping fairways off the Israeli coastline. ........................................................................................................................... 5
1-4. Tamar Field depth contour map at scale of 1:250,000. ..................................................... 6
1-5. Regional depth map for 2 km around pipeline route from Tamar SW-1 to Tamar-7 at 1:20,000 with 5-m isobaths. ........................................................................... 7
1-6. Regional depth map for 2 km around pipeline route from Tamar SW-1 to Tamar-7 at 1:20,000 with 5-m isobaths. ........................................................................... 8
1-7. Regional depth map for 2 km around pipeline route from Tamar SW-1 to Tamar-7 at 1:20,000 with 5-m isobaths. ........................................................................... 9
1-8. Regional depth map for 2 km around pipeline route from Tamar SW-1 to Tamar-7 at 1:20,000 with 5-m isobaths. ......................................................................... 10
1-9. Tamar-7 seafloor morphology (From: Gardline Surveys Inc., 2013a). .......................... 12
1-10. Tamar-7 seafloor amplitudes (From: Gardline Surveys Inc., 2013a). ............................ 13
1-11. Tamar-7 sand-prone figure (From: Gardline Surveys Inc., 2013a). ............................... 14
1-12. Tamar-7 seismic data example from Inline 11828 (From: Gardline Surveys Inc., 2013a). ............................................................................................................................ 15
1-13. Tamar-7 seismic data example from Crossline 165000 (From: Gardline Surveys Inc., 2013a). .................................................................................................................... 15
1-14. Tamar-7 top hole prognosis (From: Gardline Surveys Inc., 2013a). .............................. 16
1-15. Tamar-8 seafloor morphology (From: Gardline Surveys Inc., 2016). ............................ 18
1-16. Tamar-8 seafloor amplitudes (From: Gardline Surveys Inc., 2016). .............................. 19
1-17. Tamar-8 sand-prone lithology (From: Gardline Surveys Inc., 2016). ............................ 20
1-18. Claystone interbed probability extracat (From: Gardline Surveys Inc., 2016). .............. 21
1-19. Tamar-8 seismic data example from Inline 11805 (From: Gardline Surveys Inc., 2016). .............................................................................................................................. 22
1-20. Tamar-8 seismic data example (From: Gardline Surveys Inc., 2016). ........................... 23
1-21. Tamar-8 top hole prognosis (From: Gardline Surveys Inc., 2016). ................................ 24
LIST OF FIGURES (CONTINUED)
Figure Page
Tamar Field Development Project EIA xi Noble Energy Mediterranean Ltd March 2016 CSA-Noble-FL-16-2650-08-REP-01-FIN-REV04
1-22. Tamar-9 seafloor morphology (From: Gardline Surveys Inc., 2014). ............................ 28
1-23. Tamar-9 seafloor amplitudes (From: Gardline Surveys Inc., 2014). .............................. 29
1-24. Tamar-9 sand-prone figure (From: Gardline Surveys Inc., 2014). ................................. 30
1-25. Tamar-9 seismic data example from Inline 11983 (From: Gardline Surveys Inc., 2014). .............................................................................................................................. 31
1-26. Tamar-9 seismic data example from Crossline 16854 (From: Gardline Surveys Inc., 2014). ...................................................................................................................... 31
1-27. Tamar-9 top hole prognosis (From: Gardline Surveys Inc., 2014). ................................ 32
1-28. Seafloor areas of disturbance on the Mediterranean continental slope off the Israeli coast (From: Almagor and Hall, 1984). ............................................................... 35
1-29. Geological fault zones, locations of historical earthquakes, and regional bathymetric contours relative to the Tamar Field. .......................................................... 36
1-30. Monthly and yearly wind roses of National Center for Environmental Predictions Wind Station 1685, January 1999 through January 2009. ........................... 38
1-31. Rose diagram for annual frequency of wave direction per 10° sector across the Levantine Basin. ............................................................................................................. 39
1-32. Mean annual cycle of the number of storm tracks that passed through the Eastern Mediterranean region, 1962 to 2001 (From: Flocas et al., 2011). ..................... 40
1-33. Compass rose plot of the directional distribution of currents recorded at a depth of 25 m near the Tamar Field. ......................................................................................... 41
1-34. Compass rose plot of the directional distribution of currents recorded at a depth of 73 m near the Tamar Field. ......................................................................................... 42
1-35. Compass rose plot of the directional distribution of currents recorded at a depth of 121 m near the Tamar Field. ....................................................................................... 42
1-36. Compass rose plot of the directional distribution of currents recorded at a depth of 233 m near the Tamar Field. ....................................................................................... 43
1-37. Compass rose plot of the directional distribution of currents recorded at a depth of 1,680 m near the Tamar Field. .................................................................................... 43
1-38. Uniform grid sampling design superimposed over the Tamar Reservoir showing new and previously sampled stations (From: CSA Ocean Sciences Inc., 2014.). .......... 44
1-39. Hydrographic profiles of the water column collected between 10:30 and 20:00 on 13 February 2014 at four stations (B08, C01, D17, H09) located on the perimeter of Tamar Field (From: CSA Ocean Sciences Inc., 2014). .............................. 46
LIST OF FIGURES (CONTINUED)
Figure Page
Tamar Field Development Project EIA xii Noble Energy Mediterranean Ltd March 2016 CSA-Noble-FL-16-2650-08-REP-01-FIN-REV04
1-40. Hydrographic profile of the water column collected at approximately 17:30 on 13 February 2014 at a station located in the middle of the field (E11) (From: CSA Ocean Sciences Inc., 2014). ................................................................................... 47
1-41. Hydrographic profile of the water column collected at 07:00 on 26 March 2013 at Station TF7 (From: CSA Ocean Sciences Inc., 2014). ............................................... 48
1-42. Abundance (individuals m-2) of infauna organisms within the Tamar Field. ................. 54
1-43. Abundance (individuals m-2) of annelids within the Tamar Field. ................................. 55
1-44. Specimen of the polychaetous annelid Notomastus sp. (From: CSA Ocean Sciences Inc., 2014). ....................................................................................................... 56
1-45. Abundance (individuals m-2) of crustaceans (Arthropoda) within the Tamar Field. ............................................................................................................................... 57
1-46. Abundance (individuals m-2) of mollusks within the Tamar Field. ................................ 58
1-47. Abundance (individuals m-2) of Nemertea, Sipuncula, and Phoronida within the Tamar Field. .................................................................................................................... 59
1-48. Species richness within the Tamar Field. ....................................................................... 60
1-49. Pielou’s evenness (J′) metrics from within the Tamar Field. .......................................... 61
1-50. Shannon-Wiener Diversity Index (H′) values from within the Tamar Field. ................. 62
1-51. Ionic concentration and composition of seawater collected from near-surface, mid-depth, and near-bottom within the Tamar Field. ..................................................... 76
1-52. Means (± standard deviation) of the sum of anions and cations in seawater collected from the near-surface, mid-depth, and near-bottom within the Tamar Field. ............................................................................................................................... 78
1-53. Particle size distribution (Wentworth scale; mean + standard deviation) within the Tamar Field. .............................................................................................................. 91
1-54. Individual grid cell and pipeline station particle size classifications (Shepard, 1954) for sediment samples collected within the Tamar Field (Adapted from: CSA Ocean Sciences Inc., 2014). ................................................................................... 91
1-55. Kriged surface of sediment total organic carbon (TOC) concentrations within the Tamar Field. .............................................................................................................. 92
1-56. High-resolution sediment aluminum concentrations within the Tamar Field. ................ 95
1-57. High-resolution sediment antimony concentrations within the Tamar Field. ................. 96
1-58. High-resolution sediment arsenic concentrations within the Tamar Field. .................... 97
1-59. High-resolution sediment barium concentrations within the Tamar Field. .................... 98
1-60. High-resolution sediment beryllium concentrations within the Tamar Field. ................ 99

LIST OF FIGURES (CONTINUED)
Figure Page
Tamar Field Development Project EIA xiii Noble Energy Mediterranean Ltd March 2016 CSA-Noble-FL-16-2650-08-REP-01-FIN-REV04
1-61. High-resolution sediment cadmium concentrations within the Tamar Field. ............... 100
1-62. High-resolution sediment chromium concentrations within the Tamar Field. ............. 101
1-63. High-resolution sediment copper concentrations within the Tamar Field. ................... 102
1-64. High-resolution sediment iron concentrations within the Tamar Field. ....................... 103
1-65. High-resolution sediment lead concentrations within the Tamar Field. ....................... 104
1-66. High-resolution sediment mercury concentrations within the Tamar Field.................. 105
1-67. High-resolution sediment nickel concentrations within the Tamar Field. .................... 106
1-68. High-resolution sediment thallium concentrations within the Tamar Field. ................ 107
1-69. High-resolution sediment vanadium concentrations within the Tamar Field. .............. 108
1-70. High-resolution sediment zinc concentrations within the Tamar Field. ....................... 109
1-71. Plot of aluminum versus antimony, arsenic, barium, beryllium, cadmium, and chromium. ..................................................................................................................... 110
1-72. Plot of aluminum versus copper, lead, mercury, nickel, vanadium, and zinc. .............. 111
1-73. High-resolution sediment total petroleum hydrocarbons (TPH) concentrations within the Tamar Field. ................................................................................................. 114
1-74. Mean (+ standard deviation) concentrations for the 16 U.S. Environmental Protection Agency (USEPA) priority polycyclic aromatic hydrocarbons (PAHs) for sediment samples collected in the Tamar Field (top). ............................................. 115
1-75. High-resolution sediment total polycyclic aromatic hydrocarbon (PAH) concentrations within the Tamar Field. ........................................................................ 116
1-76. Calculated Fossil Fuel Pollution Index (FFPI) ratios within the Tamar Field. ............. 117
1-77. High-resolution sediment radium 226 concentrations within the Tamar Field. ........... 118
1-78. High-resolution sediment radium 228 concentrations within the Tamar Field. ........... 119
1-79. High-resolution sediment thorium 228 concentrations within the Tamar Field. .......... 120
1-80. Side-scan sonar image (left) and subbottom image (right) showing contact number 20 (From: DOF Subsea UK, 2010a). .............................................................. 121
1-81. Ship docking at the ports of Israel, 2000 to 2009 (From: Ministry of Transport and Road Safety, Shipping and Ports Authority, 2009). ............................................... 123
1-82. Sources of shipping containers arriving at the main ports of Israel (in thousand 20-ft equivalent units [TEU]) (From: Israel Ports Authority, 2011)............................. 124
1-83. Destination of shipping containers from main ports of Israel (in thousand 20-ft equivalent units [TEU]) (From: Israel Ports Authority, 2011). .................................... 124

LIST OF FIGURES (CONTINUED)
Figure Page
Tamar Field Development Project EIA xiv Noble Energy Mediterranean Ltd March 2016 CSA-Noble-FL-16-2650-08-REP-01-FIN-REV04
1-84. Cargo volumes passing through Israeli commercial ports, 1995 to 2008. .................... 125
1-85. Map of telecommunication cables of the Mediterranean region (From: Lan Med Nautilus Limited, 2012). ............................................................................................... 126
3-1. Subsea view of the Tamar Field Development. ............................................................ 138
3-2. Vessel specifications for the ENSCO 5006 used to drill the Tamar SW-1 well. .......... 140
3-3. Location of the Tamar SW-1 drillsite relative to the Israeli coastline and regional bathymetric contours. ..................................................................................... 141
3-4. Tamar SW-1 wellbore schematic (From: Noble Energy, 2012). .................................. 143
3-5. Tamar SW-1 plan and actual days versus depth timeline for drilling of the Tamar SW-1 well. ......................................................................................................... 144
3-6. Information on the Sedco Express (From: Rigzone, 2014). .......................................... 147
3-7. Tamar-1 drilling schematic – as built. .......................................................................... 149
3-8. Tamar-2 drilling schematic – as built. .......................................................................... 150
3-9. Tamar-3 drilling schematic – as built. .......................................................................... 151
3-10. Tamar-4 drilling schematic – as built. .......................................................................... 152
3-11. Tamar-5 drilling schematic – as built. .......................................................................... 153
3-12. Tamar-6 drilling schematic – as built. .......................................................................... 154
3-13. Proposed completion schematic (Tamar SW-1). .......................................................... 157
3-14. Information on the Atwood Advantage. ........................................................................ 160
3-15. Information on the GSF Development Driller II. ......................................................... 161
3-16. Process flow diagram for separating mineral oil-based mud (MOBM) cuttings for on-site discharge...................................................................................................... 164
3-17. S-lay pipeline installation (From: Rigzone, 2015). ....................................................... 166
3-18. Pipe being lowered into the water using a stinger for S-lay installation (From: Rigzone, 2015). ............................................................................................................. 167
3-19. Typical blowout preventer (BOP) stack. ...................................................................... 169
3-20. Well flow back schedule. .............................................................................................. 172
3-21. Well completion hydrate curve. .................................................................................... 173
3-22. Discharge streams for the ENSCO 5006. ...................................................................... 182
3-23. Discharge streams for the Atwood Advantage. ............................................................. 183
LIST OF FIGURES (CONTINUED)
Figure Page
Tamar Field Development Project EIA xv Noble Energy Mediterranean Ltd March 2016 CSA-Noble-FL-16-2650-08-REP-01-FIN-REV04
3-24. Plume diameter versus dilution for all 135 simulations (red squares for the no pigging cases; green diamonds and blue triangles for the pigging T7 and SW outlets, respectively). .................................................................................................... 189
3-26. Proposed plug and abandonment (P&A) schematic. .................................................... 203
4-1. Condensate fate parameters for a 30-day continuous discharge of condensate at Tamar SW-1 exploration well for four different time periods representing various climatic conditions. .......................................................................................... 210
4-2. Total amounts of condensate deposited on the coast at the end of 30 days of continuous discharge at Tamar SW-1 exploration well for four different time periods representing various climatic conditions. ......................................................... 211
4-3. Perspective view of example oil/gas plume. ................................................................. 212
4-4. Three phases (momentum jet, buoyant density plume, and free rise) exhibited by a gas release at depth. .............................................................................................. 213
4-5. Oil fate parameters for the instantaneous diesel fuel spill at Tamar SW-1 exploration well for four different time periods representing various climatic conditions. ..................................................................................................................... 221
4-6. Total amounts of diesel fuel deposited on the coast at the end of 30 days after an instantaneous discharge at Tamar SW-1 exploration well for four different time periods representing various climatic conditions. ......................................................... 222
4-7. Vertical profile (left) and current roses showing annual distribution of current speeds (right) at the LV1-1 mooring between 2013 and 2014. ..................................... 237
4-8. Monthly averaged current speeds at LV1-1 derived from measurements between 2013 and 2014 at the sea surface (top) and seafloor (bottom). ..................................... 238
4-9. Cumulative deposition thickness (cuttings and mud) from operational drilling discharges at the representative drilling location (Scenario 1: December to February). ...................................................................................................................... 241
4-10. Cumulative deposition thickness (cuttings and mud) from operational drilling discharges at the representative drilling location (Scenario 2: July to September). ................................................................................................................... 242
Tamar Field Development Project EIA xvi Noble Energy Mediterranean Ltd March 2016 CSA-Noble-FL-16-2650-08-REP-01-FIN-REV04
LIST OF ACRONYMS AND ABBREVIATIONS
3D three-dimensional 3LPP three-layer polypropylene AAC annual average concentration AHTS anchor handling towing supply AIS Alien Invasive Species AOT Ashdod Onshore Terminal API American Petroleum Institute ARP Average Return Period ASTM American Society for Testing and Materials B.C.E. Before Common Era bbl barrel BCF billion cubic feet bhp brake horsepower BOD biochemical oxygen demand BOP blowout preventer CCC Criterion Continuous Concentration CDC Climate Diagnostics Center CDU communication distribution unit CH4 methane CHARM Chemical Hazard and Risk Management CL confidence limit CO carbon monoxide CO2 carbon dioxide CTP casing test pressure DNV Det Norske Veritas DO dissolved oxygen DOX dissolved organic halides DP dynamically positioned DSL digital subscriber line DST Dead Sea Transform EFL electrical Flying Lead EHS Environmental, Health and Safety EIA Environmental Impact Assessment EMS Environmental Management System ERL effects range low ERM effects range median ESD emergency shutdown ESDA expansion subsea distribution assembly EUCEQS European Union Commission on Environmental Quality Standards FEA finite element analysis FFL flexible flying lead FFPI Fossil Fuel Pollution Index FIT Formation Integrity Test FLET flowline end termination FTIR Fourier Transform Infrared GMS Global Management System H2S hydrogen sulfide HFL hydraulic flying lead hp horsepower IJS intermediate jumper starter IMO International Maritime Organization

LIST OF ACRONYMS AND ABBREVIATIONS (CONTINUED)
Tamar Field Development Project EIA xvii Noble Energy Mediterranean Ltd March 2016 CSA-Noble-FL-16-2650-08-REP-01-FIN-REV04
IOLR Israel Oceanographic and Limnological Research IPF impact-producing factor ISO International Organization for Standardization IUCN International Union for Conservation of Nature IUTA infield umbilical termination assembly kip kilopound force LC50 lethal concentration 50 (50% mortality) LWD logging while drilling MAC maximum allowable concentration MARPOL International Convention for the Prevention of Pollution from Ships MASP maximum anticipated surface pressure MAWP maximum anticipated wellhead pressure MBAS methylene blue active substances (assay method) MD measured depth MEG monoethylene glycol MFS Mediterranean Forecasting System MIYP minimum internal yield pressure mmscfd million standard cubic feet per day MNIEWR Ministry of National Infrastructures, Energy and Water Resources MOBM mineral oil-based mud MoEP Ministry of Environmental Protection MT metric ton MWD measurement while drilling NCEP National Center for Environmental Predictions NO2 nitrogen dioxide NOAA U.S. National Oceanic and Atmospheric Administration Noble Energy Noble Energy Mediterranean Ltd NOx nitrogen oxides NPDES U.S. National Pollutant Discharge Elimination System NTU nephelometric turbidity unit OCNS Offshore Chemical Notification Scheme OD outer diameter OMS Operations Management System OSCP Oil Spill Contingency Plan OSPAR Convention for the Protection of the Marine Environment of the North-East
Atlantic P&A plug and abandonment PAH polycyclic aromatic hydrocarbon PCS Process Control System PM particulate matter ppb parts per billion ppg pounds per gallon ppm parts per million PSHA Probabilistic Seismic Hazards Assessment psi pounds per square inch RDIF reservoir drill-in-fluid rms root mean square RO reverse osmosis ROV remotely operated vehicle RSS rotary steerable system SCSSV surface-controlled subsurface safety valve

LIST OF ACRONYMS AND ABBREVIATIONS (CONTINUED)
Tamar Field Development Project EIA xviii Noble Energy Mediterranean Ltd March 2016 CSA-Noble-FL-16-2650-08-REP-01-FIN-REV04
SDA subsea distribution assembly SDS safety data sheet SFRDIF solids-free drill-in-fluid SOLAS Safety of Life at Sea SOx sulfur oxides SPL sound pressure level Tamar Platform Tamar Offshore Receiving and Processing Platform TCC thermomechanical cuttings cleaner TDS total dissolved solids TEU 20-ft equivalent units TKN total Kjeldahl nitrogen TN total nitrogen TOC total organic carbon TP total phosphorus TPH total petroleum hydrocarbons TSS total suspended solids TVD total vertical depth USEPA U.S. Environmental Protection Agency VOC volatile organic compound WBM water-based mud WP working pressure
Tamar Field Development Project EIA 1 Noble Energy Mediterranean Ltd March 2016 CSA-Noble-FL-16-2650-08-REP-01-FIN-REV04
CHAPTER 1: DESCRIPTION OF THE CURRENT MARITIME ENVIRONMENT
1.1 GENERAL OVERVIEW
Noble Energy Mediterranean Ltd (Noble Energy) has prepared this Environmental Impact Assessment (EIA) for the Tamar Field Development Project, which includes:
1. completion of the Tamar SW-1 well; 2. drilling and completion of three wells in the Tamar Reservoir (Tamar-7, Tamar-8, and Tamar-9);
and 3. installation of subsea infrastructure (i.e., umbilical and utility lines, pipelines) to tie these wells
into the existing Tamar subsea equipment.
This document refers to the Tamar infield and the connection of new wells (i.e. Tamar 7, 8, 9 and SW-1) but does not cover additional future lines from the field to the Tamar Platform or any export to Egypt.
Noble Energy has been active in the Tamar Field since 2006 with initial drilling activities starting in 2008. To date, seven wells have been drilled in the Tamar Field (Tamar-1 through Tamar-6 and Tamar SW-1). Of these, five wells, Tamar-2 through Tamar-6, are currently producing. A gas production and transportation system, composed of subsea trees, infield flowlines and umbilicals, and a pipeline, currently links the Tamar Field to the Tamar Offshore Receiving and Processing Platform (Tamar Platform), located approximately 149 km south-southeast of the field (Figure 1-1).
The Tamar SW-1 well is expected to serve mainly as a backup well. For a limited time of a few hours during periods of peak market demand, the Tamar SW well may be added to the existing production system to increase the system capacity. During these limited periods, an increase in gas production of 4% to 5% is expected with a minor increase in discharges. The total gas capacity, based on the current actual capacity, will not increase above the daily maximum production design of 1.2 BCF d-1.
The umbilical line, utility lines, and pipelines proposed for the Tamar Field Development Project are shown in Figure 1-1. Existing infrastructure and the Tamar Reservoir also are shown.
This EIA presents a summary of the regional environment, including environmental studies that have been performed for the Tamar Field, and assesses the potential impacts that could result from the proposed Tamar Field Development Project. To present the most complete review of the conditions in the Tamar Field and the potential impacts, the activities and studies completed in the field to date are reviewed and the results of completed monitoring throughout the field are presented. The data provide the appropriate characterization of the environment to assess field-wide impacts that may occur as a result of the proposed completion, drilling, and installation activities. Mitigation measures to reduce or eliminate potential impacts are presented in this analysis. Generic information has been used in situations where the equipment or process has not yet been identified.
Two surveys performed for Noble Energy provide important data regarding background conditions. These are referred to in this report as the Tamar Field Background Monitoring Survey performed in February 2014 and the Tamar Field and Pipeline Survey performed in March of 2013. The surveys provide background information on physicochemical conditions and the benthic community (CSA Ocean Sciences Inc., 2014).
The EIA was prepared and organized in accordance with the Ministry of National Infrastructures, Energy and Water Resources (MNIEWR) and the Ministry of Environmental Protection (MoEP, formerly the Ministry of the Environment) “Framework Guidelines for Preparation of Environmental Document Accompanying License for Exploration Purposes” (Framework) (Appendix A). The material is presented in sections that do not match the order of the Framework; Appendix B presents

Tamar Field Development Project EIA 2 Noble Energy Mediterranean Ltd March 2016 CSA-Noble-FL-16-2650-08-REP-01-FIN-REV04
a list of the sections required by the Framework and the corresponding sections of this EIA in which the information is presented.
Figure 1-1. Tamar Field Development components. Water depth is in meters.

Tamar Field Development Project EIA 3 Noble Energy Mediterranean Ltd March 2016 CSA-Noble-FL-16-2650-08-REP-01-FIN-REV04
1.1.1 Boundaries of Application and Area of Influence
The Tamar Field is located in the Tamar Lease which is approximately 90 km west of Haifa in the Levantine Basin. The Tamar lease covers approximately 250 km2, of which the Tamar Field covers approximately 100 km2. The proposed Tamar Field Development Project Application Area is located in the Tamar Field, which is at a water depth of 1,600 to 1,700 m and includes the Tamar SW-1 well area in the Tamar SW Reservoir, the area around the three wells to be drilled in the Tamar Reservoir, and the infrastructure (pipelines, umbilicals, fiber optic cables) from these wells to the existing infrastructure. This EIA examines activities and potential impacts within these areas of influence as defined based on the worst case discharge model, including areas within 2 km of the proposed activities, as well as other areas that may be environmentally affected as a result of the potential transport of discharges or emissions.
1.1.2 Maps and Orthophotos
The current and proposed Tamar Field Development Project pipeline routes are depicted by the dotted lines shown in Figure 1-2, which also shows the locations of Tamar-7 through Tamar-9.
The project location is more than 1,000 m from the coastline, so an orthophoto is not included in this report. No maritime agricultural activity is known within 30 km of the project area. Figure 1-3 illustrates the shipping lanes, mariculture sites, and submarine cables in the area. A map of the Tamar Field showing depth contours is presented in Figure 1-4.

Tamar Field Development Project EIA 4 Noble Energy Mediterranean Ltd March 2016 CSA-Noble-FL-16-2650-08-REP-01-FIN-REV04
Figure 1-2. Locations of existing and proposed wells and infrastructure in the Tamar Field
Development.
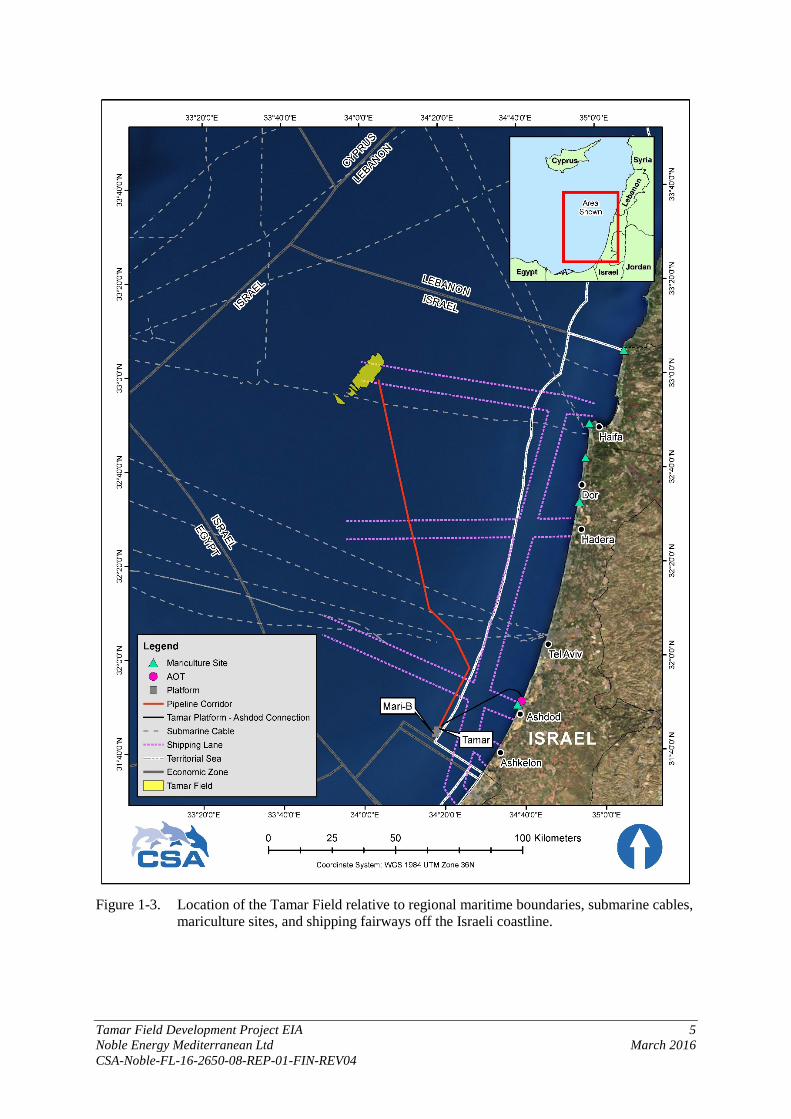
Tamar Field Development Project EIA 5 Noble Energy Mediterranean Ltd March 2016 CSA-Noble-FL-16-2650-08-REP-01-FIN-REV04
Figure 1-3. Location of the Tamar Field relative to regional maritime boundaries, submarine cables,
mariculture sites, and shipping fairways off the Israeli coastline.
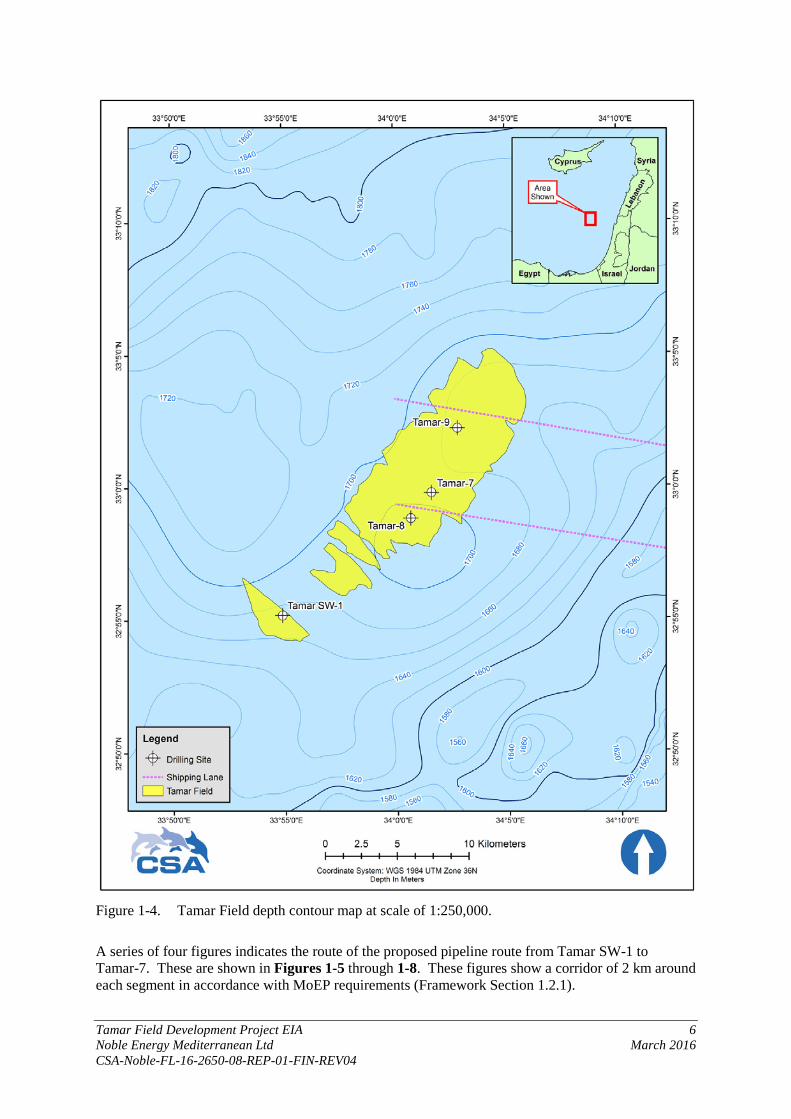
Tamar Field Development Project EIA 6 Noble Energy Mediterranean Ltd March 2016 CSA-Noble-FL-16-2650-08-REP-01-FIN-REV04
Figure 1-4. Tamar Field depth contour map at scale of 1:250,000.
A series of four figures indicates the route of the proposed pipeline route from Tamar SW-1 to Tamar-7. These are shown in Figures 1-5 through 1-8. These figures show a corridor of 2 km around each segment in accordance with MoEP requirements (Framework Section 1.2.1).

Tamar Field Development Project EIA 7 Noble Energy Mediterranean Ltd March 2016 CSA-Noble-FL-16-2650-08-REP-01-FIN-REV04
Figure 1-5. Regional depth map for 2 km around pipeline route from Tamar SW-1 to Tamar-7 at 1:20,000 with 5-m isobaths. The square in the upper left is
a larger scale map of the area; the red box indicates the area of the enlargement.
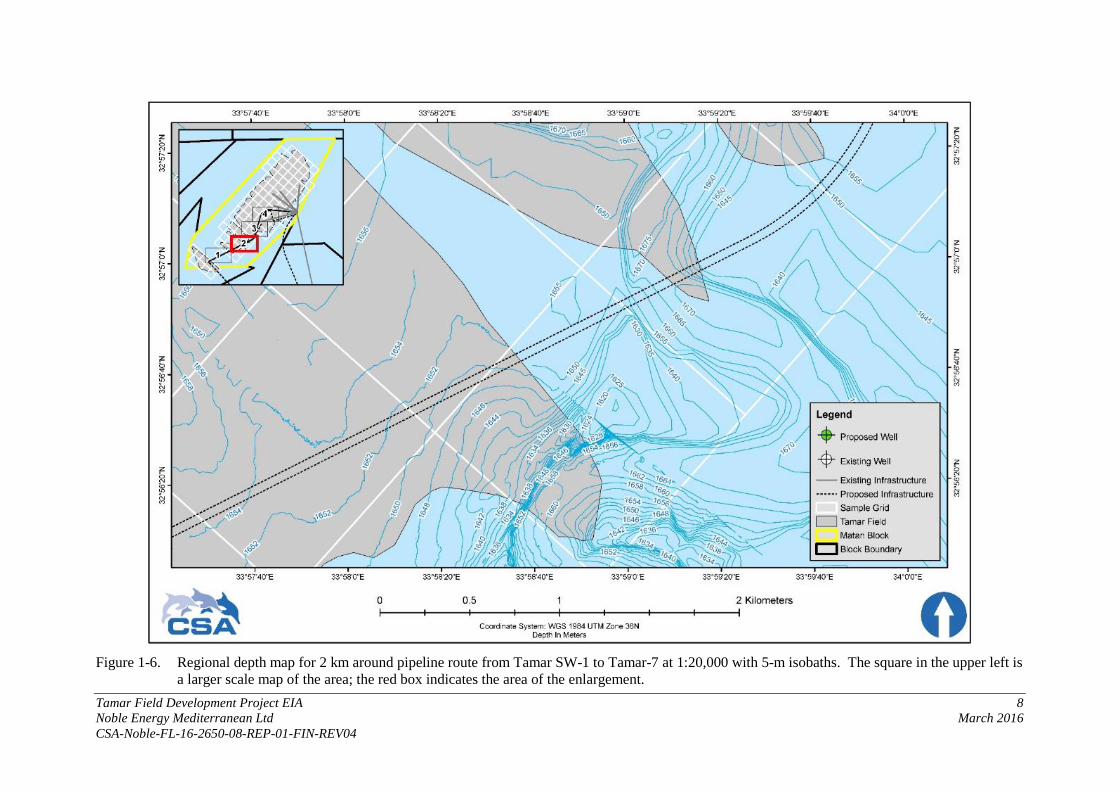
Tamar Field Development Project EIA 8 Noble Energy Mediterranean Ltd March 2016 CSA-Noble-FL-16-2650-08-REP-01-FIN-REV04
Figure 1-6. Regional depth map for 2 km around pipeline route from Tamar SW-1 to Tamar-7 at 1:20,000 with 5-m isobaths. The square in the upper left is
a larger scale map of the area; the red box indicates the area of the enlargement.
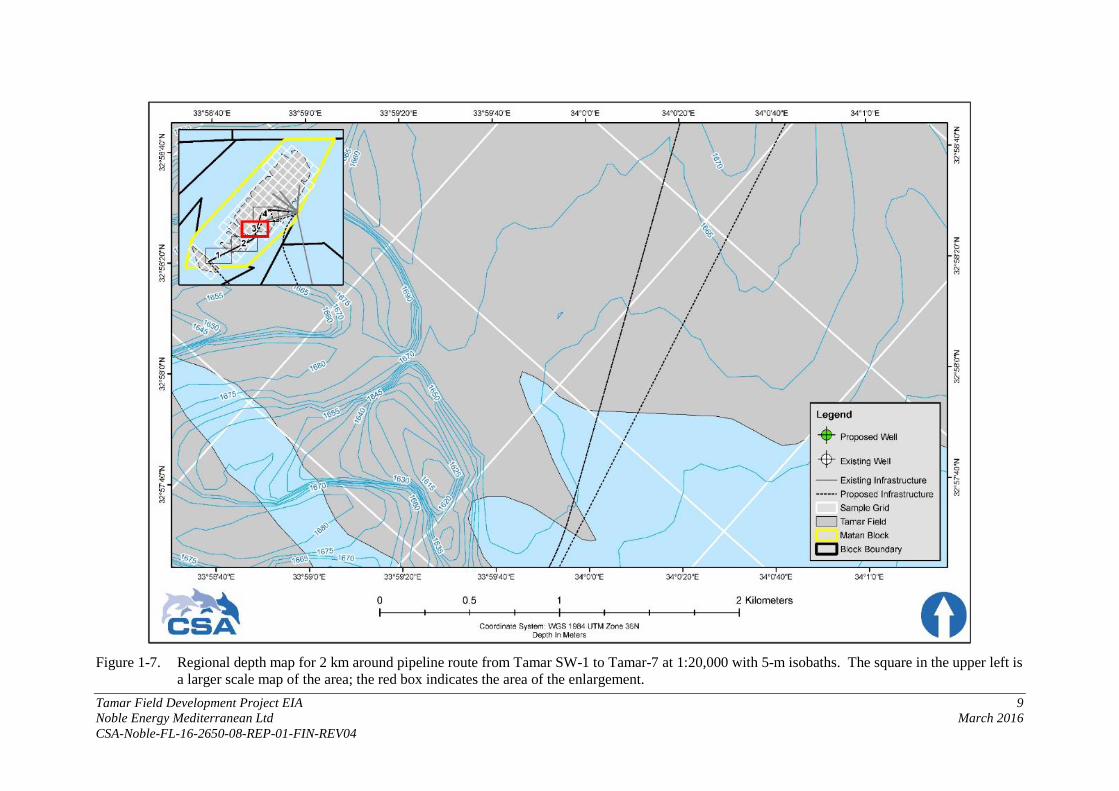
Tamar Field Development Project EIA 9 Noble Energy Mediterranean Ltd March 2016 CSA-Noble-FL-16-2650-08-REP-01-FIN-REV04
Figure 1-7. Regional depth map for 2 km around pipeline route from Tamar SW-1 to Tamar-7 at 1:20,000 with 5-m isobaths. The square in the upper left is
a larger scale map of the area; the red box indicates the area of the enlargement.

Tamar Field Development Project EIA 10 Noble Energy Mediterranean Ltd March 2016 CSA-Noble-FL-16-2650-08-REP-01-FIN-REV04
Figure 1-8. Regional depth map for 2 km around pipeline route from Tamar SW-1 to Tamar-7 at 1:20,000 with 5-m isobaths. The square in the upper left is
a larger scale map of the area; the red box indicates the area of the enlargement.
Tamar Field Development Project EIA 11 Noble Energy Mediterranean Ltd March 2016 CSA-Noble-FL-16-2650-08-REP-01-FIN-REV04
1.2 BASELINE ENVIRONMENT
1.2.1 Geological, Seismic, and Sediment Characteristics
Geological, seismic, and sediment characteristics are discussed in this section. Site-specific information for each proposed well is presented, followed by general information on the area of the proposed project.
1.2.1.1 Tamar-7
Information on the geological, seismic, and sediment characteristics of the Tamar-7 well are discussed in the Well Clearance Letter prepared by Gardline Surveys Inc. (2013a); excerpts from the report are provided in this section. The report addresses seafloor and shallow geologic conditions that may impact exploratory drilling operations within 500 m of the proposed well location. The depth limit of this geohazard assessment is Horizon H20 (3,581 m below the sea surface; 1,916 m below the seafloor).
The proposed Tamar-7 well location lies at a depth of 1,665 m below the sea surface and is on the crest of a northwest-to-southeast trending, low-relief seafloor ridge (Figure 1-9). The relief of the seafloor ridge increases to the southeast and may be the result of deformation in the underlying evaporite section. A northeast-to-southwest trending seafloor strike-slip fault is located approximately 500 m west of the proposed location.
Seafloor sediments are expected to be composed of clays and silts, becoming firmer with depth. There are no anomalous seafloor amplitudes indicative of any fluid seep within 500 m of the proposed well location (Figure 1-10). No other seafloor features were observed within a 500 m radius that could affect well emplacement. The sedimentary sequence has been subdivided into two major units on the basis of the geology at the proposed well location: 1) the clastic section of Unit A; and 2) the salt sequence of Unit B (Figures 1-11 to 1-14). Unit B was further subdivided into upper and lower units, B Upper and B Lower. An intermediate horizon, H15, was mapped in between the intermittent clastic interbed markers of ME40 and ME50. The seafloor and sediments within Unit A are expected to consist of clays and silts, with intermittent sand interbeds and lenses. Unit A is bounded at its base by an irregular, complex reflector (Horizon H10) that marks the top of Messinian evaporates at 375 m below the seafloor. The unit has an average thickness of 450 m and thickens to the southeast. It generally is thinner along the axis of the seafloor ridges.
In the uppermost interval from seafloor to 72 m below the seafloor, seismic data indicates a uniform, low amplitude character. No sandy interbeds or hard grounds are expected in this interval. Sediments appear favorable to jetting of seafloor casing, though a slightly firmer sedimentary section is predicted as the location is on the crest of a low-relief seafloor ridge.
In the interval between 72 to 185 m below the seafloor, higher energy sediments are interpreted as clays and silts with occasional sandy interbeds and lenses. Given the possibility for the presence of minor sands within this interval, minor drilling fluid circulation and wellbore stability problems are considered possible.
The lower interval within Unit A, 185 to 375 m below the seafloor, is interpreted as clays and silts. Immediately above the top of salt at 375 m below the seafloor, there is the possibility of encountering 10 to 20 m of clastic interbeds, anhydrite, or limestone; these may induce some minor drilling fluid circulation and wellbore stability problems. While a vertical borehole will not penetrate an interpreted fault in this interval, there are several small normal faults in the immediate vicinity. Drilling caution is advised. Minor drilling fluid circulation and wellbore stability problems are possible if a fault is intersected.

Tamar Field Development Project EIA 12 Noble Energy Mediterranean Ltd March 2016 CSA-Noble-FL-16-2650-08-REP-01-FIN-REV04
There is no risk of gas to the proposed location within Unit A. Horizon H10 marks the base of this unit at 375 m below the seafloor.
Figure 1-9. Tamar-7 seafloor morphology (From: Gardline Surveys Inc., 2013a).

Tamar Field Development Project EIA 13 Noble Energy Mediterranean Ltd March 2016 CSA-Noble-FL-16-2650-08-REP-01-FIN-REV04
Figure 1-10. Tamar-7 seafloor amplitudes (From: Gardline Surveys Inc., 2013a).

Tamar Field Development Project EIA 14 Noble Energy Mediterranean Ltd March 2016 CSA-Noble-FL-16-2650-08-REP-01-FIN-REV04
Figure 1-11. Tamar-7 sand-prone figure (From: Gardline Surveys Inc., 2013a).

Tamar Field Development Project EIA 15 Noble Energy Mediterranean Ltd March 2016 CSA-Noble-FL-16-2650-08-REP-01-FIN-REV04
Figure 1-12. Tamar-7 seismic data example from Inline 11828 (From: Gardline Surveys Inc., 2013a).
Figure 1-13. Tamar-7 seismic data example from Crossline 165000 (From: Gardline Surveys Inc.,
2013a).
Tamar Field Development Project EIA 16 Noble Energy Mediterranean Ltd March 2016 CSA-Noble-FL-16-2650-08-REP-01-FIN-REV04
Figure 1-14. Tamar-7 top hole prognosis (From: Gardline Surveys Inc., 2013a).
Unit B consists of discontinuous, low amplitude to transparent seismic reflectors that are locally interbedded with semi-continuous moderate amplitude reflectors. Unit B represents a thick sequence of evaporites that were deposited over the former abyssal plain during the Messinian Salinity Crisis (Druckman et al., 1995) with occasional clastic interbeds in the lower intervals of the unit. The clastic interbeds within this unit represent sediments deposited during flood events, and probably are composed predominantly of clays and silts with the possibility of some coarser interbeds. According to Druckman et al. (1995), the sediments of Unit B consist of thin interbeds of compacted nodular halite and anhydrite interbedded with medium to dark gray and moderately firm claystones, limestones, and sandstones.
Based on structural models of top Messinian salt and base Messinian salt, it is clear that the topography of these two layers have little similarity. This indicates that sediments above base Messinian salt were mobilized. One theory suggests that local earthquakes could have generated local overpressures and triggered sediment mobilization (Frey- Mart nez et al., 2007).
For the purpose of geohazard identification, Unit B has been separated into Unit B Upper and Unit B Lower. An intermediate horizon (H15) was mapped in the interval between the interfaces identified as ME50 and ME40. The purpose of this division is to enable mapping of the extent of the zones of mechanical weakness, the claystone interbeds, and within the upper and lower salt sequence (Figure 1-11).
Within Unit B Upper in the larger Levantine Basin, the uppermost interval of the evaporite sequence from Horizon H10 to ME60 is characterized by acoustically quiet salt deposits; this interval is not present at the proposed location. The seismic character below Horizon H10 more closely resembles the interval found elsewhere between ME60 and ME50, 945 m below the seafloor, which is characterized by a number of higher amplitude reflectors correlating with approximately 2-m thick

Tamar Field Development Project EIA 17 Noble Energy Mediterranean Ltd March 2016 CSA-Noble-FL-16-2650-08-REP-01-FIN-REV04
claystone interbeds at the Tamar-1 and Tamar-2 wells. Minor drilling fluid circulation and wellbore stability problems are possible at the level of the claystone interbeds.
A vertical borehole may intersect two faults within this interval, at 405 and 542 m below the seafloor. The upper fault is well-defined in the clastic section above Horizon H10, and the inferred intersection with the wellbore is a projection to depth. The lower fault is not as well defined, and is projected into the time data from an interpretation of the depth image. Drilling caution is advised due to the presence of faults and claystone interbeds. Minor drilling fluid circulation and wellbore stability problems are possible at the level of the faults.
Unit B Lower is a section of predominantly anhydrite and halite with occasional claystone interbeds from ME50 to Horizon H20, 945 to 1,916 m below the seafloor.
In the interval ME40 to ME30, from 1,247 to 1,421 m below the seafloor, is a section of anhydrite and halite with the potential for multiple claystone interbeds. Minor drilling fluid circulation and wellbore stability problems are possible throughout this interval.
The interval between ME30 and ME20, from 1,421 to 1,721 m below the seafloor, presents a transparent section and is expected to consist of anhydrite and halite.
The interval from ME20 to Horizon H20 is interpreted as anhydrite and halite with an approximately 2-m claystone interbed near 1,721 m below the seafloor. Minor drilling fluid circulation and wellbore stability problems are possible at the claystone interbed level.
Horizon H20 marks the base of this unit at 1,916 m below the seafloor, and it marks the depth limit of this evaluation.
1.2.1.2 Tamar-8
Information on the geological, seismic, and sediment characteristics of the Tamar-8 well are discussed in the Well Clearance Letter prepared by Gardline Surveys Inc. (2016); excerpts from the report are provided in this section. The report addresses seafloor and shallow geologic conditions that may impact exploratory drilling operations within 500 m of the proposed well location.
Seafloor depth at the proposed Tamar-8 well location is 1,667 m below the sea surface. The seafloor slopes less than 0.4° and is essentially flat. The seafloor at the proposed Tamar-8 well location is on a featureless, undulating abyssal plain 550 m south-southwest of a low-relief ridge.
A northeast-to-southwest trending seafloor strike-slip fault is located approximately 400 m northwest of the proposed location (Figure 1-15).
Seafloor sediments are expected to be composed of clays and silts, becoming firmer with depth. There are no anomalous seafloor amplitudes indicative of any fluid seep within 2,000 m of the proposed well location (Figure 1-16). The proposed location is 60 m northwest of the Tamar-3 wellhead and 38 m west of the production manifold and flowline, with flying leads extending south-southeast.

Tamar Field Development Project EIA 18 Noble Energy Mediterranean Ltd March 2016 CSA-Noble-FL-16-2650-08-REP-01-FIN-REV04
Figure 1-15. Tamar-8 seafloor morphology (From: Gardline Surveys Inc., 2016).

Tamar Field Development Project EIA 19 Noble Energy Mediterranean Ltd March 2016 CSA-Noble-FL-16-2650-08-REP-01-FIN-REV04
Figure 1-16. Tamar-8 seafloor amplitudes (From: Gardline Surveys Inc., 2016).

Tamar Field Development Project EIA 20 Noble Energy Mediterranean Ltd March 2016 CSA-Noble-FL-16-2650-08-REP-01-FIN-REV04
The sedimentary sequence has been subdivided into two major units on the basis of the geology at the proposed well location: the clastic post-salt section of Unit A and Unit B, and the salt sequence of Unit C (Figures 17 to 21). Unit C was further sub-divided into upper and lower units, C1 and C2 by an intermediate midway horizon occurring between intermittent claystone interbed markers.
Figure 1-17. Tamar-8 sand-prone lithology (From: Gardline Surveys Inc., 2016).

Tamar Field Development Project EIA 21 Noble Energy Mediterranean Ltd March 2016 CSA-Noble-FL-16-2650-08-REP-01-FIN-REV04
Figure 1-18. Claystone interbed probability extracat (From: Gardline Surveys Inc., 2016).

Tamar Field Development Project EIA 22 Noble Energy Mediterranean Ltd March 2016 CSA-Noble-FL-16-2650-08-REP-01-FIN-REV04
Figure 1-19. Tamar-8 seismic data example from Inline 11805 (From: Gardline Surveys Inc., 2016).

Tamar Field Development Project EIA 23 Noble Energy Mediterranean Ltd March 2016 CSA-Noble-FL-16-2650-08-REP-01-FIN-REV04
Figure 1-20. Tamar-8 seismic data example (From: Gardline Surveys Inc., 2016).
Tamar Field Development Project EIA 24 Noble Energy Mediterranean Ltd March 2016 CSA-Noble-FL-16-2650-08-REP-01-FIN-REV04
Figure 1-21. Tamar-8 top hole prognosis (From: Gardline Surveys Inc., 2016).

Tamar Field Development Project EIA 25 Noble Energy Mediterranean Ltd March 2016 CSA-Noble-FL-16-2650-08-REP-01-FIN-REV04
The seabed and sediments within Unit A are expected to consist of clays and silts with occasional sand interbeds in the upper section. Unit A is primarily hemi-pelagic drape. Within 1km of the proposed location the unit has an average thickness of 90 m, and is generally thinner along the axis of the seabed ridge.
From the seabed to 50 m below seabed, the 3D seismic data indicates that a band of thin sands filled a bathymetric low approximately 200 m west of the proposed location. There is some suggestion that coarser sediments approaching the limit of seismic resolution may be present along the edge of these overbank deposits extending to the proposed well location. These minor sands could possibly affect jetting of the seabed casing. However, the adjacent Tamar-3 well did not report any jetting problems in a similar lithological setting.
From 50 m below seabed to Horizon H05, the 3D seismic data indicates a uniform, low amplitude character. No sandy interbeds or hard grounds are expected in this interval. Sediments appear favorable for jetting of seabed casing.
There is no predicted risk of gas or shallow water flow risk at the proposed location within Unit A.
Horizon H05 marks the base of this unit at 102 m below the seafloor.
Unit B is expected to consist of clays and silts with occasional sand interbeds. Within 1 km of the proposed location, the unit is approximately 300 m thick, plus or minus 20 m. The proposed location is between two meandering channel systems to the east and a crevasse splay to the west. The sediments at the proposed location have low amplitude, parallel reflectors, and lack any seismic indicators of significant coarser interbeds. At the base of Unit B, the Top of Evaporites occurs 383 m below the seafloor, and approxiimately10-20 m of interbedded claystones, anhydrite, and/or limestone is possible. Minor drilling fluid circulation and wellbore stability problems are possible, and a reduction in drilling rate of penetration is probable.
No risk of gas or shallow water flow is predicted within Unit B at the proposed well location.
Horizon H10 marks the base of Unit B and the Top of Salt occurring at 405 m below the seafloor.
Unit C consists of discontinuous, transparent to low amplitude seismic reflectors that are locally interbedded with semi-continuous, moderate amplitude reflectors. Unit C represents thick deposits of evaporites that were deposited over the former abyssal plain during the Messinian salinity crisis with occasional claystone interbeds in the lower part of the unit (Druckman et al., 1995). The claystone interbeds within this unit represent sediments deposited during flood events, and probably are comprised of predominantly clays and silts with the possibility of some coarser interbeds. According to Druckman et al. (1995), the sediments of Unit C consist of thin interbeds of compacted nodular halite and anhydrite interbedded with medium to dark-gray and moderately firm claystones, limestones, and sandstones.
Based on structural models of Top Messinian Salt and Base Messinian Salt, it is clear that the topography of these two layers have little similarity. This fact indicates that sediments above Base Messinian Salt were mobilized. One theory suggests that local earthquakes could have generated local overpressures, and triggered sediment mobilization (Frey-Mart et al., 2007).
For the purpose of geohazard identification, Unit C has been separated into Unit C1 and Unit C2.
An intermediate horizon, Horizon H15 divides Unit C between ME40 and ME50. The purpose of this division is to enable more detailed analysis and mapping within the upper and lower salt sequence (Figures 18 to 20).

Tamar Field Development Project EIA 26 Noble Energy Mediterranean Ltd March 2016 CSA-Noble-FL-16-2650-08-REP-01-FIN-REV04
Within Unit C1 in the larger Levant Basin, the uppermost interval of the evaporite sequence from Horizon H10 to ME60, 405 to 578 m below the seafloor, is characterized by acoustically quiet salt deposits. In the vicinity of this location, ME60 is disturbed by the effects of the strike-slip to the northwest and underlying reverse faults, terminating uppermost at Horizon H10. ME60 is sporadically absent in the vicinity of the well location and it is not clear on the data analyzed if any significant interbed is present.
East and north and at the proposed location, the interval between ME60 and ME50, 578 to 879 m below the seafloor, is characterized by a pattern of slightly higher amplitude, discontinuous, parallel reflectors, which likely correlate with the presence of approximately 2 m thick claystone interbeds.
A vertical borehole may intersect a poorly imaged low angle reverse fault at 838 m below the seafloor. A repeated contact with ME50 is possible. The fault is illdefined, but is most likely healed. There remains the slight possibility of minor drilling fluid circulation and wellbore stability problems possible at this fault. The fault exhibits no connectivity to the shallow section and is located entirely in the salt section.
The interval from ME50 to ME40, 879 to 1,190 m below the seafloor, is interpreted as predominantly consisting of anhydrite and halite with possible minor claystone interbeds. Minor drilling fluid circulation and wellbore stability problems are possible.
The interval between ME40 and ME30, 1,190 to 1,330 m below the seafloor, is interpreted as a section of anhydrite and halite with the possibility of occasional thin claystone interbeds. Minor drilling fluid circulation and wellbore stability problems are possible at the level of the claystone interbeds.
The interval between ME30 and ME20, from 1,330 to 1,606 m below the seafloor, presents a transparent section, and is expected to consist of predominantly anhydrite and halite. The possibility of some minor seismically invisible claystone interbeds presents a slight possibility of minor drilling fluid circulation and wellbore stability problems.
The interval between ME20 to Horizon H20, from 1,606 to1,854 m below the seafloor, is interpreted as anhydrite and halite with some slight indications of some minor claystone interbeds and the possibility of a base salt lagging approximately 2 m claystone interbed near 1,854 m below the seafloor.
Minor drilling fluid circulation and wellbore stability problems are possible at the level of the claystone interbeds.
Horizon H20 marks the base of this unit and the base of this interpretation at 1,854 m below the seafloor.
1.2.1.3 Tamar-9
Information on the geological, seismic, and sediment characteristics of the Tamar-9 well are discussed in the Well Clearance Letter prepared by Gardline Surveys Inc. (2014); excerpts from the report are provided in this section. The report addresses seafloor and shallow geologic conditions that may impact exploratory drilling operations within 500 m of the proposed well location.
Seafloor depth at the proposed Tamar-9 well location is 1,690 m below the sea surface. The seafloor slopes less than 0.4° and is essentially flat. The seafloor at the proposed Tamar-9 well location is on a featureless, undulating abyssal plain. Seafloor sediments are expected to be composed of clays and silts, becoming firmer with depth.

Tamar Field Development Project EIA 27 Noble Energy Mediterranean Ltd March 2016 CSA-Noble-FL-16-2650-08-REP-01-FIN-REV04
A northeast-to-southwest trending seafloor strike-slip fault is located approximately 680 m southeast of the proposed location (Figure 1-22). There are no anomalous seafloor amplitudes indicative of any fluid seep within 500 m of the proposed well location (Figure 1-23). No other seafloor features were observed within a 500 m radius that could affect well emplacement.
The sedimentary sequence has been subdivided into two major units on the basis of the geology at the proposed well location: 1) the clastic section of Unit A; and 2) the salt sequence of Unit B (Figures 1-24 through 1-27). Unit B was further subdivided into upper and lower units, B Upper and B Lower. An intermediate horizon, H15, was mapped in between the intermittent clastic interbed markers of ME40 and ME50.
The seafloor and sediments within Unit A are expected to consist of clays and silts, with intermittent sand interbeds and lenses. Unit A is bounded at its base by an irregular, complex reflector (Horizon H10) that marks the top of Messinian evaporates at 395 m below the seafloor. The unit has an average thickness of 450 m and thickens to the southeast. It generally is thinner along the axis of the seafloor ridges.
In the first 75 m, 3D seismic data indicated a uniform, low amplitude character. No sandy interbeds or hard grounds are expected in this section. Sediments appear favorable to jetting of seafloor casing. Between 75 and 216 m below the seafloor, the lithology is composed of higher-energy sediments that are interpreted as clays and silts with frequent sandy interbeds and lenses.
The lower interval within Unit A, from 216 to 395 m below the seafloor, is interpreted as clays and silts; however, immediately above the top of salt at 395 m below the seafloor, there is the possibility of encountering 10 to 20 m of clastic interbeds, anhydrite, or limestone. These may induce some minor drilling fluid circulation and wellbore stability problems.
There is no risk of gas to the proposed location within Unit A.
Horizon H10 marks the base of this unit at 395 m below the seafloor.

Tamar Field Development Project EIA 28 Noble Energy Mediterranean Ltd March 2016 CSA-Noble-FL-16-2650-08-REP-01-FIN-REV04
Figure 1-22. Tamar-9 seafloor morphology (From: Gardline Surveys Inc., 2014).

Tamar Field Development Project EIA 29 Noble Energy Mediterranean Ltd March 2016 CSA-Noble-FL-16-2650-08-REP-01-FIN-REV04
Figure 1-23. Tamar-9 seafloor amplitudes (From: Gardline Surveys Inc., 2014).

Tamar Field Development Project EIA 30 Noble Energy Mediterranean Ltd March 2016 CSA-Noble-FL-16-2650-08-REP-01-FIN-REV04
Figure 1-24. Tamar-9 sand-prone figure (From: Gardline Surveys Inc., 2014).

Tamar Field Development Project EIA 31 Noble Energy Mediterranean Ltd March 2016 CSA-Noble-FL-16-2650-08-REP-01-FIN-REV04
Figure 1-25. Tamar-9 seismic data example from Inline 11983 (From: Gardline Surveys Inc., 2014).
Figure 1-26. Tamar-9 seismic data example from Crossline 16854 (From: Gardline Surveys Inc.,
2014).

Tamar Field Development Project EIA 32 Noble Energy Mediterranean Ltd March 2016 CSA-Noble-FL-16-2650-08-REP-01-FIN-REV04
Figure 1-27. Tamar-9 top hole prognosis (From: Gardline Surveys Inc., 2014).
Unit B consists of discontinuous to transparent, low amplitude seismic reflectors that are locally interbedded with semi-continuous moderate amplitude reflectors. Unit B represents thick deposits of evaporites that were deposited over the former abyssal plain during the Messinian Salinity Crisis (Druckman et al., 1995), with occasional clastic interbeds in the lower part of the unit. The clastic interbeds within the unit represent sediments deposited during flood events, and probably are composed predominantly of clays and silts, with the possibility of some coarser interbeds. According to Druckman et al. (1995), the sediments of Unit B consist of thin areas of compacted nodular halite and anhydrite interbedded with medium to dark gray and moderately firm claystones, limestones, and sandstones.
Based on structural models of top Messinian salt and base Messinian salt, it is clear that the topography of these two layers have little similarity. This indicates that sediments above base Messinian salt were mobilized. One theory suggests that local earthquakes could have generated local overpressures and triggered sediment mobilization (Frey- Mart nez et al., 2007).
For the purpose of geohazard identification, Unit B has been separated into Unit B Upper and Unit B Lower. An intermediate horizon (H15) was mapped in the interval between the interfaces identified as ME50 and ME40. The purpose of this division is to enable mapping of the extent of the zones of mechanical weakness, the claystone interbeds, and within the upper and lower salt sequence (Figure 1-24).
Within Unit B Upper in the larger Levantine Basin, the uppermost interval of the evaporite sequence from Horizon H10 to ME60 is characterized by acoustically quiet salt deposits; this interval is not present at the proposed location. The seismic character below Horizon H10 more closely resembles the interval found elsewhere between ME60 and ME50, 982 m below the seafloor, which is

Tamar Field Development Project EIA 33 Noble Energy Mediterranean Ltd March 2016 CSA-Noble-FL-16-2650-08-REP-01-FIN-REV04
characterized by a number of higher amplitude reflectors, correlating with approximately 2 m thick claystone interbeds at the Tamar-1 and Tamar-2 wells. An approximately 2 m thick claystone interbed was identified at 504 m below the seafloor. Minor drilling fluid circulation and wellbore stability problems are possible at the level of the claystone interbeds in this interval.
A vertical borehole may intersect a fault at 911 m below the seafloor near the base of the ME60-ME50 complex. The fault is ill-defined and projected into the time data from an interpretation from the depth image. The fault occurs in a relatively clean section of salt and is most likely healed. No drilling fluid circulation problems are anticipated at the fault level.
Unit B Lower from the intermediate horizon (H15) to ME40, 1,190 m below the seafloor, is interpreted as predominantly consisting of anhydrite and halite with possible claystone interbeds.
Between ME40 to ME30, from 1,190 to 1,331 m below the seafloor, the lithology consists of anhydrite and halite, with the possibility of multiple claystone interbeds. Minor drilling fluid circulation and wellbore stability problems are possible throughout this interval.
The interval between ME30 and ME20, from 1,331 to 1,648 m below the seafloor, presents a transparent section expected to consist of anhydrite and halite.
The interval between ME20 to Horizon H20 is interpreted as anhydrite and halite with the possibility of an approximately 2 m claystone interbed near 1,648 m below the seafloor. Minor drilling fluid circulation and wellbore stability problems are possible.
Horizon H20 marks the base of this unit at 1,871 m below the seafloor as well as the depth limit of this evaluation.
1.2.1.4 Regional Information
The Eastern Mediterranean region has been shaped by the interactions of the African, Arabian, and Eurasian tectonic plates since the Permo-Triassic Period. The present geotectonic framework of the region is dominated by the collision of the Arabian and African plates with the Anatolian plate. Recent characterizations of the tectonics of the Eastern Mediterranean include the work of Dilek and Sandvol (2009) and Özbakir et al. (2010). A brief descriptive summary of prominent geological features and events of the region is as follows:
Levant Margin: All available information relating to the nature of the Levant Margin comes from its southern portion through the work carried out for on-land and offshore exploration in Israel. Garfunkel (2004) proposed that north-trending normal faults with large throws to the west, active since the Late Permian, were the primary mechanism for the formation of the Levantine Basin. As rifting continued, the underlying continental crust would thin and form the basement of the Levantine Basin instead of oceanic crust as proposed by Makris et al. (1983).
Levantine Basin: The work of Garfunkel (2004) and Abdel Aal et al. (2001) has shown the basement of the Levantine Basin to consist of faulted blocks, making a horst (elevated) and graben (recessed) basin floor topography covered by 10 to 15 km of sediments with an age range from the Late Permian to Recent. Their evolutionary model suggests the generation of the Levantine Basin by intercontinental rifting and extension that stops short of seafloor spreading and oceanic crust formation. Under this model, basal sediments everywhere would be shallow water clastics and carbonates. In deeper water, turbidites and pelagic carbonates with shales would be dominant, with basin floor sediments being mostly shales and distal turbidites (sheet sands).
Nile Cone: The Nile Cone is chiefly a post-Upper Miocene sedimentary wedge that covers a much older marginal basin sequence. Together, they have a thickness of 9 to 10 km, including 1.5 km of Messinian evaporites (Mascle et al., 2006). These post-Messinian sediments, supplied by the

Tamar Field Development Project EIA 34 Noble Energy Mediterranean Ltd March 2016 CSA-Noble-FL-16-2650-08-REP-01-FIN-REV04
Nile River, have undergone significant thin-skin deformation due to downslope movement along slip-surfaces in the underlying evaporites.
Messinian Salinity Crisis: The Messinian Salinity Crisis, when the Mediterranean Sea went through a cycle of partial desiccation, is one of the most unusual oceanic events in the last 20 million years. The result of this unique event was significant deposition of sediments that formed a perfect seal to any hydrocarbons present offshore. The evaporite sediments were first discovered by Hsü et al. (1973). Their formation is attributed to the periodic restriction of seawater inflow from the Atlantic, leading to hypersalinity and deposition of gypsum in shallower basins and halite in deeper basins. The Mediterranean Sea did not dry completely, but sea level dropped by as much as 1,500 m at times. This fall led to dramatic erosion, with the formation of large canyons and deposition of coarse sediments that make good reservoir rocks.
Continental Slope: The lower continental slope in proximity to the study area is characterized by a disturbed area (Almagor and Hall, 1984) designated as the Dor Disturbance (Figure 1-28). The disturbed areas where mass slumping has occurred are in a zone of diapirs (e.g., vertically upward geological movement) and associated with Messinian drainage systems such as offshore canyons. These canyons act as conduits for transporting materials from the shelf into the basin developed and were incised onto the Levant continental slope during the Oligocene and Miocene on through the Messinian and are partly reflected in the present day submarine features (Gardosh et al., 2008).
1.2.1.5 Seismic Activity
There is very little information available regarding seismic sea waves. Ambrasseys (1962) conducted a survey of reported sea waves from Antiquity to 1961 and came to the conclusion that the region from Cyprus to Jubeil and Acre on the Levantine coast is prone to sea waves of light to rather strong intensity. The term “rather strong” on this intensity scale means that the waves would flood gently sloping areas. The height and destructive power of such waves is greater in coastal areas where they traverse shallow water than out in the open seas. Kelletat and Schellmann (2002) examined the western and southeastern coasts of Cyprus for tsunami evidence and reported movement of boulders weighing several tons by an event that took place more than 200 years ago. However, the earthquake zone along the south coast of Cyprus appears to provide the most significant overall tsunami threat to the coast of Israel (URS Corporation, 2009).
The primary sources of tsunamis are earthquakes and offshore landslides. Salamon et al. (2007) constructed a list of 21 reliably reported tsunamis that have struck the Levant coast, along with 57 moderate-to-large earthquakes that have occurred along the Dead Sea Transform (DST) system (geological fault between the Arabian and African tectonic plates), since about the mid-second century B.C.E. Ten of the tsunamis were triggered by earthquakes that originated along the DST system, six of which followed moderate earthquakes and four that followed large earthquakes. These observations indicate that approximately 14% of the moderate and 27% of the large DST earthquakes were tsunamigenic.
Geological fault zones, locations of historical earthquakes, and regional bathymetric contours relative to the Tamar Field are shown in Figure 1-29. There has been one recorded earthquake within 25 km of the Tamar SW-1 drillsite since 1979; the magnitude of the earthquake was 4.0 on the Richter scale. There have been no strong (magnitude 5.6 or greater on the Richter scale) regional earthquakes recorded within 200 km of the Tamar SW-1 drillsite since 1983. The data suggest that historic earthquakes within the Tamar Field are extremely rare events; when they occur, their magnitude has been moderate to low (i.e., less than 5.6 on the Richter scale).
Salamon et al. (2007) estimated that the threshold of tsunamigenic DST earthquakes likely ranges in magnitude from 6 to 6.5. Meral Ozel et al. (2011) have reported on the tsunami hazard in the eastern Mediterranean and its connected seas, with an emphasis on Turkey. The number of tsunamis attributable to submarine landslides is poorly understood because there are virtually no direct

Tamar Field Development Project EIA 35 Noble Energy Mediterranean Ltd March 2016 CSA-Noble-FL-16-2650-08-REP-01-FIN-REV04
observations of their occurrence. Even in cases where the evidence points to a landslide origin for the tsunami, there are usually no reliable estimates of their extent or the manner in which the movement took place (URS Corporation, 2009). Slump deposits associated with submarine landslides along the continental margin of Israel have been described by Martinez et al. (2005) using 3D seismic data. The high occurrence of slumping processes along the Israeli continental margin was possible because of a combination of seismic activity, presence of gas within the sediments, and relatively steep slopes (Martinez et al., 2005).
Figure 1-28. Seafloor areas of disturbance on the Mediterranean continental slope off the Israeli coast
(From: Almagor and Hall, 1984).

Tamar Field Development Project EIA 36 Noble Energy Mediterranean Ltd March 2016 CSA-Noble-FL-16-2650-08-REP-01-FIN-REV04
Figure 1-29. Geological fault zones, locations of historical earthquakes, and regional bathymetric
contours relative to the Tamar Field. Earthquake data were provided by the U.S. Geological Survey (2014).

Tamar Field Development Project EIA 37 Noble Energy Mediterranean Ltd March 2016 CSA-Noble-FL-16-2650-08-REP-01-FIN-REV04
1.2.2 Physical Oceanography
Wind, waves, weather, oceanographic currents, and hydrographic profiles are presented in this section. Information on seawater and sediment quality is presented in Section 1.2.4.
1.2.2.1 Winds
There is no known wind data set representative of the Tamar Field. In the absence of an observed data set, wind data can be obtained from the output of a numerical atmospheric model. Data were assessed from the National Center for Environmental Predictions (NCEP) Environmental Modeling Center Regional Spectral Model provided by the U.S. National Oceanic and Atmospheric Administration – Cooperative Institute for Research in Environmental Studies (NOAA – CIRES) Climate Diagnostics Center (CDC) (http://www.cdc.noaa.gov).
Wind speed and direction data at a 10-m height from the NCEP model grid location closest to the Tamar Field (~ 50 km north-northwest of the Tamar SW-1 well; closer to remaining Tamar wells) were obtained from the NOAA/CDC data server for the 10-year period from January 1999 to January 2009 as representative of the Tamar Field environs.
Figure 1-30 shows monthly and yearly wind roses developed from the NCEP model grid location. Based on the NCEP data set, the wind regime is characterized by predominant westerly winds throughout most of the year (January through October) and varied winds in November and December. Winds are generally moderate in speed, with average monthly speeds of approximately 5 m s-1. Overall, strong seasonal variability is not evident in the wind data. Winter winds (December through February) have higher maximum speeds than the remainder of the year; however, average winds are relatively comparable throughout the year.
1.2.2.2 Waves
Table 1-1 presents significant wave height distribution for a point near the Cyprus Coastal Ocean Forecasting and Observing System (CYCOFOS) MedGoos-3 buoy (33°42' N, 32°08' E) from July 2005 to February 2008. This station is located approximately 200 km from the Tamar SW-1 wellsite. Nearly all of the waves are less than 1.5 m in height, and wave direction is nearly always due eastward at this location (mean of 116°T, standard deviation of 53°) because of the strong westerly winds. While wave height and direction vary daily across the Levantine Basin, the yearly statistics can be regarded as representative values spatially and temporally for the entire basin (Figure 1-31).
1.2.2.3 Weather
The Eastern Mediterranean region lies between the subtropics and mid-latitudes, and cyclones that develop in the area obtain significant energy from both baroclinicity and surface fluxes (Flocas et al., 2010, 2011). Figure 1-32 shows the mean annual cycle of the number of storm tracks that pass through the Eastern Mediterranean region, based on an analysis of storm data for the period 1962 to 2001. Storm tracks are most numerous during the winter and spring months, from December to April. The occurrence of storms decreases during the warm period, with a tendency to increase again in September/October. According to Flocas et al. (2011), the maximum number of cyclonic tracks over the area is observed in January (11.2% of the annual total) and March (10.3%); the minimum number of tracks occurs in July (5.3%).
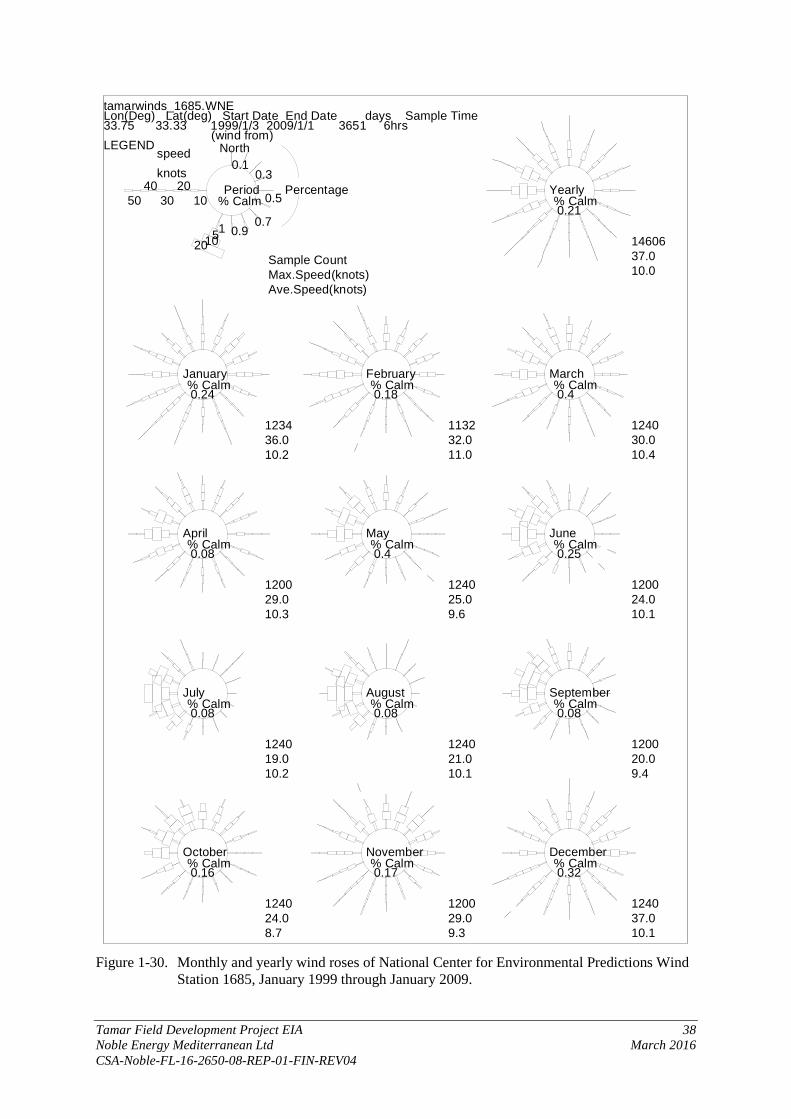
Tamar Field Development Project EIA 38 Noble Energy Mediterranean Ltd March 2016 CSA-Noble-FL-16-2650-08-REP-01-FIN-REV04
Figure 1-30. Monthly and yearly wind roses of National Center for Environmental Predictions Wind
Station 1685, January 1999 through January 2009.
tamarwinds_1685.WNELon(Deg) Lat(deg) Start Date End Date days Sample Time33.75 33.33 1999/1/3 2009/1/1 3651 6hrsLEGEND
Period Percentage% Calm
(wind from)Northspeed
knots
Sample CountMax.Speed(knots)Ave.Speed(knots)
0.10.3
0.5
0.70.9151020
1020
3040
50Yearly% Calm0.21
1460637.010.0
January% Calm0.24
123436.010.2
February% Calm0.18
113232.011.0
March% Calm0.4
124030.010.4
April% Calm0.08
120029.010.3
May% Calm0.4
124025.09.6
June% Calm0.25
120024.010.1
July% Calm0.08
124019.010.2
August% Calm0.08
124021.010.1
September% Calm0.08
120020.09.4
October% Calm0.16
124024.08.7
November% Calm0.17
120029.09.3
December% Calm0.32
124037.010.1

Tamar Field Development Project EIA 39 Noble Energy Mediterranean Ltd March 2016 CSA-Noble-FL-16-2650-08-REP-01-FIN-REV04
Table 1-1. Significant wave heights and their frequency of occurrence in the Levantine Basin during the period from July 2005 to February 2008.
Wave Height Rangea
(m) Frequency
(Occurrences over Period of Record) Percentage (%)
0 to 0.2500 91 1.5230 0.5000 1,132 18.9456 0.7500 2,183 36.5356 1.0000 1,388 23.2301 1.2500 565 9.4561 1.5000 261 4.3682 1.7500 140 2.3431 2.0000 69 1.1548 2.2500 52 0.8703 2.5000 21 0.3515 2.7500 14 0.2343 3.0000 10 0.1674 3.2500 11 0.1841 3.5000 4 0.0669 3.7500 7 0.1172 4.0000 11 0.1841 4.2500 9 0.1506 4.5000 6 0.1004 4.7500 1 0.0167 Total 5,975 100
a Upper limit of bin.
Figure 1-31. Rose diagram for annual frequency of wave direction per 10° sector across the
Levantine Basin. Waves predominantly travel towards the east.

Tamar Field Development Project EIA 40 Noble Energy Mediterranean Ltd March 2016 CSA-Noble-FL-16-2650-08-REP-01-FIN-REV04
Figure 1-32. Mean annual cycle of the number of storm tracks that passed through the Eastern
Mediterranean region, 1962 to 2001 (From: Flocas et al., 2011).
On a seasonal basis, Mandel et al. (2006) describe winter in the Eastern Mediterranean region as concomitantly/alternatively dominating or dominated by interconnected successions of Red Sea Trough, Winter Lows, polar cyclones, and Siberian and Mediterranean subtropical anticyclones. The northward and southward advance and withdrawal of the Red Sea Trough during 5 to 7 months of the year (to the Intertropical Convergence Zone) and Persian Trough variability affect the large-scale succession of the temporary cyclonic systems (i.e., Winter Lows, Cyprus Lows, and Sharav). The Red Sea Trough conditions dominate during the winter, while Winter Lows and Cyprus Lows are less prevalent.
During the summer, the Persian Trough is the dominant weather type, with subtropical anticyclones dominating at upper levels. At daily intervals, the Persian Trough has the largest persistence, rarely being interfered by other weather types. For example, the Sharav Cyclones, as temporary partners of the Persian or Red Sea Troughs, have a horizontal scale less than 1,000 km (Alpert and Ziv, 1989), while the trajectory of Cyprus cyclones is greater than 2,500 km, occurring 8 to 13 times/year and lasting 5 to 7 days (Mandel et al., 2006).
1.2.2.4 Oceanographic Currents
Noble Energy conducted a metocean study offshore Israel near the Tamar Field (Lawrence et al., 2011). Currents were measured at four depths in the water column at a site in the Tamar Field (33"03.901' N, 34"06.926' E).
The upper water column currents at the current meter location were dominated by episodes of strong flows, particularly in the winter. At 25 m depth, the maximum recorded current speed was 53.6 cm s-1, measured in January 2011. Mean current speeds at this depth were estimated to be as fast as 25 cm s-1. At 73 m depth, the maximum current speed was 49.1 cm s-1, measured in April 2011.

Tamar Field Development Project EIA 41 Noble Energy Mediterranean Ltd March 2016 CSA-Noble-FL-16-2650-08-REP-01-FIN-REV04
Mean current speeds at this depth were estimated to be as fast as 22 cm s-1. At 121 m depth, the maximum current speed was 41.5 cm s-1. Mean currents were estimated to be as fast as 17 cm s-1. At 233 m depth, the maximum current speed was 25.8 cm s-1 in January 2011. The dominant flow direction at the near-surface was toward the south and west. Near-bottom currents do not appear to have a significant seasonal trend, with a maximum speed of only 8.7 cm s-1. Figures 1-33 through 1-37 show recorded current speed and direction for the 25-, 73-, 121-, 233-, and 1,680-m depths.
Figure 1-33. Compass rose plot of the directional distribution of currents recorded at a depth of 25 m
near the Tamar Field.

Tamar Field Development Project EIA 42 Noble Energy Mediterranean Ltd March 2016 CSA-Noble-FL-16-2650-08-REP-01-FIN-REV04
Figure 1-34. Compass rose plot of the directional distribution of currents recorded at a depth of
73 m near the Tamar Field.
Figure 1-35. Compass rose plot of the directional distribution of currents recorded at a depth of
121 m near the Tamar Field.
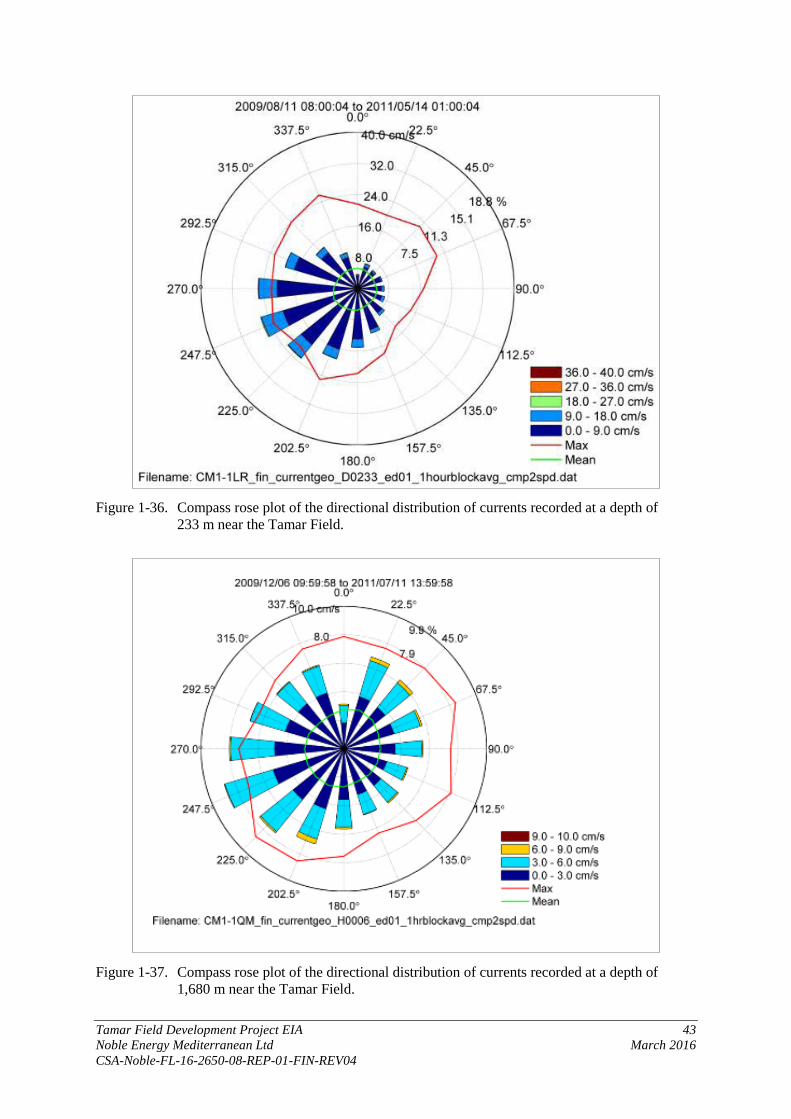
Tamar Field Development Project EIA 43 Noble Energy Mediterranean Ltd March 2016 CSA-Noble-FL-16-2650-08-REP-01-FIN-REV04
Figure 1-36. Compass rose plot of the directional distribution of currents recorded at a depth of
233 m near the Tamar Field.
Figure 1-37. Compass rose plot of the directional distribution of currents recorded at a depth of
1,680 m near the Tamar Field.

Tamar Field Development Project EIA 44 Noble Energy Mediterranean Ltd March 2016 CSA-Noble-FL-16-2650-08-REP-01-FIN-REV04
1.2.2.5 Hydrographic Profiles
The following hydrographic profile information was collected during the February 2014 Tamar Field Background Monitoring Survey and the March 2013 Tamar Field and Pipeline Survey (CSA Ocean Sciences Inc., 2013a, 2014). Results from the February 2014 Survey are presented first because they constitute a more complete picture of the environmental conditions within the Tamar Field. Station locations are shown in Figure 1-38.
Figure 1-38. Uniform grid sampling design superimposed over the Tamar Reservoir showing new
and previously sampled stations (From: CSA Ocean Sciences Inc., 2014.). The Tamar-1/6 well is in grid cell E07; Tamar-2 is in F04; Tamar-3 is in E11; Tamar-4 is on the border of D06 and F06; Tamar-5 is in D07.

Tamar Field Development Project EIA 45 Noble Energy Mediterranean Ltd March 2016 CSA-Noble-FL-16-2650-08-REP-01-FIN-REV04
February 2014 Tamar Field Background Monitoring Survey
All hydrographic data for the Tamar Field Background Monitoring Survey were collected between 10:30 and 20:00 on 13 February 2014. Four stations (B08, C01, D17, and H09) were sampled around the perimeter of the field, and one station (E11) was sampled from the middle of the field (Figure 1-38). Hydrographic profiles of temperature, salinity, dissolved oxygen (DO), turbidity, and fluorescence were recorded continuously from the near-surface (top 10% of the water column), mid-depth, and near-bottom (bottom 10% of the water column) both descending and ascending. Profiles from each station located on the perimeter of the field are shown in Figure 1-39 (ascending data are presented because historically they are less susceptible to effects of transition through the air-water interface during lowering). The profile from the station located from the center of the field is shown in Figure 1-40. All stations have nearly identical profiles, indicating no difference in water column hydrographic parameters throughout the region.
As observed during previous surveys, surface waters were cool and isothermal (~18°C) to a depth of 100 m, then decreased to 15°C through the thermocline, and gradually stabilized to 14°C through the remainder of the water column to the seafloor (Figures 1-39 and 1-40). Salinity was recorded near the surface at 39.3 and gradually stabilized with increasing water depth to 38.8 at the seafloor (Figures 1-39 and 1-40). Turbidity was low (0.10 to 0.15 nephelometric turbidity units [NTU]) throughout the water column.
As seen previously, the water column was well oxygenated at the surface (7.5 mg L-1) and gradually stabilized to 6.0 mg L-1 throughout the water column to the seafloor (Figures 1-39 and 1-40). Fluorescence, an indicator of photosynthetic activity, peaked at a depth of approximately 100 m with a concentration of approximately 0.32 mg m-3.
March 2013 Tamar Field and Pipeline Survey
During the March 2013 Tamar Field and Pipeline Survey, all hydrographic profiles were collected in a 24-hour period between 21:29 on 25 March 2013 and 18:00 on 26 March 2013. Nine stations were sampled within the developed portion of the reservoir among existing infrastructure consisting of wellsites (Tamar-1 to Tamar-6), flowlines, and umbilicals (Figure 1-38). Hydrographic profiles of temperature, salinity, DO, turbidity, and fluorescence were recorded continuously from the near-surface (top 10% of the water column), mid-depth, and near-bottom (bottom 10% of the water column). All nine stations had virtually identical hydrographic profiles; therefore, the profile of one station (TF7) is shown in Figure 1-41 as representative of the survey region.
Surface waters were cool and isothermal (17°C), then water temperatures decreased through the thermocline and stabilized to 14°C through the remainder of the water column to the seafloor. Salinity varied between 38.7 and 39.1 through the halocline (salinity gradient) and gradually stabilized with increasing water depth to 38.7 at the seafloor. Turbidity was low (0.10 to 0.15 NTU) throughout the water column.
The water column was well oxygenated at the surface (7.4 mg L-1) and through the surface-mixed layer before stabilizing to approximately 5.7 mg L-1 above the seafloor (Figure 1-41). Fluorescence peaked at a depth of approximately 175 m with a concentration of approximately 0.35 mg m-3.
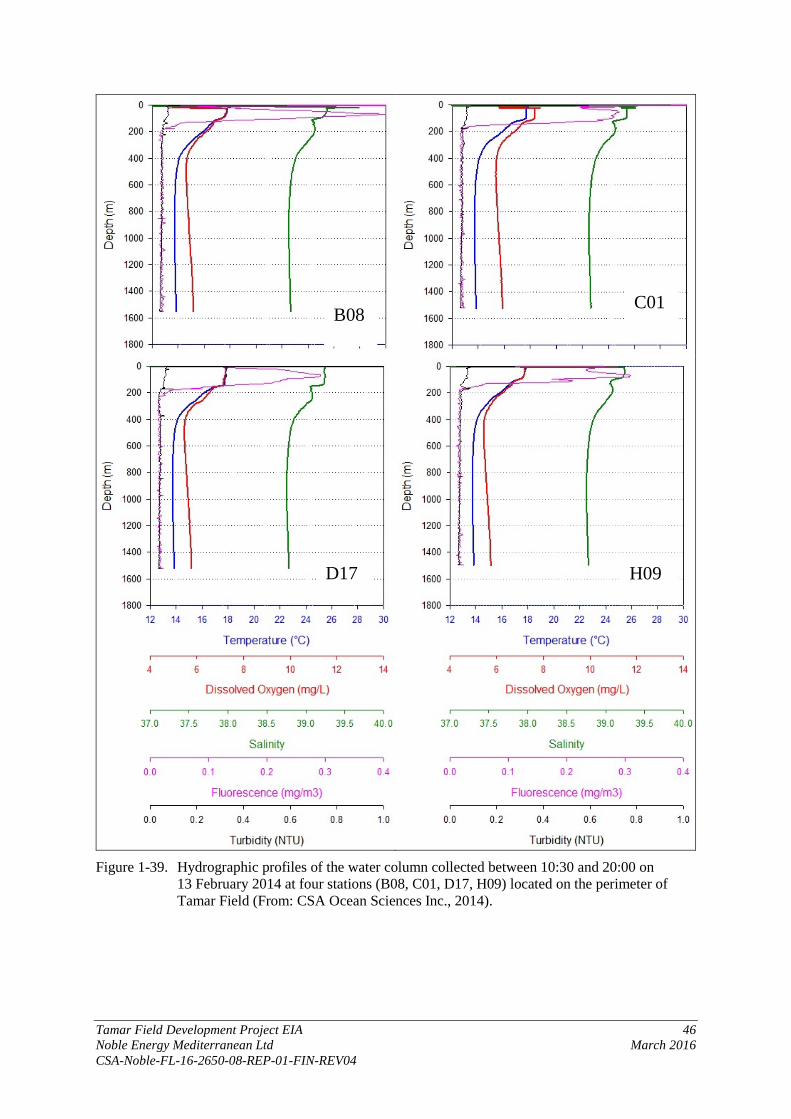
Tamar Field Development Project EIA 46 Noble Energy Mediterranean Ltd March 2016 CSA-Noble-FL-16-2650-08-REP-01-FIN-REV04
Figure 1-39. Hydrographic profiles of the water column collected between 10:30 and 20:00 on 13 February 2014 at four stations (B08, C01, D17, H09) located on the perimeter of Tamar Field (From: CSA Ocean Sciences Inc., 2014).
B08 C01
D17 H09
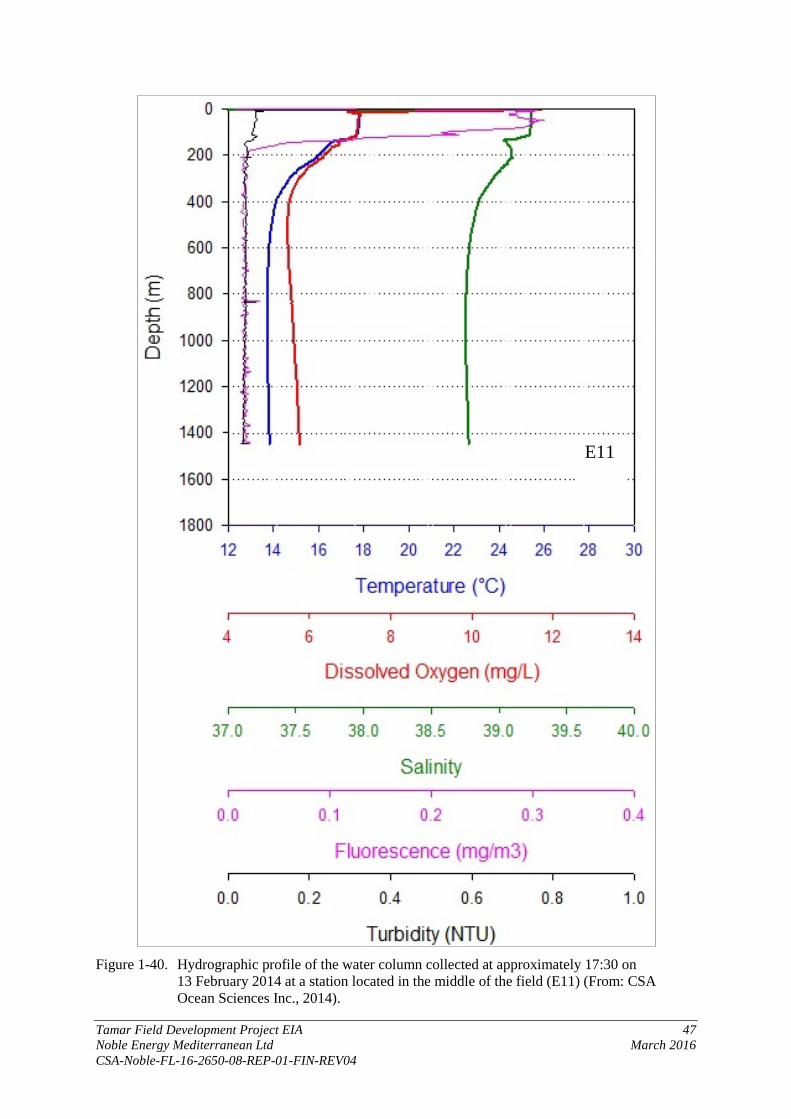
Tamar Field Development Project EIA 47 Noble Energy Mediterranean Ltd March 2016 CSA-Noble-FL-16-2650-08-REP-01-FIN-REV04
Figure 1-40. Hydrographic profile of the water column collected at approximately 17:30 on
13 February 2014 at a station located in the middle of the field (E11) (From: CSA Ocean Sciences Inc., 2014).
E11

Tamar Field Development Project EIA 48 Noble Energy Mediterranean Ltd March 2016 CSA-Noble-FL-16-2650-08-REP-01-FIN-REV04
Figure 1-41. Hydrographic profile of the water column collected at 07:00 on 26 March 2013 at
Station TF7 (From: CSA Ocean Sciences Inc., 2014).
TF7

Tamar Field Development Project EIA 49 Noble Energy Mediterranean Ltd March 2016 CSA-Noble-FL-16-2650-08-REP-01-FIN-REV04
Similarity in Hydrographic Profiles Between Surveys
Hydrographic water profiles recorded during the March 2013 Tamar Field and Pipeline Survey and the February 2014 Tamar Field Background Monitoring Survey are nearly identical. This finding is not surprising as both surveys were conducted during approximately the same season, although one year apart. The similarity indicates that the hydrographic conditions within the Tamar Field are uniform geographically as well as temporally.
The photosynthetic maximum at 100 to 175 m is typically due to an optimal combination of nutrient and light availability at those depths that promotes phytoplankton growth. Above this layer, nutrient availability for phytoplankton growth is generally limiting, while below this layer, a reduction in light penetration inhibits phytoplankton growth. Increased grazing by zooplankton and other faunal organisms may also reduce the phytoplankton community in the upper layers of the water column. The slight difference in the depth of the photosynthetic maximum between surveys is likely due to minor interannual variations in environmental conditions.
The near-surface depression of DO during both surveys may be attributed to photoinhibition (i.e., sunlight decreasing photosynthesis). The DO stabilization at water depths below 400 m is typical of the Levantine Basin because the amount of organic material sinking from the surface waters is low, which limits microbial respiration at depth (Krom, 1995).
1.2.3 Nature and Ecology
The following resource-specific discussions present summaries of pertinent, available information on both a regional (i.e., eastern Mediterranean Sea, Levantine Basin) and site-specific basis (i.e., Tamar study area). A series of site-specific surveys have been completed in the Tamar Field area, including infaunal sampling and remotely operated vehicle (ROV)-based observations to document benthic epifauna (i.e., benthic fauna present on the sediment surface) and evidence of biological activity (e.g., burrows, mounds). Regional data were derived from available literature and relevant data sources; site-specific information concerning benthic communities in the Tamar study area is available from the March 2013 and February 2014 surveys conducted in the Tamar Field and pipeline corridor to the Tamar Platform (CSA Ocean Sciences Inc., 2014). According to the Strategic Environmental Survey prepared by Israel Oceanographic and Limnological Research (IOLR), the deep sea zone of the economic waters of Israel has a very low combined ecological sensitivity (IOLR, 2015).
1.2.3.1 Plankton
Marine plankton include organisms with limited swimming capabilities that drift with the prevailing currents. Plankton range in size from less than 0.2 µm (marine viruses) to greater than 600 mm (large jellyfish) and may derive energy from sunlight (i.e., plant plankton [phytoplankton]), from the consumption of organic material (i.e., animal plankton [zooplankton]) or, in several unique deepsea habitats, from chemosynthesis of inorganic molecules. In marine systems, phytoplankton form the base of the food web, while zooplankton link phytoplankton to higher trophic levels (e.g., fish). Zooplankton also mediate the transfer of organic material from the ocean surface to the deep sea and thus are indirectly responsible for maintaining benthic community production in most deepsea ecosystems.
Phytoplankton
Phytoplankton productivity in the Mediterranean Sea is nutrient-limited (Longhurst, 1998). In contrast to other marine systems, Mediterranean phytoplankton production is co-limited by phosphorus and nitrogen (Krom et al., 1991; Thingstad et al., 2005). A west-to-east decrease in nutrient concentrations in the Mediterranean Sea results in extremely nutrient-poor (“ultra-oligotrophic”) surface waters in the eastern Levantine Basin compared to the western
Tamar Field Development Project EIA 50 Noble Energy Mediterranean Ltd March 2016 CSA-Noble-FL-16-2650-08-REP-01-FIN-REV04
Mediterranean Sea. Severe nutrient depletion in the eastern Mediterranean Sea results in low phytoplankton biomass and productivity (Tanaka et al., 2007).
Phytoplankton dynamics in the eastern Levantine Basin, including the Tamar study area, vary on a seasonal basis. Phytoplankton blooms occur in the winter and early spring (November to March) because deep winter mixing brings nutrients to surface waters (Vidussi et al., 2001). Phytoplankton growth during this season rapidly depletes phosphorus, and nutrient levels remain low during the summer when the surface water stratifies. Thus, the summer phytoplankton biomass (i.e., pigment concentration [chlorophyll a]) is low in the surface mixed layer; up to 10 times lower than observed during the winter (Krom et al., 1991). Herut et al. (2000) reported distinct phytoplankton biomass peaks in surface water (upper 120 m) following autumn and winter storms.
The dominant phytoplankton in eastern Mediterranean assemblages is Synechococcus spp. (Pitta et al., 2005), a small (<2 µm) cyanobacterium (blue-green algae). Koppelmann et al. (2003) suggested that Synechococcus spp. is one of the primary mechanisms for nitrogen fixation in the Levantine Basin and is common (Li et al., 1993; Detmer, 1995) under oligotrophic conditions (Kress, 2000; Struck et al., 2001). Analysis of phytoplankton accessory pigments in the eastern Levantine Basin also indicates the importance of prymnesiophyte nanoplankton (2 to 20 µm) and the presence of coccolithophorids, diatoms, and dinoflagellates (Psarra et al., 2005). Diatom populations studied by Psarra et al. (2005) were found to be dominated by Thalassionema frauenfeldii.
Phytoplankton in the study area are found primarily in the surface waters (0 to 150 m) where light levels are sufficient for growth; the euphotic zone, with maximum phytoplankton productivity, occurs in the surface mixed layer at a depth of 0 to 50 m (Tanaka et al., 2007). However, phytoplankton pigments (chlorophyll a) have been found to 500 m in the deep mixed layer of a warm-core eddy to the south of Cyprus (Krom et al., 1991). On average, the vertical distribution of phytoplankton pigment concentrations (chlorophyll a) in the eastern Levantine Basin reaches a maximum at 90 to 110 m, just above the nutricline (Yacobi et al., 1995; Krom et al., 2005). This is corroborated by the fluorescence profile of the water column (see, for example, Figure 1-39).
Zooplankton
Zooplankton in the eastern Mediterranean Sea can be categorized by size into microzooplankton (20 to 200 µm), mesozooplankton (>200 µm), and macrozooplankton (>2 mm). Zooplankton in surface waters rely on a phytoplankton-based food web, whereas zooplankton in the deep sea rely on a food web based on organic particulate material sinking from the surface.
Microzooplankton in the study area is a diverse assemblage of small cells that consume bacteria and small phytoplankton. The microzooplankton community includes heterotrophic nanoflagellates (2 to 10 µm) and ciliates (10 to 350 µm), as well as autotrophic nanoflagellates that have chloroplasts and can derive energy from sunlight, and are thus “mixotrophic” (Pitta et al., 2005). Ciliate abundances are maximal in the surface mixed layer (0 to 50 m) where phytoplankton production is highest, while autotrophic nanoflagellate abundances are maximal just above the nutricline, at approximately 100-m depth (Tanaka et al., 2007). In contrast, no consistent pattern is found for heterotrophic nanoflagellates in surface and deep waters of the eastern Levantine Basin, although their abundance and bacterial abundances decrease with depth (Tanaka et al., 2007).
Mesozooplankton and macrozooplankton in the eastern Levantine Basin are extremely diverse. In surface waters between Sicily and Cyprus, for example, zooplankton communities are dominated by copepods (Mazzocchi et al., 1997), specifically the small copepods Clausocalanus furcatus, C. paululus, Oithona plumifera, and Farranula rostrata (Siokou-Frangou et al., 1997). In addition to copepods, at least 21 other zooplankton taxa are found in the eastern Levantine Basin, including medusae, siphonophores, ctenophores, heteropods, pteropods, molluscan larvae, polychaetes, cladocerans, ostracods, euphausiids, decapod larvae, isopods, amphipods, echinoderm larvae,

Tamar Field Development Project EIA 51 Noble Energy Mediterranean Ltd March 2016 CSA-Noble-FL-16-2650-08-REP-01-FIN-REV04
chaetognaths, appendicularians, pyrosomes, doliolids, salps, and fish eggs and larvae (Mazzocchi et al., 1997).
Nearshore plankton in the eastern Mediterranean Sea, especially prominent macrozooplankton, is characterized by the presence of gelatinous swarms of scyphomedusan jellyfish and ctenophores. Each summer since the mid-1980s, huge swarms of the jellyfish Rhopilema nomadica have appeared along the Levant coast (Galil and Zenetos, 2002). Jellyfish swarms now appear year-round with an unwelcome addition of the comb jelly Mnemiopsis leidyi (Fuentes et al., 2009), which has invaded the Black Sea via ballast water and caused a massive commercial collapse of its pelagic fisheries. These massive swarms of voracious planktotrophs, some stretching 100 km long, draw nearer to shore, with the potential to adversely affect tourism, fisheries, and coastal installations. R. nomadica-dominated swarms are usually poly-specific and commonly include jellyfish of Atlanto-Mediterranean origin such as Rhizostoma pulmo and Aurelia aurita as well as the Lessepsian scyphomedusa Phyllorhiza punctata (Australian white-spotted jellyfish) (Edelist et al., 2011). These macrozooplankton swarms appear to be coastal-related events, and it is uncertain if the swarms would occur and affect the offshore habitat in the area of the Tamar Field.
1.2.3.2 Benthic Communities
The benthos refers to animals (benthic fauna) and plants (benthic flora) that are found on the seafloor (epifauna), in the seafloor (infauna), or near the seafloor. Benthic fauna are often sorted according to size into meiobenthos (less than 1 mm) and macrobenthos (greater than 1 mm). Information for this report was derived from regional study data from available literature and from three surveys conducted by Noble Energy. The surveys included a video documentation survey of the Tamar SW-1 site (CSA Ocean Sciences Inc., 2013b) and infauna surveys conducted in March 2013 and February 2014 (CSA Ocean Sciences Inc., 2014).
A video documentation survey recently conducted at the Tamar SW-1 study area (CSA Ocean Sciences Inc., 2013b) characterized the seafloor substrates and associated biological communities. The seafloor of the entire survey area was characterized by a smooth, relatively flat soft bottom. Soft bottom substrate was composed of mud and a fine silt veneer that was subject to resuspension from physical disturbance. Seafloor features included subtle variations in surficial topography and bioturbation in the form of mounds, burrows, and motile biota track lines. No consolidated substrates (i.e., hard bottom) or signatures of chemosynthetic communities were observed within the survey area, supporting the determinations presented in the site-specific geohazard survey (Gardline Surveys Inc., 2012).
Biological activity was a relatively common observance within the Tamar SW-1 study area and was predominantly motile biota and biologically maintained burrows and mounds (CSA Ocean Sciences Inc., 2013b). The most commonly observed organisms during the video survey were fish and shrimp. The most commonly observed fish was the tripod fish (Bathypterois sp.). Many of the fish observed during the video survey were unidentifiable by video analysis due to their awkward positioning relative to the camera or small body size. Frequency of occurrence for fish and shrimp averaged approximately two and three individuals per 100 m of survey transect, respectively. Bioturbation was frequently observed along video transects and included patterned burrows (i.e., small groupings) and small (~15 to 30 cm), conical mounds likely formed by deposit-feeding worms (Polychaeta).
Within the Tamar Field, 667 individual organisms were collected during the 2013 and 2014 surveys. The taxonomic listing of infauna within the Tamar Field is provided in Table 1-2. Infaunal abundance within the Tamar Field was patchy and ranged from 25 to 125 individuals per m2 (Figure 1-42). The dominant taxa within the field were annelid worms (Figure 1-43), primarily composed of Notomastus sp. (Figure 1-44) which accounted for 31% of the total organisms collected (Table 1-2). Crustaceans were abundant (25 to 50 individuals per m2) within the northeastern portion of the field (Figure 1-45). Mollusks and other various phyla were not abundant within the field (Figures 1-46 and 1-47; Table 1-2).
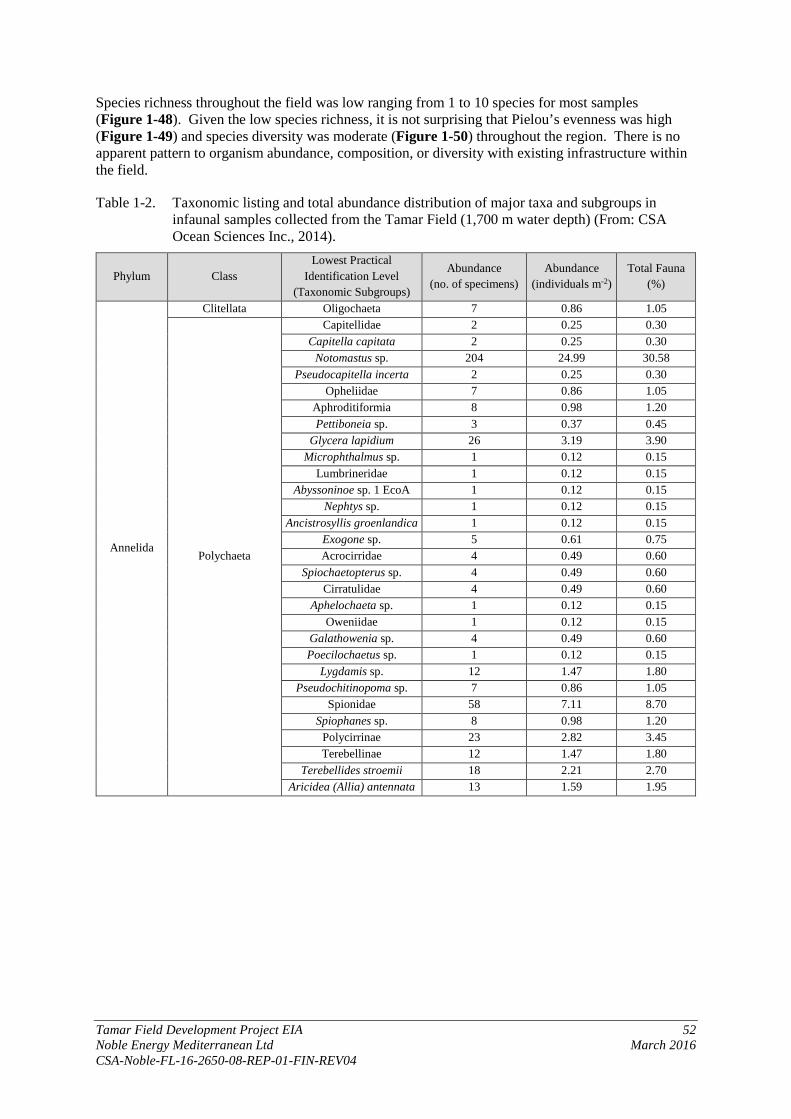
Tamar Field Development Project EIA 52 Noble Energy Mediterranean Ltd March 2016 CSA-Noble-FL-16-2650-08-REP-01-FIN-REV04
Species richness throughout the field was low ranging from 1 to 10 species for most samples (Figure 1-48). Given the low species richness, it is not surprising that Pielou’s evenness was high (Figure 1-49) and species diversity was moderate (Figure 1-50) throughout the region. There is no apparent pattern to organism abundance, composition, or diversity with existing infrastructure within the field.
Table 1-2. Taxonomic listing and total abundance distribution of major taxa and subgroups in infaunal samples collected from the Tamar Field (1,700 m water depth) (From: CSA Ocean Sciences Inc., 2014).
Phylum Class Lowest Practical
Identification Level (Taxonomic Subgroups)
Abundance (no. of specimens)
Abundance (individuals m-2)
Total Fauna (%)
Annelida
Clitellata Oligochaeta 7 0.86 1.05
Polychaeta
Capitellidae 2 0.25 0.30 Capitella capitata 2 0.25 0.30
Notomastus sp. 204 24.99 30.58 Pseudocapitella incerta 2 0.25 0.30
Opheliidae 7 0.86 1.05 Aphroditiformia 8 0.98 1.20 Pettiboneia sp. 3 0.37 0.45
Glycera lapidium 26 3.19 3.90 Microphthalmus sp. 1 0.12 0.15
Lumbrineridae 1 0.12 0.15 Abyssoninoe sp. 1 EcoA 1 0.12 0.15
Nephtys sp. 1 0.12 0.15 Ancistrosyllis groenlandica 1 0.12 0.15
Exogone sp. 5 0.61 0.75 Acrocirridae 4 0.49 0.60
Spiochaetopterus sp. 4 0.49 0.60 Cirratulidae 4 0.49 0.60
Aphelochaeta sp. 1 0.12 0.15 Oweniidae 1 0.12 0.15
Galathowenia sp. 4 0.49 0.60 Poecilochaetus sp. 1 0.12 0.15
Lygdamis sp. 12 1.47 1.80 Pseudochitinopoma sp. 7 0.86 1.05
Spionidae 58 7.11 8.70 Spiophanes sp. 8 0.98 1.20
Polycirrinae 23 2.82 3.45 Terebellinae 12 1.47 1.80
Terebellides stroemii 18 2.21 2.70 Aricidea (Allia) antennata 13 1.59 1.95
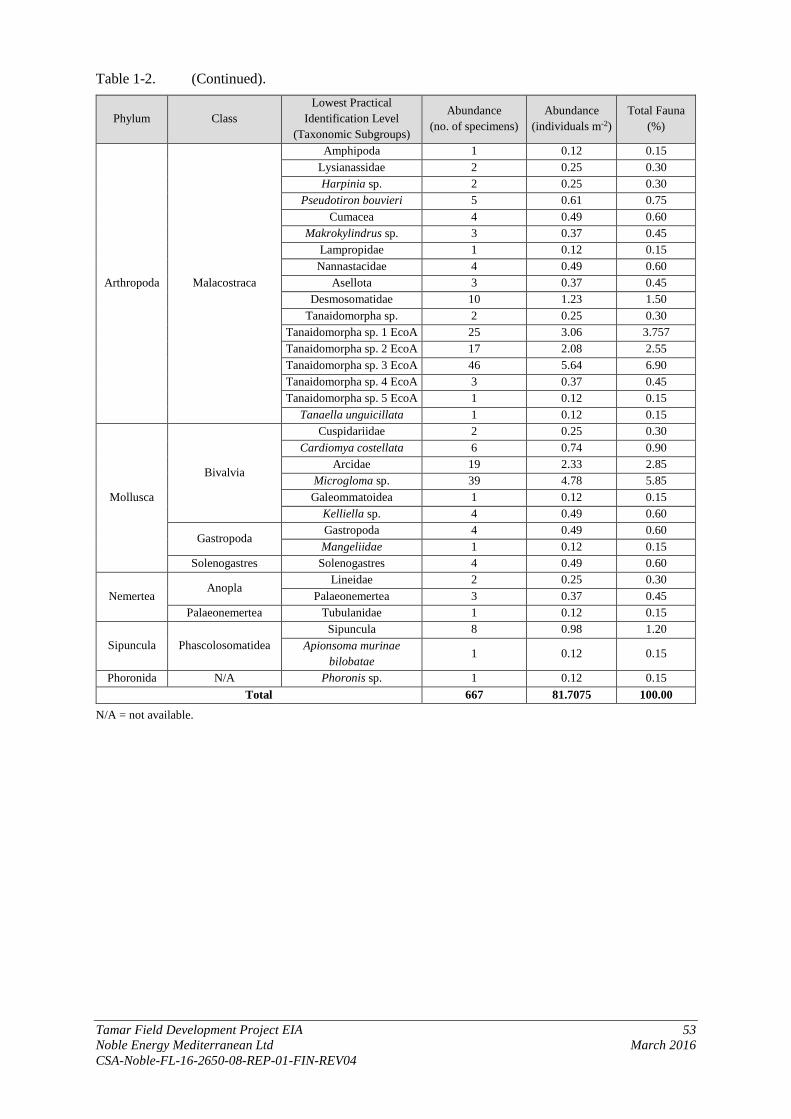
Table 1-2. (Continued).
Tamar Field Development Project EIA 53 Noble Energy Mediterranean Ltd March 2016 CSA-Noble-FL-16-2650-08-REP-01-FIN-REV04
Phylum Class Lowest Practical
Identification Level (Taxonomic Subgroups)
Abundance (no. of specimens)
Abundance (individuals m-2)
Total Fauna (%)
Arthropoda Malacostraca
Amphipoda 1 0.12 0.15 Lysianassidae 2 0.25 0.30 Harpinia sp. 2 0.25 0.30
Pseudotiron bouvieri 5 0.61 0.75 Cumacea 4 0.49 0.60
Makrokylindrus sp. 3 0.37 0.45 Lampropidae 1 0.12 0.15
Nannastacidae 4 0.49 0.60 Asellota 3 0.37 0.45
Desmosomatidae 10 1.23 1.50 Tanaidomorpha sp. 2 0.25 0.30
Tanaidomorpha sp. 1 EcoA 25 3.06 3.757 Tanaidomorpha sp. 2 EcoA 17 2.08 2.55 Tanaidomorpha sp. 3 EcoA 46 5.64 6.90 Tanaidomorpha sp. 4 EcoA 3 0.37 0.45 Tanaidomorpha sp. 5 EcoA 1 0.12 0.15
Tanaella unguicillata 1 0.12 0.15
Mollusca
Bivalvia
Cuspidariidae 2 0.25 0.30 Cardiomya costellata 6 0.74 0.90
Arcidae 19 2.33 2.85 Microgloma sp. 39 4.78 5.85 Galeommatoidea 1 0.12 0.15
Kelliella sp. 4 0.49 0.60
Gastropoda Gastropoda 4 0.49 0.60 Mangeliidae 1 0.12 0.15
Solenogastres Solenogastres 4 0.49 0.60
Nemertea Anopla
Lineidae 2 0.25 0.30 Palaeonemertea 3 0.37 0.45
Palaeonemertea Tubulanidae 1 0.12 0.15
Sipuncula Phascolosomatidea Sipuncula 8 0.98 1.20
Apionsoma murinae bilobatae
1 0.12 0.15
Phoronida N/A Phoronis sp. 1 0.12 0.15 Total 667 81.7075 100.00
N/A = not available.
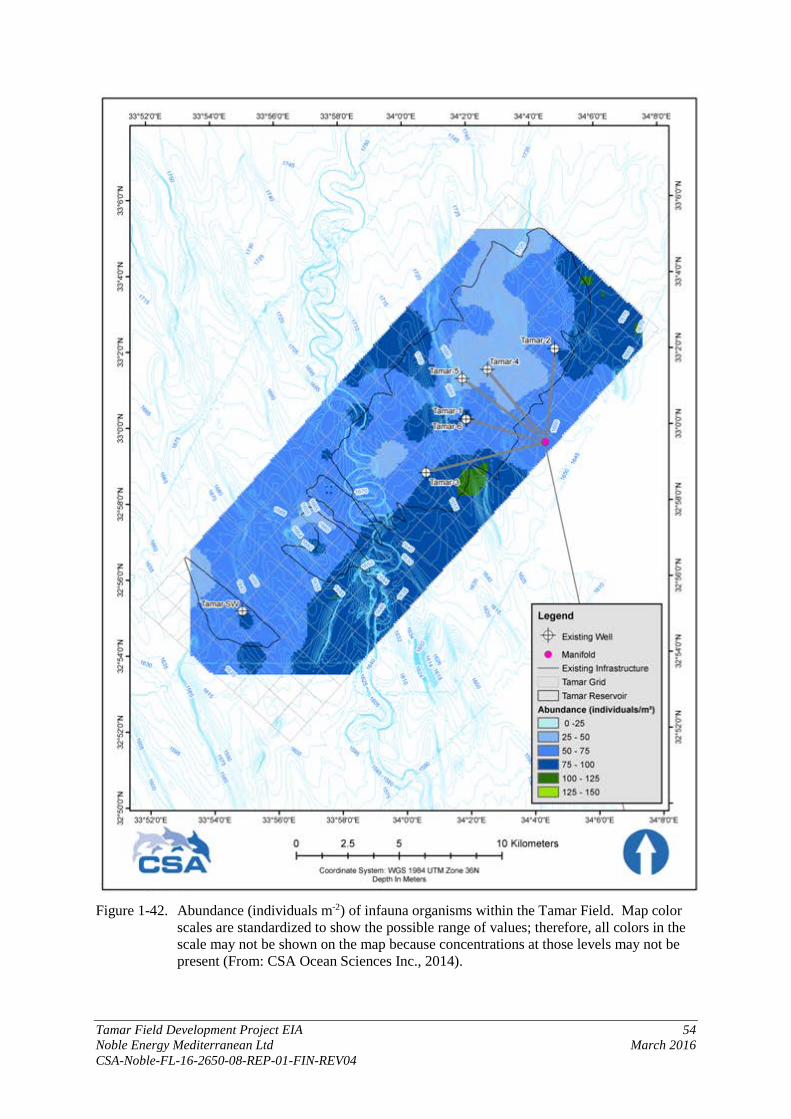
Tamar Field Development Project EIA 54 Noble Energy Mediterranean Ltd March 2016 CSA-Noble-FL-16-2650-08-REP-01-FIN-REV04
Figure 1-42. Abundance (individuals m-2) of infauna organisms within the Tamar Field. Map color
scales are standardized to show the possible range of values; therefore, all colors in the scale may not be shown on the map because concentrations at those levels may not be present (From: CSA Ocean Sciences Inc., 2014).

Tamar Field Development Project EIA 55 Noble Energy Mediterranean Ltd March 2016 CSA-Noble-FL-16-2650-08-REP-01-FIN-REV04
Figure 1-43. Abundance (individuals m-2) of annelids within the Tamar Field. Map color scales are
standardized to show the possible range of values; therefore, all colors in the scale may not be shown on the map because concentrations at those levels may not be present (From: CSA Ocean Sciences Inc., 2014).
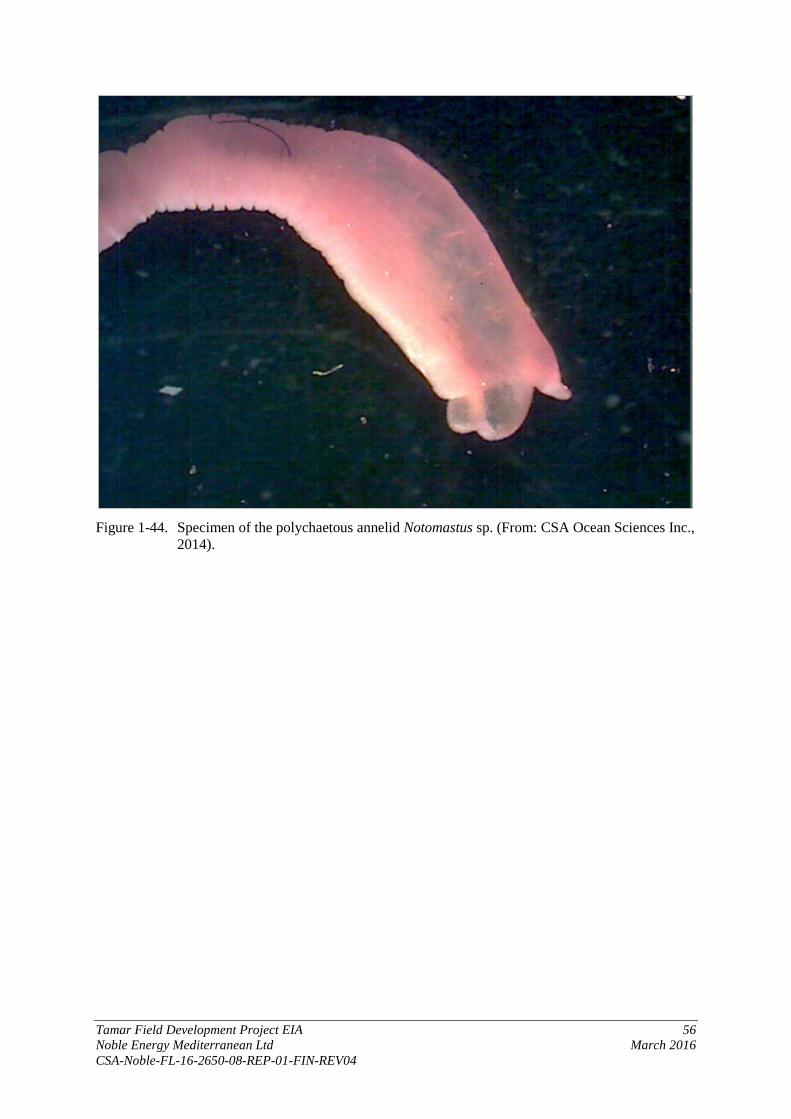
Tamar Field Development Project EIA 56 Noble Energy Mediterranean Ltd March 2016 CSA-Noble-FL-16-2650-08-REP-01-FIN-REV04
Figure 1-44. Specimen of the polychaetous annelid Notomastus sp. (From: CSA Ocean Sciences Inc.,
2014).
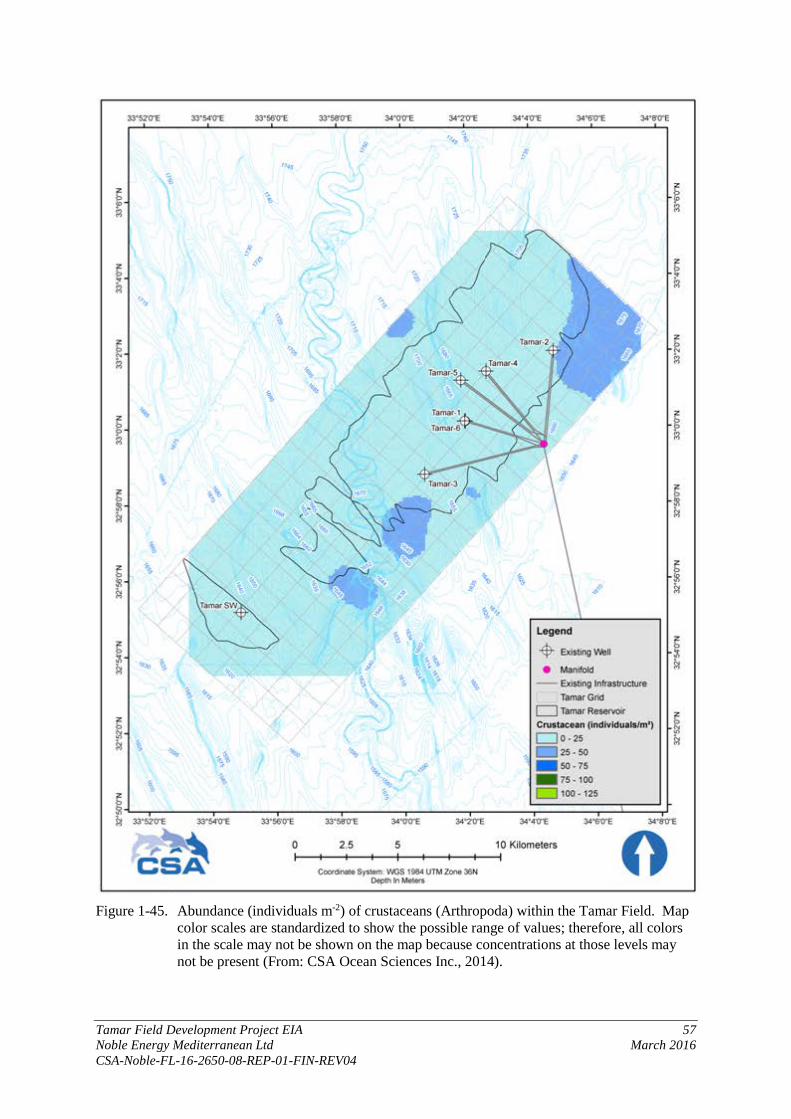
Tamar Field Development Project EIA 57 Noble Energy Mediterranean Ltd March 2016 CSA-Noble-FL-16-2650-08-REP-01-FIN-REV04
Figure 1-45. Abundance (individuals m-2) of crustaceans (Arthropoda) within the Tamar Field. Map
color scales are standardized to show the possible range of values; therefore, all colors in the scale may not be shown on the map because concentrations at those levels may not be present (From: CSA Ocean Sciences Inc., 2014).
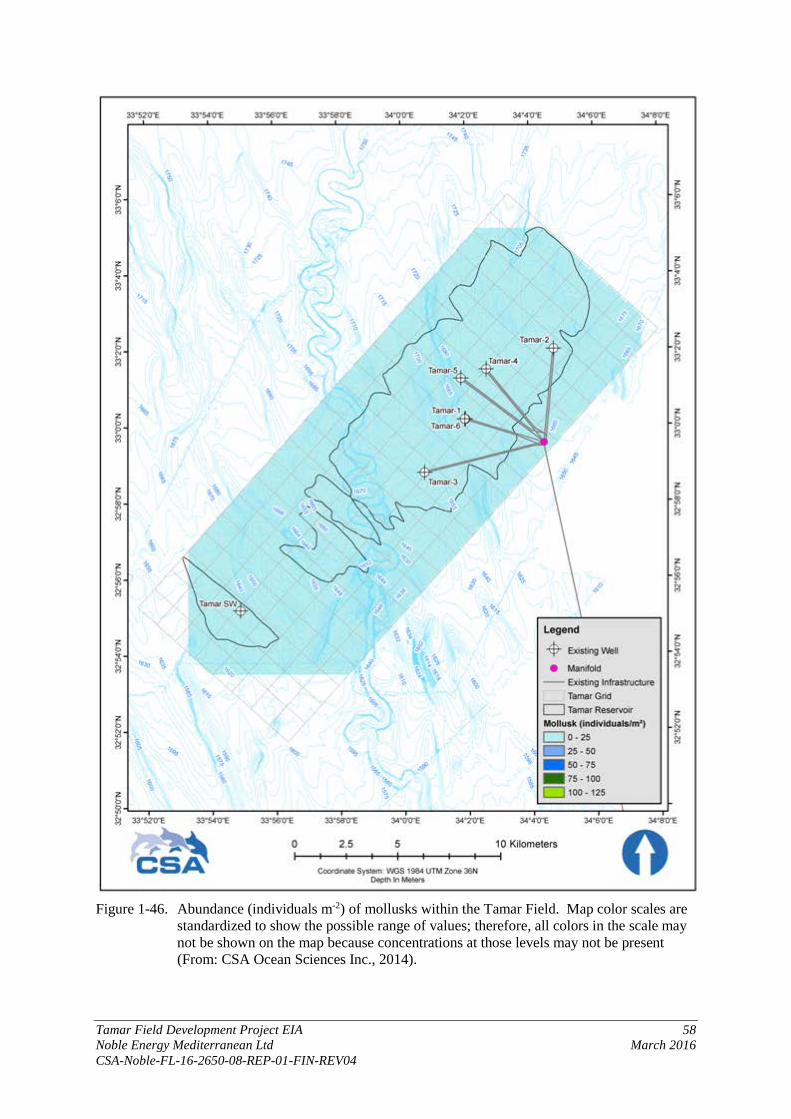
Tamar Field Development Project EIA 58 Noble Energy Mediterranean Ltd March 2016 CSA-Noble-FL-16-2650-08-REP-01-FIN-REV04
Figure 1-46. Abundance (individuals m-2) of mollusks within the Tamar Field. Map color scales are
standardized to show the possible range of values; therefore, all colors in the scale may not be shown on the map because concentrations at those levels may not be present (From: CSA Ocean Sciences Inc., 2014).

Tamar Field Development Project EIA 59 Noble Energy Mediterranean Ltd March 2016 CSA-Noble-FL-16-2650-08-REP-01-FIN-REV04
Figure 1-47. Abundance (individuals m-2) of Nemertea, Sipuncula, and Phoronida within the
Tamar Field. Map color scales are standardized to show the possible range of values; therefore, all colors in the scale may not be shown on the map because concentrations at those levels may not be present (From: CSA Ocean Sciences Inc., 2014).

Tamar Field Development Project EIA 60 Noble Energy Mediterranean Ltd March 2016 CSA-Noble-FL-16-2650-08-REP-01-FIN-REV04
Figure 1-48. Species richness within the Tamar Field. Map color scales are standardized to show the
possible range of values; therefore, all colors in the scale may not be shown on the map because concentrations at those levels may not be present (From: CSA Ocean Sciences Inc., 2014).

Tamar Field Development Project EIA 61 Noble Energy Mediterranean Ltd March 2016 CSA-Noble-FL-16-2650-08-REP-01-FIN-REV04
Figure 1-49. Pielou’s evenness (J′) metrics from within the Tamar Field. Pielou’s evenness is a value
that ranges from 0 (low evenness) to 1 (high evenness). Map color scales are standardized to show the possible range of values; therefore, all colors in the scale may not be shown on the map because concentrations at those levels may not be present (From: CSA Ocean Sciences Inc., 2014).
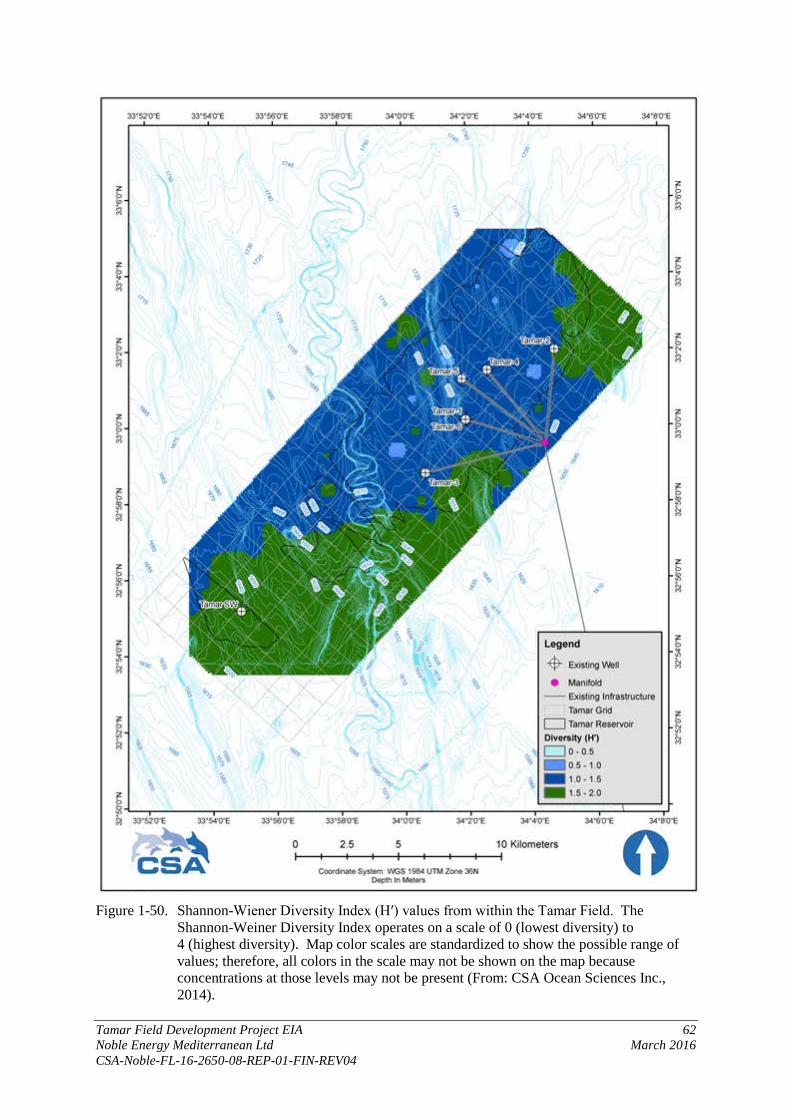
Tamar Field Development Project EIA 62 Noble Energy Mediterranean Ltd March 2016 CSA-Noble-FL-16-2650-08-REP-01-FIN-REV04
Figure 1-50. Shannon-Wiener Diversity Index (H′) values from within the Tamar Field. The
Shannon-Weiner Diversity Index operates on a scale of 0 (lowest diversity) to 4 (highest diversity). Map color scales are standardized to show the possible range of values; therefore, all colors in the scale may not be shown on the map because concentrations at those levels may not be present (From: CSA Ocean Sciences Inc., 2014).

Tamar Field Development Project EIA 63 Noble Energy Mediterranean Ltd March 2016 CSA-Noble-FL-16-2650-08-REP-01-FIN-REV04
Continental Slope and Deepsea Habitats
Continental slope and deepsea habitats in the Mediterranean Sea are characterized by eurybathic fauna (i.e., occupying a wide depth range), with very few true deepwater species (Cartes et al., 2004). Deepsea fauna found in the eastern Levantine Basin historically have been considered to be extremely impoverished in terms of species number, but recent observations from the R/V Nautilus survey conducted off the Israeli slope between 5 and 14 September 2010 (Bell and Fuller, 2011) may indicate that deepsea species diversity in the Levantine Basin is not as low as originally thought. The R/V Nautilus survey made observations of exposed rock outcrops in water depths exceeding 500 m along the Palmachim disturbance (a geological feature offshore of Tel Aviv). The rock outcrops provide habitat for relatively dense coverage of soft corals, shrimps, and crabs (Bell and Fuller, 2011).
The abyssal basins of the eastern Mediterranean Sea are extremely unusual deepsea systems. With water temperatures at 4,000 m in excess of 14°C (rather than less than 4°C for other deep oceanic basins), the entire benthic environment is as hot as the water around a hydrothermal vent system, but lacks the vents’ rich chemical energy supply. The Mediterranean also differs from other deepsea ecosystems in terms of its species composition, notably the absence of the near-ubiquitous deepwater grenadier fish Coryphaenoides armatus and the amphipod Eurythenes gryllus. Instead, Acanthephyra eximia, a deepsea shrimp species, appears to have functionally replaced E. gryllus, the dominant deepsea scavenging crustacean throughout most of the world’s oceans (Christiansen, 1989).
Danovaro et al. (2010) summarized all available information on benthic biodiversity (i.e., prokaryotes, foraminifera, meiofauna, macrofauna, and megafauna) in different deepsea ecosystems of the Mediterranean Sea (i.e., from 200 to >4,000 m water depths). Results indicated that the deepsea biodiversity is similarly high for both the eastern and the western basins of the Mediterranean Sea. In general, the biodiversity components decreased with increasing water depth. Quantitative analyses of macrofauna in deep water of the eastern Mediterranean are limited (Tyler, 2005).
Few studies have examined deepwater meiofauna off Israel; however, based on existing evidence, Galil (2004) characterized these communities as diverse but scarce, consisting of “autochthonous, self-sustaining populations of opportunistic, eurybathic species.” Survey results from 1993 revealed a strong dependence of meiofaunal abundance on depth, distance from the coast, and food (labile organic carbon) availability (Tselepides and Lampadariou, 2004). The meiofaunal community was dominated by nematodes, harpacticoid copepods, and polychaetes.
Chemosynthetic Communities
The presence of chemosynthetic benthic communities, driven by the biological oxidation of sedimentary methane (CH4), has been documented offshore Israel (Coleman and Ballard, 2001). Coleman and Ballard (2001), using side-scan sonar and ROV ground-truthing techniques, discovered gas seeps and associated calcium carbonate substrate in a water depth slightly greater than 700 m. The acoustic signature appears as small depressions or surficial pockmarks, which have been similarly described in various locations within the eastern Mediterranean (Dimitrov and Woodside, 2003; Bayon et al., 2009). The biological community associated with the pockmark formations was dominated by polychaetes and bivalves.
Mediterranean seeps appear to represent a rich habitat characterized by megafaunal species richness (e.g., gastropods) or the exceptional size of some taxa such as sponges (e.g., Rhizaxinella pyrifera) and crabs (e.g., Chaceon mediterraneus). This contrasts with the perceived non-seep characteristics of low macrofaunal and megafaunal abundance and diversity of the deep eastern Mediterranean Sea (Danovaro et al., 2010). Seep communities in the Mediterranean that include endemic chemosynthetic species and associated fauna differ from the other known seep communities in the world both at the species level and by the notable absence of the large bivalve genera Calyptogena or Bathymodiolus. The isolation of the Mediterranean seeps from the Atlantic Ocean after the Messinian
Tamar Field Development Project EIA 64 Noble Energy Mediterranean Ltd March 2016 CSA-Noble-FL-16-2650-08-REP-01-FIN-REV04
crisis led to the development of unique communities that are likely to differ in composition and structure from those in the Atlantic.
1.2.3.3 Fish and Other Nekton
The distribution and abundance of nekton of the Levantine Basin are determined, to a large extent, by the mesoscale oceanographic features of the Mediterranean Sea. The Mediterranean gets most of its nutrient salts from surface layers of the Central Atlantic, where nutrient levels are moderate. The Atlantic Water that enters the Mediterranean through the Strait of Gibraltar follows the northern coast of Africa, with various branches from circulation eddies on the way to the eastern Mediterranean Sea. On its way through the Mediterranean, seawater becomes not only oligotrophic but also warmer and very salty, hence denser. In the area offshore Israel, this water (known as Mediterranean Surface Water) sinks in a downwelling pattern to the intermediate layer and moves west during the winter. Ultimately, these waters (i.e., Levantine Intermediate Water) flow out of the Mediterranean and into the Atlantic through the lower strata of the Strait of Gibraltar. With this general pattern, the productivity of the sea offshore of Israel is estimated to be even lower than productivity of the rest of the eastern Mediterranean and is termed ultra-oligotrophic.
The Mediterranean has its own specific fauna and flora as a result of its origins and peculiar hydrography. The marine fishes of the eastern Levantine Basin have been studied by several authors. A historical account of these studies was developed by Golani (1996). The first general study of the Israeli marine ichthyofauna was by Ben-Tuvia (1953), who later revised this list (Ben-Tuvia, 1971). Another comprehensive study of the ichthyofauna of this region (Golani, 1996) included species from adjacent countries, such as Cyprus, southern Turkey, and Egypt (Golani, 2005).
The Mediterranean Sea as whole supports more than 700 fish species (Froese and Pauly, 2014). These species are variously distributed in relation to hydrography, physiography, and environmental factors over multiple basins and ridges that shape the Mediterranean. A broad pattern within the Mediterranean proper is that the number of species decreases from west to east; in the easternmost Levantine Basin offshore Israel, only 350 indigenous species are reported (Golani, 2005). This gradient of richness is thought to be correlated with gradients of increasing temperature and salinity and decreasing productivity. The waters of the Levantine Basin are considered oligotrophic (nutrient-starved) and do not support particularly rich fisheries. Another suspected effect of low productivity is that individuals of some species tend to mature at smaller sizes in the eastern Mediterranean than they do in other parts of their range – a phenomenon known as nanism.
Overall, the ichthyofauna in the Mediterranean Sea is composed of species with Atlantic (75%) and cosmopolitan (20%) origins. Important additions to the ichthyofauna are the numerous Indo-Pacific species introduced through the Suez Canal. Approximately 60 fish species of Indo-Pacific origin have invaded the Levant region since the Suez Canal opened in 1869. When these invaders are included, the total list of fish species known from the coast of Israel is slightly more than 400, from 130 families. This invasion is significant for local ecosystems as well as fisheries because several invaders have become numerically dominant in some habitats.
Fishes found off the coast of Israel may be broadly classified as either demersal (bottom dwelling) or pelagic (water column dwelling). Demersal species can be further subdivided into soft bottom and hard bottom species, depending on the type of substrate particular species associate with. The following characterizations briefly describe the composition of pelagic and demersal fish assemblages found offshore of Israel.
Pelagic Fishes
Pelagic fishes are generally migratory species that usually form schools and traverse shelf waters. Movements may be onshore to offshore, but typically parallel the coastline. Pelagic species found off the Israeli coast are represented by sharks (Carcharhinidae), anchovies (Engraulis sp.), herrings

Tamar Field Development Project EIA 65 Noble Energy Mediterranean Ltd March 2016 CSA-Noble-FL-16-2650-08-REP-01-FIN-REV04
(Sardinella aurita), jacks (Trachurus spp. and Seriola dumerili), mackerels (Scomber japonicus), tunas (Euthynnus spp., Auxis spp.), mullets (Mugilidae), and barracudas (Sphyraena spp.). These species generally respond to vertical and horizontal changes in water temperature driven by seasonal weather patterns as well as prey availability. Smaller pelagic fishes such as anchovies, herrings, and some jacks (Trachurus spp.) are planktivores. Larger pelagic species including sharks, tunas, mackerels, jacks, and barracudas feed on smaller pelagic species.
Demersal Fishes
Demersal fishes associate with either soft or hard (structured) bottom types. On a spatial scale of kilometers, fishes on soft bottom segregate into recognizable assemblages along gradients of water depth (Edelist et al., 2011). Characteristics of the sediments also influence the distribution of soft bottom demersal fishes. Offshore of Israel, medium to coarse sand is found from nearshore to approximately 80 m depth where it changes to mud. In inner shelf water depths (15 to 38 m), the soft bottom assemblage is composed of porgies (Boops boops, Pagellus erythrinus, Lithognathus mormyrus), lizardfishes (Saurida undosquamis), and goatfishes (Upeneus pori). In water depths greater than 84 m, hake (Merluccius merluccius), sparids (Dentex macrophthalmus), snipefishes (Macroramphosus scolopax), and goatfishes (Mullus barbatus, Mullus spp.) are prevalent. Some demersal species such as dragonets (Callionymus filamentosus), gurnards (Lepidotrigla cavillone, Trigla spp.), and flatfishes (Bothus podas, Citharichthys lingulata) live in direct contact with the substrate, whereas others, including conger eels (Ariosoma baelericum), cusk-eels (Ophidion barbatum), weavers (Trachinus draco), and stargazers (Uranoscopus scaber), remain buried (or partially buried) in the sediment. These species feed on a variety of invertebrates and small fishes (Edelist et al., 2011).
Limited study reveals that the demersal fish assemblages of the basin, where water depths range from 1,000 to 4,264 m, are numerically dominated by a tripodfish (Bathypterois mediterraneus) and a grenadier (Nezumia sclerorhynchus) (Jones et al., 2003; Galil, 2004). Other fishes included an anglerfish (Lophius piscatorius), forkbeards (Phycis phycis, Phycis blennioides), ghost shark (Chimera monstrous), a dragonfish (Stomias boa), and several unidentified hatchetfishes (Sternoptychidae), scorpionfishes (Scorpaenidae), gurnards (Triglidae), and flatfishes (Bothidae and Scophthalmidae). Several deep-dwelling shark species such as bluntnose six-gill shark (Hexanchus griseus), blackmouth catshark (Galeus melanostomus), several gulper shark species (Centrophorus spp.), Portuguese dogfish (Centroscymnus coelolepis), and velvet belly (Etmopterus spinax) were recorded also.
Results of site-specific surveys in the Tamar Field indicate the presence of several demersal fish species. For example, the most common fish species observed during the July 2012 Environmental Baseline Survey at the Tamar SW-1 drillsite were tripod fish (Bathypterois sp.) and halosaurs (Halosaurus sp.).
1.2.3.4 Marine Mammals
There are no site-specific marine mammal data from the Application Area. Regional sightings and strandings data for marine mammals in the Mediterranean Sea have been reviewed and summarized by Notarbartolo di Sciara and Birkun (2010) and Reeves and Notarbartolo di Sciara (2006). Kerem et al. (2012, 2014) reviewed the status of cetaceans in the Levantine Basin and Israeli waters, respectively. Table 1-4 lists marine mammal species that may be present in the Application Area.
Small cetacean species that are considered regular species or visitors in the Levantine Basin include the common bottlenose dolphin (Tursiops truncatus), short-beaked common dolphin (Delphinus delphus), Risso’s dolphin (Grampus griseus), rough-toothed dolphin (Steno bredanensis), striped dolphin (Stenella coeruleoalba), Cuvier’s beaked whale (Ziphius cavirostris), and false killer whale (Pseudorca crassidens). Large cetaceans that are considered regular residents or visitors in the Levantine Basin include the fin whale (Balaenoptera physalus), minke whale (Balaenoptera
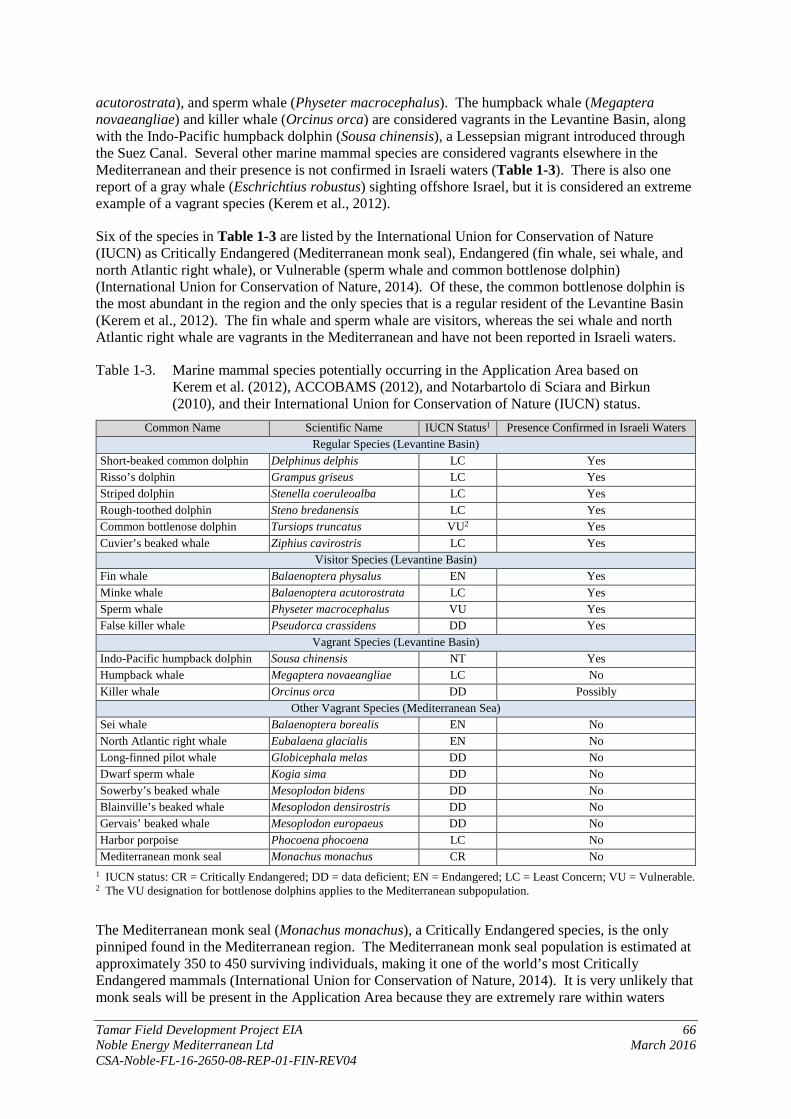
Tamar Field Development Project EIA 66 Noble Energy Mediterranean Ltd March 2016 CSA-Noble-FL-16-2650-08-REP-01-FIN-REV04
acutorostrata), and sperm whale (Physeter macrocephalus). The humpback whale (Megaptera novaeangliae) and killer whale (Orcinus orca) are considered vagrants in the Levantine Basin, along with the Indo-Pacific humpback dolphin (Sousa chinensis), a Lessepsian migrant introduced through the Suez Canal. Several other marine mammal species are considered vagrants elsewhere in the Mediterranean and their presence is not confirmed in Israeli waters (Table 1-3). There is also one report of a gray whale (Eschrichtius robustus) sighting offshore Israel, but it is considered an extreme example of a vagrant species (Kerem et al., 2012).
Six of the species in Table 1-3 are listed by the International Union for Conservation of Nature (IUCN) as Critically Endangered (Mediterranean monk seal), Endangered (fin whale, sei whale, and north Atlantic right whale), or Vulnerable (sperm whale and common bottlenose dolphin) (International Union for Conservation of Nature, 2014). Of these, the common bottlenose dolphin is the most abundant in the region and the only species that is a regular resident of the Levantine Basin (Kerem et al., 2012). The fin whale and sperm whale are visitors, whereas the sei whale and north Atlantic right whale are vagrants in the Mediterranean and have not been reported in Israeli waters.
Table 1-3. Marine mammal species potentially occurring in the Application Area based on Kerem et al. (2012), ACCOBAMS (2012), and Notarbartolo di Sciara and Birkun (2010), and their International Union for Conservation of Nature (IUCN) status.
Common Name Scientific Name IUCN Status1 Presence Confirmed in Israeli Waters Regular Species (Levantine Basin)
Short-beaked common dolphin Delphinus delphis LC Yes Risso’s dolphin Grampus griseus LC Yes Striped dolphin Stenella coeruleoalba LC Yes Rough-toothed dolphin Steno bredanensis LC Yes Common bottlenose dolphin Tursiops truncatus VU2 Yes Cuvier’s beaked whale Ziphius cavirostris LC Yes
Visitor Species (Levantine Basin) Fin whale Balaenoptera physalus EN Yes Minke whale Balaenoptera acutorostrata LC Yes Sperm whale Physeter macrocephalus VU Yes False killer whale Pseudorca crassidens DD Yes
Vagrant Species (Levantine Basin) Indo-Pacific humpback dolphin Sousa chinensis NT Yes Humpback whale Megaptera novaeangliae LC No Killer whale Orcinus orca DD Possibly
Other Vagrant Species (Mediterranean Sea) Sei whale Balaenoptera borealis EN No North Atlantic right whale Eubalaena glacialis EN No Long-finned pilot whale Globicephala melas DD No Dwarf sperm whale Kogia sima DD No Sowerby’s beaked whale Mesoplodon bidens DD No Blainville’s beaked whale Mesoplodon densirostris DD No Gervais’ beaked whale Mesoplodon europaeus DD No Harbor porpoise Phocoena phocoena LC No Mediterranean monk seal Monachus monachus CR No
1 IUCN status: CR = Critically Endangered; DD = data deficient; EN = Endangered; LC = Least Concern; VU = Vulnerable. 2 The VU designation for bottlenose dolphins applies to the Mediterranean subpopulation.
The Mediterranean monk seal (Monachus monachus), a Critically Endangered species, is the only pinniped found in the Mediterranean region. The Mediterranean monk seal population is estimated at approximately 350 to 450 surviving individuals, making it one of the world’s most Critically Endangered mammals (International Union for Conservation of Nature, 2014). It is very unlikely that monk seals will be present in the Application Area because they are extremely rare within waters

Tamar Field Development Project EIA 67 Noble Energy Mediterranean Ltd March 2016 CSA-Noble-FL-16-2650-08-REP-01-FIN-REV04
offshore Israel. A single monk seal was spotted off the coast of Herzliya in January 2010, the first sighting in recent decades. The last sightings of Mediterranean monk seals off Israel’s coast prior to this event were 50 to 60 years ago.
Kerem et al. (2014) assessed the status of small cetacean species offshore Israel, including bottlenose dolphin, short-beaked common dolphin, Risso’s dolphin, rough-toothed dolphin, and Cuvier’s beaked whale. Abundance was not estimated for any of these species. Based on strandings and sightings data, common bottlenose dolphin appears to be the most abundant. Rough-toothed dolphin is the only Mediterranean cetacean species for which the Levantine Basin may be the critical habitat for the subpopulation (Notarbartolo di Sciara and Birkun, 2010; Kerem et al., 2012).
According to Kerem et al. (2012), the common bottlenose dolphin is the most abundant cetacean in Israeli waters, accounting for 85% of reported sightings and 60% of strandings. Although most of the sightings are in coastal waters, there have been sightings up to 30 km offshore, over water depths of approximately 1,300 m. As noted previously, the Mediterranean subpopulation has been listed by the IUCN (2014) as Vulnerable. The justification for this status includes evidence of substantial incidental mortality in fishing gear, overfishing of dolphin prey, habitat loss and degradation, disturbance by marine traffic, and high levels of contamination by pollutants (Bearzi et al., 2012).
1.2.3.5 Sea Turtles
There are no site-specific sea turtle data from the Application Area. However, tracking studies indicate that sea turtles could occur in the Application Area (SEATURTLE.ORG, 2008). Three sea turtle species are known to occur in the Levantine Basin: the green turtle (Chelonia mydas), leatherback turtle (Dermochelys coriacea), and loggerhead turtle (Caretta caretta) (Table 1-4). The IUCN (2014) lists loggerhead and green turtles as Endangered, and the leatherback turtle as Vulnerable. The hawksbill turtle (Eretmochelys imbricata), a Critically Endangered species, also occurs occasionally in the Mediterranean Sea (Camiñas, 2004) but would not be expected within the Levantine Basin (Kot et al., 2013).
Table 1-4. Sea turtle species potentially occurring in the Application Area. Common Name Scientific Name IUCN Status1 Nesting in Israel Loggerhead turtle Caretta caretta EN Yes
Green turtle Chelonia mydas EN Yes Leatherback turtle Dermochelys coriacea VU No
1 International Union for Conservation of Nature (IUCN) status: EN = Endangered; VU = Vulnerable.
Loggerhead turtles and green turtles nest along the Israeli coast, with the loggerhead turtle being the most common. While the primary nesting grounds for the Mediterranean loggerhead turtle population are located along the shores of Greece, Cyprus, and Turkey, the Israeli coast has also provided habitat for hundreds of nests. Nesting starts at the end of May for loggerhead turtles and in mid-June for green turtles, continuing until the end of July and mid-August, respectively. According to data from the Israel National Parks Authority, there were 98 loggerhead turtle nests in 2009, 132 in 2010, and 139 in 2011; and there were 17 green turtle nests in 2009, 10 in 2010, and 25 in 2011 (Levy, 2011).
1.2.3.6 Seabirds and Migratory Birds
There are no site-specific bird data from the Application Area. However, the Mediterranean is home to several hundred bird species, many of which could occur in the area. This discussion includes seabirds as well as migratory birds that pass through the area.
At least 38 seabird species are native to Israeli waters (Table 1-5), including 36 seabird species listed by BirdLife International (2014a) and 2 other species based on additional information (International Union for Conservation of Nature, 2014; Palomares and Pauly, 2014). Because the Application Area

Tamar Field Development Project EIA 68 Noble Energy Mediterranean Ltd March 2016 CSA-Noble-FL-16-2650-08-REP-01-FIN-REV04
is more than 100 km offshore, the avifauna is likely to consist mainly of pelagic seabirds – those that spend most of their life cycle in the marine environment, often far offshore over the open ocean. Examples of pelagic seabirds native to Israeli waters include Cory’s Shearwater (Calonectris diomedea), Leach’s Storm-Petrel (Oceanodroma leucorhoa), Sooty Shearwater (Puffinus griseus), and Levantine Shearwater (Puffinus yelkouan). Other seabirds, including various species of gulls, terns, pelicans, and cormorants, could occur in the Application Area but are likely to be more abundant in coastal waters.
Two of the seabirds listed in Table 1-5 are Vulnerable according to the IUCN (2014) Red List. The Levantine Shearwater is endemic to the Mediterranean Basin, but its precise distribution is not well known and numbers are disputed (Bourgeois and Vidal, 2008). The main breeding colonies are in the central and eastern basin of the Mediterranean, from Corsica and Sardinia through the central Mediterranean, the Adriatic, and the Aegean (International Union for Conservation of Nature, 2014). There is no reported breeding in Israel. The Dalmatian Pelican (Pelecanus crispus) breeds in eastern Europe and east-central Asia; there is no reported breeding in Israel.
Several of the pelagic seabird species in Table 1-5 are listed in Annex II of the Protocol Concerning Specially Protected Areas and Biological Diversity of the Mediterranean (United Nations Environment Programme, 2013) as Endangered or threatened avifauna of the Mediterranean region. These include Cory’s Shearwater, Slender-billed Gull (Larus genei), Dalmatian Pelican, Great White Pelican (Pelecanus onocrotalus), Pygmy Cormorant (Phalacrocorax pygmeus), Levantine Shearwater, Little Tern (Sterna albifrons), Lesser Crested Tern (Sterna bengalensis), Caspian Tern (Sterna caspia), Gull-billed Tern (Sterna nilotica), and Sandwich Tern (Sterna sandvicensis). Two of these, the Great White Pelican and Little Tern, breed in Israel; their IUCN status is Least Concern.
Annex II also includes several shorebirds reported from Israel as listed in Table 1-6. The Slender-billed Curlew (Numenius tenuirostris), is listed by the IUCN as Critically Endangered but is considered a vagrant species in Israel and does not breed there. None of these species are likely to be present in the Application Area.
Israel is well known as one of two major bird migratory pathways in the Mediterranean region, with the other being Gibraltar. Research over the past decade has shown that approximately 500 million migrating birds fly over Israel’s narrow airspace (Leshem and Atrash, 1998). The location is a “bottleneck” of the migration route for approximately 85% of the world’s White Stork (Ciconia ciconia) population, many species of birds of prey, and most of the Paleartic population of Great White Pelicans.
The Mediterranean lies along seasonal migratory pathways for several European and African bird species; several species that breed in Europe over-winter in the Mediterranean Basin. Autumn and spring are the most active times of the year for migrating birds. Many of the migratory species seasonally traverse the expanses of Europe and Asia from the high Arctic to Africa and the Indian subcontinent. Migrating shorebirds feed and reside along sandy beaches, embayments, shallow tidal flats, and brackish ponds. Mudflats are the often the last refueling stopover for migratory birds traveling from their northern hemisphere breeding grounds (Siberia, Russia) on their way to their southern hemisphere wintering grounds before crossing the thousands kilometers of Arabian desert. The areas also provide a respite for these flying migrants on their way back.
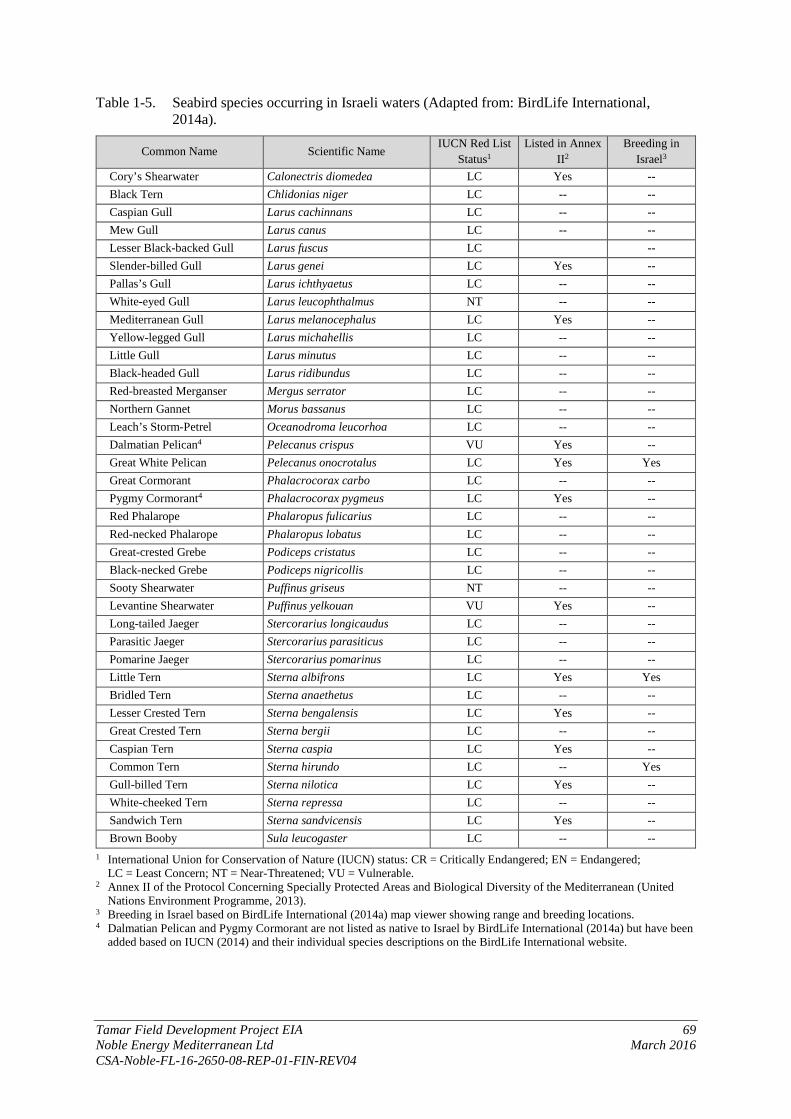
Tamar Field Development Project EIA 69 Noble Energy Mediterranean Ltd March 2016 CSA-Noble-FL-16-2650-08-REP-01-FIN-REV04
Table 1-5. Seabird species occurring in Israeli waters (Adapted from: BirdLife International, 2014a).
Common Name Scientific Name IUCN Red List
Status1 Listed in Annex
II2 Breeding in
Israel3 Cory’s Shearwater Calonectris diomedea LC Yes -- Black Tern Chlidonias niger LC -- -- Caspian Gull Larus cachinnans LC -- -- Mew Gull Larus canus LC -- -- Lesser Black-backed Gull Larus fuscus LC -- Slender-billed Gull Larus genei LC Yes -- Pallas’s Gull Larus ichthyaetus LC -- -- White-eyed Gull Larus leucophthalmus NT -- -- Mediterranean Gull Larus melanocephalus LC Yes -- Yellow-legged Gull Larus michahellis LC -- -- Little Gull Larus minutus LC -- -- Black-headed Gull Larus ridibundus LC -- -- Red-breasted Merganser Mergus serrator LC -- -- Northern Gannet Morus bassanus LC -- -- Leach’s Storm-Petrel Oceanodroma leucorhoa LC -- -- Dalmatian Pelican4 Pelecanus crispus VU Yes -- Great White Pelican Pelecanus onocrotalus LC Yes Yes Great Cormorant Phalacrocorax carbo LC -- -- Pygmy Cormorant4 Phalacrocorax pygmeus LC Yes -- Red Phalarope Phalaropus fulicarius LC -- -- Red-necked Phalarope Phalaropus lobatus LC -- -- Great-crested Grebe Podiceps cristatus LC -- -- Black-necked Grebe Podiceps nigricollis LC -- -- Sooty Shearwater Puffinus griseus NT -- -- Levantine Shearwater Puffinus yelkouan VU Yes -- Long-tailed Jaeger Stercorarius longicaudus LC -- -- Parasitic Jaeger Stercorarius parasiticus LC -- -- Pomarine Jaeger Stercorarius pomarinus LC -- -- Little Tern Sterna albifrons LC Yes Yes Bridled Tern Sterna anaethetus LC -- -- Lesser Crested Tern Sterna bengalensis LC Yes -- Great Crested Tern Sterna bergii LC -- -- Caspian Tern Sterna caspia LC Yes -- Common Tern Sterna hirundo LC -- Yes Gull-billed Tern Sterna nilotica LC Yes -- White-cheeked Tern Sterna repressa LC -- -- Sandwich Tern Sterna sandvicensis LC Yes -- Brown Booby Sula leucogaster LC -- --
1 International Union for Conservation of Nature (IUCN) status: CR = Critically Endangered; EN = Endangered; LC = Least Concern; NT = Near-Threatened; VU = Vulnerable.
2 Annex II of the Protocol Concerning Specially Protected Areas and Biological Diversity of the Mediterranean (United Nations Environment Programme, 2013).
3 Breeding in Israel based on BirdLife International (2014a) map viewer showing range and breeding locations. 4 Dalmatian Pelican and Pygmy Cormorant are not listed as native to Israel by BirdLife International (2014a) but have been
added based on IUCN (2014) and their individual species descriptions on the BirdLife International website.

Tamar Field Development Project EIA 70 Noble Energy Mediterranean Ltd March 2016 CSA-Noble-FL-16-2650-08-REP-01-FIN-REV04
Table 1-6. Shorebird species occurring in Israel that are on the Annex II list.
Common Name Scientific Name IUCN Red List
Status1 Israel Occurrence2
Breeding in Israel3
Kentish Plover Charadrius alexandrinus LC Native No
Greater Sand Plover Charadrius leschenaultii columbinus
LC Native No
Pied Kingfisher Ceryle rudis LC Native Yes White-throated Kingfisher
Halcyon smyrnensis LC Native Yes
Slender-billed Curlew Numenius tenuirostris CR Vagrant No Osprey Pandion haliaetus LC Native No Eleonora’s Falcon Falco eleonorae LC Native No
1 International Union for Conservation of Nature (IUCN) status: CR = Critically Endangered; EN = Endangered; LC = Least Concern; NT = Near-Threatened; VU = Vulnerable. 2 Occurrence in Israel based on IUCN (2014). 3 Breeding in Israel based on BirdLife International (2014a) map viewer showing range and breeding locations.
BirdLife International (2014b) lists 315 migratory bird species as occurring in Israel. Of these, species listed by the IUCN (2014) as Endangered, Critically Endangered, or Vulnerable are: Basra Reed-warbler (Acrocephalus griseldis), Greater Spotted Eagle (Aquila clanga), Eastern Imperial Eagle (Aquila heliaca), Houbara Bustard (Chlamydotis undulata), Saker Falcon (Falco cherrug), Northern Bald Ibis (Geronticus eremita), Marbled Teal (Marmaronetta angustirostris), Egyptian Vulture (Neophron percnopterus), White-headed Duck (Oxyura leucocephala), Dalmatian Pelican, Yelkouan Shearwater (Puffinus yelkouan), Syrian Serin (Serinus syriacus), and Sociable Lapwing (Vanellus gregarius).
1.2.4 Seawater and Sediment Quality
1.2.4.1 Seawater Quality
This section reviews the Tamar Field portion of the results from the February 2014 Tamar Field Background Monitoring Survey and the March 2013 Tamar Field and Pipeline Survey (CSA Ocean Sciences Inc., 2014). As for the water column profiles, results from the February 2014 Survey are presented first because they constitute a more complete picture of the environmental conditions within the Tamar Field.
Total Suspended Solids
February 2014 Tamar Field Background Monitoring Survey
Total suspended solids (TSS) concentrations averaged 6.7 ± 1.6 mg L-1 in the near-surface, 5.2 ± 0.6 mg L-1 at mid-depth, and 5.7 ± 0.8 mg L-1 at the near-bottom during the February 2014 Survey. Values generally were similar among the four water stations located on the perimeter of the field and the station located in the center of the field (Table 1-7).

Tamar Field Development Project EIA 71 Noble Energy Mediterranean Ltd March 2016 CSA-Noble-FL-16-2650-08-REP-01-FIN-REV04
Table 1-7. Station concentrations of total suspended solids (TSS) in seawater samples collected throughout the water column during the February 2014 Tamar Field Background Monitoring Survey (From: CSA Ocean Sciences Inc., 2014).
Location Station Depth TSS (mg L-1)
Perimeter of Tamar Field
B08 Near-Surface 5.8 Mid-Depth 5.3
Near-Bottom 6.0
C01 Near-Surface 7.1 Mid-Depth 4.1
Near-Bottom 6.2
D17 Near-Surface 5.7 Mid-Depth 5.3
Near-Bottom 4.7
H09 Near-Surface 5.6 Mid-Depth 5.4
Near-Bottom 4.9
Center of Tamar Field
E11 Near-Surface 9.3 Mid-Depth 5.7
Near-Bottom 6.6
March 2013 Tamar Field and Pipeline Survey
TSS concentrations at the near-bottom averaged 13.4 ± 22.0 mg L-1 during the March 2013 Tamar Field and Pipeline Survey. The high TSS concentration at Station TF1 (72.0 mg L-1) was likely due to the resuspension of sediments near the seafloor due to ROV operations (Table 1-8). The removal of this station decreases the near-bottom average to 6.1 ± 1.3 mg L-1, which is within one standard deviation of the February 2014 Survey results.
Table 1-8. Station concentrations of total suspended solids (TSS) in seawater samples collected from near-bottom water during the March 2013 Tamar Field and Pipeline Survey (From: CSA Ocean Sciences Inc., 2014).
Station TSS (mg L-1) TF1 72.0 TF2 7.8 TF3 7.2 TF4 7.4 TF5 5.6 TF6 4.3 TF7 4.9 TF8 6.1 TF9 5.6
Similarity in TSS Concentrations Between Surveys
TSS concentrations in the near-bottom samples generally were similar among stations and surveys (Table 1-9). Concentrations from within the Tamar Field were slightly higher (0.4 to 0.9 mg L-1) than stations located at the perimeter of the field; however, all values were well below the Levantine Basin

Tamar Field Development Project EIA 72 Noble Energy Mediterranean Ltd March 2016 CSA-Noble-FL-16-2650-08-REP-01-FIN-REV04
mean concentrations. This indicates that TSS concentrations within the Tamar Field are uniform geographically as well as temporally.
Similar to previous surveys, TSS levels recorded from the survey area were higher than those reported for northeastern Mediterranean surface waters, which have been reported to range from 0.6 to 1.7 mg L-1 (Yilmaz et al., 1998). The eastern Mediterranean Sea is known as a highly oligotrophic body of water with high water column transparency. Historically, the low TSS levels and high water transparency expected in the eastern Mediterranean Sea are attributed to low water column productivity and low terrestrial inputs from riverine discharges. Deepsea near-bottom water generally has few suspended solids due to few disturbances stirring up the sediment on the seafloor; small particles transported from the surface usually are entrained in subsurface currents or pycnoclines (i.e., density gradient).
Table 1-9. Mean concentrations (± standard deviation) of total suspended solids (TSS) in seawater samples collected during the March 2013 Tamar Field and Pipeline Survey and the February 2014 Tamar Field Background Monitoring Survey. Levantine Basin means are provided for comparison (From: CSA Ocean Sciences Inc., 2014).
Survey Location Depth TSS (mg L-1) March 2013 Inside Tamar Field* Near-Bottom 6.1 ± 1.3
February 2014
Perimeter of Tamar Field Near-Surface 6.7 ± 1.6 Mid-Depth 5.2 ± 0.6
Near-Bottom 5.7 ± 0.8 Center of Tamar Field Near-Surface 9.3
Center of Tamar Field (continued) Mid-Depth 5.7
Near-Bottom 6.6
Levantine Basin Mean** Near-Surface 9.8 ± 7.7 Mid-Depth 9.9 ± 7.1
Near-Bottom 9.6 ± 8.2 *The anomalous high TSS concentration for TF1 has been removed from the mean and standard deviation because the result was due to sampling error. **Mean and standard deviation calculated from pre-drill and environmental baseline surveys conducted by CSA prior to September 2013.
Nutrients
Seawater nutrient analysis consisted of total organic carbon (TOC), total nitrogen (TN), total phosphorus (TP), nitrite, nitrate, ammonium, and phosphate during the February 2014 Tamar Field Background Monitoring Survey. Only TN and TP were analyzed during the March 2013 Tamar Field and Pipeline Survey.
February 2014 Tamar Field Background Monitoring Survey
Nutrient concentrations in seawater samples were low and nearly uniform throughout the water column and survey area (Table 1-10). TOC concentrations were slightly higher in the near-surface (0.70 ± 0.10 mg L-1) than in the near-bottom (0.51 ± 0.08 mg L-1). TN concentrations were slightly higher in the mid-depth (0.17 ± 0.01 mg L-1) than in the near-surface (0.12 ± 0.01 mg L-1) or in the near-bottom (0.15 ± 0.01 mg L-1). Concentrations of nitrite, nitrate, TP, and phosphate were negligible throughout the survey region. There was no appreciable difference between stations located at the perimeter of the reservoir and the station located at the center of the field.

Tamar Field Development Project EIA 73 Noble Energy Mediterranean Ltd March 2016 CSA-Noble-FL-16-2650-08-REP-01-FIN-REV04
Table 1-10. Station concentrations of total organic carbon (TOC), total nitrogen (TN), nitrite (NO2), nitrate (NO3), ammonium (NH4), total phosphorus (TP), and phosphate (PO4) in seawater samples collected throughout the water column during the February 2014 Tamar Field Background Monitoring Survey (From: CSA Ocean Sciences Inc., 2014).
Location Station Depth Concentration (mg L-1)
TOC TN NO2 NO3 NH4 TP PO4
Perimeter of Tamar Field
B08 Near-Surface 0.65 0.12 0.0007 0.035 0.001 0.010 0.003 Mid-Depth 0.47 0.16 0.0007 0.081 0.001 0.015 0.008
Near-Bottom 0.49 0.17 0.0007 0.075 0.001 0.011 0.007
C01 Near-Surface 0.87 0.11 0.0007 0.039 0.001 0.007 0.004 Mid-Depth 0.72 0.18 0.0007 0.080 0.001 0.016 0.007
Near-Bottom 0.63 0.16 0.0007 0.072 0.001 0.012 0.007
D17 Near-Surface 0.69 0.11 0.0007 0.065 0.001 0.007 0.006 Mid-Depth 0.55 0.15 0.0007 0.074 0.001 0.011 0.007
Near-Bottom 0.41 0.14 0.0007 0.023 0.001 0.012 0.003
H09 Near-Surface 0.62 0.13 0.0008 0.040 0.001 0.010 0.004 Mid-Depth 0.50 0.17 0.0007 0.070 0.003 0.019 0.007
Near-Bottom 0.48 0.14 0.0008 0.063 0.001 0.013 0.007
Center of Tamar Field
E11 Near-Surface 0.68 0.14 0.0007 0.033 0.001 0.009 0.004 Mid-Depth 0.48 0.17 0.0007 0.073 0.001 0.012 0.007
Near-Bottom 0.54 0.15 0.0007 0.067 0.001 0.013 0.007
March 2013 Tamar Field and Pipeline Survey
Near-bottom nutrient concentrations during the March 2013 Tamar Field and Pipeline Survey were low and uniform throughout the survey area (Table 1-11). TN concentrations averaged 0.17 ± 0.04 mg L-1, while TP concentrations averaged 0.01 ± 0.002 mg L-1.
Table 1-11. Station concentrations of total nitrogen (TN) and total phosphorus (TP) in seawater samples collected near the seafloor during the March 2013 Tamar Field and Pipeline Survey (From: CSA Ocean Sciences Inc., 2014).
Station TN (mg L-1) TP (mg L-1) TF1 0.20 0.009 TF2 0.13 0.012 TF3 0.14 0.013 TF4 0.14 0.013 TF5 0.26 0.009 TF6 0.14 0.009 TF7 0.16 0.009 TF8 0.17 0.011 TF9 0.20 0.011
Similarity in Nutrient Concentrations Between Surveys
Concentrations of TN and TP were similar between the two surveys (Table 1-12). TOC, nitrite, nitrate, ammonium, and phosphate were not analyzed during the March 2013 Tamar Field and Pipeline Survey; therefore no comparison can be made regarding these five nutrients. All nutrient concentrations generally were similar regardless of whether the sample was collected inside the field or the perimeter. This indicates that like other water column constituents discussed previously,
Tamar Field Development Project EIA 74 Noble Energy Mediterranean Ltd March 2016 CSA-Noble-FL-16-2650-08-REP-01-FIN-REV04
TSS concentrations within the Tamar Field are uniform geographically as well as temporally. Concentrations of all nutrients were also well below the Levantine Basin mean and the proposed Mediterranean Sea water quality standards in Israel (MEQS).
The eastern Levantine Basin has extremely low levels of nutrients, and the region is considered “ultra-oligotrophic.” Nitrate and phosphate concentrations in surface waters in the eastern Mediterranean are one-half their concentrations in the western basin (Bethoux et al., 1992). This severe nutrient deficit in the Mediterranean Sea is because the distant Atlantic Ocean inflow brings in nutrient-depleted surface waters and there is very little nutrient input from rivers in the eastern Levantine Basin (Krom, 1995).
TOC in the form of carbohydrates, oils, proteins, and amino acids is a natural component of the water column in the marine environment, typically resulting from the mineralization of organic matter and biological activity. Generally, TOC levels are the net result of mineralization of organic matter (i.e., transformation of organic material to inorganic forms), uptake and respiration (oxidation into carbon dioxide) by microorganisms, and releases from organisms in the water column.

Tamar Field Development Project EIA 75 Noble Energy Mediterranean Ltd March 2016 CSA-Noble-FL-16-2650-08-REP-01-FIN-REV04
Table 1-12. Mean concentrations (± standard deviation) of total organic carbon (TOC), total nitrogen (TN), nitrite (NO2), nitrate (NO3), total phosphorus (TP), and phosphate (PO4) in seawater samples collected during the March 2013 Tamar Field and Pipeline Survey and the February 2014 Tamar Field Background Monitoring Survey. Mean (± standard deviation) Levantine Basin baseline survey data and the proposed Mediterranean Sea water quality standards (MEQS) in Israel are provided for comparison (Ministry of Environmental Protection, 2002). Levantine Basin mean and standard deviation is calculated from pre-drill and environmental baseline surveys conducted prior to September 2013 (From: CSA Ocean Sciences Inc., 2014).
Survey Location Depth Concentration (mg L-1)
TOC TN NO2 NO3 NH4 TP PO4
March 2013 Inside
Tamar Field Near-Bottom N/A 0.17 ± 0.01 N/A N/A N/A 0.011 ± 0.002 N/A
February 2014
Perimeter of Tamar Field
Near-Surface 0.71 ± 0.11 0.12 ± 0.01 0.001 ± 0.000 0.045 ± 0.013 0.001 ± 0.000 0.008 ± 0.002 0.004 ± 0.001 Mid-Depth 0.56 ± 0.11 0.17 ± 0.01 0.001 ± 0.000 0.076 ± 0.005 0.002 ± 0.001 0.015 ± 0.003 0.007 ± 0.000
Near-Bottom 0.50 ± 0.09 0.15 ± 0.01 0.001 ± 0.000 0.058 ± 0.024 0.001 ± 0.000 0.012 ± 0.001 0.006 ± 0.001
Center of Tamar Field
Near-Surface 0.68 0.14 0.0007 0.033 0.001 0.009 0.004 Mid-Depth 0.48 0.17 0.0007 0.073 0.001 0.012 0.007
Near-Bottom 0.54 0.15 0.0007 0.067 0.001 0.013 0.007
Levantine Basin Mean Near-Surface 1.72 ± 0.14 0.44 ± 0.49 N/A N/A N/A 0.008 ± 0.004 N/A Mid-Depth 0.89 ± 0.22 0.48 ± 0.47 N/A N/A N/A 0.014 ± 0.002 N/A
Near-Bottom 0.84 ± 0.14 0.48 ± 0.48 N/A N/A N/A 0.011 ± 0.002 N/A Proposed MEQS in Israel N/A 1.0 N/A N/A 0.5 0.1 N/A
N/A = data not available.

Tamar Field Development Project EIA 76 Noble Energy Mediterranean Ltd March 2016 CSA-Noble-FL-16-2650-08-REP-01-FIN-REV04
Ions
Cation and anion concentrations were analyzed only in seawater samples from the February 2014 Tamar Field Background Monitoring Survey. Ions were not included in the analysis of seawater samples collected during the March 2013 Tamar Field and Pipeline Survey.
Results of major ion composition analysis in seawater samples collected from several stations in the Tamar Field are presented in Figure 1-51 and Table 1-13. The cation/anion balance for all water samples are within the acceptable ±5% analytical difference for seawater samples (Table 1-13 and Figure 1-52). All ion concentrations were similar to worldwide and Mediterranean Sea means with the exception of sulfate, which was slightly elevated over Mediterranean Sea means at a few locations (Table 1-13). Sulfate is a major component of seawater, accounting for approximately 8% of its ionic composition; in the Tamar Field, it accounts for 7% to 10% of the ionic composition of seawater. The two stations with the highest sulfate concentrations occur in the near-surface or mid-depth, indicating that these slightly higher than average levels are unlikely to be due to drilling and/or production activities occurring in the field.
Figure 1-51. Ionic concentration and composition of seawater collected from near-surface,
mid-depth, and near-bottom within the Tamar Field. Shades of blue represent anion concentrations (chloride, sulfate, bicarbonate); shades of green represent cation concentrations (sodium, magnesium, calcium, potassium, strontium) (From: CSA Ocean Sciences Inc., 2014).
0
5,000
10,000
15,000
20,000
25,000
30,000
35,000
40,000
Near-Surface Mid-depth Near-Bottom
Ions
(mg/
L)
strontium
potassium
calcium
magnesium
sodium
bicarbonate
sulfate
chloride

Tamar Field Development Project EIA 77 Noble Energy Mediterranean Ltd March 2016 CSA-Noble-FL-16-2650-08-REP-01-FIN-REV04
Table 1-13. Major ion composition and ionic balance of seawater samples collected within the Tamar Field (From: CSA Ocean Sciences Inc., 2014).
Location Station Depth Anions (mg L-1) Cations (mg L-1) Ionic Balance
Chloride Sulfate Bicarbonate Sodium Magnesium Calcium Potassium Strontium Anion (meq L-1)
Cation (meq L-1)
Difference (%)
Perimeter of Tamar Field
B08
Near-Surface 21,800 3,250 132 11,200 1,390 466 441 8.36 685.24 636.12 3.70
Mid-Depth 20,100 2,580 127 10,900 1,350 443 427 7.98 623.23 618.27 0.40
Near-Bottom 21,100 2,480 131 11,400 1,380 468 441 8.45 649.44 644.09 0.40
C01
Near-Surface 21,300 2,570 129 11,000 1,350 455 432 8.24 656.92 623.35 2.60
Mid-Depth 20,500 2,910 129 11,300 1,380 460 442 8.26 641.43 639.56 0.10
Near-Bottom 21,100 2,710 128 11,500 1,410 463 451 8.32 654.17 651.11 0.20
D17
Near-Surface 19,700 3,750 121 10,800 1,320 433 425 7.77 636.19 611.08 2.00
Mid-Depth 19,300 2,700 120 10,200 1,250 422 399 7.49 603.03 578.00 2.10
Near-Bottom 20,100 2,980 124 10,900 1,340 442 429 7.94 631.50 617.63 1.10
H09
Near-Surface 19,900 2,790 128 11,100 1,360 454 434 8.17 621.98 628.71 0.50
Mid-Depth 20,500 2,910 127 11,000 1,350 457 432 8.21 641.39 623.63 1.40
Near-Bottom 18,100 2,530 126 10,800 1,320 449 423 8.11 565.75 611.83 3.90
Center of Tamar Field
E11
Near-Surface 21,300 3,130 128 10,900 1,340 457 429 8.26 668.56 618.39 3.90
Mid-Depth 21,100 3,610 129 11,300 1,380 465 437 8.24 672.93 639.68 2.50
Near-Bottom 21,400 3,110 131 11,600 1,410 459 454 8.23 671.02 655.33 1.20
Worldwide Mean1 19,000 2,649 140 10,556 1,272 400 380 13 N/A N/A N/A
Mediterranean Sea Mean2 21,200 2,950 120 – 1613 11,800 1,403 423 463 5 – 7.53 N/A N/A N/A
N/A = not available. 1 Libes, 2011. 2 Al-Mutaz, 2000. 3 Millero, 2005.

Tamar Field Development Project EIA 78 Noble Energy Mediterranean Ltd March 2016 CSA-Noble-FL-16-2650-08-REP-01-FIN-REV04
Figure 1-52. Means (± standard deviation) of the sum of anions and cations in seawater collected
from the near-surface, mid-depth, and near-bottom within the Tamar Field. The percent difference between anions and cations in water samples are all below the ±5% threshold for analytical acceptability (From: CSA Ocean Sciences Inc., 2014).
Metals
Total and dissolved metals concentrations in seawater were analyzed by ALS Environmental in Kelso, Washington, U.S. for the February 2014 Tamar Field Background Monitoring Survey. Total metals concentrations in seawater were analyzed by Geological Survey of Israel in Jerusalem, Israel for the March 2013 Tamar Field and Pipeline Survey. Dissolved metals were not analyzed from the March 2013 Survey.
February 2014 Tamar Field Background Monitoring Survey
Total and dissolved metals concentrations in seawater were either below or just above the method reporting limit for the analytical laboratory (Tables 1-14 and 1-15). Values were similar among the four water stations located on the perimeter of the field and the station located in the center of the field. Concentrations generally were similar between total and dissolved metals fractions. This indicates that metals concentrations, when detectable, will be bio-available.
Dissolved zinc concentrations were higher than total zinc concentrations (Tables 1-14 and 1-15), which is contrary to what would be expected. The equipment and field blanks (composed of deionized water) for total zinc had concentrations of 1.0 and 7.6 µg/L, respectively. The equipment and field blanks for dissolved zinc concentrations were 2.5 and 8.3 µg L-1, respectively. The zinc concentrations in the field blanks were relatively high for both the total and dissolved fraction. While this does not explain why the dissolved fraction was higher than the total fraction, it does suggest a potential source of zinc contamination that may have affected the results.
March 2013 Tamar Field and Pipeline Survey
Total metals concentrations in seawater were below the method reporting limit for the analytical laboratory, except for barium, which had a low concentration at each station (Table 1-16).
540
560
580
600
620
640
660
680
700
Near-Surface Mid-Depth Near-Bottom
meq
/LAnions
Cations
2.3%difference
1.3%difference
0.1%difference

Tamar Field Development Project EIA 79 Noble Energy Mediterranean Ltd March 2016 CSA-Noble-FL-16-2650-08-REP-01-FIN-REV04
Similarity in Metals Concentrations Between Surveys
Mean (± standard deviation) metals concentrations for the March 2013 Tamar Field and Pipeline Survey and the February 2014 Tamar Field Background Monitoring Survey are reported in Table 1-17. Table 1-17 also compares these values to Israel’s MEQS (Ministry of Environmental Protection, 2002), European Union Commission on Environmental Quality Standards (EUCEQS) for priority substances in the field of water policy (Directive 2008/105/EC and proposed amendment COM(2011)876), and toxicity reference values (marine Criterion Continuous Concentrations [CCCs] from Buchman, 2008). Where the U.S. Environmental Protection Agency’s (USEPA’s) National Recommended Water Quality Criteria (Buchman, 2008) are not available for a metal, criteria from other countries (e.g., New Zealand) are provided for reference. All seawater total and dissolved metals concentrations were below Israel’s MEQS, EUCEQS, and CCC reference values, indicating there are no seawater metals concentrations of concern within the region. Metals concentrations were also similar to concentrations reported elsewhere within the Levantine Basin (Table 1-17). Similarity among surveys and locations indicates that metals concentrations, when detected, are bio-available dissolved fractions and that concentrations are uniform geographically as well as temporally within the Tamar Field.
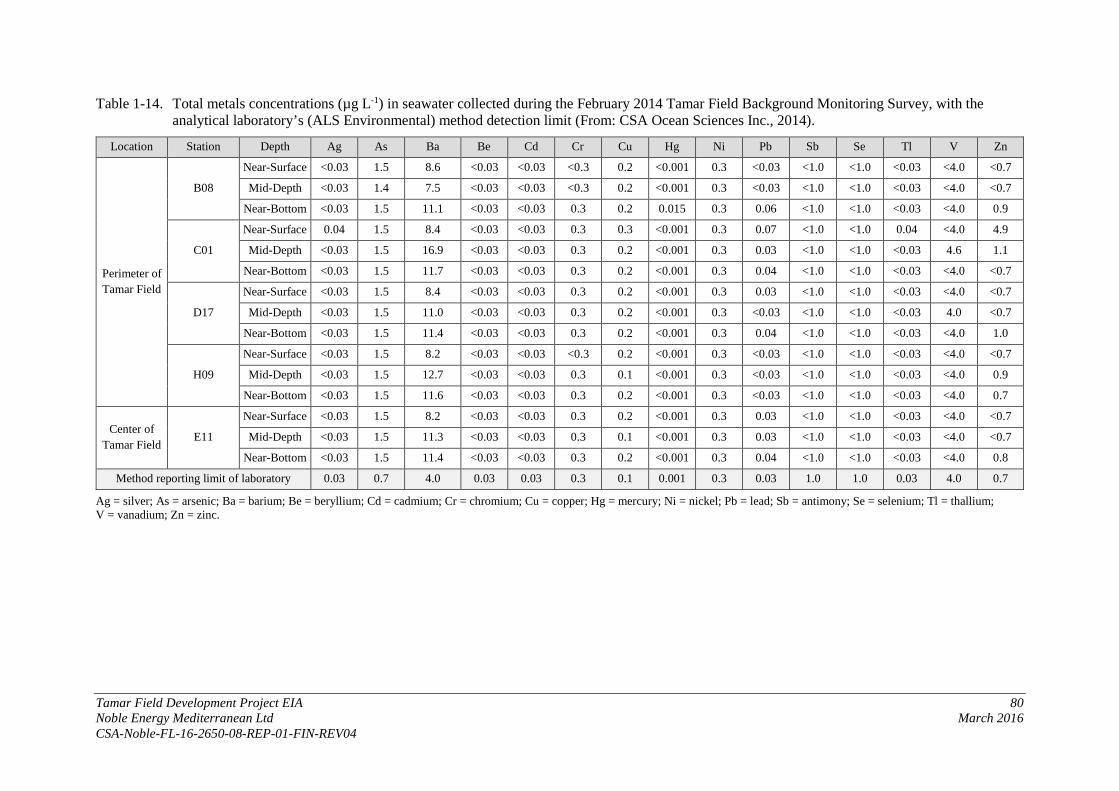
Tamar Field Development Project EIA 80 Noble Energy Mediterranean Ltd March 2016 CSA-Noble-FL-16-2650-08-REP-01-FIN-REV04
Table 1-14. Total metals concentrations (µg L-1) in seawater collected during the February 2014 Tamar Field Background Monitoring Survey, with the analytical laboratory’s (ALS Environmental) method detection limit (From: CSA Ocean Sciences Inc., 2014).
Location Station Depth Ag As Ba Be Cd Cr Cu Hg Ni Pb Sb Se Tl V Zn
Perimeter of Tamar Field
B08
Near-Surface <0.03 1.5 8.6 <0.03 <0.03 <0.3 0.2 <0.001 0.3 <0.03 <1.0 <1.0 <0.03 <4.0 <0.7
Mid-Depth <0.03 1.4 7.5 <0.03 <0.03 <0.3 0.2 <0.001 0.3 <0.03 <1.0 <1.0 <0.03 <4.0 <0.7
Near-Bottom <0.03 1.5 11.1 <0.03 <0.03 0.3 0.2 0.015 0.3 0.06 <1.0 <1.0 <0.03 <4.0 0.9
C01
Near-Surface 0.04 1.5 8.4 <0.03 <0.03 0.3 0.3 <0.001 0.3 0.07 <1.0 <1.0 0.04 <4.0 4.9
Mid-Depth <0.03 1.5 16.9 <0.03 <0.03 0.3 0.2 <0.001 0.3 0.03 <1.0 <1.0 <0.03 4.6 1.1
Near-Bottom <0.03 1.5 11.7 <0.03 <0.03 0.3 0.2 <0.001 0.3 0.04 <1.0 <1.0 <0.03 <4.0 <0.7
D17
Near-Surface <0.03 1.5 8.4 <0.03 <0.03 0.3 0.2 <0.001 0.3 0.03 <1.0 <1.0 <0.03 <4.0 <0.7
Mid-Depth <0.03 1.5 11.0 <0.03 <0.03 0.3 0.2 <0.001 0.3 <0.03 <1.0 <1.0 <0.03 4.0 <0.7
Near-Bottom <0.03 1.5 11.4 <0.03 <0.03 0.3 0.2 <0.001 0.3 0.04 <1.0 <1.0 <0.03 <4.0 1.0
H09
Near-Surface <0.03 1.5 8.2 <0.03 <0.03 <0.3 0.2 <0.001 0.3 <0.03 <1.0 <1.0 <0.03 <4.0 <0.7
Mid-Depth <0.03 1.5 12.7 <0.03 <0.03 0.3 0.1 <0.001 0.3 <0.03 <1.0 <1.0 <0.03 <4.0 0.9
Near-Bottom <0.03 1.5 11.6 <0.03 <0.03 0.3 0.2 <0.001 0.3 <0.03 <1.0 <1.0 <0.03 <4.0 0.7
Center of Tamar Field
E11
Near-Surface <0.03 1.5 8.2 <0.03 <0.03 0.3 0.2 <0.001 0.3 0.03 <1.0 <1.0 <0.03 <4.0 <0.7
Mid-Depth <0.03 1.5 11.3 <0.03 <0.03 0.3 0.1 <0.001 0.3 0.03 <1.0 <1.0 <0.03 <4.0 <0.7
Near-Bottom <0.03 1.5 11.4 <0.03 <0.03 0.3 0.2 <0.001 0.3 0.04 <1.0 <1.0 <0.03 <4.0 0.8
Method reporting limit of laboratory 0.03 0.7 4.0 0.03 0.03 0.3 0.1 0.001 0.3 0.03 1.0 1.0 0.03 4.0 0.7
Ag = silver; As = arsenic; Ba = barium; Be = beryllium; Cd = cadmium; Cr = chromium; Cu = copper; Hg = mercury; Ni = nickel; Pb = lead; Sb = antimony; Se = selenium; Tl = thallium; V = vanadium; Zn = zinc.
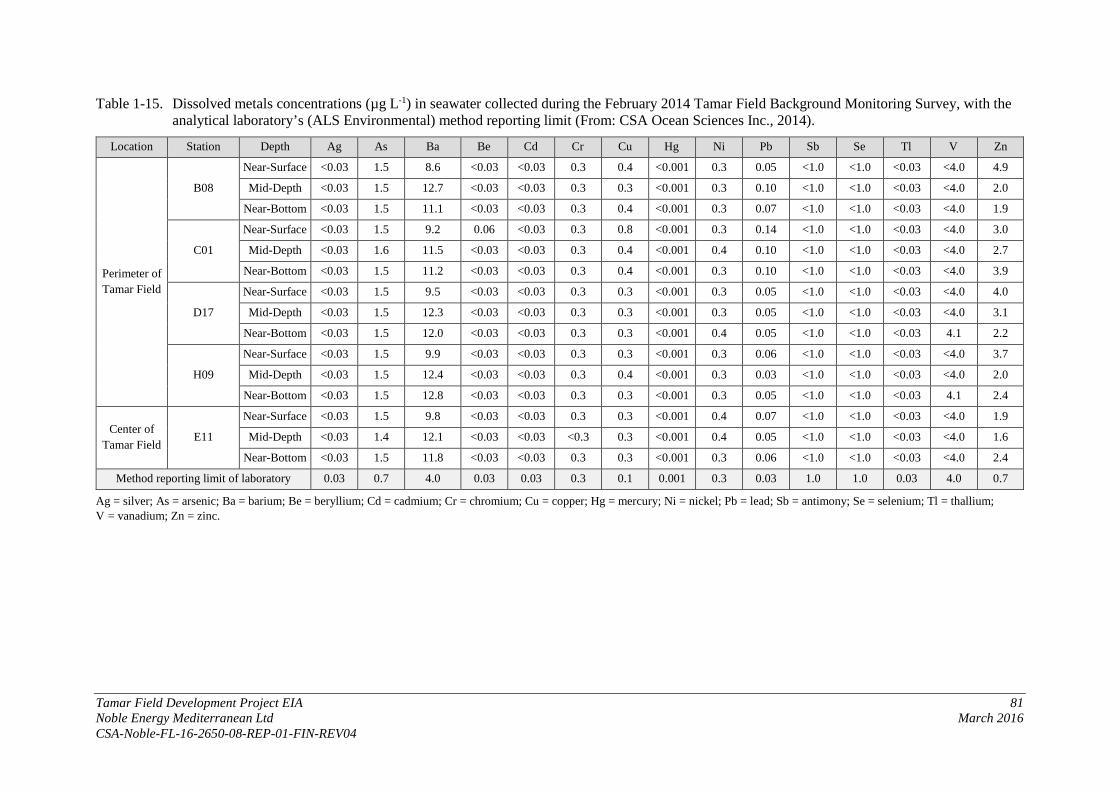
Tamar Field Development Project EIA 81 Noble Energy Mediterranean Ltd March 2016 CSA-Noble-FL-16-2650-08-REP-01-FIN-REV04
Table 1-15. Dissolved metals concentrations (µg L-1) in seawater collected during the February 2014 Tamar Field Background Monitoring Survey, with the analytical laboratory’s (ALS Environmental) method reporting limit (From: CSA Ocean Sciences Inc., 2014).
Location Station Depth Ag As Ba Be Cd Cr Cu Hg Ni Pb Sb Se Tl V Zn
Perimeter of Tamar Field
B08
Near-Surface <0.03 1.5 8.6 <0.03 <0.03 0.3 0.4 <0.001 0.3 0.05 <1.0 <1.0 <0.03 <4.0 4.9
Mid-Depth <0.03 1.5 12.7 <0.03 <0.03 0.3 0.3 <0.001 0.3 0.10 <1.0 <1.0 <0.03 <4.0 2.0
Near-Bottom <0.03 1.5 11.1 <0.03 <0.03 0.3 0.4 <0.001 0.3 0.07 <1.0 <1.0 <0.03 <4.0 1.9
C01
Near-Surface <0.03 1.5 9.2 0.06 <0.03 0.3 0.8 <0.001 0.3 0.14 <1.0 <1.0 <0.03 <4.0 3.0
Mid-Depth <0.03 1.6 11.5 <0.03 <0.03 0.3 0.4 <0.001 0.4 0.10 <1.0 <1.0 <0.03 <4.0 2.7
Near-Bottom <0.03 1.5 11.2 <0.03 <0.03 0.3 0.4 <0.001 0.3 0.10 <1.0 <1.0 <0.03 <4.0 3.9
D17
Near-Surface <0.03 1.5 9.5 <0.03 <0.03 0.3 0.3 <0.001 0.3 0.05 <1.0 <1.0 <0.03 <4.0 4.0
Mid-Depth <0.03 1.5 12.3 <0.03 <0.03 0.3 0.3 <0.001 0.3 0.05 <1.0 <1.0 <0.03 <4.0 3.1
Near-Bottom <0.03 1.5 12.0 <0.03 <0.03 0.3 0.3 <0.001 0.4 0.05 <1.0 <1.0 <0.03 4.1 2.2
H09
Near-Surface <0.03 1.5 9.9 <0.03 <0.03 0.3 0.3 <0.001 0.3 0.06 <1.0 <1.0 <0.03 <4.0 3.7
Mid-Depth <0.03 1.5 12.4 <0.03 <0.03 0.3 0.4 <0.001 0.3 0.03 <1.0 <1.0 <0.03 <4.0 2.0
Near-Bottom <0.03 1.5 12.8 <0.03 <0.03 0.3 0.3 <0.001 0.3 0.05 <1.0 <1.0 <0.03 4.1 2.4
Center of Tamar Field
E11
Near-Surface <0.03 1.5 9.8 <0.03 <0.03 0.3 0.3 <0.001 0.4 0.07 <1.0 <1.0 <0.03 <4.0 1.9
Mid-Depth <0.03 1.4 12.1 <0.03 <0.03 <0.3 0.3 <0.001 0.4 0.05 <1.0 <1.0 <0.03 <4.0 1.6
Near-Bottom <0.03 1.5 11.8 <0.03 <0.03 0.3 0.3 <0.001 0.3 0.06 <1.0 <1.0 <0.03 <4.0 2.4
Method reporting limit of laboratory 0.03 0.7 4.0 0.03 0.03 0.3 0.1 0.001 0.3 0.03 1.0 1.0 0.03 4.0 0.7
Ag = silver; As = arsenic; Ba = barium; Be = beryllium; Cd = cadmium; Cr = chromium; Cu = copper; Hg = mercury; Ni = nickel; Pb = lead; Sb = antimony; Se = selenium; Tl = thallium; V = vanadium; Zn = zinc.
Tamar Field Development Project EIA 82 Noble Energy Mediterranean Ltd March 2016 CSA-Noble-FL-16-2650-08-REP-01-FIN-REV04
Table 1-16. Total metals concentrations (µg L-1) in seawater collected during the March 2013 Tamar Field and Pipeline Survey, with the analytical laboratory’s (Geological Survey of Israel) method reporting limit (From: CSA Ocean Sciences Inc., 2014).
Station Ag As Ba Be Cd Cr Cu Hg Ni Pb Sb Se Tl V Zn
TF1 <0.1 <7.0 10 <0.5 <0.1 <10 <1.0 <0.02 <1.0 <0.1 <0.2 <7.0 <0.1 <10 <2.0
TF2 <0.1 <7.0 10 <0.5 <0.1 <10 <1.0 <0.02 <1.0 <0.1 <0.2 <7.0 <0.1 <10 <2.0
TF3 <0.1 <7.0 10 <0.5 <0.1 <10 <1.0 <0.02 <1.0 <0.1 <0.2 <7.0 <0.1 <10 <2.0
TF4 <0.1 <7.0 9 <0.5 <0.1 <10 <1.0 <0.02 <1.0 <0.1 <0.2 <7.0 <0.1 <10 <2.0
TF5 <0.1 <7.0 9 <0.5 <0.1 <10 <1.0 <0.02 <1.0 <0.1 <0.2 <7.0 <0.1 <10 <2.0
TF6 <0.1 <7.0 9 <0.5 <0.1 <10 <1.0 <0.02 <1.0 <0.1 <0.2 <7.0 <0.1 <10 <2.0
TF7 <0.1 <7.0 9 <0.5 <0.1 <10 <1.0 <0.02 <1.0 <0.1 <0.2 <7.0 <0.1 <10 <2.0
TF8 <0.1 <7.0 9 <0.5 <0.1 <10 <1.0 <0.02 <1.0 <0.1 <0.2 <7.0 <0.1 <10 <2.0
TF9 <0.1 <7.0 9 <0.5 <0.1 <10 <1.0 <0.02 <1.0 <0.1 <0.2 <7.0 <0.1 <10 <2.0 Method reporting limit of laboratory 0.5 7 0.2 0.5 0.1 10 1 0.02 0.1 0.1 0.2 7 0.1 10 2
Ag = silver; As = arsenic; Ba = barium; Be = beryllium; Cd = cadmium; Cr = chromium; Cu = copper; Hg = mercury; Ni = nickel; Pb = lead; Sb = antimony; Se = selenium; Tl = thallium; V = vanadium; Zn = zinc.
Tamar Field Development Project EIA 83 Noble Energy Mediterranean Ltd March 2016 CSA-Noble-FL-16-2650-08-REP-01-FIN-REV04
Table 1-17. Mean (± standard deviation) metals concentrations (µg L-1) in seawater from the March 2013 Tamar Field and Pipeline Survey and February 2014 Tamar Field Background Monitoring Survey. Comparisons are included for toxicity reference values, Criterion Continuous Concentrations [CCCs]) (Buchman, 2008), mean Levantine Basin baseline survey data, proposed Mediterranean Environmental Water Quality Standards (MEQS) in Israel (Ministry of Environmental Protection, 2002), and European Union Commission on Environmental Quality Standards (EUCEQS) for priority substances in the field of water policy (Directive 2008/105/EC and proposed amendment COM(2011)876). Beryllium, cadmium, silver, selenium, thallium, and vanadium are not included in this table because all means were less than the laboratories detection limit, and therefore less than established environmental characterization values (From: CSA Ocean Sciences Inc., 2014).
Analytical Fraction
Survey Location Depth Concentration (µg L-1)
As Ba Cr Cu Hg Ni Pb Sb Zn
Total Metals
March 2013 Inside Tamar
Field Near-Bottom <7.0 9.3 ± 0.5 <10.0 <1.0 <0.02 <1.0 <0.1 <0.2 <2.0
February 2014
Perimeter of Tamar Field
Near-Surface 1.5 ± 0.0 8.4 ± 0.2 0.3 ± 0.0 0.2 ± 0.1 0.004 ± 0.007 0.3 ± 0.0 0.05 ± 0.03 <1.0 1.5 ± 2.3
Mid-Depth 1.5 ± 0.1 12.0 ± 3.9 0.3 ± 0.0 0.2 ± 0.1 <0.001 0.3 ± 0.0 0.03 ± 0.00 <1.0 0.7 ± 0.4
Near-Bottom 1.5 ± 0.0 11.5 ± 0.3 0.3 ± 0.0 0.2 ± 0.0 <0.001 0.3 ± 0.0 0.05 ± 0.01 <1.0 0.7 ± 0.3
Center of Tamar Field
Near-Surface 1.5 8.2 0.3 0.2 <0.001 0.3 0.03 <1.0 <0.7
Mid-Depth 1.4 11.3 0.3 0.1 <0.001 0.3 0.03 <1.0 <0.7
Near-Bottom 1.5 11.4 0.3 0.2 <0.001 0.3 0.04 <1.0 0.8
Levantine Basin Mean
Near-Surface 1.31 ± 0.17 9.11 ± 1.59 0.34 ± 0.39 0.29 ± 0.11 0.5 ± 0 0.77 ± 1.02 0.07 ± 0.05 0.55 ± 0.15 7.19 ± 12.56
Mid-Depth 1.35 ± 0.15 11.8 ± 0.43 0.2 ± 0.08 0.22 ± 0.04 0.5 ± 0 1.65 ± 1.9 0.04 ± 0.02 0.6 ± 0.24 1.03 ± 0.69
Near-Bottom 1.32 ± 0.15 13.12 ± 2.27 0.18 ± 0.06 0.18 ± 0.04 0.5 ± 0 1.09 ± 0.76 0.04 ± 0.04 0.5 ± 0.0 0.98 ± 0.72
Table 1-18. (Continued).
Tamar Field Development Project EIA 84 Noble Energy Mediterranean Ltd March 2016 CSA-Noble-FL-16-2650-08-REP-01-FIN-REV04
Analytical Fraction Survey Location Depth
Concentration (µg L-1)
As Ba Cr Cu Hg Ni Pb Sb Zn
Dissolved Metals
February 2014
Perimeter of Tamar Field
Near-Surface 1.5 ± 0.0 9.3 ± 0.5 0.3 ± 0.0 0.5 ± 0.2 <0.001 0.3 ± 0.0 0.08 ± 0.04 <1.0 3.9 ± 0.8
Mid-Depth 1.5 ± 0.1 12.2 ± 0.5 0.3 ± 0.0 0.4 ± 0.1 <0.001 0.3 ± 0.1 0.07 ± 0.04 <1.0 2.5 ± 0.5
Near-Bottom 1.5 ± 0.0 11.8 ± 0.8 0.3 ± 0.0 0.4 ± 0.1 <0.001 0.3 ± 0.1 0.07 ± 0.02 <1.0 2.6 ± 0.9
Center of Tamar Field
Near-Surface 1.5 9.8 0.3 0.3 <0.001 0.4 0.07 <1.0 1.9
Mid-Depth 1.4 12.1 <0.3 0.3 <0.001 0.4 0.05 <1.0 1.6
Near-Bottom 1.5 11.8 0.3 0.3 <0.001 0.3 0.06 <1.0 2.4
Levantine Basin Mean
Near-Surface 1.27 ± 0.08 8.98 ± 0.43 0.25 ± 0.08 0.42 ± 0.15 0.6 ± 0.24 0.65 ± 0.35 0.08 ± 0.05 0.5 ± 0 5.1 ± 5.5
Mid-Depth 1.33 ± 0.27 11.8 ± 0.28 0.28 ± 0.13 0.3 ± 0.09 0.5 ± 0 0.88 ± 0.66 0.05 ± 0.02 0.5 ± 0 14.63 ± 28.28
Near-Bottom 1.35 ± 0.1 12.28 ± 0.92 0.25 ± 0.08 0.23 ± 0.05 0.5 ± 0 0.78 ± 0.7 0.05 ± 0.03 0.5 ± 0 2.18 ± 2.39
Proposed MEQS in Israel Mean 36 N/A 10 5 0.16 10 5 N/A 40
Maximum 69 N/A 20 10 0.4 50 20 N/A 100 EUCEQS
(Directive 2008/105/EC and proposed amendment
COM(2011)876)
MAC N/A N/A N/A N/A 0.07 34.0 14 N/A N/A
AAC N/A N/A N/A N/A N/A 8.6 1.3 N/A N/A
CCC Value3 36 200 BC 50 3.1 0.94 8.2 8.1 500p 81
AAC = annual average concentration; As = arsenic; Ba = barium; Cr = chromium; Cu = copper; Hg = mercury; MAC = maximum allowable concentration; N/A = parameter not analyzed; Ni = nickel; Pb = lead; Sb = antimony; Zn = zinc. 1Concentrations lower than reported method detection limits may be due to slight variations in analyzed sample volumes. 2Levantine Basin baseline data mean calculated from pre-drill and environmental baseline surveys conducted by CSA prior to September 2013. 3Sources of CCC toxicity reference values: primary entry is the U.S. Ambient Water Quality Criteria; BC = British Columbia Water Quality Guidelines. p = proposed. -- = concentration not determined.
Tamar Field Development Project EIA 85 Noble Energy Mediterranean Ltd March 2016 CSA-Noble-FL-16-2650-08-REP-01-FIN-REV04
Hydrocarbons
February 2014 Tamar Field Background Monitoring Survey
Seawater total petroleum hydrocarbons (TPH) concentrations were low but detectable throughout the survey region (Table 1-18). Higher concentrations of TPH generally were found in near-surface water samples in comparison to mid-depth or near-bottom samples. Seawater polycyclic aromatic hydrocarbon (PAH) concentrations were also low, with many PAHs below the laboratory’s method detection limit. PAHs were dominated by phenanthrene and naphthalene compounds.
March 2013 Tamar Field and Pipeline Survey
Seawater TPH concentrations were below the analytical laboratory’s detection limit (Table 1-19). Seawater PAH concentrations were also low, with the majority of PAHs below the laboratory’s detection limit. PAHs were dominated by phenanthrene and naphthalene compounds.
Relatively high concentrations of PAHs, compared to the rest of the survey area, were found in the near-bottom seawater sample at station TF6 (Table 1-19). The TPH concentration was not detected at this station. The location of station TF6 is approximately 1 km northwest from the nearest wellsite (Tamar-5) (Figure 1-38), indicating that it is likely far enough away and not in the downstream direction of bottom currents to be influenced by this wellsite; therefore, it is not possible to interpret the cause of elevated PAH concentrations at this location.
Similarity in Hydrocarbon Concentrations Between Surveys
Mean hydrocarbon concentrations for the March 2013 Tamar Field and Pipeline Survey and February 2014 Tamar Field Background Monitoring Survey are reported in Table 1-20. TPH concentrations during the February 2014 Survey were similar to and within one standard deviation of the Levantine Basin mean throughout the water column. TPH concentrations were higher during the February 2014 Survey than during the March 2013 Survey; however, the explanation for this is unknown. During the March 2013 Survey, water samples were collected in close proximity (within 1 km) to existing infrastructure, while water samples collected during the February 2014 Survey generally were collected more than 5 km away from the existing infrastructure and on the perimeter of the reservoir (with the exception of station E11). TPH analysis on equipment and field blanks for these sample produced concentrations of 25 and 30 µg L-1, respectively. While concentrations within these blanks were higher than the March 2013 samples, and indicate that some contamination from the water column or ship may have taken place, these concentrations are not high enough to account for the difference between surveys. It must be noted that TPH concentrations reported for the February 2014 Survey are extremely low and do not indicate a level of environmental concern.
PAH concentrations were similar between surveys with the exception of the relatively high values reported for Station TF6 during the March 2013 Tamar Field and Pipeline Survey. All applicable values are below the CCC (Buchman, 2008) (Table 1-20). Naphthalene and fluoranthene means are below the maximum allowable concentration (MAC) and annual average concentration (AAC) of the EUCEQS (Table 1-20). The analytical laboratory’s detection limit of benzo(b)fluoranthene, benzo(k,j)fluoranthene, benzo(a)pyrene, ideno(1,2,3-c,d)pyrene is above that of the MAC and benzo(g,h,i)perylene is above that of the MAC and AAC of EUCEQS. The laboratory only detected these samples at Station TF6 during the March 2013 Survey (Table 1-20). Mean PAH concentrations for both surveys were low and do not indicate any source of environmental concern.

Tamar Field Development Project EIA 86 Noble Energy Mediterranean Ltd March 2016 CSA-Noble-FL-16-2650-08-REP-01-FIN-REV04
Table 1-18. Hydrocarbon concentrations in seawater from the February 2014 Tamar Field Background Monitoring Survey. Total petroleum hydrocarbons (TPH) and the U.S. Environmental Protection Agency priority polycyclic aromatic hydrocarbons (PAHs) are represented (From: CSA Ocean Sciences Inc., 2014).
Location Station Depth TPH (µg L-1)
PAH (ng/L)
Nap
htha
lene
Ace
naph
thyl
ene
Ace
naph
then
e
Fluo
rene
Ant
hrac
ene
Phen
anth
rene
Fluo
rant
hene
Pyre
ne
Ben
z(a)
anth
race
ne
Chr
ysen
e/Tr
iphe
nyle
ne
Ben
zo(b
)flu
oran
then
e
Ben
zo(k
,j)flu
oran
then
e
Ben
zo(a
)pyr
ene
Inde
no(1
,2,3
-c,
d)py
rene
Dib
enz(
a,h)
anth
race
ne
Ben
zo(g
,h,i)
pery
lene
Perimeter of Tamar Field
B08
Near-Surface 41.1 6.60 <1.3 <1.5 1.25 <0.8 8.84 4.87 3.42 <0.8 <0.9 <2.6 <2.7 <2.1 <1.5 <1.2 <2.7
Mid-Depth 77.7 6.61 <1.3 <1.5 1.16 0.42 7.29 3.06 2.30 0.70 0.27 <2.6 <2.7 <2.1 <1.5 <1.2 <2.7
Near-Bottom 22.7 4.89 <1.3 <1.6 1.14 <0.8 5.86 2.47 2.16 <0.8 <0.9 <2.6 <2.7 <2.1 <1.5 <1.2 <2.7
C01
Near-Surface 49.5 4.71 <1.2 <1.5 0.48 <0.8 2.74 0.86 1.54 <0.8 <0.8 <2.5 <2.6 <2 <1.5 <1.2 <2.6
Mid-Depth N/A N/A N/A N/A N/A N/A N/A N/A N/A N/A N/A N/A N/A N/A N/A N/A N/A Near-Bottom 9.6 3.83 <1.2 <1.5 0.75 <0.8 3.42 0.88 1.61 <0.8 <0.8 <2.5 <2.6 <2 <1.5 <1.2 <2.6
D17
Near-Surface 89.1 5.87 0.80 2.01 1.25 <0.8 8.21 4.12 2.83 0.83 0.32 <2.5 <2.6 <2 <1.5 <1.2 <2.6
Mid-Depth 33.5 6.29 0.77 2.30 1.19 <0.8 7.42 3.20 2.21 0.74 0.24 <2.6 <2.8 <2.1 <1.5 <1.2 <2.8
Near-Bottom 41.2 6.56 <1.2 <1.5 1.34 <0.8 8.90 3.86 2.22 <0.8 <0.8 <2.5 <2.6 <2 <1.4 <1.2 <2.6
H09
Near-Surface 66.5 7.19 <1.2 <1.5 1.54 <0.8 10.81 4.59 2.19 0.98 0.28 <2.5 <2.6 <2 <1.5 <1.2 <2.6
Mid-Depth 45.2 5.59 <1.3 <1.6 0.93 <0.8 5.59 2.06 1.25 0.78 0.16 <2.6 <2.7 <2.1 <1.5 <1.2 <2.7
Near-Bottom 19.5 5.68 <1.3 <1.6 1.17 <0.8 6.99 2.60 1.57 0.84 0.18 <2.6 <2.8 <2.1 <1.5 <1.2 <2.8
Center of Tamar Field
E11
Near-Surface 20.4 5.15 <1.2 <1.5 0.93 <0.8 5.12 2.40 2.81 <0.8 <0.8 <2.5 <2.6 <2 <1.5 <1.2 <2.6
Mid-Depth 53.2 5.00 <1.2 <1.5 0.86 <0.8 5.84 2.15 1.58 <0.8 <0.8 <2.5 <2.6 <2 <1.5 <1.2 <2.6
Near-Bottom 52.3 5.34 <1.3 <1.6 0.93 <0.8 6.76 2.89 2.25 0.75 0.24 <2.6 <2.8 <2.1 <1.5 <1.2 <2.8
N/A = data not available.
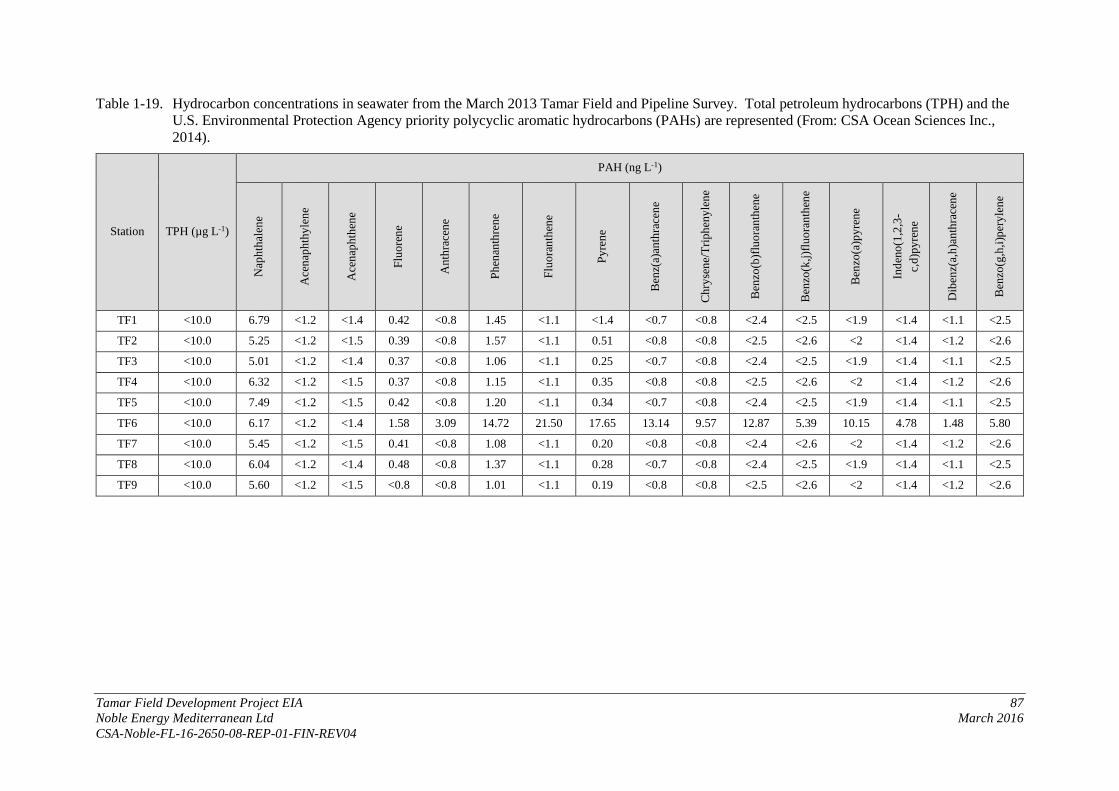
Tamar Field Development Project EIA 87 Noble Energy Mediterranean Ltd March 2016 CSA-Noble-FL-16-2650-08-REP-01-FIN-REV04
Table 1-19. Hydrocarbon concentrations in seawater from the March 2013 Tamar Field and Pipeline Survey. Total petroleum hydrocarbons (TPH) and the U.S. Environmental Protection Agency priority polycyclic aromatic hydrocarbons (PAHs) are represented (From: CSA Ocean Sciences Inc., 2014).
Station TPH (µg L-1)
PAH (ng L-1)
Nap
htha
lene
Ace
naph
thyl
ene
Ace
naph
then
e
Fluo
rene
Ant
hrac
ene
Phen
anth
rene
Fluo
rant
hene
Pyre
ne
Ben
z(a)
anth
race
ne
Chr
ysen
e/Tr
iphe
nyle
ne
Ben
zo(b
)flu
oran
then
e
Ben
zo(k
,j)flu
oran
then
e
Ben
zo(a
)pyr
ene
Inde
no(1
,2,3
-c,
d)py
rene
Dib
enz(
a,h)
anth
race
ne
Ben
zo(g
,h,i)
pery
lene
TF1 <10.0 6.79 <1.2 <1.4 0.42 <0.8 1.45 <1.1 <1.4 <0.7 <0.8 <2.4 <2.5 <1.9 <1.4 <1.1 <2.5
TF2 <10.0 5.25 <1.2 <1.5 0.39 <0.8 1.57 <1.1 0.51 <0.8 <0.8 <2.5 <2.6 <2 <1.4 <1.2 <2.6
TF3 <10.0 5.01 <1.2 <1.4 0.37 <0.8 1.06 <1.1 0.25 <0.7 <0.8 <2.4 <2.5 <1.9 <1.4 <1.1 <2.5
TF4 <10.0 6.32 <1.2 <1.5 0.37 <0.8 1.15 <1.1 0.35 <0.8 <0.8 <2.5 <2.6 <2 <1.4 <1.2 <2.6
TF5 <10.0 7.49 <1.2 <1.5 0.42 <0.8 1.20 <1.1 0.34 <0.7 <0.8 <2.4 <2.5 <1.9 <1.4 <1.1 <2.5
TF6 <10.0 6.17 <1.2 <1.4 1.58 3.09 14.72 21.50 17.65 13.14 9.57 12.87 5.39 10.15 4.78 1.48 5.80
TF7 <10.0 5.45 <1.2 <1.5 0.41 <0.8 1.08 <1.1 0.20 <0.8 <0.8 <2.4 <2.6 <2 <1.4 <1.2 <2.6
TF8 <10.0 6.04 <1.2 <1.4 0.48 <0.8 1.37 <1.1 0.28 <0.7 <0.8 <2.4 <2.5 <1.9 <1.4 <1.1 <2.5
TF9 <10.0 5.60 <1.2 <1.5 <0.8 <0.8 1.01 <1.1 0.19 <0.8 <0.8 <2.5 <2.6 <2 <1.4 <1.2 <2.6
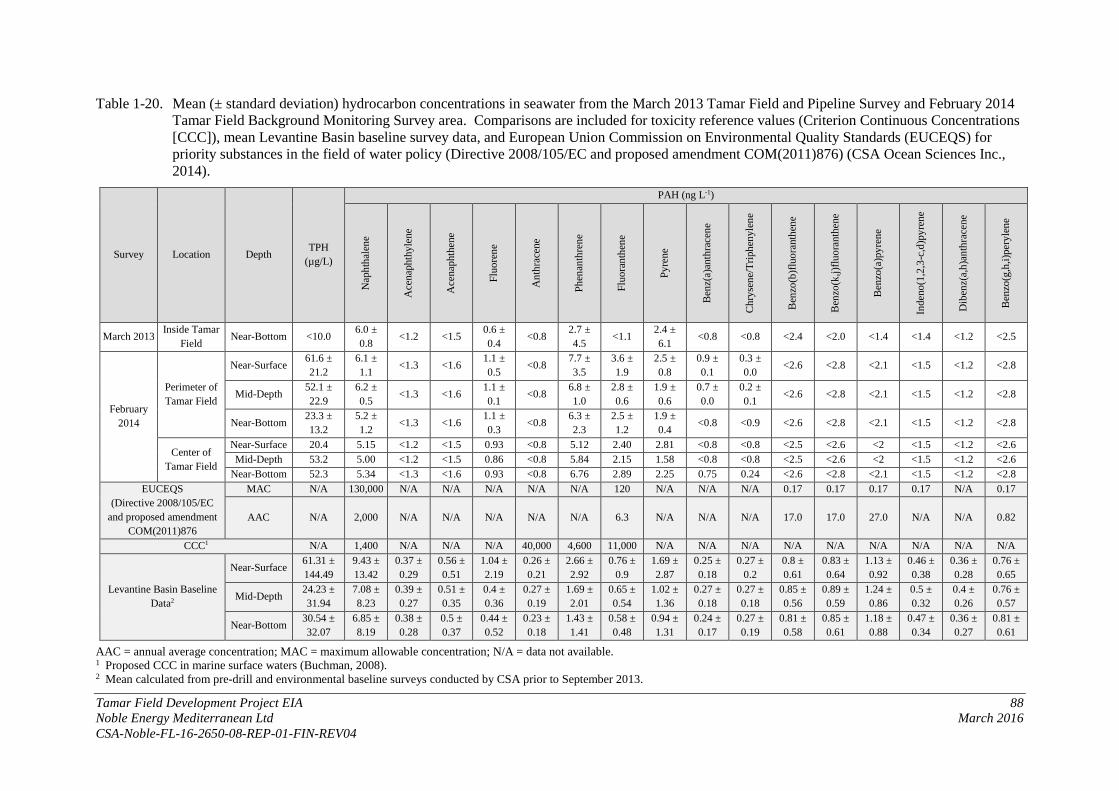
Tamar Field Development Project EIA 88 Noble Energy Mediterranean Ltd March 2016 CSA-Noble-FL-16-2650-08-REP-01-FIN-REV04
Table 1-20. Mean (± standard deviation) hydrocarbon concentrations in seawater from the March 2013 Tamar Field and Pipeline Survey and February 2014 Tamar Field Background Monitoring Survey area. Comparisons are included for toxicity reference values (Criterion Continuous Concentrations [CCC]), mean Levantine Basin baseline survey data, and European Union Commission on Environmental Quality Standards (EUCEQS) for priority substances in the field of water policy (Directive 2008/105/EC and proposed amendment COM(2011)876) (CSA Ocean Sciences Inc., 2014).
Survey Location Depth TPH (µg/L)
PAH (ng L-1)
Nap
htha
lene
Ace
naph
thyl
ene
Ace
naph
then
e
Fluo
rene
Ant
hrac
ene
Phen
anth
rene
Fluo
rant
hene
Pyre
ne
Ben
z(a)
anth
race
ne
Chr
ysen
e/Tr
iphe
nyle
ne
Ben
zo(b
)fluo
rant
hene
Ben
zo(k
,j)flu
oran
then
e
Ben
zo(a
)pyr
ene
Inde
no(1
,2,3
-c,d
)pyr
ene
Dib
enz(
a,h)
anth
race
ne
Ben
zo(g
,h,i)
pery
lene
March 2013 Inside Tamar Field Near-Bottom <10.0 6.0 ±
0.8 <1.2 <1.5 0.6 ± 0.4 <0.8 2.7 ±
4.5 <1.1 2.4 ± 6.1 <0.8 <0.8 <2.4 <2.0 <1.4 <1.4 <1.2 <2.5
February 2014
Perimeter of Tamar Field
Near-Surface 61.6 ± 21.2
6.1 ± 1.1 <1.3 <1.6 1.1 ±
0.5 <0.8 7.7 ± 3.5
3.6 ± 1.9
2.5 ± 0.8
0.9 ± 0.1
0.3 ± 0.0 <2.6 <2.8 <2.1 <1.5 <1.2 <2.8
Mid-Depth 52.1 ± 22.9
6.2 ± 0.5 <1.3 <1.6 1.1 ±
0.1 <0.8 6.8 ± 1.0
2.8 ± 0.6
1.9 ± 0.6
0.7 ± 0.0
0.2 ± 0.1 <2.6 <2.8 <2.1 <1.5 <1.2 <2.8
Near-Bottom 23.3 ± 13.2
5.2 ± 1.2 <1.3 <1.6 1.1 ±
0.3 <0.8 6.3 ± 2.3
2.5 ± 1.2
1.9 ± 0.4 <0.8 <0.9 <2.6 <2.8 <2.1 <1.5 <1.2 <2.8
Center of Tamar Field
Near-Surface 20.4 5.15 <1.2 <1.5 0.93 <0.8 5.12 2.40 2.81 <0.8 <0.8 <2.5 <2.6 <2 <1.5 <1.2 <2.6 Mid-Depth 53.2 5.00 <1.2 <1.5 0.86 <0.8 5.84 2.15 1.58 <0.8 <0.8 <2.5 <2.6 <2 <1.5 <1.2 <2.6
Near-Bottom 52.3 5.34 <1.3 <1.6 0.93 <0.8 6.76 2.89 2.25 0.75 0.24 <2.6 <2.8 <2.1 <1.5 <1.2 <2.8 EUCEQS
(Directive 2008/105/EC and proposed amendment
COM(2011)876
MAC N/A 130,000 N/A N/A N/A N/A N/A 120 N/A N/A N/A 0.17 0.17 0.17 0.17 N/A 0.17
AAC N/A 2,000 N/A N/A N/A N/A N/A 6.3 N/A N/A N/A 17.0 17.0 27.0 N/A N/A 0.82
CCC1 N/A 1,400 N/A N/A N/A 40,000 4,600 11,000 N/A N/A N/A N/A N/A N/A N/A N/A N/A
Levantine Basin Baseline Data2
Near-Surface 61.31 ± 144.49
9.43 ± 13.42
0.37 ± 0.29
0.56 ± 0.51
1.04 ± 2.19
0.26 ± 0.21
2.66 ± 2.92
0.76 ± 0.9
1.69 ± 2.87
0.25 ± 0.18
0.27 ± 0.2
0.8 ± 0.61
0.83 ± 0.64
1.13 ± 0.92
0.46 ± 0.38
0.36 ± 0.28
0.76 ± 0.65
Mid-Depth 24.23 ± 31.94
7.08 ± 8.23
0.39 ± 0.27
0.51 ± 0.35
0.4 ± 0.36
0.27 ± 0.19
1.69 ± 2.01
0.65 ± 0.54
1.02 ± 1.36
0.27 ± 0.18
0.27 ± 0.18
0.85 ± 0.56
0.89 ± 0.59
1.24 ± 0.86
0.5 ± 0.32
0.4 ± 0.26
0.76 ± 0.57
Near-Bottom 30.54 ± 32.07
6.85 ± 8.19
0.38 ± 0.28
0.5 ± 0.37
0.44 ± 0.52
0.23 ± 0.18
1.43 ± 1.41
0.58 ± 0.48
0.94 ± 1.31
0.24 ± 0.17
0.27 ± 0.19
0.81 ± 0.58
0.85 ± 0.61
1.18 ± 0.88
0.47 ± 0.34
0.36 ± 0.27
0.81 ± 0.61
AAC = annual average concentration; MAC = maximum allowable concentration; N/A = data not available. 1 Proposed CCC in marine surface waters (Buchman, 2008). 2 Mean calculated from pre-drill and environmental baseline surveys conducted by CSA prior to September 2013.
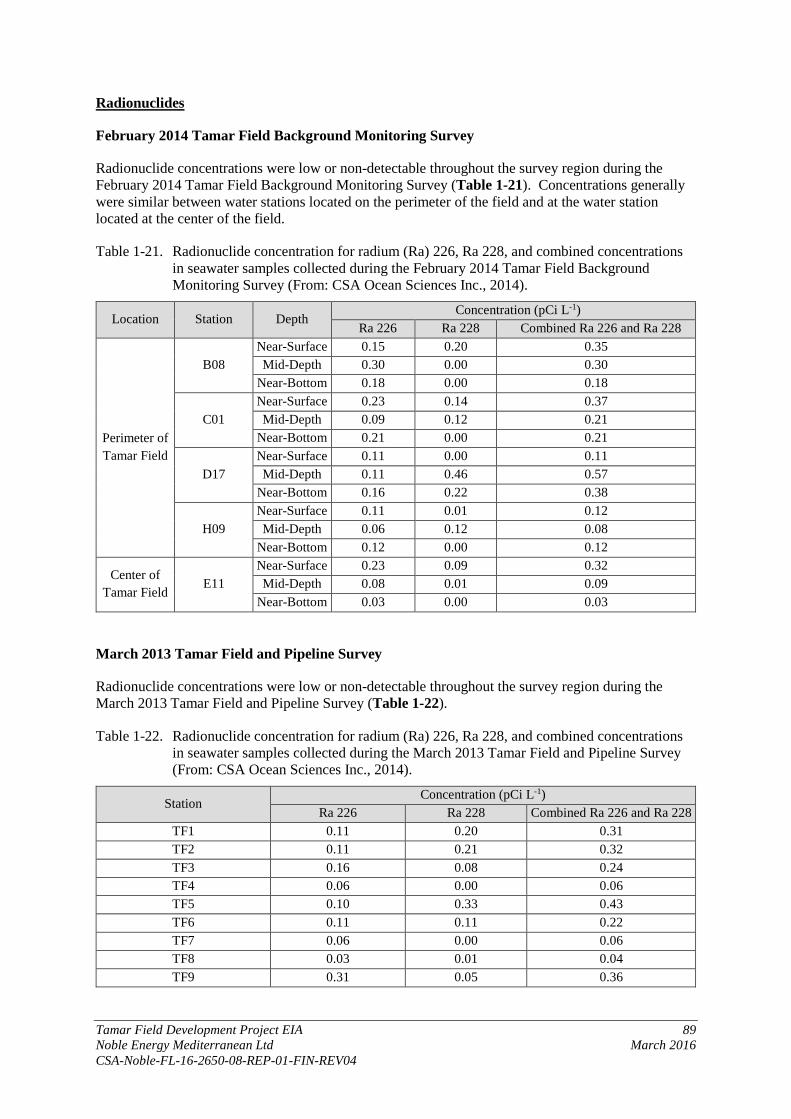
Tamar Field Development Project EIA 89 Noble Energy Mediterranean Ltd March 2016 CSA-Noble-FL-16-2650-08-REP-01-FIN-REV04
Radionuclides
February 2014 Tamar Field Background Monitoring Survey
Radionuclide concentrations were low or non-detectable throughout the survey region during the February 2014 Tamar Field Background Monitoring Survey (Table 1-21). Concentrations generally were similar between water stations located on the perimeter of the field and at the water station located at the center of the field.
Table 1-21. Radionuclide concentration for radium (Ra) 226, Ra 228, and combined concentrations in seawater samples collected during the February 2014 Tamar Field Background Monitoring Survey (From: CSA Ocean Sciences Inc., 2014).
Location Station Depth Concentration (pCi L-1)
Ra 226 Ra 228 Combined Ra 226 and Ra 228
Perimeter of Tamar Field
B08 Near-Surface 0.15 0.20 0.35 Mid-Depth 0.30 0.00 0.30
Near-Bottom 0.18 0.00 0.18
C01 Near-Surface 0.23 0.14 0.37 Mid-Depth 0.09 0.12 0.21
Near-Bottom 0.21 0.00 0.21
D17 Near-Surface 0.11 0.00 0.11 Mid-Depth 0.11 0.46 0.57
Near-Bottom 0.16 0.22 0.38
H09 Near-Surface 0.11 0.01 0.12 Mid-Depth 0.06 0.12 0.08
Near-Bottom 0.12 0.00 0.12
Center of Tamar Field
E11 Near-Surface 0.23 0.09 0.32 Mid-Depth 0.08 0.01 0.09
Near-Bottom 0.03 0.00 0.03
March 2013 Tamar Field and Pipeline Survey
Radionuclide concentrations were low or non-detectable throughout the survey region during the March 2013 Tamar Field and Pipeline Survey (Table 1-22).
Table 1-22. Radionuclide concentration for radium (Ra) 226, Ra 228, and combined concentrations in seawater samples collected during the March 2013 Tamar Field and Pipeline Survey (From: CSA Ocean Sciences Inc., 2014).
Station Concentration (pCi L-1)
Ra 226 Ra 228 Combined Ra 226 and Ra 228 TF1 0.11 0.20 0.31 TF2 0.11 0.21 0.32 TF3 0.16 0.08 0.24 TF4 0.06 0.00 0.06 TF5 0.10 0.33 0.43 TF6 0.11 0.11 0.22 TF7 0.06 0.00 0.06 TF8 0.03 0.01 0.04 TF9 0.31 0.05 0.36

Tamar Field Development Project EIA 90 Noble Energy Mediterranean Ltd March 2016 CSA-Noble-FL-16-2650-08-REP-01-FIN-REV04
Similarity in Radionuclide Concentrations Between Surveys
Mean concentrations of seawater radionuclide concentrations (radium [Ra] 226 and Ra 228) were similar between the March 2013 Tamar Field and Pipeline Survey and February 2014 Tamar Field Background Survey and are provided in Table 1-23.
Table 1-23. Mean (± standard deviation) and combined mean concentrations of radionuclides (radium [Ra] 226 and Ra 228) in seawater from the Tamar Field. Levantine Basin baseline data are provided for comparison (From: CSA Ocean Sciences Inc., 2014).
Survey Location Concentration (pCi L-1)
Depth Ra 226 Ra 228 Combined Ra 226 and Ra 228 March 2013 Inside Tamar Field Near-Bottom 0.12 ± 0.08 0.11 ± 0.12 0.23 ± 0.14
February 2014
Perimeter of Tamar Field
Near-Surface 0.15 ± 0.06 0.09 ± 0.10 0.24 ± 0.14 Mid-Depth 0.14 ± 0.11 0.18 ± 0.20 0.29 ± 0.21
Near-Bottom 0.17 ± 0.04 0.06 ± 0.11 0.22 ± 0.11
Center of Tamar Field
Near-Surface 0.23 0.09 0.32 Mid-Depth 0.08 0.01 0.09
Near-Bottom 0.03 0.00 0.03
Levantine Basin Mean* Near-Surface 0.13 ± 0.09 0.2 ± 0.13 N/A Mid-Depth 0.17 ± 0.1 0.16 ± 0.1 N/A
Near-Bottom 0.13 ± 0.1 0.16 ± 0.13 N/A
N/A = data not available. *Mean calculated from pre-drill and environmental baseline surveys conducted by CSA prior to September 2013.
Radium, naturally present in formation rock, co-precipitates with other alkaline earth elements, such as barium, and is associated with metal sulfates in drill cuttings (Veil and Smith, 1999). However, due to the high natural concentration of sulfate in the ocean, radium has a low solubility in seawater (Neff, 2005) and is unlikely to contribute to seawater radioactivity. The USEPA (1976) established a maximum contaminant level for combined Ra 226 and Ra 228 at 5 pCi L-1. Combined Ra 226 and Ra 228 concentrations in seawater from the both surveys were well below this threshold. The maximum contaminant level is a maximum permissible level of a contaminant that ensures the safety of the water over a lifetime of consumption and also takes into consideration feasible treatment technologies and monitoring capabilities. The data indicate that radium levels in seawater throughout the Tamar Field are extremely low and well below levels of concern.
1.2.4.2 Sediment Analysis
The sediment analyses presented here are derived from the surveys completed by Noble Energy during 2013 and 2014. A figure of the sampling stations was presented in Figure 1-38 and the full report is presented in CSA Ocean Sciences Inc. (2014). As stated previously, in addition to covering the Tamar Field, the surveys included sample stations along the pipeline corridor from the Tamar Field to the Tamar Platform. A review of this information is included in this section, even though the sampling stations are not in close proximity to the proposed activities, in order to provide information that may be of value in identifying potential project impacts on the environment.
Particle Size
Figures 1-53 and 1-54 summarize the particle size distribution and sediment types within the Tamar Field. All samples, including those in close proximity to existing development, were predominately composed of very fine silt and clay (~80%, combined; Figure 1-53) and thus were classified as silty clay (Figure 1-54).

Tamar Field Development Project EIA 91 Noble Energy Mediterranean Ltd March 2016 CSA-Noble-FL-16-2650-08-REP-01-FIN-REV04
Figure 1-53. Particle size distribution (Wentworth scale; mean + standard deviation) within the
Tamar Field. C = coarse; M = medium; F = fine; VF = very fine. Yellow = sand fractions; blue = silt fractions; green = clay fractions (From: CSA Ocean Sciences Inc., 2014).
Figure 1-54. Individual grid cell and pipeline station particle size classifications (Shepard, 1954) for
sediment samples collected within the Tamar Field (Adapted from: CSA Ocean Sciences Inc., 2014).
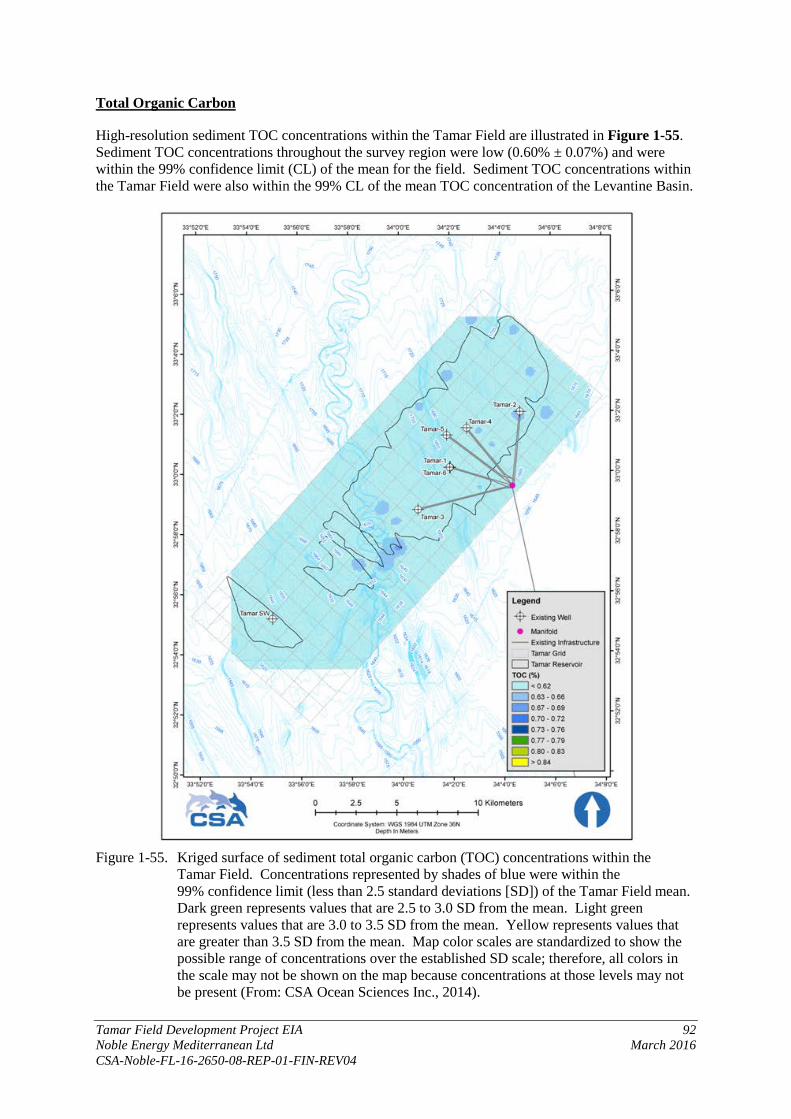
Tamar Field Development Project EIA 92 Noble Energy Mediterranean Ltd March 2016 CSA-Noble-FL-16-2650-08-REP-01-FIN-REV04
Total Organic Carbon
High-resolution sediment TOC concentrations within the Tamar Field are illustrated in Figure 1-55. Sediment TOC concentrations throughout the survey region were low (0.60% ± 0.07%) and were within the 99% confidence limit (CL) of the mean for the field. Sediment TOC concentrations within the Tamar Field were also within the 99% CL of the mean TOC concentration of the Levantine Basin.
Figure 1-55. Kriged surface of sediment total organic carbon (TOC) concentrations within the
Tamar Field. Concentrations represented by shades of blue were within the 99% confidence limit (less than 2.5 standard deviations [SD]) of the Tamar Field mean. Dark green represents values that are 2.5 to 3.0 SD from the mean. Light green represents values that are 3.0 to 3.5 SD from the mean. Yellow represents values that are greater than 3.5 SD from the mean. Map color scales are standardized to show the possible range of concentrations over the established SD scale; therefore, all colors in the scale may not be shown on the map because concentrations at those levels may not be present (From: CSA Ocean Sciences Inc., 2014).
Tamar Field Development Project EIA 93 Noble Energy Mediterranean Ltd March 2016 CSA-Noble-FL-16-2650-08-REP-01-FIN-REV04
Metals
Figures 1-56 to 1-70 are high-resolution sediment metals concentrations (aluminum, antimony, arsenic, barium, beryllium, cadmium, chromium, copper, iron, lead, mercury, nickel, thallium, vanadium, and zinc) within the Tamar Field. Selenium and silver concentrations generally were not detectable within the region (more than 75% were non-detects); therefore, figures are not provided for these metals. Most metals concentrations were within the 99% CL of the Tamar Field mean (Figures 1-56 to 1-70), with the exception of barium (Figure 1-59) and lead (Figure 1-65).
Barium concentrations throughout the Tamar Field were elevated, resulting in a situation where barium concentrations as high as 884 parts per million (ppm) were within the 99% CL of the Tamar Field Mean value (Figure 1-59). Comparison of barium concentrations within the field to the Levantine Basin mean (172.0 ± 29.9) shows a clearer picture of the state of barium concentrations within the region. Elevated barium concentrations around Tamar-1/Tamar-6, Tamar-3, Tamar-4, Tamar-5, and Tamar SW-1 are not unexpected because barite is a compound normally added to drilling mud as a weighing material to add density in order to control and balance formation pressure and increase stability of the wellbore. However, the high levels of barium in the north section of the field and reservoir centered on grid cells B09 and C09 were unexpected. These cells are located more than 2.9 km from the nearest wellsite (Figure 1-38) and occurred in concentrations much higher than expected for this distance, especially as forecast concentrations were lower between this location and the nearest wellsites. Laboratory error has been ruled out through examination of the analytical laboratory’s quality control procedures, as has sampling error because there were no sources of barium on board the vessel to potentially contaminate samples. It is impossible to know the source of the high barium concentration, although it is likely not directly related to drilling activities at the existing Tamar wellsites. Barium is not considered a toxic chemical; therefore, there are no established toxicity thresholds for this metal. High concentrations of barium within the region are not expected to negatively impact the environment within the region.
Concentrations of lead were elevated above the 99% CL of the Tamar Field mean in close proximity (~1 km) to the manifold (Figure 1-65). Lead is a component of drilling mud (~136 ppm) and barite (~165 ppm) and has been found in cuttings (~133 ppm), so its presence in the field and reservoir was not surprising. Interestingly, lead concentrations were also slightly elevated (but below the 99% CL) in the area of the inexplicitly high barium concentrations of grid cells B09 and C09. The slightly elevated lead signature in this region may indicate that the barium anomaly may have been derived from the surface, given that drilling muds and cuttings are relatively high in lead. Lead concentrations, while elevated in comparison to the Tamar Field, were not elevated in comparison to the Levantine Basin mean (22.3 ± 10.6) and are within the 99% CL threshold of this metal. Lead concentrations throughout the field and reservoir, even in areas with slightly elevated concentrations, were well below the effects range low (ERL) and effects range median (ERM) values for lead (46.7 and 218 ppm, respectively). A concentration below an ERL represents a minimal effects range where biological effects are very rarely observed, while a concentration above an ERM represents a range where biological effects are likely to be observed (Long and Morgan, 1990).
Cadmium concentrations were within the 99% CL of the Tamar Field mean (Figure 1-61); however, slightly elevated cadmium concentrations, relative to the rest of the field mean, were clustered on the eastern portion of the field though not directly around the five wellsites in the region. Cadmium is a component of the drilling mud and barite used in drilling and plugging activities within the Tamar Field (less than 2 ppm). Studies have shown that cadmium in barite has very low solubility, leaches only slightly into the seawater, and has very limited availability to marine organisms (Trefry and Smith, 2003; Neff, 2007). Similarly, after deposition to the seafloor, cadmium remains bound in barite, does not leach into sediment pore water, and remains unavailable to marine organisms. It is impossible to determine the source of the cadmium, especially because the elevated barium signature (Figure 1-59) does not spatially overlap with the cadmium concentrations (Figure 1-61). Besides being within the 99% CL of the Tamar Field mean, cadmium concentrations in the eastern portion of the field and reservoir were well below the ERM value (9.6 ppm) and ERL value (1.2 ppm) for

Tamar Field Development Project EIA 94 Noble Energy Mediterranean Ltd March 2016 CSA-Noble-FL-16-2650-08-REP-01-FIN-REV04
cadmium (Long and Morgan, 1990). Concentrations of cadmium were within the 99% CL of the Levantine Basin mean (0.15 ± 0.15). Cadmium concentrations may reflect either extremely low-level anthropogenic enrichment or natural patchiness within seafloor sediments of the region. In either case, the findings indicate that cadmium concentrations within the field were not significantly different from Tamar Field means or Levantine Basin means, and were well under concentrations of environmental concern.
Concentrations of aluminum and other trace metals vary naturally in ambient seafloor sediments, primarily due to differences in sediment grain sizes. Clay sediments are composed primarily of aluminosilicates and typically have higher concentrations of metals. However, sediments classified as silt or sand are composed primarily of quartz and fragments of carbonate shell, which dilute ambient metals concentrations (Herut and Sandler, 2006). Aluminum concentrations are assumed to correlate linearly with other metals concentrations when there is no anthropogenic input (Trefry and Smith, 2003; Trefry et al., 2013). All sediment metals concentrations (with the exception barium, as described previously) were within the 99% CL of the Levantine Basin mean (Table 1-24). Additionally, normalization of metals concentrations with sediment grain size, achieved by performing a regression of each metal against aluminum, also showed that metals concentrations in the Tamar Field were generally within the 99% prediction interval of the Levantine Basin (Figures 1-71 and 1-72). Figures for selenium and silver are not shown because concentrations generally were below the laboratory’s detection limit. A figure for thallium is not shown because regression values are similar to other metal regressions (i.e., vanadium).
Concentrations of all metals within the field and reservoir were below ERL and ERM values with the exception of arsenic, copper, and nickel (Table 1-24). However, these three metals are naturally found in high concentrations throughout the Levantine Basin. Concentrations above the ERL should be considered ambient for arsenic and copper, and concentrations above the ERM should be considered ambient for nickel (Table 1-24).
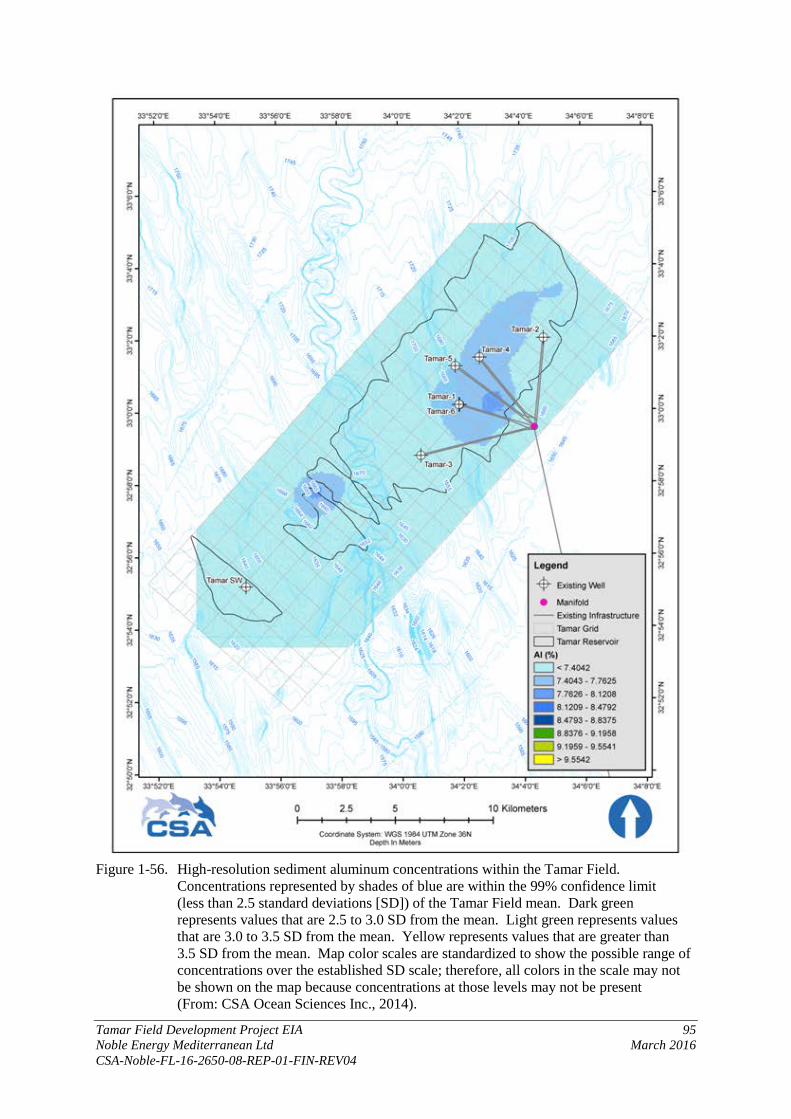
Tamar Field Development Project EIA 95 Noble Energy Mediterranean Ltd March 2016 CSA-Noble-FL-16-2650-08-REP-01-FIN-REV04
Figure 1-56. High-resolution sediment aluminum concentrations within the Tamar Field.
Concentrations represented by shades of blue are within the 99% confidence limit (less than 2.5 standard deviations [SD]) of the Tamar Field mean. Dark green represents values that are 2.5 to 3.0 SD from the mean. Light green represents values that are 3.0 to 3.5 SD from the mean. Yellow represents values that are greater than 3.5 SD from the mean. Map color scales are standardized to show the possible range of concentrations over the established SD scale; therefore, all colors in the scale may not be shown on the map because concentrations at those levels may not be present (From: CSA Ocean Sciences Inc., 2014).
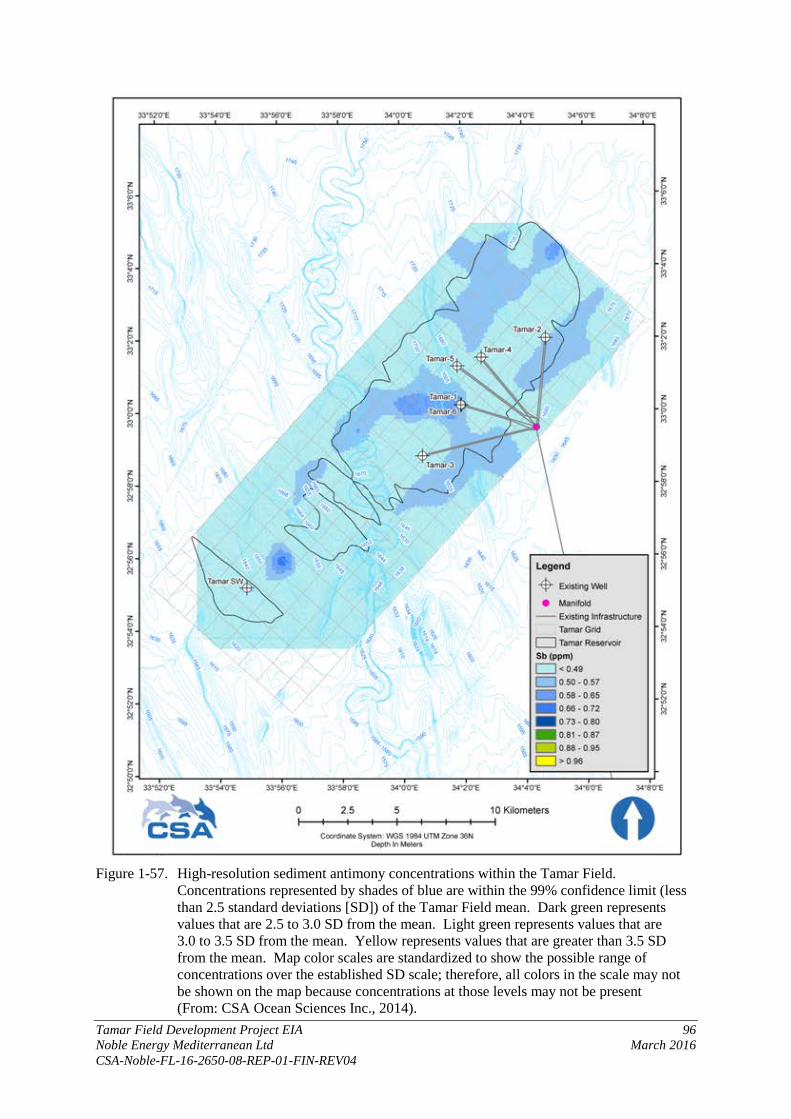
Tamar Field Development Project EIA 96 Noble Energy Mediterranean Ltd March 2016 CSA-Noble-FL-16-2650-08-REP-01-FIN-REV04
Figure 1-57. High-resolution sediment antimony concentrations within the Tamar Field.
Concentrations represented by shades of blue are within the 99% confidence limit (less than 2.5 standard deviations [SD]) of the Tamar Field mean. Dark green represents values that are 2.5 to 3.0 SD from the mean. Light green represents values that are 3.0 to 3.5 SD from the mean. Yellow represents values that are greater than 3.5 SD from the mean. Map color scales are standardized to show the possible range of concentrations over the established SD scale; therefore, all colors in the scale may not be shown on the map because concentrations at those levels may not be present (From: CSA Ocean Sciences Inc., 2014).

Tamar Field Development Project EIA 97 Noble Energy Mediterranean Ltd March 2016 CSA-Noble-FL-16-2650-08-REP-01-FIN-REV04
Figure 1-58. High-resolution sediment arsenic concentrations within the Tamar Field.
Concentrations represented by shades of blue are within the 99% confidence limit (less than 2.5 standard deviations [SD]) of the Tamar Field mean. Dark green represents values that are 2.5 to 3.0 SD from the mean. Light green represents values that are 3.0 to 3.5 SD from the mean. Yellow represents values that are greater than 3.5 SD from the mean. Map color scales are standardized to show the possible range of concentrations over the established SD scale; therefore, all colors in the scale may not be shown on the map because concentrations at those levels may not be present (From: CSA Ocean Sciences Inc., 2014).

Tamar Field Development Project EIA 98 Noble Energy Mediterranean Ltd March 2016 CSA-Noble-FL-16-2650-08-REP-01-FIN-REV04
Figure 1-59. High-resolution sediment barium concentrations within the Tamar Field.
Concentrations represented by shades of blue are within the 99% confidence limit (less than 2.5 standard deviations [SD]) of the Tamar Field mean. Dark green represents values that are 2.5 to 3.0 SD from the mean. Light green represents values that are 3.0 to 3.5 SD from the mean. Yellow represents values that are greater than 3.5 SD from the mean. Map color scales are standardized to show the possible range of concentrations over the established SD scale; therefore, all colors in the scale may not be shown on the map because concentrations at those levels may not be present (From: CSA Ocean Sciences Inc., 2014).

Tamar Field Development Project EIA 99 Noble Energy Mediterranean Ltd March 2016 CSA-Noble-FL-16-2650-08-REP-01-FIN-REV04
Figure 1-60. High-resolution sediment beryllium concentrations within the Tamar Field.
Concentrations represented by shades of blue are within the 99% confidence limit (less than 2.5 standard deviations [SD]) of the Tamar Field mean. Dark green represents values that are 2.5 to 3.0 SD from the mean. Light green represents values that are 3.0 to 3.5 SD from the mean. Yellow represents values that are greater than 3.5 SD from the mean. Map color scales are standardized to show the possible range of concentrations over the established SD scale; therefore, all colors in the scale may not be shown on the map because concentrations at those levels may not be present (From: CSA Ocean Sciences Inc., 2014).

Tamar Field Development Project EIA 100 Noble Energy Mediterranean Ltd March 2016 CSA-Noble-FL-16-2650-08-REP-01-FIN-REV04
Figure 1-61. High-resolution sediment cadmium concentrations within the Tamar Field.
Concentrations represented by shades of blue are within the 99% confidence limit (less than 2.5 standard deviations [SD]) of the Tamar Field mean. Dark green represents values that are 2.5 to 3.0 SD from the mean. Light green represents values that are 3.0 to 3.5 SD from the mean. Yellow represents values that are greater than 3.5 SD from the mean. Map color scales are standardized to show the possible range of concentrations over the established SD scale; therefore, all colors in the scale may not be shown on the map because concentrations at those levels may not be present (From: CSA Ocean Sciences Inc., 2014).
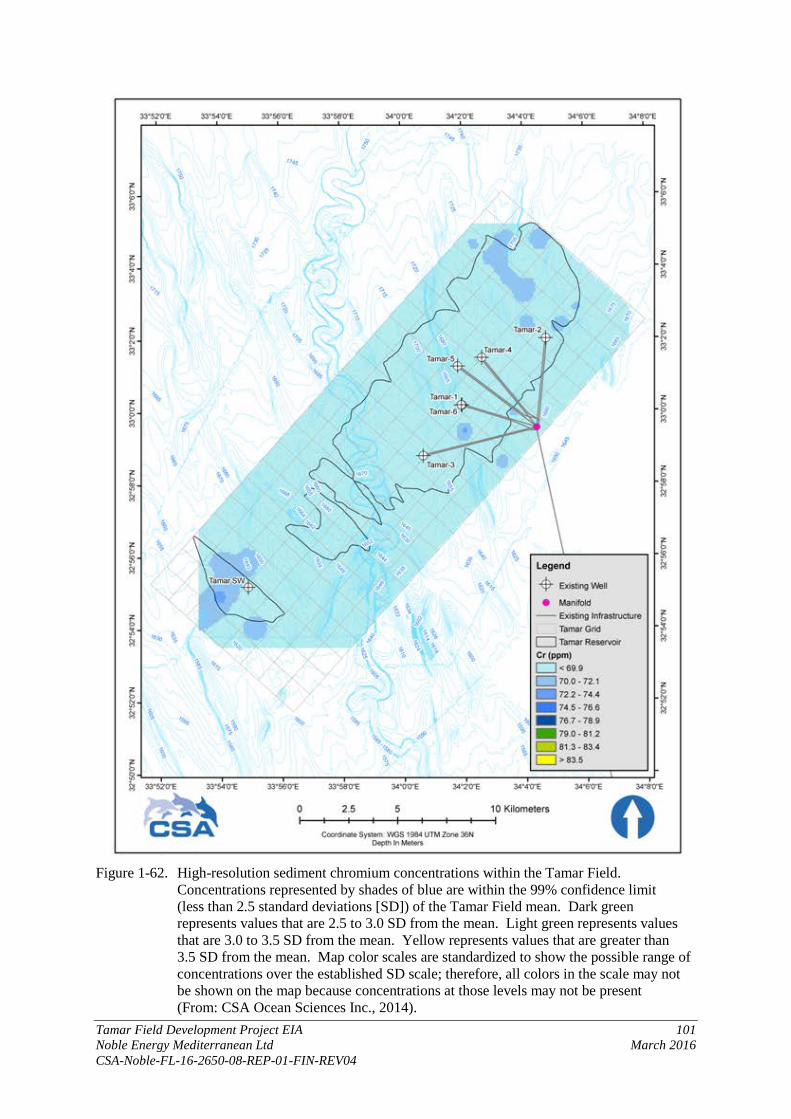
Tamar Field Development Project EIA 101 Noble Energy Mediterranean Ltd March 2016 CSA-Noble-FL-16-2650-08-REP-01-FIN-REV04
Figure 1-62. High-resolution sediment chromium concentrations within the Tamar Field.
Concentrations represented by shades of blue are within the 99% confidence limit (less than 2.5 standard deviations [SD]) of the Tamar Field mean. Dark green represents values that are 2.5 to 3.0 SD from the mean. Light green represents values that are 3.0 to 3.5 SD from the mean. Yellow represents values that are greater than 3.5 SD from the mean. Map color scales are standardized to show the possible range of concentrations over the established SD scale; therefore, all colors in the scale may not be shown on the map because concentrations at those levels may not be present (From: CSA Ocean Sciences Inc., 2014).

Tamar Field Development Project EIA 102 Noble Energy Mediterranean Ltd March 2016 CSA-Noble-FL-16-2650-08-REP-01-FIN-REV04
Figure 1-63. High-resolution sediment copper concentrations within the Tamar Field.
Concentrations represented by shades of blue are within the 99% confidence limit (less than 2.5 standard deviations [SD]) of the Tamar Field mean. Dark green represents values that are 2.5 to 3.0 SD from the mean. Light green represents values that are 3.0 to 3.5 SD from the mean. Yellow represents values that are greater than 3.5 SD from the mean. Map color scales are standardized to show the possible range of concentrations over the established SD scale; therefore, all colors in the scale may not be shown on the map because concentrations at those levels may not be present (From: CSA Ocean Sciences Inc., 2014).
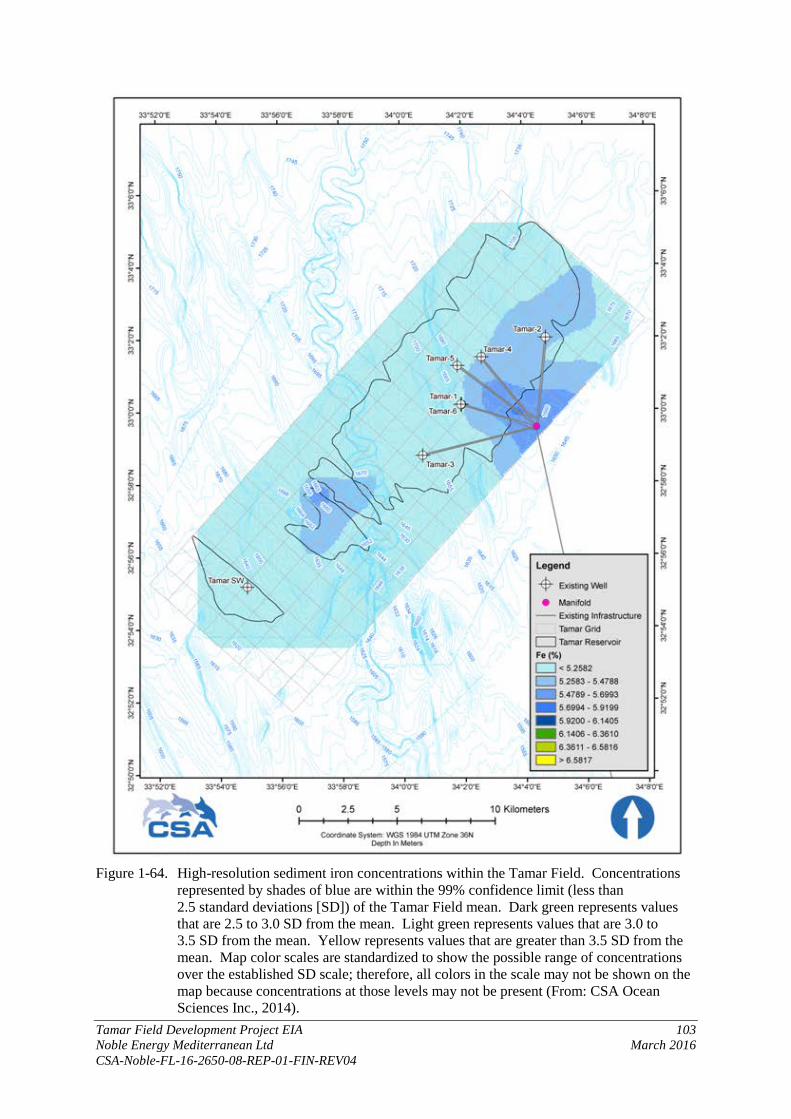
Tamar Field Development Project EIA 103 Noble Energy Mediterranean Ltd March 2016 CSA-Noble-FL-16-2650-08-REP-01-FIN-REV04
Figure 1-64. High-resolution sediment iron concentrations within the Tamar Field. Concentrations
represented by shades of blue are within the 99% confidence limit (less than 2.5 standard deviations [SD]) of the Tamar Field mean. Dark green represents values that are 2.5 to 3.0 SD from the mean. Light green represents values that are 3.0 to 3.5 SD from the mean. Yellow represents values that are greater than 3.5 SD from the mean. Map color scales are standardized to show the possible range of concentrations over the established SD scale; therefore, all colors in the scale may not be shown on the map because concentrations at those levels may not be present (From: CSA Ocean Sciences Inc., 2014).
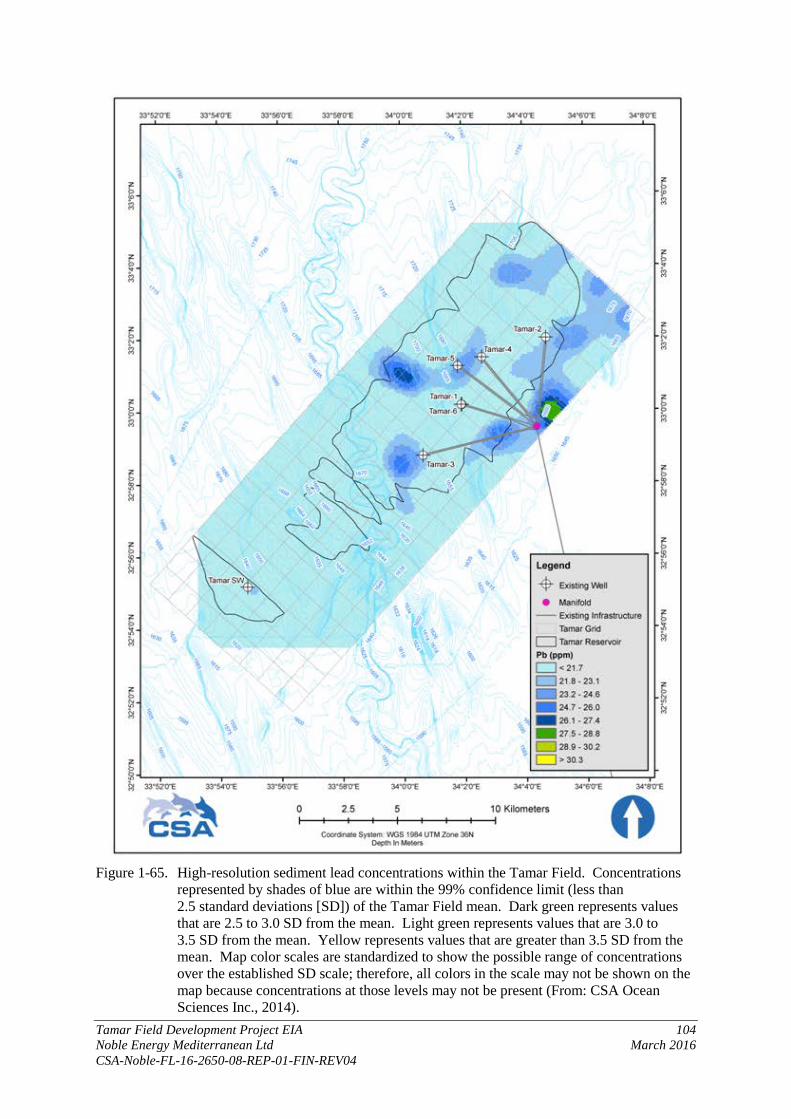
Tamar Field Development Project EIA 104 Noble Energy Mediterranean Ltd March 2016 CSA-Noble-FL-16-2650-08-REP-01-FIN-REV04
Figure 1-65. High-resolution sediment lead concentrations within the Tamar Field. Concentrations
represented by shades of blue are within the 99% confidence limit (less than 2.5 standard deviations [SD]) of the Tamar Field mean. Dark green represents values that are 2.5 to 3.0 SD from the mean. Light green represents values that are 3.0 to 3.5 SD from the mean. Yellow represents values that are greater than 3.5 SD from the mean. Map color scales are standardized to show the possible range of concentrations over the established SD scale; therefore, all colors in the scale may not be shown on the map because concentrations at those levels may not be present (From: CSA Ocean Sciences Inc., 2014).
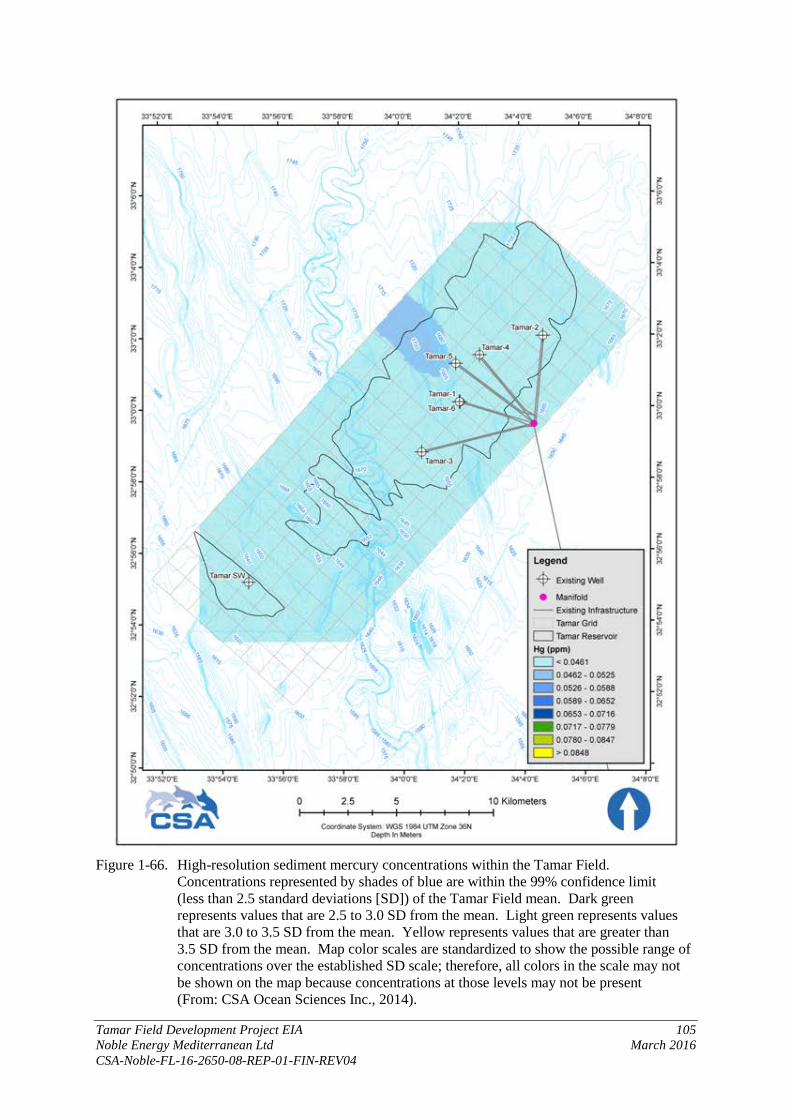
Tamar Field Development Project EIA 105 Noble Energy Mediterranean Ltd March 2016 CSA-Noble-FL-16-2650-08-REP-01-FIN-REV04
Figure 1-66. High-resolution sediment mercury concentrations within the Tamar Field.
Concentrations represented by shades of blue are within the 99% confidence limit (less than 2.5 standard deviations [SD]) of the Tamar Field mean. Dark green represents values that are 2.5 to 3.0 SD from the mean. Light green represents values that are 3.0 to 3.5 SD from the mean. Yellow represents values that are greater than 3.5 SD from the mean. Map color scales are standardized to show the possible range of concentrations over the established SD scale; therefore, all colors in the scale may not be shown on the map because concentrations at those levels may not be present (From: CSA Ocean Sciences Inc., 2014).
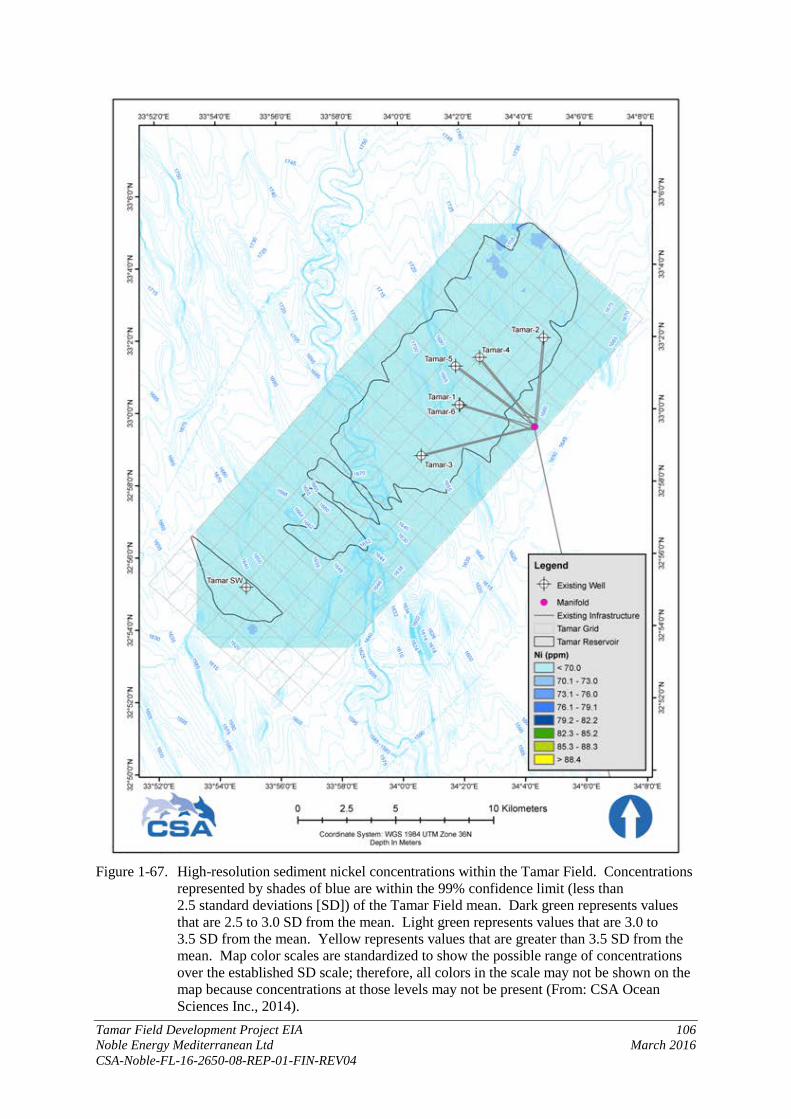
Tamar Field Development Project EIA 106 Noble Energy Mediterranean Ltd March 2016 CSA-Noble-FL-16-2650-08-REP-01-FIN-REV04
Figure 1-67. High-resolution sediment nickel concentrations within the Tamar Field. Concentrations
represented by shades of blue are within the 99% confidence limit (less than 2.5 standard deviations [SD]) of the Tamar Field mean. Dark green represents values that are 2.5 to 3.0 SD from the mean. Light green represents values that are 3.0 to 3.5 SD from the mean. Yellow represents values that are greater than 3.5 SD from the mean. Map color scales are standardized to show the possible range of concentrations over the established SD scale; therefore, all colors in the scale may not be shown on the map because concentrations at those levels may not be present (From: CSA Ocean Sciences Inc., 2014).

Tamar Field Development Project EIA 107 Noble Energy Mediterranean Ltd March 2016 CSA-Noble-FL-16-2650-08-REP-01-FIN-REV04
Figure 1-68. High-resolution sediment thallium concentrations within the Tamar Field.
Concentrations represented by shades of blue are within the 99% confidence limit (less than 2.5 standard deviations [SD]) of the Tamar Field mean. Dark green represents values that are 2.5 to 3.0 SD from the mean. Light green represents values that are 3.0 to 3.5 SD from the mean. Yellow represents values that are greater than 3.5 SD from the mean. Map color scales are standardized to show the possible range of concentrations over the established SD scale; therefore, all colors in the scale may not be shown on the map because concentrations at those levels may not be present (From: CSA Ocean Sciences Inc., 2014).

Tamar Field Development Project EIA 108 Noble Energy Mediterranean Ltd March 2016 CSA-Noble-FL-16-2650-08-REP-01-FIN-REV04
Figure 1-69. High-resolution sediment vanadium concentrations within the Tamar Field.
Concentrations represented by shades of blue are within the 99% confidence limit (less than 2.5 standard deviations [SD]) of the Tamar Field mean. Dark green represents values that are 2.5 to 3.0 SD from the mean. Light green represents values that are 3.0 to 3.5 SD from the mean. Yellow represents values that are greater than 3.5 SD from the mean. Map color scales are standardized to show the possible range of concentrations over the established SD scale; therefore, all colors in the scale may not be shown on the map because concentrations at those levels may not be present (From: CSA Ocean Sciences Inc., 2014).
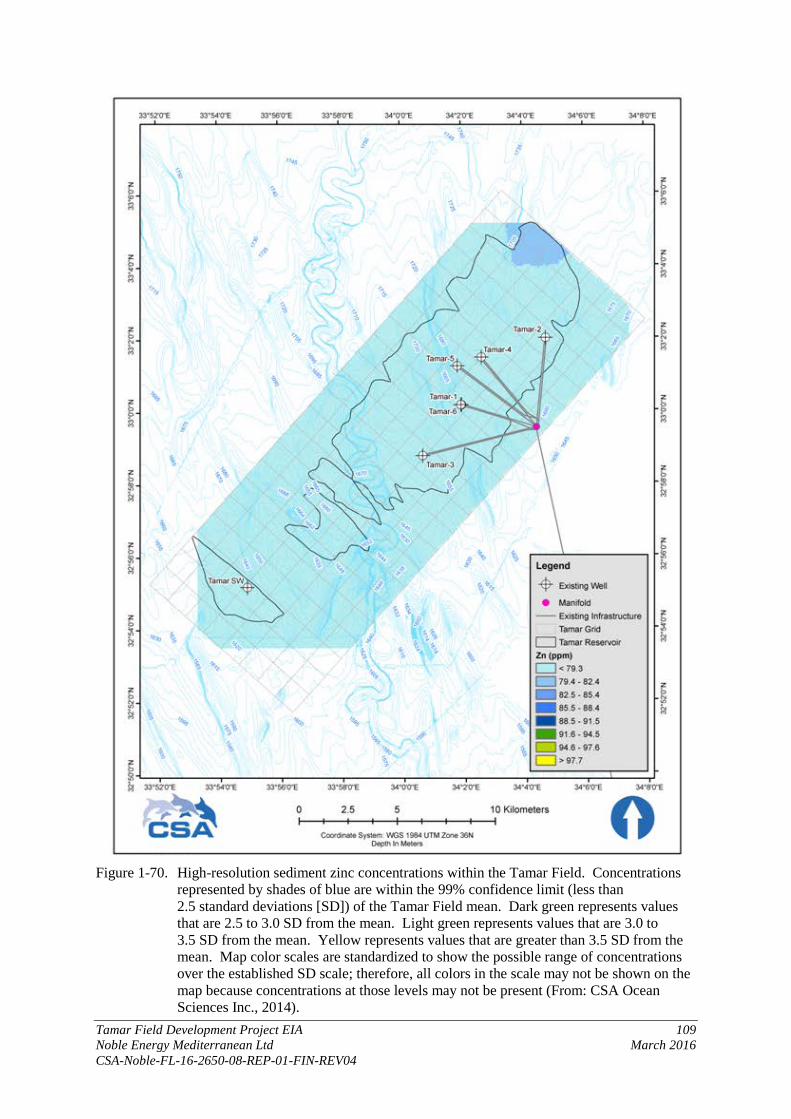
Tamar Field Development Project EIA 109 Noble Energy Mediterranean Ltd March 2016 CSA-Noble-FL-16-2650-08-REP-01-FIN-REV04
Figure 1-70. High-resolution sediment zinc concentrations within the Tamar Field. Concentrations
represented by shades of blue are within the 99% confidence limit (less than 2.5 standard deviations [SD]) of the Tamar Field mean. Dark green represents values that are 2.5 to 3.0 SD from the mean. Light green represents values that are 3.0 to 3.5 SD from the mean. Yellow represents values that are greater than 3.5 SD from the mean. Map color scales are standardized to show the possible range of concentrations over the established SD scale; therefore, all colors in the scale may not be shown on the map because concentrations at those levels may not be present (From: CSA Ocean Sciences Inc., 2014).
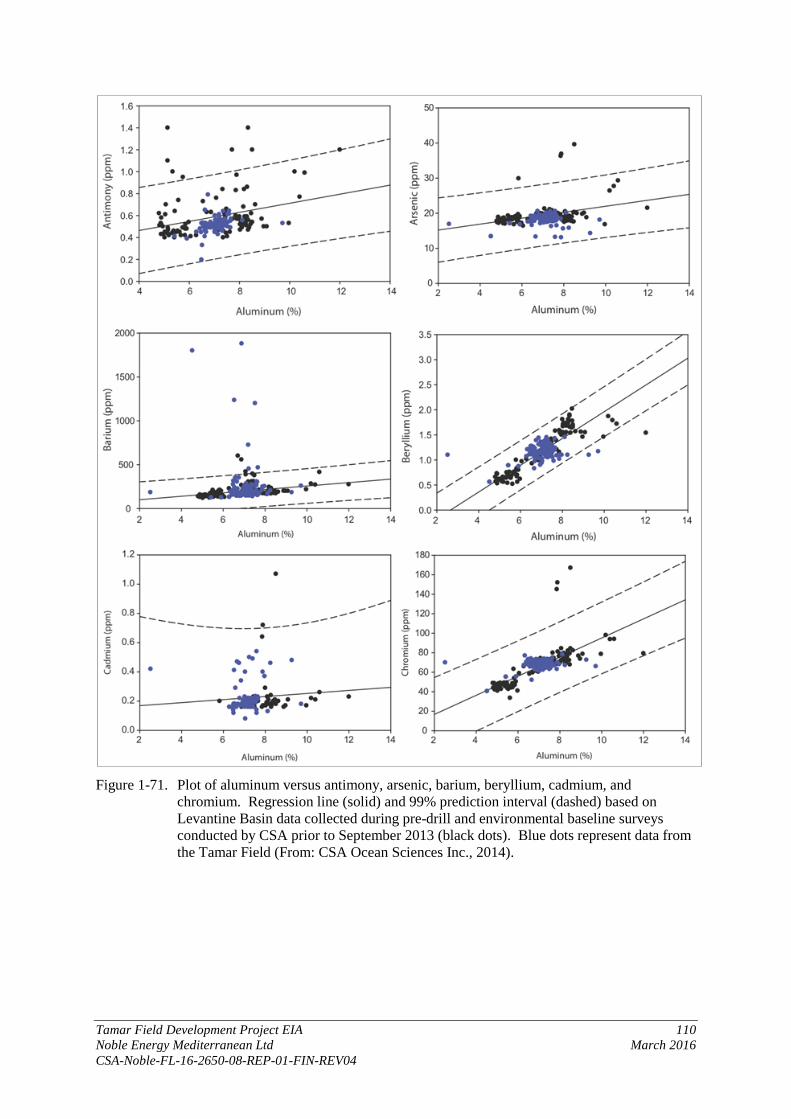
Tamar Field Development Project EIA 110 Noble Energy Mediterranean Ltd March 2016 CSA-Noble-FL-16-2650-08-REP-01-FIN-REV04
Figure 1-71. Plot of aluminum versus antimony, arsenic, barium, beryllium, cadmium, and
chromium. Regression line (solid) and 99% prediction interval (dashed) based on Levantine Basin data collected during pre-drill and environmental baseline surveys conducted by CSA prior to September 2013 (black dots). Blue dots represent data from the Tamar Field (From: CSA Ocean Sciences Inc., 2014).

Tamar Field Development Project EIA 111 Noble Energy Mediterranean Ltd March 2016 CSA-Noble-FL-16-2650-08-REP-01-FIN-REV04
Figure 1-72. Plot of aluminum versus copper, lead, mercury, nickel, vanadium, and zinc. Regression
line (solid) and 99% prediction interval (dashed) based on Levantine Basin data collected during pre-drill and environmental baseline surveys conducted by CSA prior to September 2013 (black dots). Blue dots represent data from the Tamar Field (From: CSA Ocean Sciences Inc., 2014).

Tamar Field Development Project EIA 112 Noble Energy Mediterranean Ltd March 2016 CSA-Noble-FL-16-2650-08-REP-01-FIN-REV04
Table 1-24. Mean (± standard deviation) total metals concentrations (ppm) in sediments collected from within the Tamar Field. Metals concentrations in seafloor sediments of the Levantine Basin (pre-drill and environmental baseline surveys conducted prior to September 2013), effects range low (ERL) and effects range median (ERM) values (Buchman, 2008), and metals concentrations found in drilling muds and barite used at Tamar SW-1 are provided for comparison. Antimony, selenium, and silver concentrations were generally below primary analytical laboratory detection limits and are not presented in the table (From: CSA Ocean Sciences Inc., 2014).
Location As Ba Be Cd Cr Cu Hg Ni Pb Tl V Zn
Tamar Field 18.3 ± 1.4 249.4 ± 263.2 1.2 ± 0.1 0.18 ± 0.11 67.7 ± 4.5 62.5 ± 3.4 0.04 ± 0.01 67.1 ± 6.2 20.5 ± 2.9 0.5 ± 0.2 110.4 ± 8.8 76.4 ± 6.2
Levantine Basin Mean 19.2 ± 3.4 172.0 ± 29.9 1.2 ± 0.5 0.15 ± 0.15 64.8 ± 23.8 62.1 ± 13.5 0.04 ± 0.01 67.3 ± 16.7 22.3 ± 10.6 0.4 ± 0.2 118.9 ± 31.9 88.2 ± 26.6 99% Confidence Limit of
Levantine Basin Mean 29.2 249.2 2.5 N/A 126.1 97.0 0.06 110.4 49.6 0.9 201.2 156.8
ERL 8.2 N/A N/A 1.2 81.0 34.0 0.2 20.9 46.7 N/A N/A 150.0
ERM 70.0 N/A N/A 9.6 370.0 270.0 0.7 51.6 218.0 N/A N/A 410.0
Drilling Mud 4 ± 2.3 1,076.0 ± 396.3 1.0 ± 1.1 1.0 ± 1.1 4.0 ± 3.1 8.0 ± 2.1 0.001 ± 0.001 2.0 ± 1.9 162.0 ± 46.3 N/A 3.0 ± 2.5 15.0 ± 6.1
Barite 20.0 N/A N/A 1.6 ± 0.6 8.0 121.0 N/A 7.0 165.0 N/A N/A 109.0
As = arsenic; Ba = barium; Be = beryllium; Cd = cadmium; Cr = chromium; Cu = copper; Hg = mercury; N/A = data not available; Ni = nickel; Pb = lead; Tl = thallium; V = vanadium; Zn = zinc.
Tamar Field Development Project EIA 113 Noble Energy Mediterranean Ltd March 2016 CSA-Noble-FL-16-2650-08-REP-01-FIN-REV04
Hydrocarbons
TPH concentrations throughout the survey area were generally within the 99% CL of the Tamar Field mean (Figure 1-73) and the Levantine Basin mean, with the exception of grid cells surrounding the Tamar-1/Tamar-6 and Tamar SW-1 wellsites. The approximate distance from the center point of affected grid cells D09, F08, and G08 to the Tamar-6 wellsite is 1.55 km; while the approximate distance of affected grid cells D20 and E20 to the Tamar SW-1 wellsite is 1 km (Figure 1-38). Hydrocarbons were a minor component of the mud used to drill the Tamar wellsites, and slightly elevated levels of TPH at these locations may be indicative of minor impacts due to drilling and production activities. TPH concentrations throughout the field, even in the slightly elevated grid cells, are low and are at concentrations that do not pose a threat to the environment.
Hydrocarbons were analyzed further to determine concentrations of the 16 USEPA priority PAHs. All individual PAH concentrations were below the Levantine Basin mean (Figure 1-74). Total PAH concentrations (less than 60 parts per billion [ppb]) were within the 99% CL of the Tamar Field mean (Figure 1-75), below the Levantine Basin mean (77.5 ± 19 ppb), and well below ERL (4,022 ppb) and ERM (44,702 ppb) values for total PAHs in marine sediment.
The Fossil Fuel Pollution Index (FFPI) was calculated to determine the percentage of fossil fuel PAHs relative to total PAHs (Boehm and Farrington, 1984). The FFPI is based on the knowledge that combustion-derived (pyrogenic) PAH assemblages are enriched in three- to five-ringed PAH compounds while fossil fuels (petrogenic) are enriched in polynuclear organosulfur compounds (e.g., dibenzothiophene) and two- to three-ringed PAH assemblages (Steinhauer and Boehm, 1992). The FFPI is calculated by the following equation (Boehm and Farrington, 1984):
�𝛴𝛴 𝑛𝑛𝑛𝑛𝑛𝑛ℎ𝑡𝑡ℎ𝑛𝑛𝑎𝑎𝑎𝑎𝑛𝑛𝑎𝑎𝑎𝑎(𝐶𝐶𝑜𝑜− 𝐶𝐶4) + 𝛴𝛴 𝑑𝑑𝑑𝑑𝑑𝑑𝑎𝑎𝑛𝑛𝑑𝑑𝑑𝑑𝑡𝑡ℎ𝑑𝑑𝑑𝑑𝑛𝑛ℎ𝑎𝑎𝑛𝑛𝑎𝑎𝑎𝑎(𝐶𝐶𝑜𝑜− 𝐶𝐶3) + 12𝛴𝛴 𝑛𝑛ℎ𝑎𝑎𝑛𝑛𝑛𝑛𝑛𝑛𝑡𝑡ℎ𝑟𝑟𝑎𝑎𝑛𝑛𝑎𝑎𝑎𝑎(𝐶𝐶𝑜𝑜 − 𝐶𝐶1) + +𝛴𝛴 𝑛𝑛ℎ𝑎𝑎𝑛𝑛𝑛𝑛𝑛𝑛𝑡𝑡ℎ𝑟𝑟𝑎𝑎𝑛𝑛𝑎𝑎𝑎𝑎(𝐶𝐶2 − 𝐶𝐶4)�
𝛴𝛴 𝑃𝑃𝑃𝑃𝑃𝑃
An FFPI ratio of 0 to 0.25 indicates PAH assemblages dominated by pyrogenic sources, a ratio of approximately 0.25 to 0.49 is indicative of intermediate PAH assemblages containing a mix of pyrogenic and petrogenic sources, and a ratio of 0.5 to 1.0 is indicative of PAH assemblages dominated by petrogenic sources (Boehm and Farrington, 1984).
The FFPI ratio for sediments throughout the Tamar Field are classified as either having pyrogenic or pyrogenic/petrogenic sources (Figure 1-76). Most of the sediments classified as having a mixture of pyrogenic/petrogenic sources are far from the wellsites and none directly surround any wellsite.
Radionuclides
Ambient radium concentrations in most natural soils and rocks are approximately 0.5 to 5.0 pCi g-1 of total radium (U.S. Geological Survey, 1999). Ambient concentrations of thorium (Th) 228 in sediments range from 0.36 to 1.93 pCi/g (Agency for Toxic Substances and Disease Registry, 1990). The USEPA (1998) established a protective health-based level for radium and thorium of 5 pCi g-1 at the sediment surface as a threshold for the cleanup of the top 15 cm of soil from contaminated U.S. Superfund sites.
All radionuclide concentrations within the Tamar Field are considered natural ambient concentrations (Agency for Toxic Substances and Disease Registry, 1990; U.S. Geological Survey, 1999) and are below levels of concern as outlined by the USEPA (1998) protective health-based level recommendations. High-resolution variations of sediment Ra 226 and Ra 228 as well as Th 228 concentrations are shown in Figures 1-77 to 1-79. All values were within the 99% CL for radionuclide concentrations within the Levantine Basin.
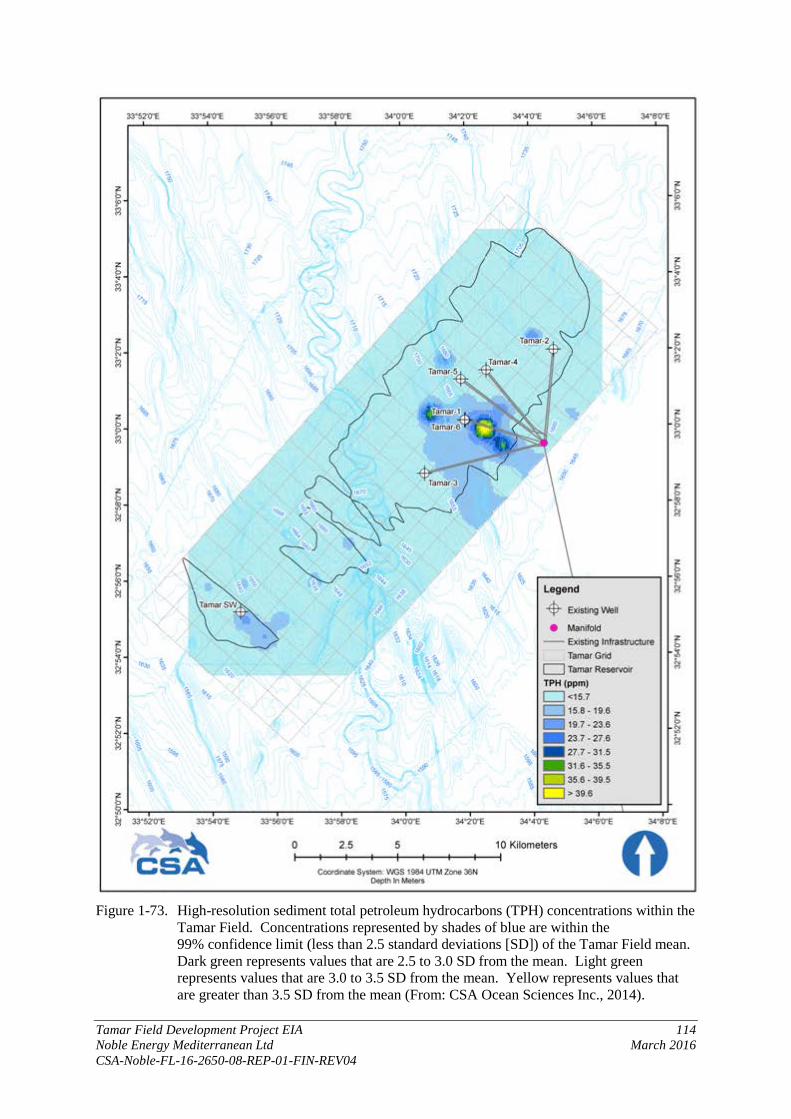
Tamar Field Development Project EIA 114 Noble Energy Mediterranean Ltd March 2016 CSA-Noble-FL-16-2650-08-REP-01-FIN-REV04
Figure 1-73. High-resolution sediment total petroleum hydrocarbons (TPH) concentrations within the
Tamar Field. Concentrations represented by shades of blue are within the 99% confidence limit (less than 2.5 standard deviations [SD]) of the Tamar Field mean. Dark green represents values that are 2.5 to 3.0 SD from the mean. Light green represents values that are 3.0 to 3.5 SD from the mean. Yellow represents values that are greater than 3.5 SD from the mean (From: CSA Ocean Sciences Inc., 2014).

Tamar Field Development Project EIA 115 Noble Energy Mediterranean Ltd March 2016 CSA-Noble-FL-16-2650-08-REP-01-FIN-REV04
Figure 1-74. Mean (+ standard deviation) concentrations for the 16 U.S. Environmental Protection
Agency (USEPA) priority polycyclic aromatic hydrocarbons (PAHs) for sediment samples collected in the Tamar Field (top). For comparative purposes, PAH signatures for the Levantine Basin Mean and Gulf of Mexico Crude Oil (SRM2779) are also shown (note scale change). Black = 2 rings (naphthalene); blue = 3 rings (phenanthrene, fluorene, acenaphthylene, acenaphthene, anthracene); green = 4 rings (chrysene, fluoranthracene, pyrene, benzo[a]anthracene); yellow = 5 rings (benzo[b]fluoranthene, benzo[k,j]fluoranthene, benzo[a]pyrene, and diben[a,h]anthracene); orange = 6 rings (ideno[1,2,3-cd]pyrene, benzo[g,h,i]perylene) (From: CSA Ocean Sciences Inc., 2014).
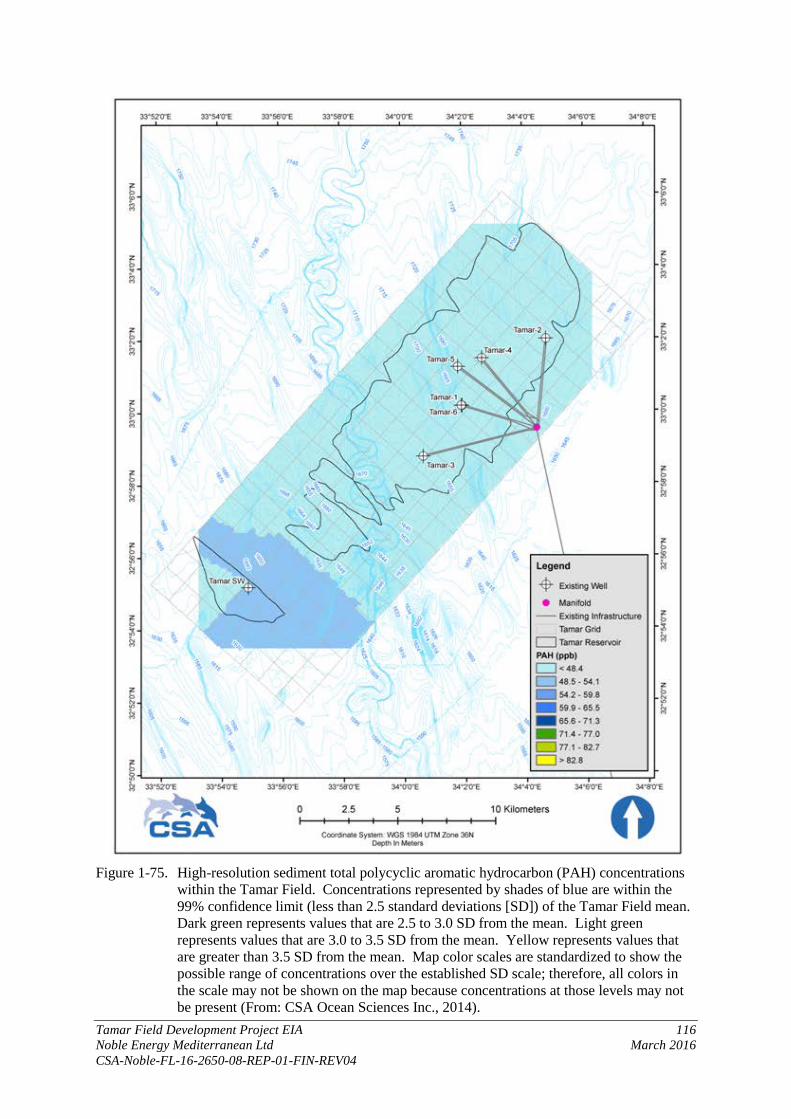
Tamar Field Development Project EIA 116 Noble Energy Mediterranean Ltd March 2016 CSA-Noble-FL-16-2650-08-REP-01-FIN-REV04
Figure 1-75. High-resolution sediment total polycyclic aromatic hydrocarbon (PAH) concentrations
within the Tamar Field. Concentrations represented by shades of blue are within the 99% confidence limit (less than 2.5 standard deviations [SD]) of the Tamar Field mean. Dark green represents values that are 2.5 to 3.0 SD from the mean. Light green represents values that are 3.0 to 3.5 SD from the mean. Yellow represents values that are greater than 3.5 SD from the mean. Map color scales are standardized to show the possible range of concentrations over the established SD scale; therefore, all colors in the scale may not be shown on the map because concentrations at those levels may not be present (From: CSA Ocean Sciences Inc., 2014).

Tamar Field Development Project EIA 117 Noble Energy Mediterranean Ltd March 2016 CSA-Noble-FL-16-2650-08-REP-01-FIN-REV04
Figure 1-76. Calculated Fossil Fuel Pollution Index (FFPI) ratios within the Tamar Field. Light blue
represents an FFPI ratio of 25%, which indicates a polycyclic aromatic hydrocarbon (PAH) assemblage dominated by pyrogenic sources. Dark blue represents an FFPI ratio between 25% and 40%, which is indicative of a mixture of pyrogenic and petrogenic sources. Green represents an FFPI ratio between 40% and 100% which indicates a PAH assemblage dominated by petrogenic sources. Map color scales are standardized to show the possible range of concentrations over the established SD scale; therefore, all colors in the scale may not be shown on the map because concentrations at those levels may not be present (From: CSA Ocean Sciences Inc., 2014).

Tamar Field Development Project EIA 118 Noble Energy Mediterranean Ltd March 2016 CSA-Noble-FL-16-2650-08-REP-01-FIN-REV04
Figure 1-77. High-resolution sediment radium 226 concentrations within the Tamar Field.
Concentrations represented by shades of blue are within the 99% confidence limit (less than 2.5 standard deviations [SD]) of the Tamar Field mean. Dark green represents values that are 2.5 to 3.0 SD from the mean. Light green represents values that are 3.0to 3.5 SD from the mean. Yellow represents values that are greater than 3.5 SD from the mean. Map color scales are standardized to show the possible range of concentrations over the established SD scale; therefore, all colors in the scale may not be shown on the map because concentrations at those levels may not be present (From: CSA Ocean Sciences Inc., 2014).

Tamar Field Development Project EIA 119 Noble Energy Mediterranean Ltd March 2016 CSA-Noble-FL-16-2650-08-REP-01-FIN-REV04
Figure 1-78. High-resolution sediment radium 228 concentrations within the Tamar Field.
Concentrations represented by shades of blue are within the 99% confidence limit (less than 2.5 standard deviations [SD]) of the Tamar Field mean. Dark green represents values that are 2.5 to 3.0 SD from the mean. Light green represents values that are 3.0 to 3.5 SD from the mean. Yellow represents values that are 3.5 SD from the mean. Map color scales are standardized to show the possible range of concentrations over the established SD scale; therefore, all colors in the scale may not be shown on the map because concentrations at those levels may not be present (From: CSA Ocean Sciences Inc., 2014).

Tamar Field Development Project EIA 120 Noble Energy Mediterranean Ltd March 2016 CSA-Noble-FL-16-2650-08-REP-01-FIN-REV04
Figure 1-79. High-resolution sediment thorium 228 concentrations within the Tamar Field.
Concentrations represented by shades of blue are within the 99% confidence limit (less than 2.5 standard deviations [SD]) of the Tamar Field mean. Dark green represents values that are 2.5 to 3.0 SD from the mean. Light green represents values that are 3.0 to 3.5 SD from the mean. Yellow represents values that are greater than 3.5 SD from the mean. Map color scales are standardized to show the possible range of concentrations over the established SD scale; therefore, all colors in the scale may not be shown on the map because concentrations at those levels may not be present (From: CSA Ocean Sciences Inc., 2014).
Tamar Field Development Project EIA 121 Noble Energy Mediterranean Ltd March 2016 CSA-Noble-FL-16-2650-08-REP-01-FIN-REV04
1.2.5 Culture and Heritage Sites
Noble Energy conducted a geophysical survey and shallow geotechnical investigation of the Tamar Development area and pipeline routes for potential cultural and heritage sites. A total of 95 side-scan sonar contacts were identified in the Tamar Field; 2 correspond to well locations and 15 indicate possible anchor locations (DOF Subsea UK, 2010a). The rest are classified as unidentified because they have not been visually inspected. The side-scan contact list is presented in Appendix C. One of the largest unidentified contacts (Figure 1-80) has dimensions 10.5-m × 0.9-m × 6.8-m and can be seen on the subbottom profile.
Figure 1-80. Side-scan sonar image (left) and subbottom image (right) showing contact
number 20 (From: DOF Subsea UK, 2010a).
1.2.6 Meteorology and Air Quality
There are no publicly available air quality data for the offshore areas of Israel, nor are site-specific offshore air quality measurements available for the Tamar Field area. Given the relatively remote location of the offshore area of interest and prevailing wind patterns (i.e., predominant westerly winds January through October; variable November and December), air quality offshore likely reflects the long-range transport of natural and anthropogenic air pollutants, with contribution from regional sources. The air quality issues noted onshore have not affected offshore air quality in the Tamar Field. In the offshore environment of the eastern Mediterranean Sea where the Tamar Field is located, air quality is expected to be good.
The primary pollutants involved in the photochemical cycles that determine air quality are nitrogen oxides (NOx), composed mainly of nitric oxide (NO) and nitrogen dioxide (NO2), and volatile organic compounds (VOCs). Another important group of air pollutants are the oxidants (e.g., ozone [O3] or peroxyacetal nitrate [PAN]), which are byproducts of the aforementioned primary compounds. Air quality measurements in coastal Israel have shown consistent decline in the last century, with recent improvements evident as a result of more stringent emissions regulations and the transition of major combustion sources from fuel oil to natural gas. During recent years, shipping and airport activities (i.e., vessel and aircraft emissions, support operations) have become significant regional sources of air pollution (Maritime Communication Services, Inc. et al., 2008).
Air quality offshore Israel is influenced by long-range transport of anthropogenic and natural air pollutants. Air pollutants of anthropogenic origin that reach Israeli waters originate mainly upstream of the main flow patterns. These pollutants are emitted from sources located in Eastern Europe, the Black Sea, and the Balkan area as well as the Western Mediterranean, Greece, and Turkey. Desert dust that arises from the Sahara is transported offshore into the Mediterranean mainly during the transient seasons of spring and autumn (Michaelidis et al., 1999). Dust transport offshore Israel is a
Tamar Field Development Project EIA 122 Noble Energy Mediterranean Ltd March 2016 CSA-Noble-FL-16-2650-08-REP-01-FIN-REV04
rather episodic phenomenon. Dust is usually transported from the Sahara northward under anticyclonic conditions or ahead of a trough.
Because the Application Area is more than 10 km from the Israeli coast, onshore air quality is not reviewed in this report. No special meteorological conditions that might cause conditions of dispersal that will give rise to high air pollution concentrations in the environment are known for the Application Area.
1.2.7 Noise
Acoustic Environment
The underwater acoustic environment includes sound produced from a variety of natural and anthropogenic sources. Some natural sounds are biological (e.g., fishes, marine mammals, some invertebrates), while others are environmental (e.g., waves, earthquakes, rain). Among the anthropogenic sources, many produce noise as a byproduct of their normal operations (e.g., shipping, drilling, tidal turbines), whereas others (e.g., sonars, airguns) are produced for specific remote sensing purposes. These sounds combine to give the continuum of noise against which all acoustic receivers have to detect required signals. Ambient noise is generally made up of three constituent types – wideband continuous noise, tonals, and impulsive noise. Ambient noise covers the whole acoustic spectrum from below 1 Hz to well above 100 kHz (Urick, 1983). Above this frequency, the ambient noise level drops below thermal noise levels.
Although there is no specific measurement of ambient noise in the Tamar Field study area, the most likely dominant sources of ambient noise for a location in proximity to one of the busiest sea routes in the world will be industrial noise and distant shipping in the absence of wind and precipitation. In addition, the areas affected by different noise contributions likely will vary throughout the year, as acoustic propagation loss varies throughout the seasons.
Potter et al. (1997) measured ambient noise levels in shallow water (i.e., 4 to 5 m water depth) off Haifa, noting that measurements of ambient noise ranged between 100 and 10,000 Hz. It is clear that the Haifa site exhibited moderate shipping activity. Further, biological sound sources (i.e., snapping shrimp) dominated the spectrum above a few hundred hertz, exceeding anticipated levels by 20 dB or more above 10 kHz.
Galil (2006) broadly characterized the acoustic environment of the Mediterranean and noted that the Eastern Mediterranean region represents one of the busiest sea routes in the world with a number of high volume port facilities and crowded shipping lanes. The opening of the Suez Canal significantly increased the volume of shipping traffic, particularly in the Eastern Mediterranean region. While shipping noise affects large segments of the world’s oceans, noise levels are greatest near well-travelled shipping lanes, straits and canals, and busy ports. According to Galil (2006), the ambient noise in areas of heavy shipping could range between 85 and 95 dB. Supertankers, large bulk carriers, container ships, and cargo vessels produce sound with source levels of approximately 190 dB (Ross, 1976; Richardson et al., 1995; National Research Council, 2003a).
1.2.8 Marine Transportation System and Infrastructure
1.2.8.1 Shipping and Maritime Operations
Figures 1-81 through 1-84 are based on data available from the Ministry of Transport (Shipping and Ports Authority) and the Israel Port Authority website. These websites present a summary of information on ship visits and source and destination data for containers passing through both the Port of Haifa and Ashdod Port; data are available for both cargo shipping and passenger traffic. Figure 1-81 presents the annual number of ship visits to the ports of Israel from 2000 to 2009. Source and destination data for ship visits are presented in Figures 1-82 and 1-83, respectively.

Tamar Field Development Project EIA 123 Noble Energy Mediterranean Ltd March 2016 CSA-Noble-FL-16-2650-08-REP-01-FIN-REV04
Figure 1-84 presents the total amount of cargo transported through the ports of Israel from 1995 to 2008.
In 2010, the movement of containers at the Port of Haifa, Ashdod Port, and Port of Eilat amounted to approximately 2.281 million containers, in thousand 20-ft equivalent units (TEU), compared to 2.032 million TEU in the same period in 2009, an increase of 12.3% in container traffic. During this period, container traffic increased by 11.5% through the Port of Haifa and 13.9% through the Port of Eilat. Total freight (in tons) at the Port of Haifa, Ashdod Port, Port of Eilat, and Israel Shipyards (Haifa) in 2010 amounted to approximately 43.3 million tons, compared to approximately 37 million tons in 2009, an increase of approximately 20.5% (Israel Ports Authority, 2011).
Figure 1-81. Ship docking at the ports of Israel, 2000 to 2009 (From: Ministry of Transport and Road
Safety, Shipping and Ports Authority, 2009).
0
1000
2000
3000
4000
5000
6000
7000
2000 2001 2002 2003 2004 2005 2006 2007 2008 2009
year
ship
s vi
sit
Eilat
Ashdod
Haifa

Tamar Field Development Project EIA 124 Noble Energy Mediterranean Ltd March 2016 CSA-Noble-FL-16-2650-08-REP-01-FIN-REV04
Figure 1-82. Sources of shipping containers arriving at the main ports of Israel (in thousand 20-ft
equivalent units [TEU]) (From: Israel Ports Authority, 2011).
Figure 1-83. Destination of shipping containers from main ports of Israel (in thousand 20-ft
equivalent units [TEU]) (From: Israel Ports Authority, 2011).
Thou
sand
TEU
Th
ousa
nd T
EU

Tamar Field Development Project EIA 125 Noble Energy Mediterranean Ltd March 2016 CSA-Noble-FL-16-2650-08-REP-01-FIN-REV04
Figure 1-84. Cargo volumes passing through Israeli commercial ports, 1995 to 2008. Blue = Port of
Eilat; green = Ashdod Port; red = Port of Haifa; and black = total (From: Ministry of Transport – Administration of Shipping & Ports, 2013).
1.2.8.2 Port of Haifa
The Port of Haifa is Israel’s largest port. The port contains a broad variety of facilities that allow for the shipping and transportation of all types of cargo as well as docking facilities for large passenger liners; it is also the location for Noble Energy’s onshore supply base, located at Israel Shipyards Ltd. The Port of Haifa handled a variety of cargo products in 2011, including local containers (8.19 million tons; 37%), transshipment containers (5.658 million tons; 26%), oil (2.815 million tons; 13%), bulk grain (2.680 million tons; 12%), bulk in grabs (1.412 million tons; 6%), and liquid chemicals (1.084 million tons; 5%) (Port of Haifa, 2012).
The port is operated by the Haifa Port Company, a government-owned company that is committed to the advancement of Israel’s economy and growth. The Haifa Port Company reportedly handled approximately 16 million tons of cargo during 2011, including 1.24 million TEUs of container traffic.
Several smaller terminal operators in the port handled another 7 tons, including the Israel Shipyards Port and specialized bulk handlers Dagon Grain Terminal and the Petroleum and Energy Infrastructures oil terminal. From 2001 to 2011, ship traffic at the Port of Haifa ranged between 2,602 and 3,066 voyages per year; average annual ship traffic was 2,796 voyages (Port of Haifa, 2012).
1.2.8.3 Shipping Lanes
Numerous shipping lanes cross Israel’s territorial waters, including shipping lanes from the ports of Israel to destinations in southern Europe, Cyprus, and North Africa, and routes between Alexandria and Port Said in Egypt to destinations in Lebanon and Syria. Shipping fairways relative to the Tamar Field, one of which traverses the field, were shown previously in Figure 1-3.
1.2.8.4 Telecommunications
The telecommunication system in Israel is the most developed system in the region. It is based mainly on two sea-based cables operated by Med Nautilus: MED1 and LEV. A Med Nautilus submarine telecommunications cable oriented perpendicular to the Israeli shore is located
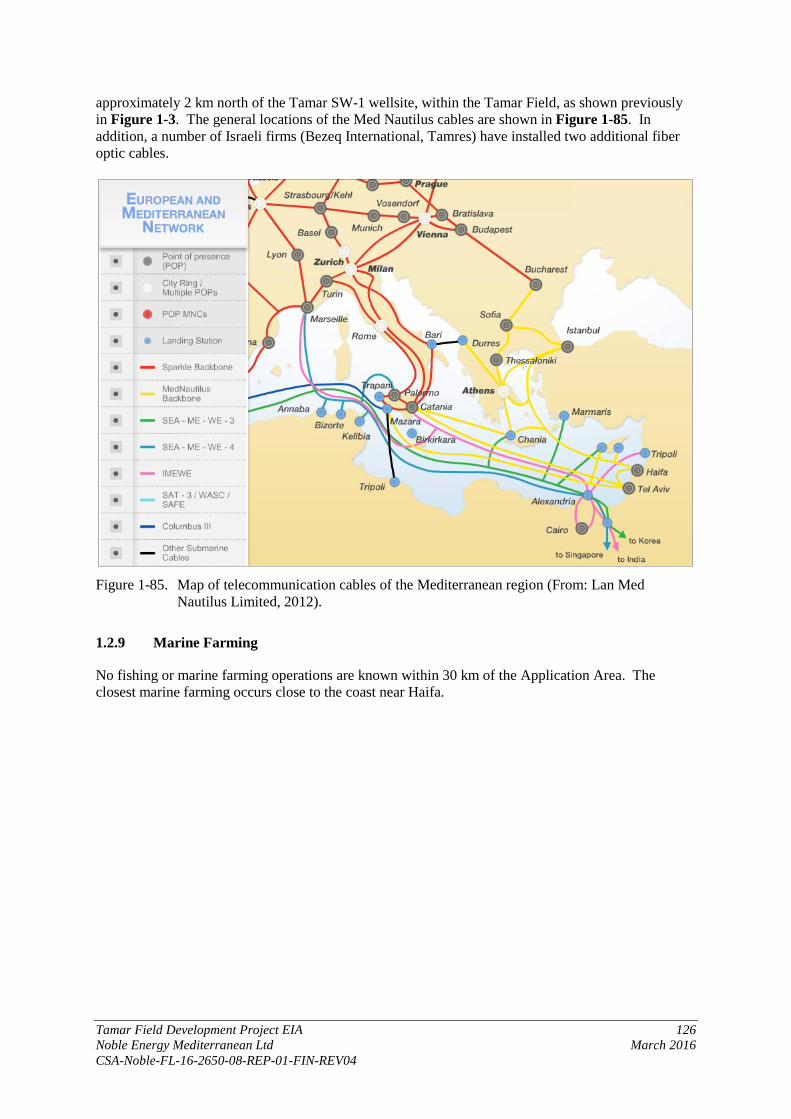
Tamar Field Development Project EIA 126 Noble Energy Mediterranean Ltd March 2016 CSA-Noble-FL-16-2650-08-REP-01-FIN-REV04
approximately 2 km north of the Tamar SW-1 wellsite, within the Tamar Field, as shown previously in Figure 1-3. The general locations of the Med Nautilus cables are shown in Figure 1-85. In addition, a number of Israeli firms (Bezeq International, Tamres) have installed two additional fiber optic cables.
Figure 1-85. Map of telecommunication cables of the Mediterranean region (From: Lan Med
Nautilus Limited, 2012).
1.2.9 Marine Farming
No fishing or marine farming operations are known within 30 km of the Application Area. The closest marine farming occurs close to the coast near Haifa.

Tamar Field Development Project EIA 127 Noble Energy Mediterranean Ltd March 2016 CSA-Noble-FL-16-2650-08-REP-01-FIN-REV04
CHAPTER 2: REASONS FOR PREFERENCE OF THE LOCATION OF THE PROPOSED PLAN AND POSSIBLE ALTERNATIVES
2.1 OVERVIEW AND APPLICATION RATIONALE
The Tamar Field Development Project includes the completion of the Tamar SW-1 well, an infield subsea tie-back for the Tamar SW-1 well into the existing Tamar subsea field architecture and the drilling, completion and infrastructure construction for three additional wells: Tamar-7, Tamar-8, and Tamar-9. The Tamar SW Field is located within the southwest reservoir of the Tamar lease block, approximately 98 km west-northwest of Haifa, within the Levantine Basin. It was discovered based on the interpretation of seismic and geophysical survey data, and confirmed by the drilling of the Tamar SW-1 exploration well in 2013. Tamar SW-1 was drilled to a depth of 5,377 m measured depth and established the presence of 134 m gas column in three discrete sand units. The Tamar Field Development Project will complete this well for production.
Tamar-7, Tamar-8, and Tamar-9 will be drilled in the main Tamar Reservoir where five existing wells (Tamar-2, Tamar-3, Tamar-4, Tamar-5, and Tamar-6) are currently producing. The three new wells will increase production from the field based on the information gathered from the existing wells.
The rationale for the project is to increase the production from the Tamar Field by tying in the Tamar SW Reservoir and expanding the existing production from the main Tamar Reservoir. The Tamar SW Reservoir will have a production capacity of 250 million standard cubic feet per day (mmscfd). During peaks of high market demand periods for a limited time of few hours, Tamar SW well may be added to the existing production system in order to increase the system capacity. In this limited periods of time an increase of 4-5% in gas production is expected with a minor increase in discharges. In any case the total gas capacity, based on the current actual capacity, will not increase above the daily maximum production design of 1.2 BCF d-1.Tamar-8 may be drilled, completed and hooked up as part of a standalone campaign to provide a redundant well.
2.2 LOCATION ALTERNATIVES
The Tamar Field Development Project will put in place the infrastructure necessary for production from the existing Tamar SW-1 well and add three additional wells to the existing Tamar Reservoir wells within the Tamar license area. The Tamar Field manifolds are in place. The pipeline route from the Tamar SW-1 well to the manifold in the Tamar Field was determined based on seafloor morphology and preliminary survey information. The pipeline routes have been selected to avoid obstacles and the routes have been reviewed to ensure that there are no significant biological communities or archaeological sites along the routes.
The proposed Tamar-7, -8, and -9 well locations have been selected based on the interpretation of seismic and geophysical survey data acquired in the Tamar Field, as well as results from previous wells completed in the Tamar Field and drilled into the geological formations. Other factors (e.g., environmental, planning, engineering, economics) were considered and helped to identify optimal project locations.
The proposed location and borehole trajectory of each individual Tamar Field Development Project well was selected and the well drilling program designed to minimize the risk of encountering the following shallow hazards:
• Seafloor instability – The proposed wells are in a relatively flat location away from any seafloor channel or fault scarp.
• Shallow faulting – The locations of the proposed wells avoid all areas of supra-salt thrust faulting and vertical faulting.

Tamar Field Development Project EIA 128 Noble Energy Mediterranean Ltd March 2016 CSA-Noble-FL-16-2650-08-REP-01-FIN-REV04
• Anomalies within salt – The proposed wells are expected to intersect clastic interbeds where there is minimal deformation.
Geohazards and environmental sensitivities were considered when selecting the drillsite locations (see Section 3.2.4.2). Gardline Surveys Inc. (2013a,b; 2014, 2016) performed individual geohazard assessments for each proposed drillsite and surrounding area based on 3D seismic data. The resulting well clearance letters are summarized in Section 1.2.1. The drillsites are located in water depths ranging from 1,665 to 1,690 m. The seafloor at the proposed drillsites is smooth and featureless. There are no significant seafloor features (such as hard bottom areas or deepwater coral formations), and there are high-amplitude signatures indicative of fluid expulsion within 500 m of each proposed well location. The seafloor sediments are believed to be composed of silts and clays with interbed sands, which become firmer with increasing water depth.
Within the broader area, the Tamar Field Development Project drillsites were selected for seafloor characteristics, shallow subsurface intervals of possible concern, and the optimal penetration point of the gas reservoir. An enlarged area encompassing the entire field was studied to define the original drillsite locations, from which the proposed locations were set to avoid potential gas hazards. The proposed drillsites were chosen to avoid active seafloor channels, shallow faulting, and potential shallow gas hazards associated with amplitude anomalies and low-angle slump escarpments or other seafloor topographic elements. The proposed final location for each drillsite was chosen to avoid deeper faults. The safety, environmental, and drilling risks at all proposed drillsite locations have been minimized by paying close attention to the seafloor characteristics and incorporating improved seismic resolution and interpretation of the shallow subsurface.
The following additional specific criteria cited in the “Guidelines for Preparation of Environmental Impact Document” were taken into account by Noble Energy:
• Structural analysis issues; the size of the field, and the location of the target stratum – these issues were considered as part of the geological evaluation as described in Section 1.2.1.
• Landslides and liquefaction – these and other potential geohazards were evaluated based on the geohazards survey report and well clearance letters as described in the preceding paragraphs of this section and in Section 1.2.1.
• Marine reserves – none are present in the Application area. • “Regions defined as special regions such as ridges, canyons or deep coral reefs, sponges, clams or
other sedentary organisms” – none are present in the Application area (see benthic communities discussion in Sections 1.2.1 and 1.2.3).
• “Proximity to towns and residential areas, visibility and appearance from the coastline” – not relevant due to the distance from shore (~90 km from Haifa).
• “Habitats of animals in danger of extinction” – there are no specific “critical” habitats for Endangered or threatened species in the Application area. Endangered or threatened species that may be present in the region are discussed in Section 1.2.3 and are included in the impact analysis in Chapter 4.
• Shipping lanes – There is one shipping lane in the Tamar Field which connects the area with the Port of Haifa (see Section 1.2.8). Appropriate measures will be taken to avoid any conflicts with shipping (see Section 5.2.10).
• Infrastructure, communications and energy lines – known regional infrastructure proximal to the drillsites includes 1) A Med Nautilus submarine telecommunications cable oriented perpendicular to the Israeli shore is located approximately 2 km north of the Tamar SW-1 wellsite, within the Tamar Field, as shown in Figure 1-4.. The drillsites have been selected to avoid any physical impacts to the telecommunications cable; all drillsites are more than 1 km away from the nearest cable. No seafloor-disturbing activities will be conducted near the telecommunications cable and no impacts are expected (see Chapter 4).
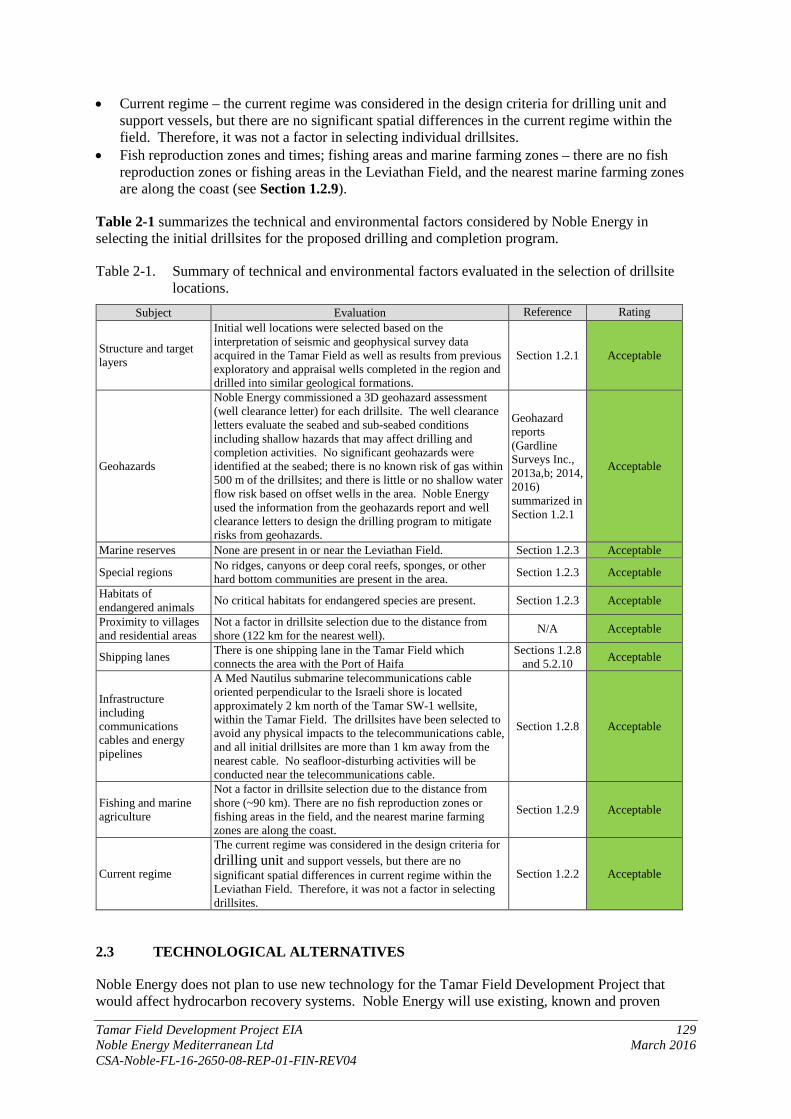
Tamar Field Development Project EIA 129 Noble Energy Mediterranean Ltd March 2016 CSA-Noble-FL-16-2650-08-REP-01-FIN-REV04
• Current regime – the current regime was considered in the design criteria for drilling unit and support vessels, but there are no significant spatial differences in the current regime within the field. Therefore, it was not a factor in selecting individual drillsites.
• Fish reproduction zones and times; fishing areas and marine farming zones – there are no fish reproduction zones or fishing areas in the Leviathan Field, and the nearest marine farming zones are along the coast (see Section 1.2.9).
Table 2-1 summarizes the technical and environmental factors considered by Noble Energy in selecting the initial drillsites for the proposed drilling and completion program.
Table 2-1. Summary of technical and environmental factors evaluated in the selection of drillsite locations.
Subject Evaluation Reference Rating
Structure and target layers
Initial well locations were selected based on the interpretation of seismic and geophysical survey data acquired in the Tamar Field as well as results from previous exploratory and appraisal wells completed in the region and drilled into similar geological formations.
Section 1.2.1 Acceptable
Geohazards
Noble Energy commissioned a 3D geohazard assessment (well clearance letter) for each drillsite. The well clearance letters evaluate the seabed and sub-seabed conditions including shallow hazards that may affect drilling and completion activities. No significant geohazards were identified at the seabed; there is no known risk of gas within 500 m of the drillsites; and there is little or no shallow water flow risk based on offset wells in the area. Noble Energy used the information from the geohazards report and well clearance letters to design the drilling program to mitigate risks from geohazards.
Geohazard reports (Gardline Surveys Inc., 2013a,b; 2014, 2016) summarized in Section 1.2.1
Acceptable
Marine reserves None are present in or near the Leviathan Field. Section 1.2.3 Acceptable
Special regions No ridges, canyons or deep coral reefs, sponges, or other hard bottom communities are present in the area. Section 1.2.3 Acceptable
Habitats of endangered animals No critical habitats for endangered species are present. Section 1.2.3 Acceptable
Proximity to villages and residential areas
Not a factor in drillsite selection due to the distance from shore (122 km for the nearest well). N/A Acceptable
Shipping lanes There is one shipping lane in the Tamar Field which connects the area with the Port of Haifa
Sections 1.2.8 and 5.2.10 Acceptable
Infrastructure including communications cables and energy pipelines
A Med Nautilus submarine telecommunications cable oriented perpendicular to the Israeli shore is located approximately 2 km north of the Tamar SW-1 wellsite, within the Tamar Field. The drillsites have been selected to avoid any physical impacts to the telecommunications cable, and all initial drillsites are more than 1 km away from the nearest cable. No seafloor-disturbing activities will be conducted near the telecommunications cable.
Section 1.2.8 Acceptable
Fishing and marine agriculture
Not a factor in drillsite selection due to the distance from shore (~90 km). There are no fish reproduction zones or fishing areas in the field, and the nearest marine farming zones are along the coast.
Section 1.2.9 Acceptable
Current regime
The current regime was considered in the design criteria for drilling unit and support vessels, but there are no significant spatial differences in current regime within the Leviathan Field. Therefore, it was not a factor in selecting drillsites.
Section 1.2.2 Acceptable
2.3 TECHNOLOGICAL ALTERNATIVES
Noble Energy does not plan to use new technology for the Tamar Field Development Project that would affect hydrocarbon recovery systems. Noble Energy will use existing, known and proven
Tamar Field Development Project EIA 130 Noble Energy Mediterranean Ltd March 2016 CSA-Noble-FL-16-2650-08-REP-01-FIN-REV04
technology to limit risk for the Tamar Field Development Project. Selected alternatives for several mechanical systems include:
2.3.1 Drilling Technology Alternatives
The wells are planned to be drilled vertically to the 13⅝ in. casing point. Below that, a directional pilot hole will be drilled to total depth, the reservoir will be evaluated, and the wellbore will be sidetracked back to vertical, offsetting the original wellbore, down to the top of reservoir as required. The wells are planned with a generous target tolerance. Control drilling or sliding to maintain the wellbore vertically is not a requirement; however, care will be taken to minimize dog legs.
2.3.1.1 Rotary Steerable Systems
Rotary steerable systems (RSSs) are designed to drill vertically or directionally with continuous rotation from the surface, eliminating the need to slide a steerable motor. Penetration rates improve with an RSS because there are no stationary components to create friction, which reduces efficiency and anchors the bottom hole assembly in the hole. Flow of drilled cuttings past the bottom hole assembly is enhanced because annular bottlenecks are not created in the wellbore. State-of-the-art RSSs have minimal interaction with the borehole, thereby preserving borehole quality. The most advanced systems exert consistent side force, similar to traditional stabilizers that rotate with the drillstring, or orient the bit in the desired direction while continuously rotating at the same number of rotations per minute as the drillstring. RSSs offer precise steering control that maximizes reservoir contact for increased production. The technology reduces the uncertainty of drilling away from the target due to deviation prone sections (salt sections). The precision steering system can be combined with polycrystalline diamond compact bits, modular motors, near-bit sensors, and measurement while drilling (MWD) and logging while drilling (LWD) tools. Based on real-time formation evaluation, better reservoir navigation decisions can be made.
2.3.1.2 Polycrystalline Diamond Compact Bits
Polycrystalline diamond compact bits provide superior directional control, longer run life, improved rate of penetration, enhanced durability, and drilling efficiency. The synthetic diamond disks shear the rock with a continuous scraping motion. Polycrystalline diamond compact bits are effective at drilling shale formations, especially when used in combination with oil-based muds.
2.3.1.3 Modular Motors
Modular motors are positive displacement drilling motors that use the hydraulic horsepower of the drilling fluid to drive the drill bit. Mud motors are used extensively in jetting in conductor casing and directional drilling operations.
2.3.1.4 Measurement While Drilling
Measurement while drilling (MWD) provides evaluation of physical properties, usually including pressure, temperature and wellbore trajectory in 3D space while extending a wellbore. MWD is standard practice in offshore directional wells. The measurements are made downhole, stored in solid-state memory for some time, and later transmitted to the surface. Data transmission methods vary from company to company but usually involve digitally encoding data and transmitting it to the surface as pressure pulses in the mud system. These pressures may be positive, negative, or continuous sine waves. Some MWD tools have the ability to store measurements for later retrieval with wireline or when the tool is tripped out of the hole, if the data transmission link fails. MWD tools that measure formation parameters (resistivity, porosity, sonic velocity, gamma ray) are referred to as logging while drilling (LWD) tools. LWD tools use similar data storage and transmission
Tamar Field Development Project EIA 131 Noble Energy Mediterranean Ltd March 2016 CSA-Noble-FL-16-2650-08-REP-01-FIN-REV04
systems, with some having more solid-state memory to provide higher resolution logs after the tool is tripped out than is possible with the relatively low bandwidth, mud-pulse data transmission system.
2.3.1.5 Logging While Drilling
Logging while drilling (LWD) provides measurements of formation properties during the excavation of the hole, or shortly thereafter, through the use of tools integrated into the bottom hole assembly. LWD has the advantage of measuring properties of a formation before drilling fluids invade deeply. Further, many wellbores prove to be difficult to measure with conventional wireline tools. Timely LWD data can be used to guide well placement so that the wellbore remains within the zone of interest or in the most productive portion of a reservoir.
2.3.1.6 Near-Bit Sensors
Near-bit sensors placed below an RSS can accurately pick a casing point with the bit only 2.5 m below the RSS. The data are transmitted to the surface along with other LWD data farther up the bottom hole assembly without any signal detection issues. This helps steer the hole section to the best place in less time.
2.3.1.7 Drilling Fluid System
Section 3.2.2.4 of this report discusses the reasons for Noble Energy’s preference of the proposed drilling fluid system over the water-based mud (WBM) system used previously in the Tamar Field.
2.3.1.8 Blowout Preventer
Specifications and a description of the blowout preventer are discussed in Section 3.2.4.1.
2.3.2 Infrastructure and Pipeline Alternatives
2.3.2.1 Wall Thickness Design and Limit States
The wall thicknesses for the pipeline will be designed for the following limit states:
• Burst (pressure containment) during operations in a corroded condition: The pressure gradient produced by the internal and external fluid densities shall be taken into account for all water depths;
• Hydrotest pressure in a non-corroded condition: Hydrotest pressure is established by the appropriate code. The pressure gradient produced by the internal and external fluid densities shall be taken into account for all water depths;
• External pressure in a non-corroded condition during installation, and in a corroded condition during operation: This is a pure collapse load case without internal pressure;
• Bending and external pressure in a non-corroded condition during installation, and in a corroded condition during operation. This is a collapse/buckling with bending load case;
• Buckle propagation: The pipelines will not be designed against buckle propagation. Integral ring buckle arrestors will be used in the portion of the line in which a buckle can propagate, if initiated.
2.3.2.2 Design for Fatigue
The subsea equipment and pipeline designs will be reviewed and checked for low-frequency fatigue, based on the potential daily production variations. Potential for vortex-induced-vibrations acting on freespans that may lead to additional fatigue will be assessed. Slug-induced vibrations on freespans also may generate fatigue damage, which will be assessed as well.

Tamar Field Development Project EIA 132 Noble Energy Mediterranean Ltd March 2016 CSA-Noble-FL-16-2650-08-REP-01-FIN-REV04
2.3.2.3 Free Spans
Span analyses will be performed along the entire length of each pipeline. This is a two-step check. First, the maximum allowable span will be determined based on the pipeline design and environmental conditions, beyond which vibrations may occur. Second, after the detailed survey has been completed, a bottom roughness analysis will be performed during which the predicted free spans are tabulated and compared to the maximum allowable span. Where predicted spans exceed the maximum allowable, a fatigue analysis will be performed to assess the fatigue life of the freespanning pipeline segment. Post-lay mitigation measures may be necessary if excessively long spans are identified along the route.
A pre-lay mitigation measure has also been adopted; this compromises the real-time preliminary bottom roughness analysis performed during the pipeline route survey while the seafloor data are being collected. If excessive spans are found, an alternate route may be developed and surveyed and the pipelines re-routed. Potential re-route during the survey has several implications; as such any re-route decisions will be undertaken in close consultation with Noble Energy's technical and permitting leads as well as the project manager.
2.3.2.4 On-Bottom Stability and Slope Stability
The pipelines will be designed to be hydro-dynamically stable when loaded by ocean currents and waves. Under operational conditions, the flowline stability will be designed for a 100-year Average Return Period (ARP) storm. For empty pipe conditions during installation, the pipeline shall be designed to be stable, as a minimum, in storm conditions with a 1-year ARP.
Potential mudslides due to seismic hazards or localized seabed failure will be identified, and the risk to the Tamar subsea equipment, pipelines, and umbilicals will be properly analyzed.
2.3.2.5 Design Temperatures
The need for special pipeline insulation is not anticipated.
2.3.2.6 Thermal Analysis
Infield flowlines and the export pipelines are essentially straight and long lines. Analysis of expansion due to operating temperatures higher than installation temperatures will be performed. This analysis will quantify the effective (compressive) force; if the resultant forces are greater than the buckling force, global finite element analysis (FEA) will be performed. The FEA will characterize the post-buckling behavior as well as stresses and strains, with the pipelines designed accordingly.
2.3.2.7 Seismic Hazards
Noble Energy has conducted a thorough Probabilistic Seismic Hazards Assessment (PSHA), which developed the baseline seismotectonic model for the Tamar Reservoir Area and bedrock accelerations for Design Level events per code relevant for design of offshore structures (International Organization for Standardization [ISO] 19901-2, 2004). Upon subsequent acquisition of site-specific geophysical and geotechnical data, detailed site response spectra for shallow and seabed soils, including amplification/damping coefficients, were developed and applied for seismic design parameters for Tamar field infrastructure and the export pipeline system per the relevant codes (ISO 19901-2, 2004 and DNV OS-F101). The surface- and near-surface soils are consistent across the Tamar Reservoir Area where infrastructure was sighted and are predominantly clays; therefore, liquefaction was not considered a hazard.
Noble Energy has also acquired additional geophysical and geotechnical survey data at the Tamar SW location and along the tie-back pipeline/umbilical route back to the existing Tamar manifold. Based

Tamar Field Development Project EIA 133 Noble Energy Mediterranean Ltd March 2016 CSA-Noble-FL-16-2650-08-REP-01-FIN-REV04
on review of the existing Tamar SW survey and geotechnical data report, the conditions in the Tamar SW area appear similar to that in the original Tamar development area. Noble Energy therefore considers the existing body of the seismic hazards assessment, detailed site-specific response spectra, and resultant design parameters developed for the original Tamar development to be applicable to the SW expansion.
2.3.2.8 Hydrotesting
Noble Energy conducted a study (Brenner, 2014) of various options for the hydrotesting operation to be conducted during commissioning (see Section 3.6.1.7). Four options for the brine solution were evaluated, including two brine alternatives (CaCl2 and NaCl), 100% monoethylene glycol (MEG), and a 50/50 MEG/water mix. The proposed alternatives included discharging the hydrotest fluids subsea. The fate of the discharge plume and the initial dilution were evaluated along with other operational considerations, including the shape and dimensions of the discharge port and the small-scale mixing and entrainment processes in the vicinity of the port. Noble Energy will model the dispersion of these possible releases to evaluate their potential impacts.
2.4 ALTERNATIVES SUMMARY
The location and technology alternatives evaluated or referenced in this chapter are summarized in Table 2-2.
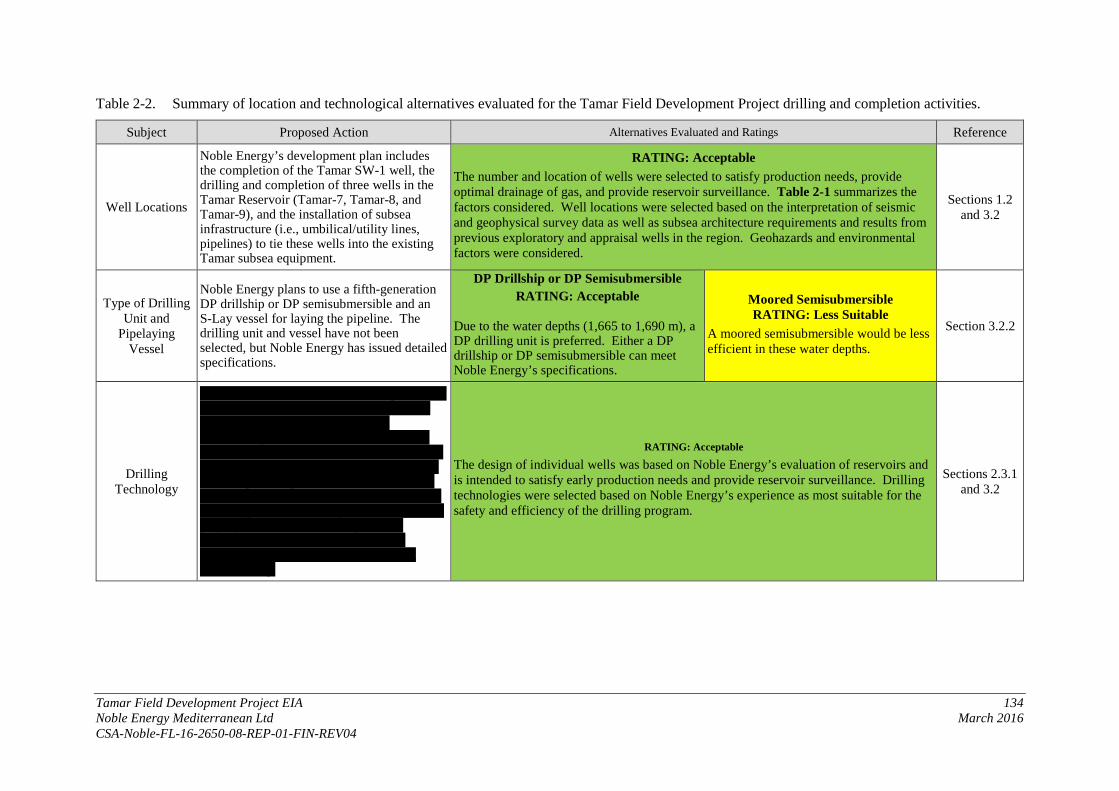
Tamar Field Development Project EIA 134 Noble Energy Mediterranean Ltd March 2016 CSA-Noble-FL-16-2650-08-REP-01-FIN-REV04
Table 2-2. Summary of location and technological alternatives evaluated for the Tamar Field Development Project drilling and completion activities.
Subject Proposed Action Alternatives Evaluated and Ratings Reference
Well Locations
Noble Energy’s development plan includes the completion of the Tamar SW-1 well, the drilling and completion of three wells in the Tamar Reservoir (Tamar-7, Tamar-8, and Tamar-9), and the installation of subsea infrastructure (i.e., umbilical/utility lines, pipelines) to tie these wells into the existing Tamar subsea equipment.
RATING: Acceptable The number and location of wells were selected to satisfy production needs, provide optimal drainage of gas, and provide reservoir surveillance. Table 2-1 summarizes the factors considered. Well locations were selected based on the interpretation of seismic and geophysical survey data as well as subsea architecture requirements and results from previous exploratory and appraisal wells in the region. Geohazards and environmental factors were considered.
Sections 1.2 and 3.2
Type of Drilling Unit and
Pipelaying Vessel
Noble Energy plans to use a fifth-generation DP drillship or DP semisubmersible and an S-Lay vessel for laying the pipeline. The drilling unit and vessel have not been selected, but Noble Energy has issued detailed specifications.
DP Drillship or DP Semisubmersible RATING: Acceptable
Due to the water depths (1,665 to 1,690 m), a DP drilling unit is preferred. Either a DP drillship or DP semisubmersible can meet Noble Energy’s specifications.
Moored Semisubmersible RATING: Less Suitable
A moored semisubmersible would be less efficient in these water depths.
Section 3.2.2
Drilling Technology
The wells (Tamar-7, -8, and -9) are planned to be drilled as as vertical or directional to the 13⅝ in. casing point. From there, a directional pilot hole will be drilled to total depth; the reservoir will be evaluated; and the wellbore will be sidetracked back to vertical, offsetting the original wellbore, down to the top of the reservoir, as required. Key drilling technologies include rotary steerable systems, polycrystalline diamond compact bits, modular mud motors, near-bit sensors, measurement while drilling, and logging while drilling.
RATING: Acceptable
The design of individual wells was based on Noble Energy’s evaluation of reservoirs and is intended to satisfy early production needs and provide reservoir surveillance. Drilling technologies were selected based on Noble Energy’s experience as most suitable for the safety and efficiency of the drilling program.
Sections 2.3.1 and 3.2

Table 2-2. (Continued).
Tamar Field Development Project EIA 135 Noble Energy Mediterranean Ltd March 2016 CSA-Noble-FL-16-2650-08-REP-01-FIN-REV04
Subject Proposed Action Alternatives Evaluated and Ratings Reference
Drilling Mud Selection
Noble Energy plans to use a combination of water-based mud (WBM) and mineral oil-based mud (MOBM). The MOBM system that Noble Energy is planning to use, subject to MNIEWR approval, is INNOVERT, a high-performance invert emulsion fluid system developed by Baroid (a product service line of Halliburton). ExxonMobil Chemical’s ESCAID 110 would be the base fluid for the mud system.
WBM and MOBM Combination: RATING: Acceptable
MOBM will enable Noble Energy to efficiently drill while maintaining proper well control, rheological control, inhibition capability, and lubricity. The MOBM system was selected based on its technical performance and environmental characteristics. Escaid 110 is a highly refined product with low toxicity and very low aromatic content; it is readily biodegradable and not expected to exhibit chronic toxicity to marine organisms.
WBM Only: RATING: Acceptable
Using WBM exclusively would be less efficient (~15% to 20% longer time to drill wells) and would require the use of numerous specialty chemicals.
Section 3.2.2
Cuttings Treatment and
Disposal
Noble Energy proposes to discharge cuttings to the ocean at the drillsites. Cuttings from MOBM well intervals will be treated in a thermomechanical cuttings cleaner (TCC) on board the drilling unit to reduce the MOBM retention on cuttings to <1% by dry weight in accordance with the effluent limitations used in the North Sea/OSPAR region (OSPAR Decision 2000/3). Cuttings from MOBM will be discharged only if the discharge is approved.
Offshore Disposal RATING: Acceptable
The proposed offshore disposal of TCC-treated cuttings to the ocean at the drillsites is the most efficient alternative and meets Noble Energy’s environmental goals by reducing the retention on cuttings to less than 1% in accordance with OSPAR guidelines.
Onshore Disposal RATING: Less Suitable
Onshore disposal would entail an energy cost that would add to the environmental footprint of the project. The cuttings would need to be disposed at the Ramat Hovav facility due to the probable high total dissolved solids content. The cuttings would contribute to filling up the Ramat Hovav facility, thereby accelerating the need for expansion of this facility before its time.
Cuttings Reinjection: RATING: Not Feasible
Reinjection requires a dedicated well that has the
ability to absorb the residual slurry. During
drilling, such wells are not generally available because
they need a continuous flow of materials to make
them feasible. Additionally, high solids
content of injected material makes it difficult to keep such wells operational.
This alternative is rated as not feasible.
Sections 3.2.2 and 3.6

Table 2-2. (Continued).
Tamar Field Development Project EIA 136 Noble Energy Mediterranean Ltd March 2016 CSA-Noble-FL-16-2650-08-REP-01-FIN-REV04
Subject Proposed Action Alternatives Evaluated and Ratings Reference
Blowout Preventer (BOP)
Technology
Detailed BOP specifications will depend on the drilling unit. Noble Energy and the rig’s owner will engage in a comprehensive inspection and testing of the rig’s subsea BOP system to ensure compliance with the U.S. Bureau of Safety and Environmental Enforcement (BSEE) regulations. The inspection and testing will be witnessed and certified by a third-party surveyor.
RATING: Acceptable A number of blowout preventer configurations have been evaluated and all were found to be fit-for-purpose. The BOP specifications are based on best industry practice and reflect Noble Energy’s commitment to safety throughout the drilling program. Final BOP selection will depend on the rig evaluation
Section 3.2.4
Infrastructure and Pipeline
Technology
The infrastructure and pipeline have been designed for the conditions in the Tamar Field. Considerations include pipeline wall thickness and limit states, fatigue, free spans, on-bottom and slope stability, temperature, expansion, and seismic hazards.
RATING: Acceptable Different specifications for pipelines and infrastructure elements were considered; the final selection was made based on the evaluation of the field conditions.
Sections 2.3.2, 3.2.3, and
3.2.4
Tamar Field Development Project EIA 137 Noble Energy Mediterranean Ltd March 2016 CSA-Noble-FL-16-2650-08-REP-01-FIN-REV04
CHAPTER 3: PROJECT DESCRIPTION
3.1 GENERAL OVERVIEW
The Tamar and Tamar SW Reservoirs are located within the Levantine Basin in the Tamar Lease, approximately 90 km west of Haifa (Figure 1-1). Noble Energy has been active in the license area since 2006 and has drilled six gas wells in the Tamar Reservoir (Tamar-1 through Tamar-6; Tamar-6 was a re-drill/completion of Tamar-1) and one in the Tamar SW Reservoir (Tamar SW-1). Tamar-2 through Tamar-6 were competed in 2012. In 2013, Noble Energy drilled the Tamar SW-1 well and installed the Tamar Platform close to the existing Mari-B Platform. At that time, flowlines and utility lines were laid to tie the Tamar Reservoir Production together through subsea infrastructure projects to send the production to the Tamar Platform. From the Tamar Platform, production is sent to the AOT via a 30 in. pipeline.
The sections that follow will present information on the proposed Tamar Field Development Project planned to develop additional Tamar gas production. Activities that have occurred to date will also be reviewed to provide the necessary background for evaluating the currently proposed activities and the potential cumulative impacts in the Tamar Reservoir Area.
3.1.1 Proposed Activities – Tamar Field Development Project
The proposed Tamar Field Development Project will include the following activities:
• Completion of the Tamar SW-1 well; • Drilling and completion of the Tamar-7, Tamar-8, and Tamar-9 wells; • Infield flowline 12¾ in. from the Tamar SW-1 well to the Tamar-7 well location;Infield flowline
16 in. from the Tamar-7 well to Tamar production manifold; • Jumper from Tamar-8 to Tamar-3 10” FLET flowline- • Infield flowlines from Tamar-9 to Tamar-2 flowline end termination; • Jumper from Tamar SW-1 to flowline end termination (FLET) on 12 in. west end flowline, 8⅝ in.
outer diameter (OD); • Jumper from FLET on 12 in. east end flowline to 16 in. FLET/flowline west end, 10¾ in. OD; • Jumper from 16 in. FLET on east end 16 in. flowline to intermediate jumper starter (IJS),
10¾ in. OD; • Jumper from IJS to manifold, 10¾ in. OD; • Installation of an Expansion Subsea Distribution Assembly (ESDA_; • Installation of electrical, hydraulic, flexible, and optical flying leads; and • Post-installation testing and pre-commissioning.
3.1.2 Existing Facilities
An overview of the activities which have been completed in the Tamar Field is provided in Table 3-1.
Table 3-1. Overview of activities and dates for the Tamar Field. Activity Project Date Operational Start-Up Date
Drill Tamar-1 Nov. 2008-Feb. 2009 Re-drilled; now Tamar-6 Drill Tamar-2 April – July 2009 2013 Tamar Field Development Project – drill and completeTamar-3 through Tamar-6 (Tamar-6 is a re-drill/completion of Tamar-1)
2011-2013 2013
Drill Tamar SW-1 2013 --

Tamar Field Development Project EIA 138 Noble Energy Mediterranean Ltd March 2016 CSA-Noble-FL-16-2650-08-REP-01-FIN-REV04
The Tamar Reservoir has been developed as a subsea tie-back to the Tamar Platform, located within 2 km of the existing Mari-B Platform. The Tamar Platform is located approximately 25 km off the coast of Israel at a water depth of approximately 250 m. The Tamar Reservoir is approximately 90 km west of Haifa at a water depth of 1,600 to 1,700 m. A subsea view of the existing Tamar Field Development, except for the Tamar SW-1 well, is shown in Figure 3-1.
Legend:
Red lines: 10 in. infield flowlines; dual 16 in. natural gas pipelines (Tamar Platform to Tamar Field)
Yellow lines: subsea manifold; subsea distribution assembly; umbilicals
Dark red: natural gas line to Ashdod Onshore Terminal
Blue lines: utility lines
Figure 3-1. Subsea view of the Tamar Field Development. The Tamar SW-1 well is not included in the figure.
3.1.2.1 Existing Wells
The first well (Tamar-1) was targeted at the crest of the Tamar Reservoir. It spudded on 18 November 2008 and reached total depth on 11 January 2009. The well was completed on 25 February 2009 and retained as a future producing well. It was subsequently re-drilled as Tamar-6.
This was followed by the drilling of Tamar-2. The Tamar-2 well was targeted on the northeast side of the Tamar Reservoir. It spudded on 26 April 2009 and reached total depth on 1 July 2009. The well was completed on 16 July 2009 and retained as a future producing well.
The Tamar Field Development Project included the drilling and completion of three locations (Tamar-3, Tamar-4, and Tamar-5), re-drill and completion of the Tamar-1 location (Tamar-6), and completion of Tamar-2. These locations and completions were designed to fully test continuity between sands and fault blocks. These wells were placed online 31 March 2013 and all have produced at rates up to 250 mmscfd.
Tamar SW-1 is a separate feature on the southwest plunging nose of the main Tamar anticline. The structure is a three-way fault closure. The well will be kept as a producing well from the Tamar “A” sand. The well will be completed and the well will be an open hole gravel pack capable of flow rates as high as 250 mmscfd.
3.1.2.2 Existing Tamar Platform
The Tamar Platform is a self-sustaining and independent facility, separate from the Mari-B Platform. Process capabilities were designed for full flow from the Tamar Reservoir up to the maximum design pressure of the incoming production flowlines. System design included the ability to direct full flow

Tamar Field Development Project EIA 139 Noble Energy Mediterranean Ltd March 2016 CSA-Noble-FL-16-2650-08-REP-01-FIN-REV04
to the departing pipeline(s) or split flow to the dedicated injection wells via an injection header on the Mari-B Platform. Flow splitting is accomplished through a combination of in-line flow control and pressure control devices.
The Tamar Platform is equipped with all ancillary systems, including living quarters, power generation, emergency power generation, safety systems, heating and heat medium processes, potable water, sewage, and produced water equipment processing to make the new platform entirely self-sufficient. Water, instrumentation, utility air, diesel, and electricity are connected to the existing Mari-B Platform (via subsea cables, conduits, or lines) to allow sharing of these utilities as necessary. Both the platform structure and process facility have the capability for expansion to meet future field optimization requirements. The platform was discussed in detail in an EIA prepared for Noble Energy (CSA International, Inc., 2012).
3.1.2.3 Existing Tamar Field Infrastructure
Gas production from the Tamar Reservoir occurs through the high flow rate subsea wells into a subsea gathering system, which consists of a 10 in. infield flowline from each well to a subsea manifold. From the subsea manifold within the Tamar Field, dual 16 in. subsea pipelines transport Tamar production approximately 149 km to the Tamar Platform, where the gas is processed.
The Tamar Field is controlled from the Tamar Platform via electrohydraulic umbilicals. The umbilicals terminate at a subsea distribution assembly located close to the subsea manifold. Electric power, communication, and chemicals are distributed from the subsea distribution assembly to the wells via individual infield umbilicals.
Corrosion inhibitor is mixed with MEG, a hydrate inhibitor, and delivered from the Tamar Platform to the subsea distribution assembly via dual 4 in. supply pipelines then distributed to the wells through infield umbilicals. The processed gas is delivered to the existing AOT via the existing 30 in. pipeline for gas sales into the Israel Natural Gas Line system. Tamar condensate is injected into a dedicated condensate pipeline running between the Tamar Platform and AOT receiving facility. The condensate line is one of three utility pipelines for production services installed from the Tamar Platform to AOT.
The pipelines and infrastructure connecting the platform to the Tamar wells was discussed in detail in an EIA prepared by Noble Energy (CSA International, Inc., 2012).
3.2 DESCRIPTION OF THE ACTIVITIES FOR THE EXISTING DEVELOPMENT AND FOR THE TAMAR FIELD DEVELOPMENT PROJECT
3.2.1 Well Locations
The surface locations of the existing Tamar wells are listed in Table 3-2.
3.2.2 Drilling Program
3.2.2.1 Existing Tamar SW-1
The Tamar SW-1 well was drilled in 2013 by the ENSCO 5006 (Figure 3-2). The well is in the Tamar SW Reservoir in the Tamar Lease located in the eastern Mediterranean Sea approximately 98 km west-northwest of Haifa, Israel in the southeastern portion of the Levantine Basin (Figure 3-3).
Tamar Field Development Project EIA 140 Noble Energy Mediterranean Ltd March 2016 CSA-Noble-FL-16-2650-08-REP-01-FIN-REV04
Table 3-2. Existing Tamar well surface locations.
Well Geographic Coordinates Mudline
Depth (m)
Seafloor Gradient (degrees)
Notes Easting (m)
Northing (m)
Latitude (N)
Longitude (E)
Tamar-1 596,477 3,652,061 33°00'09.76" 34°01'58.01" -1,678 0.6 Will not be completed; see Tamar-6
Tamar-2 600,749 3,655,499 33°01'59.98" 34°04'43.97" -1,685 0.4 Complete Tamar-3 594,501 3,649,470 32°58'46.27" 34°00'40.91" -1,669 <1.0 Complete Tamar-4 597,487 3,654,491 33°01'28.33" 34°02'37.85" -1,687 <1.0 Complete Tamar-5 596,256 3,654,047 33°01'14.32" 34°01'50.24" -1,704 1.0 Complete
Tamar-6 596,449 3,652,070 33°00'10.06" 34°01'56.94" -1,678 <1.0 Complete. Tamar-1 twin. Required for an open hole gravel pack completion
Tamar SW-1 585,568 3,642,734 32°55'10.192" 33°54'54.517" -1,645 <1.0 Drilled; completion proposed
Figure 3-2. Vessel specifications for the ENSCO 5006 used to drill the Tamar SW-1 well.
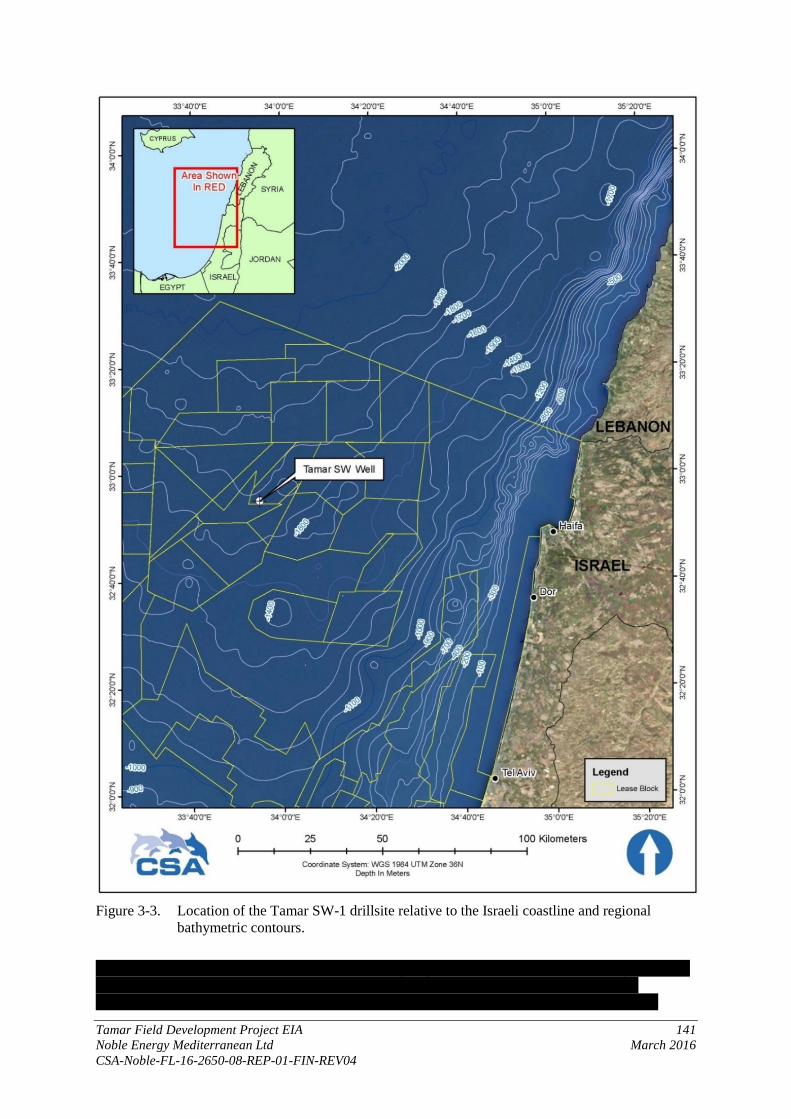
Tamar Field Development Project EIA 141 Noble Energy Mediterranean Ltd March 2016 CSA-Noble-FL-16-2650-08-REP-01-FIN-REV04
Figure 3-3. Location of the Tamar SW-1 drillsite relative to the Israeli coastline and regional
bathymetric contours.
Tamar SW-1 was drilled to evaluate the Tamar SW prospect, which consists of a three-way structural closure along a fault. The location is within the Tamar lease block. The well penetrated and evaluated a section of stacked turbidite sands. The data showed these were the equivalent sands

Tamar Field Development Project EIA 142 Noble Energy Mediterranean Ltd March 2016 CSA-Noble-FL-16-2650-08-REP-01-FIN-REV04
penetrated in both the Tamar Field (11.1 km northeast) and the Dolphin-1 well (17.8 km southwest). These equivalent sands also were drilled in the Tanin-1 and Leviathan wells. The final well total depth was 5,377 m measured depth (MD); 5,366 m total vertical depth (TVD); 100 m into the top of the “D” sand. The Tamar sands were fully evaluated with open hole wireline logs. The Tamar SW-1 well will be kept as a producing well in the Tamar “A” sand. Completion will be an open hole gravel pack capable of flow rates up to 250 mmscfd.
A 9⅞ in. × 10¾ in. production casing was set to 4,884.5 m MD (3 m into top of “A” sand at 4,881.5 m MD). The production string was cemented with 94 barrels (bbl) Elasticem mixed at 13.8 pounds per gallon (ppg). The cement was displaced with 11.9 ppg NaCl/NaBr brine. The wiper plug bumped with 2,000 pounds per square inch (psi) and the floats held. No mud was lost while running and cementing the casing string. The 10¾ in. seal assembly was set and energized with 3,000 psi. Then a 100 kilopounds force (kip) overpull was taken and the seal assembly was pressure tested to 6,700 psi.
A lead impression block run was performed, verifying the 10¾ in. casing hanger space out. Then a 10¾ in. lock-down hanger was run, set, and confirmed with 100 kips overpull.
A wireline was rigged up and a gauge ring/segmented bond tool run was made. Wireline ran a 9⅞ in. EZ-SV and set it at 4,773 m. The wireline and the production casing then were successfully pressure tested to 6,500 psi for 30 minutes.
A 125-m surface cement plug was set from 2,075 to 1,950 m with 37 bbl of Class G cement mixed at 15.8 ppg as a temporary well abandonment. The wellbore and casing hanger seal assembly was negative pressure tested (790 psi) with a seawater gradient to the mudline for 30 minutes. The blowout preventer (BOP) and riser were then disconnected and pulled, and a trash cap was installed on the MS 700 wellhead with the ROV. The anchors were then pulled and bolstered. The ENSCO 5006 departed the Tamar SW-1 well location at 06:00 hours on 2 January 2013.
The wellbore schematic for the Tamar SW-1 well is shown in Figure 3-4, and the drilling timeline is shown in Figure 3-5. The volume of WBM drilling materials used for the Tamar SW-1 well is provided in Table 3-3.
Supply vessel support was provided by several vessels, including the M/V EAS and M/V Leon. The M/V EAS is a DP anchor handling towing supply (AHTS) vessel measuring 61.8 m in length, and the M/V Leon is a swift crew and supply boat measuring 51 m in length. Both vessels were operated by EDT Ship Management Ltd. out of the Port of Haifa.
Helicopter support was provided by a Bell 412SP owned by PHI, Inc. and operated by LAHAK out of Haifa Airport.

Tamar Field Development Project EIA 143 Noble Energy Mediterranean Ltd March 2016 CSA-Noble-FL-16-2650-08-REP-01-FIN-REV04
Figure 3-4. Tamar SW-1 wellbore schematic (From: Noble Energy, 2012).
1700
1742m MD/TVD1800 1718m SS, 70m BML
1900
2000
2100
2200
26" Hole2300
2400
2500
2600
2700
2800
2900 2900m MD/TVD2876m SS, 1228m BML
3000
3100
17 1/2" Hole3200
3300
3400 TOL @ 3422m MD/TVD
3500 3522m MD/TVD3498m SS, 1850m BML
3600
3700
3800
3900
400012 1/4" x 14-3/4" Hole
4100
4200
4300
4400
45004565m MD/TVD
4541m SS, 2893m BML4600
4700
48004871m MD
4900
5000 10-5/8" Hole
5100
5200
5300 5306m MD5300m TVD
5276m SS, 3628m BML5400
5500
(2.5m Above
CASING DETAILS
1669.5 MDSize, Weight, Grade, Conn
36" LP Hsg
36",1-1/2"/1" WT,553/374 ppf,X-56, API-5L,XLW / XLCS
Liner 11-7/8" 71.80#,
HC Q-125, TSH 523
13-5/8", 88.20#,
Q-125 HC,TSH 523
Setting DepthMD/TVD/SS
TVD Depth
(meters)
20", 0.812" wt, 166.44
ppf,X-56, S-60/MT
x20", 0.625" wt, 129.29
ppf,X-56, S-60/MT

Tamar Field Development Project EIA 144 Noble Energy Mediterranean Ltd March 2016 CSA-Noble-FL-16-2650-08-REP-01-FIN-REV04
Figure 3-5. Tamar SW-1 plan and actual days versus depth timeline for drilling of the Tamar SW-1
well.
0
1000
2000
3000
4000
5000
60000 20 40 60 80 100 120
MD
RK
B (m
eter
s)
Time (days)
Days vs Depth - Tamar SW-1
Plan DaysActual Days
SW
Run and Cement 20" Pipe @ 2895m
Mud Line @ 1669m36" @ 1749m
26" Borehole
17-1/2" Borehole
Run and Cement 13-5/8" Pipe @ 3522m
14-3/4" Borehole
Run and Cement 11-7/8" Pipe @ 4565m
10-5/8" Borehole
TD @ 5377mRun formation evaluation logs
Run and Cement 9-7/8" x 10-3/4" Pipe @ 4884m
SW

Tamar Field Development Project EIA 145 Noble Energy Mediterranean Ltd March 2016 CSA-Noble-FL-16-2650-08-REP-01-FIN-REV04
Table 3-3. Volumes of drilling materials used in drilling the Tamar SW-1 well.
Product Function Well Interval Metric Ton
and Barrels Packaging in Sacks or
U.S. Gallons
No. of Packages
Used 36 in. 26 in. 17½ in. 12¼ in. × 14¾ in. 10⅝ in. 8½ in. ×
12¼ in. 9⅞ in.
Cased Hole BARACARB 5 (FIBC 1 MT) Bridging agent 7.00 3.00 10.00 No. of bulk bag used avg. 1 MT 10.00 BARACARB 25 (FIBC 1 MT) Bridging agent 20.00 2.00 3.00 25.00 No. of bulk bag used avg. 1 MT 25.00 BARACARB 50 (FIBC 1 MT) Bridging agent 48.00 48.00 No. of bulk bag used avg. 1 MT 48.00 BARACARB-DF 150 (25-kg sacks) Bridging agent 48.00 1.20 No. of 25-kg sacks used 48.00
BARACARB-DF 25 (25-kg sacks) Bridging agent 48.00 1.20 No. of 25-kg sacks used 1.20
BaraFibre Course (40-lb sacks) Fiber 4.00 0.07 No. of 40-lb sacks used 4.00 BaraFibre Superfine (11.3-kg sacks) Fiber 70.00 0.79 No. of 25-kg sacks used 70.00
BARAZAN D (25-kg sacks) Viscosifier 41.00 147.00 57.00 28.00 22.00 8.00 7.58 No. of 25-kg sacks used 303.00 BARAZAN (25-kg sacks) Viscosifier 33.00 0.83 No. of 25-kg sacks used 33.00 BARAZAN LIQUID Viscosifier 33.00 33.00 * Gallons
Barite (bulk) Weighting agent 126.30 196.00 8.00 62.10 43.68 27.00 35.80 498.88 Bulk 1 MT 498.88 BDF-467/kg Inhibition 69.00 13.00 3.00 85.00 85.00 Bentonite (FIBC 1 MT) Viscosifier 18.00 35.50 6.80 60.30 No. of bulk bag used avg. 1 MT 60.30 Brine 10.0 LPG 42 gal/bbl 12,505.00 12,505.00 U.S. gallons 525,210 C-250 55 gal Drum 4.00 4.00
Caustic Soda (25-kg sacks) pH control 0.00 No. of 25-kg sacks used 0.00 Citric Acid (25-kg sacks) Alkalinity control 16.00 110.00 72.00 4.95 No. of 25-kg sacks used 198.00 Clay Seal (275 bbl IBC) Inhibition 23.00 3.00 3.00 182.40 275 bbl IBC 29.00 Defoamer (20 L/5 gal jug) Defoamer 6.00 11.00 12.00 3.65 U.S. gallons 153.22 GEM CP (1,000 IBC) Inhibition 20.00 125.80 No. of IBC 1 cubic 125.80 GEM GP @ 3% v/v (55 gal drum) Inhibition 64.00 402.55 No. of IBC 1 cubic
GEM SP (1,000 IBC) Inhibition 16.00 3.00 5.00 150.96 No. of IBC 1 cubic
Guar Gum (25-kg sacks) Viscosifier 30.00 176.00 40.00 6.15 No. of 25-kg sacks used 246.00 KCl (potassium chloride) Inhibition/weight 84.00 74.00 158.00 No. of bulk bag used avg. 1 MT 158.00
NaCl (sodium chloride) Inhibition/weight 688.60 324.00 1316.38 No. of bulk bag used avg. 1.3 MT 1,012.60
OS-8 (5 kg CN) 10.00

Table 3-3. (Continued).
Tamar Field Development Project EIA 146 Noble Energy Mediterranean Ltd March 2016 CSA-Noble-FL-16-2650-08-REP-01-FIN-REV04
Product Function Well Interval Metric Ton
and Barrels Packaging in Sacks or
U.S. Gallons
No. of Packages
Used 36 in. 26 in. 17½ in. 12¼ in. × 14¾ in. 10⅝ in. 8½ in. ×
12¼ in. 9⅞ in.
Cased Hole PAC L (25-kg sacks) Filtration control 40.00 1.00 No. of 25-kg sacks used 40.00 PAC LE (25-kg sacks) Filtration Control 49.00 87.00 74.00 5.25 No. of 25-kg sacks used 210.00 PAC ULV (25-kg sacks) Filtration Control 107.00 9.00 197.00 115.00 72.00 12.50 No. of 25-kg sacks used 500.00 Soda ash (25-kg sacks) Calcium Treatment 2.00 11.00 40.00 30.00 2.08 No. of 25-kg sacks used 83.00 Bicarbonate sodium (25-kg sacks) Calcium Treatment 68.00 80.00 67.00 5.38 No. of 25-kg sacks used 215.00
STARCIDE (20 L/5 gal jug) Biocide 68.00 7.00 9.43 U.S. gallons 396.26 Steel Seal 400 (25-kg sacks) Bridging agent 10.00 0.25 No. of 25-kg sacks used 10.00 Xanthan gum (25-kg sacks) Bridging agent 40.00 1.00 No. of 25-kg sacks used 40.00 Xan Plex (25-kg sacks) Bridging agent 13.00 0.33 No. of 25-kg sacks used 13.00 Aquagel Gold Seal (25-kg sacks) Viscosifier 0.00
CA+ CARBONATE Bridging agent 0.00
ClaySeal 275 gal/IBC Inhibition 0.00 275 gal
DEXTRID E (Sx) Filtration Control 0.00
Nova Carb 26 (1 Ton Sacks) Bridging agent 30.00 30.00
QUIK-THIN (Sx) Thinner 0.00
Total 217.30 14,024.10 1,040.80 545.10 548.68 360.00 35.80 15,688.89
Note: empty cells indicate that no drilling material was discharged for that well interval.
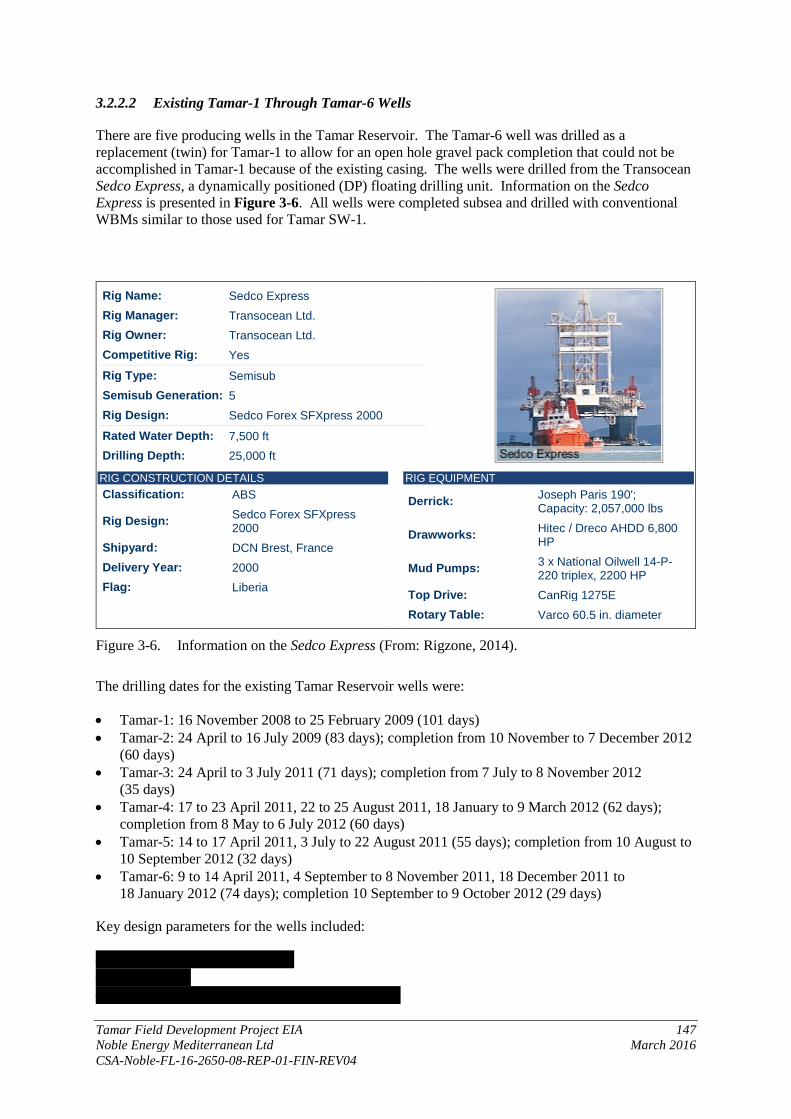
Tamar Field Development Project EIA 147 Noble Energy Mediterranean Ltd March 2016 CSA-Noble-FL-16-2650-08-REP-01-FIN-REV04
3.2.2.2 Existing Tamar-1 Through Tamar-6 Wells
There are five producing wells in the Tamar Reservoir. The Tamar-6 well was drilled as a replacement (twin) for Tamar-1 to allow for an open hole gravel pack completion that could not be accomplished in Tamar-1 because of the existing casing. The wells were drilled from the Transocean Sedco Express, a dynamically positioned (DP) floating drilling unit. Information on the Sedco Express is presented in Figure 3-6. All wells were completed subsea and drilled with conventional WBMs similar to those used for Tamar SW-1.
Rig Name: Sedco Express Rig Manager: Transocean Ltd. Rig Owner: Transocean Ltd. Competitive Rig: Yes
Rig Type: Semisub Semisub Generation: 5 Rig Design: Sedco Forex SFXpress 2000
Rated Water Depth: 7,500 ft Drilling Depth: 25,000 ft
RIG CONSTRUCTION DETAILS Classification: ABS
Rig Design: Sedco Forex SFXpress 2000
Shipyard: DCN Brest, France Delivery Year: 2000 Flag: Liberia
RIG EQUIPMENT
Derrick: Joseph Paris 190'; Capacity: 2,057,000 lbs
Drawworks: Hitec / Dreco AHDD 6,800 HP
Mud Pumps: 3 x National Oilwell 14-P-220 triplex, 2200 HP
Top Drive: CanRig 1275E Rotary Table: Varco 60.5 in. diameter
Figure 3-6. Information on the Sedco Express (From: Rigzone, 2014).
The drilling dates for the existing Tamar Reservoir wells were:
• Tamar-1: 16 November 2008 to 25 February 2009 (101 days) • Tamar-2: 24 April to 16 July 2009 (83 days); completion from 10 November to 7 December 2012
(60 days) • Tamar-3: 24 April to 3 July 2011 (71 days); completion from 7 July to 8 November 2012
(35 days) • Tamar-4: 17 to 23 April 2011, 22 to 25 August 2011, 18 January to 9 March 2012 (62 days);
completion from 8 May to 6 July 2012 (60 days) • Tamar-5: 14 to 17 April 2011, 3 July to 22 August 2011 (55 days); completion from 10 August to
10 September 2012 (32 days) • Tamar-6: 9 to 14 April 2011, 4 September to 8 November 2011, 18 December 2011 to
18 January 2012 (74 days); completion 10 September to 9 October 2012 (29 days)
Key design parameters for the wells included:
• Well design life of +30 years; • 7 in. tubing; • 9⅝ in. production liner top setting the reservoir;
Tamar Field Development Project EIA 148 Noble Energy Mediterranean Ltd March 2016 CSA-Noble-FL-16-2650-08-REP-01-FIN-REV04
• Erosion/corrosion tolerant; and • DP rig tolerant.
The wells were completed as single zone sand control completions with 7 in. tubing to enable high-rate gas production. Each well was completed with an open-hole gravel pack. Design parameters for the completions were as follows:
• Well design life of +30 years; • 7 in. tubing; • Sand control is a requirement; • Open hole gravel packs to provide high deliverability; • Erosion tolerant well design; and • Real-time downhole surveillance.
Figures 3-7 through 3-12 present the wellbore schematics for the Tamar-1 through Tamar-6 wells.

Tamar Field Development Project EIA 149 Noble Energy Mediterranean Ltd March 2016 CSA-Noble-FL-16-2650-08-REP-01-FIN-REV04
Figure 3-7. Tamar-1 drilling schematic – as built.

Tamar Field Development Project EIA 150 Noble Energy Mediterranean Ltd March 2016 CSA-Noble-FL-16-2650-08-REP-01-FIN-REV04
Figure 3-8. Tamar-2 drilling schematic – as built.

Tamar Field Development Project EIA 151 Noble Energy Mediterranean Ltd March 2016 CSA-Noble-FL-16-2650-08-REP-01-FIN-REV04
Figure 3-9. Tamar-3 drilling schematic – as built.
10¾ ” SLIJ-II x 9 ⅝” Vam Top @ 2,424.5-m MD
13⅝” 88.2# P110EC Vam Top @ 4,063-m MD
20” 166# X-56 RL4S @ 2498-m MD
36” X-56 XLW/XLCS @ 1774-m MD
9⅝” x 6” GP Packer @ 4,580.8-m MD
5½” SLB TRC-II-10 SCSSV @ 2395.5-mw/ 4.562” DB-HP Nipple (¼” x ¼” CL)
11.9-ppg WBM
Under-reamed 12¼”
RKB – MSL = 23.0-m (75.5’)Water depth = 1,678.5-m (5506.8’)RKB to Top of Tree = 1,685.3-mRKB – ML = 1,701.5-mMud line temp = 57oF
6⅝” Sand Screens (46.5-m)
9⅝” 53.5# 13CR-110 Vam Top @ 4,732.6-m MD
20/40 CarboLITE
Ball Valve (4.47” ID)
“B” SandTop ≈4664.5-m MD
“A” SandTop ≈4593.5-m MD
nipple
5½” CIM
5½” CIM
Mean Sea Level (MSL)
Sedco Express
10¾ ” 71.1# P-110 SLIJ-II
9⅝” 53.5# P-110 Vam Top to 4,503.7-m MD
5½” SCSSV
10K 5x2 Horizontal Tree (Cameron)Plugs: 5.75” ITC plug / 5.25” TH plugTH Thread: 7” 29# VAM TOPTree Weight: 50T with TRT & BPTH Penetrations: 7 hydraulic + 1 electricalTH bore ID: 4.798”TH SSR Plug installed & testedITC installed (w/ plug) & tested
debris cap
AWV
ACV
AMV
ITC
PMV
PWV PCV
FLV
10.65-ppg NaCl/NaBr packer fluid
4.500” SLB DB-6 Nipple @ 4545.2-m MD
12¼” TD @ 4,775.0-m MD8½” TD @ 4,776.0-m MD
5½” Baker CIM @ 2381.4-m MD (1/2” CL)
9⅝” Production Packer @ 4,508.2-m MD
“C” Sand Completion Interval:Top of Sand: 4,738-m MDInterval: 4738 – 4775-m MDMid Interval: 4756.5-m MD/TVDHole Angle @ Reservoir = verticalBHP = 8263-psiPore Pressure = 10.23-ppgeBHT = 165oF
9⅝” Liner Pkr/Hanger @ 3,951.9-m MD9⅝” End of Seals @ 3,949.3-m MD9⅝” Top of PBR @ 3,945.4-m MD
5½” Baker CIM @ 4435-m MD (3/8” CL)
5½” SLB DHPT GM @ 4474.3-m MD (1/4” TEC)
Tamar #3ST01 AS-BUILTAugust 10, 2012
PIP TAG @ 4505.7Cutting Zone (4.2 – 4.6-m below PIP tag)
5½” 20.0# 13CR-80 Vam Top HC
8.8-ppg 40/60 MEG/DW
7” 32.0# 13CRM-110 Vam Top HC
5 ½” DHPT
11.4-ppg WBM
TOC @ 4,475-m MD
TOC @ 2,087-m MD11.4-ppg WBM

Tamar Field Development Project EIA 152 Noble Energy Mediterranean Ltd March 2016 CSA-Noble-FL-16-2650-08-REP-01-FIN-REV04
Figure 3-10. Tamar-4 drilling schematic – as built.

Tamar Field Development Project EIA 153 Noble Energy Mediterranean Ltd March 2016 CSA-Noble-FL-16-2650-08-REP-01-FIN-REV04
Figure 3-11. Tamar-5 drilling schematic – as built.
13⅝” 88.2# P-110 EC Vam Top @ 3,526-m MD
20” 166# X-56 RL4S @ 2468-m MD
36” X-56 XLW/XLCS @ 1809-m MD
9⅝” x 6” GP Packer @ 4,541.5-m MD
11.9-ppg inhibited WBM
Under-reamed 12¼”
6⅝” Sand Screens (35-m)
9⅝” 53.5# 13CRM-110 Vam Top @ 4,678-m MD
20/40 Carbolite
Ball Valve (4.47” ID)
“A” SandTop ≈4600-m MD
CIM
Mean Sea Level (MSL)
Sedco Express
10¾ ” 71.1# P-110 SLIJ-II
9⅝” 53.5# P-110 Vam Top to 4,449-m MD(change of metallurgy to P-110 above this depth)
SCSSV
10K 5x2 Horizontal Tree (Cameron)Plugs: 5.75” ITC plug / 5.25” TH plugTH Thread: 7” 29# VAM TOPTree Weight: 50T with TRT & BPTH Penetrations: 7 hydraulic + 1 electricalTH bore ID: 4.798”TH SSR Plug installed & testedITC installed (w/ plug) & tested
AWV
ACV
AMV
debris cap
ITC
PMV
PWV PCV
FLV
10.7-ppg NaCl/NaBr packer fluid
Tamar #5ST01 AS-BUILTSeptember 10, 2012
12¼” TD @ 4,711-m MD8½” TD @ 4,712-m MD
“B” Sand Completion Interval:Top of Sand 4,677-m MDInterval: 4,678 – 4712-m MD (OAL = 34-m)Mid Interval: 4,696-m MD/ 4,693-m TVDHole Angle @ Reservoir = verticalBHP = 8235-psi (mid depth)Pore Pressure = 10.3-ppgeBHT = 172oF
RKB – MSL = 23.0-m (75.5’)Water depth = 1,704-m (5590’)RKB to Top of Tree = 1,719.9-mRKB – ML = 1,727-mMud line temp = 57oF
9⅝” Liner Pkr/Hanger @ 3,431.8-m MD9⅝” End of Seals @ 3,429.4-m MD9⅝” Top of PBR @ 3,425.4-m MD
PIP TAG @ 4462.9-m MDCutting Zone (4.2 – 4.6-m below PIP tag)
nipple
5½” CIM
5 ½” DHPT
8.8-ppg 40/60 MEG/DW
5½” Baker CIM @ 2,395.4-m MD (1/2” CL)5½” SLB TRC-II-10 SCSSV @ 2409.6-mw/ 4.562” DB-HP Nipple (¼” x ¼” CL)
4.500” SLB DB-6 Nipple @ 4,502.7-m MD9⅝” Production Packer @ 4,465.4 -m MD
5½” SLB DHPT GM @ 4,431.0-m MD (1/4” TEC)
5½” Baker CIM @ 4,404.5-m MD (3/8” CL)
10¾” SLIJ-II x 9⅝” Vam Top @ 2,478-m MD
5½” 20.0# 13CR-80 Vam Top HC
7” 32.0# 13CRM-110 Vam Top HC
13⅝” 88.2# Q-125HC SLX to 2,419-m MD(change of metallurgy to Q-125 above this depth)
TOC @ 2,087-m MD10.9-ppg WBM

Tamar Field Development Project EIA 154 Noble Energy Mediterranean Ltd March 2016 CSA-Noble-FL-16-2650-08-REP-01-FIN-REV04
Figure 3-12. Tamar-6 drilling schematic – as built.

Tamar Field Development Project EIA 155 Noble Energy Mediterranean Ltd March 2016 CSA-Noble-FL-16-2650-08-REP-01-FIN-REV04
3.2.2.3 Proposed Completion of Tamar SW-1
The proposed Tamar Field Development Project includes the completion of the Tamar SW-1 well. The Tamar SW-1 well was temporarily abandoned with the production casing set at the top of the reservoir sand. A summary of the planned completion process is described here.
A Cameron 10,000 psi working pressure (WP) horizontal subsea tree will be installed and pressure tested to 10,000 psi on the Tamar SW MS-700 high pressure wellhead. This may utilize an intervention vessel or the selected rig chosen for the completion operations depending on its capabilities.
The rig will run the BOP, riser, and latch onto the Cameron subsea tree. The BOP will be pressure tested. The riser will be displaced to 11.9 ppg NaCl/NaBr brine.
A drilling assembly will be run and the temporary shallow set cement plug at 1,950 to 2,075 m will be drilled out. The drilling assembly will be retrieved.
An 8½ in. drilling assembly with LWD will be run. The CIBP and 9⅞ in. cemented shoe track will be drilled out to 3 m above the shoe at 4,884.50 m MD. The 11.9 ppg NaCl/NaBr brine will be displaced with a Baker Hughes reservoir drill-in-fluid (RDIF).
The remainder of the shoe track will be cleaned out and approximately 30 m of 8½ in. hole will be drilled into the A sand formation. A log will be performed with the LWD. The drilling assembly will be retrieved.
An 8½ in. × 12¼ in. underreamer drilling assembly will be run and the 8½ in. open hole in the A sand will be opened up to a 12¼ in. hole. A solids-free RDIF (SFRDIF) spotted prior to pulling out into the 9⅞ in. liner approximately 150 m above the shoe. The RDIF will be displaced to a 10.65-ppg NaCl/NaBr filtered brine, and the well will be cleaned up prior to retrieving the underreamer assembly.
A gravel pack assembly will be run consisting of wash down shoe, 6⅝ in. wire mesh shrouded screens, fluid loss isolation valve, gravel pack packer assembly with gravel pack crossover tool to total depth. The SFRDIF will be displaced and the gravel pack packer set and tested. The SFRDIF will be reversed out with 10.65 ppg NaCl/NaBr.
An open hole gravel pack will be performed utilizing proppant. Once a screen out has occurred, the crossover tool will be pulled, closing the fluid loss isolation valve for well control, and the cross over tool will be retrieved.
A scoop head seal assembly will be run to isolate the gravel pack ports within the gravel pack assembly. The well will be displaced to a 10.65 ppg inhibited NaCl/NaBr brine.
The Cameron subsea tree bore protector will then be pulled.
The upper completion will be run consisting of a nipple, 9⅞ in. production packer, down hole pressure gauges, deep set chemical injection valve, 7 in. tubing, 5½ in. surface-controlled subsurface safety valve (SCSSV), shallow set chemical injection valve, and a Cameron tubing hanger. All equipment will be rated to 10,000 psi WP.
The upper completion will be run in hole, utilizing a Cameron tubing hanger running tool, Dual Ball Valve Subsea Test Tree with slick joint spaced out for BOP RAM and annular closure, a retainer valve, electrohydraulic operating pod, 7 in. landing string, lubricator valve, and 7 in. landing string to a surface flow head.

Tamar Field Development Project EIA 156 Noble Energy Mediterranean Ltd March 2016 CSA-Noble-FL-16-2650-08-REP-01-FIN-REV04
A launch and recovery system/installation workover control system (LARS/IWOCS) will be deployed to the seafloor to take control of the Cameron Subsea tree and to control the functions of the upper completion, utilizing the rig ROV for jumper installations and pressure testing.
A coil tubing lift frame will be installed prior to picking up the surface flow head. Once picked up, the upper completion would be landed and the Cameron tubing hanger set and tested.
The upper completion production packer would be set and tested.
Flow back testing will be performed as described in Section 3.2.4.
The well will be equipped with an SCSSV (a “fail-safe” downhole safety valve) below the mudline to prevent an uncontrolled release in the extremely unlikely event the subsea wellhead is compromised. In addition, the well will be equipped with two redundant downhole pressure and temperature gauges for real-time downhole surveillance as well as one chemical injection mandrel for mitigation against the potential risk of scale or hydrates. Also, the 10¾ in. casing will allow for the installation of a larger 5½ in. SCSSV. The proposed completion schematic is shown in Figure 3-13.
The completion fluid components to be used for the Tamar SW-1 completion are listed and described in Table 3-4, and the amounts expected to be used are presented in Table 3-5.
Supply vessel support will be provided by several vessels, which are expected to be equivalent to the Richard M. Currence, John P Laborde, EAS, and Leon. The Richard M. Currence and John P Laborde are 85.34 m long supply vessels. The M/V EAS is a dynamic positioning anchor handling towing supply (AHTS) vessel measuring 61.8 m in length. The M/V Leon is a swift crew and supply boat measuring 51 m in length.
Helicopter support will be provided by a Bell 412SP or equivalent. Specifications for the project vessels – the ENSCO 5006, Richard M. Currence, John P Laborde, EAS, and Leon and aircraft are provided in Appendix D.

Tamar Field Development Project EIA 157 Noble Energy Mediterranean Ltd March 2016 CSA-Noble-FL-16-2650-08-REP-01-FIN-REV04
Figure 3-13. Proposed completion schematic (Tamar SW-1).

Tamar Field Development Project EIA 158 Noble Energy Mediterranean Ltd March 2016 CSA-Noble-FL-16-2650-08-REP-01-FIN-REV04
Table 3-4. The completion fluid product description for Tamar SW-1.
BB = base box; MT = metric ton; ppg = pounds per gallon; RDIF = reservoir drill-in-fluid; sx = sacks.
Name Packaging Information
Sodium bromide Bulk fluid Base brine is 12.5 ppg. Blended with limited volume of sodium chloride salt to adjust density and increase hydrate protection.
Sodium chloride Blended in bulk fluid Utilized to provide better hydrate protection and lower brine cost.
Acetic acid (Glacial) 200 L/drum High strength organic acid used to lower pH in breaker fluids to dissolve residual calcium carbonate in filter cakes.
BioPaq 50-lb sack Chemically modified corn starch. Used as a fluid loss reducer and co-viscosifier in PerfFlow CM systems.
Carbosan 135/TR 50 kg keg A modified triazine-type biocide effective against many forms of bacteria encountered in oilfield water and drilling fluids.
Caustic soda 50-lb sack Sodium hydroxide used in conjunction with well wash to effectively clean and displace wellbore.
CI 27 55 gal/drum Amine-based corrosion inhibitor used in low pH breaker fluids carrying gravel.
KD-40 55 gal/drum
KD-40 is a water soluble corrosion inhibitor. It is an organophosphate formulation that forms a strong protective film on metal surfaces. It possesses a low aquatic toxicity and protects tubular goods approved for use in environmentally sensitive areas.
Defomex 55 gal/drum Long chain alcohol-based compound to reduce and prevent air entrapment in drilling muds when circulating/mixing.
Magnesium oxide 25-kg sack Used as a pH buffer for PerfFlow CM mud systems.
MaxGuard 55 gal/drum
Complex polyamine formulation designed to inhibit clay swelling. Used in PerfFlow CM RDIF formulations to ensure no clay swelling/migration within pore areas that are in contact with fluid filtrate.
Mudzyme X GBW 14 C 50 gal/drum Specific enzyme to break xanthan biopolymer. Used in cake
breaker formulations. Mudzyme S GBW 16
C 53 gal/drum Specific enzyme to break starch-based polymers. Used in cake breaker formulations.
MulFree RS 200 l Dr Special surfactant to ensure water wetting and avoid emulsion block. Used in RDIF systems to ensure filtrate does not cause water block inside pore throats.
Novocarb 60 1 MT BB and 25 kg sack Ground-sized marble. (Calcium carbonate). Used to seal pores and increase density.
Novocarb 20 1 MT BB and 25 kg sack Fine ground sized marble. (Calcium carbonate). Used to seal pores more effectively in conjunction with N60 for Tamar sands.
NOXYGEN 15 lb/pail
NOXYGEN XT is an organic salt, non-sulfur-based oxygen scavenger for use in calcium chloride, calcium bromide, and zinc bromide completion brine. Will not precipitate calcium sulfates such as sulfur-based scavengers do. Acts synergistically with corrosion inhibitors.
Sodium acetate 25-kg sack Used as a pH buffer regulator in specially designed RDIF cake breaker systems.
Soda ash 50 lb and 25-kg sack Sodium carbonate. Used as alkaline pH buffer for packer fluids.
Well wash 150 55 gal/drum
Blend of special surfactants with the capability of being used in brine formulations up to 18.0 ppg weighted spacer system. Water-soluble surfactants formulated to remove water-based drilling mud and mud residues from casing, pipe, and formation, and restores tubular surface to a water wet state.
UltraVis 5 gal/pail
UltraVis is a highly concentrated liquid dispersion of a high quality, non-ionic, water soluble polymer (10.5 lb/5 gal) in an organic potassium salt solution. UltraVis is used in spacer trains where these cannot come into reservoir contact.
XanVis-L 5 gal/pail
High molecular weight prehydrated xanthan biopolymer for building viscosity, a highly refined product that provides clarified fluids with low polymer residues and exceptional suspension properties, preferably pH = 6 to 10.5, additional pH, shearing and temperature will increase hydration.

Tamar Field Development Project EIA 159 Noble Energy Mediterranean Ltd March 2016 CSA-Noble-FL-16-2650-08-REP-01-FIN-REV04
Table 3-5. Materials to be used for the Tamar SW-1 well completion program.
Product Function Total Weight (lb) Excess (%) Total Plus Excess (Tons) NaBr (dry salt) Weight 2,251,749.70 15 1174.915 NaCl (dry salt) Weight 931,175.56 15 485.867 Fresh water Weight 1,057,796.91 15 551.936 Caustic soda Sodium hydroxide 1,968.00 50 1.339 Xanvis L Calcium treatment 2,748.90 50 1.871 UltraVis Viscosifier 13,494.60 50 9.184 Well Wash 150 Surfactant 14,060.62 50 9.569 Dope Free Surfactant 880.00 100 0.799 MULFREE RS Surfactant 7,742.62 50 5.269 BIO-PAQ Fluid loss 37,800.00 50 25.726 XAN-PLEX D Viscosifier 4,762.80 50 3.241 MAGNESIUM OXIDE pH buffer 6,300.00 50 4.288 MAX-GUARD Inhibition 74,934.76 50 50.999 X-CIDE 207 Microbiocide 24.00 50 0.016 NOVO-CARB 60 Weight 170,617.00 50 116.119 NOVO-CARB 20 Weight 67,240.30 50 45.762 MUDZYME X Enzyme breaker 5,918.76 50 4.028 MUDZYME S Enzyme breaker 1,189.39 50 0.809 Sodium Acetate pH buffer 3,350.00 50 2.280 Glacial Acetic pH control 5,084.04 50 3.460 CL-27 corrosion inhibitor Corrosion inhibitor 555.38 50 0.378
KD-40 Corrosion inhibitor 1,399.44 50 0.952 NOXYGEN Oxygen scavenger 120.00 50 0.082 Soda ash pH buffer 2,700.00 50 1.838
3.2.2.4 Proposed Wells Tamar-7, Tamar-8, and Tamar-9
The proposed wells (Tamar-7, Tamar-8, and Tamar-9) will be drilled and completed in the Tamar Reservoir to the same specifications as the Tamar SW-1 well, described in Section 3.2.2. The drilling unit has not been identified, but is expected to be a DP drillship similar to the Atwood Advantage (Figure 3-14) or a DP semi-submersible similar to the GSF Development Driller II (Figure 3-15). Support vessels and aircraft to be used will be similar to those used for the drilling of Tamar SW-1 (see Section 3.2.2). Specifications for the project vessels and aircraft are provided in Appendix D.
The components of the mud system for the GSF Development Driller II include the following:
• Mud Pumps: Four National 14-P-220 triplex 7500 psi pumps, each driven by two GEB-22A2 AC 1,150 hp motors;
• HP Mud System: Rated for 7,500 psi ; • Scalper Conveyer: Two Swaco Bumbo-X primary scalper conveyer • Shale Shakers: Seven Swaco BEM-600 cascading shale shakers;
The bulk mud and cement system includes:
• Bulk Material Capacity (mud + cement); 776 m³; • Sack Storage: 5,200 sacks.

Tamar Field Development Project EIA 160 Noble Energy Mediterranean Ltd March 2016 CSA-Noble-FL-16-2650-08-REP-01-FIN-REV04
Figure 3-14. Information on the Atwood Advantage.
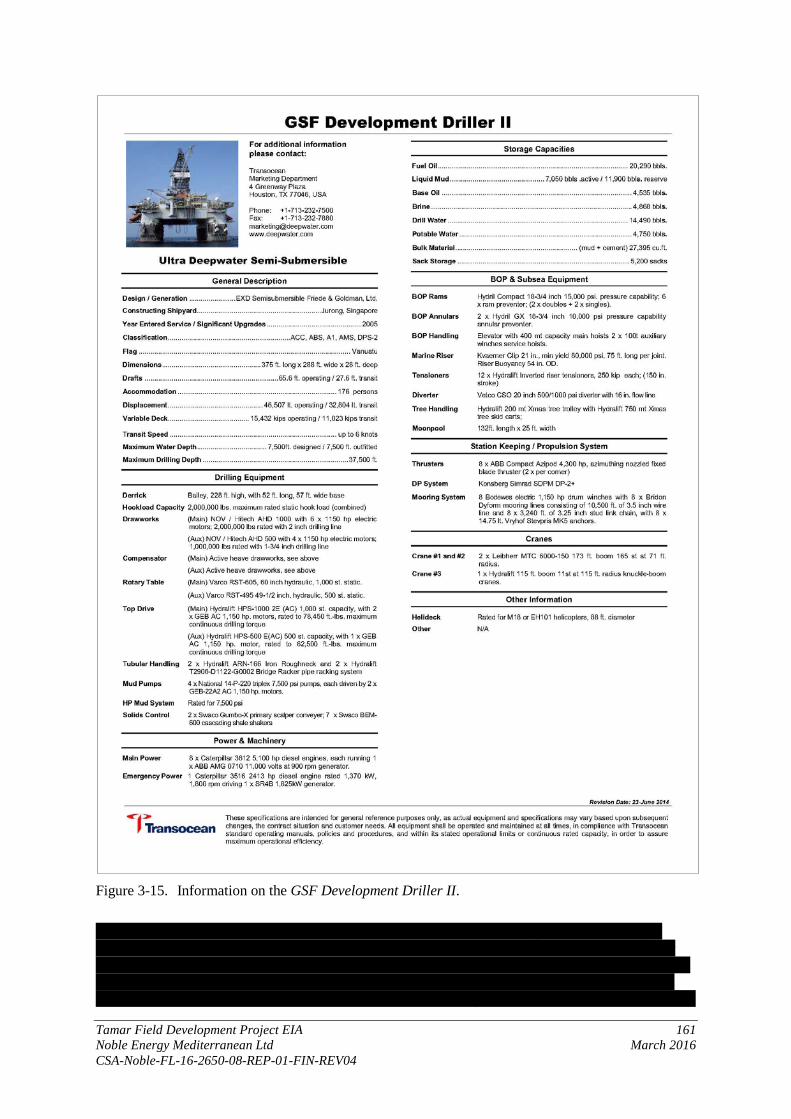
Tamar Field Development Project EIA 161 Noble Energy Mediterranean Ltd March 2016 CSA-Noble-FL-16-2650-08-REP-01-FIN-REV04
Figure 3-15. Information on the GSF Development Driller II.
The initial well intervals (before the marine riser is set) will be drilled using a water-based “spud mud,” and the cuttings and spud mud will be released at the seafloor. For the intervals drilled after the riser is set, Noble Energy has selected INNOVERT CFMOB, a high-performance invert emulsion fluid system developed by Baroid (a product service line of Halliburton). ExxonMobil Chemical’s ESCAID 110 would be the base fluid for the INNOVERT mud system. ESCAID 110 mineral base oil

Tamar Field Development Project EIA 162 Noble Energy Mediterranean Ltd March 2016 CSA-Noble-FL-16-2650-08-REP-01-FIN-REV04
is derived from selected petroleum feed stocks that have been highly refined and reacted with hydrogen to convert aromatics to cycloparaffins. This deep hydrogenation results in products of controlled composition with low aromatics content, negligible relative impurities, and a faintly sweet odor. It is a complex mixture of hydrocracked and desulfurized hydrocarbons with a narrow distillation range (205°C to 237°C). ESCAID 110 has a low viscosity and can reduce the friction factor between the drill string and the sides of the borehole considerably. It offers high drilling performance and enhanced rates of penetration and shale inhibition. Table 3-6 lists selected physical, chemical, and environmental characteristics of ESCAID 110 mineral oil-based mud (MOBM).
Table 3-6. Selected physical, chemical, and environmental characteristics of ESCAID 110 mineral oil-based mud (MOBM) (From: Imperial Oil and ExxonMobil; see Appendix E).
Property or Test Method Specifications Aniline point (°C) ASTM D 611 65.6 (minimum) – 76 Appearance Visual Pass Aromatics content (wt. %) AM-S 140.31 0.5 (maximum) PAH content (wt. %) -- <0.001 Color (Saybolt units) ASTM D 156 or ASTM D 6945 30 (minimum) Distillation (initial boiling point, °C) ASTM D 86 192 (minimum) – 205 Distillation (DP, °C) ASTM D 86 250 (minimum) Flash Point (°C) ASTM D 93 70 (minimum) – 80 Pour Point (°C) ASTM D 97 -39 – -35 (minimum) Specific Gravity (kg dm-3 @ 15.6°C) ASTM D 4052 0.790 – 0.810 Viscosity (@ 40°C, cSt) ASTM D 445 1.50 – 1.75 Octonol/water partition coefficient (Log Kow) OECD TG 117 >6.5 Biodegradability (in seawater) OECD 306 (OECD, 1992) 67% Bioassays
Corophium volutator (amphipod) 10-day LL50 341 mg kg-1 Acartia tonsa (copepod) 48-hour LL50 9,229 mg L-1 Skeletonema (alga) 72-hour NOEL 10,000 mg L-1 Tilapia mossambica (fish) 96-hour LL50 31,3000 mg L-1 Mugil parsia (fish) 96-hour LL50 306,000 mg L-1 Cyprionodon variegatus (fish) 96-hour LL50 8,958 mg L-1
ASTM = American Society for Testing and Materials; kg dm-3 = kilograms per cubic decimeter; LL50 = median lethal loading (equivalent to lethal concentration 50 [LC50]); NOEL = no observable effects level; OECD = Organisation for Economic Co-operation and Development.
INNOVERT is classified as a “Group III NADF” based on its aromatic content of less than 0.5% and PAH content of less than 0.001% (International Association of Oil & Gas Producers, 2003). Key components of the INNOVERT mud system include: (1) ESCAID 110 – the mineral oil base fluid; (2) LE SUPERMUL – a polyaminated fatty acid that can be used to emulsify water into the fluid (helps improve wetting characteristics and is designed for use in high-performance fluids); (3) lime – that can be used to increase the alkalinity level of the water phase; (4) calcium chloride – used as a brine salt in invert emulsion fluids; (4) BAROID – barite, added as needed as a weighting agent; (5) RHEMOD L – a unique, modified fatty acid for providing suspension and viscosity; (6) ADAPTA – a co-polymer for providing high-pressure/high-temperature filtration control; (7) EZ Mul NT – an invert emulsifier and oil-wetting agent; and (8) TAU MOD – a viscosifier used to improve suspension and hole cleaning capabilities in high-performance fluids.
The advantages of this formulation are as follows:
• Stable mud properties over a wide temperature and density range; suitable for high-temperature/high-pressure applications;

Tamar Field Development Project EIA 163 Noble Energy Mediterranean Ltd March 2016 CSA-Noble-FL-16-2650-08-REP-01-FIN-REV04
• A better seal than conventional technologies; • Reduced downhole losses of drilling mud; • Unique rheological properties that eliminate the need for fine-ground weighting agents while
providing excellent hole cleaning; • Increased tolerance to contaminants such as solids and water influxes; • Significantly lower solids content to help increase penetration rates; • Fewer products than for conventional synthetics, improving logistics and rig space usage; • Real-time response to chemical treatments; and • Enhanced electrical formation evaluation.
Cuttings will be separated from the MOBM prior to discharge (if approved) or transport for shore disposal. If the cuttings will be discharged, they will be treated using a thermomechanical cuttings cleaner (or equivalent system) cuttings handling process unit to process the cuttings to less than 1% oil on cuttings. Figure 3-16 shows a flow diagram for processing the drilling mud and cuttings on the drilling unit. Drilling mud is circulated down the drill pipe continuously during drilling and returns to the surface through the annular space between the drill pipe and casing, carrying drill cuttings in suspension. On the drilling unit, the mud and cuttings are passed through solids control equipment designed to separate the drill cuttings so that the mud can be pumped back down the hole. The cuttings are initially separated using mesh screens on shale shakers and then transferred to a process plant that uses mechanical action applied directly to the drill cuttings creating temperatures (260°C to 280°C) that rise above the boiling points of water and oil. Reaching these temperatures removes the hydrocarbons from the solids to less than 1% oil on cuttings. The remaining water and oil vapor is condensed into the relevant streams and recovered separately. The recovered oil is pumped back into the mud system and the water is disposed overboard if it meets offshore disposal guidelines. Water that does not meet the discharge limits is transferred to a holding tank and disposed of onshore. Typical oil in water (OIW) content of the recovered water is less than 30 ppm.
The process mill’s main function is to generate friction heat to force the evaporation of water and oils present in the feed material. The rotor operates with a rotational speed of 600 to 700 rpm, which creates a ring-shaped bed of material along the stator wall. Due to the intense agitation of the rotor, motor energy is transferred as heat to the material bed, allowing water and oil in the material to be efficiently flash evaporated. The condenser module is broken into four stages with the oil scrubber being the primary vessel that removes the final solids from the recovered vapor. From there, the vapor travels through an oil condenser, water condenser, and oil-water separator.
Key advantages of the system are as follows:
• Direct heating of the waste stream resulting in maximum energy efficiency; • Recovered base oil which can be directly recycled; • Dried solids which are clean and can be disposed of on site; • An easily relocated unit that is ideal for offshore use; and • Rapid start-up and shutdown, which facilitates simple maintenance tasks.
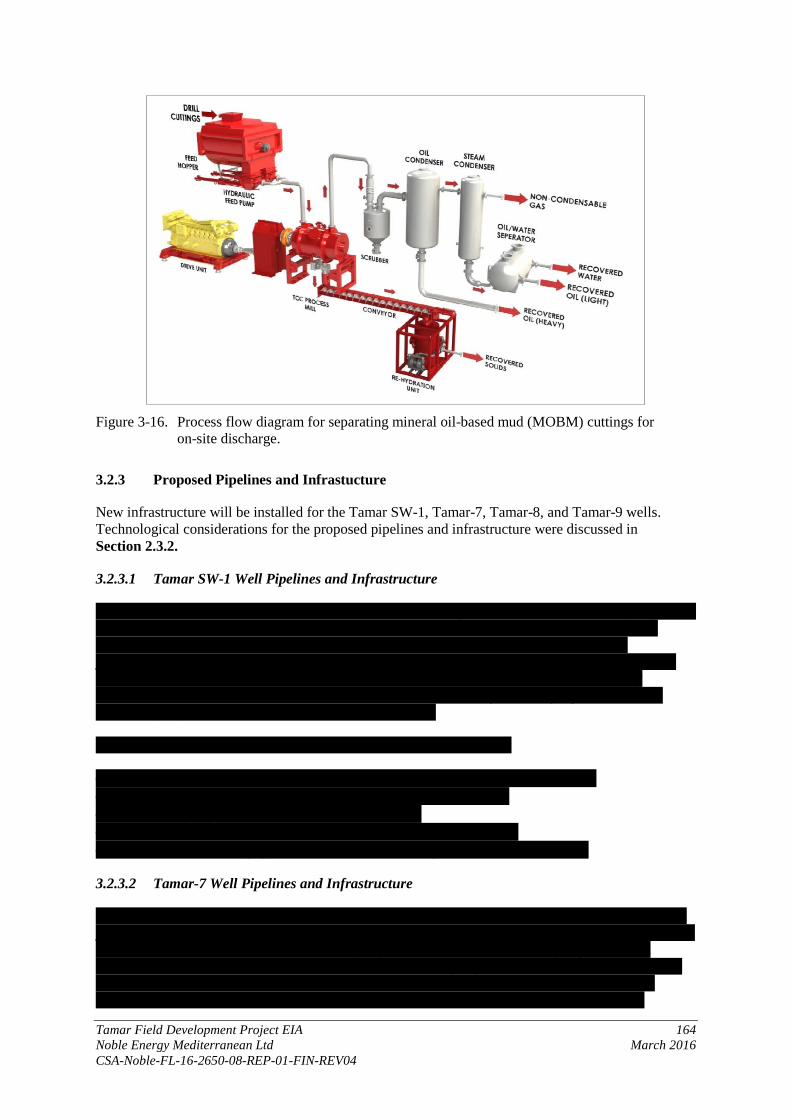
Tamar Field Development Project EIA 164 Noble Energy Mediterranean Ltd March 2016 CSA-Noble-FL-16-2650-08-REP-01-FIN-REV04
Figure 3-16. Process flow diagram for separating mineral oil-based mud (MOBM) cuttings for
on-site discharge.
3.2.3 Proposed Pipelines and Infrastucture
New infrastructure will be installed for the Tamar SW-1, Tamar-7, Tamar-8, and Tamar-9 wells. Technological considerations for the proposed pipelines and infrastructure were discussed in Section 2.3.2.
3.2.3.1 Tamar SW-1 Well Pipelines and Infrastructure
The Tamar SW-1 well will connect to a 12 in. flowline routing to the Tamar-7 wellsite. A jumper will connect the Tamar SW-1 tree to a flowline end termination (FLET) structure. The Tamar SW-1 flowline will terminate into a 12 in. FLET and connect to the Tamar-7 flowline via a 10 in. jumper. The Tamar SW-1 infield umbilical will connect at the Tamar SW-1 wellsite and run to the Tamar-3 wellsite where it will connect to the Tamar-3 infield umbilical termination assembly (IUTA). This umbilical will connect to the Tamar SW-1 well via hydraulic flying leads (HFL's), electical flying leads (EFL's), and flexible flowline (FFL).
The following summarizes the infrastructure for the Tamar SW-1 well:
• One 12 in. outside diameter flowline from Tamar SW-1 to the Tamar-7 flowline. • One 8 in. jumper to connect the Tamar SW-1 well to the flowline. • One 10 in. jumper to connect to the 16 in. Tamar-7. • One umbilical from the Tamar-3 IUTA to the Tamar SW-1 wellsite. • Subsea distribution equipment and controls (including IUTA, HFL, EFL, FFL).
3.2.3.2 Tamar-7 Well Pipelines and Infrastructure
The Tamar-7 well will connect to a 16 in. flowline routing to the existing Tamar subsea manifold. A jumper will connect the Tamar-7 tree to a FLET structure. The Tamar-7 flowline will terminate into a 16 in. FLET and connect to an intermediate jumper structure (IJS) via a 10 in. jumper and then connect from the IJS to the manifold via an additional 10 in. jumper. The Tamar-7 infield umbilical will connect at the Tamar-7 wellsite and run to the existing Tamar subsea distribution assembly (SDA) structure. This umbilical will connect to the Tamar-7 well via HFL's, EFL's, and FFL.
Tamar Field Development Project EIA 165 Noble Energy Mediterranean Ltd March 2016 CSA-Noble-FL-16-2650-08-REP-01-FIN-REV04
The following summarizes the infrastructure for the Tamar-7 well:
• One 16 in. outside diameter flowline from the Tamar-7 well to the manifold/IJS structure. • One 8 in. jumper to connect Tamar-7 well to the flowline. • One 10 in. jumper to connect the 16 in. flowline to the IJS. • One 10 in. jumper to connect the IJS to the manifold. • One umbilical from the Tamar SDA to IUTA at the Tamar-7 well. • Subsea distribution equipment and controls (including IUTA, HFL, EFL, and FFL).
3.2.3.3 Tamar-8 Well Pipelines and Infrastructure
The Tamar-8 well will connect to the existing Tamar-3 10 in. FLET via a 8 in. jumper. The Tamar-8 distribution and controls will either connect directly to the Tamar-3 IUTA via HFL’s, EFL’s, and FFL or to the Tamar-7 umbilical wellsite termination IUTA via an infield umbilical. For the later case, the Tamar-8 infield umbilical IUTA will connect to the Tamar-8 well via HFL's, EFL's and FFL. The Taamr-8 distribution and controls configuration will be dependent on the timing for completion of the Tamar SW-1 well.
The following summarizes the infrastructure for the Tamar-8 well:
• One 8 in. jumper to connect the Tamar-8 well to the Tamar-3 10 in. FLET. • One umbilical from new IUTA from the Tamar-8 well to the IUTA from the Tamar-7 well
(contingent on Tamar SW-1 well completion timing). • Subsea distribution equipment and controls (including IUTA, HFL, EFL, and FFL).
3.2.3.4 Tamar-9 Well Pipelines and Infrastructure
The Tamar-9 well will connect to a 10 in. flowline routing to the Tamar-2 wellsite. A jumper will connect the Tamar-9 tree to a 10 in. FLET structure. The Tamar-9 flowline will terminate into a 10 in. FLET and connect to the Tamar-2 flowline via a 10 in. jumper at the Tamar-2 wellsite. The Tamar-9 infield umbilical will connect at the Tamar-2 umbilical wellsite termination and run to the Tamar-9 wellsite. This umbilical will connect to the Tamar-9 well via HFL's, EFL's, and FFL.
The following summarizes the infrastructure for the Tamar-9 well:
• 10 in. outside diameter flowline from the Tamar-9 well to flowline from the existing Tamar-2 well.
• One 8 in. jumper to connect the Tamar-9 well to a new flowline (future). • One 10 in. jumper to connect to existing the Tamar-2 well FLET. • Umbilical from new IUTA from the Tamar-9 well to IUTA from Tamar-2.
Subsea distribution equipment and controls (including future and proposed IUTA, HFL, and EFL).
3.2.3.5 Pipeline and Infrastructure Materials and Installation
The subsea equipment and pipeline designs will be reviewed and checked for low-frequency fatigue, based on the potential daily production variations. The potential for vortex-induced vibrations acting on freespans that may lead to additional fatigue will be assessed. Slug-induced vibrations on freespans also may generate fatigue damage and will be assessed.
The material grade chosen for the line pipe from the Tamar SW-1 well to the Tamar-7 well is DNV grade 450 (American Petroleum Institute [API] Grade X-65). The tieback pipelines are manufactured as seamless pipe as are the MEG lines and infield flowlines. The infield flowlines, tieback pipelines, and MEG lines are coated with a three-layer polypropylene (3LPP) corrosion

Tamar Field Development Project EIA 166 Noble Energy Mediterranean Ltd March 2016 CSA-Noble-FL-16-2650-08-REP-01-FIN-REV04
coating. These are the same types of pipelines used for previous projects in the Tamar Reservoir Area (CSA International, Inc., 2012). The 16 in. flowline will carry only Tamar SW product until T-7 is brought online, at which point the 16 in. flowline will carry combined T-7 and Tamar SW-1 production to the Tamar production manifold.
The infield pipeline is defined as a maintenance free pipeline. During the production period, Noble Energy will conduct visual surveys around main subsea components and monitoring actions, including cathodic protection surveys.
The flowlines will be laid on the natural seabed. Burial is not necessary due to the water depth, although some degree of self-burial may occur over time.
It is anticipated that the deepwater flowlines will be installed using an S-lay vessel. In S-lay installation, the pipe is welded on the vessel prior to being installed via the vessel’s stinger (Figures 3-17 and 3-18). The stinger is the ramp protruding from the stern of the pipeline installation vessel that provides a gradual transition from the vessel to the seabed. Flowlines will be initiated using a temporary suction pile near the wellhead location, and pipelay will continue towards the manifold. An FLET will be welded at each end of the flowlines. The FLETs are gravity structures. Each FLET has two branches, and each branch has a valve and connector hub. The valves are operated by an ROV. The connector hub on the in-line branch will be used for pigging and testing and the other branch connector hub will be used to connect the rigid jumper to the adjacent structure (tree or manifold) for production.
Figure 3-17. S-lay pipeline installation (From: Rigzone, 2015).
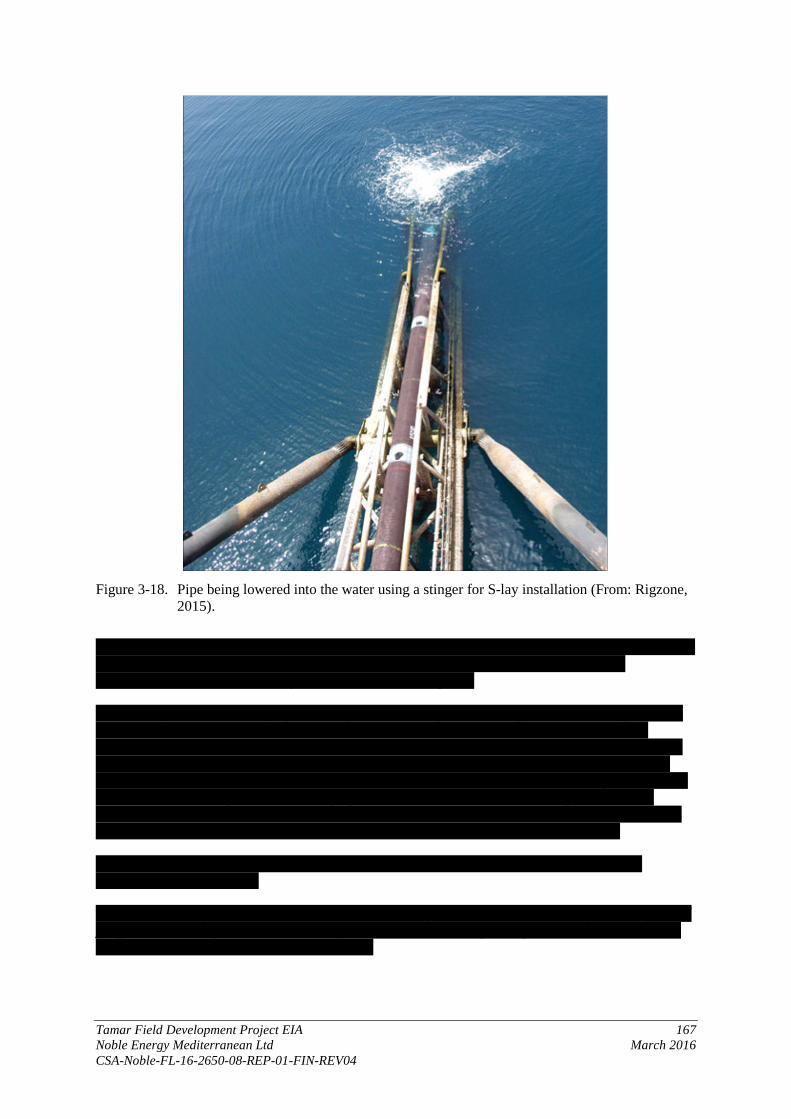
Tamar Field Development Project EIA 167 Noble Energy Mediterranean Ltd March 2016 CSA-Noble-FL-16-2650-08-REP-01-FIN-REV04
Figure 3-18. Pipe being lowered into the water using a stinger for S-lay installation (From: Rigzone,
2015).
The pipeline installation vessel or a separate support vessel will have an ROV. Primary pipeline ROV tasks include a pre-lay survey of the pipeline route, touchdown monitoring during pipeline installation, and an as-built survey after installation is complete.
An ancillary installation campaign will be performed using a suitable separate vessel. As part of the ancillary installation, rigid jumpers will be installed to connect the flowlines to the well(s) and existing manifold after flowline installation is complete. Jumper installation is achieved utilizing an ROV-operated running tool to lock-down the jumper’s collet connector to the hub on the FLET or manifold. Once locked down, the connection is tested to confirm a leak-free seal for operation of the flowline. The ancillary installation campaign also includes installation of the expansion subsea distribution assembly (ESDA), likely with a winch or crane. The umbilicals will be installed from a reel and carousel on board the ancillary installation vessel and connected via flying leads.
Intermediate jumper structures will be installed via winch or crane from either the pipeline or ancillary installation vessel.
ROV tasks that support the ancillary installation campaign include hook up of flying leads, support of jumper installation, pre-installation survey, touchdown monitoring during installation activities, and an as-built survey after installation is complete.
Tamar Field Development Project EIA 168 Noble Energy Mediterranean Ltd March 2016 CSA-Noble-FL-16-2650-08-REP-01-FIN-REV04
The vessel to be used has not been identified; Appendix D presents the specifications for an S-lay vessel, the Lewek Centurion, a 480-foot installation vessel that is representative of one to be used for the pipeline installation.
3.2.4 Safe Practices
Noble Energy follows safe practices during its drilling, completion and installation activities, and best industry practice is used during all drilling phases (e.g., setting of BOP; cementing of concrete between bore and protective pipe). An overview of Noble Energy’s safety programs is presented in Section 5.1.
3.2.4.1 BOP Specifications
Typical BOP specifications include the following (from the ENSCO 5006 specifications as used on the Tamar SW-1 well):
• BOP: VetcoHD-H4 well head connector 18¾ in. 15,000 psi WP; two Cameron 18¾ in. type TL double 15,000 psi WP hydrogen sulfide (H2S) trimmed preventers; one Hydril 18¾ in. dual annuflex annular 10,000 psi WP H2S trimmed; lower marine riser package: Cameron connector model HC, 18¾ in. 15,000 psi WP; oil state 5,000 psi flex joint.
• BOP handling: one BOP carrier, 272 MT; one x-mas tree carrier, 272 MT; two 72.5 MT BOP overhead crane.
• Control system: Cameron Multiplex system, 5,000 psi. • Diverter: Hydril FS-21-500, 21¼ in. for a 60½ in. rotary, 500 psi WP, two 14 in. vent lines and
one 18 in. flowline outlet. • Choke and kill: Cameron 15,000 psi, 4 in., H2S service manifold.
A typical blowout preventor (BOP) stack is shown in Figure 3-19.
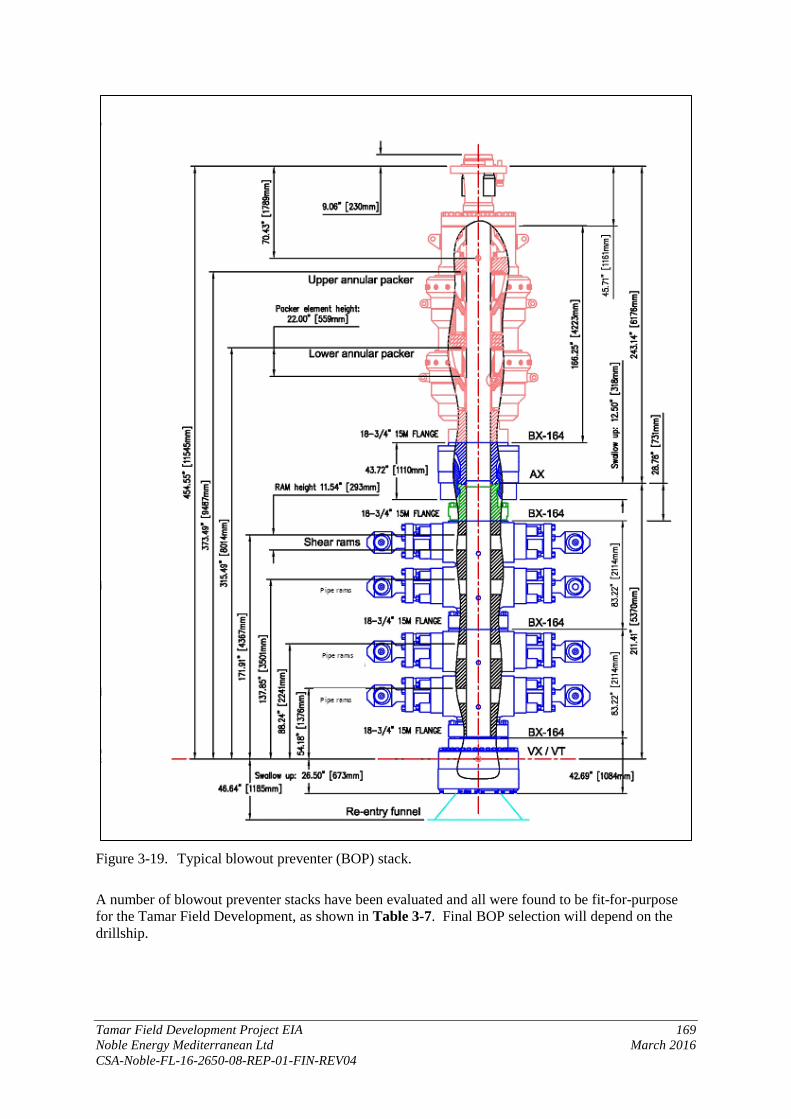
Tamar Field Development Project EIA 169 Noble Energy Mediterranean Ltd March 2016 CSA-Noble-FL-16-2650-08-REP-01-FIN-REV04
Figure 3-19. Typical blowout preventer (BOP) stack.
A number of blowout preventer stacks have been evaluated and all were found to be fit-for-purpose for the Tamar Field Development, as shown in Table 3-7. Final BOP selection will depend on the drillship.
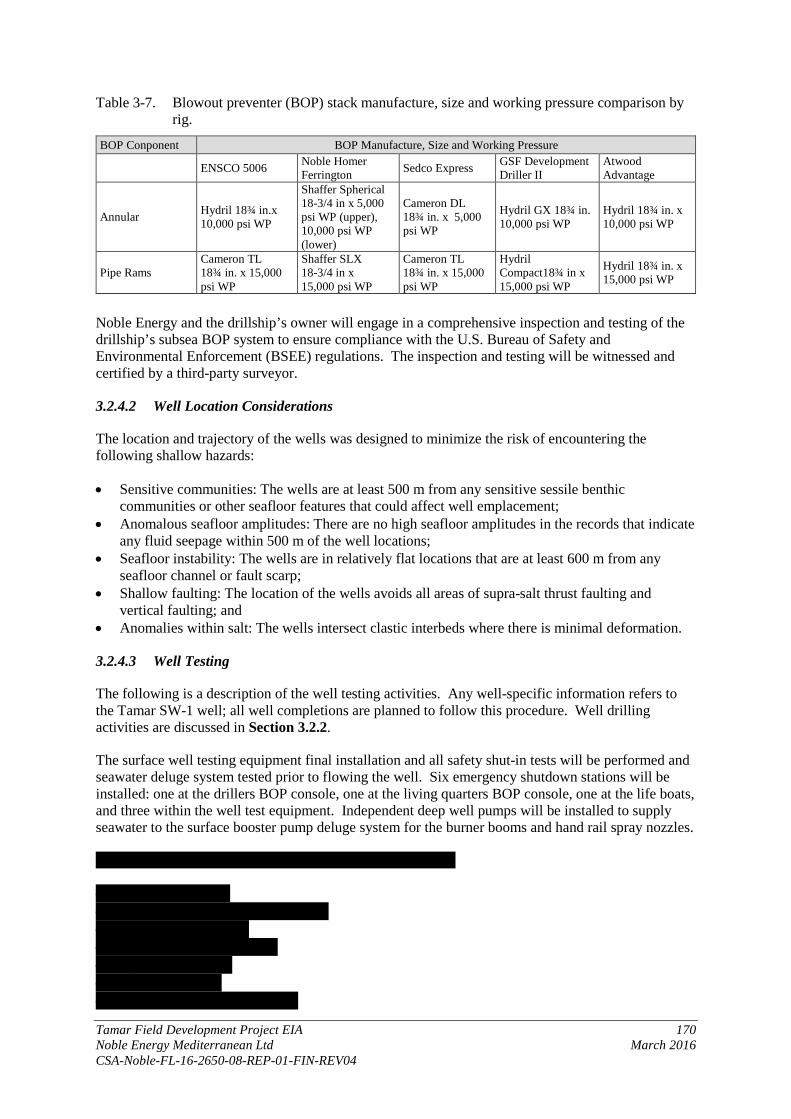
Tamar Field Development Project EIA 170 Noble Energy Mediterranean Ltd March 2016 CSA-Noble-FL-16-2650-08-REP-01-FIN-REV04
Table 3-7. Blowout preventer (BOP) stack manufacture, size and working pressure comparison by rig.
BOP Conponent BOP Manufacture, Size and Working Pressure
ENSCO 5006 Noble Homer Ferrington Sedco Express GSF Development
Driller II Atwood Advantage
Annular Hydril 18¾ in.x 10,000 psi WP
Shaffer Spherical 18-3/4 in x 5,000 psi WP (upper), 10,000 psi WP (lower)
Cameron DL 18¾ in. x 5,000 psi WP
Hydril GX 18¾ in. 10,000 psi WP
Hydril 18¾ in. x 10,000 psi WP
Pipe Rams Cameron TL 18¾ in. x 15,000 psi WP
Shaffer SLX 18-3/4 in x 15,000 psi WP
Cameron TL 18¾ in. x 15,000 psi WP
Hydril Compact18¾ in x 15,000 psi WP
Hydril 18¾ in. x 15,000 psi WP
Noble Energy and the drillship’s owner will engage in a comprehensive inspection and testing of the drillship’s subsea BOP system to ensure compliance with the U.S. Bureau of Safety and Environmental Enforcement (BSEE) regulations. The inspection and testing will be witnessed and certified by a third-party surveyor.
3.2.4.2 Well Location Considerations
The location and trajectory of the wells was designed to minimize the risk of encountering the following shallow hazards:
• Sensitive communities: The wells are at least 500 m from any sensitive sessile benthic communities or other seafloor features that could affect well emplacement;
• Anomalous seafloor amplitudes: There are no high seafloor amplitudes in the records that indicate any fluid seepage within 500 m of the well locations;
• Seafloor instability: The wells are in relatively flat locations that are at least 600 m from any seafloor channel or fault scarp;
• Shallow faulting: The location of the wells avoids all areas of supra-salt thrust faulting and vertical faulting; and
• Anomalies within salt: The wells intersect clastic interbeds where there is minimal deformation.
3.2.4.3 Well Testing
The following is a description of the well testing activities. Any well-specific information refers to the Tamar SW-1 well; all well completions are planned to follow this procedure. Well drilling activities are discussed in Section 3.2.2.
The surface well testing equipment final installation and all safety shut-in tests will be performed and seawater deluge system tested prior to flowing the well. Six emergency shutdown stations will be installed: one at the drillers BOP console, one at the living quarters BOP console, one at the life boats, and three within the well test equipment. Independent deep well pumps will be installed to supply seawater to the surface booster pump deluge system for the burner booms and hand rail spray nozzles.
The surface well test equipment will consist of the following:
• Surface flow head; • Coflexip hose production flow line; • Kill line to flow head; • Inline surface safety valve; • Cyclonic desander; • Iso-split sampler; • Double block choke manifold;

Tamar Field Development Project EIA 171 Noble Energy Mediterranean Ltd March 2016 CSA-Noble-FL-16-2650-08-REP-01-FIN-REV04
• Data header; • Chemical injection pumps upstream and downstream of choke manifold; • Three heat exchangers; • 2,000 barrels of water per day (bowpd) separator; • Dual compartment surge tank; • Triple compartment gauge tank; • Four 4-mbtu steam exchangers; • Oil manifold; • Gas manifold; • Two burner booms and burners with ignition systems; • Two air compressors; • Surface well flow and monitoring system; • Sampling and fluid and gas testing equipment; and • A dual pot filtration unit.
Once all surface safety systems have been tested, the landing string will be displaced to a lighter fluid to underbalance the well at approximately 500 psi.
The overall strategy to the flow back is to bring the well online as quickly as necessary to unload liquids and steadily ramp production to the maximum flow rate of 120 mmscfd with a maximum condensate gas ratio rate of 1.2 barrels per minute. Once at maximum rate, the well will be monitored to determine when it can be considered “cleaned up.” After determining the well is clean, flow will continue until condensate yield is determined and samples are taken. The well will be stepped down in four steps as shown in Table 3-8. After shutting in at surface for the pressure build up, the bottom hole pressure will be monitored and recorded for a minimum of 3 hours at a high-frequency scan rate (1 second intervals). Methanol will be injected at the subsea test tree, upstream and downstream of the choke manifold for hydrate inhibition. All produced gas, condensate, and injected methanol will be sent to a flare.
Any NaCl/NaBr, formation water, or condensate flowed back will be collected, filtered, tested, and discharged overboard as per Noble Energy standards. Any fluid that does not meet applicable discharge standards will be collected and sent to shore for proper disposal.
Well build up will be monitored and recorded under a closed SCSSV via the IWOCS for at least 3 hours until rig activities force the cessation of monitoring and recording bottom hole pressure data. Table 3-8 and Figure 3-20 show the estimated gas and oil flow for the flow test period of 49.5 hours. Table 3-9 presents the well production parameters expected for the wells.

Tamar Field Development Project EIA 172 Noble Energy Mediterranean Ltd March 2016 CSA-Noble-FL-16-2650-08-REP-01-FIN-REV04
Table 3-8. Estimated gas flow and carbon dioxide (CO2) emissions from the Tamar SW-1 flow test.
Test Period Duration (hours) Gas Rate (scfd) Total Gas Flowed
(scf) Total Oil Flowed
(bbl) Initial ramp-up 9 120,000,000.00 45,000,000.00 54.00 Extended clean up 36 120,000,000.00 180,000,000.00 216.00 First step down to 110 0.1 110,000,000.00 458,333.33 0.55 Flow for 0.25 hours at 110 0.25 110,000,000.00 1,145,833.33 1.38 Second step down to 100 0.1 100,000,000.00 416,666.67 0.50 Flow for 0.25 hours at 100 0.25 100,000,000.00 1,041,666.67 1.25 Third step down to 90 0.1 90,000,000.00 375,000.00 0.45 Flow for 0.25 hours at 90 0.25 90,000,000.00 937,500.00 1.13 Fourth step down to 80 0.1 80,000,000.00 333,333.33 0.40 Flow for 0.25 hours at 80 0.25 80,000,000.00 833,333.33 1.00 Fast shut-in for PBU 0.1 80,000,000.00 333,333.33 0.40 Shut-in end of test 3 0.00 0.00 0.00 Methanol injected n/a n/a n/a 100.00
Total 49.5 n/a 230,875,000.00 377.05 bbl = barrel; n/a = not applicable; PBU = pressure build up; scf = standard cubic feet; scfd = standard cubic feet per day; MOL% = mole percent; ppm = parts per million; SG = specific gravity.
Figure 3-20. Well flow back schedule.
Table 3-9. Well production parameters for well completions used for estimating emissions. Parameter Unit Tamar SW-1
Target gas rate mmscfd 250 Maximum gas rate mmscfd 300
Condensate gas ratio bbl/mmscf 1.20 Gas gravity SG 0.57
Condensate gravity API 30 H2S ppm 0.00 CO2 MOL% 0.10
API = American Petroleum Institute; bbl = barrel; CO2 = carbon dioxide; H2S = hydrogen sulfide; mmscf = million standard cubic feet; mmscfd = million standar

Tamar Field Development Project EIA 173 Noble Energy Mediterranean Ltd March 2016 CSA-Noble-FL-16-2650-08-REP-01-FIN-REV04
The well flow back sampling matrix is presented in Table 3-10, and the hydrate curve is presented in Figure 3-21.
Table 3-10. Well flow back sampling matrix.
Sample Type End of Well Cleanup After Flow
Iso-Split 1 × 20L gas
2 × 200 cc condensate
Separator 1 × 20L gas
4 × 25 L dead condensate 2 × 600 cc condensate
SGS Volatiles
3 × 500 cc gas
3 × 500 cc condensate (separator) 3 × Radon 4 × Mercury
Total Per Period
2 × 20 L gas
4 × 25 L dead condensate
2 × 200 cc condensate 2 × 600 cc condensate 3 × 500 cc gas 3 × 500 cc condensate 3 × Radon 4 × Mercury
Figure 3-21. Well completion hydrate curve.

Tamar Field Development Project EIA 174 Noble Energy Mediterranean Ltd March 2016 CSA-Noble-FL-16-2650-08-REP-01-FIN-REV04
Once the final build up period has finished, the SCSSV will remain closed and the tubing pressure will be bled off. A 60/40 MEG/seawater mix will be lubricated above the SCSSV to the subsea tree.
Slickline will be rigged up and the nipple bore protector will be retrieved from the tubing hanger. A 5¼ in. tubing hanger plug will be run and tested to make the well secure.
The landing string with the subsea test tree and tubing hanger running tool will be retrieved. The riser will be displaced to seawater, and the BOP and riser will be unlatched from the Cameron subsea tree.
The internal tree cap with 5¾ in. plug installed will be run, open water set, and tested for final well safety. A light weight debris cap will be installed.
The Cameron subsea tree would be made safe and the IWOCS will be retrieved
3.2.4.4 Drilling Integrity Tests and Maximum Anticipated Surface Pressure
The purpose of drilling integrity tests is to determine the competence of the BOPs, casing, and primary cement job and the competence of the formation below the casing shoe. Integrity tests will be performed after running and cementing each casing string.
The maximum required casing and blind shear ram surface test pressure will be equivalent to the maximum anticipated surface pressure (MASP) plus 500 psi or 70% of the minimum internal yield pressure (MIYP70%) of the casing being tested less mud weight versus pore pressure at the previous shoe difference at the wellhead, casing top, or shoe, whichever is less. For production casing strings, the casing test pressure will be determined by the completion requirements.
The MASP calculations and results accepted by the U.S. Bureau of Safety and Environmental Enforcement are reported as the lesser of the pressures calculated using the following two methods:
• Pore Pressure Method (MASPpore): This calculation assumes the well is partially unloaded to gas and equals the maximum expected pore pressure at the bottom of the open hole less the hydrostatic head of the gas column and the mud column from the bottom of the hole to the “surface.”
• Fracture Gradient Method (MASPfrac): This calculation assumes the well is completely unloaded to gas and equals the fracture pressure at the deepest exposed casing or liner shoe less the hydrostatic head of the gas from that shoe to the “surface.”
The corresponding maximum anticipated wellhead pressure (MAWP) is equivalent to MASP plus gas hydrostatic from surface to the wellhead.
The maximum required surface BOP pressure test will be equivalent to the MASP plus 500 psi less mud weight versus seawater hydrostatic difference at the mudline. Test pressures are not to exceed 70% of the annular rating or 100% of the ram rating at seafloor conditions.
A formation integrity test will be performed after running and cementing each casing string, cleaning out the rathole section, and drilling 3 m (10 ft) of new formation below the casing shoes. If a leak-off pressure that is lower than anticipated is obtained and the equivalent mud weight is less than that required to safely drill to the next casing depth, consideration will be given to squeezing the casing shoe with cement. Subsequent re-testing should verify if the primary cement job was ineffective or if the formation fracture gradient was lower than anticipated.

Tamar Field Development Project EIA 175 Noble Energy Mediterranean Ltd March 2016 CSA-Noble-FL-16-2650-08-REP-01-FIN-REV04
3.2.4.5 Testing of the Casing
Laboratory Testing
Laboratory testing is a critical element in successful well cementing. Unless specifically indicated, all cement testing procedures shall adhere to the latest version of the cement service provider’s Global Laboratory Best Practices. These are based on the following API documents or its equivalent ISO document listed below:
• API Recommended Practice 10B-2/ISO 10426-2, Recommended Practice for Testing Well Cements;
• API Recommended Practice 10B-3/ISO 10426-3, Recommended Practice on Testing of Deepwater Well Cement Formulations;
• API Recommended Practice 10B-4/ISO 10426-4, Recommended Practice on Preparation and Testing of Foamed Cement Slurries at Atmospheric Pressure;
• API Recommended Practice 10B-5/ISO 10426-5, Recommended practice for the Determination of Shrinkage and Expansion of Well Cement Formulations at Atmospheric Pressure; and
• API Recommended Practice 10B-6/ISO 10426-6, Recommended Practice for the Determination of the Static Gel Strength of Cement Formulations.
Formation Integrity Test
The purpose of a Formation Integrity Test (FIT) is to determine the competence of the primary cement job and the competence of the formation below the casing shoe. A FIT will be performed after running and cementing each casing string, cleaning out the rathole section, and drilling 3 m [10 ft] of new formation below the casing shoes. If a leak-off pressure is obtained that is lower than anticipated and the equivalent mud weight is less than that required to safely drill to the next casing depth, squeezing the casing shoe will be considered. Subsequent re-testing should verify if the primary cement job was ineffective or if the formation fracture gradient was lower than anticipated.
Casing Test Pressures
Casing pressure tests shall be conducted to the MASP or 70% of minimum internal yield pressure (MIYP70) of the casing being tested, whichever is less. For production casing strings, the casing test pressure (CTP) will be determined by the completion requirements.
3.2.4.6 Pipeline Commissioning and Startup
Hydrostastic testing of the pipelines and MEG supply lines is included in the installation work scope. During pre-commissioning and testing, the export lines and the infield flowlines will be dewatered, chemically swabbed, and nitrogen purged. The jumpers will remain filled with water.
Commissioning includes verifying the correct functioning of valves, sensors, and function testing of the umbilical. Water in jumpers will displaced and inhibited with MEG and MeOH delivered from the SDA. Leak and seal testing will be performed. Gas buy back will be considered, if required, to pressurize the system to the specified startup pressures.
Startup will include dosing of the trees down to the SCSSV with MeOH. Wells are started one at a time to produce gas and to displace nitrogen in the lines. Gas and nitrogen will be vented until pure gas flow is reached.
3.2.4.7 Pipeline Protection and Production Monitoring
The pipeline system has been designed to DNV-OS-F101 and the pipeline structures (FLETs and jumpers) are designed to American Society of Mechanical Engineers (ASME) B31.8. These codes

Tamar Field Development Project EIA 176 Noble Energy Mediterranean Ltd March 2016 CSA-Noble-FL-16-2650-08-REP-01-FIN-REV04
specify very conservative pipeline corrosion allowances to cover a range of different service applications. Most subsea systems around the world are designed for a maximum design life of 20 years; however, the Tamar pipeline system is designed for a 30 year life span. This extended life is also factored and ultimately designed into the corrosion allowances.
Maintenance and monitoring processes include sand management, corrosion management, flow metering, hydrate prevention, hydrate detection and remediation, emergency shutdown, relief and blow-down procedures, subsea ROV intervention, pigging, and maintaining an inventory of spare equipment.
The Tamar gas system uses continuous MEG injection to prevent hydrates. The MEG is combined with corrosion inhibitors designed specifically for the Tamar gas and water chemistry. The corrosion inhibitor reduces the loss of pipeline wall thickness over the life of the field, thus ensuring pipeline pressure containment and structural integrity.
The Tamar subsea system is outfitted with pressure and temperature transducers throughout the architecture. The Tamar subsea control system continuously monitors this using telemetry to allow for real-time pipeline pressure integrity management.
An emergency shutdown (ESD) system protects the Tamar and Dalit facilities and personnel from potentially adverse effects due to unexpected emergencies with minimal impact on the environment. The ESD system is an independent system that interfaces with the Process Control System (PCS) via the data highway. The ESD system is responsible for executing various alarms, shutdown, and blow-down scenarios based on the various ESD levels.
3.2.4.8 Production Control System
The Tamar Southwest Production Control System uses additional capacity built into the Tamar subsea infrastructure along with an additional Expansion Subsea Distribution Assembly (ESDA) to be installed adjacent to the existing Tamar SDA. This ESDA will accommodate the Tamar SW-1 well plus an additional 5 wells for the expansion of the Tamar Field.
Additional communication distribution unit (CDU) repeaters will be installed next to the existing Tamar CDU repeaters at the northern split of the main umbilicals to increase signal capacity. CDUs will be installed on the ESDA to convert the fiber optic signal to a DSL signal.
A wet gas flow meter will be installed at the Tamar SW-1 well to monitor and measure production from the well.
Additional hydraulic, flexible, electrical and optical flying leads will be installed by an ROV to connect the following components:
• Infield umbilical termination assembly to the trees; • Wet gas flow meter to the trees; • Existing SDA to the new subsea infrastructure; • ESDA to the existing subsea infrastructure; and • Expansion repeaters to the main umbilicals.
3.3 NOISE HAZARDS
The noise characteristics of a typical drilling unit conducting routine drilling activities and various support operations (e.g., support vessels, helicopters) are available and outlined in Table 3-11, as derived from Richardson et al. (1995). These values may be used as estimates for the noise generated during the drilling of the Tamar wells.

Tamar Field Development Project EIA 177 Noble Energy Mediterranean Ltd March 2016 CSA-Noble-FL-16-2650-08-REP-01-FIN-REV04
Table 3-11. Summary of representative noise source levels for oil and gas exploration-associated drilling operations, vessels, and aircraft (Adapted from: Richardson et al., 1995).
Sound Source Source Levels (dB re 1 µPa at 1 m) Highest
1/3-Octave Band
Level Band Level Broadband
(45−7,070 Hz) 1/3-Octave Band Center Frequency (Hz) 50 100 200 500 1,000 2,000
Continuous Sound Sources Drilling
Kulluk (45-1780 Hz)
185 174 172 176 176 168 -- 400 177
C. Explorer II 174 162 162 161 162 156 148 63 167 Semi-submersible 154 -- -- -- -- -- -- -- --
Transient Sound Sources Vessels Underway
Supply Ship 181 162 174 170 166 164 159 100 174 Supply Vessel 128-158 -- -- -- -- -- -- -- -- Crew Boat 156 -- -- -- -- -- -- -- --
Aircraft Bell 212 Helicopter 162 154 155 151 145 142 142 16 159
Note: Richardson et al. (1995) computed aircraft flyover source levels, as initially provided by Malme et al. (1989) for a standard altitude of 305 m; values were changed to a reference range of 1 m by adding 50 dB.
Salient characteristics of these representative noise sources as they apply to proposed operations include the following:
Most man-made noise associated with offshore oil and gas drilling operations or support activities are in the low frequency bands (<500 to 1,000 Hz).
Propeller cavitation, propeller singing, and propulsion machinery are primary noise sources for vessels (regardless of size), which is not an issue with a DP drillship, but would be associated with AHTS and support vessel operations.
Semi-submersible drilling units produce sound levels which are generally lower than other drilling vessels or bottom-founded drilling units (e.g., drillships, jack-up rigs) because the rig machinery is mounted on raised decks, which benefit from portions of the noise spectrum reflecting off the ocean surface.
Sound source levels for a semi-submersible are in the range of 154 dB re 1 µPa at 1 m.
Supply and crew boats produce sound source levels in the range of 128 to 158 dB re 1 µPa at 1 m; these sound sources are considered transient as they move between shore base and the drilling unit; sound from the standby vessel will be at a lower source level while idling on station.
Underwater sounds from helicopters, as with all aircrafts, reach their highest levels just below the surface and directly under the aircraft. When the aircraft is overhead, sound levels decrease with increasing aircraft altitude or increasing receiver depth. The highest energy of helicopter rotor sound is at frequencies <500 Hz, while helicopter turbines contribute to higher sound levels at frequencies >500 Hz.
Transmission of airborne sound into the water is a function of source altitude, orientation (e.g., <26° maximizes sound penetration into the water column), receiver water depth and orientation, and sea surface conditions.

Tamar Field Development Project EIA 178 Noble Energy Mediterranean Ltd March 2016 CSA-Noble-FL-16-2650-08-REP-01-FIN-REV04
Sound emanating from the drillship can be expected to be continuous, at a level of approximately 154 dB re 1 µPa at 1 m while drilling, with most energy in the low frequency bands. During non-drilling periods, sound source levels from the drillship will originate only from diesel generators, cranes, and crew activity aboard the rig.
Supply vessels in transit to and from the rig will produce transient sounds in the 128 to 158 dB (re 1 µPa at 1 m) range, with predominant low frequency components. If a supply vessel remains on standby at the rig, it will produce lower but continuous sound levels. In similar fashion, transient helicopter visits to the rig will produce predominantly low frequency sound source levels of 162 dB (re 1 µPa at 1 m), with highest sound levels to be experienced directly below the aircraft.
Noise associated with installation operations for the pipeline and infrastructure is relatively weak in intensity, and any animals that are affected are exposed to these sounds for a relatively short time. Some of the noise (from vessel engines and propellers) is similar to the existing noise associated with shipping traffic in the region. Very little noise will be generated by the operation of the flowlines and utility lines.
3.4 AIR QUALITY
Activities associated with drilling, including drilling unit positioning, drilling, cementing, and logging operations, along with associated support operations, produced emissions from internal combustion engines, including greenhouse gases and varying amounts of other pollutants such as carbon monoxide (CO), NOx, sulfur oxides (SOx), VOCs, and particulate matter (PM). The location and duration of these operations were variable. For example, while the drilling unit maintained station at the drillsite, support vessels and helicopters traveled between the shore base or airport and offshore. On a weekly basis, there was approximately one supply vessel round trip and one helicopter round trip during drilling.
The recent Tamar SW-1 well information is representative of past Tamar wells. The Tamar SW-1 well utilized the ENSCO 5006 which is equipped with four Caterpillar 3608-TA diesel engines, each rated at 3,055 hp, driving one Baylor AC generator (600 V; 60 Hz; 3,571 kilovolt amp [kVA]). Power distribution was via six silicon-controlled rectifiers, the latter of which were M&I 2,200 amp 750 volt direct current units, used for drilling and mooring. Emergency power was provided by a single Caterpillar 3512-DITA diesel engine rated at 1,281 hp, driving a single Caterpillar SR-4 AC generator (480 V; 60 Hz; 1,137 kVA).
Anchor handling and tow capabilities were provided by two support vessels. A representative vessel for these capabilities is the AHTS vessel Richard M. Currence. The Richard M. Currence and John P Laborde are each equipped with four EMD 16-265-H7 engines, each rated at 6,300 hp. The M/V EAS is equipped with two MaK 12 M453 AK engines, capable of producing a total 7,760 brake horsepower (bhp). The M/V Leon is equipped four Caterpillar 3512B TA engines, capable of producing a total of 6,000 bhp. Helicopter support is the same or similar to that provided by a Bell 412SP aircraft, equipped with two Pratt and Whitney Canada PT6T-3BE Twin-Pac turbo shafts, each producing 900 shaft horsepower (shp) (671 kW).
Emissions included pollutants that are similar to other ocean-going vessels and included carbon dioxide (CO2), NOx, SOx, PM, and unburned hydrocarbons (VOCs). Project air emissions were also associated with the operation of supply boats and AHTS vessels. A summary of air modeled using emissions from project-related sources for the representative Tamar SW-1 well is provided in Table 3-12.
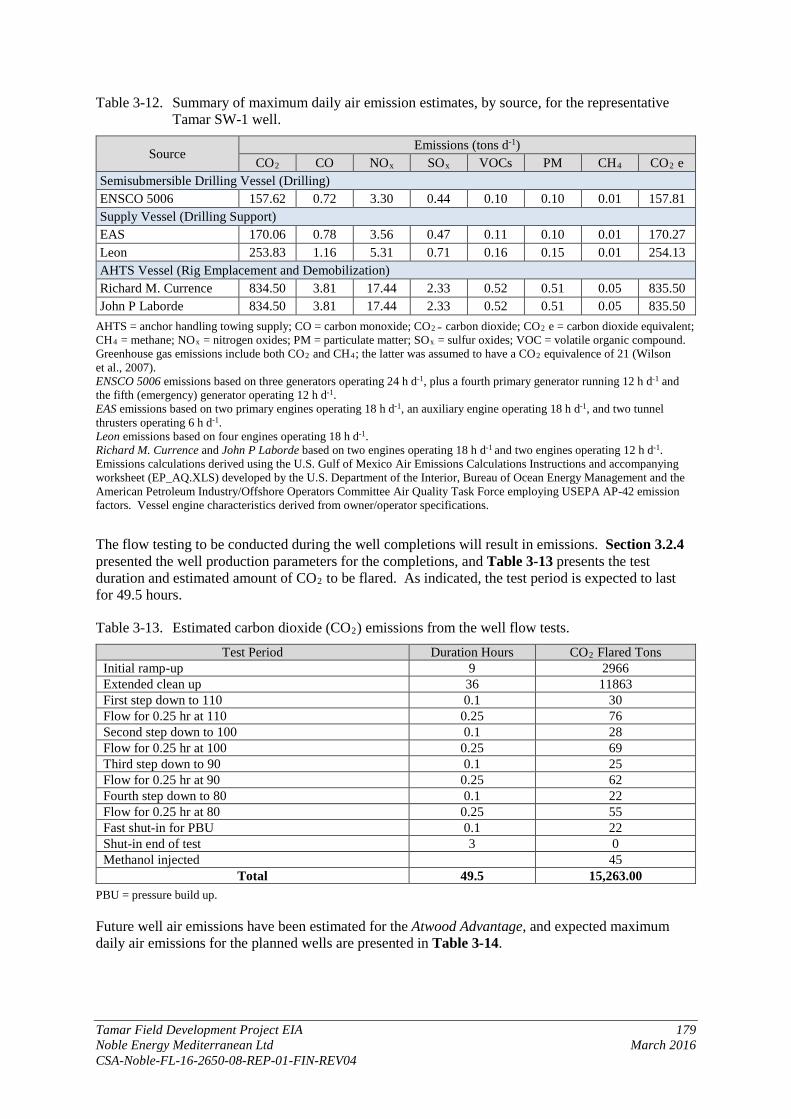
Tamar Field Development Project EIA 179 Noble Energy Mediterranean Ltd March 2016 CSA-Noble-FL-16-2650-08-REP-01-FIN-REV04
Table 3-12. Summary of maximum daily air emission estimates, by source, for the representative Tamar SW-1 well.
Source Emissions (tons d-1)
CO2 CO NOx SOx VOCs PM CH4 CO2 e Semisubmersible Drilling Vessel (Drilling) ENSCO 5006 157.62 0.72 3.30 0.44 0.10 0.10 0.01 157.81 Supply Vessel (Drilling Support) EAS 170.06 0.78 3.56 0.47 0.11 0.10 0.01 170.27 Leon 253.83 1.16 5.31 0.71 0.16 0.15 0.01 254.13 AHTS Vessel (Rig Emplacement and Demobilization) Richard M. Currence 834.50 3.81 17.44 2.33 0.52 0.51 0.05 835.50 John P Laborde 834.50 3.81 17.44 2.33 0.52 0.51 0.05 835.50
AHTS = anchor handling towing supply; CO = carbon monoxide; CO2 = carbon dioxide; CO2 e = carbon dioxide equivalent; CH4 = methane; NOx = nitrogen oxides; PM = particulate matter; SOx = sulfur oxides; VOC = volatile organic compound. Greenhouse gas emissions include both CO2 and CH4; the latter was assumed to have a CO2 equivalence of 21 (Wilson et al., 2007). ENSCO 5006 emissions based on three generators operating 24 h d-1, plus a fourth primary generator running 12 h d-1 and the fifth (emergency) generator operating 12 h d-1. EAS emissions based on two primary engines operating 18 h d-1, an auxiliary engine operating 18 h d-1, and two tunnel thrusters operating 6 h d-1. Leon emissions based on four engines operating 18 h d-1. Richard M. Currence and John P Laborde based on two engines operating 18 h d-1 and two engines operating 12 h d-1. Emissions calculations derived using the U.S. Gulf of Mexico Air Emissions Calculations Instructions and accompanying worksheet (EP_AQ.XLS) developed by the U.S. Department of the Interior, Bureau of Ocean Energy Management and the American Petroleum Industry/Offshore Operators Committee Air Quality Task Force employing USEPA AP-42 emission factors. Vessel engine characteristics derived from owner/operator specifications.
The flow testing to be conducted during the well completions will result in emissions. Section 3.2.4 presented the well production parameters for the completions, and Table 3-13 presents the test duration and estimated amount of CO2 to be flared. As indicated, the test period is expected to last for 49.5 hours.
Table 3-13. Estimated carbon dioxide (CO2) emissions from the well flow tests. Test Period Duration Hours CO2 Flared Tons
Initial ramp-up 9 2966 Extended clean up 36 11863 First step down to 110 0.1 30 Flow for 0.25 hr at 110 0.25 76 Second step down to 100 0.1 28 Flow for 0.25 hr at 100 0.25 69 Third step down to 90 0.1 25 Flow for 0.25 hr at 90 0.25 62 Fourth step down to 80 0.1 22 Flow for 0.25 hr at 80 0.25 55 Fast shut-in for PBU 0.1 22 Shut-in end of test 3 0 Methanol injected 45
Total 49.5 15,263.00 PBU = pressure build up.
Future well air emissions have been estimated for the Atwood Advantage, and expected maximum daily air emissions for the planned wells are presented in Table 3-14.
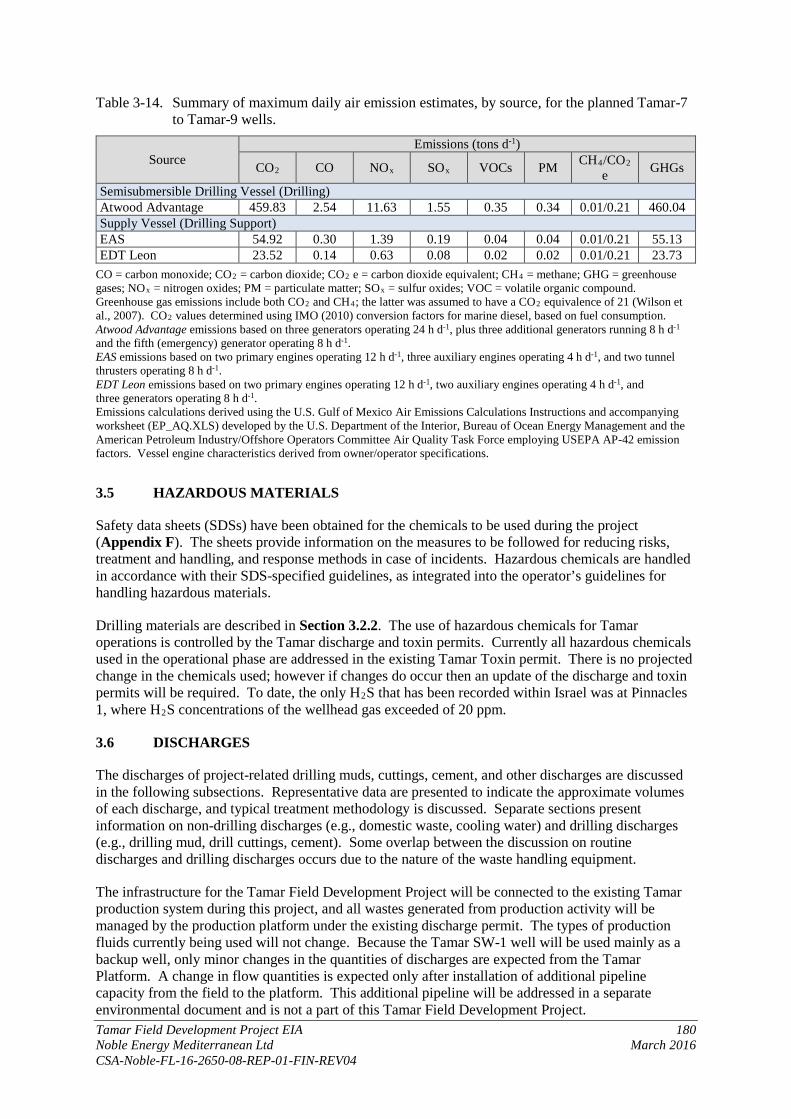
Tamar Field Development Project EIA 180 Noble Energy Mediterranean Ltd March 2016 CSA-Noble-FL-16-2650-08-REP-01-FIN-REV04
Table 3-14. Summary of maximum daily air emission estimates, by source, for the planned Tamar-7 to Tamar-9 wells.
Source Emissions (tons d-1)
CO2 CO NOx SOx VOCs PM CH4/CO2 e GHGs
Semisubmersible Drilling Vessel (Drilling) Atwood Advantage 459.83 2.54 11.63 1.55 0.35 0.34 0.01/0.21 460.04 Supply Vessel (Drilling Support) EAS 54.92 0.30 1.39 0.19 0.04 0.04 0.01/0.21 55.13 EDT Leon 23.52 0.14 0.63 0.08 0.02 0.02 0.01/0.21 23.73
CO = carbon monoxide; CO2 = carbon dioxide; CO2 e = carbon dioxide equivalent; CH4 = methane; GHG = greenhouse gases; NOx = nitrogen oxides; PM = particulate matter; SOx = sulfur oxides; VOC = volatile organic compound. Greenhouse gas emissions include both CO2 and CH4; the latter was assumed to have a CO2 equivalence of 21 (Wilson et al., 2007). CO2 values determined using IMO (2010) conversion factors for marine diesel, based on fuel consumption. Atwood Advantage emissions based on three generators operating 24 h d-1, plus three additional generators running 8 h d-1 and the fifth (emergency) generator operating 8 h d-1. EAS emissions based on two primary engines operating 12 h d-1, three auxiliary engines operating 4 h d-1, and two tunnel thrusters operating 8 h d-1. EDT Leon emissions based on two primary engines operating 12 h d-1, two auxiliary engines operating 4 h d-1, and three generators operating 8 h d-1. Emissions calculations derived using the U.S. Gulf of Mexico Air Emissions Calculations Instructions and accompanying worksheet (EP_AQ.XLS) developed by the U.S. Department of the Interior, Bureau of Ocean Energy Management and the American Petroleum Industry/Offshore Operators Committee Air Quality Task Force employing USEPA AP-42 emission factors. Vessel engine characteristics derived from owner/operator specifications.
3.5 HAZARDOUS MATERIALS
Safety data sheets (SDSs) have been obtained for the chemicals to be used during the project (Appendix F). The sheets provide information on the measures to be followed for reducing risks, treatment and handling, and response methods in case of incidents. Hazardous chemicals are handled in accordance with their SDS-specified guidelines, as integrated into the operator’s guidelines for handling hazardous materials.
Drilling materials are described in Section 3.2.2. The use of hazardous chemicals for Tamar operations is controlled by the Tamar discharge and toxin permits. Currently all hazardous chemicals used in the operational phase are addressed in the existing Tamar Toxin permit. There is no projected change in the chemicals used; however if changes do occur then an update of the discharge and toxin permits will be required. To date, the only H2S that has been recorded within Israel was at Pinnacles 1, where H2S concentrations of the wellhead gas exceeded of 20 ppm.
3.6 DISCHARGES
The discharges of project-related drilling muds, cuttings, cement, and other discharges are discussed in the following subsections. Representative data are presented to indicate the approximate volumes of each discharge, and typical treatment methodology is discussed. Separate sections present information on non-drilling discharges (e.g., domestic waste, cooling water) and drilling discharges (e.g., drilling mud, drill cuttings, cement). Some overlap between the discussion on routine discharges and drilling discharges occurs due to the nature of the waste handling equipment.
The infrastructure for the Tamar Field Development Project will be connected to the existing Tamar production system during this project, and all wastes generated from production activity will be managed by the production platform under the existing discharge permit. The types of production fluids currently being used will not change. Because the Tamar SW-1 well will be used mainly as a backup well, only minor changes in the quantities of discharges are expected from the Tamar Platform. A change in flow quantities is expected only after installation of additional pipeline capacity from the field to the platform. This additional pipeline will be addressed in a separate environmental document and is not a part of this Tamar Field Development Project.
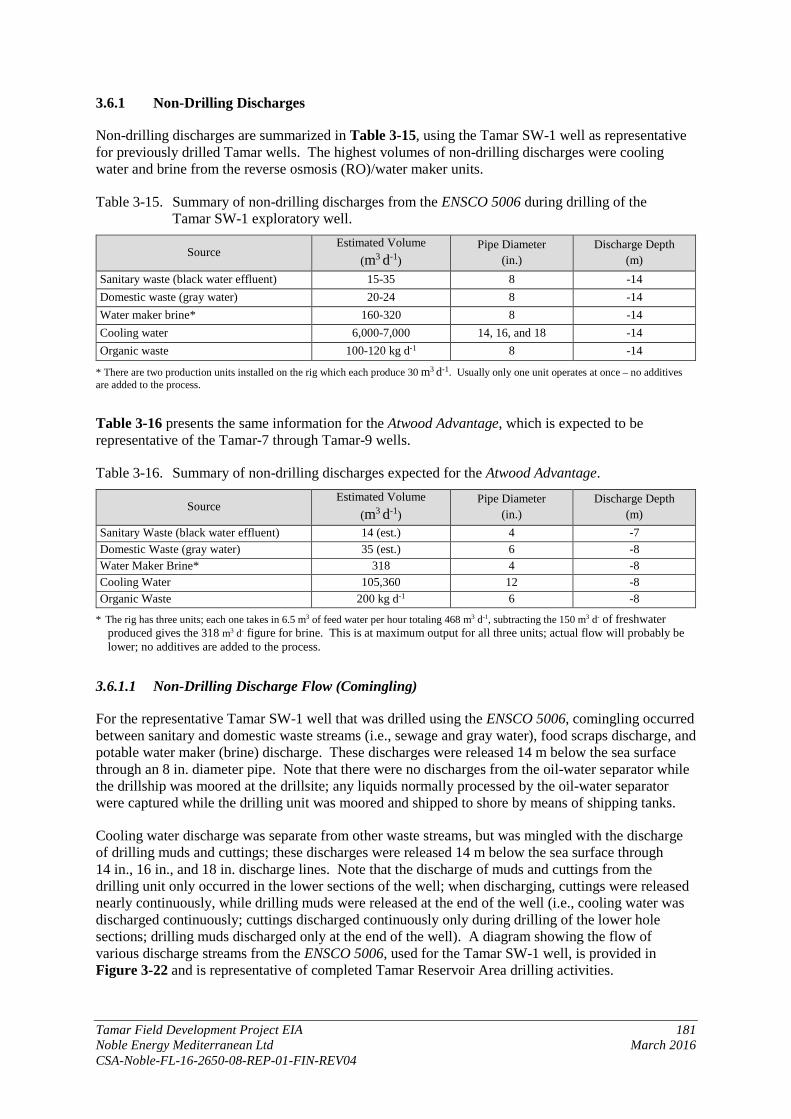
Tamar Field Development Project EIA 181 Noble Energy Mediterranean Ltd March 2016 CSA-Noble-FL-16-2650-08-REP-01-FIN-REV04
3.6.1 Non-Drilling Discharges
Non-drilling discharges are summarized in Table 3-15, using the Tamar SW-1 well as representative for previously drilled Tamar wells. The highest volumes of non-drilling discharges were cooling water and brine from the reverse osmosis (RO)/water maker units.
Table 3-15. Summary of non-drilling discharges from the ENSCO 5006 during drilling of the Tamar SW-1 exploratory well.
Source Estimated Volume
(m3 d-1) Pipe Diameter
(in.) Discharge Depth
(m) Sanitary waste (black water effluent) 15-35 8 -14 Domestic waste (gray water) 20-24 8 -14 Water maker brine* 160-320 8 -14 Cooling water 6,000-7,000 14, 16, and 18 -14 Organic waste 100-120 kg d-1 8 -14
* There are two production units installed on the rig which each produce 30 m3 d-1. Usually only one unit operates at once – no additives are added to the process.
Table 3-16 presents the same information for the Atwood Advantage, which is expected to be representative of the Tamar-7 through Tamar-9 wells.
Table 3-16. Summary of non-drilling discharges expected for the Atwood Advantage.
Source Estimated Volume
(m3 d-1) Pipe Diameter
(in.) Discharge Depth
(m) Sanitary Waste (black water effluent) 14 (est.) 4 -7 Domestic Waste (gray water) 35 (est.) 6 -8 Water Maker Brine* 318 4 -8 Cooling Water 105,360 12 -8 Organic Waste 200 kg d-1 6 -8
* The rig has three units; each one takes in 6.5 m3 of feed water per hour totaling 468 m3 d-1, subtracting the 150 m3 d- of freshwater produced gives the 318 m3 d- figure for brine. This is at maximum output for all three units; actual flow will probably be lower; no additives are added to the process.
3.6.1.1 Non-Drilling Discharge Flow (Comingling)
For the representative Tamar SW-1 well that was drilled using the ENSCO 5006, comingling occurred between sanitary and domestic waste streams (i.e., sewage and gray water), food scraps discharge, and potable water maker (brine) discharge. These discharges were released 14 m below the sea surface through an 8 in. diameter pipe. Note that there were no discharges from the oil-water separator while the drillship was moored at the drillsite; any liquids normally processed by the oil-water separator were captured while the drilling unit was moored and shipped to shore by means of shipping tanks.
Cooling water discharge was separate from other waste streams, but was mingled with the discharge of drilling muds and cuttings; these discharges were released 14 m below the sea surface through 14 in., 16 in., and 18 in. discharge lines. Note that the discharge of muds and cuttings from the drilling unit only occurred in the lower sections of the well; when discharging, cuttings were released nearly continuously, while drilling muds were released at the end of the well (i.e., cooling water was discharged continuously; cuttings discharged continuously only during drilling of the lower hole sections; drilling muds discharged only at the end of the well). A diagram showing the flow of various discharge streams from the ENSCO 5006, used for the Tamar SW-1 well, is provided in Figure 3-22 and is representative of completed Tamar Reservoir Area drilling activities.
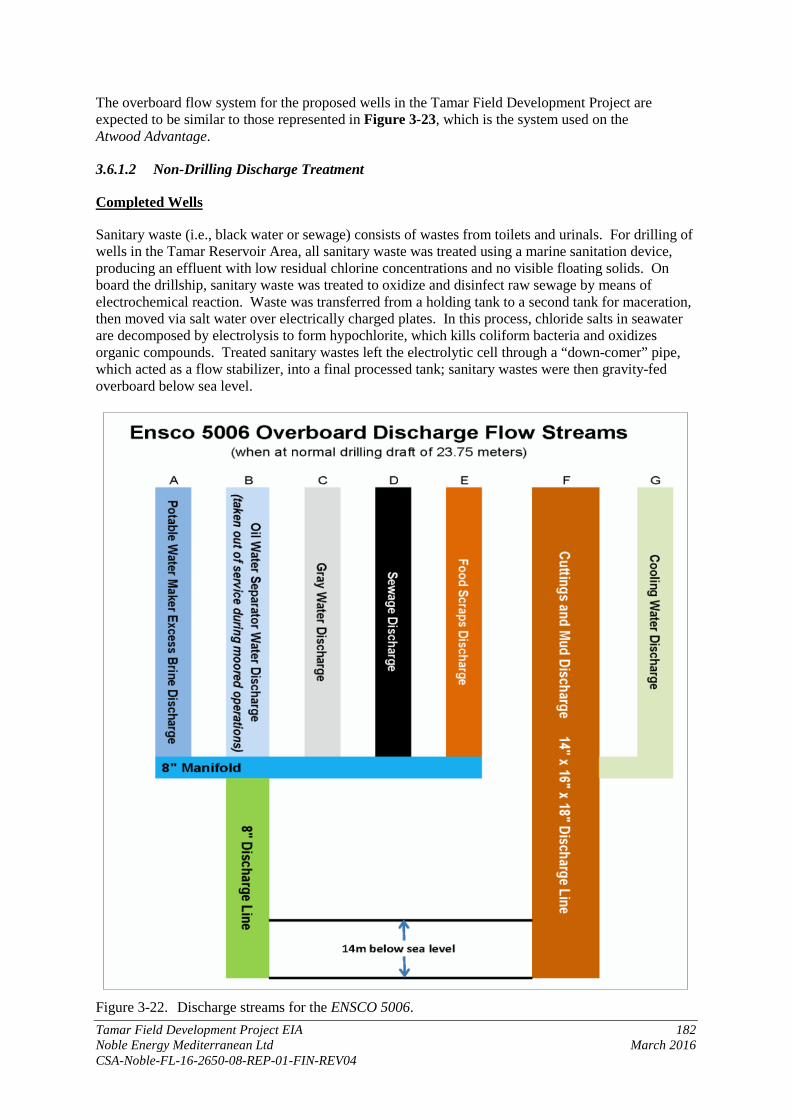
Tamar Field Development Project EIA 182 Noble Energy Mediterranean Ltd March 2016 CSA-Noble-FL-16-2650-08-REP-01-FIN-REV04
The overboard flow system for the proposed wells in the Tamar Field Development Project are expected to be similar to those represented in Figure 3-23, which is the system used on the Atwood Advantage.
3.6.1.2 Non-Drilling Discharge Treatment
Completed Wells
Sanitary waste (i.e., black water or sewage) consists of wastes from toilets and urinals. For drilling of wells in the Tamar Reservoir Area, all sanitary waste was treated using a marine sanitation device, producing an effluent with low residual chlorine concentrations and no visible floating solids. On board the drillship, sanitary waste was treated to oxidize and disinfect raw sewage by means of electrochemical reaction. Waste was transferred from a holding tank to a second tank for maceration, then moved via salt water over electrically charged plates. In this process, chloride salts in seawater are decomposed by electrolysis to form hypochlorite, which kills coliform bacteria and oxidizes organic compounds. Treated sanitary wastes left the electrolytic cell through a “down-comer” pipe, which acted as a flow stabilizer, into a final processed tank; sanitary wastes were then gravity-fed overboard below sea level.
Figure 3-22. Discharge streams for the ENSCO 5006.

Tamar Field Development Project EIA 183 Noble Energy Mediterranean Ltd March 2016 CSA-Noble-FL-16-2650-08-REP-01-FIN-REV04
Figure 3-23. Discharge streams for the Atwood Advantage.
Domestic waste (i.e., gray water) consists of the water generated from showers, sinks, laundries, galleys, safety showers, and eyewash stations. Domestic wastewater is typically screened to remove any floating solids, then discharged below sea level.
Cooling water is used to control and maintain proper temperatures on internal combustion engines on board the drilling unit and project vessels. Cooling water was comingled with muds and cuttings discharges; comingled discharges occurred below sea level.
Organic or food wastes are generated from galley and food service operations. On the ENSCO 5006, food waste was ground prior to discharge (i.e., comminuted), in accordance with Annex V of International Convention for the Prevention of Pollution from Ships (MARPOL 73/78) requirements (i.e., for vessels 400 gross tonnage and above). Food scraps were ground up in a Gulf Gulp garbage disposal unit. Food waste was typically ground to less than 25 mm diameter. Aside from grinding, no other treatment of organic wastes was conducted. Following grinding, food wastes were discharged 14 m below sea level through an 8 in. line.
Freshwater was generated on board the ENSCO 5006 via RO water makers, generating brine (i.e., concentrated seawater) as a byproduct. At maximum rated capacity, each unit could generate 30 m3 d-1 of freshwater, or a total of 60 m3 d-1. Under normal operating conditions, only one RO unit operated at a time. Maximum feed water flow rate through the unit was 380 m3 d-1; maximum brine discharge flow rate was 320 m3 d-1. The excess seawater which was discharged did not contain any added chemicals. The discharge was below sea level.
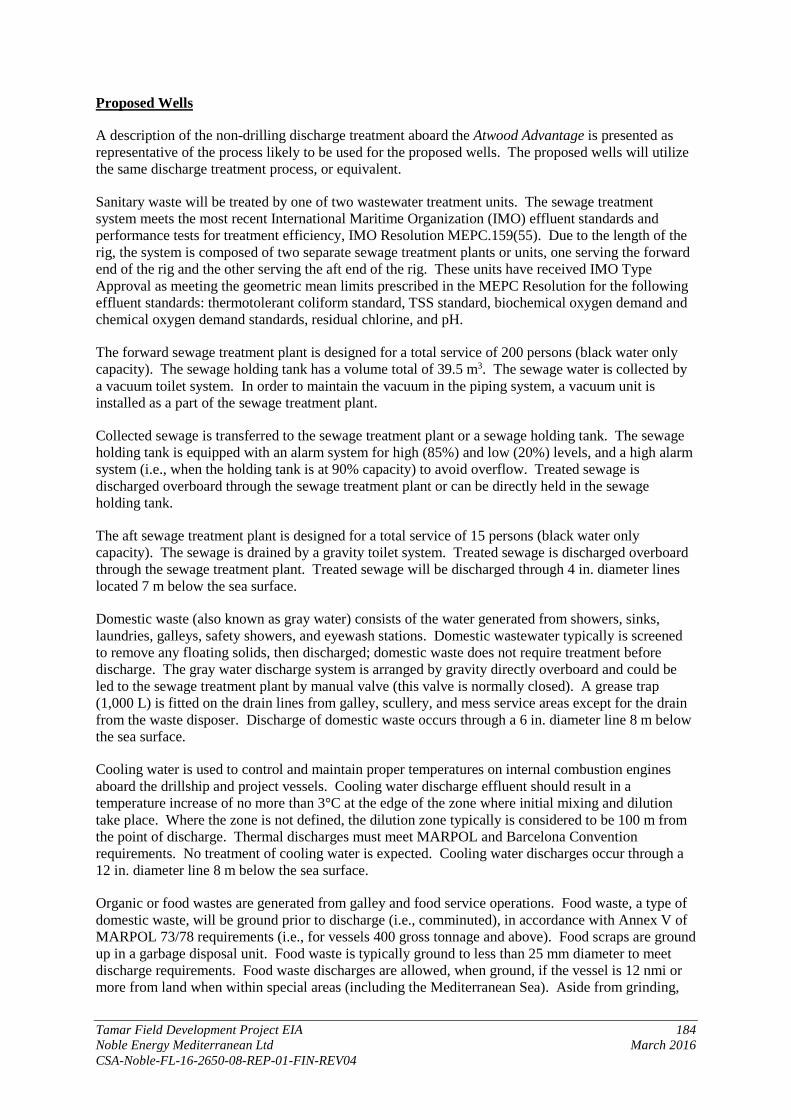
Tamar Field Development Project EIA 184 Noble Energy Mediterranean Ltd March 2016 CSA-Noble-FL-16-2650-08-REP-01-FIN-REV04
Proposed Wells
A description of the non-drilling discharge treatment aboard the Atwood Advantage is presented as representative of the process likely to be used for the proposed wells. The proposed wells will utilize the same discharge treatment process, or equivalent.
Sanitary waste will be treated by one of two wastewater treatment units. The sewage treatment system meets the most recent International Maritime Organization (IMO) effluent standards and performance tests for treatment efficiency, IMO Resolution MEPC.159(55). Due to the length of the rig, the system is composed of two separate sewage treatment plants or units, one serving the forward end of the rig and the other serving the aft end of the rig. These units have received IMO Type Approval as meeting the geometric mean limits prescribed in the MEPC Resolution for the following effluent standards: thermotolerant coliform standard, TSS standard, biochemical oxygen demand and chemical oxygen demand standards, residual chlorine, and pH.
The forward sewage treatment plant is designed for a total service of 200 persons (black water only capacity). The sewage holding tank has a volume total of 39.5 m3. The sewage water is collected by a vacuum toilet system. In order to maintain the vacuum in the piping system, a vacuum unit is installed as a part of the sewage treatment plant.
Collected sewage is transferred to the sewage treatment plant or a sewage holding tank. The sewage holding tank is equipped with an alarm system for high (85%) and low (20%) levels, and a high alarm system (i.e., when the holding tank is at 90% capacity) to avoid overflow. Treated sewage is discharged overboard through the sewage treatment plant or can be directly held in the sewage holding tank.
The aft sewage treatment plant is designed for a total service of 15 persons (black water only capacity). The sewage is drained by a gravity toilet system. Treated sewage is discharged overboard through the sewage treatment plant. Treated sewage will be discharged through 4 in. diameter lines located 7 m below the sea surface.
Domestic waste (also known as gray water) consists of the water generated from showers, sinks, laundries, galleys, safety showers, and eyewash stations. Domestic wastewater typically is screened to remove any floating solids, then discharged; domestic waste does not require treatment before discharge. The gray water discharge system is arranged by gravity directly overboard and could be led to the sewage treatment plant by manual valve (this valve is normally closed). A grease trap (1,000 L) is fitted on the drain lines from galley, scullery, and mess service areas except for the drain from the waste disposer. Discharge of domestic waste occurs through a 6 in. diameter line 8 m below the sea surface.
Cooling water is used to control and maintain proper temperatures on internal combustion engines aboard the drillship and project vessels. Cooling water discharge effluent should result in a temperature increase of no more than 3°C at the edge of the zone where initial mixing and dilution take place. Where the zone is not defined, the dilution zone typically is considered to be 100 m from the point of discharge. Thermal discharges must meet MARPOL and Barcelona Convention requirements. No treatment of cooling water is expected. Cooling water discharges occur through a 12 in. diameter line 8 m below the sea surface.
Organic or food wastes are generated from galley and food service operations. Food waste, a type of domestic waste, will be ground prior to discharge (i.e., comminuted), in accordance with Annex V of MARPOL 73/78 requirements (i.e., for vessels 400 gross tonnage and above). Food scraps are ground up in a garbage disposal unit. Food waste is typically ground to less than 25 mm diameter to meet discharge requirements. Food waste discharges are allowed, when ground, if the vessel is 12 nmi or more from land when within special areas (including the Mediterranean Sea). Aside from grinding,

Tamar Field Development Project EIA 185 Noble Energy Mediterranean Ltd March 2016 CSA-Noble-FL-16-2650-08-REP-01-FIN-REV04
no other treatment of organic wastes is expected. Following grinding, food wastes are discharged through a 6 in. diameter line 8 m below the sea surface.
Freshwater is generated aboard the drillship via two RO water makers, generating brine (i.e., concentrated seawater) as a byproduct. At maximum rated capacity, each unit can generate 6.5 m3 h-1, or 156 m3 d-1, of freshwater. Total freshwater generation capacity is 312 m3 d-1. Maximum feed water flow rate through the freshwater generating system is approximately 380 m3 d-1; maximum brine discharge flow rate is estimated at 318 m3 d-1. The excess seawater being discharged does not contain any added chemicals. The discharge is through a 4 in. diameter line 8 m below the sea surface.
The processing of drilling mud, designed to prolong the life of the drilling fluid, typically includes flow through various pieces of equipment to remove cuttings and large particles (i.e., scalper shakers, shale shakers). Once the drilling mud has passed through the shakers, it is pumped into a settling/processing pit (i.e., sand traps). Once in the sand traps, the drilling mud can be circulated and processed by other equipment (e.g., degasser, mud cleaner, desander, desilter, and centrifuge) to further remove unwanted particles. Chemicals may be added to change the rheological properties of the mud or to address a specific downhole need. Details of a representative drilling mud treatment and processing system from the ENSCO 5006 platform, including schematics of the mud processing system, are provided in Appendix G.
3.6.1.3 Non-Drilling Discharge Timing and Flow Characteristics
The timing (i.e., frequency) and flow characteristics of discharges for the ENSCO 5006 during drilling activities on the Tamar SW-1 well are summarized in Table 3-17 and are representative of Tamar wells for the completed wells. Discharge volumes are presented in Table 3-15.
For the Tamar SW-1 well, sanitary and domestic waste streams (i.e., sewage and gray water) were discharged periodically at rates of 10 to 14 m3 d-1 and 20 to 24 m3 d-1, respectively. Organic waste (i.e., food scraps) were discharged periodically at 100 to 150 kg d-1. Potable water maker discharge (brine) was discharged continuously at a rate of 160 to 320 m3 d-1. There were no discharges from the oil-water separator while the ENSCO 5006 was moored at the Tamar SW-1 drillsite.
Cooling water discharge occurred continuously at a rate of 5,000 to 10,000 m3 d-1. The discharge of muds and cuttings from the drilling unit only occurred while drilling in the lower sections of the well; when discharging, cuttings were released nearly continuously, while drilling muds were released at the end of the well. It is estimated that the continuous cuttings discharges (i.e., during drilling of the lower hole sections) occurred continuously at a rate of 21 m3 d-1; note that there are periods where work in the lower hole sections did not involve drilling, therefore, and cuttings discharges did not occur during these periods. Drilling muds were discharged from the rig only at the end of the well; the bulk discharge of mud was done at a rate of 1,749 m3 d-1.
Table 3-17. Discharge timing and flow characteristics of non-drilling discharges for the ENSCO 5006 during drilling of the Tamar SW-1 exploratory well.
Source Estimated Volume
(m3 d-1) Pipe Diameter
(in.) Discharge Depth*
(m) Frequency and Treatment
Sanitary waste (black water)
15-35 8 -14 Periodic; chlorinated
Domestic waste (gray water)
20-24 8 -14 Periodic; no treatment
Water maker brine 160-320 8 -14 Continuous; no treatment Cooling water 5,000-10,000 14, 16, and 18 -14 Continuous; no treatment Organic waste 100-150 kg d-1 8 -14 Periodic; macerated
* Negative entries indicate water depth below the sea surface.

Tamar Field Development Project EIA 186 Noble Energy Mediterranean Ltd March 2016 CSA-Noble-FL-16-2650-08-REP-01-FIN-REV04
The wells proposed to be drilled for the Tamar Field Development Project are expected to be drilled with a drilling unit similar to the DP drillship Atwood Advantage or a DP semi-submersible similar to the GSF Development Driller II. Table 3-18 shows the expected discharge timing and flow characteristics for the Atwood Advantage which is representative. Discharge volumes are presented in Table 3-15.
Table 3-18. Summary of non-drilling discharge timing and flow characteristics for the Atwood Advantage.
Source Estimated Volume (m3 d-1)
Pipe Diameter (in.)
Discharge Depth* (m)
Frequency and Treatment
Sanitary waste (black water) 10-14 (est.) 4 -7 Periodic; chlorinated
Domestic waste (gray water) 20-24 (est.) 6 -8 Continuous; no treatment
Water maker brine 318 4 -8 Continuous; no treatment
Cooling water 105,360 12 -8 Continuous; no treatment
Organic waste 100-150 kg d-1 6 -8 Periodic; macerated Negative entries indicate water depth below the sea surface.
3.6.1.4 Non-Drilling Discharge Method and Orientation
The ENSCO 5006 was used to drill the Tamar SW-1 well, and its discharge method and orientation is representative of the other wells that have been drilled. Processed and unprocessed discharges on the ENSCO 5006 occurred through a series of 8 in., 14 in., 16 in., and 18 in. pipes located 14 m below the ocean surface. Discharges were either gravity fed or pumped, with pipe orientation in a vertical, downward direction.
Discharges from the ENSCO 5006 included drilling muds and cuttings, sanitary and domestic wastes, cooling water, water maker brine, and organic waste, as detailed previously in Table 3-15. There were two primary waste streams (i.e., waste streams are comingled) – one through an 8 in. pipe located 14 m below the sea surface, the other through 14 in., 16 in., and 18 in. pipes also located at 14 m below the sea surface.
Characteristics of discharges through the 8 in. pipe:
• Sanitary and domestic wastes: periodic; 10 to 14 m3 d-1 and 20 to 24 m3 d-1, respectively. • Organic waste (i.e., food scraps): periodic; 100 to 150 kg d-1. • Potable water maker (brine): continuous; 160 to 320 m3 d-1.
Characteristics of discharges through the 14, 16, and 18 in. pipes:
• Cooling water: continuously; 5,000 to 10,000 m3 d-1.
3.6.1.5 Non-Drilling Discharge Quantity
Total quantities of non-drilling discharges from the ENSCO 5006 during the drilling of the Tamar SW-1 well are summarized in Table 3-19. These values are representative of the wells which have been drilled.
Discharge volumes will be less than the above values for the proposed wells because the new wells are expected to take approximately 3.5 days less to drill per well since MOBM will be used. This will result in estimated decreases in the discharge volumes as shown in Table 3-20.

Tamar Field Development Project EIA 187 Noble Energy Mediterranean Ltd March 2016 CSA-Noble-FL-16-2650-08-REP-01-FIN-REV04
Table 3-19. Discharge volumes of non-drilling discharges from the Tamar SW-1 well.
Discharge Type Total Volume (m3) Runoff 11,444
Waste water (oil-water separator) 0 Sanitary treated water 779
Gray water 2,050 Brine concentrate 10,013
Cooling system water 603,180 Shredded organic kitchen waste 10,241 kg
Table 3-20. Rig process discharge reductions per well assuming 3.5-day reduction in estimated drilling time based on the use of the Atwood Advantage.
Source Estimated Volume
(m3 d-1) Quantity (m3)
3.5 days per well Sanitary waste (black water) 14 49 Domestic waste (gray water) 35 122
Water maker brine 318 1,113 Cooling water 105,360 368,760 Organic waste 200 kg d-1 700
3.6.1.6 Alternatives to On-Site Discharge of Non-Drilling Discharges
Alternatives to the on-site discharge of non-drilling related effluents either are not practical or are limited. There are no practical, viable alternatives to cooling water discharges. Alternative disposal methods for brine, organic (food) wastes, and sanitary and domestic wastes include containerization and shipment to shore. The location of the drilling activity in deep water, well offshore in an open ocean environment indicates that only limited, localized impacts from these discharges are expected. Containerization and shipment will produce their own set of impacts (e.g., air quality, onshore processing, treatment, and disposal impacts), in addition to increasing safety and hygienic concerns with loading and offloading additional waste containers. For these reasons, on-site discharge was selected for the past and proposed projects.
3.6.1.7 Hydrotest Discharge
Hydrotest water, also known as hydrostatic test water, is used following installation and prior to commencement of operations to test the integrity of a pipeline, flowline, or chemical transport line.
For the 2013 Tamar Field Development Project, hydrotesting of pipelines, chemical lines, and utility lines was conducted prior to start-up. Noble Energy utilized fresh seawater for hydrotesting (i.e., with no treatment chemicals); hydrotest water was discharged back to the ocean upon completion of testing.
For the proposed Tamar Field Development Project, hydrotesting of the proposed flowlines will be required. A CaCl2 brine with a density of 1,270 kg m-3 will be used, and the brine will be discharged subsea. Slugs of MEG will be used for de-watering the pipelines. The procedure will be as follows:
• After a successful pressure test, the pressure will be reduced to ambient. The pig train will be launched in the 16 in. line. The pig train design will most likely consist of three to five foam pigs with slugs of MEG between the pigs. The total MEG required in 16 in. line is expected to be around 11 m3. Dye will be used to differentiate the MEG from the brine at the discharge point.
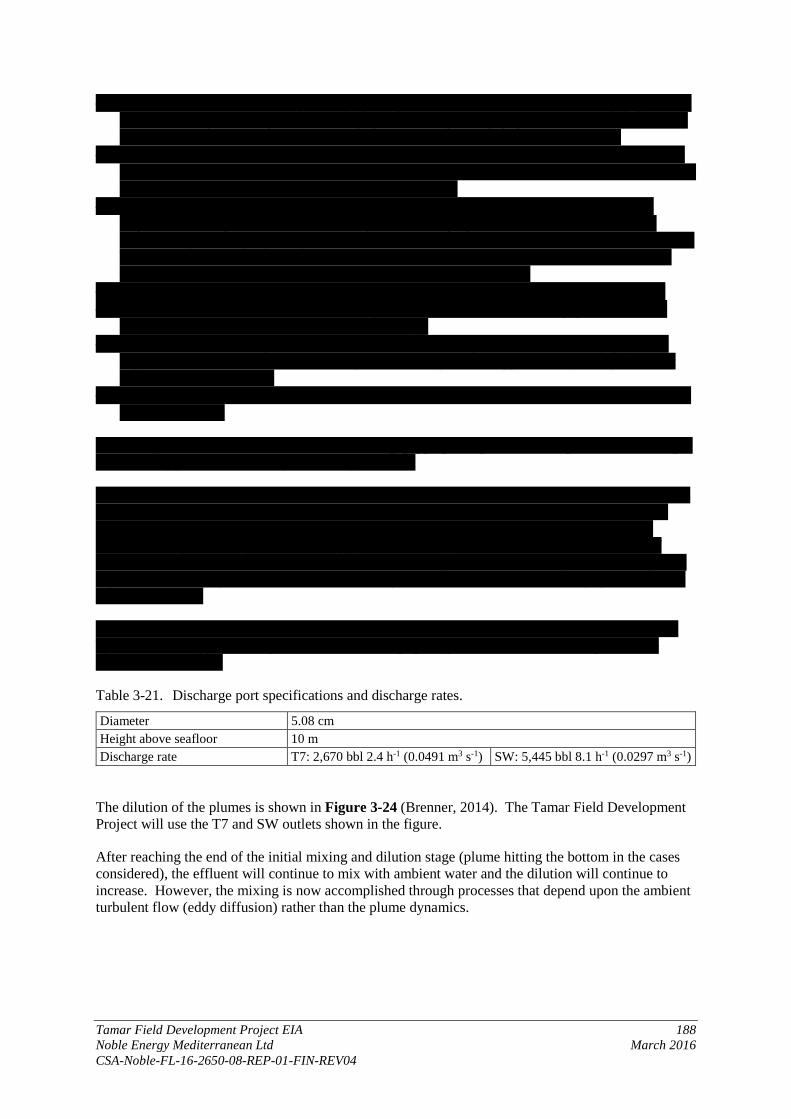
Tamar Field Development Project EIA 188 Noble Energy Mediterranean Ltd March 2016 CSA-Noble-FL-16-2650-08-REP-01-FIN-REV04
• Gas will be introduced to the system by opening the manifold branch valve and the pig speed will be controlled by throttling at the discharge point. The optimal pig speed is assumed to be around 0.6 m s-1, which equates to approximately 917 gal min -1 at the far end of the pipeline.
• When the first pig arrives in the pig launcher/receiver, the discharge color will change due to the dyed MEG. The ROV will temporarily stop de-brining activities and will connect coiled tubing to carry discharges to the vessel where they will be retained.
• De-brining will then resume taking discharges up to the vessel until the last pig is received. Liquids will be separated on deck from any break-through gas. Contaminated MEG will be collected topside for proper disposal. Contaminated MEG may contain some condensate from the break-through gas. Discharge of gas condensates or gas to the sea is not allowed; condensates will be returned to the process. Gas may be vented to the atmosphere.
• After the 16 in. line de-brine operation is completed, the process will occur on the 12 in. line. • The MEG volume for the 12¾ in. line is expected to be around 21 m3. Gel pigs could also be
used to be more effective with the diameter changes. • The 12¾ in. line discharge will be throttled to control the pig speed. The optimal pig speed is
expected to be around 0.6 m s-1. This equals a discharge rate of approximately 567 gal min-1 at the far end of the pipeline.
• Once MEG is detected subsea, the discharges will be routed topsides in the same way it was done for the 16 in. line.
Chemically treated seawater or brine used in filling, pigging, and pressure testing are to be discharged to sea during pre-commissioning and testing activities.
Release of small quantities of MEG is considered unavoidable and is permitted for operations such as making and breaking subsea hose connections, flushing out hoses or tubing, preserving dead legs, making or breaking pig launcher/receiver connections. It is recognized that some MEG will be released during de-brining when the first pig arrives in the pig launcher/receiver. The amount of MEG released to the sea shall be minimized and diverted up to the vessel through coiled tubing to be captured for later disposal on shore. Total discharge of MEG to sea from de-brining operations shall not exceed 71 bbl.
Approximately 7,000 bbl of brine will be discharged near the seafloor from two locations separated by a distance of approximately 10 km. The discharge port specifications and discharge rates are shown in Table 3-21.
Table 3-21. Discharge port specifications and discharge rates.
Diameter 5.08 cm Height above seafloor 10 m Discharge rate T7: 2,670 bbl 2.4 h-1 (0.0491 m3 s-1) SW: 5,445 bbl 8.1 h-1 (0.0297 m3 s-1)
The dilution of the plumes is shown in Figure 3-24 (Brenner, 2014). The Tamar Field Development Project will use the T7 and SW outlets shown in the figure.
After reaching the end of the initial mixing and dilution stage (plume hitting the bottom in the cases considered), the effluent will continue to mix with ambient water and the dilution will continue to increase. However, the mixing is now accomplished through processes that depend upon the ambient turbulent flow (eddy diffusion) rather than the plume dynamics.
Tamar Field Development Project EIA 189 Noble Energy Mediterranean Ltd March 2016 CSA-Noble-FL-16-2650-08-REP-01-FIN-REV04
Figure 3-24. Plume diameter versus dilution for all 135 simulations (red squares for the no pigging
cases; green diamonds and blue triangles for the pigging T7 and SW outlets, respectively).
3.6.1.8 Discharges During Commissioning of Tamar-8 Jumper
There will be discharge of sea water and <100 bbl of MEG during commissioning of the Tamar-8 jumper.
3.6.2 Drilling Mud, Drill Cuttings, and Concrete Discharge
Drilling discharges include both used drilling muds and drill cuttings, as well as cement.
For the wells that have been drilled in the Tamar Reservoir Area, Noble Energy used a WBM and several additives to facilitate drilling and maintain well control. During the initial well sections (36 in. and 26 in.), there were no surface returns; muds and cuttings exited at the borehole, settling near the drillsite and dispersing in the lower portions of the water column. Similarly, with the completion of each hole section, cementing was performed. Excess cement exited at the borehole between the casing and the formation.
Once the riser was set, surface returns commenced (i.e., with drilling of the 17½ in. section), which allowed for processing of used muds on board the drilling unit and, as necessary, the discharge of used muds and cuttings from the drilling unit. With surface returns, WBM was processed on board the drilling unit, passing through screens and shakers to remove cuttings. WBM quality was monitored and additives used, as needed. The type and volume of mud additives was determined primarily by the current state of the drilling mud and existing or anticipated downhole conditions.
Cuttings, once removed from the muds and cuttings stream, were discharged overboard. Drill cuttings are composed of formation solids (i.e., bits of rock from the formation). Clay-sized cuttings are more difficult than larger cuttings to separate from drilling mud. A typical cuttings discharge during
Tamar Field Development Project EIA 190 Noble Energy Mediterranean Ltd March 2016 CSA-Noble-FL-16-2650-08-REP-01-FIN-REV04
drilling with WBM usually contains 5% to 25% drilling fluid solids after passage through the solids control equipment on the drilling unit (Neff, 2005).
All wells drilled to date have used WBM, which was discharged at the wellsite. For the proposed wells (Tamar-7, Tamar-8, and Tamar-9), Noble Energy plans to use a MOBM for all sections following spudding of the well. The MOBM will not be discharged unless Noble Energy receives MoEP approval to discharge the MOBM-associated cuttings. The following sections review the WBM-drilled wells from previous projects as well as the changes that would occur in the drilling discharges from the use of MOBM.
3.6.2.1 Materials Used During Drilling
Drilling materials are described in Section 3.2.2.
3.6.2.2 Drilling Discharge Treatment
The wells previously drilled have utilized WBM, which was discharged at the wellsite. Tamar-7 through Tamar-9 will be drilled using MOBM, which will not be discharged. Cuttings from drilling Tamar-7 through Tamar-9 may be discharged if approval is received. Cuttings treatment was discussed in Section 3.2.2.
3.6.2.3 Discharge Timing and Flow Characteristics for Drilling Discharges
The discharge timing and flow characteristics for drilling discharges for the Tamar SW-1 well are listed in Table 3-22. The other completed wells have used a similar WBM formula, and the data may be considered representative for drilling activities to date.
Table 3-22. Discharge timing and flow characteristics for drilling discharges for the ENSCO 5006 during drilling of the Tamar SW-1 well.
Source Total
Volume (m3)
Duration (days)
Capacity (m3 d-1)
Pipe Diameter
(in.)
Discharge Depth
(m)
Frequency and Treatment
Drilling muds and cuttings – 36 in. and 26 in. sections; no surface returns (muds and cuttings released at the wellbore)
Muds: 2,861.8
Cuttings: 550
3
Muds: 953.9
Cuttings: 183.3
36 (wellbore) -1,700 Continuous during
drilling; no treatment
Drilling muds and cuttings – 17½ in., 14¾ in., 12¼ in., and 10⅝ in. sections; surface returns (muds and cuttings discharged at the surface)
Muds: 1,176.5
Cuttings: 321
19
Muds: 1,176.5
Cuttings: 16.9
14, 16, or 18 -14
Continuous for cuttings while drilling; minor amounts of WBM with cuttings; cuttings separated from muds WBM bulk discharge at end of well
Cement (at the wellbore) 206.7 1 to 2 (total) ~60
36, maximum (wellbore)
-1,700 No treatment
Notes: Drilling of 36 in. and 26 in. sections estimated to require 3 days total; muds and cuttings to be released from the wellbore continuously during this period. Drilling of 17½ in., 14¾ in., 12¼ in., and 10⅝ in. sections estimated to require 19 days total (drilling only); cuttings are discharged continuously while drilling; muds recirculated and discharged as an end of well discharge (at completion of drilling). End of well discharges of WBM will occur at <1,000 bbl h-1; 1 bbl = 0.159 m3; <159 m3 h-1; total muds: 1,176.5 m3 discharged in approximately 7.4 h, minimum. Cementing occurs periodically throughout drilling, at the completion of the drilling of each section, when setting pipe; total estimate of cement to be used: 6,900 bbl (1,097 m3); cement discharge estimated to be 1,300 bbl (206.7 m3). Negative entries in the Discharge Depth column indicate water depth below the sea surface.
Tamar Field Development Project EIA 191 Noble Energy Mediterranean Ltd March 2016 CSA-Noble-FL-16-2650-08-REP-01-FIN-REV04
For the wells proposed to be drilled during the Tamar Field Development Project, MOBM will be used, and there will be no discharge of drilling muds other than from the initial section drilled with WBM and discharged at the seafloor. The MOBM will be retained and brought to shore at the end of the project for reuse or recycling. Noble Energy has applied to MoEP for approval to discharge the cuttings from the proposed wells. If approved, the cuttings will be treated to remove the majority of the MOBM and then discharged. If approval is not received, the cuttings will be transported to shore for disposal.
3.6.2.4 Drilling Discharge Method and Orientation
The discharge of WBM drill cuttings and drilling muds from the ENSCO 5006 occurred through 14 in., 16 in., and 18 in. pipes located 14 m below the ocean surface. Discharges were either gravity fed or pumped, with the pipe oriented in a vertical, downward direction. As indicated previously, Noble Energy will not discharge the MOBM that is being proposed for use for the proposed wells and will discharge MOBM-associated cuttings only if approved by MoEP.
3.6.2.5 Bottom Discharge During Well Spudding
The weights of the individual products used during the initial stages of drilling the Tamar SW-1 well (i.e., with no surface returns) and subsequently discharged at the wellbore are summarized in Table 3-23. The total amount of drilling-related material discharged prior to riser installation is estimated to include 18,000 bbl (2,861.8 m3) of drilling mud and 25,600 bbl of brine. This information is representative for the completed wells in the Tamar Reservoir Area as well as the process that will be used for spudding the proposed wells. WBM will be used during this process for the wells to be drilled in the proposed Tamar Field Development Project.
Table 3-23. Estimated weights of drilling mud additives used for well spudding (From: Tamar SW-1 well; Noble Energy, 2012).
Product Function Total Weight (lb) Total Weight (tons) NaCl Salinity control 2,816,000 1,277.7
Soda ash Calcium reducer 12,595 5.7 Caustic soda Alkalinity/pH control 3,795 1.7
Bentonite Viscosifier 328,396 149.0 Guar gum Stabilizing agent 9,900 4.5
BARAZAN D Fluid loss control 11,770 5.3 PAC RE Fluid loss control 1,025 0.5 PAC LE Fluid loss control 3,818 1.7 Barite Weighting agent 2,207,400 1,001.5
BARA-DEFOAM W300 Defoamer 596 0.3 DEXTRID E Filtration control 7,636 3.5 STARCIDE Biocide 764 0.3
3.6.2.6 Surface Discharge of Drilling Muds
The concentrations and amounts of WBM discharges, including various mud additives, discharged at the end of drilling the Tamar SW-1 well are detailed in Table 3-24 and are similar to the surface discharges from the previous wells. These discharges occurred below the water line at a rate of less than 1,000 bbl per hour. The total amount of drilling mud discharged from the rig at the completion of drilling was estimated to be 7,400 bbl (1,176.5 m3).
Tamar Field Development Project EIA 192 Noble Energy Mediterranean Ltd March 2016 CSA-Noble-FL-16-2650-08-REP-01-FIN-REV04
Table 3-24. Water-based mud discharges from the drilling unit (From: Tamar SW-1 well; Noble Energy, 2012).
Product Composition and Function Concentration (lb/bbl)
Total Weight (lb) (tons)
NaCl NaCl (sodium salt); Inhibition/Weight 75.0 555,000 251.8 KCl KCl (potassium salt); Inhibition/Weight 35.0 259,000 117.5 Soda ash Na2CO3; Calcium Treatment 0.5 3,700 1.7 Sodium bicarbonate NaHCO3; Calcium Treatment 0.3 2,220 1.0 Caustic soda NaOH; pH Control 0.3 2,220 1.0 Citric acid C6H8O7; Alkalinity Control 0.3 1,850 0.8 Barite Barium Sulfate BaSO4; Weighting Agent 140.0 1,036,000 470.1 BARAZAN D Xanthan gum; Viscosifier 2.0 14,800 6.7 PAC LE Polysaccharide; Filtration Control 3.0 22,200 10.1 PAC RE Polysaccharide; Filtration Control 0.4 2,960 1.3 PAC ULV Polysaccharide; Filtration Control 3.0 22,200 10.1 BARA-DEFOAM W300 Petroleum distillate, Soybean oil; Defoamer 0.2 1,480 0.7
STARCIDE N, N' -Methylene bis (5-methyl oxazolidine); Biocide 0.2 1,480 0.7
GEM GP @ 4.5% v/v Polyalkylene glycol; Inhibition 10.5 77,700 35.3 CLAYSEAL PLUS Ethoxylated polyamine; Inhibition 7.0 51,800 23.5 BARACARB 5 Calcium Carbonate; Bridging Agent 7.5 55,500 25.2 BARACARB 25 Calcium Carbonate; Bridging Agent 66.2 489,880 222.3 BDF-467 Anionic Polymer; Flocculent 1.0 7,400 3.4
Well completions will result in drilling discharges as presented in Table 3-25.
Table 3-25. Total estimated discharges per well from completion activities. Product Function Total Weight (tons)
NaBr (Dry Salt) Weight 1162.013 NaCl (Dry Salt) Weight 479.481
Fresh Water Weight 542.729 Caustic Soda Sodium Hydroxide 1.339
Xanvis L Calcium Treatment 1.871 UltraVis Viscosifier 9.184
Well Wash 150 Surfactant 9.569 Dope Free Surfactant 0.799
MULFREE RS Surfactant 5.269 BIO-PAQ Fluid Loss 25.726
XAN-PLEX D Viscosifier 3.241 MAGNESIUM OXIDE pH Buffer 4.288
MAX-GUARD Inhibition 50.999 X-CIDE 207 Microbiocide 0.016
NOVO-CARB 60 Weight 116.119 NOVO-CARB 20 Weight 45.762
MUDZYME X Enzyme Breaker 4.028 MUDZYME S Enzyme Breaker 0.809 Sodium Acetate pH Buffer 2.280 Glacial Acetic pH Control 3.460
CL-27 Corrosion Inhibitor Corrosion Inhibitor 0.378 KD-40 Corrosion Inhibitor 0.710
NOXYGEN Oxygen Scavenger 0.061 Soda Ash pH Buffer 1.370

Tamar Field Development Project EIA 193 Noble Energy Mediterranean Ltd March 2016 CSA-Noble-FL-16-2650-08-REP-01-FIN-REV04
Noble Energy will use MOBM for the proposed Tamar Field Development Project wells; only the mud from the initial well sections drilled using WBM will be discharged.
3.6.2.7 Cuttings Discharges
Estimated cuttings discharge volumes, by hole section, for the Tamar SW-1 well are outlined in Table 3-26 and are representative of those for previously drilled wells. A total of 5,454 bbl of cuttings weighing 2,180 tons were released during drilling; including volumes added due to the wash out factors which varied by hole section. Cuttings from the 36 in. and 26 in. sections were released from the borehole, while cuttings from the remaining sections were released from the drilling unit on a continuous basis while drilling. Cuttings and drilling fluids released from the drilling unit were discharged 14 m below sea level.
Table 3-26. Cuttings volumes and weights, by section (From: Tamar SW-1 well; Noble Energy, 2012).
Hole Size Interval (MD)
Cuttings Volume with Wash Out Factor
(bbl)
Washout Factor
(%)
Cuttings Volume
(m3)
Cuttings Weight (tons)
36 in. (drive pipe)
1,672-1,742 m (70 m) 290 0 47 124.6
26 in. 1,742-2,915 m
(1,173 m) (with 15-m rathole)
3,160 25 503 1,257.5
17½ in. 2,915-3,537 m
(622 m) (with 15-m rathole)
730 20 117 257.4
14¾ in. 3,537-4,565 m (1,028 m) 820 15 131 347.2
10⅝ in. 4,565-5,306 m (741 m) 293 10 47 124.6
12¼ in. 4,565-4,871 m (306 m) 161 10 26 68.9
Total 5,454 -- 871 2,180 bbl = barrel; MD = measured depth.
The completion of the Tamar SW-1 well will result in a smaller amount of cuttings being discharged from the drilling unit, as shown in Table 3-27.
Table 3-27. Cuttings volumes to be discharged during the Tamar SW-1 completion.
ID (in.) Interval Top (m MD)
Interval Bottom (m MD)
Length (m)
Volume (bbl)
Cuttings Volume (m3)
10¾ in. shallow cement plug 9.56 1950 2075 125 36.41 5.79 9⅞ in. shoe track 8.625 4680 4884.5 204.5 48.48 7.71 12¼ in. open hole + 10% 12.25 4884.5 4914.5 30 15.78 2.51
bbl = barrel; ID = inner diameter; MD = measured depth.
The estimated quantities of MOBM cuttings to be generated during drilling of the wells proposed for the Tamar Field Development Project wells using MOBM are provided in Table 3-28. The cuttings volumes are based on the volume of the hole intervals that would be drilled, plus an additional “wash out factor.” MOBM amounts are based on a worst case assumption of 1% retention of base fluid on cuttings. The actual retention on cuttings after treatment is expected to be less.
Tamar Field Development Project EIA 194 Noble Energy Mediterranean Ltd March 2016 CSA-Noble-FL-16-2650-08-REP-01-FIN-REV04
Table 3-28. Estimated cuttings volumes using the mineral oil-based mud (MOBM) system.
Discharge Example Well Values*
Volume (bbl) Mass (MT) Total amount of cuttings 2,841 1,059 MOBM base fluid adhering to cuttings (assuming an OOC of 1%) 28.4 3.6
bbl = barrel; MT = metric ton; OOC = oil on cuttings. *Totals do not include the riserless section (initial well intervals where water-based muds [WBM] and cuttings will be released at the seafloor).
Total cuttings volumes are estimated to be 2,841 bbl (1,059 MT), including 28.4 bbl (3.6 MT) of MOBM base fluid adhering to cuttings. These totals do not include the initial riserless well intervals where WBM and associated cuttings will be released at the seafloor. These cuttings will be discharged only if Noble Energy receives approval from MoEP.
3.6.2.8 Alternatives to On-Site Drilling Discharges
Available alternatives to the on-site discharge of drilling muds (and cuttings) include injection or discharge into wellbores or subsurface formations, and transport of waste to shore for treatment and disposal. These practices are characterized by their own set of environmental effects, costs, and inherent limitations (e.g., practical and technical considerations). For example, the use of onshore disposal methods requires that the material be transported onshore, with increased risks to the environment and personnel safety and hygiene through handling, shipping, and transport. These issues are discussed further in Section 3.7; potential impacts are discussed in Section4.9.
3.6.2.9 Cementing
Cementing is the process of placing a cement slurry in a well by mixing powdered cement, additives, and water at the surface and pumping it by hydraulic displacement to the desired location. Actual discharge amounts of chemicals used during the cementing activities for the Tamar SW-1 well are presented in Table 3-29 and are similar to those used for the other completed and proposed Tamar Field wells. Upon completion of each hole section, cementing is performed. Excess cement exits at the borehole between the casing and the formation.
Table 3-29. Actual discharge amounts (kg) of chemicals used during the cementing for the Tamar SW-1 well.
Product 36 in. 26 in. 17½ in. 12¼ in. × 14¾ in. 10⅝ in. 8½ in. ×
12¼ in. Total Weight
(tons) Barite -- -- 9,920.18 16,575.51 11,791.38 17,785 56.07
Calcium Chloride -- 3,066.67 -- -- -- -- 3.07 Cement Class G -- 608,000.00 94,300.00 76,550.00 75,410 -- 854.26
D-Air 3000L -- 63.49 13.61 9.07 1.36 -- 0.088 Econolite L -- 26,179.11 2,422.67 -- -- 28.60 ElastiCem -- -- -- -- -- --
FluorodyeUC -- 14.00 -- -- -- 0.01 Halad-322 -- -- 544.22 -- 748.3 -- 1.29 Halad-344 -- -- -- -- -- -- -- Halad-413 -- -- -- -- -- 876.9 0.88
HR-4 -- 3,563.27 -- -- -- -- 3.97 HR-4L -- 8,961.45 -- -- -- -- 8.96 HR-5 -- -- -- -- 317.46 876.5 1.19 KCL -- 3,900.93 4,015.67 2195.01 -- -- 10.11
Latex 3000 -- -- -- -- -- 1746.4 1.75 Microblock -- -- 9,598.78 -- 5,603.27 2101.6 17.30

Table 3-29. (Continued).
Tamar Field Development Project EIA 195 Noble Energy Mediterranean Ltd March 2016 CSA-Noble-FL-16-2650-08-REP-01-FIN-REV04
Product 36 in. 26 in. 17½ in. 12¼ in. × 14¾ in. 10⅝ in. 8½ in. ×
12¼ in. Total Weight
(tons) Musol -- -- 173.70 208.44 291.81 140.6 0.81 NF-6 -- 736.19 17.53 17.53 10.52 48.1 0.83
Silicalite Liquid -- -- -- -- -- -- -- Tuned Spacer -- -- 952.38 1,020.41 907.03 1,170 4.05 WellLife-734 -- -- -- -- -- -- --
Total Metric Tons 0.00 654.49 122.00 96.94 95.08 24.75 993.25
3.6.3 Infrastructure Installation Discharges
Discharge volumes of sanitary and domestic wastes are expected to be 20 gal/person/day (0.075 m3) and 30 gal/person/day (0.113 m3), respectively, from the installation vessel during pipelaying operations. The estimated number of persons on board the DP pipelay vessel is 270. Assuming a maximum number of persons on board, daily discharges of treated black and gray water from the DP pipelay vessel would be 5,400 gal (20 m3) and 8,100 gal (31 m3), respectively; similar to that experienced during the 2013 Tamar Field Development Project.
Vessels operating during installation of pipelines, MEG lines, utility lines, and control lines will be equipped with approved marine sanitation devices. Sanitary and domestic wastes will be collected and treated prior to discharge (e.g., chlorination for sewage, removal of floating solids for domestic wastes) according to the requirements of MARPOL.
3.6.4 Quality of Discharges
3.6.4.1 Non-Drilling Discharge Quality
The results of the analyses of sanitary waste samples for the Tamar SW-1 well are presented in Table 3-30.
Tamar Field Development Project EIA 196 Noble Energy Mediterranean Ltd March 2016 CSA-Noble-FL-16-2650-08-REP-01-FIN-REV04
Table 3-30. Results of analyses of Tamar SW-1 sanitary waste.
Sampling Date
Sample Reception
Date Time Report No. Flow
[m3 mo] Flow [m3/y]
pH Field Test
BOD TOC TSS 105°C
Turbidity Field Test
[NTU]
Chlorine Field Test Oil &
Grease (FTIR)
Mineral Oil
(FTIR) DOX
NO3-N +
NO2-N NH4-N TKN-N Total
N Total
P Enterococcus Fecal
coliforms TDS Cl- Free Total µ/100 mL
10/10/2013 10/10/2013 9:30 Starboard - C11857, FWC-09663.13
250 250
7.7 33 28 59 46 0.66 2.5 1.2 0.2 71.1 15 40 111 3 2.40E+05 1.70E+05 43,405 22,078
10/12/2013 Port 7 37.4 0.3 1.9 10/16/2013 Port 7 49.84 0.79 1.1 10/17/2013 Starboard 7 32.4 2.9 6.4 10/23/2013 Port 7 32.4 0.85 1.9
10/24/2013 10/24/2013 8:00-14:00
Starboard - C12580, FWC-10210.13 7.6 44 49 90 56.3 1 1.45 5.3 0.3 1.2 32 46 47.2 4 79 540 39,570 704
10/24/2013 10/24/2013 8:00-14:00
Port - C12581, FWC-10198.13 6.9 28 36 48 45.7 3.5 6 5.6 0.3 1.8 13 24.4 26.1 3 1.1 5.1 39,520 4,305
10/27/2013 Starboard 8 29.96 2.44 3.5 11/4/2013 11/4/2013 Starboard
265 515
7.5 56 2.8 1.92 11/5/2013 11/5/2013 Port 8 60 1.13 3.62 11/9/2013 11/9/2013 Starboard 7.5 59 2.33 2.53
11/10/2013 11/10/2013 Port 6.5 61 0.29 2.7 11/17/2013 11/17/2013 Port 8.4 41 0.8 0.15 11/18/2013 11/18/2013 Starboard 7.3 20 1.6 2.89
11/20/2013 11/20/2013 10:30 Starboard - C14099, FWC-11408.13 7.2 32 55 15 45.4 1.3 2.3 1.4 0.2 3.4 1.8 20 114 115.8 3 49 9.20E+05 41,173 22,025
11/20/2013 11/20/2013 10:10 Port - C14100, FWC-11406.13 7.1 23 31 161 22.5 5.1 6 2 0.2 5.6 2.1 8.8 63 65 3 23 1.1 40,395 22,338
11/24/2013 11/24/2013 Starboard 7.3 50 2.6 1.8 11/25/2013 11/25/2013 Port 7.9 49 1.4 2.65
12/4/2013 12/4/2013 10:20 Starboard - C14731, FWC-11975.13
264 779
7.7 66 54 108 70.2 1.1 1.6 6 3 2.8 24 125 127.8 5 540 1.60E+03 40,415 21,905
12/4/2013 12/4/2013 10:00 Port - C14732, FWC-11875.13 7.2 15 47 18 46 5.2 6 2.4 0.1 2.1 13.5 23 25 3 1.1 1.1 38,910 21,345
12/7/2013 Starboard 7.2 50 0.3 0.95 12/8/2013 Port 7.8 48 0.29 3.11
12/16/2013 Starboard 8 36 1.02 12/16/2013 Port 8 46 0.82 12/23/2013 Starboard 8 35.5 1.3 12/23/2013 Port 8 21.8 1.3 BOD = biochemical oxygen demand; Cl- = chloride; DOX = dissolved organic halides; FTIR = Fourier Transform Infrared; N = nitrogen; NH4 = ammonium; NO2 = nitrite; NO3 = nitrate; NTU = nephelometric turbidity units; P = phosphorus; TDS = total dissolved solids; TKN = total Kjeldahl nitrogen; TOC = total organic carbon; TSS = total suspended solids. Note: units are mg L-1 unless noted otherwise.
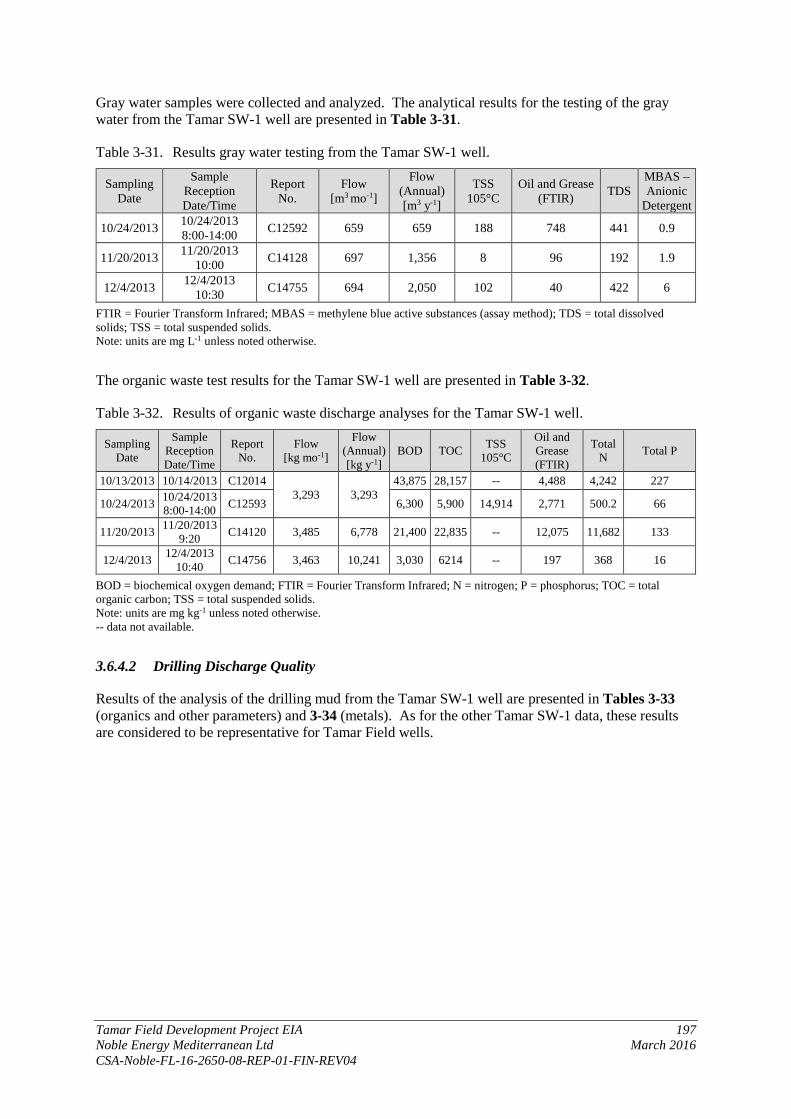
Tamar Field Development Project EIA 197 Noble Energy Mediterranean Ltd March 2016 CSA-Noble-FL-16-2650-08-REP-01-FIN-REV04
Gray water samples were collected and analyzed. The analytical results for the testing of the gray water from the Tamar SW-1 well are presented in Table 3-31.
Table 3-31. Results gray water testing from the Tamar SW-1 well.
Sampling Date
Sample Reception Date/Time
Report No.
Flow [m3 mo-1]
Flow (Annual) [m3 y-1]
TSS 105°C
Oil and Grease (FTIR) TDS
MBAS – Anionic
Detergent
10/24/2013 10/24/2013 8:00-14:00 C12592 659 659 188 748 441 0.9
11/20/2013 11/20/2013 10:00 C14128 697 1,356 8 96 192 1.9
12/4/2013 12/4/2013 10:30 C14755 694 2,050 102 40 422 6
FTIR = Fourier Transform Infrared; MBAS = methylene blue active substances (assay method); TDS = total dissolved solids; TSS = total suspended solids. Note: units are mg L-1 unless noted otherwise.
The organic waste test results for the Tamar SW-1 well are presented in Table 3-32.
Table 3-32. Results of organic waste discharge analyses for the Tamar SW-1 well.
Sampling Date
Sample Reception Date/Time
Report No.
Flow [kg mo-1]
Flow (Annual) [kg y-1]
BOD TOC TSS 105°C
Oil and Grease (FTIR)
Total N Total P
10/13/2013 10/14/2013 C12014 3,293 3,293
43,875 28,157 -- 4,488 4,242 227
10/24/2013 10/24/2013 8:00-14:00 C12593 6,300 5,900 14,914 2,771 500.2 66
11/20/2013 11/20/2013 9:20 C14120 3,485 6,778 21,400 22,835 -- 12,075 11,682 133
12/4/2013 12/4/2013 10:40 C14756 3,463 10,241 3,030 6214 -- 197 368 16
BOD = biochemical oxygen demand; FTIR = Fourier Transform Infrared; N = nitrogen; P = phosphorus; TOC = total organic carbon; TSS = total suspended solids. Note: units are mg kg-1 unless noted otherwise. -- data not available.
3.6.4.2 Drilling Discharge Quality
Results of the analysis of the drilling mud from the Tamar SW-1 well are presented in Tables 3-33 (organics and other parameters) and 3-34 (metals). As for the other Tamar SW-1 data, these results are considered to be representative for Tamar Field wells.
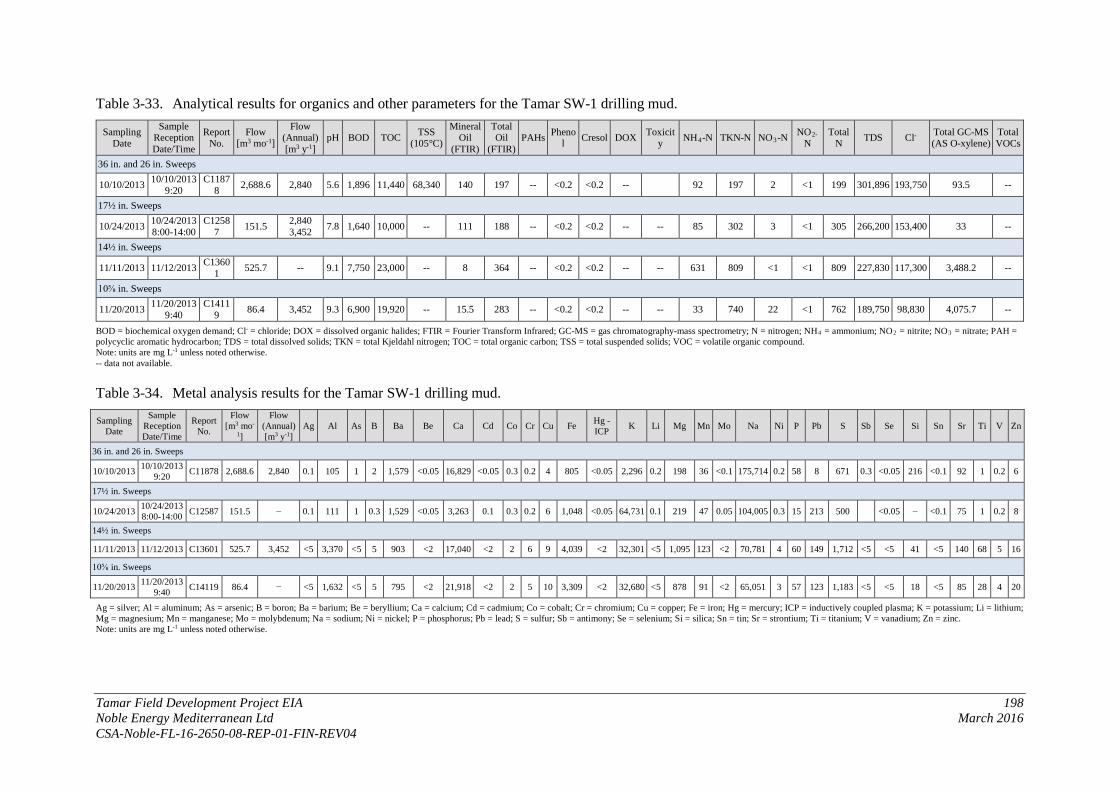
Tamar Field Development Project EIA 198 Noble Energy Mediterranean Ltd March 2016 CSA-Noble-FL-16-2650-08-REP-01-FIN-REV04
Table 3-33. Analytical results for organics and other parameters for the Tamar SW-1 drilling mud.
Sampling Date
Sample Reception Date/Time
Report No.
Flow [m3 mo-1]
Flow (Annual) [m3 y-1]
pH BOD TOC TSS (105°C)
Mineral Oil
(FTIR)
Total Oil
(FTIR) PAHs Pheno
l Cresol DOX Toxicity NH4-N TKN-N NO3-N NO2-
N Total
N TDS Cl- Total GC-MS (AS O-xylene)
Total VOCs
36 in. and 26 in. Sweeps
10/10/2013 10/10/2013 9:20
C11878 2,688.6 2,840 5.6 1,896 11,440 68,340 140 197 -- <0.2 <0.2 -- 92 197 2 <1 199 301,896 193,750 93.5 --
17½ in. Sweeps
10/24/2013 10/24/2013 8:00-14:00
C12587 151.5 2,840
3,452 7.8 1,640 10,000 -- 111 188 -- <0.2 <0.2 -- -- 85 302 3 <1 305 266,200 153,400 33 --
14½ in. Sweeps
11/11/2013 11/12/2013 C13601 525.7 -- 9.1 7,750 23,000 -- 8 364 -- <0.2 <0.2 -- -- 631 809 <1 <1 809 227,830 117,300 3,488.2 --
10⅝ in. Sweeps
11/20/2013 11/20/2013 9:40
C14119 86.4 3,452 9.3 6,900 19,920 -- 15.5 283 -- <0.2 <0.2 -- -- 33 740 22 <1 762 189,750 98,830 4,075.7 --
BOD = biochemical oxygen demand; Cl- = chloride; DOX = dissolved organic halides; FTIR = Fourier Transform Infrared; GC-MS = gas chromatography-mass spectrometry; N = nitrogen; NH4 = ammonium; NO2 = nitrite; NO3 = nitrate; PAH = polycyclic aromatic hydrocarbon; TDS = total dissolved solids; TKN = total Kjeldahl nitrogen; TOC = total organic carbon; TSS = total suspended solids; VOC = volatile organic compound. Note: units are mg L-1 unless noted otherwise. -- data not available.
Table 3-34. Metal analysis results for the Tamar SW-1 drilling mud.
Sampling Date
Sample Reception Date/Time
Report No.
Flow [m3 mo-
1]
Flow (Annual) [m3 y-1]
Ag Al As B Ba Be Ca Cd Co Cr Cu Fe Hg - ICP K Li Mg Mn Mo Na Ni P Pb S Sb Se Si Sn Sr Ti V Zn
36 in. and 26 in. Sweeps
10/10/2013 10/10/2013 9:20 C11878 2,688.6 2,840 0.1 105 1 2 1,579 <0.05 16,829 <0.05 0.3 0.2 4 805 <0.05 2,296 0.2 198 36 <0.1 175,714 0.2 58 8 671 0.3 <0.05 216 <0.1 92 1 0.2 6
17½ in. Sweeps
10/24/2013 10/24/2013 8:00-14:00 C12587 151.5 − 0.1 111 1 0.3 1,529 <0.05 3,263 0.1 0.3 0.2 6 1,048 <0.05 64,731 0.1 219 47 0.05 104,005 0.3 15 213 500 <0.05 − <0.1 75 1 0.2 8
14½ in. Sweeps
11/11/2013 11/12/2013 C13601 525.7 3,452 <5 3,370 <5 5 903 <2 17,040 <2 2 6 9 4,039 <2 32,301 <5 1,095 123 <2 70,781 4 60 149 1,712 <5 <5 41 <5 140 68 5 16
10⅝ in. Sweeps
11/20/2013 11/20/2013 9:40 C14119 86.4 − <5 1,632 <5 5 795 <2 21,918 <2 2 5 10 3,309 <2 32,680 <5 878 91 <2 65,051 3 57 123 1,183 <5 <5 18 <5 85 28 4 20
Ag = silver; Al = aluminum; As = arsenic; B = boron; Ba = barium; Be = beryllium; Ca = calcium; Cd = cadmium; Co = cobalt; Cr = chromium; Cu = copper; Fe = iron; Hg = mercury; ICP = inductively coupled plasma; K = potassium; Li = lithium; Mg = magnesium; Mn = manganese; Mo = molybdenum; Na = sodium; Ni = nickel; P = phosphorus; Pb = lead; S = sulfur; Sb = antimony; Se = selenium; Si = silica; Sn = tin; Sr = strontium; Ti = titanium; V = vanadium; Zn = zinc. Note: units are mg L-1 unless noted otherwise.

Tamar Field Development Project EIA 199 Noble Energy Mediterranean Ltd March 2016 CSA-Noble-FL-16-2650-08-REP-01-FIN-REV04
The barite analysis for the Tamar SW-1 well is presented in Table 3-35.
Table 3-35. Analytical results for barite samples used for Tamar SW-1.
Date of Shipment
Analysis Report Date/Time
Report No.
Hg - Cold Vapor Ag As Cd Cr Cu Ni Pb Zn
10/10/2013 10/10/2013 9:20
C-64124.13 2 <5 20 <2 8 121 7 165 109
11/3/2013 11/4/2013 17:00 C13127 1.5 1
12/4/2013 12/4/2013 C14760 0.7 <2
Ag = silver; As = arsenic; Cd = cadmium; Cr = chromium; Cu = copper; Hg = mercury; Ni = nickel; Pb = lead; Zn = zinc. Note: units are mg kg-1 unless noted otherwise.
An analysis of samples of the cuttings was performed also; the results are presented in Table 3-36.
Table 3-36. Cuttings analyses for the Tamar SW-1 well.
Sampling Date
Sample Reception Date/Time
Report No. TOC Ag As Cd Cr Cu Hg Ni Pb Zn
10/29/2013 11/3/2013 20:30 C13130 32,700 <5 <5 <2 9 13 <5 5 98 14
10/30/2013 11/3/2013 22:00 C13130 45,900 <5 <5 <2 2 4 <5 <2 96 7
10/31/2013 11/3/2013 10:40 C13130 34,800 <5 <5 <2 2 4 <5 <2 94 6
11/6/2013 11/12/2013 22:00 C13602 14,000 <5 <5 <2 2 4 <2 <2 83 7
11/8/2013 11/12/2013 22:10 C13602 34,200 <5 <5 <2 46 63 <2 35 207 80
11/11/2013 11/12/2013 5:55 C13602 23,600 <5 <5 <2 34 41 <2 23 127 55
11/12/2013 11/20/2013 16:20 C14135 27,400 <5 5 3 43 56 <2 38 161 89
11/23/2013 12/4/2013 11:00 C14759 31,800 <5 5 <2 40 58 <2 26 249 83
11/24/2013 12/4/2013 21:34 C14759 32,700 <5 <5 <2 56 65 <2 50 116 100
11/27/2013 12/4/2013 0:40 C14759 33,000 <5 <5 <2 48 50 <2 26 118 72
12/7/2013 12/23/2013 15:52 C15700 36,000 <5 8 <2 17 44 <2 9 206 79
12/9/2013 12/23/2013 11:40 C15700 53,000 <5 <5 <2 38 71 <2 41 98 67
12/11/2013 12/23/2013 8:50 C15700 33,800 <5 <5 <2 36 58 <2 25 84 66
Ag = silver; As = arsenic; Cd = cadmium; Cr = chromium; Cu = copper; Hg = mercury; Ni = nickel; Pb = lead; TOC = total organic carbon; Zn = zinc. Note: units are mg L-1 unless noted otherwise.
Samples of drilling muds and cuttings were tested for radioactive substances. The results of the analysis of samples from the Tamar SW-1 well are presented in Table 3-37.

Tamar Field Development Project EIA 200 Noble Energy Mediterranean Ltd March 2016 CSA-Noble-FL-16-2650-08-REP-01-FIN-REV04
Table 3-37. Results of analyses for radioactive substances in drilling muds and cuttings from the Tamar SW-1 well.
Sampling Date Time Sample ID Ra 226 Ra 228 Ra 226/228 Th 228 Pb 210
10/29/2013 20:30 70831.13-C 0.02 0.18 0.111 0.06 0.23
10/30/2013 22:00 70832.13-C 0.02 -0.17 -0.118 0.036 -0.04
10/31/2013 10:40 70833.13-C 0 -0.26 0.000 0.006 0.09
11/6/2013 22:00 73311.13-C 0.05 -0.01 -5.000 0.028 0.12
11/8/2013 22:10 73312.13-C 0.02 0.25 0.080 0.44 0.49
11/11/2013 5:50 73313.12-C 0.02 0.14 0.143 0.38 0.46
11/12/2013 16:20 75340.13-C 0.14 0.7 0.200 0.44 0.74
11/23/2013 11:00 79078.13-C 0.09 0.43 0.209 0.53 0.43
11/24/2013 21:34 79079.13-C 0.13 0.61 0.213 0.37 0.37
11/27/2013 0:40 79080.13-C 0.15 0.39 0.385 0.36 0.52
12/7/2013 12:52 Tamar SW-1 ST01 7/12/13; 12:52PM CUTTINGS 0.052 0.44 0.118 0.179 0.61
12/9/2013 11:40 Tamar SW-1 ST01 9/12/13; 11:40AM CUTTINGS 0.21 0.44 0.477 0.404 1.04
12/11/2013 8:50 Tamar SW-1 ST01 11/12/13; 08:50AM CUTTINGS 0.21 0.79 0.266 0.57 0.85
Pb = lead; Ra = radium; Th = thorium.
Data on the cuttings discharges from the proposed solids control system obtained from a well in the United Kingdom North Sea is provided in Table 3-38.
Table 3-38. Hammermill treatment data from actual sections in United Kingdom North Sea, December 2012 to January 2013 (Data from: Noble Energy, 2014).
Date Hole Section
MT Processed
M3 Processed
Feed Stock Discharge
Oil Water Solids Oil on Cuttings
Oil in Water
% M3 % M3 % M3 % mg L-1 Dec 24, 25 17.5 36.7 20.39 33 6.7 22 4.3 47 9.6 0.031 8.0 Dec 25, 26 17.5 100 55.56 34 18.9 22 12.2 45 25.0 0.044 12.0 Dec 26, 27 17.5 68 42.50 36 15.3 22 9.4 43 18.3 0.042 39.0 Dec 27, 28 17.5 95 59.38 39 23.2 21 12.5 41 24.3 0.056 6.5 Dec 29, 30 17.5 10.2 6.38 40 2.6 18 1.2 42 2.7 0.029 43.0
Jan 3, 4 12.25 99 55.00 25 13.8 32 17.6 44 24.2 0.093 53.2 Jan 4, 5 12.25 104 54.74 28 15.3 27 14.8 46 25.2 0.024 19.7 Jan 5, 6 12.25 103 54.21 23 12.5 20 10.8 58 31.4 0.034 21.5 Jan 6, 7 12.25 113 56.50 29 16.4 18 10.2 54 30.5 0.104 21.7
Jan 22, 23 8.5 130 65.00 31 20.2 13 5.5 56 36.4 0.058 8.6 Mean 0.051 26.3
Table 3-39 lists the Chemical Hazard and Risk Management (CHARM) data for the MOBM system to be used for the proposed wells (http://www.cefas.defra.gov.uk/industry-information/offshore-chemical-notification-scheme.aspx).
Tamar Field Development Project EIA 201 Noble Energy Mediterranean Ltd March 2016 CSA-Noble-FL-16-2650-08-REP-01-FIN-REV04
Table 3-39. Summary of the Offshore Chemical Notification Scheme (OCNS) Chemical Hazard and Risk Management (CHARM) data for the proposed drilling mud system.
Product
OSPAR-Derived Data Toxicity Data
Comments OCNS (UK)
Registered
OCNS Rating
Substitution Warning Toxicity (worse case)
Toxicity Sediment Reworker
LE Supermul
No -- -- -- --
Likely to pass pre-screening and the final rating would depend upon the Corophium toxicity. Expected to be an OCNS C or D rating.
ESCAID 110
Yes (non-CHARM)
C No 1,000 mg L-1 (96-h LL0) (Onchorhyncus mykiss)
--
Readily biodegradable, does not bioaccumulate (69% in 28 days)
Lime PLONOR E No N/A N/A -- Calcium Chloride
PLONOR E No N/A N/A --
Barite PLONOR E No N/A N/A --
Rhemod L Yes (non-CHARM) B Yes
237.1 mg L-1 EC50 72-h (Skeletonema costatum)
8,872 mg kg-1 (LC50 Corophium volutator)
--
Adapta Yes (non-CHARM)
E Yes >1,000 (mg L-1 limit test) (Scophtalmus maximus)
105,000 mg L-1 (LC50 Corophium volutator)
--
EZ Mul NT Yes (non-CHARM)
D No 23 mg L-1 EC50 72-h (Skeletonema costatum)
10,000 mg kg-1 (LC50 Corophium volutator)
SPP in generic at 15.0 lb bbl-1; 64,600 ppm SPP
TAU MOD Yes (non-CHARM) E No
5,600 (mg L-1 limit test) (Scophtalmus maximus)
13,662 mg kg-1 (LC50 Corophium volutator)
SPP in INNOVERT at 5.0 lb bbl-1; 68,100 ppm SPP
bbl = barrel; EC50 = median effective concentration; LC50 = lethal concentration 50; LL0 = loading concentration at which no mortality or effects exist; PLONOR = pose little or no risk to the environment; ppm = parts per million; SPP = suspended particulate phase.
3.7 WASTE
Wastes generated by drilling unit operations and processes will be identified and classified. Each identified waste will be classified and handled as scheduled waste or non-scheduled waste.
The waste classification determination will be conducted by using one or more of the following methods:
• Process knowledge – Applying knowledge of the hazardous characteristic(s) of the waste in light of the materials or the processes used; and
• Regulatory listing review – Determining if the waste is listed by waste management regulations or authorities as being considered a hazardous, scheduled, or other type of waste.
Different waste streams will be segregated by type and will not be mixed together or managed in the same container. Under no circumstances will non-hazardous wastes be allowed to be mixed in the same container with hazardous or scheduled wastes.

Tamar Field Development Project EIA 202 Noble Energy Mediterranean Ltd March 2016 CSA-Noble-FL-16-2650-08-REP-01-FIN-REV04
SDSs for the chemicals expected to be used on the project are attached in Appendix F.
Waste storage areas are designated on the drilling unit in areas isolated from other operations. Waste containers will be stored in these areas prior to processing or shipment to the contract waste management vendor. All waste materials will be stored properly in containers that are non-leaking and compatible with the waste being stored. All containers will have their lids, rings, covers, bungs, and other means of closure properly installed at all times except when waste is being added or removed, and will be stored in secondary containment.
Volumes of non-drilling liquid wastes were presented in Section 3.6.1, and drilling wastes volumes were presented in Section 3.6.2.
Well-specific estimates of solid wastes to be generated during the drilling program are unavailable. However, based on operator data provided in filed plans, the U.S. Minerals Management Service estimated that each exploration well drilled in U.S. waters generates an average of 2,000 ft3 (56.6 m3) of trash and debris (Dismukes et al., 2007). Cantin et al. (1990) employed a different approach to estimate the amount of trash and debris, basing their evaluation on the number of personnel aboard a drilling unit and daily generation rates. They estimated that approximately 2 kg/person/day of trash and debris are generated during offshore oil and gas exploratory drilling operations. For a 90-day drilling program and 150 personnel, total trash and debris generated would be approximately 27,000 kg (27 MT).
Wastes are handled and disposed of according to MARPOL and permit requirements. Wastes that cannot be discharged overboard are shipped to authorized onshore waste disposal sites in accordance with regulations.
If MOBM cuttings discharge after treatment is approved, the waste disposal requirements for the planned drilling program are expected to be negligible relative to the available services and landfill capacity, and could provide a short-term beneficial impact for waste transporters and management facilities.
If the discharge of cuttings from the wells proposed for the Tamar Field Development Project is not approved, Noble Energy plans to use a completely enclosed system to avoid exposure of personnel to contaminated wastes. The amount of mud retained on cuttings under this option would be 12% to 14% because the cuttings need enough fluid to maintain a slurry composition for transport. Total cuttings for each well is estimated to be approximately 2,600 MT. The cuttings would be transported to Haifa by supply vessel and then by truck to the Ramat Hovav landfill. It is estimated that approximately 27 vessel trips (between wells and Haifa) and 80 truck trips (Haifa to the Ramat Hovav landfill) would be required for onshore cuttings disposal (CSA Ocean Sciences Inc., 2013c). Section 4.9 discusses the potential environmental impacts of waste diposal alternatives.
3.8 ABANDONMENT/CLOSURE
For temporary abandonment, it is anticipated that after the well has reached total depth and wireline evaluation logs have been run, the wellbore will be temporarily abandoned and secured with multiple barriers. A 9⅞ in. × 10¾ in. casing string will be run to total depth and cemented in place. The cement will be displaced with sufficient mud weight to provide a hydrostatic pressure equal to or greater than the pore pressure plus 300 psi with a seawater column above the mudline. A retrievable mechanical plug will be set at the bottom of the casing string and pressure tested. A retrievable mechanical plug will be set approximately 300 m below the mudline and pressure tested. The wellbore will then be negative pressure tested with a seawater column to the mudline prior to disconnecting the BOP stack and riser. Figure 3-26 illustrates the proposed plug and abandonment (P&A) schematic. Sections 4.16 and 5.2.12 also discuss aspects of closure and abandonment.

Tamar Field Development Project EIA 203 Noble Energy Mediterranean Ltd March 2016 CSA-Noble-FL-16-2650-08-REP-01-FIN-REV04
For permanent abandonment, Noble Energy Mediterranean Ltd, as the Operator of Lease No. I/12 Tamar, will prepare a document to submit to the Petroleum Commissioner in accordance with the requirements set forth by Section 19 of the Permit to Operate (2013), Section 27 of Lease No. I/12 Tamar (2009), 30 CFR 250 Subpart Q regulations from the Gulf of Mexico, and the Abandonment Guidelines set forth by the State of Israel in the NFT_377 (2014), which reference the regulations of 30 CFR 250 Subpart Q. The plan will present an overview of the relevant regulations and proposed methods for decommissioning and abandonment of the Tamar facilities.
Figure 3-26. Proposed plug and abandonment (P&A) schematic.

Tamar Field Development Project EIA 204 Noble Energy Mediterranean Ltd March 2016 CSA-Noble-FL-16-2650-08-REP-01-FIN-REV04
CHAPTER 4: EVALUATION OF ENVIRONMENTAL IMPACTS
4.1 INTRODUCTION
4.1.1 Impact Assessment Methodology
Two factors are used to determine the significance of an impact: impact consequence and impact likelihood. Impact consequence refers to an impact’s characteristics on a specific resource (e.g., air quality, water quality, benthic communities, etc.). Such determinations take into account resource-specific sensitivity to an impact, recovery capability, and spatial and temporal occurrence. Impact consequence also includes whether an impact is:
• direct or indirect; • reversible or irreversible; and • short term (generally reflecting the duration of a project, which typically is in the range of several
weeks to several months) or long term (longer than project duration, which is typically on the order of years to decades).
Impact consequence classifications include beneficial, negligible, low, medium, and high as described in Table 4-1.
Table 4-1. Definitions of impact consequence.
Consequence Physical/Chemical Environment Biological Environment Socioeconomic and Cultural
Environment
High
One or more of the following impacts: • Widespread,
persistent contamination of air, water, or sediment
• Frequent, severe violations of air or water quality standards or guidelines
One or more of the following impacts: • Extensive, irreversible damage to sensitive
habitats such as sensitive deepwater communities, hard/live bottom communities, seagrass beds, marshes, and/or coral reefs, and other sites identified as MPAs, marine protected habitats, or areas of special concern
• Death or injury of large numbers of a species listed by the IUCN as Endangered, Critically Endangered, or Vulnerable, or irreversible damage to their critical habitat
One or more of the following impacts: • Extensive, irreversible damage
to recreational resources such as beaches, boating areas, and/or tourism
• Impacts posing a significant threat to public health or public safety
• Impacts of a magnitude sufficient to alter the nation’s social, economic, or cultural characteristics, or result in social unrest
Medium
One or more of the following impacts: • Occasional and/or
localized violation of air or water quality standards or guidelines
• Persistent sediment toxicity or anoxia in a small area
One or more of the following impacts: • Localized, reversible damage to sensitive habitats
such as sensitive deepwater communities, hard/live bottom communities, seagrass beds, marshes, and/or coral reefs, and other sites identified as MPAs, marine protected habitats, or areas of special concern
• Extensive damage to non-sensitive habitats to the degree that ecosystem function and ecological relationships could be altered
• Death, injury, disruption of critical activities (e.g., breeding, nesting, nursing), or damage to critical habitat of individuals of a species listed by the IUCN as Endangered, Critically Endangered, or Vulnerable
One or more of the following impacts: • Disruption of fishing activities
at any location for more than 30 days or exclusion from more than 10% of the fishable area at a given time
• Impacts leading to greater than a 10% change in fishery harvest
• Localized, reversible impacts on recreational resources such as beaches, boating areas, and/or tourist area
Low • Changes that can be monitored and/or noticed but are within the scope of existing variability, and do not meet any of the High or Medium definitions (above)
Negligible • Changes unlikely to be noticed or measurable against background activities Beneficial • Likely to cause some enhancement to the environment or the social/economic system
IUCN = International Union for Conservation of Nature; MPA = Marine Protected Area.
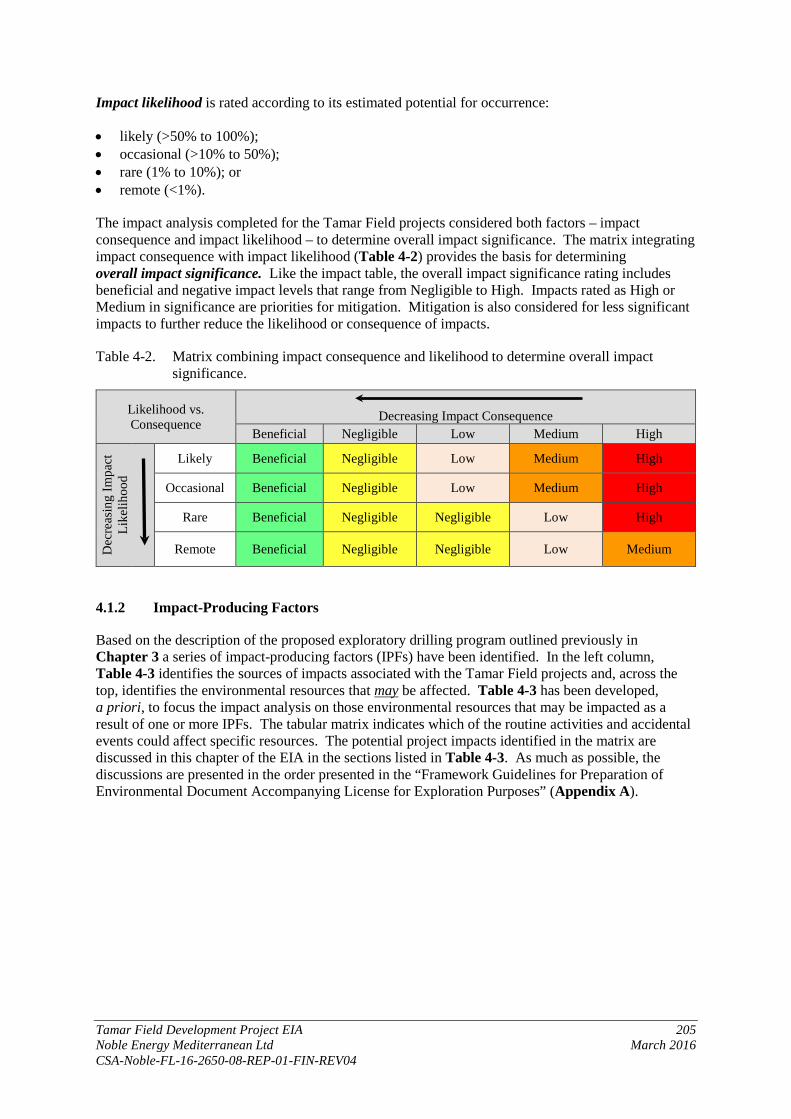
Tamar Field Development Project EIA 205 Noble Energy Mediterranean Ltd March 2016 CSA-Noble-FL-16-2650-08-REP-01-FIN-REV04
Impact likelihood is rated according to its estimated potential for occurrence:
• likely (>50% to 100%); • occasional (>10% to 50%); • rare (1% to 10%); or • remote (<1%).
The impact analysis completed for the Tamar Field projects considered both factors – impact consequence and impact likelihood – to determine overall impact significance. The matrix integrating impact consequence with impact likelihood (Table 4-2) provides the basis for determining overall impact significance. Like the impact table, the overall impact significance rating includes beneficial and negative impact levels that range from Negligible to High. Impacts rated as High or Medium in significance are priorities for mitigation. Mitigation is also considered for less significant impacts to further reduce the likelihood or consequence of impacts.
Table 4-2. Matrix combining impact consequence and likelihood to determine overall impact significance.
Likelihood vs. Consequence Decreasing Impact Consequence
Beneficial Negligible Low Medium High
Dec
reas
ing
Impa
ct
Like
lihoo
d
Likely Beneficial Negligible Low Medium High
Occasional Beneficial Negligible Low Medium High
Rare Beneficial Negligible Negligible Low High
Remote Beneficial Negligible Negligible Low Medium
4.1.2 Impact-Producing Factors
Based on the description of the proposed exploratory drilling program outlined previously in Chapter 3 a series of impact-producing factors (IPFs) have been identified. In the left column, Table 4-3 identifies the sources of impacts associated with the Tamar Field projects and, across the top, identifies the environmental resources that may be affected. Table 4-3 has been developed, a priori, to focus the impact analysis on those environmental resources that may be impacted as a result of one or more IPFs. The tabular matrix indicates which of the routine activities and accidental events could affect specific resources. The potential project impacts identified in the matrix are discussed in this chapter of the EIA in the sections listed in Table 4-3. As much as possible, the discussions are presented in the order presented in the “Framework Guidelines for Preparation of Environmental Document Accompanying License for Exploration Purposes” (Appendix A).

Tamar Field Development Project EIA 206 Noble Energy Mediterranean Ltd March 2016 CSA-Noble-FL-16-2650-08-REP-01-FIN-REV04
Table 4-3. Matrix of potential impacts (a priori). A “●” indicates a potential impact to a resource, and numbers refer to the EIA section in which the potential impact is discussed.
Project Activity/ Impact-Producing
Factor
Environmental Resource Physical/Chemical Biological Socioeconomic and Cultural
Air
Qua
lity
Sedi
men
ts/S
edim
ent Q
ualit
y
Wat
er Q
ualit
y
Plan
kton
, Fish
, and
Fish
ery
Res
ourc
es
Ben
thic
Com
mun
ities
Mar
ine
Mam
mal
s and
Sea
Tu
rtles
Mar
ine
and
Coas
tal B
irds
Prot
ecte
d M
arin
e Sp
ecie
s an
d H
abita
ts, M
arin
e H
abita
ts o
f Int
eres
t, an
d A
reas
of S
peci
al C
once
rn
Fish
ing
and
Mar
ine
Farm
ing
Ship
ping
and
Mar
itim
e In
dust
ry
Rec
reat
ion
and
Aes
thet
ics/
Tour
ism
Arc
haeo
logi
cal R
esou
rces
NON-ROUTINE (ACCIDENTAL) EVENTS (4.3)
Drilling Worst Case Gas Discharge
● (4.3.1) ●
(4.3.1) ●
(4.3.1) ●
(4.3.1) ●
(4.3.1) ●
(4.3.1) ●
(4.3.1)
● (4.3.1; 4.13)
● (4.3.1)
● (4.3.1)
● (4.3.1)
Large Diesel Fuel Spill ● (4.3.2)
● (4.3.2)
● (4.3.2)
● (4.3.2)
● (4.3.2)
● (4.3.2)
● (4.3.2)
● (4.3.2)
● (4.3.2; 4.13)
● (4.3.2)
● (4.3.2)
● (4.3.2)
Solid Waste (Accidental Loss) ●
(4.3.4) ●
(4.3.4) ● (4.3.4)
● (4.3.4)
● (4.3.4)
● (4.3.4) ●
(4.3.4)
ROUTINE PROJECT-RELATED ACTIVITIES Drilling Activities Drillship Arrival, Departure, and Stationkeeping
● (4.6.2) ●
(4.6.5) ● ( 4.12)
● (4.7.1) ●
(4.7.3)
Drilling (including release/discharge of drill muds and cuttings, flaring, and other well operations
● (4.8)
● (4.6.1)
● (4.6.2)
● (4.6.3)
● (4.6.4) ●
( 4.13) ● (4.7.3)
Physical Presence ● (4.6.3) ●
(4.6.6) ● (4.7.1)
● (4.5.3; 4.7.2)
Lights ● (4.4.1)
● (4.6.6; 4.4.2)
Noise (including support vessels and aircrafts)
●
(4.5; 4.6.5)
Routine (non-drilling related) Discharges ●
(4.6.2) ●
(4.6.3)
Solid Waste ●
(4.6.4; 4.9)
Infrastructure Installation and Operation (platform, pipelines, umbilicals) Installation Vessel Arrival, Operation, and Departure
● (4.6.2) ●
(4.6.5) ● ( 4.13)
● (4.7.1)
Installation Activities ● (4.6.1)
● (4.6.2)
● (4.6.3)
● (4.6.4) ●
(4.6.6) ● ( 4.13) ●
(4.7.3)
Physical Presence ● (4.6.1) ●
(4.6.4) ● ( 4.13)
Combustion Emissions ● (4.8)
Noise ●
(4.5; 4.6.5)
Solid Waste ●
(4.6.4; 4.9)
Support Vessel and Helicopter Traffic
Support Vessel Traffic ● (4.8) ●
(4.6.5) ● (4.6.7)
● ( 4.13)
● (4.7.1)
Helicopter Traffic ● (4.8) ●
(4.6.5) ●
(4.6.6) ●
(4.6.7)
“(#)” refers to the section number of this Environmental Impact Assessment in which the potential impact is reviewed.
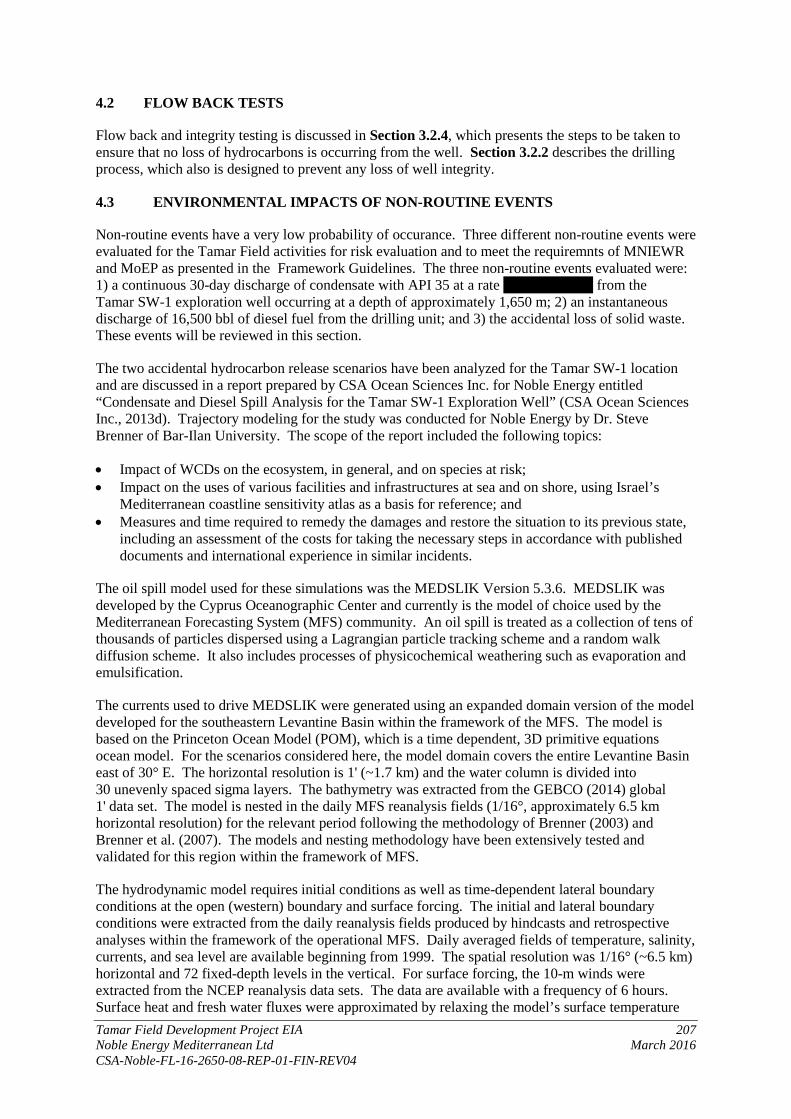
Tamar Field Development Project EIA 207 Noble Energy Mediterranean Ltd March 2016 CSA-Noble-FL-16-2650-08-REP-01-FIN-REV04
4.2 FLOW BACK TESTS
Flow back and integrity testing is discussed in Section 3.2.4, which presents the steps to be taken to ensure that no loss of hydrocarbons is occurring from the well. Section 3.2.2 describes the drilling process, which also is designed to prevent any loss of well integrity.
4.3 ENVIRONMENTAL IMPACTS OF NON-ROUTINE EVENTS
Non-routine events have a very low probability of occurance. Three different non-routine events were evaluated for the Tamar Field activities for risk evaluation and to meet the requiremnts of MNIEWR and MoEP as presented in the Framework Guidelines. The three non-routine events evaluated were: 1) a continuous 30-day discharge of condensate with API 35 at a rate of 3,369 bbl d-1 from the Tamar SW-1 exploration well occurring at a depth of approximately 1,650 m; 2) an instantaneous discharge of 16,500 bbl of diesel fuel from the drilling unit; and 3) the accidental loss of solid waste. These events will be reviewed in this section.
The two accidental hydrocarbon release scenarios have been analyzed for the Tamar SW-1 location and are discussed in a report prepared by CSA Ocean Sciences Inc. for Noble Energy entitled “Condensate and Diesel Spill Analysis for the Tamar SW-1 Exploration Well” (CSA Ocean Sciences Inc., 2013d). Trajectory modeling for the study was conducted for Noble Energy by Dr. Steve Brenner of Bar-Ilan University. The scope of the report included the following topics:
• Impact of WCDs on the ecosystem, in general, and on species at risk; • Impact on the uses of various facilities and infrastructures at sea and on shore, using Israel’s
Mediterranean coastline sensitivity atlas as a basis for reference; and • Measures and time required to remedy the damages and restore the situation to its previous state,
including an assessment of the costs for taking the necessary steps in accordance with published documents and international experience in similar incidents.
The oil spill model used for these simulations was the MEDSLIK Version 5.3.6. MEDSLIK was developed by the Cyprus Oceanographic Center and currently is the model of choice used by the Mediterranean Forecasting System (MFS) community. An oil spill is treated as a collection of tens of thousands of particles dispersed using a Lagrangian particle tracking scheme and a random walk diffusion scheme. It also includes processes of physicochemical weathering such as evaporation and emulsification.
The currents used to drive MEDSLIK were generated using an expanded domain version of the model developed for the southeastern Levantine Basin within the framework of the MFS. The model is based on the Princeton Ocean Model (POM), which is a time dependent, 3D primitive equations ocean model. For the scenarios considered here, the model domain covers the entire Levantine Basin east of 30° E. The horizontal resolution is 1' (~1.7 km) and the water column is divided into 30 unevenly spaced sigma layers. The bathymetry was extracted from the GEBCO (2014) global 1' data set. The model is nested in the daily MFS reanalysis fields (1/16°, approximately 6.5 km horizontal resolution) for the relevant period following the methodology of Brenner (2003) and Brenner et al. (2007). The models and nesting methodology have been extensively tested and validated for this region within the framework of MFS.
The hydrodynamic model requires initial conditions as well as time-dependent lateral boundary conditions at the open (western) boundary and surface forcing. The initial and lateral boundary conditions were extracted from the daily reanalysis fields produced by hindcasts and retrospective analyses within the framework of the operational MFS. Daily averaged fields of temperature, salinity, currents, and sea level are available beginning from 1999. The spatial resolution was 1/16° (~6.5 km) horizontal and 72 fixed-depth levels in the vertical. For surface forcing, the 10-m winds were extracted from the NCEP reanalysis data sets. The data are available with a frequency of 6 hours. Surface heat and fresh water fluxes were approximated by relaxing the model’s surface temperature

Tamar Field Development Project EIA 208 Noble Energy Mediterranean Ltd March 2016 CSA-Noble-FL-16-2650-08-REP-01-FIN-REV04
and salinity to the MFS reanalysis fields with a relaxation time scale of 2 days. All data were spatially and temporally interpolated to the model grid and time step as necessary. In order to eliminate the initial mismatch between the original reanalysis fields and the interpolated values, each simulation was started 3 days before the desired data to allow for model spin up.
As required my MoEP, four time periods representative of various climatic conditions over the eastern Mediterranean were considered. For each period, two types of simulations were conducted:
• a continuous 30-day discharge of oil at a rate of 3,369 bbl d-1 with API 35; and • an instantaneous discharge of 16,500 bbl of diesel fuel from the platform.
The four time periods considered were:
• 9 December 2010 to 8 January 2011: a period that included an extreme winter storm; • 26 January to 25 February 2008: typical winter conditions; • 17 July to 16 August 2008: typical summer conditions with persistent northwesterly winds and
swell; and • 25 September to 25 October 2007: autumn conditions typical of the transition seasons and
including at least one episode of strong easterly to northeasterly wind.
The model analyzed the potential for spill weathering to estimate how much condensate and diesel fuel would remain on the sea surface at various times following a spill. Portions of the study are presented in the following sections along with a discussion of the potential impacts of the two non-routine events.
The modeling results have been used by Noble Energy in the development of their Oil Spill Response Plan, and a plan has been developed for the monitoring of a potential condensate spill (CSA Ocean Sciences Inc., 2013e). Numerous assumptions were made for the modeling effort, which by definition does not represent an actual release but predicts what could happen using the scenario’s assumptions.
4.3.1 Drilling Worst Case Well Discharge (Gas)
4.3.1.1 Model Results
The results of the modeling for a continuous 30-day discharge of condensate with API 35 at a rate of 3,369 bbl d-1 from the Tamar SW-1 Exploration Well occurring at a depth of approximately 1,650 m are presented in Table 4-4. The tabular data include percent evaporated, percent of oil on the sea surface, percent dispersed, and percent deposited on the coast. The table also provides estimates of the time required to initially reach the shoreline, the length of shoreline affected, impact hotspots, and relative oiling concentration.

Tamar Field Development Project EIA 209 Noble Energy Mediterranean Ltd March 2016 CSA-Noble-FL-16-2650-08-REP-01-FIN-REV04
Table 4-4. Trajectory and weathering model results for a continuous 30-day discharge of condensate at a rate of 3,369 bbl d-1 for the four environmental scenarios at the end of 30 days.
Scenario Percent Evaporated
Percent Oil on
Sea Surface
Percent Dispersed
Percent Deposited on Coast
Days Until Initial
Shoreline Impact
Length of Coastline Affected
(km)
Coastline Affected
Impact Hotspot
Oiling Concentration
(bbl km-1)
Continuous 30-Day Discharge of Condensate (3,369 bbl d-1)
1 45.4 43.3 11 0.1 25 16.5 Cyprus and Israel
Paphos, Cyprus 86
2 45.4 26.1 9 18.6 16 223 Israel and Lebanon
Zichron Yaakov,
Israel >500
3 45.4 24.9 12 17.3 11 95 Israel and Lebanon
Jieh, Lebanon 500 to 1,100
4 45.4 39.9 10 4.2 14 133 Israel and Lebanon
Haifa Bay, Israel
100 to 195
The model predicts that condensate would evaporate and disperse rapidly, with approximately 43% of the spill evaporating in the first 72 hours in all scenarios. Figure 4-1 shows the percentages of condensate: 1) on the sea surface; 2) evaporated; 3) dispersed (into the water column); 4) deposited on the coast; and 5) deposited on the coast but potentially releasable. Shoreline impacts may occur as early as 11 days after the discharge begins. At the end of 30 days, all four scenarios show 45.4% evaporation, from approximately 25% to approximately 43% oil remaining on the sea surface, and up to 12% dispersed. The percent of condensate deposited on the coastline ranges from 0.1% to 18.6% with impacts to the coastline of Israel, Cyprus, and Lebanon. Total length of impacted shoreline ranges from 16.5 to 223 km. Impact hotspots in Israel are Zichron Yaakov and Haifa Bay, depending on the weather conditions. In all but one scenario (Scenario 1), the Israel coastline is impacted from the border of Lebanon to an area just north of Haifa. Two of the scenarios impact areas farther south of Haifa (Scenarios 2 and 4), with one scenario impacting the coastline to the south of Tel Aviv (Scenario 2). Figure 4-2 shows the extent and concentration of condensate deposited on the coast for the four scenarios.
Scenario 1 resulted in the lowest percentage of condensate deposited on the coastline (0.1% over 16.5 km), with the majority occurring outside of Israel’s waters. The worst case scenario is Scenario 2 (typical winter conditions), which resulted in 18.6% of the condensate being deposited on the coastline starting within 16 days; however, condensate reached the shoreline in 11 days for Scenario 3. Scenario 2 resulted in impacts to 223 km of coastline extending from Tel Aviv to north of the border of Lebanon, with the most adversely affected area being a 15- to 20-km section of coast near Zichron Yaakov that was expected to receive condensate concentrations greater than 500 bbl km-
1. Scenario 3 resulted in 17.3% of condensate being deposited on 95 km of coastline; however, the majority occurs outside of Israel. Scenario 4 resulted in 4.2% of condensate deposited on the 133 km of the coast, with the area most adversely affected being Haifa Bay, where concentrations were projected to reach 195 bbl km-1.
The results for the worst case condensate spill scenario indicate that a condensate spill from the Tamar SW-1 Exploration Well would affect both offshore and coastal resources to varying extents depending on the environmental conditions. Overall, coastal impacts to Israel are expected for approximately 117 km from just south of Tel Aviv to the Lebanon border.
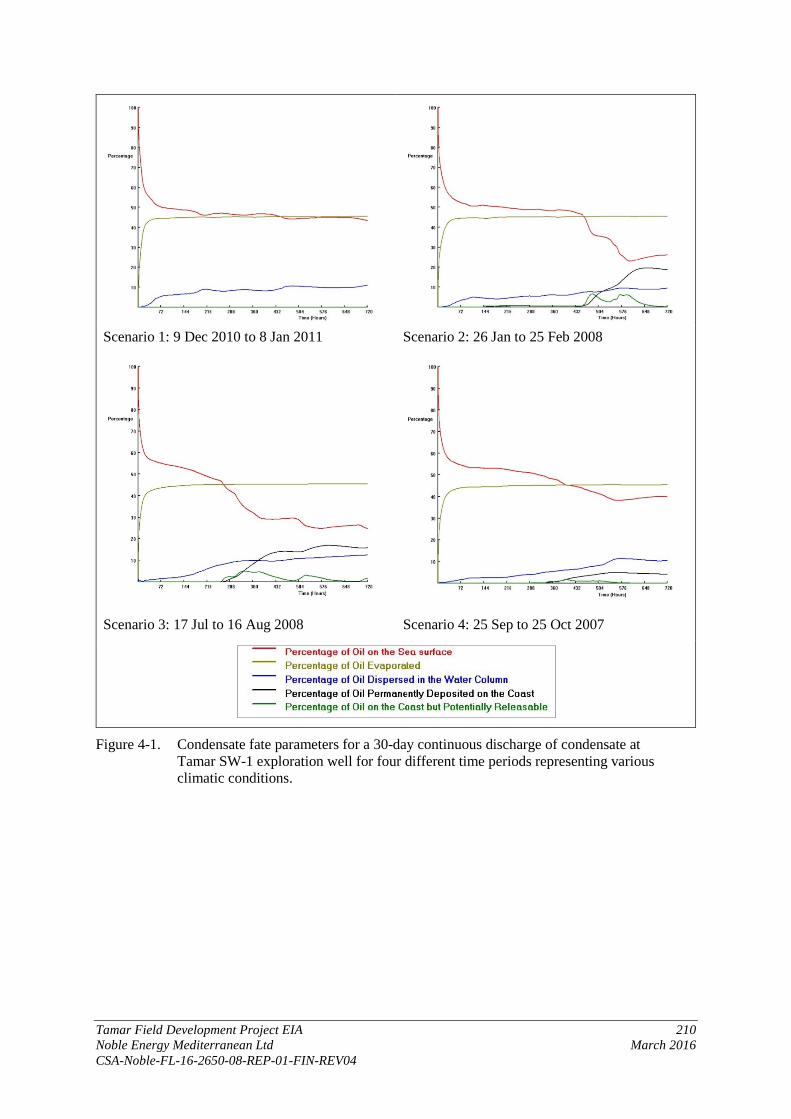
Tamar Field Development Project EIA 210 Noble Energy Mediterranean Ltd March 2016 CSA-Noble-FL-16-2650-08-REP-01-FIN-REV04
Scenario 1: 9 Dec 2010 to 8 Jan 2011 Scenario 2: 26 Jan to 25 Feb 2008
Scenario 3: 17 Jul to 16 Aug 2008 Scenario 4: 25 Sep to 25 Oct 2007
Figure 4-1. Condensate fate parameters for a 30-day continuous discharge of condensate at Tamar SW-1 exploration well for four different time periods representing various climatic conditions.

Tamar Field Development Project EIA 211 Noble Energy Mediterranean Ltd March 2016 CSA-Noble-FL-16-2650-08-REP-01-FIN-REV04
Scenario 1: 9 Dec 2010 to 8 Jan 2011 Scenario 2: 26 Jan to 25 Feb 2008
Scenario 3: 17 Jul to 16 Aug 2008 Scenario 4: 25 Sep to 25 Oct 2007
Figure 4-2. Total amounts of condensate deposited on the coast at the end of 30 days of continuous discharge at Tamar SW-1 exploration well for four different time periods representing various climatic conditions.
4.3.1.2 Discharge Plume
In a catastrophic release (i.e., blowout or pipeline failure) at depth, gas released from the seafloor is driven into the water column where it initially forms a momentum jet. The jet region is confined to the immediate vicinity and is relatively short in length (i.e., on the order of meters). The density difference between the discharge plume and the receiving water results in a buoyant force that drives the plume upward. As the plume rises, it entrains ambient seawater due to the velocity difference between the rising plume and the receiving water. This entrainment reduces the plume’s velocity and buoyancy and increases its radius. If the buoyant driving force for the plume is dissipated by 1) entrainment; 2) dissolution of gas bubbles; or 3) formation of gas hydrates before it reaches the surface, the plume will terminate.
At the upper end of the plume, oil droplets will leave and ascend to the surface solely by their own buoyancy. Rise velocities of oil droplets are much slower than the velocity of a buoyant gas-liquid plume. Compared to situations in which the plume retains its original buoyancy and remains intact all
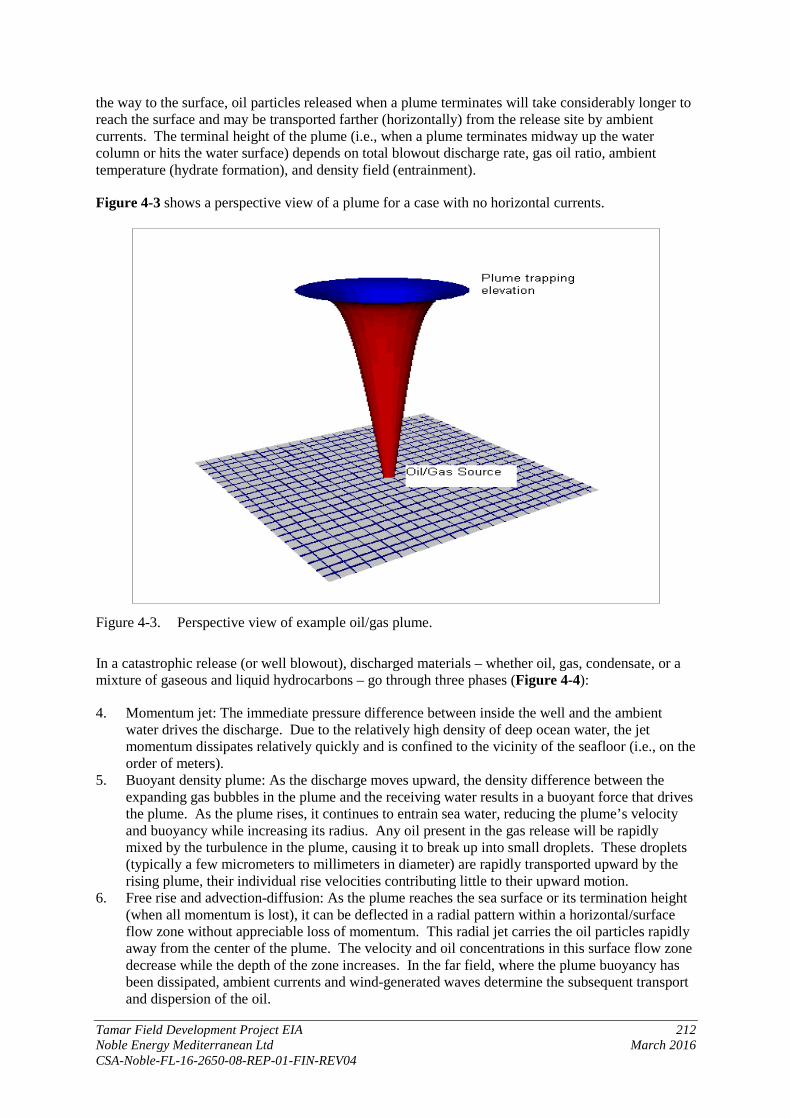
Tamar Field Development Project EIA 212 Noble Energy Mediterranean Ltd March 2016 CSA-Noble-FL-16-2650-08-REP-01-FIN-REV04
the way to the surface, oil particles released when a plume terminates will take considerably longer to reach the surface and may be transported farther (horizontally) from the release site by ambient currents. The terminal height of the plume (i.e., when a plume terminates midway up the water column or hits the water surface) depends on total blowout discharge rate, gas oil ratio, ambient temperature (hydrate formation), and density field (entrainment).
Figure 4-3 shows a perspective view of a plume for a case with no horizontal currents.
Figure 4-3. Perspective view of example oil/gas plume.
In a catastrophic release (or well blowout), discharged materials – whether oil, gas, condensate, or a mixture of gaseous and liquid hydrocarbons – go through three phases (Figure 4-4):
4. Momentum jet: The immediate pressure difference between inside the well and the ambient water drives the discharge. Due to the relatively high density of deep ocean water, the jet momentum dissipates relatively quickly and is confined to the vicinity of the seafloor (i.e., on the order of meters).
5. Buoyant density plume: As the discharge moves upward, the density difference between the expanding gas bubbles in the plume and the receiving water results in a buoyant force that drives the plume. As the plume rises, it continues to entrain sea water, reducing the plume’s velocity and buoyancy while increasing its radius. Any oil present in the gas release will be rapidly mixed by the turbulence in the plume, causing it to break up into small droplets. These droplets (typically a few micrometers to millimeters in diameter) are rapidly transported upward by the rising plume, their individual rise velocities contributing little to their upward motion.
6. Free rise and advection-diffusion: As the plume reaches the sea surface or its termination height (when all momentum is lost), it can be deflected in a radial pattern within a horizontal/surface flow zone without appreciable loss of momentum. This radial jet carries the oil particles rapidly away from the center of the plume. The velocity and oil concentrations in this surface flow zone decrease while the depth of the zone increases. In the far field, where the plume buoyancy has been dissipated, ambient currents and wind-generated waves determine the subsequent transport and dispersion of the oil.
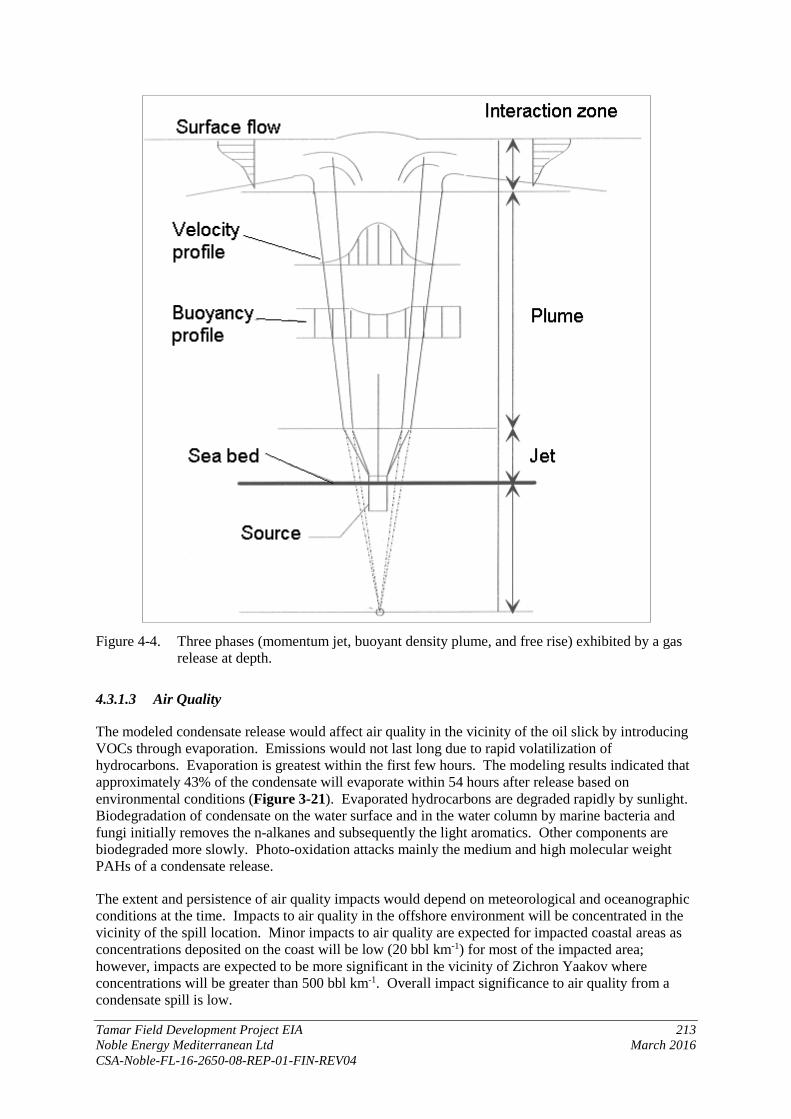
Tamar Field Development Project EIA 213 Noble Energy Mediterranean Ltd March 2016 CSA-Noble-FL-16-2650-08-REP-01-FIN-REV04
Figure 4-4. Three phases (momentum jet, buoyant density plume, and free rise) exhibited by a gas
release at depth.
4.3.1.3 Air Quality
The modeled condensate release would affect air quality in the vicinity of the oil slick by introducing VOCs through evaporation. Emissions would not last long due to rapid volatilization of hydrocarbons. Evaporation is greatest within the first few hours. The modeling results indicated that approximately 43% of the condensate will evaporate within 54 hours after release based on environmental conditions (Figure 3-21). Evaporated hydrocarbons are degraded rapidly by sunlight. Biodegradation of condensate on the water surface and in the water column by marine bacteria and fungi initially removes the n-alkanes and subsequently the light aromatics. Other components are biodegraded more slowly. Photo-oxidation attacks mainly the medium and high molecular weight PAHs of a condensate release.
The extent and persistence of air quality impacts would depend on meteorological and oceanographic conditions at the time. Impacts to air quality in the offshore environment will be concentrated in the vicinity of the spill location. Minor impacts to air quality are expected for impacted coastal areas as concentrations deposited on the coast will be low (20 bbl km-1) for most of the impacted area; however, impacts are expected to be more significant in the vicinity of Zichron Yaakov where concentrations will be greater than 500 bbl km-1. Overall impact significance to air quality from a condensate spill is low.
Tamar Field Development Project EIA 214 Noble Energy Mediterranean Ltd March 2016 CSA-Noble-FL-16-2650-08-REP-01-FIN-REV04
4.3.1.4 Water Quality
A condensate release would affect marine water quality by increasing hydrocarbon concentrations due to dissolved components and small oil droplets. A condensate discharge at depth would be expected to undergo dissolution (i.e., dissolution of water soluble fractions, including monocyclic aromatic hydrocarbons and PAHs), dispersion, and dilution (i.e., for water soluble fractions only). While in the water column, spilled condensate rising to the surface during buoyant ascent will be subject to adsorption to suspended particulate matter. Suspended particular matter and any adsorbed condensate may undergo settling or continuing suspension/resuspension in the water column. Natural weathering processes are expected to help remove the condensate from the water column and dilute the constituents. Based on the model results (Figure 3-21), approximately 43% of the condensate will evaporate or disperse naturally within 54 hours.
The constituents of condensate are light to intermediate in molecular weight and moderately volatile. The constituents can be readily degraded by aerobic microbial oxidation. Condensate is expected to float on the sea surface. Condensate dispersed in the water column can adhere to suspended sediments, but this generally occurs in coastal areas with high suspended solid loads (National Research Council, 2003b) and would not be expected to occur to any appreciable degree in Israeli offshore waters.
The extent and persistence of water quality impacts would depend on meteorological and oceanographic conditions at the time. Impacts to water quality in the offshore environment will be concentrated in the vicinity of the spill location as the volatile components evaporate. Minor to significant impacts on water quality in coastal areas would be expected for the worst case scenario. Overall impact significance to water quality from a condensate spill is medium.
4.3.1.5 Plankton, Fish, and Fishery Resources
A condensate release could affect phytoplankton and zooplankton because they do not have the ability to avoid contact with the condensate. Plankton, including fish eggs and larvae, exposed to condensate hydrocarbons could be killed or stressed. The hydrocarbons may stimulate the growth of some species and prove toxic to others (Abbriano et al., 2011). The exposure of plankton to elevated hydrocarbon concentrations would be relatively brief (generally a few days before most of the condensate evaporates or disperses and moves away from the spill site). Planktonic communities typically recover quickly due to their short generation times and high fecundity (Abbriano et al., 2011).
For exposure to methane or natural gas, fishes are expected to quickly respond to exposure, with rapid absorption of the gas into the body via the gills and adverse effects on respiratory and nervous systems; in addition, blood formation and enzyme activities will be affected. Behavioral responses to toxic gas exposure include excitement, increased activity, and a flight response. Continued exposure, although unlikely in a pipeline rupture situation, would lead to chronic poisoning. Once fishes are exposed to methane in seawater, they will move out of the area. Once fish have moved out of the area, their physiological conditions are expected to return to normal in a short period of time. Field and experimental studies cited by Patin (1999) support the general pattern of fish exposure and response to methane and its homologues in the environment.
Patin (1999) indicated that environmental factors must be considered when assessing the toxicological effects of gas exposure, including methane and its derivatives. Temperature and ambient oxygen levels can alter symptoms of gas exposure. For example, toxicant levels that do not cause an effect under low temperature can become more serious, even lethal, with increasing water temperature. Numerous studies have shown that oxygen deficits directly control the rate of fish metabolism and decrease their resistance to many organic and inorganic toxins (Patin, 1999).
Tamar Field Development Project EIA 215 Noble Energy Mediterranean Ltd March 2016 CSA-Noble-FL-16-2650-08-REP-01-FIN-REV04
Data pertinent to the effects of methane on fish are very limited. As reported by Patin (1999), gas exposure experiments by Patin (1993) showed 1) initial signs of excitement and increased motor activity by young carp; 2) scattering behavior; 3) cessation of air gulping, attributed to the filling of the gas bladder; 4) reduced motor activity after continued exposure; and 5) severe reductions in stimulus response after 1 to 2 hours of exposure. In gas concentrations of 1 mg L-1 and higher, lethal effects were seen after 1 to 2 days of exposure.
Patin (1999) also summarized studies of behavioral responses to gas exposure, noting high olfactory sensitivity of bream and perch fry as well as avoidance effects at dissolved gas concentrations of 0.1 to 0.5 mg L-1. After repeated exposure, avoidance effects were observed at 0.02 to 0.05 mg L-1. Gas concentrations resulting in mortality (48-hr LC50) were 1 to 3 mg L-1 (Umorin et al., 1991). Other studies cited by Patin (1999) give similar values of LC50 (96-hr) for marine fish fry of 0.6 to 1.8 mg L-1 (Borisov et al., 1994; Kosheleva et al., 1997).
Patin (1999) summarized the effects on indigenous fishes of accidental gas releases in the Sea of Azov. Fishes from the area around the gas releases developed significant pathologies, including impaired movement, loss of coordination, weakened muscle tone, pathologies of organs and tissues, damaged cell membranes, disturbed blood formation, modifications of protein synthesis, and radically increased total peroxidase activity. Similar anomalies were observed in flounder and sturgeon kept for 4 to 5 days in net cages within the gas plume. Fishes caught on the control stations and fishes kept in the control cages did not show any physiological deviations from one another.
Impacts to plankton, fish, and fishery resources from a pipeline gas release are expected within the gas plume and in adjacent waters where dissolution of the plume has occurred. The impact consequence to plankton, fish, and fishery resources is expected to range from minor to moderate.
In summary, the significance of impacts to plankton, fish, and fishery resources associated with a gas release is expected to range from low to medium.
4.3.1.6 Benthic Communities
A condensate release would be expected to have little or no impact on benthic communities offshore. For this analysis, CSA Ocean Sciences Inc. assumed that a release would occur from the BOP located on the seafloor and form a buoyant plume that would rise towards the sea surface. Depending on the orientation and location of the release point relative to the surrounding benthos (e.g., vertical or horizontal, at or below the sediment surface), the benthic community in the immediate vicinity of the discharge may be exposed to the plume. Any toxicity to the benthos at the initial release point will be localized to within several meters of the wellhead. Because condensate is expected to float on the sea surface, there is limited potential for any extensive contact with sediments or benthic organisms. Some portion of the condensate could adhere to particulates and eventually sink to the seafloor.
As the condensate within surface waters enters shallow water, it may come into contact with nearshore sediments, resulting in increased hydrocarbon concentrations and potential effects to nearshore benthic organisms along 117 km of coastline. Overall impact significance to benthic communities from a condensate spill is low (offshore) to medium (nearshore).
4.3.1.7 Marine Mammals and Sea Turtles
Condensate may affect marine mammals through various pathways: direct contact, inhalation of volatile components, ingestion (directly or indirectly through the consumption of fouled prey species), and (for mysticetes) impairment of feeding by fouling of baleen (Geraci and St. Aubin, 1990; Loughlin et al., 1996). Cetacean skin is highly impermeable and not seriously irritated by brief exposure to condensate; direct contact is not likely to produce a significant impact. Whales and dolphins apparently can detect slicks on the sea surface but do not always avoid them; therefore, they may be vulnerable to inhalation of hydrocarbon vapors, particularly those components of condensate
Tamar Field Development Project EIA 216 Noble Energy Mediterranean Ltd March 2016 CSA-Noble-FL-16-2650-08-REP-01-FIN-REV04
that readily evaporate. Ingestion of the lighter hydrocarbon fractions found in condensate can be toxic to marine mammals. Ingested condensate can remain within the gastrointestinal tract and be absorbed into the bloodstream, where it can irritate and/or destroy epithelial cells in the stomach and intestines. Certain constituents of condensate (i.e., aromatic hydrocarbons, PAHs) include some well-known carcinogens. These substances, however, do not show significant biomagnification in food chains and are readily metabolized by many organisms.
The impacts of a condensate release on marine mammals are expected to be moderate because the exposure to elevated hydrocarbon concentrations would be relatively brief. In general, most of the condensate will evaporate or disperse within a matter of days, effectively reducing the potential for direct impacts to marine mammals. Due to the physical/chemical properties of the condensate, toxicity would be the main concern rather than fouling. It is unlikely that large numbers of marine mammals would be exposed to the condensate, and therefore population-level impacts are unlikely to occur.
Condensate in the marine environment may affect sea turtles through various pathways: direct contact, inhalation of condensate and its volatile components, ingestion of condensate (directly or indirectly through the consumption of fouled prey species), and ingestion of floating emulsions (Geraci and St. Aubin, 1990). Several aspects of sea turtle biology and behavior place them at risk, including lack of avoidance behavior, indiscriminate feeding in convergence zones, and inhalation of large volumes of air before dives (Milton et al., 2003). Studies have shown that direct exposure of sensitive tissues (e.g., eyes, nares, other mucous membranes) to condensate or volatile hydrocarbons may cause irritation and inflammation. Condensate can adhere to sea turtle skin or shells. Sea turtles surfacing within or near a condensate release would be expected to inhale petroleum vapors. Ingested condensate, particularly the lighter fractions, can be toxic to sea turtles. Hatchling and juvenile sea turtles feed opportunistically at or near the surface in oceanic waters and are especially sensitive to released hydrocarbons (including condensate).
The impacts of a condensate release on sea turtles are expected to be moderate because the area affected would be relatively large and the exposure to elevated hydrocarbon concentrations would last more than a few days. Due to the physical/chemical properties of the condensate, toxicity would be the main concern rather than fouling. It is unlikely that large numbers of sea turtles would be exposed to the condensate offshore, and therefore population-level impacts are unlikely to occur.
Impacts on sea turtle nesting beaches would be significant during the nesting season (May through August), but is not expected to be significant during the non-nesting season. Nesting is known to occur along the beaches near Rishon Le-Zion, which may be in the impact area for a worst case scenario.
Given the remote probability of a spill and the medium consequence, the overall significance of a condensate spill on marine mammals and sea turtles is low.
4.3.1.8 Marine and Coastal Birds
Marine birds may be at risk from accidental events such as a condensate release, and the magnitude of that risk depends on factors such as the amount of time a species spends on the sea surface and the number of individuals present. It is likely that impacts would occur only once the condensate release reached the shoreline. Direct contact of marine birds with condensate may result in the fouling or matting of feathers with subsequent limitation or loss of flight, insulating, or water-repellent capabilities; irritation or inflammation of skin or sensitive tissues, such as eyes and other mucous membranes; or toxic effects from ingested condensate or the inhalation of condensate and its volatile components. Although individual birds may be oiled during an accidental release offshore, such impacts will be unlikely to affect marine and coastal birds at the population level.

Tamar Field Development Project EIA 217 Noble Energy Mediterranean Ltd March 2016 CSA-Noble-FL-16-2650-08-REP-01-FIN-REV04
The impacts of a condensate release on marine and coastal birds present along the coast are expected to be greater because the area affected would cover 117 km of shoreline, potentially impacting feeding and nesting sites. Due to the physical/chemical properties of the condensate, toxicity would be the main concern rather than fouling. It is unlikely that large numbers of birds would be exposed to the condensate offshore; however, significant impacts could occur along the coastline. Depending on the season (e.g., during high migratory periods or following fledgling of young birds), impacts at the population level are possible. Of greatest concern are bird species whose populations are currently at risk. Considering the likelihood and consequence of a condensate spell on marine and coastal birds, the overall impact significance is low to medium.
4.3.1.9 Protected Marine Species and Habitats, Marine Habitats of Interest, and Areas of Special Concern
Israel has established several different types of conservation areas, including those located along Israel’s coastal zone. Conservation areas found within Israel include the following:
• National Parks: National parks are defined as areas meant for “the public enjoyment of nature or for the preservation of areas of historic, archaeological, or architectural importance.”
• Nature Reserves: A nature reserve is “an area in which animals, plants, inanimate objects, soil, caves, water, and landscape are protected from changes in their appearance, biological makeup, and natural development.”
• Protected Natural Resources: A protected natural resource is defined as “anything or class of things in nature, whether animal, vegetable or mineral, whose preservation, in the opinion of the Minister of Agriculture, is of value.”
Designated protected marine or marine-terrestrial habitats along the Mediterranean coast of Israel, including those listed by the IUCN are summarized in Table 4-5.
Table 4-5. Summary of designated protected marine or marine-terrestrial habitats along the Mediterranean coast of Israel, including those listed by the International Union for Conservation of Nature (IUCN).
Site Name Designation IUCN or National Category
Marine or Terrestrial
Total Area (ha)
Total Marine Area (ha)
Hof Hasharon (Sharon Beach) National Park; MPA V Both ND ND Hof Palmachim National Park National Both ND ND Hof Dor HaBonim Marine Nature Reserve; MPA IV Marine ND ND Iyye Hof Rosh Ha-niqra Nature Reserve IV Marine 31.0 31.0 Iyye Hof Dor U-Ma’agan Mikha’el Nature Reserve IV Marine ND ND Nahal Alexander National Park, MPA V Marine 374.0 374.0 Nahal Poleg Nature Reserve IV Both ND ND Rosh HaNigra Nature Reserve IV Both 440.0 -- Rosh Hanikra Sea and Shore Nature Reserve; MPA National Marine 960.0 960.0 Sidney Ali National Park National Both ND ND Yam Dor HaBonim Marine Nature Reserve; MPA IV Both 574.0 532.0 Yam Evtah Marine Nature Reserve; MPA National Marine 137.0 137.0 Yam Gador Marine Nature Reserve; MPA National Marine 138.0 65.0 Yam Maa’gan Mikeael Nature Reserve National Both 450.0 -- Yam Shiqma Nature Reserve; MPA National Marine 1,030.0 1,030.0
IV and V = IUCN marine habitat categories (see text); MPA = Marine Protected Area; ND = not determined.

Tamar Field Development Project EIA 218 Noble Energy Mediterranean Ltd March 2016 CSA-Noble-FL-16-2650-08-REP-01-FIN-REV04
Table 4-5 lists two IUCN categories, which are defined as follows:
• Category IV protected areas usually help to protect or restore: 1) floral species of international, national, or local importance; 2) faunal species of international, national, or local importance, including resident or migratory fauna; and/or 3) habitats. The size of the area varies but can often be relatively small; this is not a distinguishing feature however. Management will differ depending on need. Protection may be sufficient to maintain particular habitats and/or species. However, as Category IV protected areas often include fragments of an ecosystem, these areas may not be self-sustaining and will require regular and active management interventions to ensure the survival of specific habitats and/or to meet the requirements of particular species.
• Category V protected areas result from biotic, abiotic, and human interaction and should have the following essential characteristics: 1) landscape or coastal and island seascape of high or distinct scenic quality with significant associated habitats, flora, fauna, and associated cultural features; 2) a balanced interaction between people and nature that has endured over time and still has integrity, or where there is reasonable hope of restoring that integrity; and 3) unique or traditional land-use patterns, such as evidenced in sustainable agricultural and forestry systems as well as human settlements that have evolved in balance with their landscape. The following are desirable characteristics: 1) opportunities for recreation and tourism consistent with lifestyle and economic activities; 2) unique or traditional social organizations as evidenced in local customs, livelihoods, and beliefs; 3) recognition by artists of all kinds and in cultural traditions (now and in the past); and 4) potential for ecological and/or landscape restoration.
Abdulla et al. (2008) described 17.97 km2 or 0.56% of Israel’s coast as managed or protected areas. The small declared nature reserves of Achziv in the north and Dor-Habonim midway along the coast make up the bulk of the protected and managed areas, holding a unique status as the only sites along the entire Levantine coast that conserve the coastal rocky and sandy ecosystem and their fishery resources in a near pristine state. The 0.56% of managed coast makes Israel the least advanced of the 16 Mediterranean countries surveyed by Abdulla et al. (2008).
In recent years, plans were implemented to enhance and develop at least three larger Marine Protected Areas (MPAs) along the coast in the north, south, and center of the country. These are expected to be an expansion of existing MPAs. Plans called for the establishment of four large nature reserves, stretching from the 12-nmi territorial water boundary; this will comprise approximately 600 km2, or 20% of Israel’s territorial sea. The Israel Nature and Parks Authority (INNPA) is currently negotiating this plan with the Department of Fisheries and other stakeholders, legislators, and relevant bodies. The plan is to implement several large-scale MPAs in order to protect the environment and conserve biodiversity (Yahel, 2010).
The worst case scenario for this analysis impacts a coastal area approximately 117 km in length, exposing the shoreline to concentrations of condensate ranging from 20 to more than 500 bbl km-1. Most of the shoreline consists of long, sandy beaches with changing landscapes (sandstone, dunes, low shrub land). There are extensive swimming beaches used for recreation, and sea turtle nesting has been recorded also.
While there is extensive literature about impacts of crude oil spills on coastal habitats, relatively little has been published about condensate spill impacts. Lucas and Freeman (1989) sprayed condensate onto beach grasses in Nova Scotia, Canada, and observed a temporary herbicidal effect. However, the roots were unaffected, and the plants recovered substantially by the next growing season.
Sammarco (1997) reviewed information on oil spill impacts on wetlands in an attempt to infer potential impacts of a condensate spill in Louisiana wetlands, noting that the responses of the fauna and flora will vary depending on a variety of factors. Factors that influence the extent and duration of impact include the specific compounds in the condensate, its solubility in seawater, concentration, sorptive characteristics, the organics in the sediment, season, water temperature, salinity, wind

Tamar Field Development Project EIA 219 Noble Energy Mediterranean Ltd March 2016 CSA-Noble-FL-16-2650-08-REP-01-FIN-REV04
velocity, community composition, degree of wind and wave exposure, and history of the site with respect to exposure to petroleum hydrocarbons. Initial concentrations are important to predictions of spill effects, but long-term effects depend on final chemical composition and concentrations in the sediment and water (Sammarco, 1997).
Persistent contamination and severe ecological impacts are not expected along the shoreline.
Overall impact significance to coastal habitats from a condensate spill is low based on a remote likelihood and medium impact.
4.3.1.10 Fishing and Marine Farming
Impacts on fishing or marine farming would be limited to the low probability that a safety and response zone would be established near the release site that would exclude commercial fishing vessels. This would have a limited impact due to the low levels of fishing in the project area. Negligible impacts on marine farming are anticipated due to their distance from the project site.
4.3.1.11 Shipping and Maritime Industry
A non-routine release of gas or condensate would not be expected to impact shipping or the maritime industry other than the possible establishment of a safety and response zone that would exclude non-project vessels for a short time. Overall impact significance is negligible.
4.3.1.12 Recreation and Aesthetics/Tourism
A 117-km stretch of coastline from south of Tel Aviv to the Israel/Lebanon border could be affected under the worst case scenario condensate spill. The shoreline segment adjacent to the city of Zichron Yaakov would realize the highest levels of condensate deposition. Other coastal cities affected under the worst case scenario include Haifa, Rishon LeZion, and Netanya. There also are several coastal villages in between the listed cities. These areas serve coastal and marine-related tourism with lodging, restaurants, and other facilities. Lodging in the cities is mainly based on large hotels approved by the Ministry of Tourism. The main tourist attractions along the coast of Israel are bathing beaches, heritage sites, archaeological sites, nature reserves, and national parks. Tourism and recreation in the nearshore waters and on the coast of Israel are spread all along the coast from north to south. In nearshore waters, tourism is mainly based on marine sporting activities and recreation. Water sports include diving, surfing, and sailing.
Impacts on recreational activities and resources are expected, resulting in temporary exclusion from these areas due to oil spill response and cleanup activities. Beaches may be contaminated where concentrations are great enough to require clean up to restore the affected areas. Overall impact significance to recreation and aesthetics/tourism from a condensate spill is low due to the remote likelihood and medium consequence.
4.3.1.13 Archaeological Resources
For the worst case scenario condensate spill, nearshore waters and the 117 km of coastline will be affected via deposition of weathered condensate. There is a potential for contamination of unknown or undiscovered archaeological features; much less likely is the potential for direct damage to such features during spill response and cleanup activities. If condensate should come into contact with wooden shipwrecks on the seafloor, it could adversely affect their condition or preservation (U.S. Bureau of Ocean Energy Management, 2012). Overall impact significance to archaeological resources from a condensate spill is low.
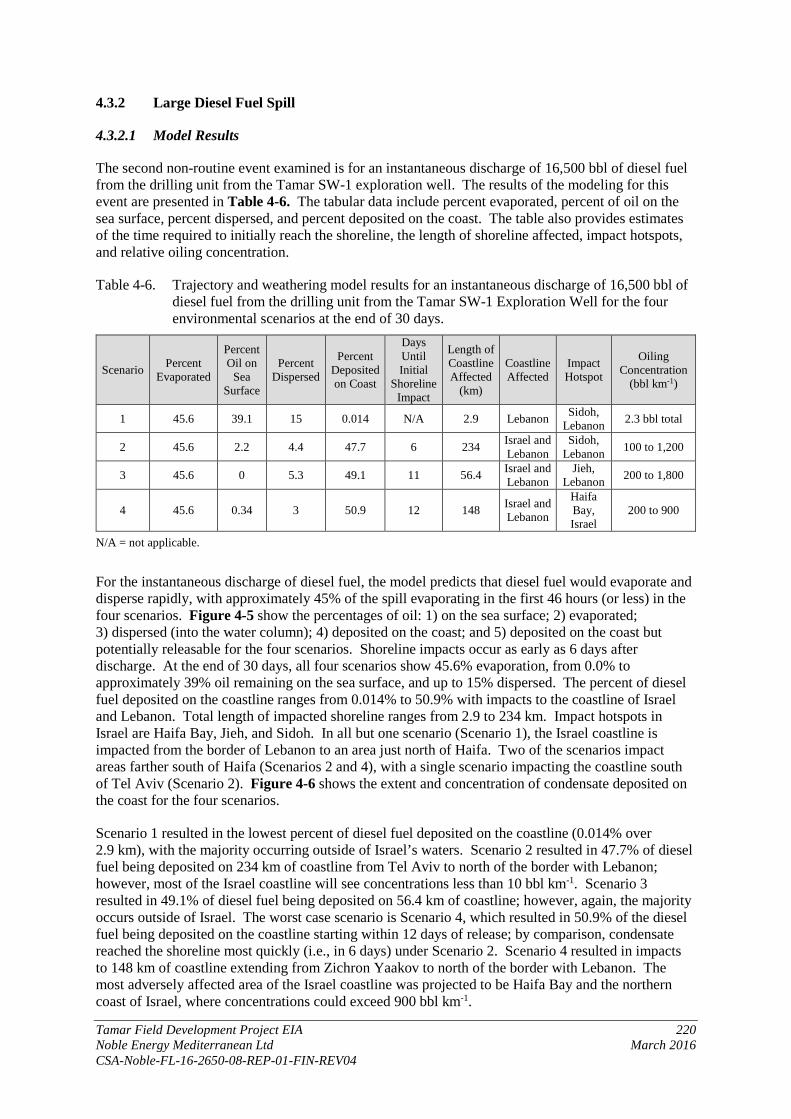
Tamar Field Development Project EIA 220 Noble Energy Mediterranean Ltd March 2016 CSA-Noble-FL-16-2650-08-REP-01-FIN-REV04
4.3.2 Large Diesel Fuel Spill
4.3.2.1 Model Results
The second non-routine event examined is for an instantaneous discharge of 16,500 bbl of diesel fuel from the drilling unit from the Tamar SW-1 exploration well. The results of the modeling for this event are presented in Table 4-6. The tabular data include percent evaporated, percent of oil on the sea surface, percent dispersed, and percent deposited on the coast. The table also provides estimates of the time required to initially reach the shoreline, the length of shoreline affected, impact hotspots, and relative oiling concentration.
Table 4-6. Trajectory and weathering model results for an instantaneous discharge of 16,500 bbl of diesel fuel from the drilling unit from the Tamar SW-1 Exploration Well for the four environmental scenarios at the end of 30 days.
Scenario Percent Evaporated
Percent Oil on
Sea Surface
Percent Dispersed
Percent Deposited on Coast
Days Until Initial
Shoreline Impact
Length of Coastline Affected
(km)
Coastline Affected
Impact Hotspot
Oiling Concentration
(bbl km-1)
1 45.6 39.1 15 0.014 N/A 2.9 Lebanon Sidoh, Lebanon 2.3 bbl total
2 45.6 2.2 4.4 47.7 6 234 Israel and Lebanon
Sidoh, Lebanon 100 to 1,200
3 45.6 0 5.3 49.1 11 56.4 Israel and Lebanon
Jieh, Lebanon 200 to 1,800
4 45.6 0.34 3 50.9 12 148 Israel and Lebanon
Haifa Bay, Israel
200 to 900
N/A = not applicable.
For the instantaneous discharge of diesel fuel, the model predicts that diesel fuel would evaporate and disperse rapidly, with approximately 45% of the spill evaporating in the first 46 hours (or less) in the four scenarios. Figure 4-5 show the percentages of oil: 1) on the sea surface; 2) evaporated; 3) dispersed (into the water column); 4) deposited on the coast; and 5) deposited on the coast but potentially releasable for the four scenarios. Shoreline impacts occur as early as 6 days after discharge. At the end of 30 days, all four scenarios show 45.6% evaporation, from 0.0% to approximately 39% oil remaining on the sea surface, and up to 15% dispersed. The percent of diesel fuel deposited on the coastline ranges from 0.014% to 50.9% with impacts to the coastline of Israel and Lebanon. Total length of impacted shoreline ranges from 2.9 to 234 km. Impact hotspots in Israel are Haifa Bay, Jieh, and Sidoh. In all but one scenario (Scenario 1), the Israel coastline is impacted from the border of Lebanon to an area just north of Haifa. Two of the scenarios impact areas farther south of Haifa (Scenarios 2 and 4), with a single scenario impacting the coastline south of Tel Aviv (Scenario 2). Figure 4-6 shows the extent and concentration of condensate deposited on the coast for the four scenarios.
Scenario 1 resulted in the lowest percent of diesel fuel deposited on the coastline (0.014% over 2.9 km), with the majority occurring outside of Israel’s waters. Scenario 2 resulted in 47.7% of diesel fuel being deposited on 234 km of coastline from Tel Aviv to north of the border with Lebanon; however, most of the Israel coastline will see concentrations less than 10 bbl km-1. Scenario 3 resulted in 49.1% of diesel fuel being deposited on 56.4 km of coastline; however, again, the majority occurs outside of Israel. The worst case scenario is Scenario 4, which resulted in 50.9% of the diesel fuel being deposited on the coastline starting within 12 days of release; by comparison, condensate reached the shoreline most quickly (i.e., in 6 days) under Scenario 2. Scenario 4 resulted in impacts to 148 km of coastline extending from Zichron Yaakov to north of the border with Lebanon. The most adversely affected area of the Israel coastline was projected to be Haifa Bay and the northern coast of Israel, where concentrations could exceed 900 bbl km-1.
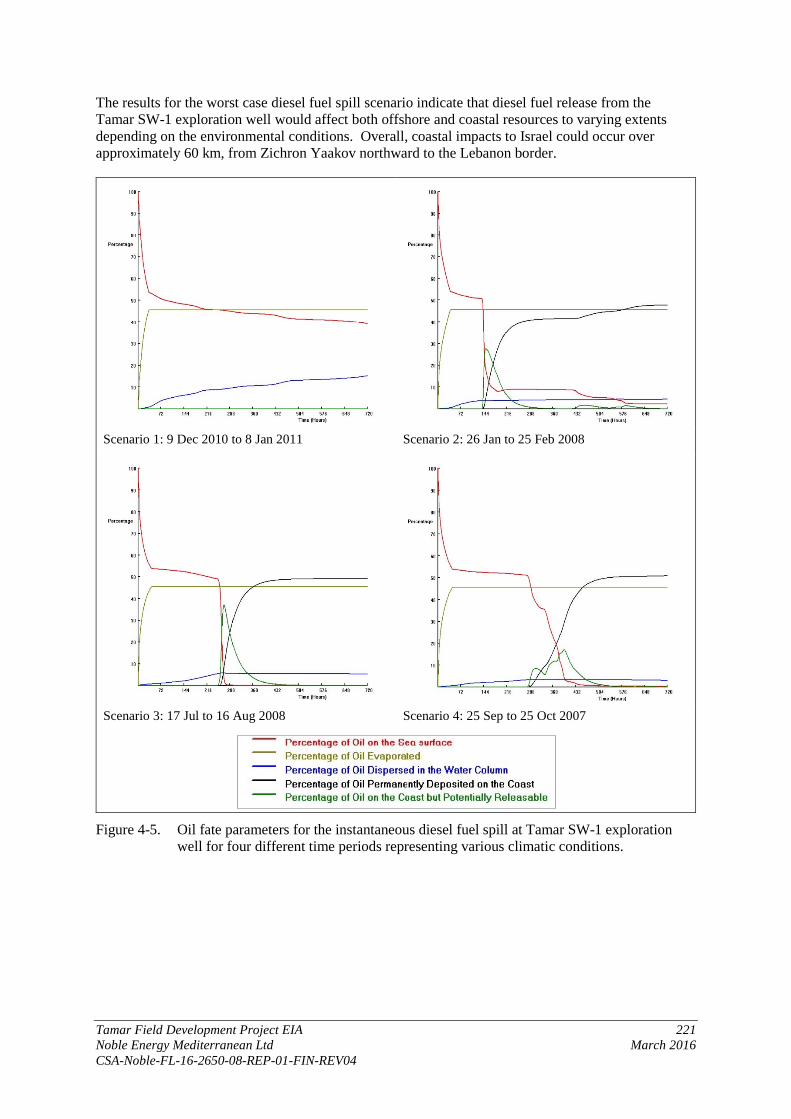
Tamar Field Development Project EIA 221 Noble Energy Mediterranean Ltd March 2016 CSA-Noble-FL-16-2650-08-REP-01-FIN-REV04
The results for the worst case diesel fuel spill scenario indicate that diesel fuel release from the Tamar SW-1 exploration well would affect both offshore and coastal resources to varying extents depending on the environmental conditions. Overall, coastal impacts to Israel could occur over approximately 60 km, from Zichron Yaakov northward to the Lebanon border.
Scenario 1: 9 Dec 2010 to 8 Jan 2011 Scenario 2: 26 Jan to 25 Feb 2008
Scenario 3: 17 Jul to 16 Aug 2008 Scenario 4: 25 Sep to 25 Oct 2007
Figure 4-5. Oil fate parameters for the instantaneous diesel fuel spill at Tamar SW-1 exploration
well for four different time periods representing various climatic conditions.
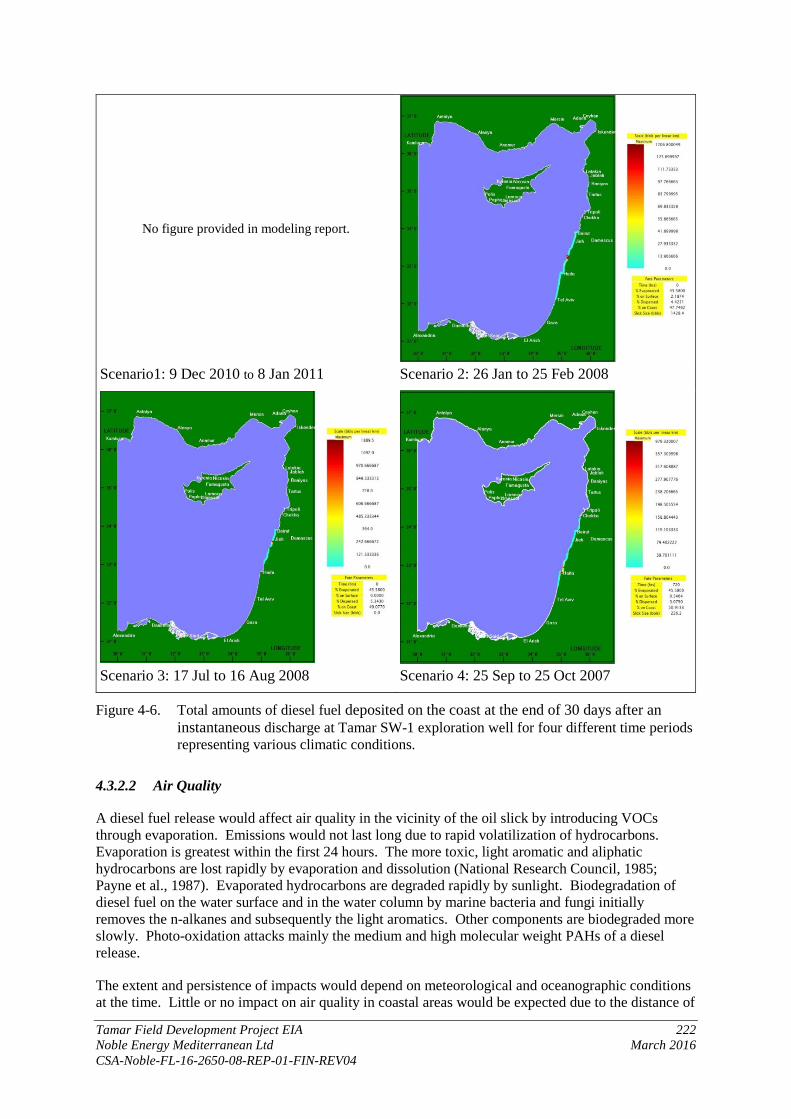
Tamar Field Development Project EIA 222 Noble Energy Mediterranean Ltd March 2016 CSA-Noble-FL-16-2650-08-REP-01-FIN-REV04
No figure provided in modeling report.
Scenario1: 9 Dec 2010 to 8 Jan 2011 Scenario 2: 26 Jan to 25 Feb 2008
Scenario 3: 17 Jul to 16 Aug 2008 Scenario 4: 25 Sep to 25 Oct 2007
Figure 4-6. Total amounts of diesel fuel deposited on the coast at the end of 30 days after an instantaneous discharge at Tamar SW-1 exploration well for four different time periods representing various climatic conditions.
4.3.2.2 Air Quality
A diesel fuel release would affect air quality in the vicinity of the oil slick by introducing VOCs through evaporation. Emissions would not last long due to rapid volatilization of hydrocarbons. Evaporation is greatest within the first 24 hours. The more toxic, light aromatic and aliphatic hydrocarbons are lost rapidly by evaporation and dissolution (National Research Council, 1985; Payne et al., 1987). Evaporated hydrocarbons are degraded rapidly by sunlight. Biodegradation of diesel fuel on the water surface and in the water column by marine bacteria and fungi initially removes the n-alkanes and subsequently the light aromatics. Other components are biodegraded more slowly. Photo-oxidation attacks mainly the medium and high molecular weight PAHs of a diesel release.
The extent and persistence of impacts would depend on meteorological and oceanographic conditions at the time. Little or no impact on air quality in coastal areas would be expected due to the distance of

Tamar Field Development Project EIA 223 Noble Energy Mediterranean Ltd March 2016 CSA-Noble-FL-16-2650-08-REP-01-FIN-REV04
the Tamar Field from shore and the degree of weathering expected. Impact consequence to offshore air quality would be short term (due to rapid evaporation) but moderate. Overall impact significance would range from negligible to low.
4.3.2.3 Sediment/Sediment Quality; Water Quality
A diesel fuel release would affect marine water quality by increasing hydrocarbon concentrations due to dissolved components and small oil droplets. Natural weathering processes are expected to rapidly remove the diesel fuel from the water column and dilute the constituents to background levels. Diesel releases are unlikely to affect sediment quality offshore, but may be expected to be carried into shallow water under certain meteorological and oceanographic conditions. Impact consequences are variable, ranging from negligible to moderate. Overall impact significance ranges from negligible to low.
4.3.2.4 Plankton, Fish, and Fishery Resources
A diesel fuel release could affect phytoplankton and zooplankton because they do not have the ability to avoid contact with oil. Planktonic communities drift with water currents and recolonize from adjacent areas. Because of these attributes and their short life cycles, plankton usually recover relatively rapidly to normal population levels following disturbances.
While adult and juvenile fishes may actively avoid a large diesel release, planktonic fish eggs and larvae would be unable to avoid contact. Eggs and larvae of fishes will die if exposed to certain toxic fractions of diesel fuel. Most fishes inhabiting oceanic waters have planktonic eggs and larvae. However, due to the wide dispersal of early life history stages of fishes, a diesel release would not be expected to have significant impacts at the population level. In the event of a large diesel release, fishing activities near the project area could be disrupted temporarily. The area affected would be moderate in size, and the duration presumably would extend beyond 30 days. Impact consequence ranges from minor to moderate. Overall impact significance ranges from negligible to low.
4.3.2.5 Benthic Communities
A diesel fuel release in surface waters would have no impact on benthic communities. Diesel is unlikely to reach the seafloor, especially at the water depth of the Tamar Field wells. A diesel fuel release transported into nearshore waters will have undergone evaporation, leaving heavier, less volatile hydrocarbon components. Weathered diesel fuel reaching shore will affect beach and subtidal sediments as well as associated benthic communities. As the diesel fuel release moves toward land, it will contact nearshore sediments, resulting in increased hydrocarbon concentrations in nearshore waters and possible adhesion to suspended sediments with subsequent sinking, with the potential to affect benthic organisms. Impact consequence is moderate. Overall impact significance is low.
4.3.2.6 Marine Mammals and Sea Turtles
Diesel fuel may affect marine mammals through various pathways: direct contact, inhalation of volatile components, ingestion (directly or indirectly through the consumption of fouled prey species), and (for mysticetes) impairment of feeding by fouling of baleen (Geraci and St. Aubin, 1987, 1988, 1990; Loughlin et al., 1996). Cetacean skin is highly impermeable and is not seriously irritated by brief exposure to diesel fuel; direct contact is not likely to produce a significant impact. Whales and dolphins apparently can detect slicks on the sea surface but do not always avoid them; therefore, they may be vulnerable to inhalation of hydrocarbon vapors, particularly those components of diesel fuel that are readily evaporated.
Ingestion of the lighter hydrocarbon fractions found in diesel fuel can be toxic to marine mammals. Ingested diesel fuel can remain within the gastrointestinal tract and be absorbed into the bloodstream, irritating and/or destroying epithelial cells in the stomach and intestines. Certain constituents of diesel
Tamar Field Development Project EIA 224 Noble Energy Mediterranean Ltd March 2016 CSA-Noble-FL-16-2650-08-REP-01-FIN-REV04
fuel (i.e., aromatic hydrocarbons, PAHs) include some well-known carcinogens. These substances, however, do not show significant biomagnification in food chains and are readily metabolized by many organisms. Additionally, released diesel fuel may foul the baleen fibers of mysticetes, thereby impairing food-gathering efficiency or result in the ingestion of diesel fuel or diesel fuel-contaminated prey.
Diesel fuel in the marine environment may affect sea turtles through various pathways: direct contact, inhalation of diesel fuel and its volatile components, ingestion of diesel fuel (directly or indirectly through the consumption of fouled prey species), and ingestion of floating tar (Geraci and St. Aubin, 1987). Several aspects of sea turtle biology and behavior place them at risk, including lack of avoidance behavior, indiscriminate feeding in convergence zones, and inhalation of large volumes of air before dives (Milton et al., 2003). Studies have shown that direct exposure of sensitive tissues (e.g., eyes, nares, other mucous membranes) to diesel fuel or volatile hydrocarbons may produce irritation and inflammation. Diesel fuel can adhere to sea turtle skin or shells. Sea turtles surfacing within or near a diesel release would be expected to inhale petroleum vapors. Ingested diesel fuel, particularly the lighter fractions, can be toxic to sea turtles. Hatchling and juvenile sea turtles feed opportunistically at or near the surface in oceanic waters and are especially sensitive to released hydrocarbons (including diesel fuel).
Overall impact significance of a diesel fuel spill on marine mammals and sea turtles is negligible to low, based on the low probability of the impact occurring and the low to medium consequence of the impact.
4.3.2.7 Marine and Coastal Birds
Direct contact of marine birds with diesel fuel may result in the fouling or matting of feathers with subsequent limitation or loss of flight capability or insulating or water-repellent capabilities; irritation or inflammation of skin or sensitive tissues, such as eyes and other mucous membranes; or toxic effects from ingested diesel fuel or the inhalation of diesel and its volatile components. Although individual birds may be oiled during an accidental release offshore, such impacts are unlikely to affect marine and coastal birds at a population level.
The impacts of a diesel fuel release on marine and coastal birds present along the coast are expected to be medium because the area affected would be cover 60 km of shoreline, potentially impacting feeding and nesting sites. Due to the physical/chemical properties of the diesel fuel, toxicity would be the main concern rather than fouling of these animals. It is unlikely that large numbers of birds would be exposed to the diesel fuel offshore; however, significant impacts could occur along the coastline. Depending upon the season (e.g., during high migratory periods; following fledgling of young birds), impacts at the population level are possible. Of greatest concern are bird species whose populations are currently at risk. Overall impact significance to marine and coastal birds from a diesel spill is low due to the medium consequence and remote probability.
4.3.2.8 Protected Marine Species and Habitats, Marine Habitats of Interest, and Areas of Special Concern
The worst case scenario for this analysis impacts a coastal area greater than 60 km in length, exposing the shoreline to concentrations of condensate ranging from 20 to more than 900 bbl km-1 (Figure 4-6). Most of the shoreline consists of long, sandy beaches with changing landscapes (sandstone, dunes, low shrub land). There are extensive swimming beaches used for recreation, and sea turtle nesting has been recorded also. Designated protected marine or marine-terrestrial habitats along the Mediterranean coast of Israel, including those listed by the IUCN are summarized in Table 4-5.
While there is extensive literature about impacts of crude oil spills on coastal habitats, relatively little has been published about diesel fuel spill impacts. Results of diesel fuel exposure are considered to be similar to condensate exposure. As noted previously, Lucas and Freeman (1989) observed a
Tamar Field Development Project EIA 225 Noble Energy Mediterranean Ltd March 2016 CSA-Noble-FL-16-2650-08-REP-01-FIN-REV04
temporary herbicidal effect following the spraying of condensate onto beach grasses; roots were unaffected and the plants recovered substantially by the next growing season.
Because most of the Israeli shoreline consists of beaches, persistent contamination and severe ecological impacts found within estuarine environments following an oil spill are not expected. Light oils such as diesel are expected to leave a film on intertidal resources and have the potential to cause persistent contamination. Oil can be directly toxic to marine invertebrates or may affect them through physical smothering, altering metabolic and feeding rates, and altering shell formation. These toxic effects can be acute (lethal) or chronic (sublethal). While intertidal benthic invertebrates may be especially vulnerable if oil becomes highly concentrated along the shoreline, concentrated diesel fuel accumulations are not expected.
Sediments may become reservoirs for spilled diesel, depending upon substrate type and how far into the sediments diesel may penetrate. While some benthic invertebrates can survive oil exposure, they may accumulate high body burdens of oil-based contaminants. Marine algae exhibit variable responses to oiling. Algae may die or become more abundant in response to oil exposure. Although oil can prevent the germination and growth of marine plants, most vegetation appears to recover after clean up. Under the worst case scenario where significant amounts of spilled diesel may accumulate and remain, shifts in population structure, species abundance and diversity, and distribution may result. Habitat loss and the loss of prey items also have the potential to affect fish and wildlife populations.
Given the likelihood of a diesel spill, the time required for it to reach the coast, the relative amounts of diesel that may be expected to reach the shoreline, and the nature of each coastal segment, the overall impact significance to coastal habitats from a diesel fuel spill is low.
4.3.2.9 Fishing and Marine Farming; Shipping and Maritime Industry
A diesel spill would temporarily disrupt fishing, shipping, and maritime industry activities because of the hydrocarbon slick and oil spill response activities. While the spill response area (based on surface waters affected) would be relatively large, the expected duration of spill response activities would be relatively brief. The volume of the spill remaining will be reduced significantly through evaporation (i.e., approximately 50% of the diesel fuel will evaporate within 3 days). Impacts to fishing activities would occur initially within offshore waters near the release site, then along 60 km of the coastline approximately 12 days after release. Resulting impacts would require exclusion from the area while the spill was offshore. Shoreline impacts would include exclusion from the area and oiling of fish ponds and cages, resulting in moderate impacts. Overall impact significance to fishing, shipping, and maritime industry activities from a diesel fuel spill is low due to the small amount of such activity in the project area.
4.3.2.10 Recreation and Aesthetics/Tourism
A 60-km stretch of coastline from south of Zichron Yaakov to the Israel/Lebanon border could be affected under the worst case scenario diesel fuel spill (Figure 4-6). Shoreline segments around Haifa Bay could realize the highest levels of diesel fuel deposition. There also are several coastal villages located between Haifa and the Israel/Lebanon border. These areas serve coastal and marine-related tourism with lodging, restaurants, and other facilities. Lodging in the cities is mainly based on large hotels approved by the Ministry of Tourism. The main tourist attractions along the coast of Israel are bathing beaches, heritage sites, archaeological sites, nature reserves, and national parks. Tourism and recreation in the nearshore waters and on the coast of Israel are spread along the coast from north to south. In nearshore waters, tourism is based mainly on marine sporting activities and recreation. Water sports include diving, surfing, and sailing.
Impacts on recreational activities and resources are expected, given that 60 km of coastline will realize some level of diesel fuel deposition, resulting in temporary exclusion from these areas due to
Tamar Field Development Project EIA 226 Noble Energy Mediterranean Ltd March 2016 CSA-Noble-FL-16-2650-08-REP-01-FIN-REV04
oil spill response and cleanup activities. Beaches may be contaminated where concentrations are great enough to require clean up to restore the affected areas.
Impact consequence ranges from low to medium, depending on season and predicted landfall. Overall impact significance to recreation and aesthetics/tourism ranges from negligible to low.
4.3.2.11 Archaeological Resources
Archaeological resources such as historic, prehistoric, and cultural sites occur onshore and buried in the seafloor offshore. Underwater archaeological remains can include submerged prehistoric settlements, coastal settlements, shipwrecks, ports and anchorages, and rock-cut installations on the coastline.
For the worst case scenario diesel fuel spill, nearshore waters and 60 km of coastline will be affected. There is potential for contamination of unknown or undiscovered archaeological features, and archeological resources could be damaged during spill response and cleanup activities. If diesel fuel should come into contact with wooden shipwrecks on the seafloor, it could adversely affect their condition or preservation (U.S. Bureau of Ocean Energy Management, 2012). Protective measures would take priority at significant coastal heritage and historic sites in the event of a spill near these sites. Overall impact significance to archaeological resources from a diesel fuel spill is low.
4.3.3 Response Costs Associated with Potential Non-Routine Events
The costs associated with oil spills were estimated by Dr. Steve Brenner of Bar-Ilan University (CSA Ocean Sciences Inc., 2013d). The estimated costs are strongly influenced by multiple factors such as the type and quantity of product spilled; response methodology and effectiveness; location and timing of the spill; affected habitat types, including sensitive areas; wildlife affected; liability limits in place; local and national laws; and cleanup strategy (Grigalunas et al., 1986; Etkin, 1998a,b, 1999, 2000, 2001a,b, 2003a,b, 2004a,b; White and Molloy, 2003; Kontovas and Psaraftis, 2008; International Tanker Owners Pollution Federation, 2013). No two spills are identical, and impacts are more diverse than the spills themselves.
The following calculations based on Etkin (2000, 2001a) are presented as an initial approximation. Etkin (2000, 2001a) did not specifically analyze a condensate spill, but data for No. 2 diesel fuel and light crude oil are used as an approximations. Etkin (2000, 2001a) proposed the following equation for estimating the cost of spill response:
• Cui = Cli t i oi mi si • and Cli = ri li Cn • and Cei = Cui Ai
Where:
• Cui = response cost per unit for scenario i; • Cli = cost per unit spilled for scenario i; • Cn = general cost per unit spilled in nation n; • Cei = estimated total response cost for scenario i; • ti = oil type modifier factor for scenario i; • oi = shoreline oiling modifier factor for scenario i; • mi = cleanup methodology modifier factor for scenario i; • si = spill size modifier factor for scenario i; • ri = regional location modifier factor for scenario i; • li = local location modifier for scenario i; and • Ai = specified spill amount for scenario i.

Tamar Field Development Project EIA 227 Noble Energy Mediterranean Ltd March 2016 CSA-Noble-FL-16-2650-08-REP-01-FIN-REV04
For this calculation:
• Cn for Israel = US$2,313.60/MT (Etkin, 2000); • li = 1.46 for a nearshore spill; • r i = 1.00 for regional factor; • ti = 0.18 for diesel fuel; 0.32 for light crude oil (as a proxy for condensate) • oi = 0.61 for 20 to 90 km of shoreline oiling (a conservative estimate for impacts to the Israel
coastline); • mi = 0.46 for dispersants as the primary response method; • mi = 0.92 for mechanical clean up as the primary response method; • si = 0.27 for spill size 340 to 1,700 MT (actual size for diesel fuel is 1,117 MT); and • si = 0.15 for spill size 1,700 to 3,400 MT (actual size for condensate is 2,557 MT).
Based on these figures, the response cost per unit spilled (Cui) is approximately: 1) $46/MT for dispersants as the primary response method for condensate; 2) $91/MT for mechanical clean up as the primary response method for condensate; 3) $646/MT for dispersants as the primary response method for diesel fuel; and 4) $92/MT for mechanical clean up as the primary response method for diesel fuel. Multiplying by the amounts specified in the two worst case spill scenarios yields the cost estimates listed in Table 4-7.
Table 4-7. Spill response cost estimates in 1999 U.S. dollars for two worst case discharge scenarios. Calculations are based on equations presented by Etkin (2000, 2001a).
Worst Case Scenario
Amount Primary Response Method (Cost) Barrels Metric Tons Dispersants Mechanical Recovery
Condensate 18,799 2,557 $116,317 $232,635 Diesel Fuel 8,398 1,117 $51,454 $102,908
The estimated costs range from $51,454 to $232,635 in 1999 U.S. dollars. Dividing by a factor of 0.726 to account for inflation (Oregon State University, 2013), these costs convert to $70,873 to $320,434 in 2012 U.S. dollars. Finally, these figures can be converted to approximately 250,890 to 1,134,336 Israeli New Shekels (ILS).
These estimates are considered to be reasonable based on the quantities and physical/chemical characteristics of the condensate/diesel fuel. In the scenarios discussed in Sections 4.3.1 and 4.3.2, the impacts would occur to resources in offshore waters, nearshore waters, and to the coastline. In each scenario, coastline impacts tend to be concentrated outside of Israel. It is expected that impacts would occur within 1 to 2 weeks of initial release. Most areas affected, and several specific resources at risk (e.g., oiled birds, oiled heritage sites), would require clean up and restoration in order to recover, particularly on the shoreline.
4.3.4 Solid Waste (Accidental Loss)
The disposal of solid waste from any vessel into the sea is prohibited under MARPOL regulations. Solid waste will be containerized and/or palletized and shipped to shore for proper disposal. However, the accidental loss of solid waste from the drillship or support vessels has the potential to adversely affect several marine resources. Ingestion of, or entanglement with, floating debris accidentally discarded into the marine environment can have a negative impact on marine mammals, sea turtles, and marine and coastal birds, or may be transported to shore where it could affect coastal habitats. Debris sinking to the seafloor can affect benthic communities. Each of these resources is evaluated in the following subsections.
Tamar Field Development Project EIA 228 Noble Energy Mediterranean Ltd March 2016 CSA-Noble-FL-16-2650-08-REP-01-FIN-REV04
4.3.4.1 Sediments/Sediment Quality
Heavy items such as welding rods, buckets, pieces of pipe, etc. may accidentally fall overboard from a drilling unit and accumulate on the seafloor. These may have a minor, localized impact on sediment quality beneath the rig location by creating small areas of hard substrate on the soft bottom seafloor (Shinn et al., 1993; Gallaway et al., 2008). The area affected would be negligible in relation to the seafloor area in the Tamar Field.
4.3.4.2 Water Quality
Lighter pieces of debris may float on the sea surface and adversely affect water quality and marine biota (National Research Council, 2008; National Oceanic and Atmospheric Administration, National Ocean Service, 2013). The potential impacts on water quality from marine debris are expected to be negligible and similar to those from the existing shipping and fishing industries.
4.3.4.3 Benthic Communities
The occasional and accidental loss of debris (e.g., welding rods, buckets, pieces of pipe, etc.) will result in an accumulation on the seafloor. Pieces of debris reaching the seafloor may be colonized by epibiota and attract fishes (due to their physical structure on the otherwise flat seafloor), with a corresponding minor and localized impact to the benthic community (Shinn et al., 1993). Depending on the nature of solid waste, leaching of organics or trace metals may occur, resulting in localized changes in sediment quality. Due to the restrictions on dumping and expected adherence to applicable MARPOL provisions, this impact is anticipated to be minor. Given the likely nature of this impact, overall impact significance is anticipated to be negligible.
4.3.4.4 Marine Mammals and Sea Turtles; Marine and Coastal Birds
Materials accidentally lost overboard during offshore oil and gas operations could 1) entangle marine fauna or 2) cause injury through the ingestion of trash and debris (Laist, 1996). Marine debris is among the threats affecting the population status of both humpback and sperm whales (National Marine Fisheries Service, 1991, 2006). Similarly, ingestion of or entanglement with accidentally discarded debris can kill or injure sea turtles (Laist, 1996; Lutcavage et al., 1997). Marine debris is among the threats affecting the endangered population status of several sea turtle species (National Research Council, 1990). Leatherback turtles are especially attracted to floating debris, particularly plastic bags because they resemble their preferred food: jellyfish. Ingestion of plastic and Styrofoam can result in drowning, lacerations, digestive disorders or blockage, and reduced mobility. Marine debris can also have a negative impact on birds that ingest or become entangled in it.
Impacts on these resources are expected to be low to medium, with a rare to occasional likelihood. As a result, overall impact significance ranges from negligible to medium and is considered low from an overall standpoint.
4.3.4.5 Protected Marine Species and Habitats, Marine Habitats of Interest, and Areas of Special Concern
Surface currents to shore may carry floating debris accidentally lost overboard. Debris accidentally lost overboard, should it reach shore, will produce minor impacts on coastal habitats, including areas where protected marine species and habitats/marine habitats of interest and areas of special concern. Given the occasional nature of this impact, overall impact significance is low.
4.3.4.6 Recreation and Aesthetics/Tourism
Floating marine debris may be carried by surface currents to shore. Debris accidentally lost overboard, should it reach shore, would produce aesthetic impacts and require cleanup. Waste from

Tamar Field Development Project EIA 229 Noble Energy Mediterranean Ltd March 2016 CSA-Noble-FL-16-2650-08-REP-01-FIN-REV04
the offshore oil and gas industry has historically contributed to marine debris on beaches and other shorelines (National Research Council, 2008; U.S. Bureau of Ocean Energy Management, 2012). Due to the distance from shore, it is highly unlikely that floating debris would contact any shorelines in sufficient quantities to affect recreation and tourism and overall impact significance is negligible.
4.4 LIGHT HAZARDS
Potential impacts from lighting on the vessels and drillship associated with the Tamar Expansion Project may affect the resources identified in Table 4-3, which included:
• Sea turtles; and • Marine and coastal birds.
The potential impacts of light from the proposed project are discussed in the following sections. Due to the period of time between projects in the Tamar Field and the minor footprint of the platform, cumulative impacts are anticipated to be negligible.
4.4.1 Sea Turtles
Some sea turtles may be attracted to offshore structures (Rosman et al., 1987; Lohoefener et al., 1990). It has been suggested that sea turtle hatchlings could be attracted to brightly lighted offshore structures, including drillships and platforms, where they may be subject to increased predation by birds and fishes (National Marine Fisheries Service, 2001).
The presence of the drillship lights will be a new light source in the study area; however, the drillship will only be on site for a relatively short period of time (i.e., several months). Impacts on sea turtle populations are likely to be limited, if they occur, to only a few individuals; no population-level impacts are expected. In the Gulf of Mexico, where thousands of offshore structures are present, platform lighting is considered unlikely to appreciably reduce the reproduction, numbers, or distribution of sea turtles (National Marine Fisheries Service, 2001).
Due to the duration of exploratory drilling operations, this impact is anticipated to be minor. Overall impact significance of lighting on sea turtles is low.
4.4.2 Marine and Coastal Birds
The potential causes for the well-documented attraction of seabirds to structures at sea include attraction to lights and the structure itself (Wolfson et al., 1979; Tasker et al., 1986; Baird, 1990; Wiese et al., 2001), as well as to the increased concentration of food sources around the structure (Baird, 1990; Montevecchi et al., 1999). Seabirds use mostly optical cues for migrating between breeding and wintering areas; navigation aids include internal maps, sunlight and sunrise/sunset cues, starlight and celestial navigation, topography, and an internal magnetic compass (Greer et al., 2010). Birds migrating through an environment which is otherwise flat and very dark at night find offshore structures an attractive visual cue. It should be noted that visibility is important in itself, to prevent collisions.
The presence of offshore structures has both a positive and negative impact on birds. The presence of offshore structures, whether permanent (e.g., platforms) or temporary (e.g., drillships, support vessels) may have an effect on bird life both as an attractant as well as a harmful agent (Baird, 1990; Montevecchi et al., 1999; Fraser et al., 2006). Some birds may be attracted to offshore structures because of the lights, as well as the fish populations that aggregate around these structures. Particularly sensitive species would be petrels and other procellariforms that forage on vertically migrating bioluminescent prey.

Tamar Field Development Project EIA 230 Noble Energy Mediterranean Ltd March 2016 CSA-Noble-FL-16-2650-08-REP-01-FIN-REV04
Birds may use offshore structures for resting, feeding, or as temporary shelter from inclement weather (Russell, 2005). However, birds migrating over water at night have been known to strike offshore structures, resulting in death or injury (Wiese et al., 2001; Russell, 2005).
While the bulk of the bird migration over Israel occurs inland, the edge of the migration routes passes over the nearshore portions of the eastern Mediterranean Sea. The radius of the bird monitoring radar located in Latrun, Israel, reaches to approximately 30 km off the shoreline and regularly detects activity up to its margin (Birding Israel, 2013). The bird migration period extends from March to the end of May and from August to the end of November.
Because of the distance between the Tamar Field and shore, it is expected that the project vessels will not be visible to migrating birds that routinely migrate along or near the coast. Consequently, the presence of the project vessels is expected to have a negligible impact on marine (seabirds or migratory) birds. Given the likely nature of this impact, overall impact significance is negligible.
4.5 NOISE IMPACTS
Potential impacts from the Tamar Expansion Project and their associated noise, as identified in Table 4-3, may affect:
• marine mammals; • sea turtles; and • recreation and aesthetics/tourism.
Expected noise levels from various project sources were identified in Chapter 3. Salient characteristics of representative noise sources as they apply to proposed operations include the following:
• Most man-made noise associated with offshore oil and gas drilling operations or support activities are in the low frequency bands (<500 to 1,000 Hz).
• Propeller cavitation, propeller singing, and propulsion machinery are primary noise sources for vessels (regardless of size).
• Drillships (and jack-up drilling rigs) produce sound levels that generally are higher than other drilling vessels (e.g., semi-submersibles) due to the sounds generated through the vessel’s hull or cantilever legs. Noise from a DP drillship would originate primarily from DP thrusters use (for stationkeeping) and machinery (e.g., generators).
• Sound source levels for a drillship are in the range of 184 to 190 dB re 1 µPa at 1 m, depending on activity.
• Supply and crew boats produce sound source levels in the range of 128 to 158 dB re 1 µPa at 1 m; these sound sources are considered transient as they move between the shore base and the drillship; sound from the standby vessel will be at a lower source level while idling on station.
• Underwater sounds from helicopters, as with all aircrafts, reach their highest levels just below the surface and directly under the aircraft. When the aircraft is overhead, sound levels decrease with increasing aircraft altitude or increasing receiver depth. The highest energy of helicopter rotor sound is at frequencies <500 Hz, while helicopter turbines contribute to higher sound levels at frequencies >500 Hz.
• Transmission of airborne sound into the water is a function of source altitude, orientation (e.g., <26° maximizes sound penetration into the water column), receiver water depth and orientation, and sea surface conditions.
Sound emanating from the drillship can be expected to be continuous and variable, with source level fluctuations depending upon activity level. During drilling, source levels are expected to be approximately 184 dB re 1 µPa at 1 m, while during maintenance, source levels are expected to be approximately 190 dB re 1 µPa at 1 m. Maintenance activities include maintaining station, setting of
Tamar Field Development Project EIA 231 Noble Energy Mediterranean Ltd March 2016 CSA-Noble-FL-16-2650-08-REP-01-FIN-REV04
casing, and cementing. Most sound energy will occur in the low frequency bands. Kyhn et al. (2011) measured drillship noise ranging from 20 Hz to >10 kHz, with clearly discernible peaks below 500 Hz noted during drilling. During maintenance, levels were elevated from 20 Hz to well above 10 kHz, with clearly detectable measurements also evident between 20 and 35 kHz at close range to the drillship. The higher frequency sound components were generated as part of the dynamic positioning of the Stena Forth and attributed to transponder use. As noise from the vessel thrusters used during dynamic positioning represents the major source of noise from the drillship, there are differences in sound levels emanating from the vessel between drilling and non-drilling periods. In addition to the thrusters, sound sources include diesel generators, cranes, and crew activity aboard the drillship.
Supply vessels in transit to and from the drillship will produce transient sounds in the 128 to 158 dB re 1 µPa at 1 m range, with predominant low frequency components. If a supply vessel remains on standby (idles) at the drillship, it will produce lower, but continuous sound levels. In similar fashion, transient helicopter visits to the drillship will produce predominantly low-frequency sound source levels of 162 dB re 1 µPa at 1 m, with highest sound levels to be experienced directly below the aircraft.
The Tamar projects have been separated by periods of months to years, making the potential for cumulative impacts very low.
4.5.1 Marine Mammals
Some marine mammals may avoid the project area due to noise associated with drilling operations. Others might be attracted to fish populations around the drillship. The most likely impacts would be short-term behavioral changes such as diving and evasive swimming, disruption of activities, or departure from the area. As resident marine mammals become accustomed to the operation noise, they will return to their routine behavior patterns.
Richardson et al. (1995) defined four zones of potential noise effects on marine mammals. In order of increasing severity, they are 1) audibility; 2) responsiveness (behavioral effects); 3) masking; and 4) hearing loss, discomfort, or injury (physical effects). The levels of sound produced during operations aboard the drillship are sufficient to be audible and to produce behavioral responses, but much lower than those known to cause hearing loss, discomfort, or injury.
Low-frequency noise from engines and equipment, including the drilling rotary table, aboard the drillship can be detected by marine mammals (Richardson et al., 1995). Mysticetes (baleen whales such as the humpback, minke, and Bryde’s whales) are more likely to detect low-frequency sounds than are most odontocetes (toothed whales and dolphins), which have their best hearing in high frequencies. Because of recent, ongoing drilling and installation (i.e., subsea completions, pipelines) operations in the region, marine mammals in the area may have become acclimated to oil and gas operations, vessel transits, and related noise.
Drillship noise will be continuous and of moderate intensity, estimated to be in the range of 184 to 190 dB re 1 µPa. Some of the noise (from support vessel engines and propellers) will be similar to the existing noise associated with shipping traffic in the region, in the range of 128 to 158 dB re 1 µPa.
No absolute sound exposure thresholds exist for marine mammals on a worldwide basis, and few countries have established exposure criteria. Since 1997, the U.S. National Marine Fisheries Service has used generic sound exposure thresholds, based on sound pressure levels (SPLs) expressed in root mean square (rms) metrics, to determine when an activity in the ocean that produces sound might result in impacts to a marine mammal such that a take by harassment might occur. Take, as defined under the U.S. Marine Mammal Protection Act, means “to harass, hunt, capture, collect, or kill, or attempt to harass, hunt, capture, collect, or kill” any marine mammal. Harassment, as defined under the Marine Mammal Protection Act, includes two levels: Level A and Level B harassment. Level A

Tamar Field Development Project EIA 232 Noble Energy Mediterranean Ltd March 2016 CSA-Noble-FL-16-2650-08-REP-01-FIN-REV04
harassment is any act which has the potential to injure a marine mammal or marine mammal stock in the wild. Level B harassment is any act, which has the potential to disturb a marine mammal or marine mammal stock in the wild by causing disruption of behavioral patterns, but does not have the potential to injure a marine mammal or marine mammal stock in the wild. To date, few studies have been conducted that examine impacts to marine mammals from continuous sound (e.g., from drilling) from which empirical sound thresholds have been established.
National Marine Fisheries Service (2013) practice regarding exposure of marine mammals to sound has been based on cetaceans. Cetaceans and pinnipeds exposed to sound pressure levels of 180 and 190 dB re 1 µPa rms or above, respectively, are considered to have been taken by Level A (i.e., injurious) harassment. Thresholds for behavioral response from impulse sounds are 160 dB rms (received level) for all marine mammals, based on behavioral response data for marine mammals exposed to seismic airgun operations (Malme et al., 1983, 1984; Richardson et al., 1986); this threshold is not applicable in the current context.
Behavioral harassment (Level B) is considered to have occurred when marine mammals are exposed to sounds at or above 120 dB rms for continuous sound, but below injurious thresholds; thresholds for behavioral response for “continuous” (non-impulsive) sounds, considered within an SPL context, have been set at 120 dB rms (for some but not all sound sources) based on the results of Malme et al. (1984) and Richardson et al. (1990). Different exposure levels have been established for pinnipeds exposed to airborne sound (i.e., 100 dB [unweighted] for pinnipeds in general; 90 dB [unweighted] for harbor seals), specifically as they pertain to pinniped disturbance (e.g., from haul-outs); these latter exposure criteria are not applicable in this context, as no pinniped or pinniped haul-outs occur near the Tamar Field. Under previous criteria, the applicable exposure threshold for drilling operations is 180 dB re 1 µPa (rms) for injury and 120 dB re 1 µPa (rms) for behavioral disturbance, using the SPL metric.
NOAA recently (December 2013) issued new acoustic exposure guidelines (National Marine Fisheries Service, 2013). While currently in the review and comment stage and not yet finalized, new acoustic exposure criteria, in general, consider two metrics upon which to assess potential for impact – peak SPL and cumulative sound exposure level (SELcum). However, sound exposure containing transient components (e.g., short duration and high amplitude; impulsive sounds) can create a greater risk of causing direct mechanical fatigue (as opposed to strictly metabolic) to the inner ear compared to sounds that are strictly non-impulsive (Henderson and Hamernik, 1986; Levine et al., 1998; Henderson et al., 2008). NOAA noted that the risk of damage from these transients often does not depend on the duration of exposure (e.g., concept of “critical level,” where damage switches from being primarily metabolic to more mechanical; short duration of impulse can be less than the ear’s integration time, leading to the potential to damage beyond the level the ear can perceive). Thus, the cumulative sound exposure level is not an appropriate metric to capture these effects.
Support vessel sound sources are below the threshold for injury (i.e., only the potential for behavioral response exists). Only DP thruster noise from a DP drillship exceeds the 180 dB threshold for injury. All project sound sources have the potential to produce behavioral response. The calculated distances from each source to the thresholds for injury and behavioral response are provided in Table 4-8.
The degree to which underwater sound propagates away from a sound source is dependent on a variety of factors, the most important of which are bathymetry and presence or absence of reflective or absorptive conditions (e.g., in-water structures, sediments). Spherical spreading occurs in a perfectly unobstructed (i.e., free-field) environment not limited by depth or water surface, resulting in a 6 dB reduction in sound level for each doubling of distance from the source (20log[range]). Because the drillship used for the Tamar projects will be operating in open ocean conditions, spherical spreading criteria are most appropriate to calculate distances to threshold.

Tamar Field Development Project EIA 233 Noble Energy Mediterranean Ltd March 2016 CSA-Noble-FL-16-2650-08-REP-01-FIN-REV04
Table 4-8. Sound sources associated with the drilling program and calculated distances to the applicable exposure threshold for injury and behavioral response.
Sound Source Source Levels (dB re 1 µPa at 1 m)
Applicable Sound Exposure Threshold (dB re 1 µPa rms) –
Injury
Applicable Sound Exposure Threshold (dB re 1 µPa rms) –
Behavioral Response
Distance from Source to Threshold (m)
Injury Behavior
Continuous Sound Sources Drilling and Maintenance
Drillship 184-190 180 120 1.6-3.2 1,585-3,162 Transient Sound Sources
Vessels Underway Supply vessel 128-158 180 120 0 2.5-74.9 Crew boat 156 180 120 0 63.1
Aircraft Bell 212 helicopter 162 180 120 0 125.9
The potential for injury from sound exposure is extremely low. Sound sources sufficiently high to cause injury are only associated with the drillship. Calculated distances noted in Table 4-8 indicate that marine mammals would have to be within 1.6 to 3.2 m of the DP thrusters to experience injury. It is extremely unlikely that marine mammals will approach this close to an operational thruster.
Based on calculations presented in Table 4-8, marine mammals (i.e., mysticetes) within 1,585 to 3,162 m of the drillship may experience behavioral disturbance from drilling- or maintenance-related noise. Similarly, marine mammals (i.e., mysticetes) within 2.5 to 74.9 m of transiting vessels may experience behavioral disturbance. In either case, marine mammals will hear the sound source prior to any exposure to these source levels; they may respond by changing course or diving, thus avoiding or minimizing any further exposure.
Due to the duration of exploratory drilling operations, the nature of the project-related sound sources, and the calculated radial distances from source to threshold levels, this impact is anticipated to be minor. Given the likely nature of this impact, overall impact significance is low.
4.5.2 Sea Turtles
Some sea turtles may be attracted to offshore structures (Rosman et al., 1987; Lohoefener et al., 1990). It has been suggested that sea turtle hatchlings could be attracted to brightly lighted offshore structures, including drillships and platforms, where they may be subject to increased predation by birds and fishes (National Marine Fisheries Service, 2001) and may be subject to noise exposure from the drillship.
Sound exposure criteria for marine mammals historically have been applied to sea turtles. Based on calculations presented in Table 4-8, sea turtles within 1.6 to 3.2 m and 1,585 to 3,163 m of the drillship may experience injury or behavioral disturbance, respectively, from drilling-related noise. Similarly, sea turtles within 2.5 to 74.9 m of transiting vessels may experience behavioral disturbance. Sea turtles within 126 m of transiting helicopters may experience behavioral disturbance when helicopters are directly overhead. As was the case with marine mammals, sea turtles will hear the sound source prior to any exposure to these source levels; they may respond by changing course or diving, thus avoiding or minimizing any further exposure.
The drillship will only be on site for a relatively short period of time (i.e., several months), limiting the potential for noise exposure. Due to the duration of exploratory drilling operations, when coupled with the nature of the project-related sound sources and the calculated radial distances from source to

Tamar Field Development Project EIA 234 Noble Energy Mediterranean Ltd March 2016 CSA-Noble-FL-16-2650-08-REP-01-FIN-REV04
threshold levels, this impact is anticipated to be minor. Noise from approaching vessels and aircrafts are expected to elicit an avoidance response. Given the likely nature of this impact, overall impact significance is low.
4.5.3 Recreation and Aesthetics/Tourism
Offshore structures (e.g., platforms, drillships) typically are visible 5 to 16 km from shore, with small structures barely visible at 5 km. On a clear night, lights on top of offshore structures may be visible to a distance of approximately 32 km (U.S. Minerals Management Service, 2007a,b). Because the Tamar Field is located approximately 90 km west of Haifa, the drillship will not be visible from shore.
Supply vessels and helicopters will periodically transit between Haifa and the Tamar Field projects. During those periods when vessels and aircraft are close to shore, they will be visible to coastal visitors involved in recreation and tourism. The Port of Haifa is one of Israel’s busiest ports. Tourists and those involved in coastal recreation will experience a variety of vessel traffic, including tankers, cargo vessels, cruise ships, and a diverse assortment of smaller watercrafts. The periodic transit of supply vessels and aircrafts does not represent a unique or unexpected event. Impacts on nearshore recreational activities, aesthetics, and tourism are expected to be negligible. With the possible exceptions of fishing and deepwater yachting, it is expected that no recreational activities will be conducted in the vicinity of or near the Tamar Field. Given the likely nature of this impact, overall impact significance is negligible.
4.6 NATURE AND ECOLOGY IMPACTS
Nature and ecology impacts are discussed in this section, which includes the following resources as identified in Table 4-3:
• Sediments and sediment quality; • Water quality; • Plankton, fish, and fishery resources; • Benthic communities; • Marine mammals and sea turtles; • Marine and coastal birds; and • Protected species/habitats.
These potential impacts are discussed under the relevant sections below, including potential cumulative impacts as applicable. Impacts from WBM mud and cuttings discharges are discussed to support the evaluation of potential cumulative impacts; no discharges of mud or cuttings are proposed for the Tamar Field Development Project.
4.6.1 Sediments and Sediment Quality
Activities at the Tamar Field may impact sediments and sediment quality, as identified in Table 4-3, by the following:
• Drilling (including the release/discharge of drill muds and cuttings); • Installation activities; and • Physical presence.
4.6.1.1 Drilling (including the release/discharge of drill muds and cuttings)
WBM Mud and Cuttings Discharge Impacts on Sediment and Sediment Quality
WBM mud and cuttings were discharged for the previous Tamar wells. The impacts of these discharges are discussed here, using literature and the results of the Tamar surveys to predict impacts.

Tamar Field Development Project EIA 235 Noble Energy Mediterranean Ltd March 2016 CSA-Noble-FL-16-2650-08-REP-01-FIN-REV04
Seafloor releases of WBM and associated drill cuttings will create a mound with a diameter of several meters to tens of meters around the wellbore. Also, during setting of the casing, cement slurry will be pumped into the well to bond the casing to the walls of the hole. Excess cement slurry will emerge from the hole and accumulate on the seafloor, typically within 10 to 15 m of the wellbore (Shinn et al., 1989). Cement slurry components include cement mix and some of the same chemicals used in WBM (Boehm et al., 2001). These releases will alter the sediment quality near the well location. Eventually, sediments will return to baseline conditions due to normal sediment movement, remixing of sediments by benthic organisms, and sediment deposition from the water column.
WBM and associated drill cuttings discharged from the drilling unit will accumulate on the seafloor, possibly resulting in changes in bottom contours, grain size, barium concentrations, and concentrations of other metals (National Research Council, 1983; Boothe and Presley, 1989; Neff, 1987, 2005, 2010). Because of the water depth, only a thin layer of deposition is expected and detectable changes may be limited to within a few hundred meters around each well.
Barite (barium sulfate) is a major insoluble component of drilling fluid discharges, and barium concentrations will increase in bottom sediments around the well. Concentrations of other metals in drilling fluids are similar to those in marine sediments, but some metals such as cadmium, copper, lead, mercury, and zinc may be elevated within a few hundred meters of the well (Boothe and Presley, 1989).
Predictive modeling of the WBM discharge was performed for a site offshore Cyprus (MUDMAP; RPS-ASA, 2013) to estimate the accumulation of mud and associated drill cuttings on the seafloor as well as their dispersion in the water column. The site is similar to sites in the Tamar Field and the results are indicative of impacts expected to have occurred during the drilling of previous wells in the Tamar Field. Two discharge scenarios were modeled: October to January and July to September. Table 4-9 summarizes the areal extent of deposition for each scenario.
Table 4-9. Areal extent and distance of water-based muds and cuttings seafloor deposition from a surface location for two scenarios (October to January and July to September) (From: RPS-ASA, 2013).
Deposition Thickness
(mm)
October to January July to September Cumulative Area Exceeding this Thickness (ha)
Maximum Distance (m)
Cumulative Area Exceeding this Thickness (ha)
Maximum Distance (m)
0.1 57.651 618 57.788 634 1 1.368 82 1.648 85
6.3 0.439 42 0.479 42 10 0.409 38 0.399 39 54 0.19 28 0.20 27
100 0.15 23 0.14 22 200 0.07 17 0.07 17
Beyond 600 m from a potential well location, modeling predicts a depositional accumulation of 0.1 mm or less from a WBM discharge, which may not be detectable and may have little or no impact on benthic communities. A deposition thickness of 1 mm may extend for approximately 85 m around the wellsite, covering an area of approximately 2.3 ha. The total area potentially covered by 1 mm of deposition for the seven wells that have been drilled to date would equate to approximately 16 ha.
While there are low levels of metals in the WBM and associated drill cuttings accumulations, the metals in drilling fluids show very low bioavailability to marine animals and do not pose a risk to benthic organisms or their predators (Neff et al., 1989a,b).

Tamar Field Development Project EIA 236 Noble Energy Mediterranean Ltd March 2016 CSA-Noble-FL-16-2650-08-REP-01-FIN-REV04
A survey of the Tamar Reservoir Area conducted in 2013 and 2014 (CSA Ocean Sciences Inc., 2014) found that the seafloor within the survey area was relatively flat and generally undisturbed, except for some highly localized (within 10 m) visual evidence of seafloor disturbance near existing infrastructure. The survey did identify some possible residual petrogenic hydrocarbon contamination in the area of the platforms; however, the concentrations were well below concentrations of concern – individual PAH concentrations were between 1 and 12 ppb. Barium concentrations also were elevated in seafloor sediments at a few locations. While barium is an indicator of development activity, it is not toxic to marine organisms; therefore, its potential for environmental impact is insignificant.
Due to the limited and minor impacts of the depositional thickness, the size of the Tamar Reservoir Area, and the limited benthic infauna, the current and cumulative impact of the discharge of WBM mud and cuttings is considered to be of low to negligible impact.
WBM and MOBM Mud and Cuttings Discharge Impacts on Sediment and Sediment Quality
While the proposed Tamar Field Development Project will not discharge MOBM drilling fluids, Noble Energy has requested approval to discharge MOBM-associated cuttings. The WBM from the initial well sections will be discharged also. It should be noted that there is no difference in the amount of barite used for MOBM versus WBM drilling fluids (personal communication, TWMA 2015).
To support their request to discharge MOBM-associated cuttings from drilling in the Leviathan Field, Noble Energy contracted RPS-ASA (2014) to model the MOBM-associated cuttings discharges from proposed wells in the Leviathan Field (Leviathan-9 and 9 ST01) based on the use of WBM for the initial well sections and MOBM for the deeper well sections (Appendix H). The site of the modeled well is approximately 9 to 19 km from the proposed Tamar wellsites. Because the proposed Leviathan and Tamar wells are similar enough in design, depth, drilling fluid system, solids control procedures, physical oceanography, and location the Leviathan modeling results may be considered representative of Tamar cuttings discharges. The RPS-ASA MUDMAP model was used to predict the transport of solid releases in the marine environment and the resulting seafloor deposition and is described in the report (Appendix H). Discharge simulations were run to examine the dispersion of mud and drill cuttings during two different seasonal periods: Scenario 1 (December to February) and Scenario 2 (July to September). The later period is characterized by substantially stronger currents in the upper water column. For each period, the MUDMAP model was applied to predict the deposition associated with each phase of drilling and the cumulative seafloor impact of all drilling discharges.
Time-stamped current measurements from a mooring in the Leviathan Field (mooring site LV1-1) located 13 to 18 km from the proposed Tamar wellsites were used for modeling. The data were combined to represent 13 vertical layers through the water column. Vertically and time varied currents for two potential drilling periods (beginning in December and July, respectively) were subset from the full dataset and used as forcing for the MUDMAP simulations. Following a qualitative review, data from deployments in 2013 and 2014 were selected for use in the dispersion model due to more frequent instrument malfunction and/or missing data during earlier periods. A series of processing steps were used to resample currents to a common (1-hour) time step; flagged or missing data for periods less than 10 hours were interpolated.
Figure 4-7 shows the current profile of the modeled site along with the annual current distribution by depth, and Figure 4-8 shows the average current speeds used in the modeling efforts. Table 4-10 shows the composition of the discharged fluids used for the modeling.
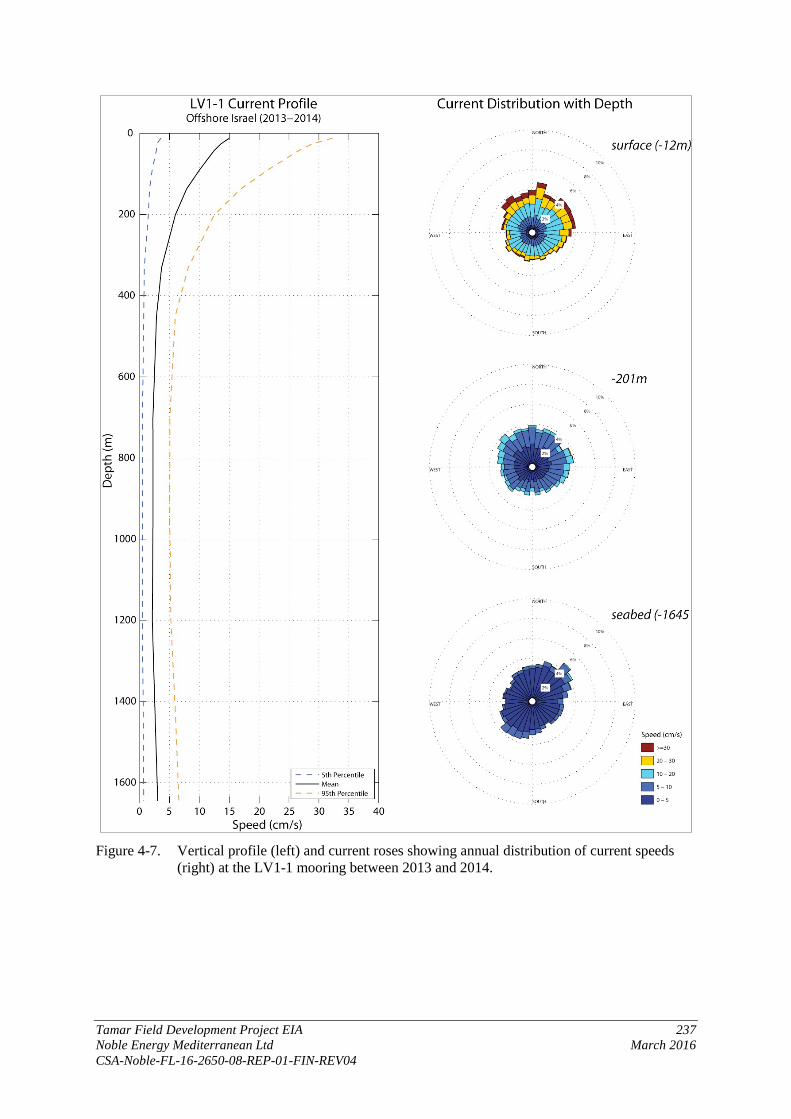
Tamar Field Development Project EIA 237 Noble Energy Mediterranean Ltd March 2016 CSA-Noble-FL-16-2650-08-REP-01-FIN-REV04
Figure 4-7. Vertical profile (left) and current roses showing annual distribution of current speeds
(right) at the LV1-1 mooring between 2013 and 2014.
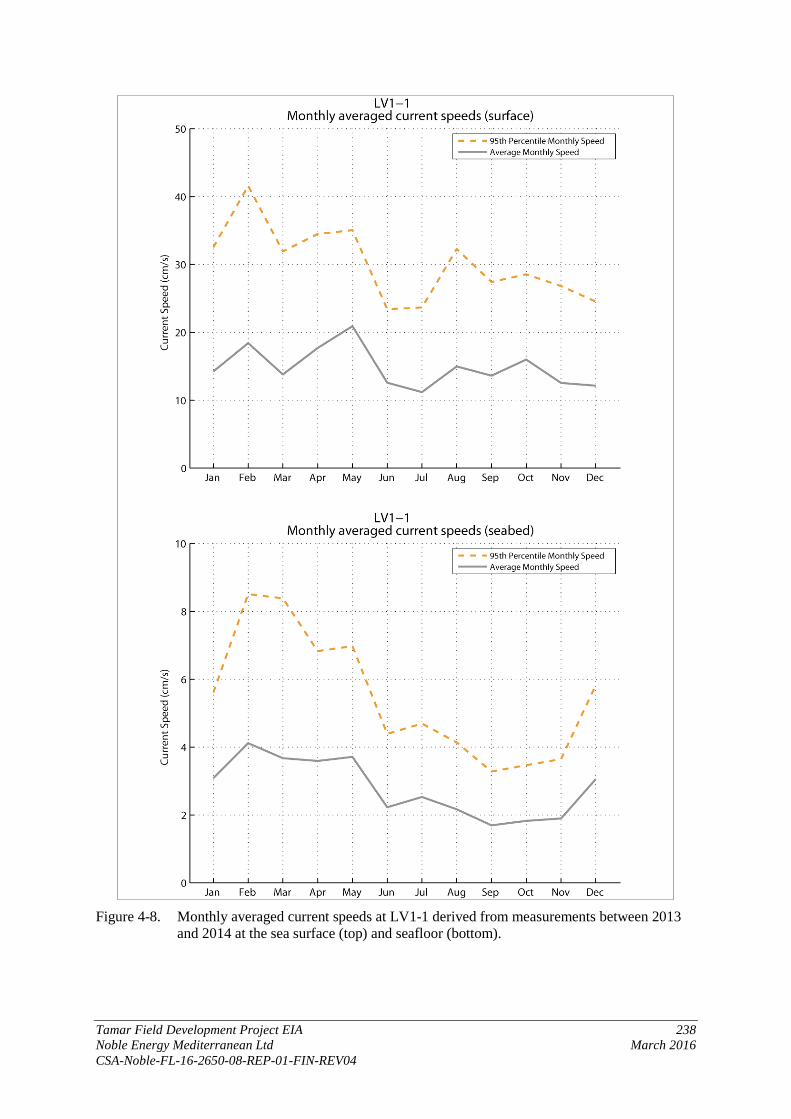
Tamar Field Development Project EIA 238 Noble Energy Mediterranean Ltd March 2016 CSA-Noble-FL-16-2650-08-REP-01-FIN-REV04
Figure 4-8. Monthly averaged current speeds at LV1-1 derived from measurements between 2013
and 2014 at the sea surface (top) and seafloor (bottom).

Tamar Field Development Project EIA 239 Noble Energy Mediterranean Ltd March 2016 CSA-Noble-FL-16-2650-08-REP-01-FIN-REV04
Table 4-10. Composition of drilling discharges used for modeling (WBM formulations based on Leviathan-5; data provided by Noble Energy).
Discharged Material Bulk Density (ppg) Bulk Density (kg m-3)
Percent Solid by Weight
Average SG of Solid Fraction
WBM cuttings (section 1-2) 22.1 2,650 100 2.65
WBM (section 1) 8.6 1,030 22 4.48 WBM (section 2) 12.5 1,500 22 4.48 MOBM cuttings
(section 3-6) 20.9 2,500 100 2.5
MOBM = mineral oil-based mud; ppg = pounds per gallon; SG = specific gravity; WBM = water-based mud.
Tables 4-11, 4-12, and 4-13 present the settling velocities of WBM cuttings, WBM and MOBM cuttings used for the 2 simulations.
Table 4-11. Water-based mud (WBM) cuttings settling velocities used for simulations (Brandsma and Smith, 1999).
Size Class Percent Volume Settling Velocity
(cm s-1) (m d-1) 1 8.00 1.350E-04 0.12 2 6.00 1.686E-03 1.46 3 7.00 2.182E-02 18.86 4 3.00 2.328E-01 201.14 5 2.00 1.447E+00 1,250.37 6 18.00 4.011E+00 3,465.65 7 16.00 9.796E+00 8,463.98 8 15.00 1.352E+01 11,679.45 9 25.00 2.598E+01 22,442.45
Table 4-12. Water-based mud (WBM) settling velocities used for simulations.
Mud Particle Size (microns) Percent Volume Settling Velocity
(cm s-1) (m d-1) 1 26.8 0.000108 0.093312 2 6.8 0.000431 0.372384 3 5 0.00097 0.83808 4 5.6 0.001724 1.489536 6 6 0.003878 3.350592 8 6.6 0.006894 5.956416 11 7.2 0.013 11.232 16 7.8 0.0276 23.8464 22 4 0.0521 45.0144 26 3.92 0.0728 62.8992 31 3.72 0.1035 89.424 37 3.39 0.1475 127.44 44 2.94 0.2086 180.2304 53 2.41 0.3026 261.4464 63 1.86 0.4276 369.4464 74 1.36 0.5899 509.6736 88 0.97 0.8342 720.7488
105 0.72 1.188 1,026.432

Table 4-12 (Continued).
Tamar Field Development Project EIA 240 Noble Energy Mediterranean Ltd March 2016 CSA-Noble-FL-16-2650-08-REP-01-FIN-REV04
Mud Particle Size (microns) Percent Volume Settling Velocity
(cm s-1) (m d-1) 125 0.59 1.683 1,454.112 149 0.55 2.392 2,066.688 177 0.55 2.997 2,589.408 210 0.52 3.617 3,125.088 250 0.43 4.381 3,785.184 297 0.28 5.296 4,575.744
Table 4-13. Thermomechanical cuttings cleaner-treated mineral oil-based mud (MOBM) cuttings settling velocities used in the modeling.
Size Class Percent Volume Settling Velocity
(cm s-1) (m d-1) 0.399 0.560 0.00001 0.00637 0.502 1.900 0.00001 0.01009 0.632 2.920 0.00002 0.01599 0.796 3.630 0.00003 0.02537 1.002 4.010 0.00005 0.04020 1.262 4.200 0.00007 0.06377 1.589 4.390 0.00012 0.10109 2.000 4.600 0.00019 0.16015 2.518 4.690 0.00029 0.25385 3.170 4.520 0.00047 0.40233 3.991 4.080 0.00074 0.63772 5.024 3.480 0.00117 1.01056 6.325 2.870 0.00185 1.60172 7.962 2.410 0.00294 2.53810
10.024 2.190 0.00466 4.02297 12.619 2.150 0.00738 6.37550 15.887 2.240 0.01170 10.10528 20.000 2.410 0.01854 16.01490 25.179 2.640 0.02938 25.38290 31.698 2.950 0.04656 40.22797 39.905 3.320 0.07379 63.75569 50.238 3.700 0.11700 101.04830 63.246 3.970 0.18540 160.15130 79.621 4.050 0.29380 253.81630
100.237 3.890 0.46560 402.27260 126.191 3.570 0.73790 637.56010 158.866 3.220 1.17000 1010.47700 200.000 2.940 1.85400 1601.49000 251.785 2.770 2.44700 2113.80600 316.979 2.570 3.15200 2723.11400 399.052 2.090 4.06000 3508.04200 502.377 1.060 5.23100 4519.23600 563.677 0.010 5.93700 5129.39000
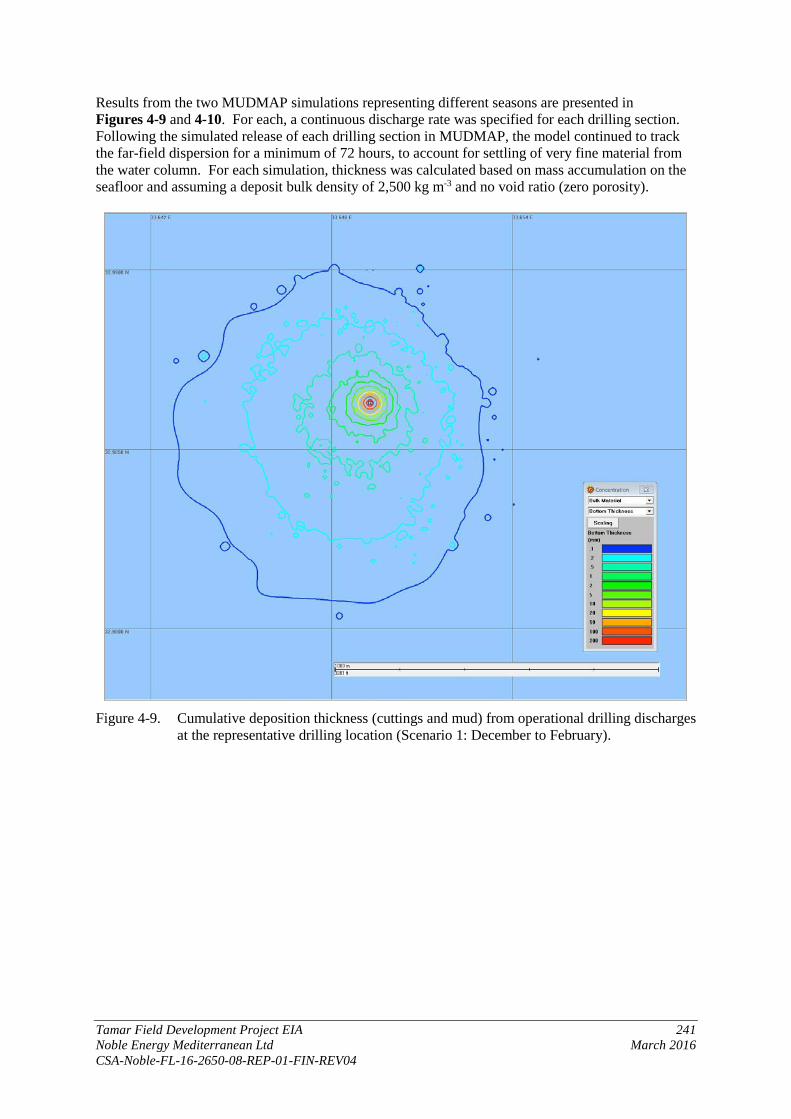
Tamar Field Development Project EIA 241 Noble Energy Mediterranean Ltd March 2016 CSA-Noble-FL-16-2650-08-REP-01-FIN-REV04
Results from the two MUDMAP simulations representing different seasons are presented in Figures 4-9 and 4-10. For each, a continuous discharge rate was specified for each drilling section. Following the simulated release of each drilling section in MUDMAP, the model continued to track the far-field dispersion for a minimum of 72 hours, to account for settling of very fine material from the water column. For each simulation, thickness was calculated based on mass accumulation on the seafloor and assuming a deposit bulk density of 2,500 kg m-3 and no void ratio (zero porosity).
Figure 4-9. Cumulative deposition thickness (cuttings and mud) from operational drilling discharges
at the representative drilling location (Scenario 1: December to February).

Tamar Field Development Project EIA 242 Noble Energy Mediterranean Ltd March 2016 CSA-Noble-FL-16-2650-08-REP-01-FIN-REV04
Figure 4-10. Cumulative deposition thickness (cuttings and mud) from operational drilling discharges
at the representative drilling location (Scenario 2: July to September).
Table 4-14 shows the distance from the discharge point impacted by different depositional thicknesses, and Table 4-15 lists the area of seafloor impacted by various depositional thicknesses.
Table 4-14. Maximum extent of thickness contours (by distance from release site) for each model scenario for the Leviathan-9 and 9 ST01 wells. Burial thresholds from Smit et al. (2008) are shown in bold.
Deposition Thickness (mm) Maximum Extent From Discharge Point (m)
Scenario 1* Scenario 2** 0.1 676 775 1 136 149
6.3 54 55 10 45 47 54 27 27
100 20 21 200 11 11
*Scenario 1: December to February. **Scenario 2: July to September.
Tamar Field Development Project EIA 243 Noble Energy Mediterranean Ltd March 2016 CSA-Noble-FL-16-2650-08-REP-01-FIN-REV04
Table 4-15. Areal extent of seafloor deposition (by thickness interval) for each model scenario for the Leviathan-9 and 9 ST01 wells. Burial thresholds from Smit et al. (2008) are shown in bold.
Deposition Thickness (mm) Cumulative Area Exceeding (km2)
Scenario 1* Scenario 2** 0.1 0.7309 0.6913 0.2 0.3316 0.3365 0.5 0.0951 0.0958 1 0.0327 0.0348 2 0.0159 0.0158 5 0.0090 0.0092
6.3 0.0079 0.0080 10 0.0060 0.0061 20 0.0041 0.0041 50 0.0023 0.0023 54 0.0021 0.0021
100 0.0012 0.0012 200 0.0003 0.0003
*Scenario 1: December to February. **Scenario 2: July to September.
The majority of the deposition is predicted to occur in the immediate vicinity of the discharge point, with depositions of up to 200 mm occurring out to 11 m from the discharge and covering approximately 0.0003 km2. A deposition of 1 mm is predicted to occur out to 136 to 149 m from the discharge and cover an area of 0.0327 to 0.0348 km2.Approximately 69% of the ESCAID 110 is expected to biodegrade in 28 days (Noble Energy, 2014). Due to this and the small area of significant depositional thicknesses, the discharge of WBM and MOBM-associated cuttings will have a limited impact on the sediments and sediment quality in the vicinity of the drillsites. Recovery of the relatively small areas that are impacted could take several years. Overall impact significance is medium based on the likely occurrence of the discharge and the medium impact consequence.
4.6.1.2 Installation Activities
Emplacement of the pipelines, MEG lines, control lines, and utility lines will disturb surficial sediments, causing increased localized turbidity, possible mobilization, transport of sediment-associated contaminants, and crushing and/or burial of benthic communities near the pipeline corridor. Impacts on water quality, sediment quality, and benthic communities are expected to be minor. Given the short duration of this activity, overall impact significance is low.
4.6.1.3 Physical Presence
Either a moored semisubmersible drilling unit or a DP drillship will be utilized for the Tamar Field projects. If a DP drillship is used, no anchors will be required and no impacts to the seafloor will occur. Moored semisubmersible drilling units typically are held in place by eight anchors with steel chains and cables. Each anchor is estimated to disturb an area of approximately 35.5 m2, for an approximate total of 284 m2 (0.03 ha). When the anchor is initially deployed and then tensioned, approximately 1,200 m of the total length of anchor chain is estimated to be in contact with the seafloor, and the chain is assumed to “sweep” a width of 5 m along that length, for an approximate total area of 0.6 ha for each chain or 4.8 ha for eight chains. The total area disturbed by anchors and chains would be dependent on the mooring pattern needed to secure the semisubmersible drilling unit. The anchors, chains, and cables will affect only a portion of the anchoring radii, even when laid on the seafloor. Cables and chains will be resting on the seafloor during the installation; once the rig is on location, cables are pulled taut towards the rig. The cables and chains will sweep the soft sediments
Tamar Field Development Project EIA 244 Noble Energy Mediterranean Ltd March 2016 CSA-Noble-FL-16-2650-08-REP-01-FIN-REV04
of the seafloor, but will not cross any sensitive features, as there will be exclusion zones if any such features are identified in the high-resolution side-scan sonar survey.
If a moored drilling unit is utilized, anchor or cable scars created during the drilling program will likely remain on the seafloor for months to years (Shinn et al., 1993). In a study of wellsites on the U.S. Gulf of Mexico continental slope, Continental Shelf Associates, Inc. (2006) detected anchor scars up to 14 years after drilling was completed. However, these features will disappear eventually as sediments are redistributed by currents and reworked by benthic organisms.
Pipelines, MEG lines, control lines, and utility lines will be installed by a DP pipelaying or similar vessel. Lines will be placed on the seafloor along the pipeline and utility line routes. Emplacement of the pipelines, MEG lines, control lines, and utility lines will disturb surficial sediments, causing increased localized turbidity, possible mobilization, transport of sediment-associated contaminants, and crushing and/or burial of benthic communities near the pipeline corridor. Given the short duration and limited area of this impact, overall impact significance is low.
4.6.2 Water Quality
Activities at the Tamar Field may have an impact on water quality due to the following as identified in Table 4-3:
• Drillship arrival, departure and stationkeeping; • Drilling (including the release/discharge of drill muds and cuttings); • Routine (non-drilling related) discharges; • Installation vessel arrival, operation, and departure; or • Installation activities.
These potential impacts are discussed in the following sections.
4.6.2.1 Drillship Arrival, Departure, and Stationkeeping
During transit to and from the project area, the drilling unit and support vessels will discharge treated sewage, domestic waste, and deck drainage. Sewage will pass through a sewage treatment plant prior to discharge. Domestic wastes (gray water) will be discharged without treatment, except for food waste, which will be macerated to pass through a 25-mm mesh. Deck drainage from machinery areas will pass through an oil-water separator prior to discharge or retained on board to be disposed of onshore. These discharges would be similar to those from other ships in the region. It is expected that the discharges would dilute rapidly in the water and not be detectable beyond the immediate vicinity of the vessel(s). As a result, the overall impact significance is negligible.
4.6.2.2 Drilling (including the release/discharge of drill muds and cuttings)
Release of drilling muds and cuttings from the wellbore during the initial stages of drilling will produce increased turbidity within the lower portions of the water column around the drillsite. This localized and short-term reduction in water quality will end shortly after completion of the upper well sections and installation of the BOP and riser.
When WBM and cuttings are discharged to the ocean (e.g., from a drilling unit), the larger particles and flocculated solids, representing approximately 90% of the mass of mud solids, form a plume that settles quickly to the bottom. The remaining 10% of the mass of the mud solids consisting of fine-grained unflocculated clay-sized particles and a portion of the soluble components of the mud from another plume in the upper water column that drifts with prevailing currents away from the discharge point and dilutes rapidly in the receiving waters (Neff, 2005).
Tamar Field Development Project EIA 245 Noble Energy Mediterranean Ltd March 2016 CSA-Noble-FL-16-2650-08-REP-01-FIN-REV04
Muds and cuttings will be expelled continuously from the wellbore during drilling of the 36 in. and 26 in. sections. Due to their size and weight, cuttings are expected to fall quickly to the seafloor as deposits near the wellbore, while drilling muds will remain suspended for a longer period. Because the drilling fluids have a density greater than that of ambient seawater, suspended muds will tend to collapse into the benthic boundary layer, the latter of which may be 1 m or more in thickness (Wimbush and Munk, 1970; Richards, 1990). Due to current shear and turbulence in the boundary layer, suspended muds will tend to stay in suspension above the seafloor. Dimensions of the mud plume will be dictated by the degree of initial dilution in surrounding seawater and ambient currents at depth. As the mud plume is advected away from the wellbore by benthic currents, its diameter will continue to grow and mud concentrations will decrease due to dispersion and mixing. Estimates of seafloor release of muds and cuttings presented by AMEC (2011) indicate that the turbidity plume generated from the release will be visible as small clouds of fine particles in the benthic boundary layer, and may extend several hundred to several thousand meters from the wellbore.
Drilling fluid and cuttings releases at the wellbore will produce a visible plume that will move with the currents as these materials are diluted and settle to the seafloor. Turbid water may extend between a few hundred meters and several kilometers down current from the discharge point. Given the continuous nature of this release, the turbidity plume from the wellbore will be present during jetting and drilling; the plume will persist for several hours after completion of the 26 in. section.
While few studies have been conducted regarding releases of drilling muds and cuttings at the wellbore, studies of surface discharges have demonstrated reductions in water clarity within a few hundred meters to approximately 2 km of drilling units (Ayers et al., 1980a,b; Ray and Meek, 1980). Neff (2010) reported that field studies of WBM and cuttings discharges in temperate and cold water environments exhibit up to a 30-fold dilution in the discharge pipe; within 30 m of the discharge, the muds and cuttings discharge can be expected to dilute an additional 1,000- to 3,000-fold. Dispersion to background levels typically requires several minutes to several hours (Neff, 1987). Depending upon near-bottom currents (i.e., velocity), releases of muds and cuttings at the wellbore may be expected to produce a turbidity plume which will extend several hundred meters from the drillsite.
The results of the Tamar Field Background Monitoring Survey (CSA Ocean Sciences Inc., 2014) indicate that water quality within the survey area has not been persistently impacted by drilling activities or infrastructure development.
Water quality impacts of MOBM cuttings discharges are expected to be less than those of WBM because 1) MOBM cuttings are treated using additional equipment (thermomechanical cuttings cleaner) to recover and recycle as much mud as practicable, and therefore the amount of mud (fine particles) discharged with cuttings is reduced; and 2) MOBM tends to adhere tightly to the cuttings particles, and they would not be expected to produce much turbidity as the cuttings sink through the water column (Neff et al., 2000). Discharges of treated MOBM cuttings may produce temporary, localized increases in suspended solids in the water column around the drilling rig. As noted in Section 4.6.1, there would be no difference in the amount of barite used in the mud system regardless of whether MOBM or WBM is used.
Turbidity effects will be localized; the total area affected by increases in water column turbidity will be limited to several hundred meters around the drillsite. The impact consequence of changes to water quality is minor. Given the localized nature of this impact and its likely occurrence, overall impact significance is anticipated to be low. Due to the time periods between drilling the wells and the transient nature of the potential impacts of drilling discharges on water quality, cumulative impacts are unlikely and not expected.
4.6.2.3 Routine (Non-Drilling Related) Discharges
Routine discharges will include treated sanitary and domestic wastes, water-maker brine, cooling water, and organic waste originating from the drillship and support vessels. Support vessels,

Tamar Field Development Project EIA 246 Noble Energy Mediterranean Ltd March 2016 CSA-Noble-FL-16-2650-08-REP-01-FIN-REV04
including the AHTS vessels, may discharge sanitary and domestic wastes and small amounts of runoff water (i.e., deck drainage).
Sanitary waste consists of human body wastes from toilets and urinals. Sanitary wastes will be treated by means of marine sanitation devices that produce an effluent with a minimum residual chlorine concentration of 1.0 mg L-1 and no visible floating solids or oil and grease. Sanitary waste will be discharged periodically at an estimated rate of 10 to 14 m3 d-1. Additional details regarding sanitary waste processing are provided previously in Chapter 3.
Domestic waste, or “gray water,” includes water from showers, sinks, laundries, galleys, safety showers, and eye-wash stations. Aside from screening to remove solids, domestic waste does not require treatment before discharge. Domestic waste will be discharged periodically at an estimated rate of 20 to 24 m3 d-1.
Freshwater on a drillship may be generated using RO water makers. Under normal operating conditions, the number of RO units operating depends on demand. On the Atwood Advantage, the maximum feed water flow rate through the units is 380 m3 d-1, with a maximum brine discharge flow rate of 318 m3 d-1. The excess seawater being discharged does not contain any added chemicals.
Cooling water is used to control and maintain proper temperatures on internal combustion engines aboard the drillship and project vessels. Cooling water discharge effluent should result in a temperature increase of no more than 3°C at the edge of the zone where initial mixing and dilution take place, typically within 100 m of the discharge source.
Organic waste (i.e., food waste) will be ground prior to discharge in accordance with Annex V of MARPOL 73/78 requirements. Aside from grinding to <25 mm particle size, no other treatment of organic wastes is expected. Organic waste will be discharged periodically at an estimated rate of 100 to 150 kg d-1.
Sanitary, domestic, and organic waste from the drillship and support vessels may affect concentrations of suspended solids, nutrients, and chlorine in the water column as well as generate increases in biological oxygen demand. Brine and cooling water discharges will produce localized increases in salinity and water temperature, respectively. However, these discharges are expected to dilute rapidly in the open ocean (U.S. Environmental Protection Agency, 1993; U.S. Minerals Management Service, 2007a). Impacts likely would be undetectable beyond tens of meters from the source. Due to the nature of routine discharges and their dilution in the receiving environment, impacts to water quality are expected to be minor. Given the likely nature of this impact, overall impact significance is low.
Deck drainage consists of all waste resulting from rainfall, equipment and deck washings, tank-cleaning operations, and runoff from curbs and gutters, including drip pans and work areas. Vessels are designed to contain runoff and prevent oily drainage from being discharged. The flow is diverted to separation systems depending on the area collected. Measures will be taken to prevent any discharge of free oil in deck drainage that would cause a film, sheen, or discoloration of the surface of the water or a sludge or emulsion to be deposited beneath the surface of the water. Only non-oily water (no visual sheen) will be discharged overboard. If the deck becomes contaminated, oily deck drainage will be contained by absorbents or collected with a pollution pan for recycling and/or disposal. Because of the separation and treatment of water from oily areas prior to discharge, deck drainage is not expected to produce a visible sheen or any other detectable impacts on water quality.
Additional miscellaneous discharges typically occur from numerous sources on project vessels. Examples include uncontaminated freshwater and seawater used for cooling water, ballast water, fire test water, desalination unit discharges, and boiler blowdown discharges (U.S. Environmental Protection Agency, 1993). These discharges must meet MARPOL and Barcelona Convention requirements and are expected to dilute rapidly in the open ocean. Impacts on water quality would likely be undetectable beyond tens of meters from the source. Pipeline, MEG line, and utility line
Tamar Field Development Project EIA 247 Noble Energy Mediterranean Ltd March 2016 CSA-Noble-FL-16-2650-08-REP-01-FIN-REV04
testing may result in the discharge of varying quantities of untreated seawater, with no impacts to near-surface water quality.
Due to the nature of routine discharges and their dilution in the receiving environment, impacts to water quality are expected to be minor. Given the likely nature of this impact, overall impact significance is low.
As for drilling discharges, the time periods between drilling the wells and the transient nature of the potential impacts of these routine discharges on water quality, cumulative impacts are unlikely and not expected.
4.6.2.4 Installation Vessel Arrival, Operation, and Departure
The DP pipelaying vessel and its support vessels will discharge treated sewage, domestic waste, and deck drainage. Sewage will pass through a sewage treatment plant prior to discharge. Domestic wastes (gray water) will be discharged without treatment, except for food waste, which will be macerated to pass through a 25-mm mesh. Deck drainage from machinery areas will pass through an oil-water separator prior to discharge or retained on board to be disposed of onshore. These discharges would have a negligible impact and would be similar to those from other ships in the region. It is expected that the discharges would dilute rapidly in the water and not be detectable beyond the immediate vicinity of the vessel(s).
4.6.2.5 Installation Activities
Emplacement of the pipelines, MEG lines, control lines, and utility lines will disturb surficial sediments, causing increased localized turbidity, possible mobilization, transport of sediment-associated contaminants, and crushing and/or burial of benthic communities near the pipeline corridor. Impacts on water quality are expected to be minor. Given the short duration of this impact, overall impact significance is low.
4.6.3 Plankton, Fish, and Fishery Resources
The following activities at the Tamar Field could impact plankton, fish, and fishery resources as identified in Table 4-3:
• Drilling (including the release/discharge of drill muds and cuttings); • Physical presence; • Routine discharges; and • Installation activities.
4.6.3.1 Drilling (including the release/discharge of drill muds and cuttings)
In the upper portions of the water column, the turbidity plume created by routine discharges will reduce light penetration for a short period of time in close proximity to the discharge, with minimal impacts to phytoplankton. Discharges from the drillship will occur 7 to 8 m below the surface, further reducing the potential for impact to plankton in the upper portions of the water column. Within the water column, potential exposure to routine discharges will be very limited. Due to rapid dilution and the location of the discharge plume, this impact is anticipated to be negligible. Given the likely nature of this impact, overall impact significance is negligible.
Discharges of drilling fluids and cuttings are likely to have little or no impact to plankton or fish due to the low toxicity and rapid dispersion of these discharges (National Research Council, 1983; Neff, 1987; Hinwood et al., 1994). Further, the only discharge or release of drilling muds and cuttings will occur at the wellbore. Plankton in the upper water column will not be affected. Demersal zooplankton within the benthic boundary layer, near the sediment-water interface, may be affected by
Tamar Field Development Project EIA 248 Noble Energy Mediterranean Ltd March 2016 CSA-Noble-FL-16-2650-08-REP-01-FIN-REV04
muds and cuttings released from the wellbore (e.g., fouling of respiratory structures). Given the localized nature of this impact, the rapid dispersion of the discharges, and the low toxicity of the discharges in the water column, overall impact significance of drilling from previous and planned Tamar Reservoir Area projects is anticipated to be negligible.
No cumulative impacts are expected on plankton, fish, and fishery resources due to drilling as the drilling periods have been spaced out over a period of months to years as well as being spaced out geographically.
4.6.3.2 Physical Presence
The presence of the drillship will attract fishes, providing shelter and food in the form of attached fouling biota (Gallaway and Lewbel, 1982). Offshore structures typically attract epipelagic fishes such as tunas, dolphin, billfishes, and jacks (Holland et al., 1990; Higashi, 1994). This “artificial reef effect” generally is considered a beneficial impact. While the impact, either positive or negative, is likely to occur, overall impact significance is negligible.
4.6.3.3 Routine Discharges
Routine discharges are unlikely to affect most marine resources (e.g., marine mammals, sea turtles, birds), but may affect plankton and fish that actively or passively pass through the discharge plume.
In the upper portions of the water column, the turbidity plume created by routine discharges will reduce light penetration for a short period of time in close proximity to the discharge, with minimal impacts to phytoplankton. Discharges from the drilling unit occur below the surface, further reducing the potential for impact to plankton in the upper portions of the water column. Within the water column, potential exposure of plankton to routine discharges will be very limited.
While increased turbidity is not expected to physically affect fishes (e.g., via interference with gill function), turbidity increases may alter the foraging success of some fishes when they are present within a plume (De Robertis et al., 2003). Given that the total area affected by these discharges is very small, foraging fish are expected to either avoid or move out of the discharge plume. Turbidity effects will be very localized.
Due to rapid dilution and the location of the discharge plume, the impact of routine discharges on plankton and fish is anticipated to be negligible. Given the likely, but localized nature of this impact, overall impact significance is anticipated to be low for the proposed drilling operations as well as for the cumulative impacts of Tamar Field activities.
4.6.3.4 Installation Activities
Routine and miscellaneous discharges typically occur from numerous sources on project vessels. Examples include sanitary waste, deck drainage, uncontaminated freshwater and seawater used for cooling water, ballast water, fire test water, desalination unit discharges, and boiler blowdown discharges (U.S. Environmental Protection Agency, 1993). These discharges must meet MARPOL and Barcelona Convention requirements and are expected to dilute rapidly in the open ocean. Impacts on water quality likely would be undetectable beyond tens of meters from the source. The potential for impacts on plankton, fish, and fishery resources is negligible.
Pipeline, MEG line, and utility line testing may result in the discharge of varying quantities of untreated seawater, with no impacts to near-surface water quality. The potential for impacts on plankton, fish, and fishery resources is negligible.
Tamar Field Development Project EIA 249 Noble Energy Mediterranean Ltd March 2016 CSA-Noble-FL-16-2650-08-REP-01-FIN-REV04
Due to the nature of routine discharges and their dilution in the receiving environment, impacts to plankton, fish, and fishery resources are expected to be minor. Given the likely nature of this impact, overall impact significance is low.
4.6.4 Benthic Communities
The following activities at the Tamar Field may impact benthic communities as identified in Table 4-3:
• Drilling (including the release/discharge of drill muds and cuttings); • Solid waste (drilling and infrastructure activities); • Installation activities; and • Infrastructure physical presence.
4.6.4.1 Drilling (including the release/discharge of drill muds and cuttings)
The main benthic impacts during the initial two well intervals will be the burial and smothering of benthic organisms within several meters to tens of meters around the wellbore. WBM can also cause oxygen depletion in near surface sediments (Trannum et al., 2006; Schaanning et al., 2008a,b). Soft bottom sediments disturbed by cuttings, drilling mud, and cement slurry will eventually be recolonized through larval settlement and migration from adjacent areas. The deposition of muds and cuttings particles can prompt tube building and burrowing activity of indigenous fauna in response to this short-term disturbance of the sediment surface (Trannum et al., 2010).
During the subsequent well intervals using MOBM, drill cuttings with small quantities of adhering MOBM will be discharged from the drilling rigs, pending MNIEWR approval. . The cuttings will sink through the water column and be deposited on the seafloor. The modeling predicts that deposition will occur in all directions around the drillsite, but primarily toward the southeast (Figures 4-9 and 4-10). Due to the water depth, the drilling discharges are predicted to produce a thin layer on the seafloor, with most of the deposition occurring within a few hundred meters of the discharge point. Thicknesses of 1 mm or greater are predicted to occur within 136 to 149 m from the discharge point. Thicknesses are predicted to be 0.1 mm or less at distances greater than 676 to 775 m from the discharge point (Table 4-14).
Benthic community effects of drilling discharges have been reviewed extensively (National Research Council, 1983; Neff, 1987, 2005, 2010; Bakke et al., 2013). Due to the low toxicity of most drilling fluids, the main mechanism of impact to benthic communities is increased sedimentation, resulting in burial or smothering. Most benthic fauna live in the upper few centimeters of offshore, fine-grained sediments, with benthic communities composed of varying feeding guilds – filter feeders, surface deposit feeders, subsurface deposit feeders, and carnivores. Deposit feeders, in particular, are recognized for their ability to process/injest or move sediment during tube building and feeding (i.e., bioturbation). The maximum depth of bioturbation is in the range of 4 to 5 cm for most infauna, although larger infaunal burrowers are known to extend 20 or more cm into the sediment. Infaunal feeding guilds are important in determining impacts from sediment deposition (i.e., filter feeding species are highly susceptible to increased sedimentation compared to deposit feeders).
The potential impacts of cuttings deposition can be summarized based on a monitoring study conducted in the deepwater Gulf of Mexico (Continental Shelf Associates, Inc., 2006). Areas of cuttings deposition within approximately 500 m of wellsites were associated with elevated organic carbon concentrations and anoxic conditions. Affected areas had patchy zones of disturbed benthic communities, including microbial mats, areas lacking visible benthic macroinfauna, zones dominated by pioneering stage assemblages, and areas where surface-dwelling species were selectively lost. Infaunal and meiofaunal densities generally were higher near drilling, although some faunal groups were less abundant near drillsites. Some stations near drilling had lower diversity, lower evenness, and lower richness indices compared with stations farther away from drilling. Some stations affected

Tamar Field Development Project EIA 250 Noble Energy Mediterranean Ltd March 2016 CSA-Noble-FL-16-2650-08-REP-01-FIN-REV04
by drilling were dominated by high abundances of one or a few deposit-feeding species, including known pollution indicators.
A risk assessment of TCC-treated cuttings was conducted by Aquateam COWI AS (2014). With regard to benthic organisms, they concluded that 1) the environmental risk associated with discharges of TCC-treated cuttings will correspond to that of WBM cuttings; 2) the levels of oil, PAH and metals in treated OBM cuttings are expected to be similar to those in WBM cuttings; and 3) chemical pollution is expected to have a negligible effect on benthic organisms. The main concern is smothering of benthic organisms.
A thickness of 6.3 mm has been proposed by Smit et al. (2008) as a ‘predicted no effect concentration’ threshold for benthic species that are sensitive to sediment deposition. The MUDMAP model of WBM and MOBM cuttings discharge predicts that deposition having a thickness of 6.3 mm or more would affect approximately 0.008 km2 around each drillsite under either scenario and would extend approximately 54 to 55 m from the discharge point (Table 4-15).
A thickness of 54 mm has also been proposed as a “median” impact threshold for burial of soft-bottom benthic organisms (Smit et al., 2008). The MUDMAP model of WBM and MOBM cuttings discharge predicts that deposition having a thickness of 54 mm or more would affect approximately 0.002 km2 around each drillsite and would extend approximately 27 m from the discharge point.
During Noble Energy surveys of the Tamar Reservoir Area in 2013 and 2014 (CSA Ocean Sciences Inc., 2014), no hard bottom substrate or chemosynthetic communities were observed. There was visible biological activity observed on video at most of the locations surveyed by ROV, and observations included fauna and bioturbation (i.e., biologically maintained burrows and mounds). As may be expected for a soft bottom deepwater environment where food availability is low, fauna observed on the seafloor were sparse. The organisms most commonly observed were tripod fish and unidentifiable shrimp. Small groupings of patterned burrows and small conical mounds likely created by polychaetes were observed in the soft sediments.
Soft bottom areas buried by cuttings will eventually be recolonized through larval settlement and migration from adjacent areas. Recovery may require several years (Neff et al., 2000; Continental Shelf Associates, Inc., 2004, 2006) and is dependent on the nature of the indigenous fauna, their tolerance to burial, life history characteristics (e.g., spawning and settlement characteristics), and their relative abundance in the deposition areas.
Cumulative impacts can be determined by calculating the area around drilling operations that has a negative impact on the benthic communities due to smothering. For concrete and other discharges around the wellbore, this is approximately 0.7 ha (using an impact area of 15 m around the wellbore and adding the impacted area for the seven completed wells and the three proposed wells, which will have a seafloor discharge from the initial well sections). If benthic communities are impacted for a radius of 75 m around the wellbore, the total impacted bottom area is approximately 1.8 ha per well. Due to the low density of benthic infauna, the distance between wells, and the relatively small size of the impacted area relative to the Tamar Reservoir Area, the cumulative impact significance of drilling discharges on benthic communities is considered to be low.
4.6.4.2 Solid Waste (Drilling and Infrastructure Activities)
The occasional and accidental loss of debris (e.g., welding rods, buckets, pieces of pipe) may result in accumulation on the seafloor. Pieces of debris reaching the seafloor may be colonized by epibiota and attract fishes (due to their physical structure on the otherwise flat seafloor), with a corresponding minor and localized impact to the benthic community (Shinn et al., 1993). Depending upon the nature of solid waste, leaching of organics or trace metals may occur, resulting in localized changes in sediment quality. Due to restrictions on dumping and expected adherence to applicable MARPOL
Tamar Field Development Project EIA 251 Noble Energy Mediterranean Ltd March 2016 CSA-Noble-FL-16-2650-08-REP-01-FIN-REV04
provisions, this impact is anticipated to be minor. Given the nature of this impact, overall impact significance for individual wells as well as cumulatively is anticipated to be low.
4.6.4.3 Installation Activities
Emplacement of the pipelines, MEG lines, control lines, and utility lines will disturb surficial sediments, causing increased localized turbidity, possible mobilization, transport of sediment-associated contaminants, and crushing and/or burial of benthic communities near the pipeline corridor. Impacts on benthic communities are expected to be minor. Given the occasional nature of this impact, overall impact significance is low.
The discharge of the hydrotest fluids will be short term but will result in high levels of salts and MEG. In terms of the salt compounds, it can be expected that any organisms that are entrapped in the brine plumes at the point of release could suffer acute exposure (Brenner, 2014). No chronic exposures are expected given that the plume is shown to quickly dissipate to ambient salt levels. Based on the modeling results, the acute toxicity levels will dissipate quickly. While it is expected that any organisms trapped in the immediate vicinity of the plume release will suffer mortality, the depauperate nature of the deepsea biota should cause only a negligible impact.
MEG has a low toxicity although entrapment in the immediate vicinity of the hydrotest discharge could cause acute effects. The bigger risk from MEG in the environment comes from possible anoxia due to bacterial degradation of the product. However, a very small amount of MEG is expected to be lost to the environment, and this material will disperse rapidly (e.g., hours) to low to non-detect levels which will minimize any impacts. Therefore, it is not expected that an MEG release will result in significant impacts on the biota. As a result, the overall impact significance of installation activities on benthic communities is negligible.
4.6.4.4 Infrastructure Physical Presence
The pipelines, umbilicals, and potentially the matting used to support them will cover benthic organisms and smother them. The presence of these hard substances (pipe) on the seafloor will serve as a substrate for additional benthic community development. Due to the limited area to be occupied by the benthic infrastructure, overall impact significance is low.
4.6.5 Marine Mammals and Sea Turtles
The following activities at the Tamar Field may impact marine mammals and sea turtles as identified in Table 4-3:
• Drillship arrival, departure, and stationkeeping; • Noise (drilling and installation); • Installation vessel arrival, operation, and departure; • Support vessel traffic; and • Helicopter traffic.
4.6.5.1 Drillship Arrival, Departure, and Stationkeeping
There is the potential for disturbance of marine mammals and sea turtles during transit of the drilling unit. The disturbance impacts would be similar to those associated with existing vessel traffic in the region. The risk of a vessel strike is considered low because of the limited amount of vessel movement and the slow speed at which the vessels will be moving, resulting in a negligible overall impact significance.

Tamar Field Development Project EIA 252 Noble Energy Mediterranean Ltd March 2016 CSA-Noble-FL-16-2650-08-REP-01-FIN-REV04
4.6.5.2 Noise (Drilling and Installation)
The drilling unit and support vessels will create noise from their operations that could have impacts on marine mammals and sea turtles. Some marine mammals may avoid the drilling unit area due to noise. The most likely impacts would be short-term behavioral changes such as diving and evasive swimming, disruption of activities, or departure from the area.
Richardson et al. (1995) defined four zones of potential noise effects on marine mammals. In order of increasing severity, they are 1) audibility; 2) responsiveness (behavioral effects); 3) masking; and 4) hearing loss, discomfort, or injury (physical effects). The levels of sound produced during drilling are sufficient to be audible and to produce behavioral responses, but much lower than those known to cause hearing loss, discomfort, or injury.
Low-frequency noise from offshore drilling activities can be detected by marine mammals (Richardson et al., 1995). Mysticetes are more likely to detect low-frequency sounds than are most odontocetes, which have their best hearing in high frequencies. However, noise associated with drilling is relatively weak in intensity, and the mammals’ exposure to these sounds will be transient. The noise will be similar to the existing noise associated with shipping traffic in the region.
Sound exposure criteria for marine mammals have been historically applied to sea turtles. Sea turtles may experience injury or behavioral disturbance from drilling-related noise. As is the case with marine mammals, sea turtles will hear the sound source prior to any exposure to these source levels; they may respond by changing course or diving, thus avoiding or minimizing any further exposure.
The drilling unit will only be on site for a relatively short period of time (i.e., several months), limiting the potential for noise exposure. Due to the duration of drilling operations, when coupled with the nature of the drilling program-related sound sources, the impact significance of noise on marine mammals and sea turtles is anticipated to be low.
Tamar drilling operations are not performed simultaneously. As a result, cumulative impacts are not considered to be different than impacts from a single drilling operation. While drilling could be occurring in neighboring lease areas, the distance between lease areas and the limited noise generated would not alter the minimal impacts on marine mammals and sea turtles from noise associated with drilling (see Section 4.5).
4.6.5.3 Installation Vessel Arrival, Operation, and Departure
There is potential for disturbance of marine mammals and sea turtles during transit of the installation vessel. The disturbance impacts would be similar to those associated with existing vessel traffic in the region. The risk of a vessel strike is considered to be low because of the limited amount of vessel movement and the slow speed at which the vessels will be moving, resulting in negligible impact significance.
4.6.5.4 Support Vessel Traffic
There is a small possibility of a support vessel striking a marine mammal during routine operations. The risk is similar to that associated with existing vessel traffic in the region. Collisions with dolphins or whales are considered highly unlikely. Most dolphins are agile swimmers and are unlikely to collide with vessels. Of the 11 marine mammal species known to have been hit by vessels in the eastern Mediterranean Sea, fin whales have been struck most frequently, sperm whales have been hit commonly, and collisions with Bryde’s whales have been rare (Laist et al., 2001). Although all sizes and types of vessels can collide with whales, most lethal or severe injuries are caused by ships 80 m or longer and traveling 14 knots or faster (Laist et al., 2001).

Tamar Field Development Project EIA 253 Noble Energy Mediterranean Ltd March 2016 CSA-Noble-FL-16-2650-08-REP-01-FIN-REV04
Vessel strikes are among the threats affecting the population status of both humpback and sperm whales (National Marine Fisheries Service, 1991, 2010). Sperm whales are vulnerable to ship strikes because they typically spend up to 10 minutes “rafting” at the surface between deep dives (Jacquet et al., 1998). There have been many reports of sperm whales of different age classes being struck by vessels, including passenger ships and tug boats. There were also instances in which sperm whales approached vessels too closely and were injured by propellers (National Marine Fisheries Service, 2010).
Due to the short duration of the drilling program, the low levels of support vessel traffic, and the low abundance of marine mammals in the area, the likelihood of vessels significantly disturbing marine mammals is considered negligible.
There is a remote possibility of a support vessel striking a sea turtle during routine operations. Vessel strikes are among the threats affecting the endangered population status of several sea turtle species (National Research Council, 1990). The risk of striking a sea turtle during this drilling program is similar to that associated with existing vessel traffic in the region. Studies indicate that sea turtles are at the surface approximately 10% of the time and readily sound (dive) to avoid approaching vessels (Byles, 1989; Lohoefener et al., 1990; Keinath and Musick, 1993; Keinath et al., 1996).
Due to the short duration of the drilling program and the frequency of the support vessel traffic, the impact significance of support vessel impacts on sea turtles is considered negligible.
4.6.5.5 Helicopter Traffic
Helicopter traffic has the potential to disturb marine mammals (Richardson et al., 1995). Reported behavioral responses of marine mammals are highly variable, ranging from no observable reaction to diving or rapid changes in swimming speed or direction (Efroymson et al., 2000; Smultea et al., 2008). Similarly, sea turtles may experience behavioral disturbance from helicopter noise. Sea turtles will hear the sound source prior to any exposure to these source levels; they may respond by changing course, diving, or avoiding further exposure. Smultea et al. (2008) concluded that behavioral responses to brief overflights by aircrafts are short term and probably of no long-term biological significance. The impact significance of helicopter traffic on marine mammals and turtles is negligible.
4.6.6 Marine and Coastal Birds
The following activities at the Tamar Field may impact marine and coastal birds as identified in Table 4-3:
• Physical presence; • Lights; • Installation activities; and • Helicopter traffic.
4.6.6.1 Physical Presence
The presence of offshore structures can have a positive and/or negative impact on birds. Some birds may be attracted to offshore drilling units and platforms because of the lights and the fish populations that aggregate around these structures. Birds may use offshore structures for resting, feeding, or as temporary shelter from inclement weather (Russell, 2005). However, birds migrating over water at night have been known to strike offshore structures, resulting in death or injury (Wiese et al., 2001; Russell, 2005). Because of the limited scope and short duration of drilling activities proposed in this program, adverse effects on marine birds from rig presence are unlikely and the overall impact significance is negligible (see Section 4.4).
Tamar Field Development Project EIA 254 Noble Energy Mediterranean Ltd March 2016 CSA-Noble-FL-16-2650-08-REP-01-FIN-REV04
4.6.6.2 Lights
A study in the North Sea indicated that platform lighting causes circling behavior in various birds, especially on cloudy nights. van de Laar (2007) and Poot et al. (2008) suggested that the birds’ geomagnetic compasses are upset by the red part of the spectrum from the type of lights currently in use. The numbers varied greatly, from none at all to some tens of thousands of birds per night per platform, with an apparent effect radius of up to 5 km. A study in the Gulf of Mexico also noted the circling phenomenon (Russell, 2005). Because of the limited scope and short duration of drilling activities proposed in this program, adverse effects from lighting on marine birds are considered unlikely and the overall impact significance is negligible.
4.6.6.3 Installation Activities
The support vessels will be transiting to and from the shore base, using the most direct route between the shore base and the drilling unit, weather permitting. Vessel traffic could disturb individuals or groups of coastal birds. It is likely that individual birds would experience, at most, a short-term behavioral disruption, resulting in a negligible overall impact significance.
4.6.6.4 Helicopter Traffic
Helicopter traffic and noise can disturb birds. Responses are highly dependent on bird species, activities that animals were previously engaged in, and previous exposures to overflights (Efroymson et al., 2000). It is likely that individual birds would experience, at most, only short-term behavioral disruption from helicopter traffic and noise. The impact significance is considered to be negligible.
4.6.7 Protected Species/Habitats
The following activities at the Tamar Field may impact protected species/habitats as identified in Table 4-3:
• Support vessel traffic; and • Helicopter traffic.
4.6.7.1 Support Vessel Traffic
Support vessel traffic along the route between shore base port and the drilling unit is not expected to cross or affect any protected areas. No impacts to protected areas or sensitive habitats are expected from support vessel traffic.
4.6.7.2 Helicopter Traffic
If helicopters cross protected areas or sensitive coastal habitats, the noise could disturb nesting birds or other wildlife. It is likely that individual wildlife would experience, at most, only short-term behavioral disruption from helicopter traffic and noise. Helicopters normally will follow the most direct route between the shore and the drilling unit (weather permitting), and under normal conditions are not expected to cross any protected areas.
4.7 SHIPPING, MARITIME INDUSTRY, RECREATION, AESTHETICS/TOURISM, AND ARCHAEOLOGICAL RESOURCES
Culture and heritage sites are addressed by the project’s review of potential impacts to: the shipping and maritime industry, recreation and aesthetics/tourism, and archaeological resources as presented in Table 4-3.
Tamar Field Development Project EIA 255 Noble Energy Mediterranean Ltd March 2016 CSA-Noble-FL-16-2650-08-REP-01-FIN-REV04
4.7.1 Shipping and Maritime Industry
The shipping and maritime industry may be impacted by activities at the Tamar Field due to the following as identified in Table 4-3:
• Drillship and installation vessel arrival, departure, and stationkeeping; • Physical presence; and • Support vessel traffic.
4.7.1.1 Drillship Arrival, Departure, and Stationkeeping
There will be limited operating access around the drilling unit for the duration of 1) drilling unit arrival from a mobilization port outside of the region and transiting through Cypriot waters; 2) positioning of the drilling unit (installation); and 3) drilling unit departure from project location. A shipping lane from the Haifa area crosses the project area. . Although the location from which the drilling unit will be mobilized is not currently known and the drilling unit could possibly use or transit through shipping lanes, little or no impact to shipping and the maritime industry is expected. The overall impact significance is expected to be negligible.
4.7.1.2 Physical Presence
The physical presence of the drilling unit could affect the route of vessels in the shipping lane due to the creation of a 500 m safety zone as discussed in Section 4.14. A continuous bridge watch on the drilling unit will be maintained to ensure compliance with the safety zone and a Notice to Mariners will be issued. Due to the distance from shore and the large size of the shipping lane, the presence of the drilling unit is not expected to have significant impacts on shipping and the maritime industry
4.7.1.3 Support Vessel Traffic
As support vessels use the shore base, a minor increase in vessel traffic will occur, and support vessel transit routes may cross normal shipping routes. These impacts are anticipated to be of minor importance due to the transit period. Support vessels will follow the most direct route between the drilling unit and the shore base, weather permitting. It is expected that support vessels would avoid traveling close to the coast, except at the approach to the shore base, and that they would minimize traversing coastal waters at night when traps or nets left overnight could be damaged. Accordingly, significant impacts from support vessel traffic on shipping or other maritime activities are expected to be avoided, with negligible impact significance.
4.7.2 Recreation and Aesthetics/Tourism
Activities at the Tamar Field may impact recreation, aesthetics, and tourism due to the physical presence of the drilling units and vessels. Offshore structures such as drilling units and platforms typically are visible 5 to 16 km from shore, with small structures (e.g., a single offshore drilling unit) barely visible at distances greater than 5 km. On a clear night, lights on top of offshore structures may be visible to a distance of approximately 32 km (U.S. Bureau of Ocean Energy Management, 2012). Since any drilling unit in the Tamar Field will be more than this distance offshore, it will not be visible from shore and will have no aesthetic impact on coastal or nearshore recreation and tourism. The Tamar Platform may be visible from shore, but is far enough offshore to be unobtrusive and have minimal impacts on aesthetics. With the possible exceptions of deepsea fishing and yachting, which could be temporarily impacted due to the presence of the project vessels, recreational activities are not expected to occur near the potential well locations.

Tamar Field Development Project EIA 256 Noble Energy Mediterranean Ltd March 2016 CSA-Noble-FL-16-2650-08-REP-01-FIN-REV04
4.7.3 Archaeological Resources
The following activities at the Tamar Field may impact archaeological resources as identified in Table 4-3:
• Drilling unit arrival, departure, and stationkeeping; • Drilling (including release/discharge of drill muds and cuttings and other well operations); and • Installation activities.
4.7.3.1 Drillship Arrival, Departure, and Stationkeeping
A high-resolution side-scan sonar survey or an ROV survey (depending on the type of rig utilized) will be conducted to evaluate the presence of cultural and archaeological resources when a well location or pipeline route has been selected. If any resources are detected during the survey, avoidance zones will be established to prevent any potential impacts from project activities, and the resultant impact significance is negligible.
4.7.3.2 Drilling (including release/discharge of drill muds and cuttings and other well operations)
Cultural/archaeological resources could be impacted by the seafloor release of mud and cuttings. Surface discharges of WBM and associated drill cuttings are not expected to reach archaeological resources on the seafloor per the results of the pre-drill surveys conducted to ensure that there are no such resources at or near the well locations. The impact significance is negligible because all impacts of drilling mud and cuttings discharges on archaeological resources are expected to be avoided.
4.7.3.3 Installation Activities
The installation of pipelines and other bottom structures has the potential to impact archaeological resources. Two surveys were conducted during 2010; one of nearshore areas out to 12 miles from shore (Oceana Marine Research Ltd., 2010), and one of areas from 12 miles offshore to the Tamar Field (DOF Subsea UK, 2010a,b). The surveys included the Tamar Field and potential pipeline routes to shore. One potential shipwreck was identified along one of the potential pipeline routes to shore, and a total of 95 side-scan contacts were identified in the Tamar Field. Two of these corresponded to well locations and 15 were possible anchor locations (DOF Subsea UK, 2010a). The rest were classified as unidentified because they have not been visually inspected. The results of the surveys will be used to ensure that such potential archaeological resources are not impacted. The overall impact significance is negligible.
4.8 AIR QUALITY
Air quality could be impacted by the Tamar Expansion Project through the following as identified in Table 4-3:
• Drilling (including release/discharge of drill muds and cuttings, flaring, and other well operations);
• Combustion emissions; • Support vessel traffic; and • Helicopter traffic.
Air modeling was not performed for this EIA because the project location is more than 10 km from the Israeli coast.

Tamar Field Development Project EIA 257 Noble Energy Mediterranean Ltd March 2016 CSA-Noble-FL-16-2650-08-REP-01-FIN-REV04
4.8.1 Drilling (including release/discharge of drill muds and cuttings, flaring and other well operations) and Combustion Emissions
As discussed in Section 3.4, engines on the drilling will emit emissions containing air pollutants, including CO, NOx, SOx, VOCs, and PM as well as greenhouse gases such as CO2 and CH4. Support vessels and helicopters will also emit air pollutants from the combustion of diesel fuel (vessels) and aviation fuel (helicopters).
Under certain atmospheric conditions, some of these gases are known to react or degrade to form different secondary compounds. These degradation products and transformation processes are important in the context of problems such as global climate change, ozone formation, and acidification.
Air pollutant emissions from the drilling unit and support vessels are expected to rapidly dilute and disperse in the offshore atmosphere. There may be intermittent impacts on air quality within several hundred meters of the wellsite during drilling. However, no detectable impacts on air quality are expected onshore based on the relatively small quantities of pollutants emitted and the distance of the Tamar Field from shore.
Gas from well testing is either flared or vented directly to the atmosphere. Combustion from flaring will result in emissions to the atmosphere. Flaring would occur only during the period of a well test, at most over a period of 2 to 3 days. If undertaken, the emissions from a well test will depend on the flow rate and gas/liquid hydrocarbon/water ratio for each well tested.
As indicated in Section 3.5, to date the only H2S that has been recorded within Israel was at Pinnacles 1, where the wellhead gas had H2S concentrations in excess of 20 ppm; H2S concentrations of concern are not expected for this project, although potential H2S emissions will be monitored.
Air pollutant emissions from a well test are expected to rapidly dilute and disperse in the offshore atmosphere. There will likely be some decrease in ambient air quality within several hundred meters of the drilling unit during the test. However, no detectable impacts on air quality onshore are expected based on the relatively small quantities of pollutants emitted and the distance of the Tamar Field from shore.
The impact significance of drilling on air quality negligible; as for water quality impacts, the time and distance between drilling operations for each well result in a negligible cumulative impact on air quality.
4.8.2 Support Vessel Traffic
The emissions from support vessels were discussed in Chapter 3. Air pollutant emissions from support vessels are expected to rapidly dilute and disperse in the atmosphere. There may be intermittent impacts on air quality within several hundred meters around a support vessel during transit. The impacts would be similar to those from other vessel traffic in the region. Little or no detectable impact on air quality is expected onshore based on the relatively small quantities of pollutants emitted and the fact that most of the vessel transit will occur in offshore areas. The overall impact significance is expected to be negligible.
4.8.3 Helicopter Traffic
Air pollutant emissions from helicopters are expected to rapidly dilute and disperse in the atmosphere. There may be intermittent impacts on air quality within several hundred meters around a helicopter during transit. The impacts would be similar to those from other aircraft traffic in the region. Negligible or no detectable impact on air quality is expected onshore based on the small quantities of pollutants emitted and the fact that most of the helicopter transit will occur in offshore areas.
Tamar Field Development Project EIA 258 Noble Energy Mediterranean Ltd March 2016 CSA-Noble-FL-16-2650-08-REP-01-FIN-REV04
4.9 WASTE
4.9.1 General Waste
Waste (other than drilling discharges discussed in Chapter 3) has been and will be transported onshore for disposal at licensed disposal facilities.
Debris accidently lost overboard could have impacts on water and sediment quality and benthic communities (National Research Council, 2008; U.S. Bureau of Ocean Energy Management, 2012). Heavy items such as welding rods, buckets, pieces of pipe, etc. may have a minor, localized impact on sediment quality beneath the rig location by creating small areas of hard substrate on the soft bottom seafloor (Shinn et al., 1993; Gallaway et al., 2008). The size of the area affected would be negligible. Lighter pieces of debris may float on the sea surface and adversely affect water quality and marine biota (National Research Council, 2008; National Oceanic and Atmospheric Administration, National Ocean Service, 2013). The potential impacts on water quality from marine debris are expected to be similar to those from the existing shipping and fishing industries.
Materials accidentally lost overboard during offshore oil and gas operations could entangle marine fauna or cause injury through the ingestion of the debris (Laist, 1996). Marine debris is among the threats affecting the population status of both humpback and sperm whales (National Marine Fisheries Service, 1991, 2010). Ingestion of or entanglement with accidentally discarded trash and debris can kill or injure sea turtles (Laist, 1996; Lutcavage et al., 1997). Marine debris is among the threats affecting the endangered population status of several sea turtle species (National Research Council, 1990). Leatherback turtles are especially attracted to floating debris, particularly plastic bags because they resemble their preferred food: jellyfish. Ingestion of plastic and Styrofoam can result in drowning, lacerations, digestive disorders or blockage, and reduced mobility. The types of impacts on marine mammals and sea turtles from program-related marine trash and debris would be similar to those from existing shipping and fishing industries.
Marine trash and debris could injure or kill birds that ingest or become entangled in it. The ingestion of plastic by marine and coastal birds can cause obstruction of the gastrointestinal tract, which can result in mortality (Laist, 1996). The types of impacts on marine birds from program-related marine trash and debris would be similar to those from the existing shipping and fishing industries.
The overall impact significance of waste generation is expected to be low to negligible (also see Section 4.6.4).
4.9.2 MOBM Cuttings
If the discharge of MOBM cuttings from the proposed wells is not approved, the cuttings from these sections will be transported to shore for disposal. As described in Section 3.7, it is estimated that approximately 27 vessel trips (between the wells and Haifa) and 80 truck trips (Haifa to the Ramat Hovav landfill) would be required for onshore cuttings disposal (CSA Ocean Sciences Inc., 2013c). The vessels and trucks will produce emissions from internal combustion engines, including greenhouse gases and other pollutants such as CO, NOx, SOx, VOCs, and PM. The estimated air pollutant emissions from this activity for a well offshore Israel are presented in Tables 4-16 and 4-17.
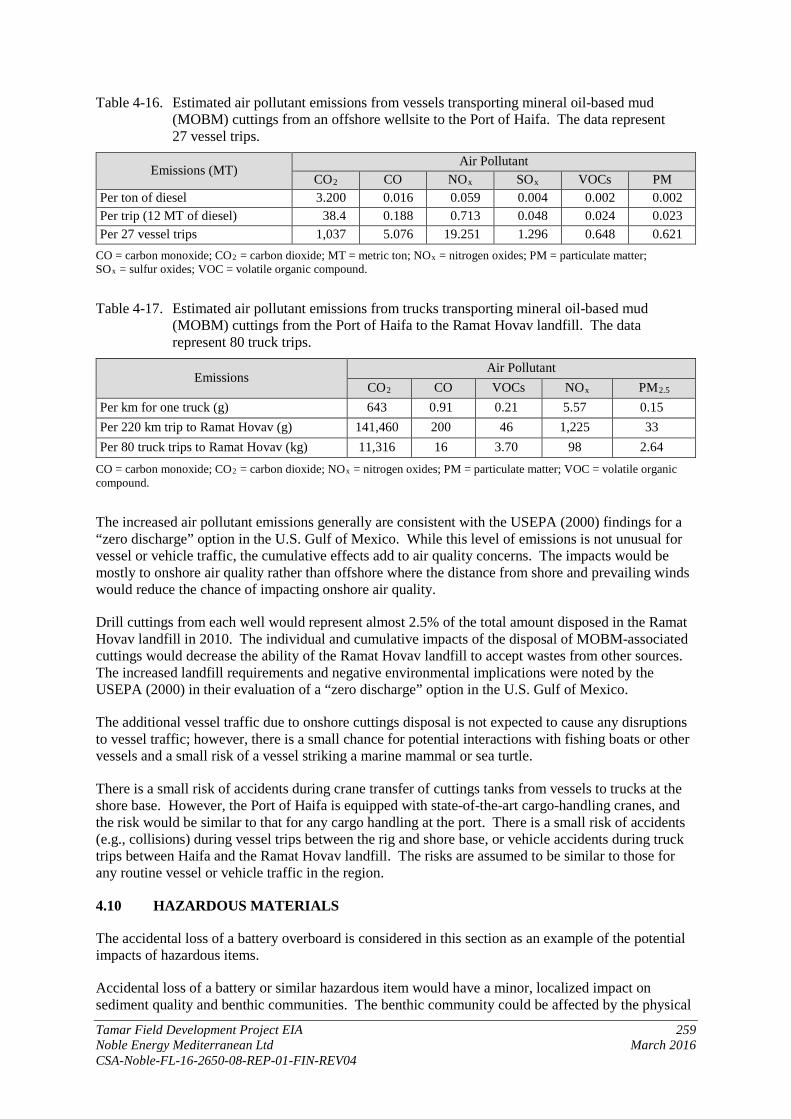
Tamar Field Development Project EIA 259 Noble Energy Mediterranean Ltd March 2016 CSA-Noble-FL-16-2650-08-REP-01-FIN-REV04
Table 4-16. Estimated air pollutant emissions from vessels transporting mineral oil-based mud (MOBM) cuttings from an offshore wellsite to the Port of Haifa. The data represent 27 vessel trips.
Emissions (MT) Air Pollutant
CO2 CO NOx SOx VOCs PM Per ton of diesel 3.200 0.016 0.059 0.004 0.002 0.002 Per trip (12 MT of diesel) 38.4 0.188 0.713 0.048 0.024 0.023 Per 27 vessel trips 1,037 5.076 19.251 1.296 0.648 0.621
CO = carbon monoxide; CO2 = carbon dioxide; MT = metric ton; NOx = nitrogen oxides; PM = particulate matter; SOx = sulfur oxides; VOC = volatile organic compound.
Table 4-17. Estimated air pollutant emissions from trucks transporting mineral oil-based mud (MOBM) cuttings from the Port of Haifa to the Ramat Hovav landfill. The data represent 80 truck trips.
Emissions Air Pollutant
CO2 CO VOCs NOx PM2.5 Per km for one truck (g) 643 0.91 0.21 5.57 0.15 Per 220 km trip to Ramat Hovav (g) 141,460 200 46 1,225 33 Per 80 truck trips to Ramat Hovav (kg) 11,316 16 3.70 98 2.64
CO = carbon monoxide; CO2 = carbon dioxide; NOx = nitrogen oxides; PM = particulate matter; VOC = volatile organic compound.
The increased air pollutant emissions generally are consistent with the USEPA (2000) findings for a “zero discharge” option in the U.S. Gulf of Mexico. While this level of emissions is not unusual for vessel or vehicle traffic, the cumulative effects add to air quality concerns. The impacts would be mostly to onshore air quality rather than offshore where the distance from shore and prevailing winds would reduce the chance of impacting onshore air quality.
Drill cuttings from each well would represent almost 2.5% of the total amount disposed in the Ramat Hovav landfill in 2010. The individual and cumulative impacts of the disposal of MOBM-associated cuttings would decrease the ability of the Ramat Hovav landfill to accept wastes from other sources. The increased landfill requirements and negative environmental implications were noted by the USEPA (2000) in their evaluation of a “zero discharge” option in the U.S. Gulf of Mexico.
The additional vessel traffic due to onshore cuttings disposal is not expected to cause any disruptions to vessel traffic; however, there is a small chance for potential interactions with fishing boats or other vessels and a small risk of a vessel striking a marine mammal or sea turtle.
There is a small risk of accidents during crane transfer of cuttings tanks from vessels to trucks at the shore base. However, the Port of Haifa is equipped with state-of-the-art cargo-handling cranes, and the risk would be similar to that for any cargo handling at the port. There is a small risk of accidents (e.g., collisions) during vessel trips between the rig and shore base, or vehicle accidents during truck trips between Haifa and the Ramat Hovav landfill. The risks are assumed to be similar to those for any routine vessel or vehicle traffic in the region.
4.10 HAZARDOUS MATERIALS
The accidental loss of a battery overboard is considered in this section as an example of the potential impacts of hazardous items.
Accidental loss of a battery or similar hazardous item would have a minor, localized impact on sediment quality and benthic communities. The benthic community could be affected by the physical
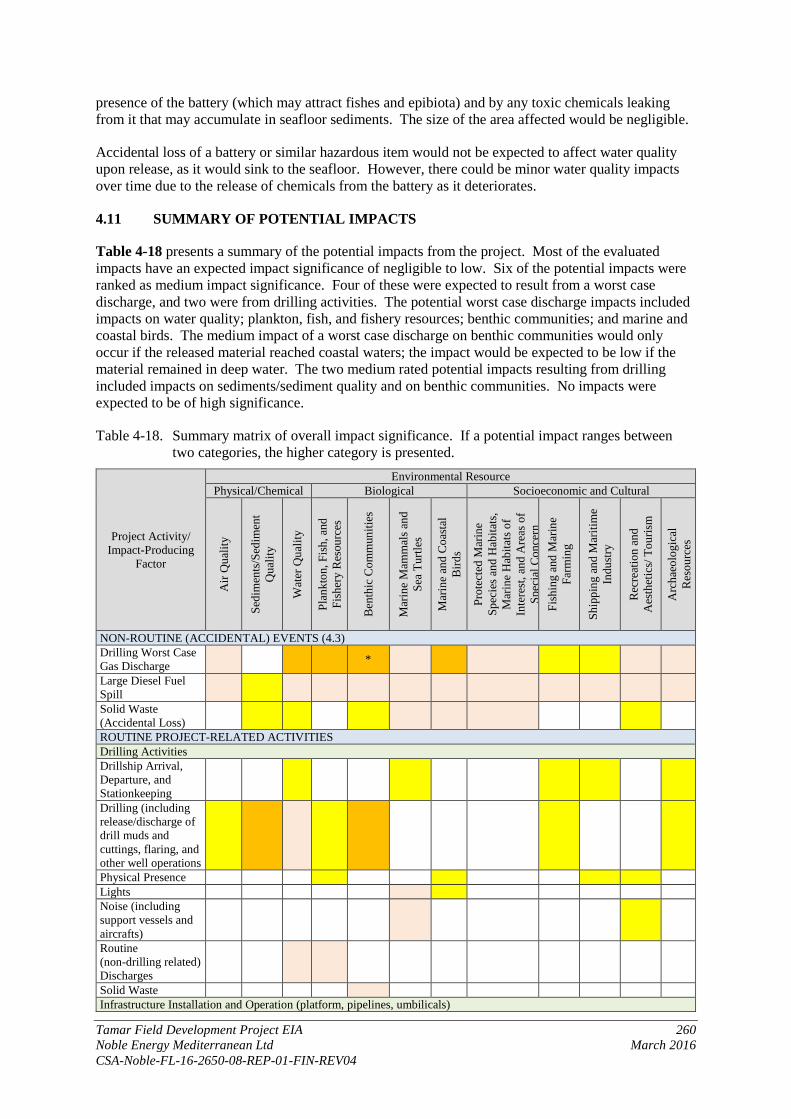
Tamar Field Development Project EIA 260 Noble Energy Mediterranean Ltd March 2016 CSA-Noble-FL-16-2650-08-REP-01-FIN-REV04
presence of the battery (which may attract fishes and epibiota) and by any toxic chemicals leaking from it that may accumulate in seafloor sediments. The size of the area affected would be negligible.
Accidental loss of a battery or similar hazardous item would not be expected to affect water quality upon release, as it would sink to the seafloor. However, there could be minor water quality impacts over time due to the release of chemicals from the battery as it deteriorates.
4.11 SUMMARY OF POTENTIAL IMPACTS
Table 4-18 presents a summary of the potential impacts from the project. Most of the evaluated impacts have an expected impact significance of negligible to low. Six of the potential impacts were ranked as medium impact significance. Four of these were expected to result from a worst case discharge, and two were from drilling activities. The potential worst case discharge impacts included impacts on water quality; plankton, fish, and fishery resources; benthic communities; and marine and coastal birds. The medium impact of a worst case discharge on benthic communities would only occur if the released material reached coastal waters; the impact would be expected to be low if the material remained in deep water. The two medium rated potential impacts resulting from drilling included impacts on sediments/sediment quality and on benthic communities. No impacts were expected to be of high significance.
Table 4-18. Summary matrix of overall impact significance. If a potential impact ranges between two categories, the higher category is presented.
Project Activity/ Impact-Producing
Factor
Environmental Resource Physical/Chemical Biological Socioeconomic and Cultural
Air
Qua
lity
Sedi
men
ts/S
edim
ent
Qua
lity
Wat
er Q
ualit
y
Plan
kton
, Fish
, and
Fi
sher
y R
esou
rces
Ben
thic
Com
mun
ities
Mar
ine
Mam
mal
s and
Se
a Tu
rtles
Mar
ine
and
Coa
stal
B
irds
Prot
ecte
d M
arin
e Sp
ecie
s and
Hab
itats
, M
arin
e H
abita
ts o
f In
tere
st, a
nd A
reas
of
Spec
ial C
once
rn
Fish
ing
and
Mar
ine
Farm
ing
Ship
ping
and
Mar
itim
e In
dust
ry
Rec
reat
ion
and
Aes
thet
ics/
Tou
rism
Arc
haeo
logi
cal
Res
ourc
es
NON-ROUTINE (ACCIDENTAL) EVENTS (4.3) Drilling Worst Case Gas Discharge *
Large Diesel Fuel Spill
Solid Waste (Accidental Loss)
ROUTINE PROJECT-RELATED ACTIVITIES Drilling Activities Drillship Arrival, Departure, and Stationkeeping
Drilling (including release/discharge of drill muds and cuttings, flaring, and other well operations
Physical Presence Lights Noise (including support vessels and aircrafts)
Routine (non-drilling related) Discharges
Solid Waste Infrastructure Installation and Operation (platform, pipelines, umbilicals)
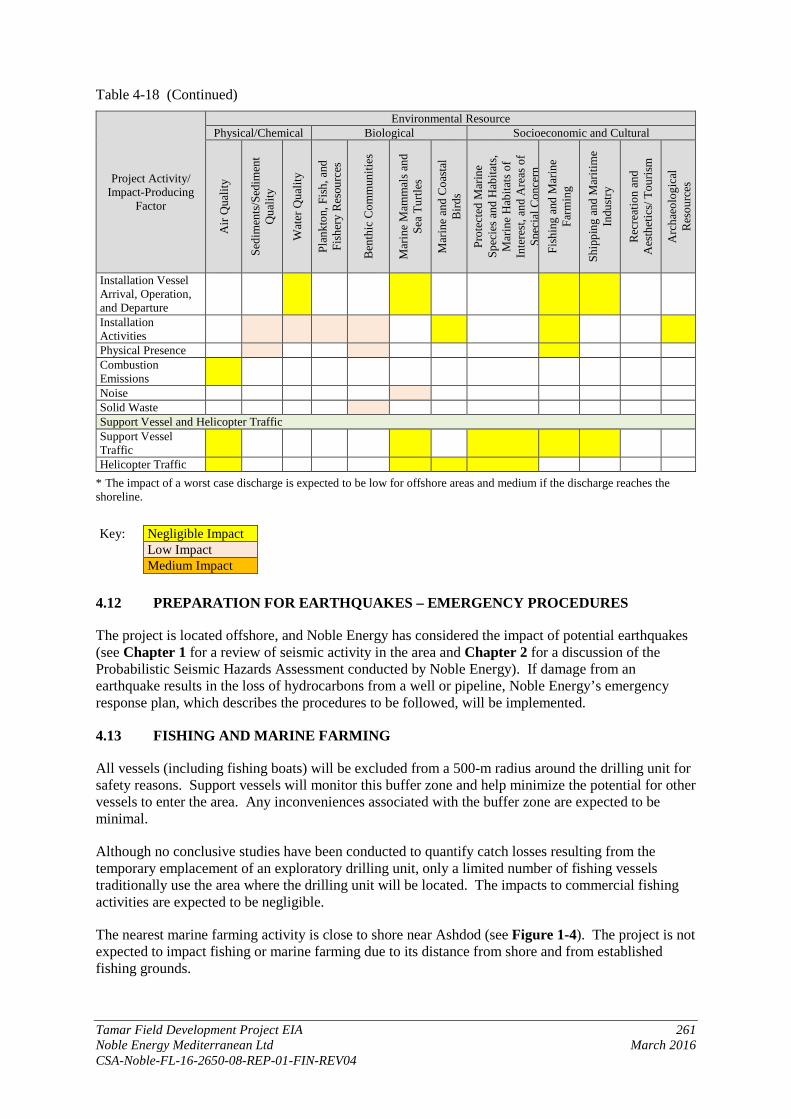
Table 4-18 (Continued)
Tamar Field Development Project EIA 261 Noble Energy Mediterranean Ltd March 2016 CSA-Noble-FL-16-2650-08-REP-01-FIN-REV04
Project Activity/ Impact-Producing
Factor
Environmental Resource Physical/Chemical Biological Socioeconomic and Cultural
Air
Qua
lity
Sedi
men
ts/S
edim
ent
Qua
lity
Wat
er Q
ualit
y
Plan
kton
, Fish
, and
Fi
sher
y R
esou
rces
Ben
thic
Com
mun
ities
Mar
ine
Mam
mal
s and
Se
a Tu
rtles
Mar
ine
and
Coa
stal
B
irds
Prot
ecte
d M
arin
e Sp
ecie
s and
Hab
itats
, M
arin
e H
abita
ts o
f In
tere
st, a
nd A
reas
of
Spec
ial C
once
rn
Fish
ing
and
Mar
ine
Farm
ing
Ship
ping
and
Mar
itim
e In
dust
ry
Rec
reat
ion
and
Aes
thet
ics/
Tou
rism
Arc
haeo
logi
cal
Res
ourc
es
Installation Vessel Arrival, Operation, and Departure
Installation Activities
Physical Presence Combustion Emissions
Noise Solid Waste Support Vessel and Helicopter Traffic Support Vessel Traffic
Helicopter Traffic * The impact of a worst case discharge is expected to be low for offshore areas and medium if the discharge reaches the shoreline.
Key: Negligible Impact Low Impact Medium Impact
4.12 PREPARATION FOR EARTHQUAKES – EMERGENCY PROCEDURES
The project is located offshore, and Noble Energy has considered the impact of potential earthquakes (see Chapter 1 for a review of seismic activity in the area and Chapter 2 for a discussion of the Probabilistic Seismic Hazards Assessment conducted by Noble Energy). If damage from an earthquake results in the loss of hydrocarbons from a well or pipeline, Noble Energy’s emergency response plan, which describes the procedures to be followed, will be implemented.
4.13 FISHING AND MARINE FARMING
All vessels (including fishing boats) will be excluded from a 500-m radius around the drilling unit for safety reasons. Support vessels will monitor this buffer zone and help minimize the potential for other vessels to enter the area. Any inconveniences associated with the buffer zone are expected to be minimal.
Although no conclusive studies have been conducted to quantify catch losses resulting from the temporary emplacement of an exploratory drilling unit, only a limited number of fishing vessels traditionally use the area where the drilling unit will be located. The impacts to commercial fishing activities are expected to be negligible.
The nearest marine farming activity is close to shore near Ashdod (see Figure 1-4). The project is not expected to impact fishing or marine farming due to its distance from shore and from established fishing grounds.
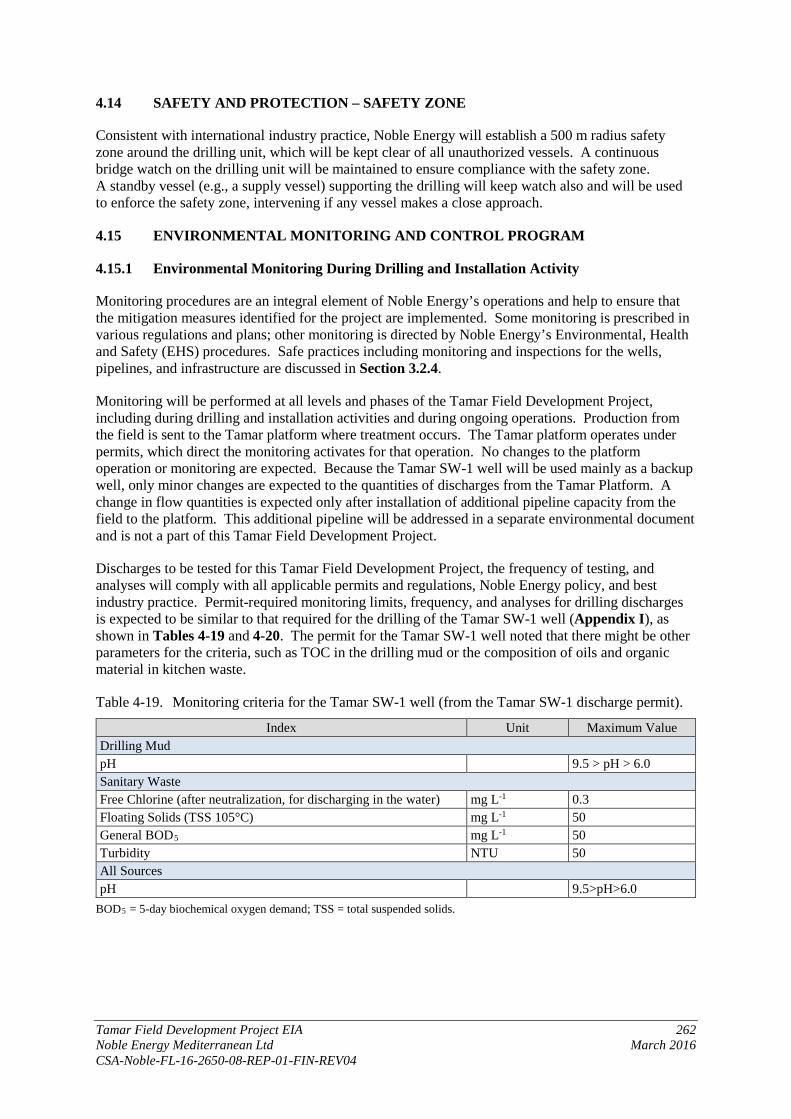
Tamar Field Development Project EIA 262 Noble Energy Mediterranean Ltd March 2016 CSA-Noble-FL-16-2650-08-REP-01-FIN-REV04
4.14 SAFETY AND PROTECTION – SAFETY ZONE
Consistent with international industry practice, Noble Energy will establish a 500 m radius safety zone around the drilling unit, which will be kept clear of all unauthorized vessels. A continuous bridge watch on the drilling unit will be maintained to ensure compliance with the safety zone. A standby vessel (e.g., a supply vessel) supporting the drilling will keep watch also and will be used to enforce the safety zone, intervening if any vessel makes a close approach.
4.15 ENVIRONMENTAL MONITORING AND CONTROL PROGRAM
4.15.1 Environmental Monitoring During Drilling and Installation Activity
Monitoring procedures are an integral element of Noble Energy’s operations and help to ensure that the mitigation measures identified for the project are implemented. Some monitoring is prescribed in various regulations and plans; other monitoring is directed by Noble Energy’s Environmental, Health and Safety (EHS) procedures. Safe practices including monitoring and inspections for the wells, pipelines, and infrastructure are discussed in Section 3.2.4.
Monitoring will be performed at all levels and phases of the Tamar Field Development Project, including during drilling and installation activities and during ongoing operations. Production from the field is sent to the Tamar platform where treatment occurs. The Tamar platform operates under permits, which direct the monitoring activates for that operation. No changes to the platform operation or monitoring are expected. Because the Tamar SW-1 well will be used mainly as a backup well, only minor changes are expected to the quantities of discharges from the Tamar Platform. A change in flow quantities is expected only after installation of additional pipeline capacity from the field to the platform. This additional pipeline will be addressed in a separate environmental document and is not a part of this Tamar Field Development Project.
Discharges to be tested for this Tamar Field Development Project, the frequency of testing, and analyses will comply with all applicable permits and regulations, Noble Energy policy, and best industry practice. Permit-required monitoring limits, frequency, and analyses for drilling discharges is expected to be similar to that required for the drilling of the Tamar SW-1 well (Appendix I), as shown in Tables 4-19 and 4-20. The permit for the Tamar SW-1 well noted that there might be other parameters for the criteria, such as TOC in the drilling mud or the composition of oils and organic material in kitchen waste.
Table 4-19. Monitoring criteria for the Tamar SW-1 well (from the Tamar SW-1 discharge permit).
Index Unit Maximum Value Drilling Mud pH 9.5 > pH > 6.0 Sanitary Waste Free Chlorine (after neutralization, for discharging in the water) mg L-1 0.3 Floating Solids (TSS 105°C) mg L-1 50 General BOD5 mg L-1 50 Turbidity NTU 50 All Sources pH 9.5>pH>6.0
BOD5 = 5-day biochemical oxygen demand; TSS = total suspended solids.
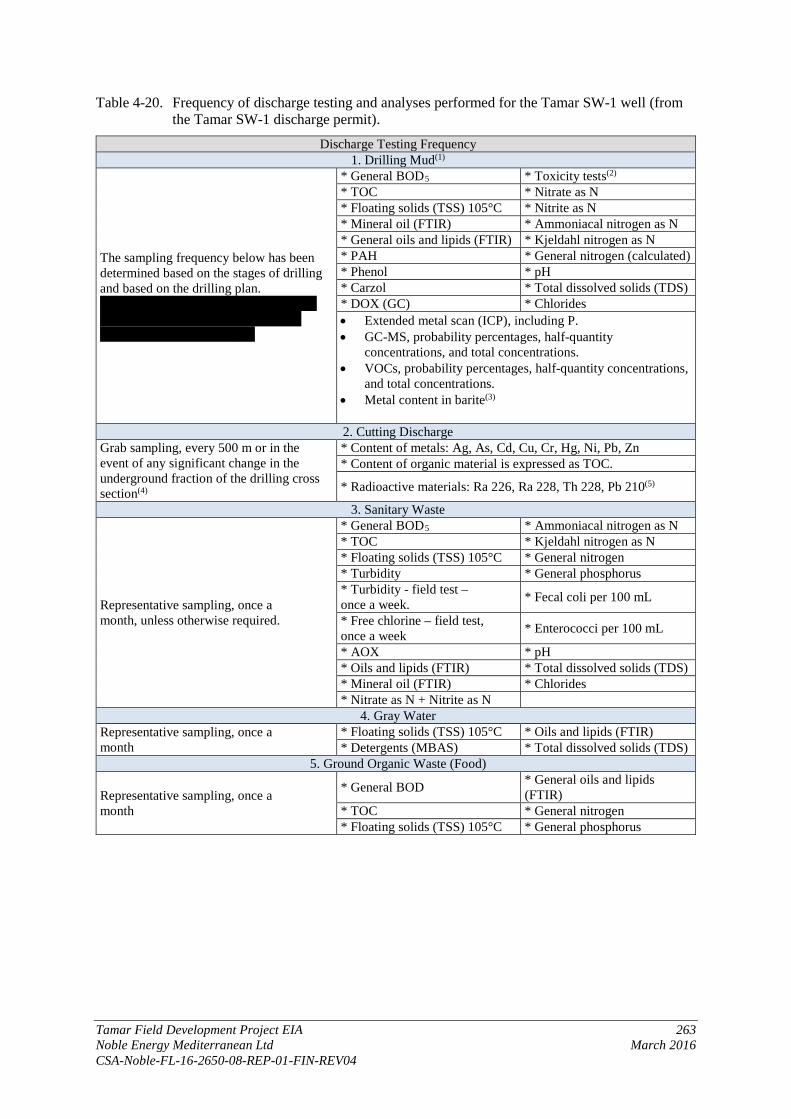
Tamar Field Development Project EIA 263 Noble Energy Mediterranean Ltd March 2016 CSA-Noble-FL-16-2650-08-REP-01-FIN-REV04
Table 4-20. Frequency of discharge testing and analyses performed for the Tamar SW-1 well (from the Tamar SW-1 discharge permit).
Discharge Testing Frequency 1. Drilling Mud(1)
The sampling frequency below has been determined based on the stages of drilling and based on the drilling plan. Grab sampling, in each drilling segment, 26 in., 36 in., 17½ in., 12¼ in., 8½ in. Total of at least four samples
* General BOD5 * Toxicity tests(2) * TOC * Nitrate as N * Floating solids (TSS) 105°C * Nitrite as N * Mineral oil (FTIR) * Ammoniacal nitrogen as N * General oils and lipids (FTIR) * Kjeldahl nitrogen as N * PAH * General nitrogen (calculated) * Phenol * pH * Carzol * Total dissolved solids (TDS) * DOX (GC) * Chlorides • Extended metal scan (ICP), including P. • GC-MS, probability percentages, half-quantity
concentrations, and total concentrations. • VOCs, probability percentages, half-quantity concentrations,
and total concentrations. • Metal content in barite(3)
2. Cutting Discharge Grab sampling, every 500 m or in the event of any significant change in the underground fraction of the drilling cross section(4)
* Content of metals: Ag, As, Cd, Cu, Cr, Hg, Ni, Pb, Zn * Content of organic material is expressed as TOC.
* Radioactive materials: Ra 226, Ra 228, Th 228, Pb 210(5)
3. Sanitary Waste
Representative sampling, once a month, unless otherwise required.
* General BOD5 * Ammoniacal nitrogen as N * TOC * Kjeldahl nitrogen as N * Floating solids (TSS) 105°C * General nitrogen * Turbidity * General phosphorus * Turbidity - field test – once a week. * Fecal coli per 100 mL
* Free chlorine – field test, once a week * Enterococci per 100 mL
* AOX * pH * Oils and lipids (FTIR) * Total dissolved solids (TDS) * Mineral oil (FTIR) * Chlorides * Nitrate as N + Nitrite as N
4. Gray Water Representative sampling, once a month
* Floating solids (TSS) 105°C * Oils and lipids (FTIR) * Detergents (MBAS) * Total dissolved solids (TDS)
5. Ground Organic Waste (Food)
Representative sampling, once a month
* General BOD * General oils and lipids (FTIR)
* TOC * General nitrogen * Floating solids (TSS) 105°C * General phosphorus
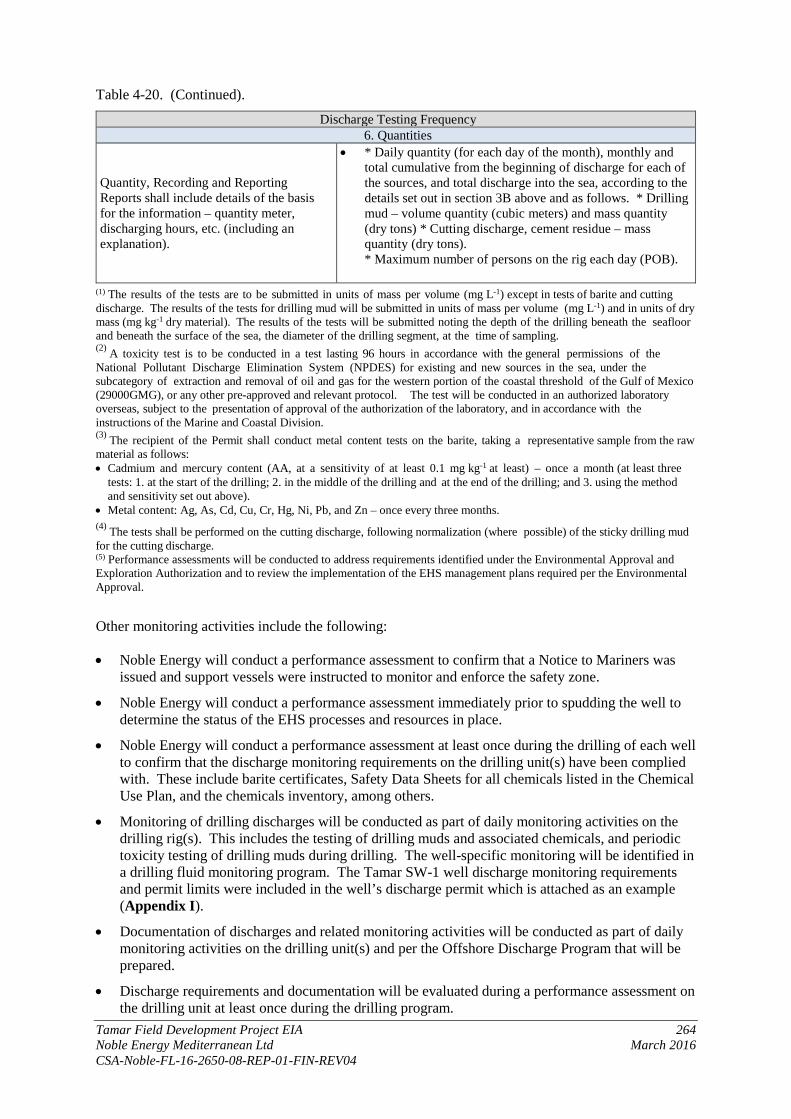
Table 4-20. (Continued).
Tamar Field Development Project EIA 264 Noble Energy Mediterranean Ltd March 2016 CSA-Noble-FL-16-2650-08-REP-01-FIN-REV04
Discharge Testing Frequency 6. Quantities
Quantity, Recording and Reporting Reports shall include details of the basis for the information – quantity meter, discharging hours, etc. (including an explanation).
• * Daily quantity (for each day of the month), monthly and total cumulative from the beginning of discharge for each of the sources, and total discharge into the sea, according to the details set out in section 3B above and as follows. * Drilling mud – volume quantity (cubic meters) and mass quantity (dry tons) * Cutting discharge, cement residue – mass quantity (dry tons). * Maximum number of persons on the rig each day (POB).
(1) The results of the tests are to be submitted in units of mass per volume (mg L-1) except in tests of barite and cutting discharge. The results of the tests for drilling mud will be submitted in units of mass per volume (mg L-1) and in units of dry mass (mg kg-1 dry material). The results of the tests will be submitted noting the depth of the drilling beneath the seafloor and beneath the surface of the sea, the diameter of the drilling segment, at the time of sampling. (2) A toxicity test is to be conducted in a test lasting 96 hours in accordance with the general permissions of the National Pollutant Discharge Elimination System (NPDES) for existing and new sources in the sea, under the subcategory of extraction and removal of oil and gas for the western portion of the coastal threshold of the Gulf of Mexico (29000GMG), or any other pre-approved and relevant protocol. The test will be conducted in an authorized laboratory overseas, subject to the presentation of approval of the authorization of the laboratory, and in accordance with the instructions of the Marine and Coastal Division. (3) The recipient of the Permit shall conduct metal content tests on the barite, taking a representative sample from the raw material as follows: • Cadmium and mercury content (AA, at a sensitivity of at least 0.1 mg kg-1 at least) – once a month (at least three
tests: 1. at the start of the drilling; 2. in the middle of the drilling and at the end of the drilling; and 3. using the method and sensitivity set out above).
• Metal content: Ag, As, Cd, Cu, Cr, Hg, Ni, Pb, and Zn – once every three months. (4) The tests shall be performed on the cutting discharge, following normalization (where possible) of the sticky drilling mud for the cutting discharge. (5) Performance assessments will be conducted to address requirements identified under the Environmental Approval and Exploration Authorization and to review the implementation of the EHS management plans required per the Environmental Approval.
Other monitoring activities include the following:
• Noble Energy will conduct a performance assessment to confirm that a Notice to Mariners was issued and support vessels were instructed to monitor and enforce the safety zone.
• Noble Energy will conduct a performance assessment immediately prior to spudding the well to determine the status of the EHS processes and resources in place.
• Noble Energy will conduct a performance assessment at least once during the drilling of each well to confirm that the discharge monitoring requirements on the drilling unit(s) have been complied with. These include barite certificates, Safety Data Sheets for all chemicals listed in the Chemical Use Plan, and the chemicals inventory, among others.
• Monitoring of drilling discharges will be conducted as part of daily monitoring activities on the drilling rig(s). This includes the testing of drilling muds and associated chemicals, and periodic toxicity testing of drilling muds during drilling. The well-specific monitoring will be identified in a drilling fluid monitoring program. The Tamar SW-1 well discharge monitoring requirements and permit limits were included in the well’s discharge permit which is attached as an example (Appendix I).
• Documentation of discharges and related monitoring activities will be conducted as part of daily monitoring activities on the drilling unit(s) and per the Offshore Discharge Program that will be prepared.
• Discharge requirements and documentation will be evaluated during a performance assessment on the drilling unit at least once during the drilling program.

Tamar Field Development Project EIA 265 Noble Energy Mediterranean Ltd March 2016 CSA-Noble-FL-16-2650-08-REP-01-FIN-REV04
• Waste management on the drilling unit will be evaluated during a performance assessment on the drilling unit at least once during the drilling program. Waste tracking documentation and related monitoring activities will be conducted per the Waste Management Program that will be prepared.
• Fuel use will be monitored and estimated air pollutant emissions will be calculated at the termination of drilling activities.
• Noble Energy will conduct performance assessments to confirm instructions were provided to vessel masters and helicopter pilots regarding avoidance of fishing vessels, aquaculture structures, and protected species.
• Waters in the vicinity of the drilling unit will be monitored for oil sheen on a daily basis. If an oil sheen is observed, the source will be identified and steps taken to reduce, minimize, or eliminate (if possible) the discharge if the source is the drilling unit or support vessels.
• Noble Energy will conduct performance assessments at least once during each drilling program to confirm that spill response resources are in place, trained personnel are available on site, and third-party contractors are familiar with spill prevention and response procedures, including notification requirements.
4.15.2 Toxicity Testing
Noble Energy has been asked to perform toxicity testing of drilling fluids and drill cuttings in conjunction with its drilling and production operations in Israel. Currently, there are no existing laboratories in Israel that have the required facilities, resources, or training to conduct such tests. It will therefore be necessary to use laboratories outside Israel for such tests. Noble Energy’s intent will be to contract with laboratories in the United States to perform the needed testing. A report entitled “A Review of Toxicity Testing Evaluating Applicability of Indigenous and Foreign Test Species” has been prepared to examine the use of toxicity tests for the project and is presented in Appendix J. The report discusses toxicity test methods, toxicity test strategies and objectives, and test species selection. It reviews the use of local vs. foreign species and provides recommendations regarding the proposed tests and their applicability to the Israel offshore environment.
Conclusions of the report (Appendix J) are:
• Currently the Eastern Mediterranean lacks the structure needed to conduct toxicity testing. This lack exists for both available laboratories with needed expertise and experience as well as any prior history of testing with local species.
• Although some data may be available for Mediterranean species, it is limited and additional methods and species testing is required to establish suitable local standard test species.
• Well-established laboratories exist in both the North Sea and Gulf of Mexico experienced in conducting toxicity testing using internationally accepted methods for oil and gas operations and chemicals.
• Standard test organisms from these regions are not indigenous to the Eastern Mediterranean. Gulf of Mexico uses temperate species; North Sea testing uses boreal species.
• Research has indicated that sensitivities within species groups tend to be similar across geographic regions (i.e. temperate, Arctic, and boreal species show similar sensitivities to chemical exposures).
• North Sea testing focuses more on toxicity testing against individual compounds while Gulf of Mexico focuses on whole effluent toxicities.
• Testing regimes adopted in both the North Sea and Gulf of Mexico use invertebrates and fishes. Invertebrate tests include pelagic and sediment-dwelling organisms.
• Crustaceans, particularly copepods and mysids, have generally been shown to be the most sensitive species; the copepod Acartia in the North Sea and the mysid Mysidopsis in the Gulf of Mexico are the standard species used in their respective regions.
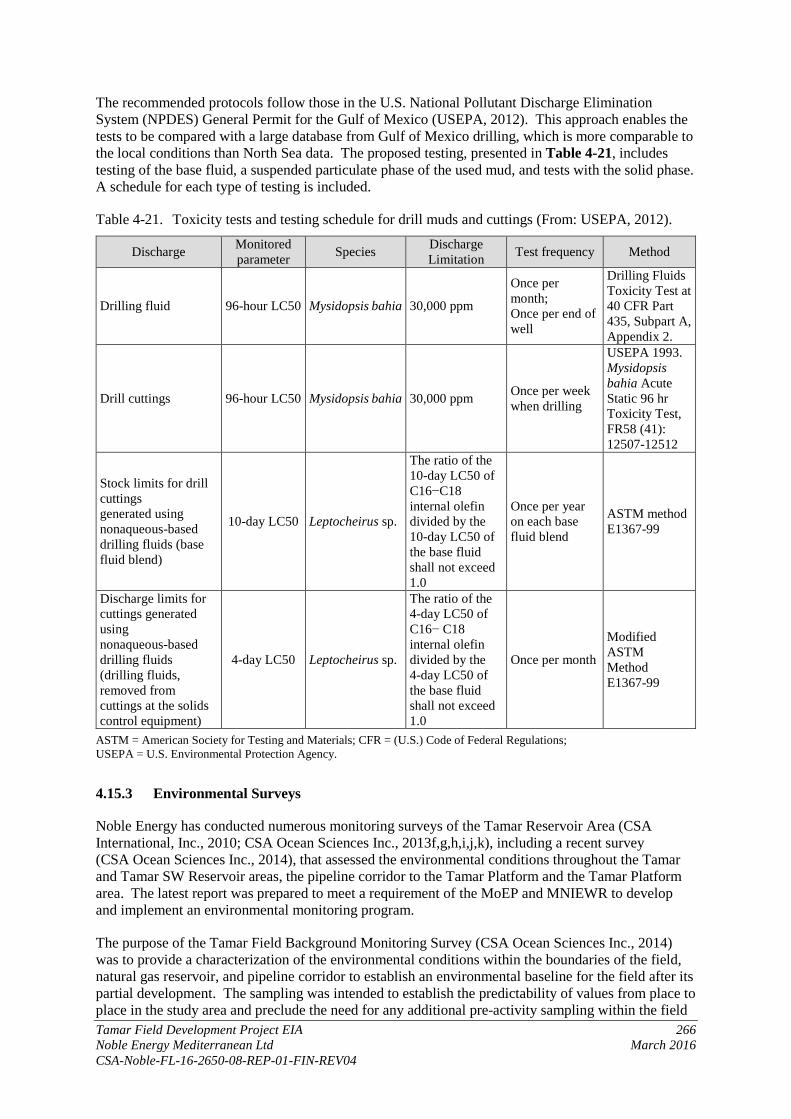
Tamar Field Development Project EIA 266 Noble Energy Mediterranean Ltd March 2016 CSA-Noble-FL-16-2650-08-REP-01-FIN-REV04
The recommended protocols follow those in the U.S. National Pollutant Discharge Elimination System (NPDES) General Permit for the Gulf of Mexico (USEPA, 2012). This approach enables the tests to be compared with a large database from Gulf of Mexico drilling, which is more comparable to the local conditions than North Sea data. The proposed testing, presented in Table 4-21, includes testing of the base fluid, a suspended particulate phase of the used mud, and tests with the solid phase. A schedule for each type of testing is included.
Table 4-21. Toxicity tests and testing schedule for drill muds and cuttings (From: USEPA, 2012).
Discharge Monitored parameter Species Discharge
Limitation Test frequency Method
Drilling fluid 96-hour LC50 Mysidopsis bahia 30,000 ppm
Once per month; Once per end of well
Drilling Fluids Toxicity Test at 40 CFR Part 435, Subpart A, Appendix 2.
Drill cuttings 96-hour LC50 Mysidopsis bahia 30,000 ppm Once per week when drilling
USEPA 1993. Mysidopsis bahia Acute Static 96 hr Toxicity Test, FR58 (41): 12507-12512
Stock limits for drill cuttings generated using nonaqueous-based drilling fluids (base fluid blend)
10-day LC50 Leptocheirus sp.
The ratio of the 10-day LC50 of C16−C18 internal olefin divided by the 10-day LC50 of the base fluid shall not exceed 1.0
Once per year on each base fluid blend
ASTM method E1367-99
Discharge limits for cuttings generated using nonaqueous-based drilling fluids (drilling fluids, removed from cuttings at the solids control equipment)
4-day LC50 Leptocheirus sp.
The ratio of the 4-day LC50 of C16− C18 internal olefin divided by the 4-day LC50 of the base fluid shall not exceed 1.0
Once per month
Modified ASTM Method E1367-99
ASTM = American Society for Testing and Materials; CFR = (U.S.) Code of Federal Regulations; USEPA = U.S. Environmental Protection Agency.
4.15.3 Environmental Surveys
Noble Energy has conducted numerous monitoring surveys of the Tamar Reservoir Area (CSA International, Inc., 2010; CSA Ocean Sciences Inc., 2013f,g,h,i,j,k), including a recent survey (CSA Ocean Sciences Inc., 2014), that assessed the environmental conditions throughout the Tamar and Tamar SW Reservoir areas, the pipeline corridor to the Tamar Platform and the Tamar Platform area. The latest report was prepared to meet a requirement of the MoEP and MNIEWR to develop and implement an environmental monitoring program.
The purpose of the Tamar Field Background Monitoring Survey (CSA Ocean Sciences Inc., 2014) was to provide a characterization of the environmental conditions within the boundaries of the field, natural gas reservoir, and pipeline corridor to establish an environmental baseline for the field after its partial development. The sampling was intended to establish the predictability of values from place to place in the study area and preclude the need for any additional pre-activity sampling within the field

Tamar Field Development Project EIA 267 Noble Energy Mediterranean Ltd March 2016 CSA-Noble-FL-16-2650-08-REP-01-FIN-REV04
or pipeline corridor. A survey of the Tamar Field was conducted in two stages. The first stage was conducted from 22 to 26 March 2013 and consisted of video, hydrographic profiling data, near-bottom water samples, and sediment and infaunal samples collected in proximity (~2 km) to the Tamar wellsites. The second stage was conducted from 9 to 13 February 2014 and consisted of hydrographic profiling data, water column samples, and sediment and infaunal samples collected throughout the Tamar Field. Additionally, a survey of the Tamar pipeline corridor was conducted from 26 to 31 March 2013 and consisted of sediment samples collected in close proximity (within 50 m) of the pipeline.
The Tamar Field Background Monitoring Survey design consisted of a uniform grid, superimposed over the natural gas reservoir, in which the center point of each grid cell was sampled. Grid cells containing previously sampled locations were not re-sampled. Data from previously sampled locations within a grid cell were averaged and assigned to the center point of that cell. The physical, chemical, geological, and biological environmental conditions were inspected for spatial variation within the study area by using geostatistical techniques based on the computation of semivariance and interpolation by kriging. The kriged data were used to assess existing effects from drilling discharges and infrastructure development through the comparison of deviations from regional ambient background values typical of the eastern Levantine Basin and internationally and locally accepted environmental standards. Additionally, the data will be used to provide information on further deviations from ambient conditions and environmental standards due to the potential effects of future development within the field. The survey design along the pipeline corridor consisted of a stratified random sampling design in which samples were randomly divided among strata that were defined by water depth. As this report is establishing the current baseline for the survey region, interpretation of data from along the pipeline is primarily descriptive; however, statistical comparisons with Levantine Basin means are provided.
Collectively, the monitoring surveys provide the necessary baseline information to support future monitoring of the environment to evaluate potential impacts from Noble Energy’s activities in the Tamar Reservoir Area. Previously prepared EIAs for the Tamar Reservoir Area also contribute information to facilitate the evaluation of spatial and temporal changes in the potentially impacted environment (CSA International, Inc., 2012; CSA Ocean Sciences Inc., 2013l). Noble Energy will continue to perform periodic surveys at specific sites and in the entire lease area. The sampling design used to date within the Tamar Field has been developed to ensure the environment within the reservoir footprint is characterized sufficiently by geostatistical methods so that no additional pre-activity survey (i.e., pre-drill surveys) will be required.
Additionally, surveys specific to post-drill analysis of each new wellsite will be conducted as per regulations. Area-wide monitoring surveys of the Tamar Field will be conducted periodically. Seawater and sediment parameters specific to the post-drill analysis and area-wide monitoring surveys are found in Tables 4-22 and 4-23.
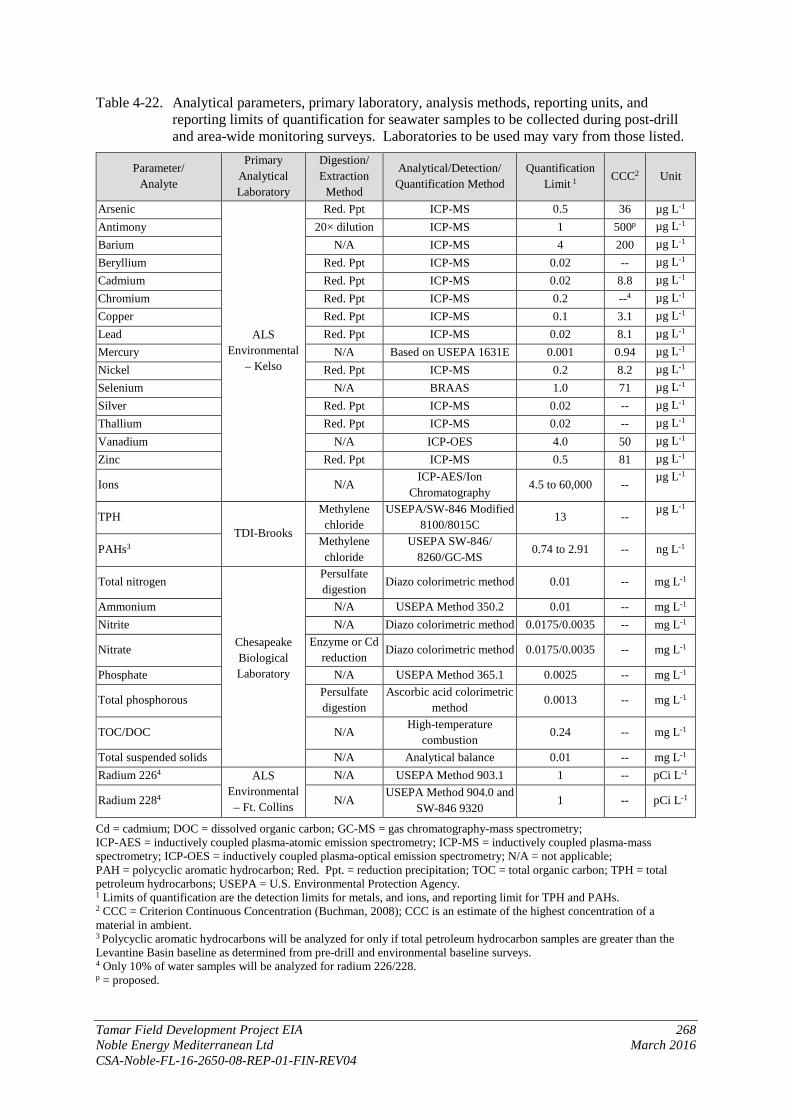
Tamar Field Development Project EIA 268 Noble Energy Mediterranean Ltd March 2016 CSA-Noble-FL-16-2650-08-REP-01-FIN-REV04
Table 4-22. Analytical parameters, primary laboratory, analysis methods, reporting units, and reporting limits of quantification for seawater samples to be collected during post-drill and area-wide monitoring surveys. Laboratories to be used may vary from those listed.
Parameter/ Analyte
Primary Analytical Laboratory
Digestion/ Extraction
Method
Analytical/Detection/ Quantification Method
Quantification Limit 1 CCC2 Unit
Arsenic
ALS Environmental
– Kelso
Red. Ppt ICP-MS 0.5 36 µg L-1 Antimony 20× dilution ICP-MS 1 500p µg L-1 Barium N/A ICP-MS 4 200 µg L-1 Beryllium Red. Ppt ICP-MS 0.02 -- µg L-1 Cadmium Red. Ppt ICP-MS 0.02 8.8 µg L-1 Chromium Red. Ppt ICP-MS 0.2 --4 µg L-1 Copper Red. Ppt ICP-MS 0.1 3.1 µg L-1 Lead Red. Ppt ICP-MS 0.02 8.1 µg L-1 Mercury N/A Based on USEPA 1631E 0.001 0.94 µg L-1 Nickel Red. Ppt ICP-MS 0.2 8.2 µg L-1 Selenium N/A BRAAS 1.0 71 µg L-1 Silver Red. Ppt ICP-MS 0.02 -- µg L-1 Thallium Red. Ppt ICP-MS 0.02 -- µg L-1 Vanadium N/A ICP-OES 4.0 50 µg L-1 Zinc Red. Ppt ICP-MS 0.5 81 µg L-1
Ions N/A ICP-AES/Ion
Chromatography 4.5 to 60,000 --
µg L-1
TPH TDI-Brooks
Methylene chloride
USEPA/SW-846 Modified 8100/8015C
13 -- µg L-1
PAHs3 Methylene chloride
USEPA SW-846/ 8260/GC-MS
0.74 to 2.91 -- ng L-1
Total nitrogen
Chesapeake Biological Laboratory
Persulfate digestion Diazo colorimetric method 0.01 -- mg L-1
Ammonium N/A USEPA Method 350.2 0.01 -- mg L-1 Nitrite N/A Diazo colorimetric method 0.0175/0.0035 -- mg L-1
Nitrate Enzyme or Cd reduction
Diazo colorimetric method 0.0175/0.0035 -- mg L-1
Phosphate N/A USEPA Method 365.1 0.0025 -- mg L-1
Total phosphorous Persulfate digestion
Ascorbic acid colorimetric method 0.0013 -- mg L-1
TOC/DOC N/A High-temperature combustion
0.24 -- mg L-1
Total suspended solids N/A Analytical balance 0.01 -- mg L-1 Radium 2264 ALS
Environmental – Ft. Collins
N/A USEPA Method 903.1 1 -- pCi L-1
Radium 2284 N/A USEPA Method 904.0 and
SW-846 9320 1 -- pCi L-1
Cd = cadmium; DOC = dissolved organic carbon; GC-MS = gas chromatography-mass spectrometry; ICP-AES = inductively coupled plasma-atomic emission spectrometry; ICP-MS = inductively coupled plasma-mass spectrometry; ICP-OES = inductively coupled plasma-optical emission spectrometry; N/A = not applicable; PAH = polycyclic aromatic hydrocarbon; Red. Ppt. = reduction precipitation; TOC = total organic carbon; TPH = total petroleum hydrocarbons; USEPA = U.S. Environmental Protection Agency. 1 Limits of quantification are the detection limits for metals, and ions, and reporting limit for TPH and PAHs. 2 CCC = Criterion Continuous Concentration (Buchman, 2008); CCC is an estimate of the highest concentration of a material in ambient. 3 Polycyclic aromatic hydrocarbons will be analyzed for only if total petroleum hydrocarbon samples are greater than the Levantine Basin baseline as determined from pre-drill and environmental baseline surveys. 4 Only 10% of water samples will be analyzed for radium 226/228. p = proposed.

Tamar Field Development Project EIA 269 Noble Energy Mediterranean Ltd March 2016 CSA-Noble-FL-16-2650-08-REP-01-FIN-REV04
Table 4-23. Analytical parameters, analytical laboratory, analysis methods, reporting units, reporting/limits of quantification, and sediment quality guidelines (effects range low [ERL] and effects range median [ERM]; Buchman, 2008) for sediment samples to be collected during post-drill and area-wide monitoring surveys. Laboratories to be used may vary from those listed.
Parameter/ Analyte
Analytical Laboratory
Digestion/ Extraction
Method
Analytical/Detection/ Quantification Method
Quantification Limit ERL ERM Units
Particle size distribution Weatherford
N/A Laser diffraction particle size analysis 0.1 -- -- μm
TOC N/A Based on European Standard Norm 1484 5 -- -- ppm
Aluminum
ALS Environmental
– Kelso
HF1 ICP-OES 25 -- -- ppm Antimony HF1 ICP-MS 0.4 -- -- ppm Arsenic HF1 ICP-MS 4.0 8.2 70 ppm Barium HF1 ICP-OES 10.0 -- -- ppm Beryllium HF1 ICP-MS 0.16 -- -- ppm Cadmium HF1 ICP-MS 0.16 1.2 9.6 ppm Chromium HF1 ICP-MS 11.6 81 370 ppm Copper HF1 ICP-MS 0.8 34 270 ppm Iron HF1 ICP-OES 50 -- -- ppm Lead HF1 ICP-MS 0.4 46.7 218 ppm
Mercury HNO3/H2SO4 Based on USEPA
1631E 0.001 0.15 0.71 ppm
Nickel HF1 ICP-MS 1.6 20.9 51.6 ppm Selenium HF1 ICP-MS 8 -- -- ppm Silver HF1 ICP-MS 0.16 1 3.7 ppm Thallium HF1 ICP-MS 0.16 -- -- ppm Vanadium HF1 ICP-MS 1.6 -- -- ppm Zinc HF1 ICP-MS 4 150 410 ppm
TPH
TDI-Brooks
Methylene chloride
USEPA/SW-846 Modified 8100/8015C 1.4 -- -- µg g-1
PAHs2 Methylene chloride
USEPA SW-846/8260/
GC-MS 0.342 – 0.041 5523
4,0024 3,1603 44,7924 ng/g
Radium 2265 ALS Environmental – Ft. Collins
N/A USEPA Method 901.1 1 -- -- pCi g-1 Radium 2285 N/A USEPA Method 901.1 1 -- -- pCi g-1 Thorium 2285 N/A USEPA, EMSL/LV 0.2 -- -- pCi g-1 EMSL/LV = Environmental Monitoring Systems Laboratory, Las Vegas; GC-MS = gas chromatography-mass spectrometry; HF = hydrofluoric acid; HNO3 = nitric acid; H2SO4 = sulfuric acid; ICP-MS = inductively coupled plasma-mass spectrometry; ICP-OES = inductively coupled plasma-optical emission spectrometry; ISO = International Organization for Standardization; N/A = not applicable; TOC = total organic carbon; TPH = total petroleum hydrocarbons; USEPA = U.S. Environmental Protection Agency. 1 This digestion procedure results in the release of nearly all the metal content of a sample and it is believed to be a more accurately estimate of the metal concentrations in all sample matrices. 2 PAHs = polycyclic aromatic hydrocarbons; PAHs will be analyzed for only if TPH concentrations are greater than the Levantine Basin baseline as determined from pre-drill and environmental baseline surveys. 3 Low molecular weight polycyclic aromatic hydrocarbons. 4 Total polycyclic aromatic hydrocarbons. 5 Only 10% of sediment samples will be analyzed for radium 226, radium 228, and thorium 228.
Tamar Field Development Project EIA 270 Noble Energy Mediterranean Ltd March 2016 CSA-Noble-FL-16-2650-08-REP-01-FIN-REV04
4.16 CLOSURE AND ABANDONMENT
The design life of the equipment to be installed for the Tamar Field Development Project is 30 years. Ongoing environmental monitoring during the operational period of the field will be available to identify and define environmental impacts of the project and to guide the planning process for closure and abandonment. The closure, removal, and/or abandonment of the facilities will be performed in a manor to minimize significant impacts on the environment. All materials that could impact the environment will be removed, and site clearance activities will be conducted. All activities will be performed in accordance with applicable regulations and best industry practice.
A Decommissioning and Abandonment Plan will be submitted by Noble Energy (see Section 5.2.12) which will describe the expected process to be followed.

Tamar Field Development Project EIA 271 Noble Energy Mediterranean Ltd March 2016 CSA-Noble-FL-16-2650-08-REP-01-FIN-REV04
CHAPTER 5: PROPOSAL FOR APPLICATION GUIDELINES (MITIGATION)
5.1 OVERVIEW
This section outlines Noble Energy’s Environmental management practices and a review of the mitigation and abatement actions to be implemented and followed to protect the environment during the Tamar Field drilling and completion activities.
5.1.1 Noble Energy Environmental Health and Safety Management
Environmental, Health and Safety management of Noble Energy activities is implemented through a hierarchy of policies, plans, and procedures that cascade from the corporate level to the business units and their individual operations. Based on these high level policies, Noble Energy Israel is developing an Operations Management System (OMS) that provides specific procedures and guidelines for implementing its EHS systems.
The OMS provides a framework for establishing performance goals and incorporates Noble Energy’s legal requirements and best practices into an umbrella framework within a model that integrates elements from both Safety and Health Management Systems and Environmental Management Systems. The OMS provides the framework for implementing a program designed to make offshore gas development safe for workers and protect the environment.
The OMS will be implemented across offshore operations and is applied to third-party contractors involved in drilling and other support activities. This ensures that all levels of operations are performed in a consistent manner such that safety and environmental protection are consistently achieved. The integration of the Noble Energy OMS and contractor operations will be implemented through Bridging Documents that identify common processes and approaches to address any differences in procedures between Noble Energy and the contractor as well as any site-specific hazards of the Tamar Field drilling and completion activities. Noble Energy will conduct an extensive comparison and review of vessel plans, processes, and procedures relative to the Noble Energy OMS to ensure that the contractor’s plans are acceptable for use as the primary system during the Tamar Field drilling and completion activities.
5.1.2 Environmental Policy
As part of its OMS, Noble Energy is developing an Environmental Management System (EMS) based on an environmental policy that stresses development of the energy resources in a responsible manner and working diligently to reduce risks to the environment and human health. Noble Energy is committed to ensuring compliance with applicable EHS legislation, implementing best practice standards where laws do not exist, and mitigating risk while protecting the environment and the communities where the company operates.
5.2 GUIDELINES AND PLANS
5.2.1 Drilling and Production Test Performance
• Noble Energy takes a risk assessment approach that analyzes safety and environmental hazards and establishes procedures, work practices, training programs, and equipment requirements, including monitoring and maintenance rules. Risk assessment and mitigation measures will be extended to requirements for its contractors and subcontractors who provide services and materials for the drilling program.

Tamar Field Development Project EIA 272 Noble Energy Mediterranean Ltd March 2016 CSA-Noble-FL-16-2650-08-REP-01-FIN-REV04
• All drilling operations will be conducted in compliance with a series of operational procedures and instructions, including prescribed drilling procedures, well control procedures, and work instructions.
• Drilling operations will be conducted using industry best practice. The installation, maintenance, and testing of the blowout preventer (BOP) will follow prescribed safety protocols.
• Drilling operations will comply with the drilling unit well control standards, including adherence to safe drilling practices. All drill string sections will be properly cemented to assure well integrity. At the completion of drilling, the well will be properly abandoned per current industry best practice and will adhere to the drilling unit well control standards.
• Employees and contractors will be trained to be cognizant of company and industry practices to prevent major incidents.
5.2.2 Handling of Hazardous Materials
• Hazardous materials will be handled in accordance with their Safety Data Sheet (SDS) specified guidelines, as integrated into the operator’s guidelines for handling hazardous materials. All hazardous materials will be properly identified, stored, and handled per SDS requirements and in such a manner that secures no spill or discharge to sea. In addition, hazardous materials will be handled with SDS-based exposure limits.
• Storage areas of hazardous materials will be designated on the drilling unit in areas isolated from other operations. Those storage areas will be maintained in clean condition with no residues or spilled materials on the container, floor, or surrounding area.
• Hazardous waste streams will be segregated by type according to their SDS and will not be mixed together or managed in the same container with nonhazardous wastes.
• Separate storage locations or sufficient space or barriers will be provided to enable the segregation of incompatible chemicals.
• All hazardous and nonhazardous waste materials will be properly stored in containers that are nonleaking and compatible with the waste being stored. All containers will have their lids, rings, covers, bungs, and other means of closure properly installed at all times except when waste is being added or removed.
• Hazardous wastes will be handled in compliance with Israel's specific hazardous waste handling guidelines and guidelines as detailed in the drilling unit environmental management procedures
• Firefighting Equipment will be available on board.
5.2.3 Reduction and Prevention of Harm to Seafloor, Seawater, and the Coastline Including Marine Ecology, Cultural and Heritage Sites, Fishing, and Marine Farming
• All discharges to the sea will be according to the discharge permit provisions. • The operator will maintain the solid control equipment (e.g., shakers, centrifuges, screens) in
operating condition. • The operator will maintain the Marine Sanitary Device in operating condition. • Drilling will be done using a combination of WBM and MOBM. The first two initial well
intervals (before the marine riser is set) will be drilled using a water-based mud. Once the marine riser is set, allowing mud and cuttings to be returned to the drilling unit, the remaining well intervals will be drilled with MOBM.
• Low-toxicity drilling fluids shall be used. The base fluid for the MOBM system, ESCAID 110, is a highly refined product with low toxicity and low aromatic content. According to the SDS (Appendix F), the base fluid is readily biodegradable and not expected to be harmful or exhibit chronic toxicity to marine organisms.
Tamar Field Development Project EIA 273 Noble Energy Mediterranean Ltd March 2016 CSA-Noble-FL-16-2650-08-REP-01-FIN-REV04
• Cuttings from MOBM well intervals will be treated in a thermomechanical cuttings cleaner (TCC) onboard the drilling unit to reduce the MOBM retention on cuttings not greater than 1% by dry weight in accordance with the effluent limitations used in the North Sea/OSPAR1 region (OSPAR Decision 2000/3).
• As part of its post-drilling surveys, Noble Energy will conduct a post-drilling ROV survey at each drillsite to ensure that the seafloor is clear of equipment and debris from drilling and completion activities.
• Noble Energy will implement a 305-m radius avoidance zone for any contacts with potential wreck sites and a 31-m radius avoidance zone for any contacts that may represent associated debris. No seafloor-disturbing activities will be conducted within these avoidance zones.
• Noble Energy will operate in accordance with guidelines developed by OGP/IPIECA2 (2010) to increase awareness of Alien Invasive Species (AIS) risks and to prepare and plan for, avoid, and monitor for such impacts throughout the project life cycle.
• The drilling unit will have a Ballast Water Management Plan and be equipped with an International Maritime Organization (IMO)-approved ballast water management system to minimize the potential for introducing AIS.
• The risk of solid waste being lost overboard (where it could pose a potential harm to the seafloor or to the coastline) will be minimized through Noble Energy’s waste management, procedures, and the drilling rig operator’s Garbage Management Plan as required by MARPOL Annex V and Israel Regulation.
• Prior to commencing the Tamar Field drilling and completion program, Noble Energy will issue a Notice to Mariners to inform fishing vessels and other vessel operators of planned vessel movements and the buffer zone around the drilling unit.
• In the event of a spill, the response would take into account the fishing and marine farming areas as well as give high priority for protection, response, and cleanup strategies regarding predominant habitat types in case the spill reaches the coast.
5.2.4 Preservation of Fauna and Flora, Including Pelagic Species
• Low-toxicity drilling fluids shall be used. The base fluid for the MOBM system, ESCAID 110, is a highly refined product with low toxicity and low aromatic content. According to the SDS the base fluid is readily biodegradable and not expected to be harmful or exhibit chronic toxicity to marine organisms.
• The risk of solid waste being lost overboard (where it could pose a risk of entanglement or ingestion by marine fauna) will be minimized through Noble Energy’s waste management, procedures, and the drilling unit operator’s Garbage Management Plan as required by MARPOL Annex V and Israel Regulation.
• To the extent practicable without compromising safety or work performance, lighting in open deck areas shall be oriented downwards to maximize work areas and minimize excess light emissions into the environment and potential harm to birds and pelagic species, when feasible and when vessel navigational safety is not compromised.
• As part of its post-drilling surveys, Noble Energy will conduct a post-drilling ROV survey at each drillsite to ensure that the seafloor is clear of equipment and debris from drilling and completion activities that can cause harm to the marine fauna and flora.
1 OSPAR is the Convention for the Protection of the Marine Environment of the North-East Atlantic (http://www.ipieca.org/). 2 International Oil and Gas Producers and IPIECA (the global oil and gas industry association for environmental and social issues (http://www.ipieca.org/).

Tamar Field Development Project EIA 274 Noble Energy Mediterranean Ltd March 2016 CSA-Noble-FL-16-2650-08-REP-01-FIN-REV04
• Support vessel operators are expected to follow all applicable maritime navigation rules and would normally follow the most direct route (weather conditions permitting) between the drillsites and the shore base. This will reduce the chance for a vessel striking a marine mammal or sea turtle.
5.2.5 Discharge Monitoring Procedures
• Noble Energy has conducted a wide field sampling program that established the baseline for water and sediment quality and infaunal communities. A Pre-drilling ROV survey is conducted to establish a baseline of the seafloor surroundings around each drillsite.
• As part of Noble Energys' post-drilling surveys, a post-drilling ROV survey shall be conducted to ensure that the seafloor around each drillsite is clear of equipment and debris.
• A monitoring program shall be prepared and conducted following completion of drilling. This Post-Drilling Monitoring survey shall include sampling of seawater, sediments, and infauna. Reporting of results will include comparison of pre-drilling and post-drilling survey results.
• As discussed in Section 4.15, discharges shall be monitored according to discharge permit requirements. The nature and frequency of testing are outlined in Tables 4-20 and 4-21
• Mud samples will be taken for every drilling section in compliance with discharge permit requirements, including the periodic toxicity testing of drilling muds during drilling.
• Noble Energy has conducted water current monitoring at current meter moorings in the Tamar Field.
• Waters in the vicinity of the drilling unit shall be visually monitored for oil sheen on a daily basis.
5.2.6 Preventing/Reducing Light Hazards
• To the extent practicable without compromising safety or work performance, lighting in open deck areas shall be oriented downwards to maximize work areas and minimize excess lighting of the sea surface, when feasible and when vessel navigational safety is not compromised.
• Navigational lighting on board the drilling unit and supply vessels will meet Safety of Life at Sea (SOLAS) requirements according to IMO Resolution MSC.253(83) or equivalent requirements.
• Helicopter flight decks shall use perimeter lighting in accordance with international standards.
5.2.7 Reducing Air Emissions
• All drilling unit and support vessel engines, generators, and other emission sources will be operated and maintained in accordance with manufacturers’ recommendations to avoid excessive emissions.
• The drilling unit and supply vessels will comply with applicable MARPOL Annex VI regulations.
• During drilling of the well, every attempt will be made to ensure that no H2S gas is released into the atmosphere. This will be done by keeping the wellbore full of drilling mud that is of sufficient density to exert a hydrostatic pressure greater than formation pressure, which will ensure that no influx into the wellbore will occur.
• Mud logging personnel will install and maintain H2S detection equipment at strategic locations on the rig. The Control Room Operator and supervisory personnel will be alerted should H2S be detected.
5.2.8 Measures for Preventing or Reducing Noise
• Drilling unit and support vessel engines will be operated and maintained in accordance with manufacturers’ specifications to avoid excessive noise.

Tamar Field Development Project EIA 275 Noble Energy Mediterranean Ltd March 2016 CSA-Noble-FL-16-2650-08-REP-01-FIN-REV04
5.2.9 Drilling Mud and Cuttings
• Drilling will be done using a combination of WBM and MOBM. The first two initial well intervals (before the marine riser is set) will be drilled using a water-based mud. Once the marine riser is set, allowing mud and cuttings to be returned to the drilling unit, the remaining well intervals will be drilled with MOBM.
• Low-toxicity drilling fluids shall be used. The base fluid for the MOBM system, ESCAID 110, is a highly refined product with low toxicity and low aromatic content. According to the SDS (Appendix F), the base fluid is readily biodegradable and not expected to be harmful or exhibit chronic toxicity to marine organisms.
• Cuttings from MOBM well intervals will be treated in a TCC onboard the drilling unit to reduce the MOBM retention on cuttings not greater than 1% by dry weight in accordance with the effluent limitations used in the North Sea/OSPAR region (OSPAR Decision 2000/3).
• Simulation modeling has been conducted to evaluate the potential deposition of cuttings on the seafloor around the drillsites.
5.2.10 Other Discharges
• All drilling unit discharges to sea will comply with the appropriate requirements of MARPOL Annex I (oil pollution prevention), Annex IV (sewage pollution prevention), Annex V (garbage pollution prevention), and the discharge permit requirements.
• Sanitary waste will pass through an IMO-approved sewage treatment plant prior to discharge to sea.
• Gray water will be discharged to sea without treatment.
• Food waste will be macerated to pass through a 25-mm mesh in accordance with MARPOL Annex V requirements.
• Cooling water, desalination brine, and deck drainage from non-machinery areas will be discharged without treatment as these effluents do not contain any added chemicals or contaminants.
• Bilge water and deck drainage from machinery areas will pass through an oil-water separator prior to discharge to sea (in accordance with MARPOL Annex I requirements) or be retained on board to be disposed of onshore.
• The drilling unit will have a Ballast Water Management Plan and be equipped with an IMO-approved ballast water management system to minimize the risk of introducing AIS.
5.2.11 Safety and Protection Zones
• Noble Energy will establish a 500 m radius safety zone around the drilling rigs, which will be kept clear of all unauthorized vessels. A continuous bridge watch on the drilling unit will be maintained to ensure compliance with the safety zone.
• Navigational markings on board the drilling unit and supply vessels will meet SOLAS requirements as per IMO Resolution MSC.253(83) or equivalent requirements.
• Prior to commencing the Tamar Field drilling and completion program, Noble Energy will consult with Ministry of Transportation and provide Notice to Mariners to inform the public of planned vessel movements and the safety zone around the drilling unit.
Tamar Field Development Project EIA 276 Noble Energy Mediterranean Ltd March 2016 CSA-Noble-FL-16-2650-08-REP-01-FIN-REV04
5.2.12 Waste Treatment and Removal
• All wastes shall be handled and disposed according to MARPOL regulations and permit requirements.
• All waste materials shall be stored properly in containers that are non-leaking and compatible with the waste being stored. All containers will have their lids, rings, covers, bungs, and other means of closure properly installed at all times except when waste is being added or removed.
• Waste containers will be stored in these areas prior to processing or shipment to the contract waste handling vendor.
5.2.13 Emergency Procedures
• Noble Energy will update the Oil Spill Contingency Plan (OSCP) to reflect Tamar drilling activities. The plan will be submitted to MoEP.
• Accidental spills shall be reported to the relevant authorities.
• Noble Energy’s OSCP outlines Tier II and III equipment and resource requirements. Noble Energy will maintain appropriate oil spill response and cleanup equipment and supplies to efficiently address spill incidents.
• Noble Energy requires the drilling unit contractor(s) to have Emergency Response Plans to deal specifically with the actions to be taken in the event of emergencies.
• Noble Energy and the drilling unit contractor will coordinate their incident management processes in the event of an emergency that requires emergency response coordination via incident management teams.
• Emergency response capabilities of equipment and personnel shall be tested through regular drills and exercises and drills to familiarize personnel with the emergency response procedures.
• Equipment stockpiles onshore and aboard supply vessels shall be routinely checked.
• Noble Energy conducts oil spill dispersion modeling to determine likely trajectories and resources at risk.
5.2.14 Geological and Seismic Risks
• Noble Energy commissioned a 3D geohazards survey of the Tamar Field. The findings from the geohazards survey were taken into account in the siting of the proposed drillsites. Noble Energy will commission a 3D geohazard assessment (Well Clearance Letter) for each drillsite.
• The response to any spills resulting from an earthquake or other emergency would be conducted in accordance with Noble Energy’s OSCP.
5.2.15 Periodical Reporting and Incident Notification
• Periodical reporting shall be done according to the specific requirements laid out in the discharge permit.
• Incident notification shall be done according to Noble Energy's incident notification procedure.
5.2.16 Changes in Development Plan
• Noble Energy will periodically report any changes in the drilling and completion plan, including the impact of such changes on the environment.
Tamar Field Development Project EIA 277 Noble Energy Mediterranean Ltd March 2016 CSA-Noble-FL-16-2650-08-REP-01-FIN-REV04
5.2.17 Wellsite Abandonment and Rehabilitation
Noble Energy Mediterranean Ltd, as the Operator of Lease No. I/12 Tamar, will prepare a document to submit to the Petroleum Commissioner in accordance with the requirements set forth by Section 19 of the Permit to Operate (2013), Section 27 of Lease No. I/12 Tamar (2009), and the Abandonment Guidelines set forth by the State of Israel in the NFT_377 (2014). The plan will present an overview of the relevant regulations and proposed methods for decommissioning and abandonment of the Tamar facilities.
5.2.18 Coordination Team and Reporting
Noble Energy shall nominate its representative to the Coordination Team, by request of the MEWR.
5.2.19 Periodical Reporting of Faults to the Petroleum Commissioner and of Environmental Issues to the Ministry for Environmental Protection
Drilling permits include specific reporting requirements. Noble Energy will report faults or exceptional incidents to the Petroleum Commissioner and report any significant environmental issues to the MNIEWR. The team will periodically report any changes in the drilling and completion plan, including the impact of such changes on the environment.

Tamar Field Development Project EIA 278 Noble Energy Mediterranean Ltd March 2016 CSA-Noble-FL-16-2650-08-REP-01-FIN-REV04
CHAPTER 6: LITERATURE CITED
Abbriano, R.M., M.M. Carranza, S.L. Hogle, R.A. Levin, A.N. Netburn, K.L. Seto, and S.M. Snyder. 2011. Deepwater Horizon Oil Spill: A Review of the Planktonic Response. Oceanography 24(3):294-301.
Abdel Aal, A., A. El Barkooky, M. Gerits, H.J. Meyer, M. Schwander, and H. Zaki. 2001. Tectonic evolution of the Eastern Mediterranean Basin and its significance for the hydrocarbon prospectivity of the Nile Delta Deepwater Area. GeoArabia 8(3):363-384.
Abdulla, A., M. Gomei, E. Maison, and C. Piante. 2008. Status of marine protected areas in the Mediterranean Sea. IUCN, Malaga and WWF, France.
ACCOBAMS. 2012. Species occurring in the ACCOBAMS area. Updated 3 July 2012. Accessed 15 August 2014 at: http://accobams.org/index.php?option=com_content&view=article&id=867&catid=34&Itemid=63.
Agency for Toxic Substances and Disease Registry. 1990. Toxicological profile for radium. Agency for Toxic Substances and Disease Registry, U.S. Public Health Service, in collaboration with the U.S. Environmental Protection Agency. December 1990. 133 pp.
Al-Mutaz, I.S. 2000. Water desalination in the Arabian Gulf region. M.F.A. Goosen and W.H. Shayya (eds.).
Almagor, G. and J.K. Hall. 1984. Morphology and bathymetry of the Mediterranean continental margin of Israel. Isr. Geol. Surv. Bull. 77:1-31.
Alpert, P. and B. Ziv. 1989. The Sharav cyclone – observations and some theoretical considerations. J. Geophys. Res. 94:18,495-18,514.
Ambrasseys, N.N. 1962. Data for the investigation of the seismic sea-waves in the Eastern Mediterranean. Bull. Seismol. Soc. Am. 52(4):895-913.
AMEC. 2011. Old Harry Drilling Mud and Cuttings Dispersion Modelling. Final Report. Prepared for Corridor Resources Inc., Halifax, NS. Project No. TN11203003. May 2011. 60 pp.
Aquateam COWI AS. 2014. Characterising thermal treated OBM drill cuttings. Sampling, characterisation, environmental analysis and risk assessment of offshore discharges. Report No. 14-028. Oslo, Norway.
Ayers, R.C., Jr., T.C. Sauer, Jr., D. Steubner, and R.P. Meek. 1980a. An environmental study to assess the effect of drilling fluids on water quality parameters during high rate, high volume discharges, pp. 351-381. In: Symposium on Research on Environmental Fate and Effects of Drilling Fluids and Cuttings. American Petroleum Institute, Washington, D.C.
Ayers, R.C., Jr., T.C. Sauer, Jr., R.P. Meek, and G. Bowers. 1980b. An environmental study to assess the impact of drilling discharges in the Mid-Atlantic. I. Quantity and fate of discharges, pp. 382-418. In: Symposium on Research on Environmental Fate and Effects of Drilling Fluids and Cuttings. American Petroleum Institute, Washington, D.C.
Baird, P.H. 1990. Concentrations of seabirds at oil-drilling rigs. Condor 92:768-771.
Bakke, T., J. Klungsøyr, and S. Sanni. 2013. Environmental impacts of produced water and drilling waste discharges from the Norwegian offshore petroleum industry. Marine Environmental Research 92:154-169.Bayon, G., L. Loncke, S. Dupré, J.-C. Caprais, E. Ducassou, S. Duperron, J. Etoubleau, J.-P. Foucher, Y. Fouquet, S. Gontharet, G.M. Henderson, C. Huguen, I. Klaucke, J. Mascle, S. Migeon, K. Olu-Le Roy, H. Ondréas, C. Pierre, M. Sibuet, A. Stadnitskaia, and J. Woodside. 2009. Multi-disciplinary investigation of fluid seepage on an unstable margin: The case of the Central Nile deep sea fan. Mar. Geol. 261:92-104.

Tamar Field Development Project EIA 279 Noble Energy Mediterranean Ltd March 2016 CSA-Noble-FL-16-2650-08-REP-01-FIN-REV04
Bearzi, G., C. Fortuna, and R. Reeves. 2012. Tursiops truncatus (Mediterranean subpopulation). The IUCN Red List of Threatened Species. Version 2014.1. Accessed 9 July 2014 at: http://www.iucnredlist.org.
Bell, K.L.C. and S.A. Fuller (eds.). 2011. New Frontiers in Ocean Exploration: The E/V Nautilus 2010 Field Season. Oceanography 24(1), supplement. 40 pp.
Ben-Tuvia, A. 1953. Mediterranean fishes of Israel. Bull. Sea Fish. Res. Stn. Haifa 8:1-40.
Ben-Tuvia, A. 1971. Revised list of Mediterranean fishes of Israel. Isr. J. Zoo. 20:1-39.
Bethoux, J.C., C. Madec, and B. Gentili. 1992. Phosphorus and nitrogen behaviour in the Mediterranean Sea. Deep-Sea Res. 39:1,641-1,654.
Birding Israel. 2013. What is the Radar at Latrun? Accessed 19 August 2014 at: www.birds.org.il/820-en/Birding-Israel.aspx.
BirdLife International. 2014a. Israel: seabirds. Accessed 15 August 2014 at: http://www.birdlife.org/datazone/speciessearchresults.php?cty=104&cri=&fam=0&gen=0&spc=&cmn=&hab=&thr=&bt=&rec=N&vag=N&sea=Y&wat=&aze=&hdnAction=ADV_SEARCH.
BirdLife International. 2014b. Israel: migratory birds. Accessed 15 August 2014 at: http://www.birdlife.org/datazone/speciessearchresults.php?cty=104&cri=&fam=0&gen=0&spc=&cmn=&hab=&thr=&bt=&rec=N&vag=N&sea=&wat=&aze=&lab=&enb=&mib=Y&hdnAction=ADV_SEARCH&SearchTerms
Boehm, P.D. and J.W. Farrington. 1984. Aspects of the Polycyclic Aromatic Hydrocarbon Geochemistry of Recent Sediments in the Georges Bank Region. Environ. Sci. Technol. 18:840-845.
Boehm, P.D., D. Turton, A. Ravel, D. Caudle, D. French, N. Rabalais, R. Spies, and J. Johnson. 2001. Deepwater Program: Literature Review, Environmental Risks of Chemical Products Used in Gulf of Mexico Deepwater Oil and Gas Operations. Vol. 1. Technical Report. OCS Study MMS 2001-011. U.S. Department of the Interior, Minerals Management Service, Gulf of Mexico OCS Region, New Orleans, LA.
Boothe, P.N. and B.J. Presley. 1989. Trends in sediment trace element concentrations around six petroleum drilling platforms in the northwestern Gulf of Mexico, pp. 3-21. In: F.R. Engelhard, J.P. Ray, and A.H. Gillam (eds.), Drilling Wastes. Elsevier Applied Science, NY.
Borisov, V.P., N.V. Osetrova, V.P. Ponomarenko, and V.N. Semenov. 1994. Impact of the offshore oil and gas developments on the biological resources of the Barents Sea. VNIRO, Moscow. 251 pp. (Russian).
Bourgeois, K. and E. Vidal. 2008. The endemic Mediterranean yelkouan shearwater Puffinus yelkouan: distribution, threats and a plea for more data. Oryx 42(2):187-194.
Brandsma, M.G. and J.P. Smith. 1999. Offshore Operators Committee mud and produced water discharge model – report and user guide. Exxon Production Research Company, December 1999.
Brenner, S. 2003. High-resolution nested model simulations of the climatological circulation in the southeastern Mediterranean Sea. Annal. Geophys. 21:267-280.
Brenner, S. 2014. Assessment of the Near Field Dispersion and Dilution of Pre-Commissioning Fluids Discharged from Pipelines of an Offshore, Deep-Water Drilling Site. Draft report submitted to Noble Energy Mediterranean Ltd. June 2014.
Brenner, S., I. Gertman, and A. Murashkovsky. 2007. Pre-operational ocean forecasting in the southeastern Mediterranean: Model implementation, evaluation, and the selection of atmospheric forcing. J. Mar. Systems 65:268-287

Tamar Field Development Project EIA 280 Noble Energy Mediterranean Ltd March 2016 CSA-Noble-FL-16-2650-08-REP-01-FIN-REV04
Buchman, M.F. 2008. Screening quick reference tables. NOAA OR&R Report 08-1, Seattle WA. Office of Response and Restoration, NOAA. 34 pp.
Byles, R.A. 1989. Satellite telemetry of Kemp’s ridley sea turtle, Lepidochelys kempi, in the Gulf of Mexico. In: S.A. Eckert, K.L. Eckert, and T.H. Richardson (comps.), Proceedings of the Ninth Annual Workshop on Sea Turtle Conservation and Biology, 7-11 February, 1989, Jekyll Island, GA. NOAA Tech. Memo. NMFS-SEFC-232. Miami, FL. 306 pp.
Camiñas, J.A. 2004. Sea turtles of the Mediterranean Sea: population dynamics, sources of mortality and relative importance of fisheries impacts. The Center for Oceanography of Malaga, Spain. Papers presented at the Expert Consultation on Interactions between Sea Turtles and Fisheries within an Ecosystem Context, Rome, 9-12 March 2004. FAO Fisheries Report No. 738, Supplement. Accessed 15 August 2014 at: ftp://ftp.fao.org/docrep/fao/007/y5750e/y5750e00.pdf.
Cantin, J., J. Eyraud, and C. Fenton. 1990. Quantitative estimates of garbage generation and disposal in the U.S. maritime sectors before and after MARPOL Annex V, pp. 119-181. In: R.S. Shomura and M.L. Godfrey (eds.). Proceedings of the Second International Conference on Marine Debris, U.S. Department of Commerce, Washington, D.C.
Cartes, J.E., F. Maynou, F. Sarda, J.B. Company, D. Lloris, and S. Tudela. 2004. Mediterranean deep-sea ecosystems: an overview of their diversity, structure, functioning and anthropogenic impacts, pp. 9-38. In: WWF/IUCN (ed.), Mediterranean deep-sea ecosystems: an overview of their diversity, structure, functioning and anthropogenic impacts with a proposal for conservation. Malaga and Rome.
Christiansen, B. 1989. Acanthephyra sp. (Crustacea: Decapoda) in the Eastern Mediterranean Sea captured by baited traps. Senckenbergiana Maritima 20:187-193.
Coleman, D. and R.D. Ballard. 2001. A highly concentrated region of cold hydrocarbon seeps in the southeastern Mediterranean Sea. Geo-Marine Letters 21:162-167.
Continental Shelf Associates, Inc. (CSA). 2004. Final Report: Gulf of Mexico Comprehensive Synthetic Based Muds Monitoring Program. Report prepared for SBM Research Group, Houston, TX. October 2004. 3 vols. Vol. I: http://www.data.boem.gov/PI/PDFImages/ESPIS/2/3050.pdf Vol. II: http://www.data.boem.gov/PI/PDFImages/ESPIS/2/3052.pdf Vol. III: http://www.data.boem.gov/PI/PDFImages/ESPIS/2/3052.pdf.
Continental Shelf Associates, Inc. 2006. Effects of Oil and Gas Exploration and Development at Selected Continental Slope Sites in the Gulf of Mexico. Volume I: Executive Summary; Volume II: Technical Report; Volume III: Appendices. U.S. Department of the Interior, Minerals Management Service, Gulf of Mexico OCS Region, New Orleans, LA. OCS Study MMS 2006-044 (51 pp.), 2006-045 (636 pp.), and 2006-046 (938 pp.).
CSA International, Inc. 2010. Baseline Environment Study for the Matan and Michal License Blocks Offshore Israel. Prepared for Noble Energy Mediterranean Ltd. January 2010.
CSA International, Inc. 2012. Environmental Impact Assessment for the Tamar Field Development Project Offshore Israel. Prepared for Noble Energy Mediterranean Ltd. September 2012. 249 pp. + apps.
CSA Ocean Sciences Inc. 2013a. Tamar Environmental Monitoring Program, Tamar Field and Pipeline Survey. Prepared for Noble Energy Mediterranean Ltd. 60 pp. + apps.
CSA Ocean Sciences Inc. 2013b. Environmental Monitoring Program Pre-Drill Survey Report. Prepared for Noble Energy Mediterranean Ltd. 42 pp. + apps.
CSA Ocean Sciences Inc. 2013c. Environmental Evaluation of Drilling Mud and Cuttings Disposal Options. Prepared for Noble Energy Mediterranean Ltd. 35 pp. + apps.

Tamar Field Development Project EIA 281 Noble Energy Mediterranean Ltd March 2016 CSA-Noble-FL-16-2650-08-REP-01-FIN-REV04
CSA Ocean Sciences Inc. 2013d. Condensate and Diesel Spill Analysis for the Tamar SW-1 Exploration Well. Prepared for Noble Energy Mediterranean Ltd. 59 pp. + apps.
CSA Ocean Sciences Inc. 2013e. Tamar Field Development Project Offshore Israel, Condensate Spill Monitoring Scope of Work/Sampling and Analysis Plan. Prepared for Noble Energy Mediterranean Ltd. 13 pp. + apps.
CSA Ocean Sciences Inc. 2013f. Tamar SW-1 Environmental Baseline Survey Offshore Israel. Prepared for Noble Energy Mediterranean Ltd. February 2013. 34 pp. + apps.
CSA Ocean Sciences Inc. 2013g. Tamar Deep Pre-Drilling Environmental Monitoring Program Offshore Israel – Scope of Work/Sampling and Analysis Plan. Prepared for Noble Energy Mediterranean Ltd. July 2013. 33 pp. + apps.
CSA Ocean Sciences Inc. 2013h. Tamar Field Pre-Drilling Environmental Monitoring Program Offshore Israel – Scope of Work/Sampling and Analysis Plan. Prepared for Noble Energy Mediterranean Ltd. August 2013. 38 pp. + apps.
CSA Ocean Sciences Inc. 2013i. Tamar SW Environmental Monitoring Program Pre-Drilling Survey Report. Prepared for Noble Energy Mediterranean Ltd. August 2013. 48 pp. + apps.
CSA Ocean Sciences Inc. 2013j. Mari-B/Tamar Production Platforms Environmental Monitoring Program Offshore Israel – March 2013 Platform Survey. Prepared for Noble Energy Mediterranean Ltd. October 2013. 52 pp. + apps.
CSA Ocean Sciences Inc. 2013k. Tamar Field Background Monitoring Survey Offshore Israel – Scope of Work/Sampling and Analysis Plan. Prepared for Noble Energy Mediterranean Ltd. December 2013. 35 pp. + apps.
CSA Ocean Sciences Inc. 2013l. Tamar SW-1 Exploration Program Environmental Assessment. Prepared for Noble Energy Mediterranean Ltd. June 2013. 96 pp. + apps.
CSA Ocean Sciences Inc. 2014. Tamar Field Background Monitoring Survey Report. Prepared for Noble Energy Mediterranean Ltd. July 2014. 132 pp. + apps.
Danovaro, R., J.B. Company, C. Corinaldesi, G. D'Onghia, B. Galil, C. Gambi, A.J. Gooday, N. Lampadariou, G.M. Luna, C. Morigi, K. Olu, P. Polymenakou, E. Ramirez-Llodra, A. Sabbatini, F. Sardà, M. Sibuet, and A. Tselepides. 2010. Deep-sea biodiversity in the Mediterranean Sea: the known, the unknown, and the unknowable. PLoS ONE 5(8):e11832.
De Robertis, A., C.H. Ryer, A. Veloza, and R.D. Brodeur. 2003. Differential effects of turbidity on prey consumption of piscivorous and planktivorous fish. Can. J. Fish. Aquat. Sci. 60:1,517-1,526.
Detmer, A. 1995. Verbreitung, Abundanz und Bedeutung von autotrophem Pico- und Nanoplankton in polaren, temperierten und subtropischen Regionen. Ber IfM Kiel, 263, Kiel, Germany. (German).
Dilek, Y. and E. Sandvol. 2009. Seismic structure, crustal architecture and tectonic evolution of the Anatolian-African Plate Boundary and the Cenozoic Orogenic Belts in the Eastern Mediterranean Region. Geol. Soc. London Spec. Publ. 327:127-160.
Dimitrov, L. and J. Woodside. 2003. Deep sea pockmark environments in the eastern Mediterranean. Mar. Geol. 195:263-276.
Dismukes, D.E., M. Barnett, D. Vitrano, and K. Strellec. 2007. Gulf of Mexico OCS Oil and Gas Scenario Examination: Onshore Waste Disposal. OCS Report MMS 2007-051. 8 pp.
DOF Subsea UK. 2010a. Route and Site Evaluation Surveys at Tamar and Dalit Field Development. Offshore Geophysical and Geotechnical Final Report: Volume 1 – Survey Results and Discussion. DSL-300056-5010-RP.

Tamar Field Development Project EIA 282 Noble Energy Mediterranean Ltd March 2016 CSA-Noble-FL-16-2650-08-REP-01-FIN-REV04
DOF Subsea UK. 2010b. Route and Site Evaluation Surveys at Tamar and Dalit Field Development. Offshore Geophysical and Geotechnical Final Report: Volume 2 – Survey Operations. DSL-300056-5011-RP.
Druckman, Y., Buchbinder, B.,Martinotti, G.M., Siman-Tov, R. and Aharon, P. (1995) The buried Afiq Canyon (eastern Mediterranean, Israel), a case study of a Tertiary submarine canyon exposed in Late Messinian times. Mar. Geol., 123, 167–185. Dumitrica, P
Edelist, D., O. Sonin, D. Golani, G. Rilov, and E. Spanier. 2011. Spatiotemporal patterns of catch and discards of the Israeli Mediterranean trawl fishery in the early 1990s: ecological and conservation perspectives. Sci. Mar. 75(4).
Efroymson, R.A., W.H. Rose, S. Nemeth, and G.W. Suter II. 2000. Ecological risk assessment framework for low-altitude overflights by fixed-wing and rotary-wing military aircraft. Report ORNL/TM-2000/289. Oak Ridge National Laboratory, Oak Ridge, TN.
Ellis, J.I., G. Fraser, and J. Russell. 2012. Discharged drilling waste from oil and gas platforms and its effects on benthic communities. Mar. Ecol. Prog. Ser. 456:285-302.
Etkin, D.S. 1998a. Factors in the dispersant use decision-making process: A historical overview and look to the future, pp. 281-304. In: Proceedings of the 21st Arctic and Marine Oil Spill Program Technical Seminar, June 10-12, 1998, Edmonton, Alberta, Canada.
Etkin, D.S. 1998b. The costs of cleanup for port oil spills. Port Technology International 8:237-242. ICG Publishing Ltd., London, UK.
Etkin, D.S. 1999. Estimating cleanup costs for oil spills, pp. 35-39. In: Proceedings of the 1999 International Oil Spill Conference. Accessed: 24 June 2013.
Etkin, D.S. 2000. Worldwide analysis of oil spill cleanup cost factors, pp. 161-174. In: Proceedings of the 23rd Arctic and Marine Oil Spill Program Technical Seminar.
Etkin, D.S. 2001a. Comparative methodologies for estimating on-water response costs for marine oil spills. pp. 1,281-1,289. In: Proceedings of the 2001 International Oil Spill Conference.
Etkin, D.S. 2001b. Methodologies for estimating shoreline cleanup costs, pp. 647-670. In: Proceedings of the 24th Arctic and Marine Oil Spill Program Technical Seminar, Emergencies Science Division, Environment Canada, Ottawa, ON, Canada.
Etkin, D.S. 2004a. Analysis of past marine oil spill rates and trends for future contingency planning, pp. 227-252. Proceedings of the 25th Arctic and Marine Oil Spill Program Technical Seminar, Emergencies Science Division, Environment Canada, Ottawa, ON, Canada.
Etkin, D.S. 2004b. Modeling oil spill response and damage costs. Proceedings of the Fifth Biennial Freshwater Spills Symposium. 15 pp. Accessed 14 November 2014 at: http://www.environmental-research.com/erc_papers/ERC_paper_6.pdf.
Flocas, H.A., I. Simmonds, J. Kouroutzoglou, K. Keay, M. Hatzaki, D. Asimakopoulos, and V. Bricolas. 2010. On cyclonic tracks over the eastern Mediterranean. Journal of Climate 23:5,243-5,257.
Flocas, H.A., I. Simmonds, J. Kouroutzoglou, K. Keay, M. Hatzaki, V. Bricolas, and D. Asimakopoulos. 2011. The passage of storms through the eastern Mediterranean. Accessed 15 August 2014 at: http://www.wcrp-climate.org/WGNE/BlueBook/2011/individual-articles/02_Flocas_Helena_wgne_2011_east_med_cyclone_tracks_flocas_simmonds_et_al.pdf.
Fraser, G.S., J. Russell, and W.M. Von Zharen. 2006. Produced water from offshore oil and gas installations on the Grand Banks, Newfoundland and Labrador: Are the potential effects to seabirds sufficiently known? Marine Ornithology 34:147-156.

Tamar Field Development Project EIA 283 Noble Energy Mediterranean Ltd March 2016 CSA-Noble-FL-16-2650-08-REP-01-FIN-REV04
Frey-Mart nez, J., J. Cartwright, B. Hall, and M. Huuse, 2007, Clastic intrusion at the base of deep-water sands: A trap-forming mechanism in the eastern Mediterranean, in A. Hurst and J. Cartwright, eds., Sand injectites: Implications for hydrocarbon exploration and production: AAPG Memoir 87, p. 49-63.
Froese, R. and D. Pauly (eds.). 2014. FishBase. Version 06/2014. Accessed 15 August 2014 at: http://fishbase.org.
Fuentes, V.L., D. Atienza, J.-M. Gili, and J.E. Purcell. 2009. First record of Mnemiopsis leidyi A. Agassiz 1865 off the NW Mediterranean coast of Spain. Aquatic Invasions 4:671-674.
Galil, B.S. 2004. The limit of the sea: the bathyal fauna of the Levantine Sea. Scientia Marina 68:63-72.
Galil, B.S. 2006. The marine caravan - the Suez Canal and the Erythrean invasion. In: S. Gollasch, B.S. Galil, and A. Cohen (eds.), Bridging divides. Kluwer Academic Publishers, Dordrecht.
Galil, B.S. and A. Zenetos. 2002. A sea change – exotics in the eastern Mediterranean, pp. 325-336. In: E. Leppakoski, S. Gollasch, and S. Olenin (eds.), Invasive Aquatic Species of Europe. Distribution, Impacts and Management. Kluwer Academic Publishers, Dordrecht.
Gallaway, B.J. and G.S. Lewbel. 1982. The ecology of petroleum platforms in the northwestern Gulf of Mexico: A community profile. U.S. Fish and Wildlife Service, Office of Biological Services, Washington, D.C. FWS/OBS-82/27. 92 pp.
Gallaway, B.J., J.G. Cole, and L.R. Martin. 2008. Platform debris fields associated with the Blue Dolphin (Buccaneer) Gas and Oil Field artificial reef sites offshore Freeport, Texas: extent, composition, and biological utilization. Prepared for U.S. Dept. of the Interior, Minerals Management Service Gulf of Mexico OCS Region, Metairie, LA. OCS Study MMS 2008-048. 113 pp.
Gardline Surveys Inc. 2012. Noble Energy Inc., 3D Geohazard Assessment, Offshore Israel, Tamar SW Prospect, Porposed Tamar SW Well Location. Well Clearance Letter and Anchoring Assessment. June 2012. Gardline Project Ref. 9205. Prepared for Noble Energy Inc., Houston, TX. Issued September 19, 2012. 39 pp.
Gardline Surveys Inc. 2013a. 3D Geohazard Assessment Offshore Israel. Tamar Prospect Proposed Tamar-7 Well Location Well Clearance Letter. Final report prepared for Noble Energy Inc.
Gardline Surveys Inc. 2013b. 3D Geohazard Assessment Offshore Israel. Tamar Prospect Proposed Tamar-8 Well Location Well Clearance Letter. Final report prepared for Noble Energy Inc.
Gardline Surveys Inc. 2014. 3D Geohazard Assessment Offshore Israel. Tamar Prospect Proposed Tamar-9 Well Location Well Clearance Letter. Final report prepared for Noble Energy Inc.
Gardline Surveys Inc. 2016. Well Clearance Letter – Tamar Area, Offshore Israel – Proposed Tamar-8 Well Location. Gardline Report 10722 prepared for Noble Energy, Inc.
Gardosh, M., Z. Garfunkel, Y. Druckman, and B. Buchbinder. 2008. Neotethyan rifting and its role in shaping the Levant Basin and Margin. Isr. Geol. Soc. Ann. Meeting, Nazareth, p. 27.
Garfunkel, Z. 2004. Origin of the Eastern Mediterranean Basin: a re-evaluation. Tectonophysics 391:11-34.
GEBCO. 2014. General Bathymetric Chart of the Oceans. Updated 7 February 2014. Accessed 14 November 2014 at: http://www.gebco.net/.
Geraci, J.R. and D.J. St. Aubin. 1987. Effects of offshore oil and gas development on marine mammals and turtles, pp. 587-617. In: D.F. Boesch and N.N. Rabalais (eds.), Long-term Environmental Effects of Offshore Oil and Gas Development. Elsevier Applied Science, New York, NY.
Tamar Field Development Project EIA 284 Noble Energy Mediterranean Ltd March 2016 CSA-Noble-FL-16-2650-08-REP-01-FIN-REV04
Geraci, J.R. and D.J. St. Aubin (eds.). 1988. Synthesis of effects of oil on marine mammals. Final Report. Prepared for the U.S. Department of the Interior, Minerals Management Service, Atlantic OCS Region, by Battelle Memorial Institute, Ventura, CA. Contract 14 120001-30293. OCS Study MMS 88-0049.
Geraci, J.R. and D.J. St. Aubin (eds.). 1990. Sea Mammals and Oil: Confronting the Risks. Academic Press, San Diego, CA. 282 pp.
Golani, D. 1996. The marine ichthyofauna of the eastern Levant – history, inventory and characterization. Isr. J. Zoo. 42:15-55.
Golani, D. 2005. Checklist of the Mediterranean Fishes of Israel. Zootaxa 947. 90 pp.
Greer, R.D., R.H. Day, and R.S. Bergman. 2010. Effects of Ambient Artificial Light on Arctic Marine Fauna. Interaction of Oil and Gas Activities with Sensitive Coastal Habitats, Northern Oil and Gas Research Forum, December 1, 2010. Accessed 19 August 2014 at: http://www.arcus.org/files/meetings/279/presentations/greer.pdf.
Grigalunas, T.A., R.C. Anderson, G.M. Brown, R.Congar, N.F. Meade, and P.E. Sorensen. 1986. Estimating the cost of oil spills: Lessons from the Amoco Cadiz incident. Marine Resource Economics 2(3):239-262.
Henderson, D., and R.P. Hamernik. 1986. Impulse noise: Critical review. Journal of the Acoustical Society of America 80:569-584.
Henderson, D., B. Hu, and E. Bielefeld. 2008. Patterns and mechanisms of noise-induced cochlear pathology, pp. 195-217. In: Schacht, J., A.N. Popper, and R.R Fay (eds.). Auditory Trauma, Protection, and Repair. Springer, New York.
Herut, B. and A. Sandler. 2006. Normalization methods for pollutants in marine sediments: review and recommendations for the Mediterranean. IOLR Report H18/2006.
Herut, B., A. Almogi-Labin, N. Jannink, and I. Gertman. 2000. The seasonal dynamics of nutrient and chlorophyll a concentrations on the SE Mediterranean shelf-slope. Oceanol. Acta 23:771-782.
Higashi, G.R. 1994. Ten years of fish aggregating device (FAD) design and development in Hawaii. Bull. Mar. Sci. 55(2-3):651-666.
Hinwood, J.B., A.E. Potts, L.R. Dennis, J.M. Carey, H. Houridis, R.J. Bell, J.R. Thomson, P. Boudreau, and A.M. Ayling. 1994. Environmental implications of offshore oil and gas development in Australia – drilling activities, pp. 124-207. In: J.M. Swan, J.M. Neff, and P.C. Young (eds.), Environmental Implications of Offshore Oil and Gas Development in Australia – the Findings of an Independent.
Holland, K.R., R.W. Brill, and R.K. Chang. 1990. Horizontal and vertical movements of yellowfin and bigeye tuna associated with fish aggregating devices. Fish. Bull. 88:493-507.
Hsü, K.J., W.B. Ryan, and M.B. Cita. 1973. Late Miocene desiccation of the Mediterranean. Nature 242:240-244.
International Association of Oil & Gas Producers. 2003. Environmental aspects of the use and disposal of non-aqueous drilling fluids associated with offshore oil & gas operations. Report No. 342. May 2003. OGP, London and Brussels. 114 pp.
International Tanker Owners Pollution Federation. 2013. Cost of Spills. Accessed 14 November 2014 at: http://www.itopf.com/knowledge-resources/documents-guides/compensation/.
International Union for Conservation of Nature. 2014. The IUCN Red List of Threatened Species. Version 2014.1. Accessed 15 August 2014 at: http://www.iucnredlist.org.

Tamar Field Development Project EIA 285 Noble Energy Mediterranean Ltd March 2016 CSA-Noble-FL-16-2650-08-REP-01-FIN-REV04
IOLR. 2015. Strategic Environmental Survey for Exploration and Production of Oil and Natural Gas at Sea. Part C. Report H20/2015.
Israel Ports Authority. 2011. Freight data – seaports. Accessed 15 August 2014 at: http://www.israports.org.il.
Jacquet, N., S. Dawson, and E. Slooten. 1998. Diving behaviour of male sperm whales: foraging implications. International Whaling Commission, Scientific Committee Doc. SC/50/CAWS 38. 20 pp.
Jones, E.G., A. Tselepides, P.M. Bagley, M.A. Collins, and I.G. Priede. 2003. Bathymetric distribution of some benthic and benthopelagic species attracted to baited cameras and traps in the deep eastern Mediterranean. Mar. Ecol. Prog. Ser. 251:75-86.
Keinath, J.A. and J.A. Musick. 1993. Movements and diving behavior of a leatherback turtle, Dermochelys coriacea. Copeia 1993(4):1,010-1,017.
Keinath, J.A., J.A. Musick, and D.E. Barnard. 1996. Abundance and Distribution of Sea Turtles off North Carolina. OCS Study MMS 95-0024. U.S. Department of the Interior, Minerals Management Service, Gulf of Mexico OCS Region, New Orleans, LA. 156 pp.
Kelletat, D. and G. Schellmann. 2002. Tsunamis on Cyprus: Field Evidences and 14C-Dating Results. Zeitschrift für Geomorphologie, NF 46(1):19-34.
Kerem, D., N. Hadar, O. Goffman, A. Scheinin, R. Kent, O. Boisseau, and U. Schattner. 2012. Update on the Cetacean Fauna of the Mediterranean Levantine Basin. Open Marine Biology Journal 6:6-27.
Kerem, D., O. Goffman, A. Scheinin, M. Elasar, N. Hadar, D. Edelist, and O. Sonin. 2014. Report on the status of small cetaceans in Israeli Mediterranean waters. Submitted to the Sub-Committee on Small Cetaceans, the Scientific Committee, the International Whaling Commission, May 2014. IMMRAC, Recanati Institute for Maritime Studies, School of Marine Sciences, University of Haifa, Haifa, Israel. Accessed 15 August 2014 at: https://events.iwc.int/index.php/scientific/SC65B/paper/viewFile/819/896/SC-65b-SM09.pdf.
Kontovas, C.A. and H.N. Psaraftis. 2008. Marine environment risk assessment: A survey on the disutility cost of oil spills. 2nd International Symposium on Ship Operations, Management and Economics, SNAME Greek Section. Athens.
Koppelmann, R., H. Weikert, and N. Lahajnar. 2003. Vertical distribution of mesozooplankton and its δ15N-signature in the deep Levantine Basin (Eastern Mediterranean) in April 1999. J. Geophys. Res. 108(69):8,118.
Kosheleva, I.A., S.L. Sokolov, N.V. Balashova, A.E. Filonov, E.I. Meleshko, R.R. Gaiazov, and A.M. Boronin. 1997. Genetic control of naphthalene biodegradation by a strain of Pseudomonas sp. 8909N. Genetika 33:762-768.
Kot, C.Y., A. DiMatteo, E. Fujioka, B. Wallace, B. Hutchinson, J. Cleary, P. Halpin and R. Mast. 2013. The State of the World's Sea Turtles Online Database: Data provided by the SWOT Team and hosted on OBIS-SEAMAP. Oceanic Society, Conservation International, IUCN Marine Turtle Specialist Group (MTSG), and Marine Geospatial Ecology Lab, Duke University. http://seamap.env.duke.edu/swot.
Kress, N. 2000. Dissolved oxygen and nutrients (o-phospate, nitrate+nitrite, silicic acid) across the Eastern Mediterranean. Results of the R/V Meteor survey M44/4 (Haifa, 10 April 1999 – Malaga, 16 May 1999). Israel Oceanographic and Limnological Research (IOLR), IOLR Report H28/2000, Haifa, Israel.
Krom, M.D. 1995. The oceanography of the eastern Mediterranean Sea. Ocean Challenge 5:22-28.
Tamar Field Development Project EIA 286 Noble Energy Mediterranean Ltd March 2016 CSA-Noble-FL-16-2650-08-REP-01-FIN-REV04
Krom, M.D., N. Kress, S. Brenner, and L.I. Gordon. 1991. Phosphorus limitation of primary productivity in the eastern Mediterranean Sea. Limnol. Oceanogr. 36:424-432.
Krom, M.D., E.M.S. Woodward, B. Herut, N. Kress, P. Carbo, R.F.C. Mantoura, G. Spyres, T.F. Thingstad, P. Wassman, C. Wexels-Riser, V. Kitidis, C.S. Law, and G. Zodiatis. 2005. Nutrient cycling in the south east Levantine basin of the eastern Mediterranean: Results from a phosphorus starved system. Deep Sea Res. II 52:2,879-2,896.
Kyhn, L.A., J. Tougaard, and S. Sveegaard. 2011. Underwater noise from the drillship Stena Forth in Disko West, Baffin Bay, Greenland. National Environmental Research Institute, Aarhus University, Denmark. NERI Technical Report No. 838. 30 pp. Accessed 21 July 2014 at: http://www.dmu.dk/Pub/FR838.pdf.
Laist, D.W. 1996. Impacts of marine debris: Entanglement of marine life in marine debris including a comprehensive list of species with entanglement and ingestions records, pp. 99-139. In: J.M. Coe and D.R. Rogers (eds.), Marine Debris: Sources, Impacts, and Solutions. Springer-Verlag, NY.
Laist, D.W., A.R. Knowlton, J.G. Mead, A.S. Collet, and M. Podesta. 2001. Collisions between ships and whales. Mar. Mamm. Sci. 17:35-75.
Lan Med Nautilus Limited. 2012. MedNautilus system. European and Mediterranean network. Accessed 21 July 2014 at: http://www.mednautilus.com/en_EN/mn-system.
Lawrence, J., T.D. Mudge, D.B. Fissel, K. Borg, and J. Reitsma. 2011. 2009-2011 Ocean Currents at Tamar and the Pipeline Route: Metocean Design Criteria Values. Prepared for Noble Energy Inc., Houston, TX by ASL Environmental Sciences, Inc., Victoria, B.C. ASL Report No. PR-658. September 2011.
Leshem, Y. and I. Atrash. 1998. Palestine-Israel: A crossroad for bird migration. Palestine-Israel Journal 5(1).
Levine, S., P. Hofstetter, X.Y. Zheng, and D. Henderson. 1998. Duration and peak level as co-22 factors in hearing loss from exposure to impact noise. Scandinavian Audiology 23 Supplementum 48:27-36.
Levy, Y. 2011. Summary of recovery actions for sea turtle populations in the Mediterranean Sea. Israel Nature and Parks Authority.
Li, W.K.W., T. Zohary, Z. Yacobi, and A.M. Wood. 1993. Ultraphytoplankton in the eastern Mediterranean Sea: towards deriving phytoplankton biomass from flow cytometric measurements of abundance, fluorescence and light scatter. Mar. Ecol. Prog. Ser. 102:79-87.
Libes, S. 2011. Introduction to marine biogeochemistry. 2nd ed. Academic Press. 928 pp.
Lohoefener, R., W. Hoggard, K. Mullin, C. Roden, and C. Rogers. 1990. Association of sea turtles with petroleum platforms in the north-central Gulf of Mexico. OCS Study/MMS 90-0025. U.S. Department of the Interior, Minerals Management Service, Gulf of Mexico OCS Regional Office, New Orleans, LA.
Long, E.R. and L.G. Morgan. 1990. The potential for biological effects of sediment-sorbed contaminants tested in the National Status and Trends Program. NOAA Tech. Memo. NOS OMA 52. National Oceanic and Atmospheric Administration. Seattle, WA.
Longhurst, A. 1998. Ecological geography of the sea. Academic Press, San Diego, CA.
Loughlin, T.R., B.E. Ballachey, and B.A. Wright. 1996. Overview of studies to determine injury caused by the Exxon Valdez oil spill to marine mammals. Amer. Fish. Soc. Symp. 18:798-808.
Lucas, Z. and B. Freeman. 1989. The effects of experimental spills of natural gas condensate on three plant communities on Sable Island, Nova Scotia, Canada. Oil & Chemical Pollution 5:263-272.
Tamar Field Development Project EIA 287 Noble Energy Mediterranean Ltd March 2016 CSA-Noble-FL-16-2650-08-REP-01-FIN-REV04
Lutcavage, M.E., P. Plotkin, B. Witherington, and P.L. Lutz. 1997. Human impacts on sea turtle survival, pp. 387-410. In: P.L. Lutz and J.A. Musick (eds.), The Biology of Sea Turtles. CRC Press, Boca Raton, FL. 432 pp.
Makris, J., Z. Ben-Avraham, A. Behle, A. Ginzburg, P. Giese, L. Steinmetz, R.B. Whitmarsh, and S. Eleftheriou. 1983. Seismic Refraction Profiles between Cyprus and Israel and their Interpretation. Geophys. J. Royal Astronom. Soc. 75:575-591.
Malme, C.I., P.R. Miles, C.W. Clark, P. Tyack, and J.E. Bird. 1983. Investigations of the potential effects of underwater noise from petroleum industry activities on migrating gray whale behavior. Report No. 5366. Prepared by Bolt, Beranek & Newman, Inc., Cambridge, MA, for the U.S. Department of the Interior, Minerals Management Service, Alaska OCS Region, Anchorage, AK.
Malme, C.I., P.R. Miles, C.W. Clark, P. Tyack, and J.E. Bird. 1984. Investigations of the potential effects of underwater noise from petroleum industry activities on migrating gray whale behavior/Phase II: January 1984 migration. BBN Report 5851. Report from BBN Laboratories Inc., Cambridge, MA for the U.S. Department of the Interior, Minerals Management Service, Alaska OCS Office, Anchorage, AK. NTIS PB86-218385.
Malme, C.I., P.R. Miles, G.W. Miller, W.J. Richardson, D.G. Roseneau, D.H. Thompson, and C.R. Greene, Jr. 1989. Analysis and ranking of the acoustic disturbance potential of petroleum activities and other sources of noise in the environment of marine mammals in Alaska. BBN Report No. 6945. MMS Study Report No. 89-0006. Prepared by BBN Systems and Technology Corporation, Cambridge, MA. NTIS No PB90/188673.
Mandel, M., P. Alpert, and I. Osetinsky. 2006. Assessing the eastern Mediterranean mesoscale circulation by clustering the daily weather. The Annual Meeting of Israel Meteorological Society, 23 March 2006, Basel Hotel, Tel Aviv, Israel.
Maritime Communication Services, Inc., Aeoliki Ltd., CSA International, Inc., and University of Cyprus Oceanographic Center. 2008. Environmental Report – Strategic Environmental Assessment (SEA) concerning hydrocarbon activities within the Exclusive Economic Zone of the Republic of Cyprus. Prepared for Ministry of Commerce, Industry and Tourism of the Republic of Cyprus, Nicosia, Cyprus. Contract Number MCIT/ES/12/2007. 373 pp.
Martinez, J.F., J. Cartwright, and B. Hall. 2005. 3D seismic interpretation of slump complexes: examples from the continental margin of Israel. Basin Res. 17:83-108.
Mascle, J., O. Sardou, L. Loncke, M. Sebastien, L. Caméra, and V. Gaullier. 2006. Morphostructure of the Egyptian continental margin: insights from swath bathymetry surveys. Mar. Geophys. Res. 27:49-59.
Mazzocchi, M.G., E.D. Christou, N. Fragopoulu, and I. Siokou-Frangou. 1997. Mesozooplankton distribution from Sicily to Cyprus (Eastern Mediterranean): I. General aspects. Oceanol. Acta 20:521-535.
Meral Ozel, N., N. Ocal, Y.A. Cevdet, D. Kalafat, and M. Erdik. 2011. Tsunami hazard in the eastern Mediterranean and its connected seas: toward a tsunami warning center in Turkey. Soil Dynamics and Earthquake Engineering 31(4):598-610.
Michaelidis, S., P. Evripidou, and G. Kallos. 1999. Monitoring and predicting Saharan Desert dust events in the eastern Mediterranean. Weather 54(11):359-365.
Millero, F.J. 2005. Chemical oceanography. 3rd ed. CRC Press. 520 pp.
Milton, S., P. Lutz, and G. Shigenaka, G. 2003. Oil toxicity and impacts on sea turtles, Chapter 4. In: G. Shigenaka (ed.), Oil and sea turtles: Biology, planning, and response. National Oceanic and Atmospheric Administration, NOAA Ocean Service, Office of Response and Restoration, Silver Spring, MD.
Tamar Field Development Project EIA 288 Noble Energy Mediterranean Ltd March 2016 CSA-Noble-FL-16-2650-08-REP-01-FIN-REV04
Ministry of Environmental Protection. 2002. Environmental Quality Standards for the Mediterranean Sea in Israel. Marine and Coastal Environment Division. 36 pp.
Ministry of Transport – Administration of Shipping & Ports. 2013. Total Freight (thousands of tons) Israeli Ports Q1/2008-Q4/2013. Prepared by the Economics and International Affairs Division. Accessed 15 August 2014 at: http://media.mot.gov.il/PDF/SPA_HE/CARGO/TotalCargo2013.pdf.
Ministry of Transport and Road Safety, Shipping and Ports Authority. 2009. Annual Statistics of the Ports and Marine Authority. Accessed June 2012 at: http://spa.mot.gov.il/images/PDF/SHNATON/StatisticalYearBook09.pdf.
Montevecchi, W.A., F.K. Wiese, G. Davoren, A.W. Diamond, F. Huettmann, and J. Linke. 1999. Seabird attraction to offshore platforms and seabird monitoring from offshore support vessels and other ships: literature review and monitoring designs [unpublished report]. Report No. 138. Environmental Studies Research Funds, Calgary, Canada. 56 pp.
National Marine Fisheries Service. 1991. Final recovery plan for the humpback whale (Megaptera novaeangliae). Prepared by the Humpback Whale Recovery Team for the National Marine Fisheries Service, Silver Spring, MD. 105 pp.
National Marine Fisheries Service. 2001. Endangered Species Act, Section 7 Consultation, Gulf of Mexico OCS Lease Sale 181. I ix B in: Gulf of Mexico OCS Oil and Gas Lease Sale 181, Eastern Planning Area. Final Environmental Impact Statement. U.S. Department of the Interior, Minerals Management Service, Gulf of Mexico OCS Region, New Orleans, LA. OCS EIS/EA MMS 2001-051. June 2001.
National Marine Fisheries Service. 2006. Draft recovery plan for the sperm whale (Physeter macrocephalus). Prepared by the Humpback Whale Recovery Team for the National Marine Fisheries Service, Silver Spring, MD.
National Marine Fisheries Service. 2010. Recovery plan for the sperm whale (Physeter macrocephalus). National Marine Fisheries Service, Silver Spring, MD. 165 pp.
National Marine Fisheries Service. 2013. Interim Sound Threshold Guidance. Accessed 21 July 2014 at: http://www.nwr.noaa.gov/Marine-Mammals/MM-sound-thrshld.cfm.
National Oceanic and Atmospheric Administration, National Ocean Service. 2013. Marine debris facts. Accessed 22 July 2014 at: http://oceanservice.noaa.gov/education/yos/resource/101mdfacts.pdf.
National Research Council. 1983. Drilling Discharges in the Marine Environment. National Academy Press, Washington, DC. 180 pp. Scientific Review. Australian Petroleum Exploration Association.
National Research Council. 1985. Oil in the sea: Inputs, fates, and effects. National Academy Press, Washington, DC. 601 pp.
National Research Council. 1990. Decline of the sea turtles: Causes and prevention. National Academy Press, Washington, DC. 259 pp.
National Research Council. 2003a. Ocean noise and marine mammals. National Academy Press, Washington, DC. 192 pp.
National Research Council. 2003b. Oil in the Sea III: Inputs, Fates, and Effects. Ocean Studies Board, Marine Board, Transportation Research Board, Division on Earth and Life Studies, National Research Council, Washington, DC. National Academies Press, Washington, DC. 280 pp.

Tamar Field Development Project EIA 289 Noble Energy Mediterranean Ltd March 2016 CSA-Noble-FL-16-2650-08-REP-01-FIN-REV04
National Research Council. 2008. Tackling Marine Debris in the 21st Century. Prepared by the Committee on the Effectiveness of International and National Measures to Prevent and Reduce Marine Debris and Its Impacts, National Research Council. 224 pp. Accessed 22 July 2014 at: http://www.nap.edu/catalog/12486.html.
Neff, J.M. 1987. Biological effects of drilling fluids, drill cuttings and produced waters, pp. 469-538. In: D.F. Boesch and N.N. Rabalais (eds.), Long-Term Effects of Offshore Oil and Gas Development. Elsevier Applied Science Publishers, London, UK.
Neff, J.M. 2005. Composition, Environmental Fates, and Biological Effects of Water Based Drilling Muds and Cuttings Discharged to the Marine Environment: A Synthesis and Annotated Bibliography. Prepared for Petroleum Environmental Research Forum and American Petroleum Institute. Battelle, Duxbury, MA. 83 pp.
Neff, J.M. 2007. Estimation of Bioavailability of Metals from Drilling Mud Barite. Integrated Environmental Assessment and Management 4(2):184-193.
Neff, J.M. 2010. Fate and effects of water based drilling muds and cuttings in cold water environments. Prepared by Neff & Associates LLC, Duxbury, MA for Shell Exploration and Production Company, Houston, TX. May 25, 2010. 309 pp.
Neff, J.M., R.E. Hillman, and J.J. Waugh. 1989a. Bioaccumulation of trace metals from drilling mud barite by benthic marine animals, pp. 461-479. In: F.R. Engelhardt, J.P. Ray and A.H. Gillam (eds.), Drilling Wastes. Elsevier Applied Science, New York. 867 pp.
Neff, J.M., R.J. Breteler, and R.S. Carr. 1989b. Bioaccumulation, food chain transfer, and biological effects of barium and chromium from drilling muds by flounder (Pseudopleuronectes americanus) and lobster (Homarus americanus), pp. 439-459. In: F.R. Engelhardt, J.P. Ray and A.H. Gillam (eds.), Drilling Wastes. Elsevier Applied Science, New York. 867 pp.
Neff, J.M., S. Ostazwski, W. Gardiner, and I. Stejskal. 2000. Effects of weathering on the toxicity of three offshore Australian crude oils and a diesel fuel to marine animals. Environ. Toxicol. Chem. 19:1,809-1,821
Noble Energy. 2012. Tamar SW-1. Application for Permit for Pouring into the Sea. Data Package. Rev6. 31 pp.
Noble Energy. 2014. Environmental Evaluation of Drilling Mud and Cuttings Offshore Discharge Option on Future Miocene Wells, Offshore Israel. Report 2014-03-27 NBL to MoEP re: MOBM for Miocene Wells Draft FINAL. 1 June 2014.
Notarbartolo di Sciara, G. and A. Birkun, Jr. 2010. Conserving whales, dolphins and porpoises in the Mediterranean and Black Seas. An ACCOBAMS status report. ACCOBAMS, Monaco. 212 pp.
Oceana Marine Research Ltd. 2010. Tamar & Dalit Development Landfall & Shallow Water Survey Report. Final report prepared for Noble Energy Inc. 67 pp.
OGP/IPIECA. 2010. Alien Invasive Species and the Oil and Gas Industry; Guidance for Prevention and Management. OGP Report Number 436.
Oregon State University. 2013. Individual year conversion factor tables. Accessed 24 June 2013 at: http://liberalarts.oregonstate.edu/spp/polisci/sites/default/files/faculty-research/sahr/inflationconversion/pdf/cv2012.pdf.
Özbakır, A.D., R. Wortel, and R. Govers. 2010. The nature and location of the plate boundary between the Anatolian and African plates. Geophysical Research Abstracts 12. EGU2010-4366.
Palomares, M.L.D. and D. Pauly (eds.). 2014. SeaLifeBase. World Wide Web electronic publication. www.sealifebase.org, version (06/2014).
Tamar Field Development Project EIA 290 Noble Energy Mediterranean Ltd March 2016 CSA-Noble-FL-16-2650-08-REP-01-FIN-REV04
Patin, S.A. 1993. Ecotoxicological characteristic of natural gas as ecological factor of the water environment. Moscow, VNIRO, 40 pp. (Russian).
Patin, S.A. 1999. Environmental Impact of the Offshore Oil and Gas Industry. Elena Cascio, translator. Eco Monitor Publishing, East Northport, NY. ISBN-10:0-967 1836-0-X. 428 pp.
Payne, J.R., B.E. Kirstein, J.R. Clayton, Jr., C. Clary, R. Redding, G.D. McNabb, Jr., and G. Farmer. 1987. Integration of Suspended Particulate Matter and Oil Transportation Study, Final Report. Minerals Management Service, Environmental Studies Branch, Anchorage, AK. Contract No. 14-12-0001-30146. 216 pp.
Pitta, P., N. Stambler, T. Tanaka, T. Zohary, A. Tselepides, and F. Rassoulzadegan. 2005. Biological response to P addition in the Eastern Mediterranean Sea. The microbial race against time. Deep Sea Research II 52:2,961-2,974.
Poot, H., B.J. Ens, H. de Vries, M.A.H. Donners, M.R. Wernand, and J.M. Marquenie. 2008. Green light for nocturnally migrating birds. Ecology and Society 13(2):47.
Port of Haifa. 2012. Statistical data. Accessed 21 July 2014 at: http://www.haifaport.co.il.
Potter, J.R., T.W. Lim, and A. Chitre. 1997. Ambient noise environments in shallow tropical seas and the implications for acoustic sensing, pp. 191-199. In: Oceanology International 97 Pacific Rim, Singapore.
Psarra, S., T. Zohary, M.D. Krom, R. Fauzi, R.F.C. Mantoura, T. Polychronaki, N. Stambler, T. Tanaka, A. Tselepides, and T.F. Thingstad. 2005. Phytoplankton response to a Lagrangian phosphate addition in the Levantine Sea (Eastern Mediterranean). Deep-Sea Research II 52:2,944-2,960.
Ray, J.P. and R.P. Meek. 1980. Water column characterization of drilling fluids dispersion from and offshore exploratory well on Tanner Bank, pp. 223-252. In: Symposium: Research on Environmental Fate and Effects of Drilling Fluids and Cuttings. Proceedings. Volume I. Lake Buena Vista, FL, 21-24 January 1980. American Petroleum Institute, Washington, D.C.
Reeves R. and G. Notarbartolo di Sciara (eds.). 2006. The status and distribution of cetaceans in the Black Sea and Mediterranean Sea. IUCN Centre for Mediterranean Cooperation, Malaga, Spain. 137 pp.
Richards, K.J. 1990. Physical processes in the benthic boundary layer. Phil. Trans. R. Soc. Lond. A 331:3-13.
Richardson, W.J., B. Würsig, and C.R. Greene, Jr. 1986. Reactions of bowhead whales, Balaena mysticetus, to seismic exploration in the Canadian Beaufort Sea. J. Acoust. Soc. Am. 79:1,117-1,128.
Richardson, W.J., C.R. Greene, Jr., C.I. Malme, and D.H. Thomson. 1990. Effects of noise on marine mammals. Report prepared by LGL Ecological Research Associates, Inc. for the U.S. Department of the Interior, Minerals Management Service, Atlantic OCS Region, Herndon, VA. OCS Study MMS 90-0093. 462 pp.
Richardson, W.J., C.R. Greene, Jr., C.I. Malme, and D.H. Thomson. 1995. Marine Mammals and Noise. Academic Press, San Diego, CA. 576 pp.
Rigzone.com, Inc. 2014. Rig Data: Sedco Express. Accessed 12 November 2014 at: http://www.rigzone.com/data/offshore_drilling_rigs/1021/Semisub/Transocean_Ltd/Sedco_Express.
Rigzone.com, Inc. 2015. How does offshore pipeline installation work? Accessed 27 August 2015 at: http://www.rigzone.com/training/insight.asp?insight_id=311&c_id=19.
Rosman, I, G.S. Boland, L.R. Martin, and C.R. Chandler. 1987. Underwater sightings of sea turtles in the northern Gulf of Mexico. U.S. Department of the Interior, Minerals Management Service, OCS Study 87-0107. 37 pp.

Tamar Field Development Project EIA 291 Noble Energy Mediterranean Ltd March 2016 CSA-Noble-FL-16-2650-08-REP-01-FIN-REV04
Ross, D. 1976. Mechanics of underwater noise. Pergamon Press, New York, NY.
RPS-ASA. 2013. Additional drilling discharges results. CSA-Cyprus B12. Report by RPS-ASA for CSA Ocean Sciences Inc. October 2013. 4 pp.
RPS-ASA. 2014. Drilling Discharges Modeling Results for Leviathan-9 & 9 ST01. Prepared for CSA Israel (Noble). August 2014. 19 pp.
Russell, R.W. 2005. Interactions between migrating birds and offshore oil and gas platforms in the northern Gulf of Mexico. Final Report. U.S. Department of the Interior, Minerals Management Service, Gulf of Mexico OCS Region, New Orleans, LA. OCS Study MMS 2005-009. 348 pp.
Salamon, A., T. Rockwell, S.N. Ward, E. Guidoboni, and A. Comastri. 2007. Tsunami Hazard evaluation of the Eastern Mediterranean: Historical Analysis and Selected Modeling. Bull. Seismol. Soc. Am. 97:705-724.
Sammarco, P.W. 1997. Effects of natural gas pipeline condensate and crude oil spills, and comments on remediation, with emphasis on south Louisiana salt marshes: a review. Technical Report for El Paso Energy, Inc., Houston, TX. Accessed 14 November 2014 at: http://www.lumcon.edu/research/faculty/spillRep.pdf.
Schaanning, M.T., H.C. Trannum, T.F. Holth, and S. Øxnevad. 2008a. Trace metal mobility and faunal effects of weight materials in water-based drilling muds. Report No. OR-5680. Norwegian Institute for Water Research.
Schaanning, M.T., H.C. Trannum, S. Øxnevad, J. Carroll, and T. Bakke. 2008b. Effects of drill cuttings on biogeochemical fluxes and macrobenthos of marine sediments. J. Exp. Mar. Biol. Ecol. 361:49-57.
SEATURTLE.ORG. 2008. Satellite Tracking – Israel Sea Turtle Tracking Project 2008: Loggerhead & Green Turtles. Accessed 15 August 2014 at: http://www.seaturtle.org/tracking/?project_id=303.
Shepard, F.P. 1954. Nomenclature based on sand-silt-clay ratios. J. Sediment Petrol. 24:151.
Shinn, E.A., B.H. Lidz, and P. Dustan. 1989. Impact assessment of exploratory wells offshore South Florida. U.S. Department of the Interior, Minerals Management Service, Gulf of Mexico OCS Region, New Orleans, LA. OCS Study MMS 89-0022. 111 pp.
Shinn, E.A., B.H. Lidz, and C.D. Reich. 1993. Habitat impacts of offshore drilling: Eastern Gulf of Mexico. U.S. Department of the Interior, Minerals Management Service, Gulf of Mexico OCS Region, New Orleans, LA. OCS Study MMS 93-0021. 73 pp.
Siokou-Frangou, I., E.D. Christou, N. Fragopoulu, and M.G. Mazzocchi. 1997. Mesozooplankton distribution from Sicily to Cyprus (Eastern Mediterranean): II. Copepod assemblages. Oceanol. Acta 20:537-548.
Smit, M.G.D., K.I.E. Holthaus, H.C. Trannum, J.M. Neff, G. Kjeilen-Eilertsen, R.G. Jak, I. Singsaas, M.A.J. Huijbregts, and A.J. Hendriks. 2008. Species sensitivity distributions for suspended clays, sediment burial, and grain size change in the marine environment. Environmental Toxicology and Chemistry 27(4):1,006-1,012.
Smultea, M., J. Mobley, D. Fertl, and G. Fulling. 2008. Short Communication: An Unusual Reaction and Other Observations of Sperm Whales Near Fixed-Wing Aircraft. Gulf and Caribbean Research 20:75-80.
Steinhauer, M.S. and P.D. Boehm. 1992. The composition and distribution of saturated and aromatic hydrocarbons in nearshore sediments, river sediments, and coastal peat of the Alaskan Beaufort Sea: Implications for detecting anthropogenic hydrocarbon inputs. Mar. Environ. Res. 33:223-253.

Tamar Field Development Project EIA 292 Noble Energy Mediterranean Ltd March 2016 CSA-Noble-FL-16-2650-08-REP-01-FIN-REV04
Struck, U., K.-C. Emeis, M. Voss, M.D. Krom, and G.H. Rau. 2001. Biological productivity during sapropel S5 formation in the Eastern Mediterranean Sea: Evidence from isotopes of nitrogen and carbon. Geochim. Cosmochim. Acta 65:3,249-3,266.
Tanaka, T., T. Zohary, M.D. Krom, C.S. Law, P. Pitta, S. Psarra, F. Rassoulzadegan, T.F. Thingstad, A. Tselepides, E.M.S. Woodward, G.A.F. Flaten, H.R. Skjoldal, and G. Zodiatis. 2007. Microbial community structure and function in the Levantine Basin of the eastern Mediterranean. Deep Sea Res. I 54:1,721-1,743.
Tasker, M.L., P. Hope-Jones, B.F. Blake, T.J. Dixon, and A.W. Wallis. 1986. Seabirds associated with oil production platforms in the North Sea. Ringing and Migration 7:7-14.
Thingstad, T.F., M.D. Krom, R.F.C. Mantoura, G.A.F. Flaten, S. Groom, B. Herut, N. Kress, C.S. Law, A.F. Pasternak, R. Pitta, S. Psarra, F. Rassoulzadegan, T. Tanaka, A. Tselepides, P. Wassman, E.M.S. Woodward, C. Wexels-Riser, G. Zodiatis, and T. Zohary. 2005. Nature of phosphorus limitation in the ultraoligotrophic eastern Mediterranean. Science 309:1,068-1,071.
Trannum, H.C., A. Pettersen, and F. Brakstad. 2006. Field trial at Sleipner Vest Alfa Nord: effects of drilling activities on benthic communities. Report No. 411.3041.2. Akvaplan-niva.
Trannum, H.C., H.C. Nilsson, M.T. Schaanning, and S. Øxnevad. 2010. Effects of sedimentation from water-based drill cuttings and natural sediment on benthic macrofaunal community structure and ecosystem processes. J. Exp. Mar. Biol. Ecol. 383:111-121.
Trefry, J.H. and J.P. Smith. 2003. Forms of Mercury in Drilling Fluid Barite and Their Fate in the Marine Environment: A Review and Synthesis. Society of Petroleum Engineers Proceedings. SPE Paper 80571.
Trefry, J.H., K.H. Dunton, R.P. Trocine, S.V. Schonberg, N.D. McTigue, E.S. Hersh, and T.J. McDonald. 2013. Chemical and biological assessment of two offshore drilling sites in the Alaskan Arctic. Marine Environmental Research 86:35-45.
Tselepides, A. and N. Lampadariou. 2004. Deep-sea meiofaunal community structure in the Eastern Mediterranean: are trenches benthic hotspots? Deep Sea Research Part I: Oceanographic Research Papers 51(6):833-847.
Tyler, P.A. 2005. Forward. Special issue: Mediterranean deep-sea biology. Scientia Marina 68(Suppl. 3):3.
Umorin, P.P., G.A. Vinogradov, A.S. Mavrin, V.B. Verbitski, and A.A. Bruznitski. 1991. Impact of the bottled gas on ichthyofauna and zooplankton organisms, pp. 222-224. In: Theses of the Second All-Union Conference on Fisheries Toxicology, Vol. 2 – Spb. (Russian).
United Nations Environment Programme. 2013. Protocol Concerning Specially Protected Areas and Biological Diversity in the Mediterranean. Annex II: List of Endangered or Threatened Species. Accessed 15 August 2014 at: http://rac-spa.org/sites/default/files/annex/annex_2_en_2013.pdf.
Urick, R.J. 1983. Principles of underwater sound. McGraw-Hill, New York. 0-07-066087-5.
URS Corporation. 2009. Tsunamic hazard in Israel. Report prepared by Hong Kie Thio, URS Corporation, Pasadena, CA. 73 pp.
U.S. Bureau of Ocean Energy Management. 2012. Outer Continental Shelf Oil and Gas Leasing Program: 2012-2017. Final Programmatic Environmental Impact Statement. U.S. Department of the Interior, Bureau of Ocean Energy Management. July 2012. OCS EIS/EA BOEM 2012-030. 2,057 pp.
U.S. Environmental Protection Agency. 1976. Interim primary drinking water regulations – promulgation of regulations on radionuclides: Federal Register, v. 41, July 9, 1976, Part II, pp. 28,402-29,409.

Tamar Field Development Project EIA 293 Noble Energy Mediterranean Ltd March 2016 CSA-Noble-FL-16-2650-08-REP-01-FIN-REV04
U.S. Environmental Protection Agency. 1993. Development Document for Effluent Limitation Guidelines and New Source Performance Standards for the Offshore Subcategory of the Oil and Gas Extraction Point Source Category. EPA 821 R 93 003. Office of Water, Washington, DC.
U.S. Environmental Protection Agency. 1998. Use of soil cleanup in 40 CFR Part 192 as remediation goals for CERCLA sites: EPA OSWER Directive 9200.4-25.
U.S. Environmental Protection Agency. 2000. Economic Analysis of Final Effluent Limitations Guidelines and Standards for Synthetic-Based Drilling Fluids and other Non-Aqueous Drilling Fluids in the Oil and Gas Extraction Point Source Category. EPA-821-B-00-012. December 2000. Washington, DC.
USEPA. 2012. The NPDES General Permit For New And Existing Sources And New Dischargers In The Offshore Subcategory Of The Oil And Gas Extraction Point Source Category For The Western Portion Of The Outer Continental Shelf Of The Gulf Of Mexico (Gmg290000). EPA Region 6.
U.S. Geological Survey. 1999. Naturally occurring radioactive materials (NORM) in produced water and oil field equipment – An issue for the energy industry. Accessed 21 July 2014 at: http://pubs.usgs.gov/fs/fs-0142-99/fs-0142-99.pdf.
U.S. Geological Survey. 2014. Earthquake Activity – Earthquake Archive Search & URL Builder. Accessed 22 July 2014 at: http://earthquake.usgs.gov/earthquakes/eqarchives/epic/epic_rect.php.
U.S. Minerals Management Service. 2007a. Gulf of Mexico OCS Oil and Gas Lease Sales: 2007-2012. Western Planning Area Sales 204, 207, 210, 215, and 218; Central Planning Area Sales 205, 206, 208, 213, 216, and 222. Final Environmental Impact Statement. U.S. Department of the Interior, Minerals Management Service, Gulf of Mexico OCS Region. OCS EIS/EA MMS 2007-018. April 2007.
U.S. Minerals Management Service. 2007b. Outer Continental Shelf Oil & Gas Leasing Program: 2007-2012. Final Environmental Impact Statement. U.S. Department of the Interior, Minerals Management Service, Herndon, VA. OCS EIS/EA MMS 2007-003. April 2007.
van de Laar, F.J.T. 2007. Green light to birds. Investigation into the effect of bird-friendly lighting. Report NAM locatie L15-FA-1. NAM, Assen, the Netherlands.
Veil, J.A. and K.P. Smith. 1999. NORM-disposal options, costs vary. Oil & Gas Journal 97(1)37-47.
Vidussi, F., H. Claustre, B.B. Manca, A. Luchetta, and J.C. Marty. 2001. Phytoplankton pigment distribution in relation to upper thermocline circulation in the eastern Mediterranean Sea during the winter. J. Geophys. Res. 106:19,939-19,956.
White, I.C. and F. Molloy. 2003. Factors that Determine the Cost of Oil Spills. International Oil Spill Conference 2003, Vancouver, Canada.
Wiese, F.K., W.A. Montevecchi, G.K. Davoren, F. Huettmann, A.W. Diamond, and J. Linke. 2001. Seabirds at risk around offshore oil platforms in the north-west Atlantic. Mar. Poll. Bull. 42(12):1,285-1,290.
Wilson, D., R. Billings, R. Oommen, and R. Chang. 2007. Year 2005 Gulfwide emission inventory study. U.S. Department of the Interior, Minerals Management Service, Gulf of Mexico OCS Region, New Orleans, LA. OCS Study MMS 2007-067. 149 pp.
Wimbush, M. and W.H. Munk. 1970. The Benthic Boundary Layer, pp. 731-758. In: A. Maxwell (ed.), The Sea, Vol. 4, Chapter 1. Wiley Interscience, New York, NY.
Wolfson, A., G.R. Van Blaricom, N. Davis, and G.S. Lewbel. 1979. The marine life of an offshore oil platform. Mar. Ecol. Prog. Ser. 1:81-89.
Tamar Field Development Project EIA 294 Noble Energy Mediterranean Ltd March 2016 CSA-Noble-FL-16-2650-08-REP-01-FIN-REV04
Yacobi, Y.Z., T. Zohary, N. Kress, A. Hecht, R.D. Robarts, M. Waiser, A.M. Wood, and W.K.W. Li. 1995. Chlorophyll distribution throughout the southeastern Mediterranean in relation to the physical structure of the water mass. J. Mar. Syst. 6:179-190.
Yahel, R. 2010. Ecosystem Approaches to Coastal and Ocean Management. Marine Protected Areas as an Ecosystem-Approach tool: Israel Red and Med(iterranean) Seas. Accessed 14 November 2014 at: http://www.unep.org/NairobiConvention/docs/EARuthy1008.pdf.
Yilmaz, K., A. Yilmaz, S. Yemenicioglu, M. Sur, I. Salihoglu, Z. Karabulut, F. Telli Karakoç, E. Hatipoglu, A.F. Gaines, D. Phillips, and A. Hewer. 1998. Polynuclear aromatic hydrocarbons (PAHs) in the eastern Mediterranean Sea. Marine Pollution Bulletin 36(11):922-925.

Tamar Field Development Project EIA 295 Noble Energy Mediterranean Ltd March 2016 CSA-Noble-FL-16-2650-08-REP-01-FIN-REV04
APPENDICES
Tamar Field Development Project EIA A-1 Noble Energy Mediterranean Ltd March 2016 CSA-Noble-FL-16-2650-08-REP-01-FIN-REV04
APPENDIX A
Framework Guidelines for Preparation of Environmental Document Accompanying License for Exploration Purposes

State of Israel
Ministry of National Infrastructure, Ministry for Environmental Energy and Water Protection Natural Resources Administration Marine and Coastal Division
Kislev, 5774
December 2013
Appendix B: Framework Guidelines for Preparation of Environmental Document Accompanying License for Exploration Purposes – Exploratory (Experimental) Drilling and
Offshore Production . Draft for Public Comment – December 2013
Environmental document accompanying Application for Exploration Drilling (hereinafter: the “Application”), for the performance of trial drilling and maritime production tests (hereinafter: the “Environmental Document”). The Guidelines were written by the Ministry of Energy and Water and the Ministry for Environmental Protection, together with the Nature and National Parks Authority (NNPA), and in coordination with the Ministry of Agriculture and Rural Development, and the Antiquities Authority. The Document is to be prepared following additional consultation with the Ministry for Environmental Protection and adaptation of the Framework Guidelines to the Application, in accordance with the details below. General Requirements A. The Environmental Document will be effected under the responsibility of the authors of the Application, and will include the name of the person responsible for its performance and the names of the professional service providers that participated in its preparation and performance. B. The Environmental Document will be prepared and performed by a company with experience and expertise in evaluation of environmental impact and marine research. The company by the selected developers of the plan to perform the document must prove a minimum of 10 years experience in the related area. C. The Company that shall be elected to prepare and perform the Document shall contain a team of experts with proven experience in research into the marine environment of Israel in the following areas: marine ecology, marine biology, a maritime biologist specializing in deep sea systems, marine chemistry, hydrodynamics, sedimentology, geology, atmospheric chemistry and marine geophysics. In the event that it is a foreign company, it shall be assisted by Israeli experts with proven experience in the above areas of content. The team shall be presented at the time of submission of the Application for the approval of the Commissioner and the Ministry for Environmental Protection, if necessary. D. For the purpose of preparation of the Environmental Document, it shall be possible to rely on relevant information collated during the past decade. E. The author of the document and the professional consultants shall fill in and sign the appropriate affidavits (Form 1, 2) in the form appearing in section 14(c) of the Planning and Building (Environmental Impact Studies) Regulations, 5763-2003. F. The Environmental Document will be submitted in Hebrew and in English and will include an extended summary at its start, which shall contain the principal findings, conclusions and recommendations for implementation of the Application. Likewise, a full bibliography and the sources of the data used by the authors of the document, separately for each of the environmental aspects, shall also be attached. Submission of the Environmental Document in English shall only be possible after receipt of prior, written consent. In the event that the Environmental Document is submitted in English, an extended summary will be attached to it containing the main findings, conclusions and recommendations for implementation of the Application in Hebrew as well. G. The Environmental Document shall be submitted in digital format as well, in a .pdf or .docx file. The drawings in the document shall also be submitted in .dwg and .shp files. Ground and aerial
Tamar Field Development Project EIA Noble Energy Mediterranean Ltd CSA-Noble-FL-16-2650-08-REP-01-FIN-REV04
A-2 March 2016

photographs (including orthophotos) used for the document shall be submitted in JPEG, TIFF and GeoTIFF or ECW or MrSID format, in accordance with the kind of result or other format approved in advance and in writing. H. The maps and aerial photographs that are submitted on digital media shall be at the highest possible resolution employed in the process of preparation thereof. On the other hand, the maps and aerial photographs that are attached to the hardcopy of the document shall be adjusted, in terms of scale, to the guidelines set out in the relevant section of the document. The maps shall set out the date of preparation and the name of the entity that effected the mapping. I. The document shall refer to all components of the Application. J. The document shall contain full reference to every section of the guidelines, in accordance with the order of the guidelines. A document that is submitted in an incomplete form shall be returned without being checked. K. If a particular section is submitted in a format that is different from the requested format, the change as compared with the guidelines must be set out and explained. L. The Guidelines are for every drilling site, whether single or multiple, including a salvage drilling site if prescribed. M. The Application (instructions + plan) must be attached to the Environmental Document that is to be submitted. N. The Framework Guidelines, following adaptation, shall constitute part of the Environmental Document and shall appear as an appendix thereto. O. Any privileged information constituting a commercial secret must be noted in order to enable publication of the environmental document without disclosing such information. It is clarified that final discretion with respect to whether material constitutes a commercial secret shall pertain to the Authority provided that the party submitting the material is given notice of such, and leave to present his position if such is not in accord with the Authority's position. P. The document must be submitted to the Petroleum Commissioner, in one copy and to the Ministry for Environmental Protection, in three copies, as a drafted, continuous and complete paper document, and in digital form as well. Q. The document shall be approved by the Petroleum Commissioner and the Ministry for Environmental Protection, who shall be assisted by the relevant entities. 1. Chapter A – Description of the current Maritime Environment to which the Application Relates 1.1. General 1.1.1. The subjects set out in this Chapter shall be used for the examination and description of the
environmental impacts expected to develop due to performance of the Application. 1.1.2. The Application shall be set out in words, and with maps and graphic descriptions. 1.1.3. The current situation of the deep sea area in the exploration sites, as well as biological,
ecological, chemical, sedimentological, atmospheric, geological and hydrodynamic aspects of the scientific data and cultural and heritage sites comprise the basis for forecasting the environmental influences that may arise due to the natural gas and oil exploration and production operations in the surrounds of theses sites.
1.1.4. The background survey set out in Appendix B1 “Framework Guidelines for Preparation of a Background Monitoring Plan for the Marine Environment Accompanying a License for Exploration Purposes – Exploratory (Experimental) Drilling and Offshore Production” shall serve as the basis for the description of the marine environment within the area of the Application.
1.2. Boundaries of Application and Area of Influence 1.2.1. The detailed area of the Application (blue line): shall include the maritime area within a
radius of up to 2 km around each of the gas and oil exploration sites, in the sea opposite the Israeli coastline, including a salvage drilling site if planned. The maritime area will include the water column, seabed and sub-seabed, and the maritime infrastructure and facilities situated at this site.
1.2.2. In the event that the drilling site is situated less than 1 nautical mile from the coastline, the
Tamar Field Development Project EIA Noble Energy Mediterranean Ltd CSA-Noble-FL-16-2650-08-REP-01-FIN-REV04
A-3 March 2016

area of the Application shall also include the area of the “coast” as defined in the Preservation of Coastal Environment Law and along a 1 km strip parallel to the drilling site.
1.2.3. The area of impact of the Application shall include the entire marine and coastal area that might be affected environmentally as a result of ongoing operations or a fault in any of the exploration sites, including ecological impacts, acoustic impacts, air quality, appearance from the coast, and hazardous materials. It is clarified that the area of impact varies depending on each of these matters and therefore, the author of the document must consult with the Ministry for Environmental Protection in order to obtain a specific delineation of the various impact boundaries, prior to preparing the document.
1.3. Maps and Orthophoto 1.3.1. The location of the exploratory drilling shall be described in words and its location noted on
the international Lat-Long grid and its coordinates on the New Israel Grid, where possible, and will be marked on all of the maps and sketches in the document.
1.3.2. The distance between the drilling site and points of note on the coast (Rosh Hacarmel, Hadera, Ashdod) and the perpendicular distance from the coast.
1.3.3. An orthophoto will be required where the distance of the exploration drillings is less than 1,000 m from the coastline.
1.3.4. A general depth map must be presented at a scale of 1:250,000 of the deep sea off the coast of Israel, with the location of the drilling sites, existing and proposed maritime boundaries and areas and shipping routes being noted on it.
1.3.5. A series of regional depth maps must be presented at a scale of 1:20,000, at a radius of 2 km from each of the sites, with the exposed rocky areas, the seabed, the type of ground (for instance: clay, silt, sand), fractures, land-slides and above- and underwater infrastructures and facilities found in each region being noted on it. The differences between the depth contours on the maps shall be 5 meters and the mapping data shall be the most up-to-date in existence. If there is information at a radius of more than 2 km, it should be presented too.
1.3.6. If there is maritime agricultural activity within a field of less than 30km from the exploratory drilling, the location of such activity and the location of the drilling site must be noted on a map at a scale of 1:50,000.
1.3.7. Detailed depth maps of the Application area (blue line) are to be set out at a scale of 1:5,000 around each of the sites, and mark on them the exposed rocky areas, the seabed, the type of ground (for instance: clay, silt, sand) and above- and underwater infrastructures and facilities found in each region. The differences between the depth contours on the maps shall be 1 meter and the mapping data shall be updated to the last decade. Likewise, the sedimentological characteristics of the seabed shall be based on a granulometric and mineral survey correctly representing the sediment in the detailed area of the plan.
1.3.8. In the event of exploratory drilling at a distance of less than 1 nautical mile from the coast, the land zoning and uses in the relevant coastal area must be marked (see section 1.2.2) as well as the physical data including the type of coverage (rock or sand, cliffs), coastal sensitivity to oil pollution, on a coastal water oil pollution sensitivity map (the map is accessible on the internet), existing and proposed marine reserves, maritime infrastructure, culture and heritage sites and antiquities, declared and undeclared bathing beaches, residential areas (existing and planned), public institutions, nature reserves and national parks, roads, engineering facilities and infrastructure lines relating to energy systems (petrol, gas, electricity), desalination plants, drainage and sewage lines, fuel reservoirs, hazardous material reservoirs, communications facilities and lines and other uses.
1.3.9. Maritime transportation and infrastructure systems, electricity infrastructure and facilities, communications and energy lines, corridors, pipelines and terminals for various infrastructures (gas, petrol, hazmat, RO, etc.) in the Application area must be set out on a maritime map at a scale of 1:20,000 together with a verbal description,
1.4. Geological, Seismic and Sedimentological Characteristics An exhaustive and detailed geo-hydrological description of the site, including: 1.4.1. Describe, in words, the general geographical location of the exploration drilling sites, their
Tamar Field Development Project EIA Noble Energy Mediterranean Ltd CSA-Noble-FL-16-2650-08-REP-01-FIN-REV04
A-4 March 2016

proximity to seismically active areas and the rock foundations upon which they will be constructed.
1.4.2. A general geological / geomorphological map must be set out at a scale of 1:200,000 of the sea off the coast of Israel, and mark thereupon the location of the exploration drilling sites. On this map, mark geological fractures, with an emphasis on fractures that are active or that are suspected of being active. Fractures described as being “suspected of being active” by the Israel Geological Institute or similar entities shall be deemed to be active unless it is proven that they are not active using the usual methods (conduct of research and geophysical cross-sections, and paleoseismological analysis). Likewise, mark locations of historical earthquakes of a magnitude of more than 2.5, areas liable to landslides and other geological and morphological phenomena which are notable.
1.4.3. Set out a series of regional geological / geomorphological maps at a scale of 1:20,000, around all of the sites, and mark geological fractures on them, with an emphasis on active (young) fractures or fractures suspected of being active. Likewise, mark locations of historical earthquakes of a magnitude of more than 2.5, areas liable to landslides, active landslides, rocky infrastructure exposed above the ordinary seabed, and other geological and morphological phenomena which are notable.
1.4.4. If the drilling mud and cutting discharge are to be discharged and/or dumped at sea, set out the area of dispersal of the mud and other cutting discharge on a geophysical survey conducted via side-scan sonar and underwater information, physical changes in the seabed due to the effects of anchoring and excavation, the build-up of waste, etc.
1.4.5. Describe in detail the rock infrastructure at each of the exploration drilling sites. Set out detailed information that might clarify the characteristics of the land (for instance: the speed of shear stress waves, the depth to the bedrock, characteristics that affect non-linear conduct, etc.).
1.4.6. Address the possibility of the existence of active geological fractures in the area of the Application and the near environment.
1.5. Hydrodynamic Regime 1.5.1. Describe the characteristic wave regime within the area of the Application. This description
shall be based on wave characteristics measured in the south eastern Mediterranean in general, and off the coast of Israel over the last 20 years in particular.
1.5.2. Set out the statistical breakdown of wave characteristics within the timeframe of one year (significant and maximum height, direction, cycle time at the top of the spectrum, and average cycle time), and within a longer timeframe of 5, 10, 20, 50 and 100 years, statistics of storm durations for various maritime conditions.
1.5.3. Refer to the affect of waves in extreme storms and the possibility of the development of killer waves, including due to a seismic source, on the stability of the marine structures within the area of the Application.
1.5.4. Describe the regime of the currents in the area of the Application, created due to the winds, and other oceanic variables (for instance: astronomic tides, Coriolis force, jet streams along the edge of the continental shelf, seasonal changes of seawater mass, temperature, salinity, etc.). This description shall be based on meteorological-oceanographic information collected since the mid-20th Century, in the Eastern Mediterranean in general and along the coast of Israel in particular.
1.5.5. Set out the statistical division of the wind regime in the Eastern Mediterranean, including the annual frequency of wind directions, wind magnitude (including gusts), seasonal effects, and extreme winds. The minimum resolution shall be 22.5° for wind direction and 2 m/s for speed.
1.5.6. Describe the current regime in the Application area or in an adjacent area, including statistic split subject to presentation of the source of the information, to the extent that such information is available.
1.6. Nature and Ecology 1.6.1. The condition of marine mammals, sea turtles, permanent sea birds, migrating birds (based
Tamar Field Development Project EIA Noble Energy Mediterranean Ltd CSA-Noble-FL-16-2650-08-REP-01-FIN-REV04
A-5 March 2016

on seasons and hourly distribution), and species of pelagic fish located in the drilling region, must be presented in accordance with information from the most up-to-date professional literature and from field surveys and population sizes must be estimated.
1.6.2. The natural monuments affixed to the seabed (benthic) must be presented. The species within the area of the Application and within the area of its impact (as described in section 1.2.3) must be described including micro and macro algae, seaweeds, seabed dwelling fauna, sedentary or territorial. In addition, describe the coastal natural monuments, as the case may be, situated within the area of the Application and within the area of its impact (as described in section 1.2.3). The information regarding natural phenomena will be in reliance upon a detailed biological survey (Appendix B1) which will be conducted within the area of the Application and the area of impact, and on information, if such exists in this area, from prior surveys. The information included shall be set out in tables, maps, graphs, pictures, video, and shall be accompanied by a detailed verbal description of the findings and with lists of inventory, including scientific names based on taxonomic classification. Note the presence of rare, unique or delicate organisms.
1.6.3. Set out the various habitats that exist in the body of water, and in the various seabed environments including hard surface areas, sponge gardens, deep coral reefs, seaweed carpets. A detailed description must be provided of fauna and flora societies in each of these habitats, including coverage percentages, and taxonomic information regarding the identity of species in the region. A map of the various habitats in the area of the Application must be included.
1.6.4. Pursuant to the above sections, a detailed analysis must be conducted of the information including on the basis of the following issues:
1.6.4.1. Identification of the creatures to a species level or to the most detailed taxonomical level possible.
1.6.4.2. Density of individuals. 1.6.4.3. Richness of species (in the various taxonomic groups). 1.6.4.4. Variety, the appropriate index must be chosen from the acceptable variety indexes
such as: Shanon-Wiener, Simpson (2004) ,Magurran, and give reasons for the choice. 1.6.4.5. Fixed and mobile species. 1.6.4.6. “Target species”: key species, species of commercial value, most common species
(breeding season, egg-laying season, area in which drilling operations will be tolerable, heavy metals and organic contaminants in target species).
1.6.4.7. Classification of species based on origin: Mediterranean-Atlantic, species with broad geographical distribution, invasive species.
1.6.5. Fishing areas within the area of the Application must be set out. Set out trawler fishing routes, fishing (note the kind of fishing - rod fishing, etc.), and show the data on a map at a scale of 1:20,000 and on a GIS layer, and the quantities of fish collected over a monthly and annual cross-section.
1.7. Sea Water and Sediment Quality 1.7.1. Set out the characteristics of the sea water and sediment quality within the area of impact,
around each of the sites. The information regarding the quality of the seawater and sediment shall be based on a seawater and sediment quality survey (Appendix B1) which shall be conducted in the area of impact of the Application and on additional relevant information if any in this area, from the monitoring plan and previous surveys. The information included shall be set out in maps, graphs and shall be accompanied by a detailed verbal description of the findings.
1.7.2. Set out the quantity of floating material in the water column, in a variety of marine climatic conditions (winds, waves, currents). The presentation of this data shall be based on sediment samples in accordance with Appendix B1 and on additional relevant information if such exists in this area. The level of turbidity of the water shall be measured at the surface, in the center of the water column and near to the seabed at each of the sites. Likewise, set out the climatic conditions at the time of taking the samples.
1.7.3. Set out the levels of chlorophyll in the water column, within the area of the Application.
Tamar Field Development Project EIA Noble Energy Mediterranean Ltd CSA-Noble-FL-16-2650-08-REP-01-FIN-REV04
A-6 March 2016

Likewise, an assessment of the dispersion of chlorophyll must be conducted over the entire area of impact, using remote sensing methods.
1.7.4. Describe, in detail, the chemical characteristics of the water column (dissolved oxygen, pH, salinity, temperature, fertilizers), within the area of the Application, around each of the sites.
1.7.5. Describe, in detail, the chemical characteristics of the sediment within the above area of the Application. The description shall focus on toxic substances, on chemical derivatives of heavy metals, TOC, PAH, SBF and their derivatives (including the results of decomposition), oxygen concentration in sediments. The sediment sampling system (the number of stations and their location) will be approved prior to performance as is set out in Appendix B1.
1.7.6. Likewise, describe the characteristics as set out in sections 1.7.5 and 1.7.5B of the fauna on the hard bed (if any) and of the fauna on the soft bed and of the fauna within the bed (in filtering animal tissue such as clams, snails, worms, polychaetes and crabs and fishes). The scope of this sampling will be approved in advance.
1.8. Culture and heritage sites The information regarding antiquities and cultural heritage sites shall be based on a detailed archeological survey or as a result of processing following a remote sensing survey (side sonar scanner, multives, ROV movies, etc.) which shall be conducted within the area of the Application and on information that exists regarding the area from prior surveys. The sites known to the Antiquities Authority (both declared and as yet undeclared sites) and other sites containing information about archeological findings or sunken ships from must be included. The total information will be presented on maps at a scale of 1:20,000, and shall include the archeological sites, pictures, videos and shall be accompanied by a detailed verbal description of the findings in the area of the Application and in its close proximity. 1.9. Meteorology and Air Quality 1.9.1. Describe the existing meteorological conditions in the area of the Application and its environs. 1.9.2. Special meteorological conditions that might cause conditions of dispersal that will give rise to
high air pollution concentrations in the environment must be noted. 1.9.3. For drilling operations planned at a distance of up to 10 km from the coast, up-to-date
information must be presented regarding the state of the existing air quality on land, within a range of up to 10 km from the boundaries of the drilling site. Up-to-date monitoring data of contaminants the concentration of which in the air might be affected as a result of the planned operations must be addressed. The following contaminants and other relevant contaminants must be addressed: NOx, SO2, PM10, PM2.5. The monitoring data will be from the past five years, and will be examined on the basis of the environment and target values (Air Quality Value Regulations, 2011) and if there is no target value, on the basis of the reference value. The availability of the data will not be less than 95% over a period of five years.
1.10. Noise 1.10.1. Set out the magnitude of the sub-marine noise at a number of representative points at each of
the sites (as set out in section 1.6 above). 1.11. Marine Transportation System and Infrastructure On the basis of section 1.3.9, describe, in words, the marine transportation and infrastructure system in the chosen alternative area. Set out the current operations of the system: Traffic volumes, entry and exit directions of vessels in accordance with the various classes of vessel, fuel containers, fishing boats, maritime farming service boats, yachts, tugboats and small operations vessels, etc. 1.12. Marine farming 1.12.1. Fishing and marine farming operations must be described, if any, at a distance of up to 30 km
from the planned drilling site. The location of marine farming sites in the impact area must be set out, along with the species of fish grown and the quantities of total annual growth.
Tamar Field Development Project EIA Noble Energy Mediterranean Ltd CSA-Noble-FL-16-2650-08-REP-01-FIN-REV04
A-7 March 2016

Chapter B – Reasons for Preference of the Location of the Proposed Plan and Possible Alternatives 2.1. General
In this Chapter, set out all of the reasons that gave rise to choice of the site proposed in the Application for Exploratory Drilling, including the salvage drilling site if planned. In addition, please refer to geological and seismic, environmental, planning, engineering and economic aspects, such as proximity to existing and planned infrastructure, exploitation of additional natural resources, impact on natural monuments, air quality, noise, etc. Data from drilling operations done in the past near to the area of the Application, if any, must also be addressed.
2.2. Location alternatives: Give details of and explain the various reasons that led to the determination of the proposed site of the exploratory drilling in the Application. Set out the location alternatives examined, the preferred alternative and the reasons that gave rise to the choice of it. The location alternatives will be examined in the exploration zone and for each location alternative, the following criteria, at least, will be examined: Structural analysis issues and the location of the target stratum; marine reserves; regions defined as special regions such as ridges, canyons or deep coral reefs, sponges, clams or other sedentary organisms; proximity to towns and residential areas, visibility and appearance from the coastline; habitats of animals in danger of extinction; shipping lanes; infrastructure, communications and energy lines; current regime; fish reproduction zones and times; fishing lanes; marine farming zones.
2.3. Technological alternatives: Set out the various technological alternatives examined and the various considerations that gave rise to the decision to use the technology set out in the Application, including the drilling technology (including vertical, angular, horizontal); the type of platform; BOP; drilling mud and liquids – composition, cutting discharge and drilling mud disposal targets. If use is planned to be made of mineral / oil based drilling mud, set out the criteria and limitations for use of one kind as opposed to another.
2.4. Possible alternative/s for deploying the infrastructures in the future production plan, including possible connection points to the terrestrial transmission system. The alternatives shall be set out in a comparison table, with each topic under examination being ranked, together with the professional reasons for selecting it. A sample table of criteria is attached in Appendix B2.
Chapter C – Description of Actions Stemming from Performance of the Application 3.1. General This Chapter shall set out a drilling plan including the drilling rig, various sea vessels and aircraft, and the plans for them, and the activities that they will perform. The description of the Application shall include reference to all of the works that will be done, including all matters relating to trial drillings, drilling phases, abandonment or announcement of a discovery and transition to production. This Chapter shall also refer to the various stages of construction and operation. Describe all of the details of the Application as will be examined in Chapter D. 3.2. Description of the Application 3.2.1. General
3.2.1.1. Describe the purpose of the drilling and the type of drilling (natural gas or oil; exploratory; salvage; verification; development; production).
3.2.1.2. Describe the drilling platform including the type of platform, the name of the platform, ownership, date of manufacture, date of upgrade, region of prior operation and fleet specifications.
3.2.1.3. Note water depth at the drilling site and depth of drilling below the seabed (below mud line - BML).
3.2.1.4. Describe the sea vessels and aircraft involved in the exploration application. 3.2.2. Description of Drilling Process
3.2.2.1. Describe, in brief, all of the drilling processes and phases including the actions and materials relating all drilling activities. Note the main operations, depth of drilling under the seabed (BML), under the surface of the water (BWD) and under the platform, for each drilling segment.
Tamar Field Development Project EIA Noble Energy Mediterranean Ltd CSA-Noble-FL-16-2650-08-REP-01-FIN-REV04
A-8 March 2016

3.2.2.2. Attach a schematic sketch showing the depth of the drilling as a function of time, including appropriate reference to the stages of the drilling and drilling data.
3.2.2.3. Set out a Gantt Chart setting out the drilling activities done in series and in parallel. 3.2.3. Prevention of Oil Blowout
Describe the blowout preventer (BOP) that has proven efficacy and that is designed to prevent oil, gas and/or liquids under the surface such as produced water, saline water from blowing out of the bore into the marine environment. Explain and describe the continuous pressure controls. Set out the standard for periodic testing of all of the means of prevention of blowout or fault.
3.2.4. Protective pipeline and concretization 3.2.4.1. - In accordance with the drilling plan, describe the protective pipeline from the seabed
to the target strata. 3.2.4.2. - Describe the concretization of the casement pipelines in the drilling, in order to
prevent possible leaks and the transition of liquids from the bore into the seawater. 3.2.4.3. - Describe the method of construction and concretizing of the bore with reference to
the timeframes of the principal stages in drilling the bore. 3.2.4.4. - Describe the composition of bore concretization materials. 3.2.4.5. - Set out the manner in which the quality of concretization is ensured during drilling,
the method of testing such and the standard used for testing. 3.2.5. Testing of drilling pipelines
- Describe the references required for ensuring that drilling and protection pipelines are in order and the method of testing such, with all of the components thereof.
3.3. Production Tests 3.3.1. describe the planned production test method, the phases thereof, the order of activities, the
equipment and the possible methods thereof, and set out the reasons for such. Set out the various indexes that will be examined such as maximum production of all production components (gas, oil, water, condensate), pressure, description of oil and/or gas including sulfur, nitrogen, CO2, etc.
3.3.2. In cases where use of chemical substances is planned in the production test, set out the substances that will be used in the production tests, the commercial names of such substances, their quantity, concentration, chemical composition and function including chemical formula, CAS (Chemical Abstract System) Number, and MSDS (Material Safety Data Sheet) and include them in the chemical table in section 3.6.
3.4. Noise Hazards Set out details of the mechanical equipment and the noise levels from the dominant sources characteristic of each form of technology. Set out details of the duration of the drilling, the hours of work each day, the number of sea vessels that will operate at the same time, throughout the hours of the day, and the aircraft involved in the work. Set out details of the frequency and magnitude of the noise that will be generated during the course of work at various distances from the source of the noise. If the drilling is less than one km from the coast, check the existence of noise-sensitive uses that may be exposed to noise levels that rise above what is permissible under the Prevention of Nuisance (Noise Prevention) Regulations, 5753-1992. 3.5. Air Quality 3.5.1. Describe the sources of emissions of contaminants into the air from the planned operations
during the drilling and production testing stages, including: Energy facilities, flare / vents, unfocused emissions and other sources.
3.5.2. For all sources of emissions presented, set out the regime for the activation, the type of fuel, the contaminants emitted and other data necessary for evaluating emission rates. The rates of emissions of contaminants shall be estimated on the basis of manufacturer's data, measurements or calculations on the basis of EPA-AP42 methodologies or on the basis of other methodologies upon prior approval.
Faults that might give rise to increase emissions of air contaminants into the environment, the
Tamar Field Development Project EIA Noble Energy Mediterranean Ltd CSA-Noble-FL-16-2650-08-REP-01-FIN-REV04
A-9 March 2016
emission of additional contaminants such as H2S or the generation of odor hazards to the populace (at sea and on land) must be addressed and the measures for preventing air contamination hazards must be set out for each possible fault.
3.6. Hazardous Materials Describe and set out all of the hazardous materials planned to be used, including drilling and production testing liquids. The following details must be noted for each material: Chemical composition, commercial name, CAS identification number, UN number and MSDS - Material Safety Data Sheet. Quantity, purpose of use and method of use, location on the platform (together with a sketch), storage and batching, method of treatment and removal. 3.7. Sources of Discharge into the Sea 3.7.1. General – ongoing activities
3.7.1.1. Describe all of the sources of discharge into the sea, and describe, for each source, the processes that give rise to the discharge and a flowchart of the process. The flows that must be presented include: Drilling mud, cutting discharge, cooling water, reverse osmosis concentrate water, organic kitchen waste (where the drilling is located more than 12 nautical miles from the coast), sanitary effluent / waste (“black water”), “gray” rinse waters, washes from the oil separation facility, cement surpluses.
The following information will be given for each source of discharge into the sea. For drilling mud and cutting discharge – see also the specific instructions in section 3.7.2.
3.7.1.2. Describe the processes that create the flow together with a drawing of the processes. 3.7.1.3. Describe the treatment processes, if any, including physical data of stocking units,
engineering and operational data for each treatment facility (the area of the facility, the volume of each unit, capacity, duration of presence, etc.); means of monitoring and control of each process / treatment; attach a schematic drawing for each treatment facility.
3.7.1.4. Set out the list of additives in each production and treatment process, the quantity of each additive, its function and the method of addition of it; attach information sheets (MSDS) for each additive, with an emphasis on ecological information for the marine environment, and possible impacts on fish farming and wild fish.
3.7.1.5. Describe the flow times including whether the flow is continuous or interrupted, fixed or variable (hourly / daily / other), and what the conditions and/or processes are that determine the quantity and/or times of flow.
3.7.1.6. Describe the method of discharge into the sea of each and every source and whether the discharge is effected separately / separate source or together with other discharges. In describing the source, set out the physical characteristics of the source / source pipe and the depth of the source with respect to the surface of the water / the seabed.
3.7.1.7. Quantities: Set out the quantities of each source, set out the information in accordance with maximum hourly, maximum daily, maximum monthly and total quantity during the course of the drilling. Set out the method of controlling quantities / amounts pumped into the sea (wharf based capacity meters, water meters, other - give details). Quantity data shall be presented in cubic meters.
3.7.1.8. With respect to the discharge of sanitary waste (“black water”) and shower / wash water (“gray water”), set out the quantity in cubic meters / day / person, for each separate source.
3.7.1.9. Quality: Describe the composition of each source. Set out the information on the basis of data from similar facilities, including the conduct of laboratory tests. This information shall include contaminant concentration data, and total contaminant load discharged into the sea (in tons) including the provisions set out in section 3.7.4 (qualities) Note, for each source of pumping, the source of the information regarding the composition of it.
3.7.1.10. Give details as to whether there are land-based alternatives for each pumping source. If not, give reasons and details regarding the way in which this subject was
Tamar Field Development Project EIA Noble Energy Mediterranean Ltd CSA-Noble-FL-16-2650-08-REP-01-FIN-REV04
A-10 March 2016
checked. Cutting discharge, drilling mud and left-over cement (drilling mud relates to any addition of liquids and materials used for drilling purposes). 3.7.2. Cutting discharge:
3.7.2.1. Quantities: Set out the quantity of cutting discharge (tons) and volume (cubic meters) discharged into the sea as follows: In each of the drilling segments, by drilling diameter; in the stage in which the drilling takes place without recycling and the cutting discharge is placed around the the wellhead directly on the seabed; in the drilling stage which is done with recycling, when the cutting discharge is brought up to the platform with the drilling mud; total quantity of cutting discharge discharged into the sea.
3.7.2.2. Treatment and removal of cutting discharge – describe the method of treatment and removal of cutting discharge.
3.7.2.3. If the cutting discharge removal destination is at sea, describe the piling up of cutting discharge and drilling mud on the seabed. Assess the radius and area affected by this process.
3.7.3. Drilling mud and left-over cement: 3.7.3.1. Quantities of drilling mud – set out the total quantity and volume of drilling mud
(cubic meters and tons), for the stage of the drilling without recycling when the drilling mud is placed near to the drilling bore on the seabed, and for the stage of drilling done when the recycled drilling mud is brought back up to the platform with the cutting discharge and total quantities of the drilling mud discharged into the sea.
3.7.3.2. Set out the composition of drilling mud in a table, including: The name of the material, the function of each material, the quantity of each material in each segment of drilling and the total quantity of materials in each segment of the drilling, totals of all materials in each segment of the drilling and total quantities of all materials in the entire drilling process. This data shall be presented in cubic meters, transition units (SG) and tons. Note which of the drilling stages the discharge into the sea takes place in, what quantity is being discharged at each stage, and the total. This data shall be presented in cubic meters and tons.
3.7.3.3. Describe the way in which the various substances are added to the water and to other drilling liquids (creating the drilling mud). In reliance upon the above, please also refer to the quantities of water / other drilling fluid that are added during the course of drilling, due to losses of water / fluids / drilling mud back into the rock strata.
3.7.3.4. For each component and material, information sheets (MSDS) must be presented, including ecological information regarding the marine environment (toxicity, biodegradability, bioaccumulation) and concentrations of each component that might be pumped into the sea.
3.7.3.5. Chemicals / additives: Set out in a concentrated table data on chemicals, based on source of use (drilling mud, cement, etc.), based on information sheets, including: the name of the chemical, its CAS number, the composition of the chemical (in the event of a compound, set out each substance and composition, and the percentage of it in the compound), ecological information including the results of toxicity tests, biodegradability, bioaccumulation and the level of its impact / toxicity on the marine environment. Wherever there is no information, write “no information”; and note the level of environmental risk according to OSPAR / the Norwegian Method (green, yellow, red, black).
3.7.3.6. Describe the method and frequency of the various tests conducted in mud and drilling liquids, including materials pumped into the drilling mud preparation system and the standards under which the tests are conducted.
3.7.3.7. Biological toxicity test – set out the tests conducted for testing biological toxicity in drilling mud / surpluses from the treatment facility pumped into the sea and set out where such tests are performed and the source of the data; examine and present the extent to which the existing toxicity tests accord with the deep sea conditions in the
Tamar Field Development Project EIA Noble Energy Mediterranean Ltd CSA-Noble-FL-16-2650-08-REP-01-FIN-REV04
A-11 March 2016

Eastern Mediterranean Deep Sea Basin. Attach an expert opinion regarding the extent to which the tests comply, and his recommendations regarding the conducting of compatibility tests for the deep sea conditions in our region.
3.7.3.8. Drilling mud treatment – describe the areas and methods of organization and the facility for the treatment of drilling mud, separation of the cutting discharge from it, testing the composition of it and details of the additives planned for the treatment facility, including the list of additives, the function of each substance, the method of placement of it, etc. Losses of drilling mud must be addressed, and estimates given as to the percentage lost, quantities (in tons) and volume (in cubic meters).
3.7.3.9. Attach sketches, including notation of physical data of units of production / processes / treatment and return of drilling mud, including work areas, volumes of treatment facilities, durations, etc.
3.7.3.10. Describe the stages of drilling in which use is made of cement, and the processes in respect of which left-over cement is discharged into the sea.
3.7.3.11. Cement quantities: Set out the total quantity of cement in each of the stages of drilling and the total quantity in use (tons). Estimate and set out the quantities of cement that are to be discharged into the sea.
3.7.4. Information on quality of discharges into the sea: Set out the information on the quality of discharges into the sea so as to include information on chemical composition as follows: This information will be based on tests from similar facilities and processes from the past five years, subject to the existence of such, and details of the source of the information. 3.7.4.1. Discharges originating in the drilling mud: Set out the chemical composition of the
water, including: An extended metal scan (ICP, mercury in AA); GCMS scan for organic materials with probability percentages, half-quantity concentrations and summary; detailed VOC scan (head space) with probability percentages, including half-quantity concentrations and summary; TOC; TSS; BOD; mineral oil (FTIR); PAH; turbidity; free chlorine; phenol; cresol; pH; AOX; DOX; species of nitrogen (nitrate - NO3; nitrite - NO2; ammoniac nitrogen NH4-N; Kjeldahl nitrogen TKN; total nitrogen - calculated); phosphorus - P; sulfide; TDS; chlorides; the information shall be presented as concentration (mg/L) and as load (weight per unit of time).
3.7.4.2. Discharges originating in the cutting discharge: Set out metal composition: Ag, As, Cd, Cu, Cr, Hg, Ni, Pb, Zn; organic matter (TOC); radioactive materials Pb-210, Th-228, Ra-226, Ra-228.
3.7.4.3. Discharges from the wash treatment facility: Set out the chemical composition of the water, including: An extended metal scan (ICP, mercury in AA); GCMS scan for organic materials with probability percentages, half-quantity concentrations and summary; detailed VOC scan (head space) with probability percentages, including half-quantity concentrations and summary; TOC; TSS; BOD; DOC; turbidity; phenol; cresol; pH; AOX; DOX; mineral oil (FTIR); species of nitrogen (nitrate - NO3; nitrite - NO2; ammoniac nitrogen NH4-N; Kjeldahl nitrogen TKN; total nitrogen - calculated); phosphorus - P; sulfide; TDS; chlorides; the information shall be presented as concentration (mg/L) and as load (weight per unit of time).
3.7.4.4. Discharges from sanitary effluent treatment facility: Set out the chemical composition of the water, including: BOD; TSS; TOC; turbidity, free chlorine, oils and lipids (FTIR), mineral oil (FTIR), species of nitrogen; sulphide; detergents (MBAS); pH; fecal coli per 100 mL, streptococcus per 100 mL, extended survey of metals (ICP), TDS; the information shall be presented as concentrate (ML) and load (mass per unit of time – mass / month or mass / year).
3.7.5. Describe the measures and structure of the platform for the purpose of separating clean upper water, in the event of rain, from oily lower water intended for treatment prior to release into the sea or removal to land.
3.8. Waste Describe the quantity of the waste expected to be created, including kitchen waste, dry waste, other
Tamar Field Development Project EIA Noble Energy Mediterranean Ltd CSA-Noble-FL-16-2650-08-REP-01-FIN-REV04
A-12 March 2016

waste created as a result of the drilling process, except for waste set out in the section regarding sources of discharge into the sea as set out in section 3.7 above. 3.9. Closure / Abandonment of Drilling Site Describe the details of the actions required for closure of the drilling site and the order of performance thereof, including permanent abandonment or temporary abandonment. Describe the measures for closing the wellhead, the target strata, and other conducting strata for two alternatives, abandonment and restoration of the previous condition; declaration of a discovery and transition to production. In the event of closure of the wellhead, the standard under which the closure means are installed must be set out. Set out the list of chemicals planned for use in closing the well and include these in the table of chemicals in section 3.6 together with information sheets. Attach a schematic drawing of a cross-section of the drilling prior to closure of the drilling and after closure (temporary / permanent). Chapter D – Evaluation of the Environmental Impacts expected to develop due to Performance of the Application and the Measures to be taken to Prevent / Minimize such In this Chapter, the various topics expected to have an environmental impact shall be set out graphically and verbally, including impact on moving or stationary species within the areas of the Application and its close and remote environs, in accordance with the provisions of section 1.2.3. The description of the environmental impacts and the sources of these shall be both qualitative and quantitative. The variety of activities expected to take place at the drilling site must be set out. With respect to each subject, an explanation shall be given as to whether it is necessary to prevent or reduce the negative environmental impacts and what means must be employed in order to prevent or reduce such, if any. In the event that during the course of preparation of the Application, influences or other findings are found that are not mentioned in this document, these must be addressed and means must be proposed for reducing the impact in the document. 4.1. Assessment of Potential Impact on Marine Environment 4.1.1. Assess the maximum scope of the impact of the drilling rig, including anchors, on the
seawater, the seabed, and the coast, as the case may be, and set out the basis for the information and the method of effecting the assessment.
4.1.2. In the event that the discharge target for the cutting discharge and drilling mud is at sea, assess the extent of impact on the environment in accordance with an evaluation of the radius and the area affected by the process, as set out in section 3.7.2.3 and set out the tests, actions and frequency thereof in order to minimize harm to the marine environment.
4.1.3. In the event of proximity to natural monuments identified in accordance with section 1.6, existing and proposed nature reserves, culture and heritage sites and marine farming facilities, the methods of action to remove the cutting discharge and the drilling mud to an alternative marine site and/or to a site on dry land are to be examined and presented.
4.1.4. Examine and present the possibility of reducing and minimizing the placement of discharge and drilling mud directly onto the seabed during the course of drilling from the drilling segment prior to installation of the riser, such as by using an RMR SYSTEM.
4.1.5. Assess the maximum scope of the impact of the drilling liquids at the time of effecting the production tests on the seawater in the area of the Application.
4.1.6. Simulation (a digital three-dimensional hydrodynamic contaminant dispersion model) for drilling mud of the dispersion zone of the drilling mud and other mining liquids – each case must be considered on its merits on the basis of environmental data and location relative to the coast, the quantity of mud and discharge and the duration of time of the drilling or discharge into the sea. This matter will be coordinated and approved in advance and in writing. If simulation is required, the model must be approved and is to be presented in a preliminary document which shall contain a description of the type of model, calibration characteristics, commencement conditions, language conditions, the grid of the model and other parameters required in order to activate the model. After approval of the conditions and calibration of the model, the scenarios for modeling the dispersion of contaminants from a hydrodynamic point
Tamar Field Development Project EIA Noble Energy Mediterranean Ltd CSA-Noble-FL-16-2650-08-REP-01-FIN-REV04
A-13 March 2016
of view will be set, in various climatic conditions. 4.2. Production Tests Describe all of the means for ensuring that under no circumstances will there be any connection (transfer of liquids or gases) from the area where the production tests are taking place and the water-carrying strata and expansion of the fuel composition (liquid and gas) underground or in the marine environment. 4.3. Environmental Impacts of Sea Pollution Event by Oil based on Extreme Scenarios 4.3.1. Please describe the current field and the movement of the oil stain along the Israeli coastline
from the drilling bore in detail and in stages. This description should rely, inter alia, on the results of activation of a three-dimensional hydrodynamic model, which has been fed with wind data and the other necessary hydrodynamic characteristics. The hydrodynamic model must set out, precisely, the field of currents in accordance with the layout of the local seabed up to the Israeli coastline.
4.3.2. If the oil slick will, based on the findings of the hydrodynamic model, penetrate the shallow portion of the continental shelf off the coast of Israel, describe via the appropriate hydrodynamic model for simulating the hydrodynamic processes in the coastal environment the current regime in the area affected mainly by local winds and waves, and analyze the impact of such currents on dispersal of the oil slick on the coastal environment.
4.3.3. In running the model and in all of the calculations stemming from it, please take into account the worst-case scenario of 30 continuous days of discharge into the marine environment, at a maximum daily capacity in accordance with the drilling data. The type of oil in the model must be the most resilient oil expected in the reservoir and/or in accordance with the worst-case scenario data.
4.3.4. Please run each of the four most common sea conditions on Israeli beaches for a period of 30 days: 4.3.4.1. Extreme winter wave storm: 9.12.2010 - 08.01.2011 4.3.4.2. Winter wave storm: 26.01.2008 - 14.02.2008 4.3.4.3. Summer swell: 17.07.2008 - 16.08.2008 4.3.4.4. Strong North-Easterly wind (Spring and Autumn): 25.09.2007 - 25.10.2007
4.3.5. Please explain in clear detail all of the data and estimates for the maximum daily quantity of oil set out in the document, and the general quantity during the course of the current scenario, without 30 day control, including formulas and calculations. Please clarify the objective difficulties in evaluating the expected quantities and the possible areas of imprecision. Please address the relevance of the modeling method performed and expand, in the explanation, on the relationship between the results of the model and the actual anticipated assessment based on international knowledge and experience from past oil pollution incidents. Explain the nature of the oil spill over the water, including the thickness and expected spread of it, and the environmental significance of the thickness and spread of the spill.
4.3.6. Please analyze, on the basis of the findings of the model, the results of the spread of the oil stain from the drilling bore and give a detailed explanation of the environmental significance of the results of the model. Please refer to the marine environment in general and to the coastal area and the various sites therein in particular. Give details and explain the environmental and other implications that might arise from an oil spill incident at sea under the various scenarios, vis-à-vis the various environments. Including a description of sensitive areas that might be affected by a pollution incident (based on a map of sensitivity of beaches to sea pollution by oil. The map is accessible on the internet and a copy may be obtained from the Marine and Coastal Division as a GIS layer). Address the various significances, including: 4.3.6.1. The impact on the ecosystem in general, and on the various species in particular. 4.3.6.2. The impact of the various uses including an assessment of the measures required to
remedy the damage and to restore the previous condition, an assessment of the length of time during which uses might be harmed and a general assessment of the costs of restoring the previous condition, all in accordance with open reports of international
Tamar Field Development Project EIA Noble Energy Mediterranean Ltd CSA-Noble-FL-16-2650-08-REP-01-FIN-REV04
A-14 March 2016

experiences. 4.3.6.3. Please address the following environments: The open sea environment, including a
distinction between deep water and the critical transition zone, the seabed, beaches used for swimming and leisure, rocky beaches and/or sandy beaches that are rich in biota, marinas, moorings, marine anchorages and ports, power station cooling water suction plant and coal terminal, reverse osmosis plants and fish farm cages.
4.3.7. Set out an oil spill spread model (name of model, name of manufacturer and representative calibration data), and output data, for the prior approval of the Ministry for Environmental Protection (Marine and Coastal Division), prior to running the model. For the purpose of approval of the calibration stage, please set out a document describing, in detail, the boundary conditions and the starting conditions of the model, and the various variables and non-variables chosen for the purpose of running the model. The following are the details, variables and conditions that are required for the approval: 4.3.7.1. General
4.3.7.1.1. The name of the model. 4.3.7.1.2. A brief description of the model. 4.3.7.1.3. Reasons for adapting the proposed Eastern Mediterranean
Sea (oil) spill simulation model. 4.3.7.1.4. Examples from around the world for use in the proposed spill
simulation model. 4.3.7.2. Meteorological-Physical Conditions and Variables
4.3.7.2.1. Conditions of edge of model (boundaries and surface) 4.3.7.2.2. Conditions of commencement of model. 4.3.7.2.3. Resolution of model, both horizontal and vertical. 4.3.7.2.4. Characteristics of starting data for model: winds, currents,
sea level, temperature, salinity, etc. 4.3.7.2.5. Bathymetry.
4.3.7.3. Chemical Variables 4.3.7.3.1. Type of oil. 4.3.7.3.2. Quantity of oil emitted per unit of time.
4.3.7.4. Calibration and Verification of Model 4.3.7.4.1. Methodological description and explanation of the proposed
method of calibration. 4.3.7.4.2. Presentation of the variables required for calibration for the
purpose of achieving the requisite model performances. 4.3.7.4.3. Presentation of calibration findings (in figures, tables, and a
verbal explanation). 4.3.7.4.4. Methodological description and explanation of the proposed
method of verification. 4.3.7.4.5. Presentation of verification findings (in figures, tables, and a
verbal explanation). 4.3.7.5. Scenarios for Examination
4.3.7.5.1. Analysis of the usual and extreme hydrodynamic characteristics in the area and environs of the drilling bore.
4.4. Light Hazards The effect of lighting and the planned production tests required for performance of the Application on the environment must be examined and measures proposed for reducing expected light hazards. 4.5. Noise Assess the expected impact of noise on animals in the environs of the drilling. Give details of the local species that might be harmed by such noises (with an emphasis on pelagic animals such as fish, whether wild or caged, marine mammals, turtles), and measures for reducing damage. 4.6. Nature and Ecology
Tamar Field Development Project EIA Noble Energy Mediterranean Ltd CSA-Noble-FL-16-2650-08-REP-01-FIN-REV04
A-15 March 2016

4.6.1. Assess the level of sensitivity of the animals and the possible impacts of construction of the rig on habitats as described on the habitat map in section 1.6.
4.6.2. Describe rehabilitation at the end of drilling work and abandonment or commencement of the operational period.
4.7. Culture and heritage sites Check the impact of performance of the plan on declared sites and on sites that may be discovered and exposed during the performance of the Application. 4.8. Air Quality 4.8.1. Set out a table that concentrates the rates of emission of air contaminants set out in section 3.5
from any source, and the method of calculation / evaluation of them. 4.8.2. Set out the measures and actions planned to be taken to reduce emissions from all sources set
out in section 3.5, and the efficacy thereof, and address the best available technology (BAT) for complying with international requirements. For facilities / operations in respect of which there are requirements in TA-Luft 2002, address compliance with such requirements. Describe the ongoing maintenance of these facilities. In particular, address the treatment of problems relating to H2S emissions into the air, in routine operations or in the event of faults.
4.8.3. Assess what faults might be expected to cause harmful material emissions into the air causing danger to elements of the population or to shipping. The following sections (4.8.4-4.8.10) will be added for applications for drilling at a distance of less than 10 km from the coast.
4.8.4. Assess the impact of emissions of the following contaminants: SO2, NOx, PM25, PM10, on the quality of the air in the environs of the bore, by running an acceptable dispersion model such as AERMOD or another model. The author of the document must obtain the prior approval of the model chosen before running it. Set out all of the input data taken for the purpose of running the model (emission rates, temperature, stack diameter, meteorological data, etc.), including the reasons for any presumptions, if any.
Meteorological data for running the model shall be taken from the meteorological station near to the coast, upon coordination with the Ministry for Environmental Protection.
4.8.5. The results of running the model shall be examined in a defined area up to the rate in which concentrations of 10% of the environmental standard are obtained. Within this range, if additional emissions sources exist, another model must be run that includes the existing and approved emissions sources, including roads, power stations and factories.
4.8.6. The model shall be run on a Cartesian grid, and individual receptors must be shown in areas where existing and approved sensitive land uses are in existence.
4.8.7. The results of running the model shall be examined with respect to environmental values and goals (Air Quality Value Regulations, 2011). If there is no target value in the Regulations, the results must be examined with respect to the reference values. The results shall be presented in tables and graphically via isoplates, on a background map. The percentage contribution of each source to the emission of each contaminant must be set out.
4.8.8. Calculate dispersal of the contaminants in scenarios of faults for severe weather conditions. 4.8.9. Set out the measures and actions planned to be taken to reduce emissions from all sources set
out in section 3.5, and the efficacy thereof, and address the best available technology (BAT) for complying with international requirements. For facilities / operations in respect of which there are requirements in TA-Luft 2002, address compliance with such requirements. Describe the ongoing maintenance of these facilities. In particular, address the treatment of problems relating to H2S emissions into the air, in routine operations or in the event of faults.
4.8.10. A magnetic medium must be attached to the Environmental Document containing the input data for the calculations, the results of the calculations, and meteorological data files.
Waste Describe the methods of treatment and removal of waste, as set out in section 3.8 above. 4.9. Hazardous Materials 4.9.1. Set out the measures for reducing risks from hazardous materials in accordance with the
Tamar Field Development Project EIA Noble Energy Mediterranean Ltd CSA-Noble-FL-16-2650-08-REP-01-FIN-REV04
A-16 March 2016

details in section 3.6 above. 4.9.2. Describe and set the measures for treatment in the event that hazardous materials are
discovered during the course of the drilling, including H2S. 4.9.3. Set out the method of treatment in emergencies (hazardous material event) and the means for
minimizing risks, including passive and active measures such as batches detectors. 4.10. Preparations for Earthquakes Prepare emergency procedures or a chapter of existing emergency procedures for the handling of earthquakes. These procedures must address all exceptional situations, including: failure of communications and contact, inability to reach emergency forces, partial emergency team, etc. 4.11. Fishing and Marine Farming 4.11.1. Describe the impacts of the exploratory drilling on fishing activity and the ways of reducing
such impacts, in the event of harm to fishing and marine farming. 4.11.2. Describe a veterinary monitoring plan to examine the impact of the drilling on questions of
fish health and public health in the event of intensive marine farming, or alternatively set out coordination with growers regarding implementation of a monitoring plan and risk assessment approved by the veterinary services.
4.12. Safety and Protection Assess the safety range required around the bore against harm to existing infrastructure and sea vessels. 4.13. Monitoring and Control Program 4.13.1. Describe the monitoring and control methods for each source discharged into the sea. Note,
inter alia, what tests are planned to be done continuously, which are done visually and which are done in laboratories on the platform, which are done at external laboratories, and at what frequency.
4.13.2. Describe the method of taking samples in order to obtain representative samples, for continuous / visual / laboratory sampling.
4.13.3. Describe the calibration and maintenance actions on monitoring and control instruments. 4.13.4. A background monitoring report of the marine environment must be submitted in accordance
with Appendix B1. 4.14. Closure of Drilling Site Examine the impact of closure of the drilling site on the environment and the means required to prevent such impacts, including the removal of materials, equipment and waste. Chapter E – Proposal for Application Guidelines General: 5.1. This Chapter shall set out all of the proposals for setting the guidelines of the Application, at
the level set out as being required for detailing the possible impacts set out in the chapters of this document, and the measures that are to be taken in order to prevent or reduce such.
5.2. The guidelines shall refer to the actions that must be taken or not taken in the entire area of the Plan, during the course of drilling and throughout the various phases of performance thereof, and following completion thereof.
5.3. The guidelines shall be for the grant of a drilling permit. 5.4. The guidelines shall relate to the installation and operation of systems to track and monitor
the effects that flow or that may flow from this Application. 5.5. The guidelines shall relate to the actions that must be done throughout the area of the
Application, upon the making of a decision to perform drilling and up to closure of the drilling site within the area of the Application.
5.6. The guidelines shall include the following topics, inter alia: 5.6.1. Guidelines for the phases of performance of drilling and production tests. 5.6.2. Guideline for the handling of hazardous materials.
Tamar Field Development Project EIA Noble Energy Mediterranean Ltd CSA-Noble-FL-16-2650-08-REP-01-FIN-REV04
A-17 March 2016

5.6.3. Guidelines for the reduction and prevention of harm to land and to seawater and the coastline, and including harm to the marine ecology, fishing and marine farming.
5.6.4. Guidelines for preservation of fauna and flora in the area of the Application including instructions for the prevention of harm to pelagic species whose presence around the drilling rig might be increased, such as sharks, marine mammals and birds.
5.6.5. Guidelines regarding the collection of data for the purpose of monitoring and tracking the quality of seawater, sediment, currents, fauna and flora and marine farming in the environs of the bore.
5.6.6. Guidelines for the construction of various monitoring systems (air, water, waste, mud and cutting discharge, etc.), to operate during the construction and performance of the Application.
5.6.7. Guidelines for performance of a veterinary monitoring plan for marine farming fish in order to ensure public health aspects.
5.6.8. Guidelines for measures for preventing / reducing light hazards. 5.6.9. Guidelines for measures for reducing air contaminant emissions. 5.6.10. Guidelines for measures for preventing or reducing noise. 5.6.11. Guidelines for measures for the treatment and removal of cutting discharge and
drilling mud. 5.6.12. Guidelines for measures for treatment of various sources of discharge including
cooling water, sanitary waste, kitchen waste, concentrate water. 5.6.13. Guidelines for the definition of safety and protection zones and the management of
safety against harm to existing infrastructure and sea vessels. 5.6.14. Guidelines for methods of treatment and removal of waste. 5.6.15. Guidelines for preparation of emergency procedures in the event of faults or accidents
including submission of an emergency factory plan for the treatment of oil spills at sea, fire.
5.6.16. Guidelines for the actions to be taken when closing and rehabilitating the drilling site. 5.6.17. Guidelines for the setting up of a team to accompany the Application, and the
composition thereof. 5.6.18. Guidelines for periodical reporting of faults to the Petroleum Commissioner, and of
environmental issues to the Ministry for Environmental Protection.
Tamar Field Development Project EIA Noble Energy Mediterranean Ltd CSA-Noble-FL-16-2650-08-REP-01-FIN-REV04
A-18 March 2016
Tamar Field Development Project EIA B-1 Noble Energy Mediterranean Ltd March 2016 CSA-Noble-FL-16-2650-08-REP-01-FIN-REV04
APPENDIX B
Cross-Reference Table for Compliance with Framework Guidelines

Table B-1. Cross-reference table for compliance with the Framework Guidelines. Yes = included in the EIA; No = not included in the EIA; N/A = not applicable.
Framework Guidelines for the Preparation of Environmental Documents Addressed in Tamar Drilling EIA C
hapt
er
Sect
ion
Sub-
Sect
ion
Heading Clause/Requirement Yes,
No, or N/A C
hapt
er
Sect
ion
Num
ber
Section Name Comments
A 1 Description of the Current Maritime Environment to which the Application Relates 1.1. General
1.1.1. The subjects set out in this Chapter shall be used for the examination and description of the environmental impacts expected to develop due to performance of the Application.
Yes 1 -- -- Chapter 1 as a whole addresses this requirement.
1.1.2. The Application shall be set out in words, and with maps and graphic descriptions. Yes 1 -- -- Chapter 1 as a whole addresses
this requirement.
1.1.3.
The current situation of the deep sea area in the exploration sites, as well as biological, ecological, chemical, sedimentological, atmospheric, geological and hydrodynamic aspects of the scientific data and cultural and heritage sites comprise the basis for forecasting the environmental influences that may arise due to the natural gas and oil exploration and production operations in the surrounds of these sites.
Yes 1 -- -- Chapter 1 as a whole addresses this requirement.
1.1.4.
The background survey set out in Appendix B1 “ Framework Guidelines for Preparation of a Background Monitoring Plan for the Marine Environment Accompanying a License for Exploration Purposes – Exploratory (Experimental) Drilling and Offshore Production ”shall serve as the basis for the description of the marine environment within the area of the Application.
Yes 1 -- --
Chapter 1 as a whole addresses this requirement. The survey reports stand alone and are referenced in the document.
1.2. Boundaries of Application and Area of Influence
1.2.1.
The detailed area of the Application (blue line): shall include the maritime area within a radius of up to 2 km around each of the gas and oil exploration sites, in the sea opposite the Israeli coastline, including a salvage drilling site if planned. The maritime area will include the water column, seabed and sub-seabed, and the maritime infrastructure and facilities situated at this site.
Yes 1 1.1.2 Maps and Orthophotos
1.2.2.
In the event that the drilling site is situated less than 1 nautical mile from the coastline, the area of the Application shall also include the area of the “coast ”as defined in the Preservation of Coastal Environment Law and along a 1 km strip parallel to the drilling site.
N/A -- -- -- Not applicable. The project sites are more than 1 nautical mile (nmi) from the coastline.
Tamar Field Development Project EIA Noble Energy Mediterranean Ltd CSA-Noble-FL-16-2650-08-REP-01-FIN-REV04
B-2 March 2016

Framework Guidelines for the Preparation of Environmental Documents Addressed in Tamar Drilling EIA C
hapt
er
Sect
ion
Sub-
Sect
ion
Heading Clause/Requirement Yes,
No, or N/A C
hapt
er
Sect
ion
Num
ber
Section Name Comments
1.2.3.
The area of impact of the Application shall include the entire marine and coastal area that might be affected environmentally as a result of ongoing operations or a fault in any of the exploration sites, including ecological impacts, acoustic impacts, air quality, appearance from the coast, and hazardous materials. It is clarified that the area of impact varies depending on each of these matters and therefore, the author of the document must consult with the Ministry for Environmental Protection in order to obtain a specific delineation of the various impact boundaries, prior to preparing the document.
Yes 4
4.3
Environmental Impacts of Non-Routine Events
4.6 Nature and Ecology Impacts
1.3. Maps and Orthophotos
1.3.1.
The location of the exploratory drilling shall be described in words and its location noted on the international Lat-Long grid and its coordinates on the New Israel Grid, where possible, and will be marked on all of the maps and sketches in the document.
Yes 3 3.2.1 Well Locations
Table 3-2 in Section 3.2.1 presents a table of the coordinates. Figure 1-3 illustrates the well locations.
1.3.2. The distance between the drilling site and points of note on the coast (Rosh Hacarmel, Hadera, Ashdod) and the perpendicular distance from the coast.
Yes The lease area is approximately 90 km west of Haifa.
1.3.3. An orthophoto will be required where the distance of the exploration drillings is less than 1,000 m from the coastline. N/A -- -- --
Not applicable. The project sites are more than 1,000 m from the coastline.
1.3.4.
A general depth map must be presented at a scale of 1:250,000 of the deep sea off the coast of Israel, with the location of the drilling sites, existing and proposed maritime boundaries and areas and shipping routes being noted on it.
Yes 1 1.1.2 Maps and Orthophotos
Figure 1-5 shows the required map.
1.3.5.
A series of regional depth maps must be presented at a scale of 1:20,000, at a radius of 2 km from each of the sites, with the exposed rocky areas, the seabed, the type of ground (for instance: clay, silt, sand), fractures, land-slides and above- and underwater infrastructures and facilities found in each region being noted on it. The differences between the depth contours on the maps shall be 5 meters and the mapping data shall be the most up-to-date in existence. If there is information at a radius of more than 2 km, it should be presented too.
Yes 1 1.1.2 Maps and Orthophotos
Pipeline route maps are presented in Section 1.1.2. Figure 1-5 shows the depth contours for the drill sites. Section 1.2.1 presents information on the bottom type at the proposed drill sites.
Tamar Field Development Project EIA Noble Energy Mediterranean Ltd CSA-Noble-FL-16-2650-08-REP-01-FIN-REV04
B-3 March 2016

Framework Guidelines for the Preparation of Environmental Documents Addressed in Tamar Drilling EIA C
hapt
er
Sect
ion
Sub-
Sect
ion
Heading Clause/Requirement Yes,
No, or N/A C
hapt
er
Sect
ion
Num
ber
Section Name Comments
1.3.6.
If there is maritime agricultural activity within a field of less than 30km from the exploratory drilling, the location of such activity and the location of the drilling site must be noted on a map at a scale of 1:50,000.
N/A -- -- --
There is no maritime agricultural activity within 30 km of the proposed drilling sites, although included in Section 1.1.2, Figure 1-4. Also discussed relative to potential shoreline impacts of non-routine events in Section 4.3.
1.3.7.
Detailed depth maps of the Application area (blue line) are to be set out at a scale of 1:5,000 around each of the sites, and mark on them the exposed rocky areas, the seabed, the type of ground (for instance: clay, silt, sand) and above- and underwater infrastructures and facilities found in each region. The differences between the depth contours on the maps shall be 1 meter and the mapping data shall be updated to the last decade. Likewise, the sedimentological characteristics of the seabed shall be based on a granulometric and mineral survey correctly representing the sediment in the detailed area of the plan
Yes 1 1.1.2 Maps and Orthophotos
The maps are at 5-m contours at an unknown scale but including a radius of 500 m around each proposed well location.
1.3.8.
In the event of exploratory drilling at a distance of less than 1 nautical mile from the coast, the land zoning and uses in the relevant coastal area must be marked (see section 1.2.2) as well as the physical data including the type of coverage (rock or sand, cliffs), coastal sensitivity to oil pollution, on a coastal water oil pollution sensitivity map (the map is accessible on the internet), existing and proposed marine reserves, maritime infrastructure, culture and heritage sites and antiquities, declared and undeclared bathing beaches, residential areas (existing and planned), public institutions, nature reserves and national parks, roads, engineering facilities and infrastructure lines relating to energy systems (petrol, gas, electricity), desalination plants, drainage and sewage lines, fuel reservoirs, hazardous material reservoirs, communications facilities and lines and other uses.
N/A -- -- -- Not applicable. The drilling sites are more than 1 nmi from the coastline.
Tamar Field Development Project EIA Noble Energy Mediterranean Ltd CSA-Noble-FL-16-2650-08-REP-01-FIN-REV04
B-4 March 2016

Framework Guidelines for the Preparation of Environmental Documents Addressed in Tamar Drilling EIA C
hapt
er
Sect
ion
Sub-
Sect
ion
Heading Clause/Requirement Yes,
No, or N/A C
hapt
er
Sect
ion
Num
ber
Section Name Comments
1.3.9.
Maritime transportation and infrastructure systems, electricity infrastructure and facilities, communications and energy lines, corridors, pipelines and terminals for various infrastructures (gas, petrol, hazmat, RO, etc.) in the Application area must be set out on a maritime map at a scale of 1:20,000 together with a verbal description
Yes 1 1.1.2 Maps and Orthophotos
Shown in Figure 1-4, although scale is not at 1:20,000.
1.4. Geological, Seismic and Sedimentological Characteristics An exhaustive and detailed geo-hydrological description of the site, including:
1.4.1. Describe, in words, the general geographical location of the exploration drilling sites, their proximity to seismically active areas and the rock foundations upon which they will be constructed.
Yes 1 1.2.1
Geological, Seismic and Sediment Characteristics
1.4.2.
A general geological/geomorphological map must be set out at a scale of 1:200,000 of the sea off the coast of Israel, and mark thereupon the location of the exploration drilling sites. On this map, mark geological fractures, with an emphasis on fractures that are active or that are suspected of being active. Fractures described as being “suspected of being active” by the Israel Geological Institute or similar entities shall be deemed to be active unless it is proven that they are not active using the usual methods (conduct of research and geophysical cross-sections, and paleoseismological analysis). Likewise, mark locations of historical earthquakes of a magnitude of more than 2.5, areas liable to landslides and other geological and morphological phenomena which are notable.
Yes 1 1.2.1
Geological, Seismic and Sediment Characteristics
A geomorphological map is included. Figures showing the wellsites and nearby faults are included. A separate map showing the locations of historical earthquakes is included.
1.4.3.
Set out a series of regional geological/geomorphological maps at a scale of 1:20,000, around all of the sites, and mark geological fractures on them, with an emphasis on active (young) fractures or fractures suspected of being active. Likewise, mark locations of historical earthquakes of a magnitude of more than 2.5, areas liable to landslides, active landslides, rocky infrastructure exposed above the ordinary seabed, and other geological and morphological phenomena which are notable.
Yes 1 1.2.1
Geological, Seismic, and Sediment Characteristics
There has only been one recorded earthquake near the Tamar Field so individual site maps showing earthquakes are not provided.
Tamar Field Development Project EIA Noble Energy Mediterranean Ltd CSA-Noble-FL-16-2650-08-REP-01-FIN-REV04
B-5 March 2016

Framework Guidelines for the Preparation of Environmental Documents Addressed in Tamar Drilling EIA C
hapt
er
Sect
ion
Sub-
Sect
ion
Heading Clause/Requirement Yes,
No, or N/A C
hapt
er
Sect
ion
Num
ber
Section Name Comments
1.4.4.
If the drilling mud and cutting discharge are to be discharged and/or dumped at sea, set out the area of dispersal of the mud and other cutting discharge on a geophysical survey conducted via side-scan sonar and underwater information, physical changes in the seabed due to the effects of anchoring and excavation, the build-up of waste, etc.
Yes 4 1.2.5 4.6.1.1
Drilling (including the release/discharge of drill muds and cuttings)
A geophysical survey and shallow geotechnical investigation was conducted and is described in section 1.2.5. Other requirements are addressed in the “impact” discussion and are not part of the baseline description. Surveys have been conducted and are discussed in section 4.15.3.
1.4.5.
Describe in detail the rock infrastructure at each of the exploration drilling sites. Set out detailed information that might clarify the characteristics of the land (for instance: the speed of shear stress waves, the depth to the bedrock, characteristics that affect non-linear conduct, etc.).
Yes 1 1.2.1
Geological, Seismic, and Sediment Characteristics
1.4.6. Address the possibility of the existence of active geological fractures in the area of the Application and the near environment
1.5. Hydrodynamic Regime
1.5.1.
Describe the characteristic wave regime within the area of the Application. This description shall be based on wave characteristics measured in the south eastern Mediterranean in general, and off the coast of Israel over the last 20 years in particular.
Yes 1 1.2.2 Physical Oceanography
Presented for July 2005 to February 2008.
1.5.2.
Set out the statistical breakdown of wave characteristics within the timeframe of one year (significant and maximum height, direction, cycle time at the top of the spectrum, and average cycle time), and within a longer timeframe of 5, 10, 20, 50 and 100 years, statistics of storm durations for various maritime conditions.
Yes 1 1.2.2 Physical Oceanography
Presented for July 2005 to February 2008.
1.5.3. Refer to the effect of waves in extreme storms and the possibility of the development of killer waves, including due to a seismic source, on the stability of the marine structures within the area of the Application.
Yes 1 1.2.2 Physical Oceanography
Presented for July 2005 to February 2008.
Tamar Field Development Project EIA Noble Energy Mediterranean Ltd CSA-Noble-FL-16-2650-08-REP-01-FIN-REV04
B-6 March 2016
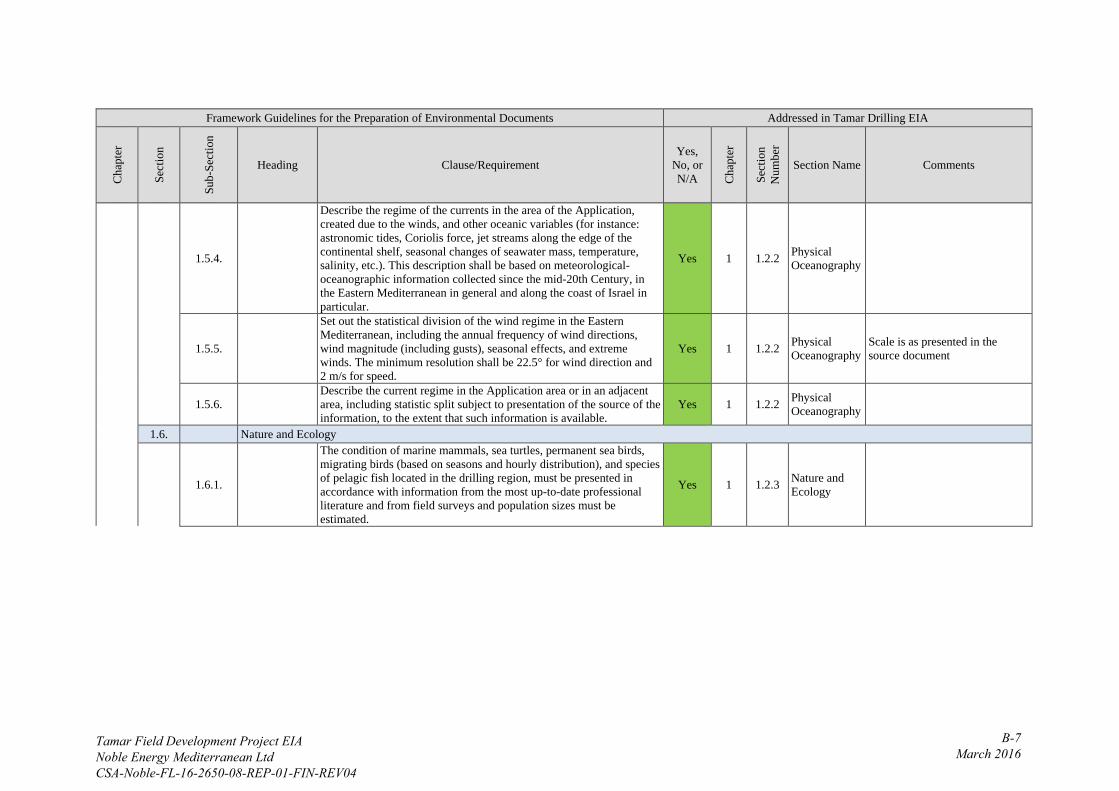
Framework Guidelines for the Preparation of Environmental Documents Addressed in Tamar Drilling EIA C
hapt
er
Sect
ion
Sub-
Sect
ion
Heading Clause/Requirement Yes,
No, or N/A C
hapt
er
Sect
ion
Num
ber
Section Name Comments
1.5.4.
Describe the regime of the currents in the area of the Application, created due to the winds, and other oceanic variables (for instance: astronomic tides, Coriolis force, jet streams along the edge of the continental shelf, seasonal changes of seawater mass, temperature, salinity, etc.). This description shall be based on meteorological-oceanographic information collected since the mid-20th Century, in the Eastern Mediterranean in general and along the coast of Israel in particular.
Yes 1 1.2.2 Physical Oceanography
1.5.5.
Set out the statistical division of the wind regime in the Eastern Mediterranean, including the annual frequency of wind directions, wind magnitude (including gusts), seasonal effects, and extreme winds. The minimum resolution shall be 22.5° for wind direction and 2 m/s for speed.
Yes 1 1.2.2 Physical Oceanography
Scale is as presented in the source document
1.5.6. Describe the current regime in the Application area or in an adjacent area, including statistic split subject to presentation of the source of the information, to the extent that such information is available.
Yes 1 1.2.2 Physical Oceanography
1.6. Nature and Ecology
1.6.1.
The condition of marine mammals, sea turtles, permanent sea birds, migrating birds (based on seasons and hourly distribution), and species of pelagic fish located in the drilling region, must be presented in accordance with information from the most up-to-date professional literature and from field surveys and population sizes must be estimated.
Yes 1 1.2.3 Nature and Ecology
Tamar Field Development Project EIA Noble Energy Mediterranean Ltd CSA-Noble-FL-16-2650-08-REP-01-FIN-REV04
B-7 March 2016

Framework Guidelines for the Preparation of Environmental Documents Addressed in Tamar Drilling EIA C
hapt
er
Sect
ion
Sub-
Sect
ion
Heading Clause/Requirement Yes,
No, or N/A C
hapt
er
Sect
ion
Num
ber
Section Name Comments
1.6.2.
The natural monuments affixed to the seabed (benthic) must be presented. The species within the area of the Application and within the area of its impact (as described in section 1.2.3) must be described including micro and macro algae, seaweeds, seabed dwelling fauna, sedentary or territorial. In addition, describe the coastal natural monuments, as the case may be, situated within the area of the Application and within the area of its impact (as described in section 1.2.3). The information regarding natural phenomena will be in reliance upon a detailed biological survey (Appendix B1) which will be conducted within the area of the Application and the area of impact, and on information, if such exists in this area, from prior surveys. The information included shall be set out in tables, maps, graphs, pictures, video, and shall be accompanied by a detailed verbal description of the findings and with lists of inventory, including scientific names based on taxonomic classification. Note the presence of rare, unique or delicate organisms.
Yes 1 1.2.3 Nature and Ecology
1.6.3.
Set out the various habitats that exist in the body of water, and in the various seabed environments including hard surface areas, sponge gardens, deep coral reefs, seaweed carpets. A detailed description must be provided of fauna and flora societies in each of these habitats, including coverage percentages, and taxonomic information regarding the identity of species in the region. A map of the various habitats in the area of the Application must be included.
Yes 1 1.2.3 Nature and Ecology
1.6.4.
Pursuant to the above sections, a detailed analysis must be conducted of the information including on the basis of the following issues: Yes 1 1.2.3 Nature and
Ecology
• 1.6.4.1. Identification of the creatures to a species level or to the most detailed taxonomical level possible.
• 1.6.4.2. Density of individuals. • 1.6.4.3. Richness of species (in the various taxonomic groups). • 1.6.4.4. Variety, the appropriate index must be chosen from the
acceptable variety indexes such as: Shannon-Wiener, Simpson (2004), Magurran, and give reasons for the choice.
• 1.6.4.5. Fixed and mobile species. • 1.6.4.6. “Target species”: key species, species of commercial
value, most common species (breeding season, egg-laying season,
Yes 1 1.2.3 Nature and Ecology
Tamar Field Development Project EIA Noble Energy Mediterranean Ltd CSA-Noble-FL-16-2650-08-REP-01-FIN-REV04
B-8 March 2016
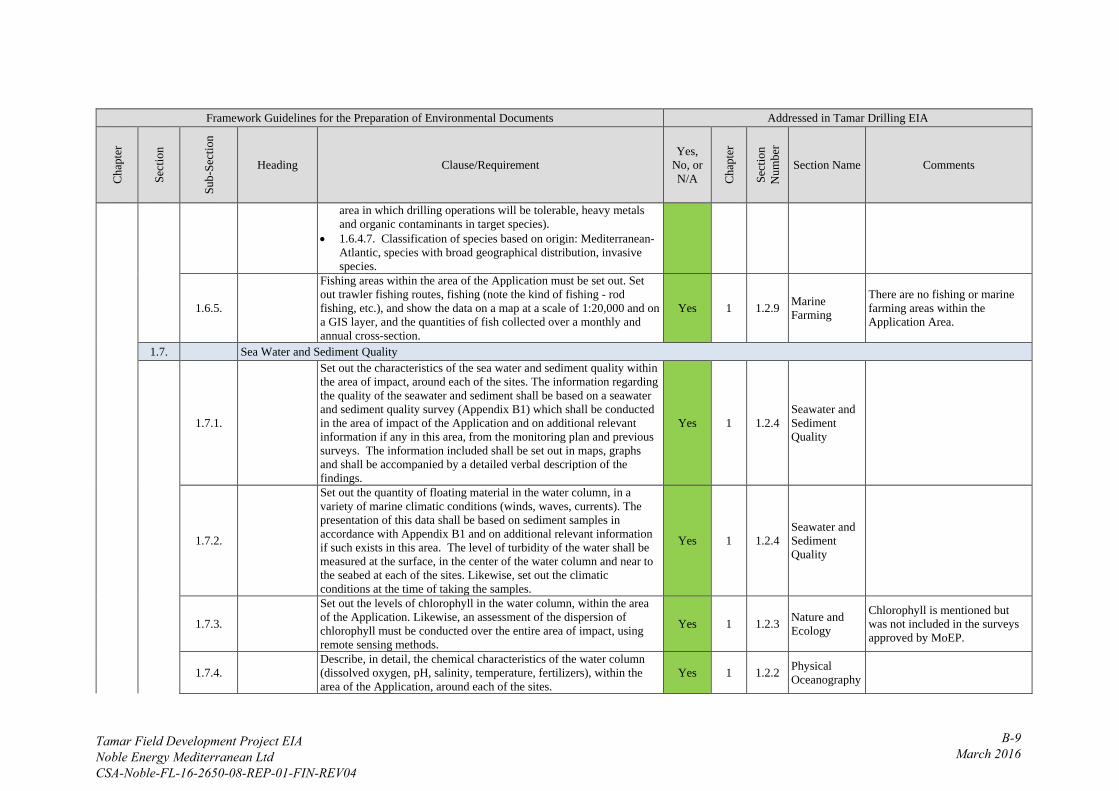
Framework Guidelines for the Preparation of Environmental Documents Addressed in Tamar Drilling EIA C
hapt
er
Sect
ion
Sub-
Sect
ion
Heading Clause/Requirement Yes,
No, or N/A C
hapt
er
Sect
ion
Num
ber
Section Name Comments
area in which drilling operations will be tolerable, heavy metals and organic contaminants in target species).
• 1.6.4.7. Classification of species based on origin: Mediterranean-Atlantic, species with broad geographical distribution, invasive species.
1.6.5.
Fishing areas within the area of the Application must be set out. Set out trawler fishing routes, fishing (note the kind of fishing - rod fishing, etc.), and show the data on a map at a scale of 1:20,000 and on a GIS layer, and the quantities of fish collected over a monthly and annual cross-section.
Yes 1 1.2.9 Marine Farming
There are no fishing or marine farming areas within the Application Area.
1.7. Sea Water and Sediment Quality
1.7.1.
Set out the characteristics of the sea water and sediment quality within the area of impact, around each of the sites. The information regarding the quality of the seawater and sediment shall be based on a seawater and sediment quality survey (Appendix B1) which shall be conducted in the area of impact of the Application and on additional relevant information if any in this area, from the monitoring plan and previous surveys. The information included shall be set out in maps, graphs and shall be accompanied by a detailed verbal description of the findings.
Yes 1 1.2.4 Seawater and Sediment Quality
1.7.2.
Set out the quantity of floating material in the water column, in a variety of marine climatic conditions (winds, waves, currents). The presentation of this data shall be based on sediment samples in accordance with Appendix B1 and on additional relevant information if such exists in this area. The level of turbidity of the water shall be measured at the surface, in the center of the water column and near to the seabed at each of the sites. Likewise, set out the climatic conditions at the time of taking the samples.
Yes 1 1.2.4 Seawater and Sediment Quality
1.7.3.
Set out the levels of chlorophyll in the water column, within the area of the Application. Likewise, an assessment of the dispersion of chlorophyll must be conducted over the entire area of impact, using remote sensing methods.
Yes 1 1.2.3 Nature and Ecology
Chlorophyll is mentioned but was not included in the surveys approved by MoEP.
1.7.4. Describe, in detail, the chemical characteristics of the water column (dissolved oxygen, pH, salinity, temperature, fertilizers), within the area of the Application, around each of the sites.
Yes 1 1.2.2 Physical Oceanography
Tamar Field Development Project EIA Noble Energy Mediterranean Ltd CSA-Noble-FL-16-2650-08-REP-01-FIN-REV04
B-9 March 2016

Framework Guidelines for the Preparation of Environmental Documents Addressed in Tamar Drilling EIA C
hapt
er
Sect
ion
Sub-
Sect
ion
Heading Clause/Requirement Yes,
No, or N/A C
hapt
er
Sect
ion
Num
ber
Section Name Comments
1.7.5.
Describe, in detail, the chemical characteristics of the sediment within the above area of the Application. The description shall focus on toxic substances, on chemical derivatives of heavy metals, TOC, PAH, SBF and their derivatives (including the results of decomposition), oxygen concentration in sediments. The sediment sampling system (the number of stations and their location) will be approved prior to performance as is set out in Appendix B1.
Yes 1 1.2.4 Seawater and Sediment Quality
1.7.6.
Likewise, describe the characteristics as set out in sections 1.7.5 and 1.7.5B of the fauna on the hard bed (if any) and of the fauna on the soft bed and of the fauna within the bed (in filtering animal tissue such as clams, snails, worms, polychaetes and crabs and fishes). The scope of this sampling will be approved in advance.
Yes 1 1.2.3 Nature and Ecology
1.8. Culture and Heritage Sites
The information regarding antiquities and cultural heritage sites shall be based on a detailed archeological survey or as a result of processing following a remote sensing survey (side-scan sonar, multives, ROV movies, etc.) which shall be conducted within the area of the Application and on information that exists regarding the area from prior surveys. The sites known to the Antiquities Authority (both declared and as yet undeclared sites) and other sites containing information about archeological findings or sunken ships from must be included. The total information will be presented on maps at a scale of 1:20,000, and shall include the archeological sites, pictures, videos and shall be accompanied by a detailed verbal description of the findings in the area of the Application and in its close proximity.
Yes 1 1.2.5 Culture and Heritage Sites
1.9. Meteorology and Air Quality
1.9.1. Describe the existing meteorological conditions in the area of the Application and its environs.
Yes 1 1.2.6 Meteorology and Air Quality
1.9.2. Special meteorological conditions that might cause conditions of dispersal that will give rise to high air pollution concentrations in the environment must be noted.
Text states that there are no special meteorological conditions affecting dispersal.
Tamar Field Development Project EIA Noble Energy Mediterranean Ltd CSA-Noble-FL-16-2650-08-REP-01-FIN-REV04
B-10 March 2016
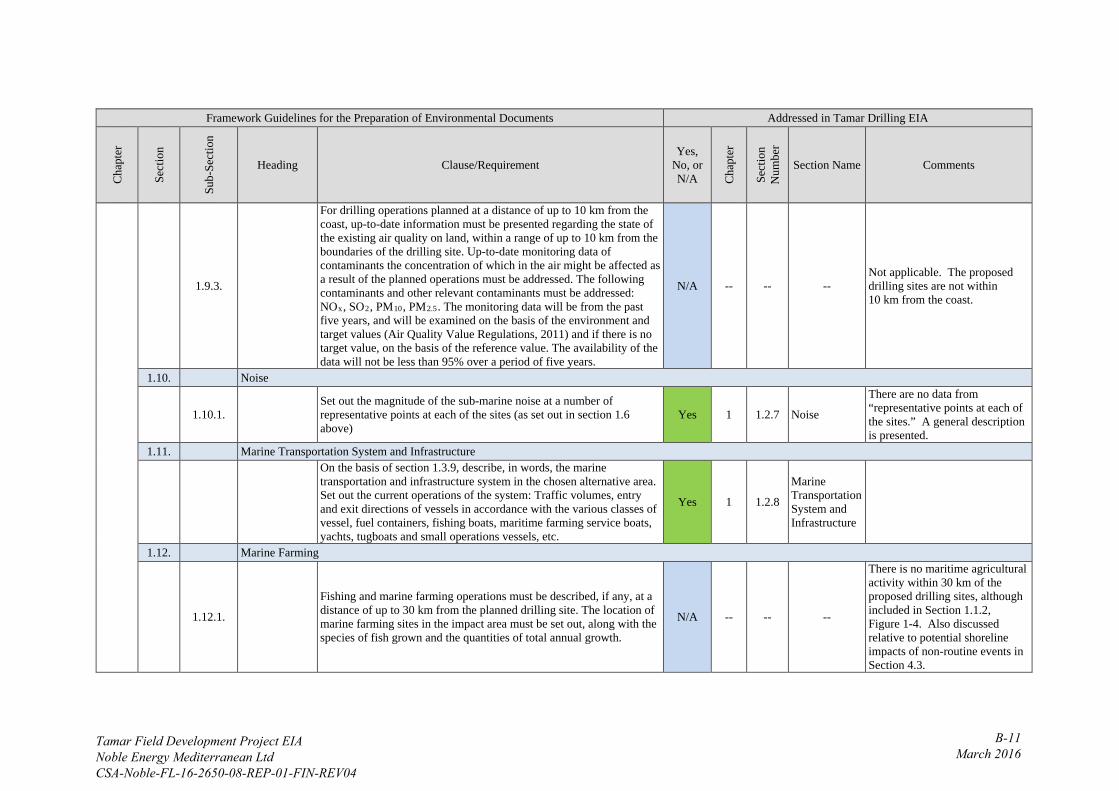
Framework Guidelines for the Preparation of Environmental Documents Addressed in Tamar Drilling EIA C
hapt
er
Sect
ion
Sub-
Sect
ion
Heading Clause/Requirement Yes,
No, or N/A C
hapt
er
Sect
ion
Num
ber
Section Name Comments
1.9.3.
For drilling operations planned at a distance of up to 10 km from the coast, up-to-date information must be presented regarding the state of the existing air quality on land, within a range of up to 10 km from the boundaries of the drilling site. Up-to-date monitoring data of contaminants the concentration of which in the air might be affected as a result of the planned operations must be addressed. The following contaminants and other relevant contaminants must be addressed: NOx, SO2, PM10, PM2.5. The monitoring data will be from the past five years, and will be examined on the basis of the environment and target values (Air Quality Value Regulations, 2011) and if there is no target value, on the basis of the reference value. The availability of the data will not be less than 95% over a period of five years.
N/A -- -- -- Not applicable. The proposed drilling sites are not within 10 km from the coast.
1.10. Noise
1.10.1. Set out the magnitude of the sub-marine noise at a number of representative points at each of the sites (as set out in section 1.6 above)
Yes 1 1.2.7 Noise
There are no data from “representative points at each of the sites.” A general description is presented.
1.11. Marine Transportation System and Infrastructure
On the basis of section 1.3.9, describe, in words, the marine transportation and infrastructure system in the chosen alternative area. Set out the current operations of the system: Traffic volumes, entry and exit directions of vessels in accordance with the various classes of vessel, fuel containers, fishing boats, maritime farming service boats, yachts, tugboats and small operations vessels, etc.
Yes 1 1.2.8
Marine Transportation System and Infrastructure
1.12. Marine Farming
1.12.1.
Fishing and marine farming operations must be described, if any, at a distance of up to 30 km from the planned drilling site. The location of marine farming sites in the impact area must be set out, along with the species of fish grown and the quantities of total annual growth.
N/A -- -- --
There is no maritime agricultural activity within 30 km of the proposed drilling sites, although included in Section 1.1.2, Figure 1-4. Also discussed relative to potential shoreline impacts of non-routine events in Section 4.3.
Tamar Field Development Project EIA Noble Energy Mediterranean Ltd CSA-Noble-FL-16-2650-08-REP-01-FIN-REV04
B-11 March 2016
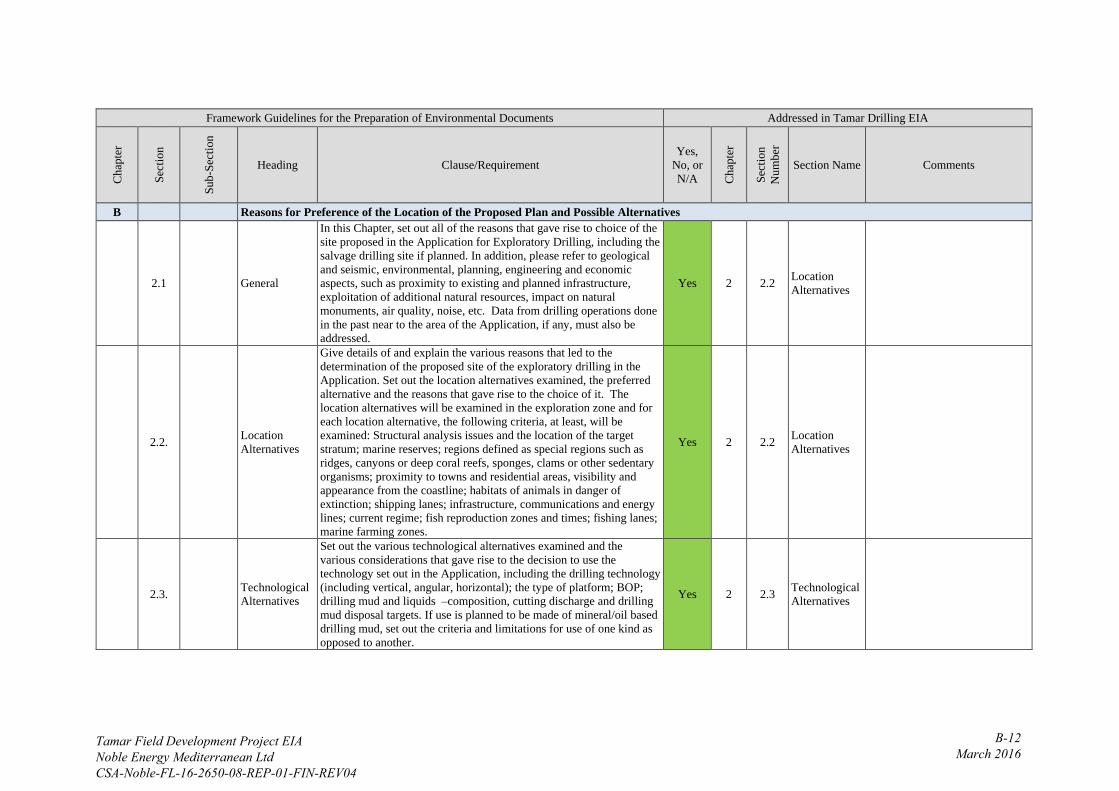
Framework Guidelines for the Preparation of Environmental Documents Addressed in Tamar Drilling EIA C
hapt
er
Sect
ion
Sub-
Sect
ion
Heading Clause/Requirement Yes,
No, or N/A C
hapt
er
Sect
ion
Num
ber
Section Name Comments
B Reasons for Preference of the Location of the Proposed Plan and Possible Alternatives
2.1 General
In this Chapter, set out all of the reasons that gave rise to choice of the site proposed in the Application for Exploratory Drilling, including the salvage drilling site if planned. In addition, please refer to geological and seismic, environmental, planning, engineering and economic aspects, such as proximity to existing and planned infrastructure, exploitation of additional natural resources, impact on natural monuments, air quality, noise, etc. Data from drilling operations done in the past near to the area of the Application, if any, must also be addressed.
Yes 2 2.2 Location Alternatives
2.2. Location Alternatives
Give details of and explain the various reasons that led to the determination of the proposed site of the exploratory drilling in the Application. Set out the location alternatives examined, the preferred alternative and the reasons that gave rise to the choice of it. The location alternatives will be examined in the exploration zone and for each location alternative, the following criteria, at least, will be examined: Structural analysis issues and the location of the target stratum; marine reserves; regions defined as special regions such as ridges, canyons or deep coral reefs, sponges, clams or other sedentary organisms; proximity to towns and residential areas, visibility and appearance from the coastline; habitats of animals in danger of extinction; shipping lanes; infrastructure, communications and energy lines; current regime; fish reproduction zones and times; fishing lanes; marine farming zones.
Yes 2 2.2 Location Alternatives
2.3. Technological Alternatives
Set out the various technological alternatives examined and the various considerations that gave rise to the decision to use the technology set out in the Application, including the drilling technology (including vertical, angular, horizontal); the type of platform; BOP; drilling mud and liquids – composition, cutting discharge and drilling mud disposal targets. If use is planned to be made of mineral/oil based drilling mud, set out the criteria and limitations for use of one kind as opposed to another.
Yes 2 2.3 Technological Alternatives
Tamar Field Development Project EIA Noble Energy Mediterranean Ltd CSA-Noble-FL-16-2650-08-REP-01-FIN-REV04
B-12 March 2016

Framework Guidelines for the Preparation of Environmental Documents Addressed in Tamar Drilling EIA C
hapt
er
Sect
ion
Sub-
Sect
ion
Heading Clause/Requirement Yes,
No, or N/A C
hapt
er
Sect
ion
Num
ber
Section Name Comments
2.4. Infrastructure Alternatives
Possible alternative/s for deploying the infrastructures in the future production plan, including possible connection points to the terrestrial transmission system. The alternatives shall be set out in a comparison table, with each topic under examination being ranked, together with the professional reasons for selecting it. A sample table of criteria is attached in Appendix B2.
Yes 2 2.3 Technological Alternatives
The new infrastructure will tie into existing infrastructure that carries the product to the Tamar Platform and then to the Ashdod Onshore Terminal.
C Description of Actions Stemming from Performance of the Application
3.1 General
This Chapter shall set out a drilling plan including the drilling rig, various sea vessels and aircraft, and the plans for them, and the activities that they will perform. The description of the Application shall include reference to all of the works that will be done, including all matters relating to trial drillings, drilling phases, abandonment or announcement of a discovery and transition to production. This Chapter shall also refer to the various stages of construction and operation. Describe all of the details of the Application as will be examined in Chapter D.
Yes 3 Project Description
Chapter 3 as a whole addresses this requirement.
3.2. Description of the Application 3.2.1 General
3.2.1.1.
Describe the purpose of the drilling and the type of drilling (natural gas or oil; exploratory; salvage; verification; development; production).
Yes 3 3.1 General Overview
3.2.1.2. Describe the drilling platform including the type of platform, the name of the platform, ownership, date of manufacture, date of upgrade, region of prior operation and fleet specifications.
Yes 3 3.2.2 Drilling Program
Section 3.2.2.3 discusses the proposed wells.
3.2.1.3. Note water depth at the drilling site and depth of drilling below the seabed (below mud line - BML).
Section 3.2.2.3 discusses the proposed wells.
3.2.1.4. Describe the sea vessels and aircraft involved in the exploration application.
Section 3.2.2.2 discusses support vessels and aircrafts, and they are referenced in Section 3.2.2.3.
3.2.2. Description of Drilling Process
Tamar Field Development Project EIA Noble Energy Mediterranean Ltd CSA-Noble-FL-16-2650-08-REP-01-FIN-REV04
B-13 March 2016
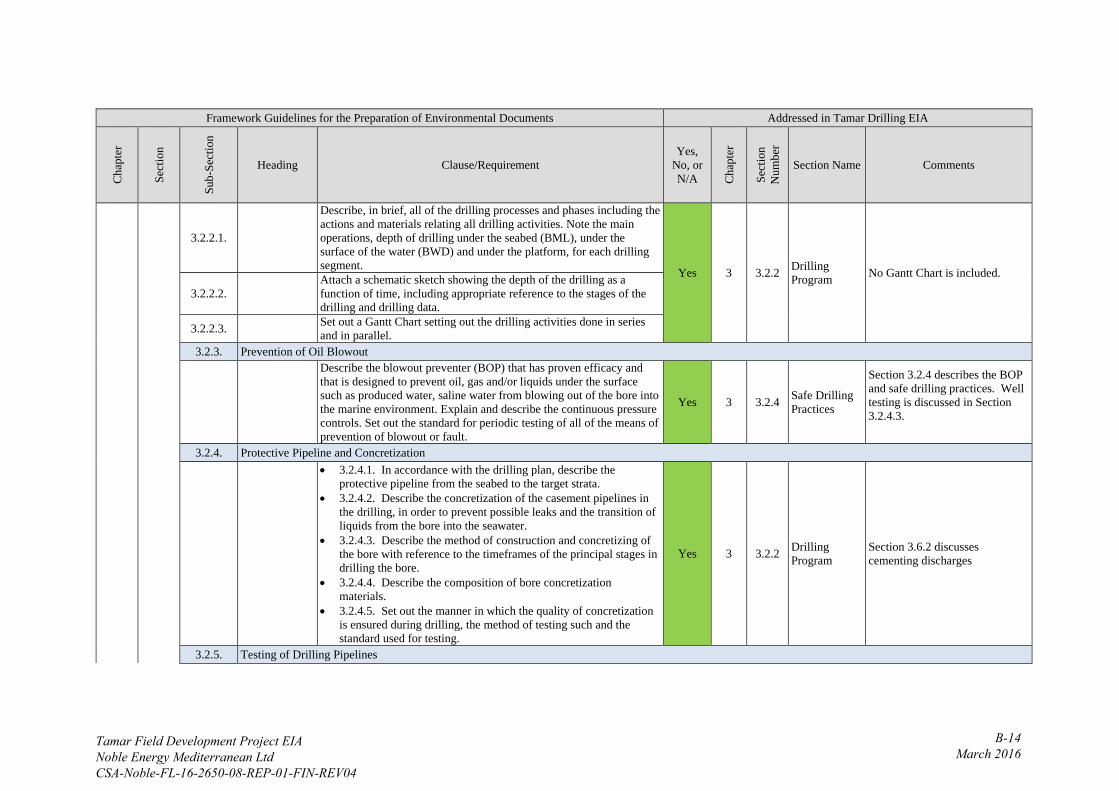
Framework Guidelines for the Preparation of Environmental Documents Addressed in Tamar Drilling EIA C
hapt
er
Sect
ion
Sub-
Sect
ion
Heading Clause/Requirement Yes,
No, or N/A C
hapt
er
Sect
ion
Num
ber
Section Name Comments
3.2.2.1.
Describe, in brief, all of the drilling processes and phases including the actions and materials relating all drilling activities. Note the main operations, depth of drilling under the seabed (BML), under the surface of the water (BWD) and under the platform, for each drilling segment. Yes 3 3.2.2 Drilling
Program No Gantt Chart is included.
3.2.2.2. Attach a schematic sketch showing the depth of the drilling as a function of time, including appropriate reference to the stages of the drilling and drilling data.
3.2.2.3. Set out a Gantt Chart setting out the drilling activities done in series and in parallel.
3.2.3. Prevention of Oil Blowout
Describe the blowout preventer (BOP) that has proven efficacy and that is designed to prevent oil, gas and/or liquids under the surface such as produced water, saline water from blowing out of the bore into the marine environment. Explain and describe the continuous pressure controls. Set out the standard for periodic testing of all of the means of prevention of blowout or fault.
Yes 3 3.2.4 Safe Drilling Practices
Section 3.2.4 describes the BOP and safe drilling practices. Well testing is discussed in Section 3.2.4.3.
3.2.4. Protective Pipeline and Concretization
• 3.2.4.1. In accordance with the drilling plan, describe the protective pipeline from the seabed to the target strata.
• 3.2.4.2. Describe the concretization of the casement pipelines in the drilling, in order to prevent possible leaks and the transition of liquids from the bore into the seawater.
• 3.2.4.3. Describe the method of construction and concretizing of the bore with reference to the timeframes of the principal stages in drilling the bore.
• 3.2.4.4. Describe the composition of bore concretization materials.
• 3.2.4.5. Set out the manner in which the quality of concretization is ensured during drilling, the method of testing such and the standard used for testing.
Yes 3 3.2.2 Drilling Program
Section 3.6.2 discusses cementing discharges
3.2.5. Testing of Drilling Pipelines
Tamar Field Development Project EIA Noble Energy Mediterranean Ltd CSA-Noble-FL-16-2650-08-REP-01-FIN-REV04
B-14 March 2016
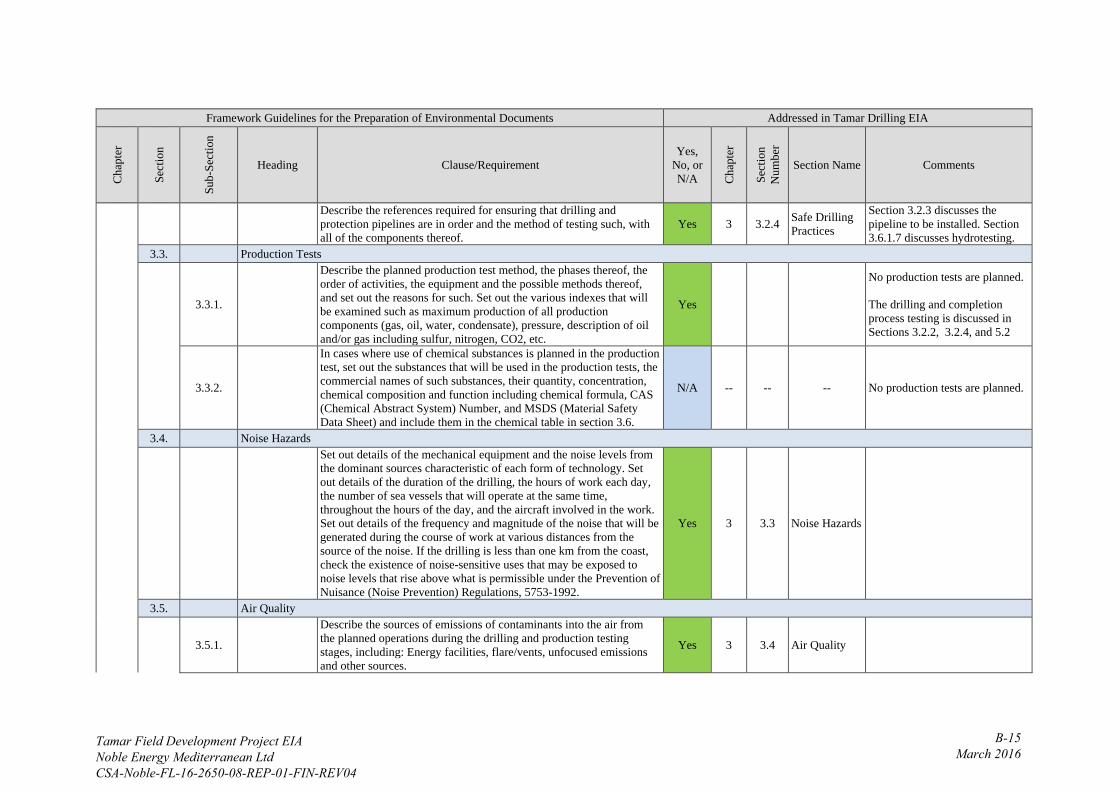
Framework Guidelines for the Preparation of Environmental Documents Addressed in Tamar Drilling EIA C
hapt
er
Sect
ion
Sub-
Sect
ion
Heading Clause/Requirement Yes,
No, or N/A C
hapt
er
Sect
ion
Num
ber
Section Name Comments
Describe the references required for ensuring that drilling and protection pipelines are in order and the method of testing such, with all of the components thereof.
Yes 3 3.2.4 Safe Drilling Practices
Section 3.2.3 discusses the pipeline to be installed. Section 3.6.1.7 discusses hydrotesting.
3.3. Production Tests
3.3.1.
Describe the planned production test method, the phases thereof, the order of activities, the equipment and the possible methods thereof, and set out the reasons for such. Set out the various indexes that will be examined such as maximum production of all production components (gas, oil, water, condensate), pressure, description of oil and/or gas including sulfur, nitrogen, CO2, etc.
Yes
No production tests are planned. The drilling and completion process testing is discussed in Sections 3.2.2, 3.2.4, and 5.2
3.3.2.
In cases where use of chemical substances is planned in the production test, set out the substances that will be used in the production tests, the commercial names of such substances, their quantity, concentration, chemical composition and function including chemical formula, CAS (Chemical Abstract System) Number, and MSDS (Material Safety Data Sheet) and include them in the chemical table in section 3.6.
N/A -- -- -- No production tests are planned.
3.4. Noise Hazards
Set out details of the mechanical equipment and the noise levels from the dominant sources characteristic of each form of technology. Set out details of the duration of the drilling, the hours of work each day, the number of sea vessels that will operate at the same time, throughout the hours of the day, and the aircraft involved in the work. Set out details of the frequency and magnitude of the noise that will be generated during the course of work at various distances from the source of the noise. If the drilling is less than one km from the coast, check the existence of noise-sensitive uses that may be exposed to noise levels that rise above what is permissible under the Prevention of Nuisance (Noise Prevention) Regulations, 5753-1992.
Yes 3 3.3 Noise Hazards
3.5. Air Quality
3.5.1.
Describe the sources of emissions of contaminants into the air from the planned operations during the drilling and production testing stages, including: Energy facilities, flare/vents, unfocused emissions and other sources.
Yes 3 3.4 Air Quality
Tamar Field Development Project EIA Noble Energy Mediterranean Ltd CSA-Noble-FL-16-2650-08-REP-01-FIN-REV04
B-15 March 2016

Framework Guidelines for the Preparation of Environmental Documents Addressed in Tamar Drilling EIA C
hapt
er
Sect
ion
Sub-
Sect
ion
Heading Clause/Requirement Yes,
No, or N/A C
hapt
er
Sect
ion
Num
ber
Section Name Comments
3.5.2.
For all sources of emissions presented, set out the regime for the activation, the type of fuel, the contaminants emitted and other data necessary for evaluating emission rates. The rates of emissions of contaminants shall be estimated on the basis of manufacturer's data, measurements or calculations on the basis of EPA-AP42 methodologies or on the basis of other methodologies upon prior approval.
Yes 3 3.4 Air Quality
Faults that might give rise to increase emissions of air contaminants into the environment, the emission of additional contaminants such as H2S or the generation of odor hazards to the populace (at sea and on land) must be addressed and the measures for preventing air contamination hazards must be set out for each possible fault.
Yes 3 3.4 Air Quality Section 5.2.7 discusses mitigation of air emissions.
3.6. Hazardous Materials
Describe and set out all of the hazardous materials planned to be used, including drilling and production testing liquids. The following details must be noted for each material: Chemical composition, commercial name, CAS identification number, UN number and MSDS - Material Safety Data Sheet. Quantity, purpose of use and method of use, location on the platform (together with a sketch), storage and batching, method of treatment and removal.
Yes 3 3.5 Hazardous Materials
SDS sheets are referenced in this section and included as Appendix F.
3.7. Sources of Discharge into the Sea 3.7.1. General – Ongoing Activities
3.7.1.1.
Describe all of the sources of discharge into the sea, and describe, for each source, the processes that give rise to the discharge and a flowchart of the process. The flows that must be presented include: Drilling mud, cutting discharge, cooling water, reverse osmosis concentrate water, organic kitchen waste (where the drilling is located more than 12 nautical miles from the coast), sanitary effluent/waste (“black water”), “gray” rinse waters, washes from the oil separation facility, cement surpluses.
Yes 3 3.6 Discharges
The following information will be given for each source of discharge into the sea. For drilling mud and cutting discharge – see also the specific instructions in
Section 3.7.2.
Tamar Field Development Project EIA Noble Energy Mediterranean Ltd CSA-Noble-FL-16-2650-08-REP-01-FIN-REV04
B-16 March 2016

Framework Guidelines for the Preparation of Environmental Documents Addressed in Tamar Drilling EIA C
hapt
er
Sect
ion
Sub-
Sect
ion
Heading Clause/Requirement Yes,
No, or N/A C
hapt
er
Sect
ion
Num
ber
Section Name Comments
3.7.1.2. Describe the processes that create the flow together with a drawing of the processes. Yes 3 3.6 Discharges
3.7.1.3.
Describe the treatment processes, if any, including physical data of stocking units, engineering and operational data for each treatment facility (the area of the facility, the volume of each unit, capacity, duration of presence, etc.); means of monitoring and control of each process/treatment; attach a schematic drawing for each treatment facility.
No 3 3.6 Discharges
No treatment processes are being constructed; production will flow to the Tamar Platform for treatment. Schematics for vessel treatment facilities are not included as they are unique to the drilling unit, which has not yet been selected. Atwood Advantage equipment information is included in Section 3.2.2.4.
3.7.1.4.
Set out the list of additives in each production and treatment process, the quantity of each additive, its function and the method of addition of it; attach information sheets (MSDS) for each additive, with an emphasis on ecological information for the marine environment, and possible impacts on fish farming and wild fish.
Yes 3 3.6 Discharges SDS sheets are provided in Appendix F.
3.7.1.5.
Describe the flow times including whether the flow is continuous or interrupted, fixed or variable (hourly/daily/other), and what the conditions and/or processes are that determine the quantity and/or times of flow.
Yes 3 3.6 Discharges
3.7.1.6.
Describe the method of discharge into the sea of each and every source and whether the discharge is effected separately/separate source or together with other discharges. In describing the source, set out the physical characteristics of the source/source pipe and the depth of the source with respect to the surface of the water/the seabed.
Yes 3 3.6 Discharges
3.7.1.7.
Quantities: Set out the quantities of each source, set out the information in accordance with maximum hourly, maximum daily, maximum monthly and total quantity during the course of the drilling. Set out the method of controlling quantities/amounts pumped into the sea (wharf based capacity meters, water meters, other - give details). Quantity data shall be presented in cubic meters.
Yes 3 3.6 Discharges
Tamar Field Development Project EIA Noble Energy Mediterranean Ltd CSA-Noble-FL-16-2650-08-REP-01-FIN-REV04
B-17 March 2016
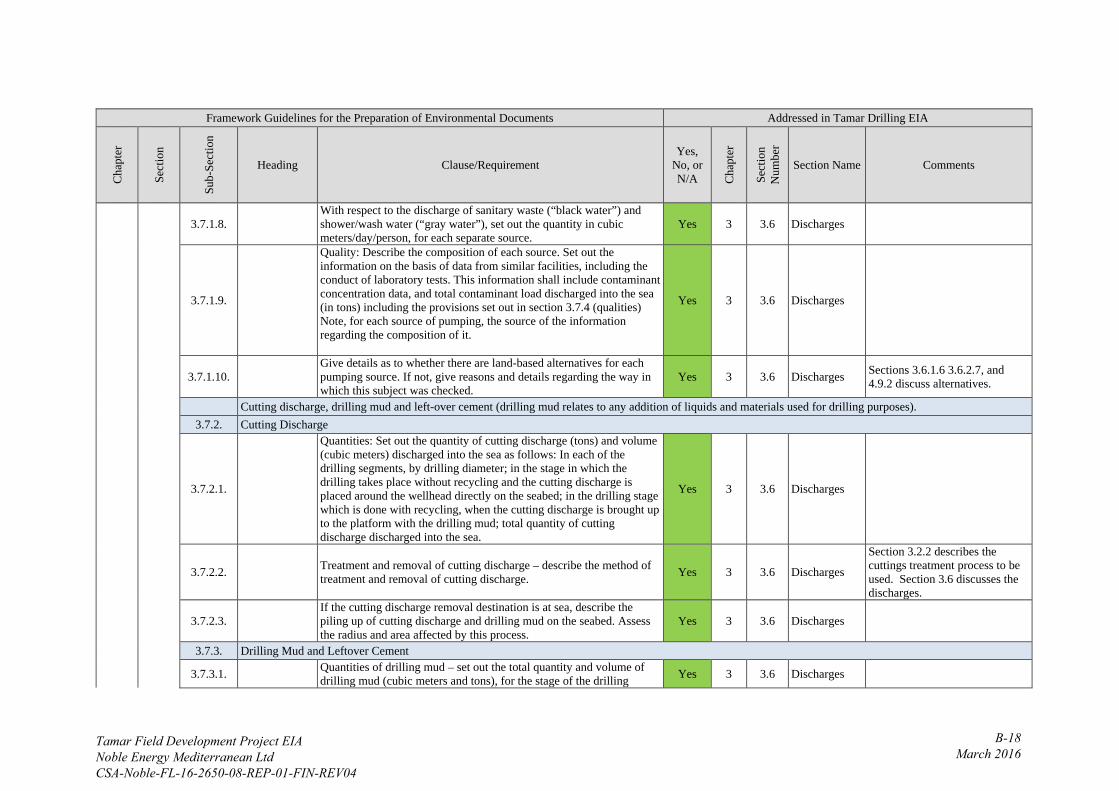
Framework Guidelines for the Preparation of Environmental Documents Addressed in Tamar Drilling EIA C
hapt
er
Sect
ion
Sub-
Sect
ion
Heading Clause/Requirement Yes,
No, or N/A C
hapt
er
Sect
ion
Num
ber
Section Name Comments
3.7.1.8. With respect to the discharge of sanitary waste (“black water”) and shower/wash water (“gray water”), set out the quantity in cubic meters/day/person, for each separate source.
Yes 3 3.6 Discharges
3.7.1.9.
Quality: Describe the composition of each source. Set out the information on the basis of data from similar facilities, including the conduct of laboratory tests. This information shall include contaminant concentration data, and total contaminant load discharged into the sea (in tons) including the provisions set out in section 3.7.4 (qualities) Note, for each source of pumping, the source of the information regarding the composition of it.
Yes 3 3.6 Discharges
3.7.1.10. Give details as to whether there are land-based alternatives for each pumping source. If not, give reasons and details regarding the way in which this subject was checked.
Yes 3 3.6 Discharges Sections 3.6.1.6 3.6.2.7, and 4.9.2 discuss alternatives.
Cutting discharge, drilling mud and left-over cement (drilling mud relates to any addition of liquids and materials used for drilling purposes). 3.7.2. Cutting Discharge
3.7.2.1.
Quantities: Set out the quantity of cutting discharge (tons) and volume (cubic meters) discharged into the sea as follows: In each of the drilling segments, by drilling diameter; in the stage in which the drilling takes place without recycling and the cutting discharge is placed around the wellhead directly on the seabed; in the drilling stage which is done with recycling, when the cutting discharge is brought up to the platform with the drilling mud; total quantity of cutting discharge discharged into the sea.
Yes 3 3.6 Discharges
3.7.2.2. Treatment and removal of cutting discharge – describe the method of treatment and removal of cutting discharge. Yes 3 3.6 Discharges
Section 3.2.2 describes the cuttings treatment process to be used. Section 3.6 discusses the discharges.
3.7.2.3. If the cutting discharge removal destination is at sea, describe the piling up of cutting discharge and drilling mud on the seabed. Assess the radius and area affected by this process.
Yes 3 3.6 Discharges
3.7.3. Drilling Mud and Leftover Cement
3.7.3.1. Quantities of drilling mud – set out the total quantity and volume of drilling mud (cubic meters and tons), for the stage of the drilling Yes 3 3.6 Discharges
Tamar Field Development Project EIA Noble Energy Mediterranean Ltd CSA-Noble-FL-16-2650-08-REP-01-FIN-REV04
B-18 March 2016

Framework Guidelines for the Preparation of Environmental Documents Addressed in Tamar Drilling EIA C
hapt
er
Sect
ion
Sub-
Sect
ion
Heading Clause/Requirement Yes,
No, or N/A C
hapt
er
Sect
ion
Num
ber
Section Name Comments
without recycling when the drilling mud is placed near to the drilling bore on the seabed, and for the stage of drilling done when the recycled drilling mud is brought back up to the platform with the cutting discharge and total quantities of the drilling mud discharged into the sea.
3.7.3.2.
Set out the composition of drilling mud in a table, including: The name of the material, the function of each material, the quantity of each material in each segment of drilling and the total quantity of materials in each segment of the drilling, totals of all materials in each segment of the drilling and total quantities of all materials in the entire drilling process. This data shall be presented in cubic meters, transition units (SG) and tons. Note which of the drilling stages the discharge into the sea takes place in, what quantity is being discharged at each stage, and the total. This data shall be presented in cubic meters and tons.
Yes 3 3.6 Discharges
3.7.3.3.
Describe the way in which the various substances are added to the water and to other drilling liquids (creating the drilling mud). In reliance upon the above, please also refer to the quantities of water/other drilling fluid that are added during the course of drilling, due to losses of water/fluids/drilling mud back into the rock strata.
No -- -- --
This information will be available following the identification of the drilling unit. Fluid loss is included in the information presented in Section 3.6.2.7.
3.7.3.4.
For each component and material, information sheets (MSDS) must be presented, including ecological information regarding the marine environment (toxicity, biodegradability, bioaccumulation) and concentrations of each component that might be pumped into the sea.
Yes
Section 3.6.4.2 presents CHARM data on the proposed drilling fluid. Appendix F presents the SDS sheets, which contain the required information.
3.7.3.5.
Chemicals/additives: Set out in a concentrated table data on chemicals, based on source of use (drilling mud, cement, etc.), based on information sheets, including: the name of the chemical, its CAS number, the composition of the chemical (in the event of a compound, set out each substance and composition, and the percentage of it in the compound), ecological information including the results of toxicity tests, biodegradability, bioaccumulation and the level of its impact/toxicity on the marine environment. Wherever there is no information, write “no information”; and note the level of
Yes 3 3.6 Discharges
Tamar Field Development Project EIA Noble Energy Mediterranean Ltd CSA-Noble-FL-16-2650-08-REP-01-FIN-REV04
B-19 March 2016

Framework Guidelines for the Preparation of Environmental Documents Addressed in Tamar Drilling EIA C
hapt
er
Sect
ion
Sub-
Sect
ion
Heading Clause/Requirement Yes,
No, or N/A C
hapt
er
Sect
ion
Num
ber
Section Name Comments
environmental risk according to OSPAR/the Norwegian Method (green, yellow, red, black).
3.7.3.6.
Describe the method and frequency of the various tests conducted in mud and drilling liquids, including materials pumped into the drilling mud preparation system and the standards under which the tests are conducted.
Yes 5 5.2 Guidelines and Plans
Section 5.2 discusses the monitoring of drilling discharges. Additional information will be available following the identification of the drilling unit. Section 4.15 discusses environmental monitoring.
3.7.3.7.
Biological toxicity test – set out the tests conducted for testing biological toxicity in drilling mud/surpluses from the treatment facility pumped into the sea and set out where such tests are performed and the source of the data; examine and present the extent to which the existing toxicity tests accord with the deep sea conditions in the Eastern Mediterranean Deep Sea Basin. Attach an expert opinion regarding the extent to which the tests comply, and his recommendations regarding the conducting of compatibility tests for the deep sea conditions in our region.
Yes 4 4.15 Discharges
The toxicity test information is presented in section 4.15, and included in Appendix J. Section 3.6 discusses the makeup of the drilling fluids.
3.7.3.8.
Drilling mud treatment – describe the areas and methods of organization and the facility for the treatment of drilling mud, separation of the cutting discharge from it, testing the composition of it and details of the additives planned for the treatment facility, including the list of additives, the function of each substance, the method of placement of it, etc. Losses of drilling mud must be addressed, and estimates given as to the percentage lost, quantities (in tons) and volume (in cubic meters).
Yes 3 3.6 Discharges
The areas and facilities are not presented as the drilling unit has not yet been identified. Fluid loss is included in the information presented in Section 3.6.2.
3.7.3.9. Attach sketches, including notation of physical data of units of production/processes/treatment and return of drilling mud, including work areas, volumes of treatment facilities, durations, etc.
Yes 3 3.6 Discharges The drilling unit has not yet been selected, so some of this information is not available.
3.7.3.10. Describe the stages of drilling in which use is made of cement, and the processes in respect of which left-over cement is discharged into the sea.
Yes 3 3.6 Discharges Cementing is discussed in Section 3.6.2.9.
Tamar Field Development Project EIA Noble Energy Mediterranean Ltd CSA-Noble-FL-16-2650-08-REP-01-FIN-REV04
B-20 March 2016
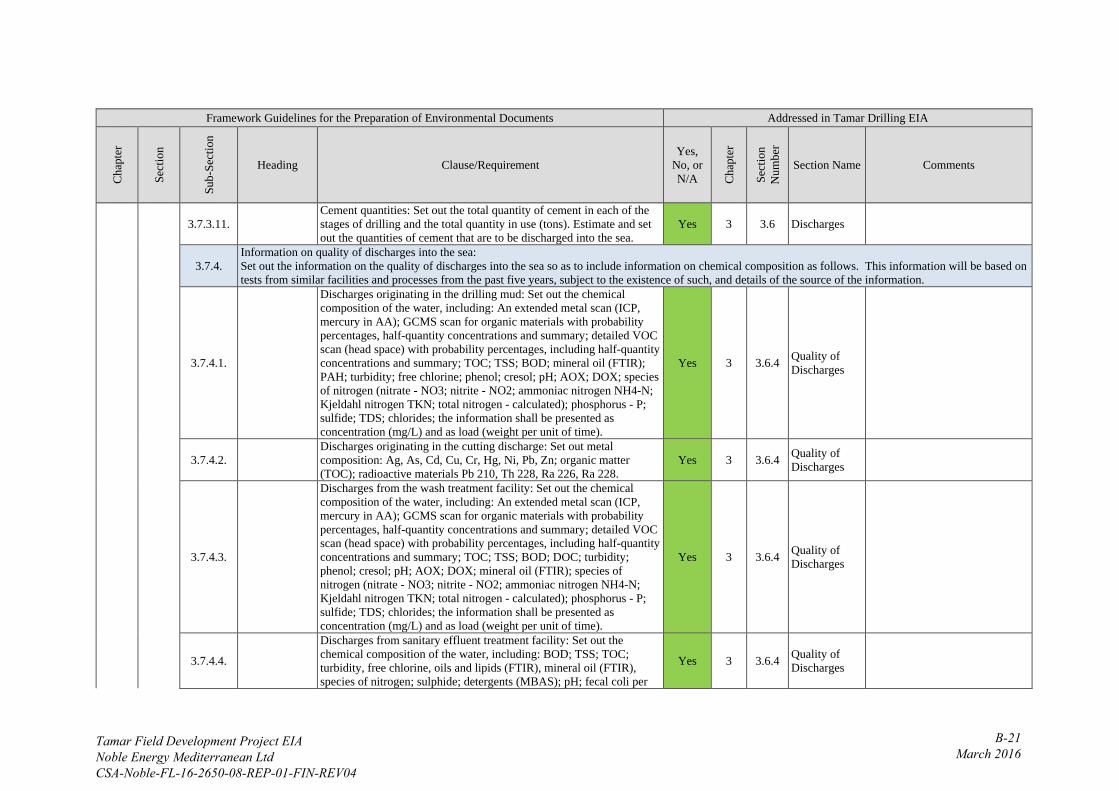
Framework Guidelines for the Preparation of Environmental Documents Addressed in Tamar Drilling EIA C
hapt
er
Sect
ion
Sub-
Sect
ion
Heading Clause/Requirement Yes,
No, or N/A C
hapt
er
Sect
ion
Num
ber
Section Name Comments
3.7.3.11. Cement quantities: Set out the total quantity of cement in each of the stages of drilling and the total quantity in use (tons). Estimate and set out the quantities of cement that are to be discharged into the sea.
Yes 3 3.6 Discharges
3.7.4. Information on quality of discharges into the sea: Set out the information on the quality of discharges into the sea so as to include information on chemical composition as follows. This information will be based on tests from similar facilities and processes from the past five years, subject to the existence of such, and details of the source of the information.
3.7.4.1.
Discharges originating in the drilling mud: Set out the chemical composition of the water, including: An extended metal scan (ICP, mercury in AA); GCMS scan for organic materials with probability percentages, half-quantity concentrations and summary; detailed VOC scan (head space) with probability percentages, including half-quantity concentrations and summary; TOC; TSS; BOD; mineral oil (FTIR); PAH; turbidity; free chlorine; phenol; cresol; pH; AOX; DOX; species of nitrogen (nitrate - NO3; nitrite - NO2; ammoniac nitrogen NH4-N; Kjeldahl nitrogen TKN; total nitrogen - calculated); phosphorus - P; sulfide; TDS; chlorides; the information shall be presented as concentration (mg/L) and as load (weight per unit of time).
Yes 3 3.6.4 Quality of Discharges
3.7.4.2. Discharges originating in the cutting discharge: Set out metal composition: Ag, As, Cd, Cu, Cr, Hg, Ni, Pb, Zn; organic matter (TOC); radioactive materials Pb 210, Th 228, Ra 226, Ra 228.
Yes 3 3.6.4 Quality of Discharges
3.7.4.3.
Discharges from the wash treatment facility: Set out the chemical composition of the water, including: An extended metal scan (ICP, mercury in AA); GCMS scan for organic materials with probability percentages, half-quantity concentrations and summary; detailed VOC scan (head space) with probability percentages, including half-quantity concentrations and summary; TOC; TSS; BOD; DOC; turbidity; phenol; cresol; pH; AOX; DOX; mineral oil (FTIR); species of nitrogen (nitrate - NO3; nitrite - NO2; ammoniac nitrogen NH4-N; Kjeldahl nitrogen TKN; total nitrogen - calculated); phosphorus - P; sulfide; TDS; chlorides; the information shall be presented as concentration (mg/L) and as load (weight per unit of time).
Yes 3 3.6.4 Quality of Discharges
3.7.4.4.
Discharges from sanitary effluent treatment facility: Set out the chemical composition of the water, including: BOD; TSS; TOC; turbidity, free chlorine, oils and lipids (FTIR), mineral oil (FTIR), species of nitrogen; sulphide; detergents (MBAS); pH; fecal coli per
Yes 3 3.6.4 Quality of Discharges
Tamar Field Development Project EIA Noble Energy Mediterranean Ltd CSA-Noble-FL-16-2650-08-REP-01-FIN-REV04
B-21 March 2016
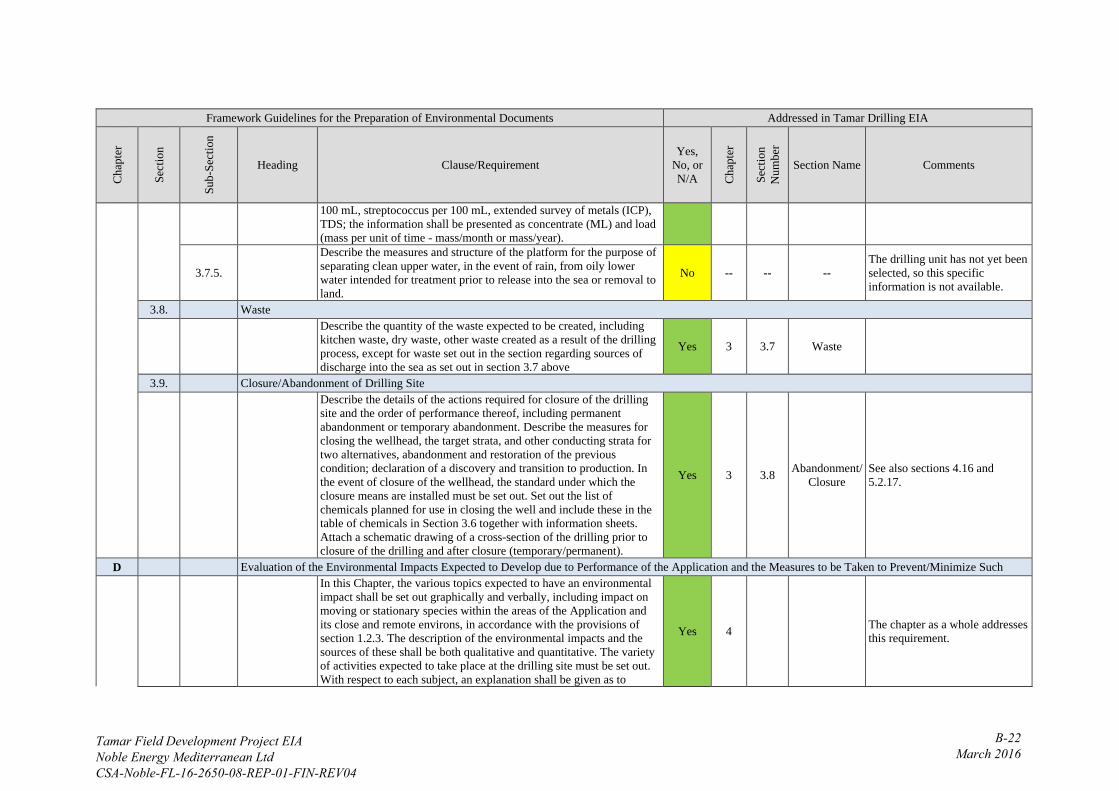
Framework Guidelines for the Preparation of Environmental Documents Addressed in Tamar Drilling EIA C
hapt
er
Sect
ion
Sub-
Sect
ion
Heading Clause/Requirement Yes,
No, or N/A C
hapt
er
Sect
ion
Num
ber
Section Name Comments
100 mL, streptococcus per 100 mL, extended survey of metals (ICP), TDS; the information shall be presented as concentrate (ML) and load (mass per unit of time - mass/month or mass/year).
3.7.5.
Describe the measures and structure of the platform for the purpose of separating clean upper water, in the event of rain, from oily lower water intended for treatment prior to release into the sea or removal to land.
No -- -- -- The drilling unit has not yet been selected, so this specific information is not available.
3.8. Waste
Describe the quantity of the waste expected to be created, including kitchen waste, dry waste, other waste created as a result of the drilling process, except for waste set out in the section regarding sources of discharge into the sea as set out in section 3.7 above
Yes 3 3.7 Waste
3.9. Closure/Abandonment of Drilling Site
Describe the details of the actions required for closure of the drilling site and the order of performance thereof, including permanent abandonment or temporary abandonment. Describe the measures for closing the wellhead, the target strata, and other conducting strata for two alternatives, abandonment and restoration of the previous condition; declaration of a discovery and transition to production. In the event of closure of the wellhead, the standard under which the closure means are installed must be set out. Set out the list of chemicals planned for use in closing the well and include these in the table of chemicals in Section 3.6 together with information sheets. Attach a schematic drawing of a cross-section of the drilling prior to closure of the drilling and after closure (temporary/permanent).
Yes 3 3.8 Abandonment/ Closure
See also sections 4.16 and 5.2.17.
D Evaluation of the Environmental Impacts Expected to Develop due to Performance of the Application and the Measures to be Taken to Prevent/Minimize Such
In this Chapter, the various topics expected to have an environmental impact shall be set out graphically and verbally, including impact on moving or stationary species within the areas of the Application and its close and remote environs, in accordance with the provisions of section 1.2.3. The description of the environmental impacts and the sources of these shall be both qualitative and quantitative. The variety of activities expected to take place at the drilling site must be set out. With respect to each subject, an explanation shall be given as to
Yes 4 The chapter as a whole addresses this requirement.
Tamar Field Development Project EIA Noble Energy Mediterranean Ltd CSA-Noble-FL-16-2650-08-REP-01-FIN-REV04
B-22 March 2016

Framework Guidelines for the Preparation of Environmental Documents Addressed in Tamar Drilling EIA C
hapt
er
Sect
ion
Sub-
Sect
ion
Heading Clause/Requirement Yes,
No, or N/A C
hapt
er
Sect
ion
Num
ber
Section Name Comments
whether it is necessary to prevent or reduce the negative environmental impacts and what means must be employed in order to prevent or reduce such, if any. In the event that during the course of preparation of the Application, influences or other findings are found that are not mentioned in this document, these must be addressed and means must be proposed for reducing the impact in the document.
4.1. Assessment of Potential Impact on Marine Environment
4.1.1.
Assess the maximum scope of the impact of the drilling rig, including anchors, on the seawater, the seabed, and the coast, as the case may be, and set out the basis for the information and the method of effecting the assessment.
Yes 4
The drilling unit is expected to be dynamically positioned and will have no anchors. Other seafloor impacts from the physical presence of the rig are discussed in Chapter 4.
4.1.2.
In the event that the discharge target for the cutting discharge and drilling mud is at sea, assess the extent of impact on the environment in accordance with an evaluation of the radius and the area affected by the process, as set out in section 3.7.2.3 and set out the tests, actions and frequency thereof in order to minimize harm to the marine environment.
Yes 4
4.1.3.
In the event of proximity to natural monuments identified in accordance with section 1.6, existing and proposed nature reserves, culture and heritage sites and marine farming facilities, the methods of action to remove the cutting discharge and the drilling mud to an alternative marine site and/or to a site on dry land are to be examined and presented.
Yes 4
No cultural sites, nature preserves, or marine farming occurs near the project site. Impacts from non-routine events are discussed in Section 4.3.
4.1.4.
Examine and present the possibility of reducing and minimizing the placement of discharge and drilling mud directly onto the seabed during the course of drilling from the drilling segment prior to installation of the riser, such as by using an RMR SYSTEM.
No -- -- -- The drilling mud system has been selected based on previous experience offshore Israel.
4.1.5. Assess the maximum scope of the impact of the drilling liquids at the time of effecting the production tests on the seawater in the area of the Application.
No -- -- --
No production testing will be performed. The impact of drilling discharges is discussed in Chapter 4.
Tamar Field Development Project EIA Noble Energy Mediterranean Ltd CSA-Noble-FL-16-2650-08-REP-01-FIN-REV04
B-23 March 2016

Framework Guidelines for the Preparation of Environmental Documents Addressed in Tamar Drilling EIA C
hapt
er
Sect
ion
Sub-
Sect
ion
Heading Clause/Requirement Yes,
No, or N/A C
hapt
er
Sect
ion
Num
ber
Section Name Comments
4.1.6.
Simulation (a digital three-dimensional hydrodynamic contaminant dispersion model) for drilling mud of the dispersion zone of the drilling mud and other mining liquids – each case must be considered on its merits on the basis of environmental data and location relative to the coast, the quantity of mud and discharge and the duration of time of the drilling or discharge into the sea. This matter will be coordinated and approved in advance and in writing. If simulation is required, the model must be approved and is to be presented in a preliminary document which shall contain a description of the type of model, calibration characteristics, commencement conditions, language conditions, the grid of the model and other parameters required in order to activate the model. After approval of the conditions and calibration of the model, the scenarios for modeling the dispersion of contaminants from a hydrodynamic point of view will be set, in various climatic conditions.
Yes 4 4.6.1 Sediments and Sediment Quality
4.2. Production Tests
Describe all of the means for ensuring that under no circumstances will there be any connection (transfer of liquids or gases) from the area where the production tests are taking place and the water-carrying strata and expansion of the fuel composition (liquid and gas) underground or in the marine environment.
Yes 4
No completion testing will be performed. The drilling and completion process testing is discussed in Sections 3.2.2, 3.2.4, and 5.2.
4.3. Environmental Impacts of Sea Pollution Event by Oil Based on Extreme Scenarios
4.3.1.
Please describe the current field and the movement of the oil stain along the Israeli coastline from the drilling bore in detail and in stages. This description should rely, inter alia, on the results of activation of a three-dimensional hydrodynamic model, which has been fed with wind data and the other necessary hydrodynamic characteristics. The hydrodynamic model must set out, precisely, the field of currents in accordance with the layout of the local seabed up to the Israeli coastline.
Yes 4 4.3
Environmental Impacts of Non-Routine Events
4.3.2.
If the oil slick will, based on the findings of the hydrodynamic model, penetrate the shallow portion of the continental shelf off the coast of Israel, describe via the appropriate hydrodynamic model for simulating the hydrodynamic processes in the coastal environment the
Yes 4 4.3
Environmental Impacts of Non-Routine Events
Tamar Field Development Project EIA Noble Energy Mediterranean Ltd CSA-Noble-FL-16-2650-08-REP-01-FIN-REV04
B-24 March 2016

Framework Guidelines for the Preparation of Environmental Documents Addressed in Tamar Drilling EIA C
hapt
er
Sect
ion
Sub-
Sect
ion
Heading Clause/Requirement Yes,
No, or N/A C
hapt
er
Sect
ion
Num
ber
Section Name Comments
current regime in the area affected mainly by local winds and waves, and analyze the impact of such currents on dispersal of the oil slick on the coastal environment.
4.3.3.
In running the model and in all of the calculations stemming from it, please take into account the worst-case scenario of 30 continuous days of discharge into the marine environment, at a maximum daily capacity in accordance with the drilling data. The type of oil in the model must be the most resilient oil expected in the reservoir and/or in accordance with the worst-case scenario data.
Yes 4 4.3
Environmental Impacts of Non-Routine Events
4.3.4.
Please run each of the four most common sea conditions on Israeli beaches for a period of 30 days: • 4.3.4.1. Extreme winter wave storm: 9.12.2010 - 08.01.2011 • 4.3.4.2. Winter wave storm: 26.01.2008 - 14.02.2008 • 4.3.4.3. Summer swell: 17.07.2008 - 16.08.2008 • 4.3.4.4. Strong North-Easterly wind (Spring and Autumn):
25.09.2007 - 25.10.2007
Yes 4 4.3
Environmental Impacts of Non-Routine Events
4.3.5.
Please explain in clear detail all of the data and estimates for the maximum daily quantity of oil set out in the document, and the general quantity during the course of the current scenario, without 30 day control, including formulas and calculations. Please clarify the objective difficulties in evaluating the expected quantities and the possible areas of imprecision. Please address the relevance of the modeling method performed and expand, in the explanation, on the relationship between the results of the model and the actual anticipated assessment based on international knowledge and experience from past oil pollution incidents. Explain the nature of the oil spill over the water, including the thickness and expected spread of it, and the environmental significance of the thickness and spread of the spill.
Yes 4 4.3
Environmental Impacts of Non-Routine Events
Estimates are presented in the text. The modeling effort was carried out using accepted modeling methodology and the results should be considered to be relevant to potential events. No in-depth discussion of the difficulties in modeling nor the relevance of the modeling was included in the report.
4.3.6.
Please analyze, on the basis of the findings of the model, the results of the spread of the oil stain from the drilling bore and give a detailed explanation of the environmental significance of the results of the model. Please refer to the marine environment in general and to the coastal area and the various sites therein in particular. Give details and explain the environmental and other implications that might arise from an oil spill incident at sea under the various scenarios, vis-à-vis the
Yes 4 4.3
Environmental Impacts of Non-Routine Events
Tamar Field Development Project EIA Noble Energy Mediterranean Ltd CSA-Noble-FL-16-2650-08-REP-01-FIN-REV04
B-25 March 2016
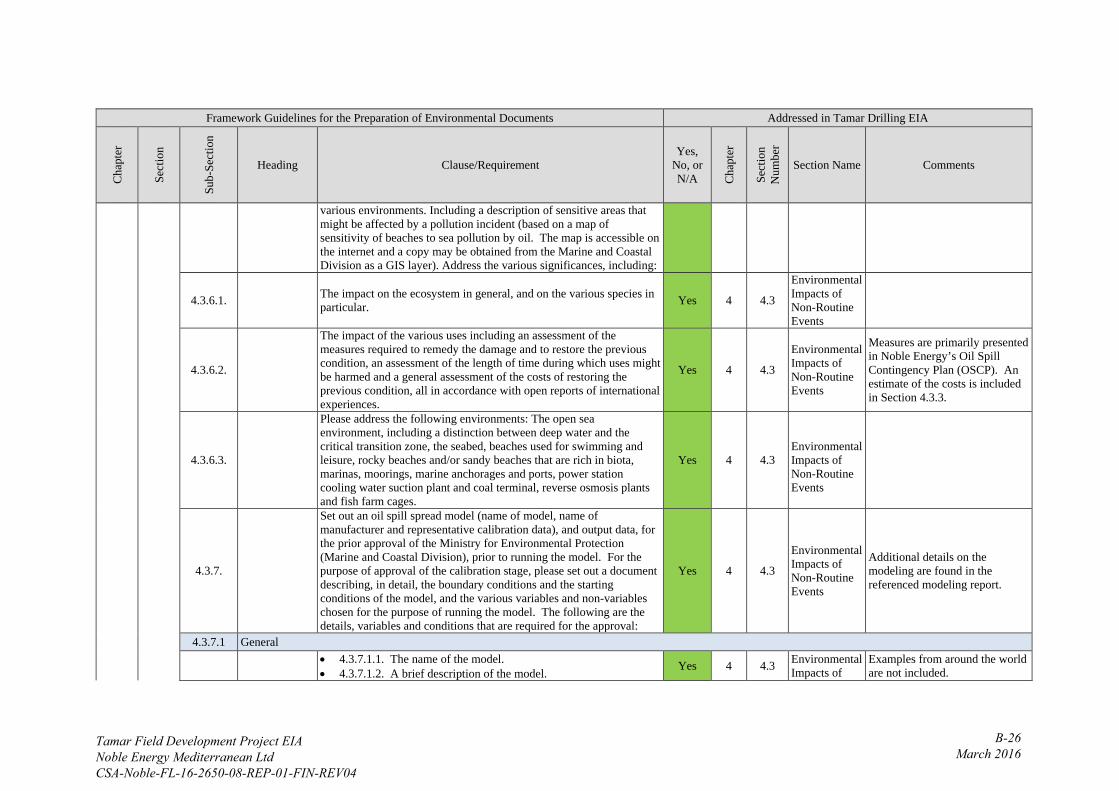
Framework Guidelines for the Preparation of Environmental Documents Addressed in Tamar Drilling EIA C
hapt
er
Sect
ion
Sub-
Sect
ion
Heading Clause/Requirement Yes,
No, or N/A C
hapt
er
Sect
ion
Num
ber
Section Name Comments
various environments. Including a description of sensitive areas that might be affected by a pollution incident (based on a map of sensitivity of beaches to sea pollution by oil. The map is accessible on the internet and a copy may be obtained from the Marine and Coastal Division as a GIS layer). Address the various significances, including:
4.3.6.1. The impact on the ecosystem in general, and on the various species in particular. Yes 4 4.3
Environmental Impacts of Non-Routine Events
4.3.6.2.
The impact of the various uses including an assessment of the measures required to remedy the damage and to restore the previous condition, an assessment of the length of time during which uses might be harmed and a general assessment of the costs of restoring the previous condition, all in accordance with open reports of international experiences.
Yes 4 4.3
Environmental Impacts of Non-Routine Events
Measures are primarily presented in Noble Energy’s Oil Spill Contingency Plan (OSCP). An estimate of the costs is included in Section 4.3.3.
4.3.6.3.
Please address the following environments: The open sea environment, including a distinction between deep water and the critical transition zone, the seabed, beaches used for swimming and leisure, rocky beaches and/or sandy beaches that are rich in biota, marinas, moorings, marine anchorages and ports, power station cooling water suction plant and coal terminal, reverse osmosis plants and fish farm cages.
Yes 4 4.3
Environmental Impacts of Non-Routine Events
4.3.7.
Set out an oil spill spread model (name of model, name of manufacturer and representative calibration data), and output data, for the prior approval of the Ministry for Environmental Protection (Marine and Coastal Division), prior to running the model. For the purpose of approval of the calibration stage, please set out a document describing, in detail, the boundary conditions and the starting conditions of the model, and the various variables and non-variables chosen for the purpose of running the model. The following are the details, variables and conditions that are required for the approval:
Yes 4 4.3
Environmental Impacts of Non-Routine Events
Additional details on the modeling are found in the referenced modeling report.
4.3.7.1 General
• 4.3.7.1.1. The name of the model. • 4.3.7.1.2. A brief description of the model. Yes 4 4.3 Environmental
Impacts of Examples from around the world are not included.
Tamar Field Development Project EIA Noble Energy Mediterranean Ltd CSA-Noble-FL-16-2650-08-REP-01-FIN-REV04
B-26 March 2016
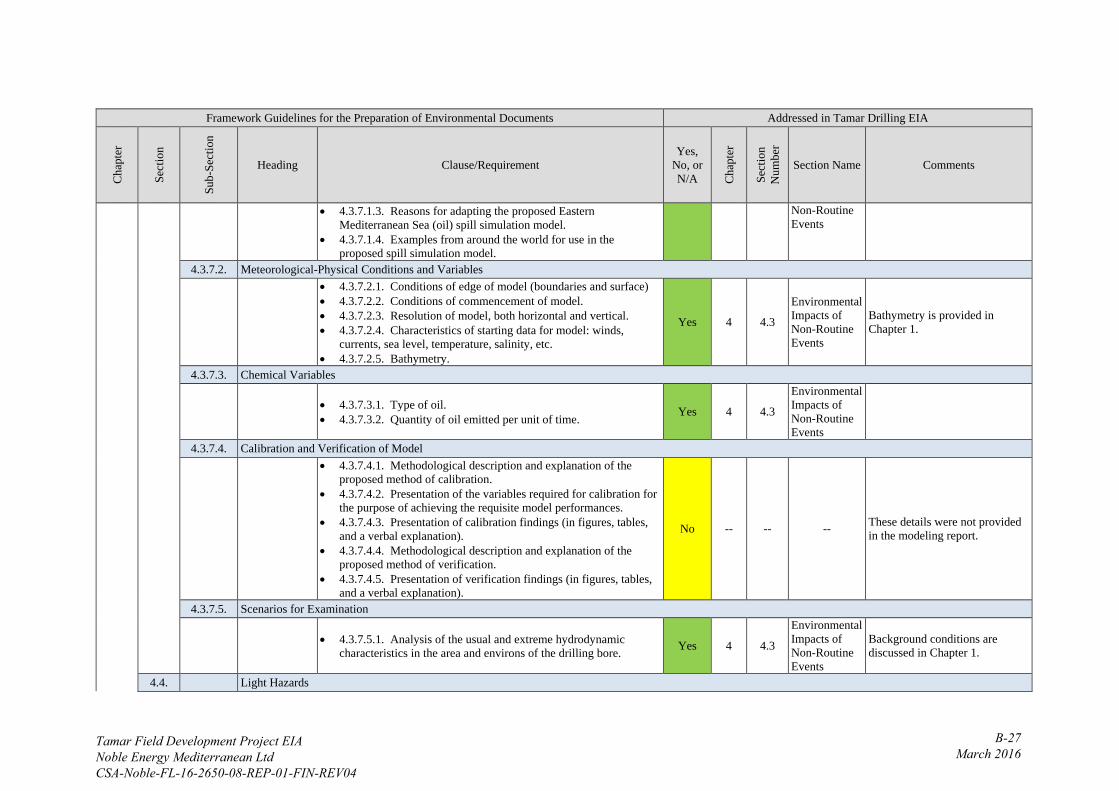
Framework Guidelines for the Preparation of Environmental Documents Addressed in Tamar Drilling EIA C
hapt
er
Sect
ion
Sub-
Sect
ion
Heading Clause/Requirement Yes,
No, or N/A C
hapt
er
Sect
ion
Num
ber
Section Name Comments
• 4.3.7.1.3. Reasons for adapting the proposed Eastern Mediterranean Sea (oil) spill simulation model.
• 4.3.7.1.4. Examples from around the world for use in the proposed spill simulation model.
Non-Routine Events
4.3.7.2. Meteorological-Physical Conditions and Variables
• 4.3.7.2.1. Conditions of edge of model (boundaries and surface) • 4.3.7.2.2. Conditions of commencement of model. • 4.3.7.2.3. Resolution of model, both horizontal and vertical. • 4.3.7.2.4. Characteristics of starting data for model: winds,
currents, sea level, temperature, salinity, etc. • 4.3.7.2.5. Bathymetry.
Yes 4 4.3
Environmental Impacts of Non-Routine Events
Bathymetry is provided in Chapter 1.
4.3.7.3. Chemical Variables
• 4.3.7.3.1. Type of oil. • 4.3.7.3.2. Quantity of oil emitted per unit of time. Yes 4 4.3
Environmental Impacts of Non-Routine Events
4.3.7.4. Calibration and Verification of Model
• 4.3.7.4.1. Methodological description and explanation of the proposed method of calibration.
• 4.3.7.4.2. Presentation of the variables required for calibration for the purpose of achieving the requisite model performances.
• 4.3.7.4.3. Presentation of calibration findings (in figures, tables, and a verbal explanation).
• 4.3.7.4.4. Methodological description and explanation of the proposed method of verification.
• 4.3.7.4.5. Presentation of verification findings (in figures, tables, and a verbal explanation).
No -- -- -- These details were not provided in the modeling report.
4.3.7.5. Scenarios for Examination
• 4.3.7.5.1. Analysis of the usual and extreme hydrodynamic characteristics in the area and environs of the drilling bore. Yes 4 4.3
Environmental Impacts of Non-Routine Events
Background conditions are discussed in Chapter 1.
4.4. Light Hazards
Tamar Field Development Project EIA Noble Energy Mediterranean Ltd CSA-Noble-FL-16-2650-08-REP-01-FIN-REV04
B-27 March 2016
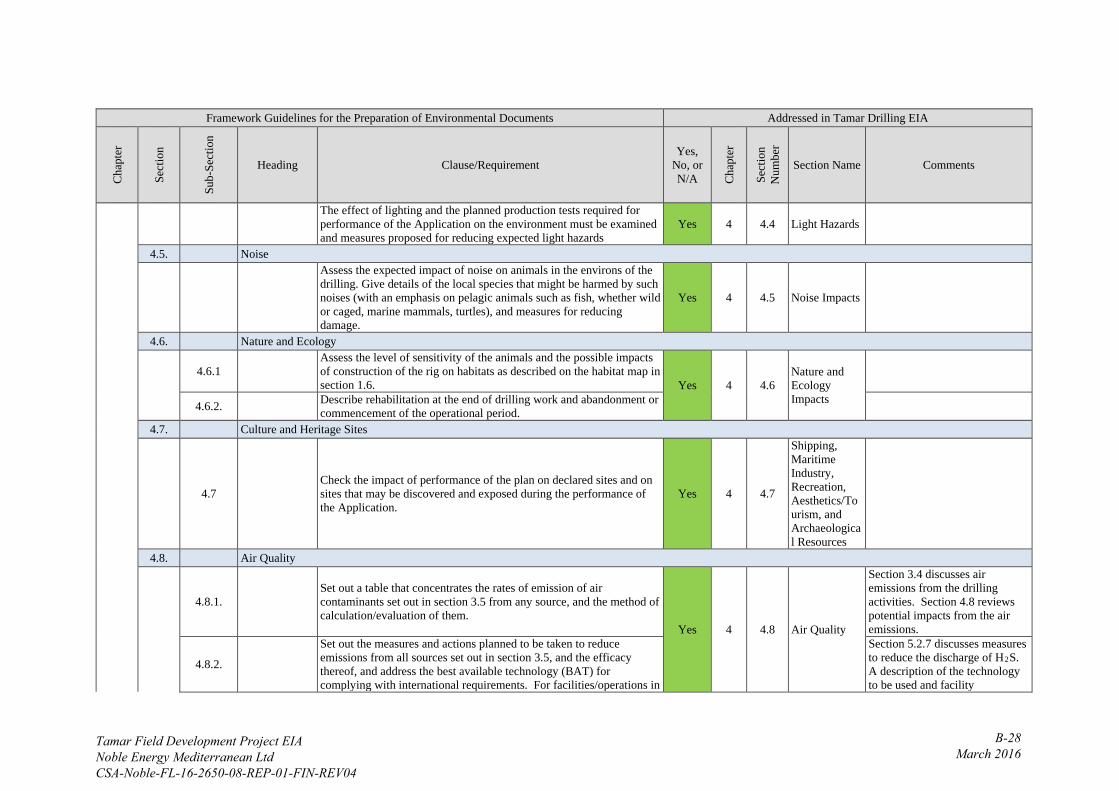
Framework Guidelines for the Preparation of Environmental Documents Addressed in Tamar Drilling EIA C
hapt
er
Sect
ion
Sub-
Sect
ion
Heading Clause/Requirement Yes,
No, or N/A C
hapt
er
Sect
ion
Num
ber
Section Name Comments
The effect of lighting and the planned production tests required for performance of the Application on the environment must be examined and measures proposed for reducing expected light hazards
Yes 4 4.4 Light Hazards
4.5. Noise
Assess the expected impact of noise on animals in the environs of the drilling. Give details of the local species that might be harmed by such noises (with an emphasis on pelagic animals such as fish, whether wild or caged, marine mammals, turtles), and measures for reducing damage.
Yes 4 4.5 Noise Impacts
4.6. Nature and Ecology
4.6.1 Assess the level of sensitivity of the animals and the possible impacts of construction of the rig on habitats as described on the habitat map in section 1.6. Yes 4 4.6
Nature and Ecology Impacts
4.6.2. Describe rehabilitation at the end of drilling work and abandonment or commencement of the operational period.
4.7. Culture and Heritage Sites
4.7 Check the impact of performance of the plan on declared sites and on sites that may be discovered and exposed during the performance of the Application.
Yes 4 4.7
Shipping, Maritime Industry, Recreation, Aesthetics/Tourism, and Archaeological Resources
4.8. Air Quality
4.8.1. Set out a table that concentrates the rates of emission of air contaminants set out in section 3.5 from any source, and the method of calculation/evaluation of them.
Yes 4 4.8 Air Quality
Section 3.4 discusses air emissions from the drilling activities. Section 4.8 reviews potential impacts from the air emissions.
4.8.2.
Set out the measures and actions planned to be taken to reduce emissions from all sources set out in section 3.5, and the efficacy thereof, and address the best available technology (BAT) for complying with international requirements. For facilities/operations in
Section 5.2.7 discusses measures to reduce the discharge of H2S. A description of the technology to be used and facility
Tamar Field Development Project EIA Noble Energy Mediterranean Ltd CSA-Noble-FL-16-2650-08-REP-01-FIN-REV04
B-28 March 2016
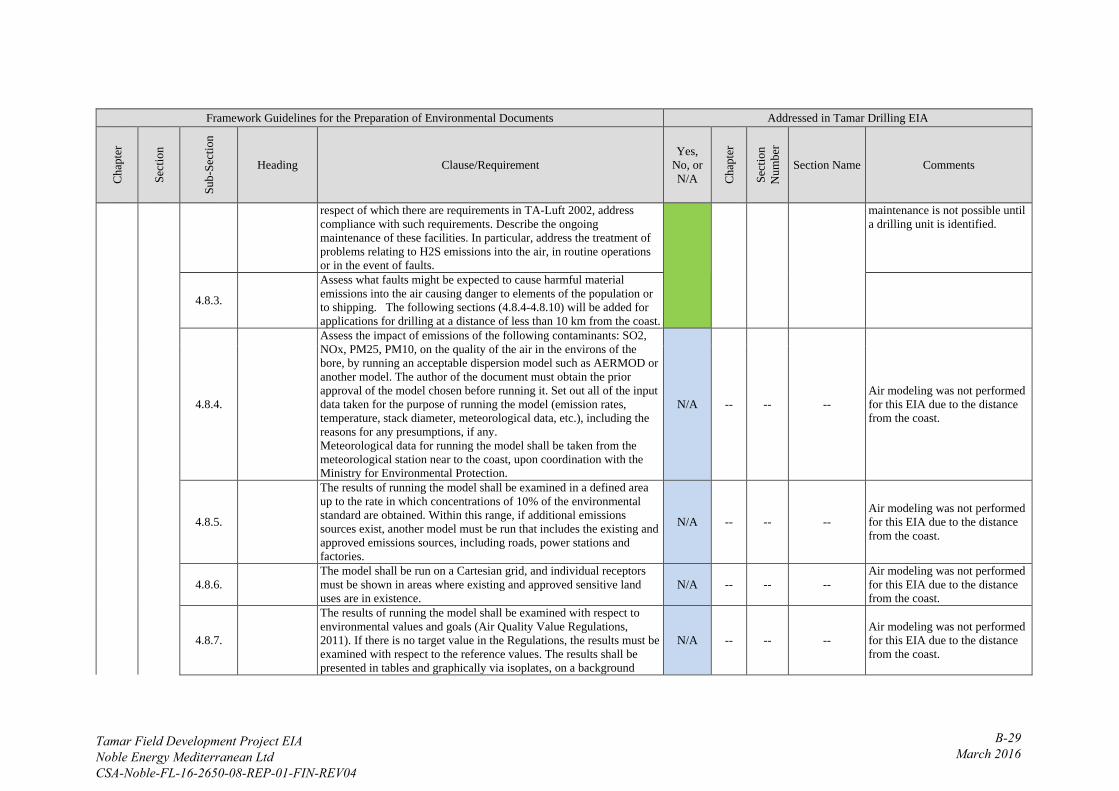
Framework Guidelines for the Preparation of Environmental Documents Addressed in Tamar Drilling EIA C
hapt
er
Sect
ion
Sub-
Sect
ion
Heading Clause/Requirement Yes,
No, or N/A C
hapt
er
Sect
ion
Num
ber
Section Name Comments
respect of which there are requirements in TA-Luft 2002, address compliance with such requirements. Describe the ongoing maintenance of these facilities. In particular, address the treatment of problems relating to H2S emissions into the air, in routine operations or in the event of faults.
maintenance is not possible until a drilling unit is identified.
4.8.3.
Assess what faults might be expected to cause harmful material emissions into the air causing danger to elements of the population or to shipping. The following sections (4.8.4-4.8.10) will be added for applications for drilling at a distance of less than 10 km from the coast.
4.8.4.
Assess the impact of emissions of the following contaminants: SO2, NOx, PM25, PM10, on the quality of the air in the environs of the bore, by running an acceptable dispersion model such as AERMOD or another model. The author of the document must obtain the prior approval of the model chosen before running it. Set out all of the input data taken for the purpose of running the model (emission rates, temperature, stack diameter, meteorological data, etc.), including the reasons for any presumptions, if any. Meteorological data for running the model shall be taken from the meteorological station near to the coast, upon coordination with the Ministry for Environmental Protection.
N/A -- -- -- Air modeling was not performed for this EIA due to the distance from the coast.
4.8.5.
The results of running the model shall be examined in a defined area up to the rate in which concentrations of 10% of the environmental standard are obtained. Within this range, if additional emissions sources exist, another model must be run that includes the existing and approved emissions sources, including roads, power stations and factories.
N/A -- -- -- Air modeling was not performed for this EIA due to the distance from the coast.
4.8.6. The model shall be run on a Cartesian grid, and individual receptors must be shown in areas where existing and approved sensitive land uses are in existence.
N/A -- -- -- Air modeling was not performed for this EIA due to the distance from the coast.
4.8.7.
The results of running the model shall be examined with respect to environmental values and goals (Air Quality Value Regulations, 2011). If there is no target value in the Regulations, the results must be examined with respect to the reference values. The results shall be presented in tables and graphically via isoplates, on a background
N/A -- -- -- Air modeling was not performed for this EIA due to the distance from the coast.
Tamar Field Development Project EIA Noble Energy Mediterranean Ltd CSA-Noble-FL-16-2650-08-REP-01-FIN-REV04
B-29 March 2016

Framework Guidelines for the Preparation of Environmental Documents Addressed in Tamar Drilling EIA C
hapt
er
Sect
ion
Sub-
Sect
ion
Heading Clause/Requirement Yes,
No, or N/A C
hapt
er
Sect
ion
Num
ber
Section Name Comments
map. The percentage contribution of each source to the emission of each contaminant must be set out.
4.8.8. Calculate dispersal of the contaminants in scenarios of faults for severe weather conditions. N/A -- -- --
Air modeling was not performed for this EIA due to the distance from the coast.
4.8.9.
Set out the measures and actions planned to be taken to reduce emissions from all sources set out in section 3.5, and the efficacy thereof, and address the best available technology (BAT) for complying with international requirements. For facilities/operations in respect of which there are requirements in TA-Luft 2002, address compliance with such requirements. Describe the ongoing maintenance of these facilities. In particular, address the treatment of problems relating to H2S emissions into the air, in routine operations or in the event of faults.
N/A -- -- -- Air modeling was not performed for this EIA due to the distance from the coast.
?? ?? Waste Describe the methods of treatment and removal of waste, as set out in section 3.8 above. Yes 4 4.9 Waste
4.9. Hazardous Materials
4.9.1. Set out the measures for reducing risks from hazardous materials in accordance with the details in section 3.6 above.
Yes 3 4.10 Hazardous Materials
SDS sheets are provided in Appendix F and present measures for reducing risk from hazardous materials. See also sections 3.5 and 5.2.2.
4.9.2. Describe and set the measures for treatment in the event that hazardous materials are discovered during the course of the drilling, including H2S.
SDS sheets are provided in Appendix F and present measures for treatment. H2S precautions are presented in Section 5.2.7.
4.9.3. Set out the method of treatment in emergencies (hazardous material event) and the means for minimizing risks, including passive and active measures such as batches detectors.
SDS sheets are provided in Appendix F and present measures for reducing risk from hazardous materials.
4.10. Preparations for Earthquakes
Tamar Field Development Project EIA Noble Energy Mediterranean Ltd CSA-Noble-FL-16-2650-08-REP-01-FIN-REV04
B-30 March 2016
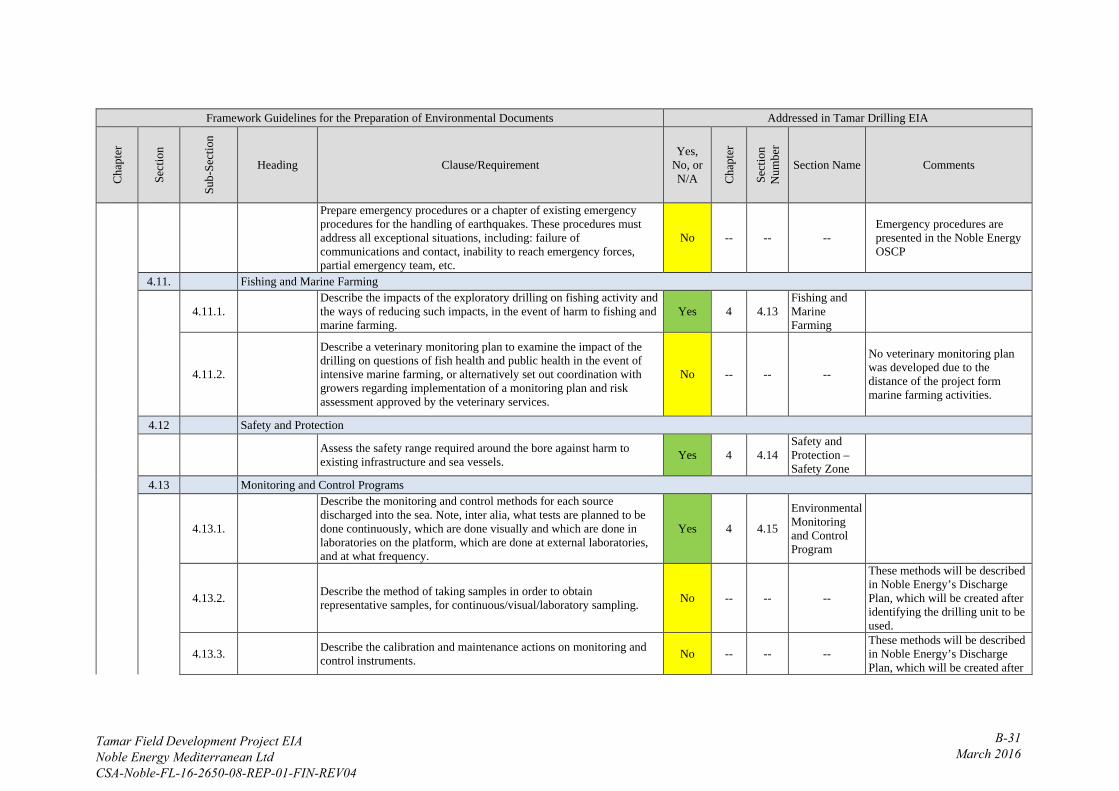
Framework Guidelines for the Preparation of Environmental Documents Addressed in Tamar Drilling EIA C
hapt
er
Sect
ion
Sub-
Sect
ion
Heading Clause/Requirement Yes,
No, or N/A C
hapt
er
Sect
ion
Num
ber
Section Name Comments
Prepare emergency procedures or a chapter of existing emergency procedures for the handling of earthquakes. These procedures must address all exceptional situations, including: failure of communications and contact, inability to reach emergency forces, partial emergency team, etc.
No -- -- -- Emergency procedures are presented in the Noble Energy OSCP
4.11. Fishing and Marine Farming
4.11.1. Describe the impacts of the exploratory drilling on fishing activity and the ways of reducing such impacts, in the event of harm to fishing and marine farming.
Yes 4 4.13 Fishing and Marine Farming
4.11.2.
Describe a veterinary monitoring plan to examine the impact of the drilling on questions of fish health and public health in the event of intensive marine farming, or alternatively set out coordination with growers regarding implementation of a monitoring plan and risk assessment approved by the veterinary services.
No -- -- --
No veterinary monitoring plan was developed due to the distance of the project form marine farming activities.
4.12 Safety and Protection
Assess the safety range required around the bore against harm to existing infrastructure and sea vessels. Yes 4 4.14
Safety and Protection – Safety Zone
4.13 Monitoring and Control Programs
4.13.1.
Describe the monitoring and control methods for each source discharged into the sea. Note, inter alia, what tests are planned to be done continuously, which are done visually and which are done in laboratories on the platform, which are done at external laboratories, and at what frequency.
Yes 4 4.15
Environmental Monitoring and Control Program
4.13.2. Describe the method of taking samples in order to obtain representative samples, for continuous/visual/laboratory sampling. No -- -- --
These methods will be described in Noble Energy’s Discharge Plan, which will be created after identifying the drilling unit to be used.
4.13.3. Describe the calibration and maintenance actions on monitoring and control instruments. No -- -- --
These methods will be described in Noble Energy’s Discharge Plan, which will be created after
Tamar Field Development Project EIA Noble Energy Mediterranean Ltd CSA-Noble-FL-16-2650-08-REP-01-FIN-REV04
B-31 March 2016

Framework Guidelines for the Preparation of Environmental Documents Addressed in Tamar Drilling EIA C
hapt
er
Sect
ion
Sub-
Sect
ion
Heading Clause/Requirement Yes,
No, or N/A C
hapt
er
Sect
ion
Num
ber
Section Name Comments
identifying the drilling unit to be used.
4.13.4. A background monitoring report of the marine environment must be submitted in accordance with Appendix B1. Yes 4 4.15
Background monitoring has been done for the Tamar projects. The reports have been submitted and are referenced in the EIA.
4.14 Closure of Drilling Site
Examine the impact of closure of the drilling site on the environment and the means required to prevent such impacts, including the removal of materials, equipment and waste
No 4 4.16 Closure and Abandonment
Impacts cannot be clearly defined at this time as the closure will be done under regulations existing at the time of closure. See also Section 5.2.17.
E Proposal for Application Guidelines
5.1 General
This Chapter shall set out all of the proposals for setting the guidelines of the Application, at the level set out as being required for detailing the possible impacts set out in the chapters of this document, and the measures that are to be taken in order to prevent or reduce such.
Yes 5 5
Proposal for Application Guidelines (Mitigation)
This chapter addresses this issue.
5.2.
The guidelines shall refer to the actions that must be taken or not taken in the entire area of the Plan, during the course of drilling and throughout the various phases of performance thereof, and following completion thereof.
Yes 5 5
Proposal for Application Guidelines (Mitigation)
This chapter addresses this issue.
5.3. The guidelines shall be for the grant of a drilling permit. Yes 5 5
Proposal for Application Guidelines (Mitigation)
This chapter addresses this issue.
5.4. The guidelines shall relate to the installation and operation of systems to track and monitor the effects that flow or that may flow from this Application.
Yes 5 5
Proposal for Application Guidelines (Mitigation)
This chapter addresses this issue.
5.5.
The guidelines shall relate to the actions that must be done throughout the area of the Application, upon the making of a decision to perform drilling and up to closure of the drilling site within the area of the Application.
Yes 5 5
Proposal for Application Guidelines (Mitigation)
This chapter addresses this issue.
5.6. The guidelines shall include the following topics, inter alia:
Tamar Field Development Project EIA Noble Energy Mediterranean Ltd CSA-Noble-FL-16-2650-08-REP-01-FIN-REV04
B-32 March 2016

Framework Guidelines for the Preparation of Environmental Documents Addressed in Tamar Drilling EIA C
hapt
er
Sect
ion
Sub-
Sect
ion
Heading Clause/Requirement Yes,
No, or N/A C
hapt
er
Sect
ion
Num
ber
Section Name Comments
5.6.1. Guidelines for the phases of performance of drilling and production tests. Yes 5 5.2.1
Drilling and Production Test Performance
5.6.2. Guideline for the handling of hazardous materials. Yes 5 5.2.2
Handling of Hazardous Materials
5.6.3. Guidelines for the reduction and prevention of harm to land and to seawater and the coastline, and including harm to the marine ecology, fishing and marine farming.
Yes 5 5.2.3
Reduction and Prevention of Harm to Seafloor, Seawater and the Coastline including Marine Ecology, Cultural and Heritage Sites, Fishing, and Marine Farming
5.6.4.
Guidelines for preservation of fauna and flora in the area of the Application including instructions for the prevention of harm to pelagic species whose presence around the drilling rig might be increased, such as sharks, marine mammals and birds.
Yes 5 5.2.4
Preservation of Fauna and Flora, Including Pelagic Species
5.6.5. Guidelines regarding the collection of data for the purpose of monitoring and tracking the quality of seawater, sediment, currents, fauna and flora and marine farming in the environs of the bore. Yes 5 5.2. Guidelines
and Plans
5.6.6. Guidelines for the construction of various monitoring systems (air, water, waste, mud and cutting discharge, etc.), to operate during the construction and performance of the Application.
Tamar Field Development Project EIA Noble Energy Mediterranean Ltd CSA-Noble-FL-16-2650-08-REP-01-FIN-REV04
B-33 March 2016
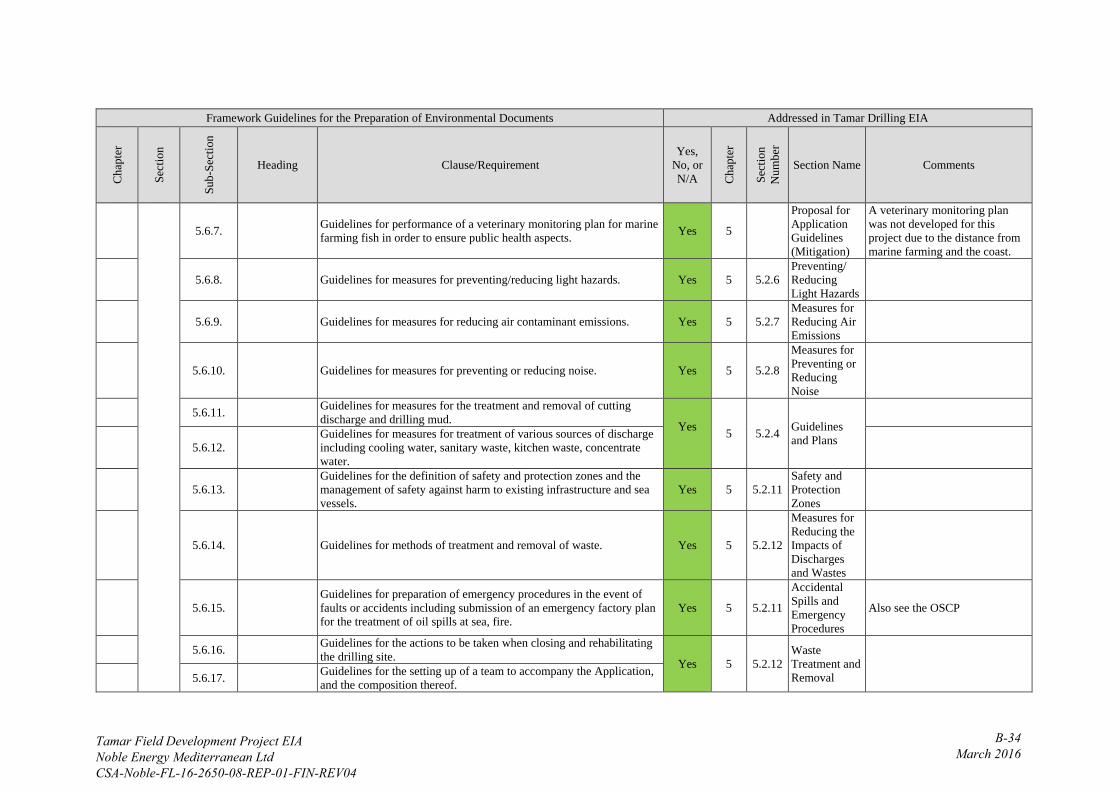
Framework Guidelines for the Preparation of Environmental Documents Addressed in Tamar Drilling EIA C
hapt
er
Sect
ion
Sub-
Sect
ion
Heading Clause/Requirement Yes,
No, or N/A C
hapt
er
Sect
ion
Num
ber
Section Name Comments
5.6.7. Guidelines for performance of a veterinary monitoring plan for marine farming fish in order to ensure public health aspects. Yes 5
Proposal for Application Guidelines (Mitigation)
A veterinary monitoring plan was not developed for this project due to the distance from marine farming and the coast.
5.6.8. Guidelines for measures for preventing/reducing light hazards. Yes 5 5.2.6 Preventing/ Reducing Light Hazards
5.6.9. Guidelines for measures for reducing air contaminant emissions. Yes 5 5.2.7 Measures for Reducing Air Emissions
5.6.10. Guidelines for measures for preventing or reducing noise. Yes 5 5.2.8
Measures for Preventing or Reducing Noise
5.6.11. Guidelines for measures for the treatment and removal of cutting discharge and drilling mud. Yes
5 5.2.4 Guidelines and Plans
5.6.12. Guidelines for measures for treatment of various sources of discharge including cooling water, sanitary waste, kitchen waste, concentrate water.
5.6.13. Guidelines for the definition of safety and protection zones and the management of safety against harm to existing infrastructure and sea vessels.
Yes 5 5.2.11 Safety and Protection Zones
5.6.14. Guidelines for methods of treatment and removal of waste. Yes 5 5.2.12
Measures for Reducing the Impacts of Discharges and Wastes
5.6.15. Guidelines for preparation of emergency procedures in the event of faults or accidents including submission of an emergency factory plan for the treatment of oil spills at sea, fire.
Yes 5 5.2.11
Accidental Spills and Emergency Procedures
Also see the OSCP
5.6.16. Guidelines for the actions to be taken when closing and rehabilitating the drilling site. Yes 5 5.2.12
Waste Treatment and Removal
5.6.17. Guidelines for the setting up of a team to accompany the Application,
and the composition thereof.
Tamar Field Development Project EIA Noble Energy Mediterranean Ltd CSA-Noble-FL-16-2650-08-REP-01-FIN-REV04
B-34 March 2016

Framework Guidelines for the Preparation of Environmental Documents Addressed in Tamar Drilling EIA C
hapt
er
Sect
ion
Sub-
Sect
ion
Heading Clause/Requirement Yes,
No, or N/A C
hapt
er
Sect
ion
Num
ber
Section Name Comments
5.6.18. Guidelines for periodical reporting of faults to the Petroleum Commissioner, and of environmental issues to the Ministry for Environmental Protection.
Yes 5 5.2.18 Coordination
Team and Reporting
Tamar Field Development Project EIA Noble Energy Mediterranean Ltd CSA-Noble-FL-16-2650-08-REP-01-FIN-REV04
B-35March 2016

Tamar Field Development Project EIA C-1 Noble Energy Mediterranean Ltd March 2016 CSA-Noble-FL-16-2650-08-REP-01-FIN-REV04
APPENDIX C
Side-Scan Sonar Targets Confidential
Tamar Field Development Project EIA D-1 Noble Energy Mediterranean Ltd March 2016 CSA-Noble-FL-16-2650-08-REP-01-FIN-REV04
APPENDIX D
Representative Project Vessels and Helicopter Specifications

ENSCO 5006
Ensco Europe & AfricaBadentoy AvenuePortlethenAberdeen, U. K. AB12 4YBPhone: + 44 1224 780400Fax: + 44 1224 783483E- mail: [email protected]
GENERAL INFORMATIONFlag Vanuatu Previous Name(s) Pride North America Year Built 1998/1999 Builder Friede & Golldman, Pascagoula, USA Design Bingo 8000, modified by the addition of 22.96 ft pontoonextensions Fore & Aft. Classification DNV, Maltese Cross 1A1 Column StabilizedDrilling Unit
MAIN DIMENSIONSDeck Area 252.60 x 213.3 ft
MACHINERYMain Power (4) Caterpillar 3608-TA diesel engines, 3,055HP; (1) Baylor AC generator, 600V 60Hz 3,571 kVA each. Power Distribution 6 SCR's: M&I ; 2,200 amp 750V dc outputeach SCR units for drilling and mooring Emergency Power (1) Caterpillar 3512-DITA diesel engine1,281 HP, (1) Caterpillar SR-4 AC generator, 480 V 60 Hz 1,137kVA
OPERATING PARAMETERSWater Depth Maximum design value: 7,500 ft, Outfitted for7,000 ft Maximum Drilling Depth 25,000 ft Transit Speed 5 knots Survival Conditions Wind: 100 knots; Waves: 105 ft at 15 sec;Current: 1.5 knots
DRILLING EQUIPMENTDerrick Loadmaster 172 x 44 x 40 ft, rated at 1,600,000 lb SHLcapacity with 14 lines Drawworks National 1625 UBDE, input 3,000hp;7838 ElmagcobrakeRotary National 60-1/2 in powered by GE 752 electric motor Top Drive Varco TDS-4S, 2 speeds, rated 750 ton, 45,500ft.lb @ 130 rpm, 7,500psi WP Mud Pumps (3) National 14P220, 2,200HP each, 7,500 psi WP
HOISTING EQUIPMENTCranage (1) AmClyde Kingpost crane, rated 80 mt at 31.5 mwith 48.76 m boom (1) Liebherr Kingpost crane MTC-1900-60D Litronic, rated 60 mt at 8.9 m with 45.72 m boom
CAPACITIESLiquid Mud 5,100 bbls (Deck Box), 4,800 bbls Reserve Mud(Minor columns) Bulk Mud/Cement 20,600 ft3 Sacks 6,000 sacks Drillwater 12,320 bblsPotable Water 4,620 bblsFuel Oil 16,650 bbls
WELL CONTROL SYSTEMSBOP VetcoHD-H4 well head connector 18-3/4 in 15,000psi WP;2 x Cameron 18-3/4 in type TL double 15,000psi WP H2Strimmed preventers; 1 x Hydril 18-3/4 in dual annuflex annular10,000psi WP H2S trimmed; LMRP: Cameron connector modelHC, 18-3/4 in 15,000psi WP; Oil State 5,000 psi flex joint. BOP Handling (1) BOP carrier, 272 mt; (1) X-mas Tree Carrier,272 mt; (2) 72.5 mt BOP overhead crane Control System Cameron Multiplex system, 5,000psiDiverter Hydril FS-21-500, 21-1/4 in for a 60 1/2 in rotary,500psi WP, 2 x 14 in vent line and 1 x 18 in flow line outlets Choke and Kill Cameron 15,000psi, 4 in, H2S service manifold
MOORINGWinches (4) Skagit double drum traction winches Wire 10,600 ft x 3-3/4 in wire and 2,500 ft x 3-1/4 in R3S chain Anchors (8) Vryhof Stevpris MK-5 anchors, 15 mt each
HELIDECK Sikorsky S-61N, 84 x 84 ft ACCOMMODATION 120 persons
ADDITIONAL DATA(4) Norsafe 60-man totally enclosed life boats; 5 x 25 man liferafts
Tamar Field Development Project EIA Noble Energy Mediterranean Ltd CSA-Noble-FL-16-2650-08-REP-01-FIN-REV04
D-2 March 2016
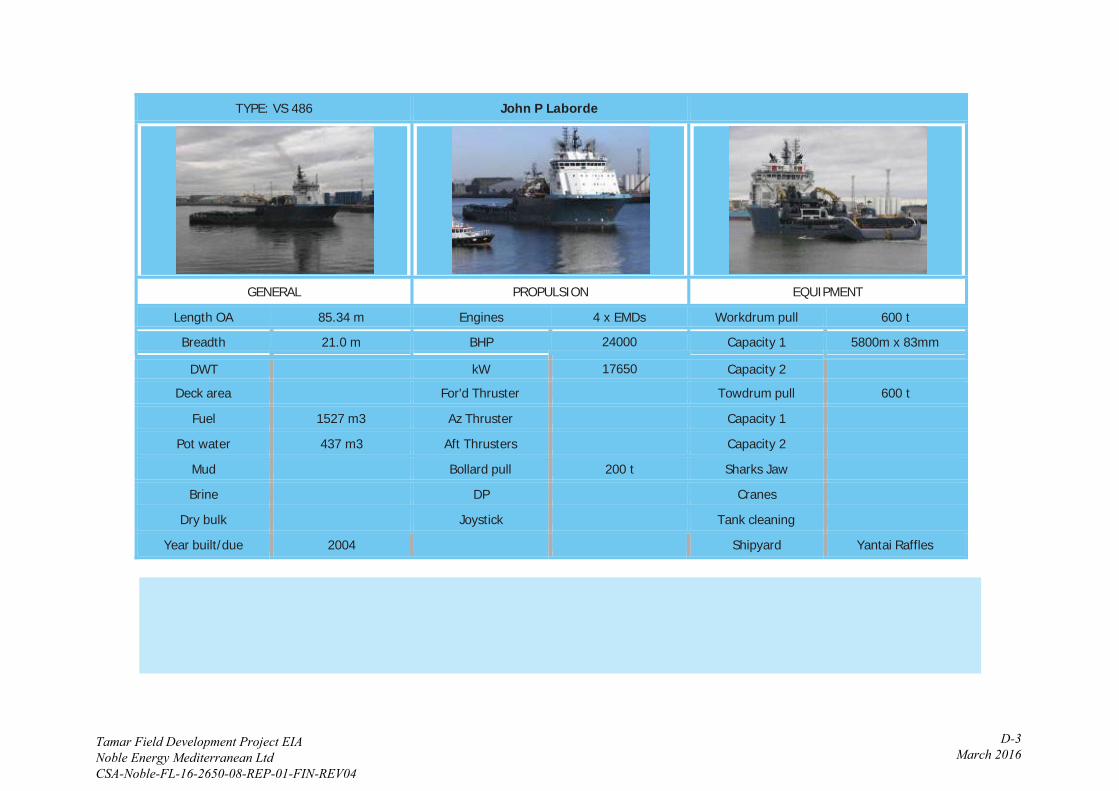
TYPE: VS 486 John P Laborde
GENERAL PROPULSION EQUIPMENT
Length OA 85.34 m Engines 4 x EMDs Workdrum pull 600 t
Breadth 21.0 m BHP 24000 Capacity 1 5800m x 83mm
DWT kW 17650 Capacity 2
Deck area For'd Thruster Towdrum pull 600 t
Fuel 1527 m3 Az Thruster Capacity 1
Pot water 437 m3 Aft Thrusters Capacity 2
Mud Bollard pull 200 t Sharks Jaw
Brine DP Cranes
Dry bulk Joystick Tank cleaning
Year built/due 2004 Shipyard Yantai Raffles
Tamar Field Development Project EIA Noble Energy Mediterranean Ltd CSA-Noble-FL-16-2650-08-REP-01-FIN-REV04
D-3 March 2016

TYPE: VS 486 Richard M Currence
GENERAL PROPULSION EQUIPMENT
Length OA 85.34 m Engines 4 x EMD 16-265H Workdrum pull 600 t
Breadth 21.0 m BHP 24000 Capacity 1 5800m x 83mm
DWT kW 17650 Capacity 2
Deck area For'd Thruster Towdrum pull 600 t
Fuel 1527 m3 Az Thruster Capacity 1
Pot water 437 m3 Aft Thrusters Capacity 2
Mud Bollard pull 200 t Sharks Jaw
Brine DP Cranes
Dry bulk Joystick Tank cleaning
Year built/due 2003 Shipyard Yantai Raffles
Tamar Field Development Project EIA Noble Energy Mediterranean Ltd CSA-Noble-FL-16-2650-08-REP-01-FIN-REV04
D-4 March 2016
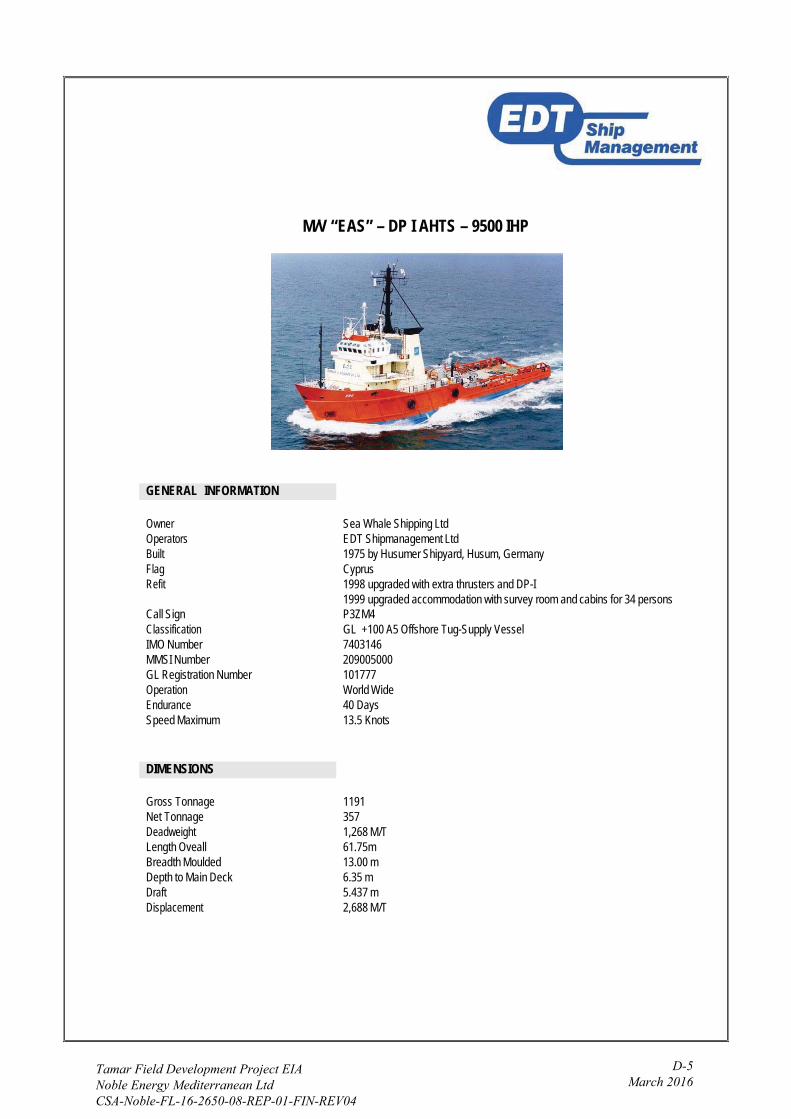
M/V “EAS” – DP I AHTS – 9500 IHP
Owner Sea Whale Shipping LtdOperators EDT Shipmanagement LtdBuilt 1975 by Husumer Shipyard, Husum, GermanyFlag CyprusRefit 1998 upgraded with extra thrusters and DP-I
1999 upgraded accommodation with survey room and cabins for 34 personsCall Sign P3ZM4Classification GL +100 A5 Offshore Tug-Supply VesselIMO Number 7403146MMSI Number 209005000GL Registration Number 101777Operation World WideEndurance 40 DaysSpeed Maximum 13.5 Knots
Gross Tonnage 1191Net Tonnage 357Deadweight 1,268 M/TLength Oveall 61.75mBreadth Moulded 13.00 mDepth to Main Deck 6.35 mDraft 5.437 mDisplacement 2,688 M/T
GENERAL INFORMATION
DIMENSIONS
Tamar Field Development Project EIA Noble Energy Mediterranean Ltd CSA-Noble-FL-16-2650-08-REP-01-FIN-REV04
D-5 March 2016
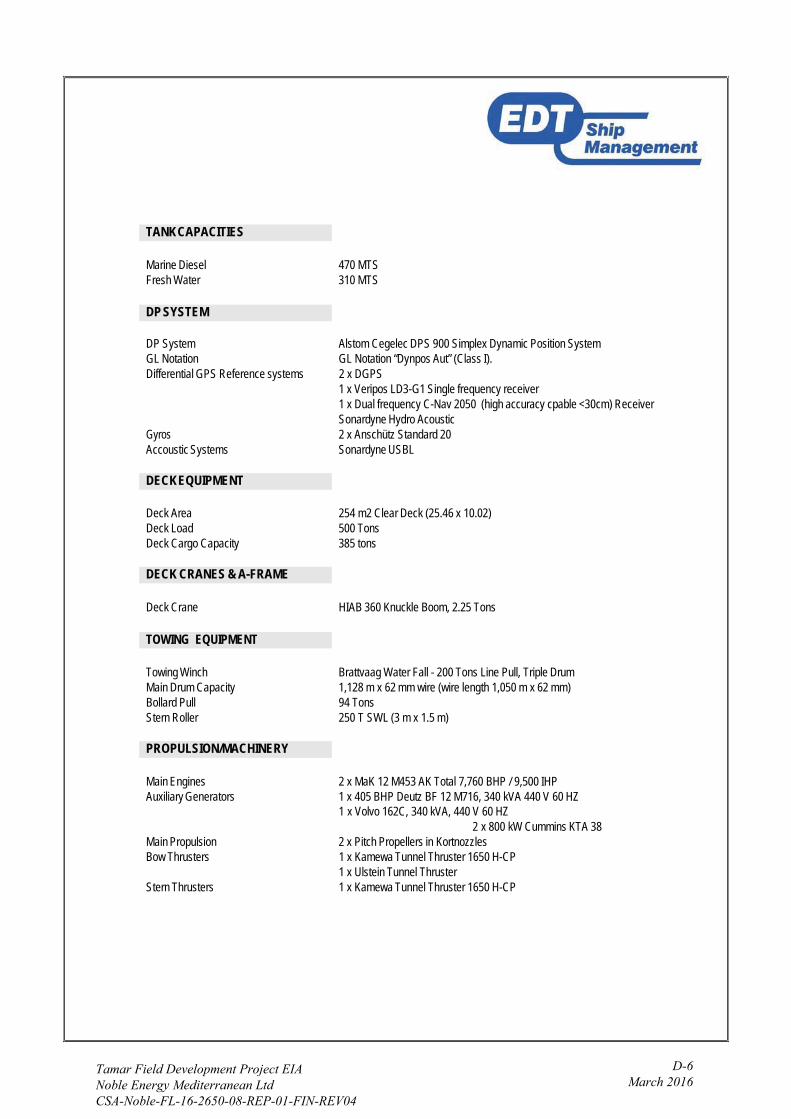
Marine Diesel 470 MTSFresh Water 310 MTS
DP System Alstom Cegelec DPS 900 Simplex Dynamic Position SystemGL Notation GL Notation “Dynpos Aut” (Class I).Differential GPS Reference systems 2 x DGPS
1 x Veripos LD3-G1 Single frequency receiver1 x Dual frequency C-Nav 2050 (high accuracy cpable <30cm) ReceiverSonardyne Hydro Acoustic
Gyros 2 x Anschütz Standard 20Accoustic Systems Sonardyne USBL
Deck Area 254 m2 Clear Deck (25.46 x 10.02)Deck Load 500 TonsDeck Cargo Capacity 385 tons
Deck Crane HIAB 360 Knuckle Boom, 2.25 Tons
Towing Winch Brattvaag Water Fall - 200 Tons Line Pull, Triple DrumMain Drum Capacity 1,128 m x 62 mm wire (wire length 1,050 m x 62 mm)Bollard Pull 94 TonsStern Roller 250 T SWL (3 m x 1.5 m)
Main Engines 2 x MaK 12 M453 AK Total 7,760 BHP / 9,500 IHPAuxiliary Generators 1 x 405 BHP Deutz BF 12 M716, 340 kVA 440 V 60 HZ
1 x Volvo 162C, 340 kVA, 440 V 60 HZ2 x 800 kW Cummins KTA 38
Main Propulsion 2 x Pitch Propellers in KortnozzlesBow Thrusters 1 x Kamewa Tunnel Thruster 1650 H-CP
1 x Ulstein Tunnel ThrusterStern Thrusters 1 x Kamewa Tunnel Thruster 1650 H-CP
TANKCAPACITIES
DP SYSTEM
DECKEQUIPMENT
DECK CRANES & A-FRAME
TOWING EQUIPMENT
PROPULSION/MACHINERY
Tamar Field Development Project EIA Noble Energy Mediterranean Ltd CSA-Noble-FL-16-2650-08-REP-01-FIN-REV04
D-6 March 2016

Total Accommodation 35 PersonsOther Facilities Survey Room 18m²(4 x 4.5m)
Laundry Room : - 2 x Wesco Navy Washing Machines- 2 x Wesco Tumble Driers
SAT TVPermanent Internet ConnectionThe Vessel is fully air conditioned.
Radars 1 x SAM Eletronics CHARTRADAR 11001 x Decca Bridge Master E
ECDIS 1 x SAM Electronics CHARTPILOT 1100GPS 1 x Leica MX 420LRIT 2 x JRC JUE-85 INMARSAT-CAIS JHS - 182Gyro Compass 2 x Anschütz Standard 20
1 x AnschützAuto Pilot 1 x Robertson
Navtex Racal Lo-kataEcho Sounder Furuno FE-700
Radio Transeivers SailorDSC Decoders 1 x Sailor for HF SSB
2 x Sailor for VHFVHF 1 x Redifon Sealand
2 x Sailor1 x Icom
Inmarsat C TelexV-Sat Voice, DataBroadband Sat Com Voice, Fax and Data
GMDSS installation in accordance with IMO regulations for vessels operating within Sea Area A3.
The specifications listed on this data sheet are subject to change without notice and cannot be used for contractual purposes.Up-to-date specifications will be supplied on request.
All details without guarantee. (30.11.2011)
ACCOMMODATION
NAVIGATION EQUIPMENT
COMMUNICATIONS
Tamar Field Development Project EIA Noble Energy Mediterranean Ltd CSA-Noble-FL-16-2650-08-REP-01-FIN-REV04
D-7 March 2016
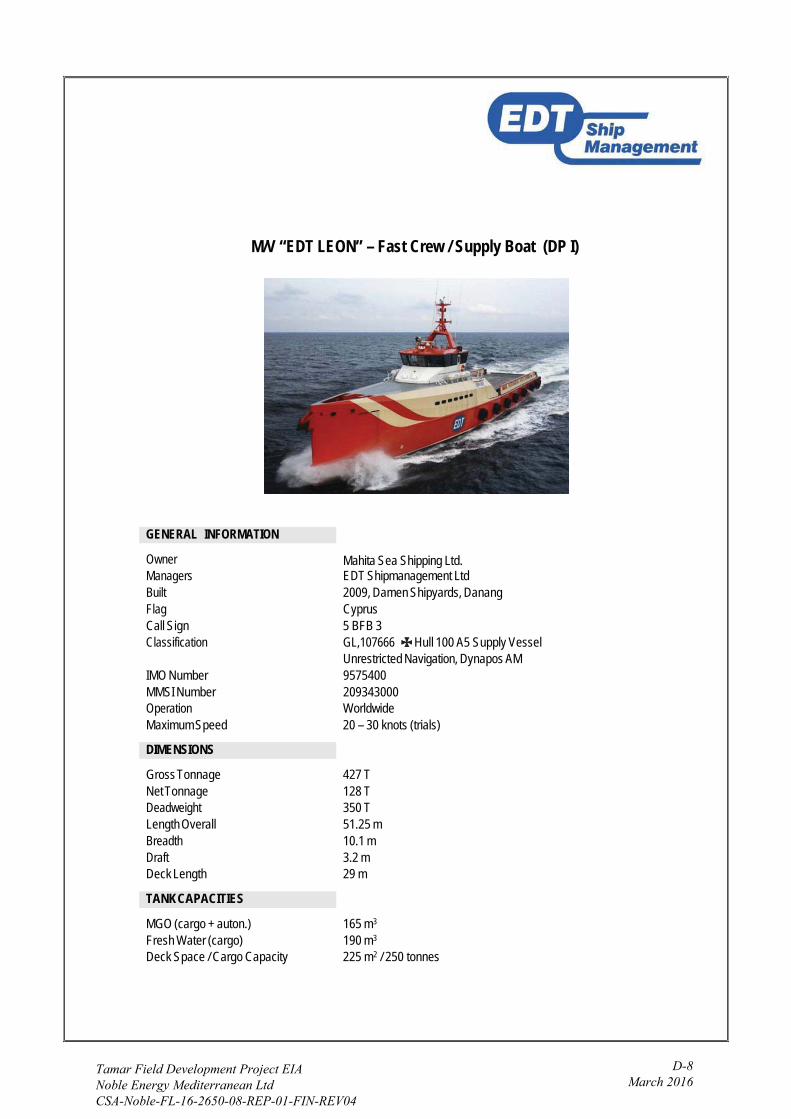
M/V “EDT LEON” – Fast Crew / Supply Boat (DP I)
Owner Mahita Sea Shipping Ltd.Managers EDT Shipmanagement LtdBuilt 2009, Damen Shipyards, DanangFlag CyprusCall Sign 5 BFB 3Classification GL,107666 Hull 100 A5 Supply Vessel
Unrestricted Navigation, Dynapos AMIMO Number 9575400MMSI Number 209343000Operation WorldwideMaximum Speed 20 – 30 knots (trials)
Gross Tonnage 427 TNet Tonnage 128 TDeadweight 350 TLength Overall 51.25 mBreadth 10.1 mDraft 3.2 mDeck Length 29 m
MGO (cargo + auton.) 165 m3
Fresh Water (cargo) 190 m3
Deck Space / Cargo Capacity 225 m2 / 250 tonnes
GENERAL INFORMATION
DIMENSIONS
TANKCAPACITIES
Tamar Field Development Project EIA Noble Energy Mediterranean Ltd CSA-Noble-FL-16-2650-08-REP-01-FIN-REV04
D-8 March 2016
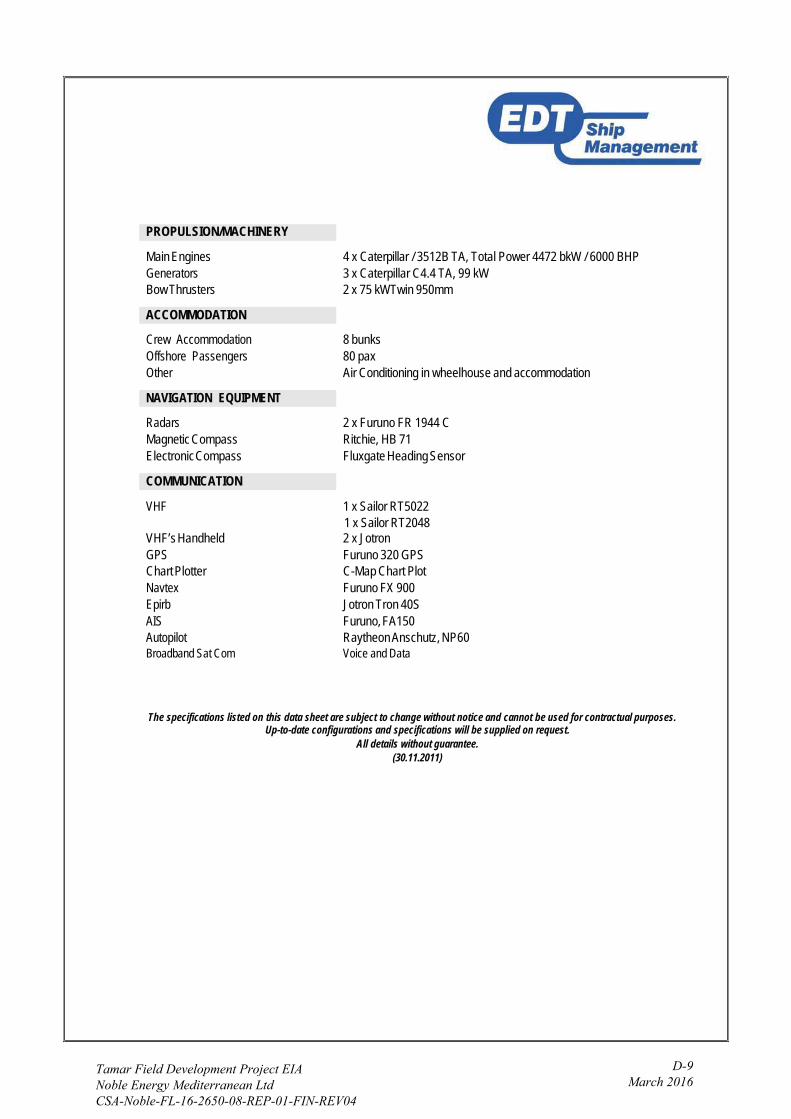
Main Engines 4 x Caterpillar / 3512B TA, Total Power 4472 bkW / 6000 BHPGenerators 3 x Caterpillar C4.4 TA, 99 kWBow Thrusters 2 x 75 kWTwin 950mm
Crew Accommodation 8 bunksOffshore Passengers 80 paxOther Air Conditioning in wheelhouse and accommodation
Radars 2 x Furuno FR 1944 CMagnetic Compass Ritchie, HB 71Electronic Compass Fluxgate Heading Sensor
VHF 1 x Sailor RT50221 x Sailor RT2048
VHF’s Handheld 2 x JotronGPS Furuno 320 GPSChart Plotter C-Map Chart PlotNavtex Furuno FX 900Epirb Jotron Tron 40SAIS Furuno, FA150Autopilot Raytheon Anschutz, NP60Broadband Sat Com Voice and Data
The specifications listed on this data sheet are subject to change without notice and cannot be used for contractual purposes.Up-to-date configurations and specifications will be supplied on request.
All details without guarantee. (30.11.2011)
PROPULSION/MACHINERY
ACCOMMODATION
NAVIGATION EQUIPMENT
COMMUNICATION
Tamar Field Development Project EIA Noble Energy Mediterranean Ltd CSA-Noble-FL-16-2650-08-REP-01-FIN-REV04
D-9 March 2016

Helicopter – BELL 412SP, N142PH, S/N 33150
Tamar Field Development Project EIA Noble Energy Mediterranean Ltd CSA-Noble-FL-16-2650-08-REP-01-FIN-REV04
D-10 March 2016

IInterior -Actual photos
Tamar Field Development Project EIA Noble Energy Mediterranean Ltd CSA-Noble-FL-16-2650-08-REP-01-FIN-REV04
D-11 March 2016

Bell 412 se!!Helicopter A TexrronCompal'l'f
Heliport Design Data and Dimensions
LANDING GEAR LOADINGAT MAXIMUMGROSS IMOIGHT (1190 POUNDS), BASED ON 1G STATIC CONDITIONSAT AFT-MOSTSTRUCTURAL CG LIMIT
Gear Type Loading (lb) Contact Area(in2) Contract Pressure (lbAn2)
Forward Aft Forward Aft Forward Aft
Standard Skid 2356 9544 24.0x 2.0 24.0 x 2.0 49 199
High Skid 2386 9514 24.0 x 2.0 24.0 x 2.0 50 199
Emergency Floats 2486 9514 24.0x 2.0 24.0 x 2.0 50 199
Tamar Field Development Project EIA Noble Energy Mediterranean Ltd CSA-Noble-FL-16-2650-08-REP-01-FIN-REV04
D-12 March 2016

Tamar Field Development Project EIA E-1 Noble Energy Mediterranean Ltd March 2016 CSA-Noble-FL-16-2650-08-REP-01-FIN-REV04
APPENDIX E
ESCAID 110 Fluid Specifications
Confidential

Tamar Field Development Project EIA F-1 Noble Energy Mediterranean Ltd March 2016 CSA-Noble-FL-16-2650-08-REP-01-FIN-REV04
APPENDIX F
Safety Data Sheets Confidential
Tamar Field Development Project EIA G-1 Noble Energy Mediterranean Ltd March 2016 CSA-Noble-FL-16-2650-08-REP-01-FIN-REV04
APPENDIX G
Drilling Mud Treatment and Processing System
Confidential

Tamar Field Development Project EIA H-1 Noble Energy Mediterranean Ltd March 2016 CSA-Noble-FL-16-2650-08-REP-01-FIN-REV04
APPENDIX H
MUDMAP Model Description

Applied Science Associates a member of the RPS Group plc
Table of Contents
List of Figures
List of Tables
Tamar Field Development Project EIANoble Energy Mediterranean LtdCSA-Noble-FL-16-2650-08-REP-01-FIN-REV04
H-2March 2016

Applied Science Associates a member of the RPS Group plc
Tamar Field Development Project EIANoble Energy Mediterranean LtdCSA-Noble-FL-16-2650-08-REP-01-FIN-REV04
H-3March 2016

Applied Science Associates a member of the RPS Group plc
Executive Summary
Tamar Field Development Project EIANoble Energy Mediterranean LtdCSA-Noble-FL-16-2650-08-REP-01-FIN-REV04
H-4March 2016
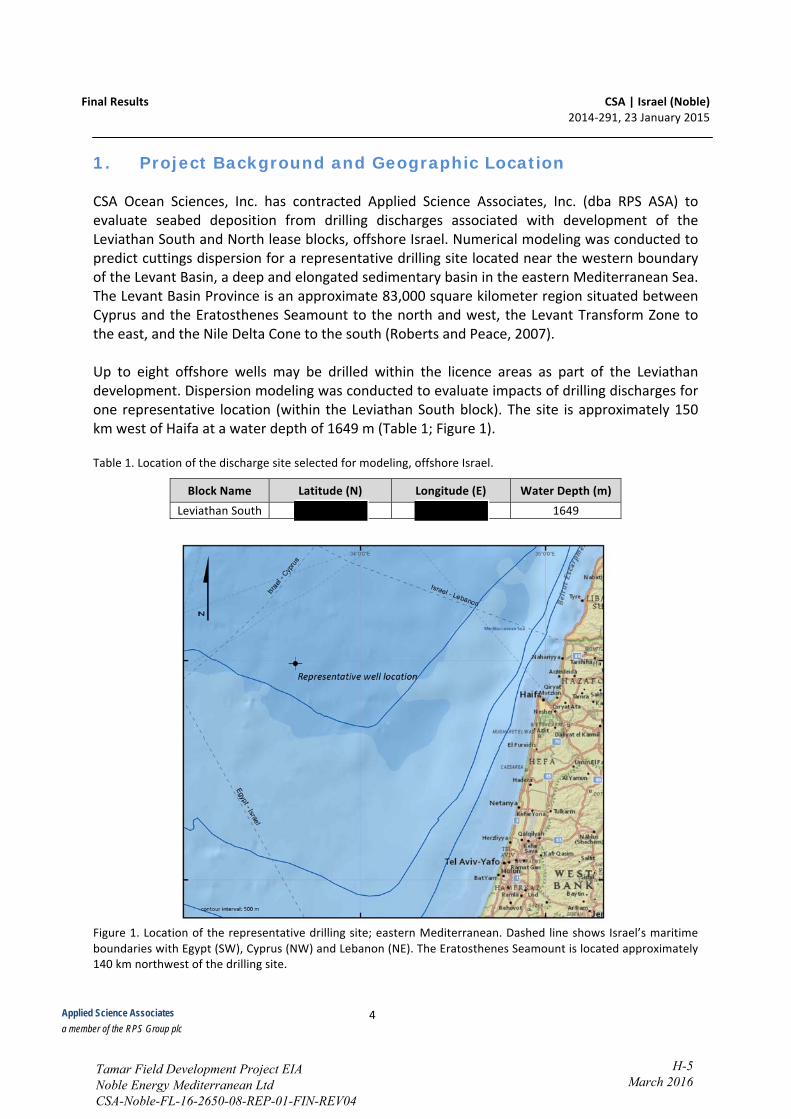
Applied Science Associates a member of the RPS Group plc
1. Project Background and Geographic Location
Tamar Field Development Project EIANoble Energy Mediterranean LtdCSA-Noble-FL-16-2650-08-REP-01-FIN-REV04
H-5March 2016
Applied Science Associates a member of the RPS Group plc
2. Model Inputs
2.1. MetOcean Data
Tamar Field Development Project EIANoble Energy Mediterranean LtdCSA-Noble-FL-16-2650-08-REP-01-FIN-REV04
H-6March 2016

Applied Science Associates a member of the RPS Group plc
••••
•
Tamar Field Development Project EIANoble Energy Mediterranean LtdCSA-Noble-FL-16-2650-08-REP-01-FIN-REV04
H-7March 2016

Applied Science Associates a member of the RPS Group plc
•
•
•
•
•
Tamar Field Development Project EIANoble Energy Mediterranean LtdCSA-Noble-FL-16-2650-08-REP-01-FIN-REV04
H-8March 2016
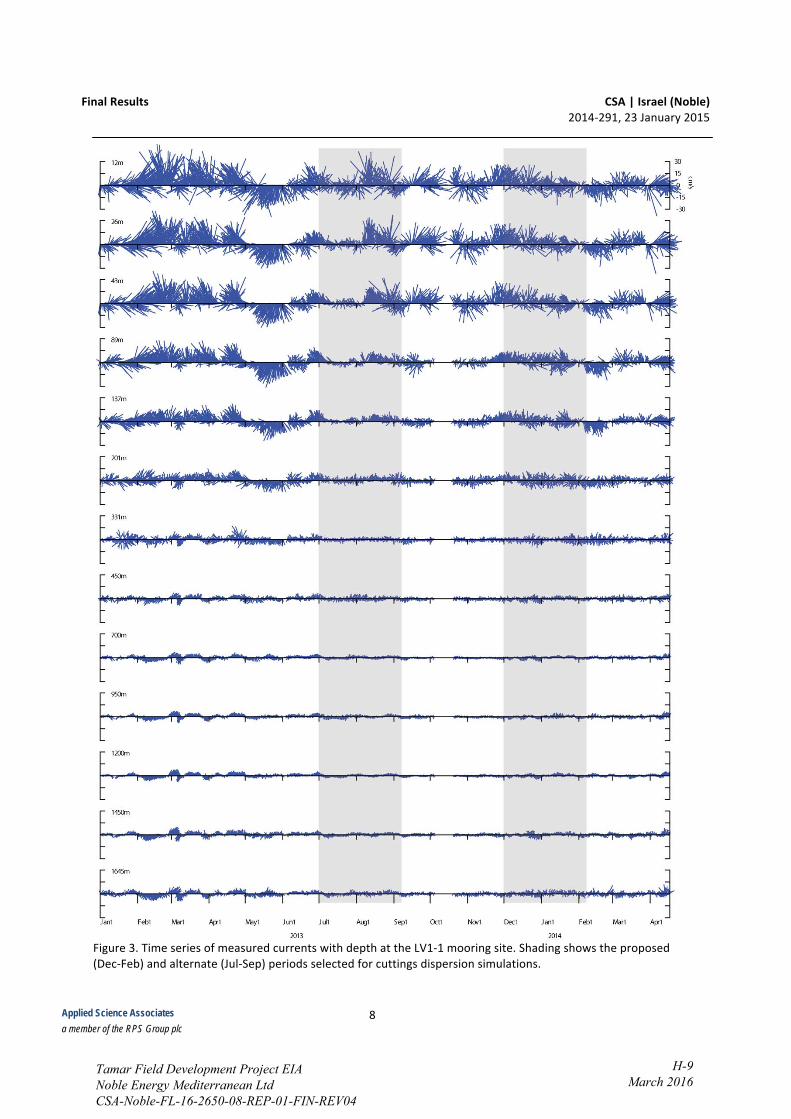
Applied Science Associates a member of the RPS Group plc
Tamar Field Development Project EIANoble Energy Mediterranean LtdCSA-Noble-FL-16-2650-08-REP-01-FIN-REV04
H-9March 2016

Applied Science Associates a member of the RPS Group plc
Tamar Field Development Project EIANoble Energy Mediterranean LtdCSA-Noble-FL-16-2650-08-REP-01-FIN-REV04
H-10March 2016
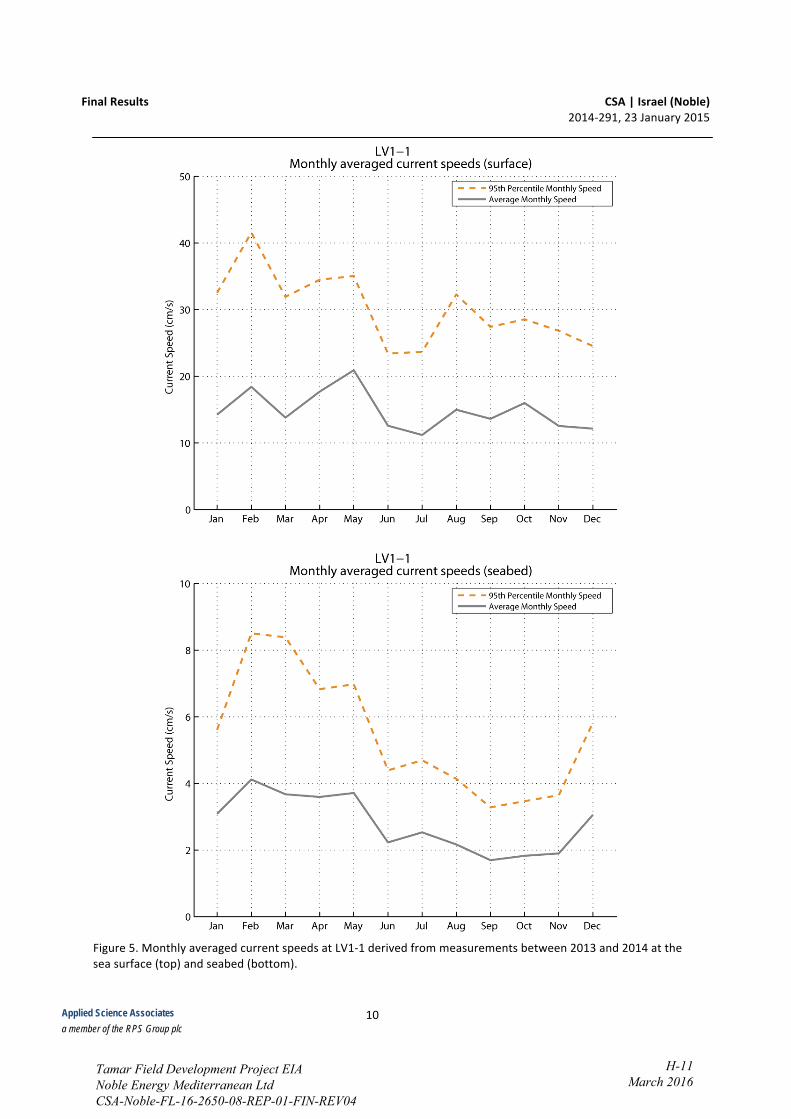
Applied Science Associates a member of the RPS Group plc
Tamar Field Development Project EIANoble Energy Mediterranean LtdCSA-Noble-FL-16-2650-08-REP-01-FIN-REV04
H-11March 2016
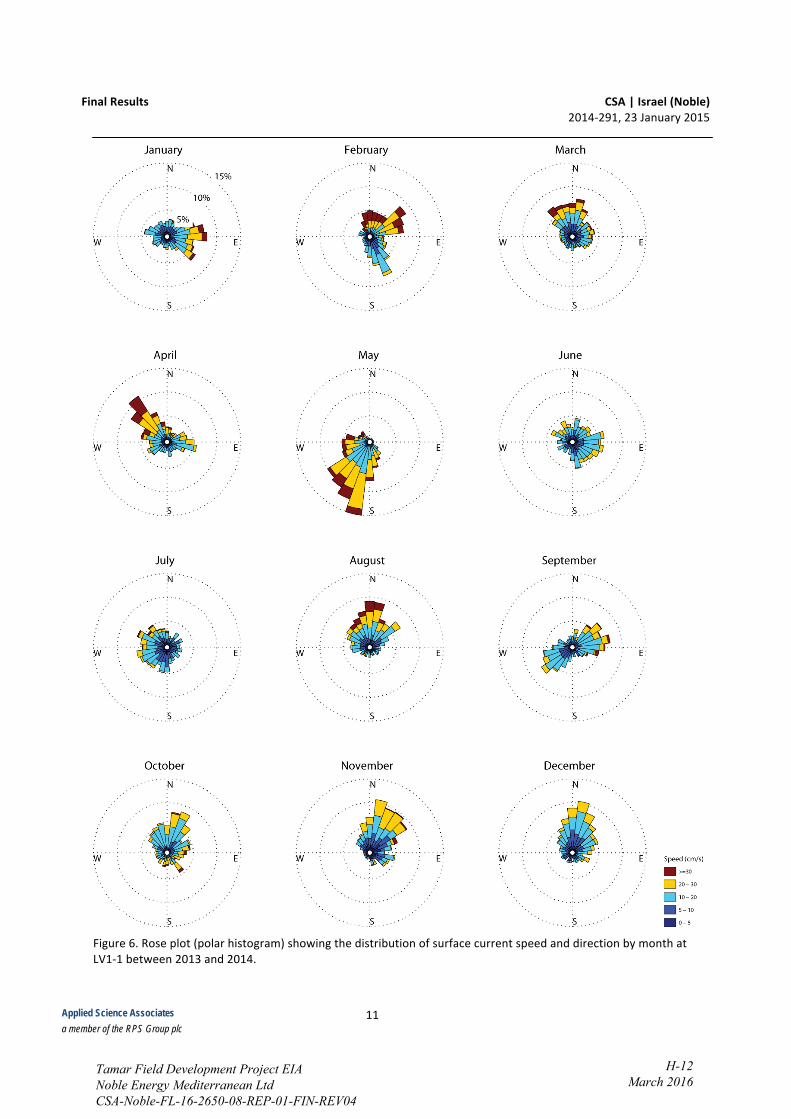
Applied Science Associates a member of the RPS Group plc
Tamar Field Development Project EIANoble Energy Mediterranean LtdCSA-Noble-FL-16-2650-08-REP-01-FIN-REV04
H-12March 2016
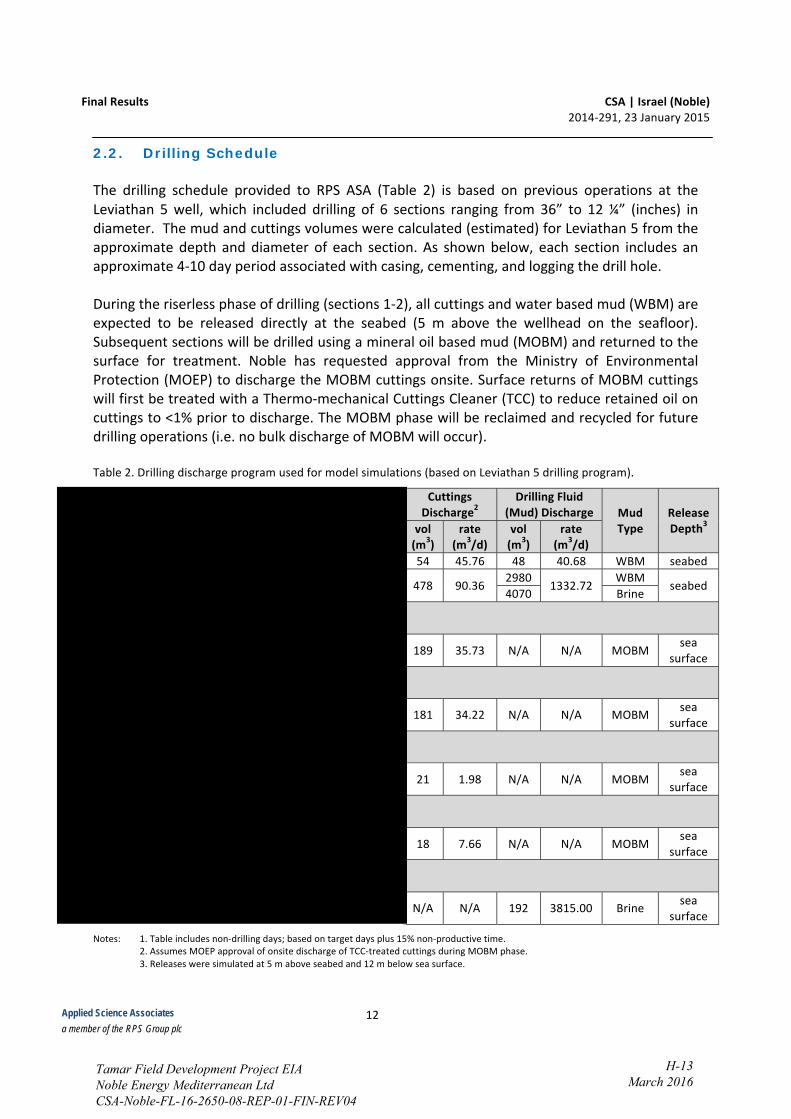
Applied Science Associates a member of the RPS Group plc
2.2. Drilling Schedule
Tamar Field Development Project EIANoble Energy Mediterranean LtdCSA-Noble-FL-16-2650-08-REP-01-FIN-REV04
H-13March 2016
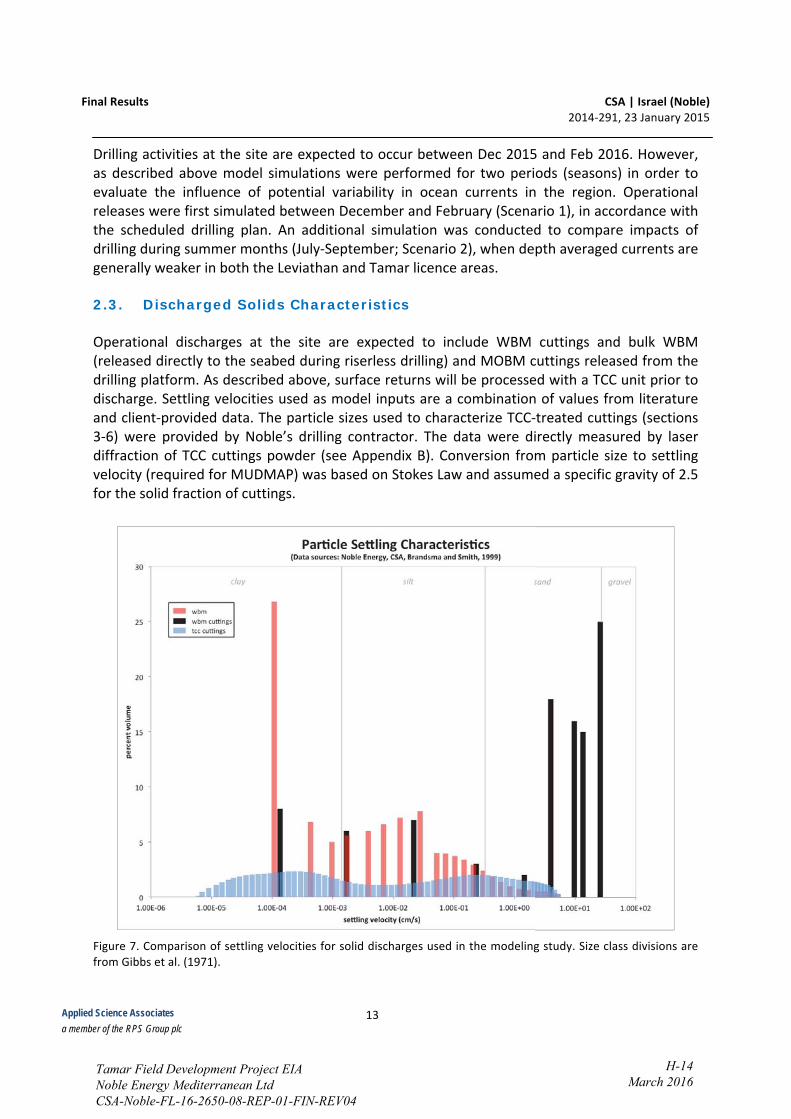
Applied Science Associates a member of the RPS Group plc
2.3. Discharged Solids Characteristics
Tamar Field Development Project EIANoble Energy Mediterranean LtdCSA-Noble-FL-16-2650-08-REP-01-FIN-REV04
H-14March 2016

Applied Science Associates a member of the RPS Group plc
Tamar Field Development Project EIANoble Energy Mediterranean LtdCSA-Noble-FL-16-2650-08-REP-01-FIN-REV04
H-15March 2016
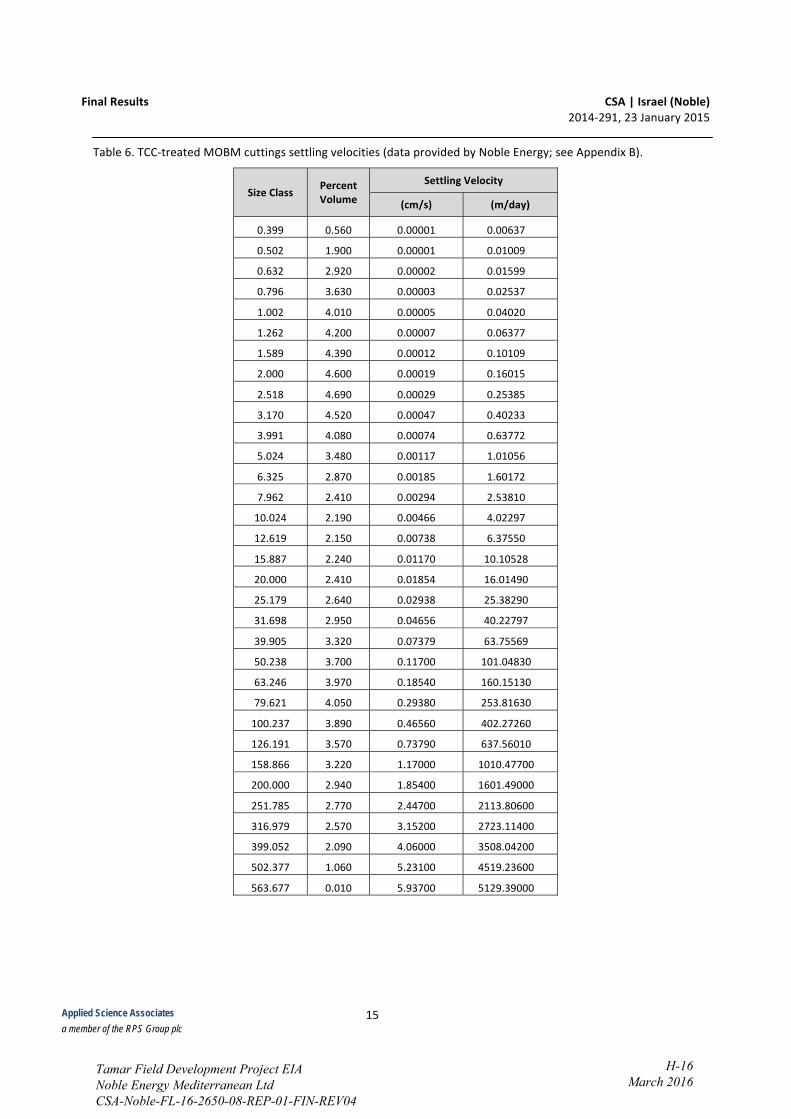
Applied Science Associates a member of the RPS Group plc
Tamar Field Development Project EIANoble Energy Mediterranean LtdCSA-Noble-FL-16-2650-08-REP-01-FIN-REV04
H-16March 2016

Applied Science Associates a member of the RPS Group plc
3. Model Results
Tamar Field Development Project EIANoble Energy Mediterranean LtdCSA-Noble-FL-16-2650-08-REP-01-FIN-REV04
H-17 March 2016
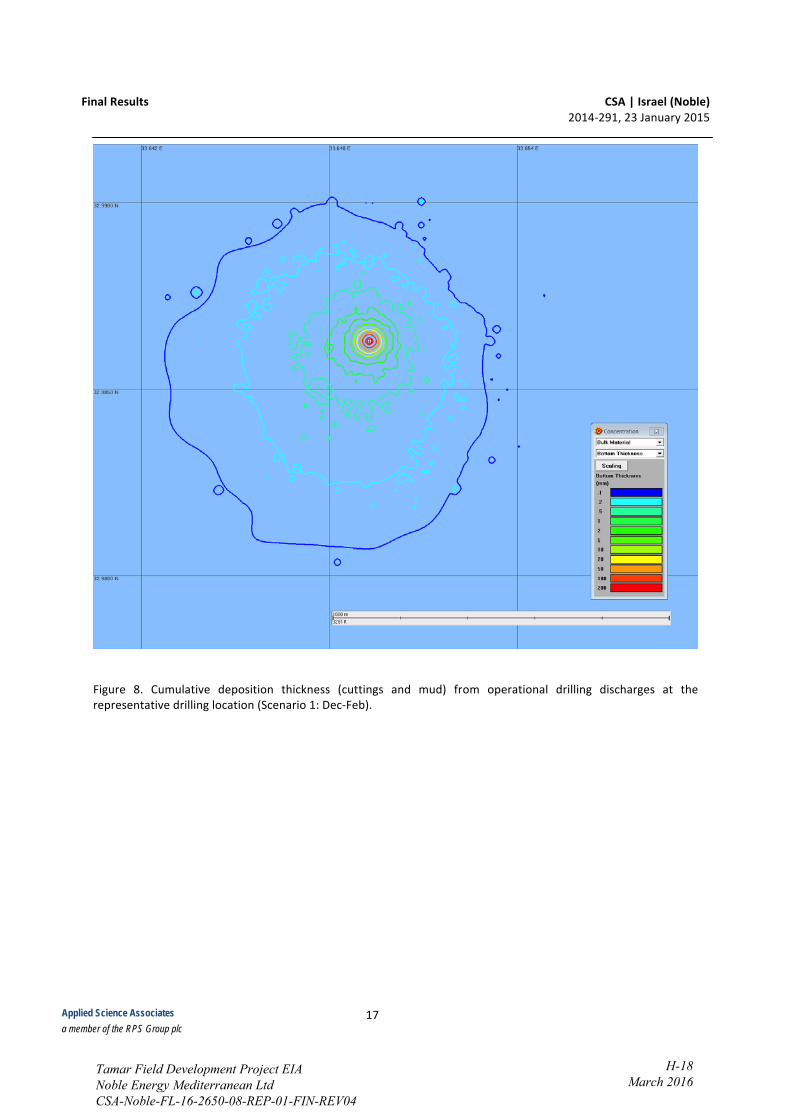
Applied Science Associates a member of the RPS Group plc
Tamar Field Development Project EIANoble Energy Mediterranean LtdCSA-Noble-FL-16-2650-08-REP-01-FIN-REV04
H-18 March 2016

Applied Science Associates a member of the RPS Group plc
Tamar Field Development Project EIANoble Energy Mediterranean LtdCSA-Noble-FL-16-2650-08-REP-01-FIN-REV04
H-19 March 2016
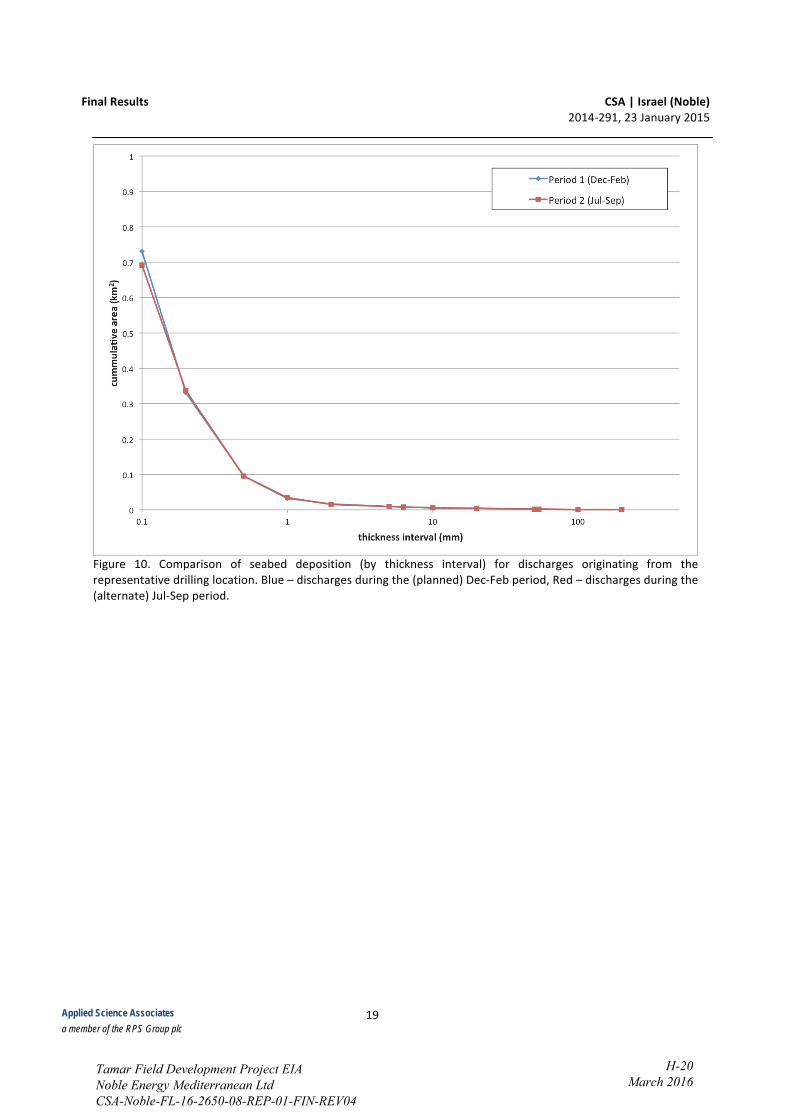
Applied Science Associates a member of the RPS Group plc
Tamar Field Development Project EIANoble Energy Mediterranean LtdCSA-Noble-FL-16-2650-08-REP-01-FIN-REV04
H-20 March 2016
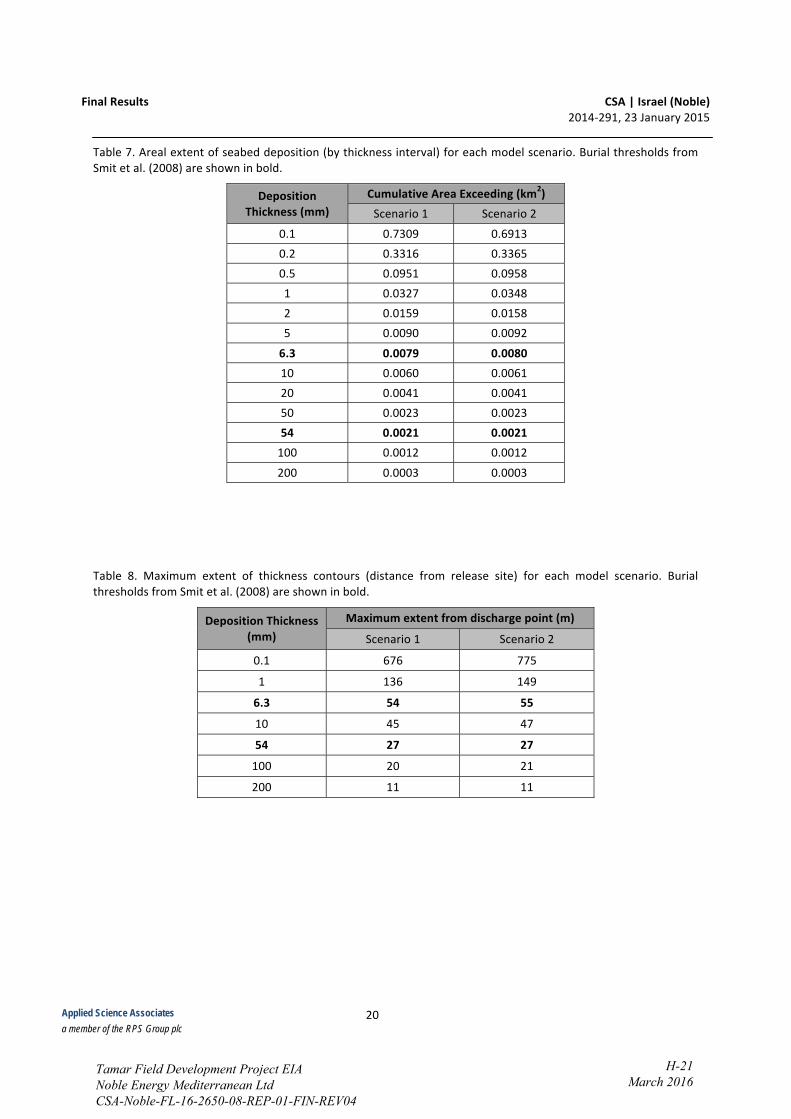
Applied Science Associates a member of the RPS Group plc
Tamar Field Development Project EIANoble Energy Mediterranean LtdCSA-Noble-FL-16-2650-08-REP-01-FIN-REV04
H-21 March 2016
Applied Science Associates a member of the RPS Group plc
4. References
Tamar Field Development Project EIANoble Energy Mediterranean LtdCSA-Noble-FL-16-2650-08-REP-01-FIN-REV04
H-22 March 2016

Applied Science Associates a member of the RPS Group plc
Appendix A: MUDMAP Model Description
Tamar Field Development Project EIANoble Energy Mediterranean LtdCSA-Noble-FL-16-2650-08-REP-01-FIN-REV04
H-23 March 2016
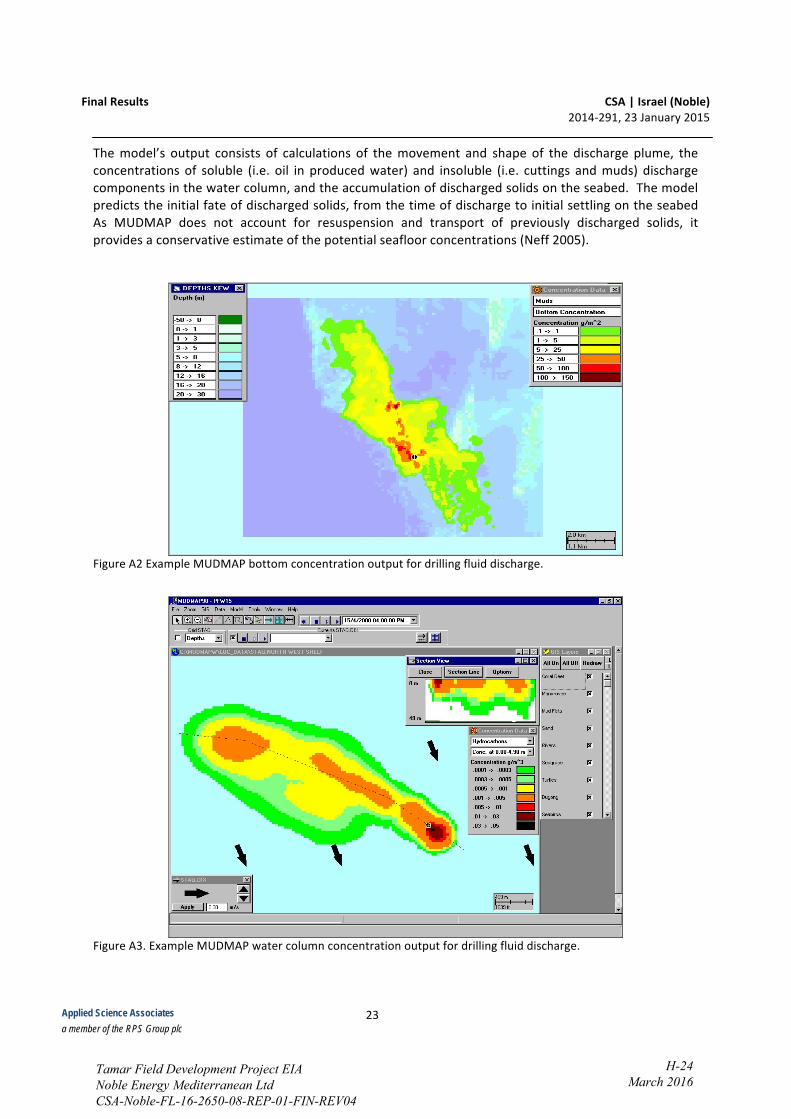
Applied Science Associates a member of the RPS Group plc
Tamar Field Development Project EIANoble Energy Mediterranean LtdCSA-Noble-FL-16-2650-08-REP-01-FIN-REV04
H-24 March 2016

Applied Science Associates a member of the RPS Group plc
Tamar Field Development Project EIANoble Energy Mediterranean LtdCSA-Noble-FL-16-2650-08-REP-01-FIN-REV04
H-25 March 2016

Applied Science Associates a member of the RPS Group plc
Appendix B: Particle Size Measurements of TCC cuttings
Tamar Field Development Project EIANoble Energy Mediterranean LtdCSA-Noble-FL-16-2650-08-REP-01-FIN-REV04
H-26 March 2016
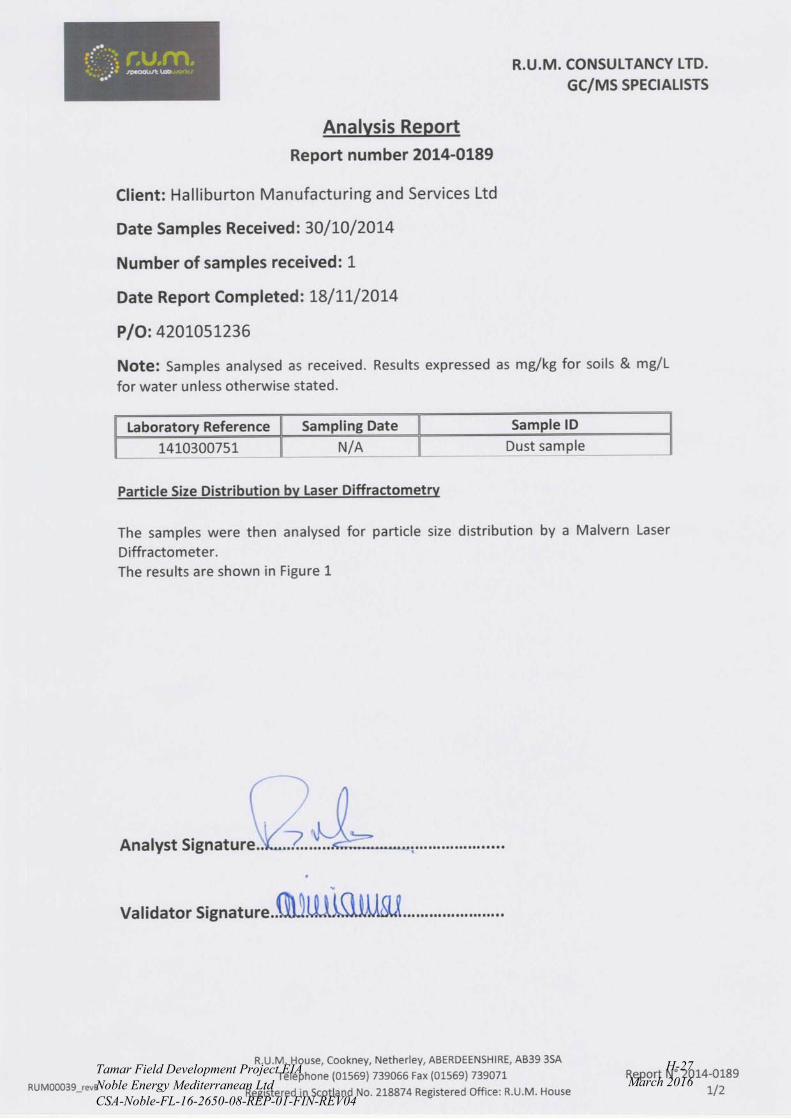
Tamar Field Development Project EIANoble Energy Mediterranean LtdCSA-Noble-FL-16-2650-08-REP-01-FIN-REV04
H-27 March 2016
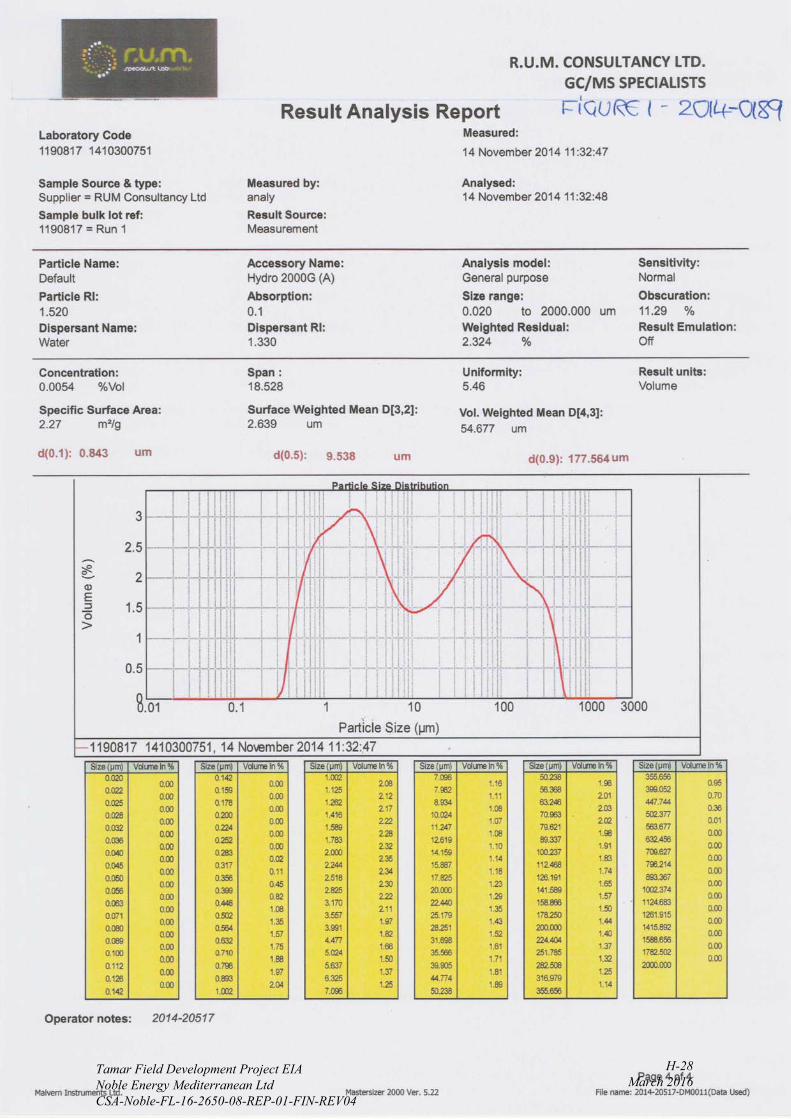
Tamar Field Development Project EIANoble Energy Mediterranean LtdCSA-Noble-FL-16-2650-08-REP-01-FIN-REV04
H-28 March 2016
Tamar Field Development Project EIA I-1 Noble Energy Mediterranean Ltd March 2016 CSA-Noble-FL-16-2650-08-REP-01-FIN-REV04
APPENDIX I
Tamar SW-1 Discharge Permit

State of Israel
Ministry for Environmental Protection
Marine and Coastal Division
17 Tishri. 5774
September 17, 2013
File: Noble Energy - Tamar SW
E-Mail & Registered Mail with Certificate of Delivery
To To
Mr. Lawson Freeman Mrs. Orna Primor
Vice President Environmental Manager
Noble Energy Mediterranean Noble Energy Mediterranean
Re: Noble Energy Mediterranean Limited (NBL) – Marine Discharge Permit (Gas Production)
– Tamar SW-1
1. Attached hereto is Permit No. 59/2013 for Discharging into the Sea (Oil and Gas
Exploration).
2. The contact person in the event of faults and for coordination is Mr. Nir Levinsky, Prevention
of Sea Pollution Supervisor, tel.: 050-6237601, beeper: 03-6106666, subscription no. 52112.
3. Pursuant to Decision No. 107 of the Committee for the Grant of Discharge Permits, the
Recipient of the Permit must publish a notice of receipt of the Permit in two newspapers,
within one month of receipt of the Permit, to the extent set out in sections 8I, 10I and
Appendix A to this Permit.
4. The Permit and the composition of the effluent discharged into the sea will be published on
the website of the Ministry for Environmental Protection at the following address:
www.sviva.gov.il.
5. Following the 2008 amendment of the Prevention of Sea Pollution from Land-Based Sources
Law, 5748-1988, the Commissioner may impose a monetary sanction on a person in breach of
any of the conditions of a permit for discharging into the sea, and for a failure to report as
required under section 4 of this Law.
6. Pursuant to the Prevention of Sea Pollution from Land-Based Sources (Prevention of Sea
Pollution Levy) Regulations, 5771-2011, which came into force on October 1, 2011, all
permit holders shall be required to pay a levy for the effluent / sanitary waste / brine that they
discharge into the sea. This payment shall be made once a quarter, by the 20th of the month,
in the months of: January, April, July and October of each year – for the previous quarter, and
in accordance with instructions that have been published. See sections 8J and 10J of the
Permit.
Yours sincerely,
Dr. Iris Safrai
Commissioner for the Prevention of Sea Pollution
from Industrial Waste
Tamar Field Development Project EIANoble Energy Mediterranean LtdCSA-Noble-FL-16-2650-08-REP-01-FIN-REV04
I-2March 2016

CC:
Mr. David Leffler, Director General, Ministry for Environmental Protection
Mr. Yitshak Ben David, Senior VP Enforcement, Chairman of the Committee for the Granting of
Permits, Ministry for Environmental Protection.
Mr. Rani Amir, Head of the Marine and Coastal Environment Division, here.
Mr. Gadi Binstock, Deputy Head of the Marine and Coastal Environment Division, here.
Dr. Ilan Melster, Commissioner of Prevention of Sea Pollution from Land-Based Sources, here.
Mr. Fred Erzuan, Scientific Center for the Prevention of Sea Pollution, here.
Dr. Dror Zurel, Scientific Center for Maritime Monitoring and Research Plans, here.
Mr. Nir Levinsky, Mrs. Yael Shay, Mr. Gidi Betelheim, Supervisors, Prevention of Sea Pollution,
here.
Coordinator, Reporting and Control Center, here
Mrs. Sefaa Halabi, Coordinator of Levies, here.
Adv. Iris Shalit, Legal Department, Ministry for Environmental Protection
Mr. Alexander Varshavsky, Petroleum Commissioner, Ministry of Energy and Water
Mr. Ilan Nissim, Head of Environment Division, Ministry of Energy and Water
Mr. Elad Levi, Internet Team, Ministry for Environmental Protection.
Tamar Field Development Project EIANoble Energy Mediterranean LtdCSA-Noble-FL-16-2650-08-REP-01-FIN-REV04
I-3March 2016

The Prevention of Sea Pollution from Land-Based Sources Law, 5748-1988.
The Prevention of Sea Pollution from Land-Based Sources Regulations, 5750-1990.
The Committee for the Grant of Permits for the Disposal / Discharging of Waste / Effluent into
the Sea
Permit to Discharge Effluent into the Sea
Updated as at September 17, 2013
Pursuant to the “Procedure No. 8.35 for Convening the Committee for the Grant of Permits for
Discharging into the Sea”, a Permit for the Discharge of Effluent (Exploratory Drilling) into the Sea is
hereby given, as set out below:
1. Permit Number: 59/2013.
2. Name of Recipient of Permit: Noble Energy Mediterranean Ltd., (NBL) Private Company
No. 56-001716-2
Address: 12 Abba Eban Blvd., Herzliya Pituach
Tel: 073-2424275; Fax: 073-2424200
Mr. Lawson Freeman, VP Email: [email protected]
Contact Person:
Mrs. Orna Primor, Environmental Manager
Tel. 073-2424235, Fax: 09-9553410, Mobile: 052-6567443,
email: [email protected]
3. Quantity and Composition of Effluents Permitted to be Pumped into the Sea:
A. Quantity of Effluents: The quantity of the effluents shall be in accordance with the provisions of section 3B
below.
B. Sources of Effluents:
Effluents from the floating ENSCO 5006 floating drilling platform, from the gas
exploration drilling operations from the Tamar SW-1 drilling site, at a drilling depth
of up to approximately 3,630 meters under the seabed, up to 5,300 meters below the
surface of the sea, in accordance with Lease Area I/12 for the Tamar Field, in
accordance with the details below:
(1) Water based drilling mud (WBM) –
Approximately 2,450 tons, approximately 7,200 cubic meters, approximately
43,600 barrels shall be discharged / dumped around the drilling well on the
seabed (stage I) and approximately 1,100 tons, approximately 1,200 cubic
meters, approximately 7,400 barrels will be discharged form the rig (stage II).
Out of a total consumption of approximately 4,240 tons, approximately 8,700
cubic meters, approximately 53,600 barrels;
Total drilling mud for discharge into the sea – approximately 3,550 tons,
approximately 8,400 cubic meters, approximately 51,000 barrels.
At the end of the drilling, the drilling mud from stage II will be discharged at
a capacity of 1,000 barrels per hour, approximately 100 cubic meters per
hour.
(2) Surplus cement - approximately 940 tons consumption (1,200 cubic meters),
Tamar Field Development Project EIANoble Energy Mediterranean LtdCSA-Noble-FL-16-2650-08-REP-01-FIN-REV04
I-4March 2016
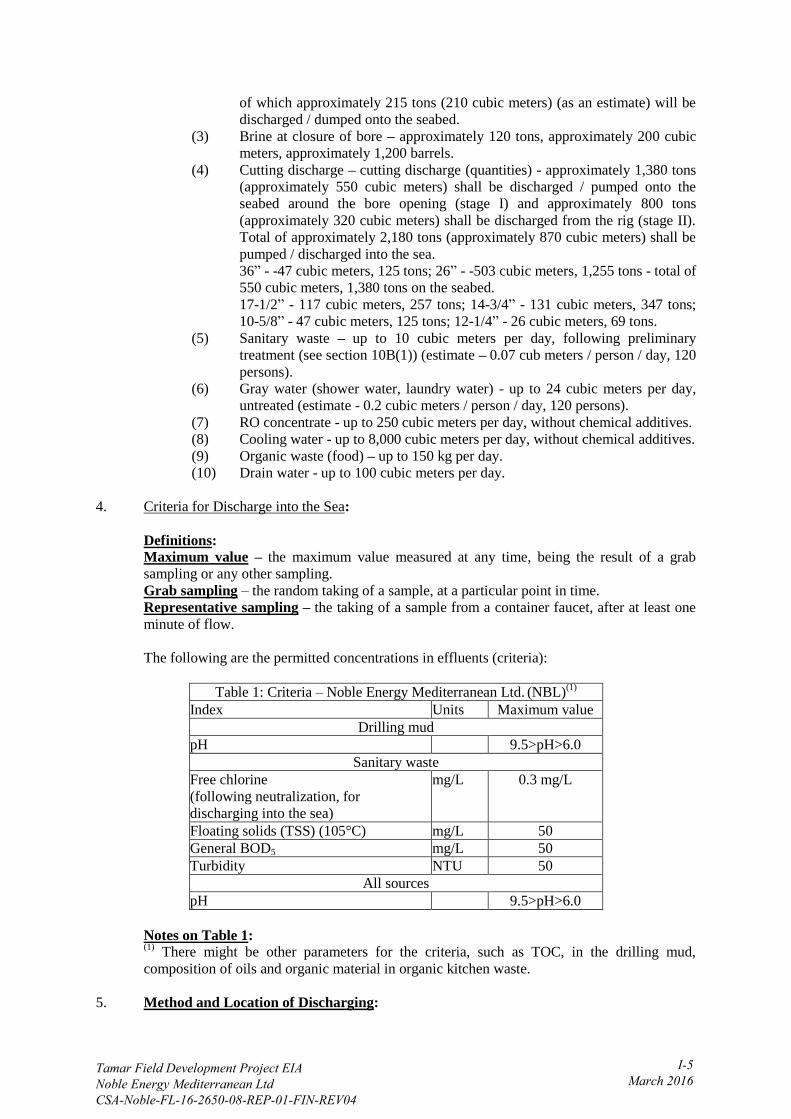
of which approximately 215 tons (210 cubic meters) (as an estimate) will be
discharged / dumped onto the seabed.
(3) Brine at closure of bore – approximately 120 tons, approximately 200 cubic
meters, approximately 1,200 barrels.
(4) Cutting discharge – cutting discharge (quantities) - approximately 1,380 tons
(approximately 550 cubic meters) shall be discharged / pumped onto the
seabed around the bore opening (stage I) and approximately 800 tons
(approximately 320 cubic meters) shall be discharged from the rig (stage II).
Total of approximately 2,180 tons (approximately 870 cubic meters) shall be
pumped / discharged into the sea.
36” - -47 cubic meters, 125 tons; 26” - -503 cubic meters, 1,255 tons - total of
550 cubic meters, 1,380 tons on the seabed.
17-1/2” - 117 cubic meters, 257 tons; 14-3/4” - 131 cubic meters, 347 tons;
10-5/8” - 47 cubic meters, 125 tons; 12-1/4” - 26 cubic meters, 69 tons.
(5) Sanitary waste – up to 10 cubic meters per day, following preliminary
treatment (see section 10B(1)) (estimate – 0.07 cub meters / person / day, 120
persons).
(6) Gray water (shower water, laundry water) - up to 24 cubic meters per day,
untreated (estimate - 0.2 cubic meters / person / day, 120 persons).
(7) RO concentrate - up to 250 cubic meters per day, without chemical additives.
(8) Cooling water - up to 8,000 cubic meters per day, without chemical additives.
(9) Organic waste (food) – up to 150 kg per day.
(10) Drain water - up to 100 cubic meters per day.
4. Criteria for Discharge into the Sea:
Definitions: Maximum value – the maximum value measured at any time, being the result of a grab
sampling or any other sampling.
Grab sampling – the random taking of a sample, at a particular point in time.
Representative sampling – the taking of a sample from a container faucet, after at least one
minute of flow.
The following are the permitted concentrations in effluents (criteria):
Table 1: Criteria – Noble Energy Mediterranean Ltd. (NBL)
(1)
Maximum value Units Index
Drilling mud
9.5>pH>6.0 pH
Sanitary waste
0.3 mg/L mg/L Free chlorine
(following neutralization, for
discharging into the sea)
50 mg/L Floating solids (TSS) (105°C)
50 mg/L General BOD5
50 NTU Turbidity
All sources
9.5>pH>6.0 pH
Notes on Table 1: (1)
There might be other parameters for the criteria, such as TOC, in the drilling mud,
composition of oils and organic material in organic kitchen waste.
5. Method and Location of Discharging:
Tamar Field Development Project EIANoble Energy Mediterranean LtdCSA-Noble-FL-16-2650-08-REP-01-FIN-REV04
I-5March 2016

Location and Site of Discharging: The effluent shall be discharged into the sea from the ENSCO 5006 drilling rig, from the
Tamar SW-1 drilling site, approximately 98 km north west of Haifa - Carmel Head, at a
seabed depth of approximately 1,650 meters.
The Ensco 5006 drilling rig is a floating mobile rig which, when drilling, is anchored to the
seabed via 8 anchors, at a radius of approximately 3,000 meters.
Method of Discharge: * Cutting discharge & drilling mud (WBM) –
During the first stage of drilling, at diameters of 26”, 36” (drilling depth at each stage:
approximately 70 meters, 1,160 meters respectively, total depth of drilling under the seabed –
approximately 1,230 meters), discharge to be directly onto the seabed, around the bore
opening, at a seabed depth of approximately 1,650 meters (estimate – two weeks);
During the second stage of drilling, after installation of the riser and BOP, at diameters of 17-
1/2”, 14-3/4” and 10-5/8” (depth of each drilling stage, approximately 620 meters, 1,045
meters, 735 meters, respectively, total drilling depth beneath the seabed of approximately
3,630 meters), pumping will be from the drilling rig, in an 8” pipe, at a depth of 14 meters
below the surface of the sea (estimate – approximately 80 working days and as set out in the
Supplement Document of August 18, 2013).
Cutting discharge, cement residue and surplus brine; drilling mud – in a uniform expanding
pipe the first part of which is 14” (through which the cutting discharge, cement residue,
drilling mud and surplus brine are pumped), the second part of which increases to 16”
(together with the flow of drilling mud) and the third part increases to 18” (together with the
cooling water), at a depth of 14 meters below the surface of the sea.
Discharge of drilling mud, after installation of the riser, shall only be effected at the end of the
drilling, whilst the cutting discharge (together with the sticky drilling mud residue) shall be
discharged into the sea throughout the duration of the drilling.
At this stage, the drilling mud and the cutting discharge shall be put transferred to the rig, the
drilling mud shall be separated from the cutting discharge via sieves and returned to the
process.
The cutting discharge will be discharged into the sea throughout the drilling process. The
drilling mud shall be discharged into the sea at the end of drilling only, except for discharges
due to operations activities (estimate – 30 to 90 cubic meters per day) and the cement residue
remaining on the discharge (estimate - approximately 40%).
Surplus cement – directly onto the seabed, around the bore opening at the time of installation
of the riser and from the drilling rig via the cutting discharge pipe (above).
* Sanitary waste, gray water, RO concentrate, ground organic waste (food) – 8” pipe at a
depth of 14 meters below the surface of the sea.
* Cooling water – in an 18” pipe, in the same pipe as the cutting discharge, cement residue
and surplus brine, at a depth of 14 meters under the surface of the sea.
* There is a prohibition against discharging or dumping directly onto the seabed, except for
the discharging of drilling mud and cutting discharge during the first stage of drilling, as set
out above and cement surpluses. Any other discharging must be done from the rig only, and
in accordance with the sources approved in this Permit (section 3B of the Permit).
6. Dates of Discharging: In accordance with the needs of the Recipient of the Permit.
7. Means of Monitoring and Control for Examining the Environmental and Health Impacts of
Discharging:
Methods of sampling and analysis shall be in accordance with the latest edition of:
“Standard Methods for the Examination of Water and Waste Water” (SM) edited and
published by APHA-AWWA WPCF, or in accordance with methods approved by the EPA.
The Recipient of the Permit shall conduct the examinations in a laboratory authorized by the
National Laboratory Certification Authority or a laboratory authorized in advance by the
Ministry for Environmental Protection – Marine and Coastal Department.
Tamar Field Development Project EIANoble Energy Mediterranean LtdCSA-Noble-FL-16-2650-08-REP-01-FIN-REV04
I-6March 2016

The Recipient of the Permit shall take samples in accordance with training for the
performance of sampling in accordance with SM.
(1) Monitoring of Effluents Pumped into the Sea: The Recipient of the Permit shall
examine the composition of the effluents in accordance with the following sampling
program:
Table 2 – Tests – Noble Energy Mediterranean Ltd. – Tamar SW
Frequency of Tests (at least) | Type of Tests
1. Drilling mud1
* Toxicity tests(2)
* General BOD5The sampling frequency below has
been determined based on the stages of
drilling and based on the drilling plan
of March 7, 2013.
-
Total of at least 4 samples
* Nitrate as N* TOC
* Nitrite as N* Floating solids (TSS) 105°C
* Ammoniacal Nitrogen as N* Mineral oil (FTIR)
* Kjeldahl nitrogen as N.* General oils and lipids (FTIR)
* General nitrogen (calculated)* PAH
* pH* Phenol
* Total Dissolved Solids (TDS)* Carzol
* Chlorides* DOX (GC)
• Extended metal scan (ICP), including P.
• GCMS, probability percentages, half-quantity concentrations and
total concentrations.
• VOC’s, probability percentages, half-quantity concentrations and
total concentrations.
• Metal content in barite (3)
2. Cutting discharge
* Content of metals: Ag, As, Cd, Cu, Cr, Hg, Ni, Pb, ZnGrab sampling, every 500 meters or in
the event of any significant change in
the underground fraction of the drilling
cross section(4)
* Content of organic material is expressed as TOC.
* Radioactive materials: Ra-226, Ra-228, Th-228, Pb-210(5)
3. Sanitary Waste
* Ammoniacal Nitrogen as N* General BOD5Representative sampling, once a
month, unless otherwise required. * Kjeldahl nitrogen as N.* TOC
* General nitrogen* Floating solids (TSS) 105°C
* General phosphorus* Turbidity
* Fecal coli per 100 mL
* Turbidity - field test – once a
week.
* Enterococci per 100 mL
* Free cholrine – field test, once a
week
* pH* AOX
* Total Dissolved Solids (TDS)* Oils and lipids (FTIR)
* Chlorides* Mineral oil (FTIR)
* Nitrate as N + Nitrite as N
4. Gray water
* Oils and lipids (FTIR)* Floating solids (TSS) 105°CRepresentative sampling, once a
month * Total Dissolved Solids (TDS)* Detergents (MBAS)
5. Ground Organic Waste (Food)
* General oils and lipids (FTIR)* General BODRepresentative sampling, once a
month * General nitrogen* TOC
* General phosphorus* Floating solids (TSS) 105°C
1
Tamar Field Development Project EIANoble Energy Mediterranean LtdCSA-Noble-FL-16-2650-08-REP-01-FIN-REV04
I-7March 2016

6. Quantities
* Daily quantity (for each day of the month), monthly and total
cumulative from the beginning of discharge for each of the sources,
and total discharge into the sea, according to the details set out in
section 3B above and as follows. * Drilling mud – volume quantity
(cubic meters) and mass quantity (dry tons) * Cutting discharge,
cement residue – mass quantity (dry tons)
* Maximum no. of persons on the rig each day (POB)
Quantity, Recording and Reporting Reports shall include details of the
basis for the information – quantity
meter / discharging hours / etc.
(including an explanation).
Notes on Table 2: (1)
The results of the tests are to be submitted in units of mass per volume (milligrams
per liter) except in tests of barite and cutting discharge.
The results of the tests for drilling mud will be submitted in units of mass per volume
(mg/L) and in units of dry mass (mg/kg dry material).
The results of the tests will be submitted noting the depth of the drilling beneath the
seabed and beneath the surface of the sea, the diameter of the drilling segment, at the
time of sampling. (2)
A toxicity test is to be conducted in a test lasting 96 hours in accordance with the
general permissions of the National Pollutant Discharge Elimination System
(NPDES) for existing and new sources in the sea, under the sub-category of
extraction and removal of oil and gas for the western portion of the coastal threshold
of the Gulf of Mexico (29000GMG), or any other pre-approved and relevant protocol.
The test will be conducted in an authorized laboratory overseas, subject to the
presentation of approval of the authorization of the laboratory, and in accordance with
the instructions of the Marine and Coastal Division. (3)
The recipient of the Permit shall conduct metal content tests on the barite, taking a
representative sample from the raw material as follows:
Cd and Hg content (AA, at a sensitivity of at least 0.1 mg / kg at least) – once a
month (at least three tests: At the start of the drilling, in the middle of the drilling and
at the end of the drilling, using the method and sensitivity set out above).
Metal content: Ag, As, Cd, Cu, Cr, Hg, Ni, Pb, Zn, – once every three months. (4)
The tests shall be performed on the cutting discharge, following normalization (where
possible) of the sticky drilling mud for the cutting discharge.
(2) Monitoring of Marine Environment:
A. The Recipient of the Permit shall monitor the marine environment up to six
weeks after the end of drilling, in accordance with a plan approved in
advance by the Marine and Coastal Division, and shall report as required (see
section 8H below).
B. The monitoring operations shall include the monitoring of physical, chemical
and biological variables, in accordance with the document of instructions for
monitoring and the approved plan, and in addition, photographs and sampling
of the seabed, in the area of the drilling affected by the operations done
during the first stage, in which the drilling mud together with the cutting
discharge and cement residue is discharged directly onto the seabed, and not
returned for treatment and separation on the drilling rig (bore diameters of
26”, 36”). The information shall include a description of the height of the
heap and an assessment of the area affected by coverage.
C. The recipient of the Permit shall apply to arrange a meeting for a
presentation and discussion of the results of the findings of the monitoring,
within one month of the date of submission of the summary report.
8. Reporting to the Committee:
A. The Recipient of the Permit shall submit the reports set out below by electronic mail
to the Marine and Coastal Department at the Ministry for Environmental Protection,
Tamar Field Development Project EIANoble Energy Mediterranean LtdCSA-Noble-FL-16-2650-08-REP-01-FIN-REV04
I-8 March 2016
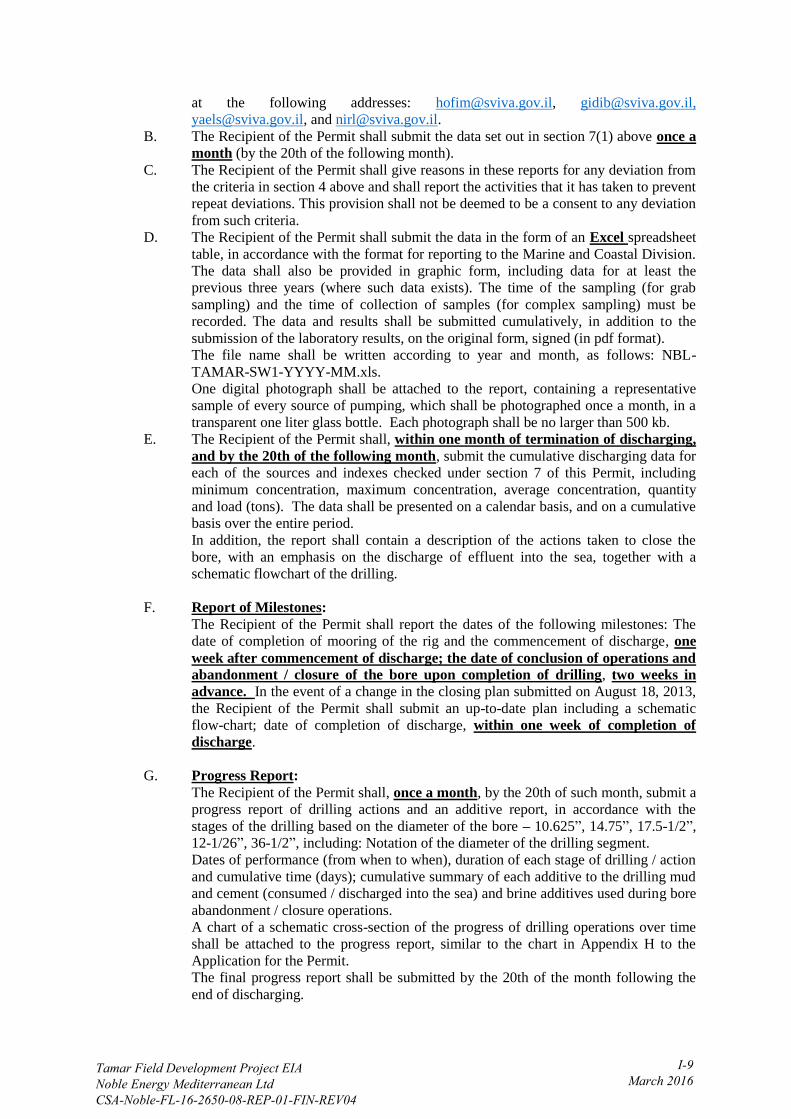
at the following addresses: [email protected], [email protected],
[email protected], and [email protected].
B. The Recipient of the Permit shall submit the data set out in section 7(1) above once a
month (by the 20th of the following month).
C. The Recipient of the Permit shall give reasons in these reports for any deviation from
the criteria in section 4 above and shall report the activities that it has taken to prevent
repeat deviations. This provision shall not be deemed to be a consent to any deviation
from such criteria.
D. The Recipient of the Permit shall submit the data in the form of an Excel spreadsheet
table, in accordance with the format for reporting to the Marine and Coastal Division.
The data shall also be provided in graphic form, including data for at least the
previous three years (where such data exists). The time of the sampling (for grab
sampling) and the time of collection of samples (for complex sampling) must be
recorded. The data and results shall be submitted cumulatively, in addition to the
submission of the laboratory results, on the original form, signed (in pdf format).
The file name shall be written according to year and month, as follows: NBL-
TAMAR-SW1-YYYY-MM.xls.
One digital photograph shall be attached to the report, containing a representative
sample of every source of pumping, which shall be photographed once a month, in a
transparent one liter glass bottle. Each photograph shall be no larger than 500 kb.
E. The Recipient of the Permit shall, within one month of termination of discharging,
and by the 20th of the following month, submit the cumulative discharging data for
each of the sources and indexes checked under section 7 of this Permit, including
minimum concentration, maximum concentration, average concentration, quantity
and load (tons). The data shall be presented on a calendar basis, and on a cumulative
basis over the entire period.
In addition, the report shall contain a description of the actions taken to close the
bore, with an emphasis on the discharge of effluent into the sea, together with a
schematic flowchart of the drilling.
F. Report of Milestones:
The Recipient of the Permit shall report the dates of the following milestones: The
date of completion of mooring of the rig and the commencement of discharge, one
week after commencement of discharge; the date of conclusion of operations and
abandonment / closure of the bore upon completion of drilling, two weeks in
advance. In the event of a change in the closing plan submitted on August 18, 2013,
the Recipient of the Permit shall submit an up-to-date plan including a schematic
flow-chart; date of completion of discharge, within one week of completion of
discharge.
G. Progress Report:
The Recipient of the Permit shall, once a month, by the 20th of such month, submit a
progress report of drilling actions and an additive report, in accordance with the
stages of the drilling based on the diameter of the bore – 10.625”, 14.75”, 17.5-1/2”,
12-1/26”, 36-1/2”, including: Notation of the diameter of the drilling segment.
Dates of performance (from when to when), duration of each stage of drilling / action
and cumulative time (days); cumulative summary of each additive to the drilling mud
and cement (consumed / discharged into the sea) and brine additives used during bore
abandonment / closure operations.
A chart of a schematic cross-section of the progress of drilling operations over time
shall be attached to the progress report, similar to the chart in Appendix H to the
Application for the Permit.
The final progress report shall be submitted by the 20th of the month following the
end of discharging.
Tamar Field Development Project EIANoble Energy Mediterranean LtdCSA-Noble-FL-16-2650-08-REP-01-FIN-REV04
I-9 March 2016
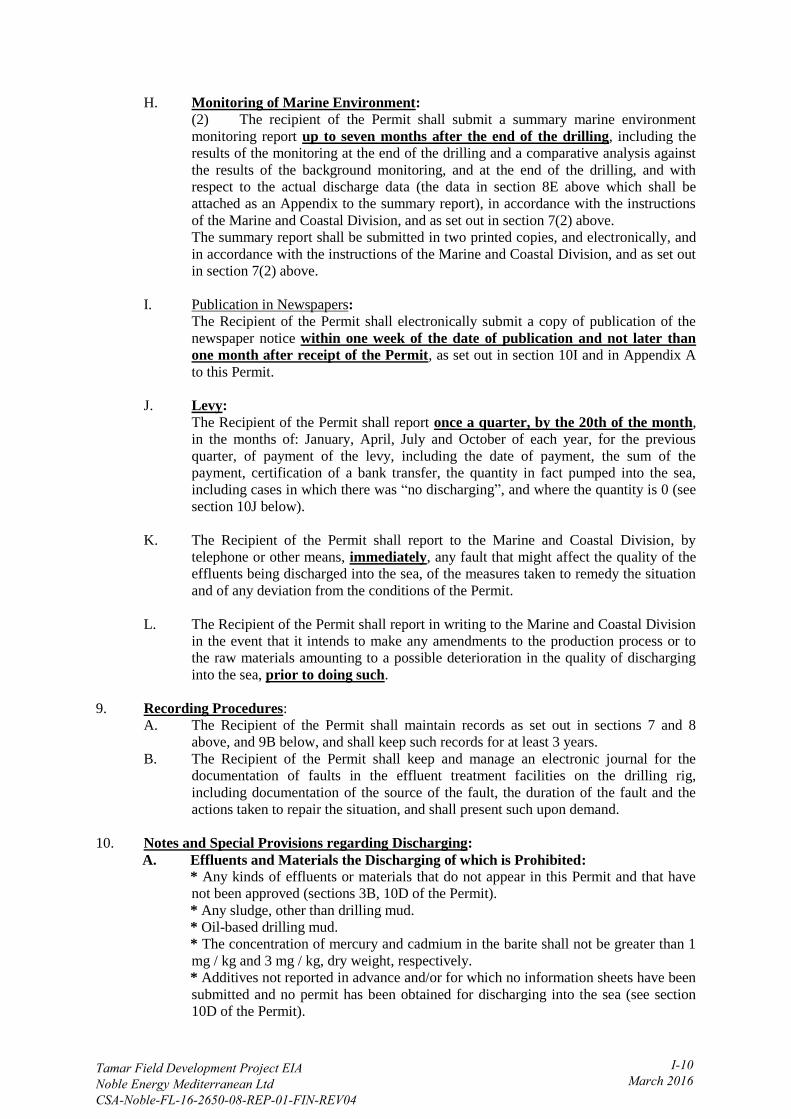
H. Monitoring of Marine Environment:
(2) The recipient of the Permit shall submit a summary marine environment
monitoring report up to seven months after the end of the drilling, including the
results of the monitoring at the end of the drilling and a comparative analysis against
the results of the background monitoring, and at the end of the drilling, and with
respect to the actual discharge data (the data in section 8E above which shall be
attached as an Appendix to the summary report), in accordance with the instructions
of the Marine and Coastal Division, and as set out in section 7(2) above.
The summary report shall be submitted in two printed copies, and electronically, and
in accordance with the instructions of the Marine and Coastal Division, and as set out
in section 7(2) above.
I. Publication in Newspapers:
The Recipient of the Permit shall electronically submit a copy of publication of the
newspaper notice within one week of the date of publication and not later than
one month after receipt of the Permit, as set out in section 10I and in Appendix A
to this Permit.
J. Levy:
The Recipient of the Permit shall report once a quarter, by the 20th of the month,
in the months of: January, April, July and October of each year, for the previous
quarter, of payment of the levy, including the date of payment, the sum of the
payment, certification of a bank transfer, the quantity in fact pumped into the sea,
including cases in which there was “no discharging”, and where the quantity is 0 (see
section 10J below).
K. The Recipient of the Permit shall report to the Marine and Coastal Division, by
telephone or other means, immediately, any fault that might affect the quality of the
effluents being discharged into the sea, of the measures taken to remedy the situation
and of any deviation from the conditions of the Permit.
L. The Recipient of the Permit shall report in writing to the Marine and Coastal Division
in the event that it intends to make any amendments to the production process or to
the raw materials amounting to a possible deterioration in the quality of discharging
into the sea, prior to doing such.
9. Recording Procedures:
A. The Recipient of the Permit shall maintain records as set out in sections 7 and 8
above, and 9B below, and shall keep such records for at least 3 years.
B. The Recipient of the Permit shall keep and manage an electronic journal for the
documentation of faults in the effluent treatment facilities on the drilling rig,
including documentation of the source of the fault, the duration of the fault and the
actions taken to repair the situation, and shall present such upon demand.
10. Notes and Special Provisions regarding Discharging:
A. Effluents and Materials the Discharging of which is Prohibited: * Any kinds of effluents or materials that do not appear in this Permit and that have
not been approved (sections 3B, 10D of the Permit).
* Any sludge, other than drilling mud.
* Oil-based drilling mud.
* The concentration of mercury and cadmium in the barite shall not be greater than 1
mg / kg and 3 mg / kg, dry weight, respectively.
* Additives not reported in advance and/or for which no information sheets have been
submitted and no permit has been obtained for discharging into the sea (see section
10D of the Permit).
Tamar Field Development Project EIANoble Energy Mediterranean LtdCSA-Noble-FL-16-2650-08-REP-01-FIN-REV04
I-10 March 2016
B. Pre-Treatment – sanitary effluent / food waste: (1) The Recipient of the Permit shall routinely and continuously operate the
sanitary effluent treatment facilities (2 Omni-pure 12 MC units for electro-
chemical treatment, to generate hypochlorite for oxidation and disinfection)
and shall keep the facilities in good condition at all times and to the extent
required in order to comply with the criteria. Free chlorine shall be tested
with a free chlorine meter prior to being discharged, in compliance with the
criteria.
(2) The Recipient of the Permit shall discharge the organic waste (food) into the
sea on condition that it has been ground and that it can pass through a sieve,
the size of the holes in which is not greater than 25 square millimeters, and
following collection and separation of oils in the kitchen of the rig, and
removal thereof to an authorized site on land.
C. Work Procedures:
(1) The Recipient of the Permit shall implement work procedures which shall
include detailed instructions for the treatment of faults that might cause
deviations from the criteria set out in section 4 above.
(2) The Recipient of the Permit shall keep record and documentation on the rig
of any removal effected from the rig including date, the party performing the
work, the quantity and destination of the removal, including maintenance,
recording and updating of the oil book and the waste book, in accordance
with Annex 1 and Annex 5 to MARPOL, respectively. In the event of
removal to the shore using a different vessel / service ship, the Recipient of
the Permit shall leave a true copy on the rig, stamped by the service ship
which effected actual removal to the shore.
(3) The Recipient of the Permit shall make the work procedures and the oil book
and the waste book available at all times and shall update them as necessary,
and shall submit them to the Marine and Coastal Department, upon demand.
D. Additives: Any alteration or addition of materials to the list of drilling mud materials and
additives in general for discharging into the sea shall require prior notice, together
with information sheets (MSDS), an explanation and details of quantities, and the
obtaining of the prior consent of the Marine and Coastal Department.
E. Use of detergents and cleaning agents
The Recipient of the Permit shall exclusively use only biodegradable cleaning agents
and detergents suitable for seawater.
F. Additional Tests: A supervisor shall be entitled to take up to four random samples a year of brines, and
to submit such for testing in an authorized external laboratory (authorized by the
Laboratory Certification Authority) at the expense of the Recipient of the Permit.
G. Compliance with Conditions of Permit: * Failure to comply with the conditions of the Permit might give rise to cancellation
of the Permit and/or to the issue of a termination order for the prevention or reduction
of sea pollution.
* Under section 11 of the Prevention of Sea Pollution from Land-Based Sources Law,
5748-1988, a business license or other license for the running or establishment of a
business shall be conditional upon compliance with the provisions of the Law.
* The failure to comply with the conditions of this Permit constitutes an offense
under the Prevention of Sea Pollution from Land-Based Sources Law, and under the
Business Licensing Law. Likewise, the Commissioner may impose a monetary
Tamar Field Development Project EIANoble Energy Mediterranean LtdCSA-Noble-FL-16-2650-08-REP-01-FIN-REV04
I-11 March 2016

sanction on the breach of any of the conditions of this Permit.
H. Closure / Abandonment of Drilling Bore: The Recipient of the Permit shall implement the plan for closure or abandonment of
the drilling bore in such a way as to ensure that the bore is fully sealed, without any
leakage into the marine environment.
The Recipient of the Permit shall be responsible for performing the abandonment /
bore closing actions, subject to a plan approved in advance by the Commissioner at
the Ministry of Energy & Water and shall present such upon request, and shall take
care to ensure the doing of any actions required to amend or prevent environmental
damage that may arise as a result of the drilling, prior to the abandonment / closure or
thereafter.
I. Publication in Newspapers: The Recipient of the Permit shall publish a notice of receipt of the Permit in two
newspapers – a national newspaper and a local newspaper relevant to the pumping
site, within one month of the date of receipt of the Permit, as set out in Appendix
A to the Permit, and shall report as required (section 8I above, Appendix A to the
Permit).
J. Discharging Levy: The Recipient of the Permit shall pay the discharge levy once a quarter, by the 20th
of the month, in the months of: January, April, July and October of each year – for
the previous quarter (see section 8J above).
K. Factory Emergency Plan (FEP): The Recipient of the Permit shall act in accordance with a factory emergency plan
(LEP) in handling incidents of sea pollution by oil (extreme scenario), approved by
the Marine and Coastal Division, as a condition of the Discharge Permit.
L. Remarks:
* The Permit shall not stand in place of any other approval required by any law.
* The term of the Permit (section 11 below) takes into account four months of actual
discharge and the date of submission of the summary marine environment monitoring
report at the end of the drilling (section 8H above).
M. Renewal of Permit: In the event that the Recipient of the Permit wishes to renew the Discharge Permit, it
shall submit a request to renew the permit, including electronically, two months prior
to the end of the term of the Permit.
11. Validity of Permit: Up until October 31, 2014, up to four months of actual discharge.
September 17, 2013
Date Signature
Yitshak Ben David
Senior VP Enforcement
Chairman of the Committee for the Granting of Permits
Tamar Field Development Project EIANoble Energy Mediterranean LtdCSA-Noble-FL-16-2650-08-REP-01-FIN-REV04
I-12 March 2016

State of Israel
Ministry for Environmental Protection
Marine and Coastal Division
Appendix A
Publication of Permits in Newspapers
Publication of Notice in Newspapers regarding Receipt of Permit for Discharging / Dumping in the
Sea
1. The Permit shall be published in a national and a local newspaper (relevant to the discharge
site).
2. Overall size of notice: 10.5 x 10.5 cm.
3. The following shall appear: The name of the business (discharging into the sea) and the
number of the Permit granted, in 16 point font.
4. The following shall appear: The method of discharging and the location thereof, in 12 point
font.
5. The following shall appear: Where the details of the Permit can be inspected (the website of
the Ministry for Environmental Protection), in 12 point font.
6. The following shall appear: The name of the owner of the Permit and the town in which the
business discharging into the sea is situated, in 11 point font.
7. The notice shall be published within one month of the date of receipt of the Permit.
8. The notifying party shall provide a copy of the notice from the newspapers by electronic
means to the Marine and Coastal Department, within one week of the date of publication.
9. The Recipient of the Permit shall be entitled to request an exemption from publication of the
Permit from the Committee, subject to the submission of a detailed request in writing to the
Chairman of the Committee, within one week of receipt of the Permit.
The following is an example:
Notice by Recipient of Permit
Sea Cucumber Canning
Discharge Permit No. 123/2010
Recipient of Permit – Sea Cucumber Canning Ltd. – Kiryat Abba
Company No. 57-12345678
Method and Location of Discharging:
[For example]
The discharging shall be effected via an 800 meter long marine
pipe in Coconut Bay, in the quantities and qualities set out in the
Discharge Permit.
The discharging shall be effected via the Alexandria brine removal
terminal, in the quantities and qualities set out in the Discharge
Permit.
The Discharge Permit may be viewed on the website of the
Ministry for Environmental Protection: www.sviva.gov.il.
Tamar Field Development Project EIANoble Energy Mediterranean LtdCSA-Noble-FL-16-2650-08-REP-01-FIN-REV04
I-13 March 2016
Tamar Field Development Project EIA J-1 Noble Energy Mediterranean Ltd March 2016 CSA-Noble-FL-16-2650-08-REP-01-FIN-REV04
APPENDIX J
Toxicity Testing Report
A REVIEW OF TOXICITY TESTING EVALUATING APPLICABILITY OF INDIGENOUS AND FOREIGN TEST SPECIES
INTRODUCTION Toxicity testing has been used for several decades as a tool for researchers to evaluate the effects of contaminants in both aquatic and terrestrial environments. The techniques were standardized and adopted in the 1980’s in the U.S. as a tool for the Environmental Protection Agency (EPA) to monitor effluents from a wide range to municipal and industrial dischargers as a way to establish water quality limits to meet the goals of the Clean Water Act. In the early 1990’s, the EPA began requiring testing of discharges from offshore drilling operations to limit the discharge of toxic materials into the marine environment. The use of toxicity testing to monitor offshore oil and gas operations has subsequently been adopted by numerous countries and are now widely applied in areas such as the North Sea, Canada, Australia, and South America. Toxicity testing can be done for both individual compounds as well as complex mixtures (Whole Effluents) of contaminants. Single component tests are useful to establish the relative toxicity of a single compound compared whereas complex mixture testing (Whole Effluent Toxicity tests – WET) measures the toxicity of multiple compounds in a mixture. The single chemical tests are useful to manufacturers who are looking to develop compounds that will have the lowest possible toxicity to the environment when used or discharged. Most municipal and industrial discharges are a complex mixture of chemicals in which toxicities of individual compounds are difficult to distinguish. In some cases, more than one chemical can contribute to a discharges toxicity. This is particularly important where additive and/or synergistic toxicity can be manifested in complex mixtures. In such cases, numerical standards by themselves do not provide sufficient protection. The toxicity tests allow for such discharges to be evaluated and compared to other similar types of discharges where contaminant concentrations can vary depending on chemical usage and other conditions of use. Over the years, the offshore oil and gas industry has conducted extensive research and product development to be able to produce the least harmful products for use in its operations. This has resulted from such programs as REACH (Registration, Evaluation and Authorization of Chemicals) which focuses on development of products that have low toxicity, are readily biodegradable and do not bioaccumulate. Through the CHARM process, products used in the industry are given rankings with regards to their suitability for use and discharge offshore. Toxicity testing is a major tool in the development of these rankings. Noble is being requested to perform toxicity testing in conjunction with its drilling and production operations in Israel. At this point in time, there are no existing laboratories in Israel that have the needed facilities, resources or training to conduct such tests. As a result, it will be necessary to utilize laboratories outside Israel for such tests. Noble’s intent will be to contract with laboratories in the United States to perform the needed testing. This document describes the proposed tests and their applicability to the Israel offshore environment. METHODOLOGY Use of acute and sublethal endpoints for assessment of contaminant risk is not unique to toxicity testing with either water or sediments. Many international regulatory programs
Tamar Field Development Project EIANoble Energy Mediterranean LtdCSA-Noble-FL-16-2650-08-REP-01-FIN-REV04
J-2 March 2016

require the use of either acute or sublethal endpoints in their decision-making processes. In the U.S., these programs are adopted to achieve (1) Water Quality Criteria (and State Standards); (2) National Pollution Discharge Elimination System (NPDES) effluent monitoring (including chemical-specific limits and sublethal endpoints in toxicity tests); (3) Federal Insecticide, Rodenticide and Fungicide Act (FIFRA) and the Toxic Substances Control Act (TSCA, tiered assessment includes several sublethal endpoints with fish and aquatic invertebrates); and under the (4) Superfund (Comprehensive Environmental Responses, Compensation and Liability Act; CERCLA). Internationally, this regulatory tool is applied through the Organization of Economic Cooperation and Development (OECD, sublethal toxicity testing with fish and invertebrates); the European Economic Community (EC, acute and sublethal toxicity testing with fish and invertebrates); and the Paris Commission (behavioral endpoints). In 1995 OSPAR adopted a Harmonised Offshore Chemical Notification Format (HOCNF) as a first step towards a harmonised mandatory control system for the use and the reduction of the discharge of offshore substances/preparations. Table 1 references the methodologies that have adopted for performance of the tests. Table 1. Summary of standardized toxicity testing methods which have been implemented around the world for both regulatory and research testing of discharged chemicals in marine environments. Organization Test Reference OSPAR A Sediment Bioassay
Using an Amphipod Corophium sp Protocol for a Fish Acute Toxicity Test
Protocols on Methods for the Testing of Chemicals Used in the Offshore Oil Industry (reference number: 2005-11 (a revised version of agreement 1995-07)) ISO 16712 / OSPAR 2006 OSPAR 2006
ISO Growth Inhibition Test Using the Marine Alga Skeletonema costatum Acute Toxicity Test Using the Marine Copepod Acartia tonsa
ISO/DIS 10253 ISO 14669
OECD Harpacticoid Copepod Development and Reproduction Test with Amphiascus tenuiremis RECOMMENDED SPECIES:
Draft New Guidance Document, December 2013
Tamar Field Development Project EIANoble Energy Mediterranean LtdCSA-Noble-FL-16-2650-08-REP-01-FIN-REV04
J-3 March 2016
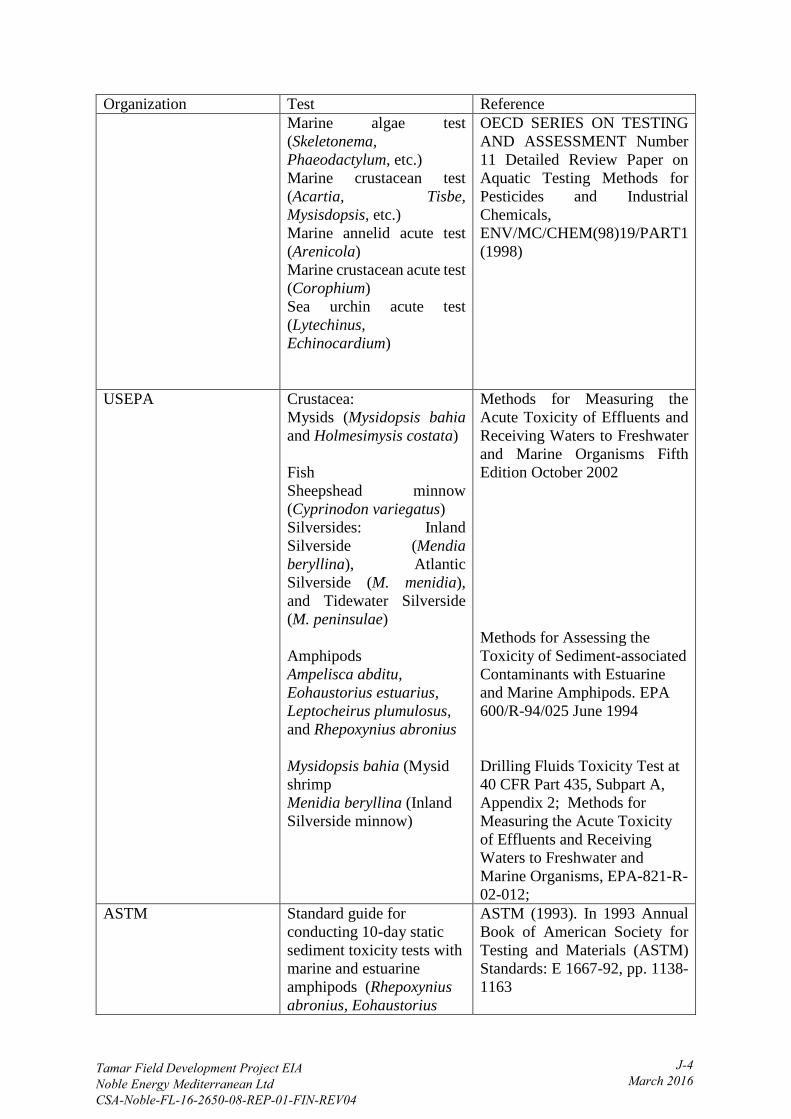
Organization Test Reference Marine algae test (Skeletonema, Phaeodactylum, etc.) Marine crustacean test (Acartia, Tisbe, Mysisdopsis, etc.) Marine annelid acute test (Arenicola) Marine crustacean acute test (Corophium) Sea urchin acute test (Lytechinus, Echinocardium)
OECD SERIES ON TESTING AND ASSESSMENT Number 11 Detailed Review Paper on Aquatic Testing Methods for Pesticides and Industrial Chemicals, ENV/MC/CHEM(98)19/PART1 (1998)
USEPA Crustacea: Mysids (Mysidopsis bahia and Holmesimysis costata) Fish Sheepshead minnow (Cyprinodon variegatus) Silversides: Inland Silverside (Mendia beryllina), Atlantic Silverside (M. menidia), and Tidewater Silverside (M. peninsulae) Amphipods Ampelisca abditu, Eohaustorius estuarius, Leptocheirus plumulosus, and Rhepoxynius abronius Mysidopsis bahia (Mysid shrimp Menidia beryllina (Inland Silverside minnow)
Methods for Measuring the Acute Toxicity of Effluents and Receiving Waters to Freshwater and Marine Organisms Fifth Edition October 2002 Methods for Assessing the Toxicity of Sediment-associated Contaminants with Estuarine and Marine Amphipods. EPA 600/R-94/025 June 1994 Drilling Fluids Toxicity Test at 40 CFR Part 435, Subpart A, Appendix 2; Methods for Measuring the Acute Toxicity of Effluents and Receiving Waters to Freshwater and Marine Organisms, EPA-821-R-02-012;
ASTM Standard guide for conducting 10-day static sediment toxicity tests with marine and estuarine amphipods (Rhepoxynius abronius, Eohaustorius
ASTM (1993). In 1993 Annual Book of American Society for Testing and Materials (ASTM) Standards: E 1667-92, pp. 1138-1163
Tamar Field Development Project EIANoble Energy Mediterranean LtdCSA-Noble-FL-16-2650-08-REP-01-FIN-REV04
J-4 March 2016
Organization Test Reference estuarius, Ampelisca abdita, Grandidierella japonica , and Leptocheirus plumulosus)
In general, it is clear that the accepted testing protocols have been developed such that there are standardized procedures across all regulatory regimes. The procedures tend to focus on species that primarily focus on well-known invertebrate and well-studied fish species. TEST STRATEGIES AND OBJECTIVES While toxicity testing has generally been accepted worldwide as a means to evaluate and regulate the discharge of materials in fresh and marine waters, the objectives of such testing in different regulatory regimes has different application strategies. In the North Sea, OSPAR adopted the Harmonised Mandatory Control System (HMCS) as a way to reduce the discharge of offshore chemicals across the Northeast Atlantic region. The objective of the HMCS is akin to an upfront approach to protect the marine environment by identifying those chemicals used in offshore oil and gas operations with the potential for causing an adverse environmental impact (Payne and Thatcher, undated), and restricting their use and discharge to the sea. This is generally done by using the toxicity testing in combination with tests that rank hazards of the individual chemical according to its persistence in the environment and tendency to bioaccumulate. This approach has led to the development of the CHARM assessment where chemicals are graded by color according to their persistence, bioaccumulation and toxicity (PBT) characteristics. Through this approach it is possible to regulate toxic chemicals at their source in terms of acceptability for discharge into the environment. In Norway, further development of this approach led to the development of the DREAM Model (Rye et al 2006) which uses toxicity data based on the PEC (Predicted Environmental Concentration)/PNEC (Predicted No Effect Concentration) to calculate an EIF (Environmental Impact Factor) for the individual components contained in a discharge. This measure provides an estimate of risk from discharges of these effluents. In the Gulf of Mexico, the U.S. Environmental Protection Agency (USEPA) regulates all offshore discharges from the oil and gas industry through a General Permit (USEPA 2012) which requires frequent toxicity testing during drilling operations and on produced water discharges from production operations. Because these discharges are usually complex mixtures of chemicals, the Agency chose to regulate the discharges at the “end of the pipe” as a means to monitor discharges that could be affected by additive or synergistic effects through toxicity limits. Bioassays of whole drilling fluids permit the assessment of potential effects of materials actually discharged from drilling operations. Research has shown that bioassay test results for individual components might be considerably different from bioassay test results obtained on those same components in an actual drilling fluid (Sprague and Logan, 1979). The General Permit, therefore, is used to monitor complex mixtures as opposed to single compounds. Toxic discharges are prohibited under this scenario. This is an approach that is also used in many other areas of the world. By comparison, the Gulf of Mexico and North Sea strategies provide obvious near term and long term benefits to meeting environmental objectives. Through the North Sea approach, the industry has been incentivized to develop the most environmentally friendly products for use
Tamar Field Development Project EIANoble Energy Mediterranean LtdCSA-Noble-FL-16-2650-08-REP-01-FIN-REV04
J-5 March 2016

in the drilling and production of hydrocarbon resources. This has led to the development of low toxicity products being available for use in the offshore operations. Because of the regulatory that exists today, operators are incentivized to use products that meet REACH and/or CHARM criteria. When the Gulf of Mexico approach is used in conjunction with products that have low toxicity CHARM or REACH rankings, the highest level of environmental protection is applied. While environmental protection is applied in the selection of products for use offshore, the real time toxicity testing also provides monitoring to insure no unintended toxicity is introduced into the ongoing operations. If such risk exists, immediate mitigation can be applied to reduce impacts. Table 2 compares the test parameters between OSPAR and Gulf of Mexico. While these differences are most evident in the length of the test, the actual test procedures themselves follow fairly similar protocols. However, the protocols established under the USEPA General Permit system for the Gulf of Mexico are specific for the testing of produced water, drilling muds, and drill cuttings with attached muds during actual operations. By comparison, the OSPAR guidelines are in general designed for the testing of single compounds that are present in a discharge with the intent to develop an estimate of risk associated with the specific contaminant. These data are used in conjunction with tests to characterize biodegradability and bioaccumulation potential of individual products to establish a risk model for discharges. Table 2. Comparison of test conditions between OSPAR and Gulf of Mexico.
TEST OSPAR Gulf of Mexico Alga S. costatum - 72 hr EC50 Not required Invertebrate A. tonsa - 48 hr LC50 M. bahia
96 hr LC 50 – drill muds 7 day NOEC – Produced water
Fish S. maximus – 96 hr LC50 M. beryllina
7 day NOEC – Produced water
Sediment Corophium volutator - 10
day LC50 Leptocheirus plumulosus – 96 hr LC50 – Drill cuttings 10 day LC50 – Base fluid
TEST SPECIES SELECTION There is general agreement among researchers as to the criteria to be used to select toxicity test species. For example, in its Standard Method for sediment toxicity testing for estuarine and marine invertebrates, the ASTM (2014) used the following criteria were considered when selecting test: (1) have a toxicological database demonstrating relative sensitivity to a range of contaminants of interest in sediment, (2) have a database for interlaboratory comparisons of procedures (for example, round-robin studies), (3) be in direct contact with sediment, (4) be readily available from culture or through field collection, (5) be easily maintained in the laboratory, (6) be easily identified, (7) be ecologically or economically important, (8) have a broad geographical distribution, be indigenous (either present or historical) to the site being evaluated, or have a niche similar to organisms of concern (for example, similar feeding guild or behavior to the indigenous organisms), (9) be tolerant of a broad range of sediment physico-
Tamar Field Development Project EIANoble Energy Mediterranean LtdCSA-Noble-FL-16-2650-08-REP-01-FIN-REV04
J-6 March 2016
chemical characteristics (for example, grain size), and (10) be compatible with selected exposure methods and endpoints. Ultimately, it was decided that a database demonstrating relative sensitivity to contaminants, contact with sediment, ease of culture in the laboratory or availability for field-collection, ease of handling in the laboratory, tolerance to varying sediment physico-chemical characteristics, and confirmation with responses with natural benthic populations were the primary criteria used for selecting A. abdita, E. estuarius, L. plumulosus, and R. abronius for the standard for 10-d sediment tests. Rand et al (1995) had similar though a smaller list of criteria: 1) because sensitivities vary, a group of species should be used representing a broad range of sensitivities; 2) be widely available and abundant; 3) be indigenous or representative of the ecosystem being tested; 4) be recreationally, commercially, or ecologically important; 5) have standardized methods for both acute and chronic tests; 6) have adequate background data (e.g. physiology, genetics, behavior). In the opinion of these authors, Items 1, 5 and 6 were the most critical criteria for test species selection. In their studies looking at exposures of marine organisms to oil and treated oil, Word et al (2014) indicated that whenever possible, test species for toxicity studies should be valuable ecosystem components (VECs) that represent the relevant environmental components potentially exposed to oil or treated oil. However, they add that species that are VECs do not necessarily lend themselves to toxicity studies. The authors suggest that characteristics for suitable test organisms would include the following:
• A sensitivity to oil and treated oil; • Relative abundance and an availability for collection or culture; • The ability to withstand laboratory handling; • Meaningful and measurable endpoints over the time period of the study; • Native to the site--specific conditions (e.g. cold water).
Numerous species have been used in testing over the years. ASTM has indicated in their toxicity testing standard that species are generally selected on the basis of availability, commercial recreational, and ecological importance, past successful use and regulatory use. The National Research Council (1983) reviewed the toxicity testing literature dealing with drilling mud effects and reported that 62 different marine species had been used in testing water based muds from the Gulf of Mexico, Pacific and Atlantic Oceans, and the Beaufort Sea. This included five major animal phyla including 12 species of fish, 30 species of crustaceans, 12 species of molluscs, 6 species of polychaetes, and 1 sea urchin species. Larval and early life stages were the most sensitive (Table 3). The copepods Acartia tonsa and Centropages typicus were the most sensitive species tested. Other relatively sensitive species included larvae of the dock shrimp Pandalus danae, pink salmon fry Oncorhynchus gorbuscha, larvae of the lobster Homarus americanus, juvenile ocean scallops Placopecten magellanicus and mysid shrimp (Mysidopsis, Neomysis, Acanthomysis (Holmeimysis), and Mysis). Crustaceans as a group, and in particular, copepods, mysids, and shrimp, were more sensitive than other major taxa to drilling fluids. There were no discernible differences in tolerance to drilling fluids among animals from the Atlantic Ocean, Gulf of Mexico, Pacific Ocean, and Beaufort Sea. Table 3. Number of LC50 values reported for each group of organisms in each toxicity range when tested against drilling muds (from National Research Council 1983).
Tamar Field Development Project EIANoble Energy Mediterranean LtdCSA-Noble-FL-16-2650-08-REP-01-FIN-REV04
J-7 March 2016

LC50 (mg/l) Organism Not
Determinable 100 100-999 1,000 -
9999 10,0000 –
99,999 100,000
Phytoplankton 5 6 0 7 0 0 Crustaceans Copepods Isopods Amphipods Mysids Shrimp Crabs Lobsters
4 0 0 1 0 1 0
2 0 0 0 0 0 0
11 0 0 1 12 0 0
15 0 0 0 15 5 1
7 1 5 21 31 16 3
0 5 14 18 18 13 3
Molluscs Gastropods Bivalves
0 0
0 0
0 0
0 1
2 15
8 17
Echinoderms Sea Urchins
0 0 0 0 1 3
Polychaetes 0 0 0 0 9 19 Finfish 0 0 0 3 52 35 TOTAL 11 2 24 47 163 153
Other researchers have also demonstrated that the sensitivities of animals from different geographic regions do not differ greatly. For example, Hansen et al (2014) tested the sensitivity of five marine species (alga Skeletonema costatum, the planktonic copepod species Acartia tonsa (temperate), Calanus finmarchicus (boreal), and Calanus glacialis (Arctic), and the benthic copepod Corophium volutator ) to eight oil spill response chemicals. The copepod species showed a relatively similar sensitivity to all of the products. Single-species acute toxicity data and (micro) mesocosm data collated for 16 insecticides by Maltby et al (2009) provided similar results. These data were used to investigate the importance of test-species selection in constructing species sensitivity distributions (SSDs) and the ability of estimated hazardous concentrations (HCs) to protect freshwater aquatic ecosystems. Species sensitivity distributions for specific taxonomic groups (vertebrates, arthropods, non-arthropod invertebrates), habitats (saltwater, freshwater, lentic, lotic), and geographical regions (Palaearctic, Nearctic, temperate, tropical) were compared. The taxonomic composition of the species assemblage used to construct the SSD had a significant influence on the assessment of hazard, but the habitat and geographical distribution of the species did not. Moreover, SSDs constructed using species recommended in test guidelines did not differ significantly from those constructed using non-recommended species. Currently, the author is not aware of any ecotoxicology studies having dealt with deep sea species. In recognizing the challenges of developing environmental risks of oil and gas operations in the Arctic, Word et al (2014) commented that “because of the relative difficulty in conducting Arctic toxicology studies at extremely low temperatures with authentic Arctic species, there are relatively few comprehensive investigations. However, relatively recent attention has focused on the issue of relative sensitivity of Arctic species to temperate species and several assessments have similarly concluded that arctic and temperate species show little difference in relative sensitivity when toxicity studies were conducted with similar methodologies”.
Tamar Field Development Project EIANoble Energy Mediterranean LtdCSA-Noble-FL-16-2650-08-REP-01-FIN-REV04
J-8 March 2016

Olsen et al. (2011) ran acute toxicity tests with Arctic and temperate species with a single PAH (2--methyl naphthalene) and concluded that median estimates for the hazardous concentrations affecting 5 and 50 percent of the species (HC5 and HC50) based on both the NOEC and LC50 estimates were less than a factor 2 higher for temperate species than for Arctic species and were not statistically different (Figure 1). The authors concluded that there was no regional differences in tolerance to 2--methyl naphthalene either at the species level (LC50 and NOEC) or at the aggregated species level (HC5 and HC50). Further they conclude that the values of survival metrics established for temperate regions are transferrable to the Arctic. These findings are supported by Word et al. 2014 who compare the relative sensitivity of Arctic and non--Arctic species using measured and literature data. They come to a similar conclusion for parent naphthalene, WAF (water accommodated fraction), and CEWAF (chemically enhanced water accommodated fraction) in spiked exposures (Figure 2). In another study looking at species sensitivities, Roberts et al (1982) compared the acute toxic response of species pairs tested simultaneously to three toxicants: sodium lauryl sulfate, cadmium, and Lannate® (methomyl). One species in each test was that recommended by the U.S. Environmental Protection Agency (EPA), the other a closely related species. Species-pairs included Prorocentrum minimum - Pseudoisochrysis paradoxa - Skeletonema costatum (phytoplankters); Neomysis americana-Mysidopsis bahia (mysid shrimp); Eurytemora affinis-Acartia tonsa (copepod); and Menidia menidia-Cyprinodon variegatus (fish). For each
Tamar Field Development Project EIANoble Energy Mediterranean LtdCSA-Noble-FL-16-2650-08-REP-01-FIN-REV04
J-9 March 2016
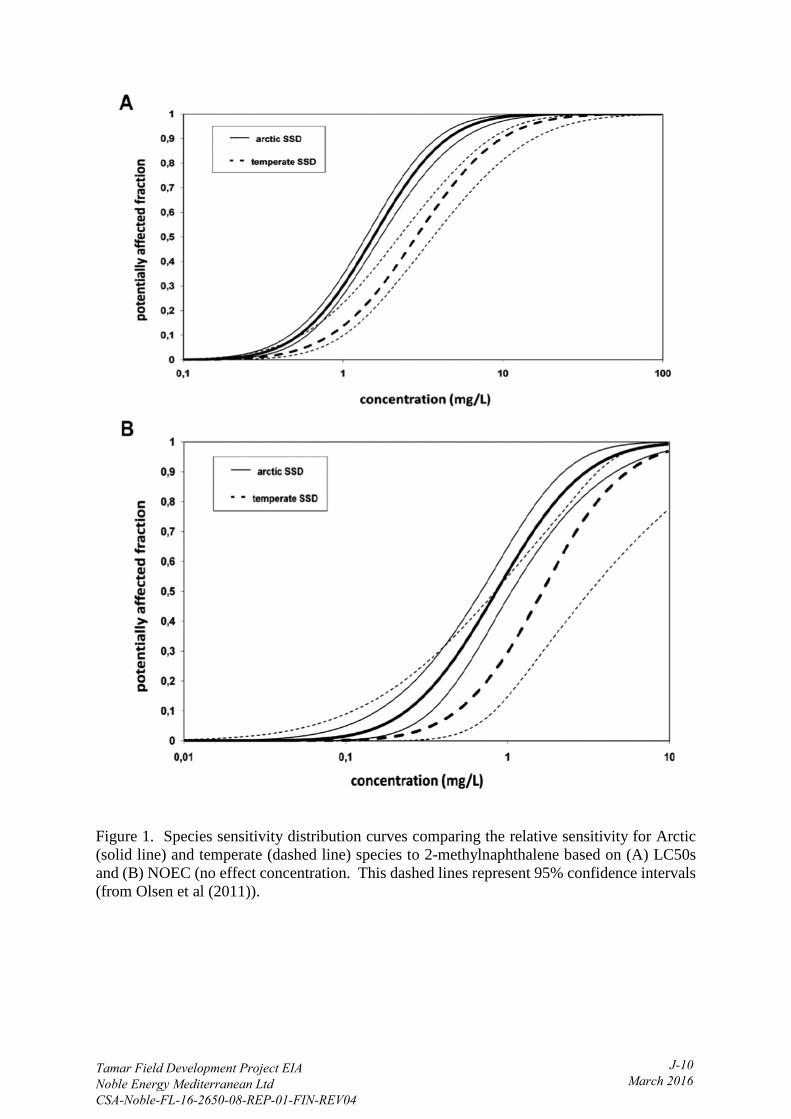
Figure 1. Species sensitivity distribution curves comparing the relative sensitivity for Arctic (solid line) and temperate (dashed line) species to 2-methylnaphthalene based on (A) LC50s and (B) NOEC (no effect concentration. This dashed lines represent 95% confidence intervals (from Olsen et al (2011)).
Tamar Field Development Project EIANoble Energy Mediterranean LtdCSA-Noble-FL-16-2650-08-REP-01-FIN-REV04
J-10 March 2016
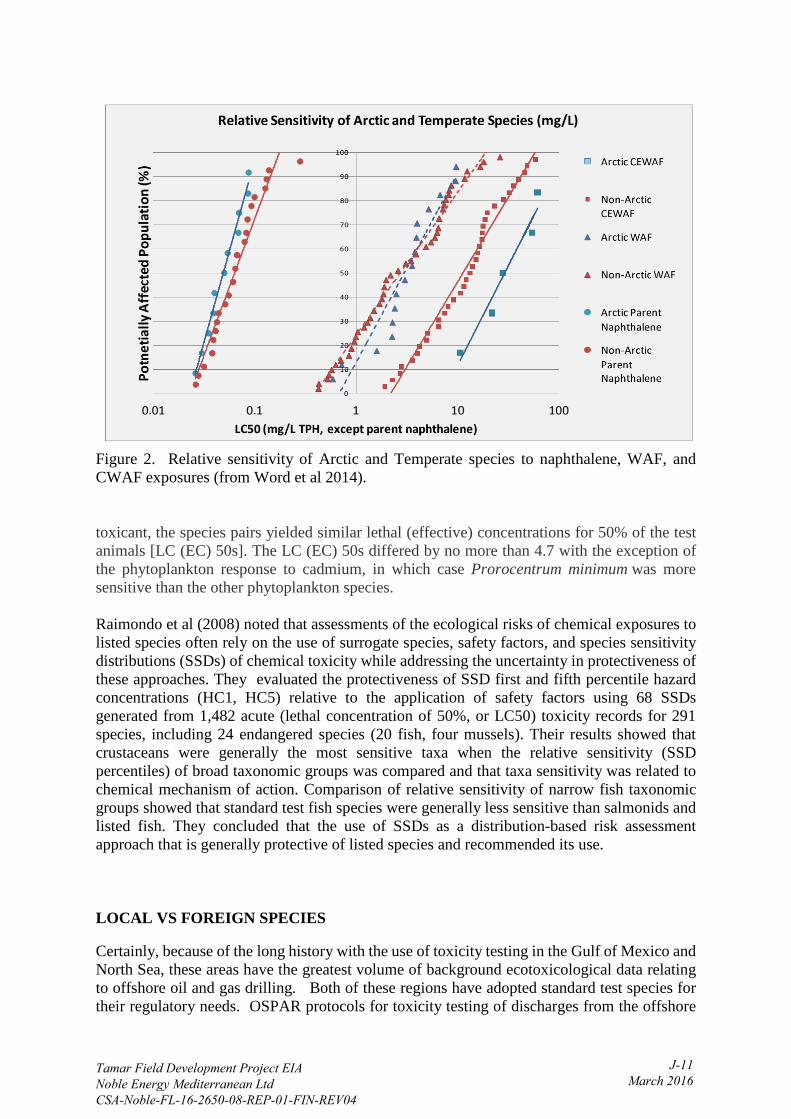
Figure 2. Relative sensitivity of Arctic and Temperate species to naphthalene, WAF, and CWAF exposures (from Word et al 2014). toxicant, the species pairs yielded similar lethal (effective) concentrations for 50% of the test animals [LC (EC) 50s]. The LC (EC) 50s differed by no more than 4.7 with the exception of the phytoplankton response to cadmium, in which case Prorocentrum minimum was more sensitive than the other phytoplankton species. Raimondo et al (2008) noted that assessments of the ecological risks of chemical exposures to listed species often rely on the use of surrogate species, safety factors, and species sensitivity distributions (SSDs) of chemical toxicity while addressing the uncertainty in protectiveness of these approaches. They evaluated the protectiveness of SSD first and fifth percentile hazard concentrations (HC1, HC5) relative to the application of safety factors using 68 SSDs generated from 1,482 acute (lethal concentration of 50%, or LC50) toxicity records for 291 species, including 24 endangered species (20 fish, four mussels). Their results showed that crustaceans were generally the most sensitive taxa when the relative sensitivity (SSD percentiles) of broad taxonomic groups was compared and that taxa sensitivity was related to chemical mechanism of action. Comparison of relative sensitivity of narrow fish taxonomic groups showed that standard test fish species were generally less sensitive than salmonids and listed fish. They concluded that the use of SSDs as a distribution-based risk assessment approach that is generally protective of listed species and recommended its use. LOCAL VS FOREIGN SPECIES Certainly, because of the long history with the use of toxicity testing in the Gulf of Mexico and North Sea, these areas have the greatest volume of background ecotoxicological data relating to offshore oil and gas drilling. Both of these regions have adopted standard test species for their regulatory needs. OSPAR protocols for toxicity testing of discharges from the offshore
Tamar Field Development Project EIANoble Energy Mediterranean LtdCSA-Noble-FL-16-2650-08-REP-01-FIN-REV04
J-11 March 2016

oil and gas industry focus on the alga Skeletonema costatum, the copepod Acartia tonsa and a fish, Scophthalamus maximus for water column impacts and on the amphipod, Corophium volutator, for sediment. In the Gulf of Mexico, protocols to test for possible water column impacts use the crustacean Mysidopsis bahia (Mysid shrimp) and the fish Menidia beryllina (Inland Silverside minnow). Sediment testing uses the amphipod Leptocheirus plumulosus. While none of these species can be considered as indigenous to the deep ocean environments (with the possible exception of the Acartia), the USEPA for one has accepted the use of the mysid, silverside minnow, and the Leptocheirus as acceptable species to monitor drilling mud and produced water discharges. Given the difficulties inherent in providing sufficient organisms from the deep water environments that meet specified criteria for testing (described earlier in this report), use of these standard test organisms satisfies the objectives of the monitoring goals. This is based on the fact that research, as described in this report, has tended to show that geographic differences do not have a marked effect on the sensitivities within species groups. This brings back the question in regards to a preference for the use of local species for toxicity testing in Israel. While this may be the preferred strategy, a short term solution may be impractical. As mentioned previously, the volume of ecotoxicology information on deep sea species such as would occur in the Eastern Mediterranean is minimal at best and more likely non-existent. As described in the above report, much of this can be attributed to the logistical problems associated with capturing sufficient test organisms, being able to maintain such organisms in culture where they would be readily available, and lastly with a paucity of data on their physiology. Additionally, one of the biggest hindrances at the present is the lack of a local laboratory engaged in toxicological testing in Israel. Until such lab is available, any toxicity test that will be undertaken will have to be shipped to a foreign lab. At the present, most of those options reside in the areas around the North Sea or the Gulf of Mexico. This is not to rule out the potential for ultimately having test species that are indigenous to the Mediterranean. For example, Perez and Beiras (2009) tested the effects of reference toxicants, three trace metals (Copper, Cadmium and Zinc), and one surfactant, sodium dodecyl sulfate (SDS) using the mysid Siriella armata (Crustacea, Mysidacea). This species is a component of the coastal zooplankton that lives in swarms in the shallow waters of the European neritic zone, from the North Sea to the Mediterranean. In the testing, S. armata showed higher sensitivity than the freshwater model organism Daphnia magna suggesting that this validated the use of Siriella mysids as model organisms in marine acute toxicity tests. Using the criteria described earlier in this report, Table 4 compares the situation as it applies to the use of local versus out of area species for testing.
Tamar Field Development Project EIANoble Energy Mediterranean LtdCSA-Noble-FL-16-2650-08-REP-01-FIN-REV04
J-12 March 2016
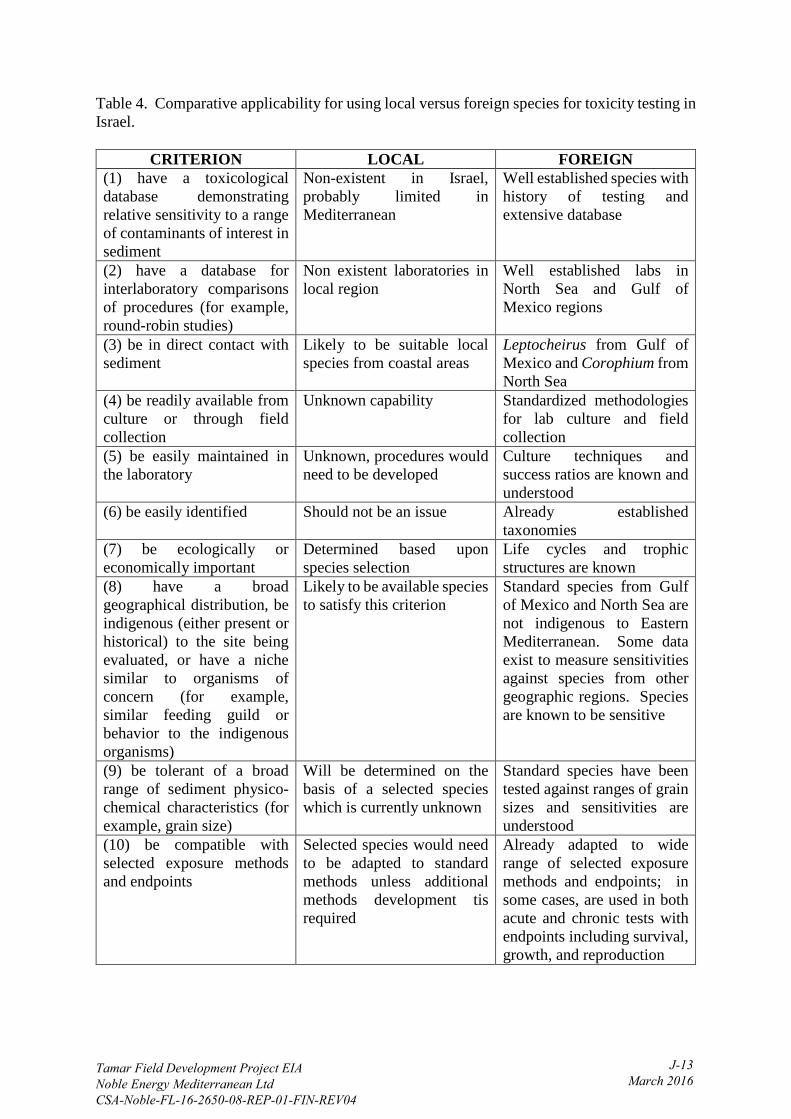
Table 4. Comparative applicability for using local versus foreign species for toxicity testing in Israel.
CRITERION LOCAL FOREIGN (1) have a toxicological database demonstrating relative sensitivity to a range of contaminants of interest in sediment
Non-existent in Israel, probably limited in Mediterranean
Well established species with history of testing and extensive database
(2) have a database for interlaboratory comparisons of procedures (for example, round-robin studies)
Non existent laboratories in local region
Well established labs in North Sea and Gulf of Mexico regions
(3) be in direct contact with sediment
Likely to be suitable local species from coastal areas
Leptocheirus from Gulf of Mexico and Corophium from North Sea
(4) be readily available from culture or through field collection
Unknown capability Standardized methodologies for lab culture and field collection
(5) be easily maintained in the laboratory
Unknown, procedures would need to be developed
Culture techniques and success ratios are known and understood
(6) be easily identified Should not be an issue Already established taxonomies
(7) be ecologically or economically important
Determined based upon species selection
Life cycles and trophic structures are known
(8) have a broad geographical distribution, be indigenous (either present or historical) to the site being evaluated, or have a niche similar to organisms of concern (for example, similar feeding guild or behavior to the indigenous organisms)
Likely to be available species to satisfy this criterion
Standard species from Gulf of Mexico and North Sea are not indigenous to Eastern Mediterranean. Some data exist to measure sensitivities against species from other geographic regions. Species are known to be sensitive
(9) be tolerant of a broad range of sediment physico-chemical characteristics (for example, grain size)
Will be determined on the basis of a selected species which is currently unknown
Standard species have been tested against ranges of grain sizes and sensitivities are understood
(10) be compatible with selected exposure methods and endpoints
Selected species would need to be adapted to standard methods unless additional methods development tis required
Already adapted to wide range of selected exposure methods and endpoints; in some cases, are used in both acute and chronic tests with endpoints including survival, growth, and reproduction
Tamar Field Development Project EIANoble Energy Mediterranean LtdCSA-Noble-FL-16-2650-08-REP-01-FIN-REV04
J-13 March 2016
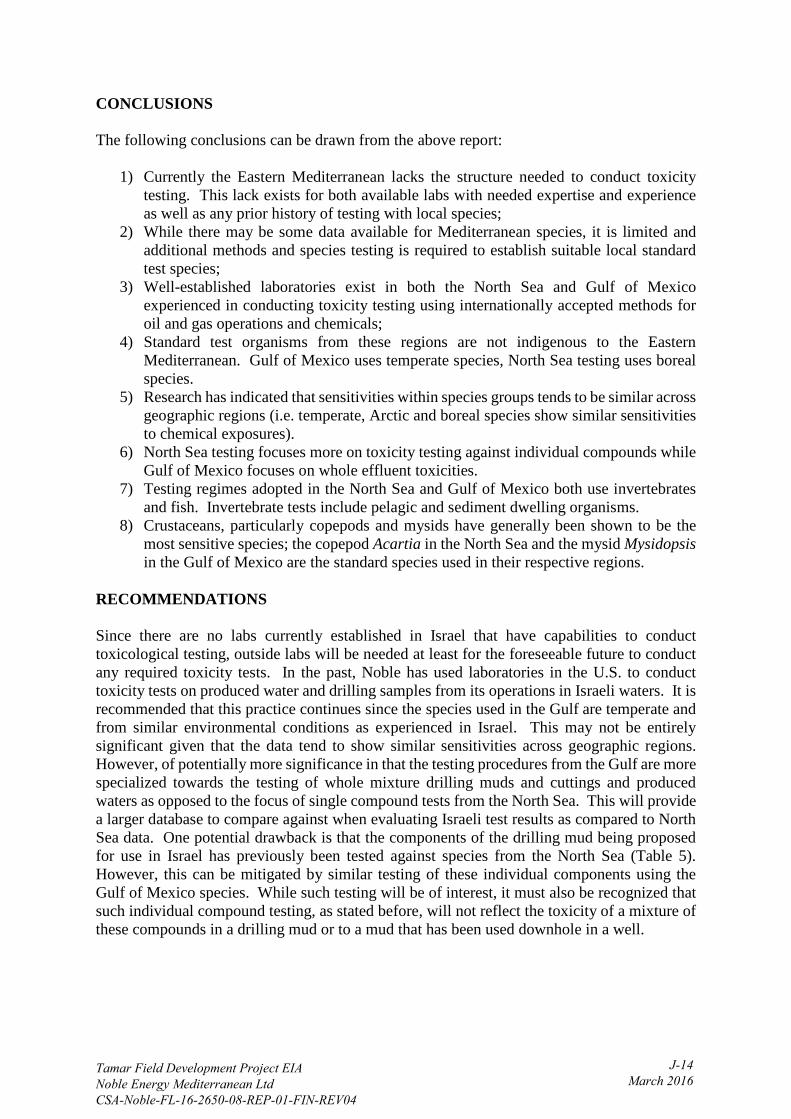
CONCLUSIONS
The following conclusions can be drawn from the above report:
1) Currently the Eastern Mediterranean lacks the structure needed to conduct toxicitytesting. This lack exists for both available labs with needed expertise and experienceas well as any prior history of testing with local species;
2) While there may be some data available for Mediterranean species, it is limited andadditional methods and species testing is required to establish suitable local standardtest species;
3) Well-established laboratories exist in both the North Sea and Gulf of Mexicoexperienced in conducting toxicity testing using internationally accepted methods foroil and gas operations and chemicals;
4) Standard test organisms from these regions are not indigenous to the EasternMediterranean. Gulf of Mexico uses temperate species, North Sea testing uses borealspecies.
5) Research has indicated that sensitivities within species groups tends to be similar acrossgeographic regions (i.e. temperate, Arctic and boreal species show similar sensitivitiesto chemical exposures).
6) North Sea testing focuses more on toxicity testing against individual compounds whileGulf of Mexico focuses on whole effluent toxicities.
7) Testing regimes adopted in the North Sea and Gulf of Mexico both use invertebratesand fish. Invertebrate tests include pelagic and sediment dwelling organisms.
8) Crustaceans, particularly copepods and mysids have generally been shown to be themost sensitive species; the copepod Acartia in the North Sea and the mysid Mysidopsisin the Gulf of Mexico are the standard species used in their respective regions.
RECOMMENDATIONS
Since there are no labs currently established in Israel that have capabilities to conduct toxicological testing, outside labs will be needed at least for the foreseeable future to conduct any required toxicity tests. In the past, Noble has used laboratories in the U.S. to conduct toxicity tests on produced water and drilling samples from its operations in Israeli waters. It is recommended that this practice continues since the species used in the Gulf are temperate and from similar environmental conditions as experienced in Israel. This may not be entirely significant given that the data tend to show similar sensitivities across geographic regions. However, of potentially more significance in that the testing procedures from the Gulf are more specialized towards the testing of whole mixture drilling muds and cuttings and produced waters as opposed to the focus of single compound tests from the North Sea. This will provide a larger database to compare against when evaluating Israeli test results as compared to North Sea data. One potential drawback is that the components of the drilling mud being proposed for use in Israel has previously been tested against species from the North Sea (Table 5). However, this can be mitigated by similar testing of these individual components using the Gulf of Mexico species. While such testing will be of interest, it must also be recognized that such individual compound testing, as stated before, will not reflect the toxicity of a mixture of these compounds in a drilling mud or to a mud that has been used downhole in a well.
Tamar Field Development Project EIANoble Energy Mediterranean LtdCSA-Noble-FL-16-2650-08-REP-01-FIN-REV04
J-14March 2016
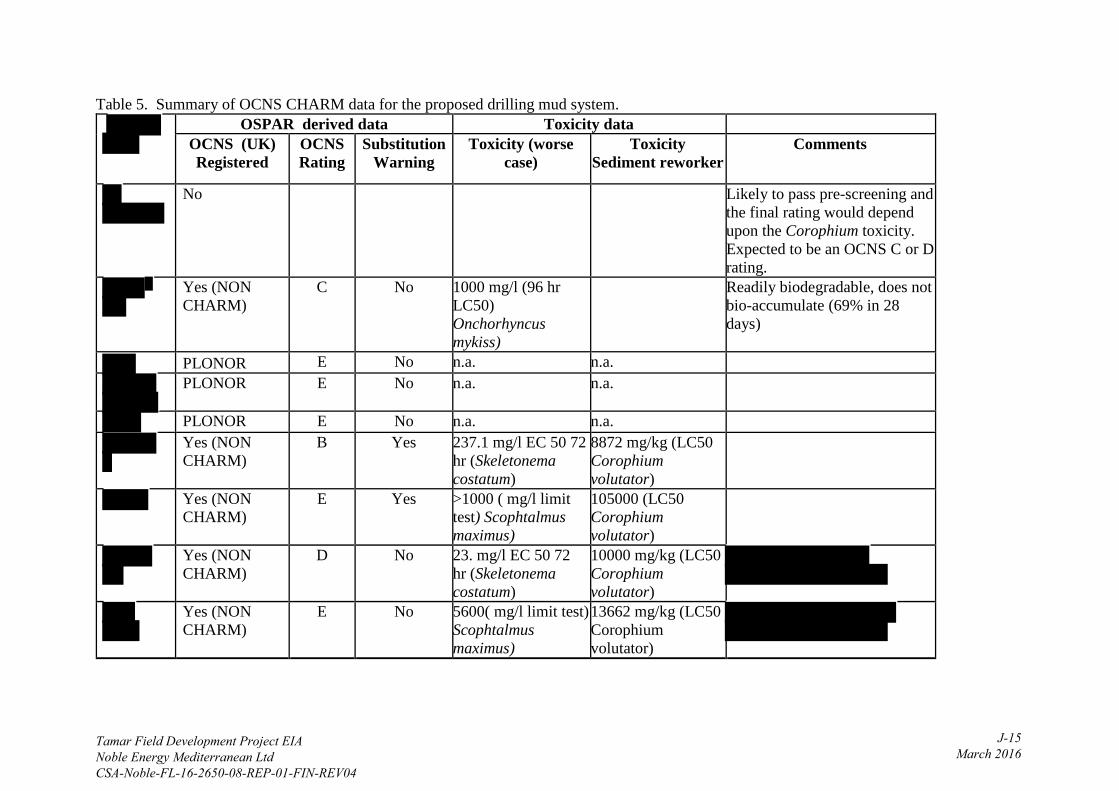
Table 5. Summary of OCNS CHARM data for the proposed drilling mud system.
OSPAR derived data Toxicity data
OCNS (UK) Registered
OCNS Rating
Substitution Warning
Toxicity (worse case)
Toxicity Sediment reworker
Comments
No Likely to pass pre-screening and
the final rating would depend upon the Corophium toxicity. Expected to be an OCNS C or D rating.
Yes (NON CHARM)
C No 1000 mg/l (96 hr LC50) Onchorhyncus mykiss)
Readily biodegradable, does not bio-accumulate (69% in 28 days)
PLONOR E No n.a. n.a.
PLONOR E No n.a. n.a.
PLONOR E No n.a. n.a. Yes (NON
CHARM) B Yes 237.1 mg/l EC 50 72
hr (Skeletonema costatum)
8872 mg/kg (LC50 Corophium volutator)
Yes (NON CHARM)
E Yes >1000 ( mg/l limit test) Scophtalmus maximus)
105000 (LC50 Corophium volutator)
Yes (NON CHARM)
D No 23. mg/l EC 50 72hr (Skeletonema costatum)
10000 mg/kg (LC50 Corophium volutator)
Yes (NON CHARM)
E No 5600( mg/l limit test) Scophtalmus maximus)
13662 mg/kg (LC50 Corophium volutator)
Tamar Field Development Project EIANoble Energy Mediterranean LtdCSA-Noble-FL-16-2650-08-REP-01-FIN-REV04
J-15March 2016

The recommended protocols would be those laid out in the NPDES General Permit for the Gulf of Mexico (USEPA 2012). The proposed testing is summarized in Table 6. It includes testing of the base fluid, a suspended particulate phase of the used mud, and tests with the solid phase. A schedule for each type of testing is included. Table 6. Schedule of toxicity testing of drill muds and cuttings (from USEPA 2012).
DISCHARGE MONITORED PARAMETER
SPECIES DISCHARGE LIMITATION
TEST FREQUENCY
METHOD
Drilling Fluid 96 hr LC50 Mysidopsis bahia
30,000 ppm Once/month Once/end of well
Drilling Fluids Toxicity Test at 40 CFR Part 435, Subpart A, Appendix 2.
Drill Cuttings 96 hr LC50 Mysidopsis bahia
30,000 ppm Once/week when drilling
USEPA 1993. Mysidopsis bahia Acute Static 96 hr Toxicity Test, FR58 (41): 12507-12512
Stock Limits for Drill Cuttings Generated using Non aqueous Based Drilling Fluids (base fluid blend)
10-day LC50 Leptocheirus sp.
The ratio of the 10-day LC50 of C16 - C18 internal olefin divided by the 10-day LC50 of the base fluid shall not exceed 1.0
Once/year on each base fluid blend
ASTM method E1367- 99
Discharge Limits for Cuttings Generated using Non aqueous Based Drilling Fluids (drilling fluids, removed from cuttings at the solids control equipment)
4-day LC50 Leptocheirus sp.
The ratio of the 4-day LC50 of C16 - C18 internal olefin divided by the 4-day LC50 of the base fluid shall not exceed 1.0
Once/month. Modified ASTM Method E1367-99
MONITORING The reality of laboratory toxicity testing is that it does not absolutely reflect actual conditions in the environment but is simply an indicator of a potential impact. One must really interpret toxicity data as a measure of risk. On a relative basis, discharge which show high levels of toxicity provide the higher level of potential risk to the environment bit for numerous reasons the reality may be less or more that indicated by the test. As the OSPAR approach is meant to identify toxic chemicals early in the process of product formulation and reduce their eventual release into the environment, the real time testing of drilling muds and cuttings in the field is to identify actual operating conditions and reduce the risk that materials are being discharged. Toxicity data which suggest regulatory parameters are being exceeded would disallow the discharge of such materials. Ultimately, if the goal is achieved, discharged materials would
Tamar Field Development Project EIANoble Energy Mediterranean LtdCSA-Noble-FL-16-2650-08-REP-01-FIN-REV04
J-16 March 2016

optimally not produce impacts related to toxicity. However, this would not completely eliminate the possibility that residual or artifactual effects could be observed. For instance, it is impossible to eliminate the impacts of the deposition of drill cuttings on the ocean floor. This would be a physical effect that should be short term depending upon how quickly recolonization would occur. Similarly, some compounds when deposited on the bottom could lead to oxygen depletion in bottom sediments due to biodegradation. One of the parameters by which chemicals are ranked through the REACH/CHARM process is biodegradability. Impacts from readily biodegraded products will be short term, longer in the case of those materials which tend to persist. It is intended that there will be long term monitoring of the Tamar and Leviathan fields that will address such impacts with field surveys targeted to determining the extent of such impacts. By using the data on the chemicals found in the drilling fluids and looking at the toxicity data, monitoring can be focused on any expected impacts that will be due to suspected toxicity or physic-chemical impacts. However, as stated earlier, the intent of implementing the programs described above, the ultimate objective is to be able to mitigate against most of these impacts before they occur.
REFERENCES
ASTM (1993). In 1993 Annual Book of American Society for Testing and Materials (ASTM) Standards: E 1667-92, pp. 1138-1163
ASTM. 2014. Standard Test Method for Measuring the Toxicity of Sediment-Associated Contaminants with Estuarine and Marine Invertebrates Active Standard ASTM E1367 Developed by Subcommittee: E50.47 Book of Standards Volume: 11.06
Hansen, B.H., D. Altin, K. Bonaunet, I.B. Overjordet. 2014. Acute toxicity of eight oil spill response chemicals to temperate, boreal, and Arctic species. J Toxicol Environ Health A. 77(9-11):495-505.
Maltby, Lorraine, Naomi Blake, Theo C. M. Brock, Paul J. Van den Brink. 2009. Insecticide species sensitivity distributions: Importance of test species selection and relevance to aquatic ecosystems. Environmental Toxicology and Chemistry 24(2): 379–388.
National Research Council. 1983. National Research Council (U.S.). Panel on Assessment of Fates and Effects of Drilling Fluids and Cuttings in the Marine Environment National Academy Press, 180 pages.
OECD 1998. OECD Series on Testing and Assessment. Number 11 Detailed Review Paper on Aquatic Testing Methods for Pesticides and Industrial Chemicals, ENV/MC/CHEM(98)19/PART1.
OSPAR. (2006). Protocols on methods for testing of chemicals used in Offshore Oil Industry. OSPAR Commission. Olsen, G.H., M.G.D. Smit, J.L. Carroll, I. Jaeger, T. Smith, and L. Camus ,2011. Arctic versus temperate comparison of risk assessment metrics for 2-methyl-naphthalene. Mar Environ Res (2011): 1-9.
Perez, Sara and Ricardo Beiras. 2010. The mysid Siriella armata as a model organism in marine ecotoxicology: comparative acute toxicity sensitivity with Daphnia magna. Ecotoxicology 19:196–206
Tamar Field Development Project EIANoble Energy Mediterranean LtdCSA-Noble-FL-16-2650-08-REP-01-FIN-REV04
J-17March 2016

Rand, Gary, P.G. Wells, and L.S> McCarty. 1995. Introduction to Aquatic Toxicology, pages 3-70. In Gary Rand (Editor), Fundamentals of Aquatic Toxicology. Effects, Environmental Fate, and Risk Assessment, Second Edition. Taylor and Francis, Philadelphia, PA.
Raimondo S1, D.N. Vivian, C. Delos, M.G. Barron. 2008. Protectiveness of species sensitivity distribution hazard concentrations for acute toxicity used in endangered species risk assessment. Environ Toxicol Chem. 27(12):2599-607.
Roberts, Morris H., J. Ernest Warinner, Chu -Fa Tsai, David Wright, L. Eugene Cronin. 1982. Comparison of estuarine species sensitivities to three toxicants. Archives of Environmental Contamination and Toxicology 11(6), pp 681-692.
Rye, Henrik, Mark Reed, Ismail Durgut, May Kristin Ditlevsen. 2006. Documentation report for the revised DREAM model. ERMS Report No. 18. SINTEF Materials and Chemistry. Trondheim, Norway.
Sprague, J.B. and Logan, W.J. Separate and Joint Toxicity to Rainbow Trout of Substances Use in Drilling Fluid For Oil Exploration. Environmental Pollution, 1979. 19: 269-281.
USEPA. 1994. Methods for Assessing the Toxicity of Sediment-associated Contaminants with Estuarine and Marine Amphipods. EPA 600/R-94/025.
USEPA. 2002. Methods for Measuring the Acute Toxicity of Effluents and Receiving Waters to Freshwater and Marine Organisms, Fifth Edition. EPA-821-R-02-012.
USEPA. 2012. The NPDES General Permit For New And Existing Sources And New Dischargers In The Offshore Subcategory Of The Oil And Gas Extraction Point Source Category For The Western Portion Of The Outer Continental Shelf Of The Gulf Of Mexico (Gmg290000). EPA Region 6.
Word, Jack et al. 2014. Environmental Impacts of Arctic Oil Spills and Arctic Spill Response Technologies. Literature Review and Recommendations. Arctic Oil Spill Response Technology Joint Industry Programme.
Tamar Field Development Project EIANoble Energy Mediterranean LtdCSA-Noble-FL-16-2650-08-REP-01-FIN-REV04
J-18March 2016
Related Documents