TALLINK GRUPP AS

Welcome message from author
This document is posted to help you gain knowledge. Please leave a comment to let me know what you think about it! Share it to your friends and learn new things together.
Transcript
TALLINK GRUPP AS

2 | 35
Interim report Q2 2020
Contents
Beginning of the financial year 1 January 2020
End of the financial year 31 December 2020
Interim reporting period 1 April 2020 – 30 June 2020
CONTENTS
MANAGEMENT REPORT...................................................................................................................... 3
MANAGEMENT BOARD’S CONFIRMATION ......................................................................................... 19
UNAUDITED CONDENSED CONSOLIDATED INTERIM FINANCIAL STATEMENTS .................................. 20
Consolidated statement of profit or loss and other comprehensive income .................................. 20
Consolidated statement of financial position ................................................................................ 21
Consolidated statement of cash flows ......................................................................................... 22
Consolidated statement of changes in equity ...............................................................................23
NOTES TO THE CONDENSED CONSOLIDATED INTERIM FINANCIAL STATEMENTS ............................. 24
Note 1 Corporate information ................................................................................................... 24
Note 2 Basis of preparation ...................................................................................................... 24
Note 3 Segment information ..................................................................................................... 24
Note 4 Financial items .............................................................................................................. 26
Note 5 Earnings per share ........................................................................................................ 26
Note 6 Property, plant and equipment ...................................................................................... 27
Note 7 Intangible assets ........................................................................................................... 28
Note 8 Interest-bearing loans and borrowings ...........................................................................29
Note 9 Share capital ................................................................................................................. 30
Note 10 Dividends ..................................................................................................................... 30
Note 11 Related party disclosures ............................................................................................. 30
STATEMENT BY THE MANAGEMENT BOARD ....................................................................................... 31
ALTERNATIVE PERFORMANCE MEASURES .........................................................................................32
CONTACT INFORMATION ................................................................................................................ 35

3 | 35
Interim report Q2 2020
Management report
MANAGEMENT REPORT In the second quarter (1 April – 30 June) of the 2020 financial year, Tallink Grupp AS and its subsidiaries (the Group) carried 388 thousand passengers, which is 85.4% less than in the second quarter last year. The number of cargo units transported decreased by 12.8% in the same comparison. The Group’s unaudited consolidated revenue decreased by 74.6% or EUR 191.1 million to a total of EUR 65.0 million. Unaudited EBITDA was EUR 2.4 million (EUR 50.7 million in Q2 2019) and unaudited net loss was EUR 27.4 million (net profit of EUR 14.9 million in Q2 2019).
In the second quarter, the Group’s revenue and operating results were impacted by the following operational factors:
- Covid-19 and related travel restrictions. - 978 trips less due to suspended operations. - Restrictions on maximum capacity.
Impact of Covid-19 and travel restrictions Due to the global outbreak of Covid-19, the state of emergency was declared in most of the Group’s home markets in mid-March together with imposing travelling and movement restrictions. The restrictions were gradually removed starting from mid-May. However, the restrictions remain in force for international passenger traffic to and from Sweden.
The impact of the Covid-19 on the Group’s second quarter operations and results has been very extensive. The combined passenger volume of April and May was down by 93% compared to last year. There was a slight recovery in June following Finland lifting its travel restrictions. Still, the number of passengers carried in the month was 72% lower compared to June 2019. Customer profiles changed from a mix of home and foreign markets to mainly home.
In the situation of extensive travel restrictions and lower demand, the focus was shifted to cost and cash flow management to ensure the sustainability of the Group’s core business. Thus, non-critical costs and investments were scaled down and several operational changes were made.
- Operations of the Tallinn-Stockholm route with vessels Victoria I and Baltic Queen has been suspended since 15 March.
- Daily operations of the Riga-Stockholm route with vessels Romantika and Isabelle has been suspended since 16 March.
- Operations of the Tallinn-Helsinki route cruise ferry Silja Europa were suspended from 17 March to 12 June and shuttle vessel Star from 18 March to 14 May.
Number of passengers carried by the Group’s
ships in Q2
0.4 million
The Group’s unaudited consolidated Q2
revenue
EUR 65.0 million

4 | 35
Interim report Q2 2020
Management report
- Operations of the Helsinki-Stockholm route with vessels Silja Serenade and Silja Symphony has been suspended since 19 March.
- Operations of Tallink Hotel Riga and Tallink Spa & Conference Hotel, which were suspended from 18 March, were reopened on 1 and 12 June, respectively. Tallink Express Hotel in Tallinn remained open in limited capacity in the second quarter. Tallink City Hotel has remained closed since 18 March.
Throughout the quarter our vessels have been flexibly rerouted to other routes.
- In cooperation with Estonian Ministry of Economic Affairs and Communication, the shuttle vessel Star was rerouted to the Paldiski-Sassnitz route from 19 March to 18 April to ensure continuing transportation of goods between the Baltic and the Nordics and western Europe.
- The cruise ferry Victoria I was rerouted to the Tallinn-Helsinki route from 7 June and the cruise ferry Baltic Queen to the Tallinn-Mariehamn route to perform 2 special cruises in June.
- The cruise ferry Romantika operated 6 special return trips in the second quarter on the Riga-Stockholm route to transport cargo and commuters. The cruise ferry Isabelle was rerouted to the Paldiski-Kapellskär route from 7 June.
- The cruise ferry Silja Serenade was rerouted to the Helsinki-Riga route from 26 June.
The Estonia-Finland routes shuttle vessel Megastar and cargo vessel Seawind, the Paldiski-Kapellskär route cargo vessel Regal Star and the Turku-Stockholm route cruise ferries Baltic Princess and Galaxy continued operating to ensure international movement of cargo.
Changes concerning workload and remuneration of personnel Due to the Covid-19 situation the following changes relating to personnel were in force in the second quarter of 2020:
- The workload and remuneration of all Estonian personnel was reduced to 70% for three months.
- Most of the Finnish personnel were on unpaid leave, except the staff on duty. - The workload of Swedish personnel was reduced to 40% in April and to 20% in May and June,
except for the staff on duty on vessels. - The workload and remuneration of all Latvian personnel was reduced to 70% for two months. - The Members of Supervisory Board of Tallink Grupp AS waived their remuneration for three
months. - The Chairman of the Management Board requested his salary to be reduced to 50% and
other Management Board Members’ salaries were reduced to 70% for three months.
During the reporting period, collective redundancies process was carried out, including among others hotel personnel and onboard personnel. To date the redundancies have affected approximately 500 employees. Additional collective redundancies process has commenced in the second quarter, which potentially affects another 700 employees by the end of the third quarter.
The average number of employees during the quarter and the number of employees at the end of quarter were, respectively, 10.7% and 15.0% lower compared to the same period a year ago.
Combination of changes relating to personnel and salary compensation support measures offered by the states resulted in a decrease by EUR 29.7 million in personnel expenses in the second quarter of 2020 compared to same period last year.
Support measures Starting from March the Group has received a total of EUR 17 million in various direct financial support. Majority of the support was received in the second quarter of 2020.
The Group used temporary salary compensation measures offered by the states.
5 | 35
Interim report Q2 2020
Management report
From 19 March to 18 June, the operations of Megastar on the Tallinn-Helsinki route and the Turku-Stockholm route two vessels were backed by Finland’s National Emergency Supply Agency’s to ensure the cargo supply. The support was of crucial help in covering the operating expenses, which were already reduced to minimum, and thereby reducing the operating losses.
Estonian parliament approved the change in legislation granting exemption from ships’ fairway dues for twelve months starting from April 2020.
Activities to improve liquidity The Supervisory Board proposed to the shareholders’ annual general meeting not to pay dividends from net profit for 2019.
An instalment for the construction of the shuttle vessel MyStar, originally scheduled for the second quarter of 2020, was postponed to the third quarter of 2020 after negotiations with the shipyard.
In order to relieve the liquidity issues caused by the Covid-19 situation, the Group’s companies were allowed to postpone the tax payments. At the end of the second quarter, the postponed tax liability amounted to EUR 11.1 and will be paid in even amounts until autumn 2021.
During the quarter the Group negotiated with existing and new financial institutions financing and payment terms including waivers of loan covenants, deferral of loan principal repayments for the year 2020 and new loan agreements. As a result, the Group’s liquidity improved in great extent and therefore the financial report has been prepared according to going concern principle.
Sales and segments In the second quarter of 2020, the Group’s total revenue decreased by EUR 191.1 million to EUR 65.0 million. Total revenue in the second quarter of 2019 and 2018 was EUR 256.1 million and EUR 255.4 million, respectively.
Revenue from route operations (core business) decreased by EUR 179.5 million to EUR 56.4 million. The passenger operations and segment results on all routes were significantly affected by Covid-19 situation and travel restrictions.
The number of passengers carried on the Estonia-Finland routes decreased by 76.7% compared to last year and the number of transported cargo units decreased by 6.9%. Estonia-Finland routes’ revenue decreased by EUR 61.3 million to EUR 33.6 million. The segment result decreased by EUR 23.9 million to EUR -2.4 million. The Estonia-Finland routes’ results include also the operations of the Paldiski-Sassnitz and the Tallinn-Mariehamn routes. The Finland’s National Emergency Supply Agency support to partially cover the operating expenses of the shuttle vessel Megastar is reported as other operating income.
The number of passengers carried on the Finland-Sweden routes decreased by 93.0%, while the number of transported cargo units decreased only by 8.7%. The route’s revenue decreased by EUR 73.4 million to EUR 16.2 million and the segment result decreased by EUR 27.6 million to EUR -18.4 million. Finland-Sweden results include also the operations of the Helsinki-Riga route as well as the expenses related to the suspended Helsinki-Stockholm route. The Finland’s National Emergency Supply Agency support to partially cover the operating expenses of the Turku-Stockholm route operations is reported as other operating income.
On the Estonia-Sweden routes the number of passengers carried decreased by 96.9% and the number of transported cargo units decreased by 25.1%. The segment revenue decreased by EUR 26.1 million to EUR 5.2 million and the segment result decreased by EUR 7.2 million to EUR -4.9 million. Estonia-Sweden routes’ results reflect the operations of the Paldiski-Kapellskär route and the expenses related to the suspended operations of the Tallinn-Stockholm route.
6 | 35
Interim report Q2 2020
Management report
There were no daily operations on the Latvia-Sweden route during the quarter. The results reflect 6 return trips performed with permission from the authorities as well as incurred operating expenses of the suspended route. The number of transported passengers and cargo units decreased by 98.5% and 89.4%, respectively. The route’s revenue decreased by EUR 18.7 million compared to last year and amounted to EUR 1.3 million. The segment result decreased by EUR 4.5 million to EUR -4.2 million.
Revenue from the segment other decreased by a total of EUR 13.5 million and amounted to EUR 8.7 million. The decrease was mainly driven by the suspended operations of 3 hotels, which resulted in 95.8% lower accommodation sales, and significantly lower revenue from services provided at the hotels. The segment revenue was positively impacted by a significant increase in online shop sales, opening of the first four Burger King restaurants and revenue from providing mooring services at the Tallinn Old City Harbour.
Earnings In the second quarter of 2020, the Group’s gross profit decreased by EUR 82.5 million compared to the same period last year, amounting to EUR -21.9 million. EBITDA decreased by EUR 48.3 million and amounted to EUR 2.4 million.
The Group’s second quarter financial result was impacted by the following factors:
- Significant cut in operating expenses, including significant decrease in personnel expenses as a result of collective redundancies, state support measures and remuneration cuts.
- Positive impact from support measures. - Positive impact from the absence of dividend payment related corporate income tax expense
in the amount of EUR 8.1 million as in the second quarter last year.
Amortisation and depreciation expense increased by EUR 1.8 million to EUR 25.2 million compared to last year. Net finance costs increased by EUR 0.2 million compared to the second quarter last year.
The Group’s unaudited net loss for the second quarter of 2020 was EUR 27.4 million or EUR 0.041 per share compared to a net profit of EUR 14.9 million or EUR 0.022 per share in 2019 and net profit of EUR 15.3 million or EUR 0.023 per share in 2018.
Results of the first 6 months of 2020 In the first 6 months (1 January – 30 June) of the 2020 financial year the Group carried 2.0 million passengers which is 56.6% less compared to the same period last year. The Group’s unaudited revenue for the period decreased by 49.4% and amounted to EUR 219.9 million. Unaudited EBITDA for the first 6 months was EUR 1.2 million (EUR 54.5 million, 6 months 2019) and unaudited net loss was EUR 57.6 million (EUR 10.4 million, 6 months 2019 net loss).
The financial result of the first 6 months of 2020 was impacted by following factors:
- Suspended operations of vessels and hotels due to the Covid-19 situation and the travel restrictions from mid-March.
- Dockings of six ships totalling 79 days (total of 121 docking days in the first 6 months of 2019)

7 | 35
Interim report Q2 2020
Management report
Investments The Group’s investments in the second quarter of 2020 amounted to EUR 14.4 million with the majority arising from the EUR 8.5 million purchase of a ro-pax vessel Sailor. Investments were made in the ships’ technical maintenance, including works performed during Silja Serenade 10 docking days in April.
Investments were also made in the development of the online booking and sales systems as well as other administrative systems and in relation to the opening of four Burger King restaurants.
Dividends Due to a deteriorated operating environment and considering the Company’s long-term interests, the Supervisory Board proposed to the shareholders’ annual general meeting not to pay dividends from net profit for 2019. On 30 July 2020 (third quarter), the shareholders’ annual general meeting decided not to pay dividends from net profit for 2019.
Financial position In the second quarter, the Group’s net debt increased by EUR 19.2 million to EUR 593.8 million and the net debt to EBITDA ratio was 5.0 at the reporting date.
At the end of the second quarter, total liquidity buffer (cash, cash equivalents and unused overdraft facilities) amounted to EUR 104.9 million (EUR 123.1 million at 30 June 2019).
At 30 June 2020, the Group’s cash and cash equivalents amounted to EUR 21.9 million (EUR 67.1 million at 30 June 2019) and the Group had EUR 83.0 million in unused overdraft facilities (EUR 56.0 million at 30 June 2019).
The Group’s
investments in Q2 amounted to
EUR 14.4 million

8 | 35
Interim report Q2 2020
Management report
Key figures
1 Alternative performance measures based on ESMA guidelines are disclosed in the Alternative Performance Measures
section of this Interim Report. 2 Does not include additions to right-of-use assets.
For the period Q2 2020 Q2 2019 Change %
Revenue (million euros) 65.0 256.1 -74.6%
Gross profit/loss (million euros) -21.9 60.6 -136.1%
EBITDA¹ (million euros) 2.4 50.7 -95.2%
EBIT¹ (million euros) -22.7 27.4 -183.0%
Net profit/loss for the period (million euros) -27.4 14.9 -283.8%
Depreciation and amortisation (million euros) 25.2 23.3 7.9%
Capital expenditures¹ ²(million euros) 14.4 18.5 -22.0%
Weighted average number of ordinary shares outstanding 669 882 040 669 882 040 0.0%
Earnings/loss per share¹ -0.041 0.022 -283.8%
Number of passengers 388 212 2 651 843 -85.4%
Number of cargo units 86 755 99 546 -12.8%
Average number of employees 6 578 7 363 -10.7%
As at 30.06.2020 31.03.2020 Change %
Total assets (million euros) 1 505.9 1 517.8 -0.8%
Total liabilities (million euros) 740.5 724.5 2.2%
Interest-bearing liabilities (million euros) 615.7 591.0 4.2%
Net debt¹ (million euros) 593.8 574.5 3.3%
Net debt to EBITDA¹ 5.0 3.5 45.7%
Total equity (million euros) 765.3 793.2 -3.5%
Equity ratio¹ (%) 51% 52%
Number of ordinary shares outstanding 669 882 040 669 882 040 0.0%
Equity per share¹ 1.14 1.18 -3.5%
Ratios¹ Q2 2020 Q2 2019
Gross margin (%) -33.7% 23.7%
EBITDA margin (%) 3.7% 19.8%
EBIT margin (%) -35.0% 10.7%
Net profit/loss margin (%) -42.1% 5.8%
ROA (%) 1.3% 4.0%
ROE (%) 0.3% 4.1%
ROCE (%) 1.5% 4.9%

9 | 35
Interim report Q2 2020
Management report
Sales & results by segments The following tables provide an overview of the quarterly sales and result development by geographical segments.
¹ Segment result is the result before administrative expenses, finance costs and taxes.
Q2 2019 Q3 2019 Q4 2019 Q1 2020 Q2 2020 Q2 Change
Passengers (thousands) 1 385 1 534 1 200 848 323 -76.7%
Cargo units (thousands) 64 60 58 65 60 -6.9%
Revenue (million euros) 94.9 102.2 86.5 59.2 33.6 -64.6%
Segment result¹ (million euros) 21.5 33.0 18.9 3.3 -2.4 -111.0%
Passengers (thousands) 772 882 676 470 54 -93.0%
Cargo units (thousands) 20 19 20 21 18 -8.7%
Revenue (million euros) 89.6 106.4 80.5 57.2 16.2 -81.9%
Segment result¹ (million euros) 9.3 20.6 2.0 -8.2 -18.4 -298.0%
Passengers (thousands) 271 302 224 141 8 -96.9%
Cargo units (thousands) 12 11 11 11 9 -25.1%
Revenue (million euros) 31.3 36.0 26.4 17.2 5.2 -83.4%
Segment result¹ (million euros) 2.3 7.1 -0.1 -4.7 -4.9 -309.3%
Passengers (thousands) 223 257 181 109 3 -98.5%
Cargo units (thousands) 4 4 4 3 0 -89.4%
Revenue (million euros) 20.0 23.8 16.1 10.1 1.3 -93.4%
Segment result¹ (million euros) 0.3 5.3 -0.9 -5.3 -4.2 -1505.9%
Revenue (million euros) 22.2 22.4 18.5 12.5 8.7 -60.8%
Segment result¹ (million euros) 8.0 5.6 2.8 0.8 0.6 -93.1%
Intersegment revenue (million euros) -1.9 -3.0 -1.6 -1.3 -0.1 95.2%
Total revenue (million euros) 256.1 287.8 226.4 154.9 65.0 -74.6%
EBITDA (million euros) 50.7 83.2 33.4 -1.3 2.4 -95.2%
Total segment result¹ (million euros) 41.4 71.6 22.7 -14.1 -29.2 -170.5%
Net profit/loss 14.9 54.6 5.5 -30.2 -27.4 -283.8%
Estonia - Finland
Finland - Sweden
Estonia - Sweden
Latvia - Sweden
Other
10 | 35
Interim report Q2 2020
Management report
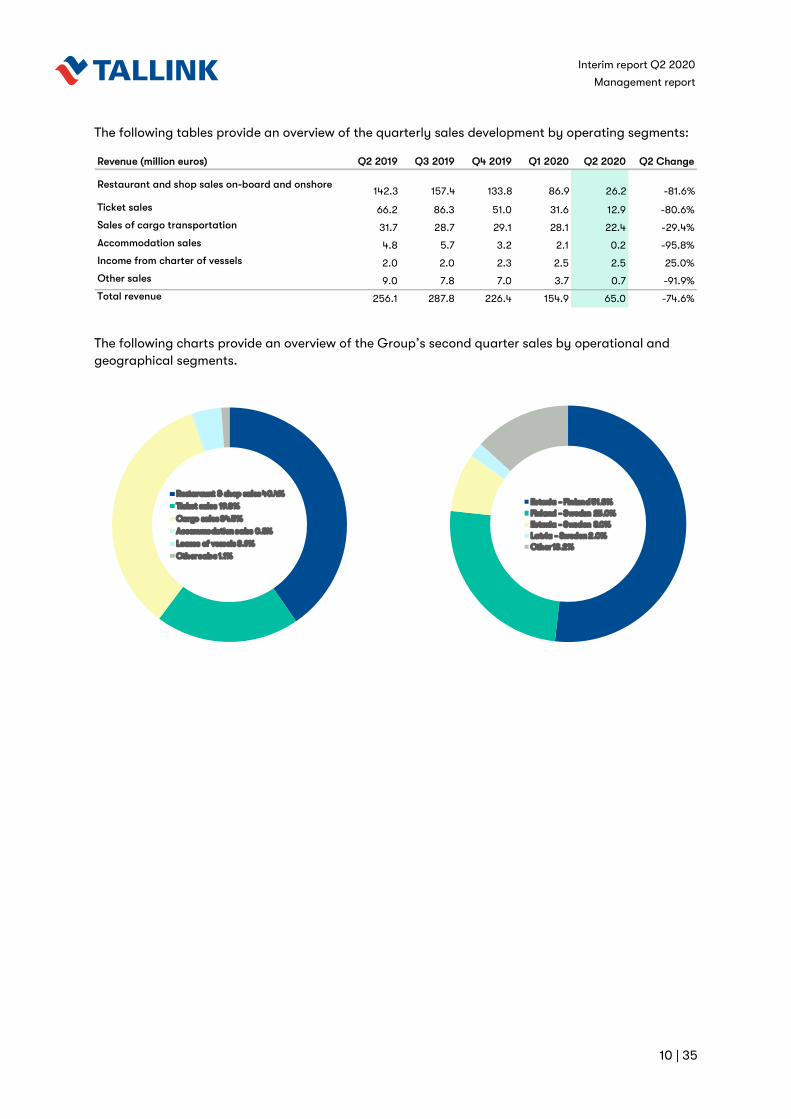
The following tables provide an overview of the quarterly sales development by operating segments:
The following charts provide an overview of the Group’s second quarter sales by operational and geographical segments.
Q2 2019 Q3 2019 Q4 2019 Q1 2020 Q2 2020 Q2 Change
142.3 157.4 133.8 86.9 26.2 -81.6%
66.2 86.3 51.0 31.6 12.9 -80.6%
31.7 28.7 29.1 28.1 22.4 -29.4%
4.8 5.7 3.2 2.1 0.2 -95.8%
2.0 2.0 2.3 2.5 2.5 25.0%
9.0 7.8 7.0 3.7 0.7 -91.9%
256.1 287.8 226.4 154.9 65.0 -74.6%
Accommodation sales
Income from charter of vessels
Other sales
Total revenue
Revenue (million euros)
Restaurant and shop sales on-board and onshore
Ticket sales
Sales of cargo transportation
Restaraunt & shop sales 40.4%
Ticket sales 19.8%
Cargo sales 34.5%
Accommodation sales 0.3%
Leases of vessels 3.9%
Other sales 1.1%
Estonia - Finland 51.8%Finland - Sweden 25.0%Estonia - Sweden 8.0%Latvia - Sweden 2.0%Other 13.2%

11 | 35
Interim report Q2 2020
Management report
Market developments The following table provides an overview of the passengers, cargo units and passenger vehicles transported during the second quarter of 2020 and 2019.
The Group’s market shares on the routes operated during the 12-month period ended 30 June 2020 were as follows:
- the Group carried approximately 57% of the passengers and 60% of the ro-ro cargo on the route between Tallinn and Helsinki;
- the Group carried approximately 55% of the passengers and 28% of the ro-ro cargo on the routes between Finland and Sweden;
- the Group was the only provider of daily passenger transportation between Estonia and Sweden*;
- the Group was the only provider of daily passenger and ro-ro cargo transportation between Riga and Stockholm*.
* Daily operations suspended since mid-March 2020.
Passengers Q2 2020 Q2 2019 ChangeJan-Jun
2020Jan-Jun
2019 Change
Estonia - Finland 322 590 1 385 108 -76.7% 1 170 408 2 382 090 -50.9%
Finland - Sweden 53 984 771 894 -93.0% 523 591 1 336 896 -60.8%
Estonia - Sweden 8 337 271 407 -96.9% 148 881 426 923 -65.1%
Latvia - Sweden 3 301 223 434 -98.5% 112 062 361 706 -69.0%
Total 388 212 2 651 843 -85.4% 1 954 942 4 507 615 -56.6%
Cargo units Q2 2020 Q2 2019 ChangeJan-Jun
2020Jan-Jun
2019 Change
Estonia - Finland 59 580 63 995 -6.9% 124 319 123 761 0.5%
Finland - Sweden 18 097 19 814 -8.7% 38 671 39 475 -2.0%
Estonia - Sweden 8 631 11 522 -25.1% 19 709 21 160 -6.9%
Latvia - Sweden 447 4 215 -89.4% 3 673 8 264 -55.6%
Total 86 755 99 546 -12.8% 186 372 192 660 -3.3%
Passenger vehicles Q2 2020 Q2 2019 ChangeJan-Jun
2020Jan-Jun
2019 Change
Estonia - Finland 94 427 223 485 -57.7% 245 919 394 996 -37.7%
Finland - Sweden 6 937 43 093 -83.9% 26 937 62 531 -56.9%
Estonia - Sweden 215 16 899 -98.7% 9 059 27 268 -66.8%
Latvia - Sweden 900 16 000 -94.4% 10 856 28 769 -62.3%
Total 102 479 299 477 -65.8% 292 771 513 564 -43.0%

12 | 35
Interim report Q2 2020
Management report
Group structure At the reporting date, the Group consisted of 47 companies. All subsidiaries are wholly owned by Tallink Grupp AS. The following diagram represents the Group’s structure at the reporting date:
The Group also owns 34% of Tallink Takso AS.
Tallink Silja Gmbh Sales agent in Germany
Sally Ab Sales agent in Åland
Hera Salongid OÜ Sale of beauty products
TLG Hotell OÜ Hotel operator
Tallink Latvija AS Sales & Marketing and
crewing in Latvia
Tallink Baltic AS Including registered
branch office in Poland Cargo sales
Tallink AS Riga-Stockholm route
Tallink Ru OOO Sales & Marketing
in Russia
Tallink Silja Ab Sales & Marketing in
Sweden
Tallink Superfast Ltd Dormant
Baltic SF IX Ltd ”Atlantic Marine”
Tallink Fast Ltd ”Baltic Princess”
Tallink Ltd ”Romantika”
Tallink Sea Line Ltd ”Galaxy”
Tallink Victory Line Ltd ”Victoria I”
Tallink High Speed Line Ltd
”Baltic Queen”
Tallinn-Helsinki Line Ltd ”Regal Star”
Baltic SF VII Ltd ”Silja Europa”
Baltic SF VIII Ltd Dormant
Tallinn Swedish Line Ltd ”Silja Symphony”
”Sea Wind”
Tallink Line Ltd ”Megastar”
Ship-owning companies
Tallink Grupp AS Holding & Operating company
Sales & Operations Service companies
Tallink Hansaway Ltd ”Star”
AS Tallink Duty Free Supply of goods
TLG Hotel Latvija SIA Hotel operator
Tallink Travel Club OÜ Travel services
HT Laevateenindus OÜ Technical ship
Management & crewing
HT Shipmanagement SIA
Technical ship management in Latvia
Baltic Retail OÜ Retail sales
HTG Stevedoring OY Stevedoring services
Hansatee Kinnisvara OÜ Lease of vehicles
Hansaliin OÜ Crewing
HT Meelelahutus OÜ Entertainment on ships
Ingleby (1699) Ltd Process agent
Mare Catering OÜ Catering services
Baan Thai OÜ Catering services
Tallink Silja OY Sales & Marketing in Finland
Tallink Scandinavian AS Holding company
LNG Shipmanagement OÜ
Crewing services
TLG Stividor OÜ Stevedoring services
Tallink Asia PTE. LTD. Retail sales
Tallink Autoexpress Ltd ”Silja Serenade”
Hansalink Ltd ”Isabelle”
Tallink Fast Food OÜ Catering services
Tallink Fast Food Latvia SIA
Catering services
Tallink Fast Food Lithuania UAB
Catering services
SIA BK Properties Real estate holding

13 | 35
Interim report Q2 2020
Management report
Personnel At 30 June 2020, the Group had 6 545 employees (7 704 at 30 June 2019). The following table provides a more detailed overview of the Group’s personnel.
1 The number of hotel personnel is not included in the total number of onshore personnel.
Shareholders & share price development The following chart displays the shareholder structure of Tallink Grupp AS as at 30 June 2020.
2020 2019 Change 2020 2019 Change 2020 2019 Change
Onshore total 1 594 1 691 -5.7% 1 614 1 658 -2.7% 1 607 1 707 -5.9%
Estonia 963 1 000 -3.7% 977 971 0.6% 982 1 008 -2.6%
Finland 415 455 -8.8% 417 446 -6.5% 412 465 -11.4%
Sweden 135 151 -10.6% 136 155 -12.3% 133 147 -9.5%
Latvia 63 67 -6.0% 65 68 -4.4% 62 69 -10.1%
Russia 13 12 8.3% 13 12 8.3% 12 12 0.0%
Germany 5 6 -16.7% 6 6 0.0% 6 6 0.0%
Onboard 4 588 5 142 -10.8% 4 770 5 059 -5.7% 4 586 5 430 -15.5%
Hotel¹ 396 530 -25.3% 438 513 -14.6% 352 567 -37.9%
Total 6 578 7 363 -10.7% 6 822 7 230 -5.7% 6 545 7 704 -15.0%
Average of Q2 Average of Jan-Jun End of Q2
Infortar AS 39.2%
Baltic Cruises Holding L.P. 16.1%
ING Luxembourg S.A. AIF Acc. 6.6%
Baltic Cruises Investment L.P. 5.5%
Other Shareholders 32.6%

14 | 35
Interim report Q2 2020
Management report
The shares of Tallink Grupp AS have been listed on the Nasdaq Tallinn stock exchange since 9 December 2005, where the shares are traded under the ticker symbol TAL1T. Starting from 3 December 2018, the shares of Tallink Grupp AS are listed as Finnish Depository Receipts (FDRs) also on Nasdaq Helsinki stock exchange, where the FDRs are traded under the ticker symbol TALLINK. At the reporting date the closing share price on Nasdaq Baltic was EUR 0.77 and the closing price of the FDR on Nasdaq Helsinki was EUR 0.77. The following charts give an overview of the share and FDR price and turnover developments in the past twelve months.
0,60
0,65
0,70
0,75
0,80
0,85
0,90
0,95
1,00
1,05
07/2019 08/2019 09/2019 10/2019 11/2019 12/2019 01/2020 02/2020 03/2020 04/2020 05/2020 06/2020
Share price in EUR
Share price in EUR FDR price in EUR
0
500
1 000
1 500
2 000
07/2019 08/2019 09/2019 10/2019 11/2019 12/2019 01/2020 02/2020 03/2020 04/2020 05/2020 06/2020
Daily turnover thousand EUR
Daily turnover thousand EUR FDR daily turnover thousand EUR
15 | 35
Interim report Q2 2020
Management report
Key Management Personnel
Supervisory Board
The Supervisory Board of Tallink Grupp AS consists of seven members and includes:
- Mr Enn Pant, Chairman - Mr Toivo Ninnas - Ms Eve Pant - Mr Ain Hanschmidt - Mr Colin Douglas Clark - Mr Kalev Järvelill - Mr Raino Paron
Management Board
The Management Board of Tallink Grupp AS operates with five members and includes:
- Mr Paavo Nõgene, Chairman - Mr Lembit Kitter - Mrs Kadri Land - Mr Harri Hanschmidt - Mrs Piret Mürk-Dubout
Economic Environment The Group considers Finland, Sweden, Estonia and Latvia its home markets with the most exposure to the economic developments in Finland. The Group has also high exposure to the economic developments in Estonia and Sweden.
In the second quarter of 2020 the Group’s economic environment was dominated by the Covid-19 pandemic outbreak and the related restrictions set by governments. According to the OECD data, the confidence of both the consumers and the businesses plummeted across all our home markets during the quarter, particularly in Estonia and Latvia.
For the Group the weaker consumer confidence reflected mainly in the lower demand for travelling. The demand was also hindered by the imposed travelling and movement restrictions. The international travel restrictions and reduced air traffic also effectively meant the absence of demand from the customers from outside our home markets.
The Covid-19 situation improved enough for gradually lifting the majority of the restrictions on all our other home markets, except for Sweden, allowing to restart of some of our passenger operations toward the end of the quarter. The state-level travelling and border-crossing restrictions effectively allowed to offer only international cargo operations to and from Sweden.
Although the cargo market fared somewhat better relative to the passenger business the Covid-19 impact is felt in this area too. Along with the tight competition, the decreased business confidence materialised as decline both in the number of cargo units and in the average revenue per unit.
Measured in euros the global fuel prices declined, on average, by 54% in the second quarter of 2020 compared to a year ago. The Group’s overall fuel cost declined by 56% compared to the same period last year. In addition to the change in the fuel market price, the change in the cost was affected by the number and timing of trips as well as an existing fuel price agreement with the price fixed above the market level.
For the foreseeable future, the key risk has to do with global and regional developments with the Covid-19 situation and related restrictions on travel and other economic activities, its economic damage and its impact on local and international trade.

16 | 35
Interim report Q2 2020
Management report
Events in Q2
Start of construction of the new shuttle vessel MyStar The physical production process of MyStar started on 6 April 2020 in Rauma shipyard in Finland with a traditional steel cutting ceremony.
Changes in the Audit Committee Luke Staniczek was recalled from the Audit Committee and from 17 April, the Audit Committee continued with three members including Meelis Asi (Chairman of the Audit Committee), Ain Hanschmidt and Mare Puusaag.
Changes in the Group structure In April 2020, TLG Agent OÜ, a wholly-owned subsidiary of the Group, was renamed LNG Shipmanagement OÜ. The main activity of the subsidiary is to provide crewing service.
In June 2020, Tallink Latvija AS, a wholly-owned subsidiary of the Group, registered a wholly-owned subsidiary in Latvia – SIA BK Properties. The purpose of founding the subsidiary is acquisition and holding of real estate properties for the operation of Burger King restaurants in Latvia.
Charter agreement extension In May 2020, Baltic SF IX Limited, a wholly-owned subsidiary of the Group, and Marine Atlantic Inc, a Canadian company with the state participation therein, concluded to extend the current charter agreement of MV Atlantic Vision (ex. Superfast IX) for two years, until November 2022. The vessel has been on the long-term bareboat charter since 14 November 2008.
Increase of overdraft limit In the second quarter, the Group extended its existing overdraft facility with Danske Bank A/S by EUR 20.0 million and Nordea Bank Abp by EUR 20.0 million. After the reporting date, in July 2020, extension of overdraft facility with SEB Pank AS by EUR 20.0 million was finalized. The increase of the overdraft facilities helps to improve the Group’s liquidity.
Changes in loan agreements Amendments to loan facility agreements signed by Tallink Grupp AS and all its lending banks whereby loan principal repayments in the amount of EUR 61 million for the year 2020 are deferred and added to the last payment of each respective loan facility came into force on 29 May 2020. The loans' final maturities and interest margins remained unchanged. Request for waivers of loan covenants were also approved.
The repayment rescheduling improved significantly the Group's liquidity position and increased flexibility to maintain sufficient working capital in challenging economic environment.
Signing of the loan agreement On 8 June 2020, Tallink Grupp AS and KredEx SA signed a working capital loan agreement. The total amount of the loan limit is EUR 100 million and the loan can be drawn in EUR 10-40 million tranches. The interest rate of the three-year maturity loan is 12-month Euribor +2%.
The loan is secured by mortgages on five vessels ranking after the existing creditors.
Purchase of ro-pax vessel Sailor On 30 June 2020, Baltic SF VIII Ltd, a subsidiary of the Group purchased a ro-pax vessel Sailor from Navirail OÜ. The ship is registered in the Cyprus Ship Registry and is going to sail under the Estonian flag. The purchase of the ro-pax vessel will strengthen the Group fleet’s cargo capacity.
Fuel price risk management In the first quarter of 2020, the Group entered into agreements with its main fuel suppliers and fixed the purchase price of fuel equivalent to about 65% of its total estimated fuel volume for 2020. Due to

17 | 35
Interim report Q2 2020
Management report
the Covid-19 situation, more flexible terms were negotiated and agreed with one of the fuel suppliers in April.
Opening of Burger King restaurants The Group opened its first three Burger King restaurants in Tallinn on 20 May 2020. The fourth restaurant was opened on 15 June 2020. The Group has secured the locations of its first Burger King restaurants in Latvia and Lithuania, to be opened in the second half of 2020.
Events after the reporting period and outlook
Prepayment for the new shuttle vessel MyStar The last prepayment instalments for the new shuttle vessel MyStar in the total amount of EUR 49.4 million will be made in the third quarter of 2020.
Dividends On 30 July 2020, the shareholders’ general meeting decided not to pay dividend from net profit for 2019.
Renovation of Tallink City Hotel Tallink City Hotel in Tallinn will undergo a full-scale renovation from September 2020. The renovation works are estimated to be finalised by the end of May 2021 and the hotel reopened in June next year.
Earnings The Group’s earnings are not generated evenly throughout the year. The summer period is the high season in the Group’s operations. In management’s opinion and based on prior experience most of the Group’s earnings are generated during the summer (June-August).
Due to the ongoing Covid-19 situation the earnings outlook for 2020 has become uncertain and will be largely subject to external factors such as the states’ decisions regarding the timing of lifting of the travel restrictions, allowing passenger traffic as well as the duration of the recovery period. In the opinion of the Management Board the Group will not earn profits in 2020 financial year.
Research and development projects Tallink Grupp AS does not have any substantial ongoing research and development projects. The Group is continuously seeking opportunities for expanding its operations in order to improve its results.
The Group is continuously looking for innovative ways to upgrade the ships and passenger area technology to improve its overall performance through modern solutions. The most recent project, in collaboration with ports in the Baltic Sea area and supported by the Connecting Europe Facility (CEF) fund, involves making preparations for the use of high-voltage shore connection during the vessels’ port stays. Another ongoing collaboration project with Tallinn University of Technology (TalTech) involves the development of smart car deck solutions.
In addition, the Group is participating in a programme, funded by the European Space Agency, with a goal to develop techniques for autonomous navigation for ships, using a combination of different sensors, machine learning and artificial intelligence.

18 | 35
Interim report Q2 2020
Management report
Risks The Group’s business, financial position and operating results could be materially affected by various risks. These risks are not the only ones we face. Additional risks and uncertainties not presently known to us, or that we currently believe are immaterial or unlikely, could also impair our business. The order of presentation of the risk factors below is not intended to be an indication of the probability of their occurrence or of their potential effect on our business.
- Covid-19 situation and developments - Accidents, disasters - Macroeconomic developments - Changes in laws and regulations - Relations with trade unions - Increase in the fuel prices and interest rates - Market and customer behaviour

19 | 35
Interim report Q2 2020
Management board’s confirmation
MANAGEMENT BOARD’S CONFIRMATION We confirm that to the best of our knowledge, the management report of Tallink Grupp AS for the second quarter of 2020 presents a true and fair view of the Group’s development, results and financial position and includes an overview of the main risks and uncertainties.
Paavo Nõgene Chairman of the Management Board
Lembit Kitter Member of the Management Board
Kadri Land Member of the Management Board
Harri Hanschmidt Member of the Management Board Piret Mürk-Dubout Member of the Management Board
Tallinn, 6 August 2020
20 | 35
Interim report Q2 2020
Unaudited condensed consolidated interim financial statements
UNAUDITED CONDENSED CONSOLIDATED INTERIM FINANCIAL STATEMENTS
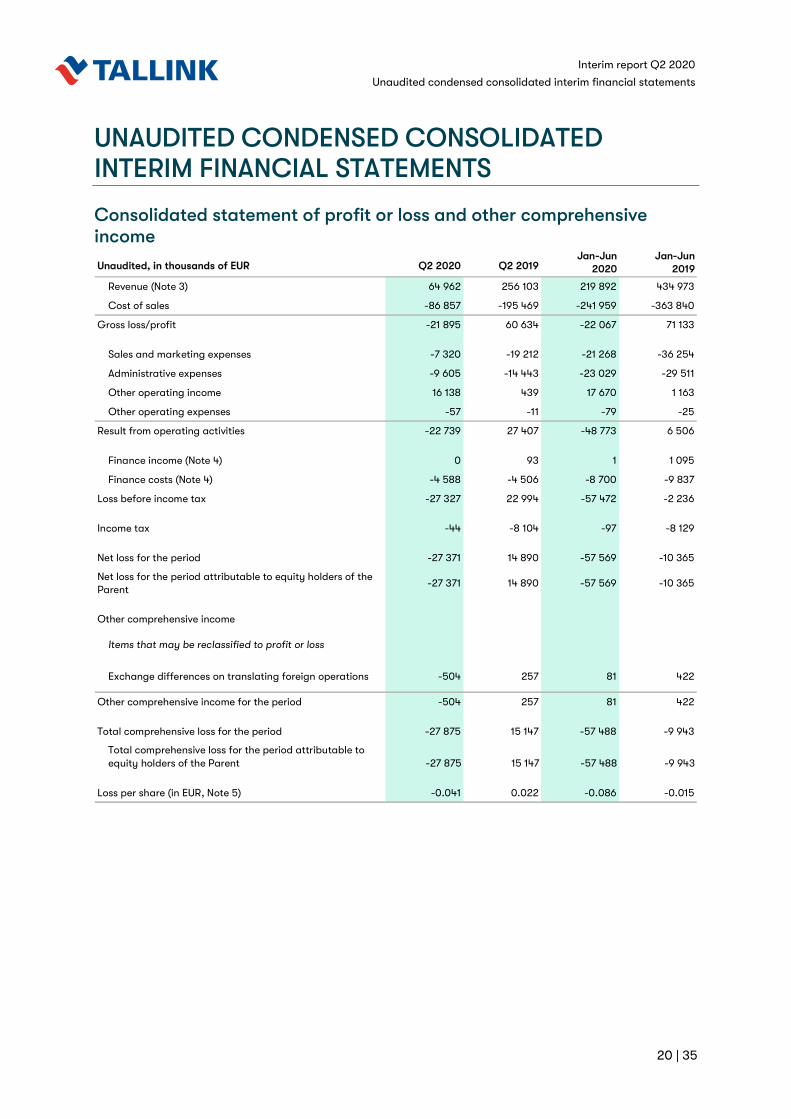
Consolidated statement of profit or loss and other comprehensive income
Unaudited, in thousands of EUR Q2 2020 Q2 2019Jan-Jun
2020Jan-Jun
2019
Revenue (Note 3) 64 962 256 103 219 892 434 973
Cost of sales -86 857 -195 469 -241 959 -363 840
Gross loss/profit -21 895 60 634 -22 067 71 133
Sales and marketing expenses -7 320 -19 212 -21 268 -36 254
Administrative expenses -9 605 -14 443 -23 029 -29 511
Other operating income 16 138 439 17 670 1 163
Other operating expenses -57 -11 -79 -25
Result from operating activities -22 739 27 407 -48 773 6 506
Finance income (Note 4) 0 93 1 1 095
Finance costs (Note 4) -4 588 -4 506 -8 700 -9 837
Loss before income tax -27 327 22 994 -57 472 -2 236
Income tax -44 -8 104 -97 -8 129
Net loss for the period -27 371 14 890 -57 569 -10 365
Net loss for the period attributable to equity holders of the Parent
-27 371 14 890 -57 569 -10 365
Other comprehensive income
Items that may be reclassified to profit or loss
Exchange differences on translating foreign operations -504 257 81 422
Other comprehensive income for the period -504 257 81 422
Total comprehensive loss for the period -27 875 15 147 -57 488 -9 943
Total comprehensive loss for the period attributable to equity holders of the Parent -27 875 15 147 -57 488 -9 943
Loss per share (in EUR, Note 5) -0.041 0.022 -0.086 -0.015
21 | 35
Interim report Q2 2020
Unaudited condensed consolidated interim financial statements
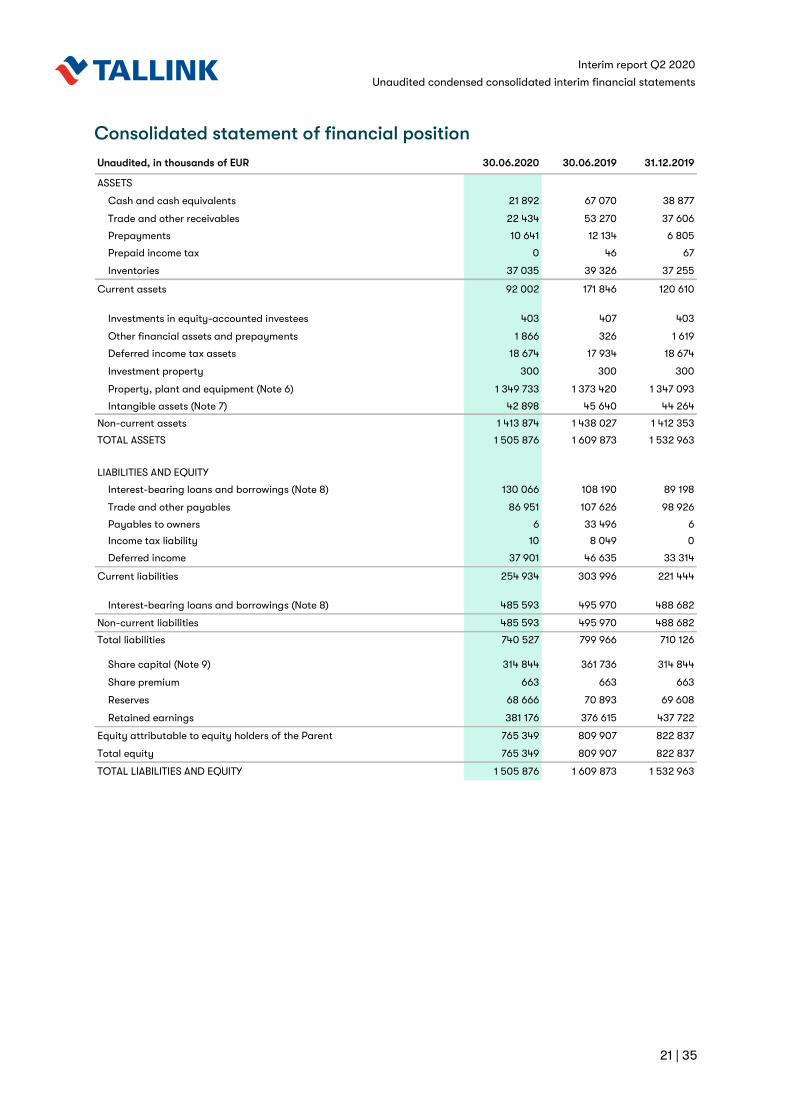
Consolidated statement of financial position
Unaudited, in thousands of EUR 30.06.2020 30.06.2019 31.12.2019
ASSETS
Cash and cash equivalents 21 892 67 070 38 877
Trade and other receivables 22 434 53 270 37 606
Prepayments 10 641 12 134 6 805
Prepaid income tax 0 46 67
Inventories 37 035 39 326 37 255
Current assets 92 002 171 846 120 610
Investments in equity-accounted investees 403 407 403
Other financial assets and prepayments 1 866 326 1 619
Deferred income tax assets 18 674 17 934 18 674
Investment property 300 300 300
Property, plant and equipment (Note 6) 1 349 733 1 373 420 1 347 093
Intangible assets (Note 7) 42 898 45 640 44 264
Non-current assets 1 413 874 1 438 027 1 412 353
TOTAL ASSETS 1 505 876 1 609 873 1 532 963
LIABILITIES AND EQUITY
Interest-bearing loans and borrowings (Note 8) 130 066 108 190 89 198
Trade and other payables 86 951 107 626 98 926
Payables to owners 6 33 496 6
Income tax liability 10 8 049 0
Deferred income 37 901 46 635 33 314
Current liabilities 254 934 303 996 221 444
Interest-bearing loans and borrowings (Note 8) 485 593 495 970 488 682
Non-current liabilities 485 593 495 970 488 682
Total liabilities 740 527 799 966 710 126
Share capital (Note 9) 314 844 361 736 314 844
Share premium 663 663 663
Reserves 68 666 70 893 69 608
Retained earnings 381 176 376 615 437 722
Equity attributable to equity holders of the Parent 765 349 809 907 822 837
Total equity 765 349 809 907 822 837
TOTAL LIABILITIES AND EQUITY 1 505 876 1 609 873 1 532 963
22 | 35
Interim report Q2 2020
Unaudited condensed consolidated interim financial statements
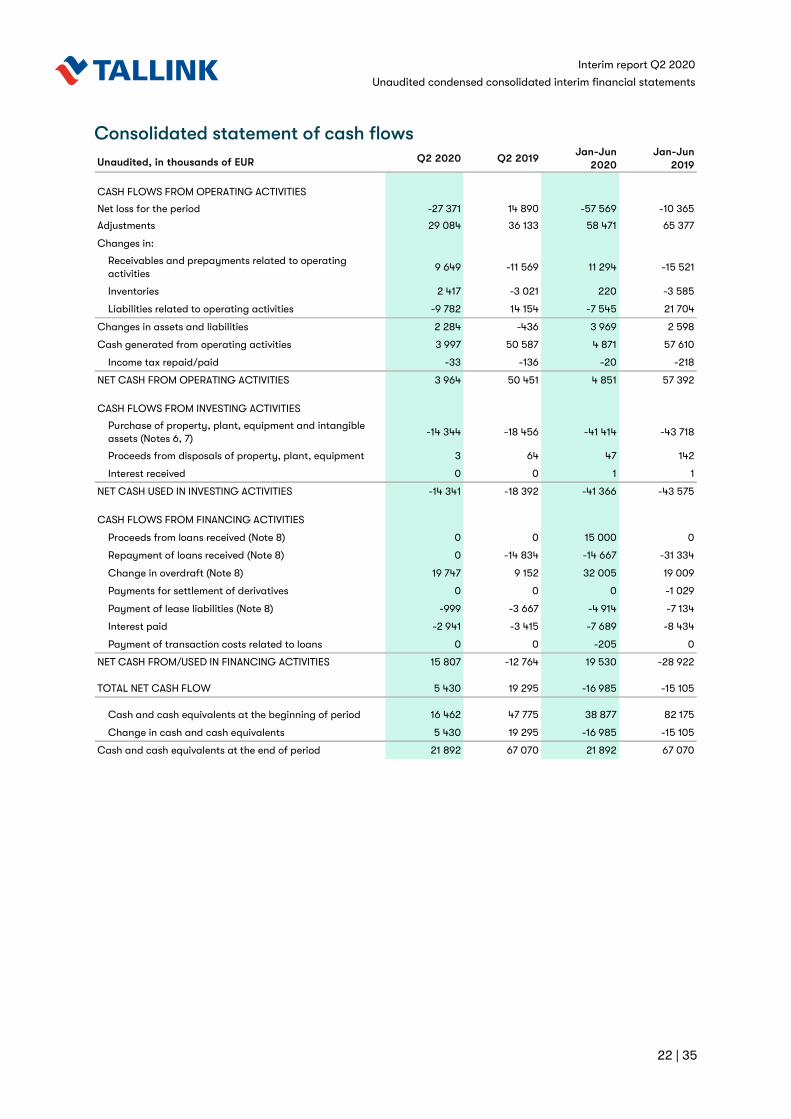
Consolidated statement of cash flows
Unaudited, in thousands of EUR Q2 2020 Q2 2019Jan-Jun
2020Jan-Jun
2019
CASH FLOWS FROM OPERATING ACTIVITIES
Net loss for the period -27 371 14 890 -57 569 -10 365
Adjustments 29 084 36 133 58 471 65 377
Changes in:
Receivables and prepayments related to operating activities
9 649 -11 569 11 294 -15 521
Inventories 2 417 -3 021 220 -3 585
Liabilities related to operating activities -9 782 14 154 -7 545 21 704
Changes in assets and liabilities 2 284 -436 3 969 2 598
Cash generated from operating activities 3 997 50 587 4 871 57 610
Income tax repaid/paid -33 -136 -20 -218
NET CASH FROM OPERATING ACTIVITIES 3 964 50 451 4 851 57 392
CASH FLOWS FROM INVESTING ACTIVITIES
Purchase of property, plant, equipment and intangible assets (Notes 6, 7)
-14 344 -18 456 -41 414 -43 718
Proceeds from disposals of property, plant, equipment 3 64 47 142
Interest received 0 0 1 1
NET CASH USED IN INVESTING ACTIVITIES -14 341 -18 392 -41 366 -43 575
CASH FLOWS FROM FINANCING ACTIVITIES
Proceeds from loans received (Note 8) 0 0 15 000 0
Repayment of loans received (Note 8) 0 -14 834 -14 667 -31 334
Change in overdraft (Note 8) 19 747 9 152 32 005 19 009
Payments for settlement of derivatives 0 0 0 -1 029
Payment of lease liabilities (Note 8) -999 -3 667 -4 914 -7 134
Interest paid -2 941 -3 415 -7 689 -8 434
Payment of transaction costs related to loans 0 0 -205 0
NET CASH FROM/USED IN FINANCING ACTIVITIES 15 807 -12 764 19 530 -28 922
TOTAL NET CASH FLOW 5 430 19 295 -16 985 -15 105
Cash and cash equivalents at the beginning of period 16 462 47 775 38 877 82 175
Change in cash and cash equivalents 5 430 19 295 -16 985 -15 105
Cash and cash equivalents at the end of period 21 892 67 070 21 892 67 070
23 | 35
Interim report Q2 2020
Unaudited condensed consolidated interim financial statements
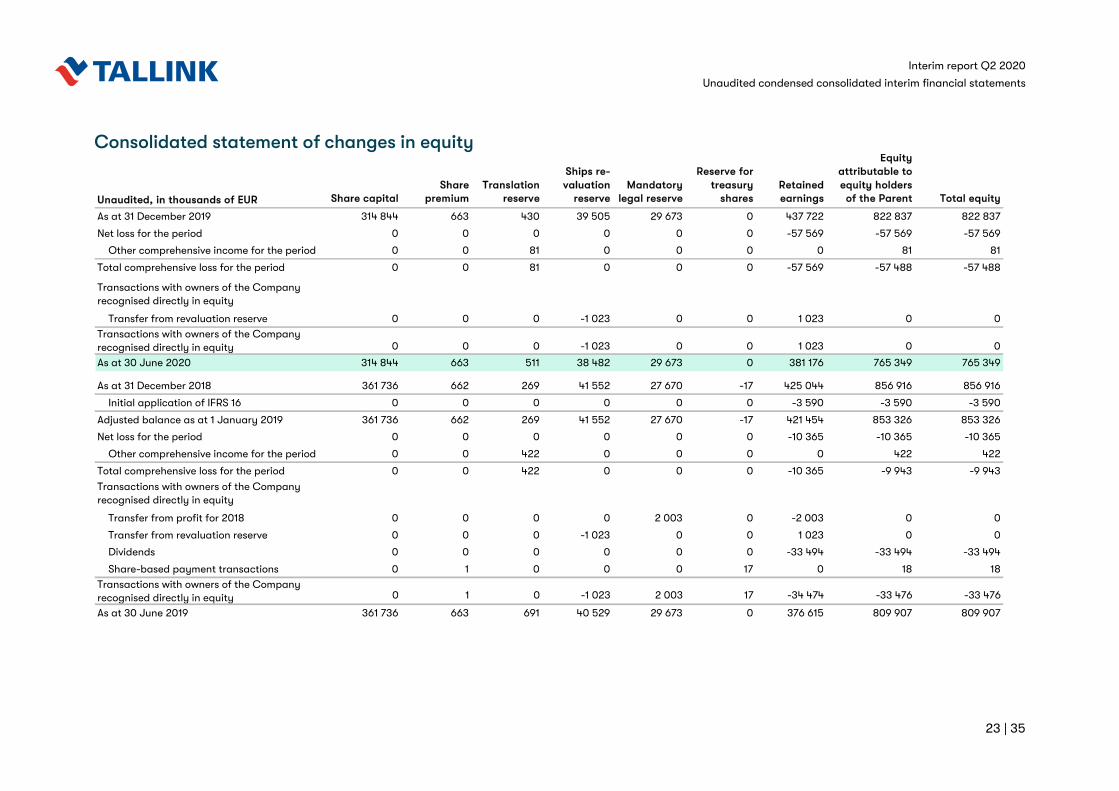
Consolidated statement of changes in equity
Unaudited, in thousands of EUR Share capitalShare
premium Translation
reserve
Ships re-valuation
reserveMandatory
legal reserve
Reserve for treasury
sharesRetained earnings
Equity attributable to equity holders
of the Parent Total equity
As at 31 December 2019 314 844 663 430 39 505 29 673 0 437 722 822 837 822 837
Net loss for the period 0 0 0 0 0 0 -57 569 -57 569 -57 569
Other comprehensive income for the period 0 0 81 0 0 0 0 81 81
Total comprehensive loss for the period 0 0 81 0 0 0 -57 569 -57 488 -57 488
Transactions with owners of the Company recognised directly in equity
Transfer from revaluation reserve 0 0 0 -1 023 0 0 1 023 0 0
Transactions with owners of the Company recognised directly in equity 0 0 0 -1 023 0 0 1 023 0 0
As at 30 June 2020 314 844 663 511 38 482 29 673 0 381 176 765 349 765 349
As at 31 December 2018 361 736 662 269 41 552 27 670 -17 425 044 856 916 856 916
Initial application of IFRS 16 0 0 0 0 0 0 -3 590 -3 590 -3 590
Adjusted balance as at 1 January 2019 361 736 662 269 41 552 27 670 -17 421 454 853 326 853 326
Net loss for the period 0 0 0 0 0 0 -10 365 -10 365 -10 365
Other comprehensive income for the period 0 0 422 0 0 0 0 422 422
Total comprehensive loss for the period 0 0 422 0 0 0 -10 365 -9 943 -9 943
Transactions with owners of the Company recognised directly in equity
Transfer from profit for 2018 0 0 0 0 2 003 0 -2 003 0 0
Transfer from revaluation reserve 0 0 0 -1 023 0 0 1 023 0 0
Dividends 0 0 0 0 0 0 -33 494 -33 494 -33 494
Share-based payment transactions 0 1 0 0 0 17 0 18 18
Transactions with owners of the Company recognised directly in equity 0 1 0 -1 023 2 003 17 -34 474 -33 476 -33 476
As at 30 June 2019 361 736 663 691 40 529 29 673 0 376 615 809 907 809 907

24 | 35
Interim report Q2 2020
Notes to the condensed consolidated interim financial statements
NOTES TO THE CONDENSED CONSOLIDATED INTERIM FINANCIAL STATEMENTS
Note 1 Corporate information
The consolidated interim financial statements of Tallink Grupp AS (the “Parent”) and its subsidiaries (together referred to as the “Group”) for the second quarter of 2020 were authorised for issue by the Management Board on 6 August 2020.
Tallink Grupp AS is a public limited company incorporated and domiciled in Estonia, with a registered office at Sadama 5, Tallinn. Tallink Grupp AS shares have been publicly traded on the Nasdaq Tallinn Stock Exchange since 9 December 2005. Starting from 3 December 2018 the shares of Tallink Grupp AS are also listed as Finnish Depository Receipts (FDRs) on the Nasdaq Helsinki Stock Exchange.
The principal activities of the Group are related to marine transportation in the Baltic Sea (passenger and cargo transportation). As at 30 June 2020, the Group employed 6 545 people (7 704 as at 30 June 2019).
Note 2 Basis of preparation
These interim consolidated financial statements of Tallink Grupp AS have been prepared in a condensed form in accordance with International Accounting Standard (IAS) 34 “Interim Financial Reporting”.
These interim consolidated financial statements have been prepared using the same accounting policies and measurement bases that were applied in the preparation of the consolidated financial statements of Tallink Grupp AS for the financial year ended on 31 December 2019. The Group prepares its consolidated annual financial statements in accordance with IFRS as adopted by the EU.
The interim consolidated financial statements are presented in thousand euros (EUR).
Note 3 Segment information
The Group’s operations are organized and managed separately according to the nature of the different markets. Different routes represent different business segments.
The following tables present the Group’s revenue and profit by reportable segments for the reporting and the comparative period.

25 | 35
Interim report Q2 2020
Notes to the condensed consolidated interim financial statements
Geographical segments – by the location of assets
For the period 1 January - 30 June, in thousands of EUR
Estonia-Finland routes
Estonia-Sweden routes
Latvia-Sweden route
Finland-Sweden routes Other
Intersegment elimination Total
2020
Sales to external customers 92 807 22 409 11 447 73 423 19 806 0 219 892
Intersegment sales 0 0 0 0 1 354 -1 354 0
Revenue 92 807 22 409 11 447 73 423 21 160 -1 354 219 892
Segment result 892 -9 615 -9 470 -26 507 1 365 0 -43 335
Unallocated expenses -5 438
Net financial items (Note 4) -8 699
Loss before income tax -57 472
For the period 1 January - 30 June, in thousands of EUR
Estonia-Finland routes
Estonia-Sweden routes
Latvia-Sweden route
Finland-Sweden routes Other
Intersegment elimination Total
2019
Sales to external customers 165 296 49 877 32 624 157 523 29 653 0 434 973
Intersegment sales 0 0 0 0 3 183 -3 183 0
Revenue 165 296 49 877 32 624 157 523 32 836 -3 183 434 973
Segment result 28 458 -2 294 -3 707 4 214 8 208 0 34 879
Unallocated expenses -28 373
Net financial items (Note 4) -8 742
Loss before income tax -2 236
26 | 35
Interim report Q2 2020
Notes to the condensed consolidated interim financial statements
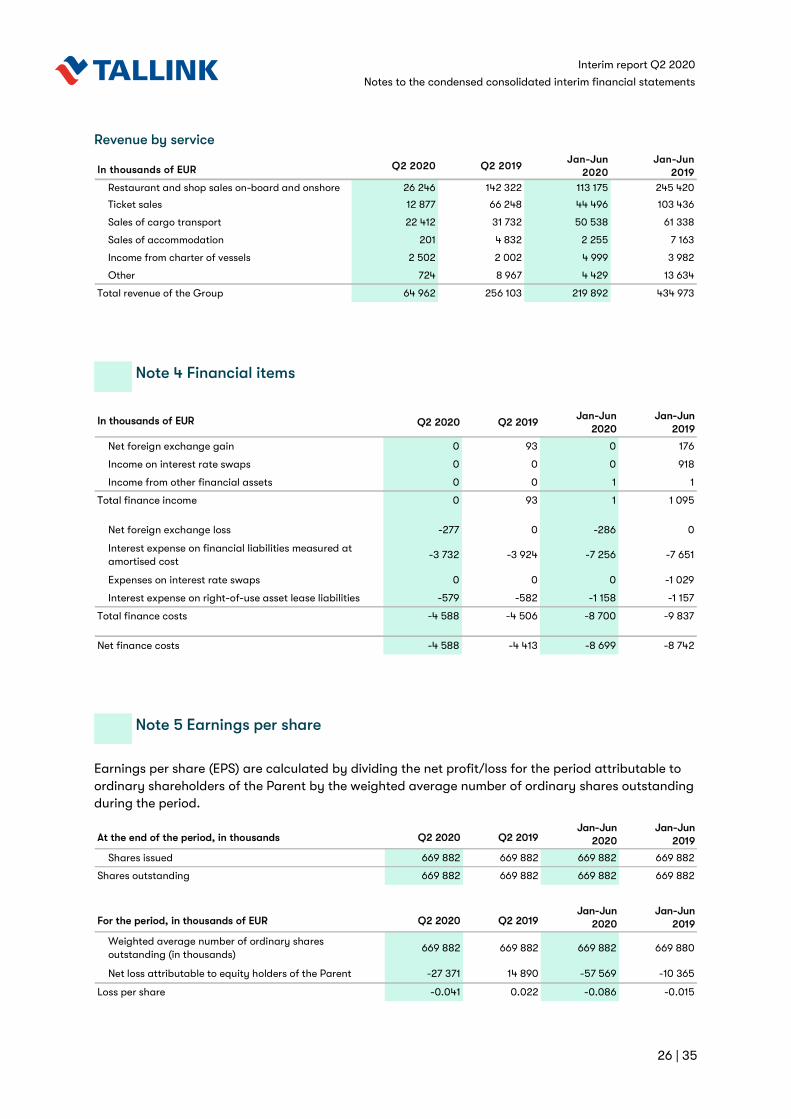
Revenue by service
Note 4 Financial items
Note 5 Earnings per share
Earnings per share (EPS) are calculated by dividing the net profit/loss for the period attributable to ordinary shareholders of the Parent by the weighted average number of ordinary shares outstanding during the period.
In thousands of EUR Q2 2020 Q2 2019Jan-Jun
2020Jan-Jun
2019
Restaurant and shop sales on-board and onshore 26 246 142 322 113 175 245 420
Ticket sales 12 877 66 248 44 496 103 436
Sales of cargo transport 22 412 31 732 50 538 61 338
Sales of accommodation 201 4 832 2 255 7 163
Income from charter of vessels 2 502 2 002 4 999 3 982
Other 724 8 967 4 429 13 634
Total revenue of the Group 64 962 256 103 219 892 434 973
In thousands of EUR Q2 2020 Q2 2019Jan-Jun
2020Jan-Jun
2019
Net foreign exchange gain 0 93 0 176
Income on interest rate swaps 0 0 0 918
Income from other financial assets 0 0 1 1
Total finance income 0 93 1 1 095
Net foreign exchange loss -277 0 -286 0
Interest expense on financial liabilities measured at amortised cost
-3 732 -3 924 -7 256 -7 651
Expenses on interest rate swaps 0 0 0 -1 029
Interest expense on right-of-use asset lease liabilities -579 -582 -1 158 -1 157
Total finance costs -4 588 -4 506 -8 700 -9 837
Net finance costs -4 588 -4 413 -8 699 -8 742
At the end of the period, in thousands Q2 2020 Q2 2019Jan-Jun
2020Jan-Jun
2019
Shares issued 669 882 669 882 669 882 669 882
Shares outstanding 669 882 669 882 669 882 669 882
For the period, in thousands of EUR Q2 2020 Q2 2019Jan-Jun
2020Jan-Jun
2019
Weighted average number of ordinary shares outstanding (in thousands)
669 882 669 882 669 882 669 880
Net loss attributable to equity holders of the Parent -27 371 14 890 -57 569 -10 365
Loss per share -0.041 0.022 -0.086 -0.015

27 | 35
Interim report Q2 2020
Notes to the condensed consolidated interim financial statements
Note 6 Property, plant and equipment
In thousands of EUR
Land and
buildings Ships
Plant and
equipmentRight-of-use
assets
Assets under
construction Total
Book value as at 31 December 2019 1 870 1 173 534 56 985 97 723 16 981 1 347 093
Additions 13 8 500 2 117 10 098 28 512 49 240
Reclassification 0 9 424 6 132 0 -15 556 0
Disposals 0 0 -68 -315 0 -383
Depreciation for the period -232 -29 953 -8 009 -8 023 0 -46 217
Book value as at 30 June 2020 1 651 1 161 505 57 157 99 483 29 937 1 349 733
As at 30 June 2020
Gross carrying amount 8 278 1 664 294 107 382 122 161 29 937 1 932 052
Accumulated depreciation -6 627 -502 789 -50 225 -22 678 0 -582 319
Book value as at 31 December 2018 2 324 1 215 295 43 658 0 6 651 1 267 928
Initial application of IFRS 16 0 0 0 100 770 0 100 770
Adjusted book value as at 1 January 2019 2 324 1 215 295 43 658 100 770 6 651 1 368 698
Additions 0 0 8 807 8 792 32 209 49 808
Reclassification 0 16 065 7 424 0 -23 489 0
Disposals 0 0 -125 -204 0 -329
Depreciation for the period -259 -30 613 -6 634 -7 251 0 -44 757
Book value as at 30 June 2019 2 065 1 200 747 53 130 102 107 15 371 1 373 420
As at 30 June 2019
Gross carrying amount 8 226 1 645 931 92 680 109 319 15 371 1 871 527
Accumulated depreciation -6 161 -445 184 -39 550 -7 212 0 -498 107

28 | 35
Interim report Q2 2020
Notes to the condensed consolidated interim financial statements
Right-of-use assets
Note 7 Intangible assets
In thousands of EUR Buildings and
premisesPlant and equipment
Total right-of-use assets
Book value as at 31 December 2019 97 142 581 97 723
Additions 9 391 707 10 098
Disposals -74 -241 -315
Depreciation for the period -7 818 -205 -8 023
Book value as at 30 June 2020 98 641 842 99 483
As at 30 June 2020
Gross carrying amount 120 874 1 287 122 161
Accumulated depreciation -22 233 -445 -22 678
Book value as at 31 December 2018 0 0 0
Initial application of IFRS 16 99 701 1 069 100 770
Adjusted book value as at 1 January 2019 99 701 1 069 100 770
Additions 8 786 6 8 792
Disposals -204 0 -204
Depreciation for the period -7 003 -248 -7 251
Book value as at 30 June 2019 101 280 827 102 107
As at 30 June 2019
Gross carrying amount 108 244 1 075 109 319
Accumulated depreciation -6 964 -248 -7 212
In thousands of EUR Goodwill Trademark OtherAssets under construction
Total
Book value as at 31 December 2019 11 066 18 922 13 055 1 221 44 264
Additions 0 0 272 2 079 2 351
Reclassification 0 0 567 -567 0
Amortisation for the period 0 -1 458 -2 259 0 -3 717
Book value as at 30 June 2020 11 066 17 464 11 635 2 733 42 898
As at 30 June 2020
Cost 11 066 58 288 37 457 2 733 109 544
Accumulated amortisation 0 -40 824 -25 822 0 -66 646
Book value as at 31 December 2018 11 066 21 838 12 000 1 260 46 164
Additions 0 0 406 2 313 2 719
Reclassification 0 0 1 344 -1 344 0
Amortisation for the period 0 -1 458 -1 785 0 -3 243
Book value as at 30 June 2019 11 066 20 380 11 965 2 229 45 640
As at 30 June 2019
Cost 11 066 58 288 33 738 2 229 105 321
Accumulated amortisation 0 -37 908 -21 773 0 -59 681

29 | 35
Interim report Q2 2020
Notes to the condensed consolidated interim financial statements
Note 8 Interest-bearing loans and borrowings
1 Capitalisation and amortisation of transaction costs and the termination of lease agreements.
Bank overdrafts are secured with commercial pledges (in the total amount of EUR 20 204 thousand) and ship mortgages. Tallink Grupp AS has given guarantees to Nordea Bank Plc and Danske Bank A/S for loans of EUR 154 768 thousand granted to its ship-owning subsidiaries. Ship-owning subsidiaries have given guarantees to Nordea Bank Finland Plc and Swedbank AS for loans of EUR 322 132 thousand granted to Tallink Grupp AS. The primary securities for these loans are pledges of the shares in the ship-owning subsidiaries and mortgages on the ships belonging to the aforementioned subsidiaries.
In thousands of EUR 31.12.2019 Addition RepaymentsExchange
differencesOther
changes¹ 30.06.2020
Lease liabilities 304 79 -46 -1 -35 301
Right-of-use assets lease liabilities 101 577 10 098 -4 868 -24 -330 106 453
Overdrafts 0 32 005 0 0 0 32 005
Long-term bank loans 475 999 15 000 -14 667 0 568 476 900
Total borrowings 577 880 57 182 -19 581 -25 203 615 659
Current portion 89 198 130 066
Non-current portion 488 682 485 593
Total borrowings 577 880 615 659
In thousands of EUR 31.12.2018 Addition RepaymentsExchange
differencesOther
changes¹ 30.06.2019
Lease liabilities 428 17 -53 -12 -23 357
Right-of-use assets lease liabilities 0 113 152 -7 081 -59 -203 105 809
Overdrafts 0 19 009 0 0 0 19 009
Long-term bank loans 509 707 0 -31 334 0 612 478 985
Total borrowings 510 135 132 178 -38 468 -71 386 604 160
Current portion 78 658 108 190
Non-current portion 431 477 495 970
Total borrowings 510 135 604 160

30 | 35
Interim report Q2 2020
Notes to the condensed consolidated interim financial statements
Note 9 Share capital
According to the articles of association of the Parent the maximum number of ordinary shares is 2 400 000 000. Each share grants one vote at the shareholders’ general meeting. Shares acquired by the transfer of ownership are eligible for participating in and voting at a general meeting only if the ownership change is recorded in the Estonian Central Registry of Securities at the time used to determine the list of shareholders for the given shareholders’ general meeting.
Tallink Grupp AS has 669 882 040 registered shares without nominal value and the notional value of each share is EUR 0.47.
Note 10 Dividends
In October 2018, the Management Board of Tallink Grupp AS decided to supplement the Company’s dividend policy, according to which if the economic performance enables it, dividends would be paid in the minimum amount of EUR 0.05 per share.
Due to a deteriorated operating environment and considering the Company’s long-term interests, on 30 July 2020, the shareholders’ general meeting decided not to pay dividend from net profit for 2019.
Note 11 Related party disclosures
The Group has conducted transactions with related parties and has outstanding balances with related parties.
For the period ended 30 June 2020, in thousands of EUR
Sales to related parties
Purchases from related parties
Receivables from related parties
Payables to related parties
Companies controlled by the Key Management Personnel
321 10 685 69 3 922
Associated companies 4 66 0 5
Total 325 10 751 69 3 927
For the period ended 30 June 2019, in thousands of EUR
Sales to related parties
Purchases from related parties
Receivables from related parties
Payables to related parties
Companies controlled by the Key Management Personnel
466 11 469 239 1 678
Associated companies 1 83 0 18
Total 467 11 552 239 1 696

31 | 35
Interim report Q2 2020
Statement by the management board
STATEMENT BY THE MANAGEMENT BOARD Hereby we acknowledge our responsibility for the Tallink Grupp AS Unaudited Condensed Consolidated Interim Financial Statements for the second quarter 2020 and confirm that these financial statements have been prepared in accordance with IAS 34 and give a true and fair view of the Group’s financial position, financial performance and cash flows.
Giving also consideration to the ongoing negotiations to ensure additional funding the Management Board is of opinion that Tallink Grupp AS and its subsidiaries are able to continue as going concerns for a period of at least one year after the date of approval of these interim financial statements.
Paavo Nõgene Chairman of the Management Board
Lembit Kitter Member of the Management Board Kadri Land Member of the Management Board Harri Hanschmidt Member of the Management Board Piret Mürk-Dubout Member of the Management Board
Tallinn, 6 August 2020

32 | 35
Interim report Q2 2020
Alternative performance measures
ALTERNATIVE PERFORMANCE MEASURES Tallink Grupp AS presents certain performance measures as key figures, which in accordance with the “Alternative Performance Measures” guidance by the European Securities and Markets Authority (ESMA) are not accounting measures of historical financial performance, financial position and cash flows, defined or specified in IFRS, but which are instead non-financial measures and alternative performance measures (APMs).
The non-financial measures and APMs provide the management, investors, securities analysts and other parties significant additional information related to the Group’s results of operations, financial position or cash flows and are often used by analysts, investors and other parties.
The non-financial measures and APMs should not be considered in isolation or as substitute to the measures under IFRS. The APMs are unaudited.
Calculation formulas of alternative performance measures EBITDA: result from operating activities before net financial items, share of profit of equity-accounted investees, taxes, depreciation and amortization
EBIT: result from operating activities
Earnings per share: net profit or loss/ weighted average number of shares outstanding
Equity ratio: total equity / total assets
Shareholder’s equity per share: shareholder’s equity / number of shares outstanding
Gross margin: gross profit / net sales
EBITDA margin: EBITDA / net sales
EBIT margin: EBIT / net sales
Net profit margin: net profit or loss / net sales
Capital expenditure: additions to property, plant and equipment – additions to right-of-use assets + additions to intangible assets
ROA: earnings before net financial items, taxes 12-months trailing / average total assets
ROE: net profit 12-months trailing / average shareholders’ equity
ROCE: earnings before net financial items, taxes 12-months trailing / (total assets – current liabilities (average for the period))
Net debt: interest-bearing liabilities less cash and cash equivalents
Net debt to EBITDA: net debt / EBITDA 12-months trailing

33 | 35
Interim report Q2 2020
Alternative performance measures
Reconciliations of certain alternative performance measures
In thousands of EUR Q2 2020 Q2 2019
Depreciation 23 312 21 669
Amortisation 1 849 1 659
Depreciation and amortisation 25 161 23 328
Result from operating activities -22 739 27 407
Depreciation and amortisation 25 161 23 328
EBITDA 2 422 50 735
EBITDA 2 422 50 735
IFRS 16 adoption effect -4 652 -4 273
EBITDA adjusted -2 230 46 462
Additions to property, plant and equipment 13 666 16 738
Additions to intangible assets 724 1 718
Capital expenditures 14 390 18 456
Net loss for the period -27 371 14 890
Weighted average number of shares outstanding 669 882 040 669 882 040
Loss per share (EUR) -0.041 0.022
Lease liabilities 301 357
Lease liabilities related to right-of-use assets 106 453 105 809
Overdraft 32 005 19 009
Long-term bank loans 476 900 478 985
Interest-bearing liabilities 615 659 604 160
Gross profit/loss -21 895 60 634
Net sales 64 962 256 103
Gross margin -33.7% 23.7%
EBITDA 2 422 50 735
Net sales 64 962 256 103
EBITDA margin 3.7% 19.8%
EBITDA adjusted -2 230 46 462
Net sales 64 962 256 103
EBITDA margin adjusted -3.4% 18.1%
EBIT -22 739 27 407
Net sales 64 962 256 103
EBIT margin -35.0% 10.7%
Net profit/loss -27 371 14 890
Net sales 64 962 256 103
Net profit/loss margin -42.1% 5.8%
Result from operating activities 12-months trailing 19 589 61 436
Total assets 30 June (previous year) 1 609 873 1 554 542
Total assets 30 September 1 564 197 1 534 787
Total assets 31 December 1 532 963 1 500 904
Total assets 31 March 1 517 773 1 572 259
Total assets 30 June 1 505 876 1 609 873
Average assets 1 546 136 1 554 473
ROA 1.3% 4.0%

34 | 35
Interim report Q2 2020
Alternative performance measures
In thousands of EUR Q2 2020 Q2 2019
Net profit 12-months trailing 2 514 33 971
Total equity 30 June (previous year) 809 907 812 701
Total equity 30 September 817 658 858 705
Total equity 31 December 822 837 856 916
Total equity 31 March 793 224 828 255
Total equity 30 June 765 349 809 907
Average equity 801 795 833 297
ROE 0.3% 4.1%
Result from operating activities 12-months trailing 19 589 61 436
Total assets 30 June (previous year) 1 609 873 1 554 542
Total assets 30 September 1 564 197 1 534 787
Total assets 31 December 1 532 963 1 500 904
Total assets 31 March 1 517 773 1 572 259
Total assets 30 June 1 505 876 1 609 873
Current liabilities 30 June (previous year) 303 996 367 624
Current liabilities 30 September 276 139 322 785
Current liabilities 31 December 221 444 212 489
Current liabilities 31 March 234 336 240 074
Current liabilities 30 June 254 934 303 996
Total assets - current liabilities 30 June (previous year) 1 305 877 1 186 918
Total assets - current liabilities 30 September 1 288 058 1 212 002
Total assets - current liabilities 31 December 1 311 519 1 288 415
Total assets - current liabilities 31 March 1 283 437 1 332 185
Total assets - current liabilities 30 June 1 250 942 1 305 877
Average assets - current liabilities 1 287 967 1 265 079
ROCE 1.5% 4.9%
In thousands of EUR 30.06.2020 31.03.2020
Interest-bearing liabilities 615 659 590 997
Cash and cash equivalents 21 892 16 462
Net debt 593 767 574 535
Total equity 765 349 793 224
Total assets 1 505 876 1 517 773
Equity ratio 50.8% 52.3%
Equity attributable to equity holders of the Parent 765 349 793 224
Number of ordinary shares outstanding 669 882 040 669 882 040
Shareholders’ equity per share (EUR per share) 1.14 1.18
Net debt 593 767 574 535
12-months trailing
Depreciation 90 816 89 173
Amortisation 7 367 7 177
Depreciation and amortisation 98 183 96 350
EBITDA 117 772 166 085
Net debt to EBITDA 5.0 3.5

35 | 35
Interim report Q2 2020
Contact information
CONTACT INFORMATION
Commercial Registry no. 10238429
Address Sadama 5
10111, Tallinn
Republic of Estonia
Phone +372 6 409 800
Fax +372 6 409 810
Website www.tallink.com
Main activity maritime transport
(passenger & cargo transport)
Related Documents


