Taking Technology to Task: The Skill Content of Technological Change in Early Twentieth Century U.S. Rowena Gray January 2012 Rowena Gray () Taking Technology to Task January 2012 1 / 27

Welcome message from author
This document is posted to help you gain knowledge. Please leave a comment to let me know what you think about it! Share it to your friends and learn new things together.
Transcript

Taking Technology to Task: The Skill Content ofTechnological Change in Early Twentieth Century U.S.
Rowena Gray
January 2012
Rowena Gray () Taking Technology to Task January 2012 1 / 27

Rowena Gray () Taking Technology to Task January 2012 2 / 27

Rowena Gray () Taking Technology to Task January 2012 3 / 27

Introduction
This paper uses a task-based approach to measure the skill content oftechnological change in U.S. manufacturing 1880-1940
The main contributions of the paper are:
new dataset describing workplace tasks to give a more precisede�nition of skill in the historical context
new �nding on the nature of pre-WWII technological change:
Electri�cation led to a hollowing out of the skill distribution�workersat the poles bene�ted at the expense of those in the middle
use of instrumental variables strategies to deal with issue ofendogeneity of electricity
Rowena Gray () Taking Technology to Task January 2012 4 / 27

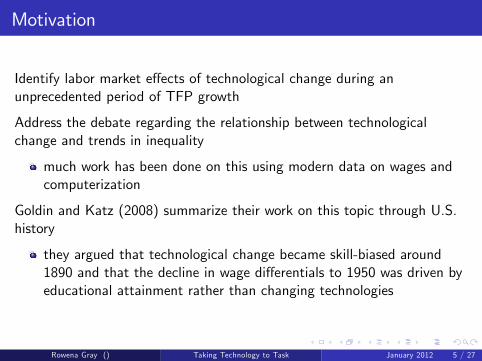
Motivation
Identify labor market e¤ects of technological change during anunprecedented period of TFP growth
Address the debate regarding the relationship between technologicalchange and trends in inequality
much work has been done on this using modern data on wages andcomputerization
Goldin and Katz (2008) summarize their work on this topic through U.S.history
they argued that technological change became skill-biased around1890 and that the decline in wage di¤erentials to 1950 was driven byeducational attainment rather than changing technologies
Rowena Gray () Taking Technology to Task January 2012 5 / 27

The Switch to Electricity
Rowena Gray () Taking Technology to Task January 2012 6 / 27
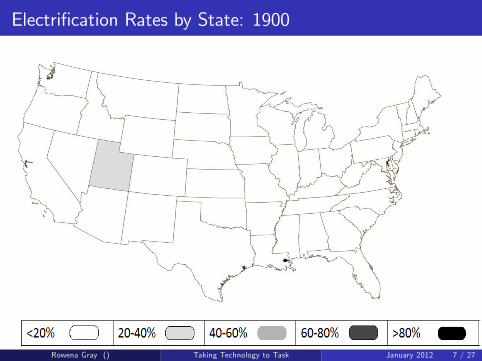
Electri�cation Rates by State: 1900
Rowena Gray () Taking Technology to Task January 2012 7 / 27
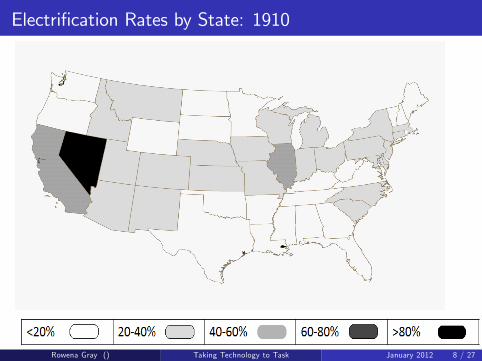
Electri�cation Rates by State: 1910
Rowena Gray () Taking Technology to Task January 2012 8 / 27

Electri�cation Rates by State: 1920
Rowena Gray () Taking Technology to Task January 2012 9 / 27
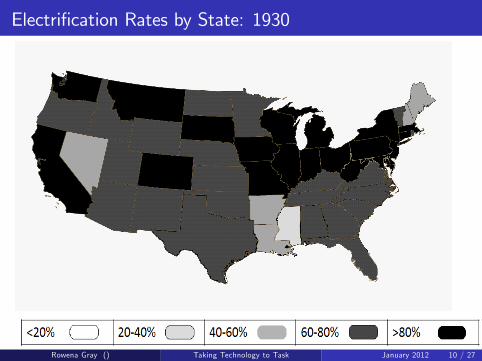
Electri�cation Rates by State: 1930
Rowena Gray () Taking Technology to Task January 2012 10 / 27

Electri�cation Rates by State: 1940
Rowena Gray () Taking Technology to Task January 2012 11 / 27

Historical Predictions
Historical Predictions
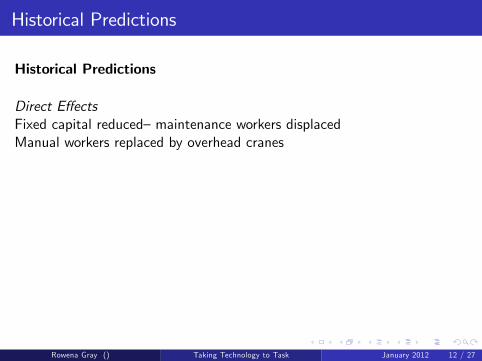
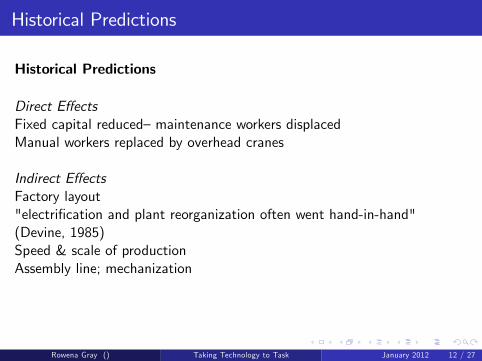
Direct E¤ectsFixed capital reduced�maintenance workers displacedManual workers replaced by overhead cranes
Indirect E¤ectsFactory layout"electri�cation and plant reorganization often went hand-in-hand"(Devine, 1985)Speed & scale of productionAssembly line; mechanization
Overall, it is an empirical question to identify the e¤ect of electricity onrelative demand for di¤erent types of labor
Rowena Gray () Taking Technology to Task January 2012 12 / 27

Historical Predictions
Historical Predictions
Direct E¤ects
Fixed capital reduced�maintenance workers displacedManual workers replaced by overhead cranes
Indirect E¤ectsFactory layout"electri�cation and plant reorganization often went hand-in-hand"(Devine, 1985)Speed & scale of productionAssembly line; mechanization
Overall, it is an empirical question to identify the e¤ect of electricity onrelative demand for di¤erent types of labor
Rowena Gray () Taking Technology to Task January 2012 12 / 27
Historical Predictions
Historical Predictions
Direct E¤ectsFixed capital reduced�maintenance workers displacedManual workers replaced by overhead cranes
Indirect E¤ectsFactory layout"electri�cation and plant reorganization often went hand-in-hand"(Devine, 1985)Speed & scale of productionAssembly line; mechanization
Overall, it is an empirical question to identify the e¤ect of electricity onrelative demand for di¤erent types of labor
Rowena Gray () Taking Technology to Task January 2012 12 / 27

Historical Predictions
Historical Predictions
Direct E¤ectsFixed capital reduced�maintenance workers displacedManual workers replaced by overhead cranes
Indirect E¤ects
Factory layout"electri�cation and plant reorganization often went hand-in-hand"(Devine, 1985)Speed & scale of productionAssembly line; mechanization
Overall, it is an empirical question to identify the e¤ect of electricity onrelative demand for di¤erent types of labor
Rowena Gray () Taking Technology to Task January 2012 12 / 27

Historical Predictions
Historical Predictions
Direct E¤ectsFixed capital reduced�maintenance workers displacedManual workers replaced by overhead cranes
Indirect E¤ectsFactory layout"electri�cation and plant reorganization often went hand-in-hand"(Devine, 1985)
Speed & scale of productionAssembly line; mechanization
Overall, it is an empirical question to identify the e¤ect of electricity onrelative demand for di¤erent types of labor
Rowena Gray () Taking Technology to Task January 2012 12 / 27

Historical Predictions
Historical Predictions
Direct E¤ectsFixed capital reduced�maintenance workers displacedManual workers replaced by overhead cranes
Indirect E¤ectsFactory layout"electri�cation and plant reorganization often went hand-in-hand"(Devine, 1985)Speed & scale of production
Assembly line; mechanization
Overall, it is an empirical question to identify the e¤ect of electricity onrelative demand for di¤erent types of labor
Rowena Gray () Taking Technology to Task January 2012 12 / 27
Historical Predictions
Historical Predictions
Direct E¤ectsFixed capital reduced�maintenance workers displacedManual workers replaced by overhead cranes
Indirect E¤ectsFactory layout"electri�cation and plant reorganization often went hand-in-hand"(Devine, 1985)Speed & scale of productionAssembly line; mechanization
Overall, it is an empirical question to identify the e¤ect of electricity onrelative demand for di¤erent types of labor
Rowena Gray () Taking Technology to Task January 2012 12 / 27

Historical Predictions
Historical Predictions
Direct E¤ectsFixed capital reduced�maintenance workers displacedManual workers replaced by overhead cranes
Indirect E¤ectsFactory layout"electri�cation and plant reorganization often went hand-in-hand"(Devine, 1985)Speed & scale of productionAssembly line; mechanization
Overall, it is an empirical question to identify the e¤ect of electricity onrelative demand for di¤erent types of labor
Rowena Gray () Taking Technology to Task January 2012 12 / 27

Data Sources
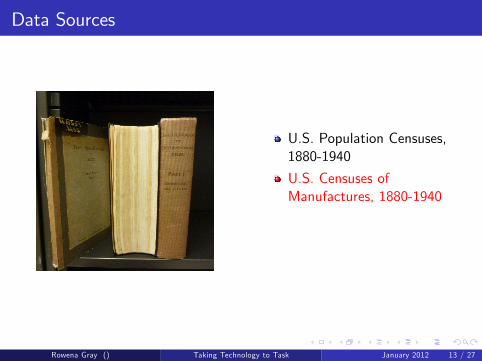
U.S. Population Censuses,1880-1940
U.S. Censuses ofManufactures, 1880-1940
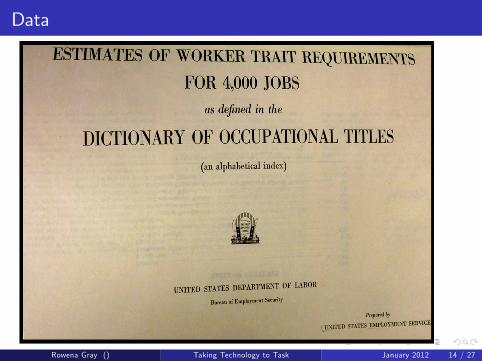
Dictionary ofOccupational Titles, 1949
Rowena Gray () Taking Technology to Task January 2012 13 / 27

Data Sources
U.S. Population Censuses,1880-1940
U.S. Censuses ofManufactures, 1880-1940
Dictionary ofOccupational Titles, 1949
Rowena Gray () Taking Technology to Task January 2012 13 / 27
Data Sources
U.S. Population Censuses,1880-1940
U.S. Censuses ofManufactures, 1880-1940
Dictionary ofOccupational Titles, 1949
Rowena Gray () Taking Technology to Task January 2012 13 / 27

Data Sources
U.S. Population Censuses,1880-1940
U.S. Censuses ofManufactures, 1880-1940
Dictionary ofOccupational Titles, 1949
Rowena Gray () Taking Technology to Task January 2012 13 / 27
Data
Rowena Gray () Taking Technology to Task January 2012 14 / 27

Data
Rowena Gray () Taking Technology to Task January 2012 15 / 27

Task Variables
Task Variables
1 Manual�Strength
2 Dexterity�Finger & Manual Dexterity, Motor & Eye-hand-footCoordination
3 Clerical�Clerical & Numerical Accuracy
4 Managerial�Average of Clerical &Dealing with People & Direction, Control & Planning
Rowena Gray () Taking Technology to Task January 2012 16 / 27

Task Variables
Task Variables
1 Manual�Strength
2 Dexterity�Finger & Manual Dexterity, Motor & Eye-hand-footCoordination
3 Clerical�Clerical & Numerical Accuracy
4 Managerial�Average of Clerical &Dealing with People & Direction, Control & Planning
Rowena Gray () Taking Technology to Task January 2012 16 / 27

Task Variables
Task Variable Construction
DOT measures by occupation (1 to 5 scale)
matched to census manufacturing occupations
created manual, dexterity, clerical & managerial measures byoccupation
ran task �cleaning� regressions to eradicate pure demographic e¤ects
normalized each task measure to a (0,1) scale as per the 1880distribution of occupations
lastly constructed the state-year averages for the �nal LHS variables
Rowena Gray () Taking Technology to Task January 2012 17 / 27

Empirical Speci�cation
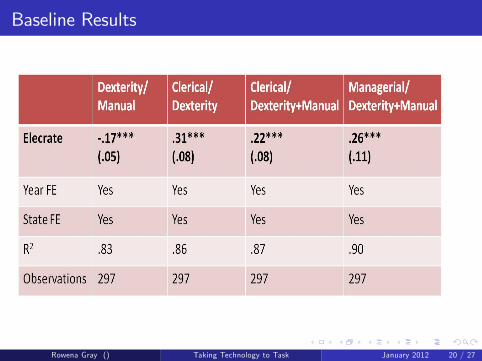
Baseline Speci�cation
lnRst = c + τ1Elecratest + αt + βs + εst
α and β are year (t) and state (s) �xed e¤ects
Rst represents the task ratios of interest:
dexterity/manual
clerical/dexterity
clerical/dexterity+manual
managerial/dexterity+manual
Rowena Gray () Taking Technology to Task January 2012 18 / 27

Empirical Speci�cation
Extended Speci�cation
lnRst= c + τ1Elecratest+τ2Caplabst+τ3FBSharest+τ4EducProxy st+αt+βs+εst
Caplab is the log of capital per worker, de�ated by a BLS wholesale priceindexFBShare is the proportion of the population that was born abroadEducProxy is a measure of educational attainment across states,constructed using census data on enrollments by age group
For this regression, the left-hand side includes data for native-bornAmericans only
Rowena Gray () Taking Technology to Task January 2012 19 / 27

Empirical Speci�cation
Extended Speci�cation
lnRst= c + τ1Elecratest+τ2Caplabst+τ3FBSharest+τ4EducProxy st+αt+βs+εst
Caplab is the log of capital per worker, de�ated by a BLS wholesale priceindex
FBShare is the proportion of the population that was born abroadEducProxy is a measure of educational attainment across states,constructed using census data on enrollments by age group
For this regression, the left-hand side includes data for native-bornAmericans only
Rowena Gray () Taking Technology to Task January 2012 19 / 27

Empirical Speci�cation
Extended Speci�cation
lnRst= c + τ1Elecratest+τ2Caplabst+τ3FBSharest+τ4EducProxy st+αt+βs+εst
Caplab is the log of capital per worker, de�ated by a BLS wholesale priceindexFBShare is the proportion of the population that was born abroad
EducProxy is a measure of educational attainment across states,constructed using census data on enrollments by age group
For this regression, the left-hand side includes data for native-bornAmericans only
Rowena Gray () Taking Technology to Task January 2012 19 / 27

Empirical Speci�cation
Extended Speci�cation
lnRst= c + τ1Elecratest+τ2Caplabst+τ3FBSharest+τ4EducProxy st+αt+βs+εst
Caplab is the log of capital per worker, de�ated by a BLS wholesale priceindexFBShare is the proportion of the population that was born abroadEducProxy is a measure of educational attainment across states,constructed using census data on enrollments by age group
For this regression, the left-hand side includes data for native-bornAmericans only
Rowena Gray () Taking Technology to Task January 2012 19 / 27

Empirical Speci�cation
Extended Speci�cation
lnRst= c + τ1Elecratest+τ2Caplabst+τ3FBSharest+τ4EducProxy st+αt+βs+εst
Caplab is the log of capital per worker, de�ated by a BLS wholesale priceindexFBShare is the proportion of the population that was born abroadEducProxy is a measure of educational attainment across states,constructed using census data on enrollments by age group
For this regression, the left-hand side includes data for native-bornAmericans only
Rowena Gray () Taking Technology to Task January 2012 19 / 27
Baseline Results
Rowena Gray () Taking Technology to Task January 2012 20 / 27

Extended OLS
Rowena Gray () Taking Technology to Task January 2012 21 / 27

OLS Summary
The OLS results suggest that, for a state such as Illinois, where theaverage manufacturing worker in 1880 had the skill level of a craftsman,by 1940 the average worker had become an operative (work that involvesless responsibility, skill and training)
Results suggest that, for the majority of manufacturing workers whoworked on the factory �oor, technological change had a strong unskill-bias
The e¤ects hold when restricted to a sample of non-migrants (& formigrants, but with smaller coe¢ cients)
Female labor force tasks were not signi�cantly associated with electricitybut it did account for about half of the increase in female labor forceparticipation over the period
Rowena Gray () Taking Technology to Task January 2012 22 / 27

Endogeneity
Endogeneity
The historical literature suggests that the shifts in relative labor demandresulting from electricity were largely unanticipated:
"There were many factories which introduced electric power because weengaged to save from 20 to 60 percent of their coal bills...those who �rstintroduced electric power on this basis found that they were making othersavings than those that had been promised, which might be called indirectsavings"
Crocker-Wheeler Electric Company, 1901
Rowena Gray () Taking Technology to Task January 2012 23 / 27

Endogeneity
Endogeneity
The historical literature suggests that the shifts in relative labor demandresulting from electricity were largely unanticipated:
"There were many factories which introduced electric power because weengaged to save from 20 to 60 percent of their coal bills...those who �rstintroduced electric power on this basis found that they were making othersavings than those that had been promised, which might be called indirectsavings"
Crocker-Wheeler Electric Company, 1901
Rowena Gray () Taking Technology to Task January 2012 23 / 27

Endogeneity
Instrumenting for Electri�cation
But, richer states or states with a particular skill concentration may haveadopted electricity earlier
Both the I.V. strategies use variations in geography as the base�motivatedby the fact that hydro-electric power had a lower marginal cost thanthermal power generation�here, I use stream gradient
1 source of time variation comes from demeaned decadal rainfall, 1910-40Alternatively, time variation comes from regulations on electric utilities
States adopted state-level regulation of the electric industry at di¤erenttimes from 1907 onwardsRegulation has been shown to have lowered prices and increased supply ofelectricity by making it easier for electric companies to grow and expand tonew areas of business
Rowena Gray () Taking Technology to Task January 2012 24 / 27

Endogeneity
Instrumenting for Electri�cation
But, richer states or states with a particular skill concentration may haveadopted electricity earlierBoth the I.V. strategies use variations in geography as the base�motivatedby the fact that hydro-electric power had a lower marginal cost thanthermal power generation�here, I use stream gradient
1 source of time variation comes from demeaned decadal rainfall, 1910-40
Alternatively, time variation comes from regulations on electric utilities
States adopted state-level regulation of the electric industry at di¤erenttimes from 1907 onwardsRegulation has been shown to have lowered prices and increased supply ofelectricity by making it easier for electric companies to grow and expand tonew areas of business
Rowena Gray () Taking Technology to Task January 2012 24 / 27

Endogeneity
Instrumenting for Electri�cation
But, richer states or states with a particular skill concentration may haveadopted electricity earlierBoth the I.V. strategies use variations in geography as the base�motivatedby the fact that hydro-electric power had a lower marginal cost thanthermal power generation�here, I use stream gradient
1 source of time variation comes from demeaned decadal rainfall, 1910-40Alternatively, time variation comes from regulations on electric utilities
States adopted state-level regulation of the electric industry at di¤erenttimes from 1907 onwardsRegulation has been shown to have lowered prices and increased supply ofelectricity by making it easier for electric companies to grow and expand tonew areas of business
Rowena Gray () Taking Technology to Task January 2012 24 / 27

Endogeneity
Instrumenting for Electri�cation
But, richer states or states with a particular skill concentration may haveadopted electricity earlierBoth the I.V. strategies use variations in geography as the base�motivatedby the fact that hydro-electric power had a lower marginal cost thanthermal power generation�here, I use stream gradient
1 source of time variation comes from demeaned decadal rainfall, 1910-40Alternatively, time variation comes from regulations on electric utilities
States adopted state-level regulation of the electric industry at di¤erenttimes from 1907 onwards
Regulation has been shown to have lowered prices and increased supply ofelectricity by making it easier for electric companies to grow and expand tonew areas of business
Rowena Gray () Taking Technology to Task January 2012 24 / 27

Endogeneity
Instrumenting for Electri�cation
But, richer states or states with a particular skill concentration may haveadopted electricity earlierBoth the I.V. strategies use variations in geography as the base�motivatedby the fact that hydro-electric power had a lower marginal cost thanthermal power generation�here, I use stream gradient
1 source of time variation comes from demeaned decadal rainfall, 1910-40Alternatively, time variation comes from regulations on electric utilities
States adopted state-level regulation of the electric industry at di¤erenttimes from 1907 onwardsRegulation has been shown to have lowered prices and increased supply ofelectricity by making it easier for electric companies to grow and expand tonew areas of business
Rowena Gray () Taking Technology to Task January 2012 24 / 27

IV Results
Rowena Gray () Taking Technology to Task January 2012 25 / 27

Robustness Checks
Robustness Checks
A variety of robustness checks were conducted on the data and the resultswere all consistent with the previous �ndingsInstrumented for FBShare using the Card (2001) shift-share instrumentState-speci�c time trendsWeighted by employment augmented with hours workedDropped outliers in electricity adoption and in economic activity
Rowena Gray () Taking Technology to Task January 2012 26 / 27

Conclusions
The evidence suggests that technological change pre-World War IIhad a "hollowing out" e¤ect on the skill distribution of U.S. labor:
white collar tasks saw the largest increases, raw manual skills were noteroded but saw little overall change, and dexterity tasks lost the mostin terms of relative demand
The results are robust to using an instrument for electri�cation thatexploits di¤erences across states in their timing of adoption of statelevel regulation of electric utilities or an instrument that usesexogenous di¤erences in geography across states
Results suggest that technological change has had a very consistente¤ect on relative demand for labor over a century and a half
Further investigation of the mechanisms through which the taskcomposition of the labor force changed over time is needed�whathappened to the displaced workers who had previously done jobs thatwere relatively intensive in dexterity tasks?
Rowena Gray () Taking Technology to Task January 2012 27 / 27
Related Documents