Taking Advantage of Business Intelligence in a Complex-Systems Environment Kristens GUDFINNSSON a,1 Mikael BERNDTSSON a , and Mattias STRAND a a University of Skövde, Sweden {kristens.gudfinnsson, mikael.berndtsson, mattias.strand}@his.se Abstract. Business intelligence (BI) has fundamentally changed how many companies conduct their business. In literature, focus has been on volume- operation companies that provide services to millions of customers. In contrast, complex-systems companies have fewer customers and pursue customer needs by providing more customized products and services. This paper presents the results at a case of a complex-systems company with the overall aim to see how a complex-systems company has taken advantage of BI. In addition, a framework was used to measure the BI maturity of the company. Literature also emphasis that complex-system companies may benefit from adopting BI applications from volume-operations companies, but the results indicate that there may be a difference in the importance of BI tools, which in turn may negatively influence such cross-category adoptions. Keywords. Business Intelligence, Business Analytics, complex-systems, volume- operations, analytic maturity Introduction The impact of information technology (IT) has driven organizations to seek new opportunities, strategies and tools to increase their competitive advantage [6]. One strategy that’s has received a lot of attention in recent years is business intelligence (BI). BI is often described as an umbrella concept, covering different activities and technologies that, in one way or another, use data and information to enhance business performance and support decision making on all organizational levels, i.e., strategic, tactical, and operational level, [14]. Usually, the hub of a BI architecture is the data warehouse (DW) [12] and various tools are used for activities like data mining, statistical analysis, forecasting and data visualization through dashboards [5]. We are aware of the debate whether the concept of Business Analytics (BA) is a subset of BI [4] or an advanced discipline within the concept of BI [8]. In this project, analytics is viewed as an integrated part of BI and the terms will be used interchangeably. In literature, companies like Harrah´s Entertainment [18], [4], Amazon.com [1], Continental airlines [2], and Netflix [15] are common examples of prominent companies that have used BI to sharpening their competitive edge. What the examples hold in common is that these businesses are so called volume-operations [10], i.e. they provide standardized products or services to hundreds of thousands to millions of customers each year and although each transaction creates limited revenues, the sheer 1 Corresponding Author. DSS 2.0 – Supporting Decision Making with New Technologies Gloria Phillips-Wren et al. (Eds.) IOS Press, 2014 © 2014 The authors and IOS Press. All rights reserved. doi:10.3233/978-1-61499-399-5-265 265

Welcome message from author
This document is posted to help you gain knowledge. Please leave a comment to let me know what you think about it! Share it to your friends and learn new things together.
Transcript
Taking Advantage of Business Intelligence in a Complex-Systems Environment
Kristens GUDFINNSSONa,1 Mikael BERNDTSSONa, and Mattias STRANDa
aUniversity of Skövde, Sweden{kristens.gudfinnsson, mikael.berndtsson, mattias.strand}@his.se
Abstract. Business intelligence (BI) has fundamentally changed how many companies conduct their business. In literature, focus has been on volume-operation companies that provide services to millions of customers. In contrast, complex-systems companies have fewer customers and pursue customer needs by providing more customized products and services. This paper presents the resultsat a case of a complex-systems company with the overall aim to see how acomplex-systems company has taken advantage of BI. In addition, a framework was used to measure the BI maturity of the company. Literature also emphasis that complex-system companies may benefit from adopting BI applications from volume-operations companies, but the results indicate that there may be adifference in the importance of BI tools, which in turn may negatively influence such cross-category adoptions.
Keywords. Business Intelligence, Business Analytics, complex-systems, volume-operations, analytic maturity
Introduction
The impact of information technology (IT) has driven organizations to seek new opportunities, strategies and tools to increase their competitive advantage [6]. One strategy that’s has received a lot of attention in recent years is business intelligence (BI).
BI is often described as an umbrella concept, covering different activities and technologies that, in one way or another, use data and information to enhance business performance and support decision making on all organizational levels, i.e., strategic, tactical, and operational level, [14]. Usually, the hub of a BI architecture is the data warehouse (DW) [12] and various tools are used for activities like data mining, statistical analysis, forecasting and data visualization through dashboards [5]. We are aware of the debate whether the concept of Business Analytics (BA) is a subset of BI [4] or an advanced discipline within the concept of BI [8]. In this project, analytics is viewed as an integrated part of BI and the terms will be used interchangeably.
In literature, companies like Harrah´s Entertainment [18], [4], Amazon.com [1],Continental airlines [2], and Netflix [15] are common examples of prominent companies that have used BI to sharpening their competitive edge. What the examples hold in common is that these businesses are so called volume-operations [10], i.e. theyprovide standardized products or services to hundreds of thousands to millions of customers each year and although each transaction creates limited revenues, the sheer
1 Corresponding Author.
DSS 2.0 – Supporting Decision Making with New TechnologiesGloria Phillips-Wren et al. (Eds.)IOS Press, 2014© 2014 The authors and IOS Press. All rights reserved.doi:10.3233/978-1-61499-399-5-265
265
total of transactions creates impressive revenues. Moreover, the interaction between the companies and their customers is often non-personal and facilitated via the Internet.
In contrast, we have complex-systems companies that provide customized services or products to large public or private businesses with the main purpose of interpreting customer needs into solutions [10]. They may be characterized as; having fewer customers (normally between tens to a thousand), providing very personalized solutions, and nursing each customer relation carefully, since each transaction involves large quantities of both products/services and revenues. The number of transactions each year can be low, but massive single order volumes create a foundation formultimillion dollar revenues [10].
As demonstrated above, there are many examples on how volume-operations companies utilize BI, but complex system companies receive very limited attention in BI literature. Still, Watson [16] indicates that complex-system companies may benefit from BI, and therefore, this work aims at increasing the knowledge regarding how complex-systems companies may use BI solutions. We do so by presenting the results of a case study aimed at investigating how a complex-systems organization used its BI-solutions and how mature the organization had become in this application. The maturity analysis was included as a means to contextualize the usage and to identify opportunities as well as hindrances perceived by the company. In addition, with the results of this case study we also contribute in fulfilling a more general knowledge-related need expressed by Arnott and Pervan [3]. As a result of a broad literature review, covering DSS-related publications during the years 1990 to 2004, theyconcluded that research on decision support systems was partly disconnected from actual practice. Arnott and Pervan [3] also expressed a need to create a better understanding on how companies are using various decision support tools and they emphasized the importance of increasing the number of case studies as a mean to improve the relevance of the research conducted within this particular area.
The remainder of the paper is structured as follows. Section 1 presents the chosen research approach. Section 2 describes the theoretical framework used for the maturity analysis. Section 3 presents the current BI usage in the Company. Section 4 presents the analytical maturity of the Company. Finally, Section 5 presents conclusions and ideas for future work.
1. Theoretical framework
There are different ways to measure analytical maturity. For this work, the maturity model provided by [9] was chosen, since it is well established in BI literature. In a worldwide survey conducted in the fall of 2010 by MIT Sloan Management Review, 3000 executives, managers and analysts from 108 countries and 30 industries were asked about their analytical capabilities and to predict future trends. Furthermore, academics and experts from various industries were asked to help understand practical issues faced by organizations today [9]. The results showed on a high correlation between analytical usage and business competitiveness. Survey respondents were asked to rate their own analytic capabilities and that resulted in a maturity level model (table 1) with three levels of maturity; Aspirational, Experienced and Transformed [9].Higher maturity in business analytics means the organization shifts towards the Transformed maturity level where analytics are used throughout the organization, prescribing actions and functioning as a competitive differentiator. At that level,
K. Gudfinnsson et al. / Taking Advantage of BI in a Complex-Systems Environment266
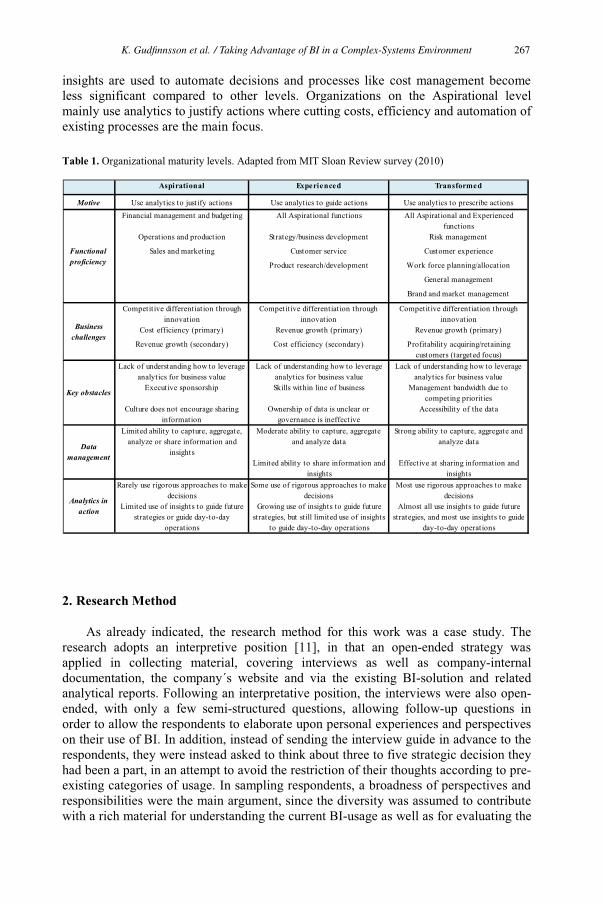
insights are used to automate decisions and processes like cost management become less significant compared to other levels. Organizations on the Aspirational level mainly use analytics to justify actions where cutting costs, efficiency and automation of existing processes are the main focus.
Table 1. Organizational maturity levels. Adapted from MIT Sloan Review survey (2010)
2. Research Method
As already indicated, the research method for this work was a case study. The research adopts an interpretive position [11], in that an open-ended strategy was applied in collecting material, covering interviews as well as company-internal documentation, the company´s website and via the existing BI-solution and related analytical reports. Following an interpretative position, the interviews were also open-ended, with only a few semi-structured questions, allowing follow-up questions in order to allow the respondents to elaborate upon personal experiences and perspectives on their use of BI. In addition, instead of sending the interview guide in advance to the respondents, they were instead asked to think about three to five strategic decision they had been a part, in an attempt to avoid the restriction of their thoughts according to pre-existing categories of usage. In sampling respondents, a broadness of perspectives and responsibilities were the main argument, since the diversity was assumed to contribute with a rich material for understanding the current BI-usage as well as for evaluating the
Aspirational Experienced Transformed
Motive Use analytics to justify actions Use analytics to guide actions Use analytics to prescribe actionsFinancial management and budgeting All Aspirational functions All Aspirational and Experienced
functionsOperations and production Strategy/business development Risk management
Sales and marketing Customer service Customer experience
Product research/development Work force planning/allocation
General management
Brand and market management
Competitive differentiation through innovation
Competitive differentiation through innovation
Competitive differentiation through innovation
Cost efficiency (primary) Revenue growth (primary) Revenue growth (primary)
Revenue growth (secondary) Cost efficiency (secondary) Profitability acquiring/retaining customers (targeted focus)
Lack of understanding how to leverage analytics for business value
Lack of understanding how to leverage analytics for business value
Lack of understanding how to leverage analytics for business value
Executive sponsorship Skills within line of business Management bandwidth due to competing priorities
Culture does not encourage sharing information
Ownership of data is unclear or governance is ineffective
Accessibility of the data
Limited ability to capture, aggregate, analyze or share information and
insights
Moderate ability to capture, aggregate and analyze data
Strong ability to capture, aggregate and analyze data
Limited ability to share information and insights
Effective at sharing information and insights
Rarely use rigorous approaches to make decisions
Some use of rigorous approaches to make decisions
Most use rigorous approaches to make decisions
Limited use of insights to guide future strategies or guide day-to-day
operations
Growing use of insights to guide future strategies, but still limited use of insights
to guide day-to-day operations
Almost all use insights to guide future strategies, and most use insights to guide
day-to-day operations
Functional proficiency
Business challenges
Key obstacles
Data management
Analytics in action
K. Gudfinnsson et al. / Taking Advantage of BI in a Complex-Systems Environment 267
current maturity of the case company. A total of 9 respondents were interview. R1 is a division manager within one of the four product areas. R2 is a product line manager, and is responsible for a product group, its development and sales. R3 is a market service manager and an analyst supporting the CEO and other managers within the company. R4 is a quality and environmental manager, and is responsible for internal quality and dealing with external environmental factors that can have effects on the company. R5 is the companies purchase manager, and is responsible for the procurement of all direct materials that are used when producing a product and buying already built components used by the company. R6 six is the controller of the company, with responsibilities of providing reports for decision support, improving cost and result management and improving economic reporting within the company. R7 is the finance manager, and is responsible for the accounting process within the company and being an economic advisor in strategic decisions. R8 is a director and part owner of the company, with various responsibilities in many areas of the business. R9 is the CEO of the company, with the overall responsibility of the company’s well-being and development.
The interviews were done at the location of the respondents and all interviews were recorded and transcribed. The average interview time was about 63 minutes and the transcripts covered in average 6000 words. All respondents were also granted the opportunity to review the transcripts and approve them for analysis. Finally, allinterviews were conducted in Swedish; consequently, all quotations presented in this paper have been translated from Swedish to English. The data analysis was based on content analysis as described by [7] where a number of usage areas emerged from the coding. These areas came up frequently during the interviews and therefore became the bases of the analysis.
2.1. Case company description
The company has chosen to be anonymous and will hereafter be referred to as the Company. It was established in 1955 and is a subcontractor towards e.g. the automobile industry. It has around 450 employees worldwide. There are five production plants, two main sites in Sweden, one in Brazil, one in USA and one in China. There are 16 subsidiaries in 16 countries (e.g. Japan, Italy, India, France and Australia) that function as sales offices. Most product development is done in cooperation with their customers in a B2B-relationship and the case company provides highly customized services andproducts. Exact figures on number of customers, transactions and annual deals made are not granted information, but the intervals indicated by the Company´s representatives are well in alignment (on the lower part) with the intervals for complex-systems companies indicated by Moore [10]. Thereby, the company meets the criteria for a complex-systems company.
3. Current BI usage in the Company
During the interviews, a number of application areas started to emerge, showing examples on how the Company is taking advantage of BI. Many of these areas correspond with the internal application processes identified by Davenport and Harris [4], as opportunities to compete on analytics. These areas became the basis for the analysis of the current BI usage, and the findings of [4] were used as reference where
K. Gudfinnsson et al. / Taking Advantage of BI in a Complex-Systems Environment268
applicable. These areas also provided insights related to the current BI maturity. Here, it may be relevant to pinpoint that since the respondents are representing different functions in the Company, a lot of the material underlying the analysis is rather diverseas it covers many important business functions. The diversity contributes in bringing interesting details into light and makes the case more thoroughly described and exemplified as well as helping triangulating the case.
3.1. Financial BI support
The financial area is one of many internal processes usually supported by BI tools. All respondents express MS Excel as the primary tool for economic calculations within the Company. This was no surprise since MS Excel is considered to be a very typical analytical technology [4]. All respondents also claim that they use Excel in one way or the other. In example, the product line manager uses it to, e.g., estimate investment costs for machines, the procurement manager uses it to calculate future procurement costs, and the controller uses it for data quality assurance. Still, the finance manager prefers the central ERP system from a data quality trust perspective or “I rely on the numbers there” as quoted from the finance manager.
The central information system of the Company is called M3 (Movex), but that does not appear to be useful when doing calculations. As the controller says "I do not use M3 much, I have it exported to Excel". Movex is mainly used for data input but is "not suited for analysis" continues the controller. Excel provides opportunities to do calculations with large amounts of rows and to find errors in the data. For example, in Excel, product margin can be easily viewed using pivot tables, sorting from high to low, and if the margin of a product is suspiciously high in Excel, someone has made an input error in the Movex system as described by both the product line manager and the controller. Excel can therefore be used to assure the data quality according to the controller. Furthermore, one of the major tasks described by the controller is follow up on book keeping practices in the sales offices. This involves cost management and as exemplified by Davenport and Harris [4] companies that have effective analysis and management of costs can use that for strategic purposes for example by helping influence customer behavior and pricing, finding the price that the customer is willing to pay.
When deciding on strategic issues like the development of a new product or whether or not to establish a new sales office or a production plant, the purchase manager says profitability calculations are done in Excel providing the main decision support to the board of directors. Ideas regarding these issues float around through e-mail and oral communication for a while, but when they reach a point where quantitative analysis needs to be done; again Excel is the main support system.
When monitoring progress and financial key performance indicators, the usage seems to be divided between using Excel, Microsoft Reporting Services and Cognos. Information regarding sales is sent by e-mail to the analyst and the controller who compile the Excel sheets into a single file with total sales. All employees of the organization then receive reports on monthly bases with sales information and other key performance indicators originating from the sales offices. Employees can quickly see if their products are being sold according to budget. Other reports regarding production can be accessed on-demand to see if products are being produced according to plan. The Product line manager says this creates the opportunity to act fast when something is not following the budget. According to Davenport and Harris [4], having
K. Gudfinnsson et al. / Taking Advantage of BI in a Complex-Systems Environment 269
this kind of constant progress monitoring with respect to key performance indicators is critical to strategy execution.
Product line managers use reports in the Cognos system in a similar way as described by the controller to monitor financial aspects regarding products, incoming orders, sales numbers, production costs, production schedules and product margins. In fact, Cognos is also used to assure data quality, e.g., by viewing graphs and to do drill downs on peak areas to see if something is suspicious in the data. This could be things like inconsistency in product margin or an unusually larger order. Getting data for these reports means a lot of e-mail communication between the sales offices and headquarters according to the controller. Excel sheets are sent and then manually compiled by the analyst, requiring a lot of costly manual labor. Furthermore, the analyst described difficulties regarding data quality. Same products could be called different names and some fields might not be filled out according to the wishes of the headquarters
The data input is done using the central Movex system and stored in the central DW. By using Cognos, division managers do not only see key performance indicators, but they may also spot anomalies in a similar way as the controller describes when using Excel. The Cognos reports can be drilled down to specific products to find errors and production planning can be viewed. The purchase manager uses MS Reporting Services for various reports regarding procurement and to analyze current inventory value. The difference between the reports used in MS Report Services and the reports available in Cognos is unclear. Overall it seems that there are three major tools for financial monitoring depending on the individual preferences of the user. However, although the purchase manager uses reports from Cognos, they are still exported to Excel for data manipulation.
Davenport and Harris [4] have emphasized that there are other aspects of financial analytics that companies need to address. These involve explaining financial performance from factors that are considered non-financial. This involves asking questions like "which activities have the greatest impact on business performance?" and "how do we know whether we are executing against our strategy?" ([4], p.61). According to the CEO, when the board of directors make a strategic decision, the company uses reports to monitor if sales and production volumes are according to plan "we constantly use measures to verify that we are following our predictions, if the profitability is according to plan and if we have the growth as predicted" as put by the CEO. That way the company follows the results of the strategic decision.
3.2. Prognosis and planning
An analysis of the collected material shows that when a division manager views the production plans, intuition and experience is used to estimate if that plan is realistic or not. The production plans need to be carefully monitored as they are based on previous orders, and not all sales offices order in the same way. One example was given by the product line manager, when one sales office sent in an unusually large order and the system continued to use that number of products when predicting the next six months. The product line manager knew that this particular sales office usually orders once every quarter so the production plans need to be spread out on three months instead of one.
Creating sensible prognosis is very difficult and demands a lot of data [4], and as explained by the finance manager “the only thing you can rely on is that it will never be
K. Gudfinnsson et al. / Taking Advantage of BI in a Complex-Systems Environment270
as you expect it to be”. According to both the controller and the finance manager, prognoses are mostly done when budgeting for the coming year. During that process of developing the prognosis, a thorough inspection is done on all products within each product group. Excel is, again, the main decision support tool but Movex also has an important role. Production- and division managers provide Excel sheets with expected sales and procurement of raw materials for example within their product categories. A vast majority of the data comes from the sales subsidiaries by e-mailing Excel sheets. The data is then imported into Movex and various computing is done and then the data is exported back to Excel. This data provides the bases for all production planning in the coming year.
Predicting what is going to happen is probably more useful than reporting and explaining what´s already happened but prediction is a difficult process that requires complex analysis and data [4]. There are essentially two major problems the company faces when developing prognosis and predictions. One of them is the fact that sales offices have difficulties in getting accurate data from their customers explains the product line manager. The other problem expressed by all of the respondents, is the fact that the organization cannot easily access the data stored at the sales offices. Although all respondents expressed the problem of not being able to access the data of the sales offices, none of them particularly described it as a problem with respect to prognosis except by one respondent. The controller described how there is a risk that the main production plant could be producing products that end up on the shelves of the sales offices and stay there until they become obsolete. This fact can skew the production plans as the company is selling unwanted products to their sales subsidiaries. This is a well-known dilemma in literature [4].
As described above, information is sent by e-mail in spreadsheets because the main office cannot access the data from the sales offices. This means that there is possibly ahuge potential to use more sophisticated prognosis in the future if the information stored in the sales offices can be imported into the DW, e.g., analyze the development of customer segments.
3.3. Manufacturing and quality
For any manufacturing company, the production is the core of business. At the same time, the respondents express the priority of having sales offices close to the customers. That provides a basis for supporting large companies operating in a global manner, as explained by the CEO "they can have the design department in one place and the production in another and we can support both". Moreover, the sales offices can be used as platforms to enter new markets and establishing novel production facilities. Finding these new markets and locations for sales offices is mostly done by oral communication with sales representatives or at exhibitions. Hearing on the news that a major customer is making investments in a particular area can also initiate the process of looking into new markets as described by the purchase manager. BI tools do not seem to be used for market analysis regarding new markets by the company headquarters, but the tools may be used to provide indications on such opportunities. The main focus of a manufacturing company is of course on production, but to gain some extra competitive advantage, companies might need to “get outside” of manufacturing so to speak. That could involve using analytics to analyze markets and price trends, [4]. Today these trends and market analysis are usually done by the sales subsidiaries but maybe in the future, some analytic tools can be used by the
K. Gudfinnsson et al. / Taking Advantage of BI in a Complex-Systems Environment 271
headquarters to help with the analysis resulting in faster decisions when appropriate. According to the empirical material, these type of analyzes are initiated by headquarters and then given to the sales subsidiaries as projects.
When the quality- and environmental manager wants to analyze defect rates, reports are exported to Excel for calculations and compilation.
The company in this case study has a process to handle customer claims, but the quality- and environmental manager describes it as both times consuming and expensive. Customers return their products at their local sales office and then the product is shipped to headquarters for registration and analysis. This can be expensive, especially when considering the fact that there are 16 sales subsidiaries positioned world-wide, covering countries such as Brazil, China, and Australia. All of them send the products back to headquarters where they are analyzed and registered. When the problem is found, a report is sent back to the sales office via e-mail, explaining the problem/cause and what actions to take. The report is then often forwarded to the customer. Once a month, an employee of the quality- and environment department compiles various Excel sheets for a monthly report on customer claims. Currently, this is a time-consuming task and the quality- and the environmental manager claims that since the company is constantly expanding, this may become an even bigger problem in the future. Especially since the quality- and environmental manager claims that: “there is too much work-load included already”. Having some sorts of automated system that monitors these claims, could become important as the company grows he continues.
According to the controller, the company is overlooking its inventory in an effort to find products before they become obsolete. Producing products that end-up on the shelves in various sales offices can provide skewed sales information for headquarters as they sell their products to the sales subsidiaries. “We could be producing products that are not needed anymore” says the controller. This spawns the following questions, as put forward by the controller: "are the products old and just lie there?; Is there someone else within the group that can use these products?; and can we offer the products to an old customer on reduced prices or do we need to throw them away?" These questions require data from the sales offices regarding their inventory status, but retrieving this data is a complex process. The controller sends out an Excel template by e-mail that needs to be filled in by the sales offices. An alternative method, which is also used, is that the controller travels to the sales offices and tries to get the data out of their systems onsite. Davenport and Harris [4] call this problem the configuration problem, which occurs at the intersection of sales and manufacturing, influencing the entire supply chain. This is the problem of making sure that the products offered are the products that the market wants. Many companies compete on configuration, some do well, and others fail like some of the well-known car manufacturers in the U.S. The mismatch between cars produced and customer desire created big problems for both Ford and General Motors. Deere and Company on the other hand used analytics to analyze its´ inventory and configuration complexity. Two production lines were analyzed to find the optimal configuration resulting in 15% increased profits of these two lines. Furthermore, the analysis resulted in 30 – 50% less number of configurations offered to customers, [4].
The empirical material indicates that most of market analysis is mainly performed by the sales subsidiaries and then analyzed by headquarters. The assumption is that because the sales offices are operating on their local market, they have the best knowledge of that market. That is true, but one of the strengths of BI support is
K. Gudfinnsson et al. / Taking Advantage of BI in a Complex-Systems Environment272
analyzing existing data and to find new knowledge that can be used as a competitive differentiator. The examples provided by the controller demonstrate that there are many ideas floating around at the headquarters, but they have difficulties with using their tools for market analysis as access to data is difficult.
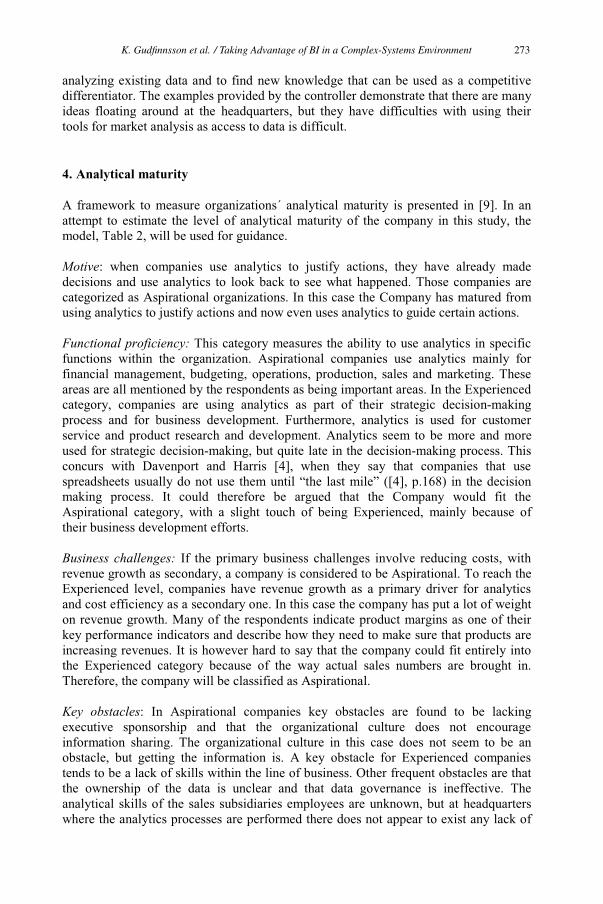
4. Analytical maturity
A framework to measure organizations´ analytical maturity is presented in [9]. In an attempt to estimate the level of analytical maturity of the company in this study, themodel, Table 2, will be used for guidance.
Motive: when companies use analytics to justify actions, they have already made decisions and use analytics to look back to see what happened. Those companies are categorized as Aspirational organizations. In this case the Company has matured from using analytics to justify actions and now even uses analytics to guide certain actions.
Functional proficiency: This category measures the ability to use analytics in specific functions within the organization. Aspirational companies use analytics mainly for financial management, budgeting, operations, production, sales and marketing. These areas are all mentioned by the respondents as being important areas. In the Experienced category, companies are using analytics as part of their strategic decision-making process and for business development. Furthermore, analytics is used for customer service and product research and development. Analytics seem to be more and moreused for strategic decision-making, but quite late in the decision-making process. This concurs with Davenport and Harris [4], when they say that companies that use spreadsheets usually do not use them until “the last mile” ([4], p.168) in the decision making process. It could therefore be argued that the Company would fit the Aspirational category, with a slight touch of being Experienced, mainly because of their business development efforts.
Business challenges: If the primary business challenges involve reducing costs, with revenue growth as secondary, a company is considered to be Aspirational. To reach the Experienced level, companies have revenue growth as a primary driver for analytics and cost efficiency as a secondary one. In this case the company has put a lot of weight on revenue growth. Many of the respondents indicate product margins as one of their key performance indicators and describe how they need to make sure that products are increasing revenues. It is however hard to say that the company could fit entirely into the Experienced category because of the way actual sales numbers are brought in. Therefore, the company will be classified as Aspirational.
Key obstacles: In Aspirational companies key obstacles are found to be lacking executive sponsorship and that the organizational culture does not encourage information sharing. The organizational culture in this case does not seem to be an obstacle, but getting the information is. A key obstacle for Experienced companies tends to be a lack of skills within the line of business. Other frequent obstacles are that the ownership of the data is unclear and that data governance is ineffective. The analytical skills of the sales subsidiaries employees are unknown, but at headquarters where the analytics processes are performed there does not appear to exist any lack of
K. Gudfinnsson et al. / Taking Advantage of BI in a Complex-Systems Environment 273
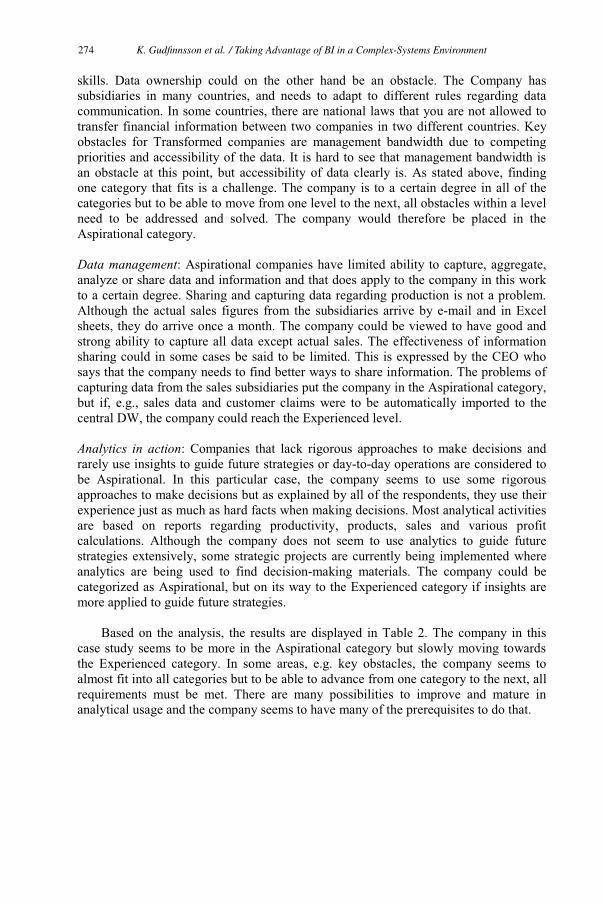
skills. Data ownership could on the other hand be an obstacle. The Company has subsidiaries in many countries, and needs to adapt to different rules regarding data communication. In some countries, there are national laws that you are not allowed to transfer financial information between two companies in two different countries. Key obstacles for Transformed companies are management bandwidth due to competing priorities and accessibility of the data. It is hard to see that management bandwidth is an obstacle at this point, but accessibility of data clearly is. As stated above, finding one category that fits is a challenge. The company is to a certain degree in all of the categories but to be able to move from one level to the next, all obstacles within a level need to be addressed and solved. The company would therefore be placed in the Aspirational category.
Data management: Aspirational companies have limited ability to capture, aggregate, analyze or share data and information and that does apply to the company in this work to a certain degree. Sharing and capturing data regarding production is not a problem. Although the actual sales figures from the subsidiaries arrive by e-mail and in Excel sheets, they do arrive once a month. The company could be viewed to have good and strong ability to capture all data except actual sales. The effectiveness of information sharing could in some cases be said to be limited. This is expressed by the CEO who says that the company needs to find better ways to share information. The problems of capturing data from the sales subsidiaries put the company in the Aspirational category, but if, e.g., sales data and customer claims were to be automatically imported to the central DW, the company could reach the Experienced level.
Analytics in action: Companies that lack rigorous approaches to make decisions and rarely use insights to guide future strategies or day-to-day operations are considered to be Aspirational. In this particular case, the company seems to use some rigorous approaches to make decisions but as explained by all of the respondents, they use their experience just as much as hard facts when making decisions. Most analytical activities are based on reports regarding productivity, products, sales and various profit calculations. Although the company does not seem to use analytics to guide future strategies extensively, some strategic projects are currently being implemented where analytics are being used to find decision-making materials. The company could be categorized as Aspirational, but on its way to the Experienced category if insights are more applied to guide future strategies.
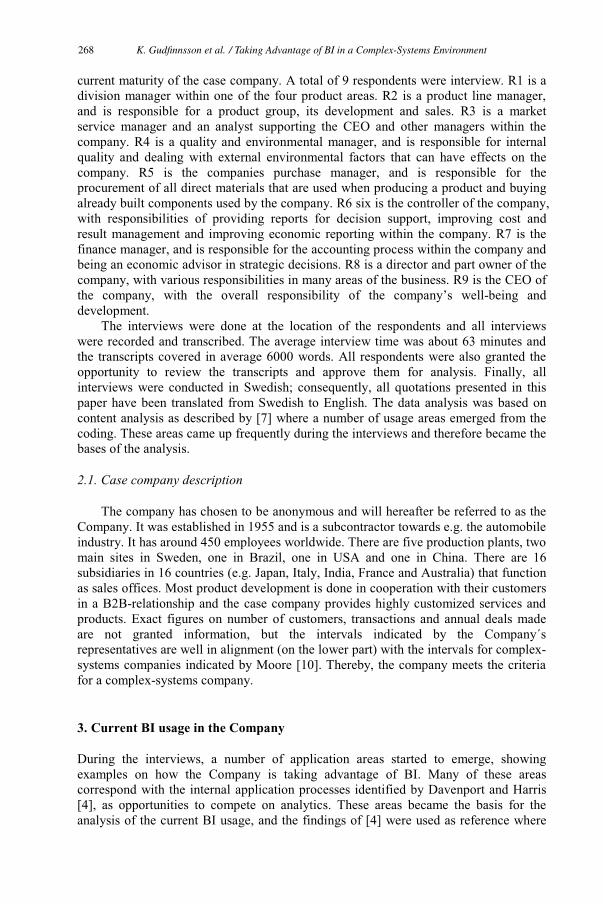
Based on the analysis, the results are displayed in Table 2. The company in this case study seems to be more in the Aspirational category but slowly moving towardsthe Experienced category. In some areas, e.g. key obstacles, the company seems to almost fit into all categories but to be able to advance from one category to the next, all requirements must be met. There are many possibilities to improve and mature in analytical usage and the company seems to have many of the prerequisites to do that.
K. Gudfinnsson et al. / Taking Advantage of BI in a Complex-Systems Environment274
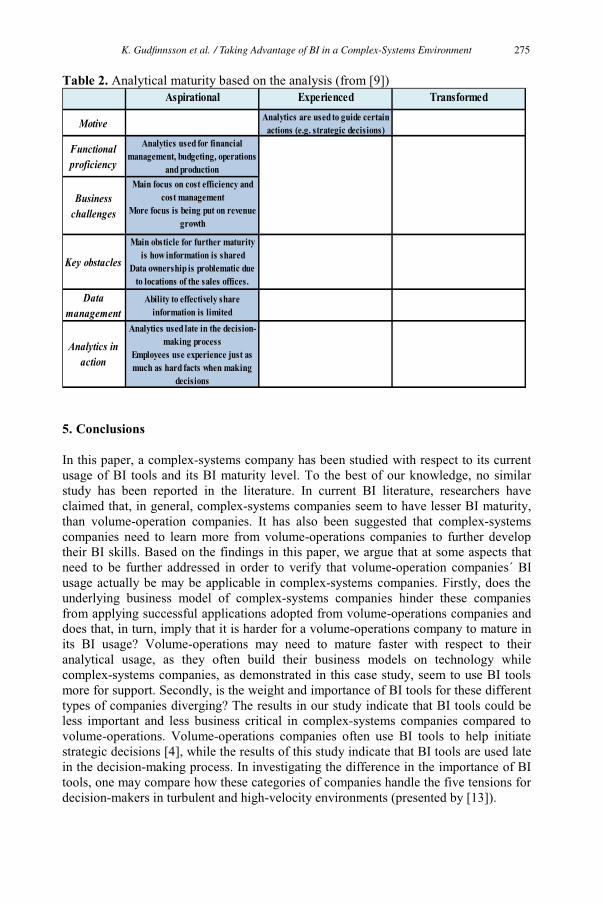
Table 2. Analytical maturity based on the analysis (from [9])
5. Conclusions
In this paper, a complex-systems company has been studied with respect to its current usage of BI tools and its BI maturity level. To the best of our knowledge, no similar study has been reported in the literature. In current BI literature, researchers have claimed that, in general, complex-systems companies seem to have lesser BI maturity, than volume-operation companies. It has also been suggested that complex-systems companies need to learn more from volume-operations companies to further develop their BI skills. Based on the findings in this paper, we argue that at some aspects thatneed to be further addressed in order to verify that volume-operation companies´ BI usage actually be may be applicable in complex-systems companies. Firstly, does the underlying business model of complex-systems companies hinder these companies from applying successful applications adopted from volume-operations companies and does that, in turn, imply that it is harder for a volume-operations company to mature in its BI usage? Volume-operations may need to mature faster with respect to their analytical usage, as they often build their business models on technology while complex-systems companies, as demonstrated in this case study, seem to use BI tools more for support. Secondly, is the weight and importance of BI tools for these different types of companies diverging? The results in our study indicate that BI tools could be less important and less business critical in complex-systems companies compared to volume-operations. Volume-operations companies often use BI tools to help initiate strategic decisions [4], while the results of this study indicate that BI tools are used late in the decision-making process. In investigating the difference in the importance of BI tools, one may compare how these categories of companies handle the five tensions for decision-makers in turbulent and high-velocity environments (presented by [13]).
Aspirational Experienced Transformed
MotiveAnalytics are used to guide certain
actions (e.g. strategic decisions)
Main focus on cost efficiency and cost management
More focus is being put on revenue growth
Main obsticle for further maturity is how information is shared
Data ownership is problematic due to locations of the sales offices.
Analytics used late in the decision-making process
Employees use experience just as much as hard facts when making
decisions
Ability to effectively share information is limited
Analytics used for financial management, budgeting, operations
and production
Analytics in action
Functional proficiency
Business challenges
Key obstacles
Data management
K. Gudfinnsson et al. / Taking Advantage of BI in a Complex-Systems Environment 275
References
[1] D. Agrawal, The Reality of Real-Time Business Intelligence. Lecture Notes in Business Information Processing, 27(1), 75-88, 2009.
[2] R. Anderson-Lehman, H. J., Watson, B. H., Wixom, & J. A. Hoffer, Flying High with Real-Time Business Intelligence. In F. Burstein, & C. W. Holsapple, Handbook on decision support systems 2 (pp. 443-462). Berlin: Springer-Verlag Berlin Heidelberg, 2008.
[3] D. Arnott & G. Pervan, Eight Key Issues for the Decision Support Systems Discipline. Decision Support Systems, 44, 657-672, 2008.
[4] T. H., Davenport & J. G., Harris, Competing on analytics: The New Science of Winning. Boston: Harvard Business School Publishing Corporation, 2007.
[5] M. Z. Elbashir, P. A., Collier, & M. J. Davern, Measuring the effects of business intelligence systems: The relationship between business process and organizational performance. International Journal of Accounting Information Systems, 9, 135-153, 2008.
[6] T. L. Friedman, The World is Flat: A Brief History of the Twenty-First Century (1st rev. and expanded ed.). New York: Farrar, Straus and Giroux, 2006.
[7] K. Krippendorff, Content Analysis: An Introduction to Its Methodology (2nd ed.). Thousand Oaks: Sage Publications, Inc, 2004.
[8] G. H., Laursen, & J. Thorlund, Business analytics for managers: Taking business intelligence beyond reporting. New Jersey: John Wiley & Sons, Inc., 2010.
[9] S. Lavalle, M. S. Hopkins, E. Lesser, R. Shockley, & N. Kruschwitz, Analytics: the new path to value.Massachusetts Institute of Technology. Massachusetts: MIT Sloan Management Review, 2010.
[10] G. A. Moore, Dealing With Darwin: How Great Companies Innovate at Every Phase of Their Evolution (2nd Edition ed.). New York: Penguin Group, 2008.
[11] W. J. Orlikowski & J. J. Baroudi, Studying IT in organizations: Research approaches and assumptions. Information Systems Research, 2, 1-28, 1991.
[12] P. Ponniah, Data warehousing fundamentals for IT professionals (2nd ed.). New Jersey: John Wiley & Sons, Inc., 2010.
[13] S.A. Carlsson, & O.A. El Sawy, Managing the five tensions of IT-enabled decision support in turbulent and high velocity environments, Information Systems and e-Business Management forthcoming (2008)
[14] Turban, R. Sharda, D. Delen, and D. King, Business Intelligence: A Managerial Approach. New Jersey: Pearson Education Inc., 2011.
[15] J. Valacich, & C. Schneider, C. Information Systems Today - Managing in the Digital World (4th Edition ed.). New Jersey: Pearson Education Inc., 2010.
[16] H. J Watson, Why Some Firms´ BI Efforts lag. Business Intelligence Journal, 13(3), 4-7, 2008.[17] H. J. Watson, & B. H. Wixom, The current state of business intelligence. Computer, 96-99, 2007.[18] B. Wixom & H. Watson, The BI-Based organization. International journal of Business Intelligence
Research, 1(1), 13-28, 2010.
K. Gudfinnsson et al. / Taking Advantage of BI in a Complex-Systems Environment276
Related Documents