MORGUARD CORPORATION 2018 ANNUAL REPORT TAKING ACTION. GETTING RESULTS.

Welcome message from author
This document is posted to help you gain knowledge. Please leave a comment to let me know what you think about it! Share it to your friends and learn new things together.
Transcript

MORGUARD CORPORATION
2018 ANNUAL REPORTTAKING ACTION. GETTING RESULTS.

ON THE COVER (LEFT TO RIGHT) 123 COMMERCE VALLEY DRIVE EASTMARKHAM, ON
THE FENESTRA AT ROCKVILLE TOWN SQUARE ROCKVILLE, MD
JEAN EDMONDS TOWERSOTTAWA, ON
The selected annual financial information in the 2018 Annual Report highlights certain key metrics for the Company. As a result, this report should be read in conjunction with the Company’s consolidated financial statements for the year ended December 31, 2018, related Management’s Discussion and Analysis (MD&A) and the Annual Information Form. These documents are available on the Company’s website at www.morguard.com. All continuous disclosure documents required by securities regulators are also filed on the System for Electronic Document Analysis and Retrieval (SEDAR) and can be accessed electronically at www.sedar.com.
NON-IFRS MEASURESThe Company’s consolidated financial statements are prepared in accordance with International Financial Reporting Standards (IFRS). The following measures, NOI and FFO (collectively, the “non-IFRS measures”) as well as other measures discussed elsewhere in the 2018 Annual Report, do not have a standardized meaning prescribed by IFRS and are, therefore, unlikely to be comparable to similar measures presented by other reporting issuers in similar or different industries. The Company uses these measures to better assess the Company’s underlying performance and financial position and provides these additional measures so that investors may do the same. Details on non-IFRS measures are set out in the Company’s MD&A for the year ended December 31, 2018 and available on the Company’s profile on SEDAR at www.sedar.com.

MORGUARD CORPORATION
2018 ANNUAL REPORT 1
FELLOW
SHAREHOLDERS
Morguard once again achieved very strong financial results in 2018. There are many reasons for our continued success,
but if I were to choose just one, it would be our ability to take action. The collective expertise of our team of real estate
professionals, often working in concert with our joint venture partners, has enabled Morguard to find and take action
on dozens of highly advantageous opportunities. Over the last two years alone, our acquisitions have totalled $1.1 billion.
Our knowledge in the discipline of real estate investment has resulted in a widely diverse portfolio representing virtually
all real estate asset classes – residential, office, retail, hotel and industrial – throughout North America. This diversified
portfolio of properties provides a stable cash flow, which in turn translates into greater financial flexibility and stability.
While our commitment to diversification remains constant, so too does our commitment to reinvestment in our properties
through ongoing capital improvements, enhanced property management, environmental sustainability initiatives and
enhanced tenant services. These commitments lead to increased tenant occupancy as well as increased rental income,
which in turn help us to meet our goal of growing shareholder value.
With Morguard’s talented management team, remarkable employees, and highly accomplished Directors, we remain
on a course to achieve continued success in 2019. As always, I extend my sincere gratitude to each and every one
of them, and to you, our loyal shareholders, for allowing Morguard to take action – and get results.
Sincerely,
K. RAI SAHI Chairman and Chief Executive Officer
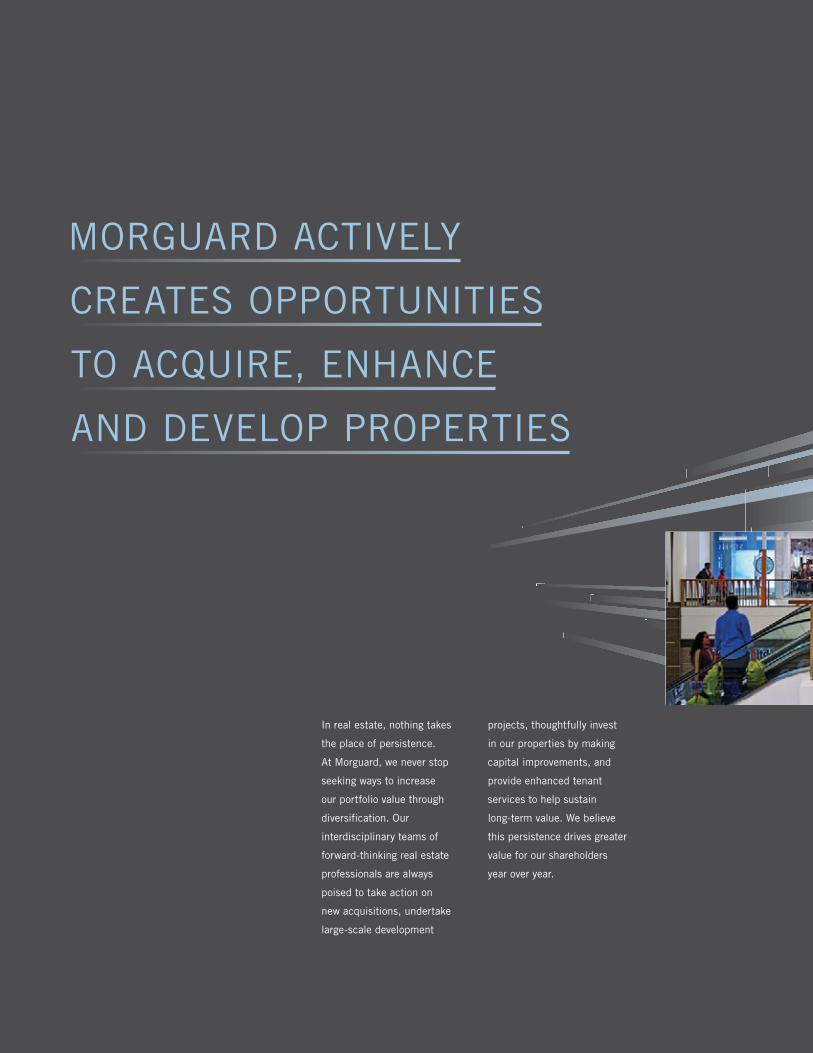
In real estate, nothing takes
the place of persistence.
At Morguard, we never stop
seeking ways to increase
our portfolio value through
diversification. Our
interdisciplinary teams of
forward-thinking real estate
professionals are always
poised to take action on
new acquisitions, undertake
large-scale development
MORGUARD ACTIVELY
CREATES OPPORTUNITIES
TO ACQUIRE, ENHANCE
AND DEVELOP PROPERTIES
projects, thoughtfully invest
in our properties by making
capital improvements, and
provide enhanced tenant
services to help sustain
long-term value. We believe
this persistence drives greater
value for our shareholders
year over year.
SECTION 1 REAL ESTATE PORTFOLIO

SECTION 1: REAL ESTATE PORTFOLIO
MORGUARD CORPORATION
2018 ANNUAL REPORT 3
BRAMALEA CITY CENTREBRAMPTON, ON

MORGUARD CORPORATION
2018 ANNUAL REPORT4
A DIVERSE PORTFOLIO
Morguard Corporation is a
real estate investment company
listed on the Toronto Stock
Exchange (TSX: MRC) with
a directly owned real estate
portfolio and ownership in
three public companies:
Morguard REIT (TSX: MRT.UN),
Morguard North American
Residential REIT (TSX: MRG.UN)
and Temple Hotels Inc.
(TSX: TPH).
Additionally, Morguard
derives income from real estate
advisory services offered to
major institutional clients,
private investors, and its
public company investments
and receives revenue from
managing equities, fixed
income and balanced
investment portfolios offered
to major institutional clients,
and private investors under
the Lincluden Investment
Management Limited
(Lincluden) brand.
The total value of owned and
managed assets was $21.0
billion as of December 31,
2018.
Owned Real Estate $10.5B
Managed Real Estate $5.4B
Managed Equities
and Fixed Income $5.1B
Total $21.0B
PERFORMANCE FROM
A DIVERSIFIED REAL
ESTATE PORTFOLIO
The strength of the Morguard
owned and managed real estate
portfolio is its diversification.
Comprising a wide range of
multi-suite residences, enclosed
regional and unenclosed
shopping centres, single- and
multi-tenant office buildings,
industrial buildings, and hotels,
the properties are located
within suburban and urban
centres across Canada and
the United States.
Such a wide variety of asset
classes allow greater stability
in our financial performance.
Our management team has an
active, current, and in-depth
knowledge of real estate
markets across North America
in all asset classes. We work in
concert with an exclusive group
of joint venture partners, giving
us greater access to new
investment opportunities for
development or acquisition.
Our experience in real estate
investment management has
contributed to Morguard’s
consistent growth and strong
performance.
Revenue from real estate
is earned through proactive
leasing of our properties, as
well as fees from our advisory
and management services.
We have been able to further
optimize our profitability
through our exceptional
abilities in operational
management. We continually
focus on strict control of
our operating costs, capital
improvements to enhance
portfolio value, sustainable
SECTION 1 REAL ESTATE PORTFOLIO
MORGUARD’S PORTFOLIO REMAINS STRONG
BECAUSE OF ITS DIVERSIFICATION

SECTION 1: REAL ESTATE PORTFOLIO
MORGUARD CORPORATION
2018 ANNUAL REPORT 5
property management,
and enhancing the tenant
experience.
Our residential properties
continue to experience high
occupancy in Canada and the
U.S. Rental rates in Canada are
achieving significant increases
with suite turnover, while in
the U.S., rental rate increases
continue a positive trend,
particularly in our core markets.
Office revenue in most urban
markets is strong, with low
vacancy rates, and rental rate
growth for our properties in
Toronto, Ottawa, and Vancouver.
Suburban office revenue was
slightly challenged by higher
vacancy rates and lower rent
increases overall. Income from
our office portfolio was up
due to the strength of our
acquisition program, having
acquired office properties
valued at $418 million over
the past two years.
The majority of our enclosed
regional shopping centres have
had stable occupancy and
those that had vacancies left
by the departure of Target
and Sears are starting to see
returns from development and
remerchandising activities.
Our unenclosed shopping
centres continue to perform
exceptionally well.
PERFORMANCE COURTOTTAWA, ON

DIVERSIFICATIONMorguard Corporation owns and manages a diversified portfolio of multi-suite
residential, office, retail, hotel and industrial properties in Canada and the United States.
This diversification has helped make our financial performance more reliable over time,
providing insulation from downturns in any given asset class or region.
• 1 COUNTRY AND REGION
8 CANADIAN PROVINCES
10 U.S. STATES
75% OF PROPERTIES IN CANADA
25% OF PROPERTIES IN U.S.
SECTION 1: REAL ESTATE PORTFOLIO
MORGUARD CORPORATION
2018 ANNUAL REPORT6

• 3 ASSET CLASS AND USE
• 4 NET OPERATING INCOME
$4.3B MORGUARD CORPORATION
$0.4B TEMPLE HOTELS
$3.0B MORGUARD REIT
$2.8B MORGUARD NORTH AMERICAN RESIDENTIAL REIT
• 2 OWNERSHIP
25% RETAIL
24% OFFICE
48OFFICE
60MULTI-SUITE RESIDENTIAL
39HOTEL
27INDUSTRIAL
38% MULTI-SUITE RESIDENTIAL
HIGH- RISE
LOW- RISE
2% INDUSTRIAL
11% HOTEL
$10.5 BILLION IN OWNED ASSETS
214 TOTAL PROPERTIES
MID- RISE
40RETAIL
SINGLE TENANT
BRANDED SINGLE TENANT
ENCLOSED SHOPPING CENTRES
MULTI TENANT
BOUTIQUE MULTI TENANT
UNENCLOSED SHOPPING CENTRES
SECTION 1: REAL ESTATE PORTFOLIO
MORGUARD CORPORATION
2018 ANNUAL REPORT 7

SECTION 1: REAL ESTATE PORTFOLIO
MORGUARD CORPORATION
2018 ANNUAL REPORT8
MARQUEE AT BLOCK 37CHICAGO, IL

SECTION 1: REAL ESTATE PORTFOLIO
MORGUARD CORPORATION
2018 ANNUAL REPORT 9
TAKING ACTION IN
VITAL MARKETS ACROSS
NORTH AMERICA
In the past two years, the
Morguard team has energetically
sought new opportunities to
expand it’s real estate portfolio.
2017 saw acquisitions totalling
$656 million. And in 2018,
Morguard spearheaded seven
acquisitions for a total value of
$451 million. Our acquisition
strategy remains consistent:
concentrate on key markets
wherein we can leverage our
existing management presence,
while seeking opportunities in
all asset classes to further
ensure diversification.
In 2018, Morguard also
continued with its dedicated
commitment to the ongoing
development and upgrades of
its real estate assets. We see
these initiatives as absolutely
essential to growing the value,
prolonging the longevity and
maintaining the desirability of
our portfolio. Through the
innovative re-imagining of
select properties, including
retail, office, and residential,
we help maintain relevance to
the tenants and communities
we serve throughout Canada
and the United States.
At the same time, Morguard’s
lengthy experience and
extensive network of operations
within real estate has led to a
proven ability to identify and
access capital and work closely
with joint venture partners in
mutually profitable endeavours.
In some cases, our partners are
experienced real estate
developers in specific markets,
and in others, Morguard serves
as the developer and manager.
These relationships enable
each partner to provide the
most appropriate skills or
resources, and to benefit
accordingly. Very often,
success in one major project
leads to other profitable
opportunities. By expanding
our scope through ventures
using different sources of
capital, we have grown
stronger, simultaneously
expanding our portfolio
while reducing risk exposure.
We will continue to pursue
more strategic relationships
as we explore new and
innovative ways to grow
the Morguard portfolio.
Morguard Corporation works
collaboratively with employees,
tenants, clients and joint
venture partners to define
goals and actions in a formal
plan comprising environmental,
social and governance
initiatives. We are committed
to using Energy Star Portfolio
Manager, and in 2018 we
had 159 participating owned
and managed Canadian office,
retail and industrial properties.
IN THE PAST TWO YEARS, THE MORGUARD
TEAM HAS ENERGETICALLY SOUGHT
NEW OPPORTUNITIES TO EXPAND IT’S
REAL ESTATE PORTFOLIO.

SECTION 1: REAL ESTATE PORTFOLIO
MORGUARD CORPORATION
2018 ANNUAL REPORT10
ACQUISITIONS 2018
7 PROPERTIES
468 RESIDENTIAL SUITES
1.1 MILLION COMMERCIAL SF
• 2
$451 MILLION IN TRANSACTIONS
• 3
• 1
• 4

SECTION 1: REAL ESTATE PORTFOLIO
MORGUARD CORPORATION
2018 ANNUAL REPORT 11
PROPERTY ASSET CLASS PRICE DESCRIPTION
Jean Edmonds Towers Ottawa, ON
Office $190.1 million These twenty-storey towers, linked by a ground level retail atrium, are 98 percent leased to Public Services and Procurement Canada, and located close to Lyon LRT Station on the upcoming O-Train Confederation Line. Purchased in a joint venture, they complete Morguard’s operational management of a full city block in Ottawa’s central business district.
Santorini Apartments Boynton Beach, FL
Residential $64.2 million A newly constructed residential property with 226 suites in a pair of six-storey buildings located in Renaissance Commons, a premier mixed-use planned urban development within 15 minutes of downtown West Palm Beach and Boca Raton.
41 Rue Victoria Gatineau, QC
Office $60.6 million This Class A office building is fully occupied on a long-term lease by a global leader in renewable energy. It holds a LEED® Registered designation, and the Association of Registered Interior Designers of Ontario Award of Merit for excellence, innovation and originality in interior design.
5985 Explorer Drive Mississauga, ON
Office $51.7 million A 128,000 square foot, Class A office building located in the Airport Corporate Centre, fully occupied by Federal Express Canada, for which it was purpose-built. The building backs onto 12.5 acres with 621 parking stalls, allowing for the potential to further develop the site.
1100 and 1101 Polytek Street Ottawa, ON
Industrial $43.4 million This two-building, small-bay industrial building comprises 243,000 square feet on 15.5 acres and was constructed in 2010 and 2015, with minimal capital expenditures forecast for the near future. Ottawa remains one of the strongest and most consistent real estate markets in Canada.
Vizcaya Lakes Boynton Beach, FL
Residential $25.9 million Vizcaya Lakes is a newly constructed residential property of which Morguard acquired 126 suites within a Class A, 328-suite condominium complex, consisting of a pair of six-storey buildings. The property is adjacent to Santorini Apartments.
1643 Josephine New Orleans, LA
Residential $14.9 million A 116-suite residential property in the city’s Garden District, the property is located close to The Georgian, Morguard’s 135-suite mid-rise apartment complex, as well as Tulane and Loyola universities. Morguard is completing a significant refurbishment of the building, with leasing expected to commence during summer 2019.
• 1
• 6 • 5 • 7
• 2
• 3
• 4
• 5
• 6
• 7
ACQUIRED PROPERTIES

SECTION 1: REAL ESTATE PORTFOLIO
MORGUARD CORPORATION
2018 ANNUAL REPORT12
In 2018, Morguard Corporation continued with its strong commitment to the ongoing development
and upgrades of its real estate assets. We see these initiatives as absolutely essential to growing
the value of our portfolio. Through the innovative re-imagining of select properties, we help maintain
relevance to the tenants and communities we serve throughout Canada and the United States.
DEVELOPMENTS
• 1
• 2 • 3
• 4
• 5
• 6
• 7

SECTION 1: REAL ESTATE PORTFOLIO
MORGUARD CORPORATION
2018 ANNUAL REPORT 13
CLIENT
PROJECT ASSET CLASS DESCRIPTION
Hilton Hotel Ottawa, ON
Hotel • Part of a complete redevelopment employing a modern and sustainable design• Includes a 17-storey Hilton Homewood Suites and 10-storey Hilton Garden Inn
with 346 rooms, restaurant, fitness centre, pool and meeting facilities• Officially opened for business in December 2018
Etobicoke Wellness Centre Toronto, ON
Office • Class A LEED® Gold medical office building • Part of Etobicoke General Hospital’s new patient tower • Doubled the facility’s square footage to provide world-class medical care
Heritage Place Ottawa, ON
Office • Integrating a new station for Ottawa Light Rail Transit into the lobby of a Class A office building in downtown Ottawa
• Renovating the curtainwall façade and lobby to accommodate and add new retail• New interior connection to Parliament East Station, which is closest to
Parliament Hill, has resulted in improved lease up and increased rents
Rainbow Square Dunellon, FL
Retail • Construction of new Publix Supermarket• Continuing redevelopment of retail community centre
East York Town Centre Toronto, ON
Retail • Continuing redevelopment of mixed use complex• Consolidating and adding services that cater to the surrounding communities
Cambridge Shopping Centre Cambridge, ON
Retail • Completed repurposing of former Target Canada premises• Diversified and enhanced tenant profile with an assortment of entertainment,
lifestyle and large format retail
Shoppers Mall Brandon, MB
Retail • Completed redevelopment of an anchor vacancy overhaul• Strengthened mall profile with grocery, pharmacy, fitness and restaurant
pad intensification
Prairie Mall Shopping Centre Grande Prairie, AB
Retail • Successful remerchandising and investment in former anchor space has drawn significant activity with its new major tenants
• Enhanced tenant profile has helped drive overall sales performance to near record levels
The Colonnade Toronto, ON
Retail • Significant remerchandising and re-investment catering to luxury retail offerings• Successful expansion of Prada and new William Ashley and Christian Dior
(2019) flagship locations
PROJECT ASSET CLASS DESCRIPTION
60 Bloor West Toronto, ON
Office • Partnering with Ledcor, Morguard is undertaking a deep retrofit of this 1970s office building, making significant mechanical and electrical upgrades to reduce energy consumption by more than 25% and receive LEED® EB:O&M Gold
Connect Bonnie Doon Edmonton, AB
Retail/ Multi-Suite Residential
• The entitlement process will result in new residential, commercial and community amenities with upwards of four million square feet of new development leveraging the new Valley Line LRT station that connects Bonnie Doon to downtown
MORGUARD
• 1
• 2
• 3
• 4
• 5
• 6
• 7

SECTION 1: REAL ESTATE PORTFOLIO
MORGUARD CORPORATION
2018 ANNUAL REPORT14
THE HEATHVIEWTORONTO, ON

SECTION 1: REAL ESTATE PORTFOLIO
MORGUARD CORPORATION
2018 ANNUAL REPORT 15
OWNERSHIP INTEREST TOTAL OWNERSHIP OCCUPANCY PROPERTY CITY PROV. OWNERSHIP (%) SUITES SUITES (%)
Mayfair Village South Edmonton AB MRC 100 237 237 100
Square 104 Edmonton AB MRG 100 277 277 99
Margaret Place• 1 Kitchener ON MRG 100 472 472 99
Aspen Grove I• 1 Mississauga ON MRC 95 168 160 100
Aspen Grove II• 1 Mississauga ON MRC 95 168 160 100
Meadowvale Gardens• 1 Mississauga ON MRG 100 325 325 97
The Arista• 1 Mississauga ON MRG 100 458 458 100
The Elmwoods• 1 Mississauga ON MRG 100 321 321 100
The Forestwoods• 1 Mississauga ON MRG 89 300 267 98
The Maplewoods• 1 Mississauga ON MRG 87 300 261 98
The Valleywoods• 1 Mississauga ON MRG 91 373 339 100
Tomken Place• 1 Mississauga ON MRG 100 142 142 100
126 Sparks Ottawa ON MRC 100 36 36 n/a
160 Chapel • 1 Ottawa ON MRG 100 370 370 100
Condominium Suites Toronto ON MRC 100 4 4 100
Downsview Park Townhomes Toronto ON MRG 100 60 60 100
Leaside Towers• 1 Toronto ON MRC 100 989 989 98
Rideau Towers I• 1 Toronto ON MRG 90 287 258 99
Rideau Towers II• 1 Toronto ON MRG 100 380 380 99
Rideau Towers III• 1 Toronto ON MRG 100 474 474 98
Rideau Towers IV• 1 Toronto ON MRG 100 400 400 100
Rouge Valley Residence• 1 Toronto ON MRG 100 396 396 100
The Bay Club• 1 Toronto ON MRC 100 293 293 95
The Colonnade• 1 Toronto ON MRC 100 157 157 97
The Heathview• 2 • 3 (Pending) Toronto ON MRC 100 587 587 98
SUBTOTAL 7,974 7,823 99
OWNERSHIP INTEREST TOTAL OWNERSHIP OCCUPANCY PROPERTY CITY STATE OWNERSHIP (%) SUITES SUITES (%)
Sunset & Gordon • 1 Los Angeles CA MRC 59 299 176 N/A
Retreat at City Center • 1 Aurora CO MRG 100 225 225 96
Settlers’ Creek • 1 Fort Collins CO MRG 100 229 229 97
The Retreat at Spring Park • 1 Garland TX MRG 100 188 188 97
Grand Venetian at Las Colinas • 1 Irving TX MRG 100 514 514 95
Verandah at Valley Ranch • 1 Irving TX MRG 100 319 319 97
Garden Lane• 1 Gretna LA MRG 100 261 261 97
Colonial Manor Apartment Homes • 1 Harahan LA MRG 100 48 48 92
Steeplechase Apartment Homes • 1 Lafayette LA MRG 100 192 192 94
Magnolia Place Apartment Homes • 1 New Iberia LA MRG 100 148 148 81
1643 Josephine (Under Development) New Orleans LA MRG 100 116 116 –
The Georgian Apartments • 1 New Orleans LA MRG 100 135 135 96
Villages of Williamsburg• 1 Shreveport LA MRG 100 194 194 90
Greenbrier Estates • 1 Slidell LA MRG 100 144 144 88
MULTI-SUITE RESIDENTIAL CANADA
U.S.
CERTIFICATIONS
• 1 Equal Housing Opportunity • 2 LEED Gold • 3 LEED Silver
CERTIFICATIONS
• 1 Certified Rental Building Program • 2 LEED Gold • 3 LEED Silver
Continued on next page
PORTFOLIO SUMMARY

SECTION 1: REAL ESTATE PORTFOLIO
MORGUARD CORPORATION
2018 ANNUAL REPORT16
OWNERSHIP INTEREST TOTAL OWNERSHIP OCCUPANCY PROPERTY CITY STATE OWNERSHIP (%) SUITES SUITES (%)
Alta at K Station• 1 • 2 Chicago IL MRC 100 848 848 98
Coast at Lakeshore East• 1 • 3 Chicago IL MRG 51 515 263 94
The Marquee at Block 37• 1 Chicago IL MRC 49 691 339 90
Briarhill Apartments• 1 Atlanta GA MRG 100 292 292 95
The Savoy Luxury Apartments• 1 Atlanta GA MRG 100 232 232 97
Barrett Walk Luxury Apartment Homes• 1 Kennesaw GA MRG 100 290 290 95
210 Watermark• 1 Bradenton FL MRG 100 216 216 98
Santorini Apartments• 1 Boynton Beach FL MRC 100 226 226 77
Vizcaya Lakes• 1 Boynton Beach FL MRC 100 126 126 90
Blue Isle Apartment Homes• 1 Coconut Creek FL MRG 100 340 340 94
2940 Solano at Monterra• 1 Cooper City FL MRG 51 252 129 95
Emerald Lake Apartments• 1 Lake Worth FL MRC 100 338 338 95
Governors Gate I• 1 Pensacola FL MRG 100 240 240 97
Governors Gate II• 1 Pensacola FL MRG 100 204 204 98
Jamestown Estates• 1 Pensacola FL MRG 100 177 177 95
Woodcliff Apartment Homes• 1 Pensacola FL MRG 100 184 184 93
Woodbine Apartment Homes• 1 Riviera Beach FL MRG 100 408 408 97
Mallory Square• 1 Tampa FL MRG 100 383 383 94
Village Crossing Apartment Homes• 1 West Palm Beach FL MRG 100 189 189 95
The Lodge at Crossroads• 1 Cary NC MRG 100 432 432 95
Perry Point Ultimate Apartments• 1 Raleigh NC MRG 100 432 432 97
Northgate at Falls Church• 1 Falls Church VA MRG 100 104 104 90
The Fenestra at Rockville Town Square Rockville MD MRC/MRG 100 492 492 88
SUBTOTAL 10,623 9,773 93
TOTAL MULTI-SUITE RESIDENTIAL 18,597 17,596 96
U.S.
MULTI-SUITE RESIDENTIAL
CERTIFICATIONS
• 1 Equal Housing Opportunity • 2 LEED Gold • 3 LEED Silver
Continued
OWNERSHIP TOTAL OWNERSHIP OCCU- OWNER- INTEREST AREA AREA PANCY PROPERTY CITY PROV. SHIP (%) (SF) (SF) (%) TOP TENANTS
111 Dunsmuir• 1 Vancouver BC MRT 100 222,000 222,000 100 Stantec Consulting Ltd, Wood Canada Limited
Chancery Place• 2 Vancouver BC MRT 100 142,500 142,500 100 Boston Pizza, Victoria’s Health Inc
Seymour Place Victoria BC MRT 100 235,500 235,500 100 Province of British Columbia
207 and 215 9th Avenue SW• 2 • 8 Calgary AB MRT 100 636,500 636,500 99 Engel & Volkers, Obsidian Energy Ltd
505 3rd Street SW• 2 • 8 Calgary AB MRT 50 142,000 71,000 70 Bank of China, Morguard Investments Ltd
7315 8th Street NE Calgary AB MRT 100 19,500 19,500 100 Genesis Land Development Corp
Centre 810 Calgary AB MRT 100 77,500 77,500 80 CIMA Canada Inc, The MI Group Ltd
Citadel West Calgary AB MRT 100 78,500 78,500 100 CH2M Hill Canada Limited
Deerport Centre• 3 Calgary AB MRT 100 48,500 48,500 59 Aerotek ULC, Colleaux Engineering Inc
OFFICE CANADA
CERTIFICATIONS
• 1 BOMA Platinum • 2 BOMA Gold • 3 BOMA Silver • 4 BOMA Bronze • 5 BOMA Certified • 6 LEED Gold • 7 LEED Silver • 8 Energy Star • 9 Bullfrog Powered
Continued on next page
SECTION 1: REAL ESTATE PORTFOLIO
MORGUARD CORPORATION
2018 ANNUAL REPORT 17
Continued
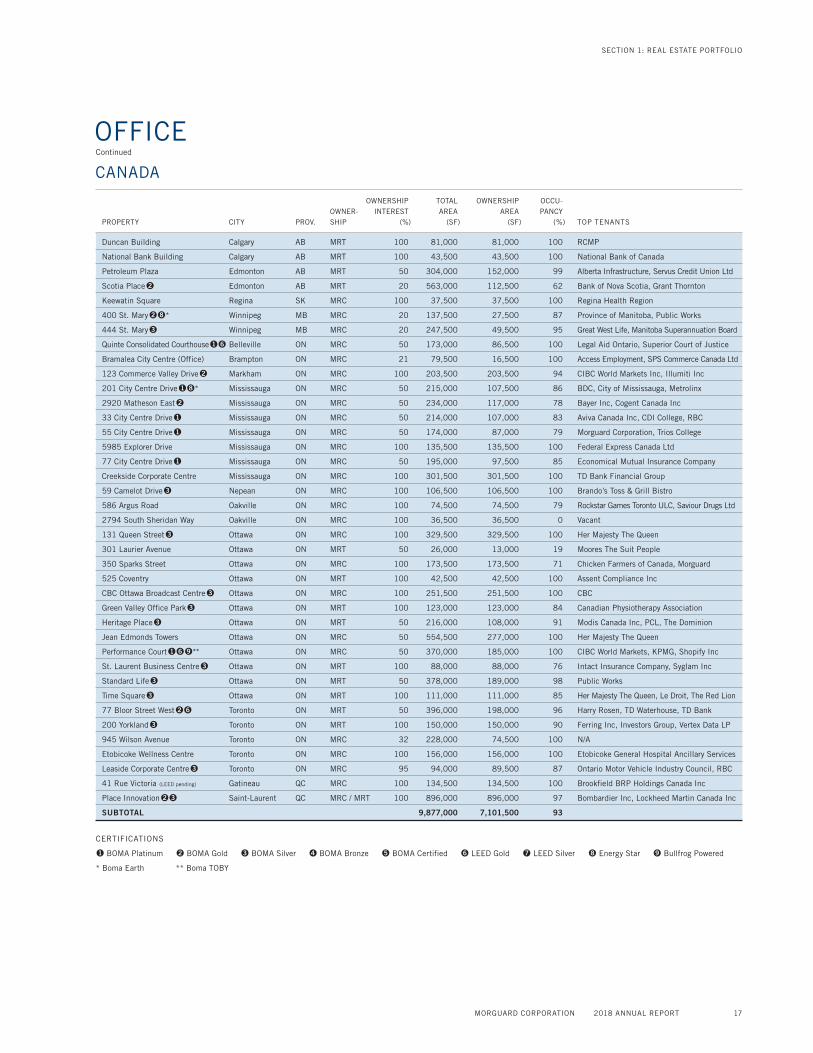
OWNERSHIP TOTAL OWNERSHIP OCCU- OWNER- INTEREST AREA AREA PANCY PROPERTY CITY PROV. SHIP (%) (SF) (SF) (%) TOP TENANTS
Duncan Building Calgary AB MRT 100 81,000 81,000 100 RCMP
National Bank Building Calgary AB MRT 100 43,500 43,500 100 National Bank of Canada
Petroleum Plaza Edmonton AB MRT 50 304,000 152,000 99 Alberta Infrastructure, Servus Credit Union Ltd
Scotia Place• 2 Edmonton AB MRT 20 563,000 112,500 62 Bank of Nova Scotia, Grant Thornton
Keewatin Square Regina SK MRC 100 37,500 37,500 100 Regina Health Region
400 St. Mary• 2 • 8 * Winnipeg MB MRC 20 137,500 27,500 87 Province of Manitoba, Public Works
444 St. Mary• 3 Winnipeg MB MRC 20 247,500 49,500 95 Great West Life, Manitoba Superannuation Board
Quinte Consolidated Courthouse• 1 • 6 Belleville ON MRC 50 173,000 86,500 100 Legal Aid Ontario, Superior Court of Justice
Bramalea City Centre (Office) Brampton ON MRC 21 79,500 16,500 100 Access Employment, SPS Commerce Canada Ltd
123 Commerce Valley Drive• 2 Markham ON MRC 100 203,500 203,500 94 CIBC World Markets Inc, Illumiti Inc
201 City Centre Drive• 1 • 8 * Mississauga ON MRC 50 215,000 107,500 86 BDC, City of Mississauga, Metrolinx
2920 Matheson East• 2 Mississauga ON MRC 50 234,000 117,000 78 Bayer Inc, Cogent Canada Inc
33 City Centre Drive• 1 Mississauga ON MRC 50 214,000 107,000 83 Aviva Canada Inc, CDI College, RBC
55 City Centre Drive• 1 Mississauga ON MRC 50 174,000 87,000 79 Morguard Corporation, Trios College
5985 Explorer Drive Mississauga ON MRC 100 135,500 135,500 100 Federal Express Canada Ltd
77 City Centre Drive• 1 Mississauga ON MRC 50 195,000 97,500 85 Economical Mutual Insurance Company
Creekside Corporate Centre Mississauga ON MRC 100 301,500 301,500 100 TD Bank Financial Group
59 Camelot Drive• 3 Nepean ON MRC 100 106,500 106,500 100 Brando’s Toss & Grill Bistro
586 Argus Road Oakville ON MRC 100 74,500 74,500 79 Rockstar Games Toronto ULC, Saviour Drugs Ltd
2794 South Sheridan Way Oakville ON MRC 100 36,500 36,500 0 Vacant
131 Queen Street• 3 Ottawa ON MRC 100 329,500 329,500 100 Her Majesty The Queen
301 Laurier Avenue Ottawa ON MRT 50 26,000 13,000 19 Moores The Suit People
350 Sparks Street Ottawa ON MRC 100 173,500 173,500 71 Chicken Farmers of Canada, Morguard
525 Coventry Ottawa ON MRT 100 42,500 42,500 100 Assent Compliance Inc
CBC Ottawa Broadcast Centre• 3 Ottawa ON MRC 100 251,500 251,500 100 CBC
Green Valley Office Park• 3 Ottawa ON MRT 100 123,000 123,000 84 Canadian Physiotherapy Association
Heritage Place• 3 Ottawa ON MRT 50 216,000 108,000 91 Modis Canada Inc, PCL, The Dominion
Jean Edmonds Towers Ottawa ON MRC 50 554,500 277,000 100 Her Majesty The Queen
Performance Court• 1 • 6 • 9 ** Ottawa ON MRC 50 370,000 185,000 100 CIBC World Markets, KPMG, Shopify Inc
St. Laurent Business Centre• 3 Ottawa ON MRT 100 88,000 88,000 76 Intact Insurance Company, Syglam Inc
Standard Life• 3 Ottawa ON MRT 50 378,000 189,000 98 Public Works
Time Square• 3 Ottawa ON MRT 100 111,000 111,000 85 Her Majesty The Queen, Le Droit, The Red Lion
77 Bloor Street West• 2 • 6 Toronto ON MRT 50 396,000 198,000 96 Harry Rosen, TD Waterhouse, TD Bank
200 Yorkland• 3 Toronto ON MRT 100 150,000 150,000 90 Ferring Inc, Investors Group, Vertex Data LP
945 Wilson Avenue Toronto ON MRC 32 228,000 74,500 100 N/A
Etobicoke Wellness Centre Toronto ON MRC 100 156,000 156,000 100 Etobicoke General Hospital Ancillary Services
Leaside Corporate Centre• 3 Toronto ON MRC 95 94,000 89,500 87 Ontario Motor Vehicle Industry Council, RBC
41 Rue Victoria (LEED pending) Gatineau QC MRC 100 134,500 134,500 100 Brookfield BRP Holdings Canada Inc
Place Innovation• 2 • 3 Saint-Laurent QC MRC / MRT 100 896,000 896,000 97 Bombardier Inc, Lockheed Martin Canada Inc
SUBTOTAL 9,877,000 7,101,500 93
OFFICE CANADA
CERTIFICATIONS
• 1 BOMA Platinum • 2 BOMA Gold • 3 BOMA Silver • 4 BOMA Bronze • 5 BOMA Certified • 6 LEED Gold • 7 LEED Silver • 8 Energy Star • 9 Bullfrog Powered
* Boma Earth ** Boma TOBY
SECTION 1: REAL ESTATE PORTFOLIO
MORGUARD CORPORATION
2018 ANNUAL REPORT18
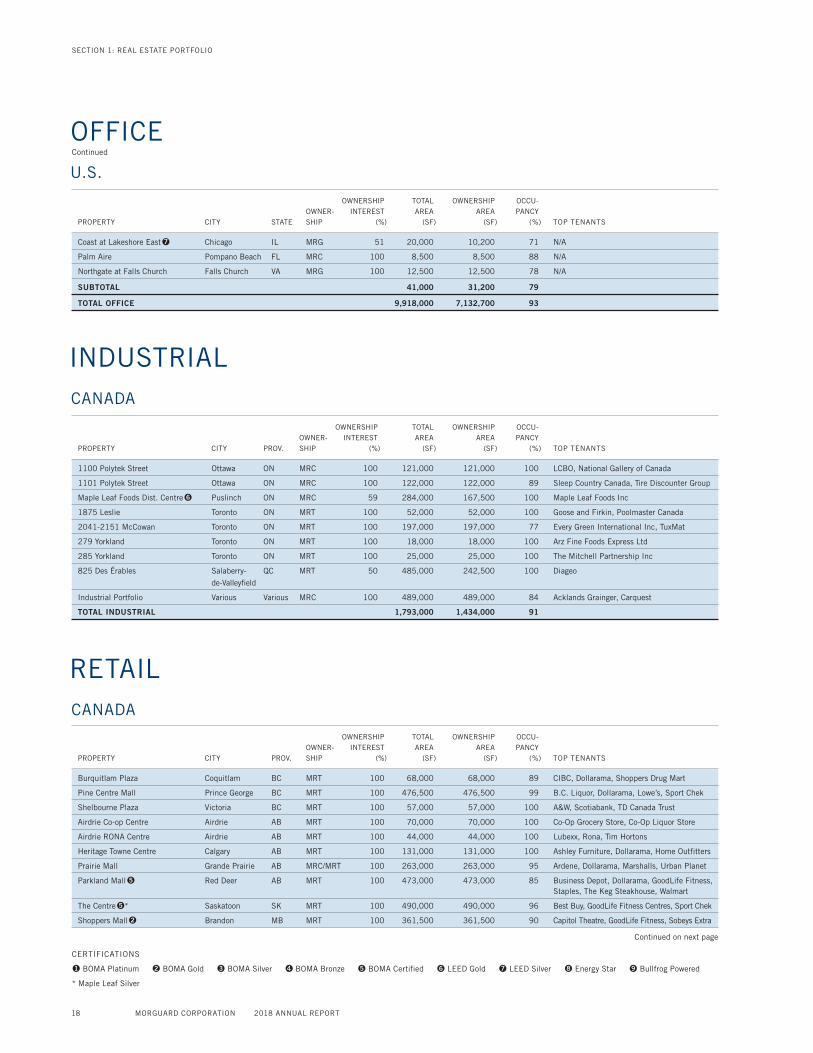
OWNERSHIP TOTAL OWNERSHIP OCCU- OWNER- INTEREST AREA AREA PANCY PROPERTY CITY PROV. SHIP (%) (SF) (SF) (%) TOP TENANTS
Burquitlam Plaza Coquitlam BC MRT 100 68,000 68,000 89 CIBC, Dollarama, Shoppers Drug Mart
Pine Centre Mall Prince George BC MRT 100 476,500 476,500 99 B.C. Liquor, Dollarama, Lowe’s, Sport Chek
Shelbourne Plaza Victoria BC MRT 100 57,000 57,000 100 A&W, Scotiabank, TD Canada Trust
Airdrie Co-op Centre Airdrie AB MRT 100 70,000 70,000 100 Co-Op Grocery Store, Co-Op Liquor Store
Airdrie RONA Centre Airdrie AB MRT 100 44,000 44,000 100 Lubexx, Rona, Tim Hortons
Heritage Towne Centre Calgary AB MRT 100 131,000 131,000 100 Ashley Furniture, Dollarama, Home Outfitters
Prairie Mall Grande Prairie AB MRC/MRT 100 263,000 263,000 95 Ardene, Dollarama, Marshalls, Urban Planet
Parkland Mall• 5 Red Deer AB MRT 100 473,000 473,000 85 Business Depot, Dollarama, GoodLife Fitness, Staples, The Keg Steakhouse, Walmart
The Centre• 5 * Saskatoon SK MRT 100 490,000 490,000 96 Best Buy, GoodLife Fitness Centres, Sport Chek
Shoppers Mall• 2 Brandon MB MRT 100 361,500 361,500 90 Capitol Theatre, GoodLife Fitness, Sobeys Extra
RETAIL CANADA
OWNERSHIP TOTAL OWNERSHIP OCCU- OWNER- INTEREST AREA AREA PANCY PROPERTY CITY PROV. SHIP (%) (SF) (SF) (%) TOP TENANTS
1100 Polytek Street Ottawa ON MRC 100 121,000 121,000 100 LCBO, National Gallery of Canada
1101 Polytek Street Ottawa ON MRC 100 122,000 122,000 89 Sleep Country Canada, Tire Discounter Group
Maple Leaf Foods Dist. Centre• 6 Puslinch ON MRC 59 284,000 167,500 100 Maple Leaf Foods Inc
1875 Leslie Toronto ON MRT 100 52,000 52,000 100 Goose and Firkin, Poolmaster Canada
2041-2151 McCowan Toronto ON MRT 100 197,000 197,000 77 Every Green International Inc, TuxMat
279 Yorkland Toronto ON MRT 100 18,000 18,000 100 Arz Fine Foods Express Ltd
285 Yorkland Toronto ON MRT 100 25,000 25,000 100 The Mitchell Partnership Inc
825 Des Érables Salaberry- QC MRT 50 485,000 242,500 100 Diageo
de-Valleyfield
Industrial Portfolio Various Various MRC 100 489,000 489,000 84 Acklands Grainger, Carquest
TOTAL INDUSTRIAL 1,793,000 1,434,000 91
INDUSTRIAL CANADA
OFFICE Continued
CERTIFICATIONS
• 1 BOMA Platinum • 2 BOMA Gold • 3 BOMA Silver • 4 BOMA Bronze • 5 BOMA Certified • 6 LEED Gold • 7 LEED Silver • 8 Energy Star • 9 Bullfrog Powered
* Maple Leaf Silver
Continued on next page
OWNERSHIP TOTAL OWNERSHIP OCCU- OWNER- INTEREST AREA AREA PANCY PROPERTY CITY STATE SHIP (%) (SF) (SF) (%) TOP TENANTS
Coast at Lakeshore East• 7 Chicago IL MRG 51 20,000 10,200 71 N/A
Palm Aire Pompano Beach FL MRC 100 8,500 8,500 88 N/A
Northgate at Falls Church Falls Church VA MRG 100 12,500 12,500 78 N/A
SUBTOTAL 41,000 31,200 79
TOTAL OFFICE 9,918,000 7,132,700 93
U.S.

SECTION 1: REAL ESTATE PORTFOLIO
MORGUARD CORPORATION
2018 ANNUAL REPORT 19
OWNERSHIP TOTAL OWNERSHIP OCCU- OWNER- INTEREST AREA AREA PANCY PROPERTY CITY PROV. SHIP (%) (SF) (SF) (%) TOP TENANTS
Charleswood Centre Winnipeg MB MRT 100 123,000 123,000 100 Boston Pizza, Dollarama, Liquor Mart, Safeway
Southdale Centre Winnipeg MB MRT 100 175,500 175,500 98 Bank of Montreal, Dollarama, Walmart
Aurora Centre Aurora ON MRT 100 304,000 304,000 100 Canadian Tire, Cineplex Odeon, Sobeys
Bramalea City Centre• 1 Brampton ON MRC 21 1,421,500 294,500 93 Best Buy, H&M, Hollister, Metro, Saks Off Fifth
Cambridge Centre• 2 Cambridge ON MRT 100 578,500 578,500 91 Cambridge Ice Centre, Indigo, Marshalls
Market Square Kanata ON MRT 100 68,000 68,000 95 Bulk Barn, Farm Boy, LCBO, TD Canada Trust
Wonderland Corners London ON MRT 100 46,000 46,000 86 Swiss Chalet, YMCA of Western Ontario
Kingsbury Centre Mississauga ON MRT 100 70,000 70,000 98 Longo’s, Shoppers Drug Mart
Hampton Park Plaza Ottawa ON MRT 100 102,000 102,000 96 East Side Mario’s, Food Basics, Scotiabank
Home Base Ottawa ON MRT 100 10,000 10,000 0 Vacant
St. Laurent• 2 Ottawa ON MRT 100 795,000 795,000 98 Hudson’s Bay, Intact Financial Corp, Sport Chek
100 Cavell Avenue Toronto ON MRC 100 5,500 5,500 84 Frecles Fox Restaurant, Shop N Go
Centerpoint Mall• 3 Toronto ON MRC 100 606,000 606,000 98 Canadian Tire, Hudson’s Bay, Lowe’s, No Frills
Guildwood Village Shopping Centre Toronto ON MRC 100 53,000 53,000 95 BMO, CIBC, Toronto Public Library, Valu-Mart
East York Town Centre• 4 Toronto ON MRC 100 383,500 383,500 78 Dollarama, Food Basics, St. Michael’s Hospital
The Colonnade Toronto ON MRC 100 102,000 102,000 83 Cartier, Christian Dior, Prada, William Ashley
Yonge & McGill Toronto ON MRC 100 7,500 7,500 100 Amato Pizza, Market Place, Toothworks
Woodbridge Square Vaughan ON MRT 50 112,000 56,000 96 Moose & Firkin, Nations Fresh Foods, Scotiabank
SUBTOTAL 7,397,000 6,214,000 94
OWNERSHIP TOTAL OWNERSHIP OCCU- OWNER- INTEREST AREA AREA PANCY PROPERTY CITY STATE SHIP (%) (SF) (SF) (%) TOP TENANTS
Westgate Shopping Center Alexandria LA MRC 100 167,500 167,500 92 Aaron’s, Autozone, Golden Corral, Roses Express
Gonzales Plaza Gonzales LA MRC 100 72,000 72,000 100 Aaron’s, Big Lots, Dollar Tree, Mattress Firm
Southland Mall Houma LA MRC 100 446,500 446,500 72 Encore, H&M, J.C. Penny, Unitech Training
Airline Park Shopping Center Matairie LA MRC 100 53,500 53,500 74 Aaron’s, Dollar Tree, Harbor Freight Tools
North Shore Square Slidell LA MRC 100 428,500 428,500 48 At Home, Foot Locker, J.C. Penny
Alta at K Station Chicago IL MRC 100 13,500 13,500 100 Fulton River Dental, River North MRI
Boynton Town Center Boynton Beach FL MRC 100 209,000 209,000 94 Best Buy, Michaels, Target, Total Wine & More
Weeki Wachee Village Brooksville FL MRC 100 82,500 82,500 98 Liquor Depot, Snap Fitness, Winn Dixie
Rainbow Square Dunnellon FL MRC 100 124,000 124,000 91 Dollar Tree, Publix, Sherwin Williams
Florida Shores Plaza Edgewater FL MRC 100 79,500 79,500 100 Big B Liquors, Labcorp, Winn Dixie
Lantana Plaza Lake Worth FL MRC 100 245,500 245,500 99 Dollar Tree, Home Depot, Office Depot, Publix
Town & Country Shopping Center Palatka FL MRC 100 196,500 196,500 64 CVS Pharmacy, Dollar Tree, Publix
Westward Shopping Center West Palm Beach FL MRC 100 233,000 233,000 100 Harbor Freight Tools, Office Depot
Northgate at Falls Church Falls Church VA MRG 100 20,500 20,500 90 Café Kindred, Miata C. Jones DDS, Title Boxing
SUBTOTAL 2,372,000 2,372,000 80
TOTAL RETAIL 9,769,000 8,586,000 90
RETAIL CANADA
U.S.
CERTIFICATIONS
• 1 BOMA Platinum • 2 BOMA Gold • 3 BOMA Silver • 4 BOMA Bronze • 5 BOMA Certified • 6 LEED Gold • 7 LEED Silver • 8 Energy Star • 9 Bullfrog Powered
Continued

SECTION 1: REAL ESTATE PORTFOLIO
MORGUARD CORPORATION
2018 ANNUAL REPORT20
OWNERSHIP INTEREST TOTAL OWNERSHIP PROPERTY CITY PROV. OWNERSHIP (%) ROOMS ROOMS
Inn at the Quay• 1 New Westminster BC TPH 100 126 126
Acclaim Hotel Calgary Airport• 1 Calgary AB TPH 100 225 225
Hilton Garden Inn• 1 Edmonton AB TPH 100 160 160
Clearwater Residence Hotel – Timberlea• 1 Fort McMurray AB TPH 100 66 66
Clearwater Suite Hotel• 1 Fort McMurray AB TPH 100 150 150
Cortona Residence Fort McMurray AB TPH 100 57 57
Franklin Suite Hotel• 1 Fort McMurray AB TPH 100 75 75
Merit Hotel & Suites• 1 Fort McMurray AB TPH 100 160 160
Nomad Hotel & Suites• 1 Fort McMurray AB TPH 100 164 164
Radisson Hotel & Suites Fort McMurray• 1 Fort McMurray AB TPH 100 134 134
Vantage Inn and Suites• 1 Fort McMurray AB TPH 100 83 83
Days Hotel and Suites• 1 Lloydminster AB TPH 100 128 128
Cambridge Red Deer• 1 Red Deer AB TPH 100 241 241
Temple Gardens Mineral Spa Resort Hotel• 1 Moose Jaw SK TPH 100 181 181
Wingate by Wyndham Regina• 1 Regina SK TPH 100 118 118
Saskatoon Inn & Conference Centre• 1 Saskatoon SK TPH 100 257 257
Holiday Inn Winnipeg South• 1 Winnipeg MB TPH 100 170 170
Residence Inn• 1 London ON TPH 50 116 58
Courtyard Marriott Markham Markham ON MRC 100 144 144
Residence Inn Marriott Markham ON MRC 100 100 100
Courtyard Marriott Mississauga Mississauga ON MRC 100 144 144
Hilton Garden Inn Toronto Airport West• 1 Mississauga ON TPH 100 152 152
Residence Inn Marriott Mississauga ON MRC 100 100 100
Courtyard Marriott• 1 Ottawa ON TPH 50 183 91.5
Hilton Garden Inn and Homewood Suites Ottawa ON MRC 100 346 346
Holiday Inn Express• 1 Ottawa ON TPH 100 115 115
Towne Place Suites by Marriott• 1 Sudbury ON TPH 100 105 105
Days Inn & Suites• 1 Thunder Bay ON TPH 100 92 92
Days Inn North• 1 Thunder Bay ON TPH 100 92 92
Courtyard by Marriott Toronto Airport• 1 Toronto ON MRC 100 168 168
Hotel Carlingview Toronto Airport• 1 Toronto ON MRC 100 112 112
Residence Inn by Marriott Toronto Airport• 1 Toronto ON MRC 100 137 137
Toronto Airport Marriott Toronto ON MRC 95 424 403
Courtyard Marriott Vaughan Vaughan ON MRC 100 144 144
Cambridge Suites Hotel Halifax• 1 Halifax NS TPH 100 200 200
The Prince George Hotel• 1 Halifax NS TPH 100 203 203
Cambridge Suites Hotel Sydney• 1 Sydney NS TPH 100 145 145
Days Inn and Suites• 1 Yellowknife NT TPH 100 80 80
Stanton Suites Hotel• 1 Yellowknife NT TPH 100 106 106
TOTAL HOTEL 5,903 5,733
HOTEL
CANADA
CERTIFICATIONS
• 1 Green Key

SECTION 1: REAL ESTATE PORTFOLIO
MORGUARD CORPORATION
2018 ANNUAL REPORT 21
TORONTO AIRPORT MARRIOTTTORONTO, ON

venture and valued strategic
partners to identify
opportunities with the greatest
potential. This thorough,
thoughtful approach means
that Morguard is always poised
to take action, garnering the
positive results that follow –
and in 2018, we exceeded our
revenue and overall earnings.
The Morguard real estate team
works in collaboration, focused
on enhancing and expanding
the Morguard portfolio and
providing greater returns for our
shareholders. Ever perceptive,
always alert, we constantly
study North American real
estate markets, particularly
within major economic hubs,
and work with select joint
SECTION 2 MORGUARD CORPORATION FINANCIAL HIGHLIGHTS
EXCEEDING OUR
PROJECTIONS
IN 2018

MORGUARD CORPORATION
2018 ANNUAL REPORT 23
SECTION 2 MORGUARD CORPORATION FINANCIAL HIGHLIGHTS
REVENUE AND
OVERALL EARNINGS
In 2018, Morguard Corporation’s
revenue and overall earnings,
exceeded management’s
projections – the result of
increases in net operating
income (NOI) and funds from
operations (FFO) coming from
our acquisitions, completed
developments and asset
management initiatives.
Total revenue increased by
$44.1 million to $1.16 billion
for 2018. NOI increased by
$34.1 million (or 6.6%), to
$548.0 million for 2018.
FFO increased by $7.3 million
to $232.4 million for 2018,
representing a 3.3% increase,
and FFO per share increased
by $1.38 per share to $20.32
per share, for 2018 compared
to $18.94 per share, for 2017,
representing a 7.3% increase.
Fair value gain on real estate
properties was $239.0 million
for 2018, compared to
$189.1 million for 2017,
an increase of $49.9 million.
CAPITAL MANAGEMENT
Prudent capital management
remains a core principle of
Morguard, and in 2018 the
Company maintained a strong,
long-term store of value, with
good cash flow and continued
access to capital. A strong
balance sheet starts with
having the right proportion of
debt to equity, with a view to
reducing interest costs through
alternative financing. During
2018, Morguard refinanced
$292.0 million of first-mortgage
debt at a weighted average
interest rate of 4.22%, resulting
in additional mortgage
proceeds of $134.0 million.
Morguard continues to be
institutionally rated (DBRS:
BBB (low) with a stable trend)
and used this rating during
2018 to issue $200 million,
three-year unsecured
debentures at an interest
rate of 4.085% and
subsequent to December 31,
2018, Morguard issued $225
million, five-year unsecured
debentures at an interest rate
of 4.715%.
RESULTS FOR
SHAREHOLDERS
Over the past 10 years, the
compound annual growth rate
of Morguard’s stock has been
26%. In 2018, we continued
our annual dividend of
$0.60 per share, paying
$6.8 million to Shareholders.
PRUDENT CAPITAL MANAGEMENT
REMAINS A CORE PRINCIPLE OF MORGUARD
CORPORATION, WITH GOOD CASH FLOW
AND CONTINUED ACCESS TO CAPITAL

SECTION 2: MORGUARD CORPORATION FINANCIAL HIGHLIGHTS
MORGUARD CORPORATION
2018 ANNUAL REPORT24
FINANCIAL HIGHLIGHTS
• 3 • 2
• 4
• 6
• 5
• 1
AS AT DECEMBER 31 2014 2015 2016 2017 2018
Total assets $7,993,684 $8,602,132 $9,588,078 $10,111,986 $11,082,758
Indebtedness $3,808,296 $4,183,810 $4,778,750 $4,935,454 $5,498,668
Indebtedness to total assets 47.6% 48.6% 49.8% 48.8% 49.6%
Shareholders’ equity $2,498,605 $2,697,724 $2,862,812 $3,082,673 $3,431,366
Number of common shares (in thousands) 12,353 11,993 11,929 11,842 11,294
TSX price $150.00 $133.00 $175.90 $179.48 $176.01
Shareholders’ equity, per common share $202.27 $224.94 $239.98 $260.32 $303.84
Equity market capitalization $1,852,950 $1,595,069 $2,098,311 $2,125,402 $1,987,857
FOR THE YEARS ENDED DECEMBER 31 2014 2015 2016 2017 2018
Revenue from real estate properties $426,667 $762,033 $775,746 $790,535 $841,497
Revenue from hotel properties $46,141 $46,562 $66,567 $237,116 $237,938
Total revenue $566,326 $883,559 $921,976 $1,113,774 $1,157,878
Net operating income $241,193 $435,899 $453,398 $513,867 $547,975
Net income $137,257 $103,520 $209,924 $344,367 $344,058
Funds from operations – basic $152,053 $183,139 $213,282 $225,072 $232,396
Funds from operations per share – basic $12.14 $14.96 $17.86 $18.94 $20.32
IN THOUSANDS OF CANADIAN DOLLARS, EXCEPT PER COMMON SHARE AMOUNTS

SECTION 2: MORGUARD CORPORATION FINANCIAL HIGHLIGHTS
MORGUARD CORPORATION
2018 ANNUAL REPORT 25
15
15
15
15
14
14
14
14
16
16
16
16
17
17
17
17
18
18
18
18
$24
1
$152
$5
66
$2
02
$4
36
$18
3
$8
84
$2
25
$4
53
$21
3
$9
22
$24
0
$51
4
$2
25
$1,1
14$
26
0
$5
48
$2
32
$1,1
58
$304
1514 16 17 18
$15
0
$13
3
$176
$179
$176
• 3 NET OPERATING INCOMEIN MILLIONS OF DOLLARS
• 6 TSX PRICEPER COMMON SHARE
• 1 TOTAL ASSETSIN BILLIONS OF DOLLARS
• 2 TOTAL REVENUEIN MILLIONS OF DOLLARS
• 4 FUNDS FROM OPERATIONS – BASIC IN MILLIONS OF DOLLARS
• 5 SHAREHOLDERS’ EQUITY PER COMMON SHARE
1514 16 17 18
$8
.0
$8
.6
$9.
6
$10.1
$11.
1

SECTION 2: MORGUARD CORPORATION FINANCIAL HIGHLIGHTS
MORGUARD CORPORATION
2018 ANNUAL REPORT26
DIVERSE HOLDINGS Morguard Corporation has investments in a diverse group of companies, enabling the Corporation
to realize revenue from distributions as well as the management services we provide.
$21.0 BILLION ASSETS UNDER MANAGEMENT
$4.3B MORGUARD CORPORATION
$0.4B TEMPLE HOTELS
$5.4B MANAGED REAL ESTATE
$5.1B MANAGED EQUITIES AND FIXED INCOME
$3.0B MORGUARD REIT
$2.8B MORGUARD NORTH AMERICAN RESIDENTIAL REIT

SECTION 2: MORGUARD CORPORATION FINANCIAL HIGHLIGHTS
MORGUARD CORPORATION
2018 ANNUAL REPORT 27
• 1 MORGUARD REIT
Morguard has a 57.6% interest in Morguard Real Estate Investment Trust (MRT). MRT is diversified with holdings in six Canadian provinces comprising retail, office, and industrial properties with a total of 8.6 million square feet of GLA.
• 2 MORGUARD NORTH AMERICAN RESIDENTIAL REIT
Morguard owns 46.9% of Morguard North American Residential Real Estate Investment Trust (MRG), and has exclusive service agreements with the Trust that include property management, asset management, debt financing and acquisitions.
• 3 TEMPLE HOTELS INC.
Morguard has a 58.7% ownership interest in Temple Hotels Inc. (Temple). A relatively small investment for Morguard, the ownership in Temple has enabled us to expand our array of management expertise, and gain deeper insight into the communities in which Temple’s hotels are located.
• 4 MANAGEMENT SERVICES
Morguard provides real estate investment and management services to major institutional clients, private investors and our public investments. In 2018, Morguard earned fees of $62.1 million from its third-party advisory services offered by Morguard and through our subsidiary, Lincluden Investment Management Limited.
$152 MILLION NET OPERATING INCOME
$132 MILLION NET OPERATING INCOME
$40 MILLION NET OPERATING INCOME
$62.1 MILLION EARNED FROM ADVISORY
49 COMMERCIAL PROPERTIES
13,430 RESIDENTIAL SUITES
4,084 HOTEL ROOMS
$10.5 BILLION THIRD-PARTY ASSETS UNDER MANAGEMENT

SECTION 2: MORGUARD CORPORATION FINANCIAL HIGHLIGHTS
MORGUARD CORPORATION
2018 ANNUAL REPORT28
AS AT DECEMBER 31 2018 2017
ASSETS
Non-current assets
Real estate properties $9,645,596 $8,655,651
Hotel properties 666,078 669,026
Equity-accounted and other fund investments 281,464 280,853
Other assets 285,103 246,440
10,878,241 9,851,970
Current assets
Mortgages and loans receivable 1,686 27,257
Amounts receivable 76,879 77,227
Prepaid expenses and other 15,551 21,082
Cash 110,401 134,450
204,517 260,016
$11,082,758 $10,111,986
LIABILITIES AND EQUITY
Non-current liabilities
Mortgages payable $3,573,185 $3,440,069
Unsecured debentures 597,697 398,152
Convertible debentures 225,936 147,701
Morguard Residential REIT Units 417,481 365,438
Deferred income tax liabilities 717,943 646,884
5,532,242 4,998,244
Current liabilities
Mortgages payable 789,516 615,959
Unsecured debentures — 134,755
Convertible debentures 2,063 88,674
Construction financing payable — 36,476
Loans payable 60,309 —
Accounts payable and accrued liabilities 244,670 253,859
Bank indebtedness 225,160 49,650
1,321,718 1,179,373
Total liabilities 6,853,960 6,177,617
EQUITY
Shareholders’ equity 3,431,366 3,082,673
Non-controlling interest 797,432 851,696
Total equity 4,228,798 3,934,369
$11,082,758 $10,111,986
BALANCE SHEETS
IN THOUSANDS OF CANADIAN DOLLARS
2018 FINANCIALS

SECTION 2: MORGUARD CORPORATION FINANCIAL HIGHLIGHTS
MORGUARD CORPORATION
2018 ANNUAL REPORT 29
FOR THE YEARS ENDED DECEMBER 31 2018 2017
Revenue from real estate properties $841,497 $790,535
Revenue from hotel properties 237,938 237,116
Land rent arbitration settlement 17,250 —
Property operating expenses
Property operating costs (184,986) (174,440)
Utilities (57,160) (52,986)
Realty taxes (126,076) (110,644)
Hotel operating expenses (180,488) (175,714)
Net operating income 547,975 513,867
OTHER REVENUE
Management and advisory fees 62,096 71,786
Interest and other income 10,947 8,907
Sales of product and land 5,400 5,430
78,443 86,123
EXPENSES
Interest 210,464 191,965
Property management and corporate 92,665 82,862
Cost of sales of product and land 3,698 3,524
Amortization of hotel properties 25,342 26,640
Amortization of capital assets and other 6,518 4,228
Provision for impairment 29,668 24,590
368,355 333,809
OTHER INCOME (EXPENSE)
Fair value gain, net 167,235 139,898
Equity loss from investments (22,654) (10,227)
Other income 13,424 3,885
158,005 133,556
Income before income taxes 416,068 399,737
Provision for income taxes
Current 15,216 21,187
Deferred 56,794 34,183
72,010 55,370
Net income for the year $344,058 $344,367
Net income attributable to:
Common shareholders $319,851 $310,120
Non-controlling interest 24,207 34,247
$344,058 $344,367
Net income per common share attributable to:
Common shareholders – basic and diluted $27.96 $26.10
STATEMENTS OF INCOME
IN THOUSANDS OF CANADIAN DOLLARS, EXCEPT PER COMMON SHARE AMOUNTS
2018 FINANCIALS

SECTION 2: MORGUARD CORPORATION FINANCIAL HIGHLIGHTS
MORGUARD CORPORATION
2018 ANNUAL REPORT30
IN THOUSANDS OF CANADIAN DOLLARS
STATEMENTS OF COMPREHENSIVE INCOME
FOR THE YEARS ENDED DECEMBER 31 2018 2017
Net income for the year $344,058 $344,367
OTHER COMPREHENSIVE INCOME (LOSS)
Items that may be reclassified subsequently to net income:
Unrealized gain on investments in real estate funds — 194
Unrealized foreign currency translation gain (loss) 112,621 (81,432)
Gain on interest rate swap agreement 161 665
112,782 (80,573)
Deferred income tax recovery 467 2,429
113,249 (78,144)
Items that will not be reclassified subsequently to net income:
Actuarial loss on defined benefit pension plans (6,721) (2,174)
Deferred income tax recovery 1,796 283
(4,925) (1,891)
Other comprehensive income (loss) 108,324 (80,035)
Total comprehensive income for the year $452,382 $264,332
Total comprehensive income attributable to:
Common shareholders $420,538 $232,383
Non-controlling interest 31,844 31,949
$452,382 $264,332
SECTION 2: MORGUARD CORPORATION FINANCIAL HIGHLIGHTS
MORGUARD CORPORATION
2018 ANNUAL REPORT 31
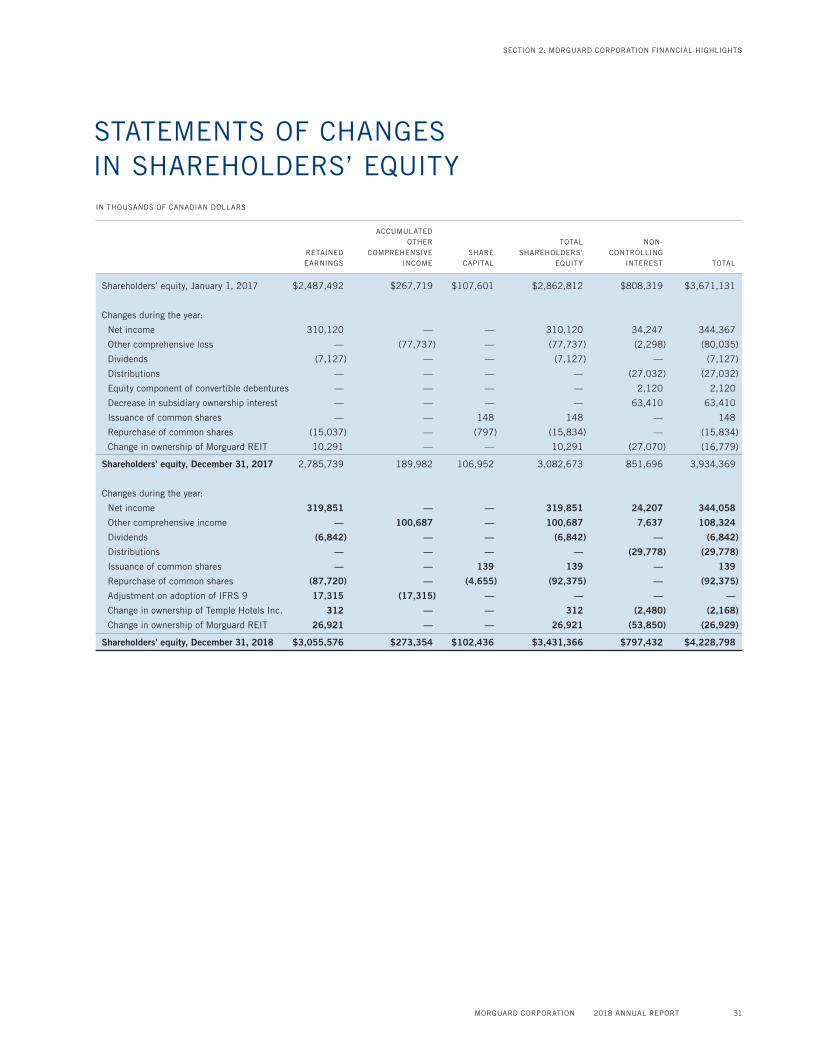
IN THOUSANDS OF CANADIAN DOLLARS
STATEMENTS OF CHANGES IN SHAREHOLDERS’ EQUITY
ACCUMULATED OTHER TOTAL NON- RETAINED COMPREHENSIVE SHARE SHAREHOLDERS’ CONTROLLING EARNINGS INCOME CAPITAL EQUITY INTEREST TOTAL
Shareholders’ equity, January 1, 2017 $2,487,492 $267,719 $107,601 $2,862,812 $808,319 $3,671,131
Changes during the year:
Net income 310,120 — — 310,120 34,247 344,367
Other comprehensive loss — (77,737) — (77,737) (2,298) (80,035)
Dividends (7,127) — — (7,127) — (7,127)
Distributions — — — — (27,032) (27,032)
Equity component of convertible debentures — — — — 2,120 2,120
Decrease in subsidiary ownership interest — — — — 63,410 63,410
Issuance of common shares — — 148 148 — 148
Repurchase of common shares (15,037) — (797) (15,834) — (15,834)
Change in ownership of Morguard REIT 10,291 — — 10,291 (27,070) (16,779)
Shareholders’ equity, December 31, 2017 2,785,739 189,982 106,952 3,082,673 851,696 3,934,369
Changes during the year:
Net income 319,851 — — 319,851 24,207 344,058
Other comprehensive income — 100,687 — 100,687 7,637 108,324
Dividends (6,842) — — (6,842) — (6,842)
Distributions — — — — (29,778) (29,778)
Issuance of common shares — — 139 139 — 139
Repurchase of common shares (87,720) — (4,655) (92,375) — (92,375)
Adjustment on adoption of IFRS 9 17,315 (17,315) — — — —
Change in ownership of Temple Hotels Inc. 312 — — 312 (2,480) (2,168)
Change in ownership of Morguard REIT 26,921 — — 26,921 (53,850) (26,929)
Shareholders’ equity, December 31, 2018 $3,055,576 $273,354 $102,436 $3,431,366 $797,432 $4,228,798

SECTION 2: MORGUARD CORPORATION FINANCIAL HIGHLIGHTS
MORGUARD CORPORATION
2018 ANNUAL REPORT32
Des
ign:
ww
w.j
umpco
mm
unic
atio
nsin
c.co
m
IN THOUSANDS OF CANADIAN DOLLARS
STATEMENTS OF CASH FLOWS
FOR THE YEARS ENDED DECEMBER 31 2018 2017
OPERATING ACTIVITIES
Net income for the year $344,058 $344,367
Add (deduct) items not affecting cash (46,610) (56,321)
Distributions from equity-accounted investments 4,472 79,961
Land held for residential development and sale (13) (310)
Additions to development property – inventory (3,930) (36,073)
Additions to tenant incentives and leasing commissions (8,170) (6,886)
Net change in operating assets and liabilities 1,597 (9,210)
Cash provided by operating activities 291,404 315,528
INVESTING ACTIVITIES
Additions to real estate properties and tenant improvements (425,643) (713,279)
Additions to hotel properties (17,029) (16,786)
Additions to capital and intangible assets (5,923) (18,107)
Proceeds from sale of real estate properties 7,214 88,685
Proceeds from the sale of hotel properties — 9,399
Investment in properties under development (94,498) (66,701)
Investment in equity-accounted and other fund investments, net (7,786) (10,400)
Investment in marketable securities (41,510) —
Increase in mortgages and loans receivable (82,783) (41,070)
Decrease in mortgages and loans receivable 108,244 78,406
Cash used in investing activities (559,714) (689,853)
FINANCING ACTIVITIES
Proceeds from new mortgages 477,769 711,961
Financing costs on new mortgages (2,797) (6,342)
Repayment of mortgages
Repayments on maturity (196,704) (388,307)
Principal instalment repayments (109,578) (112,212)
Proceeds from bank indebtedness 705,255 464,765
Repayment of bank indebtedness (529,745) (419,757)
Proceeds from issuance of Morguard Residential REIT Units, net of cost — 40,998
Proceeds from issuance of unsecured debentures, net of costs 198,805 198,800
Redemption of unsecured debentures (135,000) —
Proceeds from issuance of convertible debentures, net of costs 77,125 —
Redemption of convertible debentures (90,998) (157,218)
Proceeds from construction financing 1,481 36,476
Repayment of construction financing (37,957) (93,000)
Proceeds from (repayment of) loans payable, net 55,772 —
Dividends paid (6,703) (6,979)
Contribution from non-controlling interest — 63,410
Distributions to non-controlling interest (29,242) (26,742)
Common shares repurchased for cancellation (92,375) (15,834)
Investment in Morguard REIT (26,929) (26,797)
Investment in Temple Hotels Inc. (2,168) —
Decrease (increase) in restricted cash (7,733) 778
Cash provided by financing activities 248,278 264,000
Net decrease in cash during the year (20,032) (110,325)
Net effect of foreign currency translation on cash balance (4,017) 3,253
Cash, beginning of year 134,450 241,522
Cash, end of year $110,401 $134,450

CORPORATE INFORMATION
Registered Office55 City Centre Drive Suite 1000Mississauga, ON L5B 1M3T [email protected]
Transfer Agent Computershare Trust Company of Canada1-800-564-6253 www.computershare.com
Auditors Ernst & Young LLP
Principal Bankers Royal Bank of Canada Toronto-Dominion Bank
Share Listing Toronto Stock Exchange
Symbol MRC
Investor Relations Visit our website at www.morguard.com or view our filings on SEDAR at www.sedar.com.
Annual Shareholder Meeting Wednesday May 8, 2019 at 10:30 a.m. Rattlesnake Point Golf Club 5407 Regional Road 25 Milton, ON L9T 2X5
For additional information, please contact:
Paul Miatello Senior Vice President, Chief Financial Officer
Beverley G. Flynn Senior Vice President, General Counsel and Secretary
T 905-281-3800 [email protected]
Chris J. Cahill 3 Chief Executive Officer Deputy, Accor Hotels
David A. King 2, 4 Vice Chairman Corporate Director
Timothy J. Murphy 2, 3 Partner, McMillan LLP
Michael S. Robb1, 3 Corporate Director
Bruce K. Robertson 1, 2, 4 Vice President, Investments The Woodbridge Company Limited
K. Rai Sahi 4 Chairman and Chief Executive Officer
L. Peter Sharpe 1, 3, 4 Corporate Director
Angela Sahi Senior Vice President, Corporate Development
1 Audit Committee
2 Human Resources, Compensation and Pension Committee
3 Corporate Governance and Nominating Committee
4 Investment Committee
BOARD OF DIRECTORS INVESTOR INFORMATION
John Talano Senior Vice President, Operations (U.S.) Morguard North American Residential REIT
Robert McFarlane Vice President, Internal Audit
Brian Athey Vice President, Development
Patrick Seward Vice President, Planning and Corporate Development
Robert Wright Vice President
EXECUTIVE DIRECTORY
K. Rai Sahi Chairman and Chief Executive Officer
Paul Miatello Senior Vice President, Chief Financial Officer
Beverley G. Flynn Senior Vice President, General Counsel and Secretary
Angela Sahi Senior Vice President, Corporate Development
Christopher A. Newman Chief Financial Officer Morguard North American Residential REIT
Andrew Tamlin Chief Financial Officer Morguard REIT
Gordon Vollmer Executive Vice President, Office and Industrial Morguard Investments Limited
W. Scott MacDonald Executive Vice President, Retail Morguard Investments Limited
Margaret Knowles Senior Vice President, Development Morguard Investments Limited
Pamela McLean Senior Vice President, Finance, and Chief Financial Officer, Services Morguard Investments Limited
Sanjay Rateja Vice President, Operations Temple Hotels Inc.

MORGUARD CORPORATION
55 City Centre Drive
Suite 1000
Mississauga, ON
L5B 1M3
905-281-3800
MORGUARD.COM
Related Documents