Prepared for: Auckland Council April 2014 Takapuna Business Improvement District Quarterly Market Activity Report for the 3 month period ending 31 March 2014

Welcome message from author
This document is posted to help you gain knowledge. Please leave a comment to let me know what you think about it! Share it to your friends and learn new things together.
Transcript

Prepared for: Auckland Council
April 2014
Takapuna
Business Improvement District
Quarterly Market Activity Reportfor the 3 month period ending 31 March 2014

Takapuna Quarterly Market Activity Report Contents1 Jan 2014 to 31 Mar 2014
1. Quarterly Performance Summary Page 4
2. Monthly breakdown of spending in the Takapuna marketplace Page 6
3. How activity in Takapuna compared to your peer group last year Page 7
4. Average Transaction Value at Takapuna compared to your peer group last year Page 8
5. Which parts of New Zealand are Takapuna customers coming from? Page 9
6. Which suburbs are Takapuna's local customers coming from? Page 10
7. Which countries are Takapuna international visitors coming from? Page 11
Appendix
Information on the competitors, local area and dates you selected for this report Page 12
The small print
Disclaimer
While every effort has been made in the production of this report, Paymark, the Bank of New Zealand and Marketview Limited are not responsible for the results of any actions taken on the basis of the information in this report and expressly disclaim any liability to any person for anything done or
omitted to be done by any such person in reliance on the contents of this report and any losses suffered by any person whether direct or indirect, including loss of profits.
Privacy
No personal or household data is shown or can be derived, thereby maintaining the privacy of end customers.
Copyright
This report is protected by the copyright and trademark laws. No part of this report can be reproduced or copied in any form or by any means without the permission of Marketview Limited. Any reproduction is a breach of intellectual property rights and could subject you to civil and criminal penalties.
Page 2 of 14
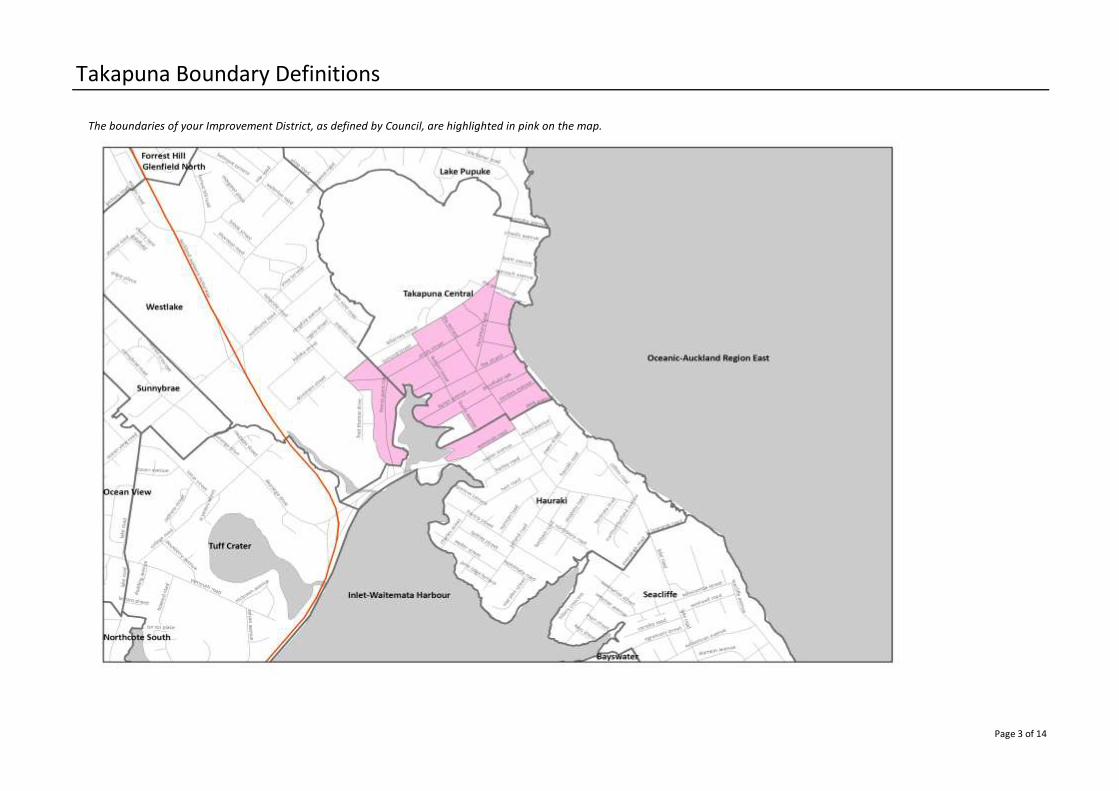
Takapuna Boundary Definitions
The boundaries of your Improvement District, as defined by Council, are highlighted in pink on the map.
Page 3 of 14

1. Quarterly Performance Summary1 Jan 2014 to 31 Mar 2014
Takapuna This Year Last Year This Year Last Year Change
Customers from New Zealand $44.77 mn $42.23 mn +6.0% 0.93 mn 0.89 mn +3.8%
International Visitors $2.57 mn $2.29 mn +12.4% 0.02 mn 0.02 mn +18.5%
TOTAL $47.34 mn $44.52 mn +6.3% 0.95 mn 0.91 mn +4.1%
% from New Zealand 94.6% 94.9% -0.3% 97.7% 98.0% -0.3%
Average Transaction Value $50.00 $48.95 +2.1% $0.136 bn
Key Competitors This Year Last Year % Change This Year Last Year
CBD $415.24 mn $386.49 mn +7.4% 8.35 mn 7.44 mn +12.2%
Newmarket $132.34 mn $128.49 mn +3.0% 1.95 mn 1.89 mn +3.1%
Ponsonby $48.38 mn $44.51 mn +8.7% 1.02 mn 0.92 mn +10.8%
All of Auckland Region $3.372 bn $3.159 bn +6.8% 67.39 mn 62.35 mn +8.1%
YOUR RANKING Spending Transactions Spending Transactions
Last Year Quartile 2 Quartile 2 Quartile 1 Quartile 1
This Year Quartile 2 Quartile 2 Quartile 1 Quartile 1
Key About this Page
Takapuna BID = retailers listed based within the Business Improvement District boundaries.
Key Competitors = The Business Improvement Districts you selected to compare your performance against
All of Auckland Region = The value of spending and transactions at retailers based in Auckland Region
This page gives an overview of spending and transaction volumes
made for the three months ending 31 March 2014 compared to
the same period last year. The top section refers to spending in
your marketplace, and at your selected competitors. The bottom
one measures overall retail spending in Auckland and is based on
spending in the last 12 months.
Your Ranking = All BIDs in the Auckland City Council have been ranked based on the change in spending/
transactions and also the total value of spending/ transactions and put into one of four quartile groups. The
quartile ranking listed above shows which quartile your BID is in this year and how that relates to last year.
Quartile One is the top 25% of BIDs and Quartile Four is the lowest 25% of BIDs.
Amount Spent Number of Transactions
Change
CHANGE TOTAL VALUE
Page 4 of 14
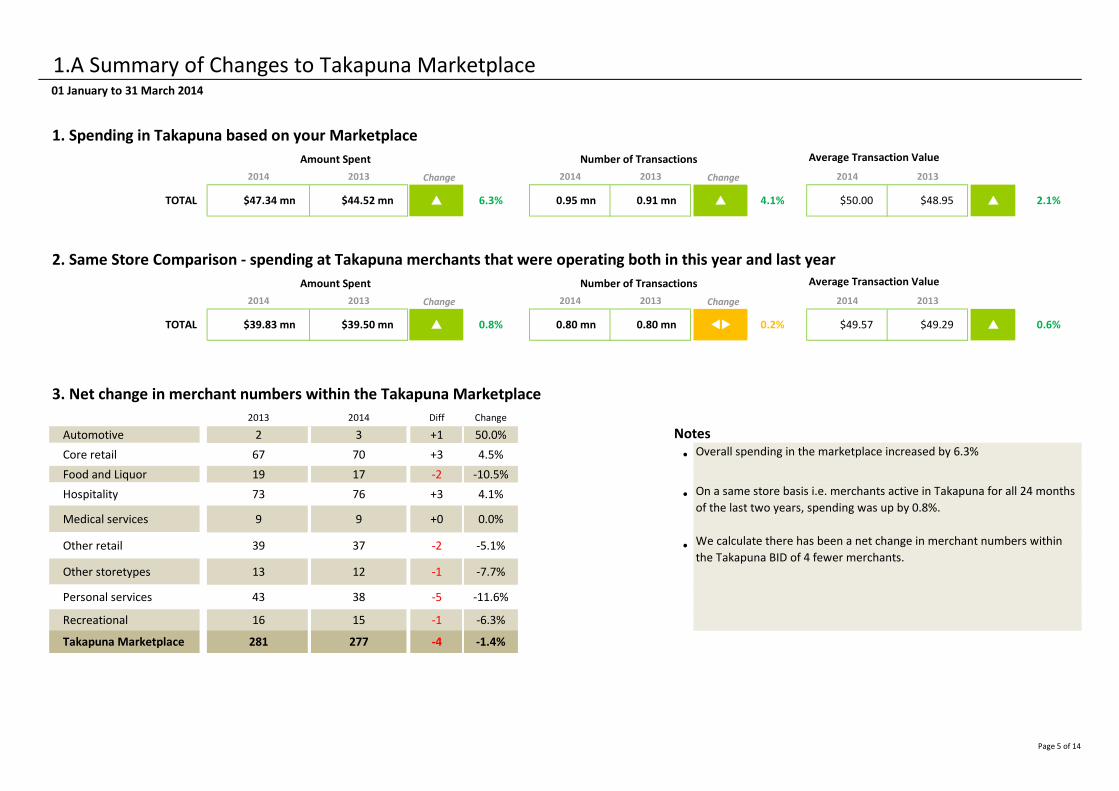
1.A Summary of Changes to Takapuna Marketplace01 January to 31 March 2014
1. Spending in Takapuna based on your MarketplaceAverage Transaction Value
2014 2013 2014 2013 Change 2014 2013
TOTAL $47.34 mn $44.52 mn p 6.3% 0.95 mn 0.91 mn p 4.1% $50.00 $48.95 p 2.1%
2. Same Store Comparison - spending at Takapuna merchants that were operating both in this year and last yearAverage Transaction Value
2014 2013 2014 2013 Change 2014 2013
TOTAL $39.83 mn $39.50 mn p 0.8% 0.80 mn 0.80 mn tu 0.2% $49.57 $49.29 p 0.6%
3. Net change in merchant numbers within the Takapuna Marketplace
2013 2014 Diff Change
Automotive 2 3 +1 50.0% Notes
Core retail 67 70 +3 4.5% •
Food and Liquor 19 17 -2 -10.5%
Hospitality 73 76 +3 4.1% •
Medical services 9 9 +0 0.0%
Other retail 39 37 -2 -5.1% •
Other storetypes 13 12 -1 -7.7%
Personal services 43 38 -5 -11.6%
Recreational 16 15 -1 -6.3%
Takapuna Marketplace 281 277 -4 -1.4%
Overall spending in the marketplace increased by 6.3%
On a same store basis i.e. merchants active in Takapuna for all 24 months
of the last two years, spending was up by 0.8%.
We calculate there has been a net change in merchant numbers within
the Takapuna BID of 4 fewer merchants.
Amount Spent Number of Transactions
Change
Amount Spent Number of Transactions
Change
Page 5 of 14
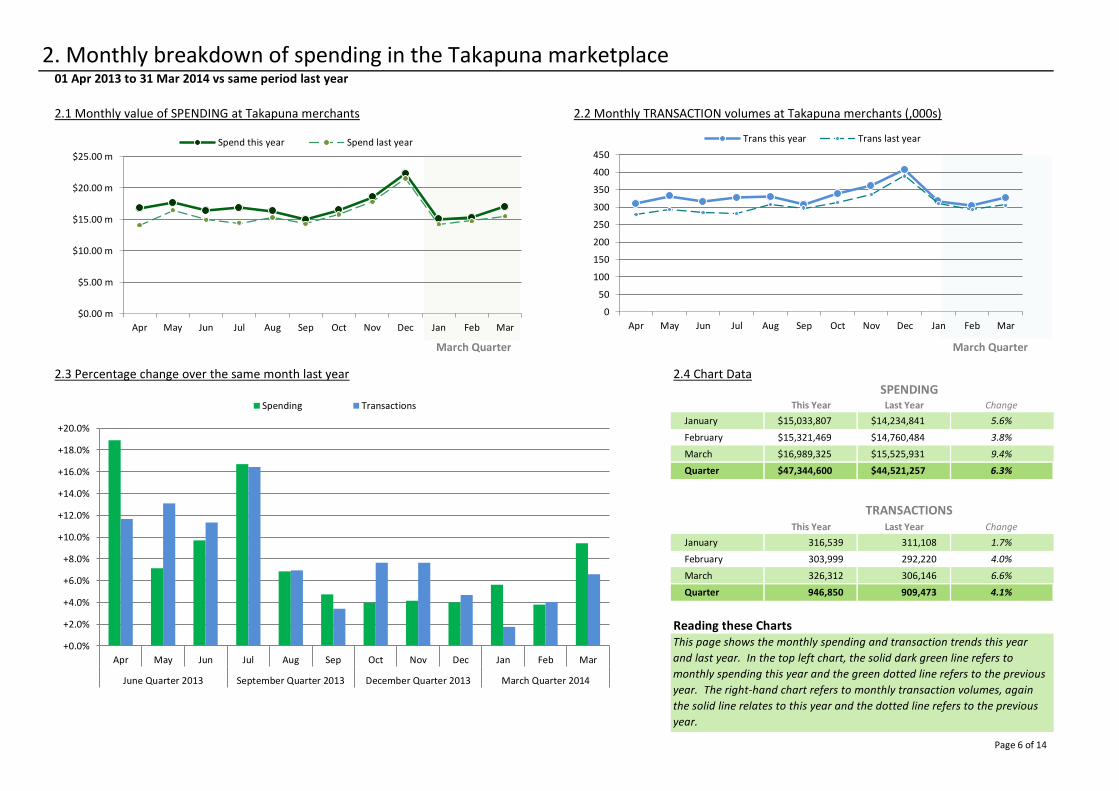
2. Monthly breakdown of spending in the Takapuna marketplace01 Apr 2013 to 31 Mar 2014 vs same period last year
March Quarter
2.3 Percentage change over the same month last year 2.4 Chart Data
This Year Last Year Change
January $15,033,807 $14,234,841 5.6%
February $15,321,469 $14,760,484 3.8%
March $16,989,325 $15,525,931 9.4%
Quarter $47,344,600 $44,521,257 6.3%
This Year Last Year Change
January 316,539 311,108 1.7%
February 303,999 292,220 4.0%
March 326,312 306,146 6.6%
Quarter 946,850 909,473 4.1%
Reading these ChartsThis page shows the monthly spending and transaction trends this year
and last year. In the top left chart, the solid dark green line refers to
monthly spending this year and the green dotted line refers to the previous
year. The right-hand chart refers to monthly transaction volumes, again
the solid line relates to this year and the dotted line refers to the previous
year.
2.1 Monthly value of SPENDING at Takapuna merchants 2.2 Monthly TRANSACTION volumes at Takapuna merchants (,000s)
SPENDING
TRANSACTIONS
March Quarter
+0.0%
+2.0%
+4.0%
+6.0%
+8.0%
+10.0%
+12.0%
+14.0%
+16.0%
+18.0%
+20.0%
Apr May Jun Jul Aug Sep Oct Nov Dec Jan Feb Mar
June Quarter 2013 September Quarter 2013 December Quarter 2013 March Quarter 2014
Spending Transactions
0
50
100
150
200
250
300
350
400
450
Apr May Jun Jul Aug Sep Oct Nov Dec Jan Feb Mar
Trans this year Trans last year
$0.00 m
$5.00 m
$10.00 m
$15.00 m
$20.00 m
$25.00 m
Apr May Jun Jul Aug Sep Oct Nov Dec Jan Feb Mar
Spend this year Spend last year
Page 6 of 14
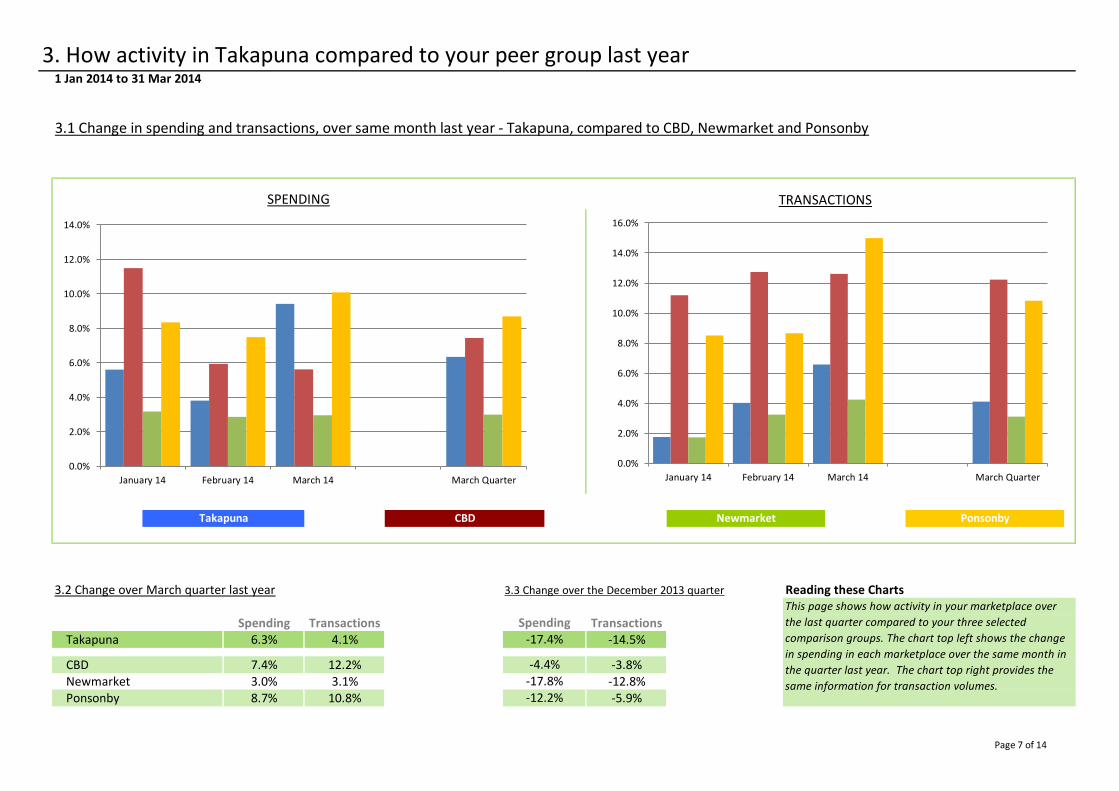
3. How activity in Takapuna compared to your peer group last year1 Jan 2014 to 31 Mar 2014
3.2 Change over March quarter last year Reading these Charts
Spending Transactions TransactionsTakapuna 6.3% 4.1% -14.5%
CBD 7.4% 12.2% -3.8%Newmarket 3.0% 3.1% -12.8%Ponsonby 8.7% 10.8% -5.9%
TRANSACTIONS
3.1 Change in spending and transactions, over same month last year - Takapuna, compared to CBD, Newmarket and Ponsonby
Takapuna CBD Ponsonby
SPENDING
Newmarket
Spending
3.3 Change over the December 2013 quarter
This page shows how activity in your marketplace over
the last quarter compared to your three selected
comparison groups. The chart top left shows the change
in spending in each marketplace over the same month in
the quarter last year. The chart top right provides the
same information for transaction volumes.
-17.4%
-4.4%-17.8%-12.2%
0.0%
2.0%
4.0%
6.0%
8.0%
10.0%
12.0%
14.0%
January 14 February 14 March 14 March Quarter
0.0%
2.0%
4.0%
6.0%
8.0%
10.0%
12.0%
14.0%
16.0%
January 14 February 14 March 14 March Quarter
Page 7 of 14
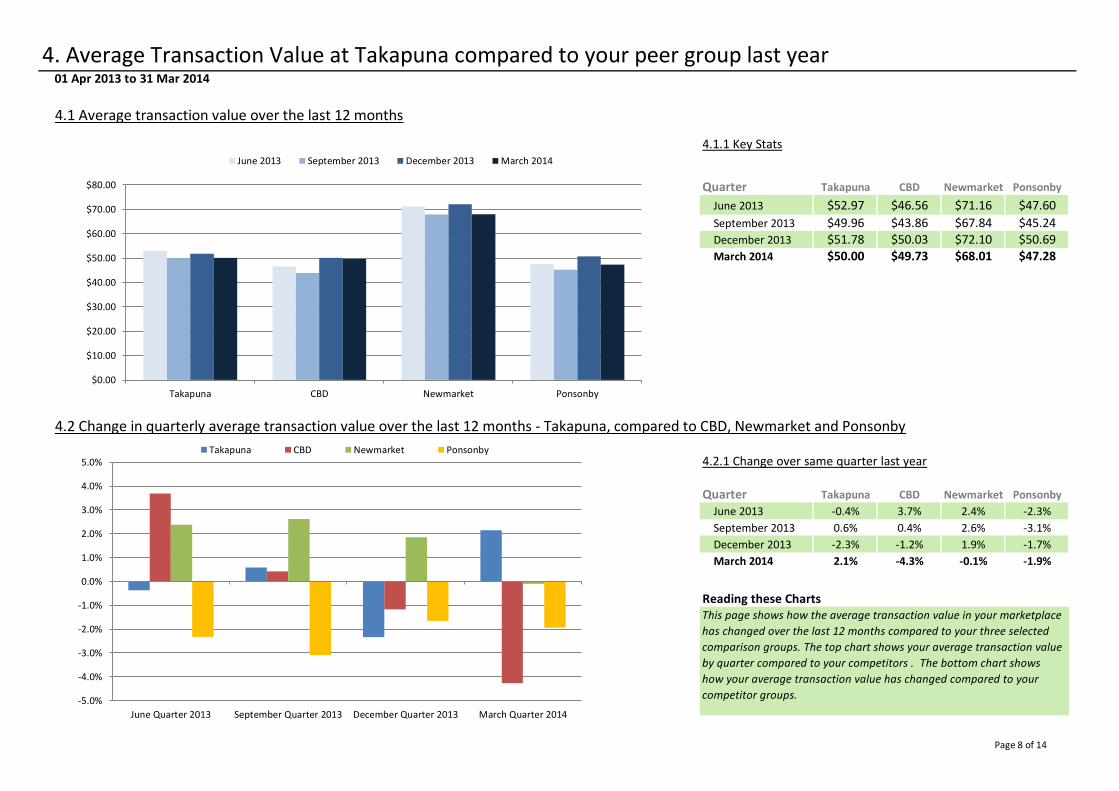
4. Average Transaction Value at Takapuna compared to your peer group last year01 Apr 2013 to 31 Mar 2014
4.1.1 Key Stats
Quarter Takapuna CBD Newmarket Ponsonby
June 2013 $52.97 $46.56 $71.16 $47.60
September 2013 $49.96 $43.86 $67.84 $45.24December 2013 $51.78 $50.03 $72.10 $50.69March 2014 $50.00 $49.73 $68.01 $47.28
4.2 Change in quarterly average transaction value over the last 12 months - Takapuna, compared to CBD, Newmarket and Ponsonby
4.2.1 Change over same quarter last year
Quarter Takapuna CBD Newmarket Ponsonby
June 2013 -0.4% 3.7% 2.4% -2.3%
September 2013 0.6% 0.4% 2.6% -3.1%
December 2013 -2.3% -1.2% 1.9% -1.7%
March 2014 2.1% -4.3% -0.1% -1.9%
Reading these Charts
4.1 Average transaction value over the last 12 months
This page shows how the average transaction value in your marketplace
has changed over the last 12 months compared to your three selected
comparison groups. The top chart shows your average transaction value
by quarter compared to your competitors . The bottom chart shows
how your average transaction value has changed compared to your
competitor groups.-5.0%
-4.0%
-3.0%
-2.0%
-1.0%
0.0%
1.0%
2.0%
3.0%
4.0%
5.0%
June Quarter 2013 September Quarter 2013 December Quarter 2013 March Quarter 2014
Takapuna CBD Newmarket Ponsonby
$0.00
$10.00
$20.00
$30.00
$40.00
$50.00
$60.00
$70.00
$80.00
Takapuna CBD Newmarket Ponsonby
June 2013 September 2013 December 2013 March 2014
Page 8 of 14

5. Which parts of New Zealand are Takapuna customers coming from?1 Jan 2014 to 31 Mar 2014
5.1 Top Local Authority Areas - Current Quarter vs the Same Quarter Last year 5.2 Top Local Authority Areas (excluding Auckland North)
5.3 Key Stats
Origin of customers % of Spending $ Spent Contribution
Auckland North 75.6% +4.1% -1.4%
Auckland Central 10.9% +8.2% +0.2%
Auckland West 2.9% +10.8% +0.1%
Auckland South 2.7% +25.4% +0.4%
Wellington City 0.8% -9.3% -0.1%
Christchurch City 0.8% +12.1% +0.0% Reading these Charts
Whangarei District 0.6% +17.2% +0.1%
Tauranga City 0.4% -2.9% -0.0%
Taupo District 0.4% +172.3% +0.2%
Hastings District 0.3% +105.8% +0.2%
Rest of New Zealand 4.8% +14.6% +0.4%
Change over last year
This page shows where people spending at Takapuna came from. The left-hand
chart shows the percentage from all local authority areas. The chart on the
right shows the top ten areas, excluding Auckland North. The dark bars
represent the percentage of spending this year, the light bars represent last
year.
% of spending = The percentage of spending coming from people living in this
part of New Zealand.
Contribution = The change in the percentage of total spending at Takapuna
coming from people living in this Area (This quarter over same quarter last
year)
$ spent = The percentage change in spending coming from people living in this
Area (This quarter over same quarter last year)
0.0%
10.0%
20.0%
30.0%
40.0%
50.0%
60.0%
70.0%
80.0%
90.0%
This Year Last Year
0.0%
5.0%
10.0%
15.0%
20.0%
25.0%
30.0%
35.0%
40.0%
45.0%
50.0%
This Year Last Year
Page 9 of 14

6. Which suburbs are Takapuna's local customers coming from?1 Jan 2014 to 31 Mar 2014
6.1 Takapuna's Top Spending Suburbs in the last 3 months 6.2 Change in value of spending over last year
6.3 Change over last year
Key
Origin of customers % of Spending $ Spent Contribution
Hauraki 9.1% +17.4% +0.9%
Takapuna Central 6.2% +4.3% -0.1%
Lake Pupuke 4.9% -7.1% -0.7%
Mt Victoria 4.4% +11.3% +0.2%
Narrow Neck 3.3% +22.0% +0.4%
Westlake 2.7% +8.3% +0.1%
Seacliffe 2.5% -9.5% -0.4%
Northcote South 2.3% +61.9% +0.8% Reading these Charts
Castor Bay 2.1% +19.5% +0.2%
Bayswater 2.0% +17.6% +0.2%
Rest of Auckland North 36.1% -2.2% -3.0%
Rest of Auckland Region 16.5% +11.1% +0.8%
Rest of New Zealand 7.9% +15.8% +0.7%
Change over last year
This page shows the suburb of origin of people spending in the Takapuna
marketplace. The left-hand chart shows the percentage each suburb
contributes to the BID. The chart on the right shows the percentage change in
spending from each suburb over last year. The table left shows the values used
in the charts.
% of spending = The percentage of spending coming from people living in this
suburb
$ spent = The percentage change in spending coming from people living in this
suburb (This quarter over same quarter last year)
Contribution = The change in the percentage of total spending at Takapuna
coming from people living in this Suburb (This quarter over same quarter last
year)
-20.0%
-10.0%
+0.0%
+10.0%
+20.0%
+30.0%
+40.0%
+50.0%
+60.0%
+70.0%Hauraki, 9.1%
Takapuna Central, 6.2%
Lake Pupuke, 4.9%
Mt Victoria, 4.4%
Narrow Neck, 3.3%
Westlake, 2.7%
Seacliffe, 2.5%
Northcote South, 2.3%
Castor Bay, 2.1%
Bayswater, 2.0%
Rest of Auckland North, 36.1%
Rest of Auckland Region, 16.5%
Page 10 of 14

7. Which countries are Takapuna international visitors coming from?1 Jan 2014 to 31 Mar 2014
7.1 Takapuna's Top Spending Countries in the last 3 months 7.2 Change in value of spending over last year
This Year Last Year
% of total spending from International Cardholders 5.43% 5.14%
7.3 Change in spending by international cardholders over last year
Key
Origin of customers % of Spending $ Spent Contribution
Australia 27.9% +2.2% -2.8%
United Kingdom 17.3% +4.8% -1.2%
United States of America 14.9% +30.2% +2.0%
Rest of Europe 4.4% +80.4% +1.7%
France 4.2% +71.4% +1.5%
Canada 3.5% -7.2% -0.7% Reading these Charts
China 3.4% +48.8% +0.8%
South Korea 3.0% -31.7% -1.9%
Germany 2.9% +78.8% +1.1%
Singapore 2.2% +29.6% +0.3%
All other 16.5% +8.0% -0.7%
TOTAL 100.0% +12.4%
Change over last year% of spending = The percentage of spending coming from people living in this
country
$ spent = The percentage change in spending coming from people living in this
country (This quarter over same quarter last year)
Contribution = The change in the percentage of total spending at Takapuna
coming from people living in this country (This quarter over same quarter last
year).
This page shows the country of origin of people spending in the Takapuna
marketplace. The left-hand chart shows the percentage each country
contributes to the BID. The chart on the right shows the percentage change in
spending from each country over last year. The table left shows the values used
in the charts.
-40.0%
-20.0%
+0.0%
+20.0%
+40.0%
+60.0%
+80.0%
+100.0%
Australia, 27.9%
United Kingdom, 17.3%
United States of America, 14.9%
Rest of Europe, 4.4%
France, 4.2%
Canada, 3.5%
China, 3.4%
South Korea, 3.0%
Germany, 2.9%
Singapore, 2.2%
All other, 16.5%
Page 11 of 14
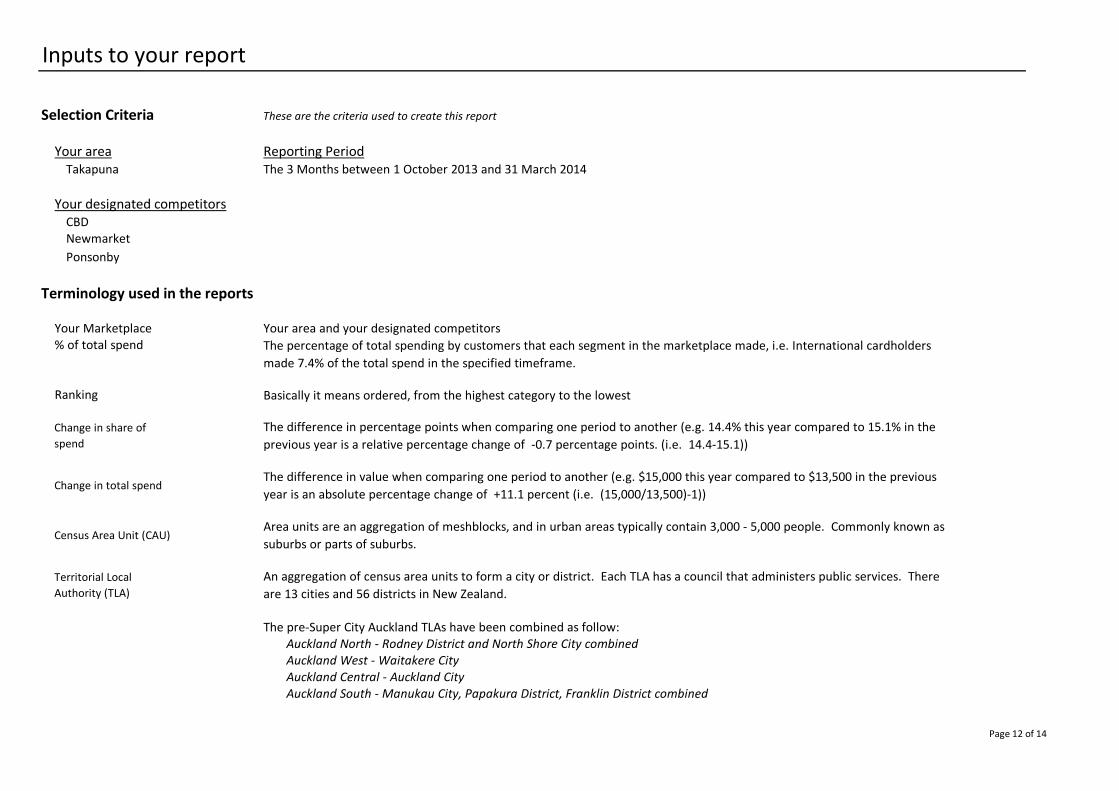
Inputs to your report
Selection Criteria These are the criteria used to create this report
Your area Reporting PeriodTakapuna The 3 Months between 1 October 2013 and 31 March 2014
Your designated competitorsCBDNewmarket
Ponsonby
Terminology used in the reports
Your Marketplace Your area and your designated competitors% of total spend
Ranking
The pre-Super City Auckland TLAs have been combined as follow:Auckland North - Rodney District and North Shore City combinedAuckland West - Waitakere CityAuckland Central - Auckland CityAuckland South - Manukau City, Papakura District, Franklin District combined
The percentage of total spending by customers that each segment in the marketplace made, i.e. International cardholders
made 7.4% of the total spend in the specified timeframe.
An aggregation of census area units to form a city or district. Each TLA has a council that administers public services. There
are 13 cities and 56 districts in New Zealand.
Census Area Unit (CAU)Area units are an aggregation of meshblocks, and in urban areas typically contain 3,000 - 5,000 people. Commonly known as
suburbs or parts of suburbs.
The difference in percentage points when comparing one period to another (e.g. 14.4% this year compared to 15.1% in the
previous year is a relative percentage change of -0.7 percentage points. (i.e. 14.4-15.1))
Basically it means ordered, from the highest category to the lowest
Change in share of
spend
Territorial Local
Authority (TLA)
Change in total spendThe difference in value when comparing one period to another (e.g. $15,000 this year compared to $13,500 in the previous
year is an absolute percentage change of +11.1 percent (i.e. (15,000/13,500)-1))
Page 12 of 14

Inputs to your report
Frequently Asked Questions
What is the source of the data used in the Auckland Council Regional Spending Database?
About Paymark
BNZ MarketView
BNZ MarketView is based on the eftpos and credit card spending of BNZ card holders in the New Zealand retail market. BNZ has around a 20% market
share of the cards business in New Zealand, and typically accounts for approximately 14 - 15% of total spending by value. There are over 700,000 BNZ
cardholders. BNZ de-personalises BNZ MarketView data by removing any potential identifiers i.e. names, addresses, account, or card numbers. These
are replaced with a unique id, a meshblock number (based on the cardholders home address), and a demographic profile. The cardholder’s age and
gender are retained, but there is no way of identifying an individual cardholder.
The data is primarily sourced from electronic card transactions made via Paymark network at each of the Business Improvement Districts operating
within the Auckland Council boundaries. To determine information on the origin and types of customers spending in each market we have used data
from BNZ MarketView. Details on both data sources are provide below.
The spending values include GST, but exclude cash out with purchases. Withdrawals from ATMs are not included. Other payment types including cash,
HP or automatic payments are also not included.
Paymark operates New Zealand’s largest electronic transaction processing network. The company is jointly own by ASB, BNZ, the National Bank and
Westpac. Around 70% of New Zealand’s eftpos terminals are connected to the Paymark Network. For merchants on the Paymark Network we receive
100% of their electronic card transactions. We use an extrapolation of BNZ cardholder spending for merchants that aren’t on the Paymark Network.
BNZ cardholders they are largely demographically representative of the country and distributed in line with the national population. They also spend
everywhere, which includes retailers not on the Paymark network. We are able to BNZ MarketView’s share of spending at Paymark merchants to
estimate the value of spending at non-Paymark merchants:
Page 13 of 14

Inputs to your report
What card types are included?
How have the Business Improvement District Boundaries been decided?
How is domestic spending determined?
How is international spending determined?
Does the data include GST?
BID boundaries have been determined by the Council’s Business Area Planning team, in consultation with the Research, Investigations and Monitoring
Unit.
Yes. NB: From 1 October 2010, GST rose from 12.5% to 15%. This means there is a natural 2.2% increase in spending between periods using the old and
new GST rates.
The data is drawn from all card spending using all card types. This includes all Eftpos cards, and all major American Express, Diners Club, MasterCard,
Visa Cards. The data will also include electronic gift cards.
From the Paymark’s Market Reporting data it is possible to distinguish between New Zealand cards and cards issued by overseas banks. Overseas cards
have a country code. We report the value of spending by the country of origin of the card, and by association, the cardholder.
Cards issued in New Zealand are identified in the database. Any transaction made in the Auckland Region, on a New Zealand issued eftpos or credit
card, is assumed to be spending made by New Zealanders.
Page 14 of 14
Related Documents


