Edelweiss Professional Investor Research Insightful. Independent. Decisive. Tactical BUY: Sobha Ltd Date: 09th April 2019 Nimit Gala Research Analyst [email protected]

Welcome message from author
This document is posted to help you gain knowledge. Please leave a comment to let me know what you think about it! Share it to your friends and learn new things together.
Transcript

Edelweiss Professional Investor Research Insightful. Independent. Decisive.
Tactical BUY: Sobha Ltd
Date: 09th April 2019
Nimit Gala
Research Analyst
Edelweiss Professional Investor Research
Tactical BUY
Sobha Ltd STAR of the South
1
Nimit Gala Research Analyst [email protected]
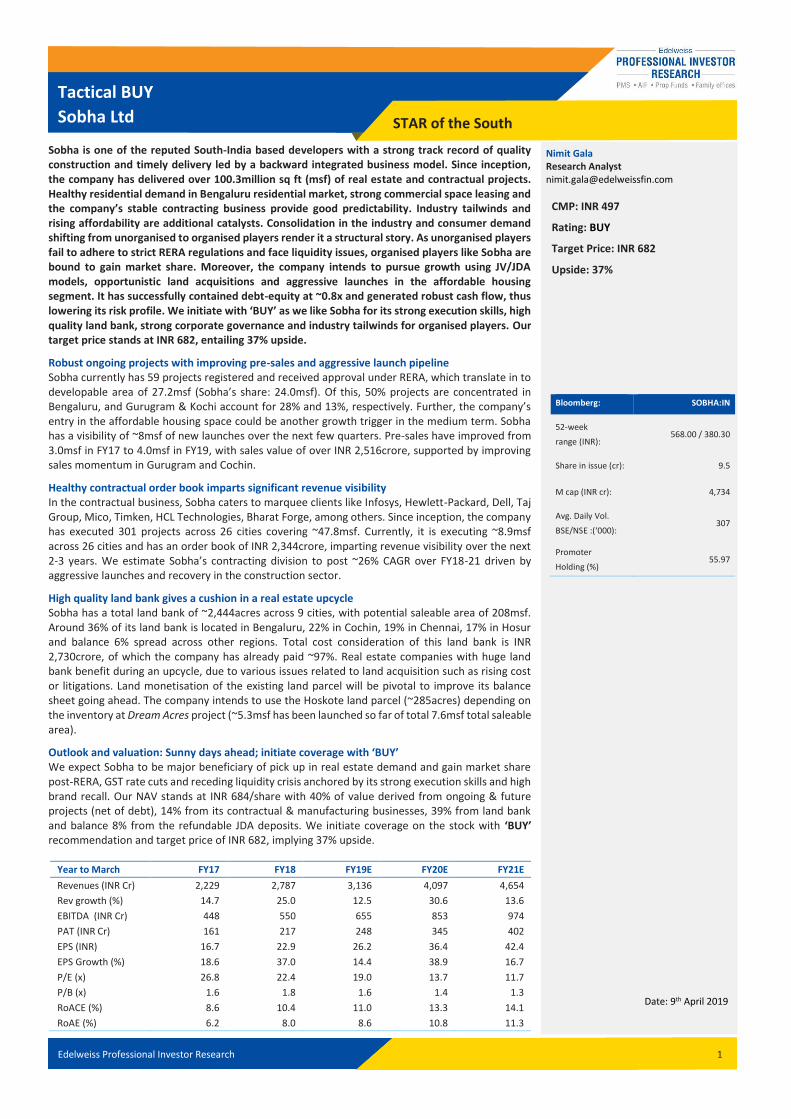
CMP: INR 497
Rating: BUY
Target Price: INR 682
Upside: 37%
Bloomberg: SOBHA:IN
52-week
range (INR): 568.00 / 380.30
Share in issue (cr): 9.5
M cap (INR cr): 4,734
Avg. Daily Vol.
BSE/NSE :(‘000): 307
Promoter
Holding (%) 55.97
Date: 9th April 2019
Sobha is one of the reputed South-India based developers with a strong track record of quality construction and timely delivery led by a backward integrated business model. Since inception, the company has delivered over 100.3million sq ft (msf) of real estate and contractual projects. Healthy residential demand in Bengaluru residential market, strong commercial space leasing and the company’s stable contracting business provide good predictability. Industry tailwinds and rising affordability are additional catalysts. Consolidation in the industry and consumer demand shifting from unorganised to organised players render it a structural story. As unorganised players fail to adhere to strict RERA regulations and face liquidity issues, organised players like Sobha are bound to gain market share. Moreover, the company intends to pursue growth using JV/JDA models, opportunistic land acquisitions and aggressive launches in the affordable housing segment. It has successfully contained debt-equity at ~0.8x and generated robust cash flow, thus lowering its risk profile. We initiate with ‘BUY’ as we like Sobha for its strong execution skills, high quality land bank, strong corporate governance and industry tailwinds for organised players. Our target price stands at INR 682, entailing 37% upside.
Robust ongoing projects with improving pre-sales and aggressive launch pipeline Sobha currently has 59 projects registered and received approval under RERA, which translate in to developable area of 27.2msf (Sobha’s share: 24.0msf). Of this, 50% projects are concentrated in Bengaluru, and Gurugram & Kochi account for 28% and 13%, respectively. Further, the company’s entry in the affordable housing space could be another growth trigger in the medium term. Sobha has a visibility of ~8msf of new launches over the next few quarters. Pre-sales have improved from 3.0msf in FY17 to 4.0msf in FY19, with sales value of over INR 2,516crore, supported by improving sales momentum in Gurugram and Cochin.
Healthy contractual order book imparts significant revenue visibility In the contractual business, Sobha caters to marquee clients like Infosys, Hewlett-Packard, Dell, Taj Group, Mico, Timken, HCL Technologies, Bharat Forge, among others. Since inception, the company has executed 301 projects across 26 cities covering ~47.8msf. Currently, it is executing ~8.9msf across 26 cities and has an order book of INR 2,344crore, imparting revenue visibility over the next 2-3 years. We estimate Sobha’s contracting division to post ~26% CAGR over FY18-21 driven by aggressive launches and recovery in the construction sector.
High quality land bank gives a cushion in a real estate upcycle Sobha has a total land bank of ~2,444acres across 9 cities, with potential saleable area of 208msf. Around 36% of its land bank is located in Bengaluru, 22% in Cochin, 19% in Chennai, 17% in Hosur and balance 6% spread across other regions. Total cost consideration of this land bank is INR 2,730crore, of which the company has already paid ~97%. Real estate companies with huge land bank benefit during an upcycle, due to various issues related to land acquisition such as rising cost or litigations. Land monetisation of the existing land parcel will be pivotal to improve its balance sheet going ahead. The company intends to use the Hoskote land parcel (~285acres) depending on the inventory at Dream Acres project (~5.3msf has been launched so far of total 7.6msf total saleable area).
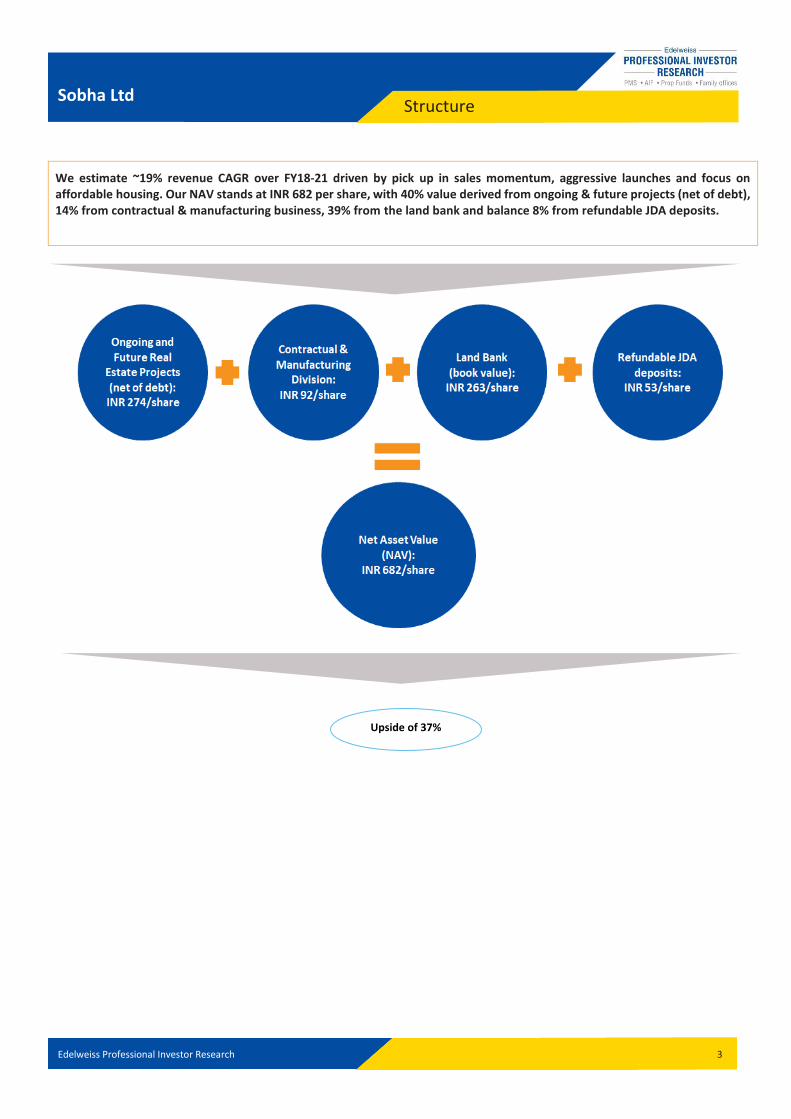
Outlook and valuation: Sunny days ahead; initiate coverage with ‘BUY’ We expect Sobha to be major beneficiary of pick up in real estate demand and gain market share post-RERA, GST rate cuts and receding liquidity crisis anchored by its strong execution skills and high brand recall. Our NAV stands at INR 684/share with 40% of value derived from ongoing & future projects (net of debt), 14% from its contractual & manufacturing businesses, 39% from land bank and balance 8% from the refundable JDA deposits. We initiate coverage on the stock with ‘BUY’ recommendation and target price of INR 682, implying 37% upside.
Year to March FY17 FY18 FY19E FY20E FY21E
Revenues (INR Cr) 2,229 2,787 3,136 4,097 4,654
Rev growth (%) 14.7 25.0 12.5 30.6 13.6
EBITDA (INR Cr) 448 550 655 853 974
PAT (INR Cr) 161 217 248 345 402
EPS (INR) 16.7 22.9 26.2 36.4 42.4
EPS Growth (%) 18.6 37.0 14.4 38.9 16.7
P/E (x) 26.8 22.4 19.0 13.7 11.7
P/B (x) 1.6 1.8 1.6 1.4 1.3
RoACE (%) 8.6 10.4 11.0 13.3 14.1
RoAE (%) 6.2 8.0 8.6 10.8 11.3
Edelweiss Professional Investor Research 2
Table of Contents
Structure ............................................................................................................................ 3
Share Price History .............................................................................................................. 4
Focus Charts 1 .................................................................................................................... 5
Focus Charts 2 .................................................................................................................... 6
I. Robust ongoing projects with improving pre-sales and aggressive launches.................. 8
II. Healthy contractual division order book imparts ample revenue visibility .................... 11
III. High quality land bank gives a cushion in a real estate upcycle .................................... 12
Outlook and Valuations ..................................................................................................... 14
Peer comparison ................................................................................................................. 15
Business Model .................................................................................................................. 18
Management Profile .......................................................................................................... 22
Timeline ............................................................................................................................. 23
Financial Analysis ............................................................................................................... 24
Financials ........................................................................................................................... 27
Annexure ............................................................................................................................ 30
Annexure Company Overview ............................................................................................ 31
Annexure Sector Overview ................................................................................................. 35
Edelweiss Professional Investor Research
Structure Sobha Ltd
3
We estimate ~19% revenue CAGR over FY18-21 driven by pick up in sales momentum, aggressive launches and focus on affordable housing. Our NAV stands at INR 682 per share, with 40% value derived from ongoing & future projects (net of debt), 14% from contractual & manufacturing business, 39% from the land bank and balance 8% from refundable JDA deposits.
Upside of 37%
Edelweiss Professional Investor Research
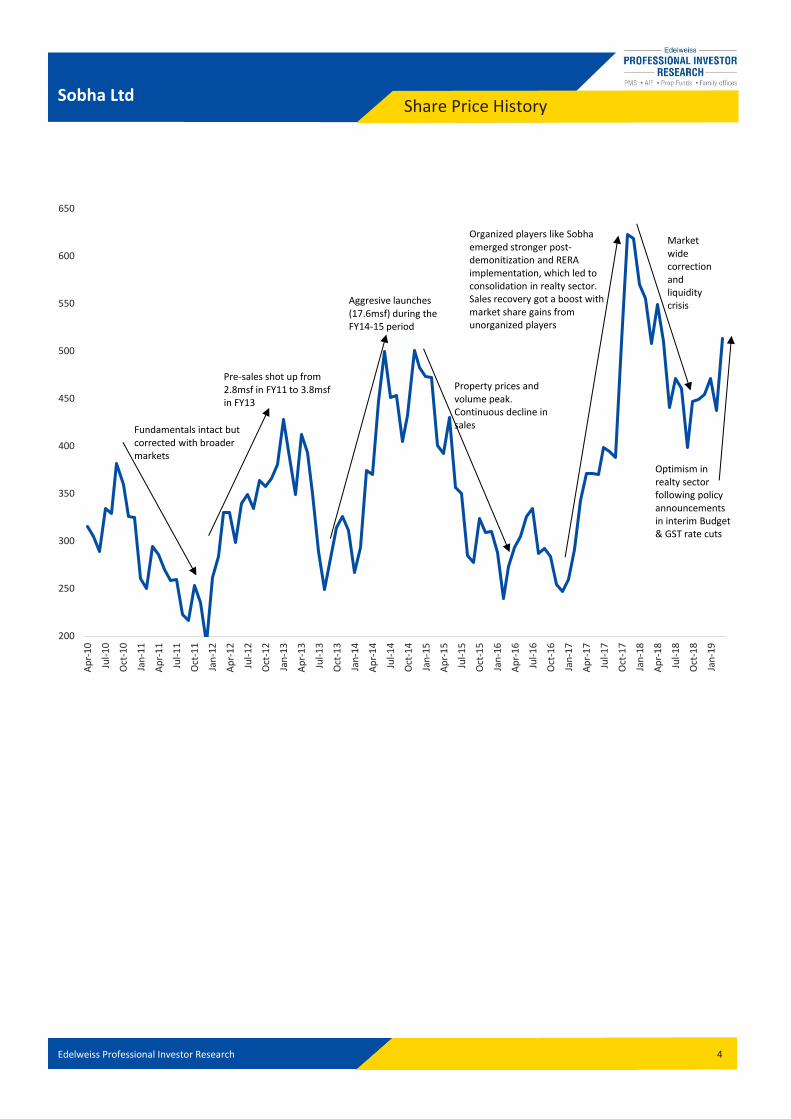
Share Price History Sobha Ltd
4
200
250
300
350
400
450
500
550
600
650
Ap
r-1
0
Jul-
10
Oct
-10
Jan
-11
Ap
r-1
1
Jul-
11
Oct
-11
Jan
-12
Ap
r-1
2
Jul-
12
Oct
-12
Jan
-13
Ap
r-1
3
Jul-
13
Oct
-13
Jan
-14
Ap
r-1
4
Jul-
14
Oct
-14
Jan
-15
Ap
r-1
5
Jul-
15
Oct
-15
Jan
-16
Ap
r-1
6
Jul-
16
Oct
-16
Jan
-17
Ap
r-1
7
Jul-
17
Oct
-17
Jan
-18
Ap
r-1
8
Jul-
18
Oct
-18
Jan
-19
Fundamentals intact but corrected with broader markets
Pre-sales shot up from 2.8msf in FY11 to 3.8msf in FY13
Aggresive launches (17.6msf) during theFY14-15 period
Property prices and volume peak. Continuous decline in sales
Organized players like Sobha emerged stronger post-demonitization and RERA implementation, which led to consolidation in realty sector. Sales recovery got a boost with market share gains from unorganized players
Marketwide correction and liquidity crisis
Optimism in realty sector following policyannouncements in interim Budget& GST rate cuts
Edelweiss Professional Investor Research
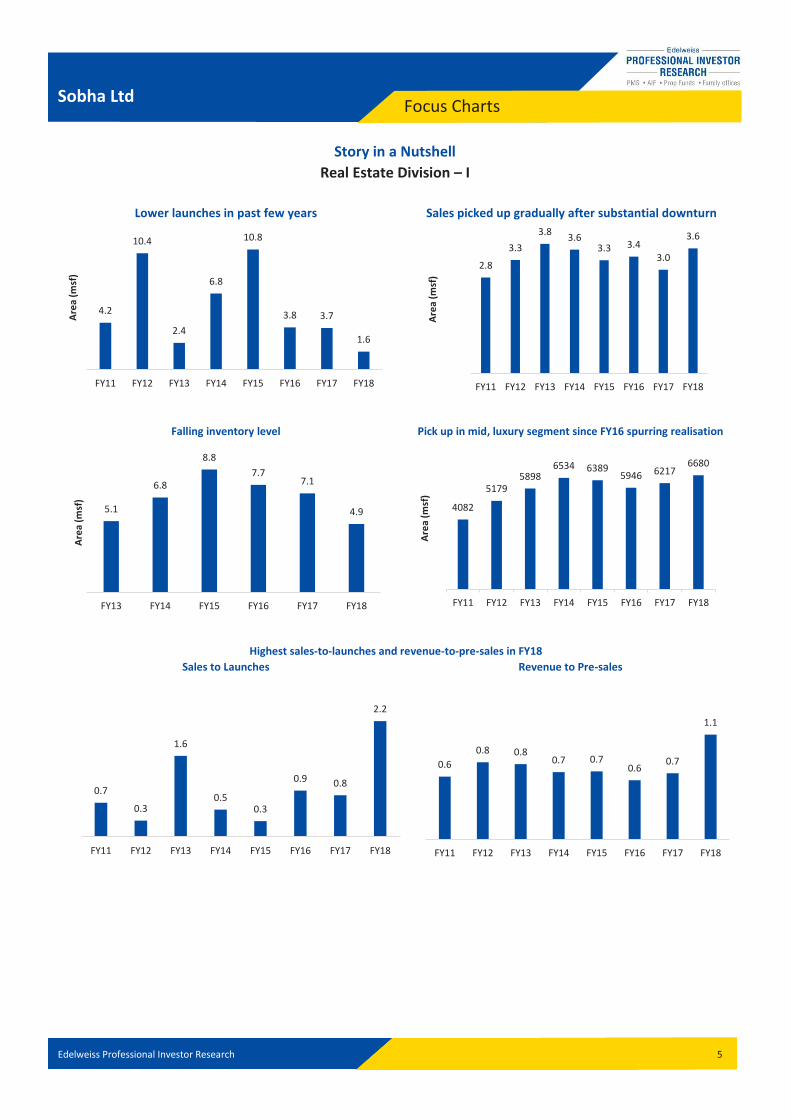
Focus Charts Sobha Ltd
5
Story in a Nutshell
Real Estate Division – I
Lower launches in past few years Sales picked up gradually after substantial downturn
Falling inventory level Pick up in mid, luxury segment since FY16 spurring realisation
Highest sales-to-launches and revenue-to-pre-sales in FY18 Sales to Launches Revenue to Pre-sales
4.2
10.4
2.4
6.8
10.8
3.8 3.7
1.6
FY11 FY12 FY13 FY14 FY15 FY16 FY17 FY18
Are
a (m
sf)
2.8
3.3
3.83.6
3.3 3.43.0
3.6
FY11 FY12 FY13 FY14 FY15 FY16 FY17 FY18
Are
a (m
sf)
5.1
6.8
8.8
7.77.1
4.9
FY13 FY14 FY15 FY16 FY17 FY18
Are
a (m
sf)
4082
51795898
6534 63895946 6217
6680
FY11 FY12 FY13 FY14 FY15 FY16 FY17 FY18
Are
a (m
sf)
0.7
0.3
1.6
0.50.3
0.9 0.8
2.2
FY11 FY12 FY13 FY14 FY15 FY16 FY17 FY18
0.6
0.8 0.80.7 0.7
0.60.7
1.1
FY11 FY12 FY13 FY14 FY15 FY16 FY17 FY18
Edelweiss Professional Investor Research
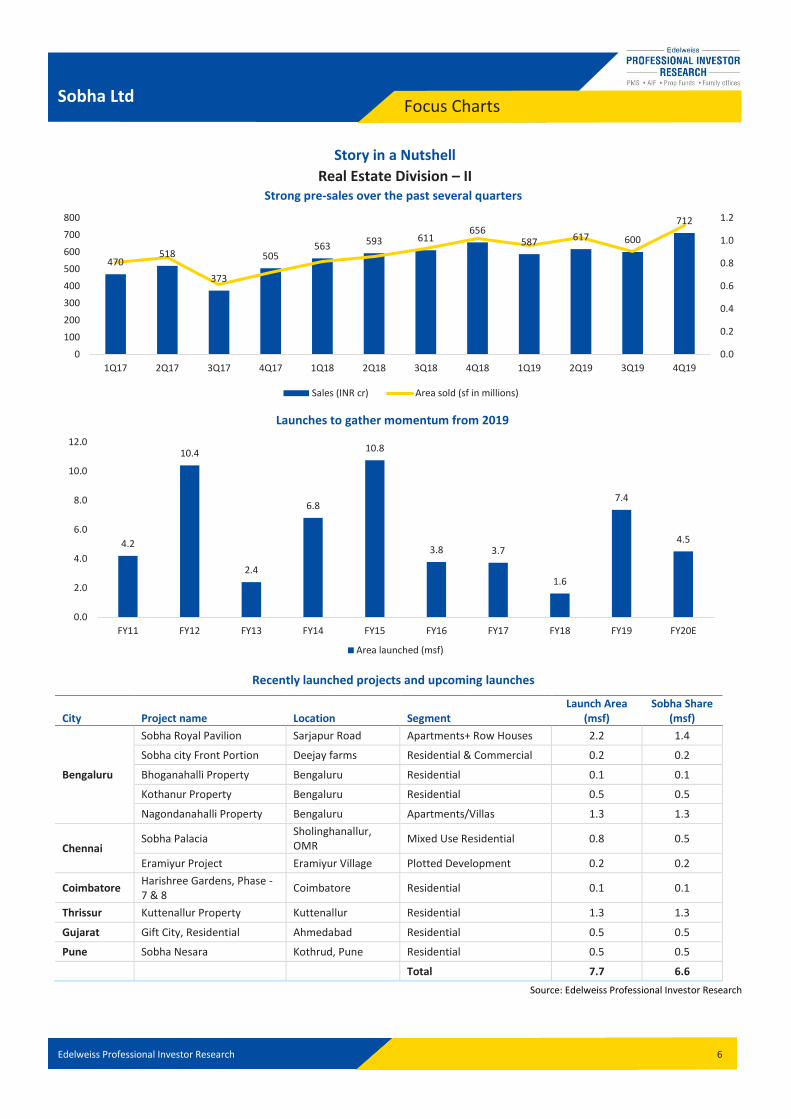
Focus Charts Sobha Ltd
6
Story in a Nutshell
Real Estate Division – II Strong pre-sales over the past several quarters
Launches to gather momentum from 2019
Recently launched projects and upcoming launches
City Project name Location Segment Launch Area
(msf) Sobha Share
(msf)
Bengaluru
Sobha Royal Pavilion Sarjapur Road Apartments+ Row Houses 2.2 1.4
Sobha city Front Portion Deejay farms Residential & Commercial 0.2 0.2
Bhoganahalli Property Bengaluru Residential 0.1 0.1
Kothanur Property Bengaluru Residential 0.5 0.5
Nagondanahalli Property Bengaluru Apartments/Villas 1.3 1.3
Chennai Sobha Palacia
Sholinghanallur, OMR
Mixed Use Residential 0.8 0.5
Eramiyur Project Eramiyur Village Plotted Development 0.2 0.2
Coimbatore Harishree Gardens, Phase - 7 & 8
Coimbatore Residential 0.1 0.1
Thrissur Kuttenallur Property Kuttenallur Residential 1.3 1.3
Gujarat Gift City, Residential Ahmedabad Residential 0.5 0.5
Pune Sobha Nesara Kothrud, Pune Residential 0.5 0.5
Total 7.7 6.6
Source: Edelweiss Professional Investor Research
470518
373
505563 593 611
656587 617 600
712
0.0
0.2
0.4
0.6
0.8
1.0
1.2
0
100
200
300
400
500
600
700
800
1Q17 2Q17 3Q17 4Q17 1Q18 2Q18 3Q18 4Q18 1Q19 2Q19 3Q19 4Q19
Sales (INR cr) Area sold (sf in millions)
4.2
10.4
2.4
6.8
10.8
3.8 3.7
1.6
7.4
4.5
0.0
2.0
4.0
6.0
8.0
10.0
12.0
FY11 FY12 FY13 FY14 FY15 FY16 FY17 FY18 FY19 FY20E
Area launched (msf)
Edelweiss Professional Investor Research
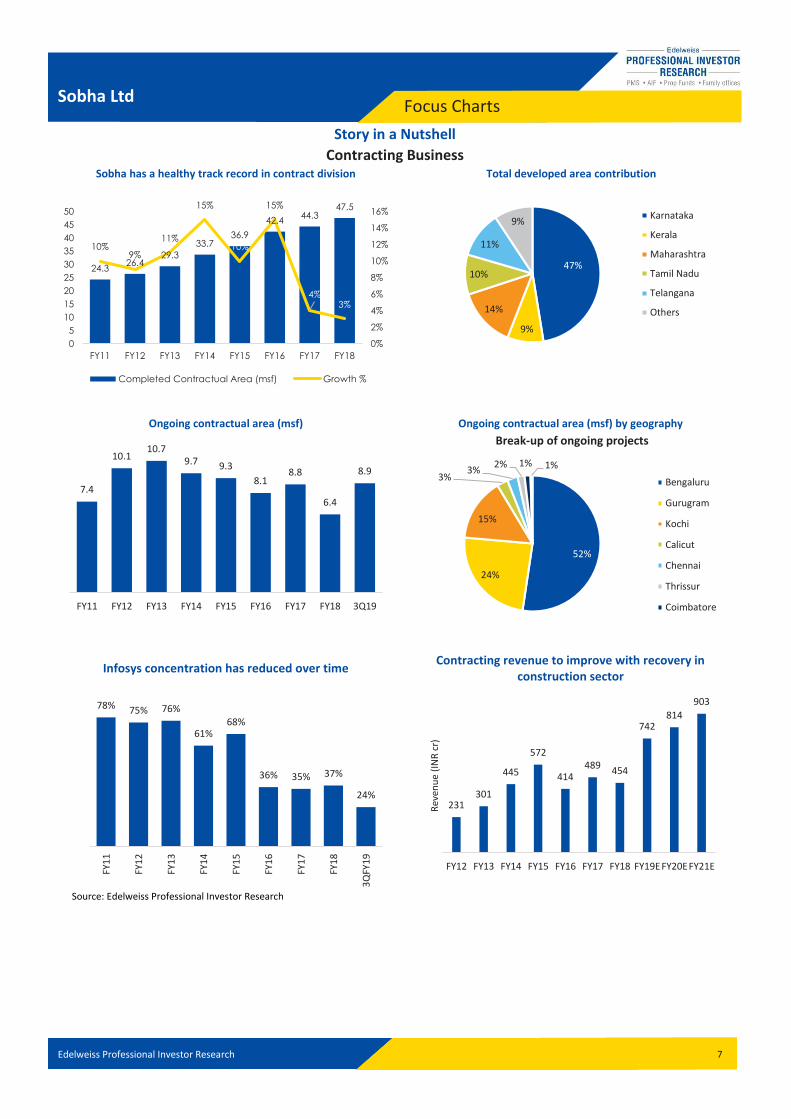
Focus Charts Sobha Ltd
7
Story in a Nutshell
Contracting Business Sobha has a healthy track record in contract division Total developed area contribution
Ongoing contractual area (msf) Ongoing contractual area (msf) by geography
Infosys concentration has reduced over time Contracting revenue to improve with recovery in
construction sector
Source: Edelweiss Professional Investor Research
24.326.4
29.3
33.736.9
42.444.3
47.5
10%9%
11%
15%
10%
15%
4%3%
0%
2%
4%
6%
8%
10%
12%
14%
16%
0
5
10
15
20
25
30
35
40
45
50
FY11 FY12 FY13 FY14 FY15 FY16 FY17 FY18
Completed Contractual Area (msf) Growth %
47%
9%
14%
10%
11%
9%Karnataka
Kerala
Maharashtra
Tamil Nadu
Telangana
Others
7.4
10.110.7
9.7 9.3
8.18.8
6.4
8.9
FY11 FY12 FY13 FY14 FY15 FY16 FY17 FY18 3Q19
52%
24%
15%
3%3%
2% 1% 1%
Break-up of ongoing projects
Bengaluru
Gurugram
Kochi
Calicut
Chennai
Thrissur
Coimbatore
78% 75% 76%
61%68%
36% 35% 37%
24%
FY1
1
FY1
2
FY1
3
FY1
4
FY1
5
FY1
6
FY1
7
FY1
8
3Q
FY1
9
231301
445
572
414489
454
742814
903
FY12 FY13 FY14 FY15 FY16 FY17 FY18 FY19EFY20EFY21E
Rev
enu
e (I
NR
cr)
Edelweiss Professional Investor Research 8
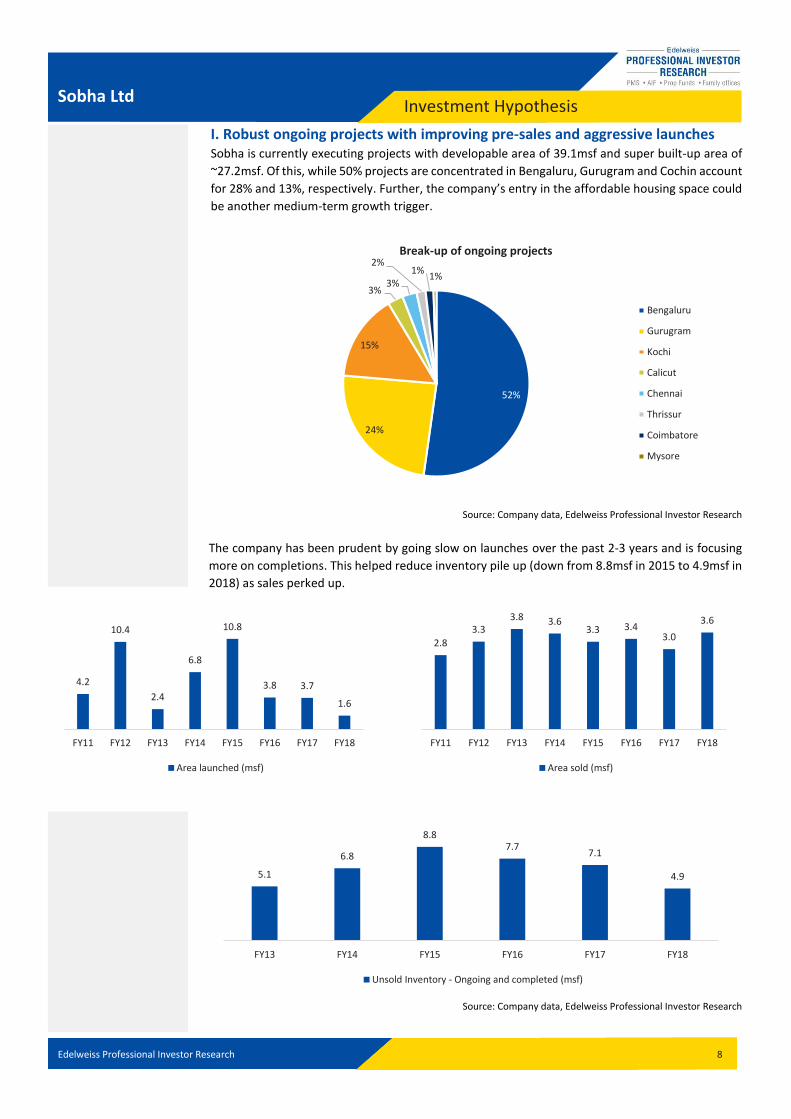
Investment Hypothesis Sobha Ltd
I. Robust ongoing projects with improving pre-sales and aggressive launches Sobha is currently executing projects with developable area of 39.1msf and super built-up area of
~27.2msf. Of this, while 50% projects are concentrated in Bengaluru, Gurugram and Cochin account
for 28% and 13%, respectively. Further, the company’s entry in the affordable housing space could
be another medium-term growth trigger.
Source: Company data, Edelweiss Professional Investor Research
The company has been prudent by going slow on launches over the past 2-3 years and is focusing
more on completions. This helped reduce inventory pile up (down from 8.8msf in 2015 to 4.9msf in
2018) as sales perked up.
Source: Company data, Edelweiss Professional Investor Research
52%
24%
15%
3%3%
2%1%
1%
Break-up of ongoing projects
Bengaluru
Gurugram
Kochi
Calicut
Chennai
Thrissur
Coimbatore
Mysore
4.2
10.4
2.4
6.8
10.8
3.8 3.7
1.6
FY11 FY12 FY13 FY14 FY15 FY16 FY17 FY18
Area launched (msf)
2.8
3.33.8 3.6
3.3 3.43.0
3.6
FY11 FY12 FY13 FY14 FY15 FY16 FY17 FY18
Area sold (msf)
5.1
6.8
8.87.7
7.1
4.9
FY13 FY14 FY15 FY16 FY17 FY18
Unsold Inventory - Ongoing and completed (msf)

Edelweiss Professional Investor Research 9
Investment Hypothesis Sobha Ltd
Sobha’s pre-sales improved from 3.0msf in FY17 to 4.0msf in FY19, with sales value of over INR
2,516crore in FY19, supported by stable sales in core market of Bengaluru and improving sales
momentum in Gurugram and Cochin. Sales in Cochin rebounded strongly after Q2FY19, where
Kerala had been severely affected by floods. The company recorded pre-sales of 1.1msf in Q4FY19
(+11% YoY) which was the highest ever quarterly sales achieved by the company.
Source: Company data, Edelweiss Professional Investor Research
The sales to launches ratio in 2018 touched the highest level since 2013 at 2.2, indicating aggressive
sales compared to launches. This, coupled with falling inventory (lowest since 2013), implies
aggressive launches ahead.
Source: Company data, Edelweiss Professional Investor Research
Sobha is planning to launch projects spanning ~8msf over the next few quarters. Bengaluru still
continues to be the focus area—contributing ~56% of new launches—followed by Thrissur and
Chennai, which will comprise 17% and 12% of launches, respectively. We expect these launches to
drive the company’s growth over the next few years and clock around 4.4msf and 4.9msf in FY20
and FY21, respectively. Also, we expect average realisation to start improving going ahead with
stablization in prices led by lower expected supply and sales recovery in Gurugram and Cochin.
470518
373
505563 593 611
656587 617 600
712
1.1
0.0
0.2
0.4
0.6
0.8
1.0
1.2
0
100
200
300
400
500
600
700
800
900
1000
1Q17 2Q17 3Q17 4Q17 1Q18 2Q18 3Q18 4Q18 1Q19 2Q19 3Q19 4Q19
Pre-sales have continued to be strong over the last several quarters
Sales (INR cr) Area sold (sf in millions)
Highest ever quarterly sales for the company
0.3
1.6
0.50.3
0.90.8
2.2
FY12 FY13 FY14 FY15 FY16 FY17 FY18
High ratio of sales to launches means aggressive project launches ahead
Sales to Launches (msf)
Edelweiss Professional Investor Research 10
Investment Hypothesis Sobha Ltd
Source: Company data, Edelweiss Professional Investor Research
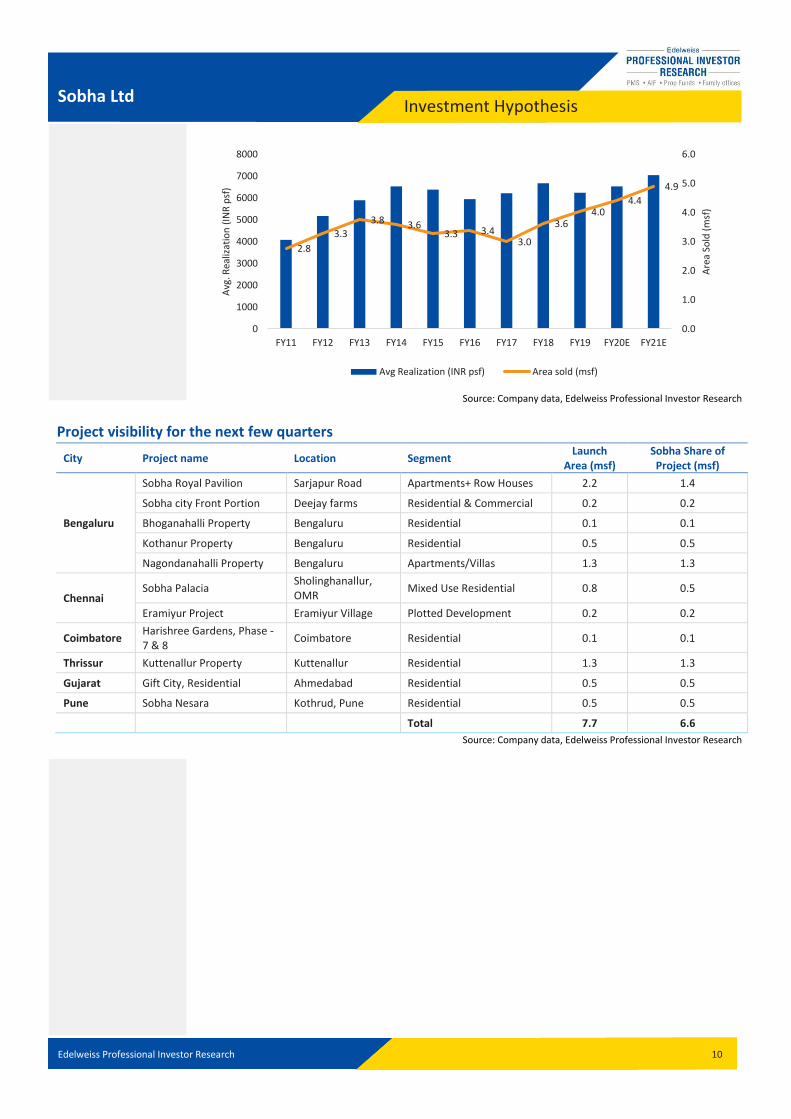
Project visibility for the next few quarters
City Project name Location Segment Launch
Area (msf) Sobha Share of
Project (msf)
Bengaluru
Sobha Royal Pavilion Sarjapur Road Apartments+ Row Houses 2.2 1.4
Sobha city Front Portion Deejay farms Residential & Commercial 0.2 0.2
Bhoganahalli Property Bengaluru Residential 0.1 0.1
Kothanur Property Bengaluru Residential 0.5 0.5
Nagondanahalli Property Bengaluru Apartments/Villas 1.3 1.3
Chennai Sobha Palacia
Sholinghanallur, OMR
Mixed Use Residential 0.8 0.5
Eramiyur Project Eramiyur Village Plotted Development 0.2 0.2
Coimbatore Harishree Gardens, Phase - 7 & 8
Coimbatore Residential 0.1 0.1
Thrissur Kuttenallur Property Kuttenallur Residential 1.3 1.3
Gujarat Gift City, Residential Ahmedabad Residential 0.5 0.5
Pune Sobha Nesara Kothrud, Pune Residential 0.5 0.5
Total 7.7 6.6
Source: Company data, Edelweiss Professional Investor Research
2.8
3.3
3.8 3.63.3 3.4
3.0
3.64.0
4.4
4.9
0.0
1.0
2.0
3.0
4.0
5.0
6.0
0
1000
2000
3000
4000
5000
6000
7000
8000
FY11 FY12 FY13 FY14 FY15 FY16 FY17 FY18 FY19 FY20E FY21E
Are
a So
ld (
msf
)
Avg
. Rea
lizat
ion
(IN
R p
sf)
Avg Realization (INR psf) Area sold (msf)
Edelweiss Professional Investor Research 11
Investment Hypothesis Sobha Ltd
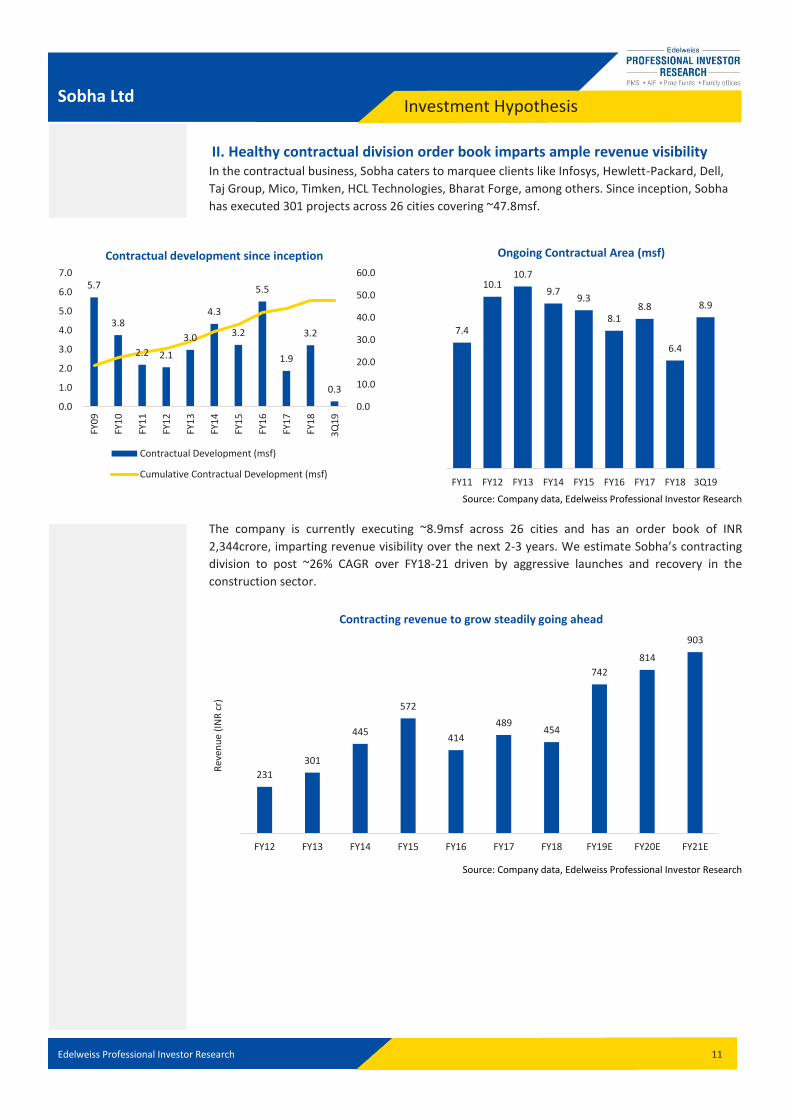
II. Healthy contractual division order book imparts ample revenue visibility In the contractual business, Sobha caters to marquee clients like Infosys, Hewlett-Packard, Dell,
Taj Group, Mico, Timken, HCL Technologies, Bharat Forge, among others. Since inception, Sobha
has executed 301 projects across 26 cities covering ~47.8msf.
Source: Company data, Edelweiss Professional Investor Research
The company is currently executing ~8.9msf across 26 cities and has an order book of INR
2,344crore, imparting revenue visibility over the next 2-3 years. We estimate Sobha’s contracting
division to post ~26% CAGR over FY18-21 driven by aggressive launches and recovery in the
construction sector.
Source: Company data, Edelweiss Professional Investor Research
5.7
3.8
2.2 2.1
3.0
4.3
3.2
5.5
1.9
3.2
0.3
0.0
10.0
20.0
30.0
40.0
50.0
60.0
0.0
1.0
2.0
3.0
4.0
5.0
6.0
7.0
FY0
9
FY1
0
FY1
1
FY1
2
FY1
3
FY1
4
FY1
5
FY1
6
FY1
7
FY1
8
3Q
19
Contractual development since inception
Contractual Development (msf)
Cumulative Contractual Development (msf)
7.4
10.110.7
9.79.3
8.18.8
6.4
8.9
FY11 FY12 FY13 FY14 FY15 FY16 FY17 FY18 3Q19
Ongoing Contractual Area (msf)
231
301
445
572
414
489454
742
814
903
FY12 FY13 FY14 FY15 FY16 FY17 FY18 FY19E FY20E FY21E
Rev
enu
e (I
NR
cr)
Contracting revenue to grow steadily going ahead
Edelweiss Professional Investor Research 12
Investment Hypothesis Sobha Ltd
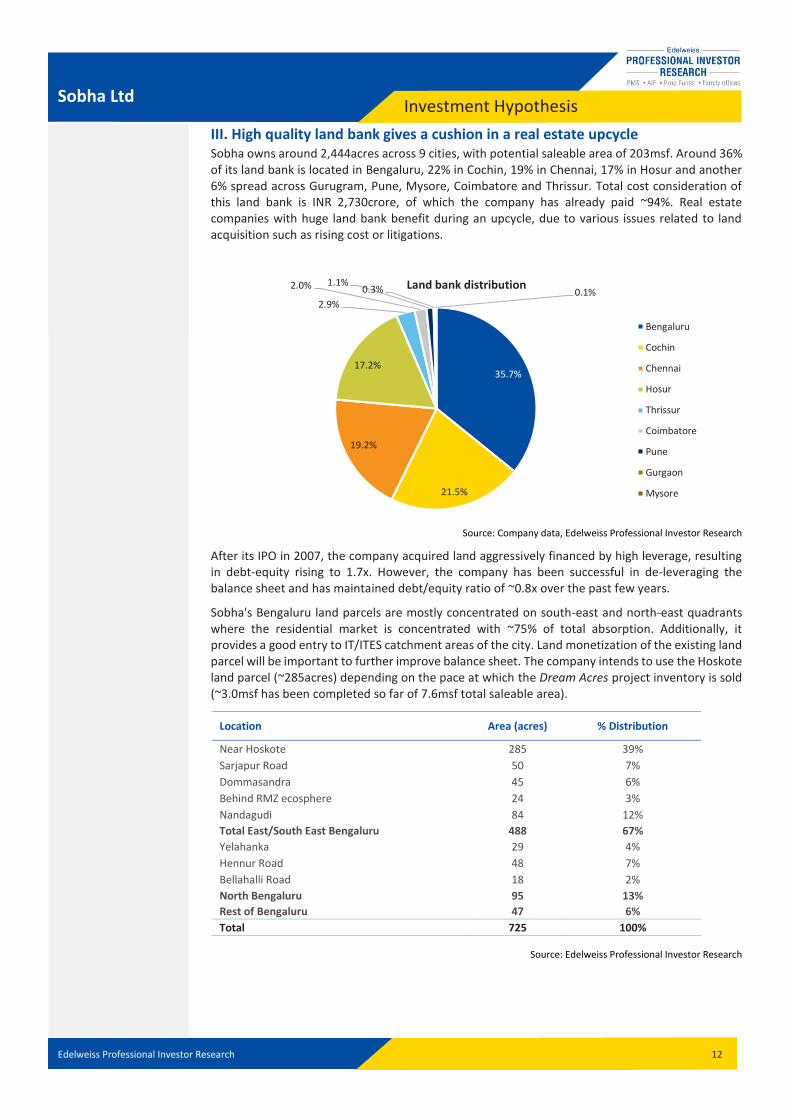
III. High quality land bank gives a cushion in a real estate upcycle Sobha owns around 2,444acres across 9 cities, with potential saleable area of 203msf. Around 36% of its land bank is located in Bengaluru, 22% in Cochin, 19% in Chennai, 17% in Hosur and another 6% spread across Gurugram, Pune, Mysore, Coimbatore and Thrissur. Total cost consideration of this land bank is INR 2,730crore, of which the company has already paid ~94%. Real estate companies with huge land bank benefit during an upcycle, due to various issues related to land acquisition such as rising cost or litigations.
Source: Company data, Edelweiss Professional Investor Research
After its IPO in 2007, the company acquired land aggressively financed by high leverage, resulting in debt-equity rising to 1.7x. However, the company has been successful in de-leveraging the balance sheet and has maintained debt/equity ratio of ~0.8x over the past few years.
Sobha's Bengaluru land parcels are mostly concentrated on south-east and north-east quadrants where the residential market is concentrated with ~75% of total absorption. Additionally, it provides a good entry to IT/ITES catchment areas of the city. Land monetization of the existing land parcel will be important to further improve balance sheet. The company intends to use the Hoskote land parcel (~285acres) depending on the pace at which the Dream Acres project inventory is sold (~3.0msf has been completed so far of 7.6msf total saleable area).
Source: Edelweiss Professional Investor Research
35.7%
21.5%
19.2%
17.2%
2.9%
2.0% 1.1%0.3% 0.1%
Land bank distribution
Bengaluru
Cochin
Chennai
Hosur
Thrissur
Coimbatore
Pune
Gurgaon
Mysore
Location Area (acres) % Distribution
Near Hoskote 285 39%
Sarjapur Road 50 7%
Dommasandra 45 6%
Behind RMZ ecosphere 24 3%
Nandagudi 84 12%
Total East/South East Bengaluru 488 67%
Yelahanka 29 4%
Hennur Road 48 7%
Bellahalli Road 18 2%
North Bengaluru 95 13%
Rest of Bengaluru 47 6%
Total 725 100%
Edelweiss Professional Investor Research 13
Investment Hypothesis Sobha Ltd
Key Risks Regional concentration: While Sobha is actively trying to diversify its regional exposure,
Bengaluru still accounts for ~50% of the ongoing projects portfolio. Weakness in this market
can dent the company’s prospects.
Macroeconomic factors: Demand in the real estate sector is correlated to economic activity
and a slowdown in the economy can hamper the ongoing recovery.
Interest rate risk: The real estate sector is interest rate sensitive and any delay in rate cuts or
rise in interest rates could negatively impact sales volume.
Regulatory risk: The company is executing a large number of real estate projects in new
geographies. Any delay in securing regulatory approvals could negatively impact project
delivery, which in turn will push up project costs and hit profitability.
Edelweiss Professional Investor Research
Outlook and Valuations Sobha Ltd
14
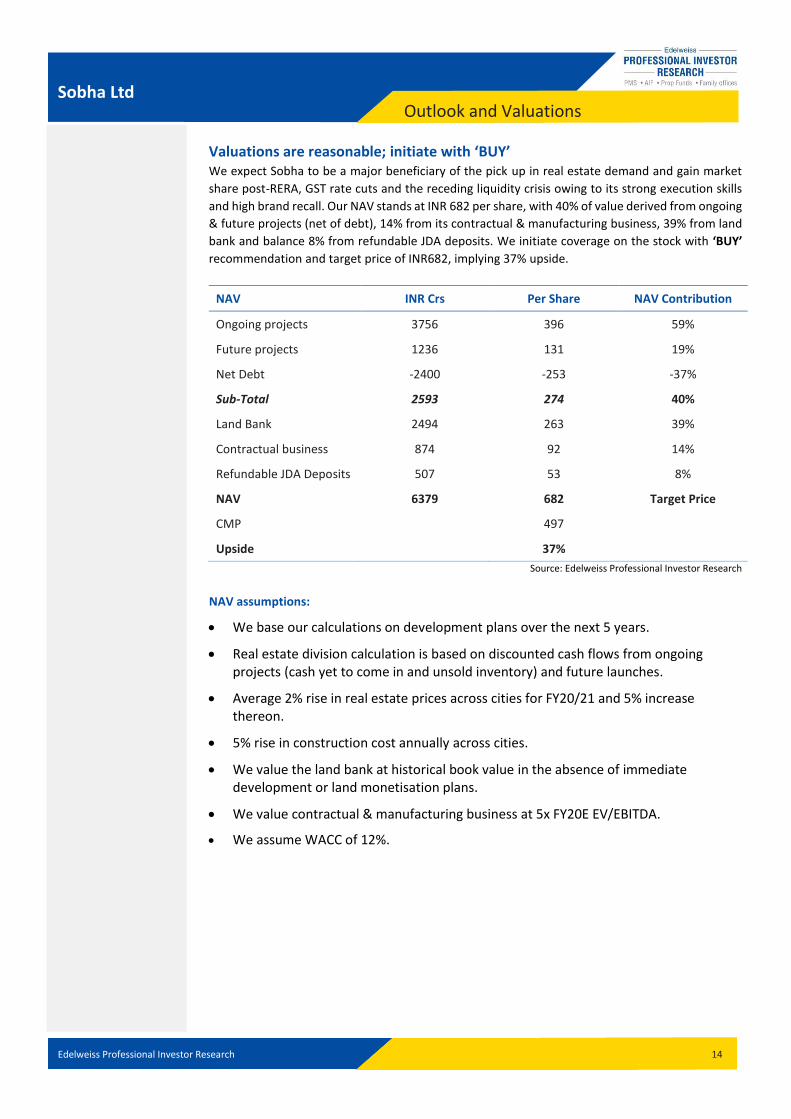
Valuations are reasonable; initiate with ‘BUY’ We expect Sobha to be a major beneficiary of the pick up in real estate demand and gain market
share post-RERA, GST rate cuts and the receding liquidity crisis owing to its strong execution skills
and high brand recall. Our NAV stands at INR 682 per share, with 40% of value derived from ongoing
& future projects (net of debt), 14% from its contractual & manufacturing business, 39% from land
bank and balance 8% from refundable JDA deposits. We initiate coverage on the stock with ‘BUY’
recommendation and target price of INR682, implying 37% upside.
NAV INR Crs Per Share NAV Contribution
Ongoing projects 3756 396 59%
Future projects 1236 131 19%
Net Debt -2400 -253 -37%
Sub-Total 2593 274 40%
Land Bank 2494 263 39%
Contractual business 874 92 14%
Refundable JDA Deposits 507 53 8%
NAV 6379 682 Target Price
CMP 497
Upside 37%
Source: Edelweiss Professional Investor Research
NAV assumptions:
We base our calculations on development plans over the next 5 years.
Real estate division calculation is based on discounted cash flows from ongoing projects (cash yet to come in and unsold inventory) and future launches.
Average 2% rise in real estate prices across cities for FY20/21 and 5% increase thereon.
5% rise in construction cost annually across cities.
We value the land bank at historical book value in the absence of immediate development or land monetisation plans.
We value contractual & manufacturing business at 5x FY20E EV/EBITDA.
We assume WACC of 12%.

Edelweiss Professional Investor Research
Peer Comparison Sobha Ltd
15
Source: Edelweiss Professional Investor Research
Source: Edelweiss Professional Investor Research
Source: Edelweiss Professional Investor Research
0.0
0.5
1.0
1.5
2.0
2.5
3.0
1Q17 2Q17 3Q17 4Q17 1Q18 2Q18 3Q18 4Q18 1Q19 2Q19 3Q19
Quarterly Sales Trend - Volume terms (in msf)
Sobha Ltd Brigade Enterprises Prestige Estates Godrej Properties Oberoi Realty
0
200
400
600
800
1000
1200
1400
1600
1800
1Q17 2Q17 3Q17 4Q17 1Q18 2Q18 3Q18 4Q18 1Q19 2Q19 3Q19
Quarterly Sales Trend - Value terms (INR cr)
Sobha Ltd Brigade Enterprises Prestige Estates Godrej Properties Oberoi Realty
0
5000
10000
15000
20000
25000
30000
35000
1Q17 2Q17 3Q17 4Q17 1Q18 2Q18 3Q18 4Q18 1Q19 2Q19 3Q19
Average Sales Realization (INR psf)
Sobha Ltd Brigade Enterprises Prestige Estates Godrej Properties Oberoi Realty
Edelweiss Professional Investor Research
Peer Comparison Sobha Ltd
16
Peer comparison - Valuations
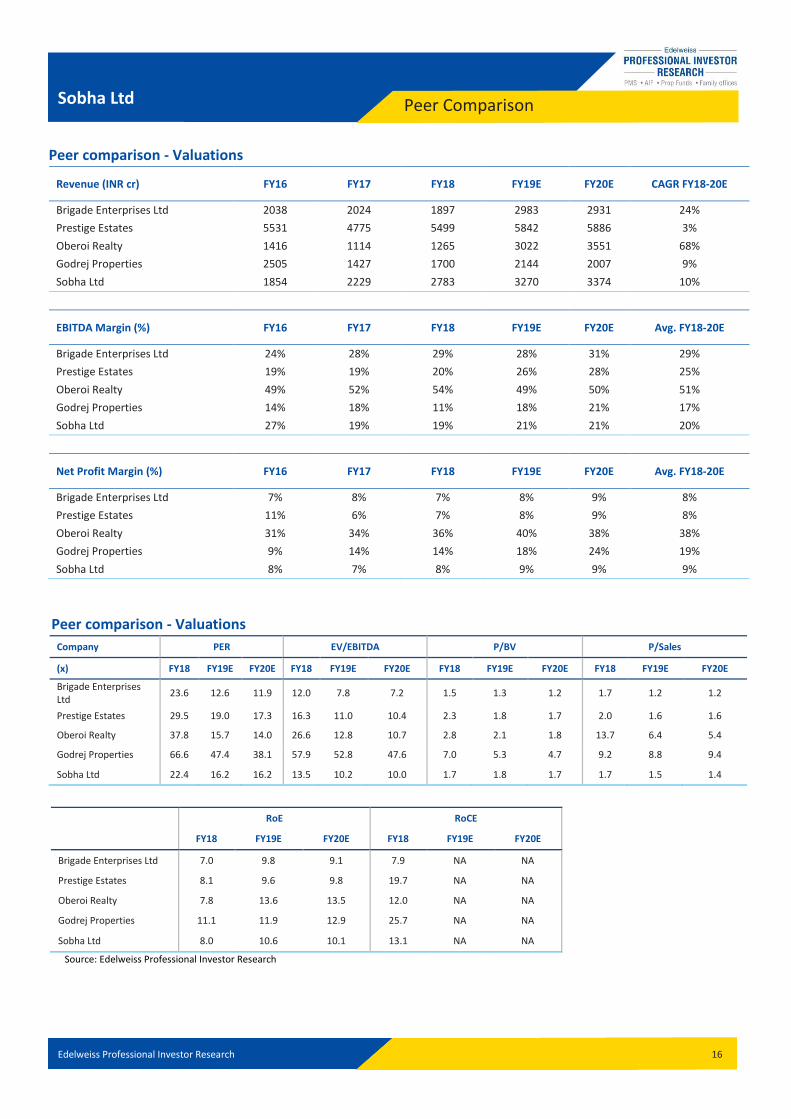
Revenue (INR cr) FY16 FY17 FY18 FY19E FY20E CAGR FY18-20E
Brigade Enterprises Ltd 2038 2024 1897 2983 2931 24%
Prestige Estates 5531 4775 5499 5842 5886 3%
Oberoi Realty 1416 1114 1265 3022 3551 68%
Godrej Properties 2505 1427 1700 2144 2007 9%
Sobha Ltd 1854 2229 2783 3270 3374 10%
EBITDA Margin (%) FY16 FY17 FY18 FY19E FY20E Avg. FY18-20E
Brigade Enterprises Ltd 24% 28% 29% 28% 31% 29%
Prestige Estates 19% 19% 20% 26% 28% 25%
Oberoi Realty 49% 52% 54% 49% 50% 51%
Godrej Properties 14% 18% 11% 18% 21% 17%
Sobha Ltd 27% 19% 19% 21% 21% 20%
Net Profit Margin (%) FY16 FY17 FY18 FY19E FY20E Avg. FY18-20E
Brigade Enterprises Ltd 7% 8% 7% 8% 9% 8%
Prestige Estates 11% 6% 7% 8% 9% 8%
Oberoi Realty 31% 34% 36% 40% 38% 38%
Godrej Properties 9% 14% 14% 18% 24% 19%
Sobha Ltd 8% 7% 8% 9% 9% 9%
Peer comparison - Valuations
Company PER EV/EBITDA P/BV P/Sales
(x) FY18 FY19E FY20E FY18 FY19E FY20E FY18 FY19E FY20E FY18 FY19E FY20E
Brigade Enterprises Ltd
23.6 12.6 11.9 12.0 7.8 7.2 1.5 1.3 1.2 1.7 1.2 1.2
Prestige Estates 29.5 19.0 17.3 16.3 11.0 10.4 2.3 1.8 1.7 2.0 1.6 1.6
Oberoi Realty 37.8 15.7 14.0 26.6 12.8 10.7 2.8 2.1 1.8 13.7 6.4 5.4
Godrej Properties 66.6 47.4 38.1 57.9 52.8 47.6 7.0 5.3 4.7 9.2 8.8 9.4
Sobha Ltd 22.4 16.2 16.2 13.5 10.2 10.0 1.7 1.8 1.7 1.7 1.5 1.4
RoE RoCE
FY18 FY19E FY20E FY18 FY19E FY20E
Brigade Enterprises Ltd 7.0 9.8 9.1 7.9 NA NA
Prestige Estates 8.1 9.6 9.8 19.7 NA NA
Oberoi Realty 7.8 13.6 13.5 12.0 NA NA
Godrej Properties 11.1 11.9 12.9 25.7 NA NA
Sobha Ltd 8.0 10.6 10.1 13.1 NA NA
Source: Edelweiss Professional Investor Research
Edelweiss Professional Investor Research 17
Case Scenarios Sobha Ltd
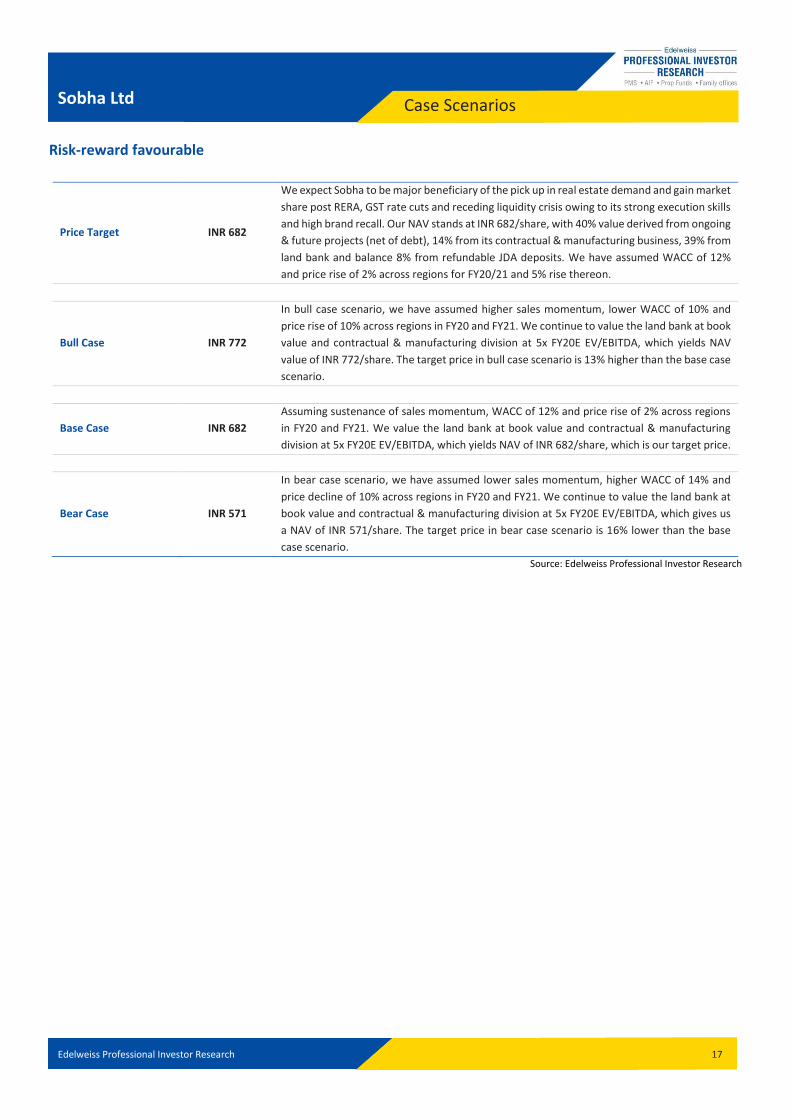
Risk-reward favourable
Price Target INR 682
We expect Sobha to be major beneficiary of the pick up in real estate demand and gain market
share post RERA, GST rate cuts and receding liquidity crisis owing to its strong execution skills
and high brand recall. Our NAV stands at INR 682/share, with 40% value derived from ongoing
& future projects (net of debt), 14% from its contractual & manufacturing business, 39% from
land bank and balance 8% from refundable JDA deposits. We have assumed WACC of 12%
and price rise of 2% across regions for FY20/21 and 5% rise thereon.
Bull Case INR 772
In bull case scenario, we have assumed higher sales momentum, lower WACC of 10% and
price rise of 10% across regions in FY20 and FY21. We continue to value the land bank at book
value and contractual & manufacturing division at 5x FY20E EV/EBITDA, which yields NAV
value of INR 772/share. The target price in bull case scenario is 13% higher than the base case
scenario.
Base Case INR 682
Assuming sustenance of sales momentum, WACC of 12% and price rise of 2% across regions
in FY20 and FY21. We value the land bank at book value and contractual & manufacturing
division at 5x FY20E EV/EBITDA, which yields NAV of INR 682/share, which is our target price.
Bear Case INR 571
In bear case scenario, we have assumed lower sales momentum, higher WACC of 14% and
price decline of 10% across regions in FY20 and FY21. We continue to value the land bank at
book value and contractual & manufacturing division at 5x FY20E EV/EBITDA, which gives us
a NAV of INR 571/share. The target price in bear case scenario is 16% lower than the base
case scenario.
Source: Edelweiss Professional Investor Research
Edelweiss Professional Investor Research
Business Model Sobha Ltd
18
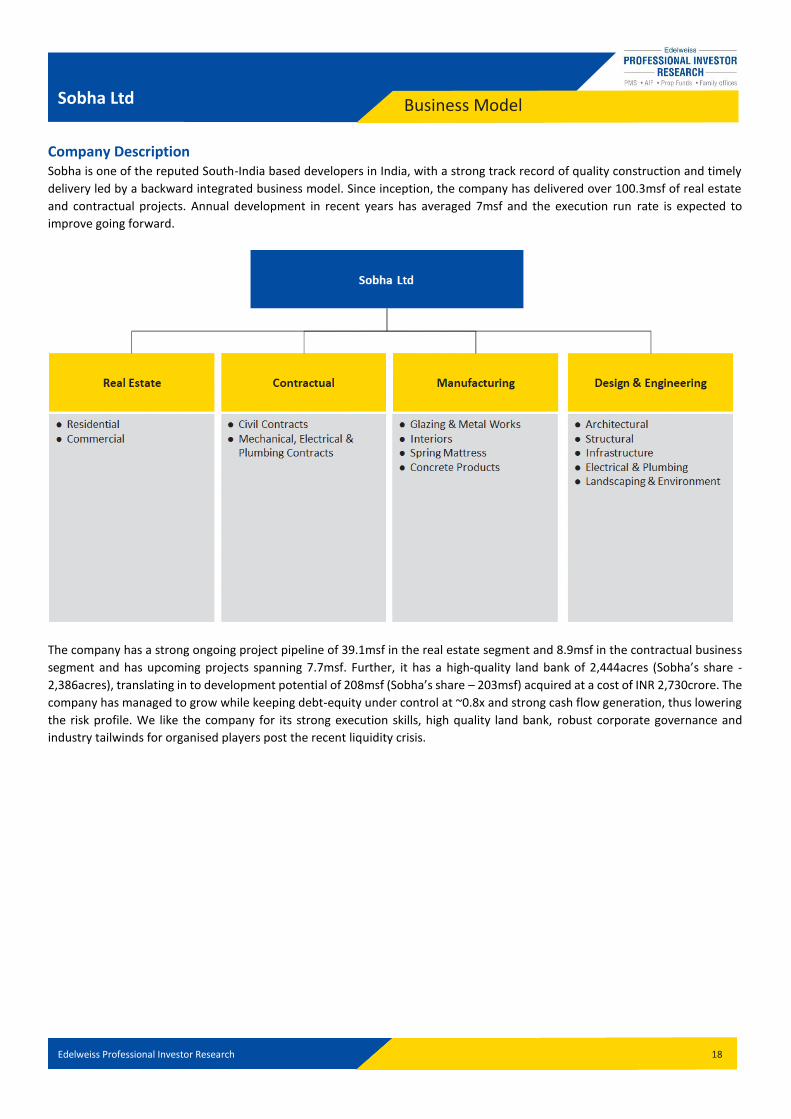
Company Description Sobha is one of the reputed South-India based developers in India, with a strong track record of quality construction and timely
delivery led by a backward integrated business model. Since inception, the company has delivered over 100.3msf of real estate
and contractual projects. Annual development in recent years has averaged 7msf and the execution run rate is expected to
improve going forward.
The company has a strong ongoing project pipeline of 39.1msf in the real estate segment and 8.9msf in the contractual business
segment and has upcoming projects spanning 7.7msf. Further, it has a high-quality land bank of 2,444acres (Sobha’s share -
2,386acres), translating in to development potential of 208msf (Sobha’s share – 203msf) acquired at a cost of INR 2,730crore. The
company has managed to grow while keeping debt-equity under control at ~0.8x and strong cash flow generation, thus lowering
the risk profile. We like the company for its strong execution skills, high quality land bank, robust corporate governance and
industry tailwinds for organised players post the recent liquidity crisis.
Edelweiss Professional Investor Research
Business Model Sobha Ltd
19
Business Model
Sobha is purely in to residential development with primary focus on the Bengaluru market. The company has a unique backward integrated model with presence of key competencies and in-house resources to deliver a project from conceptualization to completion. Backward integration includes an architectural and design studio for a team of qualified architects, concrete block making plant, metal & glazing factory, interiors & wood working factory, mechanical, electrical & plumbing division, and project implementation team. Backward integration ensures projects meet high quality standards and delivered in a timely manner. Unlike some of its peers, which have developed a rental portfolio or ventured in to the hospitality business, Sobha has continued to focus solely on development projects.
Strategic Positioning
Sobha’s backward integrated model has helped deliver projects in timely manner, maintain high quality and command a premium over peers. The company is now actively diversifying operations to regions other than Bengaluru to reduce regional concentration. Also, management maintains that it will continue to focus on core operation i.e., residential development, and not venture in rental/hospitality segment in the near term.
Competitive Edge The only backward integrated player in India with clear focus on residential development has helped Sobha build a strong brand. Huge land bank purchased at legacy prices gives an advantage in a real estate upcycle.
Financial Structure The company has managed to maintain healthy balance sheet with debt/equity of 0.8x despite tough times in the sector over the past few years and is expected to dip further to 0.6x by FY21E. Also, land monetization will be key monitorable for any further deleveraging.
Key Competitors Brigade Enterprises, Prestige Estates, Godrej Properties, Puravankara, etc.
Industry Revenue Drivers Policy announcements by the government in the recent Budget, GST rate cuts, economic recovery, healthy job growth environment and low interest rate to boost real estate demand.
Shareholder Value Proposition
We initiate coverage on the stock with ‘BUY’ and target price of INR 682, implying 37% upside. We believe the company is the best play on real estate recovery across regions, robust demand in Bengaluru and a key beneficiary of sector consolidation after RERA and the recent liquidity crisis.
Edelweiss Professional Investor Research
Business Model Sobha Ltd
20
Source: Edelweiss Professional Investor Research
64%16%
20%
FY10 - Division Contribution
Real Estate
Contracting
Manufacturing
67%
23%
10%
FY15 - Division Contribution
Real Estate
Contracting
Manufacturing72%
16%
12%
FY18 - Division Contribution
Real Estate
Contracting
Manufacturing
Edelweiss Professional Investor Research 21
Porters 5 Forces Analysis Sobha Ltd
Threat of new Entrants - Low
High initial Investment
A developer's track record matters making new entry difficult
High cost of land and land use restrictions act as natural barriers
Stringent RERA regulations will limit the number of entrants in the market
Threat of substitution - Low
No specific substitutes
Substitute could be government provided housing, mostly catering to economically weaker classes
Bargaining power of buyers - High
Too many players in the market and extremely fragmented market give customers many options to choose from
RERA gives more power to customers, making it a buyer's market
High level of unsold inventory results in reduced pricing power of developers
Bargaining power of suppliers - Low
A large number of suppliers in the market
Lower switching cost
Large real estate players have good bargaining power
Industry Rivalry - High
A large number of real estate players operating in India and high supply of
inventory limit sellers' ability to influence product prices
Edelweiss Professional Investor Research
Management Profile Sobha Ltd
22
Name Designation Profile
Mr. P.N.C. Menon Chairman Emeritus
Mr. P.N.C. Menon is the founder of Sobha Group of companies. A first generation entrepreneur, Mr. Menon began his professional career by setting up an interior decoration firm in the Sultanate of Oman in 1976. He has since incorporated several companies in the Sultanate of Oman, United Arab Emirates and Qatar, and also expanded in construction and real estate development. He founded Sobha Developers in Bengaluru in 1995.
Mr. Ravi Menon Chairman
As part of the succession plan in June 2012, Mr. Ravi Menon was appointed as the Chairman of Sobha. Soon after his graduation in Civil Engineering with distinction from Purdue University, US, he joined the company in 2004. Subsequent to joining the organization, he has handled Project Execution, Quality, Technology, Process & IT, Customer Relationship Management, Engineering & Design and many other facets of the business. He played a key role in the successful integration of pre-cast technology in construction methodology.
Mr. J.C. Sharma Vice Chairman & Managing Director
Mr. J.C. Sharma has a bachelor’s degree in Commerce (Hons.) from Xavier College, Calcutta. He is a qualified chartered accountant and company secretary with over 25 years of experience in diversified industries such as automobiles, textiles, steel and real estate in the areas of finance and management. He has previously served as General Manager, Auto Distributors; General Manager - Finance, Bhoruka Steels; and General Manager- Commerce and Finance, Grasim Industries. Mr. Sharma has been associated with Sobha since June 2001 and is entrusted with the responsibility of managing the overall affairs of the company, especially finances, land acquisition and legal functions.
Dr. S.K. Gupta Independent Director
Dr. S.K. Gupta is an Independent Director. He is a Metallurgical Engineer with a Ph.D. (Tech.) and D.Sc. (Tech.) from Moscow. He has over 59 years of experience in metallurgy, engineering and management in the steel and allied domain. He has been associated with several reputed organisations such as Jindal Saw, JSW Steel, Rourkela Steel Plant/Steel Authority of India and Mishra Dhatu Nigam (Ministry of Defence), Metallurgical and Engineering Consultants (Mecon) in varied capacities.
Dr. Punita Kumar - Sinha Independent Director
Dr. Punita Kumar-Sinha is an Independent Director of the company. She has a career spanning over 28 years focused on investment management. She is the founder of Pacific Paradigm Advisors (PPA), an independent investment advisory and management firm focused on Asia. She is also a Senior Advisor and serves as an Independent Director on boards of public and private companies in India. Prior to PPA, she was a Senior Managing Director at the Blackstone Group, leading Blackstone Asia Advisors and serving as the CIO for The India Fund (the largest India Fund in the US for almost 15 years), The Asia Tigers Fund and The Asia Opportunities Fund.
Mr. R V S Rao Independent Director
Mr. R.V.S. Rao is an Independent Director of the company. He holds a bachelor’s degree in Commerce from the University of Mysore and a bachelor’s degree in law from Bengaluru University. He is a fellow member of the Indian Institute of Banking and Finance. Mr. Rao has over 46 years of experience in banking and finance. He has served on the board of the Housing Development Finance Corporation. As a United States Agency for International Development (USAID) Consultant, he was the team leader that reviewed operations and made recommendations for the Housing Finance Company, Ghana, Africa.
Mr. Anup Shah Independent Director
Mr. Anup Shah is an Independent Director of the company. He has a bachelor’s degree in commerce from HR College, Mumbai, and a degree in law from Government Law College, Mumbai. He has over 34 years of experience in the field of law, specifically real estate law. Since founding his own firm in 1993, he has advised developers, builders and foreign and domestic investors in structuring real estate transactions, leases, development agreements and joint ventures.
Edelweiss Professional Investor Research 23
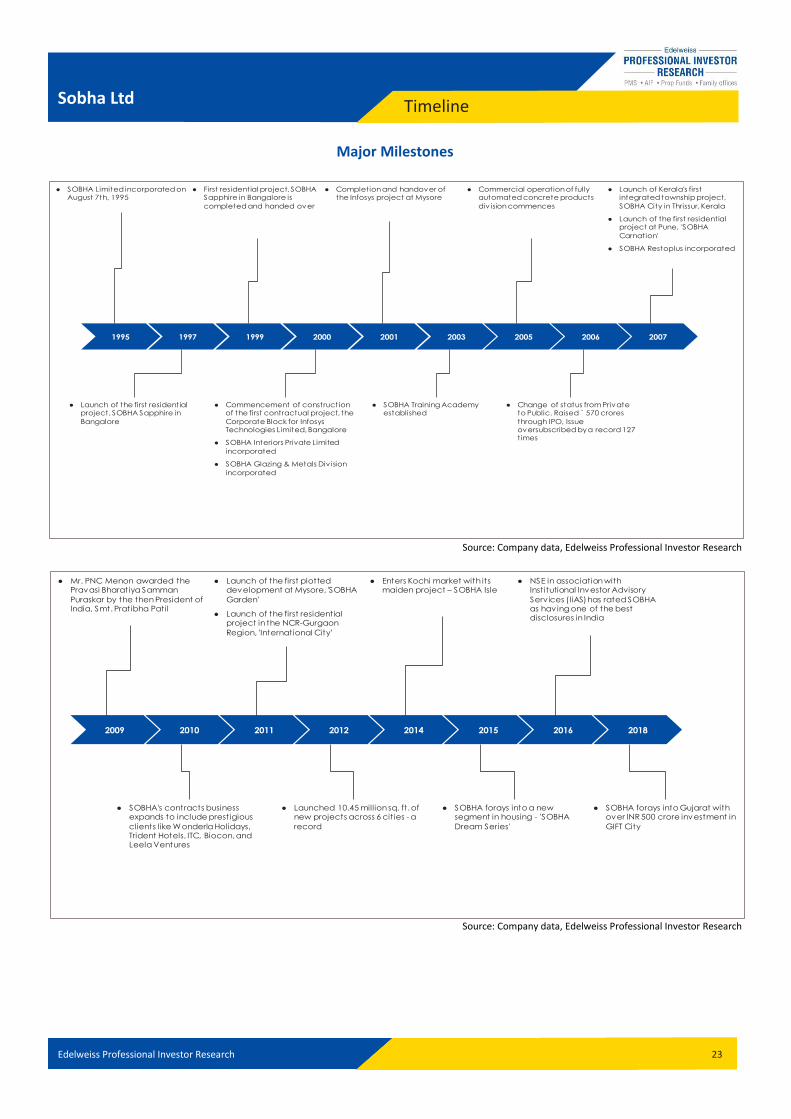
Timeline Sobha Ltd
Major Milestones
Source: Company data, Edelweiss Professional Investor Research
Source: Company data, Edelweiss Professional Investor Research
1995 1997 1999 2000 2001 2003 2005 2006 2007
● SOBHA Limited incorporated on August 7th, 1995
● Launch of the first residential project, SOBHA Sapphire in
Bangalore
● First residential project, SOBHA Sapphire in Bangalore is
completed and handed over
● Commencement of construction of the first contractual project, the
Corporate Block for Infosys Technologies Limited, Bangalore
● SOBHA Interiors Private Limited
incorporated
● SOBHA Glazing & Metals Div ision
incorporated
● Completion and handover of the Infosys project at Mysore
● SOBHA Training Academy established
● Commercial operation of fully automated concrete products
div ision commences
● Change of status from Private to Public. Raised ` 570 crores
through IPO, Issue oversubscribed by a record 127 times
● Launch of Kerala's first integrated township project,
SOBHA City in Thrissur, Kerala
● Launch of the first residential project at Pune, 'SOBHA
Carnation'
● SOBHA Restoplus incorporated
2009 2010 2011 2012 2014 2015 2016 2018
● Mr. PNC Menon awarded the Pravasi Bharatiya Samman
Puraskar by the then President of India, Smt. Pratibha Patil
● SOBHA's contracts business expands to include prestigious
clients like Wonderla Holidays, Trident Hotels, ITC, Biocon, and Leela Ventures
● Launch of the first plotted development at Mysore, 'SOBHA
Garden'
● Launch of the first residential project in the NCR-Gurgaon
Region, 'International City’
● Launched 10.45 million sq. ft. of new projects across 6 cities - a
record
● Enters Kochi market with its maiden project – SOBHA Isle
● SOBHA forays into a new segment in housing - 'SOBHA
Dream Series'
● NSE in association with Institutional Investor Advisory
Serv ices (IiAS) has rated SOBHA as having one of the best disclosures in India
● SOBHA forays into Gujarat with over INR 500 crore investment in
GIFT City
Edelweiss Professional Investor Research 24
Financial Analysis Sobha Ltd
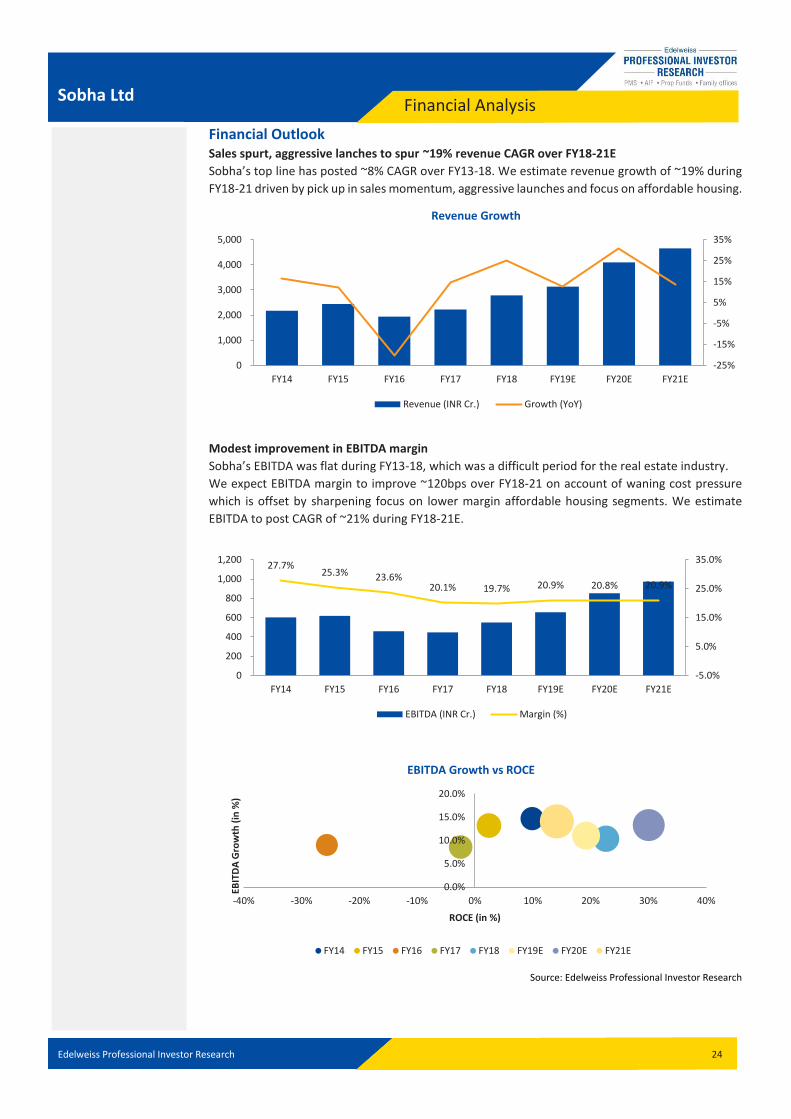
Financial Outlook Sales spurt, aggressive lanches to spur ~19% revenue CAGR over FY18-21E
Sobha’s top line has posted ~8% CAGR over FY13-18. We estimate revenue growth of ~19% during
FY18-21 driven by pick up in sales momentum, aggressive launches and focus on affordable housing.
Modest improvement in EBITDA margin
Sobha’s EBITDA was flat during FY13-18, which was a difficult period for the real estate industry.
We expect EBITDA margin to improve ~120bps over FY18-21 on account of waning cost pressure
which is offset by sharpening focus on lower margin affordable housing segments. We estimate
EBITDA to post CAGR of ~21% during FY18-21E.
Source: Edelweiss Professional Investor Research
-25%
-15%
-5%
5%
15%
25%
35%
0
1,000
2,000
3,000
4,000
5,000
FY14 FY15 FY16 FY17 FY18 FY19E FY20E FY21E
Revenue Growth
Revenue (INR Cr.) Growth (YoY)
27.7%25.3% 23.6%
20.1% 19.7% 20.9% 20.8% 20.9%
-5.0%
5.0%
15.0%
25.0%
35.0%
0
200
400
600
800
1,000
1,200
FY14 FY15 FY16 FY17 FY18 FY19E FY20E FY21E
EBITDA (INR Cr.) Margin (%)
0.0%
5.0%
10.0%
15.0%
20.0%
-40% -30% -20% -10% 0% 10% 20% 30% 40%
EBIT
DA
Gro
wth
(in
%)
ROCE (in %)
EBITDA Growth vs ROCE
FY14 FY15 FY16 FY17 FY18 FY19E FY20E FY21E

Edelweiss Professional Investor Research 25
Financial Analysis Sobha Ltd
PAT to post 23% CAGR over FY18-21
The company’s PAT growth was flat during the FY13-18. However, with robust top-line growth
underpinned by strong sales momentum and marginal EBITDA margin expansion, we estimate PAT
to post 23% CAGR over FY18-21.
Debt to dip going forward
Management’s focus on generating cash flows has bolstered Sobha’s growth, maintaining its
gearing ratio at around 0.8x since FY16, well below the industry average of ~1.3x. Sobha’s net
operational cash flow, after financial outflow, has catapulted from INR10cr in FY15 to INR375cr in
FY18. We estimate the company’s debt/equity to improve to 0.7x by FY21E.
Net Cash Flow after Financial Outflow
Source: Edelweiss Professional Investor Research
8.2%1.2%
-42.0%
16.5%
34.9%
14.4%
38.9%
16.7%
-50.0%
-30.0%
-10.0%
10.0%
30.0%
50.0%
0
50
100
150
200
250
300
350
400
450
FY14 FY15 FY16 FY17 FY18 FY19E FY20E FY21E
PAT (INR Cr.) Growth (YoY)
0.0
0.2
0.4
0.6
0.8
1.0
0
500
1000
1500
2000
2500
3000
FY13 FY14 FY15 FY16 FY17 FY18 FY19E FY20E FY21E
Debt/Equity
Borrowings (INR Cr.) Debt/Equity (x)
199.6
367.3
10.2
155.3
299.8
374.6
FY13 FY14 FY15 FY16 FY17 FY18
(IN
R c
r)
Edelweiss Professional Investor Research 26
Financial Analysis Sobha Ltd
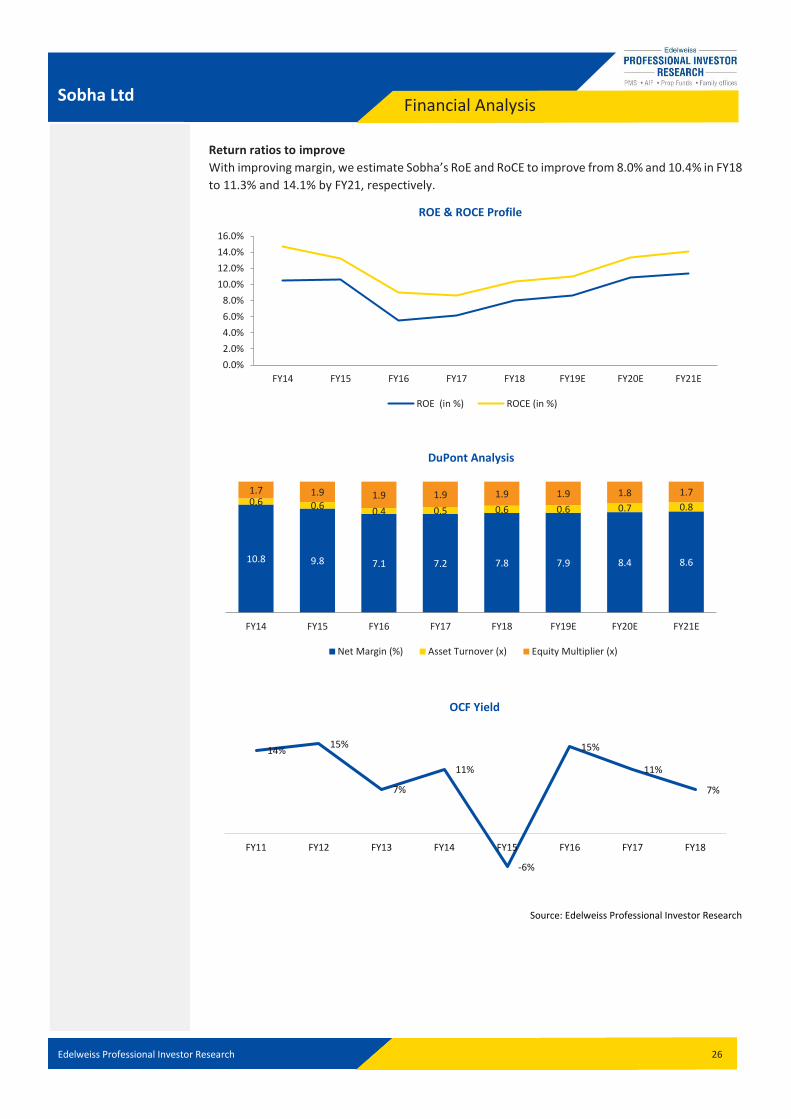
Return ratios to improve
With improving margin, we estimate Sobha’s RoE and RoCE to improve from 8.0% and 10.4% in FY18
to 11.3% and 14.1% by FY21, respectively.
Source: Edelweiss Professional Investor Research
0.0%
2.0%
4.0%
6.0%
8.0%
10.0%
12.0%
14.0%
16.0%
FY14 FY15 FY16 FY17 FY18 FY19E FY20E FY21E
ROE & ROCE Profile
ROE (in %) ROCE (in %)
10.8 9.8 7.1 7.2 7.8 7.9 8.4 8.6
0.6 0.60.4 0.5 0.6 0.6 0.7 0.8
1.7 1.9 1.9 1.9 1.9 1.9 1.8 1.7
FY14 FY15 FY16 FY17 FY18 FY19E FY20E FY21E
DuPont Analysis
Net Margin (%) Asset Turnover (x) Equity Multiplier (x)
14%15%
7%
11%
-6%
15%
11%
7%
FY11 FY12 FY13 FY14 FY15 FY16 FY17 FY18
OCF Yield
Edelweiss Professional Investor Research 27
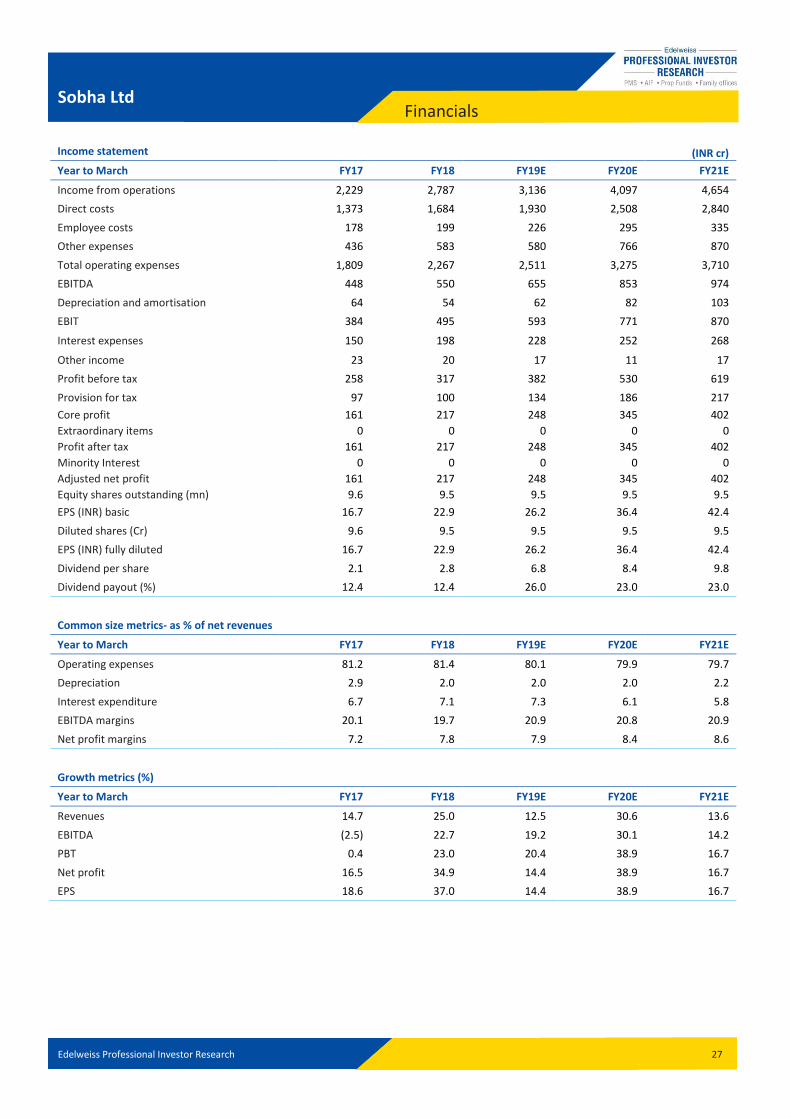
Financials Sobha Ltd
Income statement (INR cr)
Year to March FY17 FY18 FY19E FY20E FY21E
Income from operations 2,229 2,787 3,136 4,097 4,654
Direct costs 1,373 1,684 1,930 2,508 2,840
Employee costs 178 199 226 295 335
Other expenses 436 583 580 766 870
Total operating expenses 1,809 2,267 2,511 3,275 3,710
EBITDA 448 550 655 853 974
Depreciation and amortisation 64 54 62 82 103
EBIT 384 495 593 771 870
Interest expenses 150 198 228 252 268
Other income 23 20 17 11 17
Profit before tax 258 317 382 530 619
Provision for tax 97 100 134 186 217
Core profit 161 217 248 345 402
Extraordinary items 0 0 0 0 0
Profit after tax 161 217 248 345 402
Minority Interest 0 0 0 0 0
Adjusted net profit 161 217 248 345 402
Equity shares outstanding (mn) 9.6 9.5 9.5 9.5 9.5
EPS (INR) basic 16.7 22.9 26.2 36.4 42.4
Diluted shares (Cr) 9.6 9.5 9.5 9.5 9.5
EPS (INR) fully diluted 16.7 22.9 26.2 36.4 42.4
Dividend per share 2.1 2.8 6.8 8.4 9.8
Dividend payout (%) 12.4 12.4 26.0 23.0 23.0
Common size metrics- as % of net revenues
Year to March FY17 FY18 FY19E FY20E FY21E
Operating expenses 81.2 81.4 80.1 79.9 79.7
Depreciation 2.9 2.0 2.0 2.0 2.2
Interest expenditure 6.7 7.1 7.3 6.1 5.8
EBITDA margins 20.1 19.7 20.9 20.8 20.9
Net profit margins 7.2 7.8 7.9 8.4 8.6
Growth metrics (%)
Year to March FY17 FY18 FY19E FY20E FY21E
Revenues 14.7 25.0 12.5 30.6 13.6
EBITDA (2.5) 22.7 19.2 30.1 14.2
PBT 0.4 23.0 20.4 38.9 16.7
Net profit 16.5 34.9 14.4 38.9 16.7
EPS 18.6 37.0 14.4 38.9 16.7
Edelweiss Professional Investor Research 28
Financials Sobha Ltd
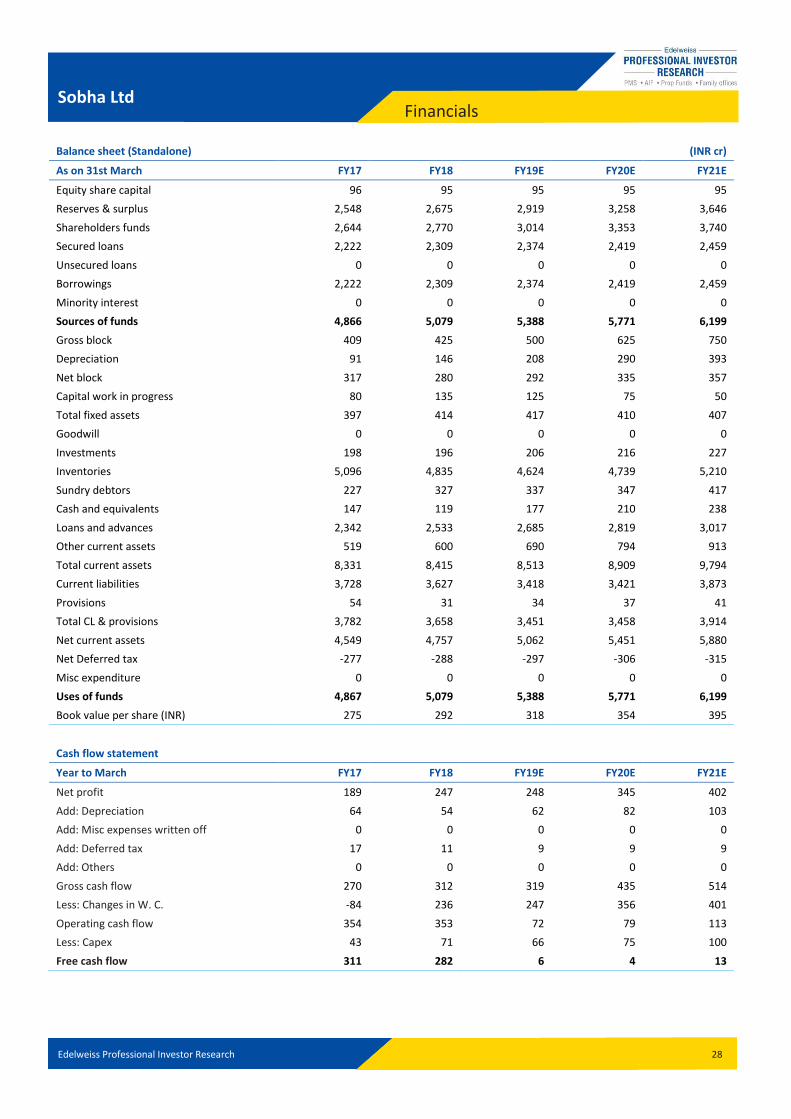
Balance sheet (Standalone) (INR cr)
As on 31st March FY17 FY18 FY19E FY20E FY21E
Equity share capital 96 95 95 95 95
Reserves & surplus 2,548 2,675 2,919 3,258 3,646
Shareholders funds 2,644 2,770 3,014 3,353 3,740
Secured loans 2,222 2,309 2,374 2,419 2,459
Unsecured loans 0 0 0 0 0
Borrowings 2,222 2,309 2,374 2,419 2,459
Minority interest 0 0 0 0 0
Sources of funds 4,866 5,079 5,388 5,771 6,199
Gross block 409 425 500 625 750
Depreciation 91 146 208 290 393
Net block 317 280 292 335 357
Capital work in progress 80 135 125 75 50
Total fixed assets 397 414 417 410 407
Goodwill 0 0 0 0 0
Investments 198 196 206 216 227
Inventories 5,096 4,835 4,624 4,739 5,210
Sundry debtors 227 327 337 347 417
Cash and equivalents 147 119 177 210 238
Loans and advances 2,342 2,533 2,685 2,819 3,017
Other current assets 519 600 690 794 913
Total current assets 8,331 8,415 8,513 8,909 9,794
Current liabilities 3,728 3,627 3,418 3,421 3,873
Provisions 54 31 34 37 41
Total CL & provisions 3,782 3,658 3,451 3,458 3,914
Net current assets 4,549 4,757 5,062 5,451 5,880
Net Deferred tax -277 -288 -297 -306 -315
Misc expenditure 0 0 0 0 0
Uses of funds 4,867 5,079 5,388 5,771 6,199
Book value per share (INR) 275 292 318 354 395
-0 0 0 0 0
Cash flow statement
Year to March FY17 FY18 FY19E FY20E FY21E
Net profit 189 247 248 345 402
Add: Depreciation 64 54 62 82 103
Add: Misc expenses written off 0 0 0 0 0
Add: Deferred tax 17 11 9 9 9
Add: Others 0 0 0 0 0
Gross cash flow 270 312 319 435 514
Less: Changes in W. C. -84 236 247 356 401
Operating cash flow 354 353 72 79 113
Less: Capex 43 71 66 75 100
Free cash flow 311 282 6 4 13

Edelweiss Professional Investor Research 29
Financials Sobha Ltd
Ratios
Year to March FY17 FY18 FY19E FY20E FY21E
ROAE (%) 6.2 8.0 8.6 10.8 11.3
ROACE (%) 8.6 10.4 11.0 13.3 14.1
Debtors (days) 37 43 39 31 33
Current ratio 2.2 2.3 2.5 2.6 2.5
Debt/Equity 0.8 0.8 0.8 0.7 0.7
Inventory (days) 834 633 538 422 409
Payable (days) 126 94 86 68 62
Cash conversion cycle (days) 746 582 491 385 380
Debt/EBITDA 5.0 4.2 3.6 2.8 2.5
Adjusted debt/Equity 0.8 0.8 0.7 0.7 0.6
Valuation parameters
Year to March FY17 FY18 FY19E FY20E FY21E
Diluted EPS (INR) 16.7 22.9 26.2 36.4 42.4
Y-o-Y growth (%) 18.6 37.0 14.4 38.9 16.7
CEPS (INR) 23.3 28.6 32.8 45.0 53.3
Diluted P/E (x) 26.8 22.4 19.0 13.7 11.7
Price/BV(x) 1.6 1.8 1.6 1.4 1.3
EV/Sales (x) 2.9 2.5 2.2 1.7 1.5
EV/EBITDA (x) 14.3 12.8 10.5 8.1 7.1
Diluted shares O/S 9.6 9.5 9.5 9.5 9.5
Basic EPS 16.7 22.9 26.2 36.4 42.4
Basic PE (x) 26.8 22.4 19.0 13.7 11.7
Dividend yield (%) 0.4% 0.6% 1.3% 1.6% 1.9%
Edelweiss Professional Investor Research 30
Annexure Business Value Drivers
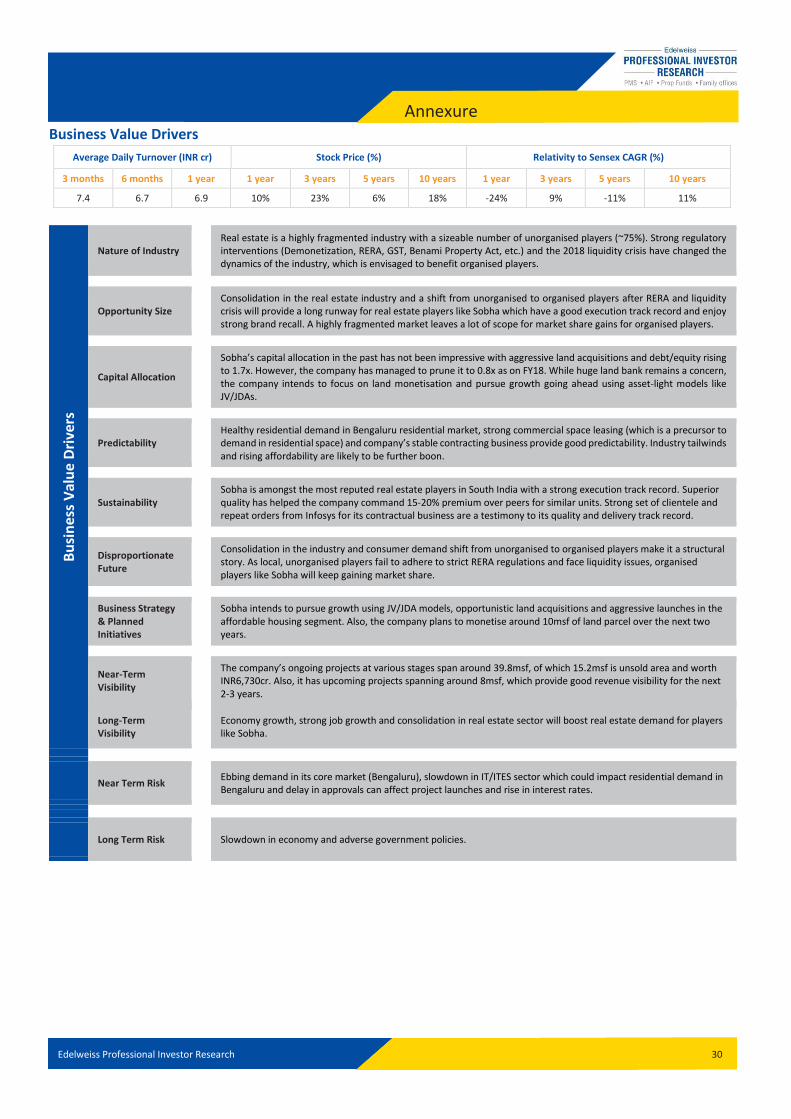
Average Daily Turnover (INR cr) Stock Price (%) Relativity to Sensex CAGR (%)
3 months 6 months 1 year 1 year 3 years 5 years 10 years 1 year 3 years 5 years 10 years
7.4 6.7 6.9 10% 23% 6% 18% -24% 9% -11% 11%
Bu
sin
ess
Val
ue
Dri
vers
Nature of Industry Real estate is a highly fragmented industry with a sizeable number of unorganised players (~75%). Strong regulatory interventions (Demonetization, RERA, GST, Benami Property Act, etc.) and the 2018 liquidity crisis have changed the dynamics of the industry, which is envisaged to benefit organised players.
Opportunity Size Consolidation in the real estate industry and a shift from unorganised to organised players after RERA and liquidity crisis will provide a long runway for real estate players like Sobha which have a good execution track record and enjoy strong brand recall. A highly fragmented market leaves a lot of scope for market share gains for organised players.
Capital Allocation
Sobha’s capital allocation in the past has not been impressive with aggressive land acquisitions and debt/equity rising to 1.7x. However, the company has managed to prune it to 0.8x as on FY18. While huge land bank remains a concern, the company intends to focus on land monetisation and pursue growth going ahead using asset-light models like JV/JDAs.
Predictability Healthy residential demand in Bengaluru residential market, strong commercial space leasing (which is a precursor to demand in residential space) and company’s stable contracting business provide good predictability. Industry tailwinds and rising affordability are likely to be further boon.
Sustainability Sobha is amongst the most reputed real estate players in South India with a strong execution track record. Superior quality has helped the company command 15-20% premium over peers for similar units. Strong set of clientele and repeat orders from Infosys for its contractual business are a testimony to its quality and delivery track record.
Disproportionate Future
Consolidation in the industry and consumer demand shift from unorganised to organised players make it a structural story. As local, unorganised players fail to adhere to strict RERA regulations and face liquidity issues, organised players like Sobha will keep gaining market share.
Business Strategy & Planned Initiatives
Sobha intends to pursue growth using JV/JDA models, opportunistic land acquisitions and aggressive launches in the affordable housing segment. Also, the company plans to monetise around 10msf of land parcel over the next two years.
Near-Term Visibility
The company’s ongoing projects at various stages span around 39.8msf, of which 15.2msf is unsold area and worth INR6,730cr. Also, it has upcoming projects spanning around 8msf, which provide good revenue visibility for the next 2-3 years.
Long-Term Visibility
Economy growth, strong job growth and consolidation in real estate sector will boost real estate demand for players like Sobha.
Near Term Risk Ebbing demand in its core market (Bengaluru), slowdown in IT/ITES sector which could impact residential demand in Bengaluru and delay in approvals can affect project launches and rise in interest rates.
Long Term Risk Slowdown in economy and adverse government policies.
Edelweiss Professional Investor Research 31
Annexure – Company Overview
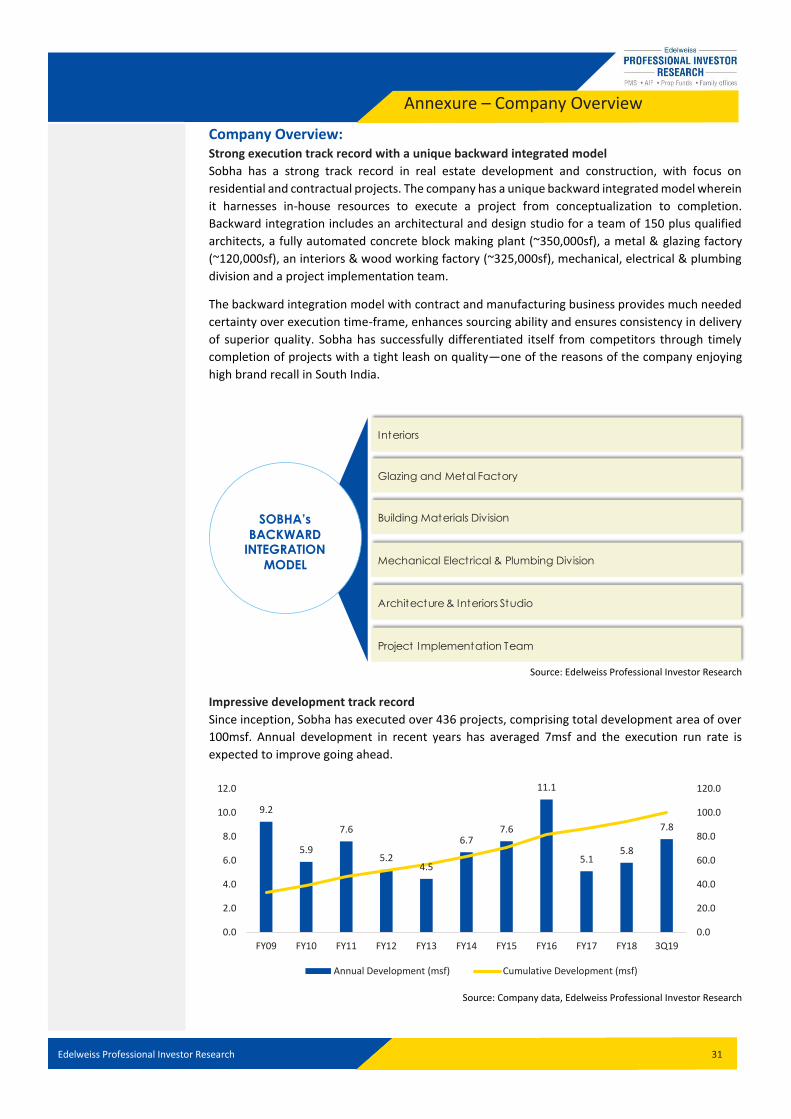
Company Overview: Strong execution track record with a unique backward integrated model
Sobha has a strong track record in real estate development and construction, with focus on
residential and contractual projects. The company has a unique backward integrated model wherein
it harnesses in-house resources to execute a project from conceptualization to completion.
Backward integration includes an architectural and design studio for a team of 150 plus qualified
architects, a fully automated concrete block making plant (~350,000sf), a metal & glazing factory
(~120,000sf), an interiors & wood working factory (~325,000sf), mechanical, electrical & plumbing
division and a project implementation team.
The backward integration model with contract and manufacturing business provides much needed
certainty over execution time-frame, enhances sourcing ability and ensures consistency in delivery
of superior quality. Sobha has successfully differentiated itself from competitors through timely
completion of projects with a tight leash on quality—one of the reasons of the company enjoying
high brand recall in South India.
Source: Edelweiss Professional Investor Research
Impressive development track record
Since inception, Sobha has executed over 436 projects, comprising total development area of over
100msf. Annual development in recent years has averaged 7msf and the execution run rate is
expected to improve going ahead.
Source: Company data, Edelweiss Professional Investor Research
Interiors
Glazing and Metal Factory
Building Materials Division
Mechanical Electrical & Plumbing Division
Architecture & Interiors Studio
Project Implementation Team
SOBHA’s
BACKWARD INTEGRATION
MODEL
9.2
5.9
7.6
5.24.5
6.77.6
11.1
5.15.8
7.8
0.0
20.0
40.0
60.0
80.0
100.0
120.0
0.0
2.0
4.0
6.0
8.0
10.0
12.0
FY09 FY10 FY11 FY12 FY13 FY14 FY15 FY16 FY17 FY18 3Q19
Annual Development (msf) Cumulative Development (msf)
Edelweiss Professional Investor Research 32
Annexure – Company Overview
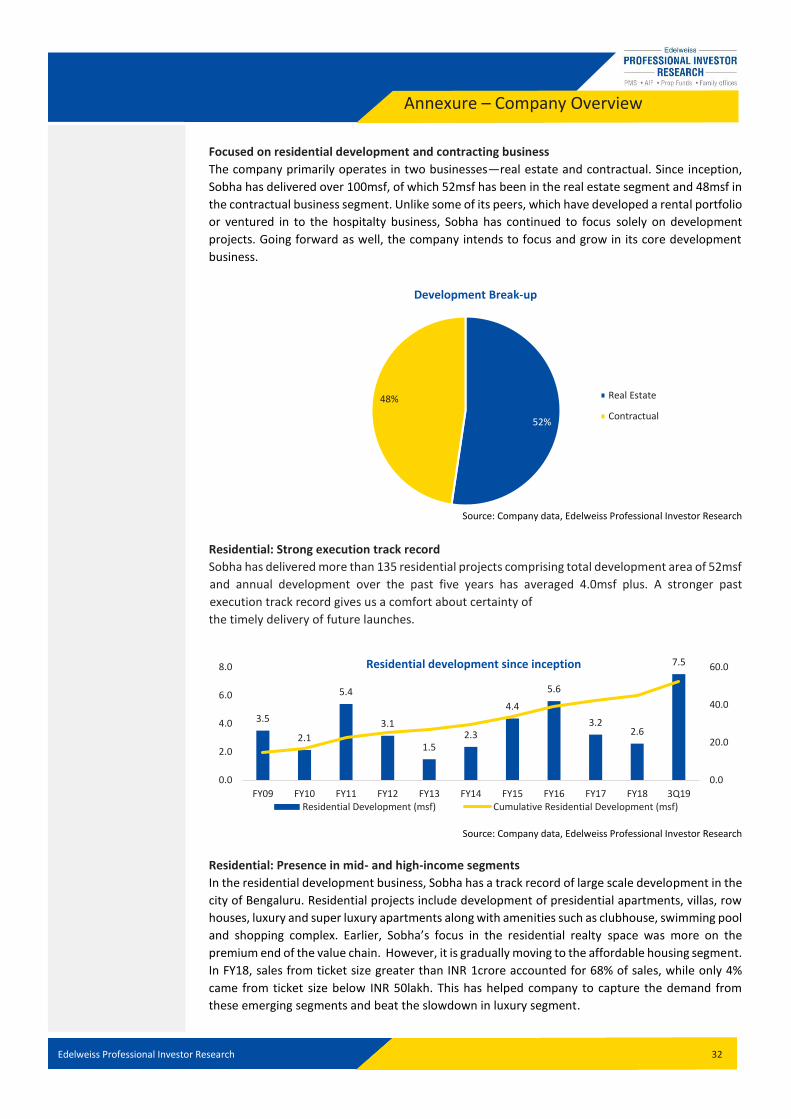
Focused on residential development and contracting business The company primarily operates in two businesses—real estate and contractual. Since inception,
Sobha has delivered over 100msf, of which 52msf has been in the real estate segment and 48msf in
the contractual business segment. Unlike some of its peers, which have developed a rental portfolio
or ventured in to the hospitalty business, Sobha has continued to focus solely on development
projects. Going forward as well, the company intends to focus and grow in its core development
business.
Source: Company data, Edelweiss Professional Investor Research
Residential: Strong execution track record
Sobha has delivered more than 135 residential projects comprising total development area of 52msf
and annual development over the past five years has averaged 4.0msf plus. A stronger past
execution track record gives us a comfort about certainty of
the timely delivery of future launches.
Source: Company data, Edelweiss Professional Investor Research
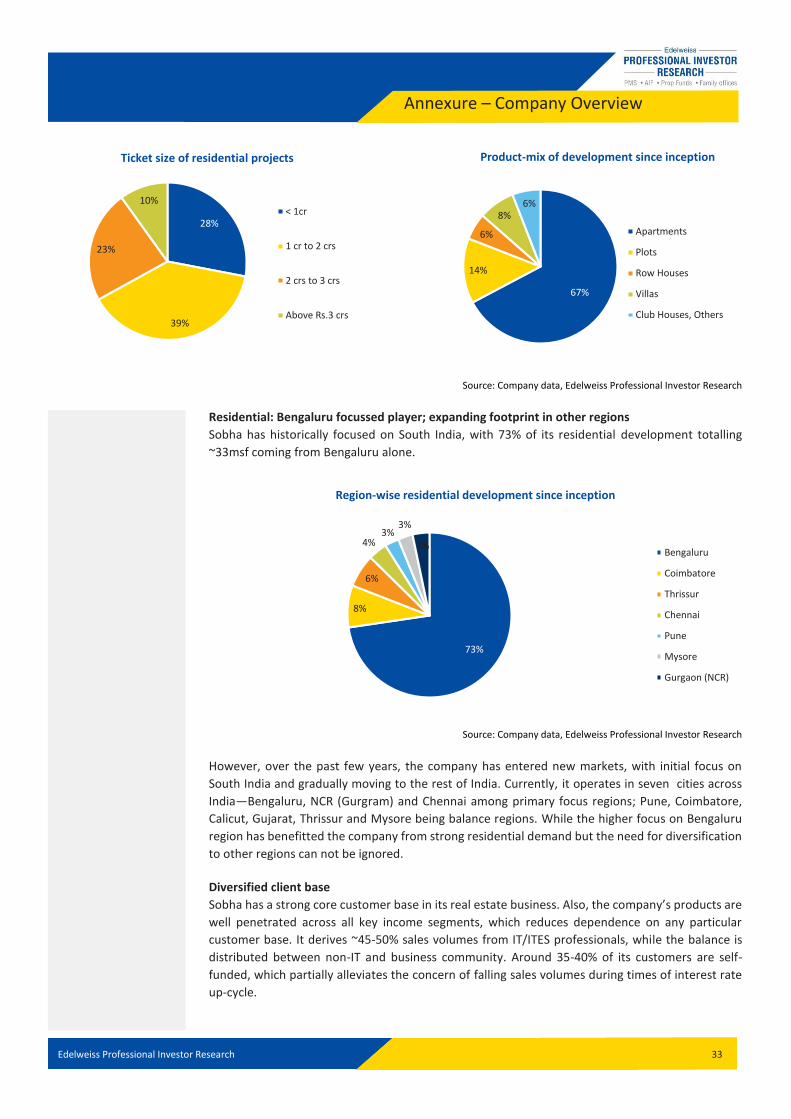
Residential: Presence in mid- and high-income segments
In the residential development business, Sobha has a track record of large scale development in the
city of Bengaluru. Residential projects include development of presidential apartments, villas, row
houses, luxury and super luxury apartments along with amenities such as clubhouse, swimming pool
and shopping complex. Earlier, Sobha’s focus in the residential realty space was more on the
premium end of the value chain. However, it is gradually moving to the affordable housing segment.
In FY18, sales from ticket size greater than INR 1crore accounted for 68% of sales, while only 4%
came from ticket size below INR 50lakh. This has helped company to capture the demand from
these emerging segments and beat the slowdown in luxury segment.
52%
48%
Development Break-up
Real Estate
Contractual
3.5
2.1
5.4
3.1
1.52.3
4.4
5.6
3.22.6
7.5
0.0
20.0
40.0
60.0
0.0
2.0
4.0
6.0
8.0
FY09 FY10 FY11 FY12 FY13 FY14 FY15 FY16 FY17 FY18 3Q19
Residential development since inception
Residential Development (msf) Cumulative Residential Development (msf)
Edelweiss Professional Investor Research 33
Annexure – Company Overview
Source: Company data, Edelweiss Professional Investor Research
Residential: Bengaluru focussed player; expanding footprint in other regions
Sobha has historically focused on South India, with 73% of its residential development totalling
~33msf coming from Bengaluru alone.
Source: Company data, Edelweiss Professional Investor Research
However, over the past few years, the company has entered new markets, with initial focus on
South India and gradually moving to the rest of India. Currently, it operates in seven cities across
India—Bengaluru, NCR (Gurgram) and Chennai among primary focus regions; Pune, Coimbatore,
Calicut, Gujarat, Thrissur and Mysore being balance regions. While the higher focus on Bengaluru
region has benefitted the company from strong residential demand but the need for diversification
to other regions can not be ignored.
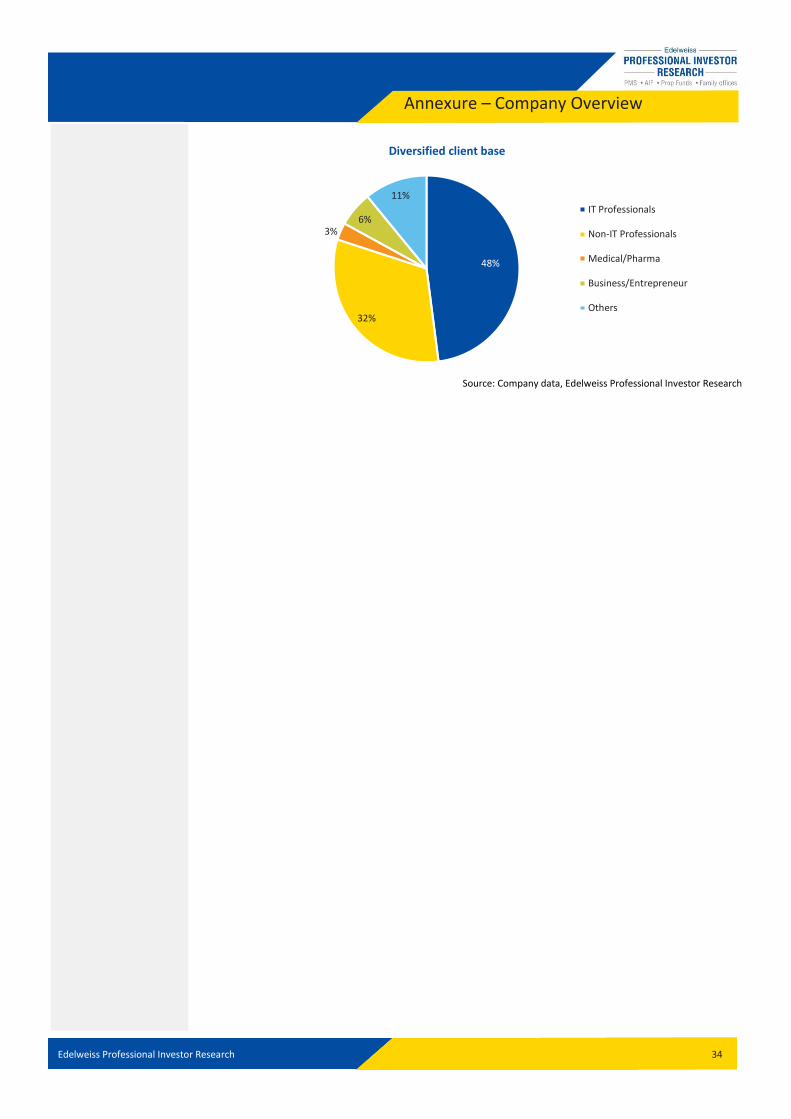
Diversified client base
Sobha has a strong core customer base in its real estate business. Also, the company’s products are
well penetrated across all key income segments, which reduces dependence on any particular
customer base. It derives ~45-50% sales volumes from IT/ITES professionals, while the balance is
distributed between non-IT and business community. Around 35-40% of its customers are self-
funded, which partially alleviates the concern of falling sales volumes during times of interest rate
up-cycle.
28%
39%
23%
10%
Ticket size of residential projects
< 1cr
1 cr to 2 crs
2 crs to 3 crs
Above Rs.3 crs
67%
14%
6%
8%6%
Product-mix of development since inception
Apartments
Plots
Row Houses
Villas
Club Houses, Others
73%
8%
6%
4%3%
3%
3%
Region-wise residential development since inception
Bengaluru
Coimbatore
Thrissur
Chennai
Pune
Mysore
Gurgaon (NCR)
Edelweiss Professional Investor Research 34
Annexure – Company Overview
Source: Company data, Edelweiss Professional Investor Research
48%
32%
3%6%
11%
Diversified client base
IT Professionals
Non-IT Professionals
Medical/Pharma
Business/Entrepreneur
Others

Edelweiss Professional Investor Research 35
Annexure – Sector Overview
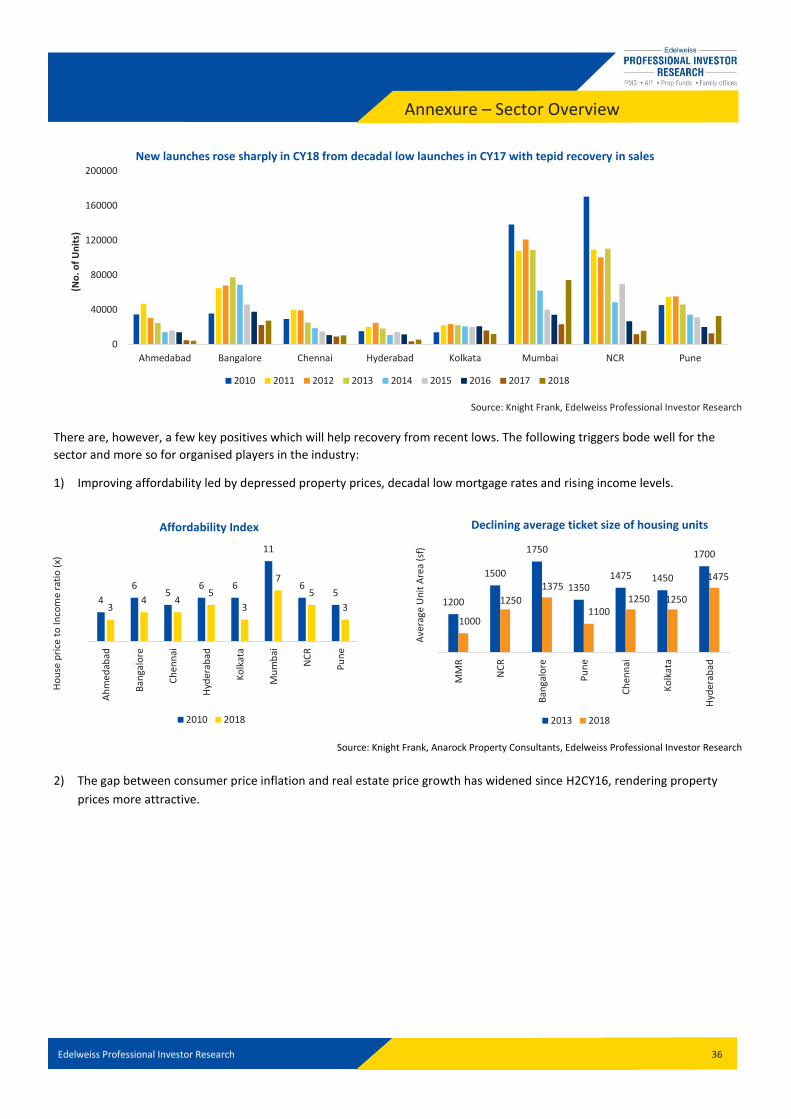
Residential Real Estate Sector: An overview The real estate sector in India has seen a prolonged slowdown with weak demand and burgeoning unsold inventory since 2010.
Unaffordable prices, poor execution from developers and wrong ticket size led to the sector losing momentum. As a result, real
estate players have gone slow on launches over the past few years. Additionally, several regulatory reforms such as
Demonization, RERA and GST along with the recent liquidity crisis further disrupted the industry and delayed recovery. Till 2017
end, while developers continued to remain in wait-and-watch mode to prepare for the new RERA/GST regime, buyers sat on the
fence expecting significant price correction. With policy announcements in the latest budget and recent GST rate cuts, we believe
the sector recovery will pick up pace.
Consistent fall in demand (CY17 sales at decadal low); greenshoots visible in CY18 sales
Demand for real estate housing units has been on a continuous downtrend since 2013 in the top-8 cities with Mumbai and NCR
being the worst affected (downtrend started in 2011). Following reasons can be attributed to the declining demand:
1) Focus on investor demand rather than end-user demand.
2) Launches in wrong ticket size.
3) Poor execution track record (delay in project delivery) resulting in ebbing consumer confidence.
Total absorption in CY17 was lowest in a decade due to a host of regulatory factors such as demonetization, RERA and GST
disrupting industry and decelerating demand further. Absorption in 2018, however, has recovered modestly as the industry is
gradually stabilising.
Source: Knight Frank, Edelweiss Professional Investor Research
New launches also plummeted to decadal low in CY17; zoomed ~76% in CY18
Following slowing demand and rising inventory levels along with the pressure to service burgeoning debt, most real estate
players have pruned launches over the past few years. NCR recorded lowest launches amongst major cities over CY10-18—down
26% CAGR. However, launches jumped significantly in CY18 as players slowly adapted to the new RERA/GST regime.
0
20000
40000
60000
80000
100000
120000
Ahmedabad Bangalore Chennai Hyderabad Kolkata Mumbai NCR Pune
No
. of
un
its
Total residential demand in Tier 1 cities declined by ~30% from peak of CY10-12, with NCR and Mumbai being hit the most
2010 2011 2012 2013 2014 2015 2016 2017 2018
Edelweiss Professional Investor Research 36
Annexure – Sector Overview
Source: Knight Frank, Edelweiss Professional Investor Research
There are, however, a few key positives which will help recovery from recent lows. The following triggers bode well for the
sector and more so for organised players in the industry:
1) Improving affordability led by depressed property prices, decadal low mortgage rates and rising income levels.
Source: Knight Frank, Anarock Property Consultants, Edelweiss Professional Investor Research
2) The gap between consumer price inflation and real estate price growth has widened since H2CY16, rendering property
prices more attractive.
0
40000
80000
120000
160000
200000
Ahmedabad Bangalore Chennai Hyderabad Kolkata Mumbai NCR Pune
(No
. of
Un
its)
New launches rose sharply in CY18 from decadal low launches in CY17 with tepid recovery in sales
2010 2011 2012 2013 2014 2015 2016 2017 2018
4
65
6 6
11
65
34 4
5
3
7
5
3
Ah
med
abad
Ban
galo
re
Ch
enn
ai
Hyd
erab
ad
Ko
lkat
a
Mu
mb
ai
NC
R
Pu
ne
Ho
use
pri
ce t
o In
com
e ra
tio
(x)
Affordability Index
2010 2018
1200
1500
1750
13501475 1450
1700
1000
1250
1375
11001250 1250
1475
MM
R
NC
R
Ban
galo
re
Pu
ne
Ch
enn
ai
Ko
lkat
a
Hyd
erab
ad
Ave
rage
Un
it A
rea
(sf)
Declining average ticket size of housing units
2013 2018
Edelweiss Professional Investor Research 37
Annexure – Sector Overview
Source: Knight Frank, Edelweiss Professional Investor Research
3) Following RERA, local players will find it increasingly difficult to adhere to stringent regulations (no pre-launches, higher
funding costs, guaranteed execution of projects), which will lead to constrained supply going ahead, helping organised
players to gain market share. Improving transparency and consolidation will address past investor concerns in real estate
stocks.
4) Focus on end-user driven demand i.e., more launches in the affordable and mid-income housing segments.
Controlled launches and lower prices have helped developers manage elevated inventory levels
Due to weakening demand and mounting unsold inventory, developers have been focusing on freeing-up capital locked in
inventory at lower prices and pruning launches. Developers’ focus on investor demand and developing luxury/premium segment
houses rather than end-user demand was one of the prime reasons for elevated inventory. However, a more concerted effort
by developers to cut ticket size by limiting unit size and reducing prices in response to the market’s demand has helped them
reduce inventory over the past few years. As on H2FY18, unsold inventory was highest for NCR at ~142,000 units, followed by
Mumbai and Bengaluru at ~126,000 and ~92,000 units, respectively.
Source: Knight Frank, Edelweiss Professional Investor Research
95
100
105
110
115
120
125
130
135
140
Q1
-20
13
Q2
-20
13
Q3
-20
13
Q4
-20
13
Q1
-20
14
Q2
-20
14
Q3
-20
14
Q4
-20
14
Q1
-20
15
Q2
-20
15
Q3
-20
15
Q4
-20
15
Q1
-20
16
Q2
-20
16
Q3
-20
16
Q4
-20
16
Q1
-20
17
Q2
-20
17
Q3
-20
17
Q4
-20
17
Q1
-20
18
Q2
-20
18
Q3
-20
18
Q4
-20
18
CPI Pune Ahmedabad NCR Bangalore Hyderabad Mumbai Chennai Kolkata
0
50000
100000
150000
200000
250000
Ahmedabad Bangalore Chennai Hyderabad Kolkata Mumbai NCR Pune
No
. of
un
its
Lower launches and price reduction led to declining inventory since 2016
Unsold Inventories (2016) Unsold Inventories (2017) Unsold Inventories (2018)
Edelweiss Professional Investor Research 38
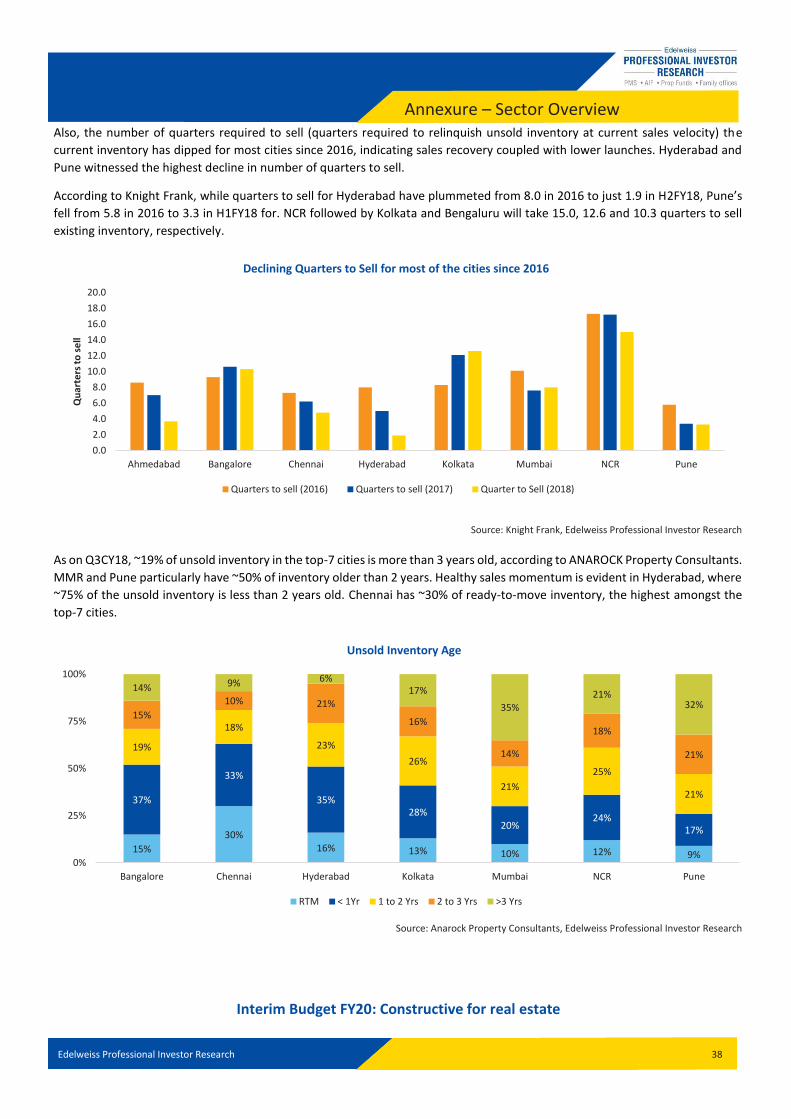
Annexure – Sector Overview Also, the number of quarters required to sell (quarters required to relinquish unsold inventory at current sales velocity) the
current inventory has dipped for most cities since 2016, indicating sales recovery coupled with lower launches. Hyderabad and
Pune witnessed the highest decline in number of quarters to sell.
According to Knight Frank, while quarters to sell for Hyderabad have plummeted from 8.0 in 2016 to just 1.9 in H2FY18, Pune’s
fell from 5.8 in 2016 to 3.3 in H1FY18 for. NCR followed by Kolkata and Bengaluru will take 15.0, 12.6 and 10.3 quarters to sell
existing inventory, respectively.
Source: Knight Frank, Edelweiss Professional Investor Research
As on Q3CY18, ~19% of unsold inventory in the top-7 cities is more than 3 years old, according to ANAROCK Property Consultants.
MMR and Pune particularly have ~50% of inventory older than 2 years. Healthy sales momentum is evident in Hyderabad, where
~75% of the unsold inventory is less than 2 years old. Chennai has ~30% of ready-to-move inventory, the highest amongst the
top-7 cities.
Source: Anarock Property Consultants, Edelweiss Professional Investor Research
Interim Budget FY20: Constructive for real estate
0.0
2.0
4.0
6.0
8.0
10.0
12.0
14.0
16.0
18.0
20.0
Ahmedabad Bangalore Chennai Hyderabad Kolkata Mumbai NCR Pune
Qu
arte
rs t
o s
ell
Declining Quarters to Sell for most of the cities since 2016
Quarters to sell (2016) Quarters to sell (2017) Quarter to Sell (2018)
15%
30%16% 13% 10% 12% 9%
37%
33%
35%28%
20%24%
17%
19%
18%
23%
26%
21%
25%
21%
15%
10% 21%
16%
14%
18%
21%
14% 9% 6%17%
35%21%
32%
0%
25%
50%
75%
100%
Bangalore Chennai Hyderabad Kolkata Mumbai NCR Pune
Unsold Inventory Age
RTM < 1Yr 1 to 2 Yrs 2 to 3 Yrs >3 Yrs
Edelweiss Professional Investor Research 39
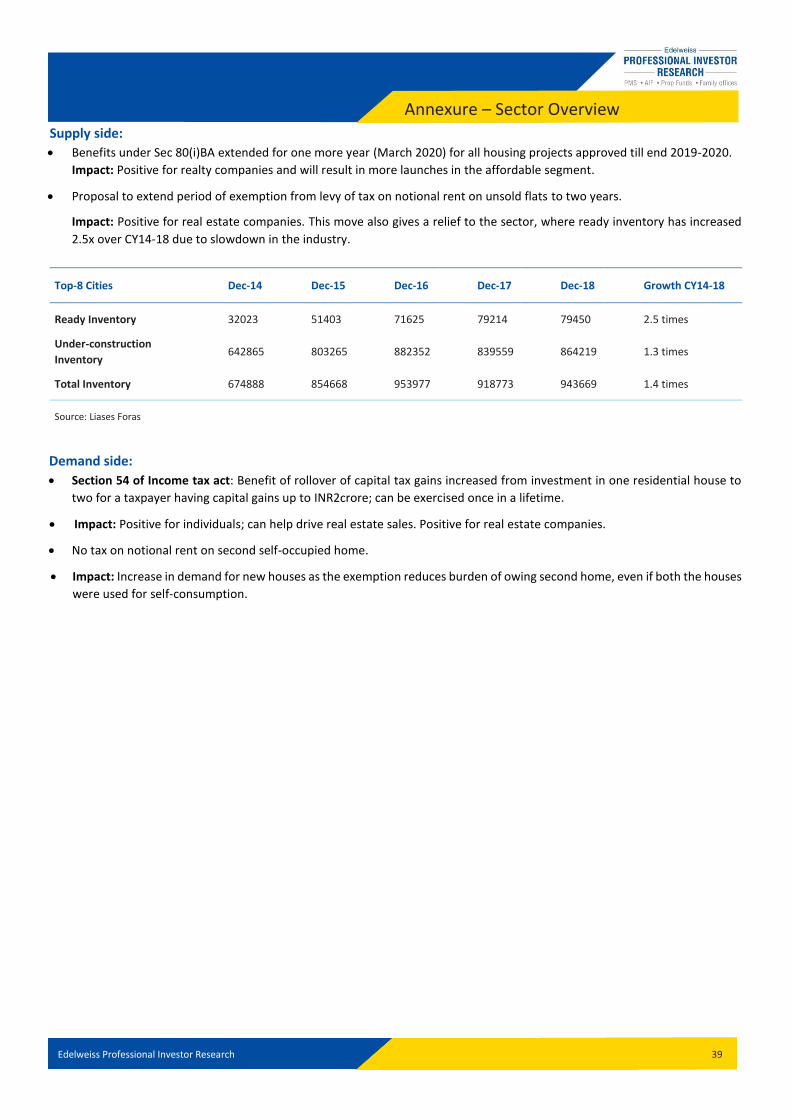
Annexure – Sector Overview Supply side:
Benefits under Sec 80(i)BA extended for one more year (March 2020) for all housing projects approved till end 2019-2020.
Impact: Positive for realty companies and will result in more launches in the affordable segment.
Proposal to extend period of exemption from levy of tax on notional rent on unsold flats to two years.
Impact: Positive for real estate companies. This move also gives a relief to the sector, where ready inventory has increased
2.5x over CY14-18 due to slowdown in the industry.
Top-8 Cities Dec-14 Dec-15 Dec-16 Dec-17 Dec-18 Growth CY14-18
Ready Inventory 32023 51403 71625 79214 79450 2.5 times
Under-construction
Inventory 642865 803265 882352 839559 864219 1.3 times
Total Inventory 674888 854668 953977 918773 943669 1.4 times
Source: Liases Foras
Demand side:
Section 54 of Income tax act: Benefit of rollover of capital tax gains increased from investment in one residential house to
two for a taxpayer having capital gains up to INR2crore; can be exercised once in a lifetime.
Impact: Positive for individuals; can help drive real estate sales. Positive for real estate companies.
No tax on notional rent on second self-occupied home.
Impact: Increase in demand for new houses as the exemption reduces burden of owing second home, even if both the houses
were used for self-consumption.
Edelweiss Professional Investor Research 40
Annexure – Sector Overview
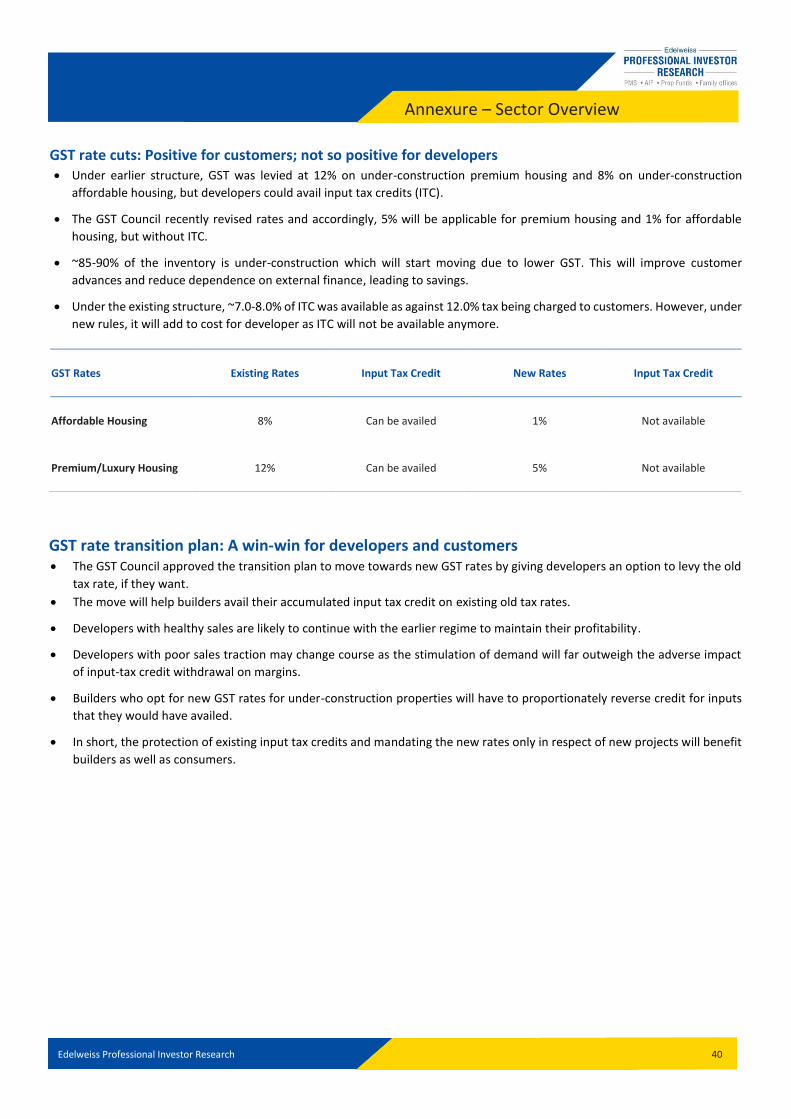
GST rate cuts: Positive for customers; not so positive for developers Under earlier structure, GST was levied at 12% on under-construction premium housing and 8% on under-construction
affordable housing, but developers could avail input tax credits (ITC).
The GST Council recently revised rates and accordingly, 5% will be applicable for premium housing and 1% for affordable
housing, but without ITC.
~85-90% of the inventory is under-construction which will start moving due to lower GST. This will improve customer
advances and reduce dependence on external finance, leading to savings.
Under the existing structure, ~7.0-8.0% of ITC was available as against 12.0% tax being charged to customers. However, under
new rules, it will add to cost for developer as ITC will not be available anymore.
GST Rates Existing Rates Input Tax Credit New Rates Input Tax Credit
Affordable Housing 8% Can be availed 1% Not available
Premium/Luxury Housing 12% Can be availed 5% Not available
GST rate transition plan: A win-win for developers and customers The GST Council approved the transition plan to move towards new GST rates by giving developers an option to levy the old
tax rate, if they want.
The move will help builders avail their accumulated input tax credit on existing old tax rates.
Developers with healthy sales are likely to continue with the earlier regime to maintain their profitability.
Developers with poor sales traction may change course as the stimulation of demand will far outweigh the adverse impact
of input-tax credit withdrawal on margins.
Builders who opt for new GST rates for under-construction properties will have to proportionately reverse credit for inputs
that they would have availed.
In short, the protection of existing input tax credits and mandating the new rates only in respect of new projects will benefit
builders as well as consumers.

Edelweiss Professional Investor Research 41
Edelweiss Broking Limited, 1st Floor, Tower 3, Wing B, Kohinoor City Mall, Kohinoor City, Kirol Road, Kurla(W)
Board: (91-22) 4272 2200
Vinay Khattar
Head Research
Rating Expected to
Buy appreciate more than 15% over a 12-month period
Hold appreciate between 5-15% over a 12-month period
Reduce Return below 5% over a 12-month period
40
60
80
100
120
140
160
180
200
220
Jan
-14
Ap
r-1
4
Jul-
14
Oct
-14
Jan
-15
Ap
r-1
5
Jul-
15
Oct
-15
Jan
-16
Ap
r-1
6
Jul-
16
Oct
-16
Jan
-17
Ap
r-1
7
Jul-
17
Oct
-17
Jan
-18
Ap
r-1
8
Jul-
18
Oct
-18
Jan
-19
Ap
r-1
9
(In
de
xed
)
Sobha Sensex

Edelweiss Professional Investor Research 42
Disclaimer Edelweiss Broking Limited (“EBL” or “Research Entity”) is regulated by the Securities and Exchange Board of India (“SEBI”) and is licensed to carry on the business of broking, depository
services and related activities. The business of EBL and its Associates (list available on www.edelweissfin.com) are organized around five broad business groups – Credit including Housing
and SME Finance, Commodities, Financial Markets, Asset Management and Life Insurance.
Broking services offered by Edelweiss Broking Limited under SEBI Registration No.: INZ000005231; Name of the Compliance Officer: Mr. Brijmohan Bohra, Email ID:
[email protected] Corporate Office: Edelweiss House, Off CST Road, Kalina, Mumbai - 400098; Tel. 18001023335/022-42722200/022-40094279
This Report has been prepared by Edelweiss Broking Limited in the capacity of a Research Analyst having SEBI Registration No.INH000000172 and distributed as per SEBI (Research
Analysts) Regulations 2014. This report does not constitute an offer or solicitation for the purchase or sale of any financia l instrument or as an official confirmation of any transaction.
The information contained herein is from publicly available data or other sources believed to be reliable. This report is provided for assistance only and is not intended to be and must
not alone be taken as the basis for an investment decision. The user assumes the entire risk of any use made of this information. Each recipient of this report should make such
investigation as it deems necessary to arrive at an independent evaluation of an investment in the securities of companies referred to in this document (including the merits and risks
involved), and should consult his own advisors to determine the merits and risks of such investment. The investment discussed or views expressed may not be suitable for all investors.
This information is strictly confidential and is being furnished to you solely for your information. This information should not be reproduced or redistributed or passed on directly or
indirectly in any form to any other person or published, copied, in whole or in part, for any purpose. This report is not directed or intended for distribution to, or use by, any person or
entity who is a citizen or resident of or located in any locality, state, country or other jurisdiction, where such distribut ion, publication, availability or use would be contrary to law,
regulation or which would subject EBL and associates / group companies to any registration or licensing requirements within such jurisdiction. The distribution of this report in certain
jurisdictions may be restricted by law, and persons in whose possession this report comes, should observe, any such restrictions. The information given in this report is as of the date of
this report and there can be no assurance that future results or events will be consistent with this information. This information is subject to change without any prior notice. EBL reserves
the right to make modifications and alterations to this statement as may be required from time to time. EBL or any of its associates / group companies shall not be in any way responsible
for any loss or damage that may arise to any person from any inadvertent error in the information contained in this report. EBL is committed to providing independent and transparent
recommendation to its clients. Neither EBL nor any of its associates, group companies, directors, employees, agents or representatives shall be liable for any damages whether direct,
indirect, special or consequential including loss of revenue or lost profits that may arise from or in connection with the use of the information. Our proprietary trading and investment
businesses may make investment decisions that are inconsistent with the recommendations expressed herein. Past performance is not necessarily a guide to future performance .The
disclosures of interest statements incorporated in this report are provided solely to enhance the transparency and should not be treated as endorsement of the views expressed in the
report. The information provided in these reports remains, unless otherwise stated, the copyright of EBL. All layout, design, original artwork, concepts and other Intellectual Properties,
remains the property and copyright of EBL and may not be used in any form or for any purpose whatsoever by any party without the express written permission of the copyright holders.
EBL shall not be liable for any delay or any other interruption which may occur in presenting the data due to any reason including network (Internet) reasons or snags in the system,
break down of the system or any other equipment, server breakdown, maintenance shutdown, breakdown of communication services or inability of the EBL to present the data. In no
event shall EBL be liable for any damages, including without limitation direct or indirect, special, incidental, or consequential damages, losses or expenses arising in connection with the
data presented by the EBL through this report.
We offer our research services to clients as well as our prospects. Though this report is disseminated to all the customers simultaneously, not all customers may receive this report at
the same time. We will not treat recipients as customers by virtue of their receiving this report.
EBL and its associates, officer, directors, and employees, research analyst (including relatives) worldwide may: (a) from time to time, have long or short positions in, and buy or sell the
securities thereof, of company(ies), mentioned herein or (b) be engaged in any other transaction involving such securities and earn brokerage or other compensation or act as a market
maker in the financial instruments of the subject company/company(ies) discussed herein or act as advisor or lender/borrower to such company(ies) or have other potential/material
conflict of interest with respect to any recommendation and related information and opinions at the time of publication of research report or at the time of public appearance. EBL may
have proprietary long/short position in the above mentioned scrip(s) and therefore should be considered as interested. The views provided herein are general in nature and do not
consider risk appetite or investment objective of any particular investor; readers are requested to take independent professional advice before investing. This should not be construed
as invitation or solicitation to do business with EBL.
EBL or its associates may have received compensation from the subject company in the past 12 months. EBL or its associates may have managed or co-managed public offering of
securities for the subject company in the past 12 months. EBL or its associates may have received compensation for investment banking or merchant banking or brokerage services from
the subject company in the past 12 months. EBL or its associates may have received any compensation for products or services other than investment banking or merchant banking or
brokerage services from the subject company in the past 12 months. EBL or its associates have not received any compensation or other benefits from the Subject Company or third party
in connection with the research report. Research analyst or his/her relative or EBL’s associates may have financial interest in the subject company. EBL, its associates, research analyst
and his/her relative may have other potential/material conflict of interest with respect to any recommendation and related information and opinions at the time of publication of
research report or at the time of public appearance.
Participants in foreign exchange transactions may incur risks arising from several factors, including the following: ( i) exchange rates can be volatile and are subject to large fluctuations;
( ii) the value of currencies may be affected by numerous market factors, including world and national economic, political and regulatory events, events in equity and debt markets and
changes in interest rates; and (iii) currencies may be subject to devaluation or government imposed exchange controls which could affect the value of the currency. Investors in securities
such as ADRs and Currency Derivatives, whose values are affected by the currency of an underlying security, effectively assume currency risk.
Research analyst has served as an officer, director or employee of subject Company: No
EBL has financial interest in the subject companies: No
EBL’s Associates may have actual / beneficial ownership of 1% or more securities of the subject company at the end of the month immediately preceding the date of publication of
research report.
Research analyst or his/her relative has actual/beneficial ownership of 1% or more securities of the subject company at the end of the month immediately preceding the date of
publication of research report: No
EBL has actual/beneficial ownership of 1% or more securities of the subject company at the end of the month immediately preceding the date of publication of research report: No
Subject company may have been client during twelve months preceding the date of distribution of the research report.
There were no instances of non-compliance by EBL on any matter related to the capital markets, resulting in significant and material disciplinary action during the last three years.
A graph of daily closing prices of the securities is also available at www.nseindia.com
Analyst Certification:
The analyst for this report certifies that all of the views expressed in this report accurately reflect his or her personal views about the subject company or companies and its or their
securities, and no part of his or her compensation was, is or will be, directly or indirectly related to specific recommendations or views expressed in this report.
Edelweiss Professional Investor Research 43
Disclaimer
Additional Disclaimer for U.S. Persons
Edelweiss is not a registered broker – dealer under the U.S. Securities Exchange Act of 1934, as amended (the“1934 act”) and under applicable state laws in the United States. In addition
Edelweiss is not a registered investment adviser under the U.S. Investment Advisers Act of 1940, as amended (the "Advisers Act" and together with the 1934 Act, the "Acts), and under
applicable state laws in the United States. Accordingly, in the absence of specific exemption under the Acts, any brokerage and investment services provided by Edelweiss, including the
products and services described herein are not available to or intended for U.S. persons.
This report does not constitute an offer or invitation to purchase or subscribe for any securities or solicitation of any investments or investment services and/or shall not be considered
as an advertisement tool. "U.S. Persons" are generally defined as a natural person, residing in the United States or any entity organized or incorporated under the laws of the United
States. US Citizens living abroad may also be deemed "US Persons" under certain rules.
Transactions in securities discussed in this research report should be effected through Edelweiss Financial Services Inc.
Additional Disclaimer for U.K. Persons
The contents of this research report have not been approved by an authorised person within the meaning of the Financial Services and Markets Act 2000 ("FSMA").
In the United Kingdom, this research report is being distributed only to and is directed only at (a) persons who have professional experience in matters relating to investments falling
within Article 19(5) of the FSMA (Financial Promotion) Order 2005 (the “Order”); (b) persons falling within Article 49(2)(a) to (d) of the Order (including high net worth companies and
unincorporated associations); and (c) any other persons to whom it may otherwise lawfully be communicated (all such persons together being referred to as “relevant persons”).
This research report must not be acted on or relied on by persons who are not relevant persons. Any investment or investment activity to which this research report relates is available
only to relevant persons and will be engaged in only with relevant persons. Any person who is not a relevant person should not act or rely on this research report or any of its contents.
This research report must not be distributed, published, reproduced or disclosed (in whole or in part) by recipients to any other person.
Additional Disclaimer for Canadian Persons
Edelweiss is not a registered adviser or dealer under applicable Canadian securities laws nor has it obtained an exemption from the adviser and/or dealer registration requirements
under such law. Accordingly, any brokerage and investment services provided by Edelweiss, including the products and services described herein, are not available to or intended for
Canadian persons.
This research report and its respective contents do not constitute an offer or invitation to purchase or subscribe for any securities or solicitation of any investments or investment
services.
Disclosures under the provisions of SEBI (Research Analysts) Regulations 2014 (Regulations)
Edelweiss Broking Limited ("EBL" or "Research Entity") is regulated by the Securities and Exchange Board of India ("SEBI") and is licensed to carry on the business of broking, depository
services and related activities. The business of EBL and its associates are organized around five broad business groups – Credit including Housing and SME Finance, Commodities, Financial
Markets, Asset Management and Life Insurance. There were no instances of non-compliance by EBL on any matter related to the capital markets, resulting in significant and material
disciplinary action during the last three years. This research report has been prepared and distributed by Edelweiss Broking Limited ("Edelweiss") in the capacity of a Research Analyst
as per Regulation 22(1) of SEBI (Research Analysts) Regulations 2014 having SEBI Registration No.INH000000172.
Related Documents