1 Folie Susanne Dröge Leakage Workshop 4 February 2008 Tackling Leakage in a World of Unequal Carbon Prices Climate Strategies Workshop, 4 February 2008, Paris supported by:

Welcome message from author
This document is posted to help you gain knowledge. Please leave a comment to let me know what you think about it! Share it to your friends and learn new things together.
Transcript
1Folie
Susanne DrögeLeakage Workshop4 February 2008
Tackling Leakage in a World of Unequal Carbon Prices
Climate Strategies Workshop, 4 February 2008, Paris
supported by:

2Folie
Susanne DrögeLeakage Workshop4 February 2008
www.climatestrategies.org
1. Assist solving collective action problems for policy makers in Europe and worldwide
2. Trans-boundary and neutral agent between academics (science), government (bureaucracy), and geopolitical boundaries (politics)
3. Sponsored and funded by EU governments and companies
4. Three major themes:– The EU emissions trading scheme– CDM– East-West Investment

3Folie
Susanne DrögeLeakage Workshop4 February 2008
Background
Global carbon market unlikely in near futurecarbon leakage likely
Parallel policy processes: EU and other nations Bali Action Plan: Copenhagen2009
Unilateral commitments EU (stricter ETS after 2013): regional carbon market(s)
Analyses of competitiveness and leakage effects from EU carbon pricing (Climate Strategies Report 2007: Differentiation and Dynamics of EU ETS Industrial Competitiveness Impacts)
Policies to address leakage:need careful analyses w.r.t. effectiveness and implicationfor global progress

4Folie
Susanne DrögeLeakage Workshop4 February 2008
Climate Strategies Project: „Tackling Leakage ...“
Point of Departure: EU ETS and leakage; interactions with(a) other countries’ ETS and leakage policy (AUS, NZ, Japan; US? Can?); (b) the international negotiations for a new global climate treaty
Packages– I: Illustrating leakage and competitiveness for selected industries:
measuring leakage, synergies/trade-offs with competitiveness; unintended feedbacks
from climate policy; relevant sectors in different MS; regional differences; – II: Free Allocation: determination of relevant sectors and allocation criteria;
effects on leakage; Implications for the EU sectors, regions, ETS; – III: Adjustments at the border: import allowances; tariffs on imports,
compensation for exporters, technical issues of implementation (legal, economic, fiscal); political implications.
– IV: Implications for Post-2012: parallel policy/negotiation processes; politicaleconomy of measures; political implications of EU and other countries measuresagainst leakage (esp. emerging economies) for climate regime and trade regime(s).

5Folie
Susanne DrögeLeakage Workshop4 February 2008
Aim of the Workshop
To convene researchers and stakeholders and induce in-depth discussions on the leakage potential created by the EU ETS.
To discuss research results and to identify research needs in the fields mentioned, not least along the needs of stakeholders (industry, governments, NGOs).
To cultivate an open exchange on all options to address leakage, the trade-offs in terms of effectiveness, efficiency and for the future regional and global climate regime (and other regimes).

6Folie
Susanne DrögeLeakage Workshop4 February 2008
9.30 – 9.45 Welcome and Introduction The CS Project and Aims of the Workshop, Susanne Dröge, SWP The EU ETS Review and Leakage, Karsten Neuhoff, Cambridge
9.45 – 10.45
Session I
Leakage and Competitiveness: Evidence, Synergies and Trade-offs (Chair: Karsten Neuhoff) Macro-economic Leakage Effects, Onno Kuik, IVM Ex-Post Evaluation of the EU ETS on the European Aluminium Industry, Julia Reinaud, IEA Potential Feedbacks of Climate Policy on Leakage: the Building Sector, Philippe Quirion, CIRED
10.45 – 11.00 Coffee Break
11.00 – 13.00
Session II
Tackling Leakage Under the EU ETS (Chair: Michel Colombier) Potential Policy Tools - An Overview, Karsten Neuhoff, Cambridge Two Policies to Address Leakage: Border Adjustments and Output-Based Allocation, Philippe Quirion, CIRED Border Tax Adjustment to Address Leakage, Olivier Godard, CNRS The Legal Framework: What are the Limitations to Border Taxes?, Roland Ismer, University of Munich
13.00 – 14.00 Lunch Break
Workshop Agenda – I
7Folie
Susanne DrögeLeakage Workshop4 February 2008
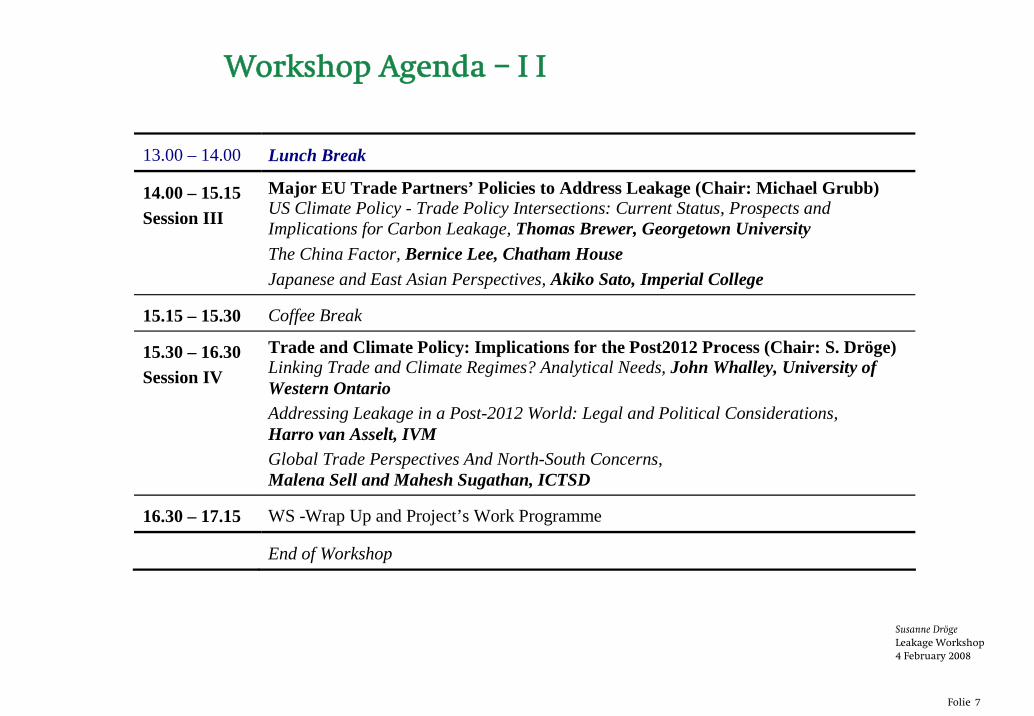
13.00 – 14.00 Lunch Break
14.00 – 15.15 Session III
Major EU Trade Partners’ Policies to Address Leakage (Chair: Michael Grubb) US Climate Policy - Trade Policy Intersections: Current Status, Prospects and Implications for Carbon Leakage, Thomas Brewer, Georgetown University The China Factor, Bernice Lee, Chatham House Japanese and East Asian Perspectives, Akiko Sato, Imperial College
15.15 – 15.30 Coffee Break
15.30 – 16.30 Session IV
Trade and Climate Policy: Implications for the Post2012 Process (Chair: S. Dröge) Linking Trade and Climate Regimes? Analytical Needs, John Whalley, University of Western Ontario Addressing Leakage in a Post-2012 World: Legal and Political Considerations, Harro van Asselt, IVM Global Trade Perspectives And North-South Concerns, Malena Sell and Mahesh Sugathan, ICTSD
16.30 – 17.15 WS -Wrap Up and Project’s Work Programme
End of Workshop
Workshop Agenda – I I
8Folie
Susanne DrögeLeakage Workshop4 February 2008
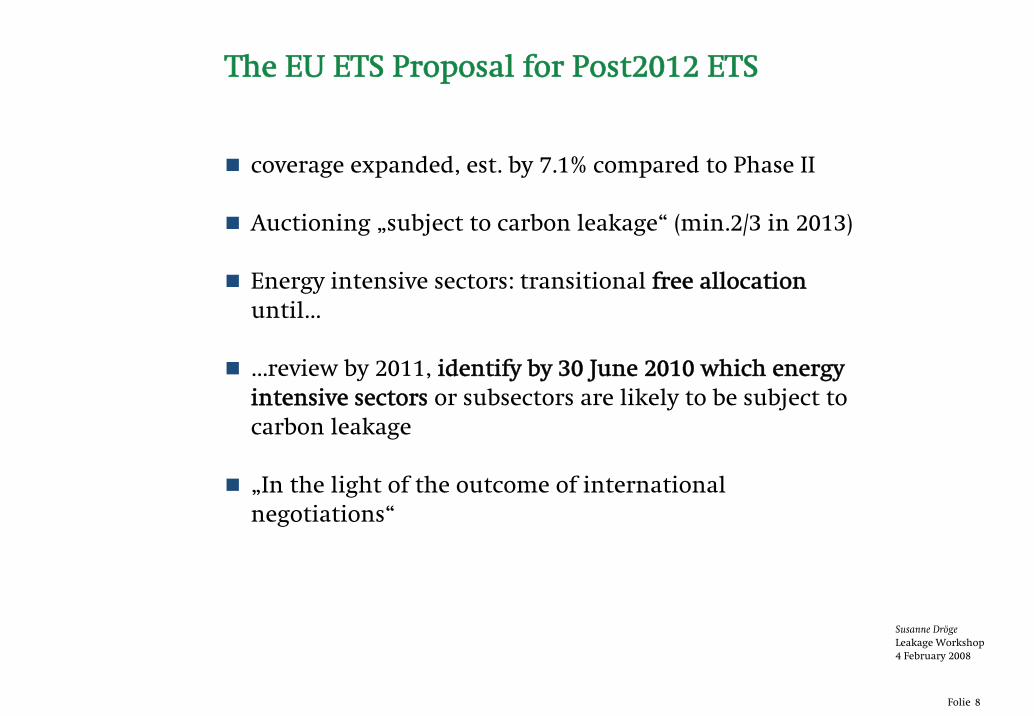
The EU ETS Proposal for Post2012 ETS
coverage expanded, est. by 7.1% compared to Phase II
Auctioning „subject to carbon leakage“ (min.2/3 in 2013)
Energy intensive sectors: transitional free allocationuntil…
…review by 2011, identify by 30 June 2010 which energy intensive sectors or subsectors are likely to be subject to carbon leakage
„In the light of the outcome of international negotiations“

9Folie
Susanne DrögeLeakage Workshop4 February 2008
Tackling Leakage in a World of Unequal Carbon Prices
Climate Strategies Workshop, 4 February 2008, Paris
supported by:

Policy options for addressing leakage impacts
Karsten NeuhoffFaculty of Economics, Cambridge University
www.electricitypolicy.org.uk/tsec/2

Electricity Policy Research Groupww
w.e
lect
rici
typo
licy.
org.
uk\ts
ec\2
ww
w.c
limat
estr
ateg
ies.o
rg
Electricity Policy Research Group
• The EU ETS Review and Leakage• Leakage and Competitiveness: Evidence,
Synergies and Trade-offs• Potential Policy Tools - An Overview
Electricity Policy Research Groupww
w.e
lect
rici
typo
licy.
org.
uk\ts
ec\2
ww
w.c
limat
estr
ateg
ies.o
rg
Electricity Policy Research Group
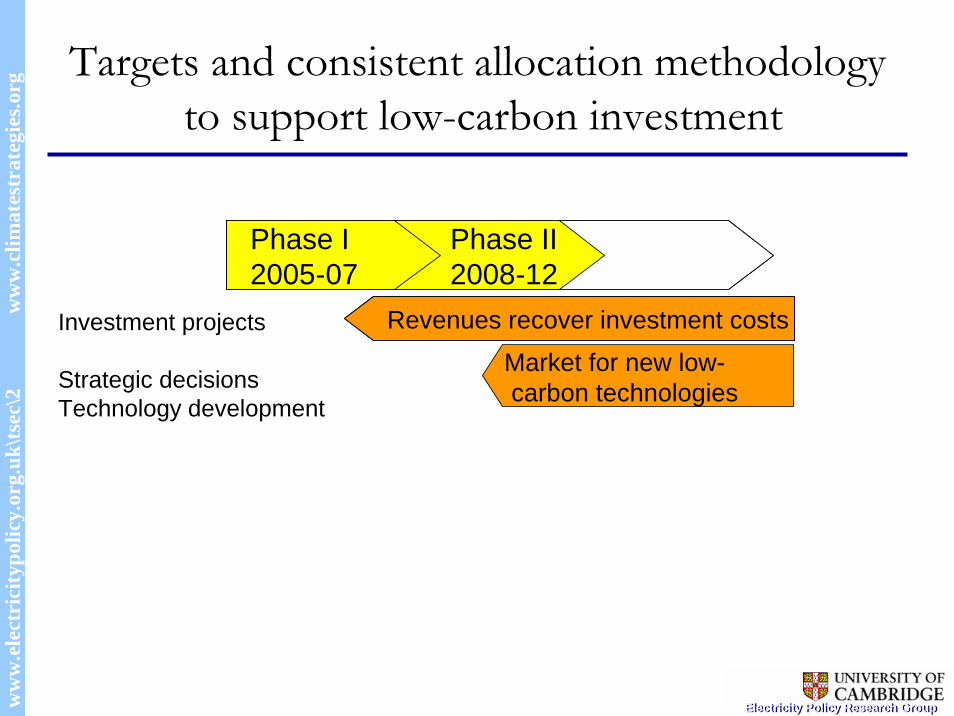
Targets and consistent allocation methodologyto support low-carbon investment
revenues finance investmentrevenues finance investment
Phase I2005-07
Phase II2008-12
Revenues recover investment costs
Phase I2005-07
Phase II2008-12
Market for new low-carbon technologies
Investment projects
Strategic decisionsTechnology development
Electricity Policy Research Groupww
w.e
lect
rici
typo
licy.
org.
uk\ts
ec\2
ww
w.c
limat
estr
ateg
ies.o
rg
Electricity Policy Research Group
Conclusion EU Impact Assessment • Preferred long term option is full auctioning• Free allocation taking place during a transitional period
– harmonised EU-wide rules– for those installations in energy intensive sectors exposed to
international competition taking into account progress in reaching an international agreement to avoid net carbon leakage
– 2010 - Commission will determine which sectors are concerned (Q/A)• 2011 in-depth assessment of energy intensive industries (Q/A)
– allowances given free of charge to industrial installations – putting in place an effective carbon equalisation system to neutralise
any distorting effects from imports, e.g. by including importers of the products concerned in the ETS.

Electricity Policy Research Groupww
w.e
lect
rici
typo
licy.
org.
uk\ts
ec\2
ww
w.c
limat
estr
ateg
ies.o
rg
Electricity Policy Research Group
Sectors covered• Energy intensive industries are defined as business entities
where the purchase of energy products and electricity amounts to at least 3.0% of the production value
• 50 sub-sectors might require price increases for their products ranging from 0.1 to 5% to recoup costs imposed by an carbon price of €20 per tonne of CO2: cement and lime production, primary steel (blast oxygen furnace), aluminium production, production of primary container glass and some basic chemicals (ammonia, nitric acid, fertilizer production) [DG Economic and Financial Affairs Economic Paper n° 297, forthcoming]

Electricity Policy Research Groupww
w.e
lect
rici
typo
licy.
org.
uk\ts
ec\2
ww
w.c
limat
estr
ateg
ies.o
rg
Electricity Policy Research Group
Measures proposed by Commission I
• Global sectoral agreements assuming realistic efforts by other regions– greater GHG reductions at the global level – positive, albeit modest, effect on the output performance of energy intensive
industries. – Not much overall economic effects (in terms of GDP)
• Free allocation of ETS allowances to energy intensive industries– On the basis of benchmarks – Contributes very strongly towards avoiding significant output losses – Without compromising total economy-wide performance – CO2 and electricity prices are hardly affected. – This instrument seems to be a very powerful tool to offset carbon leakage and
adverse effects on energy intensive industries. – This is even more the case if the free allocation would also allow for the
compensation for indirect costs

Electricity Policy Research Groupww
w.e
lect
rici
typo
licy.
org.
uk\ts
ec\2
ww
w.c
limat
estr
ateg
ies.o
rg
Electricity Policy Research Group
Pyramid of distortions – summary of experience from phase I
Excess carbon-intensive capacity
Inefficient fuel choice
Less energy-efficiency investment
Distortions
AuctionCapacity X
Capacity and technology X XHistoric output X X
Historic output and technology X X XHistoric emissions X X X X
Discourage clo
sure of plants
Discourage clo
sure of ineffic
ient plant
Increase operation of in
efficient plants
Reduce incentives fo
r
Efficiency-
improving investm
ent
Allocation method
Distortions increase emissions and/or price impacts

Electricity Policy Research Groupww
w.e
lect
rici
typo
licy.
org.
uk\ts
ec\2
ww
w.c
limat
estr
ateg
ies.o
rg
Electricity Policy Research Group
European comparison of NAP2 – fall 2006
Source: Neuhoff, K., Rogge, K., Schleich, J., Sijm, J., Tuerk, A., Kettner, C., Walker, N., Åhman, M., Betz, R.,Cludius, J., Ferrario, F., Holmgren, K., Pal, G., Grubb, M. and Matthes F., 2006, Implications of announced Phase National Allocation Plans for the EU ETS, Climate Policy 6(5) pp. 411-422.
Installed capacity P P P
Projection for productionP P
Historic production P O
Installed capacityProjections of production P
Historic ProductionProjections O O P / O P / O P
Historic Emissions O O-Not defP / O P / O P / O O P / O P / O P / OAT* BE -W BE - F BE - B CY CZ** DE DK** EE ES* FI FR GR
Installed capacityProjection for productionP P / O
Historic productionInstalled capacity P
Projections of productionP P P / O P / O
Historic ProductionProjections P / O O P P / O P / O O
Historic Emissions P P / O O P / O P / O P / O P P / O P / O P / O P / O P / O P / OHU* IE IT* LT LU LV MT NL PL PT SE SI SK UK
Ben
chm
arki
ng
Uni
form
Tech
/ Fu
el s
pec.
Emission based Incr
easi
ng D
isto
rtion
NA
P II
not
ana
lyse
dye
t / N
o tra
nsla
tion
avai
labl
e
NA
P II
not
ava
ilabl
e
NA
P II
not
ava
ilabl
e
Uni
form
Ben
chm
arki
ng
Emission based
Tech
/ Fu
el s
pec.
P – Power sectorO – Other sectors

Electricity Policy Research Groupww
w.e
lect
rici
typo
licy.
org.
uk\ts
ec\2
ww
w.c
limat
estr
ateg
ies.o
rg
Electricity Policy Research Group
Measures proposed by Commission II
• Inclusion of importers – positively on energy intensive industries' + additional
global GHG reductions.– Creates an important pressure on the ETS allowance price
• Access to CDM – significantly limits the output losses– reduces carbon leakage considerably– Positive for welfare / energy intensive industry. – Reduces GHG reductions achieved internally

Electricity Policy Research Groupww
w.e
lect
rici
typo
licy.
org.
uk\ts
ec\2
ww
w.c
limat
estr
ateg
ies.o
rg
Electricity Policy Research Group
CO2 prices across scenarios -> is reducing CO2 prices a measure?
CO
2 pr
ice
(eur
o/t)
0
510
1520
25
3035
40
Ref
eren
ce
25%
CD
M
Sec
tora
l
Sec
+fre
eal
loc
Sec
+Im
ports
Sec
+Ind
irect

Electricity Policy Research Groupww
w.e
lect
rici
typo
licy.
org.
uk\ts
ec\2
ww
w.c
limat
estr
ateg
ies.o
rg
Electricity Policy Research Group
PACE results presented by Commission for Impact Assessment (I)
-20.0%-10.0%
0.0%10.0%20.0%30.0%40.0%50.0%60.0%EU
Emis
sion
s(r
el 1
990)
Car
bon
leak
age
(202
0)
Wor
ldem
issi
ons
(rel
199
0)
Elec
pric
e(r
el B
AU)
Wel
fare
(rel
202
0BA
U)
Reference25% CDMSectoralSec+free allocSec+ImportsSec+Indirect
Electricity Policy Research Groupww
w.e
lect
rici
typo
licy.
org.
uk\ts
ec\2
ww
w.c
limat
estr
ateg
ies.o
rg
Electricity Policy Research Group
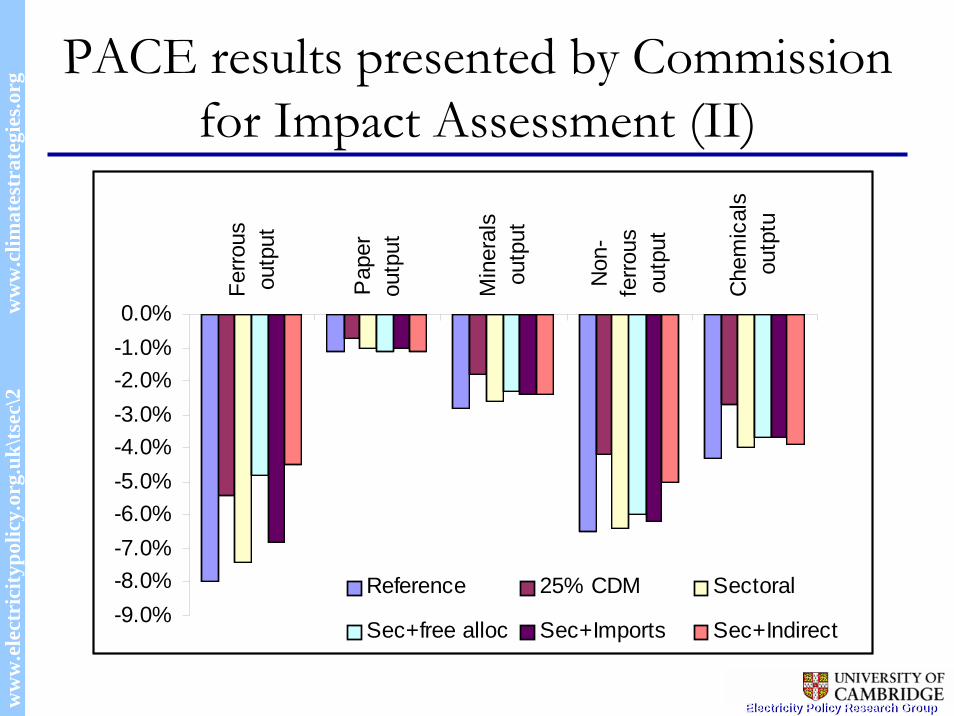
PACE results presented by Commission for Impact Assessment (II)
-9.0%-8.0%-7.0%-6.0%-5.0%-4.0%-3.0%-2.0%-1.0%0.0%
Ferro
usou
tput
Pap
erou
tput
Min
eral
sou
tput
Non
-fe
rrous
outp
ut
Che
mic
als
outp
tu
Reference 25% CDM Sectoral
Sec+free alloc Sec+Imports Sec+Indirect

Electricity Policy Research Groupww
w.e
lect
rici
typo
licy.
org.
uk\ts
ec\2
ww
w.c
limat
estr
ateg
ies.o
rg
Electricity Policy Research Group
• The EU ETS Review and Leakage• Leakage and Competitiveness: Evidence,
Synergies and Trade-offs• Potential Policy Tools - An Overview

Electricity Policy Research Groupww
w.e
lect
rici
typo
licy.
org.
uk\ts
ec\2
ww
w.c
limat
estr
ateg
ies.o
rg
Electricity Policy Research Group
CO2 cost screen: Sectors potentially exposed under unilateral CO2 pricing
Pot
entia
l Max
imum
gV
aAt
Sta
ke (M
VAS
)an
d N
et g
Va
At S
take
(NV
AS)
Hourcade Demailly, Neuhoff and Sato Differentiation and dynamics of EU ETS industrial competitiveness impacts. Embargoed until publication Nov 2007.
Potential impacts of the EU ETS on leakage are focused on a few sub-sectors
Cem
ent
Bas
ic ir
on &
ste
elLime
Fertilisers & Nitrogen
Alu
min
ium
Other inorganicbasic chemicals
Pulp &Paper
MaltCoke oven
Industrial gasesNon-wovens
Refined petroleum
Household paper
Hollow glass
Finishing of textiles
Rubber tyres & tubes
CopperCasting of iron
UK GDP
Allocation dependent (direct) CO2 costs / GVAElectricity (indirect) CO2 costs / GVA
Price increase assumption: CO2 = €20/t CO2; Electricity = €10/MWh
Flat glassVeneer sheets
0%
10%
20%
30%
40%
0.0% 0.2% 0.4% 0.6% 0.8% 1.0%
4%2%
Pot
entia
l Max
imum
gV
aAt
Sta
ke (M
VAS
)an
d N
et g
Va
At S
take
(NV
AS)
Cem
ent
Bas
ic ir
on &
ste
elLime
Fertilisers & Nitrogen
Alu
min
ium
Other inorganicbasic chemicals
Pulp &Paper
MaltCoke oven
Industrial gasesNon-wovens
Refined petroleum
Household paper
Hollow glass
Finishing of textiles
Rubber tyres & tubes
CopperCasting of iron
UK GDP
Allocation dependent (direct) CO2 costs / GVAElectricity (indirect) CO2 costs / GVA
Price increase assumption: CO2 = €20/t CO2; Electricity = €10/MWh
Flat glassVeneer sheets
0%
10%
20%
30%
40%
0.0% 0.2% 0.4% 0.6% 0.8% 1.0%
4%2%
Electricity Policy Research Groupww
w.e
lect
rici
typo
licy.
org.
uk\ts
ec\2
ww
w.c
limat
estr
ateg
ies.o
rg
Electricity Policy Research Group
• The EU ETS Review and Leakage• Leakage and Competitiveness: Evidence,
Synergies and Trade-offs• Potential Policy Tools - An Overview

Electricity Policy Research Groupww
w.e
lect
rici
typo
licy.
org.
uk\ts
ec\2
ww
w.c
limat
estr
ateg
ies.o
rg
Electricity Policy Research Group
Three principle approaches can address leakage for an exposed sector
Price level
CO2costs
Price levelPrice level
CO2 costsCO2 costs
Cos
t
Conditionalfree allocation
Cos
tC
ost
Government leadsectoral agreement
Export taxes Border adjustment
Cos
t
Export taxes Border adjustmentExport taxes Border adjustment
Electricity Policy Research Groupww
w.e
lect
rici
typo
licy.
org.
uk\ts
ec\2
ww
w.c
limat
estr
ateg
ies.o
rg
Electricity Policy Research Group
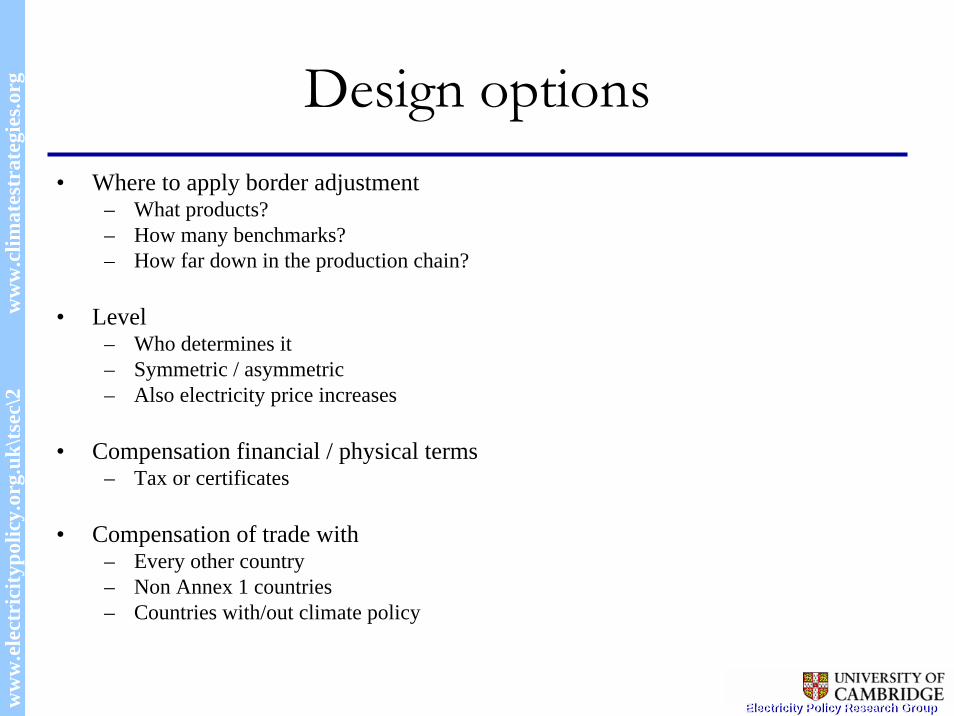
Design options• Where to apply border adjustment
– What products?– How many benchmarks?– How far down in the production chain?
• Level– Who determines it– Symmetric / asymmetric– Also electricity price increases
• Compensation financial / physical terms – Tax or certificates
• Compensation of trade with– Every other country– Non Annex 1 countries– Countries with/out climate policy

Electricity Policy Research Groupww
w.e
lect
rici
typo
licy.
org.
uk\ts
ec\2
ww
w.c
limat
estr
ateg
ies.o
rg
Electricity Policy Research Group
Steel sector
• Most exposure from BOF (and possible coke oven)• Steel can be transported at semi-finished stage
0%
10%
20%
30%
40%
50%
0 500 1000 1500 2000 2500 3000 3500Gross value added (million Euro)
Elec
tric
ity G
VAS/
CO
2 G
VAS
Cost increase electricity
Cost increase ele+CO2
Cost increase electricityfrom slab
Cost increase ele+CO2from slab
Semi Finished
Hot rolled
iron& steel
Illustrative for UK - but numbers can still change significantly
Electricity Policy Research Groupww
w.e
lect
rici
typo
licy.
org.
uk\ts
ec\2
ww
w.c
limat
estr
ateg
ies.o
rg
Electricity Policy Research Group
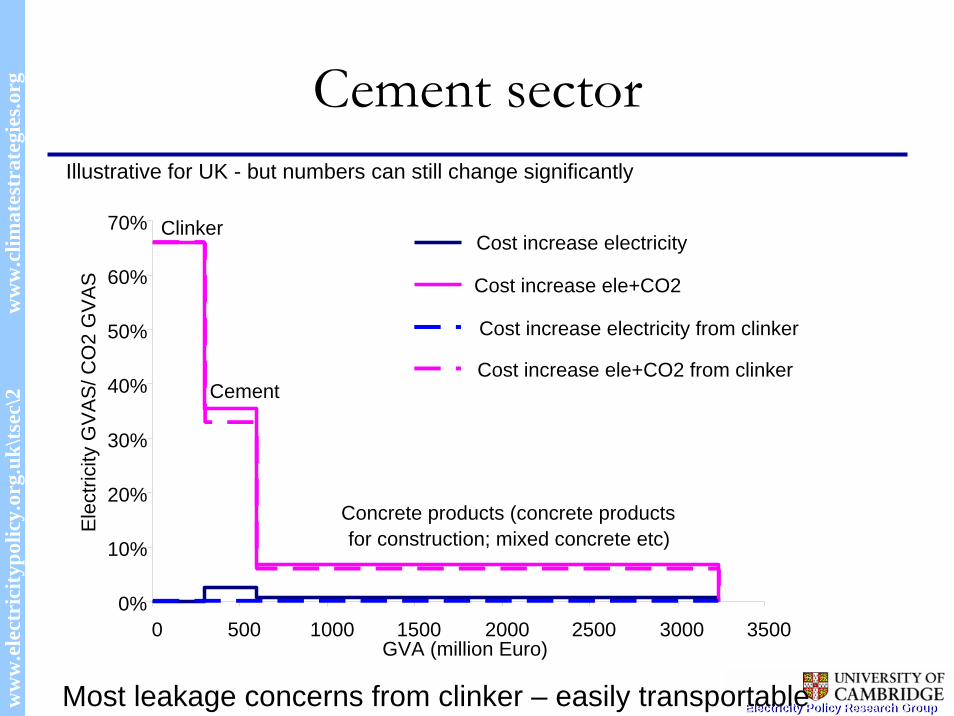
Cement sectorIllustrative for UK - but numbers can still change significantly
Most leakage concerns from clinker – easily transportable
0%
10%
20%
30%
40%
50%
60%
70%
0 500 1000 1500 2000 2500 3000 3500GVA (million Euro)
Ele
ctric
ity G
VA
S/ C
O2
GV
AS
Cost increase electricity
Cost increase ele+CO2
Cost increase electricity from clinker
Cost increase ele+CO2 from clinker
Clinker
Cement
Concrete products (concrete products for construction; mixed concrete etc)
Electricity Policy Research Groupww
w.e
lect
rici
typo
licy.
org.
uk\ts
ec\2
ww
w.c
limat
estr
ateg
ies.o
rg
Electricity Policy Research Group
Evaluation criteria
• Avoid leakage– Relocation of production /emissions– Global increase of emissions– Time frame / conditions
• Ensures substitution effect – Price impact on products

Electricity Policy Research Groupww
w.e
lect
rici
typo
licy.
org.
uk\ts
ec\2
ww
w.c
limat
estr
ateg
ies.o
rg
Electricity Policy Research Group
A carbon price works through the value chain. This can be supported by policies that address leakage.
Clinker Cement Concrete Building
Other building materials
LeanerstructuresLower clinker
content
Sub
stitu
tion
Clinkerimports Cement imports
Leak
age
Efficiency
Some leakage • Without measures • With unconditional allocation
Forgone substitution/innovation• Without measures• With free allocation

Electricity Policy Research Groupww
w.e
lect
rici
typo
licy.
org.
uk\ts
ec\2
ww
w.c
limat
estr
ateg
ies.o
rg
Electricity Policy Research Group
Evaluation criteria
• Avoid leakage– Relocation of production /emissions– Global increase of emissions– Time frame / conditions
• Ensures substitution effect – Price impact on products
• Supports efficiency of cap and trade schemes – Avoid early action issues relating to free allocation
• Support cooperation on climate policy

Electricity Policy Research Groupww
w.e
lect
rici
typo
licy.
org.
uk\ts
ec\2
ww
w.c
limat
estr
ateg
ies.o
rg
Electricity Policy Research Group
Three principle approaches can address leakage for an exposed sector
Price level
CO2costs
Price levelPrice level
CO2 costsCO2 costs
Cos
t
Conditionalfree allocation
Cos
tC
ost
Government leadsectoral agreement
Export taxes Border adjustment
Cos
t
Export taxes Border adjustmentExport taxes Border adjustment
•Little substitution to low carbon products/services
•Distorts investment•Bureaucratic constraints for innovation
•Risk of lock-in
•Has to be aligned with international climate engagement
•Requires at least informal international cooperation
•Requires strong policies of developing countries
•Risk of low common denominator
Initial evaluation

Reyer Gerlagh and Onno Kuik International Carbon Leakage in CGE’s and ETC, page: 1/11 Institute for Environmental Studies, Vrije Universiteit Amsterdam
INTERNATIONAL CARBON LEAKAGE
INTERPRETING CGE'S AND ASSESSING THE IMPLICATIONS OF
INTERNATIONAL TECHNOLOGY SPILLOVERS
Climate Strategies Workshop Tackling Leakage in a World of Unequal Carbon Prices
4 Feb 2008, Paris, France
Reyer Gerlagh Onno Kuik Economics Institute for Environmental Studies School of Social Sciences Faculty of Earth and Life Sciences University of Manchester Vrije Universiteit, Amsterdam [email protected] [email protected]
Reyer Gerlagh and Onno Kuik International Carbon Leakage in CGE’s and ETC, page: 2/11 Institute for Environmental Studies, Vrije Universiteit Amsterdam
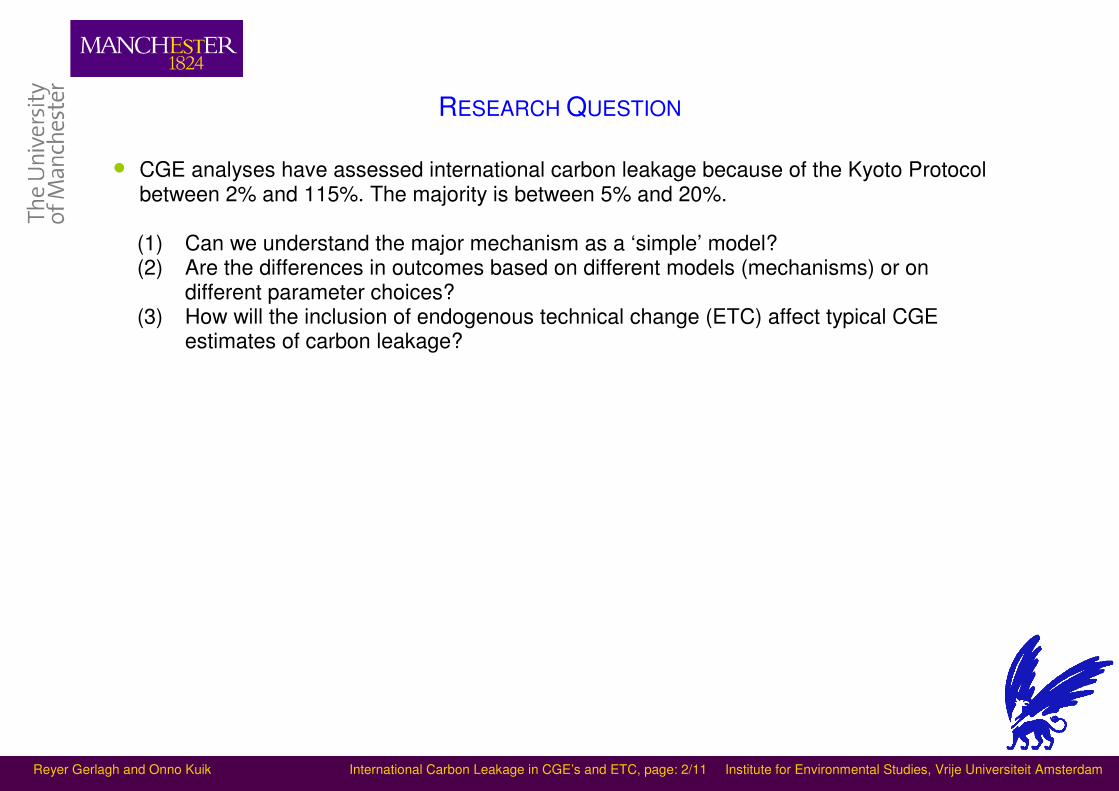
RESEARCH QUESTION
• CGE analyses have assessed international carbon leakage because of the Kyoto Protocol between 2% and 115%. The majority is between 5% and 20%.
(1) Can we understand the major mechanism as a ‘simple’ model? (2) Are the differences in outcomes based on different models (mechanisms) or on
different parameter choices? (3) How will the inclusion of endogenous technical change (ETC) affect typical CGE
estimates of carbon leakage?

Reyer Gerlagh and Onno Kuik International Carbon Leakage in CGE’s and ETC, page: 3/11 Institute for Environmental Studies, Vrije Universiteit Amsterdam
TWO SIMPLE CARBON LEAKAGE MODELS, 7-EQUATIONS, SAME BASICS,
• Two countries: Abating A and non-abating B
• θ share of country A in world carbon-energy use
• YA, YB relative change in energy-intensive sector output
• EA, EB relative change in carbon-energy input
• qA, qB output price change
• pA, pB carbon-energy price change
• τA carbon tax in abating country
• ε elasticity of demand for energy-intensive goods
• α carbon-energy share in production costs
• µ elasticity of substitution between carbon-energy and other production factors
• ψ price elasticity of global carbon-energy supply
Define the carbon leakage rate
LR = –[(1–θ)/θ]EB/EA (1)

Reyer Gerlagh and Onno Kuik International Carbon Leakage in CGE’s and ETC, page: 4/11 Institute for Environmental Studies, Vrije Universiteit Amsterdam
TWO COMPETING MODELS
• Pollution Haven Model (similar to Di Maria and Smulders 2004): One world market for
energy-intensive intermediates/goods with one output price q
• Energy Market Model: One world market for carbon-energy with one carbon-energy price p
Pollution Haven Model World market Domestic market Carbon-energy X Energy-intensive intermediates (e.g. chemicals) X Energy Market Model World market Domestic market Carbon-energy X Energy-intensive intermediates (e.g. chemicals) X
Reyer Gerlagh and Onno Kuik International Carbon Leakage in CGE’s and ETC, page: 5/11 Institute for Environmental Studies, Vrije Universiteit Amsterdam
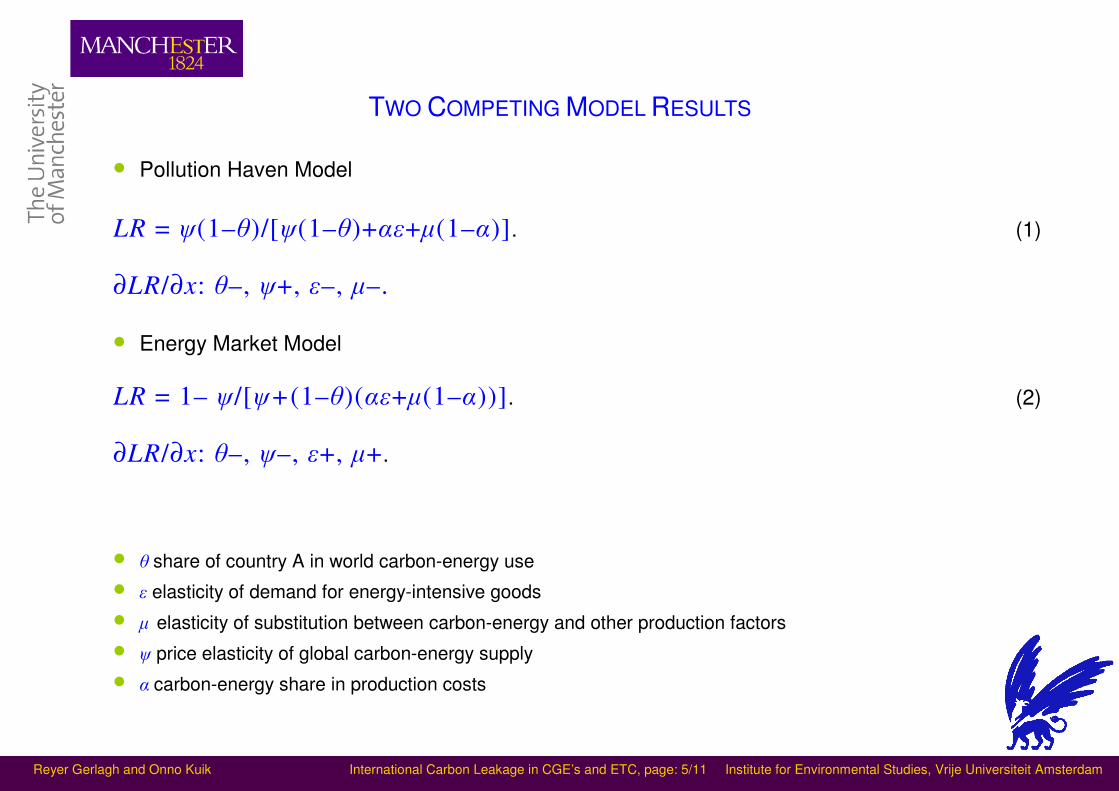
TWO COMPETING MODEL RESULTS
• Pollution Haven Model
LR = ψ(1–θ)/[ψ(1–θ)+αε+µ(1–α)]. (1)
∂LR/∂x: θ–, ψ+, ε–, µ–.
• Energy Market Model
LR = 1– ψ/[ψ+(1–θ)(αε+µ(1–α))]. (2)
∂LR/∂x: θ–, ψ–, ε+, µ+.
• θ share of country A in world carbon-energy use
• ε elasticity of demand for energy-intensive goods
• µ elasticity of substitution between carbon-energy and other production factors
• ψ price elasticity of global carbon-energy supply
• α carbon-energy share in production costs

Reyer Gerlagh and Onno Kuik International Carbon Leakage in CGE’s and ETC, page: 6/11 Institute for Environmental Studies, Vrije Universiteit Amsterdam
TESTING THE MODELS WITH CGE CARBON LEAKAGE RATES Table 1. Key results and elasticities in CGEs* Model Source LR ν ψ DEEP Kallbekken,2006,2004 0.06 4 1 G-Cubed McKibbin&Wilcoxon, 1999 0.06 1 1 Gem-E3 Bernard&Vielle, 2000 0.13 6 1 Gem-E3 Bernard&Vielle, 2000 0.04 6 1 GREEN Burniaux&O.Martins, 2000 0.05 4 8 GREEN Burniaux&O Martins, 2000 0.02 4 8 GTAP-E Burniaux&Truong,2002 0.04 19 5 GTAP-E Burniaux&Truong,2002 0.04 19 5 GTAP-E Kuik&Gerlagh,2003 0.16 7 1 GTAP-E Gerlagh&Kuik, this paper 0.14 5 0.6 GTAP-EG Paltsev, 2001 0.11 4 1 MIT-EPPA Babiker&Jacoby, 1999 0.06 3 2.9 MIT-EPPA Babiker,2005 0.20 8 0.8 MS-MRT BMR, 1999 0.19 4 1.5 MS-MRT BMR, 1999 0.16 4 1.5 WorldScan Bollen, 2004 0.17 10 3 Light Light etal,1999 0.21 4 0.5 MIT-EPPA Babiker,2005 1.15 ∞ 0.8 GTAP-E Kuik, 2006 0.15 3.3 0.6
ν = Armington elasticity between imported and domestic energy-intensive goods
ψ = carbon-energy supply elasticity *source: Kuik (2005) with Babiker (2005) and own calculations added
Reyer Gerlagh and Onno Kuik International Carbon Leakage in CGE’s and ETC, page: 7/11 Institute for Environmental Studies, Vrije Universiteit Amsterdam
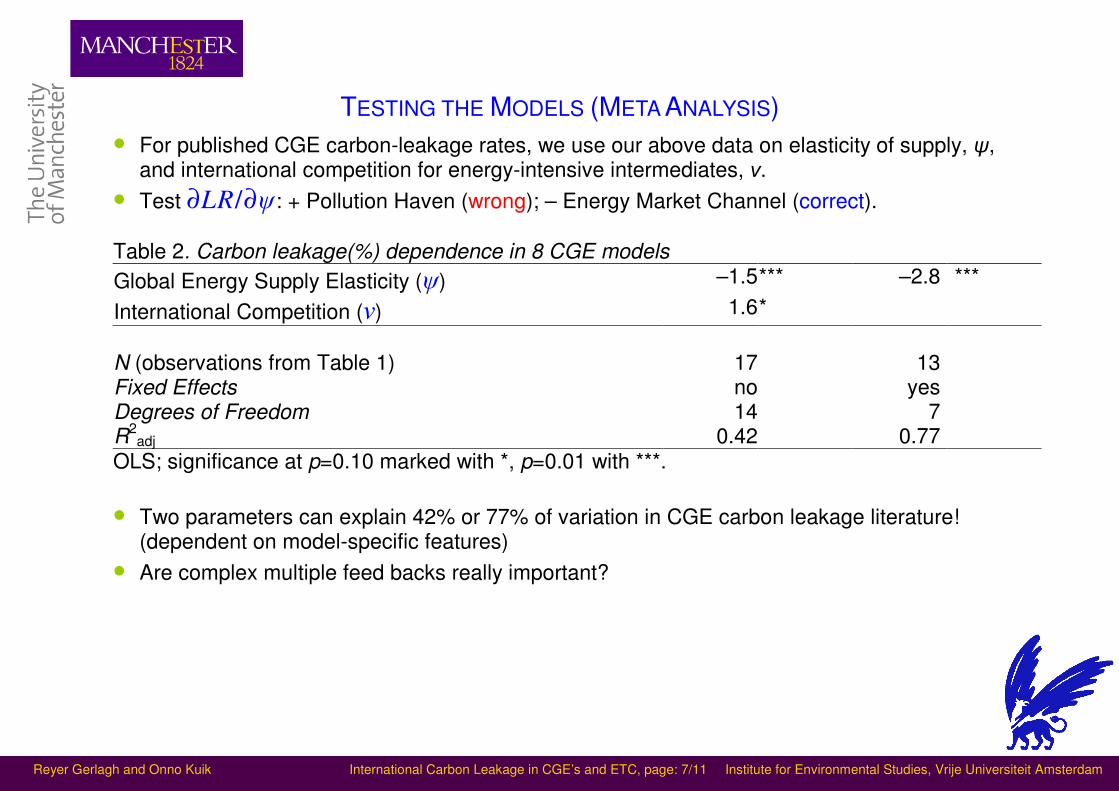
TESTING THE MODELS (META ANALYSIS)
• For published CGE carbon-leakage rates, we use our above data on elasticity of supply, ψ, and international competition for energy-intensive intermediates, ν.
• Test ∂LR/∂ψ: + Pollution Haven (wrong); – Energy Market Channel (correct).
Table 2. Carbon leakage(%) dependence in 8 CGE models
Global Energy Supply Elasticity (ψ) –1.5*** –2.8 ***
International Competition (ν) 1.6*
N (observations from Table 1) 17 13 Fixed Effects no yes Degrees of Freedom 14 7 R2
adj 0.42 0.77 OLS; significance at p=0.10 marked with *, p=0.01 with ***.
• Two parameters can explain 42% or 77% of variation in CGE carbon leakage literature! (dependent on model-specific features)
• Are complex multiple feed backs really important?

Reyer Gerlagh and Onno Kuik International Carbon Leakage in CGE’s and ETC, page: 8/11 Institute for Environmental Studies, Vrije Universiteit Amsterdam
WHAT IS INPUT-SAVING TECHNOLOGICAL CHANGE? (WING 2005)
X1 (capital & labour)
X2 (
en
erg
y)
Technology shift: σ–µ= γσ
A
B
blue line: long-term elasticity with ETC = σ
red and green line: elasticity with fixed technology = µ when energy becomes more expensive, equilibrium moves along red line from A to B. Technology adjusts and iso-output line moves from red line to green line. Equilibrium moves from B to C.
C
Reyer Gerlagh and Onno Kuik International Carbon Leakage in CGE’s and ETC, page: 9/11 Institute for Environmental Studies, Vrije Universiteit Amsterdam
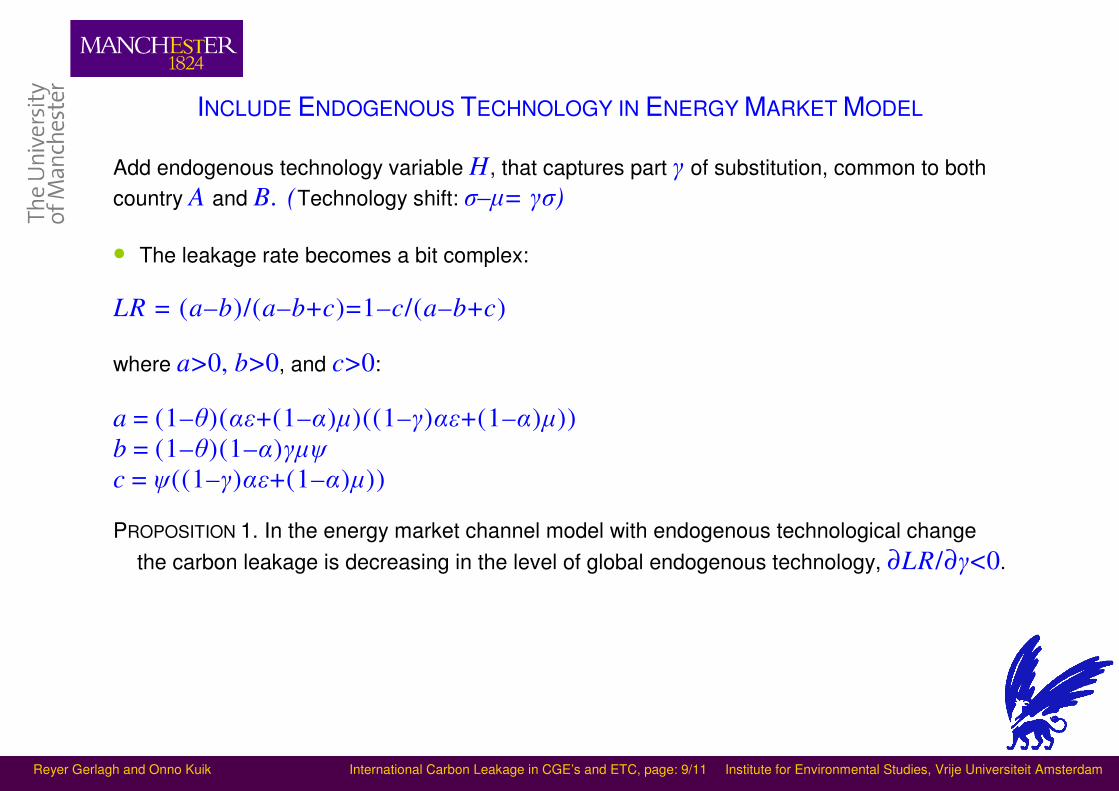
INCLUDE ENDOGENOUS TECHNOLOGY IN ENERGY MARKET MODEL
Add endogenous technology variable H, that captures part γ of substitution, common to both
country A and B. (Technology shift: σ–µ= γσ)
• The leakage rate becomes a bit complex:
LR = (a–b)/(a–b+c)=1–c/(a–b+c)
where a>0, b>0, and c>0:
a = (1–θ)(αε+(1–α)µ)((1–γ)αε+(1–α)µ))
b = (1–θ)(1–α)γµψ
c = ψ((1–γ)αε+(1–α)µ))
PROPOSITION 1. In the energy market channel model with endogenous technological change
the carbon leakage is decreasing in the level of global endogenous technology, ∂LR/∂γ<0.

Reyer Gerlagh and Onno Kuik International Carbon Leakage in CGE’s and ETC, page: 10/11 Institute for Environmental Studies, Vrije Universiteit Amsterdam
RESULTS OF GTAP-E WITH INPUT-SAVING LBD TECHNOLOGY
• Carbon leakage decreasing in coalition size + decreasing in technology spillover
-10%
-5%
0%
5%
10%
15%
20%
0.00 0.10 0.20 0.30 0.40
Gamma
Leakage r
ate
(%
)
Annex I + US + Australia Annex I - US - Australia

Reyer Gerlagh and Onno Kuik International Carbon Leakage in CGE’s and ETC, page: 11/11 Institute for Environmental Studies, Vrije Universiteit Amsterdam
OVERALL CONCLUSIONS
• Research answers (1) We can understand carbon leakage in CGEs through a 7-equation model (2) Differences between LR’s assessed by CGE models can largely be attributed to
different parameter values (3) Carbon leakage decreases substantially with ETC and ITS
• Policy answers (4) International technology spillovers can substantially reduce carbon leakage, thus (5) Unilateral climate change policy might be more effective than often suggested (based
on typical economic models that do not acknowledge ETC and ITS)

INTERNATIONAL ENERGY AGENCY AGENCE INTERNATIONALE DE L’ENERGIE
Julia ReinaudJulia ReinaudEnergy Efficiency and Environment DivisionEnergy Efficiency and Environment Division
International Energy AgencyInternational Energy Agency©© OECD/IEA,OECD/IEA, 2008
ExEx--post Evaluation of the EU ETS: post Evaluation of the EU ETS: Impacts on the Primary Impacts on the Primary
Aluminium SectorAluminium Sector
““Tackling Leakage in a World of Unequal Tackling Leakage in a World of Unequal Carbon PricesCarbon Prices””
Climate StrategiesClimate StrategiesFebruary 4 2008, ParisFebruary 4 2008, Paris
INTERNATIONAL ENERGY AGENCY AGENCE INTERNATIONALE DE L’ENERGIE
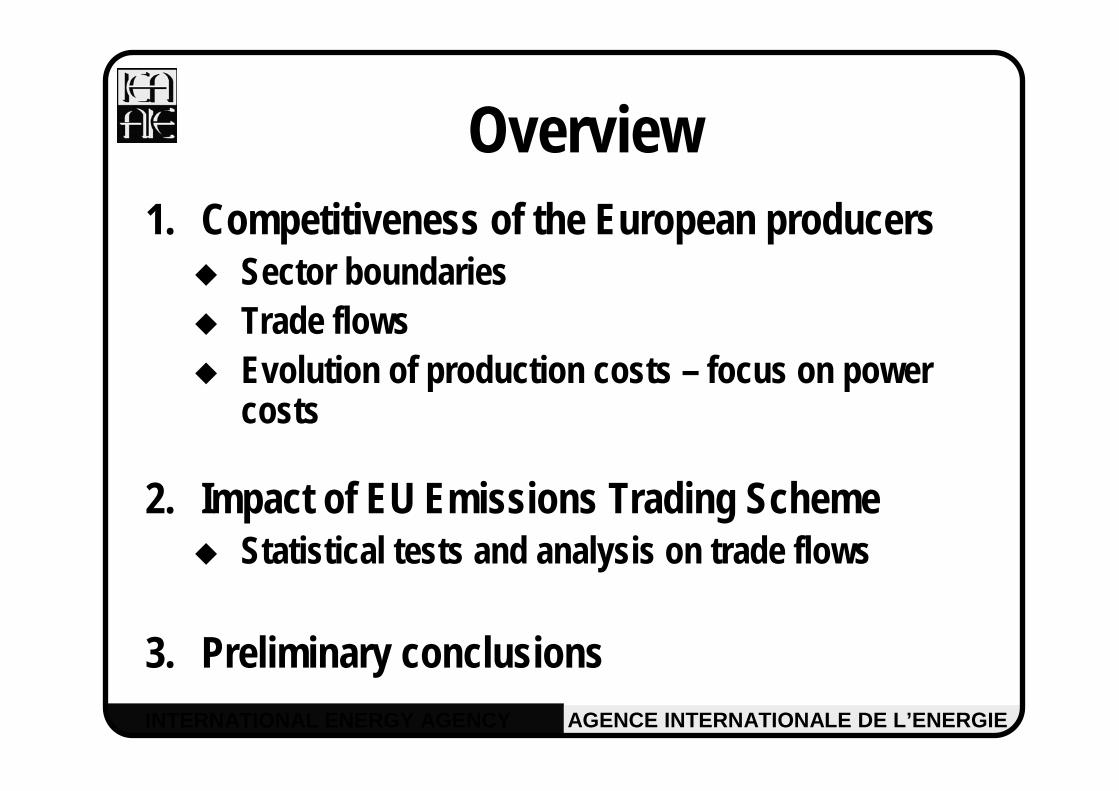
Overview1. Competitiveness of the European producers
Sector boundariesTrade flowsEvolution of production costs – focus on power costs
2. Impact of EU Emissions Trading SchemeStatistical tests and analysis on trade flows
3. Preliminary conclusions

INTERNATIONAL ENERGY AGENCY AGENCE INTERNATIONALE DE L’ENERGIE
Primary smelters
Alu remelters Alu refiners
Primary ingots
Extrusion (billets): round
Rolling (slabs & billets): rectangular
80% new scrap
Plate, sheet, strip, foilstock, etc.
Rods, sections, shapes,tubes, profiles, etc.
Wires and cable
15% primary and old scrap
Production processesSemi-finished
Casting
Cast ingots, bars, billets and slabs- alloyed/unalloyed
Focus on primary aluminum
Primary Rolling ExtrusionAverage European electricity consumption (kWh/tAl) 15 390 624 667
Source: EAA
INTERNATIONAL ENERGY AGENCY AGENCE INTERNATIONALE DE L’ENERGIE
United States29%
Western Europe22%
Others8%
China2%
CIS17%
Australia2%
Africa3%
Brazil2%
Canada7%
Middle East1%
Japan7%
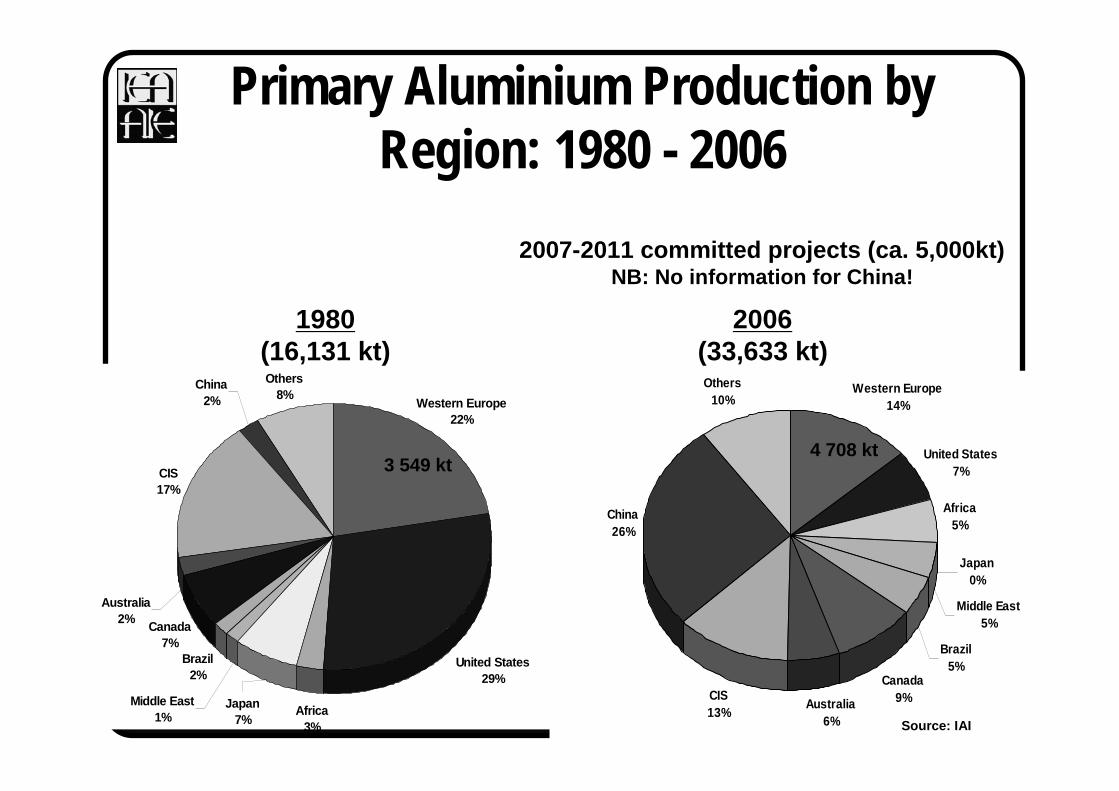
1980(16,131 kt)
2006(33,633 kt)
Primary Aluminium Production by Region: 1980 - 2006
Western Europe14%
United States7%
Africa5%
Japan0%
Middle East5%
Brazil5%
Canada9%Australia
6%
CIS13%
China26%
Others10%
4 708 kt3 549 kt
2007-2011 committed projects (ca. 5,000kt)NB: No information for China!
Source: IAI
INTERNATIONAL ENERGY AGENCY AGENCE INTERNATIONALE DE L’ENERGIE
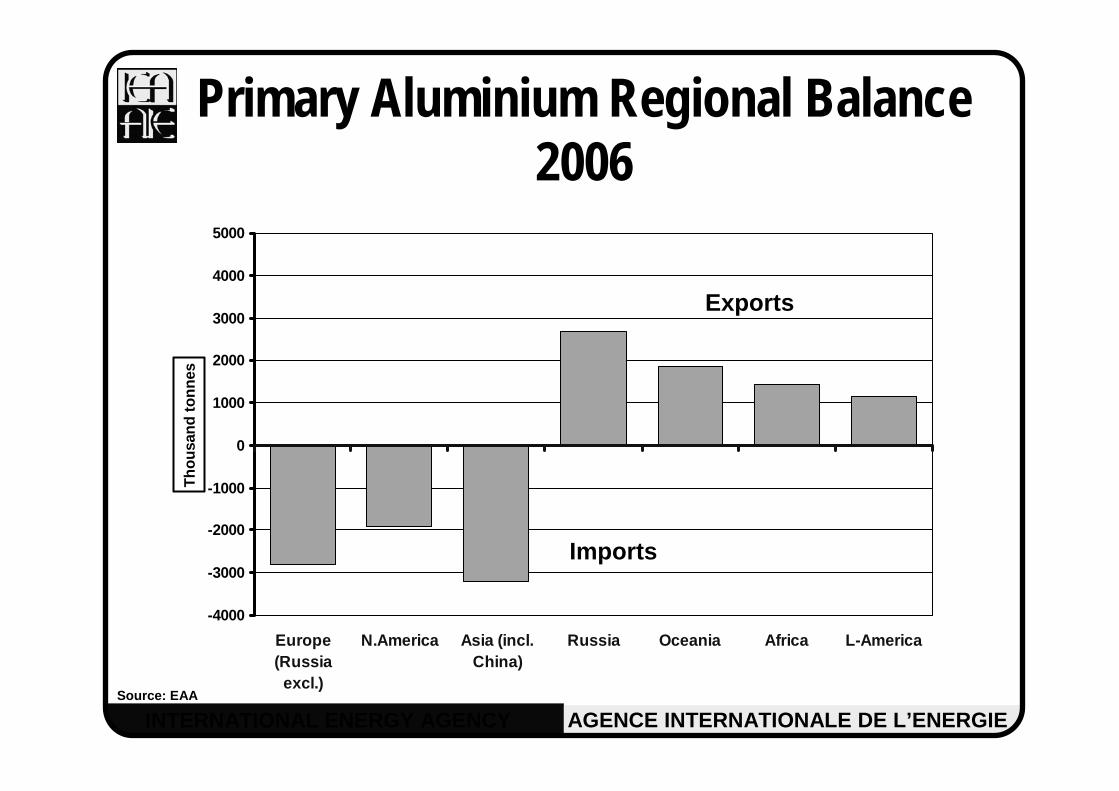
Primary Aluminium Regional Balance 2006
Source: EAA
Exports
Imports
-4000
-3000
-2000
-1000
0
1000
2000
3000
4000
5000
Europe(Russia
excl.)
N.America Asia (incl.China)
Russia Oceania Africa L-America
Th
ou
san
d t
on
nes

INTERNATIONAL ENERGY AGENCY AGENCE INTERNATIONALE DE L’ENERGIE
-
200,000
400,000
600,000
800,000
1,000,000
1,200,000
1,400,000
1,600,000
1Q/99
4Q
/99
3Q/00
2Q
/01
1Q/02
4Q
/02
3Q/03
2Q
/04
1Q/05
4Q
/05
3Q/06
2Q
/07
ton
nes
NB: Quarterly data = annual * 4
EU 27 exports(intra trade not included)
EU 27 imports(intra trade not included)
EU ETS
EU 27 primary aluminium trade
EU 27 production 2006: 3 055 kt
Source: EAA

INTERNATIONAL ENERGY AGENCY AGENCE INTERNATIONALE DE L’ENERGIE
EU-27 imports of primary aluminium by country of origin (intra EU 27 excluded)
Source: EAA
Top 5 countries represent 71% of total EU imports
since 19990
200,000
400,000
600,000
800,000
1,000,000
1,200,000
1Q/9
9 4Q
/99
3Q/0
0 2Q
/01
1Q/0
2 4Q
/02
3Q/0
3 2Q
/04
1Q/0
5 4Q
/05
3Q/0
6 2Q
/07
China
South Africa
Canada
United ArabEmirates
Iceland
Brazil
Mozambique
Russia
Norway
INTERNATIONAL ENERGY AGENCY AGENCE INTERNATIONALE DE L’ENERGIE
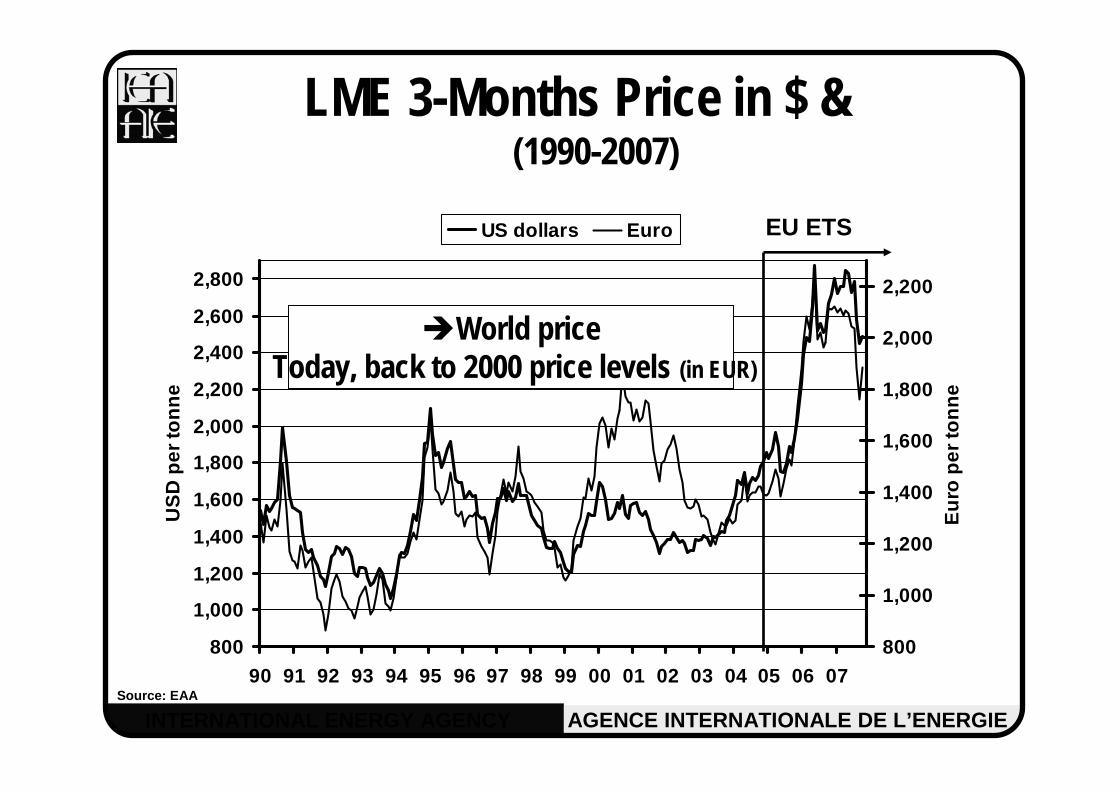
LME 3-Months Price in $ & (1990-2007)
800
1,000
1,200
1,400
1,600
1,800
2,000
2,200
2,400
2,600
2,800
90 91 92 93 94 95 96 97 98 99 00 01 02 03 04 05 06 07
US
D p
er to
nn
e
800
1,000
1,200
1,400
1,600
1,800
2,000
2,200
Eu
ro p
er to
nn
e
US dollars Euro EU ETS
World priceToday, back to 2000 price levels (in EUR)
Source: EAA

INTERNATIONAL ENERGY AGENCY AGENCE INTERNATIONALE DE L’ENERGIE
0
500
1000
1500
2000
Icel
and
No
rway
Ch
ina
Afr
ica
Mid
dle
Eas
t
Ru
ssia
Bra
zil
Can
ada
Wo
rld
EU
27
$/t
Alumina Carbon Anode Labour Power Other
+ 66%+ 50%+ 26%
+ 29%
+ 35%+ 44%
+ 48%
+ 40%
+ 31%+ 44%
2006 cost estimates Variations since 1999
/USD = +16%
Source: CRU www.crugroup.com
INTERNATIONAL ENERGY AGENCY AGENCE INTERNATIONALE DE L’ENERGIE
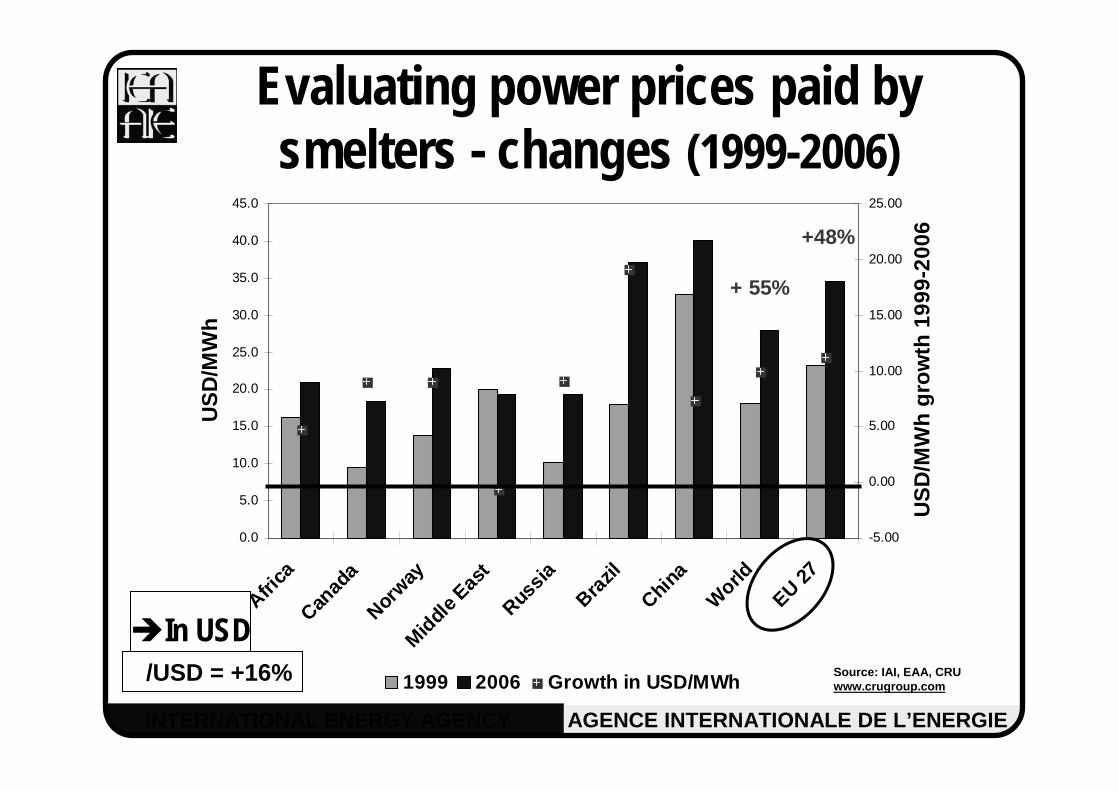
Evaluating power prices paid by smelters - changes (1999-2006)
0.0
5.0
10.0
15.0
20.0
25.0
30.0
35.0
40.0
45.0
Africa
Canad
aNor
wayM
iddl
e Eas
tRus
sia
Brazil
China
World
EU 27
US
D/M
Wh
-5.00
0.00
5.00
10.00
15.00
20.00
25.00
US
D/M
Wh
gro
wth
199
9-20
06
1999 2006 Growth in USD/MWh
+ 55%
+48%
In USDSource: IAI, EAA, CRU www.crugroup.com
/USD = +16%

INTERNATIONAL ENERGY AGENCY AGENCE INTERNATIONALE DE L’ENERGIE
Estimated power prices paid by smelters (1999 & 2006)
0.0
5.0
10.0
15.0
20.0
25.0
30.0
35.0
40.0
45.0
50.0
Germ
any
Nether
lands
Easte
rn E
urope
Icela
ndNorw
ay UKFra
nce Italy
SpainEU 2
7
EU
R/M
Wh
0.00
5.00
10.00
15.00
20.00
25.00
EU
R/M
Wh
gro
wth
199
9-20
06
1999 2006 GrowthBased on CRU and EAA www.crugroup.com
Today, only 18% of EU capacity running on wholesale pricesAll long term supply contracts will expire by 2016
INTERNATIONAL ENERGY AGENCY AGENCE INTERNATIONALE DE L’ENERGIE
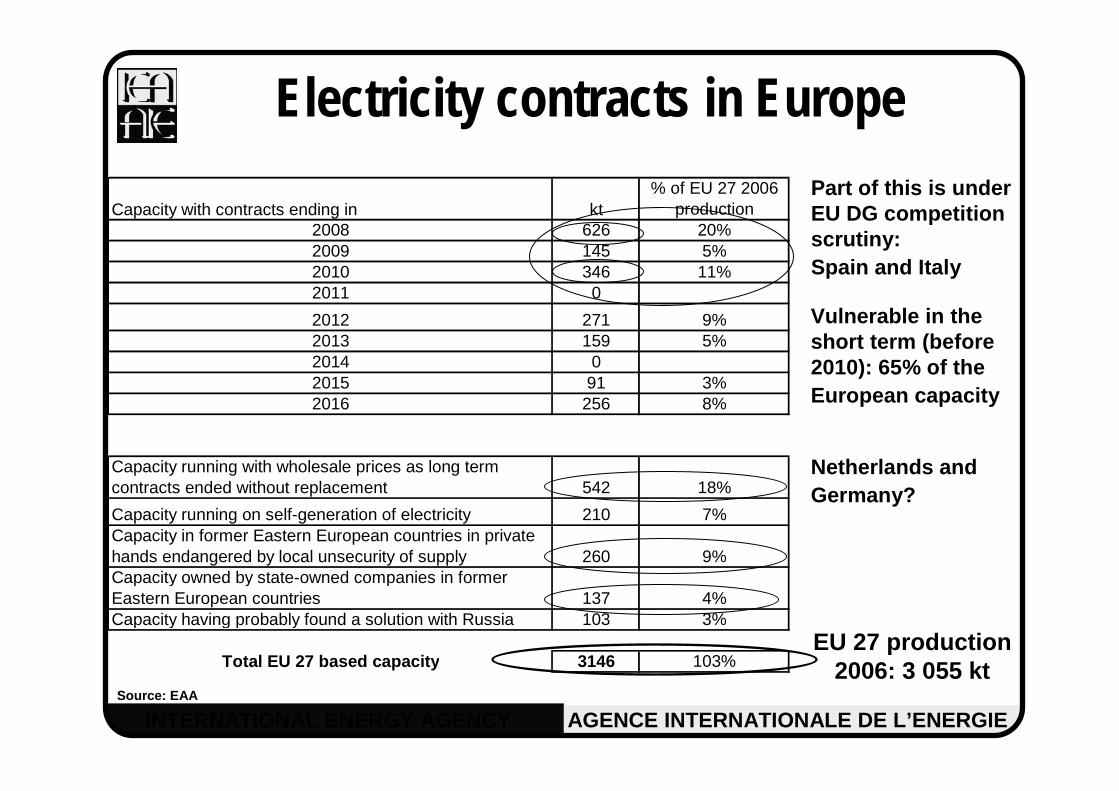
Capacity with contracts ending in kt% of EU 27 2006
production2008 626 20%2009 145 5%2010 346 11%2011 0
2012 271 9%2013 159 5%2014 02015 91 3%2016 256 8%
Capacity running with wholesale prices as long term contracts ended without replacement 542 18%
Capacity running on self-generation of electricity 210 7%Capacity in former Eastern European countries in private hands endangered by local unsecurity of supply 260 9%Capacity owned by state-owned companies in former Eastern European countries 137 4%Capacity having probably found a solution with Russia 103 3%
Total EU 27 based capacity 3146 103%
Electricity contracts in Europe
Vulnerable in the short term (before 2010): 65% of the European capacity
Netherlands and Germany?
Part of this is under EU DG competition scrutiny:Spain and Italy
EU 27 production 2006: 3 055 kt
Source: EAA

INTERNATIONAL ENERGY AGENCY AGENCE INTERNATIONALE DE L’ENERGIE
Regional features of European electricity markets
Market prices set by the marginal generator or bidderScandinavia : prices formed on NORD POOL ('merit order' principle – hourly marginal cost of generation)
“Screen prices” with trading of blocks for baseload needsUK : "screen pricing" with trading of blocks (daily, monthly, trimester) + intra-day adjustment mechanisms. Exception to “screen pricing”: CentricaContinental Europe : "screen pricing" for sale of annual blocks + “spot” (day-ahead) + intra-day adjustments
Annual contractsItaly : annual contracts via tenders (fixed or indexed prices)
Regulated tariffsSpain : “regulated” tariffs may be a chosen option – negotiation between industry and generators since 2006 for long term contracts (generation costs based on domestic coal-fired plants) Italy Reinaud, 2007

INTERNATIONAL ENERGY AGENCY AGENCE INTERNATIONALE DE L’ENERGIE
Impacts of the EU ETSTrade Flows

INTERNATIONAL ENERGY AGENCY AGENCE INTERNATIONALE DE L’ENERGIE
Statistical analysisTesting for CO2 price impact on trade flows of primary aluminium
Quarterly data: Q1 1999 to Q2 2007
Variable: net trade flows in EU 27 EU 27 consumption and productionAluminium price: LME (3 month ahead delivery)
Price premium for delivery in EuropeUS/EUR exchange rateCO2 price
Year ahead price, used as reference for electricity contracts over the next calendar yearAssuming full pass through of CO2 allowance price in electricity prices
Testing for structural change before and after EU ETS

INTERNATIONAL ENERGY AGENCY AGENCE INTERNATIONALE DE L’ENERGIE
Statistical results - Europe
No structural changes in trade flows between 1999 and 2006 in Europe
Some details R2 = 0.82Exchange rate USD/EUR: insignificantSignificant variables (in order of importance):
World aluminium priceConsumption CO2 price (starting 2Q 2004)
Negative Negative correlation between COcorrelation between CO22 and net imports: and net imports: invalidates our modelinvalidates our model’’s assumption that COs assumption that CO22 prices should prices should lead to higher importslead to higher imports
INTERNATIONAL ENERGY AGENCY AGENCE INTERNATIONALE DE L’ENERGIE
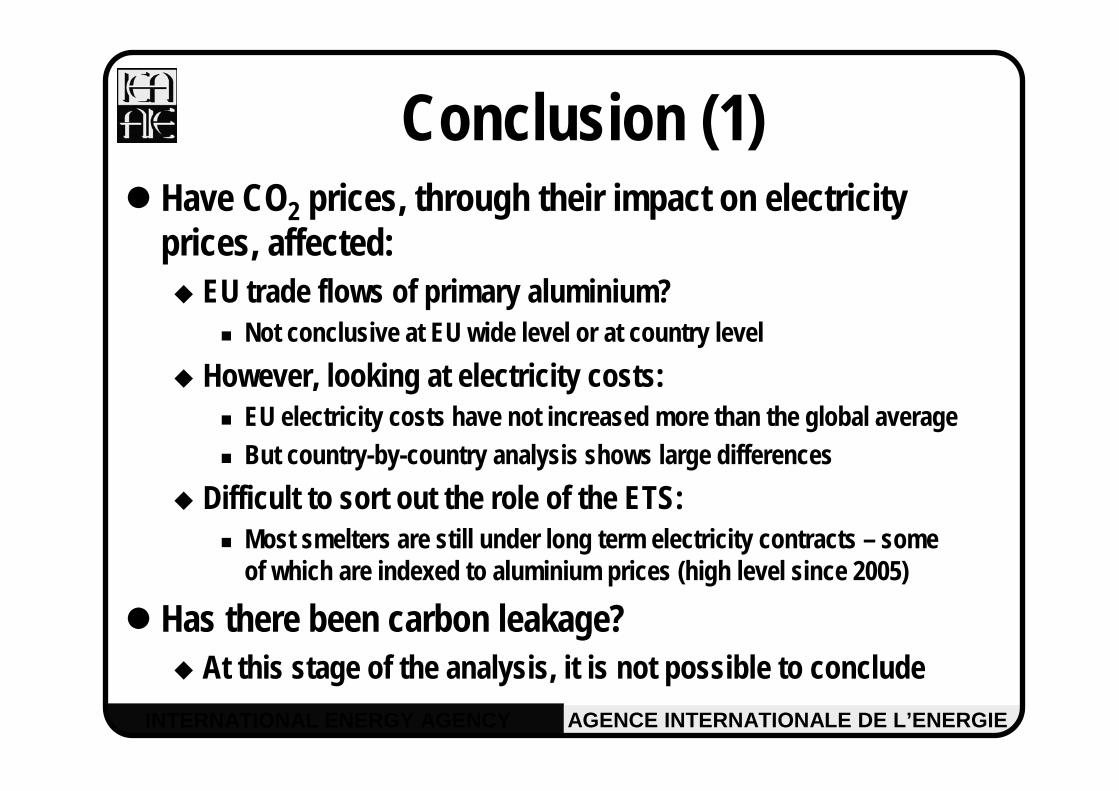
Conclusion (1)Have CO2 prices, through their impact on electricity prices, affected:
EU trade flows of primary aluminium? Not conclusive at EU wide level or at country level
However, looking at electricity costs:EU electricity costs have not increased more than the global averageBut country-by-country analysis shows large differences
Difficult to sort out the role of the ETS: Most smelters are still under long term electricity contracts – some of which are indexed to aluminium prices (high level since 2005)
Has there been carbon leakage? At this stage of the analysis, it is not possible to conclude

INTERNATIONAL ENERGY AGENCY AGENCE INTERNATIONALE DE L’ENERGIE
Conclusions (2)However, the story may change…
Post 2012: Direct emissions are coveredHow will trade exposed industries be “treated” in the EU ETS?
End of long term electricity contractsNew business models for electricity contracts?
Source: EAA
Rolling Extrusion RemeltingAnode produced on-
sitePurchased
carbon anodeAverage 2005 emissions (tCO2/t primary aluminium) 2.79 2.39 0.135 0.155 0.184
Primary
Source: IEA, CRU www.crugroup.com
With anode production
Without anode production
Average Europe 46% 45%
Increase in costs (%)

02 mai 2007
Philippe Quirion (CIRED)Based on materials by the IMACLIM-R team at CIRED,
especially Renaud Crassous

0
5
10
15
20
25
2000 2020 2040 2060 2080 2100
A1b. A1f. A1t .A2. B1. B2.REF 450 ppm
An intermediate BAU scenario and a 450 ppm (F4) scenario, peaking in 2020
stabilisation at 450 ppm implies emissions around 4 GtC in 2050, i.e. ½ tC/capita

0
5
10
15
20
25
30
35
2000 2010 2020 2030 2040 2050
€05/
tCO
2
Europe Rest Annex 1Non-Annex 1
0
50
100
150
200
250
300
350
400
2000 2010 2020 2030 2040 2050
€05/
tCO
2
Europe Rest Annex 1Non-Annex 1
CO2 prices in REF and F4 (450 ppm) scenarios
REF F4
- Exogenous emissions trajectory
- Same CO2 price in all sectors but not in all regions
- Hybrid modelling, coupling:- POLES, a partial equilibrium model of the energy sector (+ cement, steel and aluminium) (LEPII, IPTS)
- IMACLIM-R, a recursive general equilibrium model with explicit technologies in residential and transport sectors (CIRED)
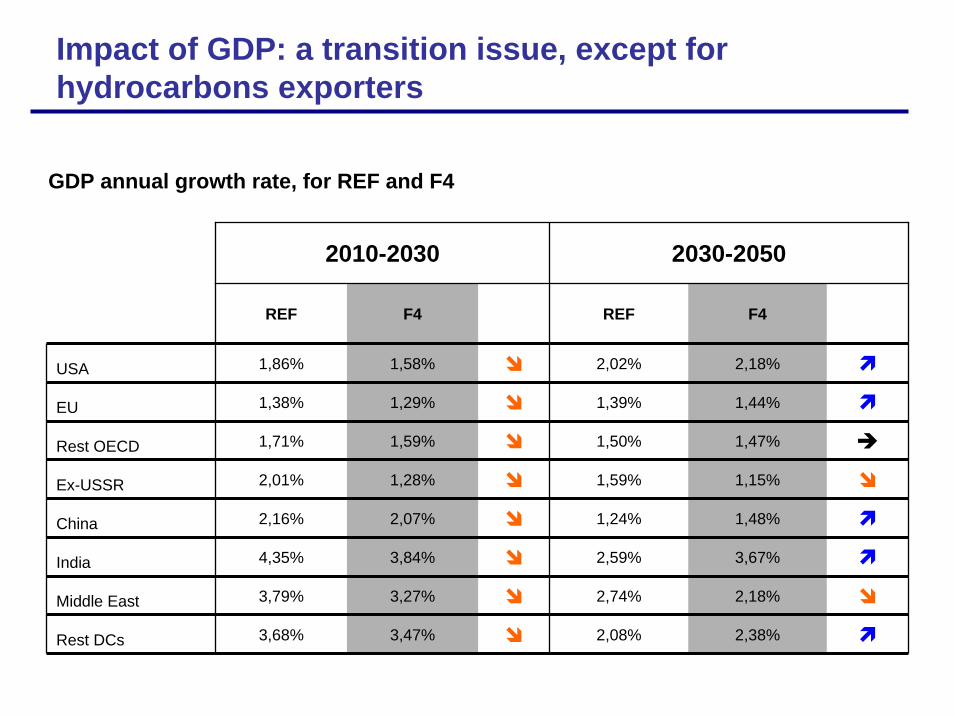
Impact of GDP: a transition issue, except for hydrocarbons exporters
2010-2030 2030-2050
REF F4 REF F4
USA 1,86% 1,58% 2,02% 2,18%
EU 1,38% 1,29% 1,39% 1,44%
Rest OECD 1,71% 1,59% 1,50% 1,47%
Ex-USSR 2,01% 1,28% 1,59% 1,15%
China 2,16% 2,07% 1,24% 1,48%
India 4,35% 3,84% 2,59% 3,67%
Middle East 3,79% 3,27% 2,74% 2,18%
Rest DCs 3,68% 3,47% 2,08% 2,38%
GDP annual growth rate, for REF and F4

Accelerated penetration of low energy dwellings
REF F4
Penetration of Low Energy Dwellings
0%10%20%30%40%50%60%70%80%90%
100%
2000 2010 2020 2030 2040 2050
Standard
Low energy
Very low energy
Penetration of Low Energy Dwellings
0%
20%
40%
60%
80%
100%
2000 2010 2020 2030 2040 2050
Standard
Low energy
Very low energy

Transports: large decrease in oil consumption, very low increase in alternative fuels
REF F4
0
500
1 000
1 500
2 000
2 500
3 000
3 500
2001 2008 2015 2022 2029 2036 2043 2050
Mto
e
Hydrogène
Biocarburants
Electricité
Charbon
Pétrole
Gaz 0
500
1 000
1 500
2 000
2 500
3 000
3 500
2001 2008 2015 2022 2029 2036 2043 2050
Mto
e
Hydrogène
Biocarburants
Electricité
Charbon
Pétrole
Gaz
Impact of the F4 (450 ppm) scenario on materials demand

Steel demand by sector in F4 compared to REF
REF F4
• Steel consumption in buildings: + 22 % in 2050 – Because more re-construction– Despite less steel per building
• Steel consumption in transports: - 32 % in 2050– Because less steel per vehicle– Despite a higher renewal rate
• Steel consumption in other sectors: - 11% in 2050• Overall: - 9% in 2050
0
200
400
600
800
1 000
1 200
1 400
1 600
1 800
2000 2010 2020 2030 2040 2050
Con
sum
ptio
n (M
t)
Rest
Transport
Building
0
200
400
600
800
1 000
1 200
1 400
1 600
1 800
2000 2005 2010 2015 2020 2025 2030 2035 2040 2045 2050
Con
sum
ptio
n (M
t)Rest
Transport
Building
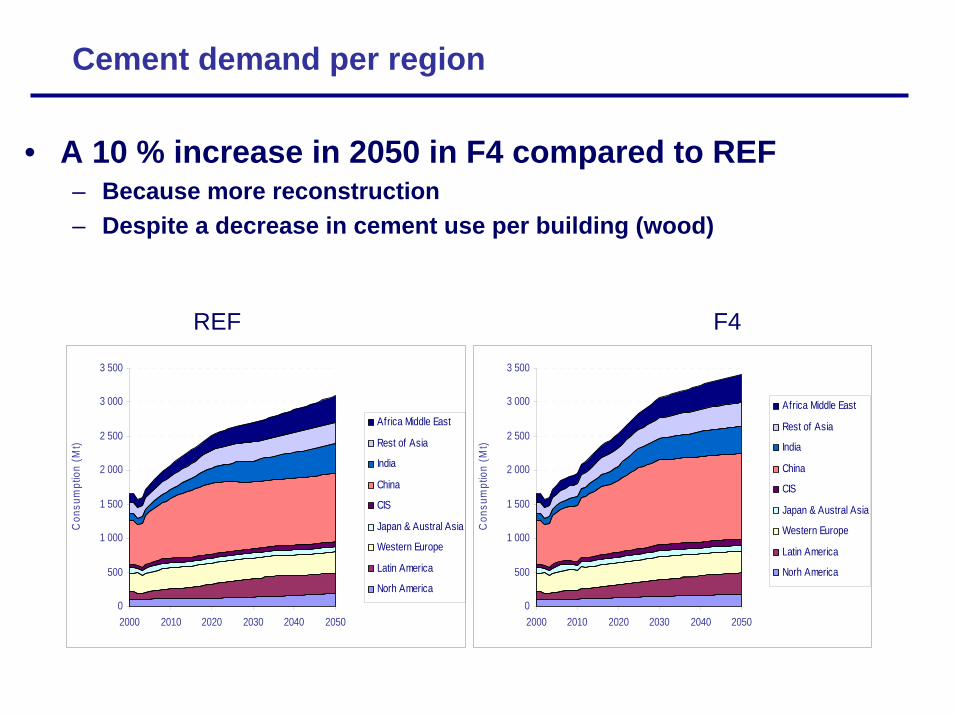
Cement demand per region
REF F4
• A 10 % increase in 2050 in F4 compared to REF– Because more reconstruction – Despite a decrease in cement use per building (wood)
0
500
1 000
1 500
2 000
2 500
3 000
3 500
2000 2010 2020 2030 2040 2050
Con
sum
ptio
n (M
t)
Africa Middle East
Rest of Asia
India
China
CIS
Japan & Austral Asia
Western Europe
Latin America
Norh America0
500
1 000
1 500
2 000
2 500
3 000
3 500
2000 2010 2020 2030 2040 2050
Con
sum
ptio
n (M
t)
Africa Middle East
Rest of Asia
India
China
CIS
Japan & Austral Asia
Western Europe
Latin America
Norh America

Aluminium demand per region
REF F4
• Slight decrease (-7% in 2050) in F4 / REF
0
10
20
30
40
50
60
70
80
2000 2010 2020 2030 2040 2050
Con
sum
ptio
n (M
t)
Africa Middle East
Rest of Asia
India
China
CIS
Japan & Austral Asia
Western Europe
Latin America
Norh America0
10
20
30
40
50
60
70
80
2000 2010 2020 2030 2040 2050
Con
sum
ptio
n (M
t)
Africa Middle East
Rest of Asia
India
China
CIS
Japan & Austral Asia
Western Europe
Latin America
Norh America

Flat glass demand per region
REF F4
• + 63 % in 2050 in F4 / REF– Massive development of double & triple glazing and solar water heaters– More reconstruction
0
20
40
60
80
100
120
2000 2010 2020 2030 2040 2050
Con
sum
ptio
n (M
t)
Africa Middle East
Rest of Asia
India
China
CIS
Japan & Austral Asia
Western Europe
Latin America
Norh America
0
20
40
60
80
100
120
2000 2010 2020 2030 2040 2050
Con
sum
ptio
n (M
t)
Africa Middle East
Rest of Asia
India
China
CIS
Japan & Austral Asia
Western Europe
Latin America
Norh America

What impact on leakage?
• Summary: Glass + 63%, Cement + 10%, Steel - 9%, Aluminium - 7%• For cement, ongoing econometric study on the determinants of net
exports (exports – imports) in the short run– With Neil Walker (UCD) – Separate regressions for France, UK, Germany, Spain and Portugal– 1976-2005– Tested variables: relative cost, available capacities, EU ETS
• Results – EU ETS: never significant– Relative cost: significant only in France and Spain– Available capacities: significant in all countries
• Weakly in France and Germany (hidden by reunification)• Strongly in the UK, Portugal and Spain: 1 more ton of available capacities
0.5 more ton of net exports
• In the short run, increase in cement consumption leakage• What about the long run, i.e., new capacities?

Table 1. Results of model 1
RHS variables (expected sign of the coefficient)
AvailCapi (+) AvailCapSpain (-)
Country Adj. R²
Coefficient Significance level
Coefficient Significance level
France 0.08 0.13 8% NT
UK (1978-2002)
0.53 0.46 1% NT
Germany (1978-89)
0.41 0.06 12% NT
Portugal** 0.45 0.53 1% -0.03 5%
Spain* 0.51 0.42 1% NT
NT: not tested because no relationship expected. * The Durbin-Watson statistic is in the uncertainty zone.
** The Durbin-Watson statistic indicates a positive autocorrelation of residuals

Philippe QUIRION (CNRS, CIRED)Based on a joint work with Damien Demailly (formerly CIRED)
Two Policies to Address Leakage: Border Adjustments and Output-Based Allocation
Climate Strategies Workshop Tackling Leakage in a World of Unequal Carbon Prices
4 February 2008

Free allocation in the EU ETS
• The 2003 directive:• Neither pure lump-sum allocation (as in the US SO2 scheme)
nor pure output-based allocation, rather capacity-based• Various motives for free allocation
1. maintain profits in the covered sectors2. address leakage
• The 2008 revision:• Free allocation mostly in sectors at risk of leakage• Unclear how the free allowances will be distributed
• Economic analysis:• Pure lump-sum allocation cannot address leakage• Output-based allocation can, but is less efficient at least in a
closed economy (e.g. Fischer, 2001; Haites, 2003; Demailly & Quirion, 2006)
Five proposals assessed
Grandfathering and Auctioning – GF&AUGF means pure lump-sum allocation.
Output-Based Allocation – OBThe amount of free allowances a firm gets is proportional to its current output level.
Auctioning + Border Adjustments – AU-BAExporters from the EU get allowances for 80% of average EU emissions (~BAT), importers must buy allowances for emissions embedded in their products (80% of EU average emissions per unit of output).
Hybrid allocation – OB-AU (the closest to the revised EU ETS?) OB for trade exposed sectors & AU for non exposed sectors.

CASE: 4 sectors and 2 regions

CO2 prices
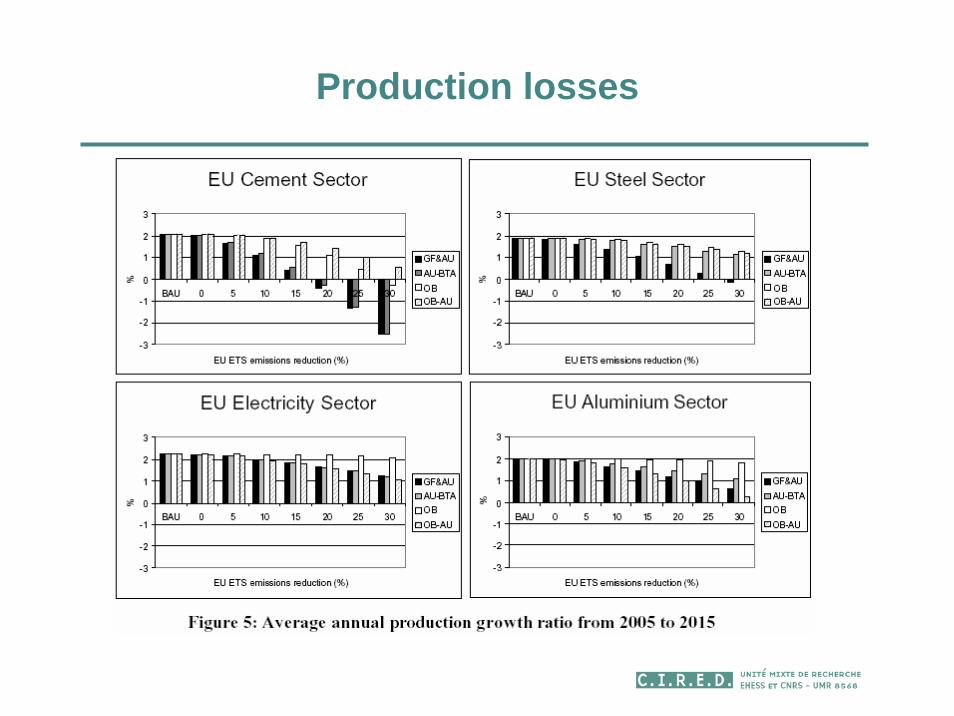
Production losses

CO2 leakage ratio RoW
UE
EE
Δ=−Δ

EU Welfare lossesw/o benefits of abatement, not accounting for leakage

EU welfare lossesw/o benefits of abatement, accounting for leakage

EU welfare lossesw/o benefits of abatement, accounting for leakage and foreign
welfare losses

Wealth transfers from the RoW to the EU
AU & GF:Increase prices for EU exported goodsTransfer wealth from foreign consumers to EU firms (GF) or budget (AU)
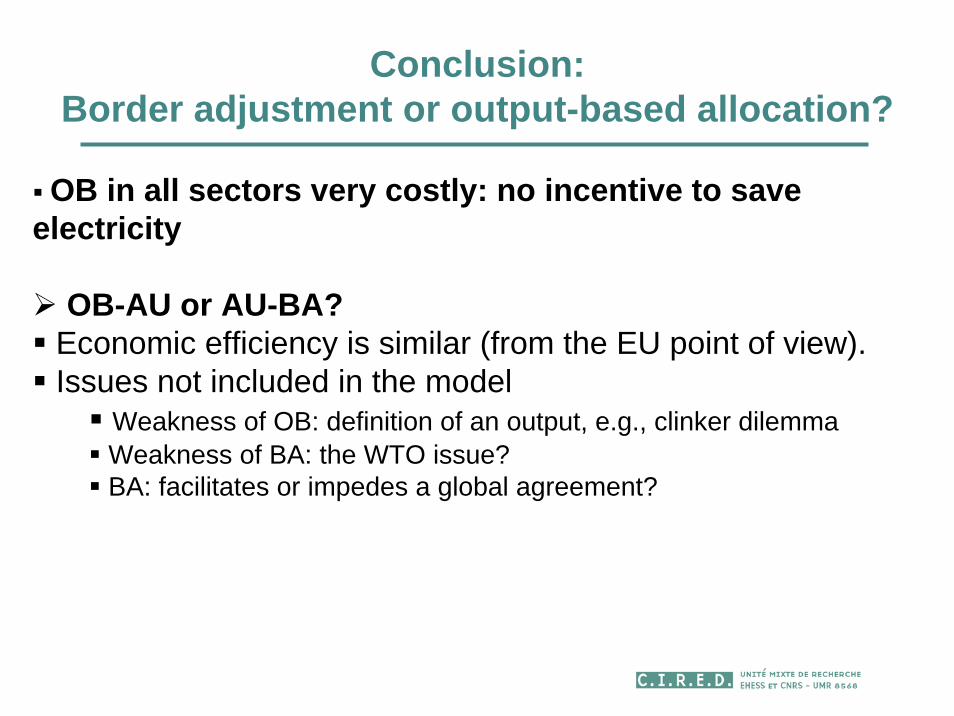
Conclusion: Border adjustment or output-based allocation?
OB in all sectors very costly: no incentive to save electricity
OB-AU or AU-BA?Economic efficiency is similar (from the EU point of view).Issues not included in the model
Weakness of OB: definition of an output, e.g., clinker dilemmaWeakness of BA: the WTO issue?BA: facilitates or impedes a global agreement?

A non-Protectionist Border Economic Adjustment in the Context of
Unilateral EU Post-Kyoto climate Commitments
Olivier GodardCnrs et Ecole polytechnique, Paris
Paris, February 4, 2008
Workshop onTackling Leakage in a World of
Unequal Carbon Prices

• Either no global Post-Kyoto regime is arrived at by 2010, or final national commitments reflect significantly different rates of effort, leading to heterogeneous shadow prices of carbon in different regions of the world
• No international sectoral agreements for exposed sectors (steel, aluminium, cement…)
• The EU sticks to its own agenda (- 20% in 2020 emissions; - 75% in 2050)
• The EU still wants to preserve future options of international cooperation with other states
• The EU remains concerned to set-up domestic measures compatible with WTO rules
• The EU maintains limits to the use of CDM credits in the ETS
Olivier Godard
Assumptions

1. Border economic adjustment (BEA) becomes an obstacle to reaching a multilateral agreement:
(a) because it is perceived as an hostile attitude and cut the willingness of other states to cooperate(b) because some states among key LDCs or other industrialized countries sue the EU before the WTO and take retaliation measures
2. The EU takes unilateral climate commitments without any BEA(a) This self-punishment option is advantageous for import from non-EU countries and reinforces incentive given to them to free-ride, which becomes an additional obstacle to reaching a Multilateral Climate Agreement (MCA)(b) Carbon leakage through loss of markets shares on the EU market and worldwide(c) By losing some industrial power, the EU is weakening its project to become a competitive knowledge economy and losing influence on the international arena.
Two self-defeating strategies
Olivier Godard

1. The BEA should make the new situation less favourable for Non-EU countries than a unilateral climate commitment without BEA, but still more favourable for them than the absence of unilateral commitment of the EU and the corresponding level of industrial competition
2. The EU unilateral commitment and BEA should be presented as one indivisible package
3. BEA should be so designed that it is made the more palatable to the WTO rules as possible
4. BEA should be conceived as a way to supplement and improve rules of ETS, which is a condition for the EU climate targets to be reached
5. Harnessing the BEA as a dynamic incentive leading the technological competition to benefit the climate policy
Key strategic directions for the design of BEA
Olivier Godard

1. Scope:only basic materials (iron, cement, glass, aluminium) and energy products (fuels) being internationally traded and submitted to direct or indirect (impact of increased electricity prices due to carbon constraints) significant CO2 constraints within the Post-2012 ETS perimeter
2. Targets:Every imports of those products from non-EU countries (non-discrimination principle) and, symmetrically exports from EU producersCountries involved in a Post-Kyoto MEA take similar BEA measures regarding the EU and other countries (same as is done for consumer or VAT taxes)
3. Two bases of adjustment:the EU sectoral rate of effort and the BAT counterfactual
Features of a EU Border Economic Adjustment
Olivier Godard

4. Principles:1. combining action on imports and action on exports2. Imposing on imports an effort inferior to the EU one3. Avoiding cumbersome task of searching information on
specific production processes abroad and making it through the reference to BAT
5. A preferred way for implementation2. An obligation for importers to buy Q permits on the EU
GHG market or CDM and JI credits Q = Qimp X effort rate X BAT specific rate of direct and indirect (electricity) emissions with Qimp = quantities of imported products
Avoids the first source of carbon leakage3. Remittance of GHG quotas to EU exporters from a
dedicated reserve taken from the gross capAvoids the second source of carbon leakage
(assumption of indivisible productive assets for both the EU market and exports for the world market)
Features of a EU Border Economic Adjustment
Olivier Godard

6. The formula:• A European sectoral rate of effort would have two
components:– The gap between the sectoral EU BAU emissions and the
sectoral amount of EUAs allocated for free:
Features of a EU Border Economic Adjustment
Olivier Godard
)r)(g(eeergee
iiielect
iciiielect isectorEU eachrate for Effort−+
−−+
+
+=11)(
)1)(1()(
With et the direct emissions in reference year t,eelec
i the amount of EUAs incorporated in power consumption needed to get the output of sector i, ec the share of EUAs given for free for the next period,g the expected growth rate of the sectors covered by the scheme for the next period,r the rate of carbon efficiency progress expected in the sector per product for the next period

7. An example with the sector of cement:• Emission rate of BAT: 0.7tCO2eq/tcement;• Sectoral rate of effort: 20%;• Candidate to imports: 40 Mt cement• BEAcement = 40 M X .20 X .7 = 5.60 MtCO2eq to buy on
the market• If the value of 1 EUA by 2013 is 30 €, it means an
overcost to import of 168 M€, or 4.2 €/tcement.• With a EU price of cement of 65€/t, it means a BEA of
6,5% of the cement’s price • With full auction for the EU cement sector, the BEA
would come to 32.5% of the EU market price• The only difference between importers and EU
producers would then find its origin in technological efficiency
Features of a EU Border Economic Adjustment
Olivier Godard

8. A mechanism delivering incentives both for EU and non-EU producers
– The more EU producers incorporate BAT technologies, the more they reduce the gap of treatment between them and importers on the EU market and the more they benefit of restitutions of quotas for exports, and.
– Non-EU producers have an incentive to develop new climate-friendly technologies: it will change the BAT and increase their benefits from the gap between the BAT and EU current technology.
industrial competition will become a driver for enhancing climate policy Olivier Godard
Features of a EU Border Economic Adjustment

Compatibility depends on several conceptual assimilations:
• Can the obligation of EU firms to surrender EUAs at the end of each period be said a tax in WTO words? Yes (compulsory, without counterpart, EUAs have a market value)
• Can GHGs emissions be said inputs of production processes? Yes since they are consumptions of units of carrying capacity of the atmosphere under a climate limit
• Can the atmosphere be said a scarce non renewable resource as regards the climate issue? Yes since, for any human time horizon, interference with the climate system will last for numerous centuries
Conclusion: which compatibility with WTO rules?
Olivier Godard

BEA meets several WTO requirements• Imported products are not treated less favourably than domestic
ones (principle of national treatment – Article III of GATT)
• Border measures for protecting non renewable resources are accepted (authorized environmental exceptions - Article XX(g))
• The BEA is not arbitrary and is based on sound justifications regarding the environmental goal (avoiding carbon leakage and enhancing international cooperation to address a global issue (chapeau of Article XX)
• The BEA is respectful of the sovereignty of other countries (it doesnot impose domestic technologies to others)
• The BEA dos not introduce unjustified discrimination betweennon-EU countries
• The EU has a direct interest in having the global climate protectedfrom a dangerous evolution
Conclusion: which compatibility with WTO rules?
Olivier Godard
Roland Ismer(Faculty of Law)
The Legal FrameworkWhat are the Limitations to Border Taxes?
Border Tax Adjustments
Roland Ismer February 4, 2008 2
I. Border Tax Adjustments – The Rationale
- Climate change requires price signal on
Carbon
- Different willingness in different countries
- Result may be leakage
- BTA as a „Decompression Chamber“
(Godard)

Border Tax Adjustments
Roland Ismer February 4, 2008 3
II. Definition
Border Tax Adjustments (BTA) are fiscal measures designed to
(i) relieve exported products of some or all of the tax charged in the exporting country in respect of similar domestic products sold to consumers on the home market; or
(ii) impose on imported products some or all of the tax charged in the importing country on similar domestic products

Border Tax Adjustments
Roland Ismer February 4, 2008 4
III. Importance of Legality under WTO
- Otherwise possible retribution
- Maintains good-will
- Provides confidence for investors (long-term
sustainability of scheme)
- No clearance mechanism
- NB: WTO-Legality may not be absolutely
necessary
Border Tax Adjustments
Roland Ismer February 4, 2008 5
III. Importance of Legality under WTO
- Illegal subsidy/discrimination?
- Justification for discrimination?
Avoid discrimination illegal
subsidy/
AND/OR
Provide justification

Border Tax Adjustments
Roland Ismer February 4, 2008 6
1. Illegal Subsidy/Discrimination
a) EXPORTS: Avoid Illegal Subsidy!
- Prior-stage cumulative taxes adjustable
- Allowances as taxes?
- Adjustable taxes? Only if incorporated!
Fn. 61 to Annex II?
- At what level?
- Generally no justification for subsidies (but: symmetry as
overriding argument?)

Border Tax Adjustments
Roland Ismer February 4, 2008 7
1. Illegal Subsidy/Discrimination
• IMPORTS: Avoid discrimination under Art. III: 2 Sent. 1 GATT ("like products")
- Product based- Energy input incorporated?- No discrimination if deemed usage of best
available technology (P of recycling)- Issue: Electricity!- Alternative: use average, and allow for
refuting conjecture (American Superfund)?

Border Tax Adjustments
Roland Ismer February 4, 2008 8
1. Illegal Subsidy/Discrimination
c) IMPORTS: Avoid Discrimination under Art. III: 2 Sent. 2 GATT (Directly competitive and substitutable products)
Border Tax Adjustments
Roland Ismer February 4, 2008 9
1. Illegal Subsidy/Discrimination
• IMPORTS: Most Favored Nation Treatment under GATT (Art. I GATT)
Participation in Kyoto or succeeding Protocol as reason for different treatment? Possibility of linking schemes?

Border Tax Adjustments
Roland Ismer February 4, 2008 10
1. Justification under Art. XX GATT
Two tier structure:
a) Any of the eight headingsb) Châpeau
Judiciary has sometimes been generous;yet example of ECJ suggests, where available,avoiding discrimination is safer option

Border Tax Adjustments
Roland Ismer February 4, 2008 11
V. Lawyers Can be Creative: How to Implement It?
- How to adjust: Taxes or allowances? - Framework convention (as under Customs
Law)?- Imputation of export taxes?- Imputation of costs for allowances in home
country? (Linking)- Definition of BAT?
Border Tax Adjustments
Roland Ismer February 4, 2008 12
VI. Conclusion
Issues• BAT or Average Technology as Refutable
Conjecture • Electricity?• Subsidies for exports not justifiable?!
US Climate Policy – Trade Policy Intersections: Current Status,
Prospects and Implications for Carbon Leakage
Thomas L. Brewer
Presentation for Climate Strategies Workshop – Paris -– 4 February 2008

Brewer - Climate and Trade Policy Intersections
2
Outline of Comments
I. Objectives
II. Overview of types of climate-trade intersections
III. Two Key Senate Bills
IV. Political context
V. Suggestions
Brewer - Climate and Trade Policy Intersections
3
Objectives
Agenda setting
Issue framing
Problem solving

Brewer - Climate and Trade Policy Intersections
4
Overview of types ofclimate-trade intersections
• Offsetting border measures• Tariff and NTB reductions• Aviation and shipping industries• Export and outward FDI promotion• International technology cooperation agreements• Program budgets• Subsidies for renewables and energy efficiency• Product labeling and standards• Government procurement
Brewer - Climate and Trade Policy Intersections
5
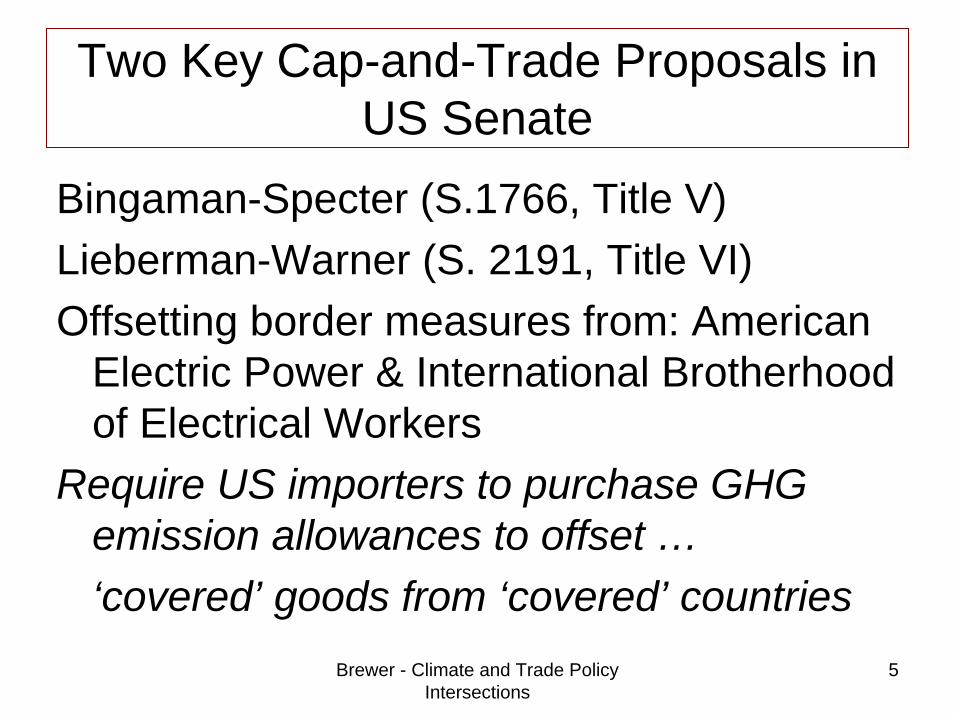
Two Key Cap-and-Trade Proposals in US Senate
Bingaman-Specter (S.1766, Title V)Lieberman-Warner (S. 2191, Title VI)Offsetting border measures from: American
Electric Power & International Brotherhood of Electrical Workers
Require US importers to purchase GHG emission allowances to offset …‘covered’ goods from ‘covered’ countries
Issue Framing
International competitiveness issue
International trade ‘level playing field’ issue
Not climate change ‘carbon leakage’ issue
Brewer - Climate and Trade Policy Intersections
6

Brewer - Climate and Trade Policy Intersections
7
Political Situation
>Trade is problematic issue for Democrats>Split within business community:
opposition by National Foreign Trade Council
>Climate change is still partisan issueLieberman-Warner (S. 2191) passed committee by 11-8 vote…For: 10 Dems + 1 RepAgainst: 8 Reps + 0 Dems
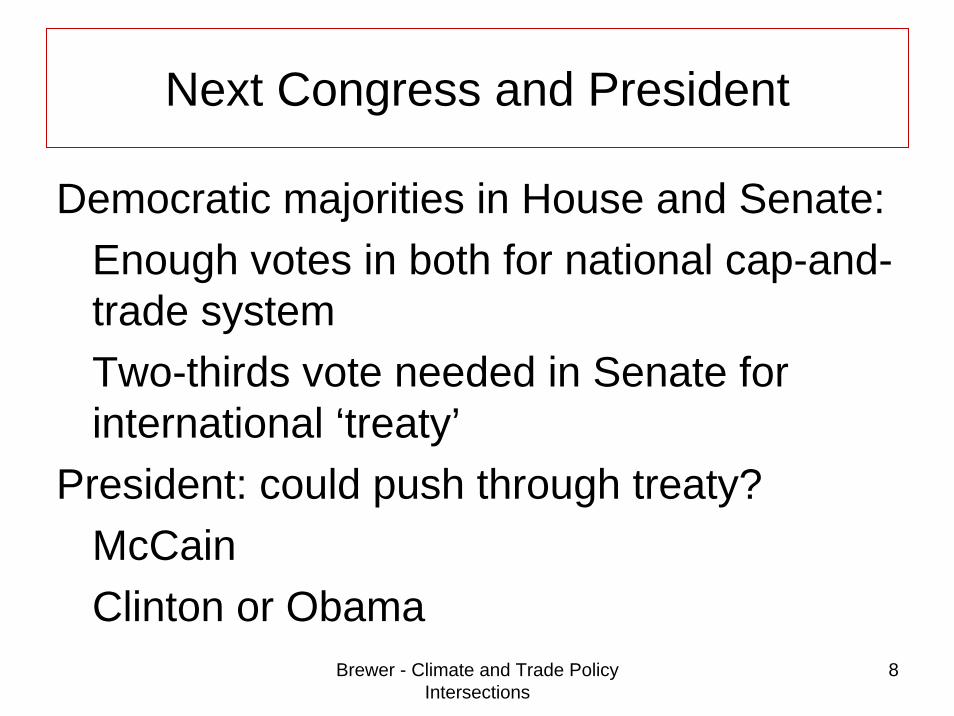
Next Congress and President
Democratic majorities in House and Senate:Enough votes in both for national cap-and-trade systemTwo-thirds vote needed in Senate for international ‘treaty’
President: could push through treaty?McCainClinton or Obama
Brewer - Climate and Trade Policy Intersections
8

Brewer - Climate and Trade Policy Intersections
9
Suggestions
• Include explicit statement in legislation: US support for multilateral climate and trade institutions
• Allow participation of US importers in foreign offset projects as well as purchases of USG ‘international allowances’
• Incorporate offsetting border measures in post-2012 ‘sectoral’ agreements
• Propose (jointly with EU) free-rider trade sanctions in post-2012 multilateral climate regime
Brewer - Climate and Trade Policy Intersections
10
For further information and comments
www.usclimatechange.com

The China Factor
Major EU Trade Partners’ Policies to Address Leakage
Bernice LeeHead, Energy, Environment and Development Programme
4th February 2008

2
The China factor
Key challengesPositive signals on climate changeWhat China really wants, or needs…Areas for EU-China cooperation

3
Growing energy consumption and emissions
Consumption: Until 2030, expected to grow by 2.9% in China p.a.
High net importer of oil: until 2030, China will import 80% of its oil supply.
Emissions: preliminary estimates for 2006 China topped the list of CO2 emitting countries. But per capita energy consumption in China is three times less than the EU.
Six key sectors: Metals, power, steel, oil refining, chemicals and construction materials consume 70% of China’s energy for industry.
4
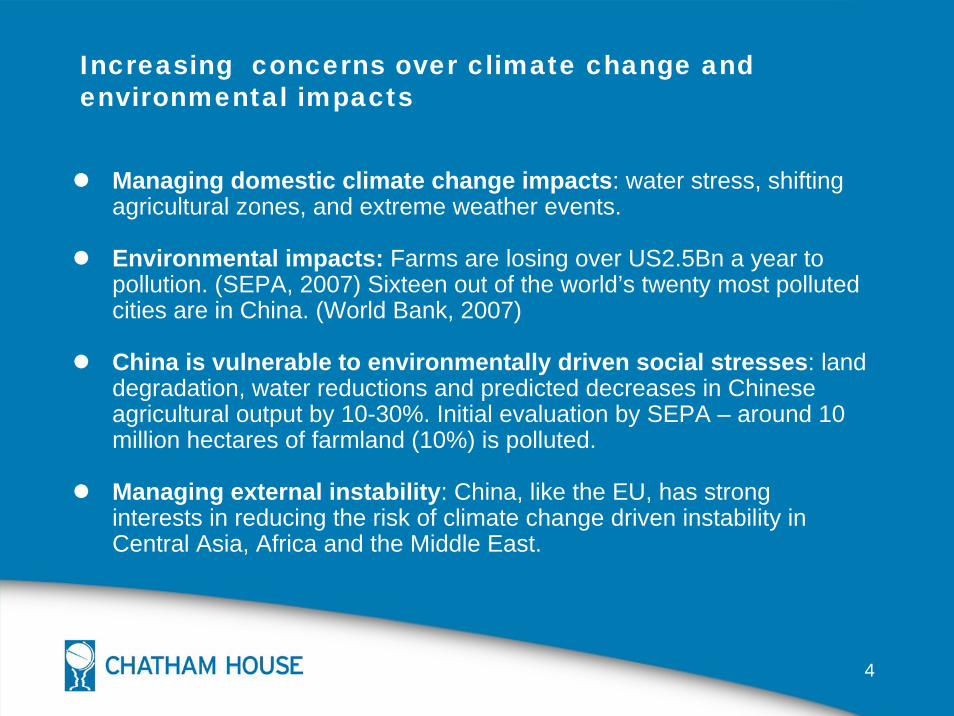
Increasing concerns over climate change and environmental impacts
Managing domestic climate change impacts: water stress, shifting agricultural zones, and extreme weather events.
Environmental impacts: Farms are losing over US2.5Bn a year to pollution. (SEPA, 2007) Sixteen out of the world’s twenty most polluted cities are in China. (World Bank, 2007)
China is vulnerable to environmentally driven social stresses: land degradation, water reductions and predicted decreases in Chineseagricultural output by 10-30%. Initial evaluation by SEPA – around 10 million hectares of farmland (10%) is polluted.
Managing external instability: China, like the EU, has strong interests in reducing the risk of climate change driven instability in Central Asia, Africa and the Middle East.
5
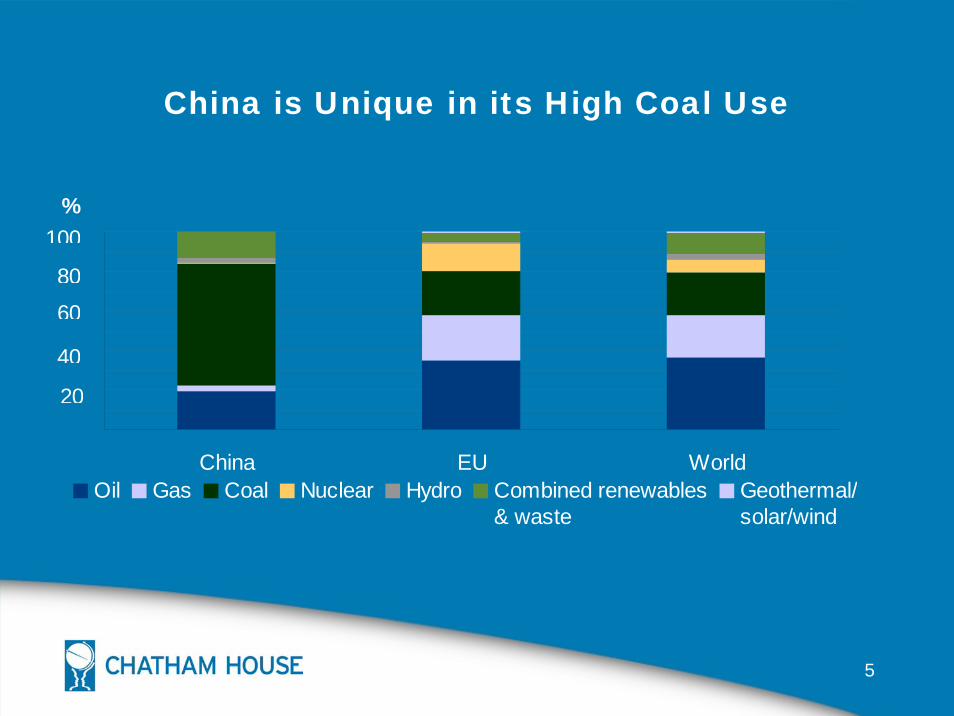
China is Unique in its High Coal Use
China EU WorldOil Gas Coal Nuclear Hydro Combined renewables
& wasteGeothermal/solar/wind
40
20
60
80
100%

6
Challenges:Aging infrastructure means significant new energy investment anticipated in China, the EU and the US
Source: IEA, 2006; Euroelectric 2007
New Electricity Capacity 2005-2030 GW
0
200
400
600
800
1000
1200
US EU Japan Russia China India MiddleEast
Africa LatinAmerica
7
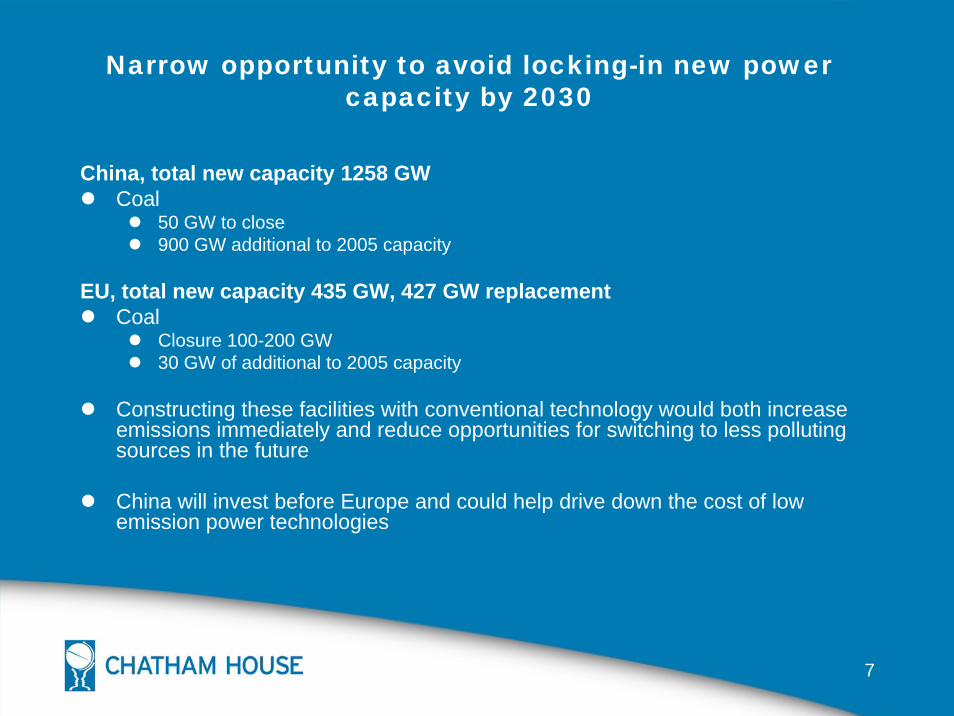
Narrow opportunity to avoid locking-in new power capacity by 2030
China, total new capacity 1258 GWCoal
50 GW to close900 GW additional to 2005 capacity
EU, total new capacity 435 GW, 427 GW replacementCoal
Closure 100-200 GW30 GW of additional to 2005 capacity
Constructing these facilities with conventional technology would both increase emissions immediately and reduce opportunities for switching to less polluting sources in the future
China will invest before Europe and could help drive down the cost of low emission power technologies

8
57%25%
7%
11% 6%
4%
9%
5%14%
16%
32%
27%7%
9%
21%
4%
45%
14%
22%
19%
6%4%9%
16%Space heating Cooling Water heating Cooking Lighting Others
EU residential buildngs’ energy use EU commercial buildings’ energy use
China residential buildings’ energy use China commercial buildings’ energy use
• Accounts for 20% of China’s final energy consumption (compared to 40% of the EU)
• By 2020, new buildings in China total 20 billion m2 = total EU-15 current building stock
• China housing program uses 20% of steel and 17.6% cement.
China has yet to lock-in inefficiency in the building sector
9
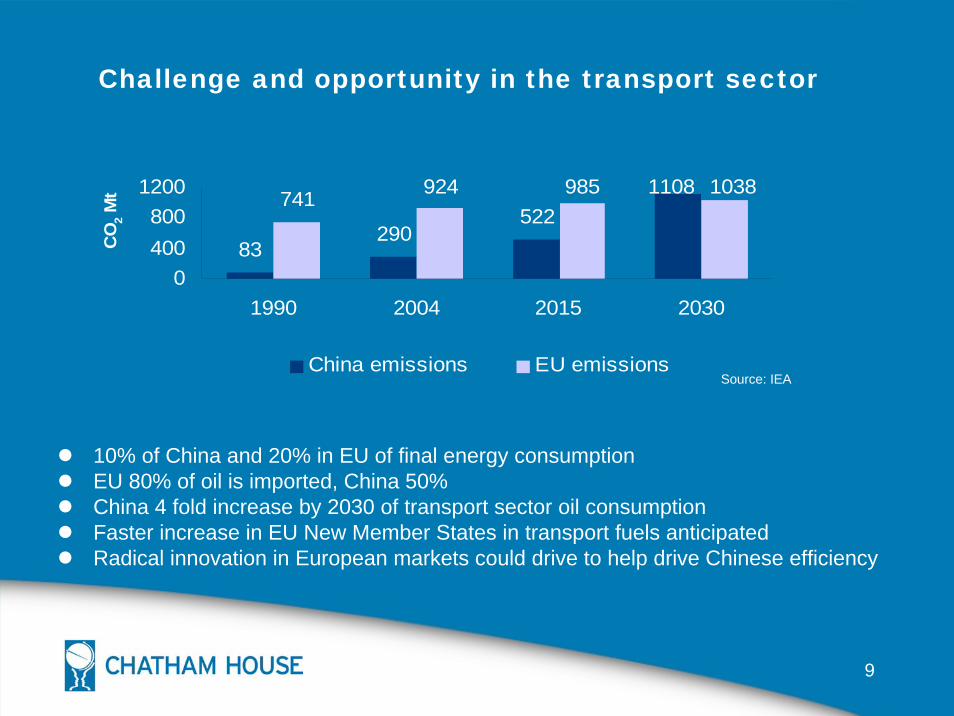
Challenge and opportunity in the transport sector
10% of China and 20% in EU of final energy consumptionEU 80% of oil is imported, China 50%China 4 fold increase by 2030 of transport sector oil consumptionFaster increase in EU New Member States in transport fuels anticipatedRadical innovation in European markets could drive to help drive Chinese efficiency
Source: IEA
83290
522741 924 985 1108 1038
0400800
1200
1990 2004 2015 2030
China emissions EU emissions
CO
2 Mt

10
Energy and climate concerns threaten Chinese domestic stability
More important
Less important
Harder Easier
Political stability
Food security
Relations with resource rich
regions
Energy services
for all
Employment creation
Energy independence/ Price stability
Reducing emissions
Clean coal technologies
Clean water
Extending growth to
poor regions
Tackling climate impacts
Maintaining Economic
growth
Domestic Stability
Energy Security
Improving energy
efficiency
Water security
Reform of State-owned enterprises
Territorial dispute in the South China
Sea
Clean air Improving
environmental protectionClimate security &
dealing with environmental
degradation
Reducing external threats Reducing
trade surplus
Dealing with external threats
Increased weight in
international affairs
Value addition
production
Increasing technological
know-how
Improve relations with neighbours
Respect in the
international system
Regional influence
Economic Security
Increasing Role in International
Affairs
11
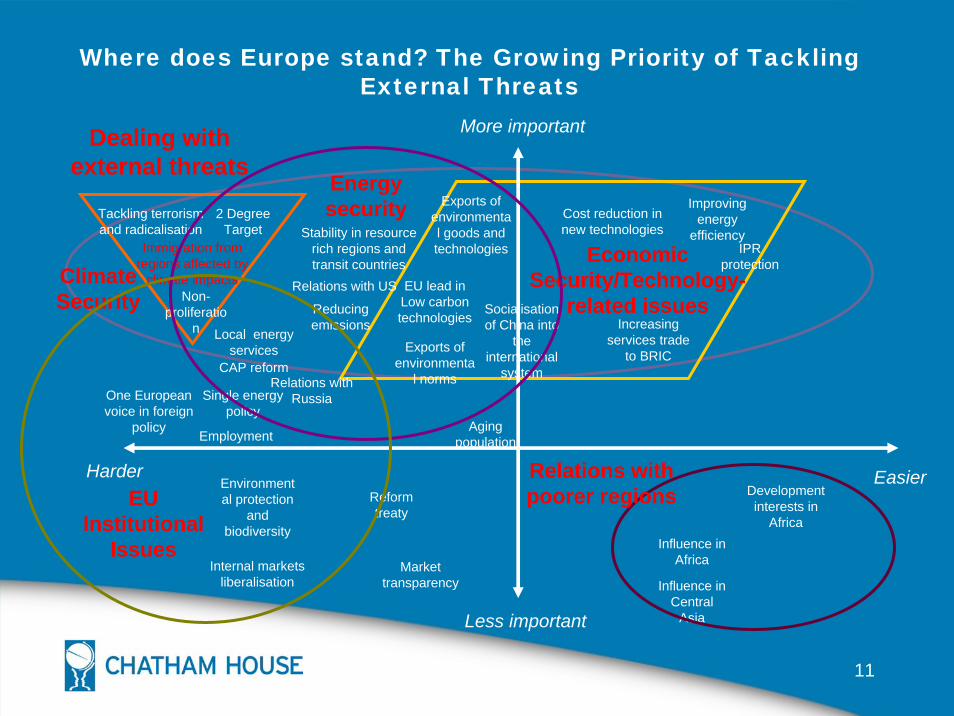
Where does Europe stand? The Growing Priority of Tackling External Threats
More important
Less important
Harder Easier
Immigration from regions affected by
climate impacts
Stability in resource rich regions and transit countries
EU lead in Low carbon technologies
Aging population
Local energy services
Reducing emissions
CAP reform
Tackling terrorism and radicalisation
2 Degree Target
Climate Security
Energy security
Dealing with external threats
Exports of environmenta
l norms
Exports of environmental goods and technologies
One European voice in foreign
policy
Relations with Russia
Relations with US
Employment
Single energy policy
Non-proliferatio
n Increasing services trade
to BRIC
Improving energy
efficiencyEconomic
Security/Technology-related issues
Cost reduction in new technologies
IPR protection
Socialisation of China into
the international
system
Development interests in
AfricaInfluence in
Africa
Influence in Central
Asia
Environmental protection
and biodiversity
EU Institutional
Issues
Reform treaty
Market transparency
Internal markets liberalisation
Relations with poorer regions

12
Hard Easy
Important
Not important
Hard Easy
Important
Not important
EUChina
Mapping Common Interests between the EU and China
Tackling climate impacts
Climate security and dealing
with environmental degradation
Energy Security
Dealing with external threats
Economic Security
Domestic Stability
Energy security
Dealing with
external threats
Climate Security
Economic Security/
Technology-related issues

13
Some positive political signals from China on climate change
1. First National Climate Change Assessment (Dec 2006)
2. China’s National Climate Change Programme (Jun 2007)
3. Public action on energy conservation and pollutant discharge reduction issued by the State Council (May 2007)
4. Policy statements around G-8 (Jul 2005 and Jun 2007)
5. Premier Wen Jiabao (State Council Executive Meeting, 11 Jul 07), "All levels of government must realize fully the grimness and urgency of achieving the energy saving and emission reduction targets." Xinhua
6. National Medium-and Long-term Science and Technology Development Plan (2006-2020) –an innovation oriented economy
7. Middle and Long Term Program of Renewable Energy Development Sep 2007 issued by the NDRC
8. 17th Party Congress: ‘science-based development’ Oct 2007
9. Wen Jiabao statement in the East Asia Summit (Nov 2007) On climate change, "China will shoulder its due international responsibilities and obligations.”
14
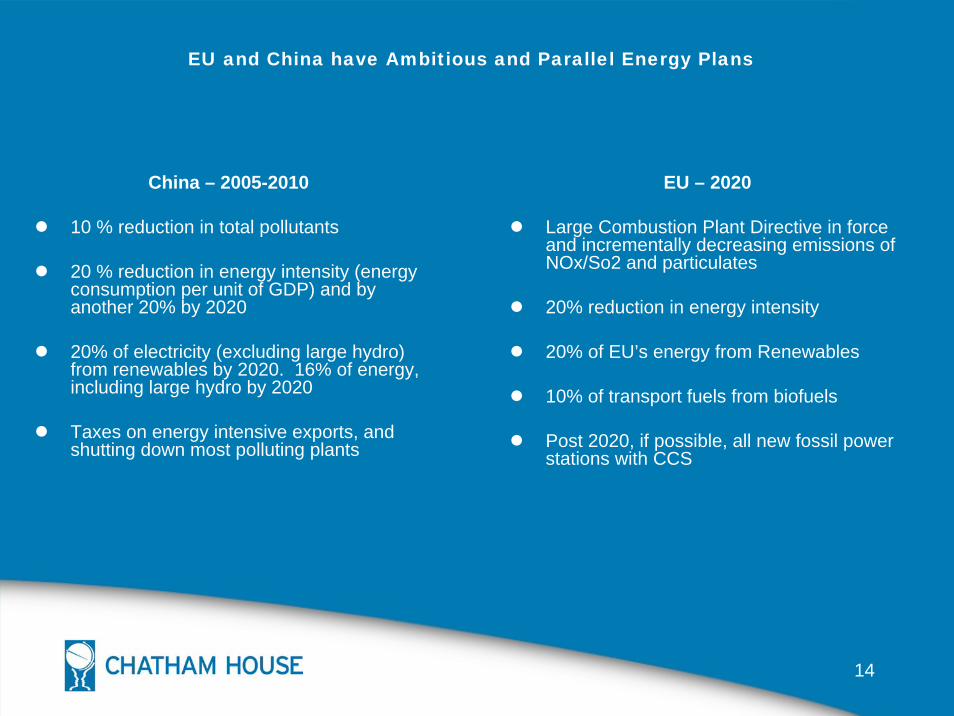
EU and China have Ambitious and Parallel Energy Plans
China – 2005-2010
10 % reduction in total pollutants
20 % reduction in energy intensity (energy consumption per unit of GDP) and by another 20% by 2020
20% of electricity (excluding large hydro) from renewables by 2020. 16% of energy, including large hydro by 2020
Taxes on energy intensive exports, and shutting down most polluting plants
EU – 2020
Large Combustion Plant Directive in force and incrementally decreasing emissions of NOx/So2 and particulates
20% reduction in energy intensity
20% of EU’s energy from Renewables
10% of transport fuels from biofuels
Post 2020, if possible, all new fossil power stations with CCS

15
Use of Financial and trade-related instruments
1. Financial and regulatory tools
Bank loans to energy-consuming and high-polluting sectors slowed down in 2007. These include oil processing and coking, chemicals, construction materials, iron and steel, non-ferrous metals, and power generation.
The China Banking Regulatory Commission (CBRC), the banking watchdog, also said that banking institutions should "resolutely recall" loans from firms that failed to meet environmental standards.
In the first half of this year, 5.5GW of the least efficient coal-fired plants (the target is 50GW by 2010) were closed down.
2. Trade-related and market-based instruments
From 1 July 2007, scrapping or cutting export tax rebates for 2831 commodities to curb the growth of energy consuming industries (MOF)
From 1 August 2007, resource taxes on lead, zinc, copper and tungsten ore by three to 16 times. (MOF)
From 1 August 2007, 15% export duties on some aluminium products to ‘restrict exports of high energy-consuming and polluting resources, products and encourage imports of raw materials’.

16
Continued..
At the WTO, Members questioned the motivations for these export restrictions, and whether they were accompanied by appropriate domestic measures.
US – higher input prices for its investors;Japan – legality; EU – coke.
From Jan 1 2008 – mixed signalsTo cool investment in the steel sector, export taxes on semifinished steel products will be raised to as much as 25 percent and a 15 percent export tax will be imposed on some stainless steel, welded pipes and other steel products, the ministry said. Existing tariffs on the export of other products, including carbon steel billets and pig iron, will be raised.Removal of import duties on alumina, refined copper and coal

17
China was positive and constructive in Bali
Some concerns pre-Bali about being cornered
Flexibilities on negotiations: end date; commitments
Its constructive stance help put the US on its back foot
Stance taken within G-77 help minimise the role of governments unwilling to negotiate on post-2012 e.g. Saudi Arabia, Malaysia
Active on the technology discussions
Agreed to language on ‘verifiability’

18
Embedded Carbon: A Necessary Factor in Defining a Fair Climate Deal
• Assessments are being undertaken to look at the impacts of trade and CO2 in relation to China. Shui and Harris (2006) 7-14% of China’s total CO2 emissions are caused by goods produced for the US.
• WWF concluded that Chinese emissions associated with exported goods amounted to 2870 million tonnes of CO2 per year.
• The Tyndall Centre put total at 1490 million tonnes, while finding Chinese imports to account for 400 Mt of CO2. It reported a net balance of around 1100 Mt in ‘exported’ CO2, equivalent to about 23% of Chinese emissions.
5800
4732
1109 1215 849 537 354
0
1000
2000
3000
4000
5000
6000
7000
US China China's netexports
Japan Germany UK Australia
Mt C
O2
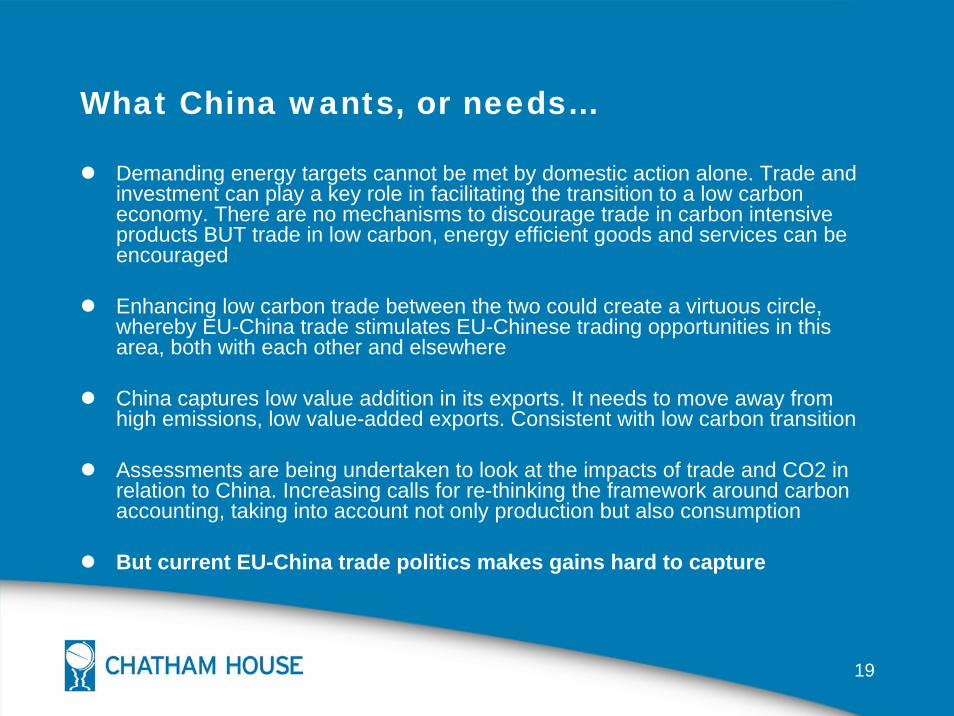
19
What China wants, or needs…
Demanding energy targets cannot be met by domestic action alone. Trade and investment can play a key role in facilitating the transition to a low carbon economy. There are no mechanisms to discourage trade in carbon intensive products BUT trade in low carbon, energy efficient goods and services can be encouraged
Enhancing low carbon trade between the two could create a virtuous circle, whereby EU-China trade stimulates EU-Chinese trading opportunities in this area, both with each other and elsewhere
China captures low value addition in its exports. It needs to move away from high emissions, low value-added exports. Consistent with low carbon transition
Assessments are being undertaken to look at the impacts of trade and CO2 in relation to China. Increasing calls for re-thinking the framework around carbon accounting, taking into account not only production but also consumption
But current EU-China trade politics makes gains hard to capture

20
Alignment with a low carbon future:China wants a bigger smile
R&D
High-Techparts
simpleparts
assembly
Marketing&
sales
Business services
Value chainValue chain
productivity
informationinformationlabourlabourtechnologytechnology
Source: DRC, 2006

21
Priority areas for EU-China Cooperation
Near-term opportunities Building Low-Carbon Economic Zones (LCEZs) in ChinaSetting world-class standards for energy efficiencyMaking coal more sustainableEU-China Ultra-Efficiency Building Research PlatformIncrease technology cooperation
Areas for Further Joint Exploration A Low Carbon Trade AgreementPioneer model Sectoral Approaches to climate changeTackling global supply constraints on renewable energyReducing dependency on imported oilDevelop a low-carbon investment regime
22
Some fault line issues
Technology, technology, technology… Key theme in practice and innegotiations.
IPR concerns are likely to dominate. But this is about cost of change
How to use integrated global production chains to push through best available technologies
Energy efficiency concerns are also linked to the slow and painful process of SOE reform
Investment conditions: spat likely to continue
Embedded carbon: difficult but key to a fair climate deal

www.climatestrategies.org 1
Economic relationship of Europe and Asia
ETS Japan Updates
Aki SatoFebruary 2008

www.climatestrategies.org 2
Overview1. Europe and Asia economics at glance2. ETS Japan result of the review panel:
December 20073. Brainstorming: Lessons that could be
learnt from other environmental cost issues

www.climatestrategies.org 3
I. Europe and Asia economics at glance
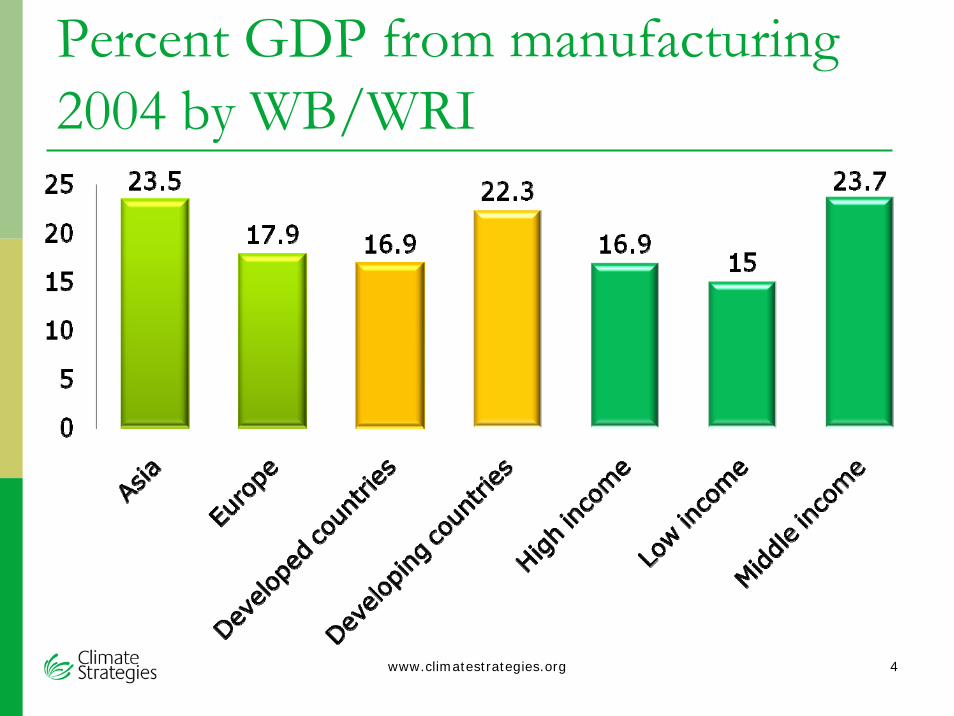
www.climatestrategies.org 4
Percent GDP from manufacturing 2004 by WB/WRI

www.climatestrategies.org 5
Trade in Goods: Manufactures imports/exports as a percent of merchandise exports 2005 by WB/WRI

www.climatestrategies.org 6
Number of parent companies/multinational companies(1993-2005) by UNCTAD/WRI

www.climatestrategies.org 7
II. ETS Japan result of the review panel: December 2007

www.climatestrategies.org 8
ETS Japan results of the review panel (1) scheme
1. 2005 – 2007: 3 year exercise, expected to have 2 more sets of 3 year emissions trade phase
2. Per office/branch voluntary participation: diverse businesses from manufacturing , IT business to merchandise
3. Baseline: past 3 years average4. Cap = Baseline – emission forecast (21% reduction)5. Grandfathering and CO2 only6. Required to return credits to the MOEJ at the end of the
phase, surplus can be carried over to the next phase7. Available credits: JPA jCER and jERU8. Compatible scheme to EU-ETS: MOEJ, Secretariat,
Competent Authority, Review Team, Validation authority,and participants
9. Online trade: GHG-TRADE.com

www.climatestrategies.org 9
ETS Japan results of the review panel (2) results1. Most participants are small – medium scale
businesses and showed their capacity to reduce emissions
2. 29% emissions reductions made (target 21%)3. Total of 24 trades made (82,624 tCO2) of which
20 were after August 20074. Average price \1,212 (highest \2,500 and lowest
\900)5. Unavailable to meet the target were mainly due to
the increase in sales quantity and vise versa6. Driven by the energy saving law mandate:
Incentive that the MOEJ subsidies to implement new energy saving technologies

www.climatestrategies.org 10
ETS Japan results of the review panel (3) future lessons1. Bench Marking system instead of Cap-Trade for
goal setting. Auctioning unlikely in voluntary scheme
2. High precision for measurement and validation3. Willing to link to overseas schemes4. Rule settings that allow broader participation5. Reducing procedural works and costs6. Clear accounting measures7. Leakage to overseas branches and factories
need to be considered and included
www.climatestrategies.org 11
III. Brainstorming:Lessons that could be learnt from other environmental cost issues
Environmental costs and how do we justify them?
Case of timber and energy efficiency scheme
www.climatestrategies.org 12
Case 1: Forest goods from illegally logged timbers
1. Issue: legal forest goods are expensive, the prices have been dragged down by illegal goods
2. Solution proposed: 1. Bilateral agreements - boil down the argument to
legal/illegal issue2. Certification – traceability could be addressed to a
degree but monitoring cost is still an issue3. Public Procurement – 20% of timber could be
covered in the case of Japan4. Enforceable legal frame work by importing
countries – CITES, Lacey Act etc. …. Perhaps if emission issues could get to a point that
carbon labelling becomes a prerequisite, carbon neutral a must (could identify and illegal), then regulation and enforceability would be strengthen….?
www.climatestrategies.org 13
1. Issue: After the oil shock, Japan was pressed to increase energy efficiency and productivity:
2. Solutions proposed1. Reporting mandate on both energy used and
planned use and open information in energy efficiency
2. Top runner system to aim for the most advanced technology
3. Voluntary scheme but full of business incentives… With the Aarhus Convention (access to
information, public participation in decision making and access to justice in environmental matters) EU-ETS could stretch for energy efficiency/CO2 information disclosure and sharing?...
Case 2: Energy saving law

www.climatestrategies.org 14
Keep the end in mindthe ultimate goal of ETS is…
To reduce GHG emissions as a whole in an economical way
To tackle global warming To realize sustainable development
and NOT necessary to foster CO2 business
Related Documents