So you want to be Tableau Desktop Certified? Ann Jackson September 2016

Welcome message from author
This document is posted to help you gain knowledge. Please leave a comment to let me know what you think about it! Share it to your friends and learn new things together.
Transcript

So you want to be Tableau
Desktop Certified?Ann Jackson
September 2016

Tableau Desktop 9 Certified Professional, DQA
Sr. Informatics Analyst at Aetna
public.tableau.com/profile/Ann.Jackson
@AnnUJackson
https://www.linkedin.com/in/AnnUJackson
Ann Jackson

Brief background
Casual Tableau
User
PHXTUG
Regular
Certified
Professional

Why become certified?
Holding certification distinguishes you as an expert
Access to expert community & swag
Strengthens your resume
Foundation to describe your technical skills
Demonstrates commitment & follow through

Put simply in a quote
“One of the painful things about our time is that those
who feel certainty are stupid, and those with any
imagination and understanding are filled with doubt
and indecision.”
Bertrand Russell

Desktop certification comes in 2 flavors
Qualified Associate (1st Level)
• $250 Exam Fee
• For users with 5+ months of
experience
• 2 hours, 34 questions multiple
choice (75% passing score)
• Schedule & take online at any time
Certified Professional (2nd Level)
• $600 Exam Fee
• For users with 9+ months of
experience
• 3 hours, essay response &
submitting work (graded by
committee)
• Schedule & take online at any time
Exam prep guide Exam prep guide

Knowledge based questions
Hands on, multiple choice
Finding answers to basic questions
Using most common features
Leveraging built in tools
Right answer to every question
Applying your expertise
Critiquing visualizations
Re-visualizing data
Data storytelling
Advanced technical concepts
No “right answer”
Qualified Associate vs. Certified Professional

Qualified Associate vs. Certified Professional
Using the Superstore data set, what is
the total sales for the ‘Home Office’
segment in July 2012?
A. $37,930.18
B. $2,168,952.03
C. $141,773.41
D. $511,670.04
Answer: $37,930.18
Management is interested in
understanding how different regions
performed in the ‘Home Office’ segment.
Create a visualization that shows the
sales for each region compared to overall
sales. Point out any interesting findings.

Today I’ll be diving into the
Qualified Associate Certification

Foundational Knowledge
Common data connections
Excel
Access
Microsoft SQL Server
Salesforce
How to connect to Tableau
Server
Multiple data sources from
the same database
Joining data

Data Prep & Data Connection
What can you do from the
data connection window?
Change data types
Change field names
Pivot data
Use data interpreter
Hide fields

Data Blending
What is data blending?
Data blending is when you blend data from multiple data sources on a single worksheet (“view”)
What isn’t data blending?
It is not a way to add new dimensions or rows to data
Consider the integration of two data sources with a common
dimension of date
1. Total number of work units produced in one data source
2. Total hours of work from staff in another data source
How many work units per staff hour each day?

Common Terminology
Data & Analytics pane
Dimensions
fields that contain
categorical data
Measures
fields that contain
numbers
Parameters
variables
Discrete “individually separate and
distinct”
Produce headers, “buckets”
Filter “members”
Colors are categorical palette
Continuous “forming an unbroken
whole, without interruption”
Produce axes
Limit the range
Color is gradient of range

Important Visual Cues
Data sources
Check marks (blue vs.
orange)
Shape of data source
(cylinder vs. cube)
Arrow and pair of shapes
Tableau server icon
Fields
Blue vs. green
Preceded by equal sign
Exclamation mark
Chain icon (orange link,
gray unlink)

Organizing & Simplifying Data
Filtering
What types of filters are there?
When are different filters applied
to data?
How does filtering vary across
these data types:
Dates
Dimensions
Measures
Extract filters
Data source filters
Context filters
Filters on dimensions
Filters on measures

Organizing & Simplifying Data
Sorting
Computed Sort Options
Alphabetical
Data source order
By a field
Manual sorting
Sorting from the sheet
Sorting from an axis
Groups, Hierarchies, Sets
Group – set of dimension
members that can be
combined into higher
categories
Hierarchies – think drill
through
Sets – Groupings of marks
How do you make them
and what’s special about
each?

Calculations, calculations, calculations
Calculated fields
Create via calculated field editor; ad-hoc calculations
Table calculations
Local to Tableau calculations; performed on the view
Level of detail calculations
Define the granularity of the aggregation

Prepping for the exam
Schedule your exam 2 to 3 weeks before you’re ready
Become familiar with Superstore and other Tableau data
sets
Exam is on a Windows virtual machine
If you’re a Mac user, practice on a Windows machine
Expect some latency, number pad may not work
Expectation that you can navigate and connect to different types
of data sources

Let’s go through some exam prep
questions. As we walk through
them, keep in mind the skills
they’re testing for.

What is the percent of total Sales
in the ‘Home Office’ Customer
Segment in July 2012?
Filtering & Sorting
Aggregation
Table calculationsSkills:
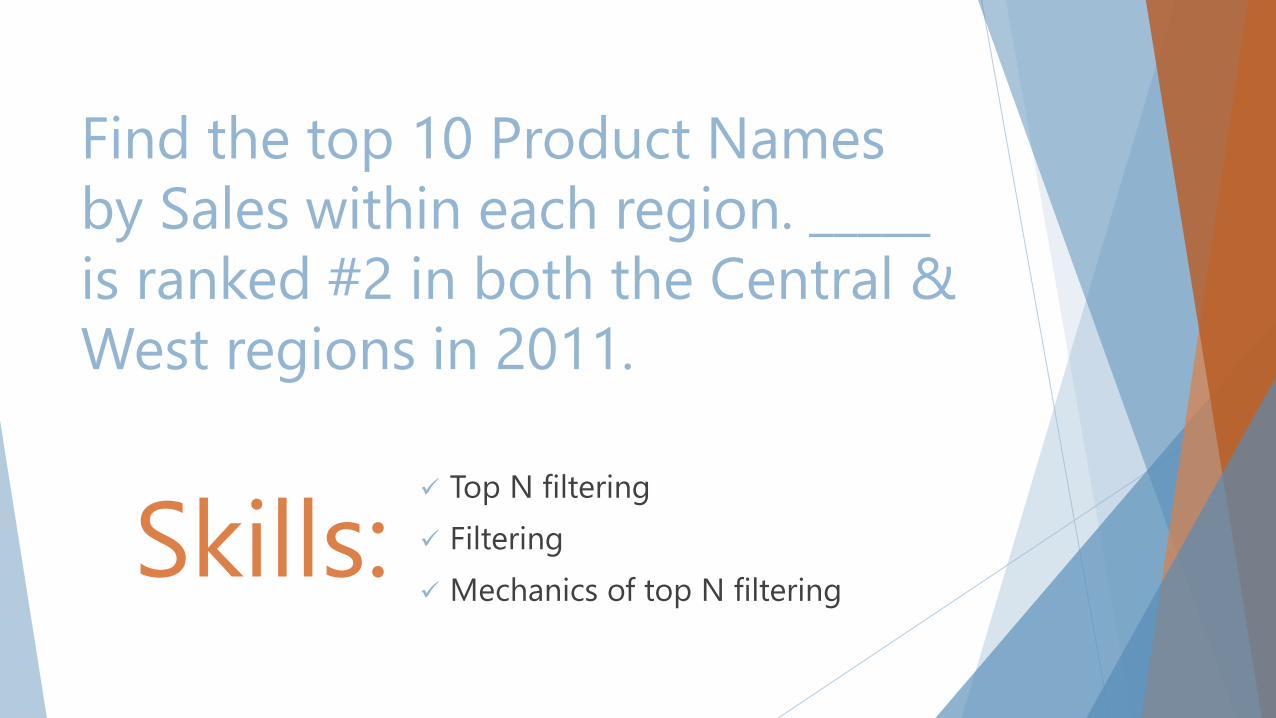
Find the top 10 Product Names
by Sales within each region. _____
is ranked #2 in both the Central &
West regions in 2011.
Top N filtering
Filtering
Mechanics of top N filteringSkills:

In the Technology Product
Category, which unprofitable
state is surrounded by only
profitable states?
Maps
Spatial analysisSkills:

What was the Moving Average of
Sales in June of 2012, including
six months prior and six months
after?
Line charts
Quick table
calculations
Customizing
table calculations
Dual axis
Skills:

In which Region do all Product
Categories fall beneath the overall
average profit?
Averages in the view
Reference line average
Window average
Averaging with totalsSkills:

Key takeaways
Know how to navigate and different methods to do the
same thing
New or popular feature? It’ll probably be on the test
If you’re writing an in depth calculated field, consider an
alternative method
Pretty visualizations won’t play a factor, but will give you
great practical experience for Certified Professional

Need more help? Tableau offers the
following courses:
http://mkt.tableau.com/files/Desktop_I_Course_Description.pdf
http://mkt.tableau.com/files/Desktop_II_Course_Description.pdf
http://mkt.tableau.com/files/Desktop_III_Course_Description.pdf
http://mkt.tableau.com/files/Classroom-Training-Visual-Analytics.pdf

Feeling cheap? Access these free
resources:
http://www.tableau.com/learn/training
http://www.tableau.com/table-calculations
http://www.tableau.com/about/blog/LOD-expressions
Related Documents


