Table of contents xiii Chemical interactions between packaging materials and foodstuffs Table of contents Table of contents ..................................................................................................................................... xiii

Welcome message from author
This document is posted to help you gain knowledge. Please leave a comment to let me know what you think about it! Share it to your friends and learn new things together.
Transcript

Table of contents xiii
Chemical interactions between packaging materials and foodstuffs
Table of contents
Table of contents ..................................................................................................................................... xiii

Summary xxv
Chemical interactions between packaging materials and foodstuffs
Summary
From the extensive literature review presented in the first chapter, it could be concluded that food
safety and quality can be influenced by the chemical interactions between packaging materials and
foodstuffs. Especially for plastics a material transfer, defined as migration, from the contact material
to the food has been intensively studied within this respect. Based on the fundamental aspects of
migration, important parameters controlling the phenomenon were identified. In addition, two
legislative approaches, issued to protect public health by reducing the exposure to migrants up to
tolerable levels, were discussed in detail. Finally the current analytical methodology to assess
overall and specific migration was reviewed.
In the presented study, an additional contribution to this particular field of food science was made.
Basically research concentrated on the following three main topics :
- chemical characterization of polyglycerol fatty acid esters (Chapter 2)
- the development of an immunochemical method for bisphenol A analysis in foodstuffs
(Chapters 3 and 4)
- evaluation of the chemical interactions between food and active and intelligent packaging
materials (Chapter 5)
In each of these sub-studies, innovative analytical approaches in the particular field of chemical
interactions between packaging materials and foodstuffs are introduced.
Polyglycerol fatty acid esters consist of a complex group of compounds, which can be applied as
plastic additives. From the mechanisms about migration reviewed in the first chapter, it could be
concluded that a good characterisation of a migrant is of prime importance. Therefore an analytical
methodology to characterise this complex group of compounds was elaborated (Chapter 2). The
method was based on an extensive liquid and gas chromatographic separation of the main
constituents of these esters. It essentially consisted of two steps : the characterisation of the
polyglycerol moiety after saponification of the esters and the analysis of the esters themselves.
Using capillary gas chromatography, the trimethyl silylethers of the polyglycerols could be
determined quantitatively up to the tetraglycerols. Since standards with an acceptable purity of tri-
and tetraglycerol were not available however, these were obtained via a column chromatographic
fractionation. A further elaboration of the gas chromatographic analysis by using cold-on column
injection combined with the use of a short capillary column, enabled the qualitative analysis up to

Summary xxvi
Chemical interactions between packaging materials and foodstuffs
heptaglycerol.
From an in depth study of the profile of the gas chromatogram from fractionated di-and
triglycerols, a possible identification of the non-cyclic and cyclic diglycerol and non-cyclic
triglycerols was presented. Consequently a qualitative idea about the presence of these side
products in a polyglycerol sample could be obtained.
From the gas chromatographic analysis of the polyglycerol fatty acid esters using a cold-on column
injection and a short capillary column, it was revealed that some of the esters present in the sample
co-eluted. Therefore, for the analysis of the esters, a combined liquid and gas chromatographic
analysis was necessary.
Using again a column chromatographic fractionation technique, standards of sufficient purity of the
following esters could be obtained : mono-and di-esters of di- and triglycerol. Using a slightly
modified column chromatographic fractionation, three fractions containing respectively the di-
esters of diglycerol, the di-and mono-esters of respectively tri-and diglycerol and finally the mono-
esters of tri-and tetraglycerol were obtained. These fractions could be analysed by capillary gas
chromatography without any risk of co-eluting peaks. Since for all these esters, except for the mono-
esters of tetraglycerol, pure standards were available, qualitative analysis of a polyglycerol esters
would be possible.
Apart from the quantitative data, also qualitative data about the following components became
available using the methodology presented : mono-esters of tetraglycerol and the various isomers
of the mono-esters of diglycerol.
In the second part of this study, the applicability of immunological techniques to analyse bisphenol
A in food matrices was evaluated. Bisphenol A is a monomer used in the production of the high
quality plastic, polycarbonate and in the production of epoxy coatings. It is a compound of
particular interest because of its xeno-estrogenic character and its suspected carcinogenicity. From
the literature review, it was revealed that essentially classical instrumental methods are used for
bisphenol A analysis, often requiring extensive sample clean-up.
In order to raise bisphenol A specific antibodies, a suitable bisphenol A hapten was prepared
(Chapter 3). The hapten consisted of a bisphenol A molecule to which a five carbon membered
spacer arm, containing an end-standing carboxylic acid group, was attached at one of the phenolic
hydroxyl groups. Thus coupling to a protein could be achieved using the carboxylic acid moiety of
the hapten and one of the phenolic hydroxyl groups was still available for immunological
interactions.

Summary xxvii
Chemical interactions between packaging materials and foodstuffs
The hapten was coupled to bovine serum albumin to obtain an immunizing antigen which was
injected into chicken hens. The antibodies could conveniently be isolated from the egg yolk. Since
eggs are produced daily and antibody concentration is relatively high, an almost infinite source of
antibodies was obtained by using the presented immunization methodology.
Reactivity towards bisphenol A was evaluated in an indirect enzyme-linked immunosorbent assay
using a bisphenol A-ovalbumin coating antigen.
Because the isolated antibodies showed indeed reactivity towards bisphenol A, they were applied
in a similar competitive indirect enzyme-linked immunosorbent assay (Chapter 4). The assay
proved to be quite sensitive towards possible matrix effects such as the ionic strength and the
presence of surface active components like proteins. It was more over revealed that the sensitivity of
the assay was lower compared to the classical instrumental techniques or of the recently developed
immunoassays for bisphenol A using mono-or polyclonal mammalian antibodies. Variation of
several assay parameters resulted in an optimised I50 level of about 2.5 µM in aqueous solutions.
As a further elaboration of the indirect competitive assay, cross reactivity towards several structural
analogues or other xeno-estrogenic compounds which could also migrate from food contact
materials, was investigated. Essentially the assay could be considered as very specific. Only for
analogues which showed strong molecular similarities significant cross reactivity was observed
(maximal 43 %).
In order to evaluate the applicability of the assay for the analysis of real food samples, milk and oil
were considered. By an adjustment of the ionic strength of the buffers used throughout the assay,
the loss in sensitivity could be minimized during the direct analysis of milk (I50 level of about 25
µM). For the analysis of oil, extraction of bisphenol A by an aqueous methanol solution was
necessary. Methanol however affected the assay characteristics. A concentration of about 20 % of
methanol resulted in similar sensitivities as observed for the assay in milk and was therefore
considered to be acceptable.
In the last part of this study (Chapter 5) the chemical interactions between active and intelligent
packaging systems and food were investigated. Active food packaging can be defined as a material
which changes the condition of the packed food in order to extend its shelf-life and/or improve its
safety and its sensory properties. Intelligent packaging materials monitor the condition of the
packed food to give information about its quality during its distribution. They can be considered as
a major recent development in the packaging technology of foods. In a EU FAIR R&D research
project, called ‘ACTIPAK’ (CT 98-4170), several active and intelligent packaging materials were
Summary xxviii
Chemical interactions between packaging materials and foodstuffs
collected in order to evaluate their composition and their overall migration behaviour.
From their compositional analysis, it seemed that most of these materials were not composed solely
out of plastics. Despite this fact, EU plastic packaging legislation was considered for the
classification of these materials. It could be concluded that several of the active components present
in these kind of packaging materials were not on the positive lists specified in the EU legislation.
From the overall migration studies in the official EU food simulants, it could be concluded that
several active food packaging materials exceeded the limits specified. It was revealed however that
the applied migration methodology did not correspond with the actual use of some of the active
packaging materials. Therefore, the use of a moisture-rich solid food simulant was introduced.
Using agar gels, more realistic overall and specific migration levels were obtained which were
moreover comparable to the levels observed in real food matrices. This alternative aqueous food
simulant was especially useful to quantify the specific migration from the selected active packaging
systems.
Despite the introduction of a more realistic migration simulation methodology, only 20 % of the
investigated active and intelligent packaging systems were in agreement with current food contact
material legislation taking into account the overall migration data and their composition. Since in
addition for a lot of the tested systems however, the plastic directives did not apply, it is clear that
an urgent need for a dedicated legislation applicable in the whole EU exists. If however the
additional legislative problems, for example with the food additive legislation, are considered
which can be expected if such packaging materials are introduced on the European market, it seems
that a case by case evaluation seems appropriate when application of these new technologies on the
EU-level should be realised within the near future without endangering food safety and quality.

Samenvatting xix
Chemical interactions between packaging materials and foodstuffs
Samenvatting
Uitgaande van het uitgebreide literatuuroverzicht (hoofdstuk 1) kon besloten worden dat de
veiligheid en kwaliteit van het voedsel in een belangrijke mate kunnen beïnvloed worden door de
chemische interacties tussen verpakkingsmaterialen en het levensmiddel. In het bijzonder werd
voor plastic de materiaaloverdracht, beter gekend als migratie, vanuit het contact materiaal naar het
levensmiddel intensief bestudeerd. Op basis van de fundamentele aspecten, werden belangrijke
parameters welke het migratie fenomeen beheersen, geïdentificeerd. Daarenboven werden twee
wettelijke benaderingen, welke de volksgezondheid moeten garanderen door de blootstelling aan
migratieresiduen tot aanvaardbare niveaus te beperken, in detail besproken. Tot slot werden de
courante analytische methoden om globale en specifieke migratie te bepalen besproken.
In het voorgestelde onderzoek wordt een bijkomende bijdrage aan dit specifieke domein van de
levensmiddelenwetenschappen gepresenteerd. Het onderzoek spitste zich in essentie toe op de
volgende drie onderwerpen :
- chemische karakterisering van polyglycerol vetzuur esters (hoofdstuk 2)
- de ontwikkeling van een immunochemische techniek voor het bepalen van bisfenol A in
levensmiddelen (hoofdstuk 3 en 4)
- evaluatie van de chemische interacties tussen actieve en intelligent verpakkingsmaterialen
en levensmiddelen (hoofdstuk 5)
In elk van deze delen is getracht een innovatieve analytische techniek in het domein van de
chemische interacties tussen levensmiddelen en verpakkingsmaterialen te introduceren.
Polyglycerol vetzuur esters zijn een complexe groep van verbindingen, welke onder andere hun
toepassing vinden in de plastiek industrie als additief. Vanuit de fundamentele kennis over het
migratieverschijnsel kon besloten worden dat een goede karakterisering van de migranten van
primordiaal belang is. Daarom werd een analytische methode ontwikkeld die moet toelaten de
samenstelling van deze verbindingen te ontrafelen. De methode is gebaseerd op een doorgedreven
vloeistof- en gaschromatografische scheiding van de belangrijkste componenten die aanwezig zijn
in deze polyglycerol esters. De methode bestond in essentie uit twee delen : de karaktersering van
het polyglycerol gedeelte na verzeping van de esters en de analyse van de esters zelf (hoofdstuk 2).
Aan de hand van capillaire gaschromatografie, werden de trimethyl silyl ethers van polyglycerolen
kwantitatief bepaald tot en met de tetraglycerolen. Aangezien zuiver tri-en tetraglycerol niet ter

Samenvatting xx
Chemical interactions between packaging materials and foodstuffs
beschikking bleken, werden aan de hand van een kolom chromatografische fractionatie voldoende
zuivere standaarden van deze componenten bekomen. Door een verdere uitbreiding van de
gaschromatografische analyse van de polyglycerolen, door gebruik te maken van de on-column
injectie techniek in combinatie met het gebruik van een korte capillaire kolom, werd bovendien de
kwalitatieve analyse tot en met heptaglycerol mogelijk gemaakt.
Door een diepgaande studie van het gaschromatografisch profiel dat bekomen werd na de analyse
van gefractioneerde di- en triglycerol stalen werd een mogelijke identificatie naar voren geschoven
betreffende respectievelijk de niet cyclische en cyclische diglycerol isomeren enerzijds en de niet
cyclische triglycerol isomeren anderzijds. Bijgevolg kon een kwalitatief idee verkregen worden
omtrent de aanwezigheid van deze producten in een polyglycerol ester.
Uit de gaschromatografische analyse, aan de hand van een on-column injectie techniek en een korte
capillaire kolom, van polyglycerol esters, bleek dat verschillende componenten co-elueerden.
Daarom werd voor de analyse van de esters een gekoppelde vloeistof- en gaschromatografische
scheiding geïntroduceerd.
Wederom werden aan de hand van een kolomchromatografische fractionatie standaarden bekomen
van de volgende componenten : mono- en di-esters van zowel di-en triglycerol. Door gebruik te
maken van een licht gemodificeerde kolomchromatografische fractionatie werden drie fracties
bekomen welke respectievelijk de volgende verbindingen bevatten : di-esters van diglycerol, de di-
en mono-esters van respectievelijk tri-en diglycerol en tenslotte de mono-esters van tri-en
tetraglycerol. Elk van deze fracties kon vervolgens gaschromatografisch geanalyseerd worden
zonder dat bepaalde verbindingen zouden co-elueren. Aangezien van al deze componenten, met
uitzondering van de mono-esters van tetralglycerol, standaarden werden bekomen, kan gesteld
worden dat aan de hand van de voorstelde methode een kwantitatief onderzoek naar de
samenstelling polyglycerol esters mogelijk is.
Naast de kwantitatieve data, was het ook mogelijk om kwalitatieve informatie te bekomen over de
volgende componenten : mono-esters van tetraglycerol en de verschillende isomeren van the mono-
esters van diglycerol.
In het tweede deel van dit werk, werden de mogelijkheden onderzocht om immunochemische
technieken toe te passen om bisfenol A te analyseren in levensmiddelen.Bisfenol A is een belangrijk
monomeer dat gebruik wordt om polycarbonaat en epoxy harsen te produceren. Het is een
verbinding waaraan de laatste jaren bijzondere aandacht werd besteed gezien zijn xeno-estrogeen
karakter en zijn mogelijkse carcinogene werking. Uitgaangde van het literatuur overzicht kon

Samenvatting xxi
Chemical interactions between packaging materials and foodstuffs
besloten worden dat de huidige analyse methodieken instrumentaal zijn die bovendien dienen
vooraf te gaan door een uitgebreide staalvoorbereiding.
Om de productie van bisfenol A specifieke antilichamen te bewerkstelligen, diende een geschikt
bisfenol A hapteen gesynthetiseerd te worden (Hoofdstuk 3). Het hapteen bestond uit een bisfenol
A molecule waarvan aan één van de fenolische hydroxylgroepen een koolstof arm, bestaande uit
vijf koolstof atomen en een eindstandige carbonzure groep, werd gekoppeld. Op deze manier kon
de covalente koppeling van het hapteen aan verschillende eiwitten gerealiseerd worden. Bovendien
was de tweede vrije fenolische hydroxylgroep nog steeds ter beschikking om immunochemische
reacties te induceren.
Het hapteen werd gekoppeld aan serum albumine van runderen om een immuniserend antigeen te
bekomen. Dit antigeen werd geïnjecteerd bij leghennen. De antilichamen werden op een elegante
manier geïsoleerd uit het eigeel. Aangezien dagelijks een ei per kip werd bekomen en aangezien de
concentratie van immunoglobulinen in het eigeel vrij hoog is, werd een nagenoeg onuitputtelijk
bron van antilichamen aangeboord aan de hand van de gebruikte immunizatie strategie.
De reactiviteit van bisfenol A ten opzichte van de geïsoleerde immunoglobulinen werd onderzocht
aan de hand van een indirecte enzym-gelieerde immunosorbent assay (ELISA). Hiertoe werd een
coating anitigeen gesynthetiseerd door het hapteen te koppelen aan ovalbumine.
Aangezien de geïsoleerde antilichamen behoorlijke reactiviteit vertoonden ten opzichtte van
bisfenol A, werden ze toegepast in een analoge indirecte competitive ELISA (Hoofdstuk 4). De
assay bleek vrij gevoelig te zijn aan mogelijke matrix effecten, zoals de aanwezigheid van zouten of
oppervlakte actieve stoffen, zoals bijvoorbeeld eiwitten. Bovendien werd duidelijk dat de assay
minder goed presteerde op het vlak van gevoeligheid in vergelijking met de huidig beschikbare
instrumentele technieken en de recent ontwikkelde ELISA’s welke gebruik maken van mono-en
polyclonale antilichamen, geïsoleerd uit zoogdieren. Door een afstellen van verschillende assay
parameters, kon een I50 waarde van ongeveer 2.5 µM bereikt worden in waterige oplossingen.
Bij een verdere evaluatie van de indirecte competitieve ELISA, werd de kruisreactiviteit van
verschillende structurele aanverwante verbindingen, alsook andere xeno-estrogene verbindingen
welke kunnen migreren vanuit verpakkingsmaterialen, onderzocht. De antilichamen konden als
bijzonder specifiek omschreven worden. Enkel voor zeer sterk gelijkende molecules werd een
belangrijke kruisreactiviteit vastgesteld (maximaal 43 %).
Om de toepasbaarheid van de assay voor de analyse van echte levensmiddelen na te gaan, werden
melk en olie beschouwd. Door een aanpassing van de ionensterkte van de buffers welke gebruikt
worden gedurende de assay, werd het verlies in gevoeligheid dat waargenomen werd in melk

Samenvatting xxii
Chemical interactions between packaging materials and foodstuffs
beperkt (I50 van ongeveer 25 µM). Voor de analyse van olie was een extractie van bisfenol A met een
waterige methanol oplossing noodzakelijk. Methanol evenwel had een nefaste invloed op de
werking van de assay. Toch werd met oplossingen die tot 20 % methanol bevatten gelijkaardige
resultaten bekomen inzake gevoeligheid als bij de analyse van melk.
In het laatste deel van dit werk (Hoofdstuk 5), werden de chemische interacties tussen actieve en
intelligente verpakkingsmaterialen enerzijds en levensmiddelen anderzijds onderzocht. Actieve
verpakking kan gedefinieerd worden als een materiaal dat het verpakte levensmiddel op een
dusdanige manier gaat veranderen dat zijn houdbaarheid en/of veiligheid en zijn sensoriële
eigenschappen verbetert. Intelligente verpakkingsmaterialen geven informatie betreffende de
kwaliteit van het verpakte levensmiddel. Deze verpakkingstechnieken kunnen beschouwd worden
als één van de belangrijkste recente ontwikkeling op het vlak van verpakken van levensmiddelen.
In een EU FAIR R&D project (ACTIPAK, CT 98-4170), werden verschillende actieve en intelligente
verpakkingsmaterialen verzameld om hun samenstelling en hun globaal migratie gedrag te
evalueren.
Uitgaande van de samenstelling van deze materialen, bleek dat het merendeel uit meer dan alleen
maar plastic bleek te bestaan. Desondanks werden de gecollecteerde materialen geklasseerd op
basis van de EU directieven welke toepasbaar zijn op plastic contact materialen. Er kon besloten
worden dat verschillende verbindingen die noodzakelijk zijn voor het werkingsmechanisme van de
actieve of intelligente verpakking niet opgenomen zijn in de positieve lijsten welke vervat zijn in de
EU wetgeving.
Op basis van de studies omtrent hun migratiegedrag in de officiële levensmiddelen simulanten,
bleek terug dat verschillende materialen niet bleken te voldoen aan de wettelijk voorziene eisen.
Het bleek evenwel dat de toegepaste methodiek om de globale migratie te bepalen niet direct
overeenstemmende met de te verwachten gebruiksomstandigheden van sommige systemen.
Daarom werd het gebruik een vochtrijke maar vaste simulant ingevoerd om het migratie fenomeen
te onderzoeken. Het gebruik van agar gels bleek inderdaad aanleiding te geven tot meer realistische
globale en specifieke migratie waarden, die zelfs goed overeenstemden met de migratiewaarden
waargenomen in echte levensmiddelen.
Ondanks de invoering van de meer realistische simulant om migratiestudies uit te voeren, bleek
slechts 20 % van de geteste materialen te voldoen aan enerzijds de beperkingen inzake
samenstelling en anderzijds de globale migratie limiet, welke van toepassing zijn voor plastic
verpakkingsmaterialen. Omdat bovendien een deel van deze systemen bleek samengesteld te zijn

Samenvatting xxiii
Chemical interactions between packaging materials and foodstuffs
uit verschillende materialen, is het duidelijk dat er een dringende nood is aan een wetgevend kader
omtrent de toepasbaarheid van deze nieuwe verpakkingstechnologieën binnen de Europese Unie.
Indien evenwel wordt rekening gehouden met bijkomende wettelijke restricties die van toepassing
kunnen zijn, zoals de wetgeving op additieven bijvoorbeeld, lijkt het dat een evaluatie van elk
individueel systeem voorlopig de snelste manier is om de toepassing van deze materialen mogelijk
te maken binnen de Europese markt zonder dat er een gevaar wordt gecreëerd inzake de
voedselveiligheid of voedselkwaliteit.

Introduction – migration from food contact materials 3
Chemical interactions between packaging materials and foodstuffs
1. Introduction : migration from food contact materials
1.1. Food contact and packaging materials
1.1.1. Classes of food contact materials
During the handling of agricultural raw materials, during their processing and transformation into
foods and during the transport of these products from the producers to the consumers, contacts
with other materials frequently occur. The most common example for the end-user of the food is
probably the packaging material. However, apart from a variety of packaging materials, a lot of
other contact materials should be considered as well, e.g. stainless steel processing, transport or
storage equipment, tubing for food transport, sealing materials in piping equipment, protection foils
or lacquers used in storage facilities, etc.
Instead of classifying these materials according to their function or use, a classification based on
their chemical characteristics is more convenient and appropriate. The European food legislation
differentiates various classes of food contact materials as indicated in Table 1.
Table 1. Groups of contact materials requiring legislation within EU1 (EEC, 1989)
1. plastics including varnish and coatings
2. regenerated cellulose
3. elastomers and rubber
4. paper and board
5. ceramics
6. glass
7. metals and alloys
8. wood, including cork
9. textile products
10. paraffin and micro-crystalline waxes
It should be stressed that this list is not involving only packaging materials, but all kinds of
materials which can be in contact with an agricultural raw material or a foodstuff (Rossi, 2000).
1 All abbreviations are summarized in Annex 1

Introduction – migration from food contact materials 4
Chemical interactions between packaging materials and foodstuffs
1.1.2. Packaging materials
Packaging materials represent an important group within the food contact materials listed in Table
1. The use of these materials is very important for the food industry because packaging fulfils four
essential functions (Robertson, 1993). Food packaging materials contain the food. Due to this
containment, the food can be protected against a broad spectrum of deteriorating processes (e.g.
light, oxygen, micro-organisms, etc.). The packaging allows moreover to create a communication
with the consumer who can be informed about content of the package (e.g. brand, price, quantity,
ingredients, producer, etc.). Finally it offers the possibility to increase the convenience of the packed
food product (e.g. ready to eat meals, individual portions, etc.). Thus the same food can be packed
in different packages in order to meet the different requirements of the various consumers (e.g.
individual size, family size, etc.).
Various food contact materials are being used to pack food. In Table 2 an overview of the use of
various packaging materials within the USA is represented (FDA, 1995a). It is striking that
polymeric materials are predominantly used as such. This can be explained by the broad range of
commercial plastics available and their diversity in functionality and applicability. In addition,
polymeric materials seem to be frequently combined with other materials such as metal or paper. If
these additional data are considered, it can be concluded that about 80 % of the packed food in the
USA is contacted with polymeric materials. EU data with regard to the use of various packaging
materials are unfortunately not available (Castle, 2000). Belgian data of Fechiplast (Fechiplast, 2000)
indicate that the general plastic and elastomer production increased with 30 % from 1995 to 2000,
illustrating the ever growing importance of the plastic industry in general and possibly of the plastic
packaging industry in particular.
Table 2. Relative use of different food packaging materials within USA (FDA, 1995a)
Packaging material Relative use (%)
Glass 10
Metal - polymer coated 17
Metal – not coated 3
Paper – polymer coated 20
Paper – not coated 10
Polymers 40

Introduction – migration from food contact materials 5
Chemical interactions between packaging materials and foodstuffs
1.1.3. Plastic food packaging materials
Plastics can be regarded as macromolecular organic compounds which can be produced
synthetically or by modification of naturally occurring products, like for example regenerated
cellulose (Figge, 1996). The European legislator however considers plastics and regenerated
cellulose as a different kind of contact material (Table 1). This is because of the special characteristics
of regenerated cellulose compared to the other plastics (Rossi, 2000). Elastomers and rubbers on the
other hand, are clearly different from plastics although they are also macromolecular organic
compounds. In contrast to plastics however, elastomers exhibit, as the name suggests, an enormous
elasticity due to a cross linked structure created by chemical vulcanisation (Sidwell, 1996).
Elastomers can also be natural (e.g. rubber) or synthetic (e.g. fluorocarbon rubber). Figure 1 cites the
main synthetic plastics used.
Figure 1. Overview of the main synthetic plastic materials used (Figge, 1996)
Basically, thermosets and thermoplasts can be differentiated depending on their thermal properties
(Brandsch and Piringer, 2000). At sufficiently high temperatures, a thermoplast will become liquid,
as indicated in Figure 2. If this polymer is cooled down, crystallisation proceeds generally so slow
that the polymer becomes super cooled or rubbery. Further lowering the temperature will finally
result in a material that becomes glassy and relatively brittle, having physical properties similar to a
crystalline solid, but due to the high molecular disorder is still a liquid. The temperature at which

Introduction – migration from food contact materials 6
Chemical interactions between packaging materials and foodstuffs
this occurs, is called the glass transition temperature (Tg2) (Robertson, 1993). Typical glass
temperatures for some important polymers are the following : low density PE (237 K), PP (270 K);
PS (373 K); PET (342 K) and PC (418 K) (Wunderlich et al., 1989; Xanthos and Todd, 1996).
Thermosets on the other hand, will not become liquid upon heating due to their high cross linked
structure (e.g. epoxy resins).
Figure 2. Elastic modulus of a thermoplastic as a function of temperature (Schouten and van der
Vegt, 1987)
With regard to their chemical synthesis, addition and condensation polymerisation can be
distinguished. Addition polymerisation proceeds via a chain reaction between unsaturated
molecules, initiated by the use of for example radical or ion formation. Condensation
polymerisation however involves the reaction between two functional groups in organic molecules.
Three possible reactions or groups are described : polycondensation (e.g. polyesters, like PET),
polyaddition (not be confused with addition polymerisation, e.g. polyurethane) and ring opening
reactions (e.g. epoxy coatings)(Figge, 1996; Brandsch and Piringer, 2000).
Apart from the fundamental component –the polymer– plastics contain other chemical components
as well. Of course, the polymer may contain residual monomers and oligomers (e.g. Jickells et al.,
1993; Kontominas, et al., 1985; Lickly et al., 1993). In addition to those however, also other low
molecular weight substances may be present as well. Additives can be added to the polymer in
2 All symbols, together with their units are summarized in Annex 2

Introduction – migration from food contact materials 7
Chemical interactions between packaging materials and foodstuffs
order to alter the properties of the polymer in a desired way (Figge, 1996; Pospíšil and Nešpúrek,
2000). Table 3 shows the main additives used in plastic manufacture together with their function.
Generally these additives are applied in relatively small concentrations, although for example fillers
(e.g. silica) and plasticizers (e.g. phthalates) are used at high concentrations as well. Apart from
these, also additives to the polymerisation medium should be considered, such as emulsifiers,
solvents, thickening agents etc. (Pospíšil and Nešpúrek, 2000; EC, 2002). A third class of substances
are the so-called aids to polymerisation, which directly influence the formation of polymers. Typical
examples include catalysts, cross-linking agents, initiators, etc. (Pospíšil and Nešpúrek, 2000; EC,
2002). Finally also impurities, degradation or reaction products of plastic ingredients were found to
be present in polymeric contact materials as well (Lichtenhaler and Ranfelt, 1978; Grob et al, 1999).
Because most of these low molecular weight compounds are not covalently bound to the polymer
chain, they are able to diffuse throughout the polymer matrix. As discussed in the following, this
diffusion is one of the basic processes of the migration from plastic food contact materials.
Table 3. Main additives for plastics and their function (Pospíšil and Nešpúrek, 2000)
Additive Function
1. nucleating agents induce regular crystallisation
2. lubricants improve processing above Tg, alters rheology
3. antistatic agents reduce the chargeability of the plastic
4. blowing agents generate inert gases to produce expanded plastics
5. plasticizers gel the polymer, improve flexibility and processibility
6. antifogging agents avoid water droplets on films used to pack moisture rich foods
7. dyes and pigments impart colour of the plastic
8. fillers and reinforcing agents increase bulk and improve physical properties
9. stabilizers
9.1. antioxidants avoid polymer oxidation by trapping free radicals or by inducing
decomposition of peroxides
9.2. UV absorbers reduce harmful effect of UV radiation
9.3. heat stabilizers prevent dehydrochlorination during processing of PVC
9.4. anti-acids neutralise acids arising from catalysts or PVC thermo
degradation

Introduction – migration from food contact materials 8
Chemical interactions between packaging materials and foodstuffs
1.2. Migration from plastics
1.2.1. Interactions in a packaging system
In a food packaging system, three phases should be considered : the food, the package and the
environment (Figure 3). In between these phases interactions may occur, resulting in an energy or a
mass transfer (Hernandez and Gavara, 1999). The mass transfer can be macroscopic as in the
chipping of a glass container or microscopic as in the contamination of food by micro-organisms.
The sub microscopic mass transfer however involves the diffusion of individual molecules in one
phase and their sorption by the other. If mass transfer is restricted only to the food and the
packaging material, the phenomenon is also known as migration (Katan, 1996a). It can be regarded
as a chemical interaction between the food and its contact materials since it results in a transport of
chemical substances from one phase to the other.
Figure 3. The three phases of a packaging system
Migration can take place from the contact material to the food and vice versa. The latter case is also
known as negative migration, while the former is simply identified as migration. A typical example
of negative migration is the flavour scalping in fruit juices due to the partial absorption of flavour
compounds by the plastic contact material (e.g. Imai et al., 1990; Baner et al. 1991; Charara et al.,
1992; Konczal et al., 1992). Due to this phenomenon the fruit juice aroma might be affected. Another
example resulting however in an improvement of food quality, is the use of oxygen scavenging
materials in the packaging of foodstuffs sensitive to oxidation (Klein and Knor, 1990).

Introduction – migration from food contact materials 9
Chemical interactions between packaging materials and foodstuffs
The mass transfer from the packaging material to the food can have both deteriorating and
improving consequences for the food. Migration of toxic packaging compounds to the food is a
serious risk to food safety (Katan, 1996b). Similarly, migration of particular substances could induce
sensorial deterioration of the food (Linssen et al., 1991; Piringer and Rütter, 2000). On the other
hand, migration of particular food additives such as antioxidants (e.g. Wessling et al., 1999) and
anti-microbial agents (e.g. Weng et al., 1999), could improve the shelf life of the product and at the
same time minimize the direct use of these additives in the food manufacture.
The mass transfer can also involve the three phases of the packaging system. In this particular case,
volatiles are transported from the environment via the contact material to the food or vice versa.
This phenomenon is known as permeation (Hernandez and Gavara, 1999; Piringer, 2000a). In
contrast to migration, no net uptake or removal of chemical substances from the food contact
material takes place. The permeation process may significantly affect the quality of the food
(Hernandez and Gavara, 1999). Mild preservation techniques such as modified atmosphere
packaging, which are used successfully to prolong the shelf life of minimally processed foods
(Devlieghere et al., 1999), are based on the selective permeation of particular gasses through the
packaging material (Potter and Hotchkiss, 1995). Chemical contamination due to permeation of
organic volatiles (e.g. solvents) through the packaging material has been reported as well (Marsili,
1997).
In the present discussion, especially the first type of sub microscopic mass transfer described –
migration - is considered in more detail.
1.2.2. Basic aspects of migration from plastic food contact materials
1.2.2.1. General principle
Basically, the migration from plastics can take place in three ways as schematically illustrated in
Figure 4 (Katan, 1996b). In the first case, the food is contacted single sided with the contact material
on the one hand and with the environment on the other. The conveyor belt can serve as a typical
example. In the second case, the food is only contacted with one or various contact materials.
Typically most packed liquid foods can be seen as an example. For the final type, no direct contact
between the food and the contact material exists. Direct contact however is not necessary to induce
migration since a mass transfer via the headspace in the package is possible as well. A typical
example could be the scavenging of secondary oxidation products by an aldehyde absorbing
polymer incorporated in the contact material (Rooney, 1995).

Introduction – migration from food contact materials 10
Chemical interactions between packaging materials and foodstuffs
Three important stages can be distinguished controlling the the sub microscopic mass transfer in
general and consequently the migration in particular : diffusion within the polymer, solvation at the
polymer-food interface and dispersion into the bulk food (Lau and Wong, 2000; Hernandez and
Gavara, 1999). First a low molecular weight compound will diffuse in the polymer in the direction
of the food due to the presence of a concentration gradient (diffusion process). Subsequently,
reaching the food-plastic interface, the migrant will be desorbed by the polymer and absorbed by
the food (solvation process). Finally the migrant, currently dissolved in the food, will diffuse into
the total food matrix, again due to the presence of a concentration gradient. Alternatively, the latter
mass transfer can be accelerated due to a convection process inside the food matrix as will be
discussed in more detail later.
The sorption and diffusion process can be described quantitatively by using the partition coefficient
KP/F and the diffusion coefficients DP and DF, where the indexes P and F refer to the polymer or
plastic and the food respectively.
Figure 4. Schematic representation of migration from food contact materials. Symbols : E :
environment; C/M : contact material; F : food; HS : headspace (explanation : see text)

Introduction – migration from food contact materials 11
Chemical interactions between packaging materials and foodstuffs
1.2.2.2. Partition coefficient and the sorption process
The partition coefficient of a migrating compound between a polymer and a food can be defined as
follows
�
�
�
F,
P,P/F C
CK [1]
where CP,∞ and CF,∞ are respectively the equilibrium concentration of the component in the polymer
and the food (Franz, 2000). Basically this definition is derived from the assumption that in
equilibrium conditions (time t=∞) the chemical potential of the migrating substance in the polymer,
µP, is equal to the chemical potential of the same compound in the food, µF as described by Baner
(2000).
Mainly the partition coefficient depends on the polarity of the substance and of the polarity of the
two phases involved. The following simple example illustrates the importance of the partition
coefficient.
At equilibrium conditions, the amount of migrated substance into the food, mF,∞ can be calculated as
follows. Supposing that initially no migrating substance was present in the food (mF,0=0) and that
mP,0 represents the initial amount of migrant present in the polymer, than it can be concluded from
the mass balance that
��
�� P,F,P,0 mmm [2]
From equation [1] however
PP/FF
F,P, VK
Vm
m ����
� [3]
where VP and VF are respectively the volume of the polymer and the food.
Consequently,
F
PP/F
P,0F,
VVK1
mm
��
��
[4]
Generally is can be assumed that VP/VF << 1. From equation [4] it can be concluded that in the case
KP/F <<1, the amount of migrated substance in the food in equilibrium conditions (mF,∞) equals the
initial amount of substance present in the polymer (mP,0). This implies that total migration of the
substance out of the polymer occurred. If on the contrary, an apolar substance is applied in an
apolar polymer contacted with water, it is clear that KP/F >>1 and from equation [4] it can be
concluded that
Introduction – migration from food contact materials 12
Chemical interactions between packaging materials and foodstuffs
0P,F, mm ���
[5]
This indicates that migration remains restricted. As most polymers used are (fairly) apolar (Figure
1) and because most of the low molecular weight compounds present in a plastic are apolar as well,
it follows from the above example that migration will especially be important in apolar food
matrices, like fatty foods. Of course, polar migrants, such as the antistatic polyethylene glycol, will
preferentially migrate to more polar, so-called aqueous foods.
Partition coefficients can be determined experimentally, but this approach often is very tedious and
prone to experimental errors. Therefore empirical methods were developed to estimate the partition
coefficients for given polymer-migrant-food systems (Baner, 2000). Detailed discussion of these
methods fall out of the scope of this work.
1.2.2.3. Diffusion coefficient and the diffusion process
The diffusion coefficient D of a migrating compound in a particular matrix follows from Fick’s first
law, stating that the mass flux of the compound in the direction x, Jx, during a time ‘t’ through an
unit area is proportional to the gradient of the concentration of the compound, C, considered in the
x direction. Mathematically this gives the following
xCDJ x�
���� [6a]
Of course, fluxes in the other directions can be defined similarly
yCDJ y�
���� [6b]
zCDJ z�
���� [6c]
Due to this flux however, the concentration in a unit cell of the matrix in which the diffusion is
taking place, with dimensions ∆x∆y∆z, will vary accordingly as a function of the time (Figure 5).
The net change of the concentration of the compound in this unit cell as a function of time can be
found from
� � � �
� �zyx
yx)z(J)zz(J
zyxzx)y(J)yy(J
zyxzy)x(J)xx(J
tC
zz
yyxx
���
�����
����
������
���
������
�
��
[7]

Introduction – migration from food contact materials 13
Chemical interactions between packaging materials and foodstuffs
Figure 5. Diffusion through an elementary volume
If the unit cell becomes infinitely small, then equation [7] becomes
z
Jy
Jx
JtC zyx
�
��
�
��
�
��
�
�� [8a]
or if the diffusion coefficient is constant
��
�
�
��
�
�
�
��
�
��
�
�
�
�2
2
2
2
2
2
z
C
yC
xCD
tC
[8b]
Equation [8a] is known as the general Fick’s second law of diffusion.
Without going into detail about the practical applicability of these diffusions laws and their
consequences for the migration from plastic food contact materials to food, it is clear that the
amount of substance migrating to the food during a specified period of time will partially depend
upon the diffusion coefficient of the migrant in the polymer (and in the food).
Because of the importance of the diffusion coefficient of the migrant in the polymer, models which
are able to predict this parameter for a given thermoplastic polymer-substance system have been
developed throughout the years (Mercea, 2000). It is not the intention to review those models in
detail in this work, because it would fall outside its scope. Only the mechanistic principle of the
most important models will be discussed to better understand the fundamental mechanisms of
diffusion of low molecular weight compounds in polymers.
Basically, two kinds of models are being developed. The first group is considered as the microscopic

Introduction – migration from food contact materials 14
Chemical interactions between packaging materials and foodstuffs
models. The second group are merely ‘atomistic’ models that try to estimate the diffusion coefficient
by making use of computer simulated diffusional processes (Mercea, 2000). For both types however,
it should be emphasised that the diffusion mechanisms in thermoplasts below and above the glass
transition temperature of the polymer, are totally different. Basically three different cases can be
considered depending on the diffusion rate of the migrant and the relaxation rate of the polymer.
Case I diffusion or Fickian diffusion occurs when the diffusion rate is much less then the relaxation
rate of the polymer. Case II diffusion is characterized by a rapid diffusion in comparison with the
relaxation of the polymer. The relaxation rate of the polymer is related t the time the polymer needs
to adjust itself to a new equilibrium. Finally case III or anomalous diffusion occurs when both the
diffusion and relaxation rates are comparable (Schlotter and Furlan, 1992). Rubbery polymers
correspond quickly to changes in their physical condition so consequently the diffusion of low
molecular weight compounds is considered to be Fickian. Due to the limited mobility of the
polymer below its glass transition temperature, diffusion obeys mostly to case II or III in these
circumstances.
Microscopic diffusion models in rubbery polymers
For the first approach, better known as the classical approach, two types of models are described :
the molecular and the free volume models. In the molecular model for rubbery polymers (T>Tg), it
is assumed that the polymer matrix consists of a random distribution of identical segments. These
are cylindrical cells composed of a number of parallel polymer chains. Because of thermal
vibrations, the unit cell expands and contracts. Similarly, the migrant will exhibit a molecular
mobility. Of course the oscillatory movement of the polymer segments is several orders of
magnitude slower then those of the migrant. If the motion of the polymer chains in a unit cell,
containing a migrant, is coordinated in such a way that a void is created large enough to
accommodate the molecule, a longitudinal movement along the polymer chain is created as
illustrated in Figure 6a (DiBenedetto, 1963 a-b).
This movement however was estimated to be several orders of magnitude faster then the
macroscopically determined diffusion rates. Hence it can be concluded that the migrating molecules
merely move forward and backward along the polymer chains, without inducing effective
diffusion. Apart from the longitudinal movement however, a perpendicular movement to the latter,
allowing the migrant to transfer into another adjacent unit cell, can occur as well (Figure 6b). This
transverse movement is much slower compared to the longitudinal one and is therefore the rate
determining step in the diffusion process. In order to allow a symmetrical separation of two

Introduction – migration from food contact materials 15
Chemical interactions between packaging materials and foodstuffs
polymer chains present in two adjacent unit cells, permitting the passage of the migrant, an
activation energy Ed is needed. This activation energy is related to the diffusion coefficient of the
migrant in the polymer. This parameter can be estimated from several polymer and migrant specific
parameters, which sometimes are however difficult to determine (Pace and Datyner, 1979 a-c). In
addition, for the relationship between Ed and the diffusion coefficient, only solutions can be found
in special cases of which the practical relevance is restricted (Kloczkowski and Mark, 1989).
Figure 6a. The activation process
of diffusion (Mercea, 2000)
Figure 6b. Polymer microstructure
and possible motions of migrants
(Mercea, 2000)
The free volume models for rubbery polymers, assume that the mobility of the migrant in the
polymer-migrant system is primarily determined by the available free volume in the system. The
free volume in a polymer is regarded as an ‘empty’ volume between the chains of the polymer.
Similarly the free volume of the migrant can be regarded as the volume not occupied between these
molecules. If both the polymer and migrants are regarded as hard spheres, void spaces in the liquid
of spheres will originate from local fluctuations in density of these spheres. If these voids are large
enough to contain a migrant and if the migrant jumps into it before the original sphere returns to its
original position, diffusion occurs. Consequently redistribution of the free volume within the liquid
of hard spheres provides diffusion (Cohen and Turnbull, 1959; Turnbull and Cohen, 1961). If the
model allows to calculate the amount of free volume, to determine the free volume distribution and

Introduction – migration from food contact materials 16
Chemical interactions between packaging materials and foodstuffs
to estimate the energy required to redistribute the free volume, realistic estimates of the diffusion
coefficient can be obtained from a limited amount of experimental data, using a quite complex
procedure (Vrentas and Vrentas, 1994a).
Microscopic or molecular diffusion models in glassy polymers
In glassy polymers, diffusion of migrants is much more complex. Time to reach equilibrium after a
diffusional jump of a migrant in a glassy polymer is generally longer than the characteristic time
involved in the diffusion of the migrant itself (Crank and Park, 1968, Stannett et al., 1979). This is
because the free volume of the polymer chains is restricted. It is assumed that the holes throughout
the polymer matrix are ‘frozen’ into the polymer as it is quenched from the rubbery state (Mercea,
2000).
It is speculated that below Tg, the fixed holes present in the polymer structure can be filled with
migrating molecules, since they act as Langmuir troughs. Therefore the models describing the
diffusion in glassy polymers are known as the dual sorption theories (Fredrickson and Helfand,
1985). Although it was assumed initially that these captured migrants were not participating in the
diffusion process (Meares, 1957 a-b), it became clear that the normally dissolved molecules in the
rubbery part of the polymer are in equilibrium with the captures ones and hence that both kind of
molecules should be kept into account to estimate the diffusion coefficient (Paul, 1969; Petropoulos,
1970). Consequently, the kinetics of the immobilisation process should be kept into account and
models become extremely complex. As a further result exact analytical results were only found in a
limited amount of cases (Fredrickson and Helfand, 1985).
The free volume models were adjusted as well to incorporate local density fluctuations in glassy
polymers. Due to the restricted polymer mobility, the redistribution of the free volume in the
polymer is hindered and consequently diffusion proceeds more difficult. Complex models have
been introduced assuming that the diffusion becomes dependent upon the solvent concentration
(Vrentas and Vrentas, 1994b).
As indicated in Figure 7, reasonably good agreement is obtained between the theoretical and
experimental values by for example the free volume models for rubbery polymers. Practical
applicability in the prediction of diffusion coefficients for the estimation of migration from plastics
remains however problematic for all the microscopic models discussed. The main reason for this lies
in the fact that almost all models included parameters which can be determined only by fitting the
experimental data to the theoretical curves obtained by the model. In addition they include a lot of
simplifying assumptions, without physical relevance. Therefore these microscopic models are

Introduction – migration from food contact materials 17
Chemical interactions between packaging materials and foodstuffs
considered especially useful because they offer an insight on the mechanism of diffusion, although
they do not truly allow prediction of the diffusion coefficients (Gusev et al., 1994).
A
B
Figure 7. Temperature (A, at three different mass fractions of the solvent, ω1 : ∆= 0.189 ; �= 0.160 ;
�= 0.136) and composition dependence (B, at two different temperatures ∆= 30°C; �=100°C) of the
diffusion coefficient of respectively toluene and ethylbenzene in polystyrene. Lines are theoretical
predictions and points are experimental data (from Vrentas and Vrentas, 1994b)
Atomistic diffusion models
The second type of models, the computational ones, envisages developing an atomistic model on
the basis of data about the atoms and molecules involved. From these data, simulations can predict
the properties and behaviour of the polymer molecule. A molecular structure is created by a
sufficient number of simulations. Once this structure is created, migrating molecules are ‘inserted’
into the model, followed again by a number of simulations. From these calculations, the actual
diffusion coefficients can be estimated. In order to make such computations possible, powerful
methods for the simulation of polymeric microstructure and dynamics are necessary together with a
large computation capacity. Basically two methods for modelling the diffusion in amorphous
Introduction – migration from food contact materials 18
Chemical interactions between packaging materials and foodstuffs
polymers are available : molecular dynamics and the transition-state approach.
Although these computation methods do not assume a microscopic diffusion mechanism as those
discussed above, they confirm the mechanisms laid down in these phenomenological models.
Therefore they are worthwhile to mention them here and explain them briefly.
In the molecular dynamics approach a theoretical polymer structure based, on detailed mechanical
equilibriums, is generated. Based on this theoretical structure an average free volume can be
calculated. Subsequently, migrating molecules are inserted into the free volumes of the theoretical
molecular structure, again taking into account several parameters, such as the energy state of the
new structure. Finally, interaction is simulated by again creating theoretical structures by
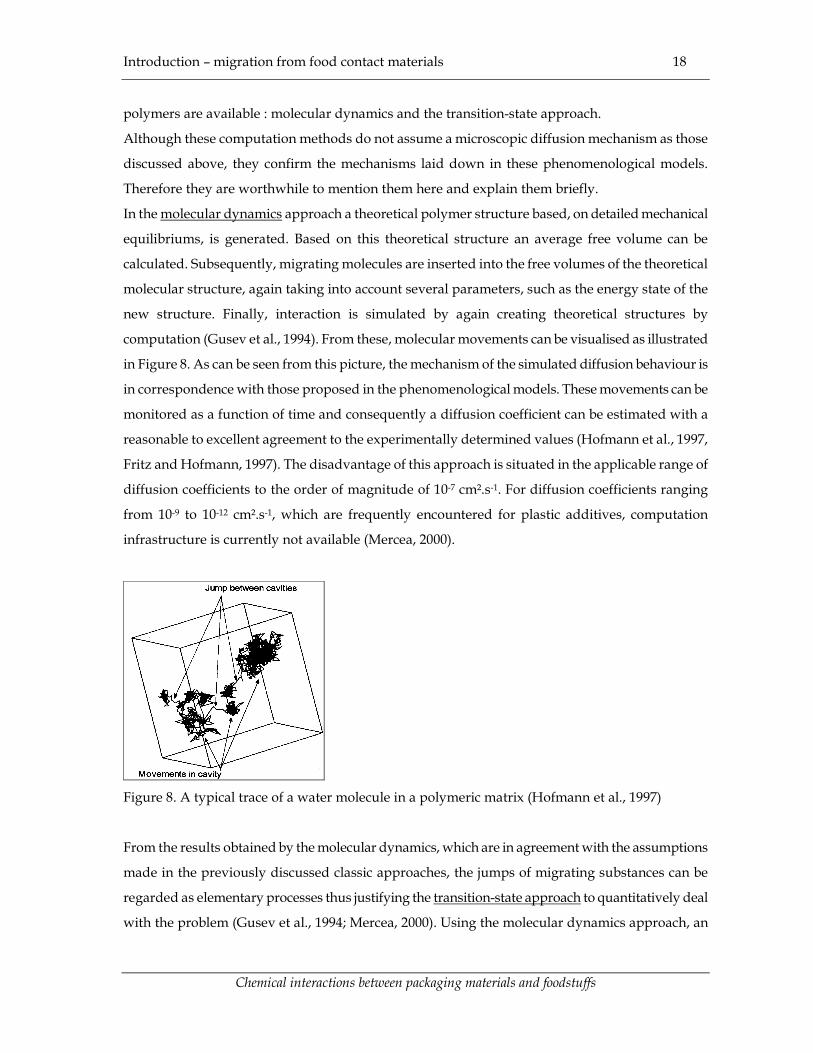
computation (Gusev et al., 1994). From these, molecular movements can be visualised as illustrated
in Figure 8. As can be seen from this picture, the mechanism of the simulated diffusion behaviour is
in correspondence with those proposed in the phenomenological models. These movements can be
monitored as a function of time and consequently a diffusion coefficient can be estimated with a
reasonable to excellent agreement to the experimentally determined values (Hofmann et al., 1997,
Fritz and Hofmann, 1997). The disadvantage of this approach is situated in the applicable range of
diffusion coefficients to the order of magnitude of 10-7 cm².s-1. For diffusion coefficients ranging
from 10-9 to 10-12 cm².s-1, which are frequently encountered for plastic additives, computation
infrastructure is currently not available (Mercea, 2000).
Figure 8. A typical trace of a water molecule in a polymeric matrix (Hofmann et al., 1997)
From the results obtained by the molecular dynamics, which are in agreement with the assumptions
made in the previously discussed classic approaches, the jumps of migrating substances can be
regarded as elementary processes thus justifying the transition-state approach to quantitatively deal
with the problem (Gusev et al., 1994; Mercea, 2000). Using the molecular dynamics approach, an

Introduction – migration from food contact materials 19
Chemical interactions between packaging materials and foodstuffs
upper bond for times at which the system fluctuates around its equilibrium condition can be
calculated. Within these time frames, the polymer is performing so-called elastic movements and for
the migrants, especially vibrational motions predominate. At longer time intervals the system will
perform structural relaxations enabling migrants to diffuse in the polymer matrix (Gusev et al.,
1994). Using stochastic methods and other advanced mathematical techniques in combination with
a number of simplifications and suppositions, the jumps of the migrant in the polymer can be
simulated without keeping into account the dynamics of the migrant during the elastic behaviour of
the polymer. Thus much longer simulation intervals can be used, reducing the time needed to
perform a simulation of the dynamics of the polymer-migrant system. The latter simulations enable
again, as in the molecular dynamics method, to estimate the diffusion coefficient of the migrant. The
transition state approach could be very useful for systems in which the interactions between the
migrant and the polymer can be neglected. For systems in which the migrant causes swelling of the
polymer however, molecular dynamic simulations remain the method of choice. Therefore it is
considered important to use both techniques in conjunction (Gusev et al., 1994, Mercea, 2000).
Considering the diffusion in the polymer below Tg, again more complications occur. It has been
reported that the molecular dynamic approach is not yet able to generate realistic estimates of the
diffusion coefficient because of the large variability in the size of the crystal cells (Mercea, 2000).
As a conclusion it can be stated that none of the above mentioned diffusion models are currently
able to estimate diffusion coefficients for every given polymer-migrant system.
1.2.3. Mathematical approach to estimate migration from plastics
1.2.3.1. General transport equation
The goal of the mathematical models describing migration from plastic food contact materials is to
predict the concentration of the migrant in the food after contact with the plastic. In such a manner,
lengthy and costly migration experiments, which are legally requested, can be avoided. In order to
obtain a reliable model, all mass transfer phenomena and other processes affecting the
concentration of the migrant in the food, should be considered. Basically the following processes are
taken into account:
- diffusion of the migrant
- convection of the medium in which the migrant is dissolved
- chemical reactions in which the migrant is involved
It is important to realise that from a theoretical point of view all these processes can take place in

Introduction – migration from food contact materials 20
Chemical interactions between packaging materials and foodstuffs
both the food and the polymer. Practically however mainly the following processes control the
migration behaviour:
- diffusion of the migrant in both the polymer and the food
- chemical reaction in both the polymer and the food
Convection of the polymer is very much restricted in normal conditions of use, so will be of no
influence with regard to the migration. In liquid foods, convection will cause a quick distribution of
the migrant in the food favouring a uniform concentration of the migrant. In solid foods or highly
viscous foods, diffusion of the migrant will be of higher importance compared to convection fluxes
of the food itself.
Migrants can be subjected to chemicals reactions in the polymer itself (e.g. partial degradation of
antioxidant during plastic extrusion) or in the food. The hydrolysis of bisphenol A diglycidyl ether
(BADGE), a cross linking agent used in epoxy coatings for food cans, is a typical example in this
respect (Tice and Mc. Guiness, 1987, Tice, 1988, Paseiro Losada et al., 1997).
Mathematically the predominant processes affecting the concentration C of the migrant at a
particular place with coordinates (x,y,z) in the food-polymer system can be written as follows :
For diffusion, as introduced before as the second diffusion law of Fick
z
Jy
Jx
JtC zyx
�
��
�
��
�
��
�
�� [8a]
For the chemical reaction
mCktC
����
� [9]
In, equation [9], m represents the order of the chemical reaction and k is the reaction rate constant.
Summation of the two equations, gives the general transport equation in which the convection in
both the polymer and the food are supposed to have minor influence
n2
2
2
2
2
2
CkzDC
yDC
xDC
tC
�����
����
�
�
[10]
Of course the main problem in solving this equation is situated in the second order partial
differential equation. Such an equation has only an analytical solution in some special cases. In
addition, the diffusion coefficient should be constant. In all other cases, numerical methods should
be used to solve the equation. Once this equation is solved however, the problem of a reliable
estimate of the diffusion coefficient of the migrant remains. As discussed previously (paragraph
1.2.2.3), mechanistic and atomistic diffusion models are currently unable to solve this problem.
The second part in this equation is rather specific for particular migrants and will not be discussed

Introduction – migration from food contact materials 21
Chemical interactions between packaging materials and foodstuffs
here in more detail. Therefore only solutions to the second order differential equation will be
presented.
As indicated before, a number of assumptions should be made to analytically solve the second
order partial differential equation given in equation [10]. Primarily, the diffusion coefficient is
supposed to be constant in both the food and the polymer. In addition, it is assumed that diffusion
takes place in only one direction, perpendicular to the surface of the polymer. Consequently, the
jjkpartial differential equation becomes
2
2
xCD
tC
�
��
�
� [11]
Solutions to this equation for have been described for finite and infinite polymers.
1.2.3.2. Diffusion from finite polymer
Further basis assumptions in addition to those mentioned above include the following :
- there is one single migrant, which is uniformly distributed in the polymer at t=0 at a
concentration CP,0
- the concentration of the migrant in the food at a particular time, CF,t is everywhere the
same, implying that the food is ideally mixed
- a constant distribution of the migrant between the polymer and the food takes place
according to
�
�
��
F,
P,
tF,
tP,P/F C
CCC
K [12]
- the contact material is a flat sheet
- the mass transfer is mainly controlled by diffusion taking place in the polymer
Crank (1975) developed the following solution to equation [11] (Piringer, 2000b; Hamdani et al.,
1997) for a polymer in contact with a finite food
� � �
��
�
�
���
�
�
��
�� �
����
�����
2P
2nP
L
tqD
0n2n
2F,
tF, e q1
121mm
[13]
in which mF,t is the amount of migrant in the food at a particular time t, qn is the positive root of the
trigonometric identity tg(qn)=-αqn, LP is the thickness of the polymer, DP the diffusion coefficient of
the migrant in the polymer and α is given by the following formula

Introduction – migration from food contact materials 22
Chemical interactions between packaging materials and foodstuffs
�
�
����
,P
,F
P
F
P/F mm
VV
K1
[14]
in which VF and VP represent the volume of respectively the food and the polymer and mP,∞ is the
mass of the migrant present in the polymer at equilibrium conditions (t=∞).
This rather complex equation [13] can be simplified by assuming the finite polymer is contacted
with an infinite food. This implies that the concentration of the migrant in the food equals zero,
since mathematically spoken, VF→∞. Consequently, from equation [14] it follows that α>>1.
According to Piringer (2000b) and Hamdani et al. (1997) equation [13 ] can then be simplified into:
� �
� ���
�
�
��
�
� ��
� �
�
��
tD4L
π12n
0n22F,
tF,P2
P
22
e π12n
81mm
[15]
Equation [15] is reported to give the same results as equation [13] if the volume of the food (VF)
exceeds 20 times the volume of the polymer (VP), which in practice is usually achieved, also in
migration tests (Hamdani et al., 1997).
Equation [15] can further be simplified for the following two cases (Hamdani et al., 1997):
- long contact time (mF,t/mF,∞>0.6)
��
�
�
��
�
� ��
�
��
tDL
2F,
tF,P2
P
2
e 81mm
[16]
- short contact time (mF,t/mF,∞<0.6)
�
�
�
tD
L2
mm P
PF,
tF, [17]
For all these models, it was assumed that diffusion in the polymer is the main factor controlling the
migration phenomenon. If other processes, such as the dissolution and the diffusion of the migrant
in the food are also important factors to consider, analytical solutions of the diffusion equation [11]
are not available. Numerical methods for some cases have been described (Laoubi and Vergnaud,
1996).
A further simplification of the problem, assuming the polymer is infinite, allows in some cases to
take into account the dissolution and the diffusion of the migrant in the food as explained in the
following.

Introduction – migration from food contact materials 23
Chemical interactions between packaging materials and foodstuffs
1.2.3.3. Diffusion from infinite polymer
The assumption of infinite polymer implies that the concentration of the migrant in the polymer is
constant as a function of time (CP,0= CP,t). Of course, this does not correspond to reality since it is
known that the concentration of the migrant in the polymer is affected by migration (Hamdani et
al., 1997). Again several solutions of equation [11] have been proposed for a number of cases taking
into account the following supplementary boundary conditions :
- there is one single migrant, which is uniformly distributed in the polymer at t=0 at a
concentration CP,0
- a constant distribution between the polymer and the food takes place according to
�
�
��
F,
P,
tF,
tP,P/F C
CCC
K [12]
- the contact material is a flat sheet
Two major cases can be distinguished depending on the concentration gradient of the migrant in
the food.
No concentration gradient of the migrant in the food
If no concentration gradient in the food is present, this implies that the food is well mixed or that
the diffusion of the migrant in the food proceeds much faster compared to the diffusion in the
polymer. The general solution of equation [11] is given by (Limm and Hollifield, 1995; Piringer,
2000b, Lickly et al., 1997; Hamdani et al., 1997) :
��
���
��
� erfc(z)e1
KAC
m2z
P/F
P,0tF, [18]
in which A is the contact surface between the polymer and the food and z is given by
A
tDKz PP/F �
� [19]
According to Hamdani et al. (1997) this equation is valid for infinite polymers contacted with finite
foods, indicating that the migrant slowly dissolves in the food as confirmed by Limm and Hollifield
(1995). Consequently, diffusion is mainly governed by solvatation.
If the migrant is very well soluble in the food however (KP/F<<1), equation [18] can be simplified
into (Piringer, 1994; Lickly et al., 1997)
�
�
tD C2A
m PP,0
tF, [20]
Introduction – migration from food contact materials 24
Chemical interactions between packaging materials and foodstuffs
According to Hamdani et al. (1997) equation [20] represents the migration from an infinite polymer
in contact with an infinite food (mathematically : CF=0). In this case, diffusion of the migrant in the
polymer will dominate the migration process.
Concentration gradient of the migrant in the food
If a concentration gradient of the migrant is present in the food, the following equation has been
proposed as a solution to equation [11] (Piringer, 2000b)
���
����
�
��
�
1tD C2m P
P,0tF, [21]
in which
P
F
F/P DD
K
1�� [22]
As can be noticed, diffusion of the migrant in both the food and the polymer are taken into account.
If in this case, diffusion in the food is fast (β>>1), equation [21] is turned into equation [20],
indicating that due to the high diffusion in the food, the concentration gradient of the migrant in the
food is negligible.
If on the other hand, β<<1, because of the poor solubility of the migrant in the food, migration will
be especially dominated by the migration in the food as indicated in the following equation derived
from equation [20] (Piringer, 2000b)
�
�
tD
KC2
m F
P/F
P,0tF, [23]
1.2.3.4. Estimation of material constants
As can be concluded from all the analytical solutions to the general diffusion equation [11],
diffusion coefficients and the partition coefficient of the migrant should be known to practically
apply these equations. As will be explained later, from a regulatory point of view, the ‘worst-case’
scenario for the prediction of the migration is of primary interest. Therefore, it is most frequently
assumed that the solubility of the migrant in the polymer is very high, which implies that KP/F=1,
thus avoiding difficulties for the estimation of the partition coefficient for a given migrant-polymer-
food system. Consequently, the problem of a realistic estimate of the diffusion coefficient remains.
Diffusion coefficients of migrants range from about 10-9 cm².s-1 down to about 10-18 cm².s-1. From the
above equations it can be concluded that this large difference in magnitude will play a major role in
the final migration result for most cases. Realistic estimates are therefore considered indispensable
Introduction – migration from food contact materials 25
Chemical interactions between packaging materials and foodstuffs
because underestimated diffusion coefficients will underestimate migration and overestimates will
make the practical use of these migration models impossible (Brandsch et al. 2000).
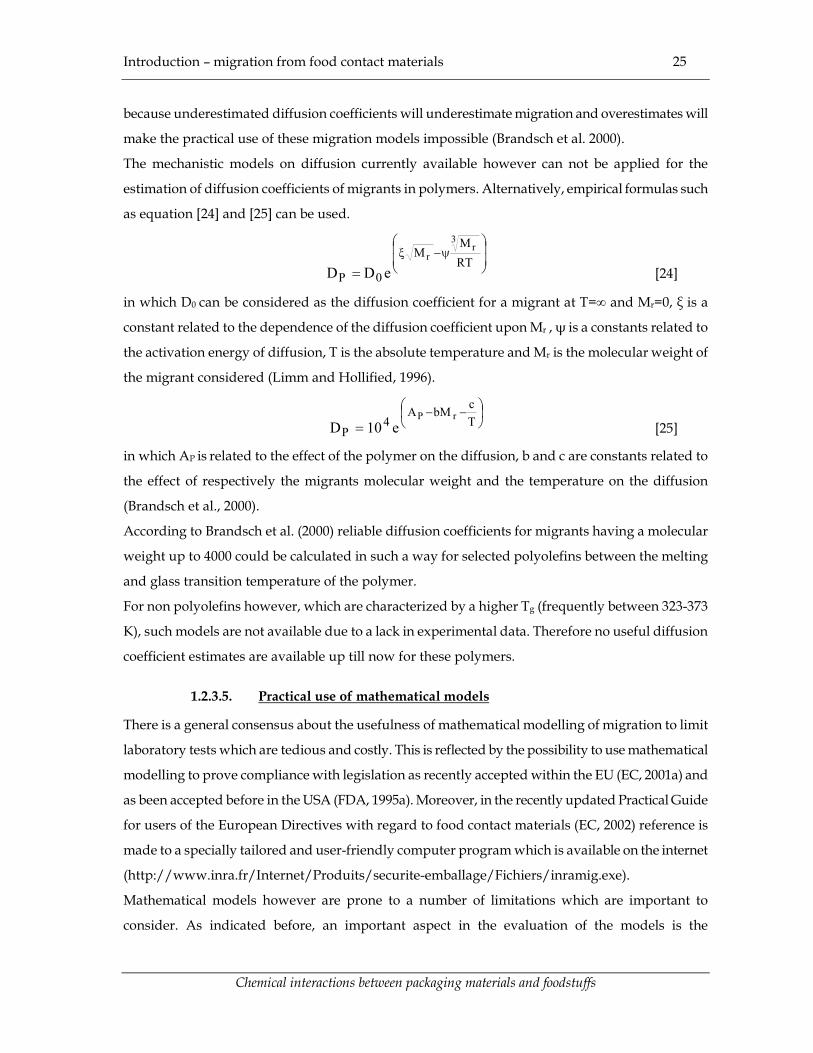
The mechanistic models on diffusion currently available however can not be applied for the
estimation of diffusion coefficients of migrants in polymers. Alternatively, empirical formulas such
as equation [24] and [25] can be used.
��
�
�
��
�
���
�
RTM
M
0P
3r
r
eDD [24]
in which D0 can be considered as the diffusion coefficient for a migrant at T=∞ and Mr=0, ξ is a
constant related to the dependence of the diffusion coefficient upon Mr , ψ is a constants related to
the activation energy of diffusion, T is the absolute temperature and Mr is the molecular weight of
the migrant considered (Limm and Hollified, 1996).
��
���
���
�TcbMA
4P
rPe10D [25]
in which AP is related to the effect of the polymer on the diffusion, b and c are constants related to
the effect of respectively the migrants molecular weight and the temperature on the diffusion
(Brandsch et al., 2000).
According to Brandsch et al. (2000) reliable diffusion coefficients for migrants having a molecular
weight up to 4000 could be calculated in such a way for selected polyolefins between the melting
and glass transition temperature of the polymer.
For non polyolefins however, which are characterized by a higher Tg (frequently between 323-373
K), such models are not available due to a lack in experimental data. Therefore no useful diffusion
coefficient estimates are available up till now for these polymers.
1.2.3.5. Practical use of mathematical models
There is a general consensus about the usefulness of mathematical modelling of migration to limit
laboratory tests which are tedious and costly. This is reflected by the possibility to use mathematical
modelling to prove compliance with legislation as recently accepted within the EU (EC, 2001a) and
as been accepted before in the USA (FDA, 1995a). Moreover, in the recently updated Practical Guide
for users of the European Directives with regard to food contact materials (EC, 2002) reference is
made to a specially tailored and user-friendly computer program which is available on the internet
(http://www.inra.fr/Internet/Produits/securite-emballage/Fichiers/inramig.exe).
Mathematical models however are prone to a number of limitations which are important to
consider. As indicated before, an important aspect in the evaluation of the models is the

Introduction – migration from food contact materials 26
Chemical interactions between packaging materials and foodstuffs
correspondence between the calculated and experimental data. Because of the necessity of a reliable
estimate of the diffusion coefficient of the migrant, it can be concluded from the above discussions
that currently only models applicable to polyolefins are available. It should be noted on the other
hand that polyolefins are currently the most frequently applied polymers for food contact.
Mathematical modelling could therefore be helpful already in a large number of applications.
The models described are only able to predict the migration of known and well characterised
migrants. Consequently the models will not be able to predict the total amount of substance
migrated from a contact material, since the contact material may contain apart from the additives
also a number of other compounds of which the identity is not completely known (e.g. ethylene
oligomers or their breakdown products present in PE).
Care should be taken in using too simplified migration models. Hamdani et al. (1997) for example
illustrated that the use of equation [20] should be considered with a lot of care. Although the model
assumes that the polymer is infinite and therefore could suggest a ‘worst-case’ scenario, they
recommended the use of equation [17] instead because of the risk of underestimating the migration
levels. In addition it should be noted that the models predict the migration from an idealized
geometric object (plane). Previously Chatwin (1996) indicated that the actual geometry of the
polymeric object should be considered as well if mathematical models are used. Another important
aspect is the possible absorption of food components by the polymer, altering the diffusion
coefficients in the polymer. Consequently, a supplementary variable is introduced, making the
presented models in most cases too simplistic.
Therefore, the use of a more general equation such as equation [13] is considered to be better.
O’Brien et al. (1999) and O’Brien and Cooper (2001) compared specific migration of various
additives from polyolefins to olive oil at various time temperature conditions with the predicted
values of this migration model (Figure 9). For polypropylene, almost all the estimated values were
higher then those experimentally observed. From a safety point of view this is interesting. Results
for polyethylene were a bit less promising. Despite this observation, Brandsch et al. (2000)
considered the overestimation of the predicted migration levels too high ! In order to obtain a more
accurate estimation, it was believed that the use of a more realistic KP/F, especially at lower
temperatures, would be appropriate.
For the sake of completeness it should be mentioned that mathematical modelling is also applied
with regard to so-called functional barrier concept. Although this concept is of particular
importance with regard to the migration from recycled and re-used polymers, it is applicable to any
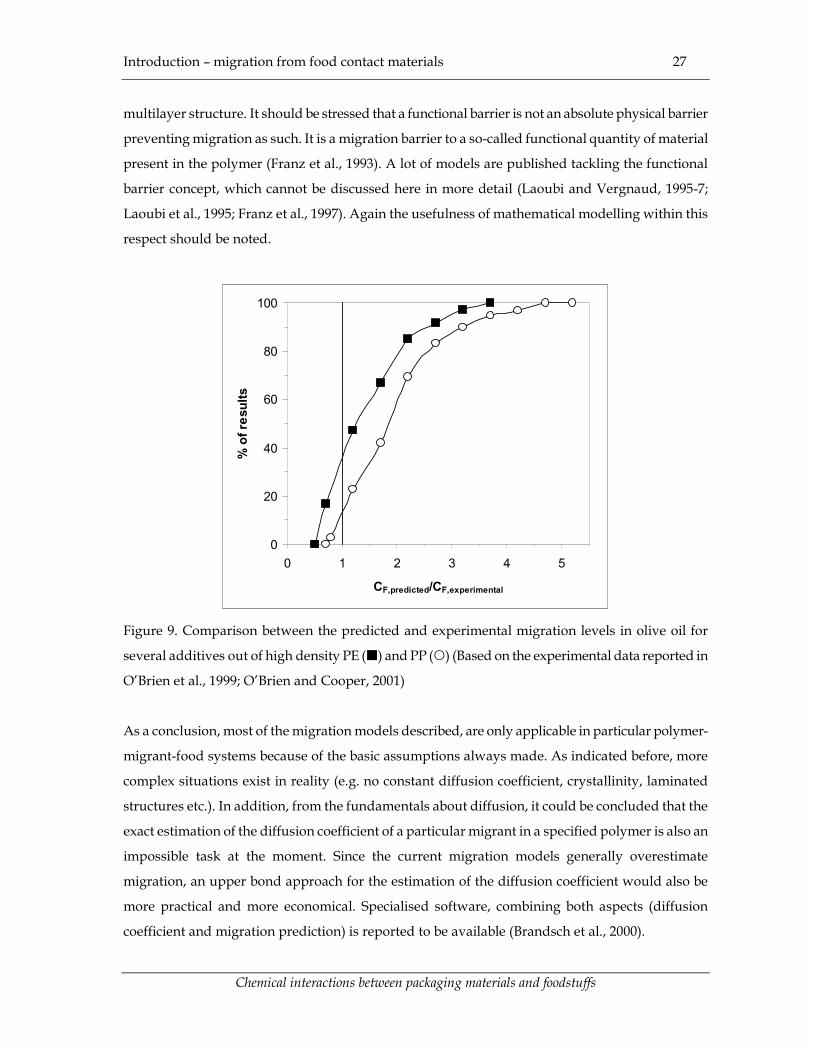
Introduction – migration from food contact materials 27
Chemical interactions between packaging materials and foodstuffs
multilayer structure. It should be stressed that a functional barrier is not an absolute physical barrier
preventing migration as such. It is a migration barrier to a so-called functional quantity of material
present in the polymer (Franz et al., 1993). A lot of models are published tackling the functional
barrier concept, which cannot be discussed here in more detail (Laoubi and Vergnaud, 1995-7;
Laoubi et al., 1995; Franz et al., 1997). Again the usefulness of mathematical modelling within this
respect should be noted.
0
20
40
60
80
100
0 1 2 3 4 5
CF,predicted/CF,experimental
% o
f res
ults
Figure 9. Comparison between the predicted and experimental migration levels in olive oil for
several additives out of high density PE (�) and PP (�) (Based on the experimental data reported in
O’Brien et al., 1999; O’Brien and Cooper, 2001)
As a conclusion, most of the migration models described, are only applicable in particular polymer-
migrant-food systems because of the basic assumptions always made. As indicated before, more
complex situations exist in reality (e.g. no constant diffusion coefficient, crystallinity, laminated
structures etc.). In addition, from the fundamentals about diffusion, it could be concluded that the
exact estimation of the diffusion coefficient of a particular migrant in a specified polymer is also an
impossible task at the moment. Since the current migration models generally overestimate
migration, an upper bond approach for the estimation of the diffusion coefficient would also be
more practical and more economical. Specialised software, combining both aspects (diffusion
coefficient and migration prediction) is reported to be available (Brandsch et al., 2000).

Introduction – migration from food contact materials 28
Chemical interactions between packaging materials and foodstuffs
1.2.4. Parameters of importance for the migration from plastics
From the above discussed mathematical models describing migration and diffusion, important
parameters affecting migration can be derived. In the following, experimental confirmation of the
influence of these parameters will be presented.
This confirmation is of importance with regard to the validity of the models discussed. In addition
however, identification of such factors are a key issue as well if regulatory aspects are considered.
By making use of the fundamental knowledge on migration, relevant test methods can be
developed and legally imposed to simulate, in the laboratory, migration to food in a practical and
economic way.
1.2.4.1. Time
Because of transport equation [10], migration should be regarded as a dynamic process. Therefore
time is of major importance determining the amount of substance migrating from the polymeric
contact material to the food. From the simplified models (equations [17], [20], [21] and [22]) it can be
concluded that, especially at the beginning of the migration process, the migrated amount is
proportional to t1/2. This is confirmed by numerous experiments, especially involving migration
from polyolefins as reviewed by Figge (1996). Of course at longer time intervals migration will
flatten off as illustrated in Figure 10. These curves are in correspondence with the general
exponential trend reflected in the more general equations describing migration mentioned above
(paragraph 1.2.3). The plateau is reached in equilibrium conditions and depends on the partition
coefficient KP/F.
Since the migration models described previously are based on a number of simplifications, it is not
surprising however that other relationships with regard to time could be observed as well. This
could be due to for example a non Fickian diffusion mechanism, like a class II diffusion which
proceeds linear as a function of time as indicated previously by Schlotter and Furlan (1992).
Evaluation of the migration dynamics could therefore reveal the nature of the diffusion mechanisms
involved.
Irrespective of the true nature of the controlling mechanisms of the migration process, it should be
clear that migration from a contact material to a food will increase as a function of time as long as no
equilibrium between these two materials is reached.

Introduction – migration from food contact materials 29
Chemical interactions between packaging materials and foodstuffs
Figure 10. Migration of n-butyl stearate from polystyrene in a test fat (adapted from Figge, 1996)
1.2.4.2. Factors affecting the diffusion and partition coefficient
The migration process is highly dominated by the diffusion coefficients of the migrant and its
partition coefficient in a particular food-polymer system. Consequently, parameters exerting an
effect on these main factors are of prime importance as well.
Temperature will highly influence the migration process as illustrated in Figure 10. Because in this
particular example, the initial migration rate is dependent upon DP (equation [17]), it is clearly
demonstrated that by increasing the temperature an increase of DP is observed resulting in a higher
initial migration speed. It is also obvious that at equilibrium conditions, higher migration levels are
observed at higher temperatures, confirming the expected change of the partition coefficient KP/F.
Generally an Arhenius type of relationship is observed between migration and temperature (Figge,
1996). However, if one of the components involved, undergoes a change in its physical state due to
a change in temperature, deviations from this relationship can be expected. Consequently migration
and its dynamics in polymers below and above glass transition temperatures will be highly
different. Similarly, migration will be influenced by the crystallinity of the food (Figge, 1996).
In addition to this extrinsic factor, a number of intrinsic factors of the polymer-food-migrant
systems affect the partition and diffusion coefficients as well.

Introduction – migration from food contact materials 30
Chemical interactions between packaging materials and foodstuffs
For the partition coefficient especially the interactions between the three phases should be
considered. Generally migration of an apolar migrant to an apolar food from an apolar polymer or
vice versa, can be considered as a worst-case. (Franz, 2000). So the polarity of each phase present in
the system is of extreme importance. This was illustrated with numerous experimental data (e.g.
Figge, 1996; Scott, 1988). Since most of the polymers used are apolar (Figure 1) it follows that
especially fatty foods are susceptible for migration. In this regard it should be stressed however that
the fat content of a food is considered of less importance compared to the so-called fat-releasing
properties, which for example are enhanced if fat is present on the foods surface (Figge, 1996; Castle
et al., 1994).
For the diffusion coefficients the migrants molecular weight is of prime importance as could be
concluded from the empirical equations [24] and [25]. In addition however, also steric effects should
be considered. As can be expected from the fundamentals of diffusion in polymers, especially
polymer crystallinity and intrinsic factors affecting it (e.g. orientation, side chains, polarity, presence
of plasticizers, etc.) should be considered with regard to the polymer. Similarly, crystallinity of the
food can be of importance as well (Figge, 1996), as already stressed before.
Interactions between the polymer, the migrants and the food are of importance as well (Franz, 2000).
If due to a significant interaction between the polymer and the food (e.g. oil in contact with
polyolefins) polymeric absorption of food components occurs, two extreme cases can be
distinguished, depending on the diffusion coefficient of the migrant (DP,m) and of the absorbed food
component (DP,f) in the polymer :
- DP,m>> DP,f, which implies that the migration from the packaging is not affected by the
uptake of the food because of the high mobility of the migrant. For oil this is the case for
migrants having a molecular weight up to 600-1000.
- DP,m<< DP,f, which means that the migrant will be ‘overrun’ by the food penetrating the
polymer. This is for example the case if a polyolefin is contacted with a solvent, serving
as a food simulant. Again two cases can be distinguished, depending on the interaction
between the solvent and the polymer :
o If the simulant is readily absorbed by the polymer, causing severe swelling, total
extraction of the migrant is possible if the partition coefficient of the migrant for
the particular polymer-solvent system allows it. This is for example the case for
iso-octane in contact with polyolefin containing some apolar additives. In order
to obtain comparable migration levels to those in real foods (e.g. oil), the contact
time between the solvent and the polymer should be restricted.

Introduction – migration from food contact materials 31
Chemical interactions between packaging materials and foodstuffs
o If the simulant is not very well absorbed by the polymer, migration is not
significantly affected. This is for example the case for a polyolefin contacted with
the polar ethanol at moderate temperatures. Consequently if migration tests
with such volatile simulants is used, contact time should not be adjusted
compared to a test carried out in oil.
These considerations are the basis for the use of alternative volatile food simulants to check
migration in oil as described more in detail elsewhere (Freytag et al., 1984; De Kruijf and Rijk, 1988;
Lickly et al., 1990; Piringer, 1990; Figge and Hilpert, 1991; Baner et al, 1992.; Indiramma et al., 1992;
Van Battum, 1996).
1.2.4.3. Other factors
In addition to the factors mentioned above, the following parameters affect the migration from
plastic food contact materials as well.
From the models related to infinite polymers (paragraph 1.2.3.3) it is clear that the initial
concentration of the migrant in the polymer influences the migrated amount to the food. This
relationship has been supported by several experimental studies (e.g. Figge and Hilpert, 1990;
O’Brien et al., 1997).
For the polymer, thickness of the tested material is of importance as well. For polyolefins a linear
relationship between the wall thickness and the migration has been reported. From a particular
limiting thickness however, migration remains constant (Figge et al., 1988a-c, Figge et al., 1989). For
other polymers however, more complex relationships were reported (Figge, 1988).
The volume of the contacted food may influence the migration as well, since the volume can affect the
migrants concentration in the food. As reported by Murthy et al. (1990), too low volumes
underestimate migration. A minimal amount of 50 mL of solvent per square decimetre of contact
material is proposed to be used. The difference in single sided or double sided contact between the food
simulant and the polymer was investigated by the same group. Per unit of contact surface, single
sided contact resulted in higher migration levels, especially if the food simulant caused swelling of
the polymer (Vijayalakshmi et al., 1992).
Finally it should be mentioned that the shape of the test object is reported to be of importance as well.
Figge (1988) observed higher antioxidants migration from high impact polystyrene into a fat if the
cut edges were exposed to the fat as well.

Introduction – migration from food contact materials 32
Chemical interactions between packaging materials and foodstuffs
1.2.5. Legislative aspects about migration from plastics
1.2.5.1. Introduction
From the a principles of migration from plastics to foods and as already indicated before, it is
obvious that this phenomenon can be a food safety issue. Plastics may contain compounds which
should be considered as carcinogens (e.g. vinylchloride, acrylonitrile) or which exhibit another type
of toxicity. In order to ensure consumer protection, legislation has been developed through the
years in various countries with regard to food contact materials in general and plastic food contact
materials in particular.
Within the European Union, a process of harmonisation, started in 1972, tries to bring all existing
legislation in the various member states in correspondence or implies new directives (Rossi, 2000).
Especially with regard to the plastic food contact materials most initiatives were elaborated. This
resulted in a fairly detailed legislation as will be discussed below. In addition to the European
legislation however, also the United States’ legislation will be discussed to illustrate different
legislative approaches to ensure consumer protection in this particular field.
1.2.5.2. General aspects of European food contact material legislation
As already indicated before, the European legislator differentiates several types of contact materials
(Table 1). Two kinds of directives can be distinguished: directives applicable to all materials
considered on the one hand and those applicable to individual substances and materials on the
other hand.
Two general directives apply to all food contact materials. The framework directive (EEC, 1989)
specified a list of food contact materials to which the directive applies (Table 1). In addition two
general principles are established:
(1) The principle of inertness, specifying that a material to come into contact with food shall
not “endanger human health and bring about an unacceptable change in the
composition of the foodstuff or a deterioration of the organoleptic characteristics
thereof”.
(2) The principle of ‘positive labelling’, specifying that contact materials should be
accompanied by the words “for food” or an appropriate symbol, unless it is obvious that
materials are clearly intended to come into contact with food. Eventually restrictions in
use should be specified as well.
In addition to these basic principles, criteria and procedures to be followed in drafting specific
directives have been pointed out.

Introduction – migration from food contact materials 33
Chemical interactions between packaging materials and foodstuffs
The symbol which can be used to indicate that a material is intended for food contact is specified in
the second general directive (EEC, 1980) (Figure 11).
Figure 11. Symbol identifying materials intended to come into contact with food (EEC, 1980)
As already stressed before, not only packaging materials are considered in these general directives,
but all materials and articles intended to come into contact with food except public water
installations.
The other directives on food contact materials relate to individual substances and materials. As can
be observed from Table 4 most of the currently issued directives relate to plastics.
In the following, specific EU directives with regard to plastic food contact materials will be
discussed in more detail.
1.2.5.3. European directives on plastic food contact materials
As indicated before, plastic food contact materials represent a very important group among the
different food contact materials used. Moreover it is a very complex group because several kinds of
polymers are used in addition to an enormous diversity of low molecular weight compounds added
to the polymer (Table 3). The directives discussed below only relate to materials solely composed of
plastic. Consequently, coated materials such as plastic coated board or polymer coated metals fall
out of their scope. In addition, Directive 2001/62/EC, changing the former 90/128/EEC for plastic
materials intended to come into contact with foods, specify that the following substances are not
considered as plastics :
- regenerated cellulose materials
- elastomers or synthetic rubbers
- paper and board
- coatings from paraffin’s or mixtures of paraffin’s with plastics
- ion exchangers
- silicones

Introduction – migration from food contact materials 34
Chemical interactions between packaging materials and foodstuffs
On the other hand, materials composed out of two or more layers of materials, each consisting
exclusively out of plastics, fall into the scope of the mentioned legislation.
Table 4. Main directives adopted on materials intended to come into contact with food applicable to
individual materials and substances
Subject Directive number Reference
Plastics
Base directive : monomers 90/128/EEC; 2001/62/EC EEC, 1990; EC, 2001a
- 1st amendment 92/39/EEC EEC, 1992
- 2nd amendment 93/9/EEC EEC, 1993a
- 3rd amendment 95/3/EEC EC, 1995
- 4th amendment 96/11/EEC EC, 1996
- 5th amendment 99/91/EC EC, 1999
Directives on basic rules for migration
tests
82/711/EEC EEC, 1982a
- 1st amendment 93/8/EEC EEC, 1993b
- 2nd amendment 97/48/EC EC, 1997
Directives on list of simulants 85/572/EEC EEC, 1985
Directive on vinylchloride (VCM)
monomer
78/142/EEC EEC, 1978
Directive on method for determining
VCM in PVC
80/766/EEC EEC, 1980
Directive on method for determining
VCM in foods
82/432/EEC EEC, 1982b
Directive on the use of certain epoxy
derivates
2001/61/EC EC, 2001b
Regenerated cellulose film
Base directive 93/10/EEC EEC, 1993c
Ceramics
Base directive 84/500/EEC EEC, 1984
Elastomers
Nitrosoamines in teats and soothers 93/11/EEC EEC, 1993d
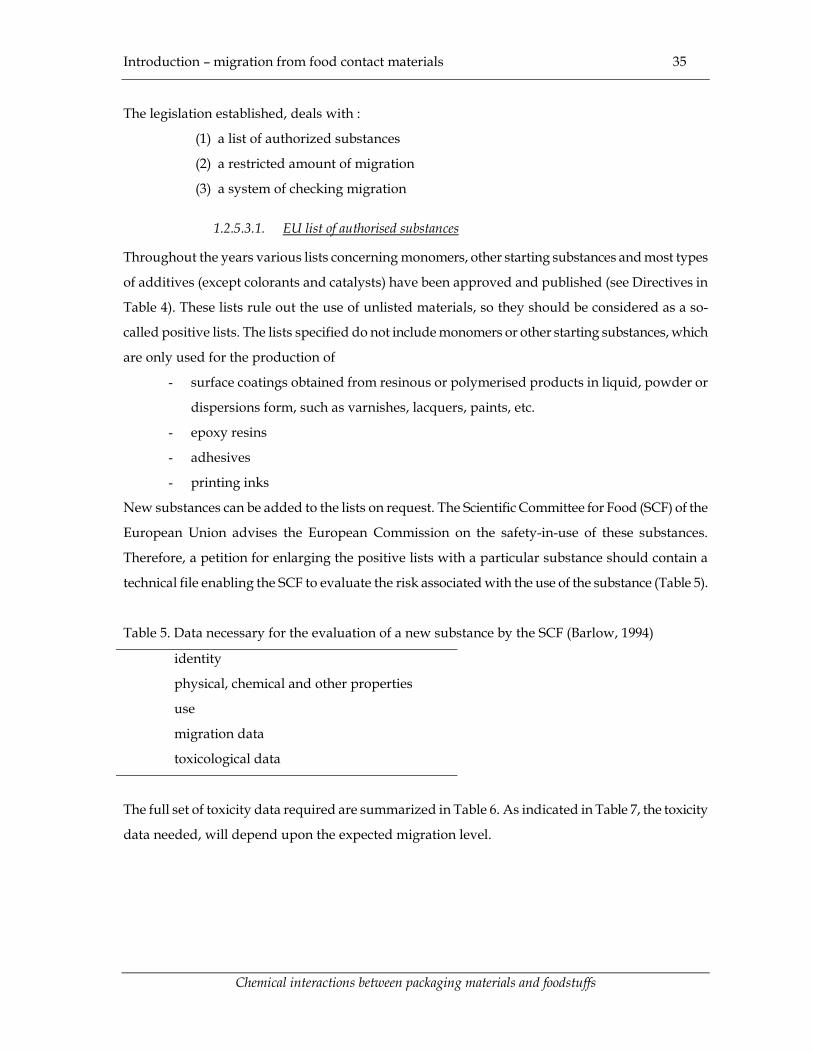
Introduction – migration from food contact materials 35
Chemical interactions between packaging materials and foodstuffs
The legislation established, deals with :
(1) a list of authorized substances
(2) a restricted amount of migration
(3) a system of checking migration
1.2.5.3.1. EU list of authorised substances
Throughout the years various lists concerning monomers, other starting substances and most types
of additives (except colorants and catalysts) have been approved and published (see Directives in
Table 4). These lists rule out the use of unlisted materials, so they should be considered as a so-
called positive lists. The lists specified do not include monomers or other starting substances, which
are only used for the production of
- surface coatings obtained from resinous or polymerised products in liquid, powder or
dispersions form, such as varnishes, lacquers, paints, etc.
- epoxy resins
- adhesives
- printing inks
New substances can be added to the lists on request. The Scientific Committee for Food (SCF) of the
European Union advises the European Commission on the safety-in-use of these substances.
Therefore, a petition for enlarging the positive lists with a particular substance should contain a
technical file enabling the SCF to evaluate the risk associated with the use of the substance (Table 5).
Table 5. Data necessary for the evaluation of a new substance by the SCF (Barlow, 1994)
identity
physical, chemical and other properties
use
migration data
toxicological data
The full set of toxicity data required are summarized in Table 6. As indicated in Table 7, the toxicity
data needed, will depend upon the expected migration level.
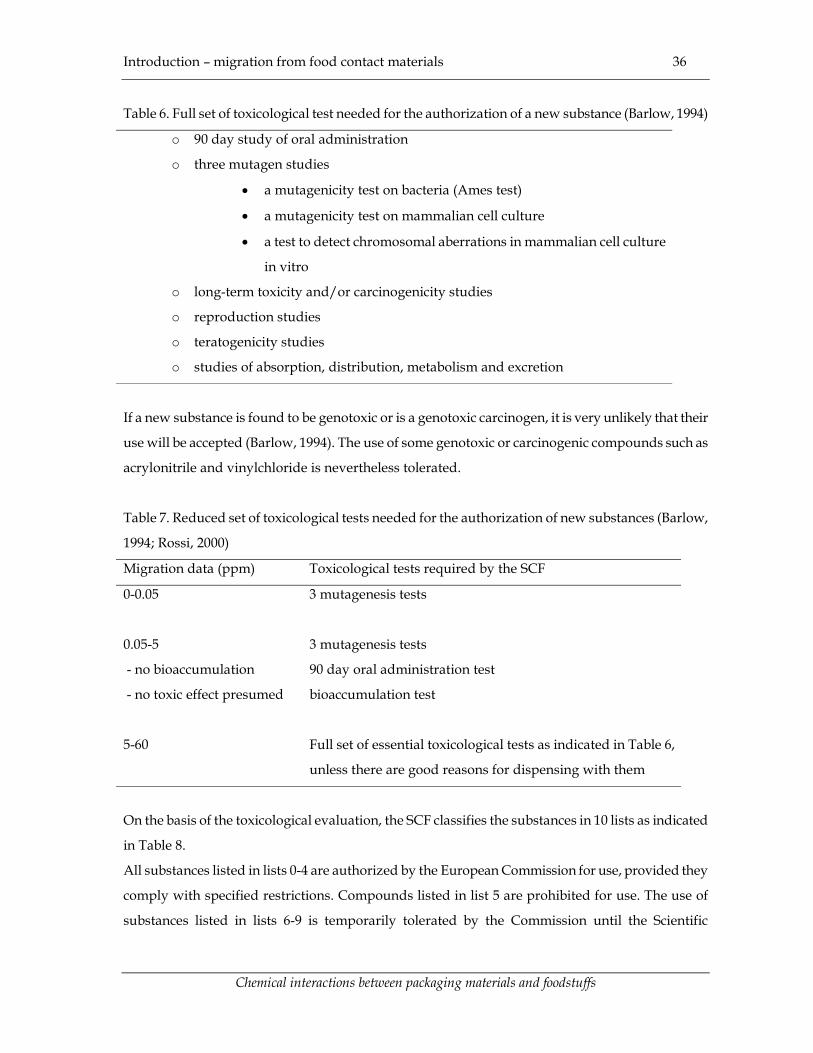
Introduction – migration from food contact materials 36
Chemical interactions between packaging materials and foodstuffs
Table 6. Full set of toxicological test needed for the authorization of a new substance (Barlow, 1994)
o 90 day study of oral administration
o three mutagen studies
�� a mutagenicity test on bacteria (Ames test)
�� a mutagenicity test on mammalian cell culture
�� a test to detect chromosomal aberrations in mammalian cell culture
in vitro
o long-term toxicity and/or carcinogenicity studies
o reproduction studies
o teratogenicity studies
o studies of absorption, distribution, metabolism and excretion
If a new substance is found to be genotoxic or is a genotoxic carcinogen, it is very unlikely that their
use will be accepted (Barlow, 1994). The use of some genotoxic or carcinogenic compounds such as
acrylonitrile and vinylchloride is nevertheless tolerated.
Table 7. Reduced set of toxicological tests needed for the authorization of new substances (Barlow,
1994; Rossi, 2000)
Migration data (ppm) Toxicological tests required by the SCF
0-0.05 3 mutagenesis tests
0.05-5 3 mutagenesis tests
- no bioaccumulation 90 day oral administration test
- no toxic effect presumed bioaccumulation test
5-60 Full set of essential toxicological tests as indicated in Table 6,
unless there are good reasons for dispensing with them
On the basis of the toxicological evaluation, the SCF classifies the substances in 10 lists as indicated
in Table 8.
All substances listed in lists 0-4 are authorized by the European Commission for use, provided they
comply with specified restrictions. Compounds listed in list 5 are prohibited for use. The use of
substances listed in lists 6-9 is temporarily tolerated by the Commission until the Scientific

Introduction – migration from food contact materials 37
Chemical interactions between packaging materials and foodstuffs
Committee has been able to evaluate them properly.
1.2.5.3.2. Migration restrictions
Apart from the fact that compositional restrictions are imposed on plastic materials, also the
migrated amount of substances to the food should be limited. Two general restrictions are applied:
- an overall migration limit
- a specific migration limit
The overall migration limit, set at 60 mg.kg-1 of food or 10 mg.dm-² contact material is the total
amount of substances which can migrate out of a plastic material to the food. This limit is set to
ensure the inert character of the packaging material as foreseen in the framework directive. In
addition it avoids that for every listed compound a specific migration limit should be specified.
The specific migration refers to the restricted migration of particular substances of toxicological
relevance. The specific migration limit (SML, [mg.kg-1]) is calculated on the basis of the acceptable
daily intake (ADI) or tolerable daily intake (TDI) laid down by the SCF for the particular substance.
Supposing that 1 kg of the food, containing the migrating substance, is consumed daily by a 60 kg
adult, it is obvious that the specific migration limit is given by :
ADI 60 SML �� [26a]
or
TDI 60 SML �� [26b]
The specific migration limit for a particular substance is specified in the positive lists issued by the
European legislator.

Introduction – migration from food contact materials 38
Chemical interactions between packaging materials and foodstuffs
Table 8. SCF classification scheme for substances used in plastic food packaging (Barlow, 1994)
List Explanation
list 0 food ingredients or normal metabolites for which no need for acceptable daily
intake (ADI) is established
list 1 substances for which an ADI, a t-ADI (temporary ADI), maximum tolerable daily
intake (MTDI), a provisional maximum tolerable daily intake (PMTDI), a
provisional tolerable weekly intake (PTWI) has been established by the SCF or the
Joint Expert Committee on Food Additives (JECFA)
list 2 substances for which a TDI or t-TDI has been established by the SCF
list 3 substances for which no ADI or TDI could be established, but of which their use is
self-limiting, their migration is very low or which are inert
list 4 substances for which no ADI or TDI could be established, but of which the
migration is not detectable
list 5 substances which bioaccumulate or are too toxic for use
list 6A substances suspected to have carcinogenic properties, but of which data are
lacking or insufficient
list 6B substances suspected to have toxic properties (other than carcinogenic), but of
which data are lacking or insufficient
list 7 substances for which toxicological data exist, but for which an ADI or TDI could
not be established
list 8 substances for which no adequate data are available
list 9 substances which could not be evaluated because of a lack of specifications or
inadequate description
list w waiting list, substances not yet included in the other lists
1.2.5.3.3. Migration testing
Based on the theoretical and experimental considerations discussed before (paragraphs 1.2.2-1.2.4),
the European legislator has implemented a number of rules concerning migration testing.
Because of the diversity in foods contacted with plastics, migration testing should be simplified to
minimize the number of tests to a practical and economic level. Therefore, simulants are proposed
to be use instead of real foods. In addition, the migration tests become analytically better feasible.
The simulants are based on four food types (Table 9). Dry foods do not require migration testing,
although migration to dry foods has been reported (Schwope and Reid, 1988; Boccacci Mariani et
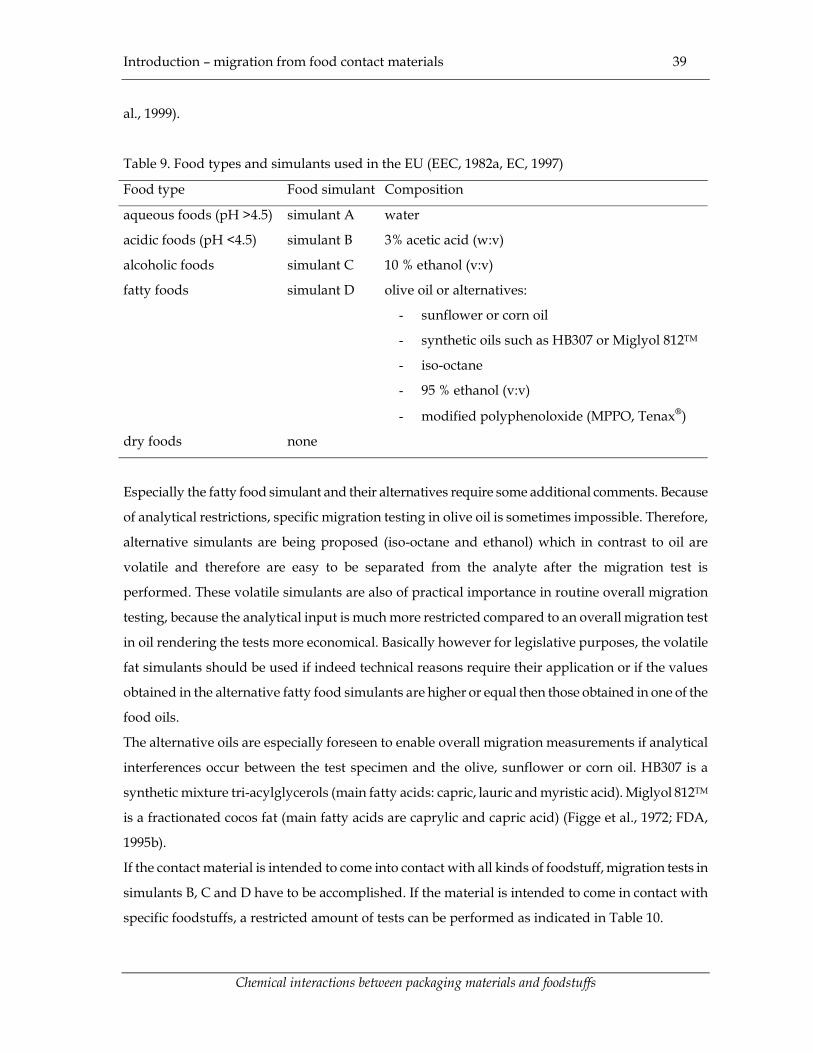
Introduction – migration from food contact materials 39
Chemical interactions between packaging materials and foodstuffs
al., 1999).
Table 9. Food types and simulants used in the EU (EEC, 1982a, EC, 1997)
Food type Food simulant Composition
aqueous foods (pH >4.5) simulant A water
acidic foods (pH <4.5) simulant B 3% acetic acid (w:v)
alcoholic foods simulant C 10 % ethanol (v:v)
fatty foods simulant D olive oil or alternatives:
- sunflower or corn oil
- synthetic oils such as HB307 or Miglyol 812TM
- iso-octane
- 95 % ethanol (v:v)
- modified polyphenoloxide (MPPO, Tenax�)
dry foods none
Especially the fatty food simulant and their alternatives require some additional comments. Because
of analytical restrictions, specific migration testing in olive oil is sometimes impossible. Therefore,
alternative simulants are being proposed (iso-octane and ethanol) which in contrast to oil are
volatile and therefore are easy to be separated from the analyte after the migration test is
performed. These volatile simulants are also of practical importance in routine overall migration
testing, because the analytical input is much more restricted compared to an overall migration test
in oil rendering the tests more economical. Basically however for legislative purposes, the volatile
fat simulants should be used if indeed technical reasons require their application or if the values
obtained in the alternative fatty food simulants are higher or equal then those obtained in one of the
food oils.
The alternative oils are especially foreseen to enable overall migration measurements if analytical
interferences occur between the test specimen and the olive, sunflower or corn oil. HB307 is a
synthetic mixture tri-acylglycerols (main fatty acids: capric, lauric and myristic acid). Miglyol 812TM
is a fractionated cocos fat (main fatty acids are caprylic and capric acid) (Figge et al., 1972; FDA,
1995b).
If the contact material is intended to come into contact with all kinds of foodstuff, migration tests in
simulants B, C and D have to be accomplished. If the material is intended to come in contact with
specific foodstuffs, a restricted amount of tests can be performed as indicated in Table 10.

Introduction – migration from food contact materials 40
Chemical interactions between packaging materials and foodstuffs
Table 10. Food simulants to be selected for testing in special cases (EC, 1997)
Contact foods Simulant
only aqueous foods A
only acidic foods B
only alcoholic foods C
only fatty foods D
all aqueous and acidic foods B
all aqueous and alcoholic foods C
all acidic and alcoholic foods C and B
all fatty and aqueous foods D and A
all fatty and acidic foods D and B
all fatty and alcoholic and aqueous foods D and C
all fatty food and alcoholic and acid foods D, C and B
It should be noted as well that if the packaging material is to be contacted with alcoholic foods with
a higher ethanol content of 10 % (v:v), the ethanol concentration of simulant C has to be adjusted
accordingly.
Alternatively groups of food products can be specified which are intended to come into contact with
the material. In Directive 85/575/EEC (EEC, 1985), lists are specified for particular food products
laying down the lists of simulants to be used in the migration tests. This is illustrated in Table 11.
As can be observed, for some foodstuffs a so-called reduction factor can be applied for the migration
tests in simulant D. This is because migration in these particular foods is supposed to be lower then
the migration in the fatty food simulants. Therefore, the obtained migration levels in simulant D
may be divided by the reduction factor to evaluate compliance with the legislation.
Apart from the simulants to be used, the legislator specifies as well the time and temperature
conditions at which the migration test should be performed as indicated in Table 12.
It is possible that the food packaging material undergoes different temperatures regimes during its
use. The principle is always that the experimental conditions should simulate a worst-case scenario.
In addition to this table, Directive 97/48/EC specifies the time temperatures conditions to be
applied with the alternative fat simulants (Table 13).

Introduction – migration from food contact materials 41
Chemical interactions between packaging materials and foodstuffs
Table 11. Some examples taken from Directive 85/575/EEC laying down the simulants to be used if
the contact material is contacted with specific food groups (X=migration test in specified simulant
necessary ; - = migration test in specified simulant not necessary)
Simulants to be used Foodstuffs
A B C D
non alcoholic beverages X X - -
chocolate, chocolate-coated products, etc. - - - X/5*
meat of zoological species (chilled, fresh, salted,
smoked) X - - X/5*
egg yolk, liquid X - - -
egg yolk, powdered or frozen - - - -
animal fats and vegetable fats and oils - - - X
cheese, non processed, no rind X X - X/3*
cheese, whole with rind X X - -
* as explained in the text
The recent directive 2001/62/EC (EC, 2001a) indicates that apart from conducting migration
experiments, specific migration can also be estimated by using general accepted migration models
based on the concentration of the migrant in the polymer. These models should of course be based
on scientific data, as those introduced before. Due to this adjustment, time consuming and
expensive migration tests can be avoided if indeed appropriate models are present for the selected
polymer-migrant-food system.

Introduction – migration from food contact materials 42
Chemical interactions between packaging materials and foodstuffs
Table 12. Time-temperature conditions for migration tests (EC, 1997)
Conditions of actual use Test conditions
Contact time Test time
t ≤ 0.5 hour 0.5 hour
0.5 h < t ≤ 1 hour 1 hour
1 h < t ≤ 2 hours 2 hours
2 h < t ≤ 24 hours 24 hours
t > 24 hours 10 days
Contact temperature Test temperature
T ≤ 5°C 5°C
5°C < T ≤ 20°C 20°C
20°C < T ≤ 40°C 40°C
40°C < T ≤ 70°C 70°C
70°C < T ≤ 100°C 100°C or reflux temperature
100°C < T ≤ 121°C 121°C*
121°C < T ≤ 130°C 130°C*
130°C < T ≤ 150°C 150°C**
T > 150°C 175°C**
* use simulant C at reflux temperature
** use simulant D at 150°C or 175°c in addition to simulants A, B and C as appropriate at
100°C or at reflux temperature
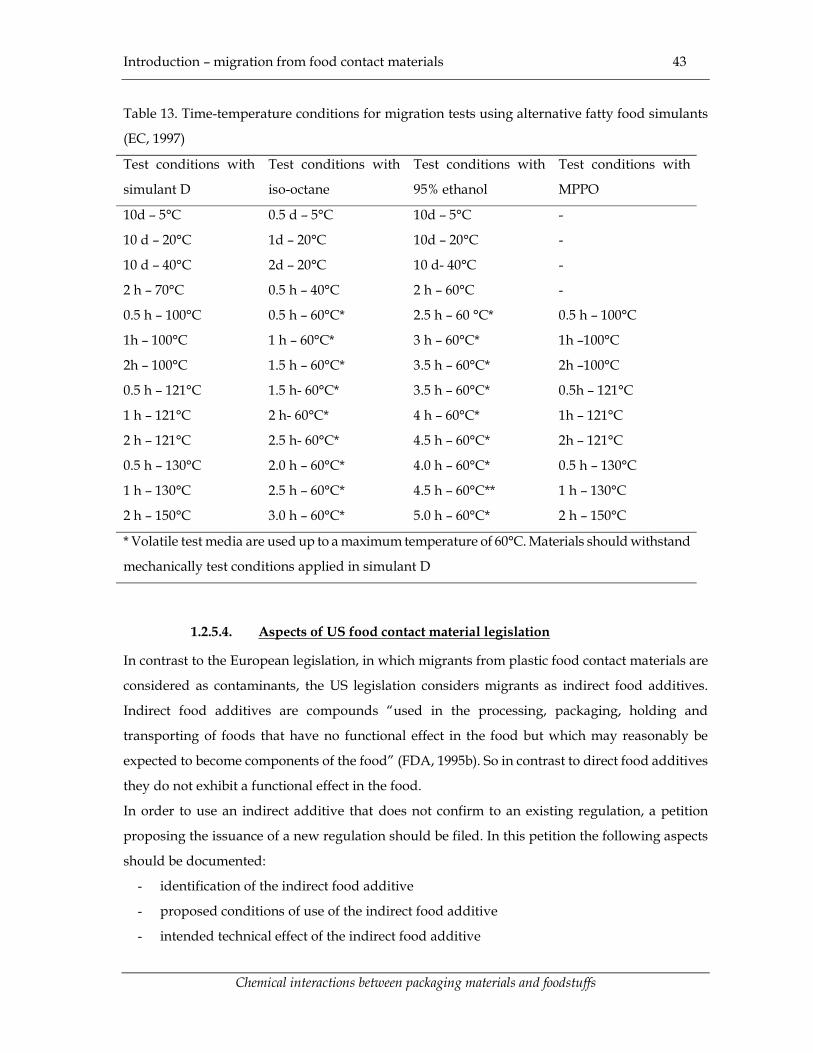
Introduction – migration from food contact materials 43
Chemical interactions between packaging materials and foodstuffs
Table 13. Time-temperature conditions for migration tests using alternative fatty food simulants
(EC, 1997)
Test conditions with
simulant D
Test conditions with
iso-octane
Test conditions with
95% ethanol
Test conditions with
MPPO
10d – 5°C 0.5 d – 5°C 10d – 5°C -
10 d – 20°C 1d – 20°C 10d – 20°C -
10 d – 40°C 2d – 20°C 10 d- 40°C -
2 h – 70°C 0.5 h – 40°C 2 h – 60°C -
0.5 h – 100°C 0.5 h – 60°C* 2.5 h – 60 °C* 0.5 h – 100°C
1h – 100°C 1 h – 60°C* 3 h – 60°C* 1h –100°C
2h – 100°C 1.5 h – 60°C* 3.5 h – 60°C* 2h –100°C
0.5 h – 121°C 1.5 h- 60°C* 3.5 h – 60°C* 0.5h – 121°C
1 h – 121°C 2 h- 60°C* 4 h – 60°C* 1h – 121°C
2 h – 121°C 2.5 h- 60°C* 4.5 h – 60°C* 2h – 121°C
0.5 h – 130°C 2.0 h – 60°C* 4.0 h – 60°C* 0.5 h – 130°C
1 h – 130°C 2.5 h – 60°C* 4.5 h – 60°C** 1 h – 130°C
2 h – 150°C 3.0 h – 60°C* 5.0 h – 60°C* 2 h – 150°C
* Volatile test media are used up to a maximum temperature of 60°C. Materials should withstand
mechanically test conditions applied in simulant D
1.2.5.4. Aspects of US food contact material legislation
In contrast to the European legislation, in which migrants from plastic food contact materials are
considered as contaminants, the US legislation considers migrants as indirect food additives.
Indirect food additives are compounds “used in the processing, packaging, holding and
transporting of foods that have no functional effect in the food but which may reasonably be
expected to become components of the food” (FDA, 1995b). So in contrast to direct food additives
they do not exhibit a functional effect in the food.
In order to use an indirect additive that does not confirm to an existing regulation, a petition
proposing the issuance of a new regulation should be filed. In this petition the following aspects
should be documented:
- identification of the indirect food additive
- proposed conditions of use of the indirect food additive
- intended technical effect of the indirect food additive

Introduction – migration from food contact materials 44
Chemical interactions between packaging materials and foodstuffs
- analytical methods for the indirect food additive
- migration data with regard to the indirect food additive
- exposure assessment of the indirect food additive
This file is submitted to the US Food and Drug Administration (FDA) for approval.
Especially the two latter aspects merit some more explanation to allow a proper comparison with
the legislative approach within the EU. If migration data indicate however that the indirect food
additive concentration is less or equal to 0.5 ppb in the daily diet or the daily intake is less or equal
to 1.5 µg/person, no issue of regulation is required (Begley, 1997; Begley, 2000). The substance
should not be a carcinogen or should not contain carcinogenic impurities (Code of Federal
Regulations, 1999). This policy is better known as the threshold of regulation. Because of its
importance, it will be discussed in the first place.
1.2.5.4.1. Threshold of regulation and threshold of toxicological concern
The threshold of regulation is based on the so-called threshold of toxicological concern for chemicals
present in the diet. This threshold can be defined as a level of exposure to chemicals below which no
significant risk is expected to exist (Kroes et al., 2000). The concept goes further then the practice of
setting acceptable daily intake because it proposes a threshold of exposure for any chemical,
including those of unknown toxicity, below which no significant risk to the human health is
observed.
The threshold of regulation is based on a database of Gold et al. (1984) containing potent
carcinogenic compounds. By making use of the probabilistic distribution of carcinogenic potencies,
the dietary concentration of most carcinogens which would give rise to a one in a million upper
bound life-time risk of cancer was estimated to be 0.5 ppb, from which a human exposure of 1.5
µg/person/day was derived. Enlarging the database did not alter the original carcinogenic potency
distribution significantly (Gold et al., 1995).
Apart from the carcinogenic endpoint of toxicity, the applicability of the threshold of toxicological
concern was also evaluated for other kinds of toxicity. Therefore a more extensive database (Munro
et al., 1996) based on the chemical structure of various chemicals was used in a study concerning
neuro-, immuno-, developmental- and endocrine toxicity together with allergenicity (Kroes et al.,
2000). From this study it could be concluded that generally the threshold set based on
carcinogenicity data is considered conservative enough to ensure safety with regard to the other
types of toxicity mentioned. In such a way a supplementary safety factor could be attributed to the
threshold of regulation. The threshold of toxicological concern could moreover be used in other

Introduction – migration from food contact materials 45
Chemical interactions between packaging materials and foodstuffs
applications as well (Kroes et al., 2000).
Barlow et al. (2001) however, considered additional data necessary to come to a final conclusion for
the endocrine disrupting chemicals, the immunotoxic compounds and the allergens. The concept
can furthermore be questioned because of variations in human sensitivity or because it is
inappropriate to deal with bioaccumulating compounds. It should be noted as well that outliers to
the set threshold of 1.5 µg/person/day were already found as well. If the concept is to be applied
for other kinds of chemical exposure, supplementary toxicological data should be considered as
well.
Despite of these points of criticism, the threshold of toxicological concern is generally considered as
a useful instrument to evaluate the relevance of toxicity of chemical substance. In such a way
limited resources can be concentrated to those chemicals of concern. More especially, it has been
applied successfully in the US in the presented threshold of regulation (Barlow et al., 2001).
1.2.5.4.2. Migration testing
In contrast to the European legislation, FDA differentiates five food types and four kinds of food
simulants as indicated in Table 14.
Table 14. Food types and simulants used in the USA (FDA, 1995b)
Food type Recommended food simulant
aqueous foods 10 % ethanol (v:v)
acidic foods 10 % ethanol (v:v)
low alcoholic foods 10 % ethanol (v:v)
high alcoholic foods 50 % ethanol (v:v)
fatty foods food oil (e.g. corn oil), HB 307 or Miglyol 812TM
Water and 3 % acetic acid are not recommended to be used because these simulants seem to
underestimate migration into aqueous foods. If on the other hand it is expected that migration
levels in 3% acetic are higher compared to those in 10 % ethanol, like in the case of acid sensitive
indirect food additives, tests in the former simulant should be performed (FDA, 1995b). Simulants
should be selected to simulate a worst-case scenario.
As in the EU, alternative fatty food simulants are proposed to deal with analytical problems.
According to the FDA, not one solvent can effectively simulate food oil for all polymers. The use of
alternative fatty food simulants is specified and restricted to some polymers as indicated in Table

Introduction – migration from food contact materials 46
Chemical interactions between packaging materials and foodstuffs
15. As can be seen, only ethanolic solutions are used. Previously also heptane was used, but this
simulant was thought to be too aggressive and therefore its use is not recommended anymore.
Table 15. Alternative fatty food simulants for specified polymeric materials (FDA, 1995b)
Polymeric material Alternative fatty food simulant
polyolefins and ethylene-vinylacetate copolymers 95 % ethanol (v:v)
rigid polyvinyl chloride 50 % ethanol (v:v)
polystyrene and rubber modified polystyrene 50 % ethanol (v:v)
Also with regard to the selected time temperature conditions a different approach as the one in the
EU is used. Generally migration tests are also conducted for 10 days at 40°C if the packaging
material is used at room temperatures. For polymers used below their glass transition temperature,
migration data obtained over 10 days should be extrapolated to 30 days to better approximate
migration levels expected after extended time periods at 20°C. For frozen or refrigerated food
applications, a test temperature of 20°C during 10 days is used. Other time temperature
combinations are proposed if the time-temperature regime does not correspond to the ones
indicated above (e.g. hot fill applications, …). The rather rational approach of the EU legislation is
not followed, resulting in number of selected migration testing protocols, which will not be
discussed in detail here (FDA, 1995b).
A very important difference with regard to the EU legislation concerns the fact that only the specific
migration of the indirect food additive is to be monitored. No overall migration needs to be
determined and no limit in this regard is specified.
Similar to EU legislation, reliable migration models may be used to replace or extrapolate migration
experiments (Begley, 2000). In addition to these models, the FDA compiled a migration database
from various sources that can be used to minimize the migration experiments to be performed. If
migration experiments are to be executed, additional data with regard to the migration dynamics
are requested to extend the FDA database. (e.g. for a ten day test, migration data at 2, 24, 96 and 240
hours are requested).
1.2.5.4.3. Exposure assessment
From the migration data, obtained by experiment or simulation, the exposure to the indirect food
additive needs to be calculated by the petitioner. As indicated above, if migration data reveal that

Introduction – migration from food contact materials 47
Chemical interactions between packaging materials and foodstuffs
the daily dietary intake is lower then the threshold value of 1.5 µg/person, the substance is of no
legal concern.
If migration results in higher concentrations then the threshold, exposure assessment is necessary.
These calculations are based on the migration experiments conducted, the consumption factors of
food packaging materials and the so-called food type distribution factors.
The consumption factors (CF) of food packaging materials have been introduced before (Table 2).
These factors represent the weight percentage of the daily diet contacted with a specific kind of a
food contact material and are based on market surveys. In addition to this, a more detailed table is
available for polymeric food contact materials as indicated in Table 16. The minimal consumption
factor used is 0.05.
Table 16. Consumption factors (CF) for polymeric food contact materials (FDA, 1995b; Begley, 2000)
Polymeric contact material CF (%)
polyolefins
low density polyethylene
high density polyethylene
polypropylene
33
18
13
2
acrylics, phenolics, etc. 15
polystyrene 10
PVC 10
all others 5
The food-type distribution factor (fT) reflects the fraction of all food contacting each material that is
aqueous, acidic, alcoholic and fatty. Again these data are derived from market surveys and
tabulated data are available (Table 17).
On the basis of the two factors introduced above and by the data obtained from the migration
experiments, the concentration of the indirect food additive in the daily diet, CF, daily, can be
calculated as follows.

Introduction – migration from food contact materials 48
Chemical interactions between packaging materials and foodstuffs
Table 17. Food type distribution factors (in percent) (FDA, 1995b; Begley, 2000)
Package category Aqueousa Acidica Alcoholic Fatty
A. General
Glass 8 36 47 9
metal-polymer coated 16 35 40 9
metal- uncoated 54 25 1b 20
paper-polymer coated 55 4 1b 40
paper-uncoated 57 1b 1b 41
polymer 49 16 1b 34
B. Polymer
polyolefins, polystyrene 67 1b 1b 31
PVC 17 40 31 12
acrylonitrile, ionomers, PVDC 1b 1b 1b 97
polycarbonates 97 1b 1b 1b
polyesters 1b 97 1b 1b
ethylenevinlyl alcohol 30 28 28 14
wax 47 1b 1b 51
cellophane 5 1b 1b 93 afor aqueous, acidic foods, generally 10 % ethanol is used as a simulant, therefore the food
type distribution factors should be summed b1 % or less
The concentration of the migrant in a food contacted with a material j, CF,j is equal to
��
��
4
1iiijF, MfC [27a]
where Mi represents the concentration of the indirect food additive in the food simulant used in the
migration experiment and fi is the food type distribution factor of material j. Since the food simulant
for aqueous and acidic foods is generally the same equation [27a] can be rewritten as follows
fattyfattyethanol % 50alcoholicethanol % 10acidic aqueousjF, MfMfM)ff(C ������� [27b]
The average concentration of the migrant in the daily diet, CF, daily, j due to migration of a single
contact material j, can be calculated by combining CF,j and the percentage of the daily diet in contact
with the contact material ‘j’ (CFj)

Introduction – migration from food contact materials 49
Chemical interactions between packaging materials and foodstuffs
jj,Fj daily,F, CFCC �� [28]
Because the migrant can be present in several contact materials, the total concentration in the daily
diet should be calculated by taking into account the migration from all contact materials j involved.
Therefore, CF, daily becomes
jj,Fj
dailyF, CFCC ��� [29]
The estimated probable daily intake of the indirect food additive (EDI) is then determined by
multiplying the dietary concentration by the total weight consumed by an individual per day,
which is supposed to be 3000 g :
daily,FC person.day
food g 3000 EDI �� [30]
This EDI represents the cumulative exposure to the indirect food additive present in all contact
materials and is used for risk evaluation.
1.2.6. Analytical approach to study migration
1.2.6.1. Introduction
As a final part of this review on migration from plastic food contact materials, analytical
methodologies to study this phenomenon will be discussed. Two approaches should be
distinguished :
- the approach of an enforcement laboratory, who’s tasks consists to check whether a contact
material used on the market complies with legislation
- the approach of other analytical laboratories which are requested by a producer of contact
materials to prove compliance with legislation.
The second approach is far more easier because the laboratory generally can use the confidential
compositional information of the material to decide which tests are necessary (overall migration,
specific migration for selected compounds). In contrast, the enforcement laboratory has no
information at all about the kind and composition of the contact material, making the analytical task
far more complex.
Once the material and composition have been revealed, the enforcement laboratory can also
evaluate the migration behaviour. Therefore tests in simulants can be used or alternatively,
concentration of the migrants in the food can be assessed. This latter approach again is much more
difficult because of the additional matrix affects. On the other hand it is indispensable if exposure
studies are to be performed. Such exposure studies are an essential tool in the analysis of risks

Introduction – migration from food contact materials 50
Chemical interactions between packaging materials and foodstuffs
arising from the exposure of migrants to the consumer. As indicated in a recent review however,
such exposure studies and risk evaluations related to migration from food contact materials are still
scarce (De Meulenaer and Huyghebaert, 2001a).
The following general approach can be presented for a migration study :
- analysis of the material
o identification of the material
o compositional analysis of the material
- selection of the appropriate contact conditions
- migration testing
o overall migration
o specific migration
1.2.6.2. Analysis of the material
The first task is to identify the polymeric object. An experienced person may often identify the
polymer by appearance or by using simple tests such as a burning experiment. For a more detailed
analysis, the method of choice is infra red analysis, using a Fourier transform infrared spectrometer
(FTIR). Because of the complexity of the spectra obtained, only a limited part of the spectrum is
used to assign specific structural units of the polymer. In addition, spectral libraries for comparison
and confirmation are indispensable. These are commercially available but supplementation with
own spectra gathered from the analysis of known samples is recommended. In addition to FTIR
analysis, also the use of other advanced analytical methods such as pyrolsis-GC or GC-MS, 1H or 13C
NMR and Raman spectroscopy is reported. Although some of them are very powerful, their use is
still restricted (Castle, 1996).
The second step consists of the compositional analysis. In principle it is not only required to test for
the hundreds of authorised substances but also for unapproved ingredients and contaminants. This
enormous task is clearly too resource intensive for enforcement. Pragmatic approaches are
considered to be more useful than a detailed analytical analysis of every possible compound.
Preliminary functional group identification of mixtures of additives using 1H NMR has been
suggested by Feigenbaum et al. (1994) as a useful technique.
The Netherlands Food Inspection Service extracts the material with diethyl ether and analyses the
extract subsequently with IR and GC-MS (Van Battum and Van Lierop, 1988; Van Lierop, 1994). An
additional analysis using LC-MS could be useful as well to include less volatile ingredients (Castle,
1996). A library of spectral data (MS, IR, NMR) has been published (Bush et al., 1993) and an even
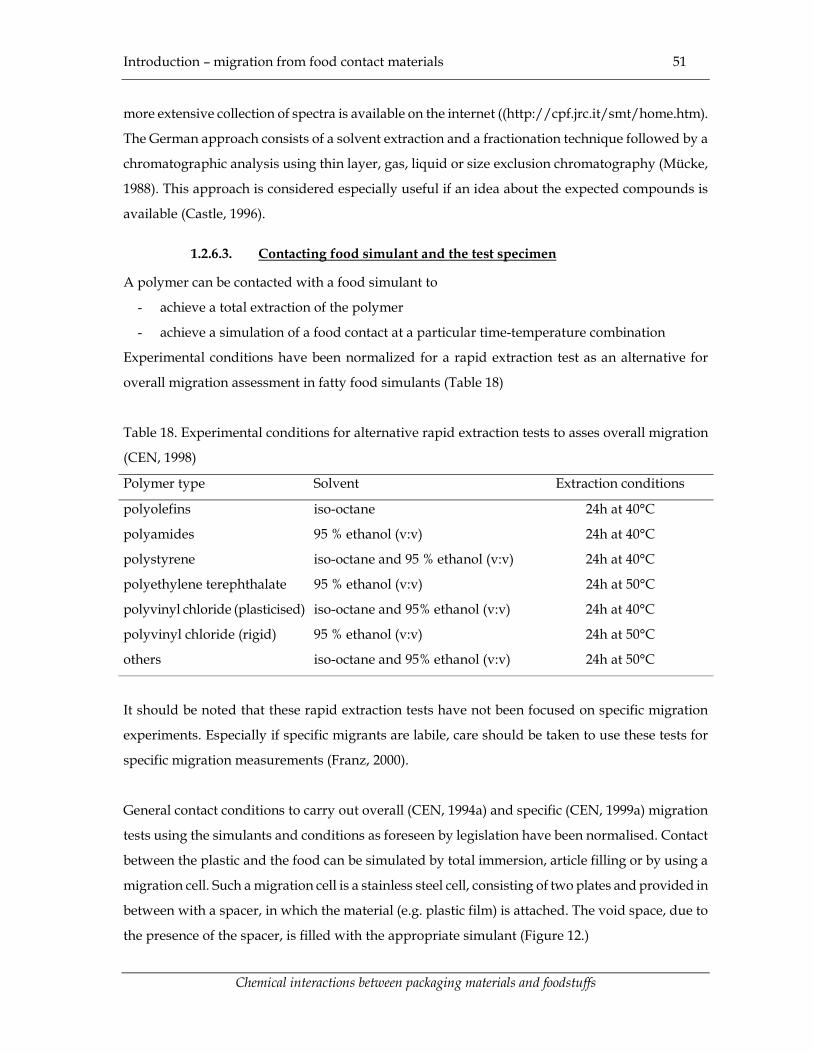
Introduction – migration from food contact materials 51
Chemical interactions between packaging materials and foodstuffs
more extensive collection of spectra is available on the internet ((http://cpf.jrc.it/smt/home.htm).
The German approach consists of a solvent extraction and a fractionation technique followed by a
chromatographic analysis using thin layer, gas, liquid or size exclusion chromatography (Mücke,
1988). This approach is considered especially useful if an idea about the expected compounds is
available (Castle, 1996).
1.2.6.3. Contacting food simulant and the test specimen
A polymer can be contacted with a food simulant to
- achieve a total extraction of the polymer
- achieve a simulation of a food contact at a particular time-temperature combination
Experimental conditions have been normalized for a rapid extraction test as an alternative for
overall migration assessment in fatty food simulants (Table 18)
Table 18. Experimental conditions for alternative rapid extraction tests to asses overall migration
(CEN, 1998)
Polymer type Solvent Extraction conditions
polyolefins iso-octane 24h at 40°C
polyamides 95 % ethanol (v:v) 24h at 40°C
polystyrene iso-octane and 95 % ethanol (v:v) 24h at 40°C
polyethylene terephthalate 95 % ethanol (v:v) 24h at 50°C
polyvinyl chloride (plasticised) iso-octane and 95% ethanol (v:v) 24h at 40°C
polyvinyl chloride (rigid) 95 % ethanol (v:v) 24h at 50°C
others iso-octane and 95% ethanol (v:v) 24h at 50°C
It should be noted that these rapid extraction tests have not been focused on specific migration
experiments. Especially if specific migrants are labile, care should be taken to use these tests for
specific migration measurements (Franz, 2000).
General contact conditions to carry out overall (CEN, 1994a) and specific (CEN, 1999a) migration
tests using the simulants and conditions as foreseen by legislation have been normalised. Contact
between the plastic and the food can be simulated by total immersion, article filling or by using a
migration cell. Such a migration cell is a stainless steel cell, consisting of two plates and provided in
between with a spacer, in which the material (e.g. plastic film) is attached. The void space, due to
the presence of the spacer, is filled with the appropriate simulant (Figure 12.)
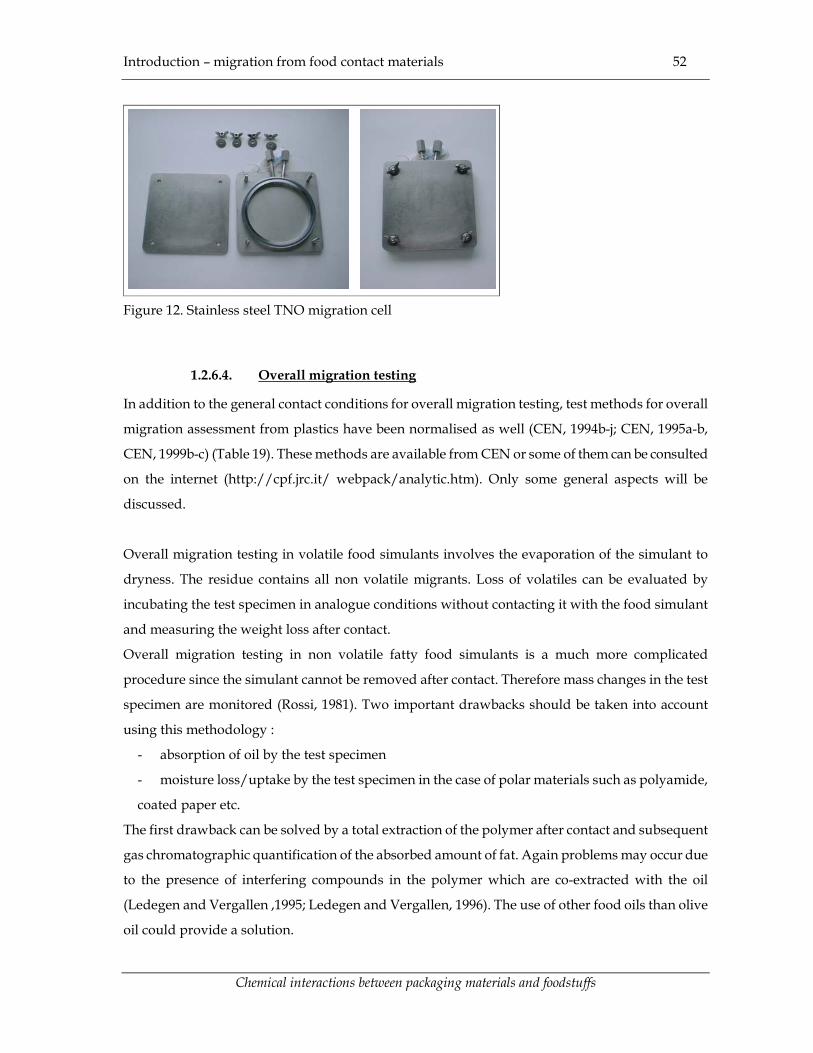
Introduction – migration from food contact materials 52
Chemical interactions between packaging materials and foodstuffs
Figure 12. Stainless steel TNO migration cell
1.2.6.4. Overall migration testing
In addition to the general contact conditions for overall migration testing, test methods for overall
migration assessment from plastics have been normalised as well (CEN, 1994b-j; CEN, 1995a-b,
CEN, 1999b-c) (Table 19). These methods are available from CEN or some of them can be consulted
on the internet (http://cpf.jrc.it/ webpack/analytic.htm). Only some general aspects will be
discussed.
Overall migration testing in volatile food simulants involves the evaporation of the simulant to
dryness. The residue contains all non volatile migrants. Loss of volatiles can be evaluated by
incubating the test specimen in analogue conditions without contacting it with the food simulant
and measuring the weight loss after contact.
Overall migration testing in non volatile fatty food simulants is a much more complicated
procedure since the simulant cannot be removed after contact. Therefore mass changes in the test
specimen are monitored (Rossi, 1981). Two important drawbacks should be taken into account
using this methodology :
- absorption of oil by the test specimen
- moisture loss/uptake by the test specimen in the case of polar materials such as polyamide,
coated paper etc.
The first drawback can be solved by a total extraction of the polymer after contact and subsequent
gas chromatographic quantification of the absorbed amount of fat. Again problems may occur due
to the presence of interfering compounds in the polymer which are co-extracted with the oil
(Ledegen and Vergallen ,1995; Ledegen and Vergallen, 1996). The use of other food oils than olive
oil could provide a solution.
Introduction – migration from food contact materials 53
Chemical interactions between packaging materials and foodstuffs
The second drawback can be solved by ensuring a constant moisture content of the test specimen by
equilibration in a moisture controlled atmosphere or by measuring the moisture content of the
material using the Karl-Fisher method (Castle et al., 1992).
Because of the more complex analytical methodology compared to overall migration assessment in
volatile simulants, the analytical tolerance is 3 mg.dm-² instead of 1 mg.dm-².
Table 19. Normalised overall migration test methods
Method Reference
overall migration in olive oil by total immersion CEN, 1994b
overall migration into aqueous simulants by total immersion CEN, 1994c
overall migration olive oil by cell CEN, 1994d
overall migration into aqueous simulants by cell CEN, 1994e
overall migration in olive oil using a pouch CEN, 1994f
overall migration into aqueous simulants using a pouch CEN, 1994g
overall migration into olive oil by article filling CEN, 1994h
overall migration into aqueous simulants by article filling CEN, 1994i
overall migration into olive oil (modified method for use in
case where incomplete extraction of olive oil occurs)
CEN, 1994j
test methods for overall migration into mixtures of 14C-labelled
synthetic tri-acyl glycerols
CEN, 1995a
test methods for overall migration at low temperatures CEN, 1995b
test methods for overall migration at high temperatures CEN, 1999b
test methods for ‘substitute tests’ for overall migration using
iso-octane and 95% ethanol
CEN, 1999c
For the sake of completeness it should be mentioned that BCR/IRRM reference materials and ring
tests (e.g. FAPAS programme of the Central Science Laboratory, UK,
http://ptg.csl.gov.uk/current.cfm) are available to allow analytical laboratories to check the
validity of their analytical methods in overall migration assessment.
1.2.6.5. Specific migration testing
1.2.6.5.1. General remarks
Specific migration testing is not always a necessity, even if a specific migration limit for a particular

Introduction – migration from food contact materials 54
Chemical interactions between packaging materials and foodstuffs
migrant is specified. By assuming total migration of the migrant from the polymer to the food,
agreement with the specific migration limit can be checked if some product specifications are
known (e.g. migrant concentration in the polymer, thickness of the polymer). Provided that the
partition coefficient is known, a similar calculation using the concentration of the migrating
substance in the polymer in equilibrium conditions can be another method not requiring advanced
analytical methods. Alternatively, mathematical modelling as indicated before can be a valuable
option for specific migration testing in particular circumstances.
Most frequently however chemical analysis is necessary to demonstrate compliance of a polymer-
migrant system. Most laboratories apply their own methods to tackle the analysis of specific
migrants in foods or food simulants. As a consequence, results obtained in different laboratories for
the same sample may vary in such a way that there is a need for uniform, standardized and
validated analytical methods (Franz, 2000). Such a standardization and validation program has
been undertaken already in a Standards Measuring and Testing Program funded by the EU for 36
monomers. For 7 substances, normalized methods for their analysis in foods or in plastics are
already available (CEN, 1999d-j). In addition, other methods are available on the internet
(http://cpf.jrc.it/smt/home.htm). In addition, reference materials and ring tests (e.g. FAPAS
programme) are available to allow analytical laboratories to check the validity of some of their
analytical methods to study specific migration.
It is impossible to discuss every possible analytical method in detail. In order to illustrate some of
the major techniques used in specific migration analysis, a review is presented with regard to the
analytical methodologies related to xeno-estrogenic migrants from food contact materials.
1.2.6.5.2. Analytical methodologies to study migration of xeno-estrogens from food contact
materials (adopted from De Meulenaer and Huyghebaert, 2001b)
Xeno estrogens from food contact materials
Although various xeno-estrogenic compounds are described, with regard to food contact materials,
especially the compounds shown in Figure 13 are of interest : bisphenol A 1, di-n-butyl phthalate 2,
butyl benzyl phthalate 3 and bisphenol A diglycidyl ether 4 (BADGE). In this review, only attention
towards the migration from these compounds is considered, although other estrogenic compounds
from contact materials (e.g. dioxins in paper), could enter into the food chain (Lafleur et al., 1990;
Lafleur et al., 1991; Kardinaal et al., 1997).
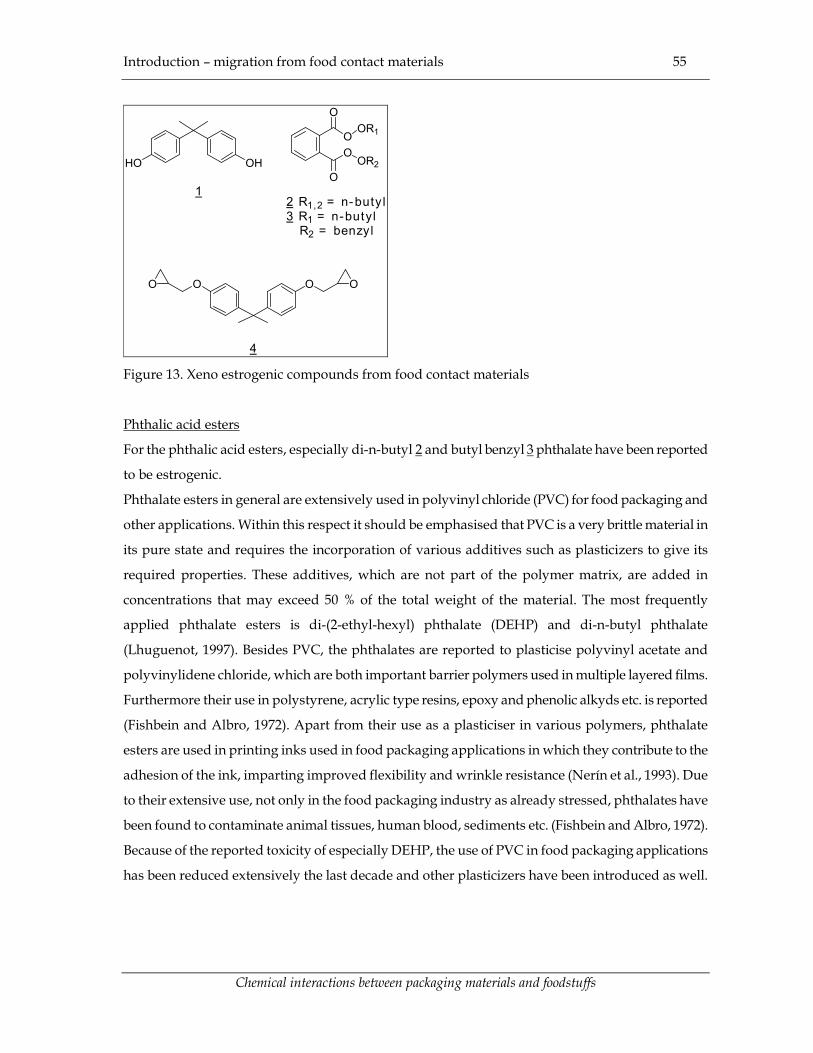
Introduction – migration from food contact materials 55
Chemical interactions between packaging materials and foodstuffs
OO
O
OOR2
OR1
OHHO
2 R1,2 = n-buty l3 R1 = n-butyl R2 = benzyl
1
OOO O
4 Figure 13. Xeno estrogenic compounds from food contact materials
Phthalic acid esters
For the phthalic acid esters, especially di-n-butyl 2 and butyl benzyl 3 phthalate have been reported
to be estrogenic.
Phthalate esters in general are extensively used in polyvinyl chloride (PVC) for food packaging and
other applications. Within this respect it should be emphasised that PVC is a very brittle material in
its pure state and requires the incorporation of various additives such as plasticizers to give its
required properties. These additives, which are not part of the polymer matrix, are added in
concentrations that may exceed 50 % of the total weight of the material. The most frequently
applied phthalate esters is di-(2-ethyl-hexyl) phthalate (DEHP) and di-n-butyl phthalate
(Lhuguenot, 1997). Besides PVC, the phthalates are reported to plasticise polyvinyl acetate and
polyvinylidene chloride, which are both important barrier polymers used in multiple layered films.
Furthermore their use in polystyrene, acrylic type resins, epoxy and phenolic alkyds etc. is reported
(Fishbein and Albro, 1972). Apart from their use as a plasticiser in various polymers, phthalate
esters are used in printing inks used in food packaging applications in which they contribute to the
adhesion of the ink, imparting improved flexibility and wrinkle resistance (Nerín et al., 1993). Due
to their extensive use, not only in the food packaging industry as already stressed, phthalates have
been found to contaminate animal tissues, human blood, sediments etc. (Fishbein and Albro, 1972).
Because of the reported toxicity of especially DEHP, the use of PVC in food packaging applications
has been reduced extensively the last decade and other plasticizers have been introduced as well.

Introduction – migration from food contact materials 56
Chemical interactions between packaging materials and foodstuffs
Bisphenol A
For food applications, bisphenol A 1 is used for the production of polycarbonate. This amorphous
thermoplast possesses a balance of functional properties such as toughness, optical clarity and fairly
high temperature resistance. Polycarbonate is especially used for the packaging of dairy products in
refillable bottles and for the manufacture of table ware such as baby bottles (Howe and Borodinsky,
1998). Apart from their use in polycarbonate materials, bisphenol A is used for the polymeric
coating of food cans. Such a coating is applied to prevent the can from corroding. These polymeric
coatings are usually highly cross-linked thermoset resins. The most widely used types of internal
coating, if heat resistance is required, are epoxyphenolic resins, PVC organosols and cross-linked
polyester resins. The epoxyphenolic resins are the most important within this respect because
bisphenol A is used to make most types of epoxy resins. These resins are cross-linked before being
applied to the can interior to decrease possible migration (MAFF, 2001).
BADGE
The bisphenol A epoxy derivative BADGE 4 is used as well for the manufacture of epoxy, acrylic,
polyesters and organosol coatings both as a stabilizer (e.g. PVC organosols to scavenge hydrogen
chloride) and cross linking agent (Sharman et al., 1995, Grob et al., 1999). These coatings are applied
at the interior part of cans, water storage installations, pipes etc. Its use as an adhesive component is
also reported (Sharman et al., 1995).
Analytical methodologies for phthalates
Analytical techniques
For the analysis of estrogenic phthalates, methodologies described for the analysis of phthalates
esters can be applied. Giam and Wong (1987) reviewed at the end of the eighties some older
analytical methodologies such as packed column gas chromatographic analysis, thin layer
chromatography, UV spectrometry, fluorescence measurements etc. Due to the development of high
resolution gas chromatography however, capillary high resolution GLC analysis of a mixture of
phthalates is the method of choice nowadays. In order to facilitate identification and to allow
quantification up to the ppb level, hyphenation of the gas chromatographic equipment to a mass
spectrometer allowing the detection of selected ions, is indispensable. Generally, phthalates are
easily separated on apolar GLC columns such as HP-1 or HP-5, Restek XTI-5, CP-Sil 5CB or similar
(Nerín et al., 1993; Castle et al., 1988, Castle et al., 1989, Castle et al., 1990, Petersen and Breindahl,
2000, Hirayama et al., 2001). For the sake of completeness it should be mentioned that some
commercially important phthalate esters, such as di-iso-octyl phthalate (DIP) and others are

Introduction – migration from food contact materials 57
Chemical interactions between packaging materials and foodstuffs
complex mixtures of isomers that are dispersed over a wide range of retention times in capillary
GLC. Therefore, LC-MS analysis under which the isomers of these phthalates are eluted as single
peaks, may facilitate the quantification of these particular mixtures (MAFF, 1996). Complete
chromatographic resolution of all phthalate esters is however reported to be difficult using HPLC.
Moreover, limits of quantification are higher compared to GC-MS methodologies. Therefore, the
possibilities of HPLC remain limited except for the quantification of particular phthalates
(Lhughuenot, 1997).
Apart from the identification and quantification of individual phthalates, determination of total
phthalates is reported as well. Phthalate esters are saponified in the presence of methanolic
potassium hydroxide. Subsequently, phthlatic acid is esterified to dimethyl phthalate by making use
of boron trifluoride as a catalyst. Subsequently the sample can be analysed by GC-MS (MAFF, 1996)
Extraction
Prior to the identification and quantification of phthalate esters, they need to be extracted from their
matrix. If the matrix consists of the packaging material itself, chloroform extraction is frequently
reported to determine phthalates in printing inks or plasticised films (Castle et al., 1989). For the
analysis of PVC materials, dissolution of the polymer in tetrahydrofurane and subsequent
precipitation of the polymer in methanol is reported (Castle et al., 1990).
If food is to be analysed, various extraction methods are reported in the review of Giam and Wong
(1987). Apart from those, the use of acetone-hexane (Castle, et al., 1988), pentane (Petersen and
Breindahl, 2000), dichloromethane-acetonitrile (MAFF, 1995), dichloromethane-cyclohexane (MAFF,
1995) have been reported. For milk samples, prior to the extraction with hexane, the addition of
potassium hydroxide and methanol for destabilisation of the emulsion is reported (Castle, 1990).
Clean-up methods
For all the extraction methods applied on foods cited above, part of the fat is co-extracted together
with the phthalate esters. In order to reach low detection levels, these interfering tri-acyl-glycerols
need to be removed from the extract. Although some other techniques have been used (Burns et al.,
1981; Giust et al., 1990, Page and Lacroix, 1992), the method of choice is gel permeation
chromatography using for example a porous styrene-divinylbenzene copolymer such as Bio-Beads
S-X3 enabling the separation of for example 63 mg of fat in a single chromatographic run on a 40 cm
x 1.5 cm column (Castle et al., 1990). Recently, Tsumura et al. (2001) presented a clean-up procedure
involving the combined use of Florisil and Bondesil PSA columns.

Introduction – migration from food contact materials 58
Chemical interactions between packaging materials and foodstuffs
Special precautions in phthalate analysis
Because phthalates are ubiquitous environmental contaminants and in particular can be a problem
in the laboratory due to the contamination of chemicals and reagents, it is always necessary to take
extensive precautions for cleaning of glassware, checking for possible sources of contamination and
running frequent control blank samples. All glassware used, should be washed prior to use with
solvents. All solvents used should be checked for phthalate contamination by evaporation of for
example 100 mL of solvent to near dryness and subsequent GC analysis (Castle et al., 1990). Impure
solvents should be rejected because of the multiple concentration steps throughout the analytical
procedure, which transform the traces of phthalates present into significant concentrations
distorting the final result (Lhuguenot, 1997). Therefore contact with other materials than glass,
stainless steel or PTFE should be avoided as much as possible throughout the total analytical
procedure (Castle et al., 1988).
Analytical methodologies for bisphenol A
Analytical techniques
In contrast to the phthaltic esters, bisphenol A is generally chromatographed in the liquid phase.
The use of C18 (Howe and Borodinsky, 1998; Takino et al., 1999; Yoshida et al., 2001) C8 and cyano
(Mountfort et al., 1997) bonded phases have been reported in combination with respectively
methanol-water, acetonitrile-water or hexane-isopropanol-dichloromethane as mobile phases. For
detection UV (230, 280 nm) is reported (Takino et al., 1999; Franz and Rijk, 1996) although with
fluorescence detection (Ex 285 or 235 nm, Em 300 or 317 nm, Howe and Borodinsky, 1998;
Mountfort et al., 1997) better sensitivity can be obtained for some matrices. Fatty matrices however,
such as the official EU fatty food simulant olive oil, show interference using fluorescence detection
rendering the applicability of this detector restricted (Simoneau et al., 2000).
Recently, gas chromatographic methods for the analysis of bisphenol A are reported. Lee and Peart
(2000) derivatised bisphenol A from sewage, sludges and waste water into its pentafluoropropionyl
or its acetylated analogue. Similarly MAFF (2001) reported in a recent food survey the use of
acetylation to quantify bisphenol A in different food matrices by GC-MS analysis. Alternatively,
Kawamura et al. (1999) reported trimethylsilylation prior to GC-MS analysis. Similarly, Takao et al.
(1999a) reported an improved peak area by on column silylation after solid phase micro extraction
of the phenol out of different matrices. Biles et al. (1997) used GC-MS without derivatisation to
confirm the presence of bisphenol A in infant formulae liquid concentrates. As a stationary phase
for GC analysis, HP-5 (MAFF, 2001) or similar seems appropriate.
Apart from the use of classical instrumental techniques such as chromatography, bio-analytical

Introduction – migration from food contact materials 59
Chemical interactions between packaging materials and foodstuffs
methods are developed for the measurement of bisphenol A. In Japan, three groups recently
developed an enzyme linked immunosorbent assay (ELISA) based respectively on the
immunization of rabbits (Kodaira et al., 2000; Ohkuma et al., 2002) and on the use of mice
monoclonal antibodies (Nishii et al., 2000).
Extraction and clean-up
For the quantification of residual bisphenol A in polycarbonate, dissolution of the polymer in
chloroform or dichloromethane is reported (Sugita et al., 1994). Afterwards Mountfort et al. (1997)
precipitated the polymer with isopropanol and added hexane which was subsequently analysed by
HPLC. This is quite surprising, since bisphenol A is not very well soluble in hexane. Sugita et al.
(1994) precipitated the polymer with acetone and dissolved the clean upper layer in water-
acetonitrile to precipitate remaining oligomers. Howe and Borodinsky (1998) extracted the
dissolved polymer with a diluted sodium hydroxide solution, which was subsequently analysed on
HPLC.
In contrast to the phthalates, a CEN method has been prepared for the quantification of bisphenol A
in the official EU food simulants (Franz and Rijk, 1996). For the non fatty food simulants, direct
analysis by HPLC-UV is recommended. For olive oil, extraction of the oil with an aqueous methanol
solution (1:1) and subsequent HPLC-UV analysis was found to be appropriate. Within laboratory
detection limits were reported to be in the range of 0.05-0.7 mg.kg-1 of food simulant. As indicated
above, using fluorescence detection, better detection limits can be obtained as reported by Howe
and Borodinsky (1998) and Mountfort et al. (1997) : respectively 5 30 µg.kg-1. For the sake of
completeness it should be noted that in the former case the fatty food simulant used, Miglyol 812TM,
was extracted using an aqueous tetrabutylammonium hydroxide solution and that in the latter case,
solid phase clean-up was used for the extraction of the analysed infant feed samples.
In a recent MAFF survey (MAFF, 2001) a general methodology to determine bisphenol A is
presented. Fat containing homogenised samples were blended with heptane-acetonitrile while for
non fatty matrices heptane was omitted. After drying and concentrating the acetonitrile fraction, the
sample was diluted with water prior to derivatisation with acetic anhydride. The acetylated
bisphenol A was extracted with heptane, which was analysed by GC-MS. Limit of detection was 2
ppb and recoveries ranged from 81-103 %.
Yoshida et al. (2001) extracted vegetables and fruits with acetonitrile, which was afterwards applied
on a Florisil cartridge for further purification prior to HPLC-UV analysis. The aqueous fraction was
directly applied on an OASIS HLB extraction cartridge followed by a cleaning on a Florisil column.

Introduction – migration from food contact materials 60
Chemical interactions between packaging materials and foodstuffs
For canned fish, Takino et al. (1999) extracted the sample with ethyl acetate followed by defatting
with hexane-acetonitrile partitioning. Subsequently further sample purification was accomplished
by applying the sample on a silicagel column prior to HPLC-UV analysis. Kawamura et al. (1999)
used polystyrene solid phase cartridges to extract bisphenol A from coffee and thee drinks.
Similarly Biles et al. (1997) reported the use of styrene-divinyl benzene solid phase extraction
cartridges for direct application of diluted infant food formulae. After removal of the apolar
interference with hexane, bisphenol A was eluted with chloroform prior to HPLC fluorescence
detection.
Analytical methodologies for BADGE
Analytical techniques
Similar to bisphenol A, BADGE can be analysed both by gas and liquid chromatographic
techniques. Sharman et al. (1995) for example confirmed the presence of BADGE using a CPSil 5CB
column in conjunction to a mass spectrometer. Similarly Simoneau et al. (1999) used GC-MS for
confirmation purposes. Most reported analytical methods however, use reversed phase HPLC using
C18 columns. Earlier methods (Crathorne et al., 1986) apply UV detection (275 nm), but better
performances are obtained using fluorescence detection. Previously, 275 nm was employed for
excitation and 300 nm for emission ( Paseiro Losada et al., 1991a, b), but better sensitivity was later
obtained at an excitation and emission wavelength of respectively 225 nm and 305 nm (Paseiro
Losada et al., 1997). Currently, the latter conditions are mostly used. The same authors reported the
use of both gradient and isocratic elution designed for different sets of analytical priorities (Paseiro
Losada et al., 1997). Simal Gandara et al. (1993) reported the use of LC-MS as well. The proposed
CEN method however describes the use of reversed phase HPLC with fluorescence detection as
indicated above (Franz and Rijk, 1997). For the sake of completeness it should be mentioned that
Biederman and Grob (1998) presented a gradient normal phase HPLC method coupled with
fluorescence detection to enable detection of other contaminants which may originate from epoxy
coatings apart from BADGE and to avoid prior clean-up steps for fatty samples.
Extraction and clean-up
For the analysis of BADGE in the package, Paseiro Losada et al. (1991b) described a fairly drastic
reflux method (10h, chloroform-methanol 25:75) for epoxy amine formulations, while Sharman et al.
(1995) extracted susceptor board containing a BADGE adhesive, with chloroform at room
temperature. Biedermann and Grob (1998) on the other hand used acetonitrile at room temperature
to extract BADGE from can coatings.

Introduction – migration from food contact materials 61
Chemical interactions between packaging materials and foodstuffs
For the analysis of BADGE in foods and food simulants, it should be kept into account that BADGE
undergoes hydrolysis with a half life of less than 2 days (Tice and Mc. Guiness, 1987, Tice, 1988,
Paseiro Losada et al., 1992). Apart from these hydrolysis products however, the presence of
chlorohydroxy derivatives as well as oligomers of BADGE have been reported to be present in
canned foods due to migration from the can coating (Biedermann et al., 1997, Grob et al., 1999).
Because hydrolysis products can be produced out of migrating BADGE during migration tests in
aqueous simulants, their presence in the simulant should be kept into account to calculate the total
specific BADGE migration from the contact material (Franz and Rijk, 1997). The advanced HPLC
fluorescence method cited above (Paseiro Losada et al., 1997) is able to quantify BADGE and its
hydrolysis products in water without a need of sample purification. In fatty food simulants such as
olive oil, BADGE hydrolysis is not a problem. A CEN method is available (Franz and Rijk, 1997) for
the quantification of BADGE in oil. The sample is dissolved in a dichloromethane-heptane mixture
before it is applied on a Florisil cartridge. BADGE is eluted from the column using
tetrahydrofurane. Limit of detection have been reported to be in the range of 1 to 10 ppb, depending
on the food simulant used.
For oil or other fatty foods such as canned fish, a direct normal phase HPLC method is described
(Biederman and Grob , 1998). Alternatively, reversed phase HPLC can be used as well. In their first
survey MAFF (1997) developed a method to determine BADGE in foods. After homogenisation, the
sample was extracted using dichloromethane. The extract was dried and dissolved in hexane.
Finally BADGE was extracted with acetonitrile and further cleaned up. In their modified procedure
recently published (MAFF, 2000), extraction of the sample with heptane-acetonitrile was followed
by HPLC-fluorescence analysis. Oil of canned fish was extracted with acetonitrile and filtered over a
C18 cartridge. Alternatively, florisil clean-up (Franz and Rijk, 1997), methanol (Rauter et al., 1999;
Philo et al., 1997) or acetonitrile (Simoneau et al., 1999) extraction are reported to remove possible
interferences from the sample extract.
1.3. Migration from other food contact materials
As indicated in the beginning of this review, apart from plastics also other contact materials are
being used in the food industry (Table 1). Plastics however are clearly the most dominant materials
used and in addition, migration from plastics is generally more important as well considering the
total exposure to the consumer. This however does not implicate that other food contact materials
are inert nor that migration from these materials is considered to be of no importance. A complete
overview of the migration mechanisms however from these materials fall out of the scope of this

Introduction – migration from food contact materials 62
Chemical interactions between packaging materials and foodstuffs
work. A summarizing table indicating major migrating compounds, relevant legislation and
reference to more detailed literature is presented here for the sake of completeness (Table 20).
1.4. Relevance of the presented research
Three main parts can be distinguished in the experimental work of this doctoral thesis :
- a study on the chemical characterization of a complex group of plastic additives
- the development of an immunochemical method for bisphenol A analysis in foodstuffs
- migration and legislative aspects of active and intelligent packaging materials
In these three major parts, basically three innovative analytical approaches in the particular field of
chemical interactions between packaging materials and foodstuffs are introduced.
1.4.1. Development of an analytical protocol for the characterisation of
polyglycerol fatty acid esters
As could be concluded from the extensive literature review on migration from plastic food contact
materials, a full identification of plastic additives is of prime importance. Polyglycerol fatty acid
esters are a complex group of compounds for which the analytical methodology is currently not
fully developed. Since these compounds can be used as additives in plastic food contact materials,
their chemical characterisation is of interest. Therefore a hyphenated analytical approach will be
presented in chapter 2 enabling the characterization of polyglycerols and polyglycerol fatty acid
esters.
1.4.2. New developments in specific migration assessment
Two new approaches for the assessment of specific migration are presented. In the first approach,
the development of an enzyme linked immunosorbent assay for the analysis of bisphenol A is
discussed. This immunochemical approach is rather unusual in this particular field of food
contaminant analysis as could be concluded from the literature review (paragraph 1.2.6.5.2). In
chapter 3, the production of bisphenol A specific antibodies in an animal host is discussed. In the
next chapter, studies on the usefulness of the isolated antibodies are presented (chapter 4).
Immunochemical methods could have some distinct advantages compared to the classical
instrumental methods used to study migration. No expensive chromatographic or mass
spectrometric equipment is necessary. Sample clean-up can be avoided or restricted to an important
extend, because of the specificity of the antibodies used. Therefore, use of chemicals and typical
devices such as solid phase extraction columns can be reduced. Immunochemical methods are
reported to be quite sensitive as well. Finally, the number of samples which can be analysed in one

Introduction – migration from food contact materials 63
Chemical interactions between packaging materials and foodstuffs
analytical run can be much higher.
In chapter 5, dealing with two new kinds of packaging technologies (active and intelligent
packaging materials), the use of alternative aqueous food simulants is discussed to study the
specific migration from selected active packaging materials.
1.4.3. New development in overall migration assessment
Similarly as for the specific migration assessment, the usefulness of alternative aqueous food
simulants is discussed for overall migration measurement from selected active packaging materials
(Chapter 5). The need for such alternative simulants is derived from overall migration studies of
several active and intelligent packaging materials in the framework of a European FAIR project
(ACTIPAK, CT98-4170). Apart from those findings, some legal drawbacks with regard to food
packaging, food additive and other relevant legislation are discussed as well (Chapter 5).

Introduction – migration from food contact materials 64
Chemical interactions between packaging materials and foodstuffs
Table 20. Migration from other food contact materials than plastics
Material Migrants Legislative status Relevant references
regenerated cellulose additives (comparable to plastics) EU legislation EEC, 1993 ; Lancaster and Richards, 1996; Warenwet; Koninklijk Besluit, 1992
elastomers and rubber starting substances, additives (comparable to plastics)
draft EU legislation; national legislation
Warenwet; Sidwell, 1996; Anonymous, 2000
paper and board additives, metals, organic contaminants (e.g. dioxins)
national legislation Warenwet; Söderhjelm and Sipiläinen-Malm, 1996; Koninklijk Besluit, 1992
ceramics heavy metals EU legislation EEC, 1984; Warenwet; Koninklijk Besluit, 1992
glass heavy metals and other minerals national legislation Tingle, 1996; Warenwet; Koninklijk Besluit, 1992
tin coated steel plate tin, iron, other minerals national legislation Murphy and Amberg-Müller, 1996; Warenwet; Koninklijk Besluit, 1992
aluminium aluminium, other minerals national legislation Murphy and Amberg-Müller, 1996; Warenwet
wood and cork additives (comparable to plastics) national legislation Warenwet
textile products additives (comparable to plastics) national legislation Warenwet
paraffins and micro-crystalline waxes waxes, paraffins national legislation
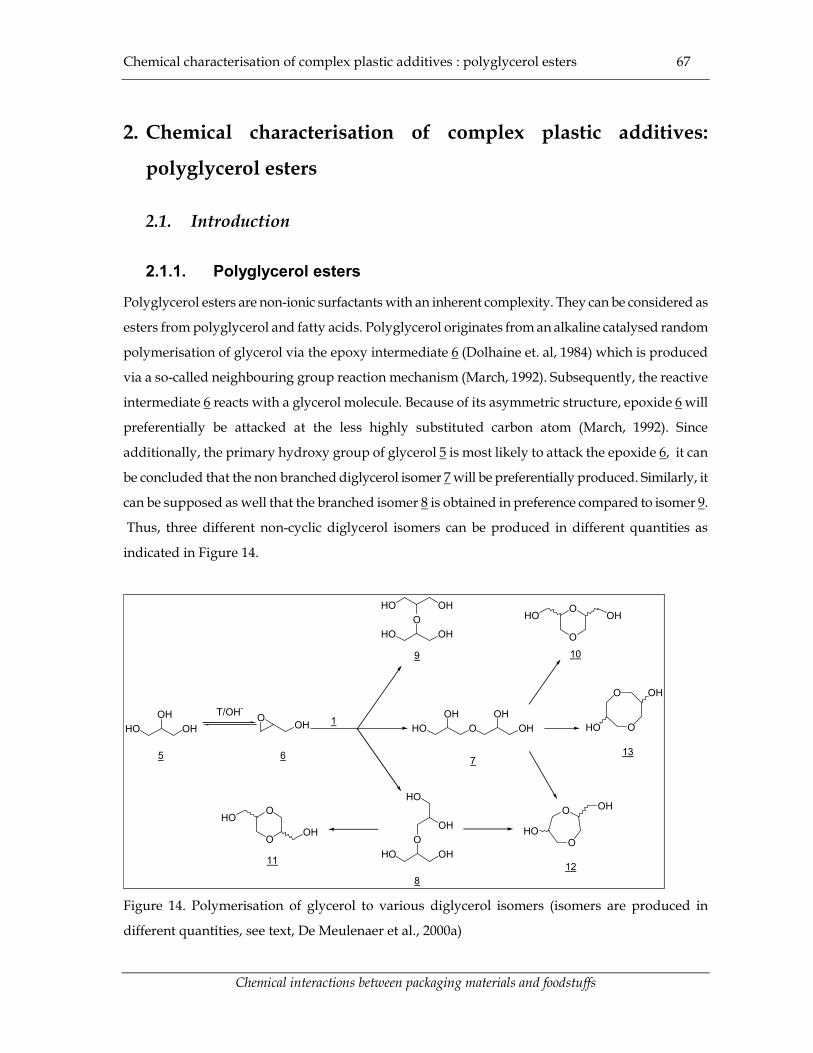
Chemical characterisation of complex plastic additives : polyglycerol esters 67
Chemical interactions between packaging materials and foodstuffs
2. Chemical characterisation of complex plastic additives:
polyglycerol esters
2.1. Introduction
2.1.1. Polyglycerol esters
Polyglycerol esters are non-ionic surfactants with an inherent complexity. They can be considered as
esters from polyglycerol and fatty acids. Polyglycerol originates from an alkaline catalysed random
polymerisation of glycerol via the epoxy intermediate 6 (Dolhaine et. al, 1984) which is produced
via a so-called neighbouring group reaction mechanism (March, 1992). Subsequently, the reactive
intermediate 6 reacts with a glycerol molecule. Because of its asymmetric structure, epoxide 6 will
preferentially be attacked at the less highly substituted carbon atom (March, 1992). Since
additionally, the primary hydroxy group of glycerol 5 is most likely to attack the epoxide 6, it can
be concluded that the non branched diglycerol isomer 7 will be preferentially produced. Similarly, it
can be supposed as well that the branched isomer 8 is obtained in preference compared to isomer 9.
Thus, three different non-cyclic diglycerol isomers can be produced in different quantities as
indicated in Figure 14.
HO OHOH
5
T/OH-
OHO
6
1
HO OHO
OHHO
9
HO O OHOH OH
7
HO OHO
8
OH
HO
O
O
OHHO
11
O
OHO
10
OH
O
O OH
HO
12
O
O OH
HO
13
Figure 14. Polymerisation of glycerol to various diglycerol isomers (isomers are produced in
different quantities, see text, De Meulenaer et al., 2000a)

Chemical characterisation of complex plastic additives : polyglycerol esters 68
Chemical interactions between packaging materials and foodstuffs
If the polymerisation proceeds to tri-, tetra- or higher glycerols, the number of linear and branched
isomers increases exponentially. Moreover, once a dimer is formed, cyclic products can result from
intra-molecular ring closure reactions (Figure 14) via a similar epoxide reaction mechanism as
explained above. Thus out of the non-branched isomer 7, cyclic diglycerols 10, 12, and 13 can be
produced. Similarly, out of isomer 8, diglycerol 12 can be obtained as well, together with isomer 11.
Since out of isomer 9 no epoxide derivative can be produced, it cannot give rise to supplementary
cyclic diglycerol isomers. Predicting which cyclic isomer is preferentially produced becomes very
difficult. Apart from the previous considerations with respect to the production of linear diglycerol
isomers, it should be kept into account that 6 membered rings are produced preferentially
compared to 7 or 8 membered rings. From the above cited principles on epoxide ring opening
reactions (nucleophilic attack of the primary hydroxyl group on the less highly substituted carbon)
it can be concluded that the cyclic isomer 13 would be preferentially produced. This however would
be very unlikely because of the low probability 8 membered cyclic molecules are produced.
Nevertheless it can be concluded that the composition of a polyglycerol mixture is extremely
complex, even if a low degree of polymerisation is reached (Dolhaine et al., 1984).
Esterification is achieved using isolated fatty acids or tri-acyl glycerols in an ad random process,
which may be catalysed by alkalics. This results in a very complex mixture of esters that vary in
polymerisation degree, polyglycerol isomers, degree of esterification, kind of esterified fatty acids
and position of esterification.
For the analysis of polyglycerols, several chromatographic techniques have been used: thin layer
chromatography (Seher, 1964; Sahasrabudhe, 1967; Dallas and Stewart, 1967), gas chromatography
(Sahasrabudhe, 1967), high performance liquid chromatography (Aitzemüller et al., 1979;
Chaimbault et al., 1999) and super critical chromatography (Macha et al., 1994). Although some of
these analyses were able to produce quantitative data, full resolution of the isomers of the lower
polyglycerols was not achieved. Interestingly, pure standards of polyglycerols could be obtained
using fractionated distillation (Sahasrabudhe, 1967; Schütze, 1977) or by selective chemical synthesis
(Aitzemüller et al., 1979; Neissner, 1980). Pure standards of polyglycerols are necessary for
quantification purposes.
Many researchers have tried to analyse polyglycerols fatty acid esters using several
chromatographic techniques as well, including paper (Behrens and Mieth, 1984), thin layer
(Neissner, 1980), column (Schütze, 1977), gas (Sahasrabudhe, 1967; Schütze, 1977), high

Chemical characterisation of complex plastic additives : polyglycerol esters 69
Chemical interactions between packaging materials and foodstuffs
performance liquid (Garti and Aserin, 1981a; Garti and Aserin, 1982; Cassel et al., 2001) and super
critical fluid chromatography (Chester and Innis, 1986). All these techniques were qualitative and
most of them did not succeed to resolve the different esters present. Isolation of pure compounds
was not reported as well.
Polyglycerol esters can be used as plastic additives. Their use as for example an antifogging or an
antistatic agent in different kinds of films has been reported. It is evident that the composition of the
final mixture will be of prime importance with regard to its functionality. In addition, the presence
of side product, such as the cyclic isomers, could be of toxicological concern as well. Therefore,
appropriate analytical methods to characterise these complex mixtures should be available.
For the sake of completeness, it should be noted that apart from their use in the plastic industry,
polyglycerol esters have an important potential for use as additives in the food (Hemker, 1981;
Babayan and McIntyre, 1971; Garti and Aserin, 1981b; Dobson et al., 1993; Krog, 1990), cosmetic and
pharmaceutical industry (Behrens and Mieth, 1984; Saad, 1975) as well. Especially the use of di-, tri-
and tetraglycerol mono- and di-esters is relevant (Krog, 1990).
From the previous chapter, it can be concluded that a thorough chemical identification of plastic
additives is an important issue. Apart from the legal and safety aspects concerned however, it
should be noted that the functionality of the polyglycerol fatty acid esters is largely dependent upon
their composition (Cassel et al., 2001). So also from a functional point of view, the elucidation of the
chemical composition of polyglycerol fatty acid esters is an important issue.
2.1.2. Research strategy
Because of the complex nature of the compounds studied, a systematic approach is proposed to
tackle their chemical identification. As a first step, the chemical analysis of the polyglycerol
backbone was studied using gas chromatographic techniques (De Meulenaer et al., 2000a). For the
characterisation of the esters themselves, a hyphenated chromatographic separation including both
liquid and gas chromatographic analysis was evaluated (De Meulenaer et al., 2000b).
In combination with qualitative chromatographic analysis, the possibilities of a quantitative
approach were elaborated as well. Therefore, it was necessary to obtain standards with an
acceptable purity which could be used for calibration purposes.

Chemical characterisation of complex plastic additives : polyglycerol esters 70
Chemical interactions between packaging materials and foodstuffs
2.2. Materials and methods
2.2.1. Reagents
Silica gel plates (60, F254, 5x10cm, film thickness 0.25 mm), silica gel 60, dry pyridine (max 0.01 %
water), ethyl acetate and 2,7 dichlorofluoresceine were obtained from Merck, Germany. Hexane,
chloroform, isopropanol, methanol, ethanol and potassium hydroxide were from Chemlab,
Belgium. Sodium periodate, benzidine, sorbitol, benzene, methanol, ethanol, hexane, potassium
hydroxide, butanol and glycerol were from Acros Organics (Belgium). Acetone (pesticide analysis
grade), petroleum ether and hydrochloric acid (25%) were purchased from Vel, Belgium.
Hexamethyldisilazane (HMDS) and trifluoracetic acid (TFA) were from Sigma, Belgium.
Polyglycerol fatty acid esters, diglycerol and polyglycerols were provided by Beldem, Belgium.
Diglycerol 7 and glycerol were pure enough to be used without any further purification (checked by
gas chromatography). Two polyglycerol samples were produced under various experimental
conditions to obtain different polymerisation degrees. The two samples are further identified
respectively as the triglycerol and polyglycerol sample.
All reagents were of analytical grade or better unless otherwise mentioned.
2.2.2. Liquid chromatography
For the thin layer chromatographic (TLC) experiments on polyglycerols, the mobile phase consisted
of ethyl acetate-isopropanol-water (5:2:1) (v:v), unless otherwise stated. The sample was dissolved
in the mobile phase (typical concentrations 1 mg.mL-1) and 10 µL of the solution is brought on the
plate using a syringe. After development, the plates were dried by exposure to air and sprayed with
a 0.1 % (w:v) aqueous sodium periodate solution. After 5 minutes, the plates were sprayed with
another spray reagent, which was prepared as follows. Benzidine (2.8 g) was dissolved in 50 mL
methanol, after which the solution was diluted with 50 mL water, 20 mL acetone and 10 mL 0.2 N
hydrochloric acid. This spray reagent should be kept in the refrigerator. The polyglycerols are
visible as white spots on a blue background (Stahl, 1967).
For open column chromatography of polyglycerols, 100 g silica gel inactivated with 5% (w:w) water
packed in glass columns (internal diameter 3.2 cm) was used together with ethyl acetate-
isopropanol-water (5:2:1) (v:v) as mobile phase. An appropriate amount of sample (approximately
0.5 g), dissolved in a few mL of methanol, was used for each experiment and samples of about 15
mL were collected and checked for their composition and purity using TLC. Samples containing

Chemical characterisation of complex plastic additives : polyglycerol esters 71
Chemical interactions between packaging materials and foodstuffs
pure polyglycerol species were combined, dried under a gentle stream of nitrogen during one night
at about 50°C to remove all traces of water. Triglycerol and tetraglycerol could be collected from the
following fraction respectively : 800-1400 mL and 1600-2400 mL.
A pure glycerol and diglycerol standard was obtained from glycerol and diglycerol samples that
were pure enough to be used without any further purification (checked by gas chromatography).
For the preparation of the pure triglycerol and tetraglycerol standard, the triglycerol and the
polyglycerol sample, as introduced previously (paragraph 2.2.1), were used respectively.
For TLC separation of polyglycerol esters, a mobile phase of chloroform-acetone 94:4 (v:v) was used
unless otherwise mentioned. Detection was achieved by spraying the developed plates with a 0.125
% (w:v) 2,7-dichlorofluoresceine solution in ethanol.
For open column chromatographic experiments on polyglycerol esters, 50 g silica gel was
inactivated with 5% (w:w) water and introduced as a slurry with the mobile phase (chloroform-
acetone 94:4 (v:v)) in a glass column (2.1 cm ID, 40cm height). Samples, immobilised on silica gel (2
g, 10 % (w:w) sample) were introduced in the column before starting the separation. Elution was
first performed with chloroform-acetone 94:4 (v:v) and subsequently with acetone and methanol.
LC-MS experiments on polyglycerols and polyglycerol esters were performed on a quadrupole HP
1100 Series LC-MSD set-up (Hewlett Packard, USA). Samples were dissolved in methanol, 5 µL
samples were injected and a flow rate of 1 mL MeOH.min-1 was used. Electro spray-MS parameters
were as follows : positive polarity, gas temperature (N2) 340°C, nebulizing gas pressure : 50 psi,
drying gas flow rate 12 L.min-1, voltage at capillary : 4000 V, Quadrupole temperature : 100°C, scan
range : 150-1000 amu, fragmentor (CID) 100 V. Molecular ions with a m.e-1 of M+23 (due to the
addition of sodium ions) are obtained.
These experimental conditions were used, unless otherwise stated.
2.2.3. Gas chromatography
Gas chromatographic analysis of polyglycerols was performed on a Carlo Erba GC 8000
(Interscience, Belgium), provided with a FID detector. Chromatographic parameters were :
stationary phase : CP Sil 5 CB WCOT, film thickness 0.25 µm, internal diameter 0.25 mm, external
diameter 0.39 mm, length 25 m (Chrompack, The Netherlands) ; mobile phase : He 0.6 mL.min-1
(controlled with a DPFC module (Carlo Erba, Interscience, Belgium) ; split 1/100 ; injector
temperature : 250 °C ; detector temperature : 340 °C ; injection volume : 1-2 µL ; temperature
Chemical characterisation of complex plastic additives : polyglycerol esters 72
Chemical interactions between packaging materials and foodstuffs
program : 100°C for 1 min — ramp 10°C.min-1—290°C for 10 min. The FID detector was operated
with hydrogen and air at 30 mL.min-1 and 300 mL.min-1 respectively.
Alternatively, a Perkin Elmer GC 8700 (Perkin Elmer, USA), provided with a FID detector was used
as well for cold on-column injection experiments. Chromatographic parameters were : stationary
phase : CP Sil 5 CB WCOT, film thickness 0.25 µm, internal diameter 0.25 mm, external diameter
0.39 mm, length 5 m (Chrompack, The Netherlands) ; mobile phase : He 1 mL.min-1 ; cold on-
column injection (1-2 µL), detector temperature : 350�C, temperature program : 100�C for 1 min —
ramp 10�C.min-1—350�C for 30 min. The FID detector was operated with hydrogen and air at 30
mL.min-1 and 300 mL.min-1 respectively.
A dried polyglycerol sample (0,1-10 mg) was dissolved in 1 mL dry pyridine containing sorbitol as
internal standard (concentration ± 1 mg.mL-1). To this solution, 1 mL HMDS and 0.1 mL TFA were
added to derivatise the polyglycerols. The solution was shaken vigorously and subsequently kept
for 15 min at room temperature. From the upper solvent layer 1-2 µL was injected.
Preliminary gas chromatographic analysis of polyglycerol fatty acid esters was performed on a
Carlo Erba GC 8000 (Interscience, Belgium), provided with a FID detector. Chromatographic
parameters were : stationary phase : CP Sil 5 CB WCOT, film thickness 0.25 µm, internal diameter
0.25 mm, external diameter 0.39 mm, length 25 m (Chrompack, The Netherlands) ; mobile phase :
He 0.6 mL.min-1 (controlled with a DPFC module (Carlo Erba, Interscience, Belgium) ; split 1/100 ;
injector temperature : 340 �C ; detector temperature : 350 �C ; injection volume : 1-2 µL ; temperature
program : 100�C for 1 min — ramp 10�C.min-1—325�C for 66 min. The FID detector was operated
with hydrogen and air at 30 mL.min-1 and 300 mL.min-1 respectively. Further gas chromatographic
experiments were performed on a Perkin Elmer GC 8700 (Perkin Elmer, USA), provided with a FID
detector. Chromatographic parameters were as described for the analysis of polyglycerols on the
same instrument. Sample preparation was similar as for the polyglycerols except that no internal
standard was added.
Chromatographic parameters for the fatty acid analysis were as follows: Carlo Erba GC 5160
(Interscience, Belgium), stationary phase : CP Sil 88 CB WCOT, film thickness 0.20 µm, internal
diameter 0.25 mm, external diameter 0.39 mm, length 30 m (Chrompack, The Netherlands) ; mobile
phase : He 1 mL.min-1 ; split-splitless injector, split ratio 1/100 (1-2 µL), injector temperature 200�C,
detector temperature : 250�C, temperature program : 120�C for 1 min — ramp 5�C.min-1—200�C for
20 min. The FID detector was operated with hydrogen and air at 30 mL.min-1 and 300 mL.min-1

Chemical characterisation of complex plastic additives : polyglycerol esters 73
Chemical interactions between packaging materials and foodstuffs
respectively.. Correction factors were derived from the injection of a reference oil (CRM 162, IRRM,
Belgium).
Fatty acid analysis was performed by transesterification of the esters in a methanolic KOH solution
(2N) and subsequent extraction of the fatty acid methyl esters in hexane.
Data collection of all gas chromatographic analyses and subsequent data processing were
performed using the Gilson Unipoint software (Middleton, USA).
These experimental conditions were followed unless otherwise stated.
2.2.4. Other methods
Continuous vacuum distillation experiments on polyglycerols, were performed using the KDL 1
equipment of Leybold-Heraeus provided with a vacuum pump, which allowed to control the
pressure in the system. Typically distillation experiments were conducted between 170-240°C and at
pressures of 101-266 Pa. 1H-NMR experiments on polyglycerols were performed on a Jeol PMX 270Si (270 MHz) NMR
instrument. Samples were dissolved in deuterated water, using acetonitrile as reference (CH3CN,
�=2.00).
Saponification experiments on 1 to 2 g of polyglycerol fatty acid esters were performed by refluxing
the sample for at least 30 min in 40 mL of water in the presence of 8 mL 50 % aqueous (w:v) KOH.
After the reaction was completed, the reaction mixture was quickly cooled and the precipitated
potassium salts of the fatty acids were removed by filtration on a paper filter. The filtrate was
incubated in a refrigerator (T between 0-6 °C) for one night and filtered again. One mL of a 1/25
(v:v) methanolic dilution of the filtrate was dried under nitrogen, derivatised and analysed gas
chromatographically according to the method described previously (paragraph 2.2.3). For the
polyglycerols the same protocol was used. The degree of esterification of the polyglycerol esters was determined based on the determination of
the saponification (Firestone, 1995) and the acetyl value (De Vleesschouwer, 1948) of the
polyglycerol esters.
2.3. Results and discussion
2.3.1. Isolation of suitable polyglycerol standards
Since glycerol and diglycerol standards with an acceptable purity were available as such and

Chemical characterisation of complex plastic additives : polyglycerol esters 74
Chemical interactions between packaging materials and foodstuffs
because tri- and tetraglycerol are the other important polyglycerols to consider, a column
chromatographic purification for these compounds was developed. Therefore, the following solvent
mixtures were evaluated in preliminary TLC experiments : ethyl acetate – isopropanol - acetone –
methanol - water (50:15:15:16:4) (v:v) (Aitzemüller et al., 1979), benzene – methanol (8:3) (v:v)
(Sahasrabudhe, 1967), acetone – butanol – water (5:4:1) (v:v) (Kirk and Sawyer, 1991) and ethyl
acetate – isopropanol – water (7:2:1), (6:2:1), (6:3:1) and (5:2:1) (v:v) (Dallas and Stewart, 1967; Kirk
and Sawyer, 1991). Only the latter solvent mixture (ethyl acetate – isopropanol – water, 5:2:1 v:v)
seemed to be successful for an adequate separation of the polyglycerols present in the mixtures
analysed.
The results of these preliminary experiments were used to develop and optimise a preparative
column-chromatographic separation to enable the isolation of tri-and tetraglycerol standards with
sufficient purity. The purity of the different isolated fractions was determined using gas
chromatographic analysis. Typically, about 170 mg of triglycerol (�95 % purity) and 70 mg
tetraglycerol (�90 % purity) could be obtained from 500 mg of a commercial polyglycerol sample.
The impurities, identified on basis of their gas chromatographic elution behaviour, were other
polyglycerols (di-tri- or tetraglycerol). Penta- and higher polyglycerols could be detected in very
low amounts in the last fractions collected of such a polyglycerol sample. This indicated that
probably pure standards could be obtained as well from these samples, using the proposed or a
similar chromatographic method, although it would be advisable to change the solvent composition
(during the experiment) to reduce solvent consumption.
Trials to isolate the different isomers of individual polyglycerols were not successful using the
chromatographic set-up described above. Attempts to isolate pure standards using a continuous
distillation technique failed as well. However, this latter technique was useful to obtain fractions
enriched with particular isomers, as will be discussed later.
For the identification of the isolated polyglycerols the use 1H-NMR was considered. No
characteristic spectra were observed for di, tri- or tetraglycerols respectively. All spectra exhibit two
multiplets at � = 3.5 and 3.8 with a ratio of approximately 5 over 1 (data not shown). Gas
chromatographic analysis of the silylated polyglycerols, coupled to mass spectrometry did not
allow to confirm the identification as well, since no characteristic ions were obtained for all the
samples analysed (data not shown).
Proper identification of the isolated tri- and tetraglycerols could be achieved using an LC-MS
technique, obtaining mass spectra of the underivatised polyglycerols species. Both spectra are
displayed in Figure 15. The molecular ion is clearly observed at a m.e-1 of M+23 due to the addition

Chemical characterisation of complex plastic additives : polyglycerol esters 75
Chemical interactions between packaging materials and foodstuffs
of sodium to the molecular ion. Furthermore some impurities were observed in both spectra
(approximately 20%). This level of impurities was higher compared to the purity as could be
calculated from the gas chromatograms. A remarkable peak at M+23+56 is however observed in
both spectra as well. This compound can be attributed to the presence of acrolein that is an impurity
present in polyglycerols. It seems that this aldehyde reacts with the polyols to obtain the
corresponding hemi-acetal, which is detected in the mass spectra. Possibly, the corresponding acetal
could be formed as well, but it is known that these type of acetals are unstable and decompose to
the corresponding hemi-acetal during the mass spectral analysis (Verhé, personal communication).
m/z150 200 250 300 3500
20
40
60
80
100 Max: 84797[M+Na]+
Triglycerol 2
63.0
319
.0
393
.1
304
.2
264
.0
320
.1
200
.1
285
.0
349
.1
394
.1
m/z150 200 250 300 3500
20
40
60
80
100 Max: 56540Tetraglycerol[M+Na]+
337
.1
393
.1
304
.3
338
.1
394
.1
305
.2
319
.0
349
.1
Figure 15. Mass spectra of tri- and tetraglycerol purified using column chromatography.
2.3.2. Gas chromatographic identification of polyglycerols
Like sugars, polyglycerols are polyalcohols. Thus it was tried to derivatise them to trimethyl silyl
derivatives, using the HMDS/TFA derivatisation method. These compounds are known to be more
volatile and more heat stable compared to the polyalcohols. A similar protocol was already
described by Sahasrabudhe (1967) and is frequently applied for the analysis of mono- and
disaccharides (Southgate, 1991). A chromatogram of a polyglycerol sample to which an internal
standard was added (see paragraph 2.3.3) is shown in Figure 16.

Chemical characterisation of complex plastic additives : polyglycerol esters 76
Chemical interactions between packaging materials and foodstuffs
Figure 16. Typical gas chromatogram of a derivatised polyglycerol sample. Peaks : 1 = diglycerol; 2
= internal standard (sorbitol); 3 = triglycerol, 4= tetraglycerol, 5= pentaglycerol
Glycerol, which is not present in the chromatogram shown in Figure 16, eluted as one peak at about
7.3 minutes.
Since diglycerol has the possibility to form different isomers (Figure 14), also different trimethyl
silyl derivatives should be observed in the chromatogram. In fact two major peaks could be
distinguished at 12.9 and 13.1 min respectively. The ratio between these two peaks was constant for
a certain batch of polyglycerol analysed. Based on reaction probabilities, the ���-diglycerol 7 (Figure
14) will be more readily synthesised compared to the branched isomer �,�-diglycerol 8, as discussed
before (see paragraph 2.1.1). Therefore, the highest peak (13.1 min) can be attributed to the linear
and the lower peak (12.9 min) to the branched isomer. Similarly the third, very small peak in front
of the two major peaks (visible in the enlargement of a chromatogram from a fractionated sample
which is enriched in particular isomers, Figure 17) was attributed to the branched isomer �,�-
diglycerol 9. Again the lower concentration of this compound in the mixture was expected, as
explained before (see paragraph 2.1.1). An additional confirmation of this identification, is the
typical elution order of these compounds. As the �,�-diglycerol 9 is a more compact molecule
compared to the linear isomer 7, it can be expected to be more volatile as well, because of the
smaller molecular interactions possible. Because of the gas chromatographic set-up used (apolar
column), the molecules are essentially separated on basis of their volatility. Consequently, the
observed elution order of the non cyclic diglycerol isomers is in correspondence with their

Chemical characterisation of complex plastic additives : polyglycerol esters 77
Chemical interactions between packaging materials and foodstuffs
molecular structure. So it can be concluded that all the possible non-cyclic isomers of diglycerol
were identified on the chromatogram.
Figure 17. Detail of a gas chromatogram of a derivatised diglycerol sample obtained by fractionated
distillation (enriched in cyclic isomers) - Identification of peaks : 1. cyclic diglycerol 10 or 12, 2. cyclic
diglycerol 11, 3. cyclic diglycerol 10 or 12, 4. cyclic diglycerol 13, 5. �,�-diglycerol 9, 6. �,�-diglycerol
8, 7. �,�-diglycerol 7
In the detailed chromatogram (Figure 17), a number of small peaks eluting before the non-cyclic
isomers were observed as well (retention time around 10 min). It seemed reasonable to attribute
these peaks to the cyclic diglycerol isomers. Several reasons are supporting this hypothesis. First of
all, it can be expected that the retention time of the cyclic-diglycerol isomers will be lower compared
to the linear isomers, since the molecular weights of the trimethyl silyl derivatives is lower.
Furthermore during a fractionated distillation experiment of a polyglycerol mixture an enrichment
of these cyclic compounds was obtained in the first (most volatile) fractions collected, while
afterwards fractions containing higher amounts of linear diglycerol isomers were isolated (results
not shown). This can be explained by the higher volatility of the cyclic isomers compared to the non-
cyclic species because of the lower number of (polar) hydroxyl groups and their more compact
molecular structure. Finally, Sahasrabudhe (1967) proposed a similar elution profile of the isomers
of diglycerols, although in these experiments no complete resolution of the different isomers could
be obtained.

Chemical characterisation of complex plastic additives : polyglycerol esters 78
Chemical interactions between packaging materials and foodstuffs
A remarkable observation was made, studying in detail the chromatogram displayed in Figure 17:
the chromatogram seemed to consist of four pares of peaks, of which one pair is extremely small
(pair 4). Since four cyclic isomers of diglycerol can be formed (Figure 14) and because from each
compound two stereoisomers isomers exist due to the 3-dimensional orientation of the ring
substituents, eight possible compounds can be obtained. This corresponds with the number of
peaks eluting before the non cyclic diglycerol isomers in the chromatogram shown in Figure 17.
Since Dolhaine et. al (1984) stated that 8-12 membered cyclic polyglycerols are rarely formed, the
smallest couple (peak 4, Figure 17) is most probably due to the eight membered cyclic isomer 13,
which seemed to be formed in very low concentrations. The largest couple (peak 3, Figure 17) can
be due to the six membered cyclic isomer 10 or the seven membered cyclic isomer 12. Normally, 6-
membered ring structures are preferably produced compared to 7-membered rings. Because in
addition isomer 10 is produced out of the most abundant linear isomer 7, its concentration can be
expected to be relatively high as well (compared to the other cyclic isomers). One the other hand
however, it should be noted that although the 7-membered isomer 12 is probably not preferentially
produced, it can be obtained via two synthetic routes of which one proceeds as well via the most
abundant linear diglycerol 7. Therefore it cannot be excluded that this peak (peak 3, Figure 17) can
be due to isomer 12 instead. Similarly for the second most intense couple (peak 2, Figure 17), no
complete certitude about its identity can be obtained (isomer 10 or 12). Since the six-membered
isomer 11, is produced however out of the less abundant isomer �,�-diglycerol 8, it seems logic to
assign peak 2 (Figure 17) to this particular isomer.
Confirmation of this identification using GC-MS experiments was not successful since no
characteristic ions of the different isomers could be detected. Moreover, isolation of each of these
isomers was not feasible. Consequently this proposal of identification could not be checked by
injection of purified standards. In contrast to the non cyclic isomers, it is very difficult to predict the
volatility of these cyclic products on basis of their molecular structure. So the hypothetical
identification could not be evaluated in such a manner either.
For the identification of the different triglycerol isomers, an even more complex chromatogram was
obtained as represented in Figure 18. Five major peaks are clearly separated from a number of
smaller peaks (retention times respectively 14.5-16.0 and 16.5-17.5 min). It should be noted that this
chromatogram originates from a fraction obtained by distillation. As a result, it is enriched with
particular isomers.
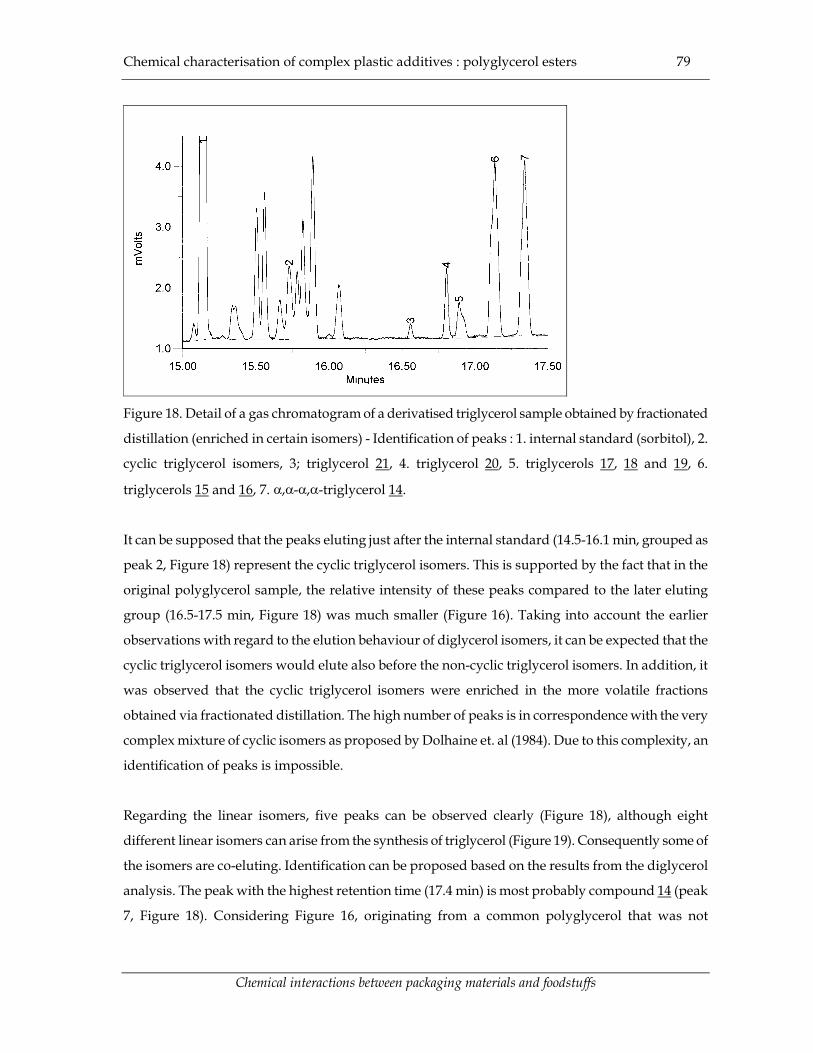
Chemical characterisation of complex plastic additives : polyglycerol esters 79
Chemical interactions between packaging materials and foodstuffs
Figure 18. Detail of a gas chromatogram of a derivatised triglycerol sample obtained by fractionated
distillation (enriched in certain isomers) - Identification of peaks : 1. internal standard (sorbitol), 2.
cyclic triglycerol isomers, 3; triglycerol 21, 4. triglycerol 20, 5. triglycerols 17, 18 and 19, 6.
triglycerols 15 and 16, 7. �,�-�,�-triglycerol 14.
It can be supposed that the peaks eluting just after the internal standard (14.5-16.1 min, grouped as
peak 2, Figure 18) represent the cyclic triglycerol isomers. This is supported by the fact that in the
original polyglycerol sample, the relative intensity of these peaks compared to the later eluting
group (16.5-17.5 min, Figure 18) was much smaller (Figure 16). Taking into account the earlier
observations with regard to the elution behaviour of diglycerol isomers, it can be expected that the
cyclic triglycerol isomers would elute also before the non-cyclic triglycerol isomers. In addition, it
was observed that the cyclic triglycerol isomers were enriched in the more volatile fractions
obtained via fractionated distillation. The high number of peaks is in correspondence with the very
complex mixture of cyclic isomers as proposed by Dolhaine et. al (1984). Due to this complexity, an
identification of peaks is impossible.
Regarding the linear isomers, five peaks can be observed clearly (Figure 18), although eight
different linear isomers can arise from the synthesis of triglycerol (Figure 19). Consequently some of
the isomers are co-eluting. Identification can be proposed based on the results from the diglycerol
analysis. The peak with the highest retention time (17.4 min) is most probably compound 14 (peak
7, Figure 18). Considering Figure 16, originating from a common polyglycerol that was not

Chemical characterisation of complex plastic additives : polyglycerol esters 80
Chemical interactions between packaging materials and foodstuffs
fractionated, it is clear that this isomer is the most abundant triglycerol isomer present. This
corresponds with the highest probability to obtain the �,�-�,�- triglycerol 14. If the chromatogram is
compared with the previous results obtained for diglycerol, it can be observed that the analogue
linear �,�-diglycerol 7 eluted as the last diglycerol isomer as well.
HO O O OHOH OH OH
14
HO O
HOOH
15
O OHOH
HO O OOH
16
OH
OH
HO
HO
OH
17
OO
OHOH
HO
HO
OH
18
O OOH
HO OH
HO OOH
19
HO
O
OH
OH
HO O
20
OHHO
O
HOHO
O
21
OHO
HO
OH
HOOH
Figure 19. Linear isomers of triglycerol
By further comparison of the chromatograms obtained for the diglycerol (Figure 17) and the
triglycerol isomers (Figure 18) respectively, a possible identification of all the peaks can be
proposed. Comparing the retention time between the �,�-diglycerol 7 and the �,�-diglycerol 8 in
Figure 17, a difference of 0.19 min is observed. Similarly the shift between the �,�-diglycerol 7 and
the �,�-diglycerol 9 amounts 0.54 min. Comparing these characteristic shifts with those observed in
the chromatogram obtained from the analysis of the triglycerols (Figure 18), some remarkable
similarities can be noticed. The difference between peak 7 and 6 amounts 0.22 min, which is similar
to the shift in retention time observed between the diglycerol isomers 7 and 8. It can therefore be
supposed that the shift between peak 7 (�,�-�,�-triglycerol 14) and peak 6 is due to a change of one
�,�- bound into an �,�- or �,�-bound. Consequently peak 6 probably corresponds to the triglycerol

Chemical characterisation of complex plastic additives : polyglycerol esters 81
Chemical interactions between packaging materials and foodstuffs
isomers 15 and 16.
Similarly, the retention time difference between peaks 5 and 6 amounts 0.25 min., so possibly
corresponding to a supplementary �,�- to �,�- or �,�-bound change with respect to isomers 15 and
16, giving rise to the isomers 17, 18 and 19. The rather low intensity of peak 5 compared to peaks 6
and 7 (Figure 18), can be explained by the fact that isomers 17, 18 and 19 are synthesised out of
diglycerol 8. In contrast, isomer 14 (peak 7, Figure 18) is synthesised out of �,�-diglycerol 7 and
isomers 15 and 16 (peak 6, Figure 18) are synthesised out of diglycerol isomers 7 and 8. The fact that
peaks 5 and 6 originate most probably from several compounds, is supported by the fact that in the
detailed chromatogram (Figure 18) asymmetric peaks were observed, in contrast to the other peaks,
which were perfectly symmetrical.
As the difference in retention time between peak 4 and 7 (�,�-�,�- triglycerol 14) amounts 0.54 min,
it can be supposed that this shift corresponds with an �,�-to �,�-bound change, as for the diglycerol
isomers. Consequently, peak 4 may be attributed to �,�-�,�-triglycerol 20. Finally a similar shift
(0.58 min) can be observed between peak 3 and 6 (�,�-�,�-triglycerol 15 and �,�-�,�- triglycerol 16),
indicating that peak 3 could correspond to �,�-�,�-triglycerol isomer 21. The low intensity of peak 4
is due to the low reactivity of the �-hydroxyl groups involved, while the even lower intensity of
peak 3 is a combination of this lower reactivity with the lower concentration of the branched
diglycerol 8.
So despite the complexity of the chromatogram obtained, a possible identification of the linear and
branched triglycerol isomers can be presented based on the chromatographic data of the diglycerol
isomers. Validation of these logic assumptions is not feasible because no pure standards of each
isomer could be obtained.
The chromatogram of tetraglycerol became so complex that no comparison with those of di- and
triglycerol was feasible (Figure 20). This is not surprising because of the very high number of linear
tetraglycerol isomers possible (27) compared to the 8, also not completely separated linear
triglycerol isomers. Moreover, a very high number of cyclic isomers can be present as well
(Dolhaine et. al, 1984). Consequently no clear identification of the different peaks could be
presented. Only for the last eluting peak (20.8 min) a possible identification as the �,�-�,�-�,�-
tetraglycerol is proposed. This is supported because this peak is the most dominant (Figure 16) from
all the tetraglycerol peaks concerned. In addition, the analogue diglycerol and triglycerol isomers 7
and 14 behaved similarly. Furthermore, it can be expected that the non branched tetraglycerol
isomer has the lowest volatility compared to the other isomers. Consequently it would be the last

Chemical characterisation of complex plastic additives : polyglycerol esters 82
Chemical interactions between packaging materials and foodstuffs
eluting peak of the tetraglycerol isomers. It should be noted that the chromatogram shown in Figure
20, again originates from a sample obtained via fractionated distillation. Consequently, it can be
enriched with particular isomers.
For pentaglycerol no individual peaks could be identified anymore. It should be noted however that
for the pentaglycerol, poor resolution and low peak intensity was observed as well. This is probably
due to the low concentration of this particular polyglycerol in the sample and its high molecular
weight.
Figure 20. Chromatogram of derivatised tetraglycerol obtained via fractionated distillation (Peak
identification : 1= tetraglycerol; 2 = pentaglycerol)
Another interesting observation with respect to the chromatogram shown in Figure 20, relates to the
fact that no clear separation was observed between the cyclic and linear isomers. A first explanation
is that due to the high number of cyclic isomers, their individual concentrations becomes so low that
they can not be detected. This is in correspondence with the lower intensity of the cyclic isomers of
di- and tri-glycerol detected. Another explanation is that the resolution power of the used column is
too low to resolve the cyclic and linear isomers form each other.
As a further elaboration of the gas chromatographic identification of polyglycerols, a sample was
analysed by cold column injection on a short capillary column. As can be observed from Figures 21
a-b, resolution of the isomers of the respective polyglycerols is decreased as could be expected. So

Chemical characterisation of complex plastic additives : polyglycerol esters 83
Chemical interactions between packaging materials and foodstuffs
this analytical approach is less appropriate if the presence of cyclic and branched di-and triglycerol
molecules should be investigated. Interestingly however and in contrast to the chromatogram
shown in Figure 16, it should be noted that the higher polyglycerols, up to heptaglycerol are much
better detected. This is probably due to the modified injection technique and the shorter column
used, making the gas chromatographic separation of these high boiling substances possible. It
should be emphasised that because of this additional chromatographic analysis, a clear qualitative
idea can be obtained about the presence of these higher polyglycerols in a particular sample. Since
the peak, probably corresponding to octaglycerol was not completely base line resolved, analysis up
to heptaglycerol was considered to be certainly feasible.
Figure 21a. Chromatogram of derivatised polyglycerol analysed on a short capillary column by on-
column injection (Peak identification : 1= diglycerol; 2 = triglycerol; 3 = tetraglycerol; 4 =
pentaglycerol; 5 = hexaglycerol; 6 = heptaglycerol: 7= octaglycerol)

Chemical characterisation of complex plastic additives : polyglycerol esters 84
Chemical interactions between packaging materials and foodstuffs
Figure 21b. Enlarged part of the chromatogram shown in Figure 21a. (Peak identification : 3 =
tetraglycerol; 4 = pentaglycerol; 5 = hexaglycerol; 6 = heptaglycerol; 7-octaglycerol)
2.3.3. Quantitative gas chromatographic analysis of polyglycerols
In order to allow quantitative analysis, an internal standard needed to be added to the sample.
Since polyalcohols were studied, preference was given to similar compounds like 1,2-propanediol,
mannitol, 1,5-pentanediol, arabitol and sorbitol. Only the latter seemed to be clearly distinguished
from all the other peaks present in a chromatogram resulting from the analysis of a typical
polyglycerol sample (Figure 16).
From the column chromatographic experiments, pure standards of tri- and tetraglycerol were
obtained from two polyglycerol samples. These were used together with pure standards of glycerol
and diglycerol in order to determine calibration curves, allowing a quantitative analysis of a
polyglycerol sample, within a concentration range of 0.1-1.5 mg.mL-1. Only the most abundant �,�-
and �,�-diglycerol isomers 7 and 8 were taken into account for the calculation of the diglycerol
calibration curve, since those were present in the standard with a calculated concentration of at least
95 percent. Similarly, for the triglycerols, the most abundant isomers 14, 15 and 16 were taken into
account. As no complete identification of the tetraglycerol isomers was achieved, all the peaks
within a certain retention time interval (19-21 min) were taken into account to calculate the
calibration line. Also the calibration line for each polyglycerol going through the origin is indicated
(Table 21). Remarkably, the tangents of the regression lines are gradually increasing if the

Chemical characterisation of complex plastic additives : polyglycerol esters 85
Chemical interactions between packaging materials and foodstuffs
polymerisation degree increases as well. Previously Sahasrabudhe (1967) observed the same
phenomenon for di- and triglycerol.
Table 21. Calibration curves (0.1-1.5 mg.mL-1) for the gas chromatographic analysis of polyglycerols,
using sorbitol as internal standard (X = area polyglycerol / area internal standard; Y =
concentration polyglycerol / concentration internal standard)
Type of
polyglycerol
Calibration curve r2
glycerol [31] Y = 1.0604 X + 0.0258
[32] Y = 1.0895 X
0.9905
0.9892
diglycerol [33] Y = 1.3307 X + 0.0376
[34] Y = 1.3894 X
0.9933
0.9903
triglycerol [35] Y = 2.3632 X + 0.0195
[36] Y = 2.4018 X
0.9923
0.9918
tetraglycerol [37] Y = 4.9521 X + 0.0065
[38] Y = 4.9052 X
0.9885
0.9884
cyclic diglycerol [39] Y = 1.2395 X *
cyclic triglycerol [40] Y = 1.8956 X *
* no correlation coefficients could be calculated since these equations were obtained by calculating the average of
equations [32] and [34] and of equations [34] and [36] respectively
From these results, the tangent of the calibration curves for cyclic di- and triglycerol isomers were
estimated as well, as explained in Table 21. This procedure was used because no pure standards of
the cyclic isomers were obtained. It should be realised that these values are estimates for all the
isomers together. Probably, the real coefficients will be different. In addition each of the individual
isomers could be characterised with a different coefficient as well.
In the following experiments the reliability of these calibration curves and the analytical method
were evaluated. This was achieved by analysing a known amount of several polyglycerol samples
coded as samples 001 to 004. The concentration of all the constituents was calculated based on the
proposed gas chromatographic analysis and calibration lines. By comparing the total sum of these
calculated concentrations with the actual amount of sample applied, an idea of the reliability of the
method could be obtained. The results of these experiments are summarised in Table 22. If the ratio
of the calculated total mass over the applied total mass is lower then one, then gas chromatographic

Chemical characterisation of complex plastic additives : polyglycerol esters 86
Chemical interactions between packaging materials and foodstuffs
method underestimates certain compounds present in the mixture and if the ratio is higher then
one, some compounds are overestimated.
Table 22. Analysis of polyglycerol samples obtained from fractionated distillation experiments
(higher polyglycerol concentrations in all samples were lower then 1 area percent and were not
taken into account ; all data are given in weight percent and are the average of two independent
measurements)
sample glycerol cyclic
diglycerol
linear
diglycerol
cyclic
triglycerol
linear
triglycerol
tetraglycerol ratio*
001 55.58 4.64 31.16 3.29 6.12 0.00 1.008
002 59.34 4.44 31.87 0.00 2.33 0.00 1.004
003 49.13 20.93 7.87 0.78 2.44 0.68 0.822
004 5.05 2.46 70.09 9.33 11.21 3.72 1.037
* ratio = ratio of the mass of sample present calculated from the amounts of the polyglycerols obtained from the gas
chromatographic analysis over the actual amount of sample applied; maximal standard deviation on calculated
polyglycerol mass amounted 0.035)
Considering the samples that were obtained from a distillate of synthetic mixtures containing
especially glycerol and diglycerol (samples 001 and 002), a very good agreement between the actual
applied amount of sample and the calculated amount of sample was obtained. No tetra- or higher
glycerols could be detected in these samples, which could be expected because of the
polymerisation reaction parameters applied. The low polymerisation degree is also proven by the
rather high concentrations of glycerol. Sample 003 contained appreciable amounts of cyclic
diglycerol. Remarkably, a serious underestimation of the calculated amount of polyglycerols
present in samples was obtained as well. This illustrates that equation [39] underestimates the cyclic
diglycerol content, which taking into account that the equation was obtained via interpolation, is
not surprising.
In order to check the reliability of the method for tri- and tetraglycerol, another synthesis was made
using more stringent polymerisation conditions to obtain a mixture containing higher amounts of
tetraglycerol. Unfortunately, the reaction mixture itself contained quite high amounts of other
higher polyglycerols as well (more then 10 % on area basis, results not shown). Because no
calibration curves for these species were available, a fractionated distillation experiment was
performed (240°C and 263 Pa, sample 004), reducing the content of higher polyglycerols up to 2%.
Again, the calculated amount of sample corresponded quite well to the actual amount present.

Chemical characterisation of complex plastic additives : polyglycerol esters 87
Chemical interactions between packaging materials and foodstuffs
As a conclusion, it can be stated that the proposed calibration lines and the used analytical method
are reliable to quantitatively estimate the concentration of non-cyclic polyglycerols up to
tetraglycerol in a sample. For the cyclic isomers, semi-quantitative data can be obtained.
2.3.4. Polyglycerol composition of polyglycerol fatty acid esters
In order to analyse the polyglycerol content of polyglycerol fatty acid esters, an isolation of the
polyglycerol fraction was necessary. It was therefore proposed to saponify the polyglycerol esters
liberating the polyglycerol moiety from them. Subsequently the polyglycerols should be isolated
from the reaction mixture to prepare them for gas chromatographic analysis.
Since glycerol is polymerised using alkaline catalysis it was checked if the saponification process
did not alter the polymerisation degree of a polyglycerol sample. Therefore, the saponification
procedure was applied on two polyglycerol samples and the composition of the resulting reaction
mixture was compared with the composition of the unsaponified samples. The results (Table 23)
indicate that for both investigated samples, no differences in the composition between the
saponified and unsaponified samples could be detected. It was concluded that the applied
saponification procedure did not induce any polymerisation or depolymerisation of the
polyglycerols. Therefore it is reasonable to conclude that by saponifying a polyglycerol fatty acid
ester and subsequent analysis of the polyglycerol moieties, compositional data of the polyglycerols
can be obtained which correspond with the polyglycerol content of the esters themselves.
Table 23. Polyglycerol content of virgin and saponified polyglycerols (given in area percent, based
on duplicate saponification experiments; average � standard deviation)
sample glycerol diglycerol triglycerol tetraglycerol
diglycerol-virgin 0.8 ± 0.8 97.4 ± 0.7 1.8 ± 0.1 0.0 ± 0.0
diglycerol-saponified 1.05 ± 0.45 96.7 ± 0.1 2.25 ± 0.55 0.0 ± 0.0
polyglycerol-virgin 0.0 ± 0.0 26.85 ± 0.45 50.0 ± 0.2 23.2 ± 0.7
polyglycerol-saponified 0.0 ± .0.0 26.75 ± 0.75 49.9 ± 0.4 23.35 ± 1.15
The following step consisted of analysing the polyglycerol content of polyglycerol fatty acid esters.
After saponification, the free fatty acids needed to be removed to avoid the presence of large peaks
due to palmitic and stearic trimethyl silyl derivatives in the chromatogram. Extraction with
petroleum ether after acidification of the reaction mixture was not successful. Precipitation of the
potassium salts of the free fatty acids by cooling the reaction mixture and subsequent filtration was

Chemical characterisation of complex plastic additives : polyglycerol esters 88
Chemical interactions between packaging materials and foodstuffs
found to be effective and easier. Thus the free fatty acids were almost completely removed (residual
concentration of about 1 to 2 percent palmitic and stearic acid on basis of their peak area).
Four different polyglycerol fatty acid esters were used for further analysis. The characteristics of
these polyglycerol fatty acid esters were summarised in Table 24. The first types of ester (samples
134 and 145) were synthesised from the triglycerol mixture, while the other samples (138 and 147)
were made from the polyglycerol mixture. The esters were also characterised by a different degree
of esterification.
Table 24. Characteristics of the synthesised polyglycerol fatty acid esters
sample type polyglycerol degree of esterification (%)*
134 triglycerol 32
145 triglycerol 48
138 polyglycerol 38
147 polyglycerol 48
* the degree of esterification is equal to the ratio of the esterified hydroxyl groups to the total amount of hydroxyl groups
present in the polyglycerol
After the saponification, the polymerisation degree of the polyglycerols was determined and
compared with the producers data of the original polyglycerols from which the esters were made.
For the first two types of polyglycerol fatty acid esters, with the lowest polymerisation degree
(samples 134 and 145), good agreement between the data from the analysis and from the producer
was obtained for all the polyglycerol species present (Table 25).
For the other two samples (138 and 147) fairly good agreement between the di- and triglycerol data
obtained from the producer and the analysis results could be observed. With regard to the
tetraglycerol content however, some remarkable differences could be seen between the producers
and the experimental data. Moreover, a striking difference in the experimental tetraglycerol content
of sample 138 and 147 could be observed as well, although the same type of polyglycerol was used
to prepare both esters.
As the polyglycerol sample from which esters 138 and 147 were synthesised, was still available for
analysis, its polyglycerol composition was determined to compare it with the other available data.
Better agreement between the diglycerol and triglycerol contents obtained from this analysis and
those obtained for the esters was observed. This was also the case with regard to the tetraglycerol

Chemical characterisation of complex plastic additives : polyglycerol esters 89
Chemical interactions between packaging materials and foodstuffs
content of sample 138. Comparing these results with the producers data, especially with regard to
the tetraglycerol content, remarkable differences were still observed. Therefore these latter data
were considered to be less reliable.
Table 25. Polyglycerol content of the synthesised polyglycerol fatty acid esters (in weight
percentages, based on independent triplicate measurements, a 95 % confidence interval (α<0.05)
was used for the statistical evaluation)
sample glycerol cyclic
diglycerol
diglycerol cyclic
triglycerol
triglycerol tetraglycerol
134 0.46 ± 0.05 0.85 ± 0.42 7.45 ± 0.30 1.00 ± 0.32 77.56 ± 2.31 12.69 ± 2.10
145 0.68 ± 1.02 1.61 ± 1.12 7.78 ± 0.64 1.55 ± 0.39 76.66 ± 2.72 11.72 ± 3.71
triglycerol* - 10 ± 6 > 80 10 ± 6
138 0.27 ± 0.20 0.88 ± 0.18 16.77 ± 0.76 0.56 ± 0.47 47.08 ± 1.79 34.43 ± 2.35
147 0.21 ± 0.26 2.28 ± 1.01 22.95 ± 0.37 0.25 ± 0.43 47.08 ± 3.07 27.23 ± 3.19
polyglycerol* - 15-30 33-55 10-25
polyglycerol§ 0.03 0.18 14.44 1.41 44.81 39.12
* producers data § gas chromatographic data, using calibration curves of Table 23
It seems that, probably due to the more stringent esterification procedure used for the synthesis of
ester 147, a depolymerisation of the polyglycerol occurred. This led to a degradation of tetraglycerol
and triglycerol. Consequently, a decrease in concentration of tetraglycerol and an increase of the
diglycerol concentration is expected. Indeed, although the diglycerol content of ester 138 was in
close agreement with the analysis data of the polyglycerol used for the synthesis of the ester, a
higher diglycerol content for the ester 147 was obtained, indicating a degradation reaction of the
polyglycerols leading to a considerably higher diglycerol content, as previously reported by
Charlemagne and Legoy (1995). This degradation reaction cannot be due to the previously applied
saponification procedure, as was proved before.
It can be concluded that the proposed method is able to determine the polymerisation degree of
polyglycerol fatty acid esters in a two-step procedure: saponification of the esters and a subsequent
gas chromatographic analysis of the isolated polyglycerols. Quantitative analysis up to the
tetraglycerols is possible, while qualitative data can be obtained using the modified gas
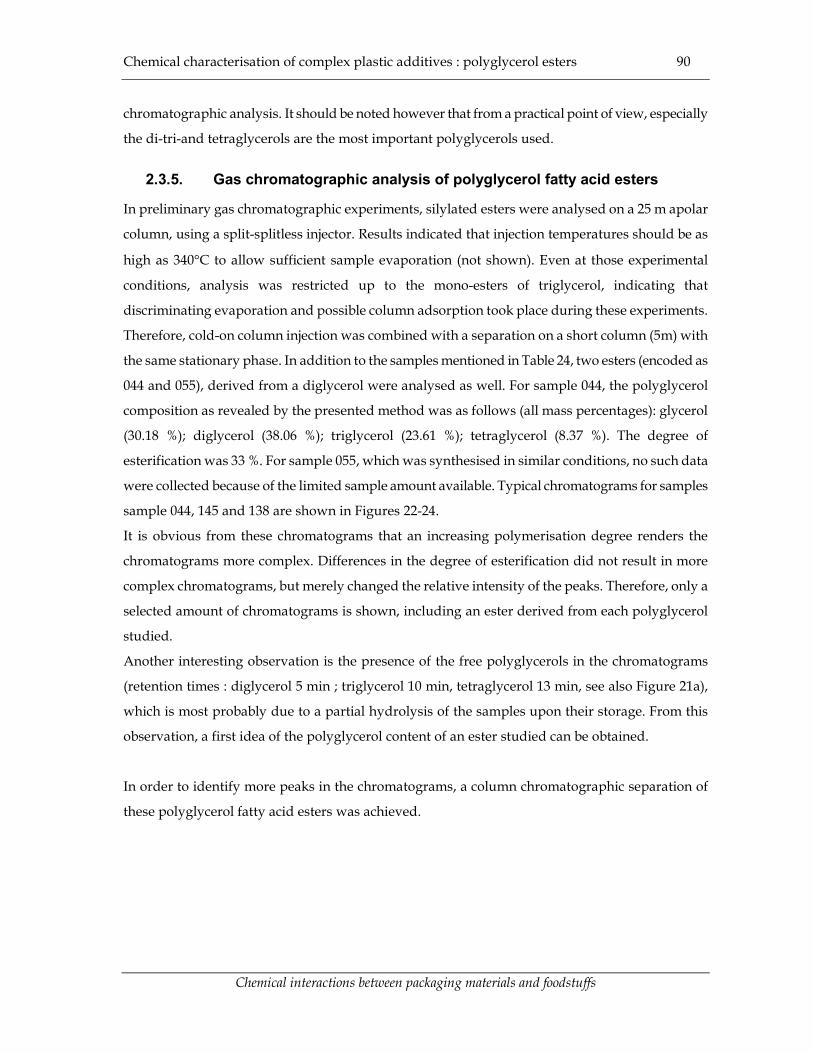
Chemical characterisation of complex plastic additives : polyglycerol esters 90
Chemical interactions between packaging materials and foodstuffs
chromatographic analysis. It should be noted however that from a practical point of view, especially
the di-tri-and tetraglycerols are the most important polyglycerols used.
2.3.5. Gas chromatographic analysis of polyglycerol fatty acid esters
In preliminary gas chromatographic experiments, silylated esters were analysed on a 25 m apolar
column, using a split-splitless injector. Results indicated that injection temperatures should be as
high as 340�C to allow sufficient sample evaporation (not shown). Even at those experimental
conditions, analysis was restricted up to the mono-esters of triglycerol, indicating that
discriminating evaporation and possible column adsorption took place during these experiments.
Therefore, cold-on column injection was combined with a separation on a short column (5m) with
the same stationary phase. In addition to the samples mentioned in Table 24, two esters (encoded as
044 and 055), derived from a diglycerol were analysed as well. For sample 044, the polyglycerol
composition as revealed by the presented method was as follows (all mass percentages): glycerol
(30.18 %); diglycerol (38.06 %); triglycerol (23.61 %); tetraglycerol (8.37 %). The degree of
esterification was 33 %. For sample 055, which was synthesised in similar conditions, no such data
were collected because of the limited sample amount available. Typical chromatograms for samples
sample 044, 145 and 138 are shown in Figures 22-24.
It is obvious from these chromatograms that an increasing polymerisation degree renders the
chromatograms more complex. Differences in the degree of esterification did not result in more
complex chromatograms, but merely changed the relative intensity of the peaks. Therefore, only a
selected amount of chromatograms is shown, including an ester derived from each polyglycerol
studied.
Another interesting observation is the presence of the free polyglycerols in the chromatograms
(retention times : diglycerol 5 min ; triglycerol 10 min, tetraglycerol 13 min, see also Figure 21a),
which is most probably due to a partial hydrolysis of the samples upon their storage. From this
observation, a first idea of the polyglycerol content of an ester studied can be obtained.
In order to identify more peaks in the chromatograms, a column chromatographic separation of
these polyglycerol fatty acid esters was achieved.

Chemical characterisation of complex plastic additives : polyglycerol esters 91
Chemical interactions between packaging materials and foodstuffs
Figure 22. Gas chromatogram of derivatised polyglycerol fatty acid 044
Figure 23. Gas chromatogram of derivatised polyglycerol fatty acid ester 145
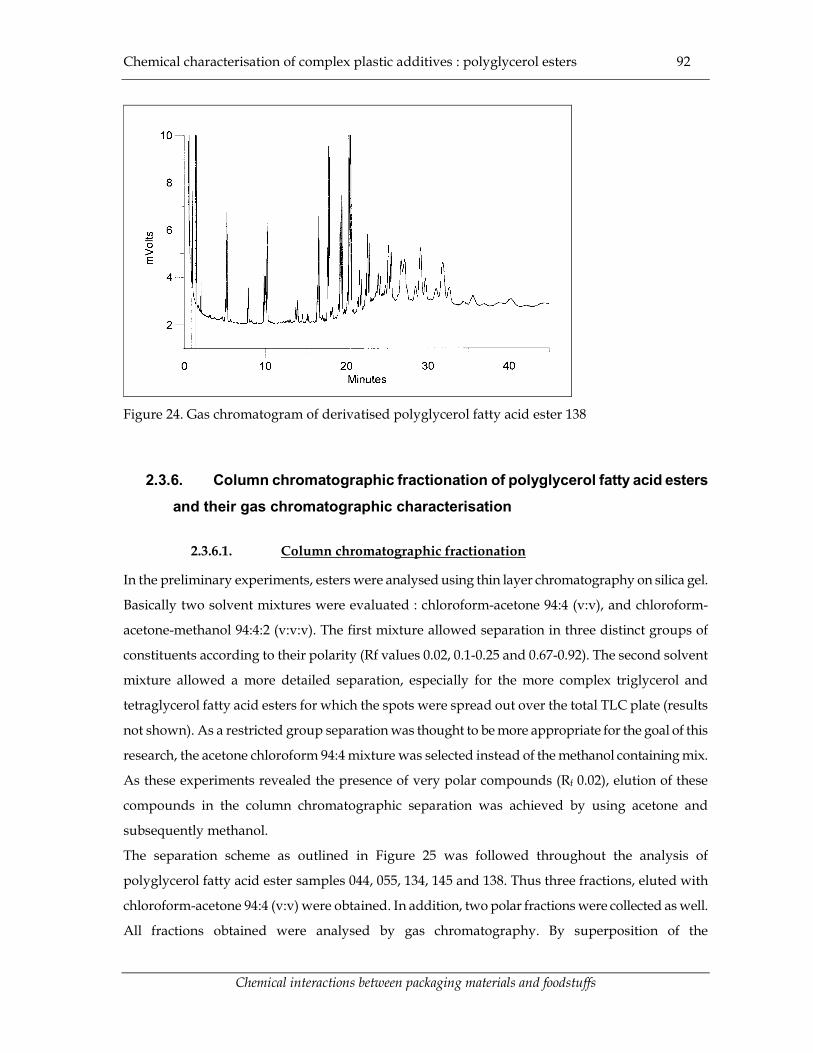
Chemical characterisation of complex plastic additives : polyglycerol esters 92
Chemical interactions between packaging materials and foodstuffs
Figure 24. Gas chromatogram of derivatised polyglycerol fatty acid ester 138
2.3.6. Column chromatographic fractionation of polyglycerol fatty acid esters and their gas chromatographic characterisation
2.3.6.1. Column chromatographic fractionation
In the preliminary experiments, esters were analysed using thin layer chromatography on silica gel.
Basically two solvent mixtures were evaluated : chloroform-acetone 94:4 (v:v), and chloroform-
acetone-methanol 94:4:2 (v:v:v). The first mixture allowed separation in three distinct groups of
constituents according to their polarity (Rf values 0.02, 0.1-0.25 and 0.67-0.92). The second solvent
mixture allowed a more detailed separation, especially for the more complex triglycerol and
tetraglycerol fatty acid esters for which the spots were spread out over the total TLC plate (results
not shown). As a restricted group separation was thought to be more appropriate for the goal of this
research, the acetone chloroform 94:4 mixture was selected instead of the methanol containing mix.
As these experiments revealed the presence of very polar compounds (Rf 0.02), elution of these
compounds in the column chromatographic separation was achieved by using acetone and
subsequently methanol.
The separation scheme as outlined in Figure 25 was followed throughout the analysis of
polyglycerol fatty acid ester samples 044, 055, 134, 145 and 138. Thus three fractions, eluted with
chloroform-acetone 94:4 (v:v) were obtained. In addition, two polar fractions were collected as well.
All fractions obtained were analysed by gas chromatography. By superposition of the

Chemical characterisation of complex plastic additives : polyglycerol esters 93
Chemical interactions between packaging materials and foodstuffs
chromatograms of the different fractions and comparison with those of the original samples, it
could be concluded that qualitatively, all kind of compounds eluted from the column. In the
following, additional details about the gas chromatographic analysis of these fractions will be given.
sample(200 mg, 10% on SiO2)
chloroform-aceton (96:4)
fraction 1(0-480 ml)
- di-esters diglycerol- esters cyclic diglycerol
fraction 3(750-1150 ml)
di-esters triglycerol
fraction 4(1150-1650 ml)
mono-esters diglycerol
aceton
fraction 5(1650-2150 ml)
- fatty acids- glycerols- mono-esters tri-and
tetraglycerol
methanol
mono-esters triglycerol LC separation
Figure 25. Fractionation scheme followed for the isolation of chromatographically pure polyglycerol
fatty acid esters
2.3.6.2. Gas chromatographic analysis of fractions 1-2
2.3.6.2.1. Di-esters of non cyclic diglycerol
The chromatogram of fraction 1 obtained from sample 055 is given in Figure 26, indicating two
distinct peak groups at respectively 14.5-16.5 and 22-27 min. For sample 044, the first eluting group
in this fraction was not intense. Polyglycerol analysis revealed the presence of diglycerol as
principle component together with an earlier eluting compound, which presently could not be
identified. Again in sample 044, this unidentified peak was not so intense compared to sample 055
(not shown). Similar results were obtained for the esters 134 and 145 (not shown).
Because of the results of the polyglycerol analysis it was concluded that fraction 1 contained
particularly esters derived from diglycerol. Considering the major peaks in this fraction (Figure 26,
triplets between 22-27 min), it was concluded that these were di-esters of diglycerol. This is based
on their low polarity (early elution during LC prefractionation) and their lower concentration in the
original sample compared to the earlier eluting peaks (Figure 22, moderate degree of esterification).
Final certitude was obtained from LC-MS experiments. In Table 26, mass spectral data of a number
of fractionated samples are summarised. As can be seen, fraction 1 of sample 044 seemed to be
composed essentially of diglycerol di-esters. As stearic acid is the most abundant fatty acid (60%) in

Chemical characterisation of complex plastic additives : polyglycerol esters 94
Chemical interactions between packaging materials and foodstuffs
this sample, the triplet with the highest intensity, eluting at 26.5-27 min, correspond to the C18:0-
C18:0 di-esters. The triplet eluting before is most probably due to the C16:0-C18:0 di-esters, while
the C16:0-C16:0 di-ester triplet is only present in small quantities.
Figure 26. Gas chromatogram of fraction 1 isolated from sample 055 after trimethyl silyl
derivatisation
Two possible explanations can be given why the di-esters of diglycerol elute as triplets.
A first possibility is the presence of various place isomers of the ester. Out of diglycerol 7, four
different di-stearic-diglycerol esters can be obtained. Preliminary gas chromatographic experiments
with a mixture of palmitic and stearic di-acyl glycerol revealed that the chromatographic set-up
used, was able to separate the 1,2- and 1,3-di-acyl glycerol from each other. So a similar separation
of diglycerol di-esters could be possible as well. Of course, in case of a complete separation, four
peaks should be distinguished, while in the experiments presented, only three different peaks could
be observed. This could be explained by a co-elution of the peaks or to a too low concentration of
one of the isomers. It should be noted as well that only one diglycerol isomers is considered, while
in fact three non-cyclic isomers are present (Figures 14 and 17). So in fact more complex
chromatograms could be expected if this hypothesis is accepted.
A second possible explanation could be the presence of di-esters of three non-cyclic diglycerol
isomers. This would imply that no separation of the place isomers of the various di-esters of a
particular diglycerol isomer is achieved. If the relative intensity of the peaks is considered in this

Chemical characterisation of complex plastic additives : polyglycerol esters 95
Chemical interactions between packaging materials and foodstuffs
case, it would imply that the relative concentration of the �,�-diglycerol 9 is relatively high, which is
not in correspondence with the results of the polyglycerol analysis.
Table 26. Mass spectral data of isolated liquid chromatographic fractions
M+23.e-1 Relative intensity Identification
Fraction 1 – sample 044
721.5 100 C18:0 – C18:0 di-esters diglycerol
693.5 38 C16:0 – C18:0 di-esters diglycerol
681.5 18 unknown
455.30 12 C18:0 mono-esters diglycerol
777.60 10 C20:0 – C20:0 di-esters diglycerol
Fraction 3 – Sample 134
823.6 100 C18:0 – C20:0 di-esters triglycerol
851.6 87 C20:0 – C20:0 di-esters triglycerol
795.50 38 C18:0 – C18:0 di-esters triglycerol
767.50 7 C16:0 – C18:0 di-esters triglycerol
Fraction 4 – sample 044
455.30 100 C18:0 mono-esters diglycerol
427.20 14 C16:0 mono-esters diglycerol
795.60 6 C18:0 – C18:0 di-esters triglycerol
Fraction isolated from chromatographic separation of fraction 5, sample 134 (10-35 mL)
529.30 100 C18:0 mono-esters triglycerol
501.30 56 C16:0 mono-esters triglycerol
603.4 8 C18:0 mono-esters tetraglycerol
557.30 7 C20:0 mono-esters triglycerol
473.30 7 C14:0 mono-esters triglycerol
In a supplementary column chromatographic separation of this fraction (2.125 g 5% inactivated
silica, 1.2 cm ID, chloroform-acetone 94:4 (v:v)), it was revealed that in the more apolar fractions, the
highest peak of each triplet (Figure 26) was dominantly present, while in the more polar fractions,
the central peak of each triplet became dominant. Both hypothesises explained above, fit in these
Chemical characterisation of complex plastic additives : polyglycerol esters 96
Chemical interactions between packaging materials and foodstuffs
observations : place isomers of di-acyl glycerol could be separated in a similar way and it can be
supposed that also an analogue separation is possible for the di-esters of the various diglycerol
isomers as well.
Since both hypotheses have some inconsistencies, total certitude about the complete identification
on the isomer level of these di-esters of diglycerol is not possible.
2.3.6.2.2. Esters of cyclic di-glycerol
In addition to the non-cyclic diglycerol esters, esters of an unidentified alcohol seemed to be present
as well (Figure 26, 14.5-16 min). Polyglycerol analysis revealed that the unidentified alcohol eluted
between glycerol and the non-cyclic diglycerol isomers. Probably this unidentified peak can be
attributed to cyclic diglycerol isomers, because its elution behaviour is in correspondence with the
earlier reported observations of the gas chromatographic separation of diglycerol isomers (Figure
17). Because the esters were collected in the first (apolar) fraction of the column chromatographic
separation of the total sample, it was supposed that those were di-esters of cyclic diglycerol.
Analysing this fraction by gas chromatography without silylation, remarkable differences of the
peaks of interest (14.5-16 min) were observed compared to the chromatogram shown in Figure 26 :
peaks eluted a bit earlier and even more important, the number of peaks and their relative intensity
changed dramatically (Figure 27). These observations indicate that the compounds considered can
be silylated, implementing the presence of a free hydroxyl group. Considering the various possible
cyclic diglycerol isomers (Figure 14), it is obvious that di-esters cannot contain a free hydroxyl
group. Consequently, the compounds considered are mono-esters of cyclic diglycerol instead of di-
esters of diglycerol.
This hypothesis is in correspondence with the results obtained in a supplementary TLC separation
of this fraction (hexane-ethyl acetate 1:1 (v:v)) in two spots with a totally different polarity (Rf 0.24
and 0.62). Gas chromatographic analysis of the polar spot revealed the presence of the compounds
considered in addition to the peaks attributable to the di-esters of diglycerol.
Additional information with regard to the fatty acid composition of each ester eluting in the
chromatogram shown in Figure 26 can be obtained as well. Considering the differences in peak
intensity of the two couples of peaks (14.5-16.5 min), the elution order and the fatty acid
composition of the total sample (C18:0 : 82 %; C16:0 : 16%) it can be concluded that the most intense
couple is due to the stearic acid mono-esters and the other couple to the palmitic esters. The fact that
only couples are observed for each ester, despite of the high number of cyclic diglycerol isomers
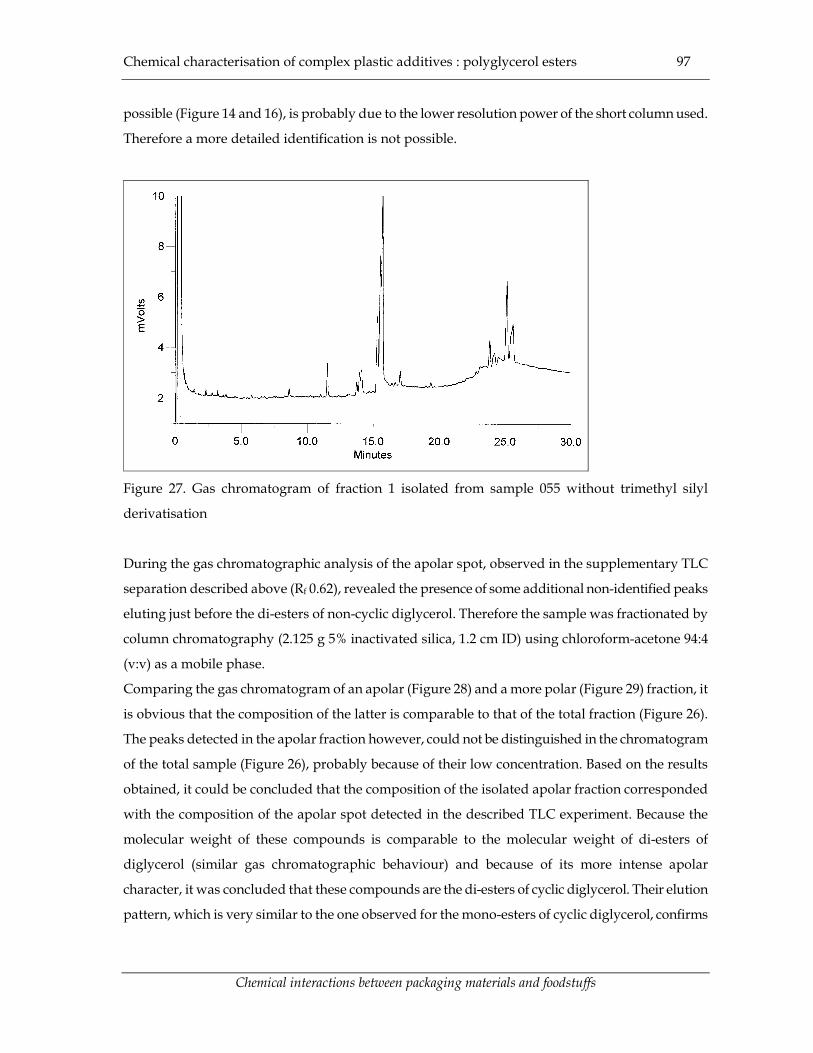
Chemical characterisation of complex plastic additives : polyglycerol esters 97
Chemical interactions between packaging materials and foodstuffs
possible (Figure 14 and 16), is probably due to the lower resolution power of the short column used.
Therefore a more detailed identification is not possible.
Figure 27. Gas chromatogram of fraction 1 isolated from sample 055 without trimethyl silyl
derivatisation
During the gas chromatographic analysis of the apolar spot, observed in the supplementary TLC
separation described above (Rf 0.62), revealed the presence of some additional non-identified peaks
eluting just before the di-esters of non-cyclic diglycerol. Therefore the sample was fractionated by
column chromatography (2.125 g 5% inactivated silica, 1.2 cm ID) using chloroform-acetone 94:4
(v:v) as a mobile phase.
Comparing the gas chromatogram of an apolar (Figure 28) and a more polar (Figure 29) fraction, it
is obvious that the composition of the latter is comparable to that of the total fraction (Figure 26).
The peaks detected in the apolar fraction however, could not be distinguished in the chromatogram
of the total sample (Figure 26), probably because of their low concentration. Based on the results
obtained, it could be concluded that the composition of the isolated apolar fraction corresponded
with the composition of the apolar spot detected in the described TLC experiment. Because the
molecular weight of these compounds is comparable to the molecular weight of di-esters of
diglycerol (similar gas chromatographic behaviour) and because of its more intense apolar
character, it was concluded that these compounds are the di-esters of cyclic diglycerol. Their elution
pattern, which is very similar to the one observed for the mono-esters of cyclic diglycerol, confirms

Chemical characterisation of complex plastic additives : polyglycerol esters 98
Chemical interactions between packaging materials and foodstuffs
this hypothesis. Of course, in this case three doublets are observed, corresponding respectively to
the C16:0-C16:0, C16:0-C18:0 and C18:0-C18:0 di-esters.
Figure 28. Gas chromatogram of a derivatised fraction isolated by column chromatographic
separation of fraction 1 of sample 044 (6-8 mL) containing di-esters of cyclic diglycerol
Figure 29. Gas chromatogram of a of derivatised fraction isolated by column chromatographic
separation of fraction 1 of sample 044 (18-20 mL) containing di-esters of non-cyclic diglycerol
isomers

Chemical characterisation of complex plastic additives : polyglycerol esters 99
Chemical interactions between packaging materials and foodstuffs
It should be noted that confirmation of these assumptions with regard to the identification of esters
of cyclic diglycerol by mass spectral data was impossible because of the low concentrations of these
compounds.
Finally, fraction 2 revealed the presence of mono-palmitine and mono-stearine glycerol (12.5-14.5
min), as confirmed by the injection of pure standards. These mono-acyl glycerols were only present
in minor quantities in samples 044 and 055. The presence of di-esters of diglycerol could be
observed as well in this fraction.
2.3.6.3. Gas chromatographic analysis of the other fractions
2.3.6.3.1. Di-esters of triglycerol
The chromatogram obtained from the third fraction of sample 044 and 055 revealed the presence of
mono-acyl glycerols. For the triglycerol derived ester however, only the peaks eluting between 26-
34.5 min (Figure 23) were observed. As can be seen from Figure 23, groups of triplets can be
differentiated. Polyglycerol analysis revealed the presence of triglycerol and its branched isomers
(not shown). Because the isolated components were more polar compared to the di-esters of
diglycerol, it was supposed that di-esters of triglycerol were isolated. This hypothesis was
confirmed by the LC-MS data (Table 26). These indicated that especially esters of C20:0 were
present, which is quite surprising since C20:0 was only present in minor quantities (2% w:w) in the
original ester. A possible explanation for this observation will be presented later (paragraph
2.3.6.3.3). Despite this inconsistency, it can be supposed that the last eluting triplet is due to the di-
esters of the most abundant fatty acid (C18:0). Similar as for the di-esters of diglycerol, the earlier
eluting groups of peaks are the C16:0-C18:0 and the C16:0-C16:0 di-esters of triglycerol.
Identification of the place isomers is even more complex compared to the di-esters of diglycerol and
was therefore considered as impossible.
It can be observed from the total chromatogram of the polyglycerol ester studied (Figure 24), that
the di-esters of triglycerol are the last eluting components that are clearly resolved. Peaks eluting at
higher retention times could be observed, but these were broad and low in intensity. Most probably
these are originating from di-esters of tetraglycerol. They are not due to for example tri-esters of
diglycerol, since these should then also be present in the first fraction collected during the column
chromatographic separation because of their low polarity, which was not the case. Consequently,
the proposed gas chromatographic technique is restricted up to the analysis of di-esters of
triglycerol. In order to enlarge the scope of the presented method, an alternative stationary phase,
Chemical characterisation of complex plastic additives : polyglycerol esters 100
Chemical interactions between packaging materials and foodstuffs
which can be used at even higher temperatures as the ones used in this research, could be applied
although possibly liquid chromatographic separation would probably become more appropriate.
2.3.6.3.2. Mono-esters of non-cyclic diglycerol
Further elution with chloroform-acetone 94:4 (v:v) was not useful, since no components could be
detected in the eluate. Therefore the polarity of the mobile phase was drastically increased. By
eluting with acetone, a fourth fraction was obtained. For the diglycerol fatty acid esters (samples
044-055), the only peaks observed were those eluting between 16 and 17.5 min (Figure 22) Because
of the fairly high polarity of these compounds and their abundance in the original sample, it was
supposed that these were the mono-esters of diglycerol. This supposition could be confirmed based
on the polyglycerol analysis (not shown) and on the LC-MS data obtained for this particular fraction
(Table 26). Consequently it can be concluded that from this fraction, pure mono-esters of diglycerol
were isolated. The two major couple of peaks in the gas chromatogram are respectively due to the
stearic ester (most intense, Figure 22, 17.5 min) and palmitic ester of diglycerol, which is in
correspondence with their elution behaviour and fatty acid composition.
As can observed, the mono-esters of diglycerol did not elute as one single peak. In order to have a
better idea about the identity of each peak, a supplementary separation of this fraction was
achieved using a longer column (Figure 30). Five peaks could be distinguished for each ester. Three
major peaks (peaks 3-5 for stearic acid ester, Figure 30) of which two form a couple with equal
intensity and two minor peaks (peaks 1-2 for stearic acid ester, Figure 30). For the palmitic acid
esters, the same pattern is repeated at an earlier elution time (Figure 30, 22.8 min-23.3 min). Of
course, due to the lower concentration, smaller peaks become more difficult to detect.
Again the question arises whether these peaks can be identified. Therefore, an idea about the
possible isomers of mono-esters of diglycerol should be obtained. Isomers differing in the place of
esterification and in the type of diglycerol isomer should be distinguished, giving rise to six
different esters out of one single fatty acid (Figure 31). Since the �,�-diglycerol 7 is the most
abundant and the �-hydroxyl group has the highest reactivity due to the low steric hindrance, the
most abundant peak 5 (Figure 30) could be attributed to isomer 22.
From the analysis of a mono-acyl glycerol sample under the same experimental conditions, it was
revealed that the 2-acyl glycerol eluted before the 1-acyl glycerol and that the difference in retention
time amounted 0.27 min. This is correspondence with the difference in retention time between

Chemical characterisation of complex plastic additives : polyglycerol esters 101
Chemical interactions between packaging materials and foodstuffs
peaks 5 and 3 (0.27 min). Therefore, probably peak 3 is due to the �,�-diglycerol esterified on the �-
hydroxyl group, corresponding to isomer 23.
Figure 30. Gas chromatographic analysis of the derivatised fraction 4 of sample 044 on a long
capillary column (25m). Peaks represent stearic esters of diglycerol as shown in Figure 28 (1. ester
24, 2. ester 26, 3. ester 23, 4. esters 25 and 27, 5. ester 22)
HO OHO
OHOHO O OOH OH
OH
OO
OHHO
2422
25
R
O HO O OHO OH
23
O
RR
O
R
OHO
HOO
OH
O
HO
OH
OO
HOO
R
OR
26 27 Figure 31. Possible isomers of mono-esters of diglycerol
Remarkably, it can be observed that the retention time difference between peak 4 and peak 5 (0.20
Chemical characterisation of complex plastic additives : polyglycerol esters 102
Chemical interactions between packaging materials and foodstuffs
min) is very similar to the retention time difference observed earlier between the �,�-diglycerol 7
and the �,�-diglycerol 8 (Figure 17, 0.19 min) in similar experimental conditions. Therefore it seems
logic to assume that peak 4 originates from the isomers 25 and 27, which would then co-elute. It is
interesting to stress in this respect that peaks 3 and 4 have an almost equal intensity, although peak
3 is due an ester of the most abundant �,�-diglycerol 7. Since peak 4 would be due to the co-elution
of two esters derived from the less abundant �,�-diglycerol 8, its intensity is increased and seems to
become comparable with the intensity of peak 3.
Similar to the shift observed between isomer 22 and isomer 23, a shift of 0.29 min is observed
between peak 4 (�,�-diglycerol esters 25 and 27) and peak 2. This indicates that peak 2 is probably
due to the �,�-diglycerol esterified on the �-hydroxyl group (isomer 26). Finally, the remaining peak
1, should be isomer 24, which is only present in very low concentration, because of the low
concentration of the �,�-diglycerol 9.
So despite the complexity of the chromatogram obtained, a possible identification of the various
mono-esters of diglycerol can be presented. This is based on the chromatographic behaviour of the
analogue mono-acyl glycerol isomers combined with the previously reported chromatographic data
on non-cyclic diglycerol isomers. Validation of these logic assumptions was not feasible because no
pure standards of each isomer could be obtained.
Comparing the more detailed chromatogram of Figure 30, with the one obtained on a shorter
column (Figure 22), it is obvious that in the latter case, peak resolution is not as good as in the
former case. Despite this fact however, it can be concluded that also in the latter chromatogram
information about the various isomers of the di-esters of non cyclic diglycerol can be obtained since
probably peaks 3 and 4 (Figure 30) will co-elute as one single peak, eluting just in front of the most
intense peak (Figure 22), corresponding to peak 5 in Figure 30.
2.3.6.3.3. Mono-esters of triglycerol
In the acetone fraction of the tri- and polyglycerol esters, similar peaks were observed as those
present in fraction 3. Polyglycerol analysis proved that both di-and triglycerol were present in this
fraction. Because of the earlier observations, it could be concluded that mono-esters of diglycerol
were present together with the di-esters of triglycerol. Consequently, it should be concluded that
the chloroform-acetone mixture was not able to elute the di-esters of triglycerol and the mono-esters
of diglycerol completely. This indicates that this particular solvent mixture is able to fractionate for

Chemical characterisation of complex plastic additives : polyglycerol esters 103
Chemical interactions between packaging materials and foodstuffs
example the di-esters of triglycerol according to their polarity. Possibly this could be the reason why
in the LC-MS data obtained for the isolated di-esters of triglycerol (Table 26), the fatty acid
composition is not completely in correspondence with the actual fatty acid composition of the
sample, since probably some fractionation occurred due to the use of the chloroform-acetone
mixture (see also paragraph 2.3.6.3.1).
Apart from free glycerols and fatty acids, mono-esters of triglycerol and tetraglycerol were expected
to be present as well in the more polar fractions originating from the tri-and polyglycerol esters.
However, because they were not observed in the isolated fractions, an even more polar solvent
(methanol) was selected for further elution. Thus total striping of the column was probably
achieved since for all samples, the different glycerols, which are the most polar constituents in the
samples, were present in this supplementary fraction. In addition, palmitic and stearic acid were
detected as well in all samples. For the diglycerol esters, especially the compounds present in
fraction 4 were detected.
For the triglycerol esters however, dominating presence of the peaks eluting at 19-21 min could be
revealed (Figure 23). As this fifth fraction seemed to contain a major compound, which was not
isolated yet, a supplementary column chromatographic separation was achieved for this fraction
after precipitation of the fatty acids by cooling (5.25g silica, 5% inactivated, 1.2 cm ID, ethyl acetate-
isopropanol-water 5:2:1 (v:v:v)). The dominating peaks present in fraction 5 of sample 134 (similar
as those present in sample 138, Figure 23 and 23, 19-21 min), were purely present in the volume
fraction 10-35 mL (chromatogram not shown). Again polyglycerol analysis revealed the presence of
triglycerol and its branched isomers (not shown). These chromatographic data support the
hypothesis that the isolated substances are the mono-esters of triglycerol. This could be confirmed
again by the LC-MS data obtained (Table 26).
Similarly to the other esters already discussed, a clear separation in couples of peaks can be
observed depending on the fatty acid present in the ester. Separating these mono-esters on a longer
capillary column to gather more information about the presence of particular isomers, was not
achievable because of the low peak intensity, probably due to the high molecular weight of the
compounds considered. Despite this fact and the high number of possible isomers it can be
assumed, based on the identification of the mono-esters of diglycerol presented above, that the
peaks with the highest intensity are the esters of �,�,�-triglycerol 14, esterified on the � position.
Probably the mono-esters of tetraglycerol should be present as well in this last fraction, but they
Chemical characterisation of complex plastic additives : polyglycerol esters 104
Chemical interactions between packaging materials and foodstuffs
could not be detected in the gas chromatogram, probably due to their low concentration. Presence
of these esters in this last fraction was confirmed by fractionation of sample 134 (Table 26). Attempts
to isolate the pure mono-esters of tetraglycerol using a similar column chromatographic separation
as described above failed.
2.3.6.4. Conclusion : gas chromatographic analysis of polyglycerol samples
From the above-described column chromatographic separation, the isolation of pure mono- and di-
esters of respectively di-and triglycerol is possible. This is an essential step in the development of a
quantitative analytical method for the analysis of polyglycerol esters as illustrated for the
quantitative analysis of polyglycerols. Although mono-esters of tetraglycerol could not be isolated
as such, their localisation in the chromatograms from samples 138 and 147 was possible because all
the other peaks could be identified as shown in Figure 32.
The broad and not intense peaks eluting at the end of the chromatogram, are probably due to the
di-esters of tetraglycerol. From this chromatogram and the earlier discussed results, it becomes clear
that the following esters co-eluted during the gas chromatographic experiments : di-esters of
diglycerol and di-esters of triglycerol, di-acyl glycerols and mono-esters of di-and triglycerol, di-
esters of diglycerol and mono-esters of tetraglycerol. This co-eluting behaviour would even be more
emphasised if other fatty acids would be used (in a higher extend) in the manufacture of the
polyglycerol fatty acid esters (e.g. C14:0 and C20:0). Thus it can be concluded that a single
chromatographic analysis of a polyglycerol sample is not sufficient to get complete compositional
information. Despite these disadvantages, the method presented allows to have a clear idea about
the concentration of polyglycerol esters of major importance.

Chem
ical characterisation of complex plastic additives : polyglycerol esters
105
Chemical interactions betw
een packaging materials and foodstuffs
Figure 32. C
hromatogram
of the derivatised polyglycerol fatty acid ester 138 identifying the various
compounds present in the sam
ple.
~ 0 > E
12
10
8 --
6-
4
2--
0
polyglycerols (up to tetraglycerol)
5.0 10.0 I
15.0
I mono-esters diglycerol
~ I mono-esters triglycerol ~
20.0
mono-esters tetraglycerol di-esters
diglycerol
25.0 Minutes
di-esters triglycerol
30.0 35.0
di-esters tetraglycerol
40.0 45.0

Chemical characterisation of complex plastic additives : polyglycerol esters 106
Chemical interactions between packaging materials and foodstuffs
2.3.7. Proposed analytical scheme for the analysis of polyglycerol fatty acid esters
Since the gas chromatographic analysis is not sufficient to gather complete analytical data about the
composition of polyglycerol esters, essentially because of co-elution of several compounds, a
prefractionation scheme as outlined in Figure 33 can be proposed. In a first fraction, eluted with
chloroform-acetone 94:4 (v:v), apolar compounds up to di-esters of diglycerol can be isolated (e.g.
di-acyl glycerols, tri-acyl glycerols). Afterwards, acetone elution isolates di-esters of triglycerol
(partially) and mono-esters of diglycerol (completely). Finally a methanol elution allows isolation of
other mono-esters and the remaining di-esters of triglycerol. These isolated fractions can
subsequently be analysed gas chromatographically without any risk of interfering peaks. In
combination with the results of a polyglycerol analysis and some additional chemical analyses, a
total analytical scheme for the characterisation of polyglycerol fatty acid esters is proposed.
sample saponification and polyglycerol analysis
total GC analysis
LC separation
di-esters diglycerol
GC-analysis di-esters triglycerolmono-esters diglycerol
mono-esters triglycerolmono-esters tetraglycerol
GC-analysis GC-analysis
fatty acid analysissaponification value*acetyl value**determination of the degree of esterification
Figure 33. Proposed analytical scheme for the analysis of polyglycerol fatty acid esters

Bisphenol A antigen and antibody production 109
Chemical interactions between packaging materials and foodstuffs
3. Bisphenol A antigen and antibody production
3.1. Introduction
3.1.1. Selected research strategy
As can be concluded from the general review presented in the first chapter, the traditional analytical
methods to study migration are quite instrumental. One of the goals of the presented research was
to evaluate the usefulness of immunochemical methods to study migration. Immunochemical
methods have some major advantages compared to instrumental analytical techniques as already
mentioned before (paragraph 1.4.2) : no need for expensive chromatographic and spectrometric
equipment, high sample throughput, avoidance or restriction of sample clean-up, high sensitivity.
Therefore the use of immunochemical methods in food analysis is so well documented.
Immunochemical techniques are based on the molecular recognition between the analyte and an
antibody. Therefore, such methods could have particular potential in specific migration analysis.
Bisphenol A was selected as a model compound. This selection was mainly based on the following
criteria. First of all, bisphenol A is an important monomer for the production of high quality food
contact materials as already emphasised before (see paragraph 1.2.6.5.2). In addition, bisphenol A
has an interesting toxicity profile, which will be shortly presented in paragraph 3.1.2.
Development of immunochemical methods for bisphenol A, necessitates the production of
bisphenol A specific antibodies. The most convenient way to achieve this is to induce the
production of polyclonal antibodies in a host animal. Therefore, its immune system should be
exposed to so-called immunogens or immunizing antigens. An antigen is traditionally regarded as a
molecule evoking an immune response, like for example antibody production. On the other hand,
the term antigen is also used to denote molecules to which antibodies bind, in for example an
immunoassay. A molecule with intrinsic structural complexity, such as a protein or a
polysaccharide, is considered to be highly immunogenic if its molecular weight exceeds 10 000
(Catty, 1988). Smaller molecules are in general non immunogenic. However, by coupling these
haptens to a macromolecule (the carrier), they can be made immunogenic. This phenomenon
allowed the development of immunoassays to quantify different kinds of low molecular weight
molecules (Mäkela and Seppälä, 1986). Because bisphenol A is not immunogenic, it needs to be
coupled to a carrier to generate bisphenol A specific antibodies in a host animal. This may require
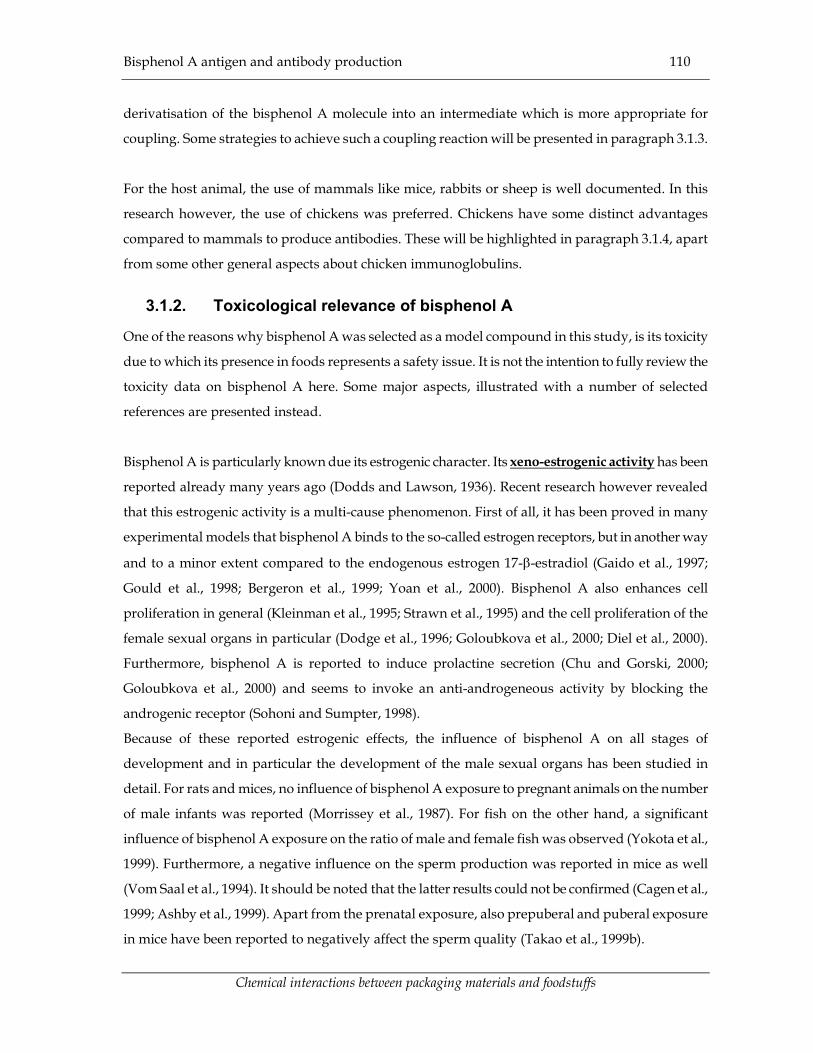
Bisphenol A antigen and antibody production 110
Chemical interactions between packaging materials and foodstuffs
derivatisation of the bisphenol A molecule into an intermediate which is more appropriate for
coupling. Some strategies to achieve such a coupling reaction will be presented in paragraph 3.1.3.
For the host animal, the use of mammals like mice, rabbits or sheep is well documented. In this
research however, the use of chickens was preferred. Chickens have some distinct advantages
compared to mammals to produce antibodies. These will be highlighted in paragraph 3.1.4, apart
from some other general aspects about chicken immunoglobulins.
3.1.2. Toxicological relevance of bisphenol A
One of the reasons why bisphenol A was selected as a model compound in this study, is its toxicity
due to which its presence in foods represents a safety issue. It is not the intention to fully review the
toxicity data on bisphenol A here. Some major aspects, illustrated with a number of selected
references are presented instead.
Bisphenol A is particularly known due its estrogenic character. Its xeno-estrogenic activity has been
reported already many years ago (Dodds and Lawson, 1936). Recent research however revealed
that this estrogenic activity is a multi-cause phenomenon. First of all, it has been proved in many
experimental models that bisphenol A binds to the so-called estrogen receptors, but in another way
and to a minor extent compared to the endogenous estrogen 17-�-estradiol (Gaido et al., 1997;
Gould et al., 1998; Bergeron et al., 1999; Yoan et al., 2000). Bisphenol A also enhances cell
proliferation in general (Kleinman et al., 1995; Strawn et al., 1995) and the cell proliferation of the
female sexual organs in particular (Dodge et al., 1996; Goloubkova et al., 2000; Diel et al., 2000).
Furthermore, bisphenol A is reported to induce prolactine secretion (Chu and Gorski, 2000;
Goloubkova et al., 2000) and seems to invoke an anti-androgeneous activity by blocking the
androgenic receptor (Sohoni and Sumpter, 1998).
Because of these reported estrogenic effects, the influence of bisphenol A on all stages of
development and in particular the development of the male sexual organs has been studied in
detail. For rats and mices, no influence of bisphenol A exposure to pregnant animals on the number
of male infants was reported (Morrissey et al., 1987). For fish on the other hand, a significant
influence of bisphenol A exposure on the ratio of male and female fish was observed (Yokota et al.,
1999). Furthermore, a negative influence on the sperm production was reported in mice as well
(Vom Saal et al., 1994). It should be noted that the latter results could not be confirmed (Cagen et al.,
1999; Ashby et al., 1999). Apart from the prenatal exposure, also prepuberal and puberal exposure
in mice have been reported to negatively affect the sperm quality (Takao et al., 1999b).

Bisphenol A antigen and antibody production 111
Chemical interactions between packaging materials and foodstuffs
A final aspect of importance which should be stressed is that the estrogenic effect of xeno-estrogenic
substances is highly concentration dependent. At low levels of exposure, estrogenic effects
dominate, while at higher exposure levels other toxicological effects are observed (Sheehan, 2000).
Therefore, it can be concluded that the detection of low amounts of xeno-estrogenic substances in
the diet is of particular importance.
In addition to the xeno-estrogenic effect the possible carcinogenicity of bisphenol A has been
studied. Although bisphenol A is not a mutagen (Andersen et al., 1978) and although reports
linking bisphenol A exposure to cancer incidence are limited (Ashby and Tennants, 1988 & 1991), a
number of observations illustrate the possible carcinogenic character of the compound. Bisphenol A
is reported to affect the mitosis (Metzler and Pfeiffer, 1995; Pfeiffer et al., 1997) and to induce
aneuploidy (Pfeiffer et al., 1997, Tsutsui et al., 1998; Tsutsui et al., 2000). In addition, bisphenol A
metabolites have shown to react with DNA inducing the production of DNA adducts (Atkinson and
Roy, 1995a-b; Tsutsui et al., 1998). As already indicated, bisphenol A may induce cell proliferation
as well.
Finally, it should be mentioned that bisphenol A exhibits an acute toxicity in both animals (LD50 150
mg.kg-1, intraperitoneal injection in mice; Sax and Lewis, 1988) and humans (dermatitis; Fregert,
1981, Morrissey et al., 1987).
3.1.3. Bisphenol A hapten synthesis strategies
Generally haptens are coupled to proteins (Catty and Raykundalia, 1989). Although this coupling
can be spontaneous when the hapten is a reactive molecule, in most cases, a suitable hapten is not
available and needs to be synthetised (Mäkela and Seppälä, 1986).
For bisphenol A, the major functional group present is the phenolic hydroxyl group. Therefore the
major coupling reactions of hydroxyl carrying haptens will be reviewed. Especially, possible
applications of the described reactions in the synthesis of bisphenol A protein conjugates will be
highlighted. Basically two major cases can be considered. The first involves the use of the hydroxyl
group for coupling after activation of bisphenol A or the carrier. The second group of coupling
reactions proceeds via the haptenation of bisphenol A into intermediates containing a carboxylic
acid group, which can be coupled to the protein. It should be realised that most of the reactions
shown, have not been applied yet for the production of suitable bisphenol A haptens.

Bisphenol A antigen and antibody production 112
Chemical interactions between packaging materials and foodstuffs
3.1.3.1. Direct coupling of bisphenol A to a carrier
Most of the methods described for coupling hydroxyl containing haptens to carrier proteins relate
to carbohydrates and are based on reactions involving carboxy groups or vicinal hydroxyl groups
(Mäkela and Seppälä, 1986). For bisphenol A however, these methods are not appropriate.
Activation of the hydroxyl group by cyanogen bromide as described by Axén and Ernback (1971)
might be a valuable option (Figure 34). If an excess of bisphenol A 1 is reacted with cyanogen
bromide, an intermediate cynate structure 28 would be formed, reacting instantaneously with
bisphenol A 1 to form the reactive imidocarbonate 29. The coupling reaction with a protein would
give rise to the N-substituted imidocarbamate 30, which would partially be turned into the N-
substituted carbamate 31 under influence of water. On the other hand, the isourea derivative 32
would be formed as well. Thus a mixture of three different adducts would be generated from one
single hapten. It should be noted that the conjugates are reported to be relatively unstable
(Cuatrecasas and Parikh, 1972).
OHHO
1
BrCN OHO
28
CN
OHO
29
NH
O OH
OHO
30
NProt
O OH OHO
NProt
NHProt
32
OHO
O
NHProt
31
Figure 34. Haptenation via activation of bisphenol A with cyanogen bromide (Prot-NH2 represents a
protein molecule)

Bisphenol A antigen and antibody production 113
Chemical interactions between packaging materials and foodstuffs
Activation of the hydroxyl function by the introduction of a di acid chloride as described by Morgan
et al. (1986a) for sterigmatocystin might be a second possibility. Thus from bisphenol A,
intermediates 33 and 34 would be formed (Figure 35) reacting further with a protein to form
conjugates 35 and 36.
Similarly, reaction with phosgene as described by Erlanger et al. (1957) would produce the reactive
chlorocarbonates 37 and 38, giving finally rise to conjugates 31 and 39 (Figure 36).
OHHO
1
HO
33
Cl Cl
O On
O Cl
O On
O
34
O Cl
O On
Cl
OOn
HO
35
O NHProt
O On
O
36
O NHProt
O On
ProtHN
OOn
Figure 35. Haptenation via activation of bisphenol A with di acid chlorides
OHHO
1
OHO
37
OHO
O
NHProt
31
Cl Cl
OCl
O
OO
38
Cl
O
Cl
O+
OO
O
NHProt
39
O
ProtHN
Figure 36. Haptenation via activation of bisphenol A with phosgene
Apart from the hapten, the carrier can be activated as well enabling the production of bisphenol A
protein adducts. Lommen et al. (1995) and Skerritt et al. (2000) described the use of 1,4-butanediol

Bisphenol A antigen and antibody production 114
Chemical interactions between packaging materials and foodstuffs
diglycidylether as a coupling agent for hydroxylated compounds to a carrier protein. In a first step,
the coupling agent is reacted with the protein, whose nucleophilic groups easily attack the epoxy
groups of the former. Due to the secondary structure of the protein, the second epoxy group of
intermediate 40 would not significantly react intra- and intermolecularly (Lommen et al., 1995). If in
the second stage, bisphenol A would be added, adduct 41 would obtained (Figure 37).
1
41
OO
OO
OO
OOH
NHProt
pH > 10.8
OO
OHNHProt
OH
OHO
40
Figure 37. Haptenation via carrier activation using 1,4-butanediodiglycidyl ether
Houen and Jensen (1995) and Skerritt et al. (2000) described the preactivation of proteins with
divinyl sulfone (DVS) into the activated intermediate 42, without substantial side reactions.
Subsequently coupling to bisphenol A would produce adduct 43 (Figure 38).
1SO
OSO
OHN
Prot
42
SO
OHN
Prot
43
O OH
Figure 38. Haptenation via carrier activation using divinylsulfone
For the sake of completeness it should be mentioned that sometimes in order to improve the
immunogenicity of an adduct by increasing the number of conjugated haptens, the protein is
sometimes modified as described by Chu et al. (1982). In this method, the carboxylic groups of the
carrier protein are modified by ethylenediamine. Thus supplementary amino groups become
available for conjugation to a hapten by using one of the discussed methods.
3.1.3.2. Coupling of bisphenol A via carboxylic acid intermediates
A carboxylic acid group may be introduced in bisphenol A by one of the methods shown in Figure
39. Inman (1975) described the so-called carboxymethylation reaction, involving the binding of a

Bisphenol A antigen and antibody production 115
Chemical interactions between packaging materials and foodstuffs
halogen acetate to the hydroxyl group creating a stable ether linkage. Thus intermediates 44 and 45
would be produced (Figure 39.a) for bisphenol A. The esterification with dicarboxylic acid
anhydrides such as succinic and glutaric anhydride is frequently described in literature (e.g.
Abouzied et al., 1993; Chu et al., 1984a-b; Robins et al., 1984; Forlani et al., 1992). Similarly for
bisphenol A the hemisuccinates 46 and 48 and hemiglutarates 47 and 49 would be obtained (Figure
39.b). In fact, this reaction was recently applied by Kodeira et al. (2000) for the production of
glutaric acid derivatives of bisphenol A. The introduction of a carboxylic acid group in phenolic
structures via a reaction with diazophenylacetic acid is described as well (Mäkela and Seppälä,
1986). Thus derivatives 50 and 51 would be obtained from bisphenol A (Figure 39.c).
a. Carboxymethylation
OHHO
1
OHO
44
OH
O
OO
45
Cl
OH
O
OH
O
HO
O
b. Reaction with dicarboxylic acid anhydrides
OHHO
1
O OO
n
+
OHO
46n = 147n = 2
OHO
n
n
O
OO
48n = 149n = 2
OHO
n
OHO
O
c. Reaction with diazophenylacetic acid
OHHO
1
+
OHO
50
OH
O
OO
51
OH
OO
HO
N+N
O
OH
Figure 39. Introduction of carboxylic acid groups into bisphenol A

Bisphenol A antigen and antibody production 116
Chemical interactions between packaging materials and foodstuffs
Once the carboxylic group is introduced, again various methods are described to couple these
intermediates to a protein (Figure 40). For the sake of clarity these reactions are illustrated for one
particular component, substance 46.
The conversion into acylazides involves the use of thionylchloride giving rise to an intermediate
acid chloride which would then be converted into derivative 52 for bisphenol A (Figure 40.a). The
current use of the method is rather restricted (Mäkela and Seppälä, 1986).
Bauminger and Wilchel (1980) described the carbodiimide mediated coupling. Although the
reaction mechanism is not yet fully understood, it is postulated that an intermediate 53 would be
formed which would react either with the protein to give the conjugate 54 or rearrange to the acyl
urea 55 (Figure 40.b). This method is frequently applied (e.g. Abad et al., 1997; Fan et al., 1984;
Kemp et al., 1986; Lau et al., 1981; Morgan et al., 1986b; Yeung et al., 1996).
In the mixed anhydride reaction, originally described by Erlanger et al. (1957), the carboxylic acid
modified hapten is reacted with isobutylchlorocarbonate. For bisphenol A, the reactive intermediate
56 would be obtained (Figure 40.c). Subsequently, reaction with a carrier protein would give
conjugate 54. This method has been used extensively as well (e.g. Briand et al., 1985; Cairoli et al.,
1996; Chu et al., 1976; Garden and Sporns, 1994; Gendolf et al., 1984; Thouvenot and Morfin, 1983)
The conversion of a carboxyl group into a reactive N-hydroxy succinimide ester was first described
by Cuatrecasas and Parikh (1972) for the activation of modified agarose. Since then however the
method has been extensively used for haptenation (e.g. Abad, 1997 et al.; Cairoli, 1996 et al.; Feng,
1994 et al.; Hill et al., 1993; Kitagawa et al., 1981; Usleber et al., 1993). For bisphenol A, the reaction
would involve the preparation of the activated ester 57 in the presence of dicyclohexylcarbodiimide
(DCC) (Figure 40.d). The N-succinimide group would be removed upon the addition of a protein
giving the bisphenol A-protein conjugate 54.
3.1.3.3. Conclusion : overall strategy for bisphenol A antigen and immunogen
synthesis
The goal of this research is to synthetize bisphenol A antigens which can be applied in
immunoassays. Although it is very difficult or even impossible to predict the specificity and affinity
of antibodies towards a particular antigen, it is clear that these characteristics are largely influenced
by the extent of uniformity and density of hapten conjugation. Furthermore, hapten orientation on
the adducts is considered of importance as well. Therefore, it can be concluded from the previous
review that the choice of the coupling reaction and the reactive centre(s) of the hapten involved, will
highly influence the antibody specificity and affinity (Catty and Raykundalia, 1989). Since it is
considered essential that the obtained adducts are as uniform as possible, a single bisphenol A

Bisphenol A antigen and antibody production 117
Chemical interactions between packaging materials and foodstuffs
hapten should be obtained, which preferably is coupled to a protein via a single reactive centre.
Therefore, the use of cyanogen bromide (Figure 34) for example is not considered as useful for this
particular research. Because bisphenol A is a bifunctional molecule however, it should be realised
that activation or derivatisation reactions involving the hydroxyl groups, will always induce the
production of at least two haptens. Therefore it was considered essential to protect one of these
hydroxyl groups before the other hydroxyl group is used in haptentation reactions. Thus
intermediate 58 would be obtained (Figure 41).
a. Conversion to acylazides
OHO
46
OHO
O
b. Reaction with carbodiimides
1. SO2Cl2. NaNO2
OHO
52
+
NN
O
OHO
46
OHO
OOHO
53
OO
ORN
C RN
NR
HNR
OHO
55
NO
O
R
O
R
ProtNH2
OHO
54
NHProtO
O
c. Mixed anhydride reaction
OHO
46
OHO
O
Cl O
OOHO
56
OO
O
O
O
d. Conversion into reactive N-hydroxy-succinimide esters
OHO
46
OHO
ON OO
OH
DCC
OHO
57
OO
ON
O
O
Figure 40. Activation routes of carboxyl group end capped intermediates for haptenation
As the use of haptens containing a carboxylic acid group is so frequently described in literature, it is
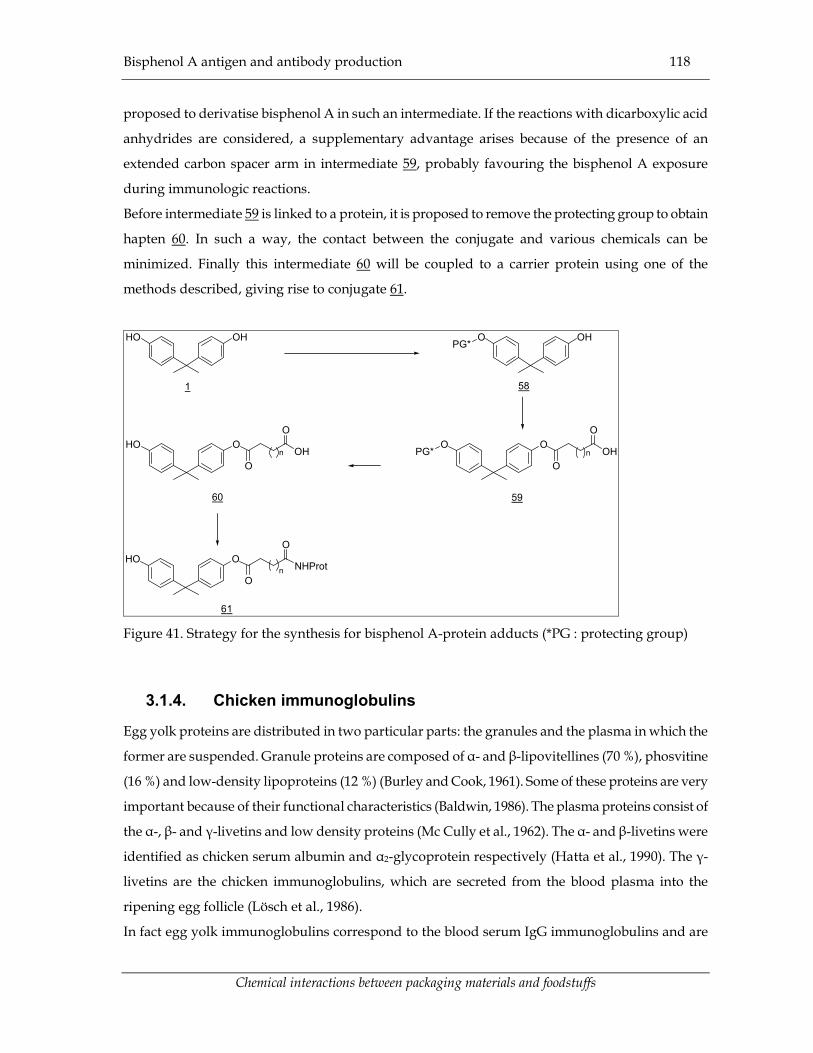
Bisphenol A antigen and antibody production 118
Chemical interactions between packaging materials and foodstuffs
proposed to derivatise bisphenol A in such an intermediate. If the reactions with dicarboxylic acid
anhydrides are considered, a supplementary advantage arises because of the presence of an
extended carbon spacer arm in intermediate 59, probably favouring the bisphenol A exposure
during immunologic reactions.
Before intermediate 59 is linked to a protein, it is proposed to remove the protecting group to obtain
hapten 60. In such a way, the contact between the conjugate and various chemicals can be
minimized. Finally this intermediate 60 will be coupled to a carrier protein using one of the
methods described, giving rise to conjugate 61.
OHO
58
OHHO
1
OO
59
OHO
O
PG*
PG*OHO
60
OHO
O
OHO
61
NHProtO
O
nn
n
Figure 41. Strategy for the synthesis for bisphenol A-protein adducts (*PG : protecting group)
3.1.4. Chicken immunoglobulins
Egg yolk proteins are distributed in two particular parts: the granules and the plasma in which the
former are suspended. Granule proteins are composed of α- and β-lipovitellines (70 %), phosvitine
(16 %) and low-density lipoproteins (12 %) (Burley and Cook, 1961). Some of these proteins are very
important because of their functional characteristics (Baldwin, 1986). The plasma proteins consist of
the α-, β- and γ-livetins and low density proteins (Mc Cully et al., 1962). The α- and β-livetins were
identified as chicken serum albumin and α2-glycoprotein respectively (Hatta et al., 1990). The γ-
livetins are the chicken immunoglobulins, which are secreted from the blood plasma into the
ripening egg follicle (Lösch et al., 1986).
In fact egg yolk immunoglobulins correspond to the blood serum IgG immunoglobulins and are

Bisphenol A antigen and antibody production 119
Chemical interactions between packaging materials and foodstuffs
known as IgY (Leslie and Clem, 1969). The other blood serum immunoglobulins, IgM and IgA, are
found dominantly in egg white (Rose et al., 1974) but were found in the yolk as well in very low
concentrations due to a possible protein diffusion from the white into the yolk sac (Lösch et al.,
1986). Quantitatively spoken only IgY is relevant in eggs since IgA and IgM concentrations in the
egg white are considerably lower then the IgY concentration in the yolk (10 mg.mL -1 yolk versus
<0.1 mg.mL –1 egg white, Otake et al., 1991, Lösch et al., 1986).
The interest for IgY isolation arises from the possible applications of these immunoglobulins in
diagnostics and therapeutics. Moreover they have immunoprophylactic potential (Schade and
Hlinak, 1993).
Therapeutic and prophylactic applications may be possible in animal production and in the
treatment or prevention of human intestinal diseases (Lösch et al, 1986, Akita and Nakai, 1992). Oral
administration of specific egg yolk antibodies towards gastrointestinal infections by Escherichia coli
(Ikemori et al., 1992; O'Farrelly et al., 1992), Salmonella enteriditis (Peralta et al., 1994) and murine
rotavirus (Bartz et al., 1980) in animal models is already described. Similarly the passive
immunization of infants by supplementing food with specific antibodies from the colostrum of
immunized cows against E. coli (Hilpert et al., 1987; Tacket et al., 1988), rotavirus (Brussow et al.,
1987; Ebina et al., 1985) or Shegella flexneri (Tacket et al., 1992) is known. Similarly egg yolk
immunoglobulins of immunized hens can be applied in the fortification of infant foods as suggested
by Akita and Nakai (1992) and in special cases of foods as well (Lösch et al., 1986).
Apart from their use as a kind of functional food or feed ingredient, polyclonal antibodies can be
applied in almost all immunologically based diagnostic methods such as enzyme immunoassay
(Khil'ko et al., 1989, Bar-Joseph and Malkinson, 1980) and radioimmunoassay (Viera et al., 1986),
immunoprecipitation (Song et al., 1985), immunofluorescence (Doller et al., 1987), etc. Most of the
applications refer to their use in enzyme immunoassays for microbiological (Ricke and Schaeffer,
1990, Rose and Mockett, 1983) or chemical (Fertel et al., 1981) analysis. In Table 27., the more recent
applications of chicken immunoglobulins in chemical analysis are summarized.
Despite of the fact that chicken egg yolk immunoglobulins are currently not used at their full
potential, they possess a large number of advantages compared to their mammal analogues. The
use of chickens for specific immunoglobulin production is more convenient compared to the use of
mammals, because the antibodies are delivered in an egg and consequently no invasive techniques
are necessary to harvest them. No bleeding of the animal is necessary which is beneficial for animal

Bisphenol A antigen and antibody production 120
Chemical interactions between packaging materials and foodstuffs
welfare (Hassl & Aspöck, 1988; Svendsen et al., 1995; Polson et al., 1980). Poultry have a lower
phylogenetic status than mammals and it is therefore desirable to use birds instead of mammals
(Svendsen et al., 1995). Consequently a better compatibility with modern animal protection
regulations is assured (Akita and Nakai, 1992). Within this respect it is worthwhile noticing that the
ECVAM report recommends the use of chicken antibodies to mammalian antibodies for ethical
purposes (Schade et al., 1996). Antibody production is more economical (Polson et al., 1980; Hassl et
al., 1987; Svendsen et al., 1995) because of the higher immunoglobulin production, cheaper housing,
the chickens lower susceptibility for diseases and because the production could proceed in
commercial egg production units. A supplementary advantage is the evolutionary distance from
mammals, which offer the possibility to produce specific antibodies towards for example
mammalian antigens (Jensenius et al., 1981). It should also be stressed that chicken antibodies have
some supplementary advantages to mammalian antibodies because they lack reactivity with Fc
receptors, complement and rheumatoid factors and human anti-mouse IgG antibodies.
Consequently well known interferences in immunoassays can be avoided (Kricka, 1999; Larsson et
al., 1993).
Table 27. Recent applications of chicken immunoglobulins in chemical analysis
Type of component Reference
proteins
- lactoferrin
- peanut protein
- soy bean glycinine
Meisel (1990)
Blais and Philippe (2000)
Meisel (1993)
mycotoxins
- deoxynivalenol
- zearalenone
- T-2 toxin
Schneider et al. (2000)
Pichler et al. (1998)
Kierek-Jaszczuk et al. (1997)
spiramycin Albrecht et al. (1996)
herbicides Welzig et al. (2000)
The reason for their restricted use probably is the problem of IgY isolation and purification from the
complex egg yolk matrix. A recent review (De Meulenaer and Huyghebaert, 2001b) indicates that
convenient isolation and purification methods applicable in the laboratory or even in an industrial
environment are currently available. Therefore and because of the advantages of chicken

Bisphenol A antigen and antibody production 121
Chemical interactions between packaging materials and foodstuffs
immunoglobulins, the chicken was selected as the host animal for antibody production.
3.2. Materials and Methods
3.2.1. Reagents and buffers
In addition to some of the reagents already mentioned (paragraph 2.2.1), the following were used as
well.
Sodium hydrogencarbonate and sodium hydroxide pa were obtained from Chem-Lab, Belgium.
Anhydrous disodium carbonate, sodium chloride, hydrochloric acid 25 %, dimethylformamide
(DMF), tetrahydrofurane (THF) and diethylether were purchased from UCB, Belgium. Bisphenol A
97%, potassium dihydrogenphosphate, disodium hydrogenphosphate dodecahydrate, imidazole,
tert-butyl(chloro)dimethylsilane (tBCDS), anhydrous sodium sulphate, N-hydroxy succinimide, 4-
dimethylaminopyridine, glutaric anhydride, succinic anhydride, N,N,N-tributyl-1-butylammonium
fluoride (TBAF), N,N’-dicyclohexylcarbodiimide (DCC), acetic acid, potassium carbonate,
ammonium chloride, trimethylsilylchloride (tMCS) sodium tetraborate decahydrate, citric acid and
ammoniumsulphate were from Acros Organics, USA. Bovine serum albumin (BSA, fraction V, 96%),
ovalbumin (OVA, Grade III, +97 %), Freund’s incomplete adjuvans, Freund’s complete adjuvans,
2,4,6-trinitrobenzenesulfonic acid 95 % (TNBS) and Tween 20 were from Sigma Chemical, USA.
Hydrogen peroxide 30 %, orthophenylenediamine (OPD), dry pyridine and potassium chloride
were from Merck, Germany. Horseradish peroxidase conjugated rabbit anti chicken IgG was from
ICN Biomedicals Inc, USA. Potassium caseinate and the skimmed milk powder were gifts of Rovita,
Germany and Belgomilk, Belgium respectively. Sephadex G25 was purchased from Pharmacia and
was equilibrated for at least 16h in an excess of phosphate buffered saline prior to use.
All reagents were of analytical grade unless otherwise mentioned.
Dried THF was obtained by continues reflux of THF over sodium using benzophenon as an
indicator.
Phosphate buffered saline (PBS) was prepared by making up a mixture of 8.0 g NaCl, 0.2 g KH2PO4,
2.8 g Na2HPO4.12H2O and 0.2 g KCl up to one litre with distilled water. Coating buffer (pH 9.6)
consisted of 1.59 g Na2CO3 and 2.93 g NaHCO3 diluted till one litre with distilled water. Dilution
buffer (PBS-Tween 20) consisted of PBS with 0.05% (v:v) Tween 20. Wash solution was 0.9% (w:v)
NaCl with 0.05% (v:v) Tween 20. Blocking solution was PBS with 3% (w:v) K-caseinate. Substrate
buffer (pH 5.0) consisted of 7.3 g citric acid and 11.86 g Na2HPO4.2H2O made up to 1 litre with
water. Substrate solution was a 40 mg OPD in 100 mL of substrate buffer to which just before use 5
mL of 0.03% (v:v) H2O2 was added. Stop solution was 2.5 M HCl.

Bisphenol A antigen and antibody production 122
Chemical interactions between packaging materials and foodstuffs
3.2.2. Hapten synthesis
Synthesis of 4-[1-(4-{[tert-butyl(dimethyl)silyl]oxy}phenyl) methylethyl]phenol 64 (Figure 43)
To a solution of 2.28 g (10 mmol) bisphenol A 1 in 50 mL DMF, 1.70 g (25 mmol) imidazole was
added. Subsequently, a solution of 1.51 g (10 mmol) tBCDS in 20 mL DMF was added drop wise at
room temperature (RT). The reaction mixture was stirred for 1 h at RT and pored out in 100 mL of
water. The mixture was extracted with hexane (2�50 mL and 2�25 mL, thus avoiding the co-
extraction of unreacted bisphenol A. The organic phase was dried over sodium sulphate and
evaporated to dryness under reduced pressure. The white residue was dissolved in 5 mL of hexane-
ethyl acetate 6:1 (v:v) and further purified by column chromatography. Therefore a glass column (32
mm internal diameter) was filled with 60 g of silica gel using hexane-ethyl acetate 6:1 (v:v) as a
mobile phase. Elution was accomplished by gravity. From the fraction eluting between 160-350 mL
1.11 g (32 %) of pure product could be obtained after evaporation to dryness under reduced
pressure.
Synthesis of 5-{4-[1-(4-{[tert-butyl(dimethyl)silyl]oxy}phenyl)-1-methylethyl]phenoxy}-5-oxopentanoic acid
67 (Figure 45)
To a solution of 1368 mg (4 mmol) 64 in 30 mL dry tetrahydrofurane (THF), 13.68 g (120 mmol)
glutaric anhydride and 489 mg 4-dimethylaminopyridine (4 mmol) was added. The mixture was
heated to reflux for 2 h, pored out in 50 mL of water, acidified with 10 N HCl to pH<2 and extracted
with chloroform (2�50 mL and 2�25 mL). The organic phase was dried over sodium sulphate and
evaporated to dryness under reduced pressure. The residue was dissolved in 20 mL of diethyl ether
and cooled for 2h at –18°C to precipitate part of the glutaric anhydride in excess, which was
removed by filtration. After evaporation to dryness under reduced pressure, the residue was
dissolved in 2 mL hexane-ethyl acetate 4:1 (v:v) and further purified using column chromatography.
Therefore, a glass column (10 mm internal diameter) was filled with 5 g silica gel and hexane.
Elution was accomplished with 40 mL hexane–ethyl acetate (4:1) (v:v). After evaporation to dryness
under reduced pressure the residue was dissolved in 2 mL hexane-ethyl acetate 4:1 (v:v) and again
purified using a similar chromatographic set-up. From the fraction eluting between 5-55 mL 967 mg
(53%) of pure product could be obtained after evaporation to dryness under reduced pressure.
Synthesis of 5-{4-[1-(4-hydroxyphenyl)-1-methylethyl]phenoxy}-5-oxopentanoic acid 47 (Figure 46)
To an ice-cooled solution of 790 mg (2.5 mmol) TBAF in 15 mL THF an ice-cooled solution of 1140
mg (2.5 mmol) 67 in 15 mL THF is added drop wise. After 1h at 0°C, the reaction mixture is pored

Bisphenol A antigen and antibody production 123
Chemical interactions between packaging materials and foodstuffs
out in 30 mL of water, acidifed with 10 N HCl to pH < 2 and extracted with chloroform (3�20 mL).
The combined organic fractions are washed with 25% HCl (10 �10 mL), dried over sodium sulphate
and evaporated to dryness under reduced pressure, yielding 633 mg of pure hapten 47 (74%).
3.2.3. Preparation and characterization of immunizing and coating conjugates.
Haptens were covalently attached to bovine serum albumin (BSA) and ovalbumin (OVA)
respectively. For the synthesis of the immunizing conjugates, 102 mg hapten 47 (0.3 mmol) in 3 mL
DMF was mixed with 48 mg (0.4 mmol) N-hydroxy succinimide and 62 mg (0.3 mmol) DCC. The
solution was left for 16 h at RT and the crystals formed were removed by decantation. The solution
was added drop wise to 10 mL of a protein solution (15 mg BSA.mL-1 in 50 mM sodium carbonate at
pH 9.6). This solution was stirred for 4 h at RT and finally the conjugates were purified by gel
filtration on Sephadex G 25 using PBS as eluant.
Three different coating conjugates were produced using OVA, with a varying bisphenol A to
protein ratio as indicated in paragraph 3.3.2. Similar reaction conditions as for the production of
BSA-bisphenol conjugates were used, except for the volume of the protein solution, since the
protein concentration in the carbonate buffer was kept constant at 15 mg OVA.mL-1.
The extent of coupling for each conjugate was determined using the trinitrobenzosulfonic acid
method as described by Fields (1972). Keeping into account the number of available amino groups
in BSA and OVA as reported by Habeeb (1966), the bisphenol A load of the immunizing and coating
antigen were estimated.
3.2.4. Chicken immunization and immunoglobulin isolation
In a first series of immunization experiments, three Isa Brown chickens (numbered 1-3) of 40 weeks
old were injected intramuscularly with 1 mL of a 1:1 (v:v) mixture of Freund complete adjuvant and
PBS containing 500 µg of immunizing antigen. After three weeks a supplementary injection of 1 mL
of a 1:1 (v:v) mixture of Freund incomplete adjuvant and PBS containing 500 µg of immunizing
antigen was given. Afterwards boaster injections of 500 µg of immunizing conjugate in PBS were
repeated every three weeks during a 70 day period, after which the immunization procedure was
stopped. A similar protocol was followed in a second series of immunization experiments in which
the hens (numbered 4-6) were younger at the start of the immunization procedure (20 weeks).
Eggs were collected daily and individually identified. The immunoglobulins were isolated from the
individual egg yolks using a modified aqueous dilution method described by Akita and Nakai

Bisphenol A antigen and antibody production 124
Chemical interactions between packaging materials and foodstuffs
(1992). Briefly, ‘v’ mL of egg yolk was separated from the egg and diluted with 8 � v mL of water
and pH was set with 1N HCl between 5.0 and 5.2. After 16 h incubation at 4°C and centrifugation
(10 000g, 1h, 4°C), the supernatant was filtered. After addition of 72 g of ammonium sulphate and
170 mL of water, 1h incubation at RT and centrifugation (10 000 g, 20 min, RT), the residue was
dissolved in a 19% (w:v) sodium sulphate solution. After 20 min of incubation at RT and
centrifugation (2 000 g, 20 min, RT) the residue was dissolved in a 14% (w:v) sodium sulphate
solution. After 20 min of incubation at RT and centrifugation (2 000 g, 20 min, RT) the residue was
dissolved in v/6 mL PBS and stored in small aliquots at –18°C. For further use they were diluted
from this final solution.
3.2.5. Indirect ELISA
Ninety-six well F 96 Maxisorp Nunc immuno plates from Nunc (Denmark) were coated with
coating antigen A solution (12.5 µg.mL-1 in coating buffer; 100 µL/well) by overnight incubation at
4°C in the dark. Plates were washed three times (200 µL wash solution/well) and blocked (200 µL
blocking solution/well) for 2h at RT, in the dark. Afterwards the plates were washed twice as
previously. The respective primary antibody dilutions were added (100 µL/well in dilution buffer)
and the plates were incubated for 1 h at 37°C. Afterwards the plates were washed three times as
previously. For the detection reaction, HRP-conjugated secondary antibody was added (100
µL/well, 3.4 µg.mL-1 in dilution buffer). After 1 h incubation at 37°C and washing of the plates
(three times), 100 µL/well of substrate solution was added, followed by an additional incubation at
37°C for 1h. Finally 25 µL/well of the stop solution was added before measuring the absorbance at
492 nm. Absorbances were corrected for blanc readings obtained by using immunoglobulins
isolated from the eggs of non immunized chickens. No differences between blanc readings using
these immunoglobulins or those isolated out of immunized chickens, prior to immunization, was
observed. Measurements were performed in quadruplate.
3.2.6. Instruments
The Titertek multiskan plus MK II (USA) was used throughout this research. NMR spectra were
obtained using a JEOL PMX 270 SI (270 MHz) instrument, using tetramethylsilane as a reference.
For the mass spectra a Varian MAT 112 mass spectrometer (USA) (70 eV) was used which was
coupled with a Varian aerograph 2700 gas chromatograph (USA). The gas chromatograph was
equipped with a CPSil 5CB column (Chrompack, the Netherlands) (internal diameter 0.32 mm, film
thickness 0.25 µm, 5m length). A Perkin-Elmer model 1310 infrared spectrometer was used to obtain
IR spectra.
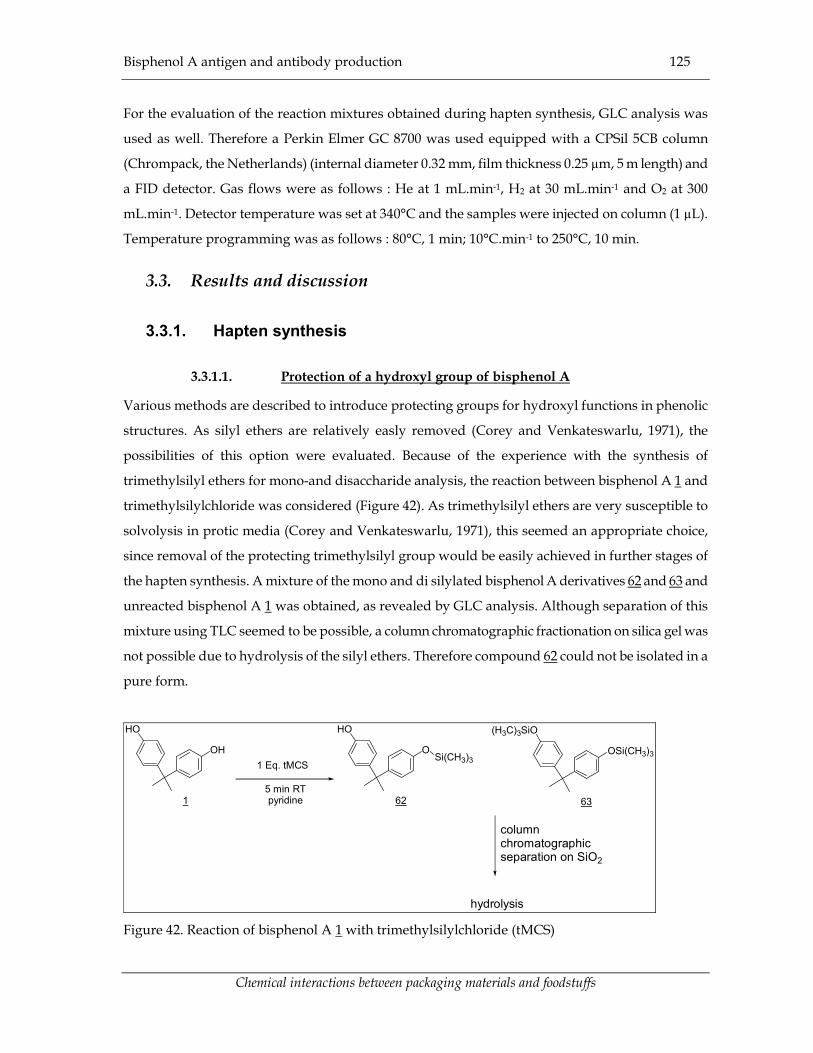
Bisphenol A antigen and antibody production 125
Chemical interactions between packaging materials and foodstuffs
For the evaluation of the reaction mixtures obtained during hapten synthesis, GLC analysis was
used as well. Therefore a Perkin Elmer GC 8700 was used equipped with a CPSil 5CB column
(Chrompack, the Netherlands) (internal diameter 0.32 mm, film thickness 0.25 µm, 5 m length) and
a FID detector. Gas flows were as follows : He at 1 mL.min-1, H2 at 30 mL.min-1 and O2 at 300
mL.min-1. Detector temperature was set at 340°C and the samples were injected on column (1 µL).
Temperature programming was as follows : 80°C, 1 min; 10°C.min-1 to 250°C, 10 min.
3.3. Results and discussion
3.3.1. Hapten synthesis
3.3.1.1. Protection of a hydroxyl group of bisphenol A
Various methods are described to introduce protecting groups for hydroxyl functions in phenolic
structures. As silyl ethers are relatively easly removed (Corey and Venkateswarlu, 1971), the
possibilities of this option were evaluated. Because of the experience with the synthesis of
trimethylsilyl ethers for mono-and disaccharide analysis, the reaction between bisphenol A 1 and
trimethylsilylchloride was considered (Figure 42). As trimethylsilyl ethers are very susceptible to
solvolysis in protic media (Corey and Venkateswarlu, 1971), this seemed an appropriate choice,
since removal of the protecting trimethylsilyl group would be easily achieved in further stages of
the hapten synthesis. A mixture of the mono and di silylated bisphenol A derivatives 62 and 63 and
unreacted bisphenol A 1 was obtained, as revealed by GLC analysis. Although separation of this
mixture using TLC seemed to be possible, a column chromatographic fractionation on silica gel was
not possible due to hydrolysis of the silyl ethers. Therefore compound 62 could not be isolated in a
pure form.
OH
HO
O
HO
Si(CH3)3
1 62
1 Eq. tMCS
5 min RTpyridine
OSi(CH3)3
(H3C)3SiO
63
column chromatographic separation on SiO2
hydrolysis Figure 42. Reaction of bisphenol A 1 with trimethylsilylchloride (tMCS)

Bisphenol A antigen and antibody production 126
Chemical interactions between packaging materials and foodstuffs
Consequently, another silyl ether was considered by reacting bisphenol A 1 with tert-
butyl(chloro)dimethylsilane (tBCDS). The tert-butyldimethylsiloxy group is reported to be 104 times
more stable compared to the trimethylsiloxy group (Corey and Venkateswarlu, 1971) and was
therefore more promising in the isolation of a more stable mono-protected bisphenol A derivative
64.
Reaction conditions were adapted from Corey and Venkateswarlu (1971) and Sinha et al. (1995)
(Figure 43.) The addition of imidazol as a catalyst and dimethylformamide as solvent proved to be
very effective. It is assumed that the reaction proceeds via N-dimethyl-tert-butyl-silylimidazole of
which can be expected to be a very reactive silylating agent (Corey and Venkateswarlu, 1971).
OH
HO
O
HO
SiN
N
1 64
1 Eq. tBCDS
2.5 Eq
1h RTDMF
O
O
Si
65
Si
Figure 43. Reaction of bisphenol A 1 with tert-butyl(chloro)dimethylsilane (tBCDS)
In the preliminary experiments, reactions on a 1 mmol bisphenol A 1 were performed to optimise
reaction conditions and extraction. Reaction mixtures were essentially evaluated using TLC and
GLC techniques. Initially, the reaction mixture was extracted using ethyl acetate as described by
Sinha et al (1995) for the production of a deoxynivalenol derivative. In our experiments however
emulsion formation, which could be reduced only partially by the addition of sodium chloride,
complicated the extraction. Moreover, it seemed that ethyl acetate co-extracted unreacted bisphenol
A 1. If the ethyl acetate extract was redissolved in hexane, the mono and diderivative of bisphenol A
64 and 65 were isolated almost free from bisphenol A, which remained insoluble. Therefore it was
decided to extract the reaction mixture with hexane instead, thus preventing the emulsion
formation and co-extraction of bisphenol A 1. The latter was considered as a supplementary
advantage because bisphenol A 1 could not interfere in the column chromatographic clean-up as
described. Scaling up of the reaction to a 10 mmol bisphenol A 1 level, increased the use of the
exraction solvent. Petroleum ether p.a. was therefore considered as an alternative to the more
expensive hexane, but a too high variation in the yield of the mono-derivative 64 was observed (20-
30%).
Reaction conditions were varied to optimise the production of intermediate 64. Increasing the

Bisphenol A antigen and antibody production 127
Chemical interactions between packaging materials and foodstuffs
amounts of tBCDS in order to reduce the presence of bisphenol A 1 in the reaction mixture,
increased the yields of diderivative 65 (approximately 8, 13 and 44 % for respectively 1, 2 and 3 eq
tBCDS), without affecting the yield of the monoderivative 64 in a similar manner (30-35 %). As in
the chromatographic clean-up the diderivative 65 eluted first, a low concentration in the crude
reaction mixture was preferred. Therefore only 1 eq tBCDS was used in subsequent experiments.
The amounts of imidazole added to the reaction mixture did not influence the yields of both
reaction products in the range studied (2.5 eq up to 12.5 eq).
Extending the reaction time from 1 up to 3 hours did not alter the reaction mixture as well. Neither
an increase of the reaction temperature to 60°C instead of room temperature did. These
observations are in contrast with the more severe reaction conditions used previously by Sinha et al.
(1995) or Corey and Venkateswarlu (1971). This illustrates that bisphenol A 1 reacts readily with
tBCDS, most probably because the available hydroxyl groups are not sterically shielded and weakly
acidic.
For the chromatographic clean-up a compromise between yield, purity and solvent consumption
needed to be found. As soon as most of the diderivative 65 was eluted, collection of the
monoderivative 64 started to a total volume of 350 mL. Further elution with the more polar ethyl
acetate and finally methanol revealed the presence of monoderivative 64, bisphenol A 1 and some
other unknown low molecular weight impurities. As maximally 150 mg of residual material could
be isolated, this fraction was not considered for isolation of derivative 64.
Based on gas chromatographic analysis and spectral data, the isolated 4-[1-(4-{[tert-
butyl(dimethyl)silyl]oxy}phenyl)methylethyl]phenol 64 was considered to be pure (>95 %) enough
for further use. Spectral data of compounds 64 and 65 are summarized in Tables 28 and 29.

Bisphenol A antigen and antibody production 128
Chemical interactions between packaging materials and foodstuffs
Table 28. Spectral data of 4-[1-(4-{[tert-butyl(dimethyl)silyl]oxy}phenyl)methylethyl]phenol 64 1H NMR (CDCl3) �: 0.08 (s, 6H, SiCH3), 0.86 (s, 9H, tBu), 1.49 (s, 6H, CH3), 6.56 (d, 2H,
aromatic), 6.63 (d, 2H, aromatic), 6.95 (d, 4H, aromatic). 13C NMR (CDCl3) �: -4.26 (2�CH3-Si), 18.29 (Cquat , tBu), 25.82 (tBu), 31.20 (2�CH3), 41.80 (C-CH3),
114.82 (2�CH, aromatic), 119.42 (2�CH, aromatic), 127.80 and 128.05 (4�CH,
aromatic), 143.50 and 143.77 (2�C aromatic), 153.20 and 153.30 (Cquat-OH and
Cquat-OSi).
MS: m.z-1 (%): 343 (41); 329 (27); 328 (80); 286 (21); 136 (18); 135 (100); 107 (11); 73
(20).
IR (cm-1) �max: 3272 (OH); 1511 (Ph); 1252 (Si(CH3)2)
Table 29. Spectral data of tert-butyl{4-[1-(4-{[tert-butyl(dimethyl)silyl]oxy}phenyl)-1-
methylethyl]fenoxy}dimethylsilane 65 1H NMR (CDCl3) �: 0,08 (s, 12H, SiCH3); 0,86 (s, 18H, tBu); 1,51 (s, 6H, CH3); 6,60 (d, 4H,
aromatic); 6,96 (d, 4H,aromatic) 13C NMR (CDCl3) �: -4,21 (4�CH3-Si); 18,31 (2�Cquat , tBu); 25,72 and 25,84 (tBu); 31,23 (2�CH3);
41,95 (C-CH3); 119,20 and 119,31 (4�CH, aromatic); 127,71 and 127,81 (4�CH,
aromatic); 143,81 (2�C aromatic); 153,37 (2�Cquat-OSi)
MS: m.z-1 (%): no M+; 427 (26); 207 (37); 171,2 (12); 86 (13); 84 (32); 73 (16); 51 (15);
49 (81); 47 (100)
IR (cm-1) �max: 1607, 1509, 1473 (Ph), 1237 (Si(CH3)2)
3.3.1.2. Introduction of a carboxy ended spacer arm
For the introduction of a carboxy group containing spacer arm in the bisphenol A molecule, the
reaction with dicarboxylic acid anhydrides was evaluated. Therefore, both succinic and glutaric
anhydride were used.
Preliminary experiments using succinic anhydride and similar experimental conditions as described
by Abouzied et al. (1993) and Robins et al. (1984) were unsuccesfull (100°C, 2-16h in pyridine, 3-6
eq). Alternative reaction conditions adapted from Chu et al. (1984a-b) (24h reflux in THF, 30 eq) did
not allow the isolation of the pure derivative 66 (Figure 44), because the initial reaction product was
still partially present in addition to some unidentified compounds. Therefore further attempts to
couple succinic anhydride to bisphenol A were not undertaken.

Bisphenol A antigen and antibody production 129
Chemical interactions between packaging materials and foodstuffs
O
HO
Si
NN
2h � THF
O
O
Si
HO
O
64
30 Eq
1 Eq.
O OO
O
+other reaction products
66 Figure 44. Reaction of intermediate 64 with succinic anhydride
Reaction with glutaric anhydride was more successful. Adapting the reaction conditions described
by Chu et al. (1984a-b), derivative 67 could be obtained in acceptable yields (Figure 45). Because of
the high amounts of glutaric anhydride used, problems during sample clean-up occurred. Lowering
the amount of anhydride was not possible because of incomplete reaction, even at longer reaction
times. Therefore, attempts to isolate the pure derivative 67 concentrated on column
chromatographic techniques and selective precipitation of the excess of anhydride. The latter could
be achieved using diethyl ether at low temperature. The crude derivative 67 was further purified
using a double column chromatographic clean-up. Spectral data of this compound are presented in
Table 30.
O
HO
Si
NN
2h � THF
O OO
O
O
Si
HO
O
O
64
30 Eq
1 Eq.
67 Figure 45. Reaction of intermediate 64 with glutaric anhydride

Bisphenol A antigen and antibody production 130
Chemical interactions between packaging materials and foodstuffs
Table 30. Spectral data of 5-{4-[1-(4-{[tert-butyl(dimethyl)silyl]oxy}phenyl)-1-methylethyl]phenoxy}-
5-oxopentanoic acid 67 1H NMR (CDCl3) �: 0.08 (s, 6H, SiCH3), 0.86 (s, 9H, tBu), 1.54 (s, 6H, CH3), 1.96 (quint, 2H,
CH2CH2COOH), 2.41 (t, 2H, CH2COOH), 2.55 (t, 2H, CH2COOPh), 6.62 (d,
2H, aromatic), 6.85 (d, 2H, aromatic); 6.96 and 7.08 (d, 2�2H, aromatic). 13C NMR (CDCl3) �: -4.23 (2�CH3-Si), 18.08 (CH2CH2COOH), 19.65 (Cquat , tBu), 25.59 (tBu), 30.91
(2�CH3), 32.64 (CH2COOPh), 33.11 (CH2COOH), 42.02 (C-CH3), 119.23 (2�CH
aromatic), 120.62 (2�CH aromatic), 127.62 and 127.71 (4�CH aromatic), 142.88
and 148.17 (2�C aromatic), 148.57 (Cquat-OSi), 153.34 (Cquat-OCO), 171.43
(COOPh), 178.80 (COOH).
MS: m.z-1 (%): 88 (24); 86 (90); 84 (100); 49 (26); 47 (30).
IR (cm-1) �max: 3416 (OH); 1749 (COOPh); 1704 (COOH);1510 (Ph); 1226 (Si(CH3)2)
3.3.1.3. Removal of the protecting group
The last step in the synthesis of a suitable bisphenol A hapten, consisted of the removal of the
protecting group from derivative 67. This step is quite delicate because the hydrolysis of the ester
bound should be avoided. Based on Corley and Venkateswarlu (1971), the following experimental
combinations were evaluated respectively: acetic acid/water (1:1, v:v) for 16 h at RT or 4 h reflux,
MeOH saturated with K2CO3 for 3h at RT, 1 M NH4Cl in water/THF (1:1) (v:v) for 4h at RT. None of
these were successful because of incomplete reactions or side reactions (e.g. hydrolysis of ester
bound). Therefore the use of TBAF, as reported previously by Sinha et al. (1995), was evaluated.
Initial experiments at room temperature resulted in a complex reaction mixture. By lowering the
temperature however, side reactions could be minimized, enabling the isolation of hapten 47
(Figure 46). Again problems were encountered however during sample clean-up because of the
presence of tributylamine in the reaction mixture. Initial attempts to remove this major impurity
using TLC as reported by Sinha et al. (1995) failed. An intensive extraction with concentrated
hydrochloric acid on the other hand was able to remove the side products present, without
inducing hydrolysis of the ester bound. The spectral data of hapten 47 are summarized in Table 31.

Bisphenol A antigen and antibody production 131
Chemical interactions between packaging materials and foodstuffs
OH
OHO
OO
2.5 Eq TBAF1h 0°C
THFO
O
Si
HO
O
O
64 47 Figure 46. Removal of the protecting group from compound 64
Table 31. Spectral data of 5-{4-[1-(4-hydroxyphenyl)-1-methylethyl]phenoxy}-5-oxopentanoic acid 47 1H NMR (CDCl3) �: 1.63 (s, 6H, CH3), 2.06 (quint, 2H, CH2CH2COOH), 2.49 (t, 2H, CH2COOH),
2.67 (t, 2H, CH2COOPh), 6.75 (d, 2H, aromatic), 6.95 (d, 2H, aromatic), 7.07 (d,
2H, aromatic), 7.22 (d, 2H, aromatic). 13C NMR (CDCl3) �: 20.36 (CH2CH2COOH), 31.58 (C-CH3), 33.43 (CH2COOPh), 34.08
(CH2COOH), 42.65 (C-CH3), 115.39 (2�CH aromatic); 121.33 (2�CH aromatic) ;
128.46 and 128.52 (CH aromatic), 143.36 (C aromatic), 149.00 (C aromatic),
149.33 (Cquat-OH); 154.22 (Cquat-OCO); 172.65 (COOPh); 179.43 (COOH).
MS: m.z-1 (%): 228 (37); 213 (100); 86 (23,77); 84 (35).
IR (cm-1) �max: 3416 (OH); 1749 (COOpH); 1704 (COOH);1510 (pH); 1226 (Si(CH3)2)
3.3.2. Synthesis and characterization of hapten-protein conjugates
For the coupling of hapten 47, a suitable protein needed to be selected. Based on literature data,
bovine serum albumin was selected as a protein to produce the immunizing conjugates while for
the coating conjugates, ovalbumin was selected. This latter choice introduced a supplementary
advantage because in such a way non specific binding of the chicken immunoglobulins to the
coating conjugates would be minimized.
For the coupling, hapten 47 was converted into the reactive N-hydroxy succinimide ester 68, which
was not isolated as such. Because of the release of water, a dicarbodiimide was added (Figure 47).
Finally the activated hapten 68 was coupled to the two proteins. The bisphenol A load of the
conjugate could be modulated by changing the ratios of hapten 47/protein during the coupling
reaction. The extend of coupling was studied by the relative number of free aminogroups present in
the protein as described by Fields (1972). Thus, one immunizing conjugate and three coating
conjugates were obtained as presented in Table 32.

Bisphenol A antigen and antibody production 132
Chemical interactions between packaging materials and foodstuffs
OH
OHO
OO
47
N OO
OH
DCC
OHO
68
O
ON
O
OO
NC
N
+ H2O
H2OHN N
HN
HN
OH O
ProtNH2
OHO
69
O O
NHProt
x
Figure 47. Coupling of hapten 47 to proteins
Table 32. Immunizing and coating bisphenol A antigens
Antigen Bisphenol A/protein ratio during
synthesis (mol.mol-1)
Actual Bisphenol A/protein ratio
(mol.mol-1)
immunizing antigen 138 26
coating antigen A 90 4.86
coating antigen B 45 3.80
coating antigen C 22.5 2.95
3.3.3. Chicken immunization
Chickens were immunized as described and the eggs were identified and collected daily. For the
isolation of the immunglobulins, basically the aqueous dilution technique as described by Akita and
Nakai (1992) was followed with some modifications. SDS-PAGE analysis revealed that the isolated
immunoglobulins were indeed sufficiently purified (not shown). Response of the chickens towards
the immunization procedure was evaluated by using an indirect ELISA as described.
In the first series of immunization experiments, only two of the immunized chickens reacted
towards the applied immunization procedure. Because one of these chickens stopped egg
production 35 days after the start of the immunization procedure, the amount of useful collected
eggs was too small. Therefore, only the eggs from one single chicken were used throughout further
experiments. As can be seen from Figure 48., appreciable response was observed about 1 month

Bisphenol A antigen and antibody production 133
Chemical interactions between packaging materials and foodstuffs
after the immunization procedure started. In addition, this response could be maintained till
at least 70 days, after which the immunization experiments were aborted because of the large
number of useful eggs already collected.
0,0
0,2
0,4
0,6
0,8
1,0
1000 10000 100000
(IgY dilution)-1
B/B
0
Figure 48. Response of chicken 2, immunized with bisphenol A-BSA conjugate at various days after
the start of the immunization (� = 7 days; �= 28 days; �= 42 days, ◊ = 45 days, � = 70 days)
(response B, was normalized to the highest absorbance level observed, B0, which was maximally 1.3)
In the second series of immunization experiments, all chickens reacted quite well to the
immunization with the bisphenol A-BSA conjugate, in contrast to the first immunization series.
Possibly, the younger age of the chickens could be a cause of this. Again, immune response could be
maintained during a long period. In contrast to the first immunization experiment however, lower
titers were obtained, as can be observed from Figure 49. Possibly again the age of the chickens could
be an explanation for these observations, although it should be noted that the immunized
population is far too small to come to firm conclusions in this regard. Although recently a limited
amount of reports on the production of bisphenol A specific antibodies were published (Kodeira et
al., 2000; Nishii et al., 2000; Ohkuma et al., 2002), this is the first reported successful chicken
immunization with plastic monomer-protein conjugates in general and with bisphenol A-protein
conjugates in particular. It should be noted as well, that due to the daily egg production and the

Bisphenol A antigen and antibody production 134
Chemical interactions between packaging materials and foodstuffs
high concentration of immunoglobulins in the egg yolk, large quantities of useful antibodies could
be collected throughout this research.
0
0,2
0,4
0,6
0,8
1
100 1000 10000 100000
(IgY diution)-1
B/B
0
Figure 49. Response of a chickens 4-6, immunized with bisphenol A-BSA conjugate at various days
after the start of the immunization (�= chicken 4, day 58; �= chicken 5, day 45; ◊ = chicken 6, day
45) (response was normalized to the highest absorbance level observed B0, which was maximally
1.2)
3.4. Conclusions
In this chapter, the synthesis of a suitable bisphenol A hapten was presented. Furthermore, the
hapten was coupled to BSA in order to obtain a immunizing conjugate, which was injected in
chickens. Immunoglobulins were isolated from the egg yolks. Apart from coupling the hapten to
BSA, it was also coupled to OVA obtaining a coating conjugate which could be used in an indirect
ELISA. This indirect ELISA was used to evaluate the reactivity of the isolated antibodies towards
bisphenol A. Two series of chickens could be successfully immunized, but differences in response
between the two series and within the series were observed.

Use of Bisphenol A antibodies in enzyme-linked immunosorbent assays 137
Chemical interactions between packaging materials and foodstuffs
4. Use of Bisphenol A antibodies in enzyme-linked
immunosorbent assays
4.1. Introduction
As already emphasised in Chapter 3, antibodies can be applied for various purposes. One of the
more important analytical applications are the so-called enzyme-linked immunosorbent assays
(ELISA’s). Such assays are based on the chemical conjugation of an enzyme to either an antigen or
an antibody (‘enzyme-linked’), which allows the detection of immuno complexes formed on a solid
phase (‘immunosorbent’). This is because the fixed enzyme, once the free reagents present in excess
are washed away, can yield a coloured product upon the addition of a substrate and a suitable
chromogen. This general principle can be applied in various formats. In this introduction, only the
assay examined in the reported experimental work is briefly presented.
In the previous chapter (Chapter 3), the indirect non-competitive ELISA has been used for the
detection of bisphenol A- specific antibodies in the IgY isolate from immunized chickens. A similar
format, but in a competitive mode, was used intensively to evaluate the usefulness of the isolated
antibodies for the quantification of bisphenol A. As indicated in Figure 50, after coating of the multi-
well plates with coating antigen and blocking the remaining available binding places, both the
antibodies and the sample containing the analyte are added to the wells. Consequently a
competition arises between the free and bound antigen to bind to the antibodies. After removal of
the excess of primary antibodies, a tracer is added. This tracer consists of a secondary anti IgY
antibody linked to an enzyme. Again, the tracer in excess is removed after incubation. Subsequently
the substrate of the enzyme together with a chromogen are added. After the enzymatic reaction, the
tracer can be quantified due to the colour change of the chromogen. Thus the amount of bound
primary antibody (bisphenol A antibody) is determined indirectly.
The main objective of this research was to investigate whether the isolated antibodies could be used
in such an enzyme-linked immunosorbent assay for the quantification of bisphenol A in relevant
matrices. Therefore, the influence of several parameters on the assay performance was investigated.
Subsequently, the specificity of the assay was studied. Finally, the assays applicability to analyse
bisphenol A in real food matrices was explored.

Use of Bisphenol A antibodies in enzyme-linked immunosorbent assays 138
Chemical interactions between packaging materials and foodstuffs
Figure 50. Schematic representation of an indirect competitive ELISA
4.2. Materials and Methods
4.2.1. Reagents and buffers
In addition to the reagents mentioned in paragraph 3.2.1, the following reagents and buffers were
used, unless otherwise mentioned.
4, 4’-Dihydroxybenzophenon 99%, 4, 4’-ethylidenebisphenol 99%, 4-cumylphenol 99%, bis-(4-
hydroxyphenyl)-methane 98%, p-cresol 99%, m-cresol 99% , 4-hydroxydiphenylmethane 99%, 4,4’-
cyclohexylidenebisphenol 98%, 2,2-bis-(4-hydroxyphenyl)-perfluoropropane 97%, bis-(4-
hydroxyphenyl)-sulphone 98%, 4,4’-(1,4-phenylene-diisopropylidene)-bisphenol 98%, 4,4’-
isopropylidene bis(2,6-dimethylphenol) 98%, 3,4’-isopropylidene-diphenol 98%, 4,4’-(1,3-
phenylenediisopropylidene)bisphenol 99%, 1,4-dihydroxybenzene, 4,4’-dihydroxybiphenyl 97%,
butyl benzyl phthalate, 4-butylphenol and 4,4’-(1-phenylethylidene) bisphenol 99% were from
Aldrich Chemical Company, USA. Benzoic acid pa was obtained from Chem-Lab, Belgium.
Butylhydroxyanisol was from Koch-light laboratories, England. BADGE was a generous gift from
Ciba Specialty Chemicals, Belgium. 1,3-dihydroxybenzene, potassium thiocyanate and sodium
bromide were purchased from UCB, Belgium. Phenol 99%, 4-nonylphenol (mixture of isomers) 99%,

Use of Bisphenol A antibodies in enzyme-linked immunosorbent assays 139
Chemical interactions between packaging materials and foodstuffs
di-n-butyl phthalate, benzyl alcohol, sodium perchlororate, EDTA, di-sodium EDTA and potassium
iodide were from Acros Organics, USA. 2,2’-azino-bis(3-ethylbenzthiazoline-6-sulfonic acid) 98 %
(ABTS) was from Sigma Chemical, USA. Commercial sunflower oil was obtained from
Vandemoortele (Belgium).
All reagents used were of analytical grade or better, unless otherwise mentioned.
If ABTS was used as a detection reagent, substrate buffer (pH 4.0) consisted of 0.05 M tri-sodium
citrate in distilled water. Substrate solution consisted of 30 mg ABTS in 100 mL of substrate buffer
to which just before use 5 mL of 6 % (v:v) H2O2 was added. Stop solution was a 0.1 M HF, 0.008 M
NaOH and 0.001 M Na2EDTA solution.
Aqueous solutions of bisphenol A and the substances for which cross reactivity was evaluated were
prepared as follows. One gram of substance was dissolved in 50 mL of methanol and this solution
was diluted in water up to the desired concentration. Methanol concentration in the final solutions
was considered to be negligible (constant concentration 1.5% v:v). For aqueous methanolic
bisphenol A solutions, in which higher concentrations of methanol were used, methanol was added
additionally till the desired concentration was reached.
4.2.2. Initial experiments
4.2.2.1. Enzymatic reactions
For all enzymatic reactions, the secondary antibody–horseradish peroxidase conjugate was diluted
up to a concentration of 1.35 µg.mL-1 in substrate buffer. Of this solution, 25 µL was added to each
well of a 96-well plate (polystyrene, Corning Flat bottom) together with 100 µL of the appropriate
substrate solution (in triplicate). After 30 minutes of incubation at 37°C, 25 µL of the appropriate
stop solution was added to each well and absorbance was measured within five minutes after the
addition of the stop solution at the specified wavelengths (for OPD 492 nm; for ABTS 405 nm) on a
Titertek multiskan plus MK II (USA). Composition of substrate buffers and solutions are given
elsewhere (paragraphs 3.2.1 and 4.2.1). Blanc experiments refer to experiments in which the
addition of enzyme solution was replaced by the addition of the same volume substrate buffer.
These conditions were used unless otherwise mentioned.
4.2.2.2. Signal reading and plate studies
Three plate readers were evaluated : Organon technika (The Netherlands), Titertek multiskan (USA)
and the Titertek multiskan plus MK II (USA).
To evaluate the repeatability of the readers, 200 µL of a diluted OPD solution was added to each

Use of Bisphenol A antibodies in enzyme-linked immunosorbent assays 140
Chemical interactions between packaging materials and foodstuffs
well of a 96-well plate (polystyrene, Corning Flat bottom). The OPD solution was prepared by
mixing 1 mL of a secondary antibody–horseradish peroxidase conjugate dilution as obtained
previously (paragraph 4.2.2.1) with 4 mL substrate solution (paragraph 4.2.2.1) and by subsequent
incubation of this mixture for 60 minutes at 37°C. After the addition of the stop solution (1 mL), the
mixture was diluted with substrate buffer until the absorbance amounted approximately 1.0.
For the evaluation of the plates, the ELISA protocol described in paragraph 3.2.5 was followed with
the following modification. Instead of adding different IgY dilutions in each well, the same (1/4000)
IgY dilution of one particular egg (chicken 2, day 42) was added to each well, obtaining an overall
absorbance of about 1.0.
4.2.2.3. Blocking solution studies for the indirect ELISA
For the evaluation of the blocking solutions, the ELISA protocol described in paragraph 3.2.5 was
followed, with exception of the blocking solution described. Blanc experiments refer to experiments
in which primary antibodies were isolated from the eggs of non immunized chickens.
4.2.3. Immunosorbent assays
4.2.3.1. Indirect competitive ELISA
4.2.3.1.1. Assay optimisation experiments
General conditions of the immunoassay
Ninety-six well F 96 Maxisorp Nunc immuno plates from Nunc (Denmark) or Greiner plates
(Microlon ® 600, flat bottom, extra high binding capacity, Germany) were coated with coating
antigen A solution (12.5 µg.mL-1 coating buffer, 100 µL/well) by overnight incubation at 4°C in the
dark. Plates were washed three times (200 µL wash solution/well) and blocked (200 µL blocking
solution/well) for 2 h at RT, in the dark. Afterwards the plates were washed twice as previously.
For the competition step, 50 µL of the appropriate bisphenol A-dilution and 50 µL of the primary
antibody solution were added to each well. Primary antibodies were diluted as follows : 20 µL of
the original primary antibody solution in PBS was further diluted to 7.24 mL with PBS.
Subsequently, 26.64 mL PBS containing 0.3 % (w:v) BSA, 520 µL NaOH 0.1N and 5.6 mL of a 4M
NaCl solution were added, obtaining a final dilution of the primary antibody of 1/2000, a pH of 8.0,
a BSA concentration of 0.2 % (w:v) and a calculated ionic strength of 700 mM. This dilution is
referred to as the competition buffer. The plates were incubated for 1 h at 37°C. Afterwards, the
plates are washed as described above (three times). For the detection reaction, the HRP-conjugated

Use of Bisphenol A antibodies in enzyme-linked immunosorbent assays 141
Chemical interactions between packaging materials and foodstuffs
secondary antibody was added (100 µL/well, 3.4 µg.mL-1 dilution buffer). After 1 h incubation at
37°C and washing of the plates (three times), 100 µL/well of substrate solution was added, followed
by an additional incubation for 1h at 37°C. Finally 25 µL/well of the appropriate stop solution was
added before measuring the absorbance at the appropriate wavelength within 5 minutes (492 nm).
Absorbances were corrected for blanc readings obtained by using immunoglobulins isolated from
the eggs of non immunized chickens. As detection reagent, OPD was used.
These conditions were followed unless otherwise stated.
Ionic strength studies
The general assay conditions were applied except for the amount of 4 M NaCl added to the
competition buffer, which was adjusted to vary its ionic strength. The amount of PBS was reduced
accordingly, keeping the primary antibody concentration constant for all experiments. If necessary
the addition of NaCl solution was replaced by the addition of deionised water. The ionic strength
was calculated using the following formula
��
i
2iifd2
1I [41]
where I is the ionic strength, d is the concentration of each ion and f is its charge. Reported ionic
strengths refer to those of the diluted IgY solution before it is applied in the assay. BSA itself was
not present in the competition buffer for the reported experiment.
Surface active component studies
The influence of the following surface active agents in the competition buffer was evaluated using
the general assay format, as a function of the ionic strength and their concentration: bovine serum
albumin (0.2 % w:v), Tween 20 (0-0.4 % v:v) and potassium caseinate (0.2 % w:v).
pH studies
The amount of NaOH (0.1 N) or HCl (0.1 N) added to the competition buffer was adjusted together
with the amount 4 M NaCl and PBS in such a way that the desired pH was reached, keeping the
ionic strength constant. Initially these studies were performed using Tween 20, but apart from this
surfactant also potassium caseinate (0.2% w:v) and BSA (0.2% w:v) were used respectively.
Otherwise the general assay conditions were used.
Chaotropic ions
The optimised assay format was used in these experiments, but the amount of 4M NaCl added to
the competition buffer was adjusted in such a way that the addition of the chaotropic ions at the
indicated concentrations did not influence the final ionic strength of the competition buffer.
Coating antigen studies

Use of Bisphenol A antibodies in enzyme-linked immunosorbent assays 142
Chemical interactions between packaging materials and foodstuffs
Three different coating antigens, as indicated in Table 32, were used at varying concentrations (0.4-
12.5 µg.mL-1) during the coating of the multi-well plates. Otherwise the general assay format was
followed.
Chromogen
The optimised assay format was followed, except that if OPD was used as a substrate, conditions of
the enzymatic reactions were adjusted accordingly.
For all other experiments, the general assay format was used, except for the specified parameter
which was varied as indicated.
4.2.3.1.2. Assay specificity
Competitive assays using coating antigen C (0.8 µg.mL-1 in coating buffer) were performed
according to the general assay format, using various structural bisphenol A analogues to determine
their respective I50 values (µM). I50 is the concentration of the analyte at which half of the maximal
signal intensity is reached. Cross reactivity was calculated as (e.g. Abad and Montaya, 1997)
100II
(%) reactivity Crosscompound 50,
A bisphenol 50,�� [42]
4.2.3.1.3. Application of the indirect competitive ELISA for dairy emulsions
Competitive immunoassays according to the optimised assay format were accomplished using milk
samples which were spiked with bisphenol A at the appropriate concentration. Reconstituted milk
was prepared as follows: 10 g of skimmed milk powder is dissolved in 60 mL of distilled water. For
the addition of bisphenol A, the appropriate aqueous solution was added at this stage as well. If
necessary, sunflower oil at the appropriate concentration is emulsified in the dispersion using an
Ultraturrax mixer at moderate speed. Afterwards, the mixture is diluted till a final volume of 100
mL is reached. Pasteurized milk samples, packed in PET bottles at various fat contents were
obtained from retail shops. These samples were spiked with a concentrated methanolic bisphenol A
solution, keeping the methanol concentration constant at 1.5 % (v:v).
4.2.3.1.4. Application of the indirect competitive ELISA for fatty foods
Competitive immunoassays according to the optimised assay format were accomplished using
aqueous methanolic bisphenol A solutions at the appropriate methanol and bisphenol A
concentration.

Use of Bisphenol A antibodies in enzyme-linked immunosorbent assays 143
Chemical interactions between packaging materials and foodstuffs
4.2.3.1.5. Optimised format
Ninety-six well F 96 Maxisorp Nunc immuno plates from Nunc (Denmark) or Greiner plates
(Microlon ® 600, flat bottom, extra high binding capacity, Germany) were coated with coating
antigen C solution (0.8 µg.mL-1 coating buffer, 100 µL/well) by overnight incubation at 4°C in the
dark. Plates were washed three times (200 µL wash solution/well) and blocked (200 µL blocking
solution/well) for 2 h at RT, in the dark. Afterwards the plates were washed twice as previously.
For the competition step, 50 µL of the appropriate bisphenol A-dilution and 50 µL of the primary
antibody solution were added to each well. Primary antibodies were diluted as follows : 20 µL of
the original primary antibody solution in PBS was further diluted to 7.24 mL with PBS.
Subsequently, 26.64 mL PBS containing 0.3 % (w:v) BSA, 520 µL NaOH 0.1N and 5.6 mL of a 4M
NaCl solution were added, obtaining a final dilution of the primary antibody of 1/2000, a pH of 8.0,
a BSA concentration of 0.2 % (w:v) and a calculated ionic strength of 700 mM. This dilution is
referred to as the competition buffer. The plates were incubated for 1 h at 37°C. Afterwards, the
plates are washed as described above (three times). For the detection reaction, the HRP-conjugated
secondary antibody was added (100 µL/well, 3.4 µg.mL-1 dilution buffer). After 1 h incubation at
37°C and washing of the plates (three times), 100 µL/well of substrate solution containing ABTS as
a chromogen was added followed by an additional incubation at 37°C for 1 h. Finally 25 µL/well of
the appropriate stop solution was added before measuring the absorbance at the appropriate
wavelength (405 nm). Absorbances were corrected for blanc readings obtained by using
immunoglobulins isolated from the eggs of non immunized chickens.
All reagents were warmed-up till incubation temperatures, plates were stacked per couple in
between two empty plates and covered during incubation with a protective film.
If necessary, concentrations of the primary antibodies needed to be adjusted in such a way that the
maximal absorbance in absence of analyte amounted about 1.3.
4.2.3.2. Data processing
Competition curves were obtained in quadruplate. For the statistical evaluation a 95 % confidence
interval was applied. The obtained competition curves were fitted to the four parameter logistic
function corresponding to the equation [43] (Englebienne, 2000) using a commercial software
package (SPSS 10.0).

Use of Bisphenol A antibodies in enzyme-linked immunosorbent assays 144
Chemical interactions between packaging materials and foodstuffs
S
Ix1
SB Bp
50
0 �
���
�
�
���
�
�
��
��
�
�
�� [43]
As indicated in Figure 51, B0 is the maximal absorbance, obtained in the absence of the analyte (x = 0
µM). S is the lower asymptote to the competition curve. The I50 value (µM) is equal to the
concentration of the analyte at which the absorbance equals half of the maximal absorbance.
Consequently, it is related to the assay sensitivity. It is obvious from Figure 51 that the assay
sensitivity is also determined by the factor p. This factor is the so-called Hill slope. In most of the
assays performed, essentially the I50 value was of prime importance however with regard to the
assay sensitivity, since most competition curves were characterised with comparable p factors (0.65-
0.75). Therefore the estimated I50 value was used to evaluate the sensitivity of the assay, as
moreover is usually done by other researchers as well (e.g. Abad and Montaya, 1997).
0
0,1
0,2
0,3
0,4
0,5
0,6
0,7
0,8
0,9
1
0,0001 0,001 0,01 0,1 1 10 100
Concentration (µM)
B/B
0
Figure 51. Some theoretical competition curves based on equation [43] to illustrate the influence of
the equation constants on the assay performance (S is equal to zero in all cases; � : I50= 1µM; p = 1;
� : I50= 0.01 µM; p = 1; no symbol, plain line : I50= 1 µM; p = 0.5)
When required, curves were normalised by expressing the experimental absorbance levels (B) as
(B/B0,max), where B0,max is the maximal absorbance in absence of analyte for the group of competition

Use of Bisphenol A antibodies in enzyme-linked immunosorbent assays 145
Chemical interactions between packaging materials and foodstuffs
curves considered.
4.3. Results and discussion
4.3.1. Initial experiments
As illustrated in the introduction to this chapter (paragraph 4.1), an enzyme-linked immunosorbent
assay consists of a number of consecutive steps of which for all the experiments the following are
comparable: blocking, the enzymatic reaction, and the reading of the signal. In addition, the used
plates will be comparable as well. Because these aspects had an influence during all the experiments
performed, initial attention was attributed to their optimisation.
4.3.1.1. Enzymatic reactions
For the enzymatic reactions, initially orthophenylenediamine (OPD) was selected as a chromogen,
while in later experiments also the use of 2,2’-azino-bis(3-ethylbenzthiazoline-6-sulfonic acid)
(ABTS) was considered. The following parameters of the enzymatic reactions, using the indicated
chromogens between the brackets, were selected for further evaluation : chromogen concentration
(OPD, ABTS), substrate concentration (OPD, ABTS), the factor time (OPD, ABTS), the citrate
concentration and pH (ABTS) and the stop solution (ABTS).
Various chromogen concentrations were tested (0-1 mg OPD.mL-1; 0-0.5 mg ABTS.mL-1). As could be
expected, a linear relationship between the chromogen concentration and the signal intensity was
observed (for OPD : 0-100 µg.mL-1; for ABTS : 0-150 µg.mL-1). No influence of the chromogen
concentration on the blanc readings (without enzyme) could be observed within these concentration
ranges. Final chromogen concentrations were selected in such a way that they became not a limiting
factor in the final assays used (OPD : 400 µg.mL-1; ABTS 300 µg.mL-1). This was confirmed in assays
in which double concentrations of chromogen were used during the enzymatic reactions, without
influence on the final absorbance signal.
Another critical parameter, especially if OPD was used as a chromogen, was the substrate (hydrogen
peroxide) concentration. As illustrated in Figure 52, the net absorbance (corrected for the blanc
reading), was maximal at a particular peroxide concentration (� 0.0015 %, v:v). This was quite
surprising since Catty and Raykundalia (1989) and Portsmann et al. (1981), advised to use much
higher substrate concentrations (e.g. 1.5 %, v:v). At these concentrations however, net absorbance
levels became very low (Figure 52). In addition, high blanc readings (without enzyme) were

Use of Bisphenol A antibodies in enzyme-linked immunosorbent assays 146
Chemical interactions between packaging materials and foodstuffs
observed, which of course is undesirable. Low concentrations (e.g. 0.00015 %, v:v; Figure 52)
resulted also in low absorbance levels. Since additional experiments in the concentration range
0.0006-0.0015 % (v:v) revealed that only minor differences in the net absorbance levels were
obtained, a final substrate concentration of 0.0015 % (v:v) was selected if OPD was used as a
chromogen.
0
0,4
0,8
1,2
1,6
0,0001 0,001 0,01 0,1 1 10
Substrate concentration (%, v:v)
abso
rban
ce (4
92 n
m)
Figure 52. Influence of substrate concentration (hydrogen peroxide) on the net absorbance of OPD
solutions in the presence of peroxydase
For ABTS a continuous increase in signal intensity was observed until the substrate concentration
amounted 0.05 % (v:v). In contrast to OPD however, no decrease in signal intensity was observed if
higher substrate concentrations were applied (up to 0.6 % v:v, not shown). No effect of the substrate
concentration on the blanc reading (without enzyme) could be observed either, in the range tested,.
The low absorbance observed for both chromogens, if low substrate concentrations are present, can
be explained by the restricted reagent concentration. At high substrate concentrations, the
enzymatic reaction will proceed at a rate which becomes independent upon the substrate
concentration, explaining the results observed for ABTS. The deviating behaviour for OPD can be
partially explained by the high blanc readings which were observed using the high substrate
concentrations reported. Since the overall absorbance levels (not corrected for the blanc) in these
experimental conditions were also lower then those observed with the optimal substrate
Use of Bisphenol A antibodies in enzyme-linked immunosorbent assays 147
Chemical interactions between packaging materials and foodstuffs
concentration, this could not be the only explanation. Possibly, the chromogen dependent formation
of an inactive substrate-enzyme complex at these high substrate concentrations could the cause
(Porstmann et al., 1981). Because of the chromogen dependent character of this inactivation, the
observed difference between OPD and ABTS could be explained as well.
As could be expected, incubation time was positively correlated with signal intensity (only tested for
OPD, 10-60 min, not shown). Doubling the incubation time from 30 min, as used in initial
immunoassays, to 60 minutes, increased signal intensity with 50% without changing the blanc
readings (without enzyme).
Another aspect of practical importance with regard to the time, was the influence of the time gap (0-
20 min) between the mixing of all the reagents at room temperature and the incubation at 37°C (for
30 min; only tested for OPD). If the time gap was restricted up to 5 min, which is practically easy to
be realised, no significant differences in absorbance levels were observed. It should be noted
however that if the time gap exceeded 20 min, the difference in absorbance level was only slightly
different from the reference (time gap 0 min) : 1.102 �0.010 for the reference and 1.222 � 0.028 for the
time gap of 20 min. So the modest enzymatic activity at room temperature is overrun almost
completely during the incubation at 37°C. Since an incubation time of 60 minutes at 37°C was
respected during the assays performed later, it can be expected that the time gap between the
mixing of all the reagents at room temperature and the incubation of 37°C is not a crucial factor
influencing assay performance.
The influence of the time (5-20 min) between the end of the enzymatic reactions (addition of the
stop solution) and the measurement on the absorbance level recorded was evaluated as well,
because of practical concerns. Both for OPD and ABTS no significant difference in the net
absorbance levels could be observed in the time frame tested. For OPD however an increase in the
overall absorbance level was observed together with a similar increase in the blanc signal (without
enzyme) at the highest substrate concentrations (1.5 %, v:v) tested. Again this observation illustrates
the inappropriate use of the high substrate concentrations as recommended by some authors. For
ABTS, it should be noted that the observations reported were only valid for selected stop solutions,
as explained further on.
Additional attention to the citrate concentration and the pH was given if ABTS was used as a
chromogen because several concentrations were recommended in literature (Catty and
Raykundalia, 1989 : 0.1 M, pH 6.0; Saunders, 1979 : 0.05 M, pH 4). The lower the citrate
concentration, the higher the absorbance level observed, irrespective of the pH of the buffer used.

Use of Bisphenol A antibodies in enzyme-linked immunosorbent assays 148
Chemical interactions between packaging materials and foodstuffs
Better results were also obtained if the more acidic pH level was selected. A further decrease of the
citrate concentration (at pH 4) resulted in even higher absorbance levels. In addition however, blanc
signal (without enzyme) increased as well. Presumably, the citrate prevents direct chromogen
oxidation.
A final aspect of importance if ABTS was used as a substrate was the stop solution used. Again
various possibilities were found in literature (Table 33). Since Saunders (1979) already stressed the
importance of a carefully prepared stopping reagent, these reagents were compared for further use.
Table 33. Various solutions to stop the hydrogen peroxide mediated enzymatic oxidation of ABTS
Solution code Composition Reference
1 0.1 mM NaN3 Porstmann et al., 1981
2 0.3 M NaF Catty and Raykundalia, 1989
3 0.1 M HF, 0.01 M NaOH, 1 mM EDTA Saunders, 1979
4 0.1 M HF, 0.008 M NaOH, 1mM Na2EDTA Saunders, 1979
Solution 1 was immediately rejected because very low absorbance levels were observed. Solution 2
was not retained as well, because the final absorbance level observed seemed to be less stable as a
function of time compared to stop solutions 3 and 4, which were stable in the time frame tested, as
reported previously. No differences between these two latter solutions were observed with respect
to the signal intensity and stability. Since EDTA is difficult to dissolve however, preference for
further use was given to solution 4.
4.3.1.2. Signal reading and plates
During the initial immunosorbent assays, it was quickly revealed that enormous problems with
assay repeatability existed. Two important causes could be identified : the spectrophotometers and
the plates used.
For the spectrophotometers three different instruments were evaluated. All 96 wells of a multiwell
plate were filled identically with a solution containing the oxidised chromogen (OPD) and the
absorbance was recorded in quadruplate for each instrument. The relative standard deviation for
each well and the average relative standard deviation over all the wells were calculated and
compared (Table 34).
As can be observed, one instrument clearly caused serious repeatability problems. Consequently for

Use of Bisphenol A antibodies in enzyme-linked immunosorbent assays 149
Chemical interactions between packaging materials and foodstuffs
further measurements, the Titertek multiskan plus MK II instrument was prefered.
Table 34. Results of the repeatability experiments concerning the spectrophotometer (average
absorbance level amounted approximately 1.0)
Instrument Maximal relative standard
deviation (%)
Average relative standard
deviation (%)
Organon technika 14.3 4.1
Titertek multiskan 5.4 2.7
Titertek multiskan plus MK II 1.9 0.8
Since for the plates especially the homogeneity of the coating of the reactants is of importance, all the
96 wells of a plate were treated identically starting from the initial coating step. Three plates of each
tested brand were evaluated. The relative standard deviation on the absorption levels of all 96 wells
was calculated for each plate individually. In addition, for each brand the relative standard
deviation on the average absorbance level of each individual plate was compared (Table 35).
Table 35. Results of the repeatability experiments concerning the plates (average absorbance level
amounted approximately 1.0)
Plate brand Relative standard deviation
per plate
Relative standard deviation on
the plate averages
Linbro 7.6 32.4 38.4 73.4
Greiner, 96 well plate 16.0 26.2 10.4 22.9
Corning 12.8 20.6 13.4 11.4
Maxisorp-platen, Nunc 10.2 10.5 7.0 6.4
Maxisorp-platen, Nunc, without
edges
6.2 4.0 5.4 4.8
As can be observed, relative standard deviations within one plate were extremely high for some
brands, indicating that within these individual plates inhomogeneous coating occurred. Also the
variability between the plates of each single brand was in some cases rather high, demonstrating the
large variability between several plates of one single brand. The plates of Nunc seemed to have the
best intra- and interplate homogeneity. It should be noted in this respect that some plates tested,
were not typically immunoplates (e.g. Greiner, ordinary 96-well plates), which could explain some
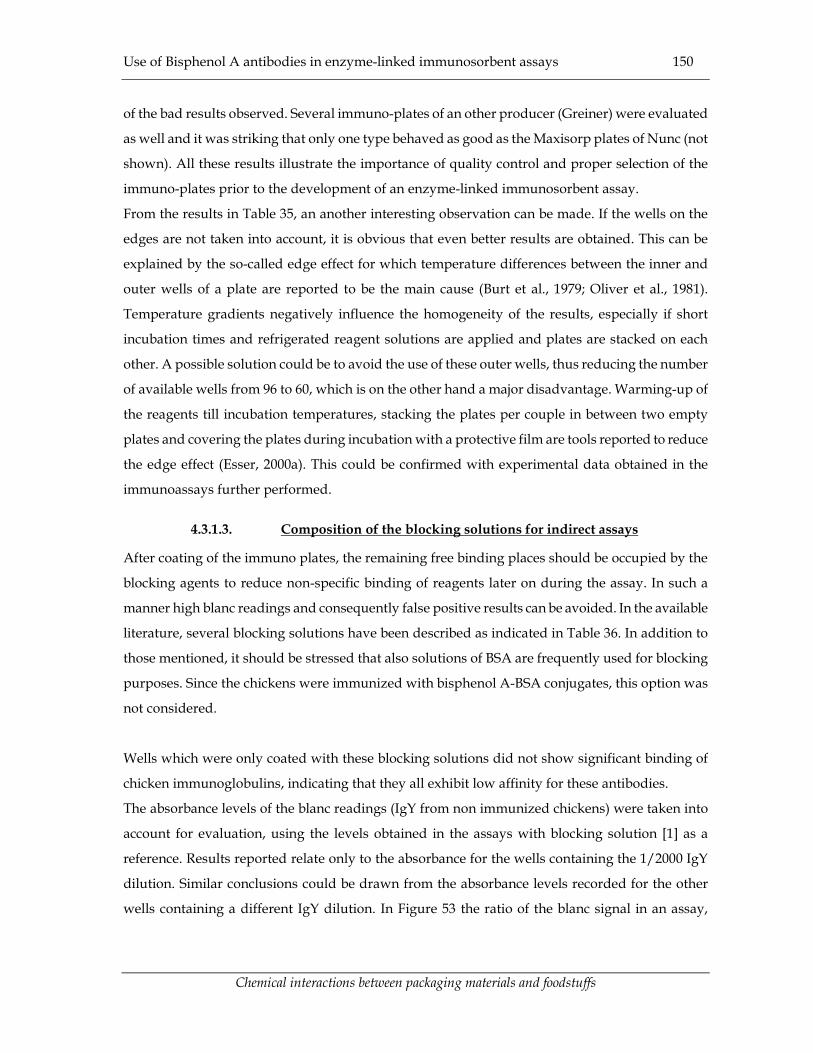
Use of Bisphenol A antibodies in enzyme-linked immunosorbent assays 150
Chemical interactions between packaging materials and foodstuffs
of the bad results observed. Several immuno-plates of an other producer (Greiner) were evaluated
as well and it was striking that only one type behaved as good as the Maxisorp plates of Nunc (not
shown). All these results illustrate the importance of quality control and proper selection of the
immuno-plates prior to the development of an enzyme-linked immunosorbent assay.
From the results in Table 35, an another interesting observation can be made. If the wells on the
edges are not taken into account, it is obvious that even better results are obtained. This can be
explained by the so-called edge effect for which temperature differences between the inner and
outer wells of a plate are reported to be the main cause (Burt et al., 1979; Oliver et al., 1981).
Temperature gradients negatively influence the homogeneity of the results, especially if short
incubation times and refrigerated reagent solutions are applied and plates are stacked on each
other. A possible solution could be to avoid the use of these outer wells, thus reducing the number
of available wells from 96 to 60, which is on the other hand a major disadvantage. Warming-up of
the reagents till incubation temperatures, stacking the plates per couple in between two empty
plates and covering the plates during incubation with a protective film are tools reported to reduce
the edge effect (Esser, 2000a). This could be confirmed with experimental data obtained in the
immunoassays further performed.
4.3.1.3. Composition of the blocking solutions for indirect assays
After coating of the immuno plates, the remaining free binding places should be occupied by the
blocking agents to reduce non-specific binding of reagents later on during the assay. In such a
manner high blanc readings and consequently false positive results can be avoided. In the available
literature, several blocking solutions have been described as indicated in Table 36. In addition to
those mentioned, it should be stressed that also solutions of BSA are frequently used for blocking
purposes. Since the chickens were immunized with bisphenol A-BSA conjugates, this option was
not considered.
Wells which were only coated with these blocking solutions did not show significant binding of
chicken immunoglobulins, indicating that they all exhibit low affinity for these antibodies.
The absorbance levels of the blanc readings (IgY from non immunized chickens) were taken into
account for evaluation, using the levels obtained in the assays with blocking solution [1] as a
reference. Results reported relate only to the absorbance for the wells containing the 1/2000 IgY
dilution. Similar conclusions could be drawn from the absorbance levels recorded for the other
wells containing a different IgY dilution. In Figure 53 the ratio of the blanc signal in an assay,
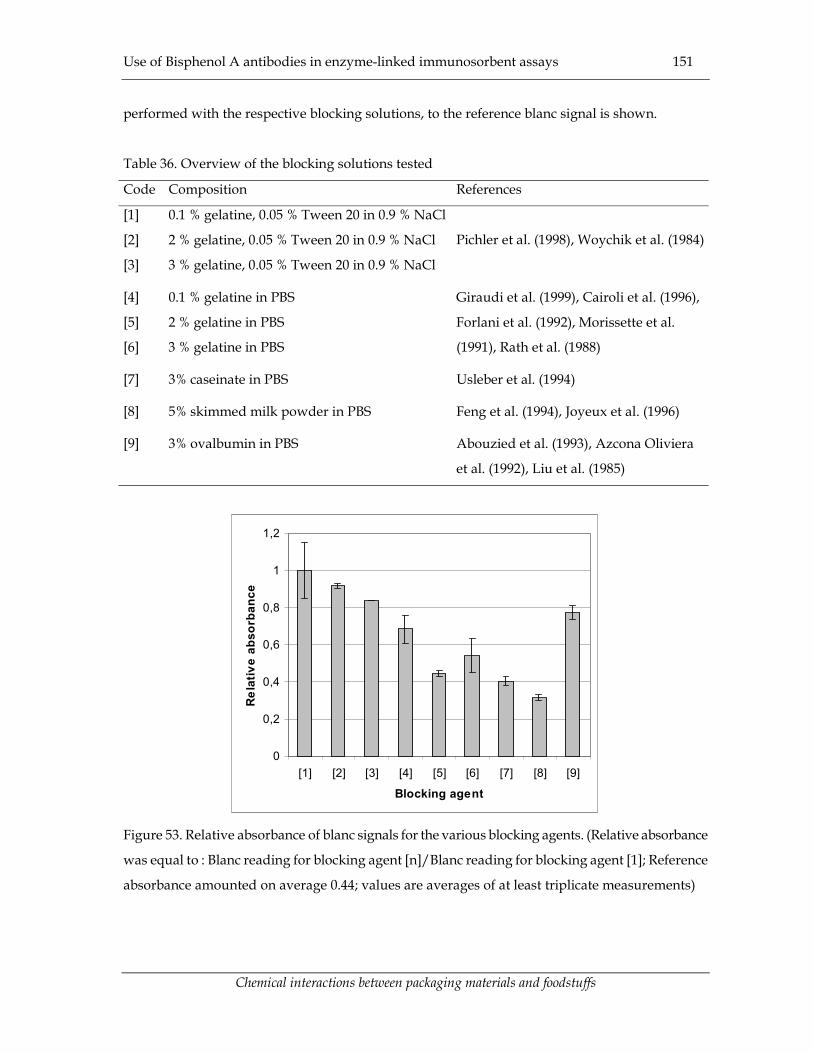
Use of Bisphenol A antibodies in enzyme-linked immunosorbent assays 151
Chemical interactions between packaging materials and foodstuffs
performed with the respective blocking solutions, to the reference blanc signal is shown.
Table 36. Overview of the blocking solutions tested
Code Composition References
[1] 0.1 % gelatine, 0.05 % Tween 20 in 0.9 % NaCl
[2] 2 % gelatine, 0.05 % Tween 20 in 0.9 % NaCl
[3] 3 % gelatine, 0.05 % Tween 20 in 0.9 % NaCl
Pichler et al. (1998), Woychik et al. (1984)
[4] 0.1 % gelatine in PBS
[5] 2 % gelatine in PBS
[6] 3 % gelatine in PBS
Giraudi et al. (1999), Cairoli et al. (1996),
Forlani et al. (1992), Morissette et al.
(1991), Rath et al. (1988)
[7] 3% caseinate in PBS Usleber et al. (1994)
[8] 5% skimmed milk powder in PBS Feng et al. (1994), Joyeux et al. (1996)
[9] 3% ovalbumin in PBS Abouzied et al. (1993), Azcona Oliviera
et al. (1992), Liu et al. (1985)
0
0,2
0,4
0,6
0,8
1
1,2
[1] [2] [3] [4] [5] [6] [7] [8] [9]
Blocking agent
Rel
ativ
e ab
sorb
ance
Figure 53. Relative absorbance of blanc signals for the various blocking agents. (Relative absorbance
was equal to : Blanc reading for blocking agent [n]/Blanc reading for blocking agent [1]; Reference
absorbance amounted on average 0.44; values are averages of at least triplicate measurements)

Use of Bisphenol A antibodies in enzyme-linked immunosorbent assays 152
Chemical interactions between packaging materials and foodstuffs
Blanc readings for the reference blocking solution was maximal (Figure 53). Increasing the gelatine
concentration in these solutions decreased the blanc signal. If Tween 20 was omitted from the
gelatine solution, even lower blanc readings were obtained. Probably, Tween 20 competed in the
former blocking solutions with the gelatine as suggested by Esser (2000b). Ovalbumin was
considered to be inappropriate as well. Dairy protein solutions (casein and skimmed milk powder)
were even more effective compared to the gelatine solutions in reducing the blanc absorbance
signal. Because skimmed milk powder is however more complex in composition compared to the
caseinate used, preference was given to the later protein isolate to use it as a blocking agent in
further experiments.
4.3.2. Indirect Competitive ELISA
For the evaluation of their usefulness, the isolated antibodies from the bisphenol A immunized
chickens were applied in an indirect competitive ELISA. To do so, the influence of several assay
parameters on the assay performance were evaluated.
4.3.2.1. Assay optimization
4.3.2.1.1. Ionic strength of the competition buffer
Figure 54 shows some typical competition curves obtained from the assay for various ionic
strengths of the competition buffer. In Table 37, the estimated B0 and I50 values for some of the
competition curves are summarized. The estimated values for the lower ionic strengths are omitted
because of the large variability on the estimated values. The ionic strength of the competition buffer
revealed to be very important with regard to the assay performance. At low ionic strengths, the I50
values became unacceptability high. The values were not significantly influenced anymore by the
ionic strength starting approximately from 800 mM. A further increase of the ionic strength
however resulted in a dramatic reduction of the maximal absorbance (Table 37). Therefore the range
of 400-800 mM was considered as optimal taking into account the achievable sensitivity range.
Finally a 700 mM ionic strength was selected for further use.
Similar findings were observed previously in immunoassays for other organic compounds using
mammal antibodies (Harrison et al., 1989, Li et al., 1991; Marco et al., 1993, Lee et al., 1995; Abad
and Montaya, 1997). According to Abad and Montaya (1997) these observations indicate that the
interaction between antibodies and hydrophobic compounds is influenced by the polarity of the
buffers used. It should be noted in this respect that in a parallel research performed with regard to

Use of Bisphenol A antibodies in enzyme-linked immunosorbent assays 153
Chemical interactions between packaging materials and foodstuffs
the application of chicken immunoglobulins for the detection of peanut proteins, a similar but less
intense effect was observed (De Meulenaer et al., 2002), although such finding were not reported
using antibodies from other animals. Therefore it can not be excluded that the observed results in
the presented bisphenol A assay are partially attributable to the fact that chicken antibodies were
used.
0.0
0.2
0.4
0.6
0.8
1.0
0.01 0.1 1 10 100 1000Bisphenol A concentration (µM)
B/B
0,m
ax
Figure 54. Competition curves with a varying ionic strength of the competition buffer (�= 200 mM;
�= 300 mM; � = 400 mM; �= 800 mM; � = 3000 mM)
Table 37. Estimated B0 and I50 values of competition curves as a function of the ionic strength of the
competition buffer
Ionic strength
(mM)
400 800 1600 2400 3000
B0 0.96 � 0.01 0.72 � 0.01 0.40 � 0.01 0.47 � 0.03 0.48 � 0.01
I50 (µM) 13.67 � 1.34 3.13 � 0.35 3.94 � 0.59 4.72 � 0.52 3.47 � 0 .37
As a conclusion, special attention to the ionic strength of the competition solution should be given.
In the presented experiment, bisphenol A was dissolved in distilled water. If real samples would be
analysed however, it should be realised that these may contain minerals as well. Consequently the

Use of Bisphenol A antibodies in enzyme-linked immunosorbent assays 154
Chemical interactions between packaging materials and foodstuffs
ionic strength of the competition buffer should be adjusted (e.g. by changing the amount of 4M
NaCl added) if necessary. In order to have an idea about the ionic strength of the dissolved sample,
a conductivity measurement could be useful since a linear relationship between the ionic strength
(0-1 M; conductivity ranging between 0-100 mS) and the conductivity of phosphor buffered saline
solutions was found (not shown). For more complex matrices however, as for example milk, this
methodology was not sufficient as presented elsewhere (paragraph 4.3.2.3). For such samples, ionic
strength should be adjusted until the optimal level is obtained and subsequently spiked samples
should be used for calibration.
From Figure 54 and Table 37, it was revealed as well that the sensitivity of the assay was lower than
expected (about 500 ppb), since immunoassays are known to be very sensitive. Therefore, further
attempts to improve assay sensitivity were performed.
4.3.2.1.2. Surface active agents in the competition buffer
Surface active compounds such as Tween 20 are frequently applied in immunoassays to reduce
non-specific interactions. Therefore the influence of the Tween 20 concentration on the assay
performance was evaluated. As can be seen from Figure 55, I50 values increased drastically due to
the presence of Tween 20 at several ionic strengths tested. Consequently, Tween 20 concentration
should be as low as possible to achieve better assay sensitivity. If no Tween 20 is present however,
reproducibility of the competition curves was very low. Similar observations were made previously
in a number of other immunoassays for organic compounds (Stanker et al., 1989; Chiu et al., 1995;
Abad and Montaya, 1997).
Apart from the effects on assay sensitivity, Tween 20 affected the maximum absorbance B0 as well:
B0 values became maximal at relative low Tween 20 concentrations (0.025 % v:v) at all ionic
strengths tested. These observations are not in complete agreement with those previously reported
by Abad and Montaya (1997) who found a constant decrease of the maximal absorbance as function
of the Tween 20 concentration. For the sake of completeness, it should be noted that at lower ionic
strengths then those reported in Figure 55, even higher maximal absorbance levels were observed,
which was in correspondence with the data shown in Figure 54 and Table 37.
Apart from Tween 20, also the use of Tween 60 was considered, but all competition curves were
characterized with higher I50 values at the same ionic strength and the same surfactant
concentration (0.01-0.015 % v:v). The use of potassium caseinate (0.1 % w:v) in the competition
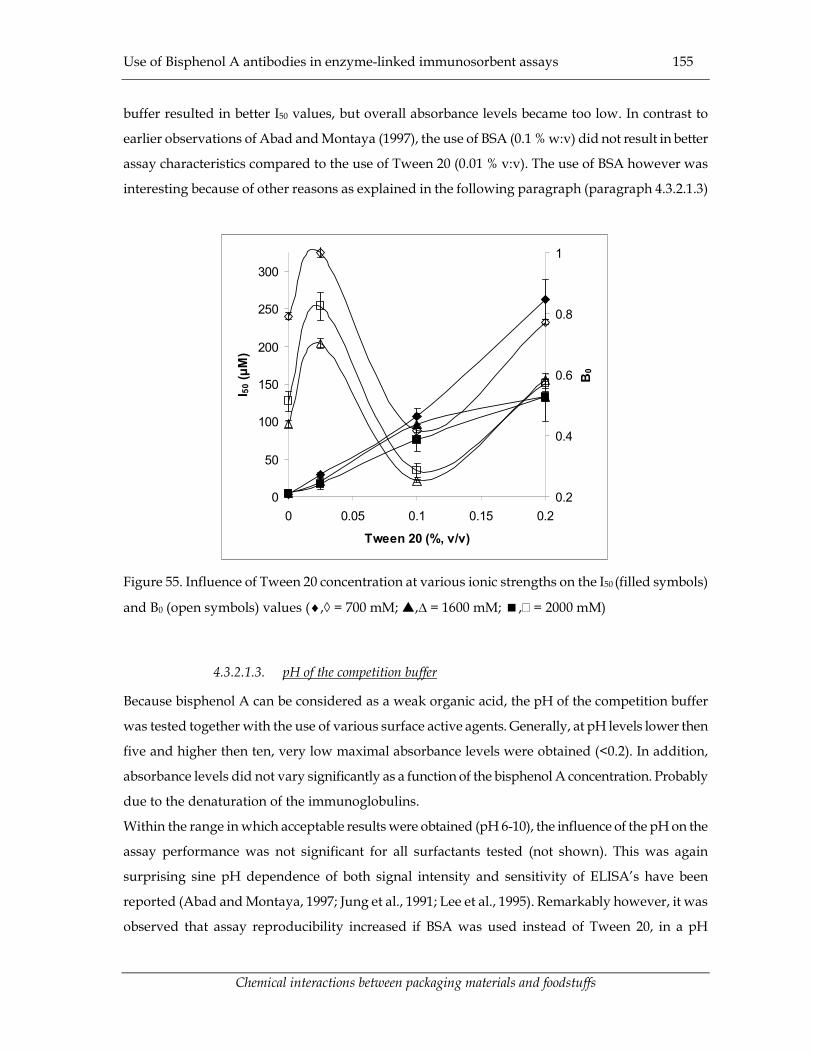
Use of Bisphenol A antibodies in enzyme-linked immunosorbent assays 155
Chemical interactions between packaging materials and foodstuffs
buffer resulted in better I50 values, but overall absorbance levels became too low. In contrast to
earlier observations of Abad and Montaya (1997), the use of BSA (0.1 % w:v) did not result in better
assay characteristics compared to the use of Tween 20 (0.01 % v:v). The use of BSA however was
interesting because of other reasons as explained in the following paragraph (paragraph 4.3.2.1.3)
0
50
100
150
200
250
300
0 0.05 0.1 0.15 0.2
Tween 20 (%, v/v)
I 50 (µ
M)
0.2
0.4
0.6
0.8
1
B0
Figure 55. Influence of Tween 20 concentration at various ionic strengths on the I50 (filled symbols)
and B0 (open symbols) values (�,◊ = 700 mM; �,� = 1600 mM; �,� = 2000 mM)
4.3.2.1.3. pH of the competition buffer
Because bisphenol A can be considered as a weak organic acid, the pH of the competition buffer
was tested together with the use of various surface active agents. Generally, at pH levels lower then
five and higher then ten, very low maximal absorbance levels were obtained (<0.2). In addition,
absorbance levels did not vary significantly as a function of the bisphenol A concentration. Probably
due to the denaturation of the immunoglobulins.
Within the range in which acceptable results were obtained (pH 6-10), the influence of the pH on the
assay performance was not significant for all surfactants tested (not shown). This was again
surprising sine pH dependence of both signal intensity and sensitivity of ELISA’s have been
reported (Abad and Montaya, 1997; Jung et al., 1991; Lee et al., 1995). Remarkably however, it was
observed that assay reproducibility increased if BSA was used instead of Tween 20, in a pH
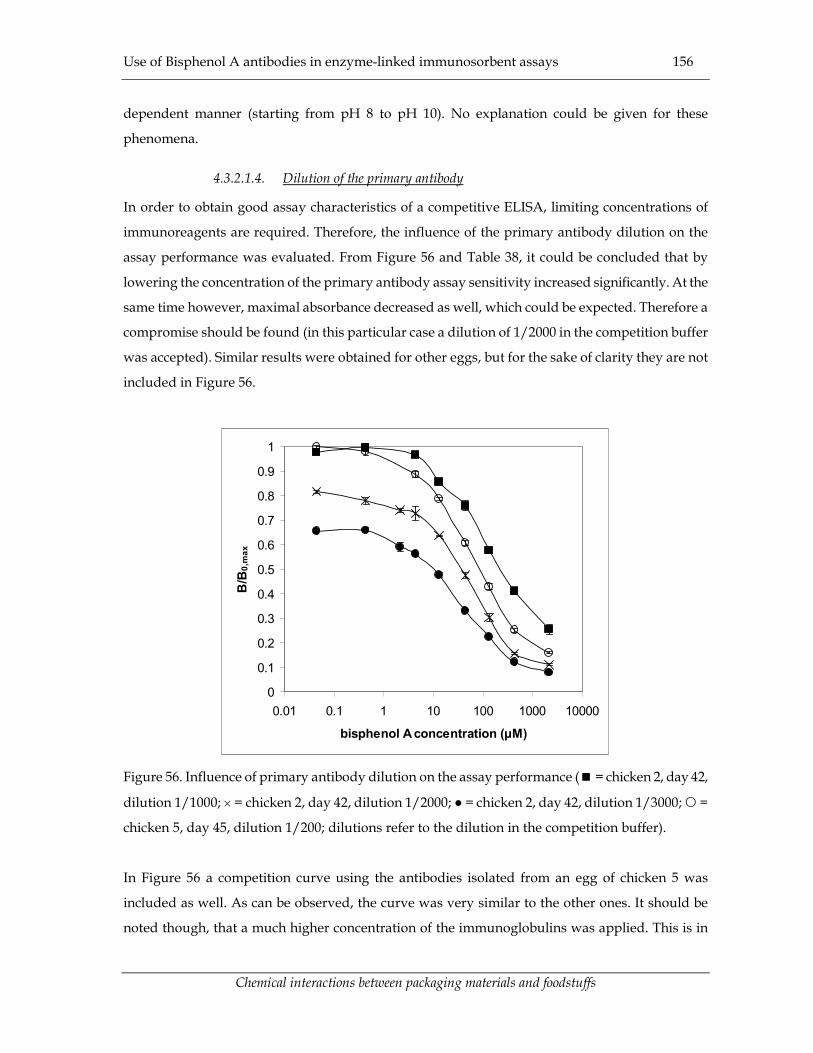
Use of Bisphenol A antibodies in enzyme-linked immunosorbent assays 156
Chemical interactions between packaging materials and foodstuffs
dependent manner (starting from pH 8 to pH 10). No explanation could be given for these
phenomena.
4.3.2.1.4. Dilution of the primary antibody
In order to obtain good assay characteristics of a competitive ELISA, limiting concentrations of
immunoreagents are required. Therefore, the influence of the primary antibody dilution on the
assay performance was evaluated. From Figure 56 and Table 38, it could be concluded that by
lowering the concentration of the primary antibody assay sensitivity increased significantly. At the
same time however, maximal absorbance decreased as well, which could be expected. Therefore a
compromise should be found (in this particular case a dilution of 1/2000 in the competition buffer
was accepted). Similar results were obtained for other eggs, but for the sake of clarity they are not
included in Figure 56.
0
0.1
0.2
0.3
0.4
0.5
0.6
0.7
0.8
0.9
1
0.01 0.1 1 10 100 1000 10000
bisphenol A concentration (µM)
B/B
0,m
ax
Figure 56. Influence of primary antibody dilution on the assay performance (� = chicken 2, day 42,
dilution 1/1000; � = chicken 2, day 42, dilution 1/2000; ● = chicken 2, day 42, dilution 1/3000; � =
chicken 5, day 45, dilution 1/200; dilutions refer to the dilution in the competition buffer).
In Figure 56 a competition curve using the antibodies isolated from an egg of chicken 5 was
included as well. As can be observed, the curve was very similar to the other ones. It should be
noted though, that a much higher concentration of the immunoglobulins was applied. This is in

Use of Bisphenol A antibodies in enzyme-linked immunosorbent assays 157
Chemical interactions between packaging materials and foodstuffs
correspondence with the results obtained previously with regard to the titers of these respective
eggs (Figures 47-48). So despite the fact that these immunoglobulins were not as reactive compared
to the immunoglobulins obtained from the eggs of chicken 2, they can be applied in immunoassays,
if their concentration is adjusted properly.
Table 38. Estimated B0 and I50 values of competition curves as a function of the dilution of the
primary antibody (all antibodies were from chicken 2, day 42, see also Figure 56)
Dilution of primary
antibody
1/1000 1/2000 1/3000
B0 1.00 � 0.01 0.81 � 0.01 0.65 � 0.01
I50 (µM) 128.85 � 22.28 52.82 � 7.19 37.40 � 4.73
Considering the dilution of the antibodies used, the volume of the isolated IgY solution obtained
from one egg (typically 2-3 mL) and the daily egg production, it becomes clear that a chicken offers
an almost infinite source of immunoglobulins. This is, as already mentioned in paragraph 3.1.4., one
of the major advantages of using chickens as host animals for antibody production.
4.3.2.1.5. Presence of chaotropic ions during the competition step
The use of so-called chaotropic ions, like thiocyanate, to improve assay characteristics has been
reported (Amano et al., 1995). Apart from thiocyanate also other ions are known to be chaotropic
such as perchlorate and iodide (Amano et al., 1995; Joyeux et al., 1996). Therefore their use was
considered as well in this study in order to evaluate their effect on the assay performance. Bromide,
which is also an halogen like iodide, was included as well for comparison purposes.
The results reported (Figure 57), indicate that the presence of the chaotropic ions resulted in a
concentration dependent decrease of the maximal absorbance (B0) for all ions studies, except for
bromide. The effect on assay sensitivity (I50) was especially pronounced if low concentrations of the
ion were present, except for thiocyanate. Again no significant effect for bromide could be observed
in the concentration range tested. It should be noted however that the effect on the assay sensitivity
was rather moderate for all the other ions studied.
Similar concentration dependent effects of chaotropic ions on the assay performance have been
reported (Nawa, 1992), although they were more pronounced. A possible explanation for the
improved assay characteristics is probably due to a lowering of the non specific interactions
between antigens and immunoglobulins because chaotropic ions are known to inhibit the formation
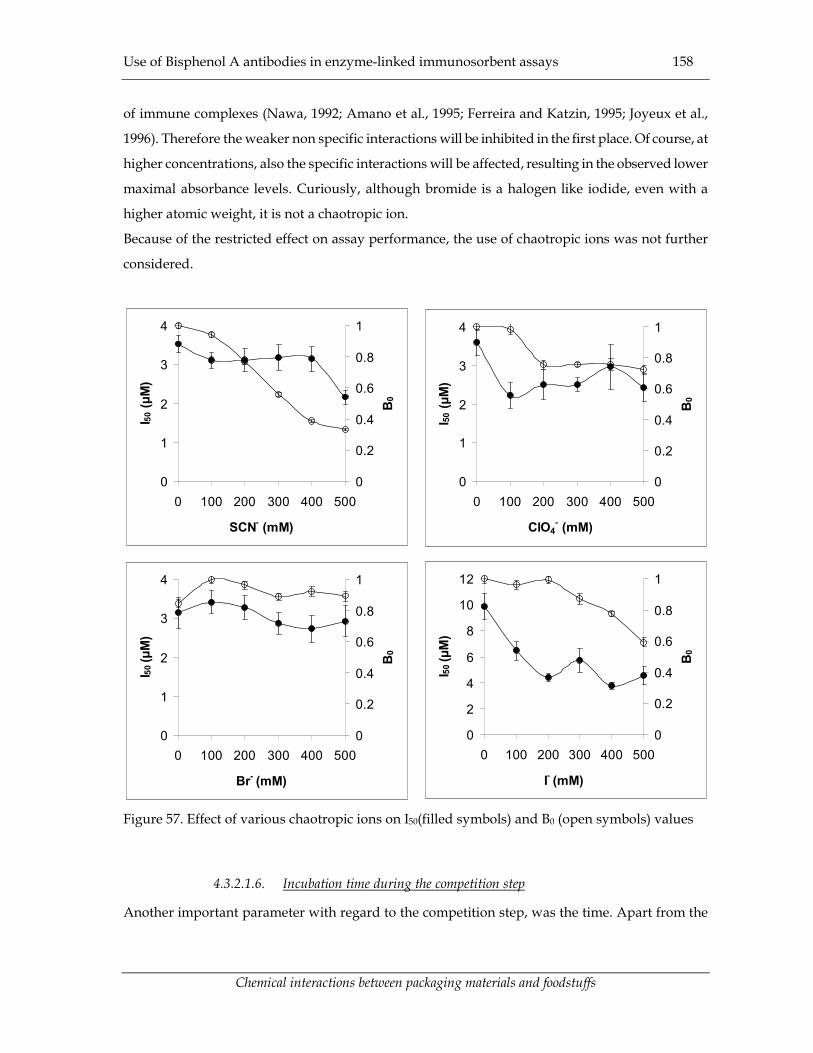
Use of Bisphenol A antibodies in enzyme-linked immunosorbent assays 158
Chemical interactions between packaging materials and foodstuffs
of immune complexes (Nawa, 1992; Amano et al., 1995; Ferreira and Katzin, 1995; Joyeux et al.,
1996). Therefore the weaker non specific interactions will be inhibited in the first place. Of course, at
higher concentrations, also the specific interactions will be affected, resulting in the observed lower
maximal absorbance levels. Curiously, although bromide is a halogen like iodide, even with a
higher atomic weight, it is not a chaotropic ion.
Because of the restricted effect on assay performance, the use of chaotropic ions was not further
considered.
0
1
2
3
4
0 100 200 300 400 500
SCN- (mM)
I 50 (µ
M)
0
0.2
0.4
0.6
0.8
1
B0
0
1
2
3
4
0 100 200 300 400 500
ClO4- (mM)
I 50 (µ
M)
0
0.2
0.4
0.6
0.8
1
B0
0
1
2
3
4
0 100 200 300 400 500
Br- (mM)
I 50 (µ
M)
0
0.2
0.4
0.6
0.8
1
B0
0
2
4
6
8
10
12
0 100 200 300 400 500
I- (mM)
I 50 (µ
M)
0
0.2
0.4
0.6
0.8
1
B 0
Figure 57. Effect of various chaotropic ions on I50(filled symbols) and B0 (open symbols) values
4.3.2.1.6. Incubation time during the competition step
Another important parameter with regard to the competition step, was the time. Apart from the
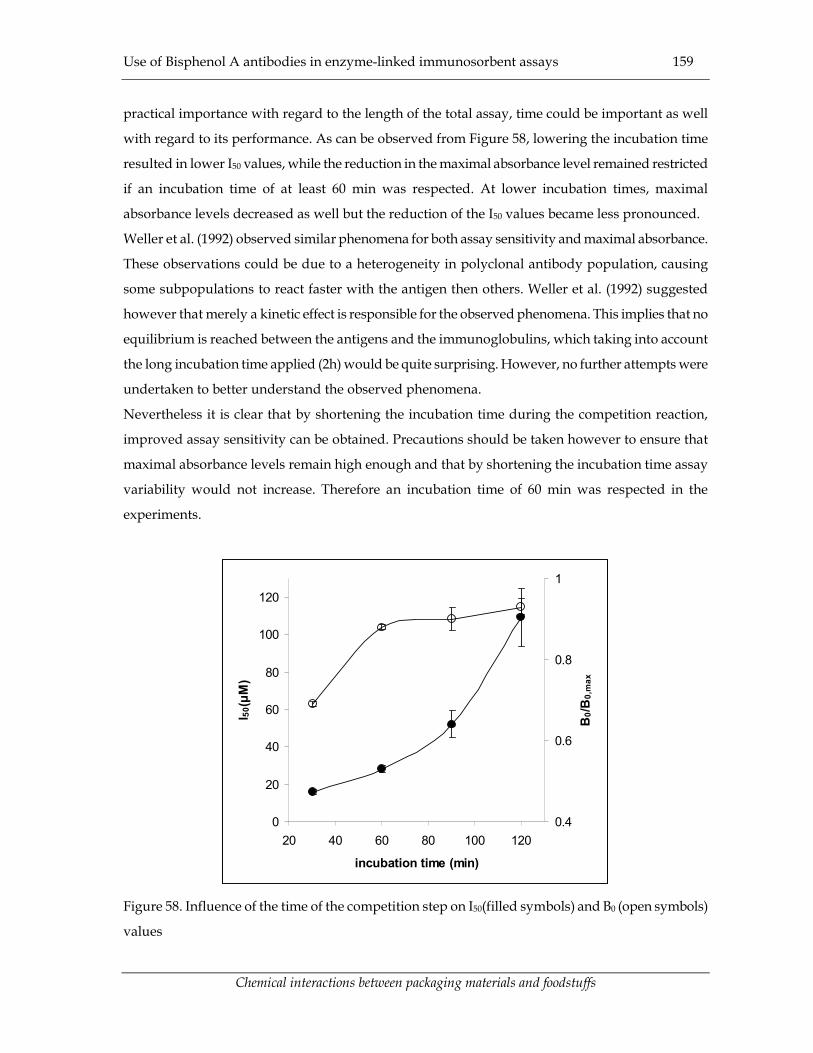
Use of Bisphenol A antibodies in enzyme-linked immunosorbent assays 159
Chemical interactions between packaging materials and foodstuffs
practical importance with regard to the length of the total assay, time could be important as well
with regard to its performance. As can be observed from Figure 58, lowering the incubation time
resulted in lower I50 values, while the reduction in the maximal absorbance level remained restricted
if an incubation time of at least 60 min was respected. At lower incubation times, maximal
absorbance levels decreased as well but the reduction of the I50 values became less pronounced.
Weller et al. (1992) observed similar phenomena for both assay sensitivity and maximal absorbance.
These observations could be due to a heterogeneity in polyclonal antibody population, causing
some subpopulations to react faster with the antigen then others. Weller et al. (1992) suggested
however that merely a kinetic effect is responsible for the observed phenomena. This implies that no
equilibrium is reached between the antigens and the immunoglobulins, which taking into account
the long incubation time applied (2h) would be quite surprising. However, no further attempts were
undertaken to better understand the observed phenomena.
Nevertheless it is clear that by shortening the incubation time during the competition reaction,
improved assay sensitivity can be obtained. Precautions should be taken however to ensure that
maximal absorbance levels remain high enough and that by shortening the incubation time assay
variability would not increase. Therefore an incubation time of 60 min was respected in the
experiments.
0
20
40
60
80
100
120
20 40 60 80 100 120
incubation time (min)
I 50(µ
M)
0.4
0.6
0.8
1B
0/B0,
max
Figure 58. Influence of the time of the competition step on I50(filled symbols) and B0 (open symbols)
values

Use of Bisphenol A antibodies in enzyme-linked immunosorbent assays 160
Chemical interactions between packaging materials and foodstuffs
4.3.2.1.7. Coating antigens
The influence of the coating antigen on the assay performance was evaluated as well. Using coating
antigen A (Table 32), it was observed that by increasing its concentration, higher I50 levels were
obtained (Figure 59). This seems logic because due to the competition reaction, higher amounts of
bisphenol A are necessary to prevent 50 % of the immunoglobulins from binding onto the increased
amount of coating antigen. The maximal absorbance increased as well until a plateau was reached,
indicating that all immunoglobulins were bound to the plate upon a particular antigen
concentration (� 3µg.mL-1) in absence of bisphenol A. Of course, at even higher coating antigen
concentrations, I50 values increased further on, because of the competition effect.
0
10
20
30
40
50
60
70
80
90
0 2 4 6 8 10 12
Coating antigen concentration (µg/mL)
I 50 (µ
M)
0.5
0.6
0.7
0.8
0.9
1
1.1
B0
Figure 59. Influence of the coating antigen A concentration on I50 (filled symbols) and B0 (open
symbols) values.
Because of these observations, other coating antigens were produced with a lower bisphenol A load
and similar experiments were performed. As can be seen from Figure 60, a similar trend as the one
observed in the previous experiments was obtained. It should be noted however that for the antigen
with the lowest bisphenol A load tested (coating antigen C), the decrease in I50 values was less
pronounced compared to the other antigens. Despite the bisphenol A load of the coating antigen B
was lower compared to coating antigen A, higher I50 values were observed at all concentrations

Use of Bisphenol A antibodies in enzyme-linked immunosorbent assays 161
Chemical interactions between packaging materials and foodstuffs
levels tested. This was surprising because of the earlier observations shown in Figure 59.
Presumably, apart from the number of bisphenol A molecules per coating antigen molecule, some
other factors are important as well. Possibly, for example the orientation of the bisphenol A
molecules on the coating antigen could change as well by changing its hapten load.
0
10
20
30
40
50
60
70
80
90
100
0 0.5 1 1.5 2 2.5
Coating antigen concentration (µg/mL)
I 50 (µ
M)
0.3
0.5
0.7
0.9
1.1
1.3
1.5
1.7
B0
Figure 60. Influence of the kind of coating antigen and its concentration on I50 (filled symbols) and B0
(open symbols) values (�,◊ = coating antigen A; �,� = coating antigen B; �,� coating antigen = C;
for the characteristics of these coating antigens: see Table 32)
4.3.2.1.8. Influence of tracer concentration
In final step of the ELISA before the enzymatic reaction, the secondary antibody enzyme conjugate
is added to detect the bound primary antibodies. Especially an effect on the maximal absorbance
level was observed (Figure 61). Although increasing I50 levels were obtained upon an increasing the
tracer concentration, the effect was not as intense in comparison to the other parameters already
studied.
4.3.2.1.9. Influence of tracer incubation time
In previous experiments (paragraph 4.3.2.1.6.), it was revealed that a decrease of the incubation time
during the competition reaction could improve assay sensitivity. Therefore the effects of the tracer

Use of Bisphenol A antibodies in enzyme-linked immunosorbent assays 162
Chemical interactions between packaging materials and foodstuffs
incubation time on the assay performance was evaluated as well. From Figure 62, it is obvious that
the observed effects are in correspondence with those reported previously. A decrease of the
incubation time resulted in an increased assay sensitivity, which on the other hand is counter-acted
via a decrease in maximal absorbance level.
50
55
60
65
70
75
80
85
90
95
100
0.5 1 1.5 2 2.5 3 3.5
concentration (µg/ml)
I 50(µ
M)
0.4
0.5
0.6
0.7
0.8
0.9
1
1.1
B0
Figure 61. Influence of the concentration of the secondary antibody-enzyme conjugate on the I50
(filled symbols) and B0 (open symbols) values

Use of Bisphenol A antibodies in enzyme-linked immunosorbent assays 163
Chemical interactions between packaging materials and foodstuffs
45
55
65
75
85
95
105
115
25 45 65 85
incubation time (min)
I 50 (µ
M)
0.7
0.8
0.9
1
1.1
1.2
1.3
B0
Figure 62. Influence of the incubation time during the detection reaction on on the I50 (filled
symbols) and B0 (open symbols) values
4.3.2.1.10. Influence of the chromogen
Since OPD is frequently applied as a chromogen in peroxidase-based immunoassays, this
chromogen was selected initially to conduct the experiments reported. Apart from OPD however,
also other chromogens are used, such as ABTS. Saunders (1979) intensively studied the applicability
of this chromogen and in fact preferred its use above OPD. Therefore its use was considered as well
in the present study. In Figure 63, two competition curves are represented using respectively OPD
and ABTS as a chromogen.
It is obvious that maximal absorbance levels using ABTS were considerably lower (mind the
difference in two absorbance scales !). On the other hand, lower blanc readings were observed as
well. Therefore, the lower maximal absorbance level was not considered as a major problem if ABTS
was used as a substrate. It should be noted as well that in other experiments, using another batch of
ABTS, higher maximal absorbance levels (up to 0.6) were observed, without any effect on the blanc
readings.
As can be observed, the competition curve obtained using ABTS as a chromogen is slightly shifted
to the right compared to OPD. This is reflected as well in the estimated I50 values : 2.40 µM � 0.19 for
ABTS and 11.36 µM � 0.67 for OPD (95 % confidence level). Possibly, the observed improvement in

Use of Bisphenol A antibodies in enzyme-linked immunosorbent assays 164
Chemical interactions between packaging materials and foodstuffs
assay sensitivity is due to the lower blanc absorbance levels if ABTS is used as a chromogen. Also in
other experiments in which higher maximal absorbances were obtained, significant improvement in
assay sensitivity was obtained if ABTS was used as a chromogen instead of OPD. Therefore, OPD
was replaced by ABTS during the course of this study as a chromogen.
0
0.2
0.4
0.6
0.8
1
1.2
1.4
0.01 0.1 1 10 100 1000 10000
Bisphenol A concentration (µM)
B (4
92 n
m)
-0.01
0.04
0.09
0.14
0.19
B (
405
nm)
Figure 63. Influence of the chromogen on the assay performance. (�,� : OPD, left absorbance
scale; �,◊ : ABTS, right absorbance scale; filled symbols refer to net absorbance readings, open
symbols refer to blanc absorbance readings)
4.3.2.2. Specificity of the indirect competitive ELISA
The specificity of the assay was evaluated for a number of compounds. Structural analogues, of
which several are allowed to be used within the EU for the production of plastic food contact
materials, were included. In addition some other phenolic compounds of which some are known to
be xeno- estrogenic (nonylphenol 82, butylhydroxyanisol 92) were studied. Apart from these
phenolic compounds however, also some other well known xeno-estrogenic compounds (dibenzyl
phthalate 2, butyl benzyl phthalate 3, BADGE 4) present in food contact materials were studied.
Results obtained for immunoglobulins isolated from one particular egg (chicken 2, day 42) are
summarized in Table 39.

Use of Bisphenol A antibodies in enzyme-linked immunosorbent assays 165
Chemical interactions between packaging materials and foodstuffs
As can be observed from this table, closely structural related compounds show cross reactivity :
Cumylphenol 73 and 3,4’-isopropylidene-diphenol 77 showed respectively about 40 and 30 % of
cross reactivity. Taking into account that only minor structural differences between these
compounds and the target molecule exist (removal of one hydroxyl group in the case of
cumylphenol 73 and the different position of one hydroxyl group on the phenolic ring structure for
3,4’-isopropylidene-diphenol 77), it is rather surprising to see that such small molecular differences
are detected by the immunoglobulins. Probably the selection of the hapten, used for the production
of the immunizing conjugate, could be the reason for the fairly high cross reactivity observed for
cumylphenol 73. It is surprising in this regard that for 4-hydroxydiphenylmethane 72 (replacement
of one hydroxyl group with one methyl group with respect to bisphenol A) a strong reduction in
cross reaction was detected. Possibly the higher apolar character of this compound could be an
explanation for this phenomenon. It should be noted in this respect that the cross reactivity
observed could be an advantage as well. Probably, molecules with a strong structural similarity as
bisphenol A 1, could have a similar toxicological profile. Therefore, the detection of these analogues
could be of interest from a food safety point of view as well.
As can be observed, removal of one of the central methyl groups (4, 4’-ethylidenebisphenol 71),
reduced cross reactivity drastically up to almost 20 %, while total removal of these central methyl
groups (bis-(4-hydroxyphenyl)-methane 70) resulted in even lower molecular recognition.
Replacement of the methylgroups with other functional groups gave similar results (2,2-bis-(4-
hydroxyphenyl)-perfluorpropane 74; 4,4’-(1-phenylethylidene)bisphenol 75; 4,4’-
cyclohexylidenebisphenol 85; 4,4’-dihydroxybiphenyl 88; 4, 4’-dihydroxybenzophenon 89; bis-(4-
hydroxyphenyl)-sulphone 90). This indicates that the central methyl groups play an important role
in the immunochemical recognition reaction. This is an important observation since the hapten used
for antigen synthesis was selected in such a way that these central methyl groups were both
present.
Bisphenol A analogues in which the two phenolic groups are separated with a supplementary
aromatic ring (4,4’-(1,4-phenylene-diisopropylidene)-bisphenol 86; 4,4’-(1,3-phenylene-
diisopropylidene)bisphenol 87) , did show some limited cross reactivity. This could not be due to
the recognition of one single phenolic group, since cross reactivity versus phenol 78 could not be
observed. If on the other hand other functionalities are introduced in the phenolic structure, some
molecular recognition seemed to occur, taking into account the results observed for 4-butylphenol
81. Presumably, the presence of an apolar group in combination with the phenolic moiety enhances
immunological reactivity. If this apolar group became more voluminous, like in the case of

Use of Bisphenol A antibodies in enzyme-linked immunosorbent assays 166
Chemical interactions between packaging materials and foodstuffs
nonylphenol 82, or smaller, like in the case of the cresols 79 and 80, cross reactivity was reduced
again. Therefore, probably butylhydroxyanisol 92 showed some unexpected appreciable cross
reactivity. It should be noted in this respect as well that both nonylphenol 82 and
butylhydroxyanisol 92 are reported to be xeno-estrogenic compounds, like bisphenol A.
Replacement of the apolar moiety with a supplementary hydroxylgroup (dihydroxy benzenes 83
and 84) resulted in low cross reactivity as well. Replacement of the phenolic functionality as such by
other groups (benzylalcohol 91, benzoic acid 93) gave similar results.
Other xeno-estrogenic compounds, that can be present in plastic food contact materials, such as the
studied phthalates could not be recognized by the immunoglobulins. This clearly indicates that no
link between the xeno-estrogenic character and the immunological recognition is present. This is in
correspondence with the data observed for another xeno-estrogenic compound, BADGE, which
shows some structural similarities with bisphenol A.
Cross reactivity for a selected number of compounds (70, 71, 78, 88, 89, 92) was also studied for eggs
from the same chicken isolated on other days. No significant differences could be observed with the
data reported in Table 39 (not shown). This does not seem surprising since the immunoglobulins
originated from the same chicken. Therefore the same compounds were evaluated with respect to
the immunoglobulins isolated from an egg of chicken 5 (day 45). Again, comparable levels of cross
reactivity were obtained : bis-(4-hydroxyphenyl)-methane 70 (2 %) ; 4, 4’-ethylidenebisphenol 71 (19
%) ; butylhydroxyanisol 92 (14 %).
As a conclusion, the presented assay can be considered as very specific, although for some
structural analogues important cross reactivity was observed. Moreover, it seems that comparable
levels of cross reactivity were observed irrespective of the data of egg production or of the chicken
producing the egg.

Use of Bisphenol A antibodies in enzyme-linked immunosorbent assays 167
Chemical interactions between packaging materials and foodstuffs
Table 39. Cross reactivities of the immunoglobulins isolated from the egg of day 45, from chicken 2
Chemical structure Name Cross reactivity (%)
R4R1
R3R2
R2,R3 = CH3, R1,R4 = OH
R2,R3 = H, R1,R4 = OH
R2= CH3, R3 = H, R1,R4 = OH
R1,R2,R3 = H, R4 = OH
R1=H, R2,R3 = CH3, R4 = OH
R2,R2 = CF3, R1,R4 = OH
R2= CH3, R3 = C6H5, R1,R4 = OH
bisphenol A 1
bis-(4-hydroxyphenyl)-methane 70
4, 4’-ethylidenebisphenol 71
4-hydroxydiphenylmethane 72
4-cumylphenol 73
2,2-bis-(4-hydroxyphenyl)-perfluorpropane 74
4,4’-(1-phenylethylidene)bisphenol 75
100
5
18
3
43
3
<0.1
R6R2
R5R3
R1 R7
R4
R1, R3,R5,R7 = CH3, R2,R6 = OH, R4 = H
R1, R2,R3,R5,R7 = H, R4,R6 = OH,
4,4-isopropylidene bis(2,6-dimethylphenol) 76
3,4’-isopropylidene-diphenol 77
<0.1
32
O
O
O
O
R2
R1
R1, R2 = C4H9
R1= C4H9, R2 = C6H5
di-n-butyl phthalate 2
butyl benzyl phthalate 3 <0.1
<0.1
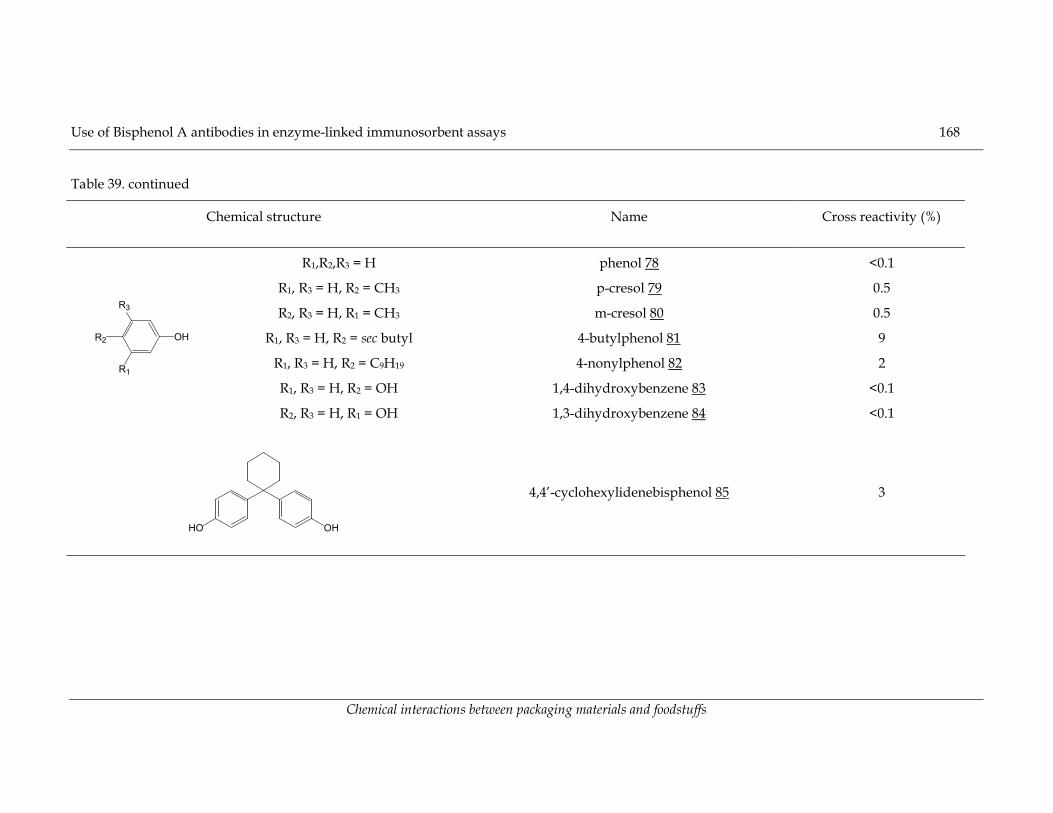
Use of Bisphenol A antibodies in enzyme-linked immunosorbent assays 168
Chemical interactions between packaging materials and foodstuffs
Table 39. continued
Chemical structure Name Cross reactivity (%)
OH
R3
R1
R2
R1,R2,R3 = H
R1, R3 = H, R2 = CH3
R2, R3 = H, R1 = CH3
R1, R3 = H, R2 = sec butyl
R1, R3 = H, R2 = C9H19
R1, R3 = H, R2 = OH
R2, R3 = H, R1 = OH
phenol 78
p-cresol 79
m-cresol 80
4-butylphenol 81
4-nonylphenol 82
1,4-dihydroxybenzene 83
1,3-dihydroxybenzene 84
<0.1
0.5
0.5
9
2
<0.1
<0.1
OHHO
4,4’-cyclohexylidenebisphenol 85 3

Use of Bisphenol A antibodies in enzyme-linked immunosorbent assays 169
Chemical interactions between packaging materials and foodstuffs
Table 39. continued
Chemical structure Name Cross reactivity (%)
HO OH
4,4’-(1,4-phenylene-diisopropylidene)-bisphenol
86 2
HO
OH
4,4’-(1,3-phenylenediisopropylidene)bisphenol 87 0.5
OHHO
4,4’-dihydroxybiphenyl 88 <0.1
OHHO
O
4, 4’-dihydroxybenzophenon 89 0.1
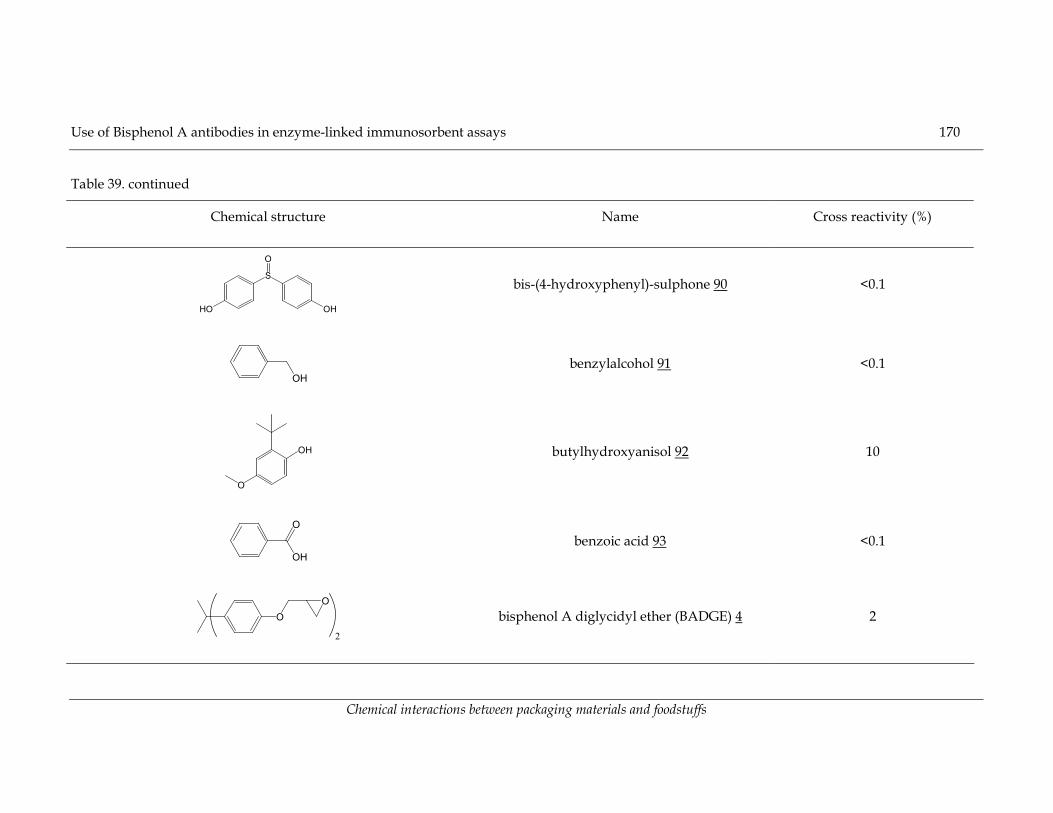
Use of Bisphenol A antibodies in enzyme-linked immunosorbent assays 170
Chemical interactions between packaging materials and foodstuffs
Table 39. continued
Chemical structure Name Cross reactivity (%)
S
OHHO
O
bis-(4-hydroxyphenyl)-sulphone 90 <0.1
OH benzylalcohol 91 <0.1
OH
O
butylhydroxyanisol 92 10
OH
O
benzoic acid 93 <0.1
OO
2 bisphenol A diglycidyl ether (BADGE) 4 2

Use of Bisphenol A antibodies in enzyme-linked immunosorbent assays 171
Chemical interactions between packaging materials and foodstuffs
4.3.2.3. Application of the indirect competitive ELISA for dairy emulsions
Because polycarbonate bottles can be re-used, their application for the packaging of pasteurised
milk increases. The use of polycarbonate baby-bottles becomes also more popular then the use of
the traditional glass bottles, because of their superior physical properties. However, due to the
washing of the bottles, a partial degradation of the polymer can not be excluded. As indicated in the
first chapter, an accelerated migration of bisphenol A from the bottle could occur in these
circumstances. Therefore it would be interesting to have a tool which is able to check the migration
immediately in the food of interest, which in this particular case is milk. Current analytical methods
which are available for bisphenol A analysis would require extensive extraction and clean-up steps
to tackle this analytical problem as shown in chapter 1. Since milk is an aqueous liquid, it would be
possible to apply it directly in the presented assay. This would be a major advantage compared to
the traditional analytical techniques.
Initial experiments on whole reconstituted milk revealed a strong reduction in assay quality
(increased I50 and reduced B0). Because comparable results were obtained for skimmed reconstituted
milk, the reduced assay performance could not solely be due to an absorption of bisphenol A by the
fat globules rendering it unavailable for immunochemical reactions (results not shown).
Since milk contains an appreciable amount of salts, the ionic strength of the competition buffer was
adjusted because of the earlier observations with regard to the influence of ionic strength on the
assay performance. From Figure 64, it is obvious that at the ionic strengths of the competition
buffer, which are comparable to those normally used if aqueous bisphenol A solutions are analysed,
reduced B0 and increased I50 levels were obtained, confirming the results mentioned above. By
lowering the ionic strength of the competition buffer, competition curves are gradually shifted
towards the competition curve observed for aqueous bisphenol A solutions. Consequently, the
assay performance could be influenced in such a way that the inhibition curves obtained in milk
were almost similar to those obtained in water.
In a supplementary experiment, the difference between milk samples with a varying fat content was
evaluated (skimmed, semi-skimmed, whole milk). From Figure 65 it is clear that no differences
between the semi-skimmed and whole milk could be observed, while the differences with the
skimmed milk were very small. In fact, no significant differences in I50 levels were observed for all
three samples (26.04� 1.84 µM; 23.92 �1.32 µM; 26.60� 1.38 µM; for skimmed, semi-skimmed and
whole milk respectively). Consequently it can be concluded that the reduced assay sensitivity
compared to the assay in water can not be due to the absorption of the bisphenol A by the fat
globules. Since bisphenol A is an apolar compound it can be expected it is indeed partially absorbed

Use of Bisphenol A antibodies in enzyme-linked immunosorbent assays 172
Chemical interactions between packaging materials and foodstuffs
by the fat. Therefore the immunglobulins seems able to interact at the water-oil interface inducing
immunochemical reaction the bisphenol A molecules.
0.0
0.1
0.2
0.3
0.4
0.01 0.10 1.00 10.00 100.00 1000.00
Bisphenol A concentration (µM)
B (4
05 n
m)
Figure 64. Competition curves obtained in skimmed milk at selected ionic strengths of the
competition buffer (aqueous bisphenol A solution : ◊ = 700 mM; bisphenol A in milk : �= 140 mM; �
= 220 mM; � = 300 mM; � = 400 mM; �= 600 mM)
The observed differences between the competition curves obtained in milk or in water can be
attributed to the complex sample matrix. Proteins or specific interactions with minerals like iodine,
as illustrated in a previous paragraph (4.3.2.1.5), could be responsible for the observed differences.
It can be concluded that the assay can be applied for the direct analysis of milk samples, without
any need of sample pre-treatment. Because of the observed matrix effects however, it should be
realised that a calibration with a sample of similar composition is necessary. Moreover it is clear that
due to these matrix effects, assays sensitivity decreases.

Use of Bisphenol A antibodies in enzyme-linked immunosorbent assays 173
Chemical interactions between packaging materials and foodstuffs
0.00
0.05
0.10
0.15
0.20
0.25
0.30
0.35
0.40
0.001 0.01 0.1 1 10 100 1000
Bisphenol A concentration (µM)
B (4
05 n
m)
Figure 65. Competition curves obtained in skimmed (�), semi-skimmed (�) and whole milk (�)
4.3.2.4. Application of the indirect competitive ELISA for fatty foods
From the first chapter it could be concluded that migration of bisphenol A is especially important in
fatty food matrices. Therefore the applicability of the assay for the quantification of bisphenol A in
lipids was investigated. Of course, the lipid extract or the oil can not be used as such in the assay. A
draft CEN procedure was prepared for the quantification of bisphenol A in oil. This method is
based on an extraction of bisphenol A from the oil using an aqueous methanol solution (50 % v:v)
and subsequent HPLC-UV analysis (Franz and Rijk, 1996). If the aqueous methanolic extract could
be applied in the assay as such, the instrumental analytical procedure in the CEN method could be
avoided. Therefore the assay characteristics were evaluated as a function of the methanol
concentration in the competition buffer (Figure 66).
The presence of methanol during the competition step resulted in a significant concentration
dependent decrease in the B0 and I50 levels. At the highest methanol concentration tested, high assay
variability was observed as well. This is in correspondence with the results obtained by Abad and
Montaya (1997) who investigated the influence of several organic solvents on the characteristics of a
carbaryl assay. Probably the denaturating effect of the alcohol on proteins is responsible for these
effects.

Use of Bisphenol A antibodies in enzyme-linked immunosorbent assays 174
Chemical interactions between packaging materials and foodstuffs
0
5
10
15
20
25
30
35
40
45
0 10 20 30 40
MeOH (%)
I50 (µ
M)
0
0.1
0.2
0.3
0.4
0.5
0.6
0.7
B0
Figure 66. Influence on methanol during the competition on the I50(filled symbols) and B0 (open
symbols).
Despite of the observed effects, the presence of about 10 % of methanol resulted in an I50 value
which is still lower compared to those obtained in optimal conditions in milk. Therefore such
methanol concentrations are considered to be acceptable and moreover, the dilution necessary to
reach this level remains restricted. Taking into account the sensitivity loss due to the dilution of the
aqueous methanolic extract and the sensitivity loss due to the presence of methanol, even higher
concentrations could be tolerated. Consequently, the presented assay could be applicable for the
analysis of lipidic matrices, again taking into account that the overall sensitivity of the assay is
rather restricted.
4.3.3. Conclusions
An indirect competitive enzyme-linked immunosorbent assay could be developed using the
antibodies isolated from the eggs of BSA-bisphenol A immunized chickens. The sensitivity of the
assay was however lower then could be expected from other immunoassays in general and from
assays recently developed for bisphenol A analysis (Kodeira et al., 2000; Nishii et al., 2000; Ohkuma
et al., 2002). A step-wise approach was followed to increase the assay sensitivity by varying several
assay parameters. Only a slight improvement of the assay sensitivity compared to the first
experiments could be obtained. From these experiments, it seemed that care should be taken to

Use of Bisphenol A antibodies in enzyme-linked immunosorbent assays 175
Chemical interactions between packaging materials and foodstuffs
avoid matrix dependent effects on assay performance (e.g. salt effects, surface active agents).
Despite the fact that assay sensitivity was lower then expected, the specificity of the assay to various
bisphenol A like molecules, which could migrate from food contact materials was evaluated. In
addition, also some other phenolic compounds and xeno-estrogenic compounds were investigated.
Generally, the assay could be considered to be very specific.
Finally, the applicability of the assay for the analysis of relevant food samples was investigated.
Only a slight decrease in assay sensitivity was observed if the assay was applied for the direct
analysis of milk. For fatty foods, a simple extraction with a aqueous methanol solution followed by
a restricted dilution of the extract to reduce the methanol concentration, similar results could be
obtained. Both examples illustrate the potency of the developed assay.
Use of Bisphenol A antibodies in enzyme-linked immunosorbent assays 137
Chemical interactions between packaging materials and foodstuffs
4. Use of Bisphenol A antibodies in enzyme-linked
immunosorbent assays
4.1. Introduction
As already emphasised in Chapter 3, antibodies can be applied for various purposes. One of the
more important analytical applications are the so-called enzyme-linked immunosorbent assays
(ELISA’s). Such assays are based on the chemical conjugation of an enzyme to either an antigen or
an antibody (‘enzyme-linked’), which allows the detection of immuno complexes formed on a solid
phase (‘immunosorbent’). This is because the fixed enzyme, once the free reagents present in excess
are washed away, can yield a coloured product upon the addition of a substrate and a suitable
chromogen. This general principle can be applied in various formats. In this introduction, only the
assay examined in the reported experimental work is briefly presented.
In the previous chapter (Chapter 3), the indirect non-competitive ELISA has been used for the
detection of bisphenol A- specific antibodies in the IgY isolate from immunized chickens. A similar
format, but in a competitive mode, was used intensively to evaluate the usefulness of the isolated
antibodies for the quantification of bisphenol A. As indicated in Figure 50, after coating of the multi-
well plates with coating antigen and blocking the remaining available binding places, both the
antibodies and the sample containing the analyte are added to the wells. Consequently a
competition arises between the free and bound antigen to bind to the antibodies. After removal of
the excess of primary antibodies, a tracer is added. This tracer consists of a secondary anti IgY
antibody linked to an enzyme. Again, the tracer in excess is removed after incubation. Subsequently
the substrate of the enzyme together with a chromogen are added. After the enzymatic reaction, the
tracer can be quantified due to the colour change of the chromogen. Thus the amount of bound
primary antibody (bisphenol A antibody) is determined indirectly.
The main objective of this research was to investigate whether the isolated antibodies could be used
in such an enzyme-linked immunosorbent assay for the quantification of bisphenol A in relevant
matrices. Therefore, the influence of several parameters on the assay performance was investigated.
Subsequently, the specificity of the assay was studied. Finally, the assays applicability to analyse
bisphenol A in real food matrices was explored.

Use of Bisphenol A antibodies in enzyme-linked immunosorbent assays 138
Chemical interactions between packaging materials and foodstuffs
Figure 50. Schematic representation of an indirect competitive ELISA
4.2. Materials and Methods
4.2.1. Reagents and buffers
In addition to the reagents mentioned in paragraph 3.2.1, the following reagents and buffers were
used, unless otherwise mentioned.
4, 4’-Dihydroxybenzophenon 99%, 4, 4’-ethylidenebisphenol 99%, 4-cumylphenol 99%, bis-(4-
hydroxyphenyl)-methane 98%, p-cresol 99%, m-cresol 99% , 4-hydroxydiphenylmethane 99%, 4,4’-
cyclohexylidenebisphenol 98%, 2,2-bis-(4-hydroxyphenyl)-perfluoropropane 97%, bis-(4-
hydroxyphenyl)-sulphone 98%, 4,4’-(1,4-phenylene-diisopropylidene)-bisphenol 98%, 4,4’-
isopropylidene bis(2,6-dimethylphenol) 98%, 3,4’-isopropylidene-diphenol 98%, 4,4’-(1,3-
phenylenediisopropylidene)bisphenol 99%, 1,4-dihydroxybenzene, 4,4’-dihydroxybiphenyl 97%,
butyl benzyl phthalate, 4-butylphenol and 4,4’-(1-phenylethylidene) bisphenol 99% were from
Aldrich Chemical Company, USA. Benzoic acid pa was obtained from Chem-Lab, Belgium.
Butylhydroxyanisol was from Koch-light laboratories, England. BADGE was a generous gift from
Ciba Specialty Chemicals, Belgium. 1,3-dihydroxybenzene, potassium thiocyanate and sodium
bromide were purchased from UCB, Belgium. Phenol 99%, 4-nonylphenol (mixture of isomers) 99%,
Use of Bisphenol A antibodies in enzyme-linked immunosorbent assays 139
Chemical interactions between packaging materials and foodstuffs
di-n-butyl phthalate, benzyl alcohol, sodium perchlororate, EDTA, di-sodium EDTA and potassium
iodide were from Acros Organics, USA. 2,2’-azino-bis(3-ethylbenzthiazoline-6-sulfonic acid) 98 %
(ABTS) was from Sigma Chemical, USA. Commercial sunflower oil was obtained from
Vandemoortele (Belgium).
All reagents used were of analytical grade or better, unless otherwise mentioned.
If ABTS was used as a detection reagent, substrate buffer (pH 4.0) consisted of 0.05 M tri-sodium
citrate in distilled water. Substrate solution consisted of 30 mg ABTS in 100 mL of substrate buffer
to which just before use 5 mL of 6 % (v:v) H2O2 was added. Stop solution was a 0.1 M HF, 0.008 M
NaOH and 0.001 M Na2EDTA solution.
Aqueous solutions of bisphenol A and the substances for which cross reactivity was evaluated were
prepared as follows. One gram of substance was dissolved in 50 mL of methanol and this solution
was diluted in water up to the desired concentration. Methanol concentration in the final solutions
was considered to be negligible (constant concentration 1.5% v:v). For aqueous methanolic
bisphenol A solutions, in which higher concentrations of methanol were used, methanol was added
additionally till the desired concentration was reached.
4.2.2. Initial experiments
4.2.2.1. Enzymatic reactions
For all enzymatic reactions, the secondary antibody–horseradish peroxidase conjugate was diluted
up to a concentration of 1.35 µg.mL-1 in substrate buffer. Of this solution, 25 µL was added to each
well of a 96-well plate (polystyrene, Corning Flat bottom) together with 100 µL of the appropriate
substrate solution (in triplicate). After 30 minutes of incubation at 37°C, 25 µL of the appropriate
stop solution was added to each well and absorbance was measured within five minutes after the
addition of the stop solution at the specified wavelengths (for OPD 492 nm; for ABTS 405 nm) on a
Titertek multiskan plus MK II (USA). Composition of substrate buffers and solutions are given
elsewhere (paragraphs 3.2.1 and 4.2.1). Blanc experiments refer to experiments in which the
addition of enzyme solution was replaced by the addition of the same volume substrate buffer.
These conditions were used unless otherwise mentioned.
4.2.2.2. Signal reading and plate studies
Three plate readers were evaluated : Organon technika (The Netherlands), Titertek multiskan (USA)
and the Titertek multiskan plus MK II (USA).
To evaluate the repeatability of the readers, 200 µL of a diluted OPD solution was added to each
Use of Bisphenol A antibodies in enzyme-linked immunosorbent assays 140
Chemical interactions between packaging materials and foodstuffs
well of a 96-well plate (polystyrene, Corning Flat bottom). The OPD solution was prepared by
mixing 1 mL of a secondary antibody–horseradish peroxidase conjugate dilution as obtained
previously (paragraph 4.2.2.1) with 4 mL substrate solution (paragraph 4.2.2.1) and by subsequent
incubation of this mixture for 60 minutes at 37°C. After the addition of the stop solution (1 mL), the
mixture was diluted with substrate buffer until the absorbance amounted approximately 1.0.
For the evaluation of the plates, the ELISA protocol described in paragraph 3.2.5 was followed with
the following modification. Instead of adding different IgY dilutions in each well, the same (1/4000)
IgY dilution of one particular egg (chicken 2, day 42) was added to each well, obtaining an overall
absorbance of about 1.0.
4.2.2.3. Blocking solution studies for the indirect ELISA
For the evaluation of the blocking solutions, the ELISA protocol described in paragraph 3.2.5 was
followed, with exception of the blocking solution described. Blanc experiments refer to experiments
in which primary antibodies were isolated from the eggs of non immunized chickens.
4.2.3. Immunosorbent assays
4.2.3.1. Indirect competitive ELISA
4.2.3.1.1. Assay optimisation experiments
General conditions of the immunoassay
Ninety-six well F 96 Maxisorp Nunc immuno plates from Nunc (Denmark) or Greiner plates
(Microlon ® 600, flat bottom, extra high binding capacity, Germany) were coated with coating
antigen A solution (12.5 µg.mL-1 coating buffer, 100 µL/well) by overnight incubation at 4°C in the
dark. Plates were washed three times (200 µL wash solution/well) and blocked (200 µL blocking
solution/well) for 2 h at RT, in the dark. Afterwards the plates were washed twice as previously.
For the competition step, 50 µL of the appropriate bisphenol A-dilution and 50 µL of the primary
antibody solution were added to each well. Primary antibodies were diluted as follows : 20 µL of
the original primary antibody solution in PBS was further diluted to 7.24 mL with PBS.
Subsequently, 26.64 mL PBS containing 0.3 % (w:v) BSA, 520 µL NaOH 0.1N and 5.6 mL of a 4M
NaCl solution were added, obtaining a final dilution of the primary antibody of 1/2000, a pH of 8.0,
a BSA concentration of 0.2 % (w:v) and a calculated ionic strength of 700 mM. This dilution is
referred to as the competition buffer. The plates were incubated for 1 h at 37°C. Afterwards, the
plates are washed as described above (three times). For the detection reaction, the HRP-conjugated

Use of Bisphenol A antibodies in enzyme-linked immunosorbent assays 141
Chemical interactions between packaging materials and foodstuffs
secondary antibody was added (100 µL/well, 3.4 µg.mL-1 dilution buffer). After 1 h incubation at
37°C and washing of the plates (three times), 100 µL/well of substrate solution was added, followed
by an additional incubation for 1h at 37°C. Finally 25 µL/well of the appropriate stop solution was
added before measuring the absorbance at the appropriate wavelength within 5 minutes (492 nm).
Absorbances were corrected for blanc readings obtained by using immunoglobulins isolated from
the eggs of non immunized chickens. As detection reagent, OPD was used.
These conditions were followed unless otherwise stated.
Ionic strength studies
The general assay conditions were applied except for the amount of 4 M NaCl added to the
competition buffer, which was adjusted to vary its ionic strength. The amount of PBS was reduced
accordingly, keeping the primary antibody concentration constant for all experiments. If necessary
the addition of NaCl solution was replaced by the addition of deionised water. The ionic strength
was calculated using the following formula
��
i
2iifd2
1I [41]
where I is the ionic strength, d is the concentration of each ion and f is its charge. Reported ionic
strengths refer to those of the diluted IgY solution before it is applied in the assay. BSA itself was
not present in the competition buffer for the reported experiment.
Surface active component studies
The influence of the following surface active agents in the competition buffer was evaluated using
the general assay format, as a function of the ionic strength and their concentration: bovine serum
albumin (0.2 % w:v), Tween 20 (0-0.4 % v:v) and potassium caseinate (0.2 % w:v).
pH studies
The amount of NaOH (0.1 N) or HCl (0.1 N) added to the competition buffer was adjusted together
with the amount 4 M NaCl and PBS in such a way that the desired pH was reached, keeping the
ionic strength constant. Initially these studies were performed using Tween 20, but apart from this
surfactant also potassium caseinate (0.2% w:v) and BSA (0.2% w:v) were used respectively.
Otherwise the general assay conditions were used.
Chaotropic ions
The optimised assay format was used in these experiments, but the amount of 4M NaCl added to
the competition buffer was adjusted in such a way that the addition of the chaotropic ions at the
indicated concentrations did not influence the final ionic strength of the competition buffer.
Coating antigen studies
Use of Bisphenol A antibodies in enzyme-linked immunosorbent assays 142
Chemical interactions between packaging materials and foodstuffs
Three different coating antigens, as indicated in Table 32, were used at varying concentrations (0.4-
12.5 µg.mL-1) during the coating of the multi-well plates. Otherwise the general assay format was
followed.
Chromogen
The optimised assay format was followed, except that if OPD was used as a substrate, conditions of
the enzymatic reactions were adjusted accordingly.
For all other experiments, the general assay format was used, except for the specified parameter
which was varied as indicated.
4.2.3.1.2. Assay specificity
Competitive assays using coating antigen C (0.8 µg.mL-1 in coating buffer) were performed
according to the general assay format, using various structural bisphenol A analogues to determine
their respective I50 values (µM). I50 is the concentration of the analyte at which half of the maximal
signal intensity is reached. Cross reactivity was calculated as (e.g. Abad and Montaya, 1997)
100II
(%) reactivity Crosscompound 50,
A bisphenol 50,�� [42]
4.2.3.1.3. Application of the indirect competitive ELISA for dairy emulsions
Competitive immunoassays according to the optimised assay format were accomplished using milk
samples which were spiked with bisphenol A at the appropriate concentration. Reconstituted milk
was prepared as follows: 10 g of skimmed milk powder is dissolved in 60 mL of distilled water. For
the addition of bisphenol A, the appropriate aqueous solution was added at this stage as well. If
necessary, sunflower oil at the appropriate concentration is emulsified in the dispersion using an
Ultraturrax mixer at moderate speed. Afterwards, the mixture is diluted till a final volume of 100
mL is reached. Pasteurized milk samples, packed in PET bottles at various fat contents were
obtained from retail shops. These samples were spiked with a concentrated methanolic bisphenol A
solution, keeping the methanol concentration constant at 1.5 % (v:v).
4.2.3.1.4. Application of the indirect competitive ELISA for fatty foods
Competitive immunoassays according to the optimised assay format were accomplished using
aqueous methanolic bisphenol A solutions at the appropriate methanol and bisphenol A
concentration.

Use of Bisphenol A antibodies in enzyme-linked immunosorbent assays 143
Chemical interactions between packaging materials and foodstuffs
4.2.3.1.5. Optimised format
Ninety-six well F 96 Maxisorp Nunc immuno plates from Nunc (Denmark) or Greiner plates
(Microlon ® 600, flat bottom, extra high binding capacity, Germany) were coated with coating
antigen C solution (0.8 µg.mL-1 coating buffer, 100 µL/well) by overnight incubation at 4°C in the
dark. Plates were washed three times (200 µL wash solution/well) and blocked (200 µL blocking
solution/well) for 2 h at RT, in the dark. Afterwards the plates were washed twice as previously.
For the competition step, 50 µL of the appropriate bisphenol A-dilution and 50 µL of the primary
antibody solution were added to each well. Primary antibodies were diluted as follows : 20 µL of
the original primary antibody solution in PBS was further diluted to 7.24 mL with PBS.
Subsequently, 26.64 mL PBS containing 0.3 % (w:v) BSA, 520 µL NaOH 0.1N and 5.6 mL of a 4M
NaCl solution were added, obtaining a final dilution of the primary antibody of 1/2000, a pH of 8.0,
a BSA concentration of 0.2 % (w:v) and a calculated ionic strength of 700 mM. This dilution is
referred to as the competition buffer. The plates were incubated for 1 h at 37°C. Afterwards, the
plates are washed as described above (three times). For the detection reaction, the HRP-conjugated
secondary antibody was added (100 µL/well, 3.4 µg.mL-1 dilution buffer). After 1 h incubation at
37°C and washing of the plates (three times), 100 µL/well of substrate solution containing ABTS as
a chromogen was added followed by an additional incubation at 37°C for 1 h. Finally 25 µL/well of
the appropriate stop solution was added before measuring the absorbance at the appropriate
wavelength (405 nm). Absorbances were corrected for blanc readings obtained by using
immunoglobulins isolated from the eggs of non immunized chickens.
All reagents were warmed-up till incubation temperatures, plates were stacked per couple in
between two empty plates and covered during incubation with a protective film.
If necessary, concentrations of the primary antibodies needed to be adjusted in such a way that the
maximal absorbance in absence of analyte amounted about 1.3.
4.2.3.2. Data processing
Competition curves were obtained in quadruplate. For the statistical evaluation a 95 % confidence
interval was applied. The obtained competition curves were fitted to the four parameter logistic
function corresponding to the equation [43] (Englebienne, 2000) using a commercial software
package (SPSS 10.0).

Use of Bisphenol A antibodies in enzyme-linked immunosorbent assays 144
Chemical interactions between packaging materials and foodstuffs
S
Ix1
SB Bp
50
0 �
���
�
�
���
�
�
��
��
�
�
�� [43]
As indicated in Figure 51, B0 is the maximal absorbance, obtained in the absence of the analyte (x = 0
µM). S is the lower asymptote to the competition curve. The I50 value (µM) is equal to the
concentration of the analyte at which the absorbance equals half of the maximal absorbance.
Consequently, it is related to the assay sensitivity. It is obvious from Figure 51 that the assay
sensitivity is also determined by the factor p. This factor is the so-called Hill slope. In most of the
assays performed, essentially the I50 value was of prime importance however with regard to the
assay sensitivity, since most competition curves were characterised with comparable p factors (0.65-
0.75). Therefore the estimated I50 value was used to evaluate the sensitivity of the assay, as
moreover is usually done by other researchers as well (e.g. Abad and Montaya, 1997).
0
0,1
0,2
0,3
0,4
0,5
0,6
0,7
0,8
0,9
1
0,0001 0,001 0,01 0,1 1 10 100
Concentration (µM)
B/B
0
Figure 51. Some theoretical competition curves based on equation [43] to illustrate the influence of
the equation constants on the assay performance (S is equal to zero in all cases; � : I50= 1µM; p = 1;
� : I50= 0.01 µM; p = 1; no symbol, plain line : I50= 1 µM; p = 0.5)
When required, curves were normalised by expressing the experimental absorbance levels (B) as
(B/B0,max), where B0,max is the maximal absorbance in absence of analyte for the group of competition

Use of Bisphenol A antibodies in enzyme-linked immunosorbent assays 145
Chemical interactions between packaging materials and foodstuffs
curves considered.
4.3. Results and discussion
4.3.1. Initial experiments
As illustrated in the introduction to this chapter (paragraph 4.1), an enzyme-linked immunosorbent
assay consists of a number of consecutive steps of which for all the experiments the following are
comparable: blocking, the enzymatic reaction, and the reading of the signal. In addition, the used
plates will be comparable as well. Because these aspects had an influence during all the experiments
performed, initial attention was attributed to their optimisation.
4.3.1.1. Enzymatic reactions
For the enzymatic reactions, initially orthophenylenediamine (OPD) was selected as a chromogen,
while in later experiments also the use of 2,2’-azino-bis(3-ethylbenzthiazoline-6-sulfonic acid)
(ABTS) was considered. The following parameters of the enzymatic reactions, using the indicated
chromogens between the brackets, were selected for further evaluation : chromogen concentration
(OPD, ABTS), substrate concentration (OPD, ABTS), the factor time (OPD, ABTS), the citrate
concentration and pH (ABTS) and the stop solution (ABTS).
Various chromogen concentrations were tested (0-1 mg OPD.mL-1; 0-0.5 mg ABTS.mL-1). As could be
expected, a linear relationship between the chromogen concentration and the signal intensity was
observed (for OPD : 0-100 µg.mL-1; for ABTS : 0-150 µg.mL-1). No influence of the chromogen
concentration on the blanc readings (without enzyme) could be observed within these concentration
ranges. Final chromogen concentrations were selected in such a way that they became not a limiting
factor in the final assays used (OPD : 400 µg.mL-1; ABTS 300 µg.mL-1). This was confirmed in assays
in which double concentrations of chromogen were used during the enzymatic reactions, without
influence on the final absorbance signal.
Another critical parameter, especially if OPD was used as a chromogen, was the substrate (hydrogen
peroxide) concentration. As illustrated in Figure 52, the net absorbance (corrected for the blanc
reading), was maximal at a particular peroxide concentration (� 0.0015 %, v:v). This was quite
surprising since Catty and Raykundalia (1989) and Portsmann et al. (1981), advised to use much
higher substrate concentrations (e.g. 1.5 %, v:v). At these concentrations however, net absorbance
levels became very low (Figure 52). In addition, high blanc readings (without enzyme) were

Use of Bisphenol A antibodies in enzyme-linked immunosorbent assays 146
Chemical interactions between packaging materials and foodstuffs
observed, which of course is undesirable. Low concentrations (e.g. 0.00015 %, v:v; Figure 52)
resulted also in low absorbance levels. Since additional experiments in the concentration range
0.0006-0.0015 % (v:v) revealed that only minor differences in the net absorbance levels were
obtained, a final substrate concentration of 0.0015 % (v:v) was selected if OPD was used as a
chromogen.
0
0,4
0,8
1,2
1,6
0,0001 0,001 0,01 0,1 1 10
Substrate concentration (%, v:v)
abso
rban
ce (4
92 n
m)
Figure 52. Influence of substrate concentration (hydrogen peroxide) on the net absorbance of OPD
solutions in the presence of peroxydase
For ABTS a continuous increase in signal intensity was observed until the substrate concentration
amounted 0.05 % (v:v). In contrast to OPD however, no decrease in signal intensity was observed if
higher substrate concentrations were applied (up to 0.6 % v:v, not shown). No effect of the substrate
concentration on the blanc reading (without enzyme) could be observed either, in the range tested,.
The low absorbance observed for both chromogens, if low substrate concentrations are present, can
be explained by the restricted reagent concentration. At high substrate concentrations, the
enzymatic reaction will proceed at a rate which becomes independent upon the substrate
concentration, explaining the results observed for ABTS. The deviating behaviour for OPD can be
partially explained by the high blanc readings which were observed using the high substrate
concentrations reported. Since the overall absorbance levels (not corrected for the blanc) in these
experimental conditions were also lower then those observed with the optimal substrate

Use of Bisphenol A antibodies in enzyme-linked immunosorbent assays 147
Chemical interactions between packaging materials and foodstuffs
concentration, this could not be the only explanation. Possibly, the chromogen dependent formation
of an inactive substrate-enzyme complex at these high substrate concentrations could the cause
(Porstmann et al., 1981). Because of the chromogen dependent character of this inactivation, the
observed difference between OPD and ABTS could be explained as well.
As could be expected, incubation time was positively correlated with signal intensity (only tested for
OPD, 10-60 min, not shown). Doubling the incubation time from 30 min, as used in initial
immunoassays, to 60 minutes, increased signal intensity with 50% without changing the blanc
readings (without enzyme).
Another aspect of practical importance with regard to the time, was the influence of the time gap (0-
20 min) between the mixing of all the reagents at room temperature and the incubation at 37°C (for
30 min; only tested for OPD). If the time gap was restricted up to 5 min, which is practically easy to
be realised, no significant differences in absorbance levels were observed. It should be noted
however that if the time gap exceeded 20 min, the difference in absorbance level was only slightly
different from the reference (time gap 0 min) : 1.102 �0.010 for the reference and 1.222 � 0.028 for the
time gap of 20 min. So the modest enzymatic activity at room temperature is overrun almost
completely during the incubation at 37°C. Since an incubation time of 60 minutes at 37°C was
respected during the assays performed later, it can be expected that the time gap between the
mixing of all the reagents at room temperature and the incubation of 37°C is not a crucial factor
influencing assay performance.
The influence of the time (5-20 min) between the end of the enzymatic reactions (addition of the
stop solution) and the measurement on the absorbance level recorded was evaluated as well,
because of practical concerns. Both for OPD and ABTS no significant difference in the net
absorbance levels could be observed in the time frame tested. For OPD however an increase in the
overall absorbance level was observed together with a similar increase in the blanc signal (without
enzyme) at the highest substrate concentrations (1.5 %, v:v) tested. Again this observation illustrates
the inappropriate use of the high substrate concentrations as recommended by some authors. For
ABTS, it should be noted that the observations reported were only valid for selected stop solutions,
as explained further on.
Additional attention to the citrate concentration and the pH was given if ABTS was used as a
chromogen because several concentrations were recommended in literature (Catty and
Raykundalia, 1989 : 0.1 M, pH 6.0; Saunders, 1979 : 0.05 M, pH 4). The lower the citrate
concentration, the higher the absorbance level observed, irrespective of the pH of the buffer used.

Use of Bisphenol A antibodies in enzyme-linked immunosorbent assays 148
Chemical interactions between packaging materials and foodstuffs
Better results were also obtained if the more acidic pH level was selected. A further decrease of the
citrate concentration (at pH 4) resulted in even higher absorbance levels. In addition however, blanc
signal (without enzyme) increased as well. Presumably, the citrate prevents direct chromogen
oxidation.
A final aspect of importance if ABTS was used as a substrate was the stop solution used. Again
various possibilities were found in literature (Table 33). Since Saunders (1979) already stressed the
importance of a carefully prepared stopping reagent, these reagents were compared for further use.
Table 33. Various solutions to stop the hydrogen peroxide mediated enzymatic oxidation of ABTS
Solution code Composition Reference
1 0.1 mM NaN3 Porstmann et al., 1981
2 0.3 M NaF Catty and Raykundalia, 1989
3 0.1 M HF, 0.01 M NaOH, 1 mM EDTA Saunders, 1979
4 0.1 M HF, 0.008 M NaOH, 1mM Na2EDTA Saunders, 1979
Solution 1 was immediately rejected because very low absorbance levels were observed. Solution 2
was not retained as well, because the final absorbance level observed seemed to be less stable as a
function of time compared to stop solutions 3 and 4, which were stable in the time frame tested, as
reported previously. No differences between these two latter solutions were observed with respect
to the signal intensity and stability. Since EDTA is difficult to dissolve however, preference for
further use was given to solution 4.
4.3.1.2. Signal reading and plates
During the initial immunosorbent assays, it was quickly revealed that enormous problems with
assay repeatability existed. Two important causes could be identified : the spectrophotometers and
the plates used.
For the spectrophotometers three different instruments were evaluated. All 96 wells of a multiwell
plate were filled identically with a solution containing the oxidised chromogen (OPD) and the
absorbance was recorded in quadruplate for each instrument. The relative standard deviation for
each well and the average relative standard deviation over all the wells were calculated and
compared (Table 34).
As can be observed, one instrument clearly caused serious repeatability problems. Consequently for

Use of Bisphenol A antibodies in enzyme-linked immunosorbent assays 149
Chemical interactions between packaging materials and foodstuffs
further measurements, the Titertek multiskan plus MK II instrument was prefered.
Table 34. Results of the repeatability experiments concerning the spectrophotometer (average
absorbance level amounted approximately 1.0)
Instrument Maximal relative standard
deviation (%)
Average relative standard
deviation (%)
Organon technika 14.3 4.1
Titertek multiskan 5.4 2.7
Titertek multiskan plus MK II 1.9 0.8
Since for the plates especially the homogeneity of the coating of the reactants is of importance, all the
96 wells of a plate were treated identically starting from the initial coating step. Three plates of each
tested brand were evaluated. The relative standard deviation on the absorption levels of all 96 wells
was calculated for each plate individually. In addition, for each brand the relative standard
deviation on the average absorbance level of each individual plate was compared (Table 35).
Table 35. Results of the repeatability experiments concerning the plates (average absorbance level
amounted approximately 1.0)
Plate brand Relative standard deviation
per plate
Relative standard deviation on
the plate averages
Linbro 7.6 32.4 38.4 73.4
Greiner, 96 well plate 16.0 26.2 10.4 22.9
Corning 12.8 20.6 13.4 11.4
Maxisorp-platen, Nunc 10.2 10.5 7.0 6.4
Maxisorp-platen, Nunc, without
edges
6.2 4.0 5.4 4.8
As can be observed, relative standard deviations within one plate were extremely high for some
brands, indicating that within these individual plates inhomogeneous coating occurred. Also the
variability between the plates of each single brand was in some cases rather high, demonstrating the
large variability between several plates of one single brand. The plates of Nunc seemed to have the
best intra- and interplate homogeneity. It should be noted in this respect that some plates tested,
were not typically immunoplates (e.g. Greiner, ordinary 96-well plates), which could explain some

Use of Bisphenol A antibodies in enzyme-linked immunosorbent assays 150
Chemical interactions between packaging materials and foodstuffs
of the bad results observed. Several immuno-plates of an other producer (Greiner) were evaluated
as well and it was striking that only one type behaved as good as the Maxisorp plates of Nunc (not
shown). All these results illustrate the importance of quality control and proper selection of the
immuno-plates prior to the development of an enzyme-linked immunosorbent assay.
From the results in Table 35, an another interesting observation can be made. If the wells on the
edges are not taken into account, it is obvious that even better results are obtained. This can be
explained by the so-called edge effect for which temperature differences between the inner and
outer wells of a plate are reported to be the main cause (Burt et al., 1979; Oliver et al., 1981).
Temperature gradients negatively influence the homogeneity of the results, especially if short
incubation times and refrigerated reagent solutions are applied and plates are stacked on each
other. A possible solution could be to avoid the use of these outer wells, thus reducing the number
of available wells from 96 to 60, which is on the other hand a major disadvantage. Warming-up of
the reagents till incubation temperatures, stacking the plates per couple in between two empty
plates and covering the plates during incubation with a protective film are tools reported to reduce
the edge effect (Esser, 2000a). This could be confirmed with experimental data obtained in the
immunoassays further performed.
4.3.1.3. Composition of the blocking solutions for indirect assays
After coating of the immuno plates, the remaining free binding places should be occupied by the
blocking agents to reduce non-specific binding of reagents later on during the assay. In such a
manner high blanc readings and consequently false positive results can be avoided. In the available
literature, several blocking solutions have been described as indicated in Table 36. In addition to
those mentioned, it should be stressed that also solutions of BSA are frequently used for blocking
purposes. Since the chickens were immunized with bisphenol A-BSA conjugates, this option was
not considered.
Wells which were only coated with these blocking solutions did not show significant binding of
chicken immunoglobulins, indicating that they all exhibit low affinity for these antibodies.
The absorbance levels of the blanc readings (IgY from non immunized chickens) were taken into
account for evaluation, using the levels obtained in the assays with blocking solution [1] as a
reference. Results reported relate only to the absorbance for the wells containing the 1/2000 IgY
dilution. Similar conclusions could be drawn from the absorbance levels recorded for the other
wells containing a different IgY dilution. In Figure 53 the ratio of the blanc signal in an assay,

Use of Bisphenol A antibodies in enzyme-linked immunosorbent assays 151
Chemical interactions between packaging materials and foodstuffs
performed with the respective blocking solutions, to the reference blanc signal is shown.
Table 36. Overview of the blocking solutions tested
Code Composition References
[1] 0.1 % gelatine, 0.05 % Tween 20 in 0.9 % NaCl
[2] 2 % gelatine, 0.05 % Tween 20 in 0.9 % NaCl
[3] 3 % gelatine, 0.05 % Tween 20 in 0.9 % NaCl
Pichler et al. (1998), Woychik et al. (1984)
[4] 0.1 % gelatine in PBS
[5] 2 % gelatine in PBS
[6] 3 % gelatine in PBS
Giraudi et al. (1999), Cairoli et al. (1996),
Forlani et al. (1992), Morissette et al.
(1991), Rath et al. (1988)
[7] 3% caseinate in PBS Usleber et al. (1994)
[8] 5% skimmed milk powder in PBS Feng et al. (1994), Joyeux et al. (1996)
[9] 3% ovalbumin in PBS Abouzied et al. (1993), Azcona Oliviera
et al. (1992), Liu et al. (1985)
0
0,2
0,4
0,6
0,8
1
1,2
[1] [2] [3] [4] [5] [6] [7] [8] [9]
Blocking agent
Rel
ativ
e ab
sorb
ance
Figure 53. Relative absorbance of blanc signals for the various blocking agents. (Relative absorbance
was equal to : Blanc reading for blocking agent [n]/Blanc reading for blocking agent [1]; Reference
absorbance amounted on average 0.44; values are averages of at least triplicate measurements)

Use of Bisphenol A antibodies in enzyme-linked immunosorbent assays 152
Chemical interactions between packaging materials and foodstuffs
Blanc readings for the reference blocking solution was maximal (Figure 53). Increasing the gelatine
concentration in these solutions decreased the blanc signal. If Tween 20 was omitted from the
gelatine solution, even lower blanc readings were obtained. Probably, Tween 20 competed in the
former blocking solutions with the gelatine as suggested by Esser (2000b). Ovalbumin was
considered to be inappropriate as well. Dairy protein solutions (casein and skimmed milk powder)
were even more effective compared to the gelatine solutions in reducing the blanc absorbance
signal. Because skimmed milk powder is however more complex in composition compared to the
caseinate used, preference was given to the later protein isolate to use it as a blocking agent in
further experiments.
4.3.2. Indirect Competitive ELISA
For the evaluation of their usefulness, the isolated antibodies from the bisphenol A immunized
chickens were applied in an indirect competitive ELISA. To do so, the influence of several assay
parameters on the assay performance were evaluated.
4.3.2.1. Assay optimization
4.3.2.1.1. Ionic strength of the competition buffer
Figure 54 shows some typical competition curves obtained from the assay for various ionic
strengths of the competition buffer. In Table 37, the estimated B0 and I50 values for some of the
competition curves are summarized. The estimated values for the lower ionic strengths are omitted
because of the large variability on the estimated values. The ionic strength of the competition buffer
revealed to be very important with regard to the assay performance. At low ionic strengths, the I50
values became unacceptability high. The values were not significantly influenced anymore by the
ionic strength starting approximately from 800 mM. A further increase of the ionic strength
however resulted in a dramatic reduction of the maximal absorbance (Table 37). Therefore the range
of 400-800 mM was considered as optimal taking into account the achievable sensitivity range.
Finally a 700 mM ionic strength was selected for further use.
Similar findings were observed previously in immunoassays for other organic compounds using
mammal antibodies (Harrison et al., 1989, Li et al., 1991; Marco et al., 1993, Lee et al., 1995; Abad
and Montaya, 1997). According to Abad and Montaya (1997) these observations indicate that the
interaction between antibodies and hydrophobic compounds is influenced by the polarity of the
buffers used. It should be noted in this respect that in a parallel research performed with regard to

Use of Bisphenol A antibodies in enzyme-linked immunosorbent assays 153
Chemical interactions between packaging materials and foodstuffs
the application of chicken immunoglobulins for the detection of peanut proteins, a similar but less
intense effect was observed (De Meulenaer et al., 2002), although such finding were not reported
using antibodies from other animals. Therefore it can not be excluded that the observed results in
the presented bisphenol A assay are partially attributable to the fact that chicken antibodies were
used.
0.0
0.2
0.4
0.6
0.8
1.0
0.01 0.1 1 10 100 1000Bisphenol A concentration (µM)
B/B
0,m
ax
Figure 54. Competition curves with a varying ionic strength of the competition buffer (�= 200 mM;
�= 300 mM; � = 400 mM; �= 800 mM; � = 3000 mM)
Table 37. Estimated B0 and I50 values of competition curves as a function of the ionic strength of the
competition buffer
Ionic strength
(mM)
400 800 1600 2400 3000
B0 0.96 � 0.01 0.72 � 0.01 0.40 � 0.01 0.47 � 0.03 0.48 � 0.01
I50 (µM) 13.67 � 1.34 3.13 � 0.35 3.94 � 0.59 4.72 � 0.52 3.47 � 0 .37
As a conclusion, special attention to the ionic strength of the competition solution should be given.
In the presented experiment, bisphenol A was dissolved in distilled water. If real samples would be
analysed however, it should be realised that these may contain minerals as well. Consequently the
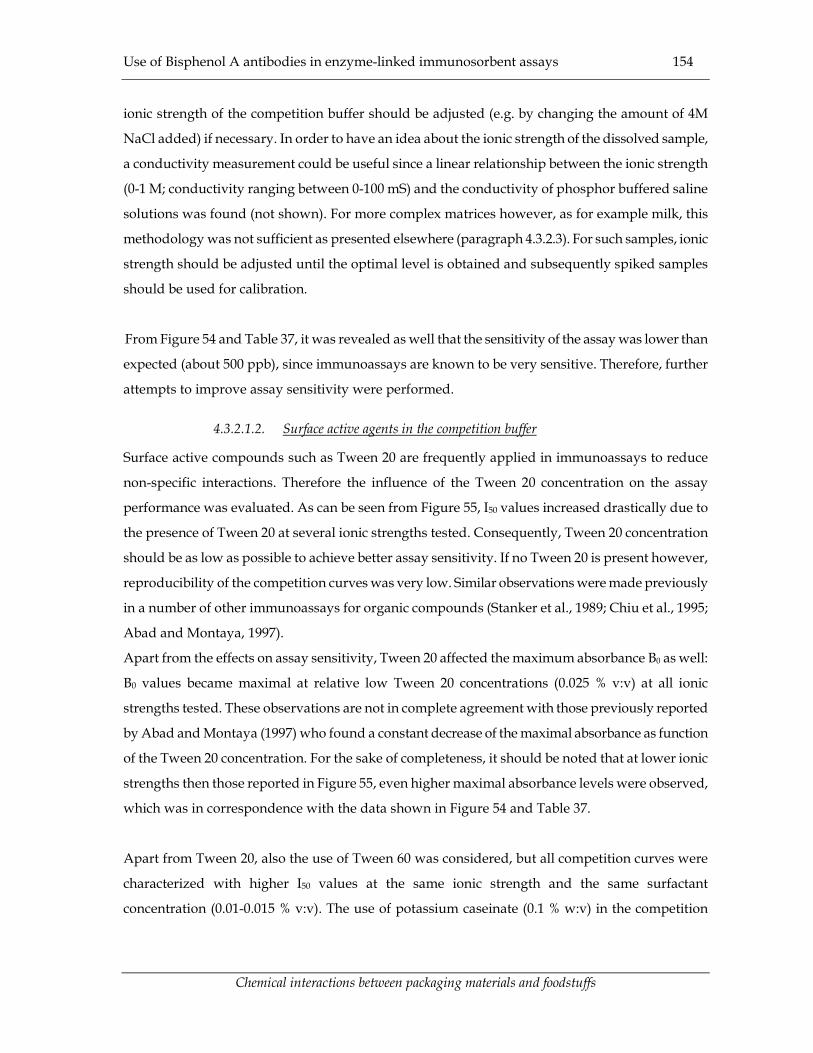
Use of Bisphenol A antibodies in enzyme-linked immunosorbent assays 154
Chemical interactions between packaging materials and foodstuffs
ionic strength of the competition buffer should be adjusted (e.g. by changing the amount of 4M
NaCl added) if necessary. In order to have an idea about the ionic strength of the dissolved sample,
a conductivity measurement could be useful since a linear relationship between the ionic strength
(0-1 M; conductivity ranging between 0-100 mS) and the conductivity of phosphor buffered saline
solutions was found (not shown). For more complex matrices however, as for example milk, this
methodology was not sufficient as presented elsewhere (paragraph 4.3.2.3). For such samples, ionic
strength should be adjusted until the optimal level is obtained and subsequently spiked samples
should be used for calibration.
From Figure 54 and Table 37, it was revealed as well that the sensitivity of the assay was lower than
expected (about 500 ppb), since immunoassays are known to be very sensitive. Therefore, further
attempts to improve assay sensitivity were performed.
4.3.2.1.2. Surface active agents in the competition buffer
Surface active compounds such as Tween 20 are frequently applied in immunoassays to reduce
non-specific interactions. Therefore the influence of the Tween 20 concentration on the assay
performance was evaluated. As can be seen from Figure 55, I50 values increased drastically due to
the presence of Tween 20 at several ionic strengths tested. Consequently, Tween 20 concentration
should be as low as possible to achieve better assay sensitivity. If no Tween 20 is present however,
reproducibility of the competition curves was very low. Similar observations were made previously
in a number of other immunoassays for organic compounds (Stanker et al., 1989; Chiu et al., 1995;
Abad and Montaya, 1997).
Apart from the effects on assay sensitivity, Tween 20 affected the maximum absorbance B0 as well:
B0 values became maximal at relative low Tween 20 concentrations (0.025 % v:v) at all ionic
strengths tested. These observations are not in complete agreement with those previously reported
by Abad and Montaya (1997) who found a constant decrease of the maximal absorbance as function
of the Tween 20 concentration. For the sake of completeness, it should be noted that at lower ionic
strengths then those reported in Figure 55, even higher maximal absorbance levels were observed,
which was in correspondence with the data shown in Figure 54 and Table 37.
Apart from Tween 20, also the use of Tween 60 was considered, but all competition curves were
characterized with higher I50 values at the same ionic strength and the same surfactant
concentration (0.01-0.015 % v:v). The use of potassium caseinate (0.1 % w:v) in the competition

Use of Bisphenol A antibodies in enzyme-linked immunosorbent assays 155
Chemical interactions between packaging materials and foodstuffs
buffer resulted in better I50 values, but overall absorbance levels became too low. In contrast to
earlier observations of Abad and Montaya (1997), the use of BSA (0.1 % w:v) did not result in better
assay characteristics compared to the use of Tween 20 (0.01 % v:v). The use of BSA however was
interesting because of other reasons as explained in the following paragraph (paragraph 4.3.2.1.3)
0
50
100
150
200
250
300
0 0.05 0.1 0.15 0.2
Tween 20 (%, v/v)
I 50 (µ
M)
0.2
0.4
0.6
0.8
1
B0
Figure 55. Influence of Tween 20 concentration at various ionic strengths on the I50 (filled symbols)
and B0 (open symbols) values (�,◊ = 700 mM; �,� = 1600 mM; �,� = 2000 mM)
4.3.2.1.3. pH of the competition buffer
Because bisphenol A can be considered as a weak organic acid, the pH of the competition buffer
was tested together with the use of various surface active agents. Generally, at pH levels lower then
five and higher then ten, very low maximal absorbance levels were obtained (<0.2). In addition,
absorbance levels did not vary significantly as a function of the bisphenol A concentration. Probably
due to the denaturation of the immunoglobulins.
Within the range in which acceptable results were obtained (pH 6-10), the influence of the pH on the
assay performance was not significant for all surfactants tested (not shown). This was again
surprising sine pH dependence of both signal intensity and sensitivity of ELISA’s have been
reported (Abad and Montaya, 1997; Jung et al., 1991; Lee et al., 1995). Remarkably however, it was
observed that assay reproducibility increased if BSA was used instead of Tween 20, in a pH

Use of Bisphenol A antibodies in enzyme-linked immunosorbent assays 156
Chemical interactions between packaging materials and foodstuffs
dependent manner (starting from pH 8 to pH 10). No explanation could be given for these
phenomena.
4.3.2.1.4. Dilution of the primary antibody
In order to obtain good assay characteristics of a competitive ELISA, limiting concentrations of
immunoreagents are required. Therefore, the influence of the primary antibody dilution on the
assay performance was evaluated. From Figure 56 and Table 38, it could be concluded that by
lowering the concentration of the primary antibody assay sensitivity increased significantly. At the
same time however, maximal absorbance decreased as well, which could be expected. Therefore a
compromise should be found (in this particular case a dilution of 1/2000 in the competition buffer
was accepted). Similar results were obtained for other eggs, but for the sake of clarity they are not
included in Figure 56.
0
0.1
0.2
0.3
0.4
0.5
0.6
0.7
0.8
0.9
1
0.01 0.1 1 10 100 1000 10000
bisphenol A concentration (µM)
B/B
0,m
ax
Figure 56. Influence of primary antibody dilution on the assay performance (� = chicken 2, day 42,
dilution 1/1000; � = chicken 2, day 42, dilution 1/2000; ● = chicken 2, day 42, dilution 1/3000; � =
chicken 5, day 45, dilution 1/200; dilutions refer to the dilution in the competition buffer).
In Figure 56 a competition curve using the antibodies isolated from an egg of chicken 5 was
included as well. As can be observed, the curve was very similar to the other ones. It should be
noted though, that a much higher concentration of the immunoglobulins was applied. This is in

Use of Bisphenol A antibodies in enzyme-linked immunosorbent assays 157
Chemical interactions between packaging materials and foodstuffs
correspondence with the results obtained previously with regard to the titers of these respective
eggs (Figures 47-48). So despite the fact that these immunoglobulins were not as reactive compared
to the immunoglobulins obtained from the eggs of chicken 2, they can be applied in immunoassays,
if their concentration is adjusted properly.
Table 38. Estimated B0 and I50 values of competition curves as a function of the dilution of the
primary antibody (all antibodies were from chicken 2, day 42, see also Figure 56)
Dilution of primary
antibody
1/1000 1/2000 1/3000
B0 1.00 � 0.01 0.81 � 0.01 0.65 � 0.01
I50 (µM) 128.85 � 22.28 52.82 � 7.19 37.40 � 4.73
Considering the dilution of the antibodies used, the volume of the isolated IgY solution obtained
from one egg (typically 2-3 mL) and the daily egg production, it becomes clear that a chicken offers
an almost infinite source of immunoglobulins. This is, as already mentioned in paragraph 3.1.4., one
of the major advantages of using chickens as host animals for antibody production.
4.3.2.1.5. Presence of chaotropic ions during the competition step
The use of so-called chaotropic ions, like thiocyanate, to improve assay characteristics has been
reported (Amano et al., 1995). Apart from thiocyanate also other ions are known to be chaotropic
such as perchlorate and iodide (Amano et al., 1995; Joyeux et al., 1996). Therefore their use was
considered as well in this study in order to evaluate their effect on the assay performance. Bromide,
which is also an halogen like iodide, was included as well for comparison purposes.
The results reported (Figure 57), indicate that the presence of the chaotropic ions resulted in a
concentration dependent decrease of the maximal absorbance (B0) for all ions studies, except for
bromide. The effect on assay sensitivity (I50) was especially pronounced if low concentrations of the
ion were present, except for thiocyanate. Again no significant effect for bromide could be observed
in the concentration range tested. It should be noted however that the effect on the assay sensitivity
was rather moderate for all the other ions studied.
Similar concentration dependent effects of chaotropic ions on the assay performance have been
reported (Nawa, 1992), although they were more pronounced. A possible explanation for the
improved assay characteristics is probably due to a lowering of the non specific interactions
between antigens and immunoglobulins because chaotropic ions are known to inhibit the formation

Use of Bisphenol A antibodies in enzyme-linked immunosorbent assays 158
Chemical interactions between packaging materials and foodstuffs
of immune complexes (Nawa, 1992; Amano et al., 1995; Ferreira and Katzin, 1995; Joyeux et al.,
1996). Therefore the weaker non specific interactions will be inhibited in the first place. Of course, at
higher concentrations, also the specific interactions will be affected, resulting in the observed lower
maximal absorbance levels. Curiously, although bromide is a halogen like iodide, even with a
higher atomic weight, it is not a chaotropic ion.
Because of the restricted effect on assay performance, the use of chaotropic ions was not further
considered.
0
1
2
3
4
0 100 200 300 400 500
SCN- (mM)
I 50 (µ
M)
0
0.2
0.4
0.6
0.8
1
B0
0
1
2
3
4
0 100 200 300 400 500
ClO4- (mM)
I 50 (µ
M)
0
0.2
0.4
0.6
0.8
1
B0
0
1
2
3
4
0 100 200 300 400 500
Br- (mM)
I 50 (µ
M)
0
0.2
0.4
0.6
0.8
1
B0
0
2
4
6
8
10
12
0 100 200 300 400 500
I- (mM)
I 50 (µ
M)
0
0.2
0.4
0.6
0.8
1
B 0
Figure 57. Effect of various chaotropic ions on I50(filled symbols) and B0 (open symbols) values
4.3.2.1.6. Incubation time during the competition step
Another important parameter with regard to the competition step, was the time. Apart from the

Use of Bisphenol A antibodies in enzyme-linked immunosorbent assays 159
Chemical interactions between packaging materials and foodstuffs
practical importance with regard to the length of the total assay, time could be important as well
with regard to its performance. As can be observed from Figure 58, lowering the incubation time
resulted in lower I50 values, while the reduction in the maximal absorbance level remained restricted
if an incubation time of at least 60 min was respected. At lower incubation times, maximal
absorbance levels decreased as well but the reduction of the I50 values became less pronounced.
Weller et al. (1992) observed similar phenomena for both assay sensitivity and maximal absorbance.
These observations could be due to a heterogeneity in polyclonal antibody population, causing
some subpopulations to react faster with the antigen then others. Weller et al. (1992) suggested
however that merely a kinetic effect is responsible for the observed phenomena. This implies that no
equilibrium is reached between the antigens and the immunoglobulins, which taking into account
the long incubation time applied (2h) would be quite surprising. However, no further attempts were
undertaken to better understand the observed phenomena.
Nevertheless it is clear that by shortening the incubation time during the competition reaction,
improved assay sensitivity can be obtained. Precautions should be taken however to ensure that
maximal absorbance levels remain high enough and that by shortening the incubation time assay
variability would not increase. Therefore an incubation time of 60 min was respected in the
experiments.
0
20
40
60
80
100
120
20 40 60 80 100 120
incubation time (min)
I 50(µ
M)
0.4
0.6
0.8
1B
0/B0,
max
Figure 58. Influence of the time of the competition step on I50(filled symbols) and B0 (open symbols)
values
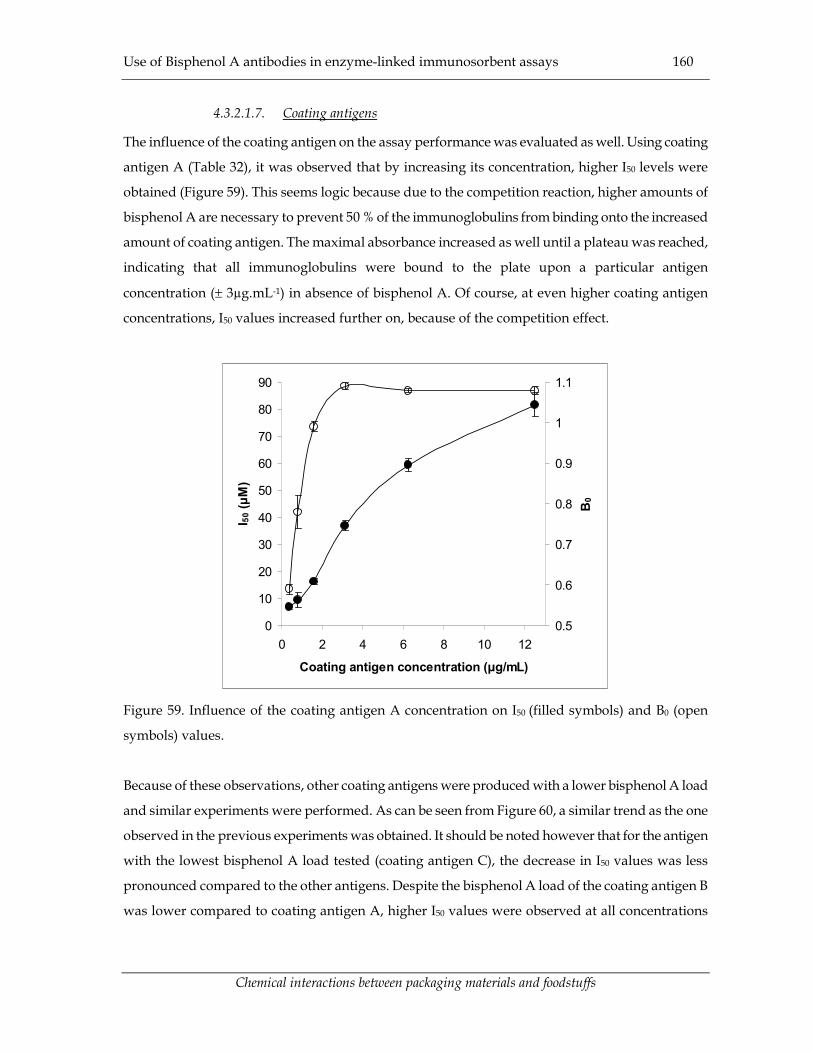
Use of Bisphenol A antibodies in enzyme-linked immunosorbent assays 160
Chemical interactions between packaging materials and foodstuffs
4.3.2.1.7. Coating antigens
The influence of the coating antigen on the assay performance was evaluated as well. Using coating
antigen A (Table 32), it was observed that by increasing its concentration, higher I50 levels were
obtained (Figure 59). This seems logic because due to the competition reaction, higher amounts of
bisphenol A are necessary to prevent 50 % of the immunoglobulins from binding onto the increased
amount of coating antigen. The maximal absorbance increased as well until a plateau was reached,
indicating that all immunoglobulins were bound to the plate upon a particular antigen
concentration (� 3µg.mL-1) in absence of bisphenol A. Of course, at even higher coating antigen
concentrations, I50 values increased further on, because of the competition effect.
0
10
20
30
40
50
60
70
80
90
0 2 4 6 8 10 12
Coating antigen concentration (µg/mL)
I 50 (µ
M)
0.5
0.6
0.7
0.8
0.9
1
1.1
B0
Figure 59. Influence of the coating antigen A concentration on I50 (filled symbols) and B0 (open
symbols) values.
Because of these observations, other coating antigens were produced with a lower bisphenol A load
and similar experiments were performed. As can be seen from Figure 60, a similar trend as the one
observed in the previous experiments was obtained. It should be noted however that for the antigen
with the lowest bisphenol A load tested (coating antigen C), the decrease in I50 values was less
pronounced compared to the other antigens. Despite the bisphenol A load of the coating antigen B
was lower compared to coating antigen A, higher I50 values were observed at all concentrations
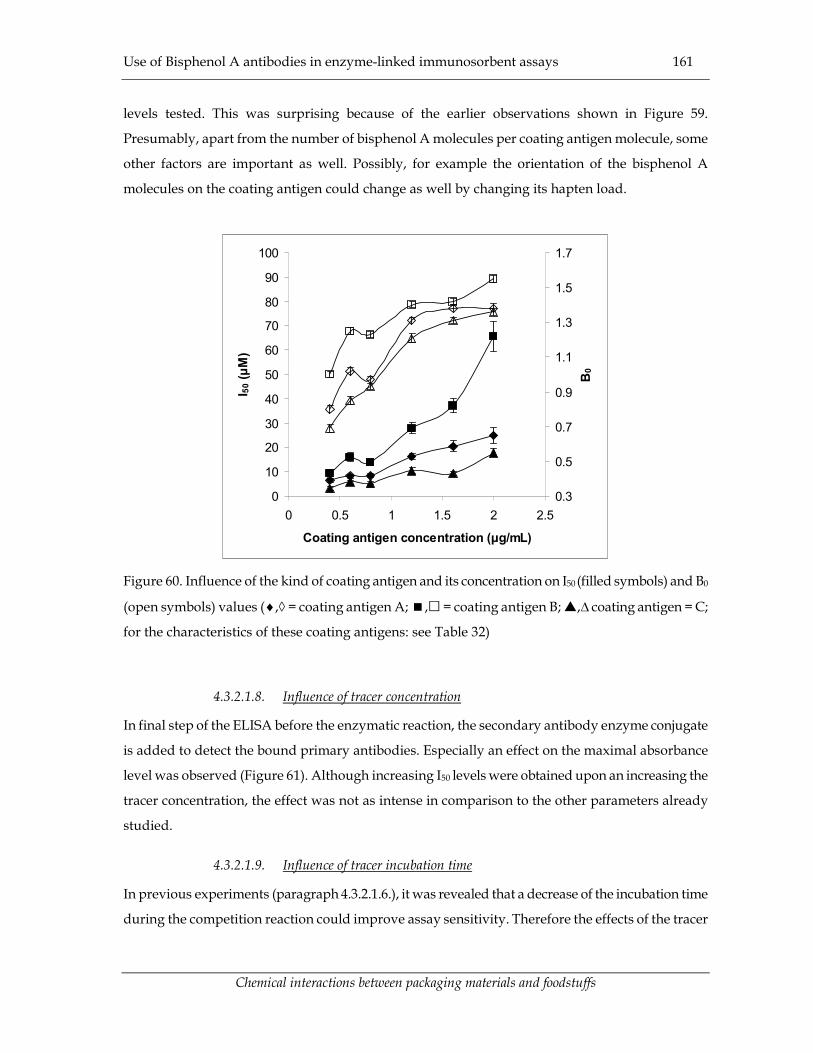
Use of Bisphenol A antibodies in enzyme-linked immunosorbent assays 161
Chemical interactions between packaging materials and foodstuffs
levels tested. This was surprising because of the earlier observations shown in Figure 59.
Presumably, apart from the number of bisphenol A molecules per coating antigen molecule, some
other factors are important as well. Possibly, for example the orientation of the bisphenol A
molecules on the coating antigen could change as well by changing its hapten load.
0
10
20
30
40
50
60
70
80
90
100
0 0.5 1 1.5 2 2.5
Coating antigen concentration (µg/mL)
I 50 (µ
M)
0.3
0.5
0.7
0.9
1.1
1.3
1.5
1.7
B0
Figure 60. Influence of the kind of coating antigen and its concentration on I50 (filled symbols) and B0
(open symbols) values (�,◊ = coating antigen A; �,� = coating antigen B; �,� coating antigen = C;
for the characteristics of these coating antigens: see Table 32)
4.3.2.1.8. Influence of tracer concentration
In final step of the ELISA before the enzymatic reaction, the secondary antibody enzyme conjugate
is added to detect the bound primary antibodies. Especially an effect on the maximal absorbance
level was observed (Figure 61). Although increasing I50 levels were obtained upon an increasing the
tracer concentration, the effect was not as intense in comparison to the other parameters already
studied.
4.3.2.1.9. Influence of tracer incubation time
In previous experiments (paragraph 4.3.2.1.6.), it was revealed that a decrease of the incubation time
during the competition reaction could improve assay sensitivity. Therefore the effects of the tracer

Use of Bisphenol A antibodies in enzyme-linked immunosorbent assays 162
Chemical interactions between packaging materials and foodstuffs
incubation time on the assay performance was evaluated as well. From Figure 62, it is obvious that
the observed effects are in correspondence with those reported previously. A decrease of the
incubation time resulted in an increased assay sensitivity, which on the other hand is counter-acted
via a decrease in maximal absorbance level.
50
55
60
65
70
75
80
85
90
95
100
0.5 1 1.5 2 2.5 3 3.5
concentration (µg/ml)
I 50(µ
M)
0.4
0.5
0.6
0.7
0.8
0.9
1
1.1
B0
Figure 61. Influence of the concentration of the secondary antibody-enzyme conjugate on the I50
(filled symbols) and B0 (open symbols) values
Use of Bisphenol A antibodies in enzyme-linked immunosorbent assays 163
Chemical interactions between packaging materials and foodstuffs
45
55
65
75
85
95
105
115
25 45 65 85
incubation time (min)
I 50 (µ
M)
0.7
0.8
0.9
1
1.1
1.2
1.3
B0
Figure 62. Influence of the incubation time during the detection reaction on on the I50 (filled
symbols) and B0 (open symbols) values
4.3.2.1.10. Influence of the chromogen
Since OPD is frequently applied as a chromogen in peroxidase-based immunoassays, this
chromogen was selected initially to conduct the experiments reported. Apart from OPD however,
also other chromogens are used, such as ABTS. Saunders (1979) intensively studied the applicability
of this chromogen and in fact preferred its use above OPD. Therefore its use was considered as well
in the present study. In Figure 63, two competition curves are represented using respectively OPD
and ABTS as a chromogen.
It is obvious that maximal absorbance levels using ABTS were considerably lower (mind the
difference in two absorbance scales !). On the other hand, lower blanc readings were observed as
well. Therefore, the lower maximal absorbance level was not considered as a major problem if ABTS
was used as a substrate. It should be noted as well that in other experiments, using another batch of
ABTS, higher maximal absorbance levels (up to 0.6) were observed, without any effect on the blanc
readings.
As can be observed, the competition curve obtained using ABTS as a chromogen is slightly shifted
to the right compared to OPD. This is reflected as well in the estimated I50 values : 2.40 µM � 0.19 for
ABTS and 11.36 µM � 0.67 for OPD (95 % confidence level). Possibly, the observed improvement in

Use of Bisphenol A antibodies in enzyme-linked immunosorbent assays 164
Chemical interactions between packaging materials and foodstuffs
assay sensitivity is due to the lower blanc absorbance levels if ABTS is used as a chromogen. Also in
other experiments in which higher maximal absorbances were obtained, significant improvement in
assay sensitivity was obtained if ABTS was used as a chromogen instead of OPD. Therefore, OPD
was replaced by ABTS during the course of this study as a chromogen.
0
0.2
0.4
0.6
0.8
1
1.2
1.4
0.01 0.1 1 10 100 1000 10000
Bisphenol A concentration (µM)
B (4
92 n
m)
-0.01
0.04
0.09
0.14
0.19
B (
405
nm)
Figure 63. Influence of the chromogen on the assay performance. (�,� : OPD, left absorbance
scale; �,◊ : ABTS, right absorbance scale; filled symbols refer to net absorbance readings, open
symbols refer to blanc absorbance readings)
4.3.2.2. Specificity of the indirect competitive ELISA
The specificity of the assay was evaluated for a number of compounds. Structural analogues, of
which several are allowed to be used within the EU for the production of plastic food contact
materials, were included. In addition some other phenolic compounds of which some are known to
be xeno- estrogenic (nonylphenol 82, butylhydroxyanisol 92) were studied. Apart from these
phenolic compounds however, also some other well known xeno-estrogenic compounds (dibenzyl
phthalate 2, butyl benzyl phthalate 3, BADGE 4) present in food contact materials were studied.
Results obtained for immunoglobulins isolated from one particular egg (chicken 2, day 42) are
summarized in Table 39.

Use of Bisphenol A antibodies in enzyme-linked immunosorbent assays 165
Chemical interactions between packaging materials and foodstuffs
As can be observed from this table, closely structural related compounds show cross reactivity :
Cumylphenol 73 and 3,4’-isopropylidene-diphenol 77 showed respectively about 40 and 30 % of
cross reactivity. Taking into account that only minor structural differences between these
compounds and the target molecule exist (removal of one hydroxyl group in the case of
cumylphenol 73 and the different position of one hydroxyl group on the phenolic ring structure for
3,4’-isopropylidene-diphenol 77), it is rather surprising to see that such small molecular differences
are detected by the immunoglobulins. Probably the selection of the hapten, used for the production
of the immunizing conjugate, could be the reason for the fairly high cross reactivity observed for
cumylphenol 73. It is surprising in this regard that for 4-hydroxydiphenylmethane 72 (replacement
of one hydroxyl group with one methyl group with respect to bisphenol A) a strong reduction in
cross reaction was detected. Possibly the higher apolar character of this compound could be an
explanation for this phenomenon. It should be noted in this respect that the cross reactivity
observed could be an advantage as well. Probably, molecules with a strong structural similarity as
bisphenol A 1, could have a similar toxicological profile. Therefore, the detection of these analogues
could be of interest from a food safety point of view as well.
As can be observed, removal of one of the central methyl groups (4, 4’-ethylidenebisphenol 71),
reduced cross reactivity drastically up to almost 20 %, while total removal of these central methyl
groups (bis-(4-hydroxyphenyl)-methane 70) resulted in even lower molecular recognition.
Replacement of the methylgroups with other functional groups gave similar results (2,2-bis-(4-
hydroxyphenyl)-perfluorpropane 74; 4,4’-(1-phenylethylidene)bisphenol 75; 4,4’-
cyclohexylidenebisphenol 85; 4,4’-dihydroxybiphenyl 88; 4, 4’-dihydroxybenzophenon 89; bis-(4-
hydroxyphenyl)-sulphone 90). This indicates that the central methyl groups play an important role
in the immunochemical recognition reaction. This is an important observation since the hapten used
for antigen synthesis was selected in such a way that these central methyl groups were both
present.
Bisphenol A analogues in which the two phenolic groups are separated with a supplementary
aromatic ring (4,4’-(1,4-phenylene-diisopropylidene)-bisphenol 86; 4,4’-(1,3-phenylene-
diisopropylidene)bisphenol 87) , did show some limited cross reactivity. This could not be due to
the recognition of one single phenolic group, since cross reactivity versus phenol 78 could not be
observed. If on the other hand other functionalities are introduced in the phenolic structure, some
molecular recognition seemed to occur, taking into account the results observed for 4-butylphenol
81. Presumably, the presence of an apolar group in combination with the phenolic moiety enhances
immunological reactivity. If this apolar group became more voluminous, like in the case of

Use of Bisphenol A antibodies in enzyme-linked immunosorbent assays 166
Chemical interactions between packaging materials and foodstuffs
nonylphenol 82, or smaller, like in the case of the cresols 79 and 80, cross reactivity was reduced
again. Therefore, probably butylhydroxyanisol 92 showed some unexpected appreciable cross
reactivity. It should be noted in this respect as well that both nonylphenol 82 and
butylhydroxyanisol 92 are reported to be xeno-estrogenic compounds, like bisphenol A.
Replacement of the apolar moiety with a supplementary hydroxylgroup (dihydroxy benzenes 83
and 84) resulted in low cross reactivity as well. Replacement of the phenolic functionality as such by
other groups (benzylalcohol 91, benzoic acid 93) gave similar results.
Other xeno-estrogenic compounds, that can be present in plastic food contact materials, such as the
studied phthalates could not be recognized by the immunoglobulins. This clearly indicates that no
link between the xeno-estrogenic character and the immunological recognition is present. This is in
correspondence with the data observed for another xeno-estrogenic compound, BADGE, which
shows some structural similarities with bisphenol A.
Cross reactivity for a selected number of compounds (70, 71, 78, 88, 89, 92) was also studied for eggs
from the same chicken isolated on other days. No significant differences could be observed with the
data reported in Table 39 (not shown). This does not seem surprising since the immunoglobulins
originated from the same chicken. Therefore the same compounds were evaluated with respect to
the immunoglobulins isolated from an egg of chicken 5 (day 45). Again, comparable levels of cross
reactivity were obtained : bis-(4-hydroxyphenyl)-methane 70 (2 %) ; 4, 4’-ethylidenebisphenol 71 (19
%) ; butylhydroxyanisol 92 (14 %).
As a conclusion, the presented assay can be considered as very specific, although for some
structural analogues important cross reactivity was observed. Moreover, it seems that comparable
levels of cross reactivity were observed irrespective of the data of egg production or of the chicken
producing the egg.

Use of Bisphenol A antibodies in enzyme-linked immunosorbent assays 167
Chemical interactions between packaging materials and foodstuffs
Table 39. Cross reactivities of the immunoglobulins isolated from the egg of day 45, from chicken 2
Chemical structure Name Cross reactivity (%)
R4R1
R3R2
R2,R3 = CH3, R1,R4 = OH
R2,R3 = H, R1,R4 = OH
R2= CH3, R3 = H, R1,R4 = OH
R1,R2,R3 = H, R4 = OH
R1=H, R2,R3 = CH3, R4 = OH
R2,R2 = CF3, R1,R4 = OH
R2= CH3, R3 = C6H5, R1,R4 = OH
bisphenol A 1
bis-(4-hydroxyphenyl)-methane 70
4, 4’-ethylidenebisphenol 71
4-hydroxydiphenylmethane 72
4-cumylphenol 73
2,2-bis-(4-hydroxyphenyl)-perfluorpropane 74
4,4’-(1-phenylethylidene)bisphenol 75
100
5
18
3
43
3
<0.1
R6R2
R5R3
R1 R7
R4
R1, R3,R5,R7 = CH3, R2,R6 = OH, R4 = H
R1, R2,R3,R5,R7 = H, R4,R6 = OH,
4,4-isopropylidene bis(2,6-dimethylphenol) 76
3,4’-isopropylidene-diphenol 77
<0.1
32
O
O
O
O
R2
R1
R1, R2 = C4H9
R1= C4H9, R2 = C6H5
di-n-butyl phthalate 2
butyl benzyl phthalate 3 <0.1
<0.1

Use of Bisphenol A antibodies in enzyme-linked immunosorbent assays 168
Chemical interactions between packaging materials and foodstuffs
Table 39. continued
Chemical structure Name Cross reactivity (%)
OH
R3
R1
R2
R1,R2,R3 = H
R1, R3 = H, R2 = CH3
R2, R3 = H, R1 = CH3
R1, R3 = H, R2 = sec butyl
R1, R3 = H, R2 = C9H19
R1, R3 = H, R2 = OH
R2, R3 = H, R1 = OH
phenol 78
p-cresol 79
m-cresol 80
4-butylphenol 81
4-nonylphenol 82
1,4-dihydroxybenzene 83
1,3-dihydroxybenzene 84
<0.1
0.5
0.5
9
2
<0.1
<0.1
OHHO
4,4’-cyclohexylidenebisphenol 85 3

Use of Bisphenol A antibodies in enzyme-linked immunosorbent assays 169
Chemical interactions between packaging materials and foodstuffs
Table 39. continued
Chemical structure Name Cross reactivity (%)
HO OH
4,4’-(1,4-phenylene-diisopropylidene)-bisphenol
86 2
HO
OH
4,4’-(1,3-phenylenediisopropylidene)bisphenol 87 0.5
OHHO
4,4’-dihydroxybiphenyl 88 <0.1
OHHO
O
4, 4’-dihydroxybenzophenon 89 0.1

Use of Bisphenol A antibodies in enzyme-linked immunosorbent assays 170
Chemical interactions between packaging materials and foodstuffs
Table 39. continued
Chemical structure Name Cross reactivity (%)
S
OHHO
O
bis-(4-hydroxyphenyl)-sulphone 90 <0.1
OH benzylalcohol 91 <0.1
OH
O
butylhydroxyanisol 92 10
OH
O
benzoic acid 93 <0.1
OO
2 bisphenol A diglycidyl ether (BADGE) 4 2

Use of Bisphenol A antibodies in enzyme-linked immunosorbent assays 171
Chemical interactions between packaging materials and foodstuffs
4.3.2.3. Application of the indirect competitive ELISA for dairy emulsions
Because polycarbonate bottles can be re-used, their application for the packaging of pasteurised
milk increases. The use of polycarbonate baby-bottles becomes also more popular then the use of
the traditional glass bottles, because of their superior physical properties. However, due to the
washing of the bottles, a partial degradation of the polymer can not be excluded. As indicated in the
first chapter, an accelerated migration of bisphenol A from the bottle could occur in these
circumstances. Therefore it would be interesting to have a tool which is able to check the migration
immediately in the food of interest, which in this particular case is milk. Current analytical methods
which are available for bisphenol A analysis would require extensive extraction and clean-up steps
to tackle this analytical problem as shown in chapter 1. Since milk is an aqueous liquid, it would be
possible to apply it directly in the presented assay. This would be a major advantage compared to
the traditional analytical techniques.
Initial experiments on whole reconstituted milk revealed a strong reduction in assay quality
(increased I50 and reduced B0). Because comparable results were obtained for skimmed reconstituted
milk, the reduced assay performance could not solely be due to an absorption of bisphenol A by the
fat globules rendering it unavailable for immunochemical reactions (results not shown).
Since milk contains an appreciable amount of salts, the ionic strength of the competition buffer was
adjusted because of the earlier observations with regard to the influence of ionic strength on the
assay performance. From Figure 64, it is obvious that at the ionic strengths of the competition
buffer, which are comparable to those normally used if aqueous bisphenol A solutions are analysed,
reduced B0 and increased I50 levels were obtained, confirming the results mentioned above. By
lowering the ionic strength of the competition buffer, competition curves are gradually shifted
towards the competition curve observed for aqueous bisphenol A solutions. Consequently, the
assay performance could be influenced in such a way that the inhibition curves obtained in milk
were almost similar to those obtained in water.
In a supplementary experiment, the difference between milk samples with a varying fat content was
evaluated (skimmed, semi-skimmed, whole milk). From Figure 65 it is clear that no differences
between the semi-skimmed and whole milk could be observed, while the differences with the
skimmed milk were very small. In fact, no significant differences in I50 levels were observed for all
three samples (26.04� 1.84 µM; 23.92 �1.32 µM; 26.60� 1.38 µM; for skimmed, semi-skimmed and
whole milk respectively). Consequently it can be concluded that the reduced assay sensitivity
compared to the assay in water can not be due to the absorption of the bisphenol A by the fat
globules. Since bisphenol A is an apolar compound it can be expected it is indeed partially absorbed

Use of Bisphenol A antibodies in enzyme-linked immunosorbent assays 172
Chemical interactions between packaging materials and foodstuffs
by the fat. Therefore the immunglobulins seems able to interact at the water-oil interface inducing
immunochemical reaction the bisphenol A molecules.
0.0
0.1
0.2
0.3
0.4
0.01 0.10 1.00 10.00 100.00 1000.00
Bisphenol A concentration (µM)
B (4
05 n
m)
Figure 64. Competition curves obtained in skimmed milk at selected ionic strengths of the
competition buffer (aqueous bisphenol A solution : ◊ = 700 mM; bisphenol A in milk : �= 140 mM; �
= 220 mM; � = 300 mM; � = 400 mM; �= 600 mM)
The observed differences between the competition curves obtained in milk or in water can be
attributed to the complex sample matrix. Proteins or specific interactions with minerals like iodine,
as illustrated in a previous paragraph (4.3.2.1.5), could be responsible for the observed differences.
It can be concluded that the assay can be applied for the direct analysis of milk samples, without
any need of sample pre-treatment. Because of the observed matrix effects however, it should be
realised that a calibration with a sample of similar composition is necessary. Moreover it is clear that
due to these matrix effects, assays sensitivity decreases.
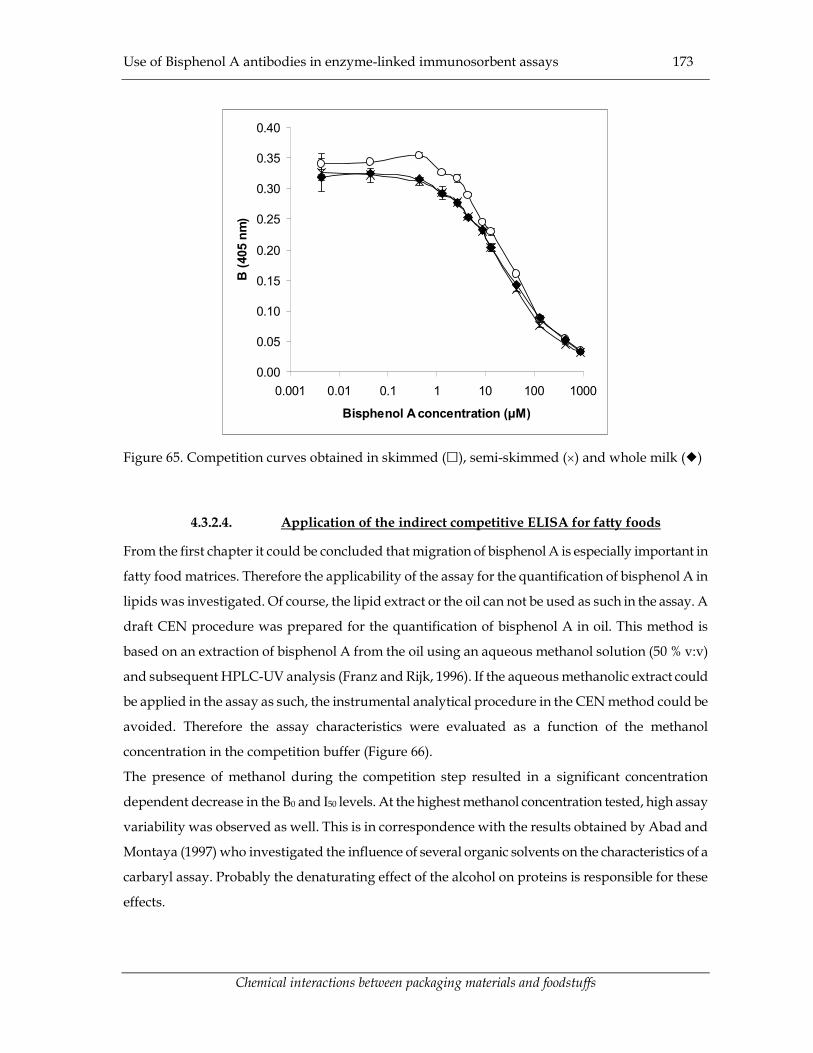
Use of Bisphenol A antibodies in enzyme-linked immunosorbent assays 173
Chemical interactions between packaging materials and foodstuffs
0.00
0.05
0.10
0.15
0.20
0.25
0.30
0.35
0.40
0.001 0.01 0.1 1 10 100 1000
Bisphenol A concentration (µM)
B (4
05 n
m)
Figure 65. Competition curves obtained in skimmed (�), semi-skimmed (�) and whole milk (�)
4.3.2.4. Application of the indirect competitive ELISA for fatty foods
From the first chapter it could be concluded that migration of bisphenol A is especially important in
fatty food matrices. Therefore the applicability of the assay for the quantification of bisphenol A in
lipids was investigated. Of course, the lipid extract or the oil can not be used as such in the assay. A
draft CEN procedure was prepared for the quantification of bisphenol A in oil. This method is
based on an extraction of bisphenol A from the oil using an aqueous methanol solution (50 % v:v)
and subsequent HPLC-UV analysis (Franz and Rijk, 1996). If the aqueous methanolic extract could
be applied in the assay as such, the instrumental analytical procedure in the CEN method could be
avoided. Therefore the assay characteristics were evaluated as a function of the methanol
concentration in the competition buffer (Figure 66).
The presence of methanol during the competition step resulted in a significant concentration
dependent decrease in the B0 and I50 levels. At the highest methanol concentration tested, high assay
variability was observed as well. This is in correspondence with the results obtained by Abad and
Montaya (1997) who investigated the influence of several organic solvents on the characteristics of a
carbaryl assay. Probably the denaturating effect of the alcohol on proteins is responsible for these
effects.

Use of Bisphenol A antibodies in enzyme-linked immunosorbent assays 174
Chemical interactions between packaging materials and foodstuffs
0
5
10
15
20
25
30
35
40
45
0 10 20 30 40
MeOH (%)
I50 (µ
M)
0
0.1
0.2
0.3
0.4
0.5
0.6
0.7
B0
Figure 66. Influence on methanol during the competition on the I50(filled symbols) and B0 (open
symbols).
Despite of the observed effects, the presence of about 10 % of methanol resulted in an I50 value
which is still lower compared to those obtained in optimal conditions in milk. Therefore such
methanol concentrations are considered to be acceptable and moreover, the dilution necessary to
reach this level remains restricted. Taking into account the sensitivity loss due to the dilution of the
aqueous methanolic extract and the sensitivity loss due to the presence of methanol, even higher
concentrations could be tolerated. Consequently, the presented assay could be applicable for the
analysis of lipidic matrices, again taking into account that the overall sensitivity of the assay is
rather restricted.
4.3.3. Conclusions
An indirect competitive enzyme-linked immunosorbent assay could be developed using the
antibodies isolated from the eggs of BSA-bisphenol A immunized chickens. The sensitivity of the
assay was however lower then could be expected from other immunoassays in general and from
assays recently developed for bisphenol A analysis (Kodeira et al., 2000; Nishii et al., 2000; Ohkuma
et al., 2002). A step-wise approach was followed to increase the assay sensitivity by varying several
assay parameters. Only a slight improvement of the assay sensitivity compared to the first
experiments could be obtained. From these experiments, it seemed that care should be taken to

Use of Bisphenol A antibodies in enzyme-linked immunosorbent assays 175
Chemical interactions between packaging materials and foodstuffs
avoid matrix dependent effects on assay performance (e.g. salt effects, surface active agents).
Despite the fact that assay sensitivity was lower then expected, the specificity of the assay to various
bisphenol A like molecules, which could migrate from food contact materials was evaluated. In
addition, also some other phenolic compounds and xeno-estrogenic compounds were investigated.
Generally, the assay could be considered to be very specific.
Finally, the applicability of the assay for the analysis of relevant food samples was investigated.
Only a slight decrease in assay sensitivity was observed if the assay was applied for the direct
analysis of milk. For fatty foods, a simple extraction with a aqueous methanol solution followed by
a restricted dilution of the extract to reduce the methanol concentration, similar results could be
obtained. Both examples illustrate the potency of the developed assay.

Interactions with active and intelligent packaging materials 179
Chemical interactions between packaging materials and foodstuffs
5. Interactions with active and intelligent packaging materials
5.1. Introduction
In order to meet ever more extensive consumer demands and market trends with regard to food
and food products, new technologies have been introduced over the years in the food industry.
Probably the most important recent development in the area of food contact materials are the so-
called active and intelligent packaging systems. Active food packaging can be defined as a material
which changes the condition of the packed food to extend its shelf-life and/or improve its safety
and its sensory properties. Intelligent packaging materials monitor the condition of the packed food
to give information about its quality during its distribution (De Kruijf et al., 2002).
Various kinds of active packaging systems exist and have been recently reviewed by Vermeiren et
al. (1999) : oxygen, ethylene or carbon dioxide scavengers; moisture regulators; anti-microbial
packaging systems; antioxidants releasers etc. In essence, two important classes can be
distinguished: active scavenging systems or absorbers, removing undesired compounds, and active
releasing systems or emitters, intentionally releasing compounds such as preservatives to the food.
Commercial available indicators monitoring the food quality include time-temperature, leakage or
freshness indicators (Ahvenainen et al., 1999; De Kruijf et al., 2002).
Although both technologies are applied frequently in the USA and Japan, introduction within the
European market remains restricted. The main reason for their restricted application is the lack of a
suitable legislative framework. In addition, no extensive information about consumer and trade
acceptability and their environmental impact is available. Therefore in 1999, an EU funded study
was started within the framework of the EU FAIR R&D programme, called ‘ACTIPAK’ (CT 98-
4170). The project dealt with the evaluation of the safety, effectiveness, economic and environmental
impact and consumer acceptance of active and intelligent packaging materials. The project, in which
nine research organisations and three industrial partners participated, was coordinated by TNO,
Nutrition and Food Research, The Netherlands.
Essentially, the five following objectives could be distinguished within the project :
- review and collect active and intelligent packaging systems
- classify the collected packaging materials based on their composition and their overall
migration behaviour
- evaluate the effectiveness , shelf-life extending capacity and microbiological safety of the

Interactions with active and intelligent packaging materials 180
Chemical interactions between packaging materials and foodstuffs
collected materials
- evaluate the toxicological, environmental and economic aspects of the collected systems
- draft some recommendations for future legislative amendments with regard to active
and intelligent packaging materials.
Basically, the contribution relevant to the presented study, was concentrated on the second and fifth
task of the project. It included the following aspects:
- evaluation of the composition of the collected active and intelligent packaging materials
- overall migration studies using official food simulants
- overall migration and specific migration studies using alternative food simulants
- classification of the collected active and intelligent packaging systems
- reflection on the use of active packaging systems taking into account other relevant
legislation, with special emphasis on the food additive legislation.
5.2. Materials and Methods
5.2.1. Samples
The active and intelligent packaging systems were obtained from their producers. An overview of
the different systems is given in Table 40.
5.2.2. Migration testing with official simulants
Overall migration in volatile simulants (water, 3% (v:v) acetic acid, 10-15 % (v:v) ethanol, 95 % (v:v)
ethanol and iso-octane) was measured by contacting the system with the simulants as indicated in
Table 40. Stainless steel migration cells were used if possible, although some films were filled as
pouches or totally submerged. Sachets were submerged as well in a glass container filled with
simulant, which was covered with a glass plate during incubation to avoid excessive evaporation.
For sample OS-3, glass bottles filled with simulant were closed by the crown cap and turned upside
down during incubation.
For the overall migration in olive oil or sunflower oil, samples were placed in stainless steel
migration cells, except sample OS-3, which was filled with olive oil as such. After incubation during
10 days at 40°C, the relevant CEN methods were followed as close as possible.
Overall migration tests for three indicators were carried out by total immersion of the sachet (OI1),
by using a one-side test on a especially prepared indicator with a large area (OI2) and by total
immersion of two indicators stuck together (CDI).

Interactions with active and intelligent packaging materials 181
Chemical interactions between packaging materials and foodstuffs
Other relevant contact conditions (time-temperature combinations) are specified in Tables 42 and
43.
All the data represented are the average of at least three measurements. For the statistical
evaluation a 95 % confidence interval was applied.
5.2.3. Migration testing with alternative simulants
Samples
Samples were selected on basis of the results of the migration studies using the official aqueous and
acidic food simulants. Two iron-based oxygen absorbing systems filled with a powder were
considered (OS 1-2). For the moisture regulators, a film containing a moisture absorbing agent (MR-
4), a sachet filled with granules (MR-1) and a pad filled with a fibrous material (MR-3) were
investigated.
Preparation of the simulant
Agar gel (1-2%, w:w) was prepared by mixing the appropriate amount of agar (Bacteriological agar,
n°1, Oxoid, England) with 500 mL of distilled water. An appropriate amount of water was heated
up to boiling temperature and was subsequently added to the agar dispersion previously prepared.
This mixture was further heated until the solution was clear (near to boiling temperature). Care
should be taken to avoid excessive foaming during boiling of the agar solution and to avoid burning
of the agar if the highest concentration is used. After a clear solution was obtained, an appropriate
amount of acetic acid was added if necessary (3% v:v). If sodium chloride was added to the gel,
brine (15% w:v) was used instead of distilled water to prepare the agar.
Once the liquid agar solution is prepared, it is cooled down to about 50 °C. It should be noted that
at these temperatures agar is rather viscous and tends almost to solidify. If solidification of the gel
would occur before it is applied, gentle reheating may liquefy the gel again.
Different ways to apply the agar gel as a simulant for migration testing are possible.
Migration studies in cell (Moisture absorbing film, MR-4)
The assembled migration cell (TNO, The Netherlands) is weighed before the agar is applied
(typically about 1800 g). Afterwards, the cell is filled with agar (typically about 100 g), without
application of the packaging material. After solidification of the agar, the cell is weighed again, in
order to quantify the amount of agar. Subsequently the cell is opened to apply the packaging
material. After incubation, the active packaging material is removed and the cell together with the
agar are weighed again, to quantify the remaining agar. Alternatively, the cell can be filled with
liquid agar in the presence of the packaging material as well. This approach is not recommended if
migration tests at refrigeration temperatures are conducted. Again the amount of agar before and
Interactions with active and intelligent packaging materials 182
Chemical interactions between packaging materials and foodstuffs
after the migration test should be quantified.
For the migration experiment in meat, a fresh meat sample (steak, Belgian beef, lean meat, about 100
g) is cut into a suitable piece (about 7�7 cm and 2cm thickness) or is minced. Subsequently, the meat
is placed on the film which is applied in a migration cell. After application of the meat, the cell is
closed firmly.
Agar was liquefied by adding an equal volume of water to the gel and mixing it. The obtained
liquid was further purified and extracted to allow quantification of the compound considered. For
the migration to meat, the recovered sample was homogenised in a mixer and a sub-sample was
taken for further clean-up and analysis.
Migration experiments were all performed at least in triplicate and every migrate was analysed in
duplicate. For the statistical evaluation a 95 % confidence interval was applied.
Overall migration experiments for other systems
Liquid agar was pored over the desired active packaging systems. Alternatively, the agar can be
pored in a PE box and after solidification, agar slices (about 10�15 cm and 1 cm thickness) are cut
from it. Afterwards, the system can be sandwiched between two slices. The latter approach is
recommended if migration tests at refrigeration temperatures are performed or if the material
absorbs the liquid simulant, like for example via pores.
Reported results are the average of at least triplicate measurements and a 95 % confidence interval
was again considered.
Dry matter content
Dry matter content of the agar was determined in triplicate by conventional oven drying. An
appropriate amount of agar was mixed with dried sea sand in a aluminium dish at 100-105°C until
constant weight was reached.
Overall migration calculation
Overall migration was calculated as indicated in Figure 68.
Rhodamine B migration from MR-3.
The saturation level of MR-3 was determined by submerging the material in distilled water during
30 min followed by a removal of the excess of distilled water by gravity in a funnel and weighing
the amount of absorbed water (approximately 15 g/pad).
Pads were spiked with 6 mg of rhodamine B (+99%, Acros, Belgium) using an aqueous solution (2
mg.mL-1). This was accomplished by injection of the rhodamine B solution through the perforated
side of the pad using a syringe and a stainless steel needle. In order to reach higher saturation
levels, the rhodamine B solution was diluted with water in such a way that the amount of
chromogen added to each pad was the same and the desired saturation degree was reached.
Interactions with active and intelligent packaging materials 183
Chemical interactions between packaging materials and foodstuffs
Pads were contacted with sliced agar gels (1% w:w) at the indicated temperature. Afterwards, agar
gels were mixed and 1 g of agar was dispersed in 50 ml of water and further diluted till a final
volume of 100 ml. Rhodamine B was determined by flow injection analysis in a Gilson 122
Fluorometer (USA) using an excitation wavelength of 540 nm and an emission wavelength of 650
nm. Spiked agar gels were used for calibration purposes and readings were corrected for blancs.
Extensive flushing of the detection system and the pump with hot water (60°C) is recommended
after the analysis.
Migration tests were carried out in triplicate and each migrate was analysed in duplicate. A 95 %
confidence interval was considered.
Water activity measurements
Water activity at room temperature was measured using a Novasina Thermoconstanter
(Switserland). The sample was introduced in the apparatus and the reading of the water activity
was performed upon reaching equilibrium conditions.
5.3. Results and discussion
5.3.1. Compositional analysis
Several active and intelligent packaging systems were collected, based on a number of criteria
including their availability, their functionality and their working mechanism. In addition, priority
was given to systems produced within the EU or by the sponsors of the project.
In Table 40 the collected systems are summarized, together with their function, layout and the way
the migration tests were performed (see paragraph 5.3.2.).
A first remarkable observation is the complexity of the layout of some of the collected systems.
Various systems consisted of multilayered materials such as metallic crown caps with an internal
plastic liner or sachets which basically consisted of perforated paper sheets coated with plastic such
as polyethylene. In addition, these sachets are filled with various powdery or fibrous substances.
These latter sachet-type systems are most frequently added additionally to the packed food, which
compared to systems in which the active system is incorporated in the film is a major disadvantage,
because in such a way, they do not enhance user-friendliness.
In addition however, this observation is important from a legislative point of view as well, since
European plastic food contact material legislation refers only to those systems which are solely
composed of plastics, as indicated in the first chapter of this work. Therefore, if legislation is strictly
applied, only a part of the collected systems are subjected to this most detailed EU legislation with

Interactions with active and intelligent packaging materials 184
Chemical interactions between packaging materials and foodstuffs
regard to food contact materials. Consequently it is obvious that a serious lack in the current
legislation on food contact materials exists with regard to these new type of packaging materials.
Since the directives on plastic contact materials are the most detailed, they were considered as an
adequate tool to evaluate the composition of the various packaging materials studied.
Table 40. Overview of the collected active and intelligent packaging systems
Code Use Layout Migration layout
OS1-2 oxygen scavenger sachet or plastic cap filled with
powder
total immersion
OS3 oxygen scavenger crown cap with liner one sided contact
OS4 oxygen scavenger film migration cell
OS5 oxygen scavenger film pouch, one sided
ES1-2 ethylene scavenger film or sachet filled with granules total immersion
MR1-2 moisture regulator sachet filled with granules total immersion
MR3 moisture regulator pad filled with fibrous material total immersion
MR4 moisture regulator film containing moisture absorber total immersion
AMP1 anti-microbial system sachet containing anti-microbial
agent
total immersion
AMP2-5 anti-microbial system film containing anti-microbial
agent
migration cell
AMP6 carbon dioxide releaser film total immersion
OA1 aroma releasing film film migration cell
OA2 aldehyde absorbing
film
film migration
cell/pouch
TTI1-3 time temperature
indicator
label total immersion
OI1-2 oxygen indicator sachet total immersion
OI1-2 oxygen indicator label migration cell*
CDI carbon dioxide
indicator
label total immersion
* specially prepared label
As indicated before, European legislation with regard to food contact materials in general and to

Interactions with active and intelligent packaging materials 185
Chemical interactions between packaging materials and foodstuffs
plastics in particular is based on compositional restrictions because so-called positive lists are
specified (paragraph 1.2.5.3.1). Therefore compositional analysis of the collected active and
intelligent packaging systems is of prime importance, although some of them are composed of
various materials such as plastics, paper, metal, etc. Based on such analysis, the materials can be
evaluated with regard to the compositional restrictions specified in the legislation. In such an
evaluation it seemed obvious to consider only those ingredients, which are responsible for the
active and intelligent characteristics of the package. These are most probably difficult to replace
because of their functionality in contrast to the other non-functional components. Of course, the
non-functional ingredients should at the end comply as well with the legislative specifications.
For those intelligent systems which are applied on the outer side of the food package (e.g. time
temperature indicators), the migration of the indicators active substances is strongly influenced by
the food package on which the material is attached to. As a matter a fact, this food package may act
as a functional barrier. Consequently, migration out of such systems is considered of less
importance.
Apart from the positive lists specified in the European food contact material legislation, also other
legislative restrictions should be considered for the evaluation: food additive, pesticide, hygiene,
labelling, etc. (Fabech et al. 2000). Taking especially the food packaging and food additive
legislations in mind, the classification as outlined in Table 41 for the active packaging systems is
presented with regard to their composition. Considering this table and the food additive legislation
however, it should be realised that both restrictions towards the use of the food additive and its
concentration are specified. So consequently similar restrictions should be considered for active
food packaging materials releasing food additives. Furthermore it should be noted that the use of
additives in foodstuffs should be reported on the package. It seems logic that a similar declaration is
foreseen for active releasing packaging materials as well. In addition to these aspects also some
others should be considered if the system should comply with food additive legislation. These will
be discussed in more detail elsewhere (paragraph 5.3.5).
For some of the active systems collected, no identification of the functional ingredient was possible,
presumably because it was incorporated in the polymer structure. Consequently its extraction and
identification was rendered impossible. In these cases, the compounds in the systems were
supposed to be in agreement with the legislation because the contrary could not be concluded from
the producers’ information.

Interactions with active and intelligent packaging materials 186
Chemical interactions between packaging materials and foodstuffs
Table 41. Classification of active food packaging systems with regard to their composition
System Active ingredients
Agreement with list of food contact
materials or food additives* or
equivalent
No agreement with list of food contact
materials and food additives
OS iron, sulphite, sodium chloride, silica polymeric scavenger
ES zeolite permanganate
MR silicates, cellulose, sugar derivatives
combined with a semi permeable film
-
AMP ethanol, acids, zinc, silver, anti-
microbial protein
carbon dioxide releaser
OA colorants, volatiles
*food additives can only be used in a restricted amount of foodstuffs
One of the systems seemed to contain permanganate. Serious questions about its use in the presence
of foodstuffs can be raised. Although human and animal studies indicate that inorganic manganese
compounds have very low acute toxicity by any route of exposure (Pisarczyck, 1995), lethal
consequences of oral ingestion of potassium permanganate are described (Young et al., 1996).
Previously, Reides (1990) reported an LDLo for humans amounting 143 mg.kg-1. The risk however of
residual permanganate is most probably negligible because of the strong oxidizing character of the
compound. All the migrated permanganate might have reacted with the organic compounds
present in the foodstuff. This could be a more serious consequence of the permanganate migration
since essential nutrients such as vitamins, amino-acids, (poly)unsaturated fatty acids etc., may be
oxidized.
For some of the positively classified active systems, supplementary explanation is necessary. For the
iron containing oxygen scavenging systems it should be noted that iron oxide is in the positive list
of plastics, together with alloys of iron and other metals such as tin, bronze and cupper. Moreover,
tin coated steel plate has been a major food packaging material for decades. For those materials
included in the positive lists, a specific migration limit for iron is moreover specified, except for iron
oxide (48 mg iron.kg-1). For all these materials, including the active systems containing iron powder
as such, iron will be a major migrating substance in particular foods. Therefore the presence of iron
powder in the packaging materials tested, is not supposed to be in conflict with the legislation.

Interactions with active and intelligent packaging materials 187
Chemical interactions between packaging materials and foodstuffs
Despite this fact, concerns about increased concentrations of the pro-oxidant ferrous ions in food
could be put forward. Sodium chloride and silicate are classified as active components as well, since
chloride is reported to catalyse the oxygen scavenging properties of powdered iron and silica
improved the oxygen removal rates by the iron, due to the creation of a local high relative humidity
(Klein and Knor, 1990). Both compounds are on the positive lists for plastics.
Sulphite is a well-known food additive for its antioxidant properties apart from its anti-microbial
character and its colour enhancement properties. It is not included in the positive list for plastics. Its
use as a food additive is restricted because of its toxicity (Davidson and Juneja, 1990; Gould and
Russell, 1991).
One of the moisture absorbers contains sugar derivatives. These consist of a mixture of compounds
of which some minor ingredients are not included on the plastic packaging positive list. The same
analogues are approved however as food additives, although similar minor components are present
as well. Considering the food additives legislation and its interpretation, a similar approach for the
food packaging legislation could be followed. For the sake of completeness it should be noted that
the polymer used in this active packaging material is considered essential as well for its proper
function. From the analytical data, it could be concluded that the polymer is composed out of listed
monomers.
Although silver is not in the positive list for plastics, its use as a food additive is allowed in for
example candies for colouring purposes. The anti-microbial protein is a food additive which can be
used in several kinds of foods. In addition to the protein, traces of a compound, making the
covalent binding between the film and the protein possible, were detected. The same substance
however can be traced back as a technical aid present in enzyme treated food products. Therefore,
the composition of the material was supposed to be in agreement with the legislation considered.
Finally, the colorants and volatile flavour components detected are also listed as food additives and
therefore can be used in some particular foods.
As for the intelligent systems, the oxygen indicators contain a redox dye, a reducing and an alkaline
compound. Except for the dye, all ingredients are in the positive lists for plastics or are food
additives. It should be noted moreover that one of the systems is not intended to come in direct
contact with the food itself, since it is placed in a plastic sachet which is introduced in the food
package together with the food. The other oxygen indicator is not in direct contact with the food as
well, since it is separated from the food by an oxygen permeable plastic film. The carbon dioxide
indicator is an acid-base system, which uses a coloured indicator, which is not on the positive list,

Interactions with active and intelligent packaging materials 188
Chemical interactions between packaging materials and foodstuffs
nor is a food additive.
5.3.2. Overall migration studies in official food simulants
As indicated in the first chapter, European legislation with regard to plastic food contact materials,
prescribes test procedures to be followed to estimate the migration from a food contact material to
food simulants (paragraph 1.2.5.3.3). These test procedures specify the type of food simulant to be
used, the contact time and contact temperature. Standard procedures for the estimation of the
overall migration have been laid down by CEN. Generally these procedures were followed as close
as possible throughout the experimental part, although various materials could not be considered as
plastics as already mentioned in paragraph 5.3.1. It should be realised however in this respect that
for example in the Dutch legislation similar test conditions as those for plastics on the EU level,
apply as well for other contact materials as well, like for example paper. Therefore, the applied test
conditions can be considered to be relevant. Moreover, in order to compare the various results with
each other, similar tests conditions should be used.
Generally overall migration was tested at a time-temperature combination simulating long-term
contact at room temperature (Tables 42-43). It should be realised that some of the tested systems are
supposed to be applied at refrigeration temperatures. Again to allow proper comparison between
the different systems and to avoid confusion about the data obtained, similar test conditions were
selected for all systems. By doing so a worst-case scenario was simulated. For one of the anti-
microbial systems, releasing ethanol, the loss of volatiles was not taken into account for the
calculation of the overall migration level.
If possible, overall migration data are expressed as amounts per unit of surface (mg.dm-²). For a
large part of the investigated systems however, this approach was not possible because the contact
surface was difficult to measure or was not completely relevant (e.g. sachets or indicators). For these
systems the overall migration is expressed as amounts per object (mg/object). For the interpretation
of the obtained data with regard to current EU legislation the first approach is straightforward. For
the second approach an overall migration limit of 60 mg.kg-1 of packed food can be applied. Even
then however, a clear interpretation of the overall migration level remains difficult because for most
of the sachets no information is available about the minimal amount of food to be contacted with.
Therefore its specification can be considered as essential to evaluate migration levels in an objective
manner. In order to allow some evaluation in the framework of the presented research, as a first
approach it can be supposed that sachets are used in packages containing a minimal amount of 250
g of food, although in practice lower amounts of food are packed with an active packaging as well.

Interactions with active and intelligent packaging materials 189
Chemical interactions between packaging materials and foodstuffs
Thus, the overall migration limit for sachets amounts 15 mg/object. It should be stressed however
that in reality a case by case evaluation of these systems will be necessary taking into account the
expected amount of food to be contacted with the active packaging object.
For the iron containing oxygen absorbers the high overall migration levels in acetic acid are
exceeding the limits. Systems were heavily swollen and brown discoloration of both the system
ingredients and the residues could be observed. Due to the excessive swelling of one of the systems,
floating of the material in the simulant could not be avoided, explaining the low repeatability of the
results reported. It is obvious that these high migration levels were mainly due to ferric compounds
formed upon electrolytical dissolution of the iron powder (swelling due to hydrogen gas
production) and subsequent exposure to air. Also for the other simulants containing water, high
migration levels were observed, although a white instead of a brown residue was obtained after
contact. Possibly, sodium chloride was the main constituent of the migration residue. For the other
oxygen absorbers not containing iron, overall migration levels were in most cases acceptable.
One of the ethylene scavenging materials exceeded the overall migration limit in only one particular
type of simulant.
One of the moisture regulating systems (MR-4) showed excessive migration in water containing
simulants. The migration residue foamed during the evaporation of the simulants and the residue
was sticky, viscous and hygroscopic. After contact the moisture regulating system seemed to have
taken up large amounts of simulant as well. After contact with 95 % ethanol, a stiffening of the
system was observed. Overall migration limits in a limited amount of simulants were exceeded as
well by some of the other moisture regulating systems.
For the anti-microbial systems, overall migration levels were generally in agreement with current
restrictions. For the ethanol releasing systems however care should be taken in the interpretation of
the results reported since the migration of ethanol is not considered. If this migration was kept into
account, overall migration levels would be too high. The carbon dioxide releasing material showed
high overall migration levels as well, especially in 95% ethanol. In the latter case, this was due to
dissolution of the film. Systems AMP2 and AMP5 exceeded overall migration levels in respectively
the fatty food and acidic food simulant.
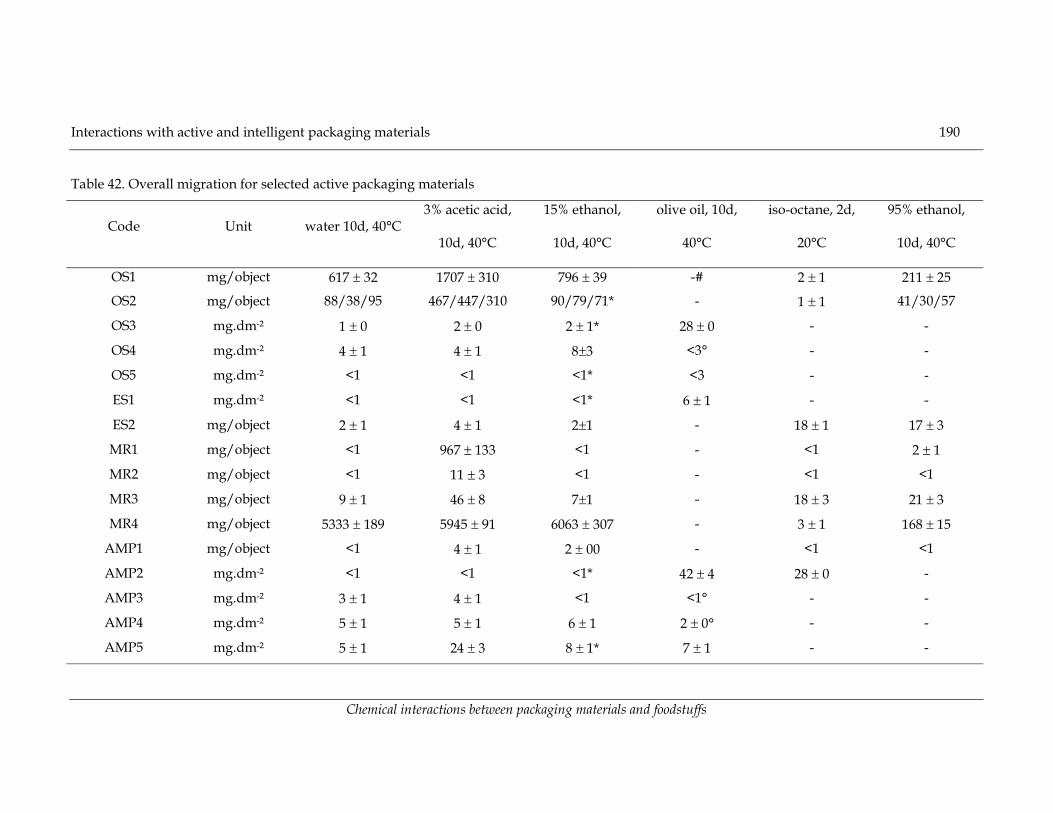
Interactions with active and intelligent packaging materials 190
Chemical interactions between packaging materials and foodstuffs
Table 42. Overall migration for selected active packaging materials
Code Unit water 10d, 40°C 3% acetic acid,
10d, 40°C
15% ethanol,
10d, 40°C
olive oil, 10d,
40°C
iso-octane, 2d,
20°C
95% ethanol,
10d, 40°C
OS1 mg/object 617 � 32 1707 � 310 796 � 39 -# 2 � 1 211 � 25
OS2 mg/object 88/38/95 467/447/310 90/79/71* - 1 � 1 41/30/57
OS3 mg.dm-² 1 � 0 2 � 0 2 � 1* 28 � 0 - -
OS4 mg.dm-² 4 � 1 4 � 1 8�3 <3° - -
OS5 mg.dm-² <1 <1 <1* <3 - -
ES1 mg.dm-² <1 <1 <1* 6 � 1 - -
ES2 mg/object 2 � 1 4 � 1 2�1 - 18 � 1 17 � 3
MR1 mg/object <1 967 � 133 <1 - <1 2 � 1
MR2 mg/object <1 11 � 3 <1 - <1 <1
MR3 mg/object 9 � 1 46 � 8 7�1 - 18 � 3 21 � 3
MR4 mg/object 5333 � 189 5945 � 91 6063 � 307 - 3 � 1 168 � 15
AMP1 mg/object <1 4 � 1 2 � 00 - <1 <1
AMP2 mg.dm-² <1 <1 <1* 42 � 4 28 � 0 -
AMP3 mg.dm-² 3 � 1 4 � 1 <1 <1° - -
AMP4 mg.dm-² 5 � 1 5 � 1 6 � 1 2 � 0° - -
AMP5 mg.dm-² 5 � 1 24 � 3 8 � 1* 7 � 1 - -
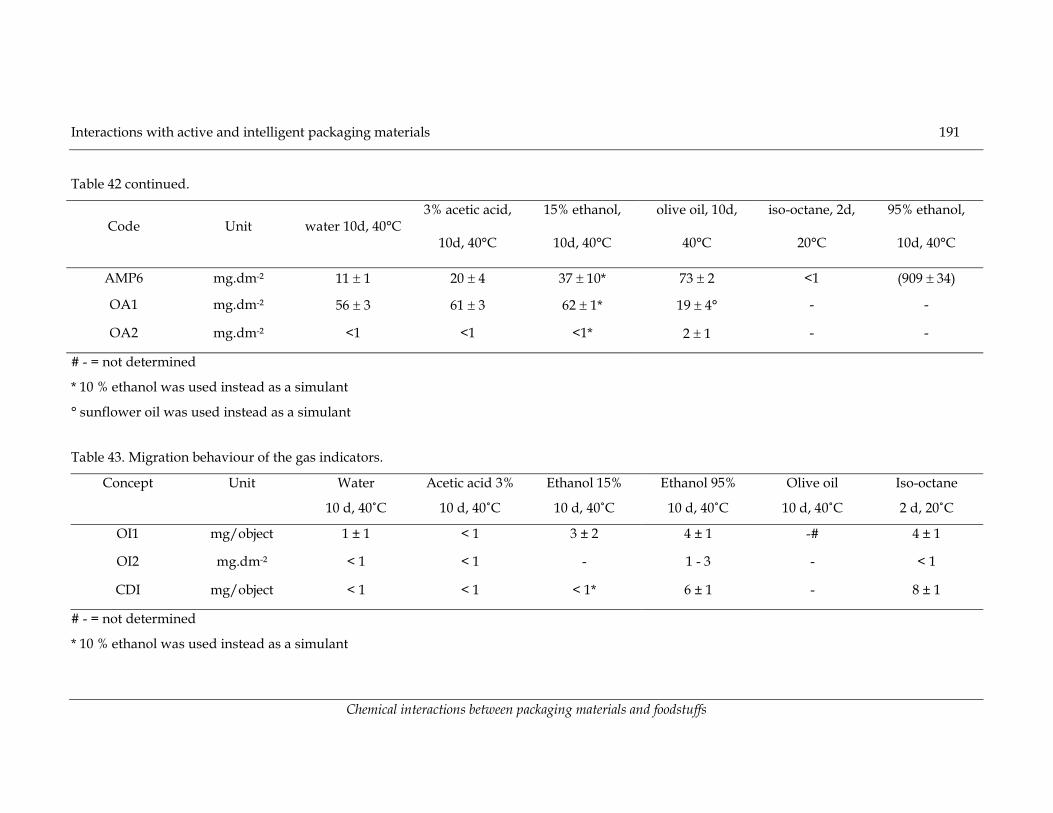
Interactions with active and intelligent packaging materials 191
Chemical interactions between packaging materials and foodstuffs
Table 42 continued.
Code Unit water 10d, 40°C 3% acetic acid,
10d, 40°C
15% ethanol,
10d, 40°C
olive oil, 10d,
40°C
iso-octane, 2d,
20°C
95% ethanol,
10d, 40°C
AMP6 mg.dm-² 11 � 1 20 � 4 37 � 10* 73 � 2 <1 (909 � 34)
OA1 mg.dm-² 56 � 3 61 � 3 62 � 1* 19 � 4° - -
OA2 mg.dm-² <1 <1 <1* 2 � 1 - -
# - = not determined
* 10 % ethanol was used instead as a simulant
° sunflower oil was used instead as a simulant
Table 43. Migration behaviour of the gas indicators.
Concept Unit Water
10 d, 40˚C
Acetic acid 3%
10 d, 40˚C
Ethanol 15%
10 d, 40˚C
Ethanol 95%
10 d, 40˚C
Olive oil
10 d, 40˚C
Iso-octane
2 d, 20˚C
OI1 mg/object 1 ± 1 < 1 3 ± 2 4 ± 1 -# 4 ± 1
OI2 mg.dm-² < 1 < 1 - 1 - 3 - < 1
CDI mg/object < 1 < 1 < 1* 6 ± 1 - 8 ± 1
# - = not determined
* 10 % ethanol was used instead as a simulant

Interactions with active and intelligent packaging materials 192
Chemical interactions between packaging materials and foodstuffs
For the flavour and aroma releasing system (OA-1), loss of its colour was observed if contacted with
water containing simulants. Overall migration limits were nevertheless also exceeded in fatty food
simulants.
Again special care should be taken if the overall migration levels of releasing systems are evaluated.
Apart from the restrictions specified in the food packaging legislation, food additive legislation
should be respected as well. This implies that specific additives can be used in specific foods, as
already emphasized previously. In addition however, maximal additive concentrations should be
respected as well. If due to the specific migration of a food additive, the overall migration limits are
exceeded, the overall migration could be corrected for the migration of the active compound
released, if the food additive legislation is still respected. The corrected overall migration level
should of course then be in compliance with the current limit (Figure 67). This principle however
may not be used to circumvent the actual overall migration limit. Therefore it could be stipulated
that the overall migration limit can be corrected for the migration of food additives if indeed these
compounds exhibit their activity in the selected foodstuff. Of course, this proposal should not be
applied if the active component is not a food additive nor a food ingredient. Neither it should be
applicable for active components that are not intended to be released from the active system (e.g.
sodium chloride in oxygen absorber). Again, additional reflections with regard to possible conflicts
with food additive legislation will be discussed in more detail later (paragraph 5.3.5).
corrected overall m igration : < 10 mg/ dm²
specific migration of active compound (food additive) : < specific migration limit or food additive restrictions
overall migration
Figure 67. Schematic representation of a possible alternative to calculate overall migration from
active releasing food packaging systems
Summarizing, Table 44 shows a classification of the studied active packaging systems according to
their overall migration behaviour. It can be observed that only a minority of the tested systems
fulfilled the current overall migration limit in all official food simulants. Other systems did only

Interactions with active and intelligent packaging materials 193
Chemical interactions between packaging materials and foodstuffs
exceed the limit in a few simulants. It should also be noted that both releasing and scavenging
active packaging systems exceeded the overall migration limit. Considering their functionality, this
was quite surprising for the scavenging systems.
Table 44. Classification of the active systems according to their overall migration behaviour in the
official EU food simulants (A = water, B = 3 % acetic acid, C = 10-15 % ethanol, D = olive oil or
equivalents) (based on data shown in Tables 42-43)
Overall migration < 10 mg.dm-² or equivalent Overall migration > 10 mg.dm-² or equivalent in
indicated simulants
OS4-5 OS1-2 (A,B,C,D)
ES-1 MR4 (A,B,C,D)
MR-2 AMP1&6 (A,B,C,D)
AMP3-4 OA1 (A,B,C,D)
OA2 OS3 (D) ; ES2 (D) ; MR3 (B,D); MR1 (B) ; AMP2
(D) AMP5 (B)
For the intelligent packaging systems, the overall migration behaviour observed agreed with legal
limitations (Table 43).
In this part of the study, the official test methods of the European legislator were used to evaluate
the overall migration from the various packaging materials. For some of these systems, indeed these
methods are appropriate, because they do not differ in their layout from the normal plastic
packaging materials, like for example films. On the other hand, it is clear that by immersing a
moisture-absorbing sachet in water, a conflict arises with the use of this sachet in real life conditions.
Consequently the relevance of the migration data obtained is doubtful. So the question arises
whether the simulants proposed by the legislator are realistic for some of these new types of
packaging materials. This question is especially relevant because some of the systems are used in
contact with solid foodstuffs, containing appreciable amounts of moisture (e.g. oxygen scavenger in
packed prepared meat). Migration in solid food matrices could be much smaller compared to liquid
matrices, because of the restricted diffusion. Moreover, a soaking of the active packaging sachets by
the liquid simulant is avoided. For fatty food simulants at high temperatures, modified
polyphenylene oxide has been used already as a solid food contact material. Because especially in
aqueous food simulants high overall migration values were observed, a solid aqueous simulant

Interactions with active and intelligent packaging materials 194
Chemical interactions between packaging materials and foodstuffs
instead of a liquid simulant, seem to be more appropriate for testing these kinds of active packaging
materials. This will discussed in the next paragraph.
5.3.3. Migration studies with alternative food simulants
5.3.3.1. Introduction
As indicated above (paragraph 5.3.2), for some of the tested active packaging materials, the
unrealistic methodology to simulate migration, was considered as a possible reason for the high
migration levels observed. Especially for the aqueous and acidic food simulants extremely high
overall migration levels were obtained for some oxygen absorbers and moisture regulators. Most of
these packaging systems are intended to be in contact with fresh or minimally processed foods such
as (prepared) meat or fish, vegetables, etc. According to EU regulations, water and/or acetic acid
should be used, among other simulants, to perform migration tests for these types of foods. If such
migration experiments were performed, the considered active packaging systems got soaked, thus
possibly accelerating the migration process. If similar migration tests would be performed using
real food matrices, such as meat, soaking could possibly be prevented. Although these foods are
moisture-rich, the water is rendered macroscopically immobile since it is physically entrapped.
Moreover, mobility of the migrant in the food would be restricted because of its solid nature.
Therefore migration levels are expected to be lower then those observed in the liquid simulant. Of
course, preference would be given to a simulant instead of a real food to conduct migration
experiments. This simulant should be similar to the food considered : moisture-rich, but not liquid.
Moreover, the simulant should be easily standardised, preferably cheap and easy to use and
manipulate.
Agar gels seemed to be an appropriate choice as an alternative simulant for water. Similarly,
acidified agar gels could be used to study migration to acidic moisture-rich solid foods. Therefore,
these alternative food simulants are considered to study the overall and specific migration from
selected active food contact materials.
5.3.3.2. Results and discussion
5.3.3.2.1. Remarks with regard to the development and principle of the method
Agar gels contain usually 1% (w:w) of agar. Therefore the water content is very high resulting in
very high water activities (typically 0.98 or higher). Due to the addition of acetic acid to the aqueous
phase, no solidification of the gel occurred at a 1% (w:w) agar concentration, requiring the use of
Interactions with active and intelligent packaging materials 195
Chemical interactions between packaging materials and foodstuffs
high agar concentrations (2% w:w). Apart from agar, also the use of gelatine could be considered.
At temperatures of 40°C no solid material is obtained, restricting the practical applicability of such
an alternative. Since the migration experiments in the official food simulants were performed at
40°C, preference was given to the use of agar gels in order to be able to compare the migration
levels obtained.
Boiling temperatures are necessary for dissolving the agar in water. It is obvious that care should be
taken when the material to be tested is contacted with the alternative simulant in its liquid state,
because of its elevated temperature. In fact two options are possible.
In the first case, the hot simulant is cooled down near its melting temperature (about 50°C) and
contacted at this temperature with the test specimen. After application of the simulant, it should be
cooled down as soon as possible to the desired incubation temperature.
The second option consists of cooling down the agar to the desired incubation temperature or until
the gel solidifies. Subsequently, agar slices can easily be cut from the solid agar block and the test
specimen can be sandwiched in between two agar slices. Because of the rather flexible nature of the
solid agar gel, close contact between the test specimen and the simulant is still achieved. The latter
approach is also recommended if due to its structure, the test specimen could absorb the simulant
(e.g. MR-3). If this occurs, it can easily be seen because of the presence of solid gel particles inside
the test specimen. This second option could also be applied using a standard migration cell. Once
the agar is solidified in the cell, it can be opened to apply the packaging film, without any risk of
loss of the simulant.
Overall migration measurements are based on the difference in the total dry matter content of the
agar gel before and after contact as shown in Figure 68. Since dry matter content is determined by
oven drying, only components with a comparable volatility as water can be added to the gel to
change its characteristics, like for example its pH. Otherwise, a loss of dry matter (= non volatile
substances) could occur due to the negative migration from the simulant to the test specimen.
Therefore the use of acetic acid did not present any problem in this regard, since it is also
evaporated during the drying process. As a further consequence only specific migration
measurements can be performed if non volatile substances, like for example sodium chloride, are
added to the agar gel. Of course, care should be taken to avoid analytical interferences between the
substances added and the analytes of interest.
Since the total dry matter content of the gel should be known after contact, it is important to recover

Interactions with active and intelligent packaging materials 196
Chemical interactions between packaging materials and foodstuffs
all the simulant and quantify it. Using liquid simulants, this is fairly easily achieved. For solid
simulants, problems may occur like for example observed in the initial experiments using
moistened silica gel. These experiments failed because it was impossible to recover completely the
powdery silica gel, which stuck partially to the test specimen. As a consequence, results obtained
from migration experiments, were not repeatable. Agar gels on the other hand can be applied as one
piece, which are quite firm and easy to handle.
In order to determine the dry matter content it is important that a homogenous sample is obtained.
Because of the solid structure it can be possible that the highest dry matter content is found near the
contact surface with the test specimen. Similarly, due to evaporation of water at the agars surface,
an increased dry matter content can be observed at these places as well. Therefore, after total
recovery of the agar gel, it was weighed and mixed in a blender to homogenize it. From this
mixture, sub-samples were taken to determine the relative dry matter content. Since the total
amount of recovered simulant is known, the total dry matter content can easily be calculated.
Similar data can be obtained from the gel before contact and therefore overall migration can be
calculated as shown in Figure 68.
Similar as to the official methods, only non volatile migrants can be quantified. Moreover, the
presented methodology for overall migration measurement is a gravimetric technique as well. In
contrast to the official methods, no differences in weight as such are recorded but merely changes in
the total dry matter content. Taking into account the analytical limitations of the dry matter content
analysis via oven drying and the relatively high amount of dry matter initially present (typically
1000 mg for a 1% w:w agar gel), it can be expected that the sensitivity of the overall migration
measurements using the proposed alternative simulant will be of a different level compared to the
overall migration measurements using the analogue official simulants. Therefore the method is only
applied on those active systems which, in migration studies using the official simulants, proved to
exhibit high overall migration levels.
For the specific migration measurements, it seemed sufficient to liquefy the agar by the addition of
water and subsequent mixing. Alternatively this mixture could be heated until the agar melts down.
Afterwards classic clean-up and analytical techniques were able to quantify the specific migrants.

Interactions with active and intelligent packaging materials 197
Chemical interactions between packaging materials and foodstuffs
agar- amount
- dry matter content (%;w:w)total dry matter before contact
DMbc
incubation
agar- amount
- dry matter content (%;w:w)total dry matter after contact
DMac
overall migration = DMac-DMbc
agar- amount
- dry matter content (%;w:w)total dry matter before contact
DMbc
incubation
agar- amount
- dry matter content (%;w:w)total dry matter after contact
DMac
agar- amount
- dry matter content (%;w:w)total dry matter before contact
DMbc
agar- amount
- dry matter content (%;w:w)total dry matter before contact
DMbc
incubation
agar- amount
- dry matter content (%;w:w)total dry matter after contact
DMac
agar- amount
- dry matter content (%;w:w)total dry matter after contact
DMac
overall migration = DMac-DMbc
Figure 68. Principle of the overall migration measurement using the agar as an alternative simulant
5.3.3.2.2. Overall migration from iron based oxygen absorbers
It was observed that the overall migration from iron-based oxygen absorbers was very high in the
official aqueous and acidic food simulants (Tables 42 and 45). However, using the alternative
aqueous simulant, a nearly six-fold reduction in overall migration from OS-1 was observed. Similar
results were obtained for OS-2, although the reduction was somewhat more restricted (two-fold).
Interestingly, for this sample, repeatability was much better if agar was used as a simulant instead
of water. As indicated previously (paragraph 5.3.2), overall migration measurements in the liquid
simulants were not repeatable because the material tended to float during the incubation. Since the
agar is a solid material it is able to prevent the active packaging material from floating.
Although the active packaging materials were not soaked, their content was completely moistened.
This moistening could be expected because of the high difference in water activity between the
active packaging material and the agar gel. It is important to realise that although the water is
physically trapped in the agar gel, it is still very mobile because of the high water activity. In
contrast to the official aqueous simulant, water is released in a somewhat controlled manner.
Combining this phenomenon with the restricted diffusion in the solid simulant, probably explains
the significant reduction in overall migration observed. Because of these lower overall migration
levels, the amount of food to be contacted with such active materials can be reduced drastically, if
only the overall migration limit is taken into account (60 mg.kg-1 food). For OS-1 however, the
minimal amount of food which can be contacted remains unrealistically high (about 2 kg!).

Interactions with active and intelligent packaging materials 198
Chemical interactions between packaging materials and foodstuffs
Therefore the practical applicability of these systems in contact with for example meat, remains
questionable.
Table 45. Overall migration from oxygen scavengers in aqueous and acidic food simulants after
incubation during 10 days at 40°C (reported data are the averages of at least 3 measurements)
Sample Simulant Overall migration (mg/object)
OS1 water* 617 � 32
OS1 1 % agar 113 � 22
OS1 3 % acetic acid* 1707 � 310
OS1 2% agar, 3% acetic acid 1484 � 190
OS2 water* 63 � 27
OS2 1 % agar 35 � 8
OS2 3 % acetic acid* 392 � 136
OS2 2% agar, 3% acetic acid 529 � 25
*adopted from Table 40
Using the alternative acidic solid food simulant, again a reduction in the average overall migration
level for OS-1 was observed compared to the level obtained in the official analogue. The reduction
however was not significant. For OS-2, even higher overall migration levels were obtained.
Probably in the latter case, this was again due to the fact that by using the agar gel, floating of the
absorber can be prevented and therefore more intense contact between the simulant and the test
object is possible. It should be noted that for both absorbers, the agar showed cracking after
incubation in the acidic agar gels. This is probably due to the production of hydrogen gas, due to
the electrolytic dissolution of the iron in the acidic environment.
So in contrast to the use of the solid aqueous food simulant, the use of acidified agar gels did not
result in a significant reduction of the overall migration levels. No explanation for these results
could be found. It should be noted however that the amount of iron present in the samples is
considerably higher compared to the amounts of sodium chloride. In addition, the migration
process of iron is partially governed by the electrochemical dissolution of the metal. It is unclear
whether the diffusion of protons in the agar would proceed faster compared to the diffusion of the
other ions of interest (Fe2+, Na+ and Cl-) and therefore could minimize the effect of the solid
simulant. Nevertheless, it is obvious that the use of these active packaging materials in moisture
rich acidic foods is not suitable, even if the water is physically entrapped.

Interactions with active and intelligent packaging materials 199
Chemical interactions between packaging materials and foodstuffs
5.3.3.2.3. Overall migration from moisture regulators
Using the official aqueous and acidic food simulants, it was observed that for some of the moisture
regulators tested, high overall migration levels were observed, as indicated in Table 46.
After contacting MR-4 with the alternative solid aqueous simulant (10 days, 40°C), strong reduction
in the amount of agar was observed together with an equivalent uptake of water by the active
packaging material (about 40 g on a total of 100 g). Surprisingly, no significant differences could be
observed between the results obtained using the official aqueous simulant, even if the incubation
time was drastically reduced. Presumably, migration proceeded very fast for this particular system,
since maximal migration levels were already obtained after 24 h of incubation at 40°C. Shorter
incubation times were not considered because they would not be relevant with regard to the system
studied. Therefore experiments were performed at lower temperatures using both the official and
alternative aqueous food simulant. A two fold reduction in the overall migration level was observed
using agar as a simulant. These results are in agreement with those observed for the iron-based
oxygen scavengers, illustrating again the potential of the use of agar gels as more realistic simulants
for overall migration measurement to aqueous solid foods. It should be realised however that even
by using the alternative simulant, the overall migration level exceeded the limit. Consequently the
considered sample is not appropriate to be contacted with aqueous foodstuffs, even if the food is
not liquid.
In order to change the water activity of the agar gel, sodium chloride was added. As can be
observed however, results obtained were unrealistic. This could be expected because of the negative
migration of the salt to the active packaging material as explained before (paragraph 5.3.3.2.1).
For the other moisture regulators, especially the overall migration levels in the official acidic food
simulant were high. Using the acidified agar gel, overall migration was reduced almost two-fold for
MR-1. This is in contrast to the results previously obtained for the iron-based oxygen absorbers.
Despite the strong reduction in overall migration, it should be noted that MR-1 is intended to be
used as a desiccant in dry foods. Consequently, the practical importance of the obtained results
remains rather limited.
For MR-3, variable and inconsistent results were obtained using the alternative acidic simulant.
Probably this is due to the analytical limitations of the method presented. Only if the overall
migration is sufficiently high, reliable results can be obtained. As for MR-3 overall migration levels
in the official acidic simulant was relatively low compared to the other systems considered, it seems

Interactions with active and intelligent packaging materials 200
Chemical interactions between packaging materials and foodstuffs
that the methodology is not suitable to assess these low migration levels. This example clearly
illustrates the analytical limitations of the alternative simulants in overall migration measurements.
Table 46. Overall migration from moisture regulators in the official and alternative aqueous and
acidic food simulants
Sample Simulant Incubation time/temperature Overall migration
MR-4 water- cell 10 days – 40°C 674 � 37 mg.dm-²
MR-4 1 % agar-cell 10 days – 40°C 679 � 40 mg.dm-²
MR-4 1 % agar-cell 1 day – 40°C 675 � 9 mg.dm-²
MR-4 water 2 days- 5°C 503 � 40 mg.dm-²
MR-4 1% agar 2 days- 5°C 224 � 26 mg.dm-²
MR-4 1 % agar, 15% NaCl-cell 10 days – 40°C -2270 � 23 mg.dm-²
MR-1 3% acetic acid* 10 days – 40°C 967 � 133 mg/object
MR-1 2% agar, 3% acetic acid 10 days – 40°C 443 � 142 mg/object
MR-3 3% acetic acid* 10 days – 40°C 45 ± 8 mg/object
MR-3 2% agar, 3% acetic acid 10 days – 40°C -226/-31/225 mg/object
*adopted from Table 42
5.3.3.2.4. Specific migration from MR-4
All migration experiments were performed at refrigerated temperatures because in the overall
migration studies it was revealed that rapid equilibrium is reached at 40°C. Moreover, meat was
used as well as a ‘simulant’ to compare the behaviour of agar with real food matrices. Results are
summarized in Table 47.
Two migrants could be identified in the migrate and the reported results refer to the main
component (about 90 % w:w). Comparing the specific migration data observed in water with the
overall migration data presented in Table 46, it can be concluded that the quantified migrant is only
a part of the total migrate from the active packaging material. Probably other compounds migrating
from the film itself were involved, which were not detected with the applied analytical method.
Similar as in Table 46, it seems that the specific migration is influenced by the temperature in a
comparable manner as the overall migration.

Interactions with active and intelligent packaging materials 201
Chemical interactions between packaging materials and foodstuffs
Table 47. Specific migration from sample MR-4
Simulant Incubation time/temperature Specific migration (mg.dm-²)
water 2 days – 40°C 369 � 16
water 2 days - 5°C 304 � 14
1 % agar 2 days - 5°C 169 � 11
fresh meat 2 days - 5°C 129 � 19
fresh meat-minced 2 days - 5°C 95 � 25
1 % agar + 15 % NaCl 2 days - 5°C 82 � 7
15 % NaCl 2 days - 5°C 112 � 7
More interesting however, a nearly two-fold reduction in the specific migration is observed using
agar as alternative aqueous solid food simulant. Performing a comparable migration experiment in
meat, it seemed that specific migration levels were similar to those obtained in agar. This result
clearly illustrates the suitability of an agar gel to evaluate migration to solid moisture-rich foods.
The introduction of the alternative simulant is not intended to circumvent the existing migration
limits, by changing the methodology to assess migration. The results presented in Table 47, clearly
illustrate that more realistic migration levels are obtained in agar, which are though still higher
compared to those observed in meat.
As a further elaboration of the solid aqueous simulant, brine was added to the agar gel to reduce its
water activity (about 0.9). An additional reduction in the specific migration was obtained compared
to the levels observed for normal agar. This indicates that, if necessary, the properties of solid
aqueous food simulant can be further adjusted in such a way that better correspondence with the
water activity of the food of interest can be obtained. Water activity is clearly a major driving force
in determining the specific migration of the active compound considered. Similar conclusions could
be drawn by comparing the specific migration levels obtained in water and in brine respectively.
Since the specific migration levels in brine were significantly higher compared to those obtained in
its solid equivalent, it can be concluded that water activity is not the only factor of importance.
Probably the physical entrapment of the water in a solid gel structure and the reduced mobility of
the migrants in the solid simulant seem to be of importance as well.
5.3.3.2.5. Specific migration from MR-3
Some concern exists about the possible accelerated migration from moisture absorbing pads if these

Interactions with active and intelligent packaging materials 202
Chemical interactions between packaging materials and foodstuffs
reach their saturation level. Therefore, migration from pads at different saturation levels to agar gels
was studied. Since no specific migrants could be identified in these active packaging materials, they
were spiked with rhodamine B, which is a fluorescent chromogen.
Results indicate that by increasing the water content of the pad, lower amounts of rhodamine B
migrated to the agar (Table 48). Possibly, due to the lower concentrations of rhodamine B in the
aqueous phase of the pad at higher saturation levels, equilibrium with the agar is reached at lower
chromogen concentrations in the simulant. Consequently, migration was not enhanced due to
higher saturation levels of the pad.
Table 48. Migration of rhodamine B from moisture absorbing pad ad different saturation levels (10
days at 5°C)
Saturation level (%) rhodamine B (mg/pad)
20 1.85 � 00.6
60 0.46 � 0.06
80 0.31 � 0.03
5.3.3.3. Conclusions
Agar gels are able to simulate overall migration to solid moisture-rich food from iron-based oxygen
absorbers and moisture regulators in a much more realistic manner compared to the official
aqueous food simulant. The usefulness of agar to assess overall migration measurements is
however somewhat restricted.
For specific migration experiments, agar seems very promising as an alternative aqueous food
simulant. Additional experiments on other relevant food contact materials seems necessary to
confirm the results of this research.
Despite of the introduction of this more realistic approach to simulate migration from some active
food packaging systems to solid moisture-rich foods, the classification of the active packaging
materials as shown in Table 44, does not change. Therefore it should be concluded that some of the
active packaging systems studied, simply exhibited too high migration levels to be applied in
contact with foodstuffs.
5.3.4. Classification of active and intelligent packaging systems
On the basis of their compositional data and their observed migration behaviour the studied active

Interactions with active and intelligent packaging materials 203
Chemical interactions between packaging materials and foodstuffs
and intelligent packaging systems can be classified. Therefore, the scheme as outlined in Figure 69
was used. Five different categories can be distinguished (category A-E). For systems listed in
category A, only minor legal problems can be expected if they would be applied in practice. For all
other systems, applicability is questionable due to various reasons or combinations thereof (e.g. non
listed components, too high migration levels etc.).
In this classification exercise, the fact whether a packaging system is solely composed of plastics or
not is not taken into account. The presented classification uses EU legislation on food contact
materials for plastics as a reference. As could be concluded from the first chapter, this legislation can
be considered as the most detailed regulation on food contact materials which is applicable in the
whole EU. Therefore it seemed reasonable to use these criteria as a starting point for the
classification. Other legislative restrictions (specific migration limits, food additive, labelling, etc.)
should be considered as well before a particular material can be approved. These are not considered
in the presented classification.
Category A systems comply with current overall migration and compositional restrictions for
plastic food contact materials. Only four of the nineteen tested active materials (MR2, AMP3, ES1,
OA2) can be classified in this category. Systems classified as A, can be composed out of other
materials as plastics as well. Admission to bring these on the EU market should be requested in
each individual member state. It is obvious that such a procedure is very tedious. This fact
combined with the limited number of the evaluated systems classified in category A, clearly
indicates that a (uniform) legislation in the EU for these types of food packaging materials is needed
to guarantee their break-through on the EU market.
For the intelligent systems only those applied at the outside of the package (TTI 1-3) are classified in
this category. Although these materials contain not listed substances, their presence is considered of
minor importance because of the presence of a functional barrier reducing the likely migration of
these substances to minimal and probably safe levels. It is nevertheless clear that carcinogenic and
mutagenic substances cannot be used even if an adequate functional barrier is present.
If the packaging complies with overall migration restrictions, but if the active compounds are not
listed, although toxicological data are available or they are listed as food additives, it is classified in
category B. For the oxygen scavenging films OS4-5 and the oxygen indicators OI1-2 relevant
toxicological data with regard to the active ingredients were found so they can be classified as such.
Similarly the anti-microbial packaging AMP4 could be classified in this category. Some of the
studied systems contained however suspected mutagenic compounds. This clearly illustrates that

Interactions with active and intelligent packaging materials 204
Chemical interactions between packaging materials and foodstuffs
care should be taken in the interpretation of such a classification. A detailed evaluation of the
toxicological data is necessary to evaluate the safety of the systems classified as such. If toxicity data
of the active component allow their uptake in the positive lists, the materials involved could be
classified in category A.
Figure 69. Classification scheme for intelligent and active packaging materials
If the packaging material does not meet the migration limit, although it complies with the positive
lists, it is classified as category C. In most cases, the migration limit is not respected because too
high amounts of the active component migrate from the active packaging material (e.g. ethanol). On
the other hand, also other compounds may migrate into excessive amounts, even if they are not

Interactions with active and intelligent packaging materials 205
Chemical interactions between packaging materials and foodstuffs
intended to do so (e.g. sodium chloride for some oxygen scavengers). Both toxicological relevant
(e.g. iron TDI 0.8 mg/kg bodyweight) and not relevant compounds (e.g. sodium chloride) might be
involved. Following systems were classified in this category: OS1-2, MR1, MR3 and AMP1-2.
Curiously only a limited amount of active releasing systems could be classified as such (AMP1-2).
As already indicated before, such systems could be classified in category A, if a corrected overall
migration level as introduced in Figure 67, would be applied. For the scavenging systems, such a
correction can not be tolerated.
If the packaging system fails on both aspects of the packaging legislation (overall migration and
positive list), but if the compounds present are food additives or if relevant toxicological
information is available, they are classified in category D. Following systems could be classified as
such: OS-3, MR4, OA1, ES2 and AMP5. If the toxicity data of the active compounds enable their
incorporation on the positive list, the systems could be classified in category C.
If no toxicological data are available or the component is not a food additive and the systems passes
the migration tests, the systems are classified in category E. None of the collected active systems fell
into this category. Since for the carbon dioxide indicator, several components were present for
which no toxicity data were available, it was classified as such. If toxicity data would become
available, the system could be classified as B.
System AMP6 could not be classified at all, since it exceeded the migration limits and no adequate
toxicity data on the active components were available.
In Table 49 an overview of the classification is presented. It is supposed that the materials tested can
be contacted with all kinds of foodstuffs. Of course, some active packaging materials will only be
used with some specific foodstuffs. Therefore, adjustment of the proposed classification, taking into
account the intended use of the active packaging material, can be made. Alternatively, the use in a
particular kind of foodstuff, in which the overall migration limit was exceeded, could be excluded.
By doing so the following active systems, initially classified as C, could be classified as A if their use
in the indicated food classes is avoided : MR1 (acidic foods), AMP2 (fatty foods) and MR3 (acidic
and fatty foods).
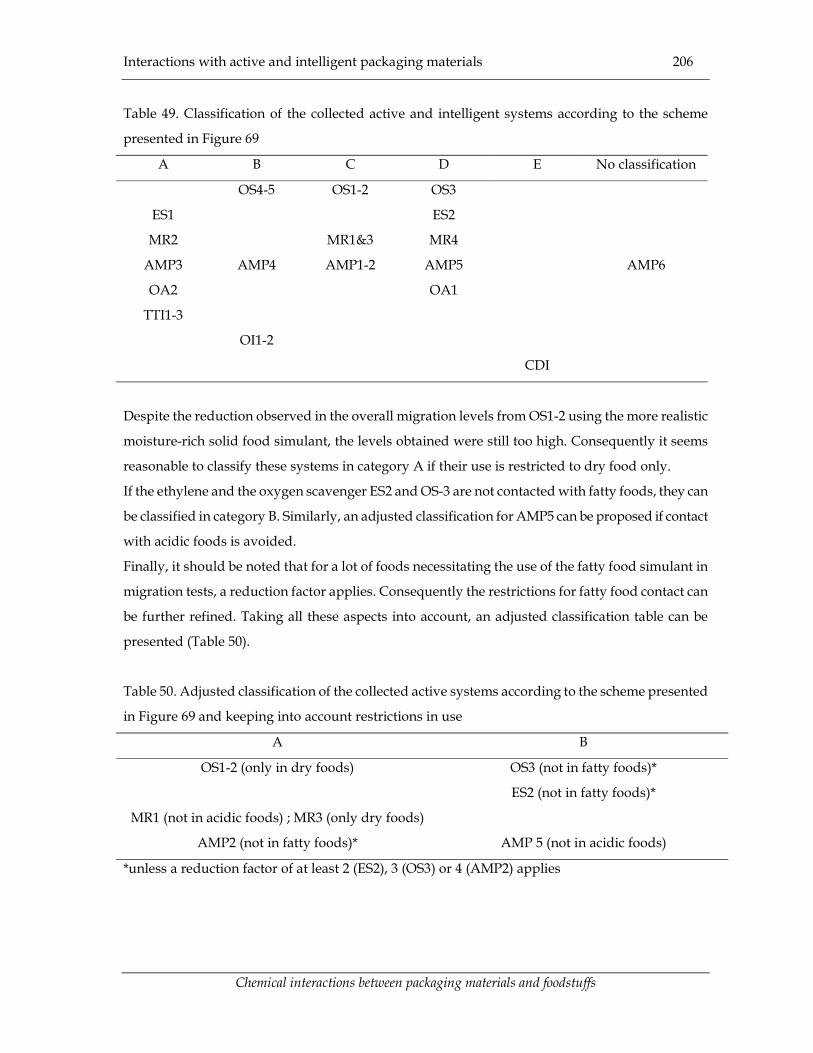
Interactions with active and intelligent packaging materials 206
Chemical interactions between packaging materials and foodstuffs
Table 49. Classification of the collected active and intelligent systems according to the scheme
presented in Figure 69
A B C D E No classification
OS4-5 OS1-2 OS3
ES1 ES2
MR2 MR1&3 MR4
AMP3 AMP4 AMP1-2 AMP5 AMP6
OA2 OA1
TTI1-3
OI1-2
CDI
Despite the reduction observed in the overall migration levels from OS1-2 using the more realistic
moisture-rich solid food simulant, the levels obtained were still too high. Consequently it seems
reasonable to classify these systems in category A if their use is restricted to dry food only.
If the ethylene and the oxygen scavenger ES2 and OS-3 are not contacted with fatty foods, they can
be classified in category B. Similarly, an adjusted classification for AMP5 can be proposed if contact
with acidic foods is avoided.
Finally, it should be noted that for a lot of foods necessitating the use of the fatty food simulant in
migration tests, a reduction factor applies. Consequently the restrictions for fatty food contact can
be further refined. Taking all these aspects into account, an adjusted classification table can be
presented (Table 50).
Table 50. Adjusted classification of the collected active systems according to the scheme presented
in Figure 69 and keeping into account restrictions in use
A B
OS1-2 (only in dry foods) OS3 (not in fatty foods)*
ES2 (not in fatty foods)*
MR1 (not in acidic foods) ; MR3 (only dry foods)
AMP2 (not in fatty foods)* AMP 5 (not in acidic foods)
*unless a reduction factor of at least 2 (ES2), 3 (OS3) or 4 (AMP2) applies

Interactions with active and intelligent packaging materials 207
Chemical interactions between packaging materials and foodstuffs
5.3.5. Possible conflicts with regard to food additive legislation
5.3.5.1. Introduction
As already stressed before, apart from the food contact material regulations, also other food
legislation should be considered to implement active and intelligent packaging systems. Fabech et
al. (2000) presented recently a comprehensive overview of the legislation which could be relevant in
this respect.
Food additive legislation may be one of the most important to consider and therefore some of the
main conflicts which can be identified will be discussed here in some more detail, together with
some propositions how these problems could be solved.
Basically, since intelligent packaging materials are designed to monitor the (quality of the) packed
food, a conflict with food additive legislation is not likely to occur. A more complex situation arises
if active packaging materials are considered, because these can be designed in such a way that
substances deliberately migrate to the food.
From the collected active packaging materials, it became clear that both releasing and absorbing
systems can be distinguished. It is obvious that especially the releasing systems are a matter of
concern in the present discussion. Experimental migration studies however revealed that also
absorbing active systems may transfer particular components of interest to the food, like for
example sodium chloride (food ingredient) or sugar alcohols (food additive). If these compounds
can fulfil a technical function in the food, they should be regarded as food additives and
consequently, the active packaging material in concern should be considered as a releasing system
as well. Otherwise, the migrants should be regarded as contaminants and food additive legislation
should not be considered.
These experimental observations clearly indicate that not only the releasing active packaging
systems but also the absorbing materials are of importance if the legislative aspects of food
additives, are discussed with respect to active packaging materials.
Supplementation of additives to the food via the packaging material is foreseen in the legislation
since it is specified that their addition may serve a technological purpose during the packaging,
transport or storage of the food. This is exactly what the purpose of active packaging is : fulfilling a
technological function in the food while the food is already packed. Although food additive
legislation basically agrees with the principle of active releasing packaging materials, some major

Interactions with active and intelligent packaging materials 208
Chemical interactions between packaging materials and foodstuffs
problems with this regulation may occur.
5.3.5.2. Problem identification and solution
Problems with regard to migration
As indicated above, the concentration of the active compound should be high enough to ensure that
the active packaging system is really effective. Due to migration however, the concentration of the
active compound in the food can become that high that the migration restrictions are not respected.
As suggested already before (Figure 67), a possible solution could be to subtract the migration of the
active compound from the overall migration level. This corrected level should be in compliance
with current restrictions. If the specific migration level is exceeded, the use of the material should be
rejected since these specific migration levels are based on toxicological considerations. Of course
maximal concentration as specified in the food additive legislation should be respected as well. This
might necessitate a specification about the minimal amount of food to be contacted with the
material.
The migration of the active compound to (semi-) solid foods probably creates a non uniform
distribution of the component in food, due to restricted diffusion. Therefore, those parts of the food
in close contact with the contact material will contain the highest concentrations of the additive. It
might be possible that from a safety point of view, that particularly in those parts, too high
concentrations are reached
A similar problem is observed for the non uniform distribution of pesticides on crops. In this
particular area, the concept of the acute reference dose has been recently applied, which could also
be helpful in this particular case. It is obvious that too high local concentrations of the active
compound should be avoided.
Problems with positive lists specified for food additives and labelling
Food additive legislation foresees lists in which the use of an additive is tolerated for a particular
foodstuff. As already stated before, it is clear that these regulations should be respected, even if the
supplementation of the additive proceeds via the packaging material. Therefore, proper instructions
for use and application should be provided together with the active packaging material. It is
obvious as well that the presence of the food additive in the food should be labelled, even if it
originates from the packaging material.

Interactions with active and intelligent packaging materials 209
Chemical interactions between packaging materials and foodstuffs
Problems with regard to the acceptable daily intake
Toxicological relevant compounds used as food additives, are characterised with an acceptable
daily intake value. This value is used as a tool to set maximal concentrations present in the food. A
regular evaluation of the food consumption and the concentration of the particular food additive
enables to calculate the estimated daily intake of the compound. If this estimated intake is higher
then the acceptable intake, legislation will be changed by lowering the maximal concentrations in
the food. It is possible that due to the application of the new packaging technology discussed, the
intake of some additives will increase and might cause too high daily intakes.
Consequently, the intake of additives via the packaging material should also be monitored, similar
as the monitoring of the additives supplemented in the traditional way to the food. If necessary,
maximal levels in some foods should be changed in order to guarantee food safety.
Problems about the presence of impurities
For food additives, some purity criteria are specified. Migrants from a releasing packaging material,
which are not due however to the presence of the food additive, should not be considered as
impurities of the additive itself.
A more important problem could arise due to the accelerated degradation of the food additive
because of the processing of the active packaging material (e.g. antioxidants in an extruded plastic
film). Food additive legislation considers the additive even if it is present in an altered form. So
consequently possible reaction products should be identified to allow toxicological evaluation if
necessary. Both the original compound and its side-products should be taken into account to
evaluate the compliance with the qualitative restrictions specified in both food contact and food
additive legislation.
Problems with regard to active and ordinary migrants
It has been suggested that deliberate addition of substances to the food via the contact material
should be declared in the ingredient list. Of course not every migrant should be mentioned. In
addition, a plastic additive can be a food additive at the same time, but its migration may not serve
a technical function in the food. So consequently a difference between an active and an ordinary
migrant, not fulfilling a technical function in the food, should be made. Only those migrants which
are active should be indicated on the ingredient list of the packed food. This approach however
could create some problems since traditional food contact materials such as tin cans or wood can be
considered to be active and consequently the active ingredients (tin, wood components) should be
declared. On the other hand, if the claimed activities of a packaging material are not in

Interactions with active and intelligent packaging materials 210
Chemical interactions between packaging materials and foodstuffs
correspondence with the activity of the migrating substances, it could be an indication that other
migrating species are involved.
As indicated above, the active compound released by an active packaging material may not fulfil its
technical function to the food. This could be due to several reasons which are not relevant in the
present discussion, but experimental evidence of such cases have been demonstrated in other parts
of the ‘ACTIPAK’ project. The contact material should then be considered as an ordinary food
packaging material, for which the food contact material legislation applies.
For all these problems, it should be emphasised as well that food legislation does not tolerate the
presence of compounds which normally should not be present in the food as such. So basically if the
compound is not fulfilling a function in the food, its presence should be regarded in detail, to
evaluate the cause of its presence and to decide whether its presence can be tolerated or not.
5.3.5.3. Conclusions
Most probably this list of possible conflicts with food additive and other related legislation and
active food packaging materials is not complete. In addition, some of the solutions suggested can be
replaced by others. Nevertheless this short overview indicates that major problems may arise with
regard to food additive legislation if active packaging materials are to be implemented.
To make the situation even more complicated, it should be realised that apart from conflicts with
food additive legislation, also other legal problems can be expected. In addition, concern about the
microbiological safety of some of the systems applied, arises as well. Therefore it seems reasonable
to assume that a general solution to these legal and other problems will only be available within a
number of years. In order to enable food industry to apply this new technology sooner, it could be
suggested that a European committee of experts, as could for example be present in the European
Food Authority, evaluates petitions by a case by case methodology. Considering the reflections
about the possible conflicts with food additive legislation, the scheme as outlined in Figure 70 could
be applied for the evaluation of active food packaging materials. Particularly for the active releasing
materials, compliance with food legislation will very much depend on the type of food to be
contacted with the material. Therefore the case by case strategy for the evaluation of these
packaging systems, will always be necessary up to a certain extend, even if dedicated legislation
would be come available in the time to come.

Interactions with active and intelligent packaging materials 211
Chemical interactions between packaging materials and foodstuffs
Material specifications deliverd by producer :- composition- conditions of use- claimed activities
Identification of migrating substances(desk research)
Can migrating susbtance induce
an activity ?(desk research)
Can migrating susbtance induce
an activity ?(desk research)
Can migrating susbtance induceactivity differentfrom the claimed
acitvity ?(desk research)
Can migrating susbtance induceactivity differentfrom the claimed
acitvity ?(desk research)
Y
Is claimedactivity
present ?(lab research)
Is claimedactivity
present ?(lab research)
N
Can this expe-rimentally beconfirmed ?
(lab research))
Can this expe-rimentally beconfirmed ?
(lab research))
Y
Adjustment of activity claims
Y
N
Is the material in correspondencewith food contact
material legis-lation ?
Is the material in correspondencewith food contact
material legis-lation ?
N
N
Is the materialin correspondencewith food additive,
legislation, or is activecomponent
a food ingredient ?
No approval
Y
Y
ApprovalNo approval
N
Y
N
Figure 70. Main conflicts with food additive legislation which may arise due to the introduction of
active packaging materials
5.3.6. Conclusions
With regard to the composition, a first important conclusion is that a lot of active and intelligent
packaging systems are very complex. Apart from plastics, other materials such as paper, metals,
minerals etc. are being used. Various of these complex layouts, are not supposed to enhance the
user-friendliness of these materials because most of them should be added separately to the packed
food. Some active materials on the other hand are simple plastic films. Therefore the present
legislation for plastics applies only for a minority of the tested materials.
If this legislation is considered however to classify the systems, it seemed that both conflicts with

Interactions with active and intelligent packaging materials 212
Chemical interactions between packaging materials and foodstuffs
regard to their composition and their migration behaviour occurred. The use of an alternative
aqueous solid food simulant, which proved to simulate migration in a much more realistic manner
then the official aqueous food simulant, for some of the evaluated systems, did not allow to change
these conclusions.
Apart from the food contact material legislation, also other food legislation should be considered in
the evaluation of these materials. Food additive legislation is an important example, especially with
regard to the releasing active systems.
Generally it could be concluded that a dedicated regulation seems to be necessary to permit
breakthrough of these materials on the EU market and to guarantee their safe introduction and use
in Europe. Because of the multitude of legislative problems which can be expected if active or
intelligent packaging systems are to be implemented, a case by case evaluation by for example the
European Food Authority seems appropriate if indeed application of these new technologies on the
EU-level should be realised within the near future.
General conclusions 215
Chemical interactions between packaging materials and foodstuffs
6. General conclusions
The first part of the experimental work of this study about chemical interactions between foods and
packaging materials, considered the chemical characterisation of polyglycerol esters. These
compounds are a group of complex plastic additives. The analytical scheme presented consisted
essentially of two steps : the identification of the polyglycerol moiety of the esters followed by a
further analysis of the esters themselves.
Polyglycerols could be determined quantitatively up to the tetraglycerols, while qualitative analysis
up to heptaglycerol was possible using a gas chromatographic separation, after derivatisation of the
polyols into trimethyl silyl ethers. A possible identification of various non cyclic and cyclic isomers
of di-and triglycerol could be presented as well.
For the analysis of the polyglycerol esters, a combined liquid and gas chromatographic analytical
method was presented. The liquid chromatographic pre-fractionation of the sample seemed
necessary because several components co-eluted during the gas chromatographic analysis. Using
column chromatography, standards with sufficient purity of the following compounds were
isolated : di-esters of di- and triglycerol and mono-esters of di-and triglycerol. Consequently,
qualitative analysis of these compounds would be possible using the methodology presented.
Mono-esters of tetraglycerol could be analysed qualitatively as well. In addition, a possible
identification of various isomers of the mono-esters of diglycerol was presented.
The second part dealt with an evaluation of immunological methods as an alternative analytical
methodology to study the specific migration. Therefore a model compound, bisphenol A, was
selected and an enzyme-linked immunosorbent assay was developed.
Bisphenol A was converted into a suitable hapten which could be covalently bound to proteins. In
such a manner, an immunizing antigen could be produced which was injected in chicken hens. The
polyclonal antibodies could conveniently be isolated from the yolk of the eggs, the hens produced.
Using a bisphenol A coating antigen, it could be revealed that the IgY antibodies showed reactivity
towards bisphenol A.
Using the same coating antigen and a secondary anti IgY antibody from rabbits, which was coupled
to a peroxydase, the isolated antibodies were applied in an indirect competitive enzyme-linked
immunosorbent assay. The assay proved to be quite sensitive towards possible matrix effects such a
the ionic strength and the presence of surface active components like proteins. It was moreover
revealed that the sensitivity of the assay was lower compared to the classical instrumental methods
General conclusions 216
Chemical interactions between packaging materials and foodstuffs
or to recently developed immunoassays for bisphenol A using poly- and monoclonal mammalian
antibodies. Variation of several experimental parameters did not result in a spectacular increase in
assay sensitivity.
Nevertheless, the assay proved to be very specific towards bisphenol A. In addition the loss of
sensitivity in the direct analysis of milk could be restricted as well.
In the last part of this study, the interactions between food and active and intelligent packaging
systems were investigated. This part consisted of a EU FAIR R&D research project, called
‘ACTIPAK’ (CT 98-4170).
It was revealed that the studied packaging systems were complex in their composition. Only a few
materials were solely composed of plastics. Despite this observation, EU food contact material
legislation with regard to plastics was considered to evaluate the collected systems. Problems with
both their composition (positive list) and their overall migration behaviour were observed. Only 20
% of the tested systems did not present any problems. These observations clearly indicate the need
for a dedicated EU legislation to allow brake-through of active and intelligent food packaging
systems on the EU market.
The use of an alternative aqueous solid food simulant was evaluated for some oxygen absorbers
and moisture regulators. The agar gels seemed to simulate the migration to moisture-rich solid
foodstuffs such as meat, in a much more realistic way, compared to the official aqueous food
simulant.
In addition to the problems of their composition and their migration behaviour, active and
intelligent packaging materials may be in conflict with other food legislative aspects. Food additive
legislation can be considered as an important example in this respect, especially for active
packaging materials. Because of the multitude of legislative problems which can be expected if
active or intelligent packaging systems are to be implemented, a case by case evaluation by the
European Food Authority seems appropriate in order to guarantee food safety and quality.

General conclusions 215
Chemical interactions between packaging materials and foodstuffs
6. General conclusions
The first part of the experimental work of this study about chemical interactions between foods and
packaging materials, considered the chemical characterisation of polyglycerol esters. These
compounds are a group of complex plastic additives. The analytical scheme presented consisted
essentially of two steps : the identification of the polyglycerol moiety of the esters followed by a
further analysis of the esters themselves.
Polyglycerols could be determined quantitatively up to the tetraglycerols, while qualitative analysis
up to heptaglycerol was possible using a gas chromatographic separation, after derivatisation of the
polyols into trimethyl silyl ethers. A possible identification of various non cyclic and cyclic isomers
of di-and triglycerol could be presented as well.
For the analysis of the polyglycerol esters, a combined liquid and gas chromatographic analytical
method was presented. The liquid chromatographic pre-fractionation of the sample seemed
necessary because several components co-eluted during the gas chromatographic analysis. Using
column chromatography, standards with sufficient purity of the following compounds were
isolated : di-esters of di- and triglycerol and mono-esters of di-and triglycerol. Consequently,
qualitative analysis of these compounds would be possible using the methodology presented.
Mono-esters of tetraglycerol could be analysed qualitatively as well. In addition, a possible
identification of various isomers of the mono-esters of diglycerol was presented.
The second part dealt with an evaluation of immunological methods as an alternative analytical
methodology to study the specific migration. Therefore a model compound, bisphenol A, was
selected and an enzyme-linked immunosorbent assay was developed.
Bisphenol A was converted into a suitable hapten which could be covalently bound to proteins. In
such a manner, an immunizing antigen could be produced which was injected in chicken hens. The
polyclonal antibodies could conveniently be isolated from the yolk of the eggs, the hens produced.
Using a bisphenol A coating antigen, it could be revealed that the IgY antibodies showed reactivity
towards bisphenol A.
Using the same coating antigen and a secondary anti IgY antibody from rabbits, which was coupled
to a peroxydase, the isolated antibodies were applied in an indirect competitive enzyme-linked
immunosorbent assay. The assay proved to be quite sensitive towards possible matrix effects such a
the ionic strength and the presence of surface active components like proteins. It was moreover
revealed that the sensitivity of the assay was lower compared to the classical instrumental methods

General conclusions 216
Chemical interactions between packaging materials and foodstuffs
or to recently developed immunoassays for bisphenol A using poly- and monoclonal mammalian
antibodies. Variation of several experimental parameters did not result in a spectacular increase in
assay sensitivity.
Nevertheless, the assay proved to be very specific towards bisphenol A. In addition the loss of
sensitivity in the direct analysis of milk could be restricted as well.
In the last part of this study, the interactions between food and active and intelligent packaging
systems were investigated. This part consisted of a EU FAIR R&D research project, called
‘ACTIPAK’ (CT 98-4170).
It was revealed that the studied packaging systems were complex in their composition. Only a few
materials were solely composed of plastics. Despite this observation, EU food contact material
legislation with regard to plastics was considered to evaluate the collected systems. Problems with
both their composition (positive list) and their overall migration behaviour were observed. Only 20
% of the tested systems did not present any problems. These observations clearly indicate the need
for a dedicated EU legislation to allow brake-through of active and intelligent food packaging
systems on the EU market.
The use of an alternative aqueous solid food simulant was evaluated for some oxygen absorbers
and moisture regulators. The agar gels seemed to simulate the migration to moisture-rich solid
foodstuffs such as meat, in a much more realistic way, compared to the official aqueous food
simulant.
In addition to the problems of their composition and their migration behaviour, active and
intelligent packaging materials may be in conflict with other food legislative aspects. Food additive
legislation can be considered as an important example in this respect, especially for active
packaging materials. Because of the multitude of legislative problems which can be expected if
active or intelligent packaging systems are to be implemented, a case by case evaluation by the
European Food Authority seems appropriate in order to guarantee food safety and quality.

References 219
Chemical interactions between packaging materials and foodstuffs
7. References
Anonymous (2000) Committee of expert on materials coming into contact with food. 38th Meeting.
Explanation of the draft version 4 of the resolution on rubber intended to come into contact with
foodstuffs. 62p.
Abad, A. and Montaya, A. (1997) Development of an enzyme-linked immunosorbent assay to
carbaryl. 2. Assay optimization and application to the analysis of water samples. Journal of
Agricultural and Food Chemistry 45 1495-1501.
Abad, A., Primo, J. and Montoya, A. (1997) Development of an enzyme-linked immunosorbent assay
to carbaryl. 1. Antibody production from several haptens and characterization in different
immuno assay formats. Journal of Agricultural and Food Chemistry 45 1486-1494.
Abouzied, M.M., Azcona Olievera, J.I., Yoshizawa, T. and Pestka, J.J (1993) Production of polyclonal
antibodies to the trichothecene mycotoxin 4,15-diacetylnivalenol with the carrier adjuvant
cholera toxin. Applied and Environmental Microbiology 59 1264-1268.
Ahvenainen, R., Hurme, E. and Smolander, M. (1999) Active and smart packaging for food
products. Verpackungs-Rundschau, Technisch-Wissenschaftliche Beilage 50 36-40.
Aitzetmüller, K., Böhrs, M. and Arzberger, E. (1979) Analysis of polyglycerols and other polyols from
emulsifiers by HPLC. Fette Seifen und Anstrichmittel 81 436-441.
Akita, E.M. and Nakai, S. (1992) Immunoglobulins from egg yolk: isolation and purification. Journal of
Food Science 57 629-633.
Albrecht, U., Hammer, P. and Heeschen, W. (1996) Chicken antibody based ELISA for the detection of
spiramycin in raw milk. Milchwissenschaft 51 209-212.
Amano, S., Ohta, Y., Fujiwara, K., Miyake, K., Fujii, S., Yoshida, T., Matsubara, O., Masuda, Y. and
Hayashi, T. (1995) Improvement of the sandwich ELISA for the determination of basement
membrane collagen complex in sera of patients with chronic liver diseases by utilizing the
chaotropic ion, NaSCN. International Hepatology Communications 4 1-8.
Andersen, M., Kiel, P., Larsen, H. and Maxild, J. (1978). Mutagenic action of aromatic epoxy resins.
Nature 276 391-392.
Ashby, J. and Tennants, R.W. (1988). Chemical structure, Salmonella mutagenicity and extent of
carcinogenicity as indicators of genotoxic carcinogens. Mutation research 204 17-115. In : Roy, D.,
Palangat, M., Chen, C., Thomas, R.D., Colerangle, J., Atkinson, A. and Yan, Z. (1997).
Biochemical and molecular changes at the cellular level in response to exposure to
environmental estrogen-like chemicals. Journal of Toxicology and Environmental Health 50 1-29.

References 220
Chemical interactions between packaging materials and foodstuffs
Ashby, J. and Tennants, R.W. (1991). Definitive relationships among chemical structure,
carcinogenicity and mutagenicity for 301 chemicals tested by the U.S. NTP. Mutation research 257
229-306. In : Hilliard, C.A., Armstrong, M.J., Bradt, C.I., Hill, R.B., Greenwood, S.K. and
Galloway, S.M. (1998). Chromosome aberrations in vitro related to cytotoxicity of nonmutagenic
chemicals and metabolic poisons. Environmental and Molecular Mutagenesis 31 316-326.
Ashby, J., Tinwell, H. and Haseman, J. (1999). Lack of effects for low dose levels of bisphenol A and
diethylstilbestrol on the prostate gland of CF1 mice exposed in utero. Regulatory Toxicology and
Pharmacology 30 156-166.
Atkinson, A. and Roy, D. (1995a). In vitro conversion of environmental estrogenic chemical bisphenol
A to DNA binding metabolite(s). Biochemical and Biophysical Research Communications 210 424-433.
Atkinson, A. and Roy, D. (1995b). In vivo DNA adduct formation by bisphenol A. Environmental and
Molecular Mutagenesis 26 60-66.
Axén, R. and Ernback, S. (1971) Chemical fixation of enzymes to cyanogen halide activated
polysaccharide carriers. European Journal of Biochemistry 18 351-360.
Azcona Oliviera, J.I., Abouzied, M.M., Plattner, R.D., Norred, W.P. and Pestka, J.J. (1992)
Generation of antibodies reactive with fumonisins B1, B2 and B3, by using cholera toxin as the
carrier-adjuvant. Applied and Environmental Microbiology 58 69-73.
Babayan, V.K. and Mc Intyre, R.T. (1971) Preparation and properties of some polyglycerol esters of
short and medium chain length fatty acids. Journal of the American Oil Chemists’ Society 48 307-
309.
Baldwin, R.E. (1986) Functional properties of eggs in foods, in “Egg Science and Technology”, W.J.
Stadelman and O.J. Cotterill (Ed.), Macmillan Publishers, 345-383.
Baner, A.L. (2000) Partition coefficients, in “Plastic packaging materials for food, barrier function, mass
transport, quality assurance and legislation”, O.-G. Piringer and A.L. Baner (Ed.), Wiley-VCH,
Weinheim, 79-123.
Baner, A., Bieber, W., Figge, K., Franz, R. and Piringer, O. (1992) Alternative fatty food simulants for
migration testing of polymeric food contact materials. Food Additives and Contaminants 9 137-148.
Baner, A.L., Kalyankaer, V. and Shoun, L.H. (1991) Aroma sorption evaluation of aseptic packaging.
Journal of Food Science 56 1051-1054.
Bar-Joseph, M. and Malkinson, M. (1980) Hen egg yolk as a source of antiviral antibodies in the
enzyme-linked immunosorbent asay (ELISA): a comparison of two plant viruses. Journal of
Virological Methods 1 179-183.

References 221
Chemical interactions between packaging materials and foodstuffs
Barlow, S.W. (1994) The role of the Scientific Committee for food in evaluating plastics for packaging,
Food Additives and Contaminants 11 249-259.
Barlow, S.W., Kozianowski, G., Würtzen, G. and Schlatter, J. (2001) Threshold of toxicological concern
for chemical substances present in the diet. Food and Chemical toxicology 39 893-905.
Bartz, C.R. Conklin, R.H., Tunstall, C.B. and Steele, J.H. (1980) Prevention of murine rotavirus
infection with chicken egg yolk immunoglobulin. Journal of Infectious Diseases 142 439-441.
Bauminger, S. and Wilchek, M. (1980) The use of carbodiimides in the preparation of immunizing
conjugates. Methods in enzymology 70 151-159.
Begley, T.H. (1997) Methods and approaches used by FDA to evaluate the safety of food packaging
materials. Food Additives and Contaminants 14 545-553.
Begley, T.H. (2000) Migration from food packaging: regulatory considerations for estimating
exposure, in “Plastic packaging materials for food, barrier function, mass transport, quality
assurance and legislation”, O.-G. Piringer and A.L. Baner (Ed.), Wiley-VCH, Weinheim, 359-392.
Behrens, H. and Mieth, G. (1984) Synthese, Charakterisierung und Applikation von Polyglycerolen
und Polyglycerolfettsäurestern. Die Nährung 28 815-835.
Bergeron, R.M., Thompson, T.B., Leonard, L.S., Pluta, L. and Gaido, K.W. (1999). Estrogenicity of
bisphenol A in a human endometrial carcinoma cell line. Molecular and Cellular Endocrinology 150
179-187.
Biedermann, M., Bronz, M., Grob, K., Gfeller, H. and Schmid, J.P. (1997) BADGE and its
accompanying compounds in canned oily foods: further results. Mitteilungen aus dem Gebiete der
Lebensmitteluntersuchung und Hygiene 88 277-292,
Biedermann, M. and Grob K. (1998) Food contamination from epoxy resins and organosols used as
can coatings : analysis by gradient NPLC. Food Additives and Contaminants 15 609-618.
Biles, J.E., McNeal, T.P. and Begley, T.H. (1997) Determination of bisphenol A migrating from epoxy
can coatings to infant formula liquid concentrates. Journal of Agricultural and Food Chemistry 45
4697-4700
Blais,B.W., Philippe, L.M. (2000) A cloth-based enzyme immunoassay for detection of peanut proteins
in foods. Food and Agricultural Immunology 12 243-248.
Boccacci Mariani, M., Chiacchiernini, E. and Gesumundo, C. (1999) Potential of diisopropyl
naphthalenes from recycled paperboard packaging into dry foods. Food Additives and
Contaminants 16 207-213.

References 222
Chemical interactions between packaging materials and foodstuffs
Brandsch, J., Mercea, P. and Piringer, O. (2000) Possibilities and limitations of migration modelling, in
“Plastic packaging materials for food, barrier function, mass transport, quality assurance and
legislation”, O.-G. Piringer and A.L. Baner (Ed.), Wiley-VCH, Weinheim, 446-468.
Brandsch, J. and Piringer, O. (2000) Characteristics of plastic materials, in “Plastic packaging materials
for food, barrier function, mass transport, quality assurance and legislation”, O.-G. Piringer and
A.L. Baner (Ed.), Wiley-VCH, Weinheim, 9-45.
Briand, J.P., Muller, S. and Van Regenmortel, MV.H. (1985) Synthetic peptides as antigens : pitfalls of
conjugation methods. Journal of Immunologival Methods 78 78 56-69.
Brussow, H., Hilpert, H., Walther, I., Sidoti, J., Mietens, C. and Bachmann, P. (1987) Bovine milk
immunoglobulins for passive immunization to infantile rotavirus gastro-enteritis. Journal of
Clinical Microbiology 25 982-986.
Burley, R.W. and Cook, W.H. (1961) Isolation and composition of avian yolk granules and their
constituent alpha and beta-lipovitellins. Canadian Journal of Biochemical Physiology 39 1295.
Burns, B.G., Musial, C.J. and Uthe, J.F. (1981) Novel cleanup method for quantitative gas
chromatographic determination of trace amounts of di-2-ethylhexyl phthalate in fish lipid. The
Journal of the AOAC International 64 282-286.
Burt, S.M, Carter, T.J.N. and Kricka, L.J. (1979). Thermal characteristics of microtitre plates used in
immunological assays. Journal of Immunological Methods 31 231-236.
Bush, J., Gilbert, J. and Goenaga, X. (1993) Spectra for the identification of monomers in food
packaging. Kluwer Academic Publishers, Dordrecht, The Netherlands, 435p.
Cagen, S.Z., Waechter, J.M.Jr., Dimond, S.S., Breslin, W.J., Butala, J.H., Jekat, F.W., Joiner, R.L.,
Shiotsuka, R.N., Veenstra, G.E. and Harris, L.R. (1999). Normal reproductive organ
development in CF-1 mice following prenatal exposure to bisphenol A. Toxicological Sciences 50
36-44.
Cairoli, S., Arnoldi, A. and Pagani, S. (1996) Enzyme -linked immunoassay for the quantitation of the
fungicide tetraconazole in fruits and fruit juices. Journal of Agricultural and Food Chemistry 44
3849-3854.
Cassel, S., Chaimbault, P., Debaig, C., Benvegnu, T., Claude, S., Plusquellec, D., Rollin, P. and Lafosse,
M. (2001) Liquid chromatography of polyglycerol fatty esters and fatty ethers on porous
graphite carbon and octadecyl silica by using evaporative light scattering detection and mass
spectrometry. Journal of Chromatography 919 95-106.
Castle, L. (1996) Methodology in “Migration from food contact materials”, Katan, L.L (Ed.), Blackie
Academic and Professional, London, 207-250.

References 223
Chemical interactions between packaging materials and foodstuffs
Castle, L. (2000) Exposure estimates used in risk assessment. Measuring migration to food is
important – why and how ? Programme and Abstracts of the 2nd International Symposium on
Food packaging : ensuring the safety and quality of foods, ILSI Europe, p.19.
Castle, L., Gilbert, J. and Eklund, T. (1990) Migration of plasticizer from poly(vinylchloride) milk
tubing. Food Additives and Contaminants 7 591-596.
Castle, L., Hedgcock, S.E., Kwiatkowska, C.A., Sharman, M. and Smith, I.D. (1992) An improved olive
oil overall migration test for plastics using Karl Fisher titration. Food Additives and Contaminants 9
11-17.
Castle, L., Honeybone, C.A., Read, W.A., Sharman, M. and Gilbert, J. (1994) Development and
interlaboratory assessment of a method to determine “fatty contact” in support of EC directives
on migration form food contact plastics. Deutsche Lebensmittel-Rundschau 90 5-9.
Castle, L., Mayo, A. and Gilbert, J. (1989) Migration of plasticizers from printing inks into foods. Food
Additives and Contaminants 6 437-443.
Castle, L., Mercer, A.J., Startin, J.R. and Gilbert, J. (1988) Migration from plasticized film into foods 3,
Migration of phthalate, sebacate, citrate and phosphate esters from films used for retail food
packaging. Food Additives and Contaminants 5 9-20.
Catty, D. (1988). Properties of antibodies and antigens. In“Antibodies, a practical approach Volume
I” , Catty, D. (Ed.), IRL Press, Oxford, 7-18.
Catty, D. and Raykundalia, C. (1989). ELISA and related enzyme immunoassays. In “Antibodies, a
practical approach Volume II” , Catty, D. (Ed.), IRL Press, Oxford, 97-154.
CEN (1994a) European Standards EN/ENV 1186-1, Materials and articles in contact with foodstuffs-
Plastics, part 1 : guide to the selection of conditions and test methods for overall migration.
European Committee for standardization, Brussels, Belgium.
CEN (1994b) European Standards EN/ENV 1186-2, Materials and articles in contact with
foodstuffs-Plastics, part 2 : test methods for overall migration in olive oil by total immersion.
European Committee for standardization, Brussels, Belgium.
CEN (1994c) European Standards EN/ENV 1186-3, Materials and articles in contact with
foodstuffs-Plastics, part 3 : test methods for overall migration into aqueous simulants by
total immersion. European Committee for standardization, Brussels, Belgium.
CEN (1994d) European Standards EN/ENV 1186-4, Materials and articles in contact with
foodstuffs-Plastics, part 4 : test methods for overall migration in olive oil by cell. European
Committee for standardization, Brussels, Belgium.
CEN (1994e) European Standards EN/ENV 1186-5, Materials and articles in contact with

References 224
Chemical interactions between packaging materials and foodstuffs
foodstuffs-Plastics, part 5 : test methods for overall migration into aqueous simulants by cell.
European Committee for standardization, Brussels, Belgium.
CEN (1994f) European Standards EN/ENV 1186-6, Materials and articles in contact with
foodstuffs-Plastics, part 6 : test methods for overall migration in olive oil using a pouch.
European Committee for standardization, Brussels, Belgium.
CEN (1994g) European Standards EN/ENV 1186-7, Materials and articles in contact with
foodstuffs-Plastics, part 7 : test methods for overall migration into aqueous simulants using a
pouch. European Committee for standardization, Brussels, Belgium.
CEN (1994h) European Standards EN/ENV 1186-8, Materials and articles in contact with
foodstuffs-Plastics, part 8 : test methods for overall migration in olive oil by by article filling.
European Committee for standardization, Brussels, Belgium
CEN (1994i) European Standards EN/ENV 1186-9, Materials and articles in contact with
foodstuffs-Plastics, part 9 : test methods for overall migration in into aqueous simulants by
article filling. European Committee for standardization, Brussels, Belgium.
CEN (1994j) European Standards EN/ENV 1186-10, Materials and articles in contact with
foodstuffs-Plastics, part 10 : test methods for overall migration into olive oil (modified
method for use in case where incomplete extraction of olive oil occurs). European
Committee for standardization, Brussels, Belgium.
CEN (1995a) European Standards EN/ENV 1186-11, Materials and articles in contact with
foodstuffs-Plastics, part 11 : test methods for overall migration into mixtures of 14C-labelled
synthetic triglycerides. European Committee for standardization, Brussels, Belgium.
CEN (1995b) European Standards EN/ENV 1186-12, Materials and articles in contact with
foodstuffs-Plastics, part 12 : test methods for overall migration at low temperatures.
European Committee for standardization, Brussels, Belgium.
CEN (1998) European Standards EN/ENV 1186, Materials and articles in contact with foodstuffs-
Plastics, part 15 (draft version). European Committee for standardization, Brussels, Belgium,
August 1998.
CEN (1999a) European Standards EN/ENV 13130-1, Materials and articles in contact with
foodstuffs-Plastic substances subject to limitation, part 1 : guide to test methods for the
specific migration of substances from plastics into foods and food simulants and the
determination of substances in plastics and the selection of conditions of exposure to food
simulants. European Committee for standardization, Brussels, Belgium.
CEN (1999b) European Standards EN/ENV 1186-13, Materials and articles in contact with

References 225
Chemical interactions between packaging materials and foodstuffs
foodstuffs-Plastics, part 13 : test methods for overall migration at high temperatures.
European Committee for standardization, Brussels, Belgium.
CEN (1999c) European Standards EN/ENV 1186-14, Materials and articles in contact with
foodstuffs-Plastics, part 14 : test methods for ‘substitute tests’ for overall migration using iso-
octane and 95% ethanol. European Committee for standardization, Brussels, Belgium.
CEN (1999d) European Standards EN/ENV 13130-2, Materials and articles in contact with
foodstuffs-Plastic substances subject to limitation, part 2 : Determination of terephthalic acid
in food simulants. European Committee for standardization, Brussels, Belgium.
CEN (1999e) European Standards EN/ENV 13130-3, Materials and articles in contact with
foodstuffs-Plastic substances subject to limitation, part 3 : Determination of acrylonitrile in
food and food simulants. European Committee for standardization, Brussels, Belgium.
CEN (1999f) European Standards EN/ENV 13130-4, Materials and articles in contact with
foodstuffs-Plastic substances subject to limitation, part 4 : Determination of 1,3 butadiene in
plastics. European Committee for standardization, Brussels, Belgium.
CEN (1999g) European Standards EN/ENV 13130-5, Materials and articles in contact with
foodstuffs-Plastic substances subject to limitation, part 5 : Determination of vinylidene
chloride in food simulants. European Committee for standardization, Brussels, Belgium.
CEN (1999h) European Standards EN/ENV 13130-6, Materials and articles in contact with
foodstuffs-Plastic substances subject to limitation, part 6 : Determination of vinylidene
chloride in plastics. European Committee for standardization, Brussels, Belgium.
CEN (1999i) European Standards EN/ENV 13130-7, Materials and articles in contact with
foodstuffs-Plastic substances subject to limitation, part 7 : Determination of monoethylene
glycol and diethylene glycol in food. European Committee for standardization, Brussels,
Belgium.
CEN (1999j) European Standards EN/ENV 13130-8, Materials and articles in contact with
foodstuffs-Plastic substances subject to limitation, part 8 : Determination of isocyanates in
plastics. European Committee for standardization, Brussels, Belgium.
Chaimbault, P., Cassel, S., Claude, S., Debaig, C., Benvegnu, T., Plusquellec, D., Rollin, P. and Lafosse,
M. (1999) Direct analysis of industrial oligoglycerols by liquid chromatography with
evaporative light-scattering detection and mass spectrometry. Chromatographia 50 239-242.
Charara, Z.N., Williams, J.W., Schmidt, R.H. and Marshall, M.R. (1992) Orange flavor absorption into
various polymeric packaging materials. Journal of Food Science 57 963-972.
Charlemagne, D. and Legoy, M.D. (1995) Enzymatic synthesis of polyglycerol fatty acid ester in a

References 226
Chemical interactions between packaging materials and foodstuffs
solvent free system. Journal of the American Oil Chemists’ Society 72 61-65.
Chatwin, P.C. (1996) Mathematical modelling in “Migration from food contact materials”, Katan, L.L
(Ed.), Blackie Academic and Professional, London, 26-50.
Chester, T.L. and Innis, D.P. (1986) Effect of free hydroxy groups in the separation of polyglycerol
esters by capillary supercritical fluid chromatography. Journal of High Resolution Chromatography
and Chromatography Communications 9 178-181.
Chiu, Y.W., Carlson, R.E., Marcus, K.L. and Karu, A.E.A. (1995) Monoclonal immunoassay for the
coplanar polychlorinated biphenyls. Analytical Chemistry 67 3829-3839.
Chu, F.S., Chang, F.C.C. and Hinsdill, R.D. (1976) Production of antibody against ochratoxin A.
Applied and Environmental Microbiology 31 831-835.
Chu, F.S., Lau, H.P., Fan, T.S. and Zhang, G.S. (1982) Ethylenediamine modified bovine serum
albumin as protein carrier in the production of antibody against mycotoxins. Journal of
Immunological Methods 55 73-78.
Chu, F.S., Liang, M.Y.C., Zhang, G.S. (1984a) Production and characterization of antibody against
diacetoxyscirpenol. Applied and Environmental Microbiology 48 777-780.
Chu, F.S., Zhang, G.S., Williams, M.D. and Jarvis, B.B. (1984b) Production and characterization of
antibody against deoxyverrucarol. Applied and Environmental Microbiology 48 781-784.
Chun, T. and Gorski, J. (2000). High concentrations of bisphenol A induce cell growth and prolactin
secretion in an estrogen-responsive pituitary tumor cell line. Toxicology and Applied Pharmacology
162 161-165.
Code of Federal Regulations (1999) Title 21: Food and Drugs, Volume 3, Part 170- Food Additives,
http://www.cfsan.fda.gov/~lrd/cfr17039.html.
Cohen, M.H. and Turnbull, J.D. (1959) Molecular transport in liquids and glasses. The Journal of
Chemical Physics 31 1164-1169.
Corey, E.J. and Venkateswarklu, A. (1971) Protection of hydroxyl groups as tert.Butyldimethyl
derivatives. Journal of the American Chemical Society 94 6190-6191.
Crank, J., (1975), “Mathematics of diffusion”,Clarendon Press, London, 212 p.
Crank, J., Park, G.S. (1968), “Diffusion in polymers”, Academic Press, London.
Crathorne, B., Palmer, C.P. and Stanley, J.A. (1986) High performance liquid chromatographic
determination of bisphenol A diglycidyl ether and bisphenol F diglycidyl ether in water. Journal
of Chromatography 360 266-270.
Cuatrecasas, P. and Parikh, I. (1972) Adsorbents for affinity chromatography. Use of N-
hydroxysuccinimide esters of agarose. Biochemistry 11 2291-2299.

References 227
Chemical interactions between packaging materials and foodstuffs
Dallas, M.S. and Stewart, M.F. (1967) Thin-layer chromatography of polyglycerols. Analyst 92 634-637.
Davidson, P.M. and Juneja, V.K. (1990) Antimicrobial agents in “Food Additives”, Branen, A.L.,
Davidson, P.M. and Salminen, S. (Ed.), Marcel Dekker, New York, p. 83-138.
De Kruijf, N. and Rijk, M.A.H. (1988) Iso-octane as fatty food simulant: possibilities and limitations.
Food Additives and Contaminants 5 467-483.
De Kruijf, N., Van Beest, M., Rijk, R., Sipilaïnen-Malm, T., Paseiro Losada, P., De Meulenaer, B.
(2002) Active and intelligent packaging: applications and regulatory aspects. Food Additives
and Contaminants 19 144-162.
De Meulenaer, B., Vanhoutte, A. and Huyghebaert, A. (2000a) Development of chromatographic
method for the determination of degree of polymerisation of polyglycerols and polyglycerol
fatty acid esters. Chromatographia 51 44-52.
De Meulenaer, B., Van Royen G., Vanhoutte, A. and Huyghebaert, A. (2000b) Combined liquid and
gas chromatographic characterisation of polyglycerol fatty acid esters. Journal of Chromatography
A 896 239-251.
De Meulenaer, B. and Huyghebaert, A. (2001a) ‘Migration of xeno-estrogens from food contact
materials’, in “Recent Research Development in Agricultural and Food Chemistry, Volume 5”,
Pandalai, S.G. (Ed.), Research Signpost, India, p 73-87.
De Meulenaer, B. and Huyghebaert, A. (2001b) Isolation and purification of chicken egg yolk
immunoglobulins: a review. Food and Agricultural Immunology 13 275-288.
De Meulenaer, B., De La Court M., Huyghebaert, A. (2002) On the use of chicken immunoglobulins for
the detection of peanut proteins in foodstuffs. Poster presentation on the TNO International
Food Allergy Forum.
De Vleesschauwer, A., Hendrickx, H. and Heyndrickx, G. (1948). Onderzeoeksmethoden van
zuivelproducten. N.V. Standaardboekhandel, Antwerp, Belgium, 253p.
Devlieghere, F., Van Belle, B. and Debevere, J. (1999) Shelf life of modified atmosphere packed cooked
meat products: a predictive model. International Journal of Food Microbiology 46 57-70.
DiBenedetto, A.T. (1963a) Molecular properties of amorphous high polymers I. A cell theory fior
amorphous high polymers. Journal of Polymer Science, Part A: General Papers 1 3459-3476.
DiBenedetto, A.T. (1963b) Molecular properties of amorphous high polymers II. An interpretation of
gaseous diffusion through polymers. Journal of Polymer Science, Part A: General Papers 1 3477-
3487.
Diel, P., Schulz, T., Smolnikar, K., Strunck, E., Vollmer, G. and Michna, H. (2000). Ability of xeno- and
phytoestrogens to modulate expression of estrogen-sensitive genes in rat uterus : estrogenicity

References 228
Chemical interactions between packaging materials and foodstuffs
profiles and uterotropic activity. Journal of Steroid Biochemistry and Molecular Biology 73 1-10.
Dobson, K.S., Williamns, K.D. and Boriack, C.J. (1993) The preparation of polyglycerol esters suitable
as low-caloric fat substitutes. Journal of the American Oils Chemists’ Society. 70 1089-1092.
Dodds, E.C. and Lawson, W. (1936). Synthetic oestrogenic agents without the phenanthrene nucleus.
Nature 13 996.
Dodge, J.A., Glasebrook, A.L., Magee, D.L., Phillips, D.L., Sato, M., Short, L.L. and Bryant H.U. (1996).
Environmental estrogens : effects on cholesterol lowering and bone in the ovariectomized rat.
Journal of Steroid Biochemistry and Molecular Biology 59 339-343.155-161.
Dolhaine, H., Preus, W. and Wollman, K. (1984) Strukturen im Polyglycerin. Fette Seifen und
Anstrichmittel 86 339-343.
Doller, P.C., Doller, G. and Gert, H.J. (1987) Subtype specific identification of influenza virus in cell
cultures wit FTIC-labelled egg yolk antibodies. Medical Microbiology and Virology 176 27
Ebina, T. Sato, A., Umezu, K., Ishida, N;, Ohyama, S., Oizumi, A., Aikawa, K., Katagiri, S.,
Katsushima, N., Amai, A., Kitaoka, S. Suzuki, H. and Kanno, T. (1985) Prevention of rotavirus
infection by oral administration of cow colostrum containing antihuman rotavirus antibody.
Medical and Microbiological Immunology 174 177-185.
EC (1995) Council Directive No. 95/111/EC of 14 February 1995 amending Council Directive
90/128/EEC relating to plastics materials and articles intended to come into contact with
foodstuffs. Official Journal of the European Communities L41, 23 February 1995, p.44.
EC (1996) Council Directive 96/11/EC of 5 March 1996 amending Directive 90/128/EEC relating to
plastics materials and articles intended to come in contact with foodstuffs. Official Journal of the
European Communities L61, 12 March 1996, p. 26.
EC (1997) Council Directive No. 97/48/EC of 29 July 1997 amending for second time Council
Directive 82/711/EEC laying down the basic rules necessary for testing migration of the
constituents of plastic materials and articles intended to come in contact with foodstuffs. Official
Journal of the European Communities L222, 12 August 1997, p.10.
EC (1999) Commission Directive No. 99/91/EC of 23 November 1999, amending Directive
90/128/EEC relating to plastics materials and articles intended to come into contact with
foodstuffs. Official Journal of the European Communities. L310, 4 December 1999, p.41.
EC (2001a) Commission Directive 2001/62/EC of 21 August 2001 changing the Directive 90/12/EEC
relating to plastics materials and articles intended to come in contact with foodstuffs. Official
Journal of the European Communities L221, 17 August 2001, p. 18.

References 229
Chemical interactions between packaging materials and foodstuffs
EC (2001b) Commission Directive 2001/61/EC of 8 August 2001 on the use of certain epoxy
derivatives in materials and articles to come into contat with foodstuffs. Official Journal of the
European Communities L215, 9 August 2001, 26-29.
EC (2002) Food contact materials, practical guide. 01.03.02, http://cpf.jrc.it/webpack/downloads
/PRACTICAL%20GUIDE-010302.pdf, 165 p.
EEC (1978) Council Directive No. 78/142/EEC of 30 January 1978 on the approximation of the laws of
the Member States relating to materials and articles with vinyl chloride monomer and are
intended to come in contact with foodstuffs. Official Journal of the European Communities L044, 15
February 1978, p.15.
EEC (1980) Commission Directive No. 80/766/EEC of 8 July 1980 laying down the Community
method of analysis for the official control of the vinyl chloride monomer level in materials and
articles intended to come in contact with foodstuffs. Official Journal of the European Communities
L213, 16 August 1980, p.42.
EEC (1981) Commission Directive No. 81/432/EEC of 29 April 1981 laying down the Community
method of analysis for the official control of the vinyl chloride released by materials and articles
into foodstuffs. Official Journal of the European Communities L167, 24 June 1981, p.6.
EEC (1982a) Council Directive No. 82/711/EEC of 18 October 1982 laying down the basic rules
necessary for testing migration of the constituents of plastic materials and articles intended to
come in contact with foodstuffs. Official Journal of the European Communities L297, 23 October
1982, p.26.
EEC (1982b) Council Directive No. 82/711/EEC of 18 October 1982 laying down the basic rules
necessary for testing migration of the constituents of plastic materials and articles intended to
come in contact with foodstuffs. Official Journal of the European Communities L297, 23 October
1982, p.26.
EEC (1984) Council Directive No. 84/500/EEC of 15 October 1984 on the approximation of the laws of
the Member States relating to ceramic articles intended to come in contact with foodstuffs.
Official Journal of the European Communities L277, 20 October 1984, p.12.
EEC (1985) Council Directive No. 85/572/EEC of 19 December 1985 laying down the list of simulants
to be used for testing migration of constituents of plastic materials and articles intended to come
in contact with foodstuffs. Official Journal of the European Communities L372, 31 December 1985,
p.14.
EEC (1989) Council Directive No. 89/109/EEC of 21 December 1988 on the approximation of the laws
of the Member States relating to materials and articles intended to come in contact with

References 230
Chemical interactions between packaging materials and foodstuffs
foodstuffs. Official Journal of the European Communities L40, 11 February 1989, p.38 and
Corrigendum in Official Journal of the European Communities L347, 28 November 1989, p.37.
EEC (1990) Council Directive No. 90/128/EEC of 23 February 1990 relating to plastics materials and
articles intended to come into contact with foodstuffs. Official Journal of the European Communities
L75, 21 March 1990, p.19 and Corrigendum in Official Journal of the European Communities L349,
13 December 1990, p.26.
EEC (1992) Council Directive No. 92/39/EEC of 14 May 1992 amending Directive 90/128/EEC
concerning plastics materials and articles intended to come into contact with foodstuffs. Official
Journal of the European Communities L168, 23 June 1992, p.21.
EEC (1993a) Council Directive No. 93/9/EEC of 15 March 1993 amending for the second time
Directive 90/128/EEC relating to plastics materials and articles intended to come into contact
with foodstuffs. Official Journal of the European Communities L90, 14 April 1993, p.26.
EEC (1993b) Council Directive No. 93/8/EEC of 15 March 1993 laying down the basic rules necessary
for testing migration of the constituents of plastic materials and articles intended to come in
contact with foodstuffs. Official Journal of the European Communities L90, 14 April 1993, p.37.
EEC (1993c) Commission Directive No. 93/10/EEC of 15 March 1993 relating to materials and articles
of regenerated cellulose film intended to come into contact with foodstuffs. Official Journal of the
European Communities L093, 17 April 1993, p.27.
EEC (1993d) Commission Directive No. 93/11/EEC of 15 March 1993 concerning the release of the N-
nitrosoamines and N-nitrosable substances form elastomer or rubber teats and soothers. Official
Journal of the European Communities L093, 17 April 1993, p.37.
Englebienne, P. (2000) Immune and receptor assays in theory and practice, CRC Press, Boca Raton,
USA, 392p.
Erlanger, B.F., Borek, F., Beiser, S.M. and Liberman, S. (1957) Steroid-protein complexes : I.
Preparation and chracterization of conjugates of bovine sterum albumin with testosterone and
with cortisone. Journal of Biological Chemistry 228 713-727.
Esser, P. (2000a). Edge effect in microwellTM ELISA. http://www.nunc.nalgenunc.com/
resource/technical/bulletins/01-edgeEffect.html.
Esser, P. (2000b). Blocking agent and detergent in ELISA. http://www.nunc.nalgenunc.com/
resource/technical/bulletins/09.html.
Fabech, B., Hellstrǿm, T., Henrysdotter, G., Hjulmand-Lassen, M., Nilsson, J., Rüdinger, L.,
Sipiläinen-Malm, T., Solli, E., Svensson, K., Thorkelsson, A.E., and Tuomaala, V. (2000) Active

References 231
Chemical interactions between packaging materials and foodstuffs
and intelligent food packaging. A Nordic report on legislative aspects. TemaNord report
2000:584, Copenhagen, Denmark, 84p.
Fan, T.S.L., Zhang, G.S. and Chu, F.S. (1984) Production and characterization of antibody against
aflatoxin Q1. Applied and Environmental Microbiology 47 526-532.
FDA (1995a) Recommendations for chemistry data for indirect food additive petitions.
http://vm.cfsan.fda.gov/~dms/opa-cg5.html, 15p.
FDA (1995b) Guidance for industry. Preparation of premarket notifications for food contact substances
: chemistry recommendations. http://vm.cfsan.fda.gov/~dms/opa-pmnc.html, 32p.
Fechiplast (2000) Jaarverslag 2000, Fedichem, 25p.
Feigenbaum, A.E., Bouquant, J., Ducruet, V.J., Ehret-Henry, J., Marqué, D.L., Riquet, A.M., Scholler, D.
and Wittman, J.C. (1994) Guidelines of the Commission of the European Communities: a
challenge for the control of packaging. Food Additives and Contaminants 11 141-154.
Feng, P.C.C, Sharp, C.R., Horton, S.R. (1994) Quantitation of alachlor residues in monkey urine by
ELISA. Journal of Agricultural and Food Chemistry 42 316-319.
Ferreira M. and Katzin, A. (1995) The assessment of antibody affinity distribution by thiocyanate
elution: a simple dose-response approach. Journal of Immunological Methods 187 297-305.
Fertel, R., Yetiv, J.Z., Coleman, M.A., Schwarz, R.D., Greenwald, J.E. and Bianchine, J.R. (1981)
Formation of antbodies to prostaglandins in the yolk of chicken eggs. Biochemical and Biophysical
Research Communications 102 1028-1033.
Fields, R. (1972) The rapid determination of amino groups with TNBS. Methods in enzymology 25 464-
468.
Figge, K. (1988) Dependence of the migration out of mass plastics on the thickness and sampling of the
material. Food Additives and Contaminants 5 397-420.
Figge, K. (1996) Plastics in “Migration from food contact materials”, Katan, L.L (Ed.), Blackie
Academic and Professional, London, 77-110.
Figge, K., Eder, S.R. and Piater, H. (1972) Migration von Hilfsstoffen der Kunststoffverabeitung aus
Folien in flüssige und feste Fette bzw. Simulantien. Deutsche Lebensmittel-Rundschau 68 359-367.
Figge, K. and Hilpert, H.A. (1990) Proofs for a general validity of the proportionality between the
quantity of a migrated component and its concentration in polymeric materials. Deutsche
Lebensmittel-Rundschau 86 111-116.
Figge, K. and Hilpert, H.A. (1991) Migration of different additives from polyolefine specimens into
ethanol 95% by vol., test fat HB307 and olive oil – a comparison. Deutsche Lebensmittel-Rundschau
87 1-4.

References 232
Chemical interactions between packaging materials and foodstuffs
Figge, K., Rabel, W., Baustian, M. and Meier, F. (1988a) Einfluss der Dicke polymerer Packstoffe auf
den Übertritt von Bestandteilen in fettlässige Lebensmittel. Deutsche Lebensmittel-Rundschau 84
177-179.
Figge, K., Rabel, W., Baustian, M. and Meier, F. (1988b) Einfluss der Dicke polymerer Packstoffe auf
den Übertritt von Bestandteilen in fettlässige Lebensmittel. Deutsche Lebensmittel-Rundschau 84
180-185.
Figge, K., Rabel, W., Baustian, M. and Meier, F. (1988c) Einfluss der Dicke polymerer Packstoffe auf
den Übertritt von Bestandteilen in fettlässige Lebensmittel. Deutsche Lebensmittel-Rundschau 84
211-214.
Figge, K., Rabel, W., Baustian, M. and Meier, F. (1989) Einfluss der Dicke polymerer Packstoffe auf den
Übertritt von Bestandteilen in fettlässige Lebensmittel. Deutsche Lebensmittel-Rundschau 85 8-13.
Firestone, D. (1995) Oils and fats. In “Official methods of analysis of AOAC international”, 16th
edition, Cunniff, P. (Ed.), AOAC, Arlington, USA, p. 627-628.
Fishbein, L. and Albro, P.W. (1972) Chromatographic and biological aspect of phthalate esters, Journal
of Chromatography 70 365-412.
Forlani, F. Arnoldi, A. and Pagaini, S. (1992) Development of an enzyme-linked immunosorbent
assay for triazole fungicides. Journal of Agricultural and Food Chemistry 40 328-331.
Franz, R. (2000) Migration of plastic constituents, in “Plastic packaging materials for food, barrier
function, mass transport, quality assurance and legislation”, O.-G. Piringer and A.L. Baner (Ed.),
Wiley-VCH, Weinheim, 287-357.
Franz, R., Huber, H. and Piringer, O. (1993) Method of test and assessment of recycled polymers for
food packaging used under the aspect of migration across a functional barrier. Deutsche
Lebensmittel-Rundschau 89, 273-275 and 317-324.
Franz, R., Huber, H. and Piringer, O. (1997) Presentation and experimental verification of a physico-
mathematical model describing the migration across functional barrier layers into foodstuffs.
Food Additives and Contaminants 14, 627-640.
Franz, R. and Rijk, R. (1996) Materials and articles in contact with foodstuffs. Plastics. Part X.
Determination of 2,2-bis-(4-hydroxyphenyl)propane (bisphenol A) in food simulants. CEN/TC
194/SC1/WG2 PM/Ref 13480.
Franz, R. and Rijk, R. (1997) Migration testng of plastic materials and articles in contact with
foodstuffs. Determination of 2,2-bis-4-hydroxyphenyl)propane-bis(2,3-epoxypropyl)ether in
food simulants. CEN/TC 194/SC1/WG2 PM/Ref 13510.
Frederickson, G.H. and Hefland, E. (1985) Dual mode transport of penetrants in glassy polymers.

References 233
Chemical interactions between packaging materials and foodstuffs
Macromolecules 18 2201-2207.
Fregert, S. (1981). Epoxy dermatitis from the non-working environment. British Journal of Dermatology
105 (suppl. 21) 63-64.
Freytag, W., Figge, K. and Biebder, W.D. (1984) Migration of different plastic additives from various
plastics into iso-octane and into olive oil. Deutsche Lebensmittel-Rundschau 80 333-335.
Fritz, L. and Hofmann, D. (1997) Molecular dynamics of transport of water-ethanol mixtures through
polydimethylsiloxane membranes. Polymer 38 1035-1045.
Gaido, K.W., Leonard, L.S., Lovell, S., Gould, J.C., Babaï, D., Portier, C.J. and McDonnell, D.P. (1997).
Evaluation of chemicals with endocrine modulating activity in a yeast-based steroid hormone
receptor gene transcription assay. Toxicology and Applied Pharmacology 143 205-212.
Garden, S.W. and Sporns, P. (1994) Development and evaluation of an enzyme immunoassay for
sulfamerazine in milk. Journal of Agricultural and Food Chemistry 42 1379-1391.
Garti, N. and Aserin, A. (1981a) Analyses of polyglycerol esters of fatty acids using high performance
liquid chromatography. Journal of Liquid Chromatography 4 1173-1194.
Garti, N. and Aserin, A. (1981b) Evaluation of polyglycerol fatty acid esters in the baking of bread.
Bakers Digest 67 19-43.
Garti, N. and Aserin, A. (1982) Polyglycerol esters composition: theoretical random distribution versus
HPLC analysis. Journal of the American Oil Chemists’ Society. 59 317-319.
Gendolf, E.H., Pestka, J.J., Swanson, S.P. and Hart, L.P. (1984) Detection of T-2 toxin in Fusarium
sporotrichioides-infected corn by enzyme linked immunosorbent assay. Applied and
Environmental Microbiology 47 1161-1163.
Giam, C.S. and Wong, M.K. (1987) Plasticizers in food. Journal of Food Protection 30 769-782.
Giraudi, G., Rosso, I., Baggiani, C., Giovannoli, C., Vanni, A. and Grassi, G. (1999) Development of
an enzyme-linked immunosorbent assay for benalaxyl and its application to the analysis of
water and wine. Analytica Chemica Acta 392 85-94.
Giust, J.A., Seipelt, T., Anderson, B.K., Deis, D.A. and Hinders, J.D. (1990) Determination of bis(2-
ethylhexyl)phthalate in cow's milk and infant formula by high performance liquid
chromatography. Journal of Agricultural and Food Chemistry 38 415-418.
Gold, L.S., Manley, N.B., Slone, T.H., Garfinkel, G.B., Ames, B.N., Rohrbach, L., Stern, B.R. and Chow,
K. (1995) Sixthy plots of the carcinogenic potency database: results of animal bioassays
published in the general literature 1989-1900 and by the National Toxicology Program through
1990-1993.. Environmental Health Perspectives 103, 3-122.
References 234
Chemical interactions between packaging materials and foodstuffs
Gold, L.S., Sawyer, C.B., Magaw, R., Backman, G.M., de Veciana, M., Levinson, R., Hooper, N.K.,
Havender, W.R., Bernstein, L., Peto, R., Pike, M. and Ames, B.N. (1984) A carcinogenisis potency
database of standardized results of animal bioassays. Environmental Health Perspectives 58, 9-319.
Goloubkova, T., Ribeiro, M.F.M., Rodrigues, L.P., Cecconello, A.L. and Spritzer, P.M. (2000). Effects of
xenoestrogen bisphenol A on uterine and pituitary weight, serum prolactin levels and
immunoreactive prolactin cells in ovarie tomized Wistar rats. Archives of toxicology 74 92-98.
Gould, J.C., Leonard, L.S., Maness, S.C., Wagner, B.L., Conner, K., Zacharewski, T., Safe, S.,
McDonnell, D.P. and Gaido, K.W. (1998). Bisphenol A interacts with the estrogen receptor � in a
distinct manner from estradiol. Molecular and Cellular Endocrinology 142 203-214.
Gould, G.W. and Russel, N.J. (1991) Sulphite in “Food Preservation”, Russell, N.J. and Gould, G.W.
(Ed.), Blackie, Glasgow, 72-87.
Grob, K., Spinner, C., Brunner, M. and Etter, R. (1999) The migration from the internal coatings from
food cans; summary of the findings and call for more effective regulation of polymers in contact
with foods : a review. Food Additives and Contaminants 16 579-590.
Gusev, A., Müller-Plathe, F., van Gunsteren, W.F. and Suter, U.W. (1994) Dynamics of small molecules
in bulk polymers. Advances in Polymer Science 116 204-247.
Habeeb, A. (1966) Determination of free amino groups in proteins by trinitrobenzenesulfonic acid.
Analytical Biochemistry 14 328-336.
Hamdani, M., Feigenbaum, A. and Vergnaud, J.M. (1997) Prediction of worst case migration from
packaging to food using mathematical models, Food Additives and Contaminants 14 49-506.
Harrison, R.O., Brimfield, A.A. and Nelson, J.O. (1989) Development of an monoclonal antidboy based
enzyme immunoassay method for analysis of maleic hydrazide. Journal of Agricultural and Food
Chemistry 37 958-964.
Hassl, A. and Aspöck, H. (1988) Purification of egg yolk immunoglobulins : a two-step procedure
using hydrophobic interaction chromatography and gel filtration. Journal of Immunological
Methods 110 225-228.
Hassl, A., Aspöck, H. and Flamm, H. (1987) Comparative studies on specificity of yolk
immunoglobulin Y isolated from eggs laid by hens immunzied with Toxoplasma gondii antigen.
Zentralblatt fur Bakteriologie Mikrobiologie und Hygiene Series A - Medical Microbiology infectious
Diseases Virology Parasitology 267 247-253.
Hatta, H., M. Kim. and Yamamoto, T. (1990) A novel isolation method for henn egg yolk antibody,
"IgY". Agricultural and Biological Chemistry 54 2531-2535.
Hemker, W. (1981) Associative structures of polyglycerol esters in food emulsions. Journal of the
References 235
Chemical interactions between packaging materials and foodstuffs
American Oil Chemists’ Society 58 114-119.
Hernandez, R.J. and Gavara, R. (1999) Plastic packaging. Methods for studying mass transfer
interactions, a literature review. Pira International, Leatherhead, 53p.
Hill, A.S., Mc. Adam, D.P., Edward, S.L. and Skerritt, J.H. (1993) Quantification of bioresmethrin, a
synthetic pyrethroid grain protectant, by enzyme immunoassay. Journal of Agricultural and Food
Chemistry 41 2011-2018.
Hilpert, H., Brussow, H., Mietens, C., Sidoti, J., Lerner, L. and Werchau, H. (1987) Use of bovine milk
concentrate containing antibody to rotavirus to treat rotavirus gastroenteriditis in infants.
Journal of Infectious Diseases 156 158-166.
Hirayama, K., Tanaka, H., Kawana, K., Tani, T. and Nakazawa, H. (2001) Analysis of plasticizers in
cap-sealing resins for bottles foods, Food Additives and Contaminants 18 357-362.
Hofmann, D. Fritz, L., Ulbrich, J. and Paul, D. (1997) Molecular modelling of amorphous membrane
polymers. Polymer 38 6145-6155.
Houen, G. and Jensen, O.M. (1995) Conjugation to preactivated proteins using divinylsulfone and
iodoacetic acid. Journal of Immunological Methods 181 187-200.
Howe, S.R. and Borodinsky, L (1998) Potential exposure to bisphenol A from food-contact use of
polycarbonate resins. Food Additives and Contaminants 15 370-375.
Ikemori, Y., Kuroki, M., Peralta, R.C., Yokoyama, H. and Kodoma, Y. (1992) Protection of neonatal
calves against fatal enteric colibacillosis by administration of egg yolk powder from hens
immunized with K-99 piliated enterotoxigenic Escherichia coli. American Journal of Veterinary
Research 53 2005-2008.
Imai, T., Harte, B.R. and Giacin, J.R. (1990) Partition distribution or aroma volatiles from orange juice
into selected polymeric sealant films. Journal of Food Science 55 158-161.
Indiramma, A.R., Raj, B., Kamalamma, V., Balasubrabmanyam, N. and Veeraju, P. (1992) Migratory
aspects of food packaging materials with food simulanting solvents n-heptane and n-hexane.
Deutsche Lebensmittel-Rundschau 88 279-282.
Inman, J.K. (1975) Thymus -independent antigens : the preparation of covalent, hapten-ficoll
conjugates. Journal of immunology 114 704-709.
Jensenius, J.C., Andersen, I., Hau, J., Crone, M. and Koch, C. (1981) Eggs : conveniently packaged
antibodies, methods for purification of yolk IgG. Journal of Immunological methods 46 63-8.
Jickells, S.M., Gancedo, P., Nerin, C., Castle, L. and Gilbert, J. (1993) Migration of styrene monomer
from thermoset polyester cookware into food during high temperature applications. Food
Additives and Contaminants 10 567-573.

References 236
Chemical interactions between packaging materials and foodstuffs
Joyeux, C., Chrzavzez, E., Boquien, C.Y., Picque, D. and Corrieu, G. (1996) Reusable solid phase
immunoassay for the detection of citrate lyase. Analytica Chimica Acta 320 77-86.
Jung, F., Szekacs, A., Li, Q.X. and Hammock, B.D. (1991) Detection of aminotriazoles using selective
amino group protection by chromophores. Journal of Agricultural and Food Chemistry 39 129-
136.
Kardinaal, A., Waalkens,-Berendsen, D. and Arts, C. (1997) Pseuo-oestrogens in the diet : health
benefits and safety concerns. Trends in Food Science and Technology 8 327-333.
Katan, L.L. (1996a) Introduction in “Migration from food contact materials”, Katan, L.L (Ed.), Blackie
Academic and Professional, London, 1-10.
Katan, L.L. (1996b) Effects of migration in “Migration from food contact materials”, Katan, L.L (Ed.),
Blackie Academic and Professional, London, 1-10.
Kawamura, Y. Sano, H. and Yamada, T. (1999) Migration of bisphenol A from can coatings to drinks,
Journal of the Food Hygienic Society of Japan 40 158-165.
Kemp, H.A., Mills, E.N.C. and Morgan, M.R.R. (1986) Enzyme-linked immunosorbent assay of 3-
acetyldexynivalenol applied to rice. Journal of the Science of Food and Agriculture 37 888-894.
Khil'ko, S.N., Kirasova, M.A., Piker, E.G., Osidze, S.D., Fomina, N.V., Burgasova, M.P. and
Tikhonenko, T.I. (1989) Immunoenzyme assay of adeniviral hexon determination of antibodies
from hyperimmunized chickens. Molecular Genetics Microbiology and Virology 9 43.
Kierek-Jaszczuk,D., Marquardt,R.R. and Abramson,D. (1997) Use of a heterologous solid-phase
antigen in an indirect competitive antibody-capture anzyme-linked immunosorbent assay for T-
2 mycotoxin. Journal of Food Protection 60 321-327.
Kirk, R.S. and Sawyer, R. (1991) Pearson’s Composition and analysis of foods, 9th edition, Longman
Scientific and Technical, London, UK, p.708.
Kitagawa, T., Shimozono, T., Aikawa, T., Yoshida, T. and Nishimura, H. (1981) Preparation and
characterization of hetero-bifunctional cross-linking reagents for protein modifications. Chemical
and Pharmaceutical Bulletin 29 1130-1135.
Klein, T. and Knor, D. (1990) Oxygen absorption properties of powdered iron. Journal of Food Science 55
869-870.
Kleinman, D., Karas, M., Roberts, C.T., LeRoith, D., Phillip, M., Segev, Y., Levy, J. and Sharoni, Y.
(1995). Modulation of insulin-like growth factor-receptors and membrane-associated IGF
binding proteins in endometrial cancer cells by estradiol. Endocrinology 136 2531-2537. In : Klotz,
D.M., Hewitt, S.C., Korach, K.S. and Diaugustine, R.P. (2000). Activation of a uterine insulin-like
growth factor I signaling pathway by clinical and environmental estrogens : Requirement of

References 237
Chemical interactions between packaging materials and foodstuffs
estrogen receptor-�. Endocrinology 141 3430-3439.
Kloczkowski, A. and Mark, J.G. (1989) On the Pace-Datyner theory of diffusion of small molecules
through polymers. Journal of Polymer Sciences, Part B : Polymer Physics 27 1663-1674.
Krog, N.J. (1990) Food emulsifiers and their chemical and physical properties. In “Food Emulsions”,
Larsson, K. and Friberg, S.E. (Ed.), 2nd Edition, Marcel Dekker Inc., New York, USA, 127-178.
Kodeira, T., Kato, I., Li, J., Mochizuki, T., Hoshino, M., Usuki, Y., Oguri, H. and Yanaihara, N. (2000)
Novel ELISA for the measurement of immunoreactive bispehnol A, Biomedical Research-Tokyo 21
117-121.
Konczal, J.B., Harte, B.R., Hoojjat, P. and Giacin, J.R. (1992) Apple juice flavor compound sorption by
sealant films. Journal of Food Science 57, 967-972.
Koninklijk Besluit (1992) betreffende materialen en voorwerpen bestem om met voedinsmiddelen in
aanraking te komen, in “Belgische Warenwetgeving”, Chapter 8, Die Keure, Brugge.
Kontominas, M.G., Gupta, C. and Gilbert, S.G. (1985) Interaction of vinylchloride with
polyvinlylchloride in model food systems by HPLC-chromatography:migration aspects. Food
Science and Technology (LWT) 18 353-356.
Kricka, L.J. (1999) Human anti-animal antibody interferences in immunological assays. Clinical
Chemistry 45 942-956.
Kroes, R., Galli, C., Munro, I., Schilter, B., Tran, L.-A., Walker, R. and Würtzen, G. (2000) Threshold of
toxicological concern for chemical substances present in the diet: a pratical tool for assessing the
need for toxicity testing. Food and Chemical Toxicology 38, 255-312.
Lafleur, L., Bousquet, T., Ramage, K., Brunck, B., Davis, T., Luksemburg, W. and Peterson, B. (1990)
Analysis of TCDD and TCDF on the ppq level in milk and food sources. Chemosphere 20 1657-
1662.
Lafleur, L., Bousquet, T., Ramage, K., Davis, T., Mark, M., Lorusso, D., Woodrow, D. and Saldana, T.
(1991) Migration of 2,3,7,8-TCDD, 2,3,7,8-TCDF from paper based food-packaging and food
contact products. Chemosphere 23 1575-1579.
Lancaster, P.J. and Richards, D.O. (1996) Regenerated cellulose in “Migration from food contact
materials”, Katan, L.L (Ed.), Blackie Academic and Professional, London, 181-190.
Laoubi, S., Feigenbaum, A. and Vergnaud, M. (1995) Safety of re-cycled plastics for food contact
materials: testing to define a functional barier. Packaging Technology and Science 8 17-27.
Laoubi, S. and Vergnaud, M. (1995) Process of contaminant transfer through a food package made of
recycled film and a functional barrier. Packaging Technology and Science 8 97-110.
Laoubi, S. and Vergnaud, M. (1996) Theoretical treatment of pollutant transfer from a polymer

References 238
Chemical interactions between packaging materials and foodstuffs
packaging made of recycled film and a functional barrier. Food Additives and Contaminants 13
293-306.
Laoubi, S. and Vergnaud, M. (1997) Modelling transport between a monolayer and a bi-layer
polymeric package and food. Food Additives and Contaminants 14 641-647.
Larsson, A., Barlöw, R.-M., Lindahl, T.L. and Forsberg, P.-O. (1993) Chicken IgG : utilizing the
evolutionary advantage. Poultry Science 72 1807-1812.
Lau, H.P., Gaur, P.K. and Chu, F.S. (1981) Preparation and characterization of aflatoxin B2a
hemiglutarate and its use for the production of antibody against aflatoxin B1. Journal of Food
Safety 3 1-13.
Lau, O.W. and Wong, S.K. (2000) Contamination in food from packaging material. Journal of
Chromatography A 882 255-270.
Ledegen, D. and Vergallen, H. (1995) Comparison of the overall migration in olive oil using a polar
and a non polar column. Analytical Laboratory Note, Dart Industries-Tupperware, Aalst, Belgium,
11p.
Ledegen, D. and Vergallen, H. (1996) Testing of food contact materials : interference problem by using
olive oil as fatty food simulant. Analytical Laboratory Note, Dart Industries-Tupperware, Aalst,
Belgium, 7p.
Lee, H.B. and Peart, T.E. (2000) Determination of bisphenol A in sewage effluent and sludge by solid
phase and supercritical fluid extraction and gas chromatography/mass spectrometry, Journal of
AOAC international 82 290-297.
Lee, N., Skerritt, J.H. and McAdam, D.P. (1995) Hapten synthesis and development of ELISA’s for
detection of endosulfan in water and soil. Journal of Agricultural and Food Chemistry 43 1730-1739.
Leslie, G.A. and Clem, L.W. (1969) Phylogeny of immunoglobulin structure and function. III.
Immunoglobulin of the chicken. Journal of Experimental Medicine 130 1337.
Lhuguenot, J.C. (1997) Determination of phthalic esters, in. "Analysis of Food Constituents", J.L.
Multan (Ed.), Wiley-VCH New-York, 457-462.
Li, G.X., Zhao, M.S., Gee, S.J., Kurth, M.J., Seiber, J.N. and Hammock, B.D. (1991) Development of a
enzyme-linked immunosorbent assay for 3,5,6-trichloro-2-pyridinol. 2 Assay optimization and
application to environmental water samples. Journal of Agricultural and Food Chemistry 39 1685-
1692.
Lichtenhaler, R.G. and Ranfelt, F. (1978) Determination of antioxidants and their transformation
products in polyethylene by high-performance liquid chromatography. Journal of
Chromatography 149 553-560.

References 239
Chemical interactions between packaging materials and foodstuffs
Lickly, T.D., Bell, C.D. and Lehr, K.M. (1990) The migration of Irganox 1010 antioxidant from high-
density polyethylene and polypropylene into a series of potential fatty food simulants. Food
Additives and Contaminants 7 805-814.
Lickly, T.D., Markham, D.A. and Mc.Donald, M.E. (1993) Migration of acrylonitrile from
styrene/acrylonitrile copolymers into food simulating liquids. Journal of Agricultural and Food
Chemistry 41 119-124.
Lickly, T.D., Rainey, M.L., Burgert, L.C., Breder, C.V. and Borodinsky, L. (1997) Using a simple
diffusion model to predict residual monomer migration – considerations and limitations. Food
Additives and Contaminants 14 65-74.
Limm, W. and Hollifield, H. (1995) Effect of temperature and mixing on polymer adjuvant migration
to corn oil and water. Food Additives and Contaminants 12 609-624.
Limm, W. and Hollifield, H. (1996) Modelling of additive diffusion in polyolefins. Food Additives and
Contaminants 13, 949-967.
Linssen, J.P.H., Janssens, J.L.G.M., Reitsma, J.C.E. and Roozen, J.P. (1991) Sensory analysis of
polystyrene packaging material taint in cocoa powder for drinks and chocolate flakes. Food
Additives and Contaminants 8 1-7.
Liu, M.T., Ram, B.P., Hart, L.P. and Pestka, J.J. (1985) Indirect enzyme-linked immunosorbent assay
for the mycotoxin zearalenone. Applied and Environmental Microbiology 50 332-336.
Lommen, A., Haasnoot, W. and Weseman, J.M. (1995) Nuclear magnetic resonance controlled method
for coupling of fenoterol to a carrier and enzyme. Food and Agricultural Immunology 7 123-129.
Lösch, U., Schranner, I., Wanke, R. and Jürgens, L. (1986) The chicken egg, an antibody source. Journal
of Veterinary Medicine Series B Infectious Diseases and Veterinary Public Health 33 609-619.
Macha, M., Mettler, H.-P., Bokel, M. and Röder, W. (1994) Analysis of silansied polyglycerols by
supercritical chromatography. Journal of Chromatography A 675 267-270.
MAFF (1995) Phthalates in paper and board packaging. Food surveillance information sheet, MAFF UK 60
3p.
MAFF (1996) Phthalates in food. Food surveillance information sheet, MAFF UK 82 5p.
MAFF (1997) Survey of BADGE epoxy monomer in canned foods. Food Surveillance information sheet,
MAFF, UK 125 6p.
MAFF (2000) BADGE and Related substances in canned foods. Food Surveillance information sheet,
MAFF, Food standards Agency UK 9/00 13 p.
MAFF (2001) Survey of bisphenols in canned food. Food Surveillance information sheet, MAFF, Food
standards Agency UK 13/01 11p.

References 240
Chemical interactions between packaging materials and foodstuffs
Mäkelä, O. and Seppälä, I.J.T. (1986) Haptens and carriers, In “Handbook of experimental
immunology, volume I. Immunochemistry”, D.M. Weir (Ed.), 4th edition, Blackwell Scientific
Publications, Oxford, 3.1-3.13.
March, J. (1992) Advanced Organic Chemistry, 4th Edition, John Wiley and Sons, New York, 1495p.
Marco, M.P., Gee, S.J., Cheng, H.M., Liang, Z.Y. and Hammock, B.D. (1993) Development of an
enzyme-linked immunosorbent assay for carbaryl. Journal of Agricultural and Food Chemistry 41
423-430.
Marsili, R. (1997) Off-flavors and malodors in foods: mechanisms of formation and analytical
techniques. In “Techniques for analyzing food aroma”, R. Marsili (Ed.), Marcel Dekker, New
York, p. 237-264.
Mc Cully, K.A., Mok, C.C. and Common, R.H. (1962) Papar electrophoretic characterization of
proteins and lipoproteins of hen's egg yolk. Canadian Journal of Biochemical Physiology 40 937.
Meares, P. (1957a) Second order transistion of poly(vinylacetate). Transactions of the Faraday Society 53
31-40.
Meares, P. (1957b) Diffusion of gases in poly(vinylacetate. Relation to the second order transition.
Transactions of the Faraday Society 53 101-106.
Meisel, H. (1990) Enzyme-immunoassay ELISA using IgY antbodies against lactoferrin.
Milchwissenschaft 45 510-512.
Meisel, H. (1993) Enzyme-linked immunosorbent and immunoblotting using IgY antibodies against
soyabean glycinin A. International Dairy Journal 3 149-161.
Metzler, M. and Pfeiffer, E. (1995). Effects of estrogens on microtubule polymerization in vitro :
Correlation with estrogenicity. Environmental Health Perspectives 103 (suppl 7), 21-22.
Mercea, P. (2000) Models for diffusion in polymers, in in “Plastic packaging materials for food, barrier
function, mass transport, quality assurance and legislation”, O.-G. Piringer and A.L. Baner (Ed.),
Wiley-VCH, Weinheim, 125-157.
Morgan, M.R.A., Kang, A.S and Chan, H.W.S. (1986a) Production of antisera against sterigmatocystin
hemiacetal and its potential for use in an enzyme-linked immunosorbent assay for
sterimatocystin in barley. Journal of the Science of Food and Agriculture 37 873-880.
Morgan, M.R.A., Kang, A.S and Chan, H.W.S. (1986b) Aflatoxin determination in peanut butter by
enzyme linked immunosorbent assay. Journal of the Science of Food and Agriculture 37 908-914.
Morissette, C., Goulet, J. and Lamoureux, G. (1991) Rapid and sensitive sandwich enzyme linked
immunoassay for detection of staphylococcal enterotoxin B in cheese. Applied and
Environmental Microbiology 57 836-842.
References 241
Chemical interactions between packaging materials and foodstuffs
Morrissey, R.E., George, J.D., Price, C.J., Tyl, R.W., Marr, M.C. and Kimmel C.A. (1987). The
developmental toxicity of bisphenol A in rats and mice. Fundamental and applied toxicology 8 571-
582.
Mountfort, K.A., Kelly, J., Jickells, S.M., Castle, L. (1997) Investigations into the potetnial degradation
of polycarbonate baby bottles during sterilization with consequent release of bisphenol A. Food
Additives and Contaminants 14 737-740.
Mücke, G. (1988) Analytical methods for verifying the composition of food-contact plastics. Food
Additives and Contaminants 437-443.
Munro, I.C., Ford, R.A., Kennepohl, E. and Sprenger, J.G. (1996) Correlation of structural class with
No-Observed-Effect-Levels: a proposal for estrablishing a threshold of concern. Food and
Chemical Toxicology 34, 829-867.
Murphy, T.P. and Amberg-Müller, J.P. (1996) Metals in “Migration from food contact materials”,
Katan, L.L (Ed.), Blackie Academic and Professional, London, 111-144.
Murthy, R.A.N., Raj, B., Vijayalakshmi, N.S. and Veeraju, P. (1990) Effect of volume of food simulating
solvents in migration tests. Deutsche Lebensmittel-Rundschau 86 392-394.
Nawa, M. (1992) An enzyme-linked immunosorbent assay using a chaotropic agent (sodium
thiocyanate) for serotype specific reaction between crude dengue viral antigen and anti-dengue
mouse antibody. Microbiological Immunology 36 721-730.
Neissner, R. (1980) Polyglycerine und Fettsäure-Polyglycerinpartialester (Herstellung, Kennzahlen,
DC-Trennung). Fette Seifen und Anstrichmittel 82 93-100.
Nerín, C., Cacho, J. and Gancedo, P. (1993) Plasticizers from printing inks in a selection of food
packagings and their migration to food. Food Additives and Contaminants 10 453-460.
Nishii, S., Soya, Y., Matsui, K., Ishibashi, T. and Kawamura, Y. (2000) Determination of bisphenol A by
ELISA using an organic solvent-resistant anti-bisphenol A monoclonal antibody, Bunseki Kagaku
49 969-975.
O’Brien, A., Cooper, I. and Tice, P.A. (1997) Correlation of specific migration (Cf) of plastics additives
with their initial concentration in the polymer (Cp). Food Additives and Contaminants 14 705-719.
O’Brien, A., Cooper, I. and Tice, P.A. (2001) Polymer additive migration to foods - a direct comparison
of experimental data and values calculated from migration models for polypropylene. Food
Additives and Contaminants 18 343-355.
O’Brien, A., Goodson, A. and Cooper, I. (1999) Polymer additive migration to foods - a direct
comparison of experimental data and values calculated from migration models for high density
polyethylene (HDPE). Food Additives and Contaminants 16 167-380.
References 242
Chemical interactions between packaging materials and foodstuffs
O'Farrelly, C., Branton, D. and Wanke, C.A. (1992) Oral ingestion of egg yolk immunoglobulins from
hens immunized with an enterotoxigenic Escherichia coli strain prevents diarrhoea in rabbits
challenged with the same strain. Infection and Immunity 60 2593.
Ohkuma, H., Abe, K., Ito, M., Kokado, A., Kambegawa, A. and Maeda, M. (2002) Development of a
highly sensitive enzyme-linked immunosorbent assay fro bisphenol A in serum. The Analyst
127 93-97.
Oliver, D.G., Sanders, A.H., Hogg, R.D. & Woods, J. (1981). Thermal gradients in microtitration
plates, effects on enzyme-linked immunoassay. Journal of Immunological Methods 42 195-201.
Otake, S. Nishihara, Y., Makimura, M., Hatta, H., Kim, M., Yamamoto, T. and Hirasawa, M. (1991)
Protection of rats against dental caries by passive immunization with hen-egg-yolk antibody
(IgY). Journal of Densitry Research 70 162-166.
Pace, R.J. and Datyner, A. (1979a) Statistical mechanical models for diffusion of simple penetrants in
polymers.1. Theory. Journal of Polymer Science, Polymer Physics Edition 17 437-451.
Pace, R.J. and Datyner, A. (1979b) Statistical mechanical models for diffusion of simple penetrants in
polymers.1. Application – vinyl polymers. Journal of Polymer Science, Polymer Physics Edition 17
452-464.
Pace, R.J. and Datyner, A. (1979c) Statistical mechanical models for diffusion of simple penetrants in
polymers.1. Application – vinyl and related polymers. Journal of Polymer Science, Polymer Physics
Edition 17 465-476.
Page, N.D. and Lacroix, G.M. (1992) Studies into the transfer and migration of phthalate esters from
aluminium foil-paper laminates to butter and margarine. Food Additives and Contaminants 9 197-
212.
Paseiro Losada, P., Lopez Mahia, P., Vazquez Oderiz, L., Simal Lozano, J. and Simal Gandara, J.
(1991a) Sensitive and rapid reverse phase liquid chromatography fluorescence method for
determining bisphenol A diglycidyl ether in aquesous based food simulants. The Journal of the
AOAC International 74 925-928.
Paseiro Losada, P., Paz Abuin, S., Vazques Oderiz, L., Simal Lozano, J. and Simal Gandara, J. (1991b)
Quality control of cured epoxy resins. Determination of residual free monomers (m-
xylidenediamine and bisphenol A diglycidyl ether) in the finished product. Journal of
Chromatography 585 75-81.
Paseiro Losada, P., Pérez Lamela, C., Lopez Fabal, M., Sanmartin Fenollera, P. and Simal Lozano, J.
(1997) Two RP-HPLC sensitive methods to quantify and identify bisphenol A diglycidyl
ether and its hydrolysis products. 1. European Union aqueous food simulants. Journal of
References 243
Chemical interactions between packaging materials and foodstuffs
Agricultural and Food Chemistry 45 3493-3500.
Paseiro Losada, P., Simal Lozano, J., Paz Abuin, S., Lopez Mahia, P. and Simal Gandara, J. (1992)
Kinetics of the hydrolysis of bisphenol F diglycildyl ehter in water-based food simulants.
Comparison with bisphenol A diglycidyl ether. Journal of Agricultural and Food Chemistry 40 868-
872.
Paul, D.R. (1969) effect of immobilizing adsorption on the diffusion time lag. Journal of Polymer
Science A-2, 7 1811-1818.
Peralta, R., Yokoyama, H., Ikemori, Y. and Kodoma, Y. (1994) Passive immunisation against
experimental salmellosis in mice by orally administered henn egg-yolk antibodies specific for
14-kDa fimbriae of Salmonella enteriditis. Journal of Medical Microbiology 41 29-35.
Petersen, J.H. and Breindahl, T. (2000) Plasticizers in total diets samples, baby food and infant
formulae. Food Additives and Contaminants 17 133-141.
Petropoulos, J.H. (1970) Quantitative analysis of gaseous diffusion in glass polymers. Journal of
Polymer Science A-2, 8, 1797-1801.
Pfeiffer, E., Rosenberg, B., Deuschel, S. and Metzler, M. (1997). Interference with microtubules and
induction of micronuclei in vitro by various bisphenols. Mutation Research 390 21-31.
Philo, M.R., Damant, A.P. and Castle, L. (1997) Reactions of epoxide monomers in food simulants
used to test plastics for migration. Food Additives and Contaminants 14 75-82.
Pichler, H., Krska, R., Székács, A. and Grasserbauer, M. (1998) An enzyme-immunoassay for the
detection of the mycotoxin zearalenone by use of yolk antibodies. Fresenius Journal of
Analytical Chemistry 362 176-177.
Piringer, O. (1994) Evaluation of plastics for food packaging. Food Additives and Contaminants 11
221-230.
Piringer, O. (1990) Ethanol und Ethanol/wasser-Gemische als Prüflebensmittel für die Migration
aus Kunststoffen. Deutsche Lebensmittel-Rundschau 86 35-39.
Piringer, O. (2000a) Permeation of gases, water vapor and volatile organic compounds, in “Plastic
packaging materials for food, barrier function, mass transport, quality assurance and
legislation”, O.-G. Piringer and A.L. Baner (Ed.), Wiley-VCH, Weinheim, 239-285.
Piringer, O. (2000b) Transport equations and their solutions, in “Plastic packaging materials for food,
barrier function, mass transport, quality assurance and legislation”, O.-G. Piringer and A.L.
Baner (Ed.), Wiley-VCH, Weinheim, 183-219.

References 244
Chemical interactions between packaging materials and foodstuffs
Piringer, O. and Rütter, M. (2000) Sensory problems caused by food and packaging interactions, in
“Plastic packaging materials for food, barrier function, mass transport, quality assurance and
legislation”, O.-G. Piringer and A.L. Baner (Ed.), Wiley-VCH, Weinheim, 407-426.
Pisarczyk, K. (1995) Manganese compounds in “Kirk Othmer Encyclopaedia of Chemical
Technology”, 4th Edition, John Wiley and sons, New York.
Polson, A., Von Wechmar, M.B., Van Regenmortel, M.V.H. (1980) Isolation of viral IgY antibodies
from yolks of immunized hens. Immunological Communications 9 475-493.
Porstmann, B., Portsmann, T., Gaede, D., Nugel, E. and Egger, E. (1981) Temperature dependent
rise in activity of horseradish peroxidase caused by non-ionic detergents and its use in
enzyme-immunoassay. Clinica Chimica Acta 109 175-181.
Pospíšil, J. and Nešpúrek, S. (2000) Additives for plastics and their transformation products, in “Plastic
packaging materials for food, barrier function, mass transport, quality assurance and
legislation”, O.-G. Piringer and A.L. Baner (Ed.), Wiley-VCH, Weinheim, 47-77.
Potter, N.N and Hotchkiss, J.H. (1995) Food Science, 5th Edition, Chapman and Hall, New York, 608p.
Rath, S., Stanley, C.M. and Steward; M.W. (1988) An inhibition enzyme immunoassay for
estimating relative antibody affinity and affinity heterogeneity Journal of Immunological
Methods 106 245-249
Rauter, W., Dickinger, G., Zihlarz, R. and Lintschinger, J. (1999) Determination of bisphenol A
diglycidyl ether (BADGE) and its hydrolysis products in canned oily foods afrom the Austrian
market. Zeitschrift für Lebensmittel-Untersuchung und Forschung A 208 208-211.
Reides, A.H. (1990) Manganese compounds in “Ullman’s Encyclopaedia of Industrial Chemistry”,
5th Edition, Volume A 16, VCH, Weinheim.
Ricke, S.C. and Schaefer, D.M. (1990) Characterization of egg yolk antibodies for detection and
quantification of selenomonas ruminatum by using an enzyme-linked immunosorbent assay.
Applied and Environmental Microbiology 56 2795-2800.
Robertson, G.L. (1993) Food Packaging, Principles and practice, Marcel Dekker, New York, 676p.
Robins, R.J., Morgan, M.R.A., Rhodes, M.J.C. and Furze, J.M. (1984) Determination of quassin in
picogram quantities by an enzyme-linked immunosorbent assay. Phytochemistry 23 1119-1123.
Rooney, M.L. (1995) Active packaging in polymer fims. In “Active food packaging”, M.L. Rooney
(Ed.), Blackie Academic and Professional, London, p. 74-110.
Rose, M.E. and Mockett, A.P. (1983) Antibodies to coccidia: detection by the enzyme-linked
immunosorbent assay (ELISA). Parasite Immunology 5 479-483.
Rose, M.E., Orlans, E. and Buttress, N. (1974) Immunoglobulin classes in hen's egg: their segregation

References 245
Chemical interactions between packaging materials and foodstuffs
in yolk and white. European Journal of Immunology 4 521-523.
Rossi (1981) Fourth interlaboratory study of methods for determining total migration of plastic
materials in liquids simulating fatty foodstuffs. Journal of the Association of Official Analytical
Chemists 66 697-703.
Rossi, L. (2000) European Community legislation on materials and articles intended to come into
contact with food, in “Plastic packaging materials for food, barrier function, mass transport,
quality assurance and legislation”, O.-G. Piringer and A.L. Baner (Ed.), Wiley-VCH, Weinheim,
393-406.
Saad, H. (1975) Emulsifying agents: their use in cosmetic products. Journal of the American Oil Chemists’
Society 52 127A.
Sahasrabudhe, M.R. (1967) Chromatographic analysis of polyglycerols and their fatty acids. Journal of
the Americal Oil Chemists’ Society 44 376-378.
Saunders, G.C. (1979) The art of solid-phase enzyme immunoassay including selected protocols. In
“Immunoassays in the Clinical Laboratory”, Alan, R. Liss, Inc., New York, 99-118.
Sax, N.I. and Lewis R.J. (1988) Dangerous properties of industrial materials. 7th Edition, New York,
Van Nostrand Reinhold, 458-1008p.
Schade, R. and Hlinak, A. (1993) Die Extraktion spezifischer Antikörper aus dem Dotter von
Hühneiern- eine attaktive un unblutige Alternative zur Gewinnung spezifischer Antikörper in
Säugern. Monatshefte fur Veterinar Medizin 48 91-98.
Schade, R. Staak, C., Hendriksen, C., Erhard, M., Hugl, H., Koch, G., Larsson, A., Pollmann, W., Van
Regenmortel, M., Rijke, E., Spielmann, H., Steinbusch, H., Straughan, D. (1996) The Production
of Avian (Egg Yolk) Antibodies: IgY The Report and Recommendations of ECVAM Workshop
21 Alternatives to Laboratory Animals 24 925-934.
Schlotter, N.E. and Furlan, P.Y. (1992) A review of small molecule diffusion in polyofefins, Polymer 33
3323-3342.
Schneider, L., Pichler, H. and Krska, R. (2000) An enzyme-linked immunoassay for the determination
of deoxynivalenol in wheat based on chicken egg yolk antibodies. Fresenius Journal of Analytical
Chemistry 367 98-100.
Schouten, A.E. and van der Vegt, A.K. (1987) Plastics. Delta Press, Overberg, The Netherlands, 250 p.
Schütze, I. (1977) Analytische Charackterisierung von Polyglycerinester-Emulgatoren. Die Nährung 21
405-415.
Schwope, A.D. and Reid, R.C. (1988) Migration to dry foods. Food Additives and Contaminants 5 445-
454.

References 246
Chemical interactions between packaging materials and foodstuffs
Scott, G. (1988) Migration and loss of antioxidants from polyethylene. Food Additives and Contaminants
5 421-432.
Seher, A. (1964) Die Analyse nicht ionogener grenzflächenaktiver Stoffe II: Nachweis von Polyglycerin
mit Hilfe der Dünnschicht-Chromatographie. Fette Seifen und Anstrichmittel 66 371-375.
Sharman, M., Honeybone, C.A., Jickells, S.M. and Castle, L. (1995) Detection of residues of the epoxy
adhesive component bisphenol A diglycidyl ether (BADGE) in microwave susceptors and its
migration into food, Food Additives and Contaminants 12 779-787.
Sheehan, D.M. (2000). Activity of environmentally relevant low doses of endocrine disruptors and the
bisphenol A controversy : initial results confirmed. Proceedings of the Society for Experimental
Biology and Medicine 224 57-60.
Sidwell, J.A. (1996) Elastomers in “Migration from food contact materials”, Katan, L.L (Ed.), Blackie
Academic and Professional, London, 191-206.
Simal Gandara, J., P. Lopez Mahia, Paseiro Losada, P., Simal Lozano, J. and Paz Abuin, S. (1993)
Overall migration and specific migration of bisphhenol A diglycidyl ether monomer and m-
xylenediamine hardener from an optimized epxy-amine formulation into water-based food
simulants. Food Additives and Contaminants 10 555-565.
Simoneau, C., Roeder, G. And Anklam, E. (2000) Migration of bisphenol A from baby bottles : effect of
experimental conditions and European survey, Proceedings of the 2nd ILSI symposium "Food
Packaging Ensuring the Safety and Quality of Foods", Vienna Austria, ILSI, Brussels, Belgium.
Simoneau, C., Theobald, A., Hannaert, P., Roncari, P., Roncari, A., Rudolph, T. and Anklam, E. (1999)
Monitoring of bisphenol A diglycidylether (BADGE) in canned fish in oil. Food Additives and
Contaminants 16 189-195.
Sinha, R.C., Savard, M.E. and Lau, R. (1995) Production of monoclonal antibodies for the specific
detection of deoxynivalenol and 15-acetyldeoxynivalenol by ELISA. Journal of Agricultural and
Food Chemistry 43 1740-1744.
Skerritt, J.H., Guihot, S.L., Mc Donald, S.E. and Culvenor, R.A. (2000) Development of immunoassy
for tyramine and tryptamine toxins from Phalaris aquatica L.. Journal of Agricultural and Food
Chemistry 48 27-32.
Söderhjelm, L. and Sipiläinen-Malm, T. (1996) Paper and board in “Migration from food contact
materials”, Katan, L.L (Ed.), Blackie Academic and Professional, London, 159-180.
Sohoni, P. and Sumpter, J.P. (1998). Several environmental oestrogens are also anti-androgens. Journal
of endocrinology 158 327-339.
Song, C-S, Yu, J-H., Bai, D.H., Hester, P.Y. and Kim, K-H. (1985) Antibodies to the alpha subunit of
References 247
Chemical interactions between packaging materials and foodstuffs
insulin receptor from eggs of immunized hens. Journal of Immunology 135 3354-3359.
Southgate, D.A.T. (1991) Determination of food carbohydrates, 2nd Edition, Elsevier Applied Science,
London, UK., 232p.
Stahl, E. (1967) Dünnschicht Chromatographie. Ein Laboratoriumhandbuch, 2nd Edition, Springer
Verlag, Berlin, Germany, p. 979.
Stanker, L.H., Bigbee, C., Van Emon, J., Watkins, B., Jensen, R.H., Morris, C. And Vaderlaan, M. (1989)
Immunoassay for pyrethroids: detection of permithrin in meat. Journal of Agricultural and Food
Chemistry 37 834-839.
Stannett, V.T., Koros, W.J., Paul, D.R., Lonsdale, H.K. and Baker, R.W. (1979). Recent advances in
membrane science and technology. Advances in Polymer Science 32 71-121.
Strawn, E., Novy, M., Burry, K. and Bethea, C. (1995). Insulin-like growth factor-1 promotes
leiomyoma cell growth in vitro. American Journal of Obstetrics and Gynecology 172 1837-1843. In :
Klotz, D.M., Hewitt, S.C., Korach, K.S. and Diaugustine, R.P. (2000). Activation of a uterine
insulin-like growth factor I signaling pathway by clinical and environmental estrogens :
Requirement of estrogen receptor-�. Endocrinology 141 3430-3439.
Sugita, T., Kawamura, Y., Yamada, T. (1994) Determination of residual monomers and polymerization
regulators in polycarbonate by high-performance liquid chromatography, Journal of the Food
Hygienic Society of Japan 35 510-516,
Svendsen, L, Crowley, A., Ostergaard, L.H., Stodulski, G. and Hau, J. (1995) Development and
comparison of purification strategies for chicken antibodies from egg yolk. Laboratory Animal
Science 45 89-93.
Tacket, C.O., Binion, S.B., Bostwick, E., Losonsky, G., Roy, M and Edelman, R. (1992) Efficacy of
bovine milk immunoglobulin concentrate in preventing illness after Shigella flexneri challenge.
American Journal of Tropical Medicine and Hygiene 47 276-283.
Tacket, C.O., Losonsky, G., Link, H., Hoang, Y., Guerry, P. Hilpert, H. and Levine, M.M. (1988)
Protection by milk immunoglobulin concentrate against oral challenge with enterotoxigenic E.
coli. New England Journal of Medecine 318 1240-1243.
Takao, Y., Lee, H.C. and Arizono, K. (1999a) An attempt by solid-phase microextraction with on-
column silylation for a rapid and highly sensitive determination of bisphenol A, Bunseki Kagaku
48 589-593.
Takao, T., Nanamiya, W., Nagano, I., Asaba, K., Kawabata, K. and Hashimoto, K. (1999b). Exposure
with the environmental estrogen bisphenol A disrupts the male reproductive tract in young
mice. Life sciences 65 2351-2357.

References 248
Chemical interactions between packaging materials and foodstuffs
Takino, A., Tsuda, T., Kojima, M., Harada, H., Muraki, L. and Wada, M. (1999) Development of an
analytical method for bisphenol A in canned fish and meat by HPLC. Journal of the Food Hygienic
Society of Japan 40 325-333.
Thouvenot, D. and Morfin, R.F. (1983) Radioimmunoassay for zearlenone and zearalanol in human
serum : production, properties and use of porcine antibodies. Applied and Environmental
Microbiology 45 16-23.
Tice, P.A. (1988) PIRA project on migration of monomers and overall migration. Food Additives and
Contaminants 5 373-380.
Tice, P.A. and McGuiness, J.D. (1987) Migration from food contact materials. 1. Establishment and
aims of the PIRA project. Food Additives and Contaminants 4 267-276.
Tingle, V. (1996) Glass in “Migration from food contact materials”, Katan, L.L (Ed.), Blackie Academic
and Professional, London, 145-158.
Tsumura, Y., Ishimitsu, S., Saito, I., Sakai, H., Kobayashi, Y. and Tonogai, Y. (2001) Eleven phthalate
esters and di(2-ethyl-hexyl) , Food Additives and Contaminants 18 449-460.
Tsutsui, T., Tamura, Y., Suzuki, A., Hirose, Y., Kobayashi, M., Nishimura, H., Metzler, M. and Barrett,
C. (2000). Mammalian cell transformation and aneuploidy induced by five bisphenols.
International journal of cancer 86 151-154.
Tsutsui, T., Tamura, Y., Yagi, E., Hasegawa, K, Takahashi, M., Maizumi, N., Yamaguchi, F. and
Barrett, C. (1998). Bisphenol-A induces cellular transformation, aneuploidy and DNA adduct
formation in cultured syrian hamster embryo cells. International Journal of Cancer 75 290-294.
Turnbull, D. and Cohen, M.H. (1961) Free volume model of amorphous phase: glass transition. The
Journal of Chemical Physics 34 120-125.
Usleber, E., Schneider, E., Märtlbauer, E. and Terplan, G. (1993) Two formatos of enyme
immunoassaty for 15-acetyldeoxynivalenol applied to wheat. Journal of Agricultural and Food
Chemistry 41 2019-23.
Usleber, E., Straka, M. and Terplan, G. (1994) Enzyme inmmunoassay for fumonisin B1 applied to
corn-based foods. Journal of Agricultural and Food Chemistry 42 1392-1396.
Van Battum, D. (1996) Alternative fatty-food simulants. A fact finding excercice, C FRA BV
Consultancy for food packaging regulatory affairs, Doorn, The Netherlands, 84p.
Van Battum, D. and Van Lierop, J.B.H. (1988) Testing of food contact materials in the Netherlands.
Food Additives and Contaminants 5 381-395.
Van Lierop, J.B.H. (1994) Enforcement of European Community legislation at the national level. Food
Additives and Contaminants 11 131-139.

References 249
Chemical interactions between packaging materials and foodstuffs
Vermeiren, L., Devlieghere, F., Van Beest, M., De Kruijf, N., Debevere, J. (1999) Development in the
active packaging in foods. Trends in Food Science and Technology 10 77-86.
Vieira, J.G., Oliveira, M.A., Maciel, R.M., Mesquita, C.H. and Russo, E.M. (1986) Development of an
radioimmunoassay for the synthetic amino terminal (1-34) fragment of human parathyroid
hormone using egg yolk-obtained antibodies. Journal of Immunossay 7 57-72.
Vijayalakshmi, N.S., Raj, B., Murthy, R.A.N. and Veeraju, P. (1992) Effect of one-side and two-side
exposure of plain films on the amount of extractives into food simulants in migration tests.
Deutsche Lebensmittel-Rundschau 88 154-156.
Vom Saal, F.S., Finch, C.E. and Nelson, J.F. (1994). Natural history and mechanisms of aging in
humans, laboratory rodents and other selected vertebrates. In : Knobil, E., Neill, J. and Pfaff, D.
(Eds.) Physiology of reproduction, Vol 2. New York, Raven Press, 1213-1313. In : Vom Saal, F.S.,
Cooke, P.S., Buchanan, D.L., Palanza, P., Thayer, K.A., Nagel, S.C., Parmigiani, S. and Welshons,
W.V. (1998). A physiological based approach to the study of bisphenol A and other estrogenic
chemicals on the size of reproductive organs, daily sperm production, and behavior. Toxicology
and Industrial Health 14 239-260
Vrentes, J.S. and Vrentes, C.M. (1994a) Solvent self-diffusion in rubbery polymer-solvent systems.
Macromolecules 27 4684-4690.
Vrentes, J.S. and Vrentes, C.M. (1994b) Solvent self-diffusion in glassy polymer-solvent systems.
Macromolecules 27 5570-5576.
Warenwet. Food Legislation of the Netherlands. Uitvoeringsbesluiten Regeling verpakkingen en
gebruiksartikelen CIII-5, Kon. Vermande B.V. Uitgevers, Lelystad, 148p.
Weller, M.G., Weil, L. and Niessner, R. (1992) Increased sensitivity of an enzyme immunoassay
(ELISA) for the determination of triazine herbicides by variation of tracer incubation time.
Mikrochimica Acta 108 29-40.
Welzig, E., Pichler, H., Krsaka,R., Knopp,D. and Niessner, R. (2000) Development of an enzyme
immunoassay for the determination of the herbicide metsulfuron-methyl based on chicken egg
yolk antibodies. International Journal of Environmental Analytical Chemistry 78 279-288.
Weng, Y.M., Chen, M.J. and Chen W. (1999) Antimicrobial food packaging materials from
poly(ethylene)co-methacrylic acid). Food Science and Technology (LWT) 32 191-195.
Wessling, C., Nielsen, T., Leufven, A. and Jägerstad, M. (1999) Retention of alfa tocopherol in low-
density polyethylene (LDPE) and polypropylene (PP) in contact with foodstuffs and food-
simulanting liquids. Journal of the Science of Food and Agriculture 79 1635-1641.
Woychik, N.A., Hinsdill, R.D. and Chu, F.S. (1984) Production and Characterization of monoclonal

References 250
Chemical interactions between packaging materials and foodstuffs
antibodies against aflatoxin M1. Applied and Environmental Microbiology 48 1096-1099.
Wunderlich, B.; Cheng, S.Z.D., Loufakis, K. (1989) Thermodynamic properties in “Encyclopedia of
Polymer Science and Engineering”, Volume 16, Mark, H., Bikales, N.M., Overberger, C.G.,
Menges G. (Eds.), John Wiley and Sons, New York, USA, p. 767-807.
Xanthos, M. and Todd, D.B. (1996) Plastic processing in “Encyclopedia of Chemical Technology”,
Volume 19, 4th Edition, Grant, M.H. (Ed.), John Wiley and Sons, New York, USA.
Yeung, J.M., Prelusky, D.B., Savard, M.E., Dang, B.D. and Robinson, L.A. (1996) Sensitive immunoassy
for fumonisin B1 in corn. Journal of Agricultural and Food Chemistry 44 3582-3586.
Yoan, K., Pellaroni, L., Ramamoorthy, K., Gaido, K. and Safe, S. (2000). Ligand structure-dependent
differences in activation of estrogen receptor � in human HepG2 liver and U2 osteogenic cancer
cell lines. Molecular and cellular endocrinology 162 211-220.
Yokota, H., Iwano, H., Endo, M., Kobayashi, T., Inoue, H., Ikushiro, S. and Yuasa, A. (1999).
Glucuronidation of the environmental oestrogen bisphenol A by an isoform of UDP-
glucuronosyltransferase, UGT2B1, in the rat liver. The Biochemical Journal 340 405-409. In :
Nakagawa, Y. and Tayama, S. (2000). Metabolism and cytotoxicity of bisphenol A and other
bisphenols in isolated rat hepatocytes. Archives of Toxicology 74 99-105.
Young, R.J., Critchley, J.A.J.H., Young, K.K., Freebairn, R.C., Reynolds, A.P. and Lolin, Y.I. (1996)
Fatal acute hepatorenal failure following potassium permanganate ingestion. Human and
Experimental Toxicology 15 259-261.
Yoshida, T., Horie, M., Hoshino, Y. and Nakazawa, H. (2001) Determination of bisphenol A in canned
vegetables and fruit by high performance liquid chromatography. Food Additives and
Contaminants 18 69-75.

Annex 1: abbreviations 251
Chemical interactions between packaging materials and foodstuffs
8. Annex 1: abbreviations
ABTS: 2,2’-azino-bis(3-ethylbenzthiazoline-6-sulfonic acid)
ADI: acceptable daily intake [mg.kg-1 bodyweight.day-1]
AMP: anti-microbial packaging materials
BADGE: bisphenol A diglycidyl ether
BCR: Bureau of certified reference materials
BSA: bovine serum albumin
CDI: carbon dioxide indicator
CEN: European centre for normalisation (Centre Européen
de Normalisation)
DCC: N,N’-dicyclohexylcarbodiimide
DEHP: di-(ethyl-2-hexyl)phthalate
DIP: di-iso-octyl phthalate
DMF: dimethylformamide
EDI: estimated daily intake [mg.kg-1 bodyweight.day-1]
EDTA: ethylenediamine tetra-acetic acid
ELISA: enzyme-linked immunosorbent assay
ES: ethylene scavenger
EU: European Union
FTIR: Fourier transform infra red spectroscopy
GC: gas chromatography or gas chromatograph
GC-MS: gas chromatography coupled to mass
spectrometry
GLC: gas liquid chromatography – capillary gas
chromatography
HMDS: hexamethyldisilazane
HPLC: high pressure liquid chromatography
HPLC-UV: high pressure liquid chromatography coupled
to ultra violet detection
HS: head space
ID: internal diameter
Ig A: immunoglobulins A
Annex 1: abbreviations 252
Chemical interactions between packaging materials and foodstuffs
Ig G: immunoglobulins G
Ig M: immunoglobulins M
IgY: egg yolk immunoglobulins, similar to IgG
IRRM: Institute for reference materials and measurements
(former BCR)
JECFA: Joint Expert Committee on Food Additives
LC-MS: liquid chromatography coupled to mass
spectrometry
LC: liquid chromatography
MAFF: Ministry of Agriculture, Fisheries and Foods of the
United Kingdom
MPPO: modified polyphenoloxide or Tenax®
MR: moisture regulator
MS: mass spectrometry
MTDI: maximum tolerable daily intake
NMR: nuclear magnetic resoncance
OA: other active packaging material
OI: oxygen indicator
OS: oxygen scavenger
OVA: ovalbumin
PA: polyamide
PAN: polyacrylonitrile
PBS: phosphate buffered saline
PC: polycarbonate
PE: polyethylene
PET: polyethyleneterephthalate
PP: polypropylene
PS: polystyrene
PTFE: polytetrafluorethylene
PTWI: provisional tolerable weekly intake [mg.kg-1 bodyweight.week-1]
PVAC: polyvinylacetate
PVAL: polyvinylalcohol
PVC: polyvinylchloride

Annex 1: abbreviations 253
Chemical interactions between packaging materials and foodstuffs
PVDC: polyvinylidenechloride
RT: room temperature
SCF: Scientific Committee for Food of the European Union
SDS-PAGE: sodium dodecyl sulphate polyacryl
gelelectrophoresis
Simulant A : water
Simulant B : 3 % (v:v) acetic acid
Simulant C : 10 or 15 % (v:v) ethanol
Simulant D : olive oil or equivalent
SML: specific migration limit [mg.kg-1 food]
t-ADI: temporary ADI [mg.kg bodyweigth-1.day-1]
TBAF: N,N,N-tributyl-1-butylammonium fluoride
tBCDS: tert-butyl(chloro)dimethylsilane
TDI: tolerable daily intake [mg.kg bodyweigth-1.day-1]
TFA: trifluoro acetic acid
THF: tetrahydrofurane
TLC: thin layer chromatography
tMCS: trimethylsilylchloride
TNBS: 2,4,6-trinitrobenzenesulfonic acid
t-TDI: temporary TDI [mg.kg bodyweigth-1.day-1]
TTI: time temperature indicator
USA: United States of America
US: United States (of America)
VCM: vinyl chloride monomer
UV: ultra violet

Annex 1: abbreviations 254
Chemical interactions between packaging materials and foodstuffs

Annex 2: symbols 255
Chemical interactions between packaging materials and foodstuffs
9. Annex 2: symbols
A : contact surface between the polymer and the food [cm²]
AP : effect of the polymer on the diffusion
B : absorbance
B0 : absorbance in absence of analyte
b : constant related to the effect of the molecular weight of
the migrant on diffusion
[mole.g-1]
C : concentration of a compound [g.cm-³]
c : constant related to the effect of the temperature on the
diffusion
[K-1]
CF : concentration of a component in the food [mg.kg-1] or equivalent
CF,daily: concentration of the indirect food additive in the daily
diet
[mg.kg-1] or equivalent
CF, daily, j : concentration of the indirect food additive in the
daily diet, due to contact with material j
[mg.kg-1] or equivalent
CF,experimental : experimentally observed concentration of a
component in the food
[mg.kg-1] or equivalent
CF,∞ : equilibrium concentration of a component in the food [g.cm-³]
CF,j : concentration of the indirect food additive in food
contacted with material j
[g.cm-³]
CF,predicted : predicted concentration of a migrating component
in the food
[kg.m-³]
CF,t : concentration of a component in the food at time t [g.cm-³]
CP,0 : initial concentration of a component in the polymer [g.cm-³]
CP,t : concentration of a component in the polymer at time t [g.cm-³]
CP,∞ : equilibrium concentration of a component in the
polymer
[g.cm-³]
CF : consumption factor of a particular food contact material
CFj : consumption factor of food contact material j
C/M : contact material
D : diffusion coefficient [cm².s-1]
DF : diffusion coefficient of a compound in the food [cm².s-1]

Annex 2: symbols 256
Chemical interactions between packaging materials and foodstuffs
DP : diffusion coefficient of a compound in the polymer [cm².s-1]
DP,f : diffusion coefficient of a food component in the polymer [cm².s-1]
DP,m : diffusion coefficient of a migrant in the polymer [cm².s-1]
D0 : diffusion coefficient [cm²v]
d : ion concentration M
E : environment
Ed : activation energy of diffusion [kJ.mole-1]
Em : emission wavelength [nm]
Ex : excitation wavelength [nm]
e : the base number of the natural logarithm (ln(e) = 1)
erf(z): error function of the variable z
erfc(z) : 1-erf(z)
F : food
f : charge
fj: food type distribution factor of contact material j
I : ionic strength mM
I50, compound : concentration of the analyte at which the
absorbance equals half of the maximal absorbance in an
ELISA
µM
Jx, Jy, Jz : mass flux of a component, in the respectively the
direction of the x, y and z-axis
[g.cm-².s-1]
Jx (x); Jx (x+∆x) : mass flux of a component, in the direction of
the x-axis at place x and x+∆x respectively
[g.cm-².s-1]
Jy (y); Jy (y+∆y) : mass flux of a component, in the direction of
the y-ayis at place y and y+∆y respectively
[g.cm-².s-1]
Jz (z); Jz (z+∆z) : mass flux of a component, in the direction of
the z-axis at place z and z+∆z respectively
[g.cm-².s-1]
KP/F : partition coefficient of a component between the food
and the polymer
k : rate constant of a chemical reaction of order m [(cm³.g-1)m.s-1]
LP : thickness of the polymer [cm]
M : molecular weight [g.mole-1]
mF, 0 : initial amount of a migrating substance in the food [g]

Annex 2: symbols 257
Chemical interactions between packaging materials and foodstuffs
mF, t : amount of a migrating substance in the food at time t [g]
mF,∞ : amount of a migrating substance into the food at
equilibrium
[g]
mP,0 : initial amount of a migrating substance in the polymer [g]
mP,∞ : amount of a migrating substance in the polymer at
equilibrium
[g]
Mr : molecular weight of the migrant [g.mole-1]
m : order of a chemical reaction
n : mathematical help variable
P : polymer or plastic
R : universal gas constant= 8.314 [J.mole-1.K-1]
Rf : retention factor in TLC experiments
qn : positive root of the trigonometric equation tg (qn)=-αqn
S : lower asymptote to the competition curve as defined in
formula [43]
T : absolute temperature [K]
Tg : glass transition temperature [K]
t : time [s]
VF : volume of the food [cm³]
VP : volume of the polymer [cm³]
x : concentration of the analyte (formula [43])
z : dimensionless factor as defined in equation [19]
α : dimensionless factor as defined in equation [14]
β : dimensionless factor as defined in equation [22]
∆x, ∆y, ∆z : small step in respectively the x, y, z, direction [cm]
δ : chemical shift in NMR [ppm]
ξ : constant related to the dependence of the diffusion
coefficient upon Mr
[(mole.g-1)1/2]
ψ : constant related to the activation energy of the diffusion [J.g-1/3.mole-2/3]
µF : chemical potential of a component in the food [J.mole-1]
µP : chemical potential of a component in the polymer [J.mole-1]
π : the number pi

Annex 2: symbols 258
Chemical interactions between packaging materials and foodstuffs
ω1 : mass fraction of a solvent in a polymer
Related Documents
![Paper Class Xiii[Leader(Xii Xiii)]](https://static.cupdf.com/doc/110x72/577cc5851a28aba7119ca7e3/paper-class-xiiileaderxii-xiii.jpg)