Title Page: Aquatic toxicity assessment: environmental hazard classification of Uranium products. Report submitted by the Golder Associates on 30 June 2014 30 June 2014 REPORT AQ U A TIC TO XICITY ASSESSM ENT Environm entalH azard C lassification ofU ranium Products R eportN um ber. 147613036-0002-R -R ev0

Welcome message from author
This document is posted to help you gain knowledge. Please leave a comment to let me know what you think about it! Share it to your friends and learn new things together.
Transcript
Title Page: Aquatic toxicity assessment: environmental hazard classification of Uranium products.
Report submitted by the Golder Associates on 30 June 2014
30 June 2014
REP
ORT
AQUATIC TOXICITY ASSESSMENT
Environmental Hazard Classification of Uranium Products Report Number. 147613036-0002-R-Rev0

URANIUM PRODUCTS AQUATIC TOXICITY ASSESSMENT
Table of Contents
Table of Contents............................................................................................................................................. 2
Glossary........................................................................................................................................................... 6
Plain English Summary..................................................................................................................................... 8
1.0 Introduction....................................................................................................................................... 8
2.0 Purpose............................................................................................................................................ 8
3.0 Methodology..................................................................................................................................... 8
4.0 Results and Conclusions.................................................................................................................. 8
Executive Summary........................................................................................................................................ 11
1.0 Introduction..................................................................................................................................... 11
2.0 Purpose.......................................................................................................................................... 11
3.0 Methodology................................................................................................................................... 11
4.0 Results and Conclusion..................................................................................................................12
Full Report...................................................................................................................................................... 14
1.0 Introduction..................................................................................................................................... 14
1.1 Background................................................................................................................................. 14
1.2 Objectives................................................................................................................................... 14
1.3 Scope of Work............................................................................................................................ 16
2.0 Uranium – Background Information................................................................................................16
3.0 Regulatory Frameworks..................................................................................................................16
3.1 Global Harmonised System........................................................................................................17
3.2 Australian Dangerous Goods Code............................................................................................17
3.3 International Maritime Dangerous Goods Code..........................................................................17
4.0 Aquatic Toxicity Assessment..........................................................................................................17
4.1 Overview..................................................................................................................................... 17
4.2 Literature Review – Sources.......................................................................................................18
4.3 Available Data............................................................................................................................. 18
4.4 Assessment of Uranium Toxicity in Accordance with the GHS...................................................18
4.5 Data Gaps................................................................................................................................... 22
4.6 Bioaccumulation Potential...........................................................................................................23
5.0 Transformation/Dissolution Testing.................................................................................................23
5.1 Background................................................................................................................................. 23
5.2 Particle Size Distribution.............................................................................................................23
5.3 Elemental Composition...............................................................................................................25
5.4 Freshwater Solubility................................................................................................................... 26
5.5 Marine Solubility..........................................................................................................................31
30 June 2014Report No. 147613036-002-R-Rev0
2

URANIUM PRODUCTS AQUATIC TOXICITY ASSESSMENT
5.6 Quality Assurance / Quality Control............................................................................................35
6.0 Classification of Uranium Products.................................................................................................36
6.1 GHS Classification......................................................................................................................36
6.2 Class 9 Dangerous Goods Classification....................................................................................38
7.0 Uncertainties................................................................................................................................... 41
8.0 Conclusions.................................................................................................................................... 41
9.0 References..................................................................................................................................... 43
10.0 Limitations....................................................................................................................................... 46
Report Signature Page................................................................................................................................... 47
APPENDIX A.................................................................................................................................................. 48
1.0 Statement of Review.......................................................................................................................48
APPENDIX B.................................................................................................................................................. 49
1.0 Aquatic Toxicity Data – Raw Acute and Chronic Data....................................................................49
APPENDIX C.................................................................................................................................................. 61
1.0 Factors Affecting AquaticToxicity/Bioavailability.............................................................................61
1.1 pH............................................................................................................................................... 61
1.2 Dissolved Organic Matter............................................................................................................61
1.3 Hardness..................................................................................................................................... 62
1.4 Alkalinity...................................................................................................................................... 62
2.0 References..................................................................................................................................... 64
APPENDIX D.................................................................................................................................................. 66
1.0 Species Sensitivity Distribution for Uranium Toxicity......................................................................66
2.0 References..................................................................................................................................... 69
APPENDIX E.................................................................................................................................................. 70
1.0 Golder Associates Technical Memordanum...................................................................................70
1.1 Introduction................................................................................................................................. 70
1.2 Objectives................................................................................................................................... 70
1.3 Background................................................................................................................................. 70
2.0 Aquatic Toxicology Data................................................................................................................. 71
2.1 Availability of Data..................................................................................................................... 71
2.2 Bioaccumulation Potential...........................................................................................................71
2.3 Radiological Effects.................................................................................................................... 72
2.4 Data Gaps................................................................................................................................... 72
3.0 Proposed Testing............................................................................................................................ 72
3.1 Rationale..................................................................................................................................... 72
3.2 Ecotoxicological.......................................................................................................................... 72
3.3 Chemical..................................................................................................................................... 73
30 June 2014Report No. 147613036-002-R-Rev0
3

URANIUM PRODUCTS AQUATIC TOXICITY ASSESSMENT
3.4 Proposed Laboratories................................................................................................................73
4.0 Costs............................................................................................................................................... 74
4.1 Co-funding Options.....................................................................................................................74
5.0 References..................................................................................................................................... 75
6.0 Limitations....................................................................................................................................... 75
7.0 Closing............................................................................................................................................ 75
APPENDIX F.................................................................................................................................................. 77
1.0 Transformation / Dissolution Test – Laboratory Certificates...........................................................77
APPENDIX G.................................................................................................................................................. 78
1.0 Limitations....................................................................................................................................... 78
30 June 2014Report No. 147613036-002-R-Rev0
4

URANIUM PRODUCTS AQUATIC TOXICITY ASSESSMENT
Abbreviations
Abbreviation DescriptionADG Australian Dangerous Goods Code As ArsenicANZECC Australian and New Zealand Environment and Conservation CouncilARMCANZ Agriculture and Resource Management Council of Australia and New ZealandBa BariumBAF Bioaccumulation factorBCF Bioconcentration factorCCME Canadian Council of Ministers of the EnvironmentCd CadmiumCr Chromium Cu CopperEC Effect concentrationECx Effect concentration for x% of speciesEHS Environmentally hazardous substancesFe IronGHS Globally Harmonized System for Classification and Labelling of ChemicalsIC Inhibition concentrationIMDG International Maritime Dangerous Goods CodeICP-OES Inductively coupled plasma-optical emission spectrometrykg kilogramL litreLC Lethal concentrationLOAEL Lowest observed adverse effect levelLOR Limit of reportingm metresMARPOL Marine Pollution Conventionmg milligrammg/kg∙d milligram of chemical per kilogram body weight per daymg/L milligrams per litreµg microgramµg/L micrograms per litreµm micrometresNOAEL No observed adverse effect levelNOEC No observed effect concentrationQA/QC Quality assurance and quality controlT/D Transformation/dissolutionTRV Toxicity reference valueUF Uncertainty FactorU UraniumUN United NationsUNECE United Nations Economic Commission for EuropeUO4 Uranium oxide, uranyl peroxide, uranium (VI) peroxide, uranium peroxide
hydrate (UO4·2H2O)U3O8 Triuranium octoxideUSEPA United States Environmental Protection AgencyZn Zinc
30 June 2014Report No. 147613036-002-R-Rev0
5

URANIUM PRODUCTS AQUATIC TOXICITY ASSESSMENT
GlossaryTerm Definition
Acute exposure A contact between an agent and a target occurring over a short time.
Acute toxicity An adverse effect that is induced by short-term exposure (generally 24- to 96-hours) to a chemical. Acute toxicity tests evaluate effects on survival.
Background level (or concentration)
The amount (or concentration) of agent in a medium that is not attributed to the sources under investigation in an exposure assessment.
Bioavailability The ability of substances to interact with the biological system of an organism. Systemic bioavailability will depend on the chemical or physical reactivity of the substance and its ability to be absorbed through the gastrointestinal tract, respiratory tract or skin.
Chronic exposure The extended or long-term exposure to a stressor, conventionally taken to include at least a tenth of the life-span of a species.
Chronic toxicity An adverse effect that is generally induced by prolonged exposure to a chemical. It may also include an ability to produce an adverse effect that persists over a long period of time (such as effects on growth or reproduction), whether or not it occurs immediately upon exposure to a chemical or is delayed.
Ecosystem An integrated and stable association of living and non-living resources functioning within a defined physical location. A community of organisms and its environment functioning as an ecological unit.
Exposure Concentration or amount of a particular chemical that reaches a target organism, system, population or sub-population in a specific frequency for a defined duration. Exposure is usually quantified as the concentration of the agent in the medium integrated over the time duration of contact.
Exposure assessment
The estimation (qualitative or quantitative) of the magnitude, frequency, duration, route and extent (e.g., number of organisms) of exposure to one or more contaminated media for a population, for different sub-groups of the population, or for individuals.
Hazard Inherent property of a contaminant or situation having the potential to cause adverse effects when a population may be exposed to that contaminant.
Limit of reporting (LOR)
The minimum concentration or mass of analyte that can be detected at a known confidence level.
No observed effect concentration (NOEC)
The highest exposure concentration at which there are no biologically significant increases in the frequency or severity of adverse effect between the exposed population and its appropriate control.
pH The degree of acidity (or alkalinity) of soil or solution; generally presented from 1 to 14. A difference of one pH unit represents a ten-fold change in hydrogen ion concentration.
Receptor The person or organism subjected to an exposure (to chemicals or physical agents).
Risk Assessment Process that evaluates the probability of adverse effects that may occur, or are occurring on target organism(s) as a result of exposure to one or more stressors.
30 June 2014Report No. 147613036-002-R-Rev0
6

URANIUM PRODUCTS AQUATIC TOXICITY ASSESSMENT
Term Definition
Risk The probability that, in a certain time frame, an adverse outcome will occur in a person, group of people, plants, animals and/or the ecology of a specified area that is exposed to a particular dose or concentration of a hazardous agent, that is, risk depends on both the intrinsic toxicity of the agent and the level of exposure. Risk differs from hazard primarily because risk considers probability.
Risk characterisation The qualitative and, wherever possible, quantitative determination, including attendant uncertainties, of the probability of occurrence of known and potential adverse effects of an agent in a given organism, system or (sub)population under defined exposure conditions.
Sensitivity Differences in toxic response within a population; this can be due numerous biological or environmental factors.
Toxicity Inherent property of a chemical to cause an adverse biological effect.
Uncertainty Refers to the inability to know for sure, often due to incomplete data.
30 June 2014Report No. 147613036-002-R-Rev0
7

URANIUM PRODUCTS AQUATIC TOXICITY ASSESSMENT
Plain English Summary
1.0 INTRODUCTION
The environmental hazard classification associated with the transport of hazardous materials is specified in the Australian Dangerous Goods (ADG) code, International Maritime Dangerous Goods (IMDG) code and the United Nations (UN) Globally Harmonized System of Classification and Labelling of Chemicals (GHS). These classifications determine the manner in which a spill or accident is managed and the flow of public information.
Uranium oxides are currently classified as Dangerous Goods (DG) for transport (via road/rail and ship) under Classes 7 (radioactive) and 9 (aquatic toxicant; Chronic Category 4). Based on the available literature and anecdotal evidence there is a belief that uranium products (UO4 and U3O8) are most probably insoluble and therefore do not present the risk attached to the current aquatic classification.
2.0 PURPOSEThis aim of this project was to clarify the classification of uranium products (UO4 and U3O8) in accordance with ADG and IMDG.
3.0 METHODOLOGYThe project involved the following:
Literature review and aquatic toxicology assessment of uranium to derive benchmark toxicity concentrations in both fresh and marine waters.
Undertaking transformation/dissolution (T/D) testing of one sample of each of two uranium oxides (UO4 and U3O8) to assess the solubility in fresh and marine water.
Use of the above findings for DG classification of the uranium oxides: UO4 and U3O8 in accordance with ADG and IMDG codes.
Two approaches were used in the assessment of the aquatic toxicity of uranium products (UO4 and U3O8). These were:
An assessment of toxicity consistent with GHS guidance (i.e., to establish acute and chronic aquatic toxicity screening benchmarks for uranium); and
An assessment of toxicity using standard international statistical methods (species sensitivity distributions (SSD)).
The intent of undertaking two assessments of aquatic toxicity was to identify if the toxicity assessment that was performed following GHS guidance was supported, or if there was evidence to suggest that uranium products presented a different aquatic toxicity hazard relative to the GHS approach.
4.0 RESULTS AND CONCLUSIONSThe GHS classification obtained on the basis of aquatic toxicity was that uranium products (UO4 and U3O8) remain classifiable as Class 9 Dangerous Goods (hazardous to the aquatic environment) under the IMDG and ADG codes, and GHS guidance. The applicable acute and chronic categories and descriptions are as follows:
Short-term (Acute): The uranium products tested (UO4 and U3O8) are classifiable as Category 1 acute aquatic toxicants which are considered very toxic to aquatic life.
Long-term (Chronic): The uranium products tested (UO4 and U3O8) are classifiable as Category 1 chronic aquatic toxicants which are considered very toxic to aquatic life with long lasting effects.
Figure 1 shows the classification process for the uranium products UO4 and U3O8.
30 June 2014Report No. 147613036-002-R-Rev0
8

URANIUM PRODUCTS AQUATIC TOXICITY ASSESSMENT
The Category 1 aquatic toxicity classifications for acute and chronic differ from the Chronic Category 4 classification. This is because the T/D testing at 1 mg/L, 10 mg/L and 100 mg/L of uranium products in freshwater and marine water indicated that each product was soluble to some degree. Table A shows the results at 7 days and 28 days for the 1 mg/L loading and the results at 7 days for the 10 mg/L and 100 mg/L loadings in fresh and marine water for the two uranium products tested.
Table A: Transform / Dissolution Test Results for 1 mg U/L LoadingLoading Day Freshwater Marine waters
Loading Day UO4 mg U/L
UO4 % soluble
U3O8 mg U/L
U3O8 % soluble
UO4 mg U/L
UO4 % soluble
U3O8 mg U/L
U3O8 % soluble
1 mg/L 7 0.25 32 0.25 30 0.66 84 0.25 30
1 mg/L 28 0.20 26 0.52 62 0.7 90 0.57 67
10 mg/L 7 0.65 8 1.5 18 4.6 58 2.1 25
100 mg/L 7 3.6 5 9.0 11 11.7 15 10.3 12
The day 7 and day 28 solubilities were compared to the project-derived acute and chronic aquatic toxicity benchmarks, presented below:
Acute benchmark of 55 µg U/L (0.055 mg U/L).
Chronic benchmark of 25 µg U/L (0.025 mg U/L).
As the solubilities of both uranium products were higher than the acute and chronic benchmarks, the uranium products were classifiable as Category 1 acute and Category 1 chronic toxicants.
Both uranium products exhibited higher solubility in marine water (compared with freshwater) at day 28 of the T/D testing. In general, the solubilities of the uranium products were found to increase with time until the respective limits of solubility were reached. UO4 was found to reach its solubility limit at a faster rate than U3O8 in both fresh and marine water.
The aquatic toxicology assessment concluded that the benchmarks derived in accordance with GHS guidance were generally consistent with the alternative SSD benchmarks generated in this report. In effect, the outcome of these two assessments was the same: uranium is acutely and chronically toxic to aquatic organisms.
The Category 4 classification appeared to be based on the assumption that uranium is insoluble. This is consistent with some of the published literature, where uranium oxides can be described as “insoluble”, without quantified limits of measurement. The GHS guidance acknowledges the lack of an accepted definition of solubility and the challenges of using anecdotal (rather than measured) solubility information as follows: “…..for many metals or metal compounds, it is probable that the available information will be descriptive only, e.g. poorly soluble. Unfortunately there appears to be very little (consistent) guidance about the solubility ranges for such descriptive terms. Where these are the only information available it is probable that solubility data will need to be generated using the Transformation/Dissolution Protocol” (Annex 9, section A9.7.2.2.2, GHS 2013).
Marine aquatic toxicology data were not found during this project. It is suggested that these data be obtained in order to classify the environmental hazard of uranium products for marine environments. In the absence of marine ecotoxicological data to establish a marine toxicity benchmark, the freshwater data have been used to prepare an environmental hazard classification of uranium products under the IMDG code. It is recommended that the classification for marine transportation be reviewed should a marine toxicity benchmark become available.
30 June 2014Report No. 147613036-002-R-Rev0
9

URANIUM PRODUCTS AQUATIC TOXICITY ASSESSMENT
Figure A: Aquatic Classification of Uranium Products UO4 and U3O8 according to GHS
UO4 solubility: Freshwater: 0.1 mg/L to 0.25 mg/L Marine water: 0.4 mg/L to 0.7 mg/L
U3O8 solubility: Freshwater: 0.07 mg/L to 0.52 mg/L
Marine water: <0.05 mg/L to 0.57 mg/L
UO4 Classification: GHS Acute Category 1
GHS Chronic Category 1
U3O8 Classification: GHS Acute Category 1
GHS Chronic Category 1
30 June 2014Report No. 147613036-002-R-Rev0
10

URANIUM PRODUCTS AQUATIC TOXICITY ASSESSMENT
Executive Summary
1.0 INTRODUCTIONThe environmental hazard classification associated with the transport of hazardous materials is specified in the Australian Dangerous Goods (ADG) code, International Maritime Dangerous Goods (IMDG) code and the United Nations (UN) Globally Harmonized System of Classification and Labelling of Chemicals (GHS) (UNECE, 2013). These classifications determine the risk management controls to support safe transport including transport, storage and packaging. The Department of Industry (DoI) requires a classification of uranium ore concentrates according to the accepted protocols. According to the Guide to Safe Transport of Uranium Oxide Concentrate (Transport Guide, CoA 2012), uranium oxides are currently classified as Dangerous Goods (DG) for transport (via road/rail and ship) under Classes 7 (radioactive) and 9 (aquatic toxicant; Chronic Category 4 1). There is a widely held belief that uranium products (UO4 and U3O8) are most probably insoluble and therefore do not present the risk attached to the current aquatic classification.
2.0 PURPOSEThe aim of this project was to clarify the DG Class 9 classification of the uranium products UO4 and U3O8 in accordance with ADG and IMDG Codes (excluding Class 7 which was beyond the scope of this project).
3.0 METHODOLOGYThe key criterion in the classification of metals and poorly soluble inorganic metal compounds is: whether the substance is sufficiently poorly soluble that solubility levels do not exceed the aquatic toxicity benchmarks (acute and/or chronic). The methodologies used in this project involved the following:
Literature review and aquatic toxicology assessment of uranium to derive benchmark toxicity concentrations in both fresh and marine waters. Classification as environmentally hazardous within the GHS is based on the aquatic toxicity of a
substance. This entails establishing an aquatic toxicity screening benchmark for uranium aquatic toxicity.
The aquatic toxicity of metals and sparingly soluble inorganic substances such as metal compounds and minerals depend on the bioavailable fraction (the dissolved free ion concentration in water).
Undertaking transformation/dissolution (T/D) testing of one sample of each of two uranium oxides (Sample 1, UO4 and Sample 2, U3O8) to assess the solubility of the concentrates in fresh and marine water. The GHS classification for such compounds is based on the estimated bioavailable fraction using a
transformation/dissolution (T/D) test to estimate the concentration of dissolved metal ions under standard conditions. This test ‘simulates’ the available metal concentration in the environment.
Use of the above findings for DG classification of the uranium oxides: UO4 and U3O8 in accordance with ADG and IMDG codes. The measured solubility from the T/D test is compared to the aquatic toxicity benchmarks to classify
environmental hazard in accordance with the GHS. Two approaches were used in the assessment of the aquatic toxicity of uranium products (UO4 and U3O8). These were:
An assessment of toxicity consistent with GHS guidance (i.e., to establish acute and chronic aquatic toxicity screening benchmarks for uranium); and
An assessment of aquatic toxicity using standard international statistical methods (species sensitivity distributions (SSDs).
1 The aquatic toxicity classification (Category 4) is a default safety net classification for use when the data available do not allow classification under the formal criteria. This Category 4 classification is based on the assumption that solubility of the product is below the acute (short-term) toxicity threshold and the substance is not readily degraded and or has the potential to bioaccumulate.
30 June 2014Report No. 147613036-002-R-Rev0
11

URANIUM PRODUCTS AQUATIC TOXICITY ASSESSMENT
SSDs are commonly used in establishing ambient water quality guidelines. The intent of performing two assessments of aquatic toxicity was to identify if the toxicity assessment that was performed following GHS guidance was supported, or if there was evidence to suggest that uranium products presented a different aquatic toxicity hazard relative to the GHS approach.
4.0 RESULTS AND CONCLUSIONThe GHS classification obtained on the basis of comparing product solubility to aquatic toxicity was that uranium products (UO4 and U3O8) remain classifiable as Class 9 Dangerous Goods (hazardous to the aquatic environment) under the IMDG and ADG codes, and GHS guidance. The applicable acute and chronic categories and descriptions are as follows:
Short-term (Acute): The uranium products tested (UO4 and U3O8) are classifiable as Category 1 acute aquatic toxicants which are considered very toxic to aquatic life.
Long-term (Chronic): The uranium products tested (UO4 and U3O8) are classifiable as Category 1 chronic aquatic toxicants which are considered very toxic to aquatic life with long lasting effects.
The Category 1 aquatic toxicity classifications for acute and chronic differ from the Chronic Category 4 classification presented in the Transport Guide (CoA 2012). This is because the T/D testing at 1 mg/L, 10 mg/L and 100 mg/L of uranium products in freshwater and marine water indicated that each product was soluble to some degree. Table E1 shows the results at 7 days and 28 days for the 1 mg/L loading and the results at 7 days for the 10 and 100 mg/L loadings in fresh and marine water for the two uranium products tested.
Table E1: Transformation / Dissolution Test Results for 1 mg U/L LoadingLoading Day Freshwater Marine waters
Loading Day UO4 mg U/L
UO4 % soluble
U3O8 mg U/L
U3O8 % soluble
UO4 mg U/L
UO4 % soluble
U3O8 mg U/L
U3O8 % soluble
1 mg/L 7 0.25 32 0.25 30 0.66 84 0.25 30
1 mg/L 28 0.20 26 0.52 62 0.7 90 0.57 67
10 mg/L 7 0.65 8 1.5 18 4.6 58 2.1 25
100 mg/L 7 3.6 5 9.0 11 11.7 15 10.3 12
The day 7 and day 28 solubilities were compared to the project-derived acute and chronic aquatic toxicity benchmarks, presented below:
Acute benchmark of 55 µg U/L (0.055 mg U/L).
Chronic benchmark of 25 µg U/L (0.025 mg U/L).
As the solubilities of both uranium products were higher than the acute and chronic benchmarks, the uranium products were classifiable as Category 1 acute and Category 1 chronic toxicants.
In the absence of marine aquatic toxicity data the environmental hazard classification for marine ecosystems is based on freshwater toxicity benchmarks (as per GHS A9.3.2.1). It is suggested that the classification for marine transportation is reviewed when a marine toxicity benchmark is derived.
Both uranium oxides tested exhibited higher solubility in marine water (compared with freshwater) at day 28 of the T/D testing. In general, the solubilities of the uranium oxides tested were found to increase with time until the respective limits of solubility were reached. UO4 was found to reach its solubility limit at a faster rate than U3O8 in both fresh and marine water. At day 28, U3O8 solubility was still increasing (in the 1 mg/L loading for both media). Should the test have continued beyond 28 days a greater soluble fraction than reported herein (62 % in freshwater and 67% in marine water) may have resulted.
The aquatic toxicology assessment concluded that the benchmarks derived in accordance with GHS guidance were generally consistent with the alternative SSD benchmarks generated in this report, and the
30 June 2014Report No. 147613036-002-R-Rev0
12

URANIUM PRODUCTS AQUATIC TOXICITY ASSESSMENT
SSD benchmarks prepared by others. In effect, the outcome of these two assessments was the same: uranium is acutely and chronically toxic to aquatic organisms.
The Category 4 classification in the Transport Guide (CoA 2012) appeared to be based on the assumption that uranium is insoluble. This is consistent with some of the published literature, where uranium oxides can be described as “insoluble”. This misconception is compounded by limited measured solubility data for uranium and the absence of guidance or definitions of solubility. The GHS guidance acknowledges the lack of an accepted definition of solubility and the challenges of using anecdotal (rather than measured) solubility information as follows: “…..for many metals or metal compounds, it is probable that the available information will be descriptive only, e.g. poorly soluble. Unfortunately there appears to be very little (consistent) guidance about the solubility ranges for such descriptive terms. Where these are the only information available it is probable that solubility data will need to be generated using the Transformation/Dissolution Protocol” (Annex 9, section A9.7.2.2.2, GHS 2013).
30 June 2014Report No. 147613036-002-R-Rev0
13

URANIUM PRODUCTS AQUATIC TOXICITY ASSESSMENT
Full Report
1.0 INTRODUCTIONThis report presents the environmental hazard classification (aquatic toxicity) for uranium products UO4 and U3O8 in accordance with Australian Dangerous Goods (ADG) and International Maritime Dangerous Goods (IMDG) codes.
This report has been prepared by Golder Associates Pty Ltd (Golder) for the Department of Industry (hereafter referred to as the DoI) according to Golders’ proposal (P47613016-001-P-Rev0 dated 26 February 2014) and the DoI’s contract (007960, Schedule 2).
This document has been reviewed by Dr Graeme Batley of Commonwealth Scientific and Industrial Research Organisation (CSIRO, refer Statement of Review in Error: Reference source not found).
1.1 BackgroundAccording to the Guide to Safe Transport of Uranium Oxide Concentrate (Transport Guide, CoA 2012), uranium oxides are currently classified as Dangerous Goods (DG) for transport (via road/rail and ship) under Classes 7 (radioactive) and 9 (aquatic toxicant; Chronic Category 42). Based on literature and anecdotal evidence, there is a widely held belief that uranium products (UO4 and U3O8) are most probably insoluble and therefore do not present the risk attached to the current aquatic classification. The classification determines the risk management controls to support safe transport including transport, storage and packaging. This project aimed to clarify the classification of uranium products UO4 and U3O8.
If uranium products are found not to be an aquatic toxicant, they could be re-classified according to GHS principles with regards to DG Class 9. If uranium products are aquatic toxicants, the current classification will remain underpinned by scientific data to support the classification.
The result is a more informed approach to the management of spills and accidents based on scientific knowledge. This should assist in communicating ‘actual’ risks associated with uranium mining and is consistent with the Australian Government “best practice” approach to uranium mining.
1.2 ObjectivesThe objective of the work was to determine the environmental hazard classification (aquatic toxicity) for uranium products UO4 and U3O8 in accordance with ADG and IMDG codes for transportation over land and sea, respectively. Figure 1 provides an overview of the project and classification process.
2 The aquatic toxicity classification (Category 4) is a default safety net classification for use when the data available do not allow classification under the formal criteria. This Category 4 classification is based on the assumption that solubility of the product is below the acute (short-term) toxicity threshold and the substance is not readily degraded and or has the potential to bioaccumulate.
30 June 2014Report No. 147613036-002-R-Rev0
14

URANIUM PRODUCTS AQUATIC TOXICITY ASSESSMENT
Figure 1: Project and Classification Overview
30 June 2014Report No. 147613036-002-R-Rev0
15

URANIUM PRODUCTS AQUATIC TOXICITY ASSESSMENT
Section 4.3
Section 4.4
Section 4.4
Section 5.0
Section 6.0
Section of this Report
30 June 2014Report No. 147613036-002-R-Rev0
16

URANIUM PRODUCTS AQUATIC TOXICITY ASSESSMENT
1.3 Scope of WorkThe scope of work was:
A literature review and aquatic toxicity assessment of uranium. Identification of aquatic toxicity benchmarks.
Transformation/ dissolution testing of two uranium oxides: UO4 and U3O8, using fresh and marine water in order to assess solubility to support the environmental hazard classification.
Dangerous goods classification of two uranium oxides: UO4 and U3O8 in accordance with ADG and IMDG codes.
MARPOL Classification for marine transport. MARPOL classification does not apply in relation to the transportation of uranium. MARPOL Classification has not been discussed further in this report.
2.0 URANIUM – BACKGROUND INFORMATIONUranium is a naturally occurring element that is ubiquitous throughout the natural environment, being found in soil, water, air, plants, animals and humans (Simon and Garnier-Laplace 2004; Barillett et al. 2007; Bourrachot et al. 2008). Natural concentrations of uranium in surface waters have been found to range from a few nanograms per litre to 6 µg/L. In areas affected by anthropogenic activities, including mining, agriculture, research and military use, concentrations of uranium in water have been reported up to 2 mg/L (Simon and Garnier-Laplace 2004; Bourrachot et al. 2008; Massarin et al. 2010).
Natural uranium poses relatively low radioactivity (CCME 2011). Uranium is a weak emitter of radiation (has a long half-life) and the alpha particles emitted by uranium have low penetrating power. Ionizing radiation from uranium is attenuated at approximately 50 µm in water or tissue (Bleise et al. 2003; Whicker and Schultz 1982a cited in CCME, 2011).
Uranium exists in the freshwater environment in a number of soluble forms including the free uranyl ion, UO2
2+, and in complexes with inorganic and organic ligands (Hogan et al. 2005). Uranium exists in four oxidation states with uranium (VI) predominating (as the uranyl ion) in oxic waters (CCME 2011).
CCME (2011) presents solubility in water for the following uranium compounds:
Elemental uranium, uranium IV dioxide, and uranium IV trioxide are described as ‘insoluble’; and
Uranyl sulfate trihydrate, uranyl nitrate hexahydrate (127 g/100 g H2O) and uranyl acetate dehydrate (7.7 g/100 mL at 15°C) are described as ‘soluble’.
Much of the published uranium literature indicates that uranium oxides are “insoluble”. This misconception is compounded by limited measured solubility data for uranium and the absence of guidance or definitions of solubility. The GHS guidance acknowledges the lack of an accepted definition of solubility and the challenges of using anecdotal (rather than measured) solubility information as follows: “…..for many metals or metal compounds, it is probable that the available information will be descriptive only, e.g. poorly soluble. Unfortunately there appears to be very little (consistent) guidance about the solubility ranges for such descriptive terms. Where these are the only information available it is probable that solubility data will need to be generated using the Transformation/Dissolution Protocol” (Annex 9, section A9.7.2.2.2, GHS 2013).
A limited literature search on UO4 and U3O8 solubility identified two publications which investigated the solubility of these compounds in water. Gayer and Thompson (1958) investigated UO4 solubility and ionic reactions in weak acid/base solutions as well as conductivity water (water distilled from alkaline permanganate solution). UO4 was found to be soluble in conductivity water to 1.5 x 10⁻⁵ moles/ 1000 g H2O (or approximately 4.5 mg/L) as UO4 (Gayer and Thompson, 1958). Using the same methodology Gayer et al. (1964) found that U3O8 is soluble in conductivity water to 5.0 x 10⁻⁵ moles/ 1000 g H2O (or approximately 42 mg/L).
3.0 REGULATORY FRAMEWORKSThe following paragraphs briefly describe the regulatory frameworks applicable in Australia for environmental hazard classification of mineral ores for the purposes of safe transportation on land and on sea. Regulatory
30 June 2014Report No. 147613036-002-R-Rev0
17

URANIUM PRODUCTS AQUATIC TOXICITY ASSESSMENT
frameworks and codes applicable to solid bulk cargoes are not considered on the basis that the uranium concentrates considered in this report are transported in steel drums.
3.1 Global Harmonised SystemThe GHS was produced by international collaboration with the aim to provide guidance on hazard classification and labelling of chemicals to achieve consistency and harmonisation between jurisdictions for the safe use, transport and disposal of chemicals.Classification as environmentally hazardous within the GHS is based on the aquatic toxicity of a substance. The aquatic toxicity of metals and sparingly soluble inorganic substances such as metal compounds and minerals depend on the bioavailable fraction (the dissolved free ion concentration in water). The GHS classification rules for such compounds are based on the estimated bioavailable fraction using a transformation/dissolution (T/D) test to estimate the concentration of dissolved metal ions under standard conditions. This test ‘simulates’ the available metal concentration in the environment. This test was originally designed for use with freshwater. A saltwater equivalent was later developed.
3.2 Australian Dangerous Goods CodeThe 7th edition of the Australian Dangerous Goods Code (ADG7) adopts the GHS classification rules for classifying environmentally hazardous substances (UNECE 2009). A relatively new and significant addition to ADG7 was the introduction of classification criteria for Class 9 Environmentally Hazardous Substances (UN No 3077, UN No 3082). This formally requires manufacturers and importers to consider the Class 9 classification of their goods. The criteria presented within ADG7 are a highly summarised version of the criteria set out in the UN Manual of Tests and Criteria (UN 2008) which are aligned with the criteria presented within the GHS for Classifying Hazardous Substances (GHS 3rd revised edition UNECE 2009).
Environmentally hazardous substances meeting the descriptions of UN 3077 or UN 3082 are not subject to ADG7 when transported by road or rail in:
a) packaging;b) intermediate bulk containers (IBCs)3; orc) any other receptacle not exceeding 500 kg(L).
3.3 International Maritime Dangerous Goods CodeThe International Maritime Dangerous Goods Code (IMDG) has also introduced classification criteria for Class 9 Environmentally Hazardous Substances (EHS). Similarly to the ADG, the IMDG criteria are a brief summary of the criteria detailed in the GHS.
The Environmentally Hazardous Substance classification captures substances that are very toxic or toxic to aquatic organisms either over an acute or chronic duration.
4.0 AQUATIC TOXICITY ASSESSMENT4.1 OverviewThe objective of the aquatic toxicity assessment of the uranium products was two-fold:
To assess toxicity in accordance with GHS (this is presented in Section Error: Reference source not found); and
To assess toxicity based on benchmarks derived from species sensitivity distributions (SSDs) (as discussed in Section Error: Reference source not found).
Two aquatic toxicity assessments of uranium products were identified at the proposal stage with the potential for different outcomes. A different outcome to the GHS hazard classification was considered possible where studies identified in the literature review may not meet the criteria for use in the GHS classification, but may be used to assess aquatic toxicity of uranium based on the weight of evidence in the published literature.
3 Intermediate bulk containers (IBCs) are rigid or flexible portable packagings that have a capacity of not more than 3.0 m3 (3,000 litres).
30 June 2014Report No. 147613036-002-R-Rev0
18

URANIUM PRODUCTS AQUATIC TOXICITY ASSESSMENT
4.2 Literature Review – SourcesA literature review was undertaken of readily available published information on uranium aquatic toxicology. This involved primary and secondary sources, including the following sources:
Peer-reviewed scientific literature
Freely available ecotoxicological databases (e.g., ANZECC & ARMCANZ (2000) water quality guideline database for toxicants, USEPA ECOTOX database; ECETOC Aquatic Toxicity (EAT) database)
Published reviews on uranium aquatic toxicology and water quality guideline development by reputable authors or agencies (e.g., United States Environmental Protection Agency (USEPA), Canadian Council of Ministers of the Environment, the Dutch National Institute for Health and Environment (Rijksinstituut voor Volksgezondheid en Milieu, RIVM), the European Centre for Ecotoxicology and Toxicology of Chemicals (ECETOC)).
4.3 Available DataThe literature review identified acute and chronic studies for aquatic plants/ algae, invertebrates/crustacea, and fish as defined by the GHS. A summary of the data found during the preparation of this report is presented in the following paragraphs by receptor grouping (plants/algae, invertebrates and fish). The raw data and bibliography for the aquatic toxicity review are presented in Error: Reference source not found. A summary of the factors that can affect aquatic toxicity of uranium is provided in Error: Reference source not found.
4.3.1 Aquatic Plants/AlgaeOver 10 acute and chronic freshwater studies representing over five species of aquatic plant (macro and microalgae) were found during the preparation of this report. These data have been used to classify the environmental hazard of uranium products in freshwater in accordance with the GHS and the ADG code.
No studies of uranium effects on marine plants were found during the preparation of this report. Environmental hazard classification of uranium products in marine water in accordance with GHS and the IMDG code is not possible at this time.
4.3.2 Invertebrates/CrustaceaOver 15 acute and chronic freshwater studies representing over 10 species of invertebrates were found during the preparation of this report. These data have been used to classify the environmental hazard of uranium products in freshwater in accordance with the GHS and the ADG code.
The available data indicate that invertebrates are the most sensitive receptor group out of aquatic plants, invertebrates and fish.
Only one study of uranium effects to a marine invertebrate was found during the preparation of this report, but the data were incomplete and inadequate. This is considered to be insufficient to support the environmental hazard classification of uranium products in marine water in accordance with GHS and the IMDG code.
4.3.3 FishOver 15 acute and chronic studies representing over 10 species of freshwater fish were found during the preparation of this report. These data have been used to classify the environmental hazard of uranium products in freshwater in accordance with the GHS and the ADG code.
No studies of uranium effects on marine fish were found.
4.4 Assessment of Uranium Toxicity in Accordance with the GHSThis section presents the approach for deriving the acute and chronic benchmarks for uranium products UO4
and U3O8.
In section GHS Annex 9 (section A9.2.3.7), it is stated: It is not possible to test all species present in an aquatic ecosystem. Representative species are therefore chosen which cover a range of trophic levels and
30 June 2014Report No. 147613036-002-R-Rev0
19
URANIUM PRODUCTS AQUATIC TOXICITY ASSESSMENT
taxonomic groupings. The taxa chosen, fish, crustacean and aquatic plants that represent the “base-set” in most hazard profiles, represent a minimum data-set for a fully valid description of hazard. The lowest of the available toxicity values will normally be used to define the hazard category.
Toxicity data was therefore collated and assessed for suitability according to GHS Annex 9 for acute and chronic endpoints as follows:
Acute toxicity data for fish 96-hour LC50 (OECD Test Guideline 203 or equivalent), a crustacean species 48-hour EC50 (OECD Test Guideline 202 or equivalent) and/or an algal species 72- or 96-hour EC50 (OECD Test Guideline 201 or equivalent). These species are considered as surrogates for all aquatic organisms by the GHS.
Chronic toxicity data generated for fish according to the OECD Test Guidelines 210 (Fish Early Life Stage), 202 Part 2 or 211 (Daphnia Reproduction) and 201 (Algal Growth Inhibition). GHS indicates that NOECs or other equivalent L(E)Cx should be used. Data on other species (e.g. Lemna sp.) were also considered where the test methodology was found suitable.
The data collated (refer to APPENDIX B, Tables B1-B5) were screened for suitability according to taxonomic grouping, test endpoint and test method.
Freshwater aquatic toxicity studies that were considered suitable to support classification under the GHS and the ADG code were used to derive screening benchmarks (or reference concentrations) for
acute effects (endpoints of survival); and
chronic effects (endpoints of growth and reproduction).
No marine data were found during the preparation of this report. According to GHS Annex 9 (Section 9.3.2.1):
For classifying substances in the harmonized system, freshwater and marine species toxicity data can be considered as equivalent data. It should be noted that some types of substances, e.g. ionizable organic chemicals or organometallic substances may express different toxicities in freshwater and marine environments. Since the purpose of classification is to characterize hazard in the aquatic environment, the result showing the highest toxicity should be chosen. In the absence of marine aquatic toxicology data, the freshwater acute and chronic benchmarks were used to complete the classification (of environmental hazard) for uranium products in marine waters in accordance with the IMDG and the GHS.
Although the GHS guidance is specific in some respects (e.g., description of acceptability criteria for the use of acute and chronic aquatic toxicological test data4, test endpoints5 and receptor groups6), it does not provide detailed methodology for the screening of the aquatic toxicology data or for deriving aquatic toxicology benchmarks. The data gathering and processing, and the approach for deriving the toxicology benchmarks used in this project are summarised below.
4.4.1 Data Gathering and ProcessingThe aquatic toxicology data were processed as follows prior to derivation of the acute and chronic benchmarks. The following steps were performed:
1) Collate effect concentrations from the literature (presented in full in Error: Reference source not found).
A summary of the collated effects data obtained from the literature review are provided in Table 1.
4 Tests should be performed consistent with Organisation for Economic Co-operation and Development (OECD) Test Guidelines or equivalent.5 Acute tests include:72-h or 96-h algae/plant EC50; 48-h crustacean/invert LC50; 96-h fish LC50. Chronic tests include NOECs or ECx: algal growth inhibition; Daphnia reproduction; fish early life stage (Section 4.1.1.3 and 4.1.1.4, Chapter 4.1 Hazards to the Aquatic Environment, Part 4 Environmental Hazards, GHS 2009).6 Algae (plants), crustacean (invertebrates) and fish.
30 June 2014Report No. 147613036-002-R-Rev0
20

URANIUM PRODUCTS AQUATIC TOXICITY ASSESSMENT
Table 1: Summary of Literature Review ResultsAll Data No. of results
Publications reviewed/considered 32
Number of taxonomic groups covered by toxicity data identified in literature
6 (fish, invertebrates, algae, macrophytes, eukaryote, gastropods)
Number of species identified 47Number of total data points (all endpoints) 327
2) Normalise effect concentrations – converted to total uranium (µg U/L).
Where uranium was measured or reported as uranium compound (e.g., uranyl nitrate, uranium sulfate trihydrate rather than “effective uranium”), the data were converted to µg U/L for consistency7. Refer to Table B6 and Table B7 in Error: Reference source not found.
3) Division of data into:
acute (L(E)C50 lethality endpoints); and
chronic (EC10, NOEC growth and reproduction endpoints).
These toxicity endpoints are specified in GHS (2009, Annex 9, A9.2.4).
4) Group data by test endpoint (e.g., EC10) and species.
The acute and chronic effect concentrations were collated for statistical analysis.
Table 2: Summary of Acute and Chronic DataData After Screening Process Acute Chronic
Number of taxonomic groups 2 (fish, invertebrates)6 (fish, invertebrates, algae, macrophytes,
eukaryote, gastropods)Number of species 10 28Number of data points after screening process 68 41
5) Plot data (scatter graph: y axis = uranium concentration, x axis = species).
A summary of the processed data is provided in Figure 2 and Figure 3 for acute and chronic endpoints respectively.
7 It was noted that the uranium concentrations dataset was likely to contain a mix of ‘total’ uranium, filtered uranium and nominal results. The method of measurement of uranium concentration was not made clear in all instances.
30 June 2014Report No. 147613036-002-R-Rev0
21

URANIUM PRODUCTS AQUATIC TOXICITY ASSESSMENT
Figure 2: Acute Data Used to Derive Benchmark
Figure 3: Chronic Data Used to Derive Benchmark
6) Calculate geometric means of the aquatic toxicity data for each species (refer Error: Reference source not found for raw data). Geomeans were calculated where there was more than one data point for the same endpoint for an individual species. Based on the literature review, Ceriodaphnia dubia was the most sensitive receptor of those identified by GHS (refer to section Error: Reference source not found and Figure 2 and Figure 33 above)8. The dataset for Ceriodaphnia dubia was then assessed for test
8 Two species were identified in the chronic toxicity dataset with EC/IC10 concentrations similar to or less than those of C. dubia. These were the pulmonate snail (Amerianna cumingi) and the amphipod (Hyalella azteca). Data for the snail were not used to derive the chronic benchmark as this test organism is not identified by GHS. Data for the amphipod
30 June 2014Report No. 147613036-002-R-Rev0
22

URANIUM PRODUCTS AQUATIC TOXICITY ASSESSMENT
conditions which could impact toxicity or uranium availability (e.g., pH, water hardness and organic carbon content, where available). The acute and chronic benchmarks were calculated using the data for this sensitive receptor. A summary of the toxicity data and the derived benchmarks derived is provided in Error: Reference source not found.
Table 3: Aquatic Toxicity Benchmark Derivation
Sensitive receptorAcute Toxicity Data
LC(EC)50 (µg/L)
Chronic Toxicity DataEC10/ IC10
(µg/L)
Ceriodaphnia dubia (C. dubia) n = 11* n = 6**Ceriodaphnia dubia (C. dubia) 44 35Ceriodaphnia dubia (C. dubia) 44 33Ceriodaphnia dubia (C. dubia) 89 59Ceriodaphnia dubia (C. dubia) 60 22Ceriodaphnia dubia (C. dubia) 43 25Ceriodaphnia dubia (C. dubia) 390 7Ceriodaphnia dubia (C. dubia) 8 -Ceriodaphnia dubia (C. dubia) 76 -Ceriodaphnia dubia (C. dubia) 66 -Ceriodaphnia dubia (C. dubia) 47 -Ceriodaphnia dubia (C. dubia) 52 -Geometric Mean(Aquatic Toxicity Benchmarks) 56 25
*No data points omitted from geomean calculation**1 data point omitted from geomean calculation (1,900 µg/L considered an outlier)
4.4.2 Aquatic Toxicity BenchmarksThe GHS guidance discusses use of lowest effect concentrations or a weight of evidence in deriving aquatic toxicity benchmarks but falls short of providing explicit guidance.
Following review of the scatter plot of effects concentrations (grouped by species) and calculated geomeans (grouped by species), the acute and chronic geomeans for the most sensitive species with sufficient data (n≥3) were adopted as the toxicity benchmarks. These are as follows:
Acute benchmark of 55 µg U/L9 (geomean of LC(EC)50 for Ceriodaphnia dubia, n=1110).
Chronic benchmark of 25 µg U/L (geomean of EC(IC)10 for Ceriodaphnia dubia, n=611).
An alternative approach to the assessment of the aquatic toxicity data and the derivation of aquatic toxicity benchmarks for uranium was performed for comparison with the benchmarks above, and to evaluate the appropriateness of the derived benchmarks relative to those derived using a more robust method. The alternative assessment is presented in Error: Reference source not found.
4.5 Data GapsThe aquatic toxicology review found there were insufficient acute and chronic marine data available to classify the environmental hazard of uranium products for marine environments, i.e., in accordance with IMDG.
were not used as only a single datapoint was available.9 Rounded, the calculated geomean = 56 µg U/L.10 Effect concentrations ranged from 8 µg U/L – 390 µg U/L 11 Effect concentrations ranged from 7 µg U/L – 59 µg U/L. One effect concentration (1,900 µg U/L from Liber et al. 2007) was excluded from the data set because it was considered likely to be an outlier although the primary study was not available for review at time of preparation of this report. This rationale for excluding this data point was that the reported effect concentration was inconsistent with, and two orders of magnitude above, other effect concentrations for C. dubia. Inclusion of the 1,900 µg U/L data point resulted in a geomean of 46 µg U/L which is greater than all but one of the chronic effect concentrations for this species.
30 June 2014Report No. 147613036-002-R-Rev0
23

URANIUM PRODUCTS AQUATIC TOXICITY ASSESSMENT
A technical memorandum has been provided summarising the aquatic toxicity data and gaps in these data following the literature review (Error: Reference source not found12). The memorandum presented recommendations for marine ecotoxicological testing to fill gaps in the data that may be required to support the environmental hazard classification (aquatic toxicity) for the uranium products UO4 and U3O8 in accordance with the IMDG code.
Marine ecotoxicicity tests are recommended in order to complete the environmental hazard classification under the IMDG code. In the absence of marine ecotoxicity data to derive an aquatic toxicology benchmark, the freshwater benchmark has been used to prepare an interim environmental hazard classification of uranium products under the IMDG code. This is presented in Section Error: Reference source not found.
In addition to the recommendation for marine testing, Error: Reference source not found presents summary information on the radiological effects of uranium found during the preparation of this report. This information indicates that the risks from uranium’s chemical toxicity to the aquatic environment are generally greater than those from uranium’s radiological toxicity (Mathews et al. 2009; CCME 2011). In effect, a chemistry-based uranium toxicity benchmark that protects aquatic ecosystems is generally also protective of uranium’s radioactive hazards (Mathews et al. 2009).
4.6 Bioaccumulation PotentialTwo bioaccumulation studies of uranium were found. One 28-day bioaccumulation study in a freshwater fish, and one study of dietary uptake of uranium in a marine crab and marine winkle. CCME (2011) indicate that there is some evidence that uranium can bioaccumulaute in lower trophic levels, however the CCME (2011) water quality guideline for uranium does not take bioaccumulation into account. Similarly, ANZECC and ARMCANZ (2000) do not identify uranium as a bioaccumulative substance. Therefore, based on CCME (2011) and ANZECC and ARMCANZ (2000), uranium was not considered bioacummulative for the purposes of the DG Class 9 classification.
5.0 TRANSFORMATION/DISSOLUTION TESTING5.1 BackgroundAn environmental hazard classification is typically based on the aquatic toxicity of a substance. The aquatic toxicity of metals and sparingly soluble inorganic substances such as metal compounds and minerals depends on the bioavailable fraction. This roughly equates to the transformed or dissolved free ion concentration in water. The GHS provides guidance and procedures for such compounds.
A standard test method to measure transformation or dissolution of poorly soluble metal and inorganic metal compounds was published by the OECD in 2001 and adopted by the GHS. The test method is commonly referred to as the transformation/dissolution (T/D) test. It is a new and evolving method, thus there are many aspects of both conducting the test and interpreting the results that require careful consideration.
Two samples of processed uranium were supplied to the analytical laboratory (HRL Technology Pty Ltd; HRL) for T/D testing as described below:
Sample 1 - UO4 (uranium peroxide); and
Sample 2 – U3O8 (triuranium octoxide).
The environmental hazard classifications in accordance with the GHS under the ADG and IMDG codes are presented in Section Error: Reference source not found. These classifications were based on the solubilities generated using the 1 mg/L,10 mg/L and 100 mg/L loadings in the freshwater and marine water T/D tests compared to the acute and chronic benchmarks derived in Section Error: Reference source not found.
5.2 Particle Size DistributionA particle size distribution test was carried out on UO4 and U3O8 using a Laser Particle Size Analyser (Malvern Mastersizer 2000, Malvern Instruments Ltd, Enigma Business Park, Grovewood Road, Malvern, WR14 1XZ, United Kingdom) over the range 0.02μm to 2000μm (HRL 2014a,b). 12 Excluding Attachments A and B.
30 June 2014Report No. 147613036-002-R-Rev0
24

URANIUM PRODUCTS AQUATIC TOXICITY ASSESSMENT
The particle size distributions for UO4 and U3O8 are provided in .
30 June 2014Report No. 147613036-002-R-Rev0
25

URANIUM PRODUCTS AQUATIC TOXICITY ASSESSMENT
Table 4: Particle Size Distribution of UO4 and U3O8
Size (µm)UO4
Volume under size (% w/w)
U3O8
Volume under size (% w/w)
100 100 100
50 99 100
25 91 80
10 65 31
5 41 13
1 4.8 0.2
0.5 1.2 0
0.1 0 0
Volume-weighted Mean Particle Size 10.2 µm 16.5 µm
Particle size is an important consideration in the environmental and human exposure to uranium. The larger the particle size, the less likely that the particle will be mobile in the environment. In air, large particles are more likely to settle near the point of release and in water bodies, larger particles (>0.1 µm) are less likely to remain in the water column as suspended particles.
The particle size may also have an impact on the rate of dissolution as the surface area to water ratio decreases with increasing particle size. According to the GHS (Section A9.7.5.4), the batch/product (for metal compounds and dusts) with smallest representative particle size should be used for T/D testing and subsequent classification. If the particle sizes differ significantly (between mines/ suppliers) a separate classification for that product can be undertaken if the solubility results in a different hazard classification.
5.3 Elemental CompositionThe elemental composition of the uranium products were assessed using a SPECTRO ARCOS End-On-Plasma (axially viewed) Inductively Coupled Plasma Optical Emission Spectrometer (ICP-OES) (SPECTRO Analytical Instruments GmbH, Boschstraße 10, 47533, Kleve, Germany) following acid digestion in a closed vessel system. Compositional results are presented in Table 5 below.
Table 5: Composition of UO4 and U3O8 blank HRL Sample No: CMM / 14 / 0453-01
(HRL, 2014a)HRL Sample No: CMM / 0453-02
(HRL, 2014b)
Sample ID/units UO4 % w/w UO4 mg/kg U3O8 % w/w U3O8 mg/kg
Moisture as received (%) 0.301 - 0.093 -
Total Uranium as U 68 680000 82.29 823000
Uranium expressed as U3O8 80.2 802000 97.04 970000
Uranium expressed as UO4∙2H2O
96.6 966000 - -
Silver (Ag) < 0.0008 <8 0.002 20
Aluminium (Al) 0.071 710 0.003 30
Arsenic (As) 0.012 120 < 0.001 <10
Boron (B) < 0.015 <150 < 0.015 <150
Barium (Ba) < 0.0002 <2 < 0.0002 <2
Beryllium (Be) 0.0001 1 0.0001 1
Calcium (Ca) 0.025 250 0.002 20
30 June 2014Report No. 147613036-002-R-Rev0
26

URANIUM PRODUCTS AQUATIC TOXICITY ASSESSMENT
blank HRL Sample No: CMM / 14 / 0453-01 (HRL, 2014a)
HRL Sample No: CMM / 0453-02 (HRL, 2014b)
Sample ID/units UO4 % w/w UO4 mg/kg U3O8 % w/w U3O8 mg/kg
Cadmium (Cd) < 0.0002 <2 0.003 30
Cobalt (Co) < 0.0015 <15 < 0.0015 <15
Chromium (Cr) 0.001 10 < 0.001 <10
Copper (Cu) < 0.005 <50 0.011 110
Iron (Fe) 0.878 8780 0.001 10
Potassium (K) 0.006 60 0.003 30
Magnesium (Mg) 0.004 40 0.001 10
Manganese (Mn) < 0.001 <10 < 0.001 <10
Molybdenum (Mo) 0.002 20 0.014 140
Sodium (Na) 0.277 2770 0.07 700
Niobium (Nb) < 0.005 <50 < 0.005 <50
Nickel (Ni) < 0.002 <20 < 0.002 <20
Phosphorus (P) 0.011 110 < 0.002 <20
Lead (Pb) < 0.004 <40 < 0.004 <40
Sulfur (S) < 0.010 <100 < 0.010 <100
Antimony (Sb) < 0.010 <100 < 0.010 <100
Selenium (Se) 0.015 150 < 0.015 <150
Silicon (Si) 0.01 100 < 0.010 <100
Tin (Sn) 0.002 20 < 0.002 <20
Strontium (Sr) 0.0004 4 < 0.0002 <2
Thorium (Th) 0.025 250 < 0.025 <250
Titanium (Ti) 0.002 20 < 0.001 <10
Thallium (Tl) 0.004 40 < 0.004 <40
Vanadium (V) 0.008 80 < 0.008 <80
Zinc (Zn) 0.01 100 < 0.010 <100
Zirconium (Zr) 0.016 160 0.056 560
5.4 Freshwater SolubilityFull (28-day) T/D tests were performed for UO4 and U3O8 in freshwater by HRL in accordance with OECD Environment publication “Annex 10 guidance on T/D of metals and metal compounds in aqueous media”.
In the 28-day dissolution test, the reconstituted fresh water was made (in accordance with ISO 6341:2012) using Analytical Grade Reagents as follows:
NaHCO3 65.7 mg/L
KCl 5.75 mg/L
CaCl∙2H2O 294 mg/L
MgSO4∙7H2O 123 mg/L
The water was sterilised by filtration, using a 0.22 μm filter, and used to prepare stock aqueous solutions of the test substances (UO4 and U3O8) at concentrations of 1 mg/L, 10 mg/L, and 100 mg/L. pH was maintained
30 June 2014Report No. 147613036-002-R-Rev0
27

URANIUM PRODUCTS AQUATIC TOXICITY ASSESSMENT
between 6 and 8.5. The pH and dissolved oxygen (DO) were monitored throughout the experiment at each collection time point using a pH electrode and dissolved oxygen probe respectively (refer to Error: Referencesource not foundError: Reference source not found). The stock solution was then separated into three test vessels (triplicates) which were covered and continuously agitated in a tumbler (100 revolutions per minute, rpm) for the duration of the experiment. The solutions were covered to protect from light and the room temperature was kept constant at 21.5 ± 0.5 °C. Sampling occurred at the following times: 2 h, 6 h, 24 h, 2 days, 4 days, 7 days, 10 days, 14 days, 21 days and 28 days. At each time point an aliquot of 10 mL was obtained (using syringe or pipette) which was filtered (through pre-washed Microscience Hydration filters, 0.45 μm). The aliquots were acidified with 1% v/v Ultrapure HNO3 and split into duplicate samples (i.e. a total of 6 samples per time point and loading rate; 18 samples for three loadings per time point). Samples were analysed for dissolved uranium using a SPECTRO ARCOS End-On-Plasma (axially viewed) Inductively Coupled Plasma Optical Emission Spectrometer (ICP-OES) (SPECTRO Analytical Instruments GmbH, Boschstraße 10, 47533, Kleve, Germany).. The samples were presented to the ICP-OES via a Tyledyne CETAC ASX-520 Autosampler (also from SPECTRO Analytical Instruments GmbH).
The T/D samples were analysed in triplicate for each weight fraction with a duplicate sample taken from each bottle for determination of the metals; the average of each weight fraction has been reported. All solutions were analysed for copper, iron, nickel, lead, zinc, and uranium, and results are reported as mg/L (refer to Error: Reference source not found).
Reconstituted water samples (blanks) were analysed to measure background concentrations of uranium in the test medium. For instrument detection limits, calibration (initial and verification) and linearity range refer to Error: Reference source not found.
Table 6 and 4 below summarise the average dissolved uranium concentrations from UO4 and U3O8 samples at different time points. The laboratory test reports are attached in Error: Reference source not found (HRL 2014a, b).
Table 6: Summary of Freshwater T/D Results a, b, c, d
Loading Time (h) UO4 Average UO4 Standard Deviation U3O8 Average U3O8 Standard
Deviation
1 mg/L 2 0.096 0.013 0.076 0.006
1 mg/L 6 0.104 0.008 0.072 0.006
1 mg/L 24 0.116 0.010 0.101 0.019
1 mg/L 96 0.185 0.021 0.206 0.063
1 mg/L 168 0.252 0.040 0.254 0.094
1 mg/L 672 0.202 0.117 0.524 0.187
10 mg/L 2 0.507 0.122 0.410 0.028
10 mg/L 6 0.566 0.166 0.380 0.022
10 mg/L 24 0.448 0.049 0.565 0.023
10 mg/L 96 0.603 0.095 1.19 0.044
10 mg/L 168 0.650 0.039 1.49 0.033
100 mg/L 2 3.12 0.148 3.61 0.097
100 mg/L 6 6.84 0.975 3.19 0.037
100 mg/L 24 2.10 0.012 4.33 0.105
100 mg/L 96 4.48 1.37 7.76 0.134
100 mg/L 168 3.6 1.86 9.02 0.264a Freshwater samples reported at a limit of reporting (LOR) of 0.03 mg/L for UO4 and U3O8.b The freshwater experiments were conducted at a pH of 7.3- 8.1.c Only the GHS specified time points are summarised above; for all time points measured refer to Error: Reference source not found.
30 June 2014Report No. 147613036-002-R-Rev0
28
URANIUM PRODUCTS AQUATIC TOXICITY ASSESSMENT
d Uranium is measured as total soluble U in the dissolution solutions.
30 June 2014Report No. 147613036-002-R-Rev0
29

URANIUM PRODUCTS AQUATIC TOXICITY ASSESSMENT
Figure 4: Dissolution Data for UO4 in Freshwater a,b,c,d
a Polynomial trend lines were selected as these represented the best fit for the data. b In accordance with GHS, acute and chronic assessment, the trend lines for 100 mg/L and 10 mg/L loadings stop at 7 days (limit for acute data T/D reporting). The complete (chronic) reported data are plotted with time points >7 days represented with semi-transparent markers. The trend line for the 1 mg/L loading is drawn from the data set for the complete (chronic) duration of the test.c 100 mg/L loading data show greater variability compared to the lower loadings (1 and 10 mg/L). These data are reported close to the limit of solubility in freshwater. Gayer and Thompson (1958) reported the solubility of UO4 in water to reach equilibrium at 1.5x10⁻⁵ moles UO4/ 1000 g water (or approximately 4.5 mg/L).d Only the GHS specified time points are summarised above; for all time points measured refer to Error: Reference source not found.
30 June 2014Report No. 147613036-002-R-Rev0
30

URANIUM PRODUCTS AQUATIC TOXICITY ASSESSMENT
Figure 5: Dissolution Data for U3O8 in Freshwater a,b,c
a Polynomial trend lines were selected as these represented the best fit for the data.b In accordance with GHS acute and chronic assessment, the trend lines for 100 mg/L and 10 mg/L loadings stop at 7 days (limit for acute data T/D reporting). The complete (chronic) reported data are plotted with time points >7 days represented with semi-transparent markers. The trend line for the 1 mg/L loading is drawn from the data set for the complete (chronic) duration of the test.
c Only the GHS specified time points are summarised above; for all time points measured refer to Error: Reference source not found
Table 6Figure 45 were derived by averaging the results received for each time point (for each analyte; i.e. 6 results per time point).
The T/D data for both uranium samples are best fitted with polynomial trend lines. Other curve fitting models were tested (in Microsoft Excel™) but had decreased calculated correlations.
Additional time points were reported for both samples (refer to Error: Reference source not foundError: Reference source not found). These are not reported in this section as they do not influence the classification. The additional time points were collected to assist with curve fitting.
UO4 solubility13 (in freshwater) on average ranged from:
0.1 to 0.25 mg/L for the 1 mg/L loading:
0.5 to 0.65 mg/L for the 10 mg/L loading; and
2.1 to 6.8 mg/L for the 100 mg/L loading.
The 100 mg/L loading data showed greater variability when compared to the lower loadings (1 and 10 mg/L). This may be due to the data being close to the limit of solubility in freshwater. Gayer and Thompson (1958) reported the solubility of UO4 in water to reach equilibrium at 1.5x10⁻⁵ moles UO4/L (approximately 4.5 mg/L).
In general, the solubility for UO4 in freshwater increases with time until changes in the conditions (e.g., aging, oxidation, etc.) cause the uranium to fall out of solution.
13 Solubility was estimated by converting the uranium oxide to percent uranium in 1 mg and then multiplying by the reported solubility at each time point. For example: U in UO4 account for 78.8% of the molecular weight. Therefore in 1 mg of UO4, there is 0.788 mg of U. Solubility at 7 days for 1 mg/L loading was 0.252 mg/L. Therefore 0.252 mg/L x 100 / 0.788 mg/L = 32%.
30 June 2014Report No. 147613036-002-R-Rev0
31

URANIUM PRODUCTS AQUATIC TOXICITY ASSESSMENT
After 7-days, UO4 solubility in freshwater, for the 1 mg/L loading, reached approximately 32% (of total UO4
added). By 28-days UO4 solubility for the 1 mg/L loading had decreased to approximately 26% (of total UO4
added) (Table 7).
U3O8 solubility (in freshwater) on average ranged from:
0.076 to 0.52 mg/L for the 1 mg/L loading:
0.38 to 1.49 mg/L for the 10 mg/L loading; and
3.2 to 9.02 mg/L for the 100 mg/L loading.
In general, the solubility for U3O8 in freshwater increases with time and begins to plateau at the 28-day time point.
After 7-days, U3O8 solubility in freshwater, for the 1 mg/L loading, reached approximately 30% (of total U3O8
added). After 28-days, the solubility of U3O8 in freshwater for the 1 mg/L loading was approximately 62% (of total added U3O8) (Table 7).
Table 7: Uranium Products Solubility (%) in Freshwater (at 7 and 28 days)Loading Day UO4 mg U/L UO4 % soluble U3O8 mg U/L U3O8 % soluble
1 mg/L 7 0.25 32 0.25 301 mg/L 28 0.20 26 0.52 6210 mg 7 0.65 8 1.5 18100 mg/L 7 3.6 5 9.0 11
The overall trend observed with U3O8 solubility in freshwater differs slightly from that of UO4 due to differences in solubility limits for the two different oxides and the kinetics for the hydrolysis reactions.
5.5 Marine SolubilityIn addition to the T/D testing in freshwater, a 28-day T/D test in standard marine water was performed in accordance with GHS in order to inform a DG classification under the IMDG code. The 28-day test in marine solution was conducted as per the OECD protocol and similar to the method described in Section Error: Reference source not found. The marine test solution was made up from analytical grade reagents as follows:
NaF 3 mg/L
SrCl2∙6H2O 20 mg/L
H3BO3 30 mg/L
KBr 100 mg/L
KCl 700 mg/L
CaCl2∙2H2O 1.47 g/L
Na2SO4 4.0 g/L
MgCl2∙6H2O 10.78 g/L
NaCl 23.5 g/L
Na2SiO3∙9H2O 20 mg/L
NaHCO3 200 mg/L
30 June 2014Report No. 147613036-002-R-Rev0
32

URANIUM PRODUCTS AQUATIC TOXICITY ASSESSMENT
The marine test solution was made up to a pH of 8.0 to reflect the pH of seawater. Marine test solutions were set up at the standard loading (UO4 and U3O8 concentrations of 1, 10 and 100 mg/L), agitated, sampled and analysed similar to the freshwater samples (refer to Error: Reference source not found for full description of laboratory methods).
Table 8, Figure 66 and 7 summarise the average dissolved uranium concentrations from UO4 and U3O8 at different time points in marine water. The laboratory test reports are attached in Error: Reference source not foundError: Reference source not found (HRL 2014a, b).
Table 8: Summary of Marine Water T/D Resultsa b, c, d, e
Loading Time (h) UO4 Average UO4 Standard Deviation U3O8 Average U3O8 Standard
Deviation
1 mg/L 2 0.411 0.011 0.050 a 0.000
1 mg/L 6 0.481 0.010 0.050 a 0.000
1 mg/L 24 0.641 0.024 0.050 a 0.000
1 mg/L 96 0.777 0.021 0.174 0.026
1 mg/L 168 0.661 0.016 0.252 0.040
1 mg/L 672 0.713 0.069 0.568 0.099
10 mg/L 2 2.12 0.105 0.419 0.031
10 mg/L 6 2.44 0.092 0.424 0.031
10 mg/L 24 3.45 0.127 0.618 0.028
10 mg/L 96 4.58 0.076 1.58 0.071
10 mg/L 168 4.59 0.184 2.11 0.072
100 mg/L 2 6.91 0.221 3.68 0.188
100 mg/L 6 7.19 0.147 3.58 0.128
100 mg/L 24 8.84 0.422 4.71 0.085
100 mg/L 96 10.9 0.520 9.01 0.329
100 mg/L 168 11.7 0.773 10.3 0.142a Samples reported as <0.1 mg/L are below the limit of reporting (LOR). Average concentrations were calculated using 1/2 x LOR (i.e. 0.05 mg/L) (GHS Section A9.3.5.6.2; US EPA 2014).b Approximately 13% of UO4 (in the 1 mg/L loading <96h) and 13% of U3O8 samples were below LOR (0.1 mg/L) in the reported dataset.c The marine tests were conducted at a pH ranging from 7.6 - 8.1.d Only the GHS-specified time points are summarised above; for all time points measured refer to Error: Reference source not found.e Uranium is reported as elemental U from dissolution solutions.
30 June 2014Report No. 147613036-002-R-Rev0
33

URANIUM PRODUCTS AQUATIC TOXICITY ASSESSMENT
Figure 6: Dissolution Data for UO4 in Marine Water a,b,c,d
a Polynomial trend lines were found to be the best fit for the dissolution data. b In accordance with GHS acute and chronic assessment, the trend lines for 100 mg/L and 10 mg/L loadings stop at 7 days (limit for acute data T/D reporting). The complete (chronic) reported data are plotted with time points >7 days represented with semi-transparent markers. The trend line for the 1 mg/L loading is drawn from the data set for the complete (chronic) duration of the test.d Only the GHS specified time points are summarised above; for all time points measured refer to Error: Reference source not found
30 June 2014Report No. 147613036-002-R-Rev0
34

URANIUM PRODUCTS AQUATIC TOXICITY ASSESSMENT
Figure 7: Dissolution Data for U3O8 in Marine Water a,b,c,d
a Polynomial trend lines were found to be the best fit for the dissolution data. b In accordance with GHS acute and chronic assessment, the trend lines for 100 mg/L and 10 mg/L loadings stop at 7 days (limit for acute data T/D reporting). The complete (chronic) reported data are plotted with time points >7 days represented with semi-transparent markers. The trend line for the 1 mg/L loading is drawn from the data set for the complete (chronic) duration of the test.c 1 mg/L loading is below LOR (0.1 mg/L) at the early time points (up to 24 h).d Only the GHS specified time points are summarised above; for all time points measured refer to Error: Reference source not found.
The T/D data presented in Table 8, Figure 66 and 7 were derived by averaging the results received for each time point (for each analyte).
The T/D data for both uranium samples were best fitted with polynomial trend lines. Other curve fitting models were tested (in Microsoft Excel™) but had decreased calculated correlations.
Additional time points were reported for both samples (refer to Error: Reference source not found); these were not reported in this section as they did not influence the classification. The additional time points were collected to assist with curve fitting.
UO4 solubility in marine water on average ranged from:
0.4 mg/L to 0.7 mg/L for the 1 mg/L loading:
2.1 to 4.6 mg/L for the 10 mg/L loading; and
6.9 to 11.7 mg/L for the 100 mg/L loading.
UO4 (at all loading rates) was found to plateau rapidly (by 100-h time point) as it approached its solubility limit and then decreased marginally at the last two time points.
At 28-days, the solubility of UO4 in marine water, for the 1 mg/L loading, was approximately 90% (of total UO4 added) (Table 9).
U3O8 solubility in marine water on average ranged from:
<LOR (0.1 mg/L) to 0.57 mg/L for the 1 mg/L loading:
30 June 2014Report No. 147613036-002-R-Rev0
35

URANIUM PRODUCTS AQUATIC TOXICITY ASSESSMENT
0.4 to 2.1 mg/L for the 10 mg/L loading; and
3.6 to 10.3 mg/L for the 100 mg/L loading.
The T/D results for the 1 mg/L loading of for U3O8 at early time points were below LOR (0.1 mg/L). Results reported below LOR were treated as ½ LOR (as per GHS Section A9.3.5.6.2; US EPA 2014) for statistical purposes. As a result, time points 2 h to 24 h had calculated average concentrations of 0.5 mg/L. At 28-days, solubility of U3O8 in marine water, for the 1 mg/L loading, was approximately 67% (of total added U3O8) (Table 9).
Table 9: Uranium Oxide Solubility (%) in Marine water (at 7- and 28-days)Loading Day UO4 mg U/L UO4 % soluble U3O8 mg U/L U3O8 % soluble
1 mg/L 7 0.66 84 0.25 301 mg/L 28 0.7 90 0.57 6710 mg 7 4.6 58 2.1 25100 mg/L 7 11.7 15 10.3 12
In general, the solubilities of the uranium oxides tested were found to increase with time until the respective limits of solubility were reached. UO4 was found to reach its solubility limit at a faster rate than U3O8 in both fresh- and marine water. At day 28, U3O8 solubility was still increasing (in the 1 mg/L loading for both media) and may have reached a greater soluble fraction than reported in this report (62 % in freshwater and 67% in marine water) if the test period had been prolonged.
No published data on the solubility of uranium oxides in marine water were identified, but the results were in accordance with increased solubility (of sparingly soluble metals) in saline solutions. This may be due to the formation of uranium complexes and redox reactions, with the salts in seawater, which increases mineral solubility (Millero 2001).
Additional elements were also reported (refer to Error: Reference source not foundError: Reference source not found) as part of the T/D testing. These elements have not been summarised in this section due to the high solubility of uranium. The additional elements were reported for consideration of additive toxicity (in accordance with GHS), should this have been required.
The solubility of the uranium oxides tested (UO4 and U3O8), is generally consistent with the findings of Gayer and Thompson (1958) and Gayer et al. (1964). Gayer and Thompson (1958) found that UO4 was soluble in conductivity water to approximately 4.5 mg UO4/L and that U3O8 was soluble in conductivity water to approximately 42 mg U3O8/L (Gayer et al. 1964). These findings differ from the general literature on uranium oxides and the assumptions made in the Guide to Safe Transport of Uranium Oxide Concentrate (CoA 2012).
5.6 Quality Assurance / Quality ControlThe limits of reporting (LOR) for each dissolution test were:
Freshwater (reconstituted standard water): 0.03 mg/L (30 µg/L); and
Marine water (standard marine medium): 0.1 mg/L (100 µg/L).
Uranium in marine water has a higher LOR due to matrix interferences; the high salt concentration results in a reduced plasma response for uranium during the ICP-OES analysis.
Internal laboratory quality controls were processed throughout the studies (for both freshwater and marine water samples) to ensure validity of results. Calibration verification samples were analysed accordingly:
Initial calibration verification; and
Continuing calibration verification.
30 June 2014Report No. 147613036-002-R-Rev0
36

URANIUM PRODUCTS AQUATIC TOXICITY ASSESSMENT
All uranium calibration verification samples were within the acceptable limits of variability for both freshwater and marine water samples (refer to Error: Reference source not found).
6.0 CLASSIFICATION OF URANIUM PRODUCTS6.1 GHS ClassificationThe key criterion in the classification of metals and poorly soluble inorganic metal compounds is whether the substance is sufficiently poorly soluble that the levels dissolved during the T/D testing do not exceed the aquatic toxicity benchmarks (acute and/or chronic).
The results of the T/D tests were assessed in the following manner (see also Error: Reference source not found and Error: Reference source not found):
Acute and Chronic Category 1:
Acute Category 1 applies if, after a 7-day T/D test, the soluble concentration of uranium in the 1 mg/L loading is greater than or equal to the acute aquatic toxicity benchmark.
Chronic Category 1 applies unless there is evidence of rapid partitioning and no bioaccumulation. Observations of rapid partitioning can be made from a T/D test. If there is an initial soluble fraction of uranium that is rapidly reversed (cleared) and the substance is not categorised by a regulatory as a bioaccumulative substance then Chronic Category 1 does not apply.
Acute and Chronic Category 2:
Acute Category 2 apples if after a 7-day dissolution test the soluble concentration of uranium from the 10 mg/L loading exceeds the acute aquatic toxicity benchmark (but the 1 mg/L loading does not exceed the acute benchmark).
Chronic Category 2 classification applies if the 1 mg/L loading in the T/D test after 28 days does not exceed the chronic aquatic toxicity benchmark.
Acute and Chronic Category 3:
Acute Category 3 applies if after 7days dissolution the soluble concentration of uranium from the 100 mg/L loading exceeds acute aquatic toxicity benchmark (but 10 mg/L loading does not exceed the acute aquatic toxicity benchmark).
Chronic Category 3 classification applies if the 1 mg/L loading in the T/D test after 28 days does not exceed chronic aquatic toxicity benchmark.
Category 4: This category is a safety-net classification adopted when the acute aquatic toxicity benchmark is above the available T/D data (i.e., no evidence of acute hazards), but there are no chronic aquatic toxicity testing data to establish a chronic aquatic toxicity benchmark.
Not Classifiable: The soluble concentration in the 100 mg/L loading of the T/D test is below the acute aquatic toxicity benchmark (LC(EC)50) then it is not an environmentally hazardous substance (aquatic).
30 June 2014Report No. 147613036-002-R-Rev0
37
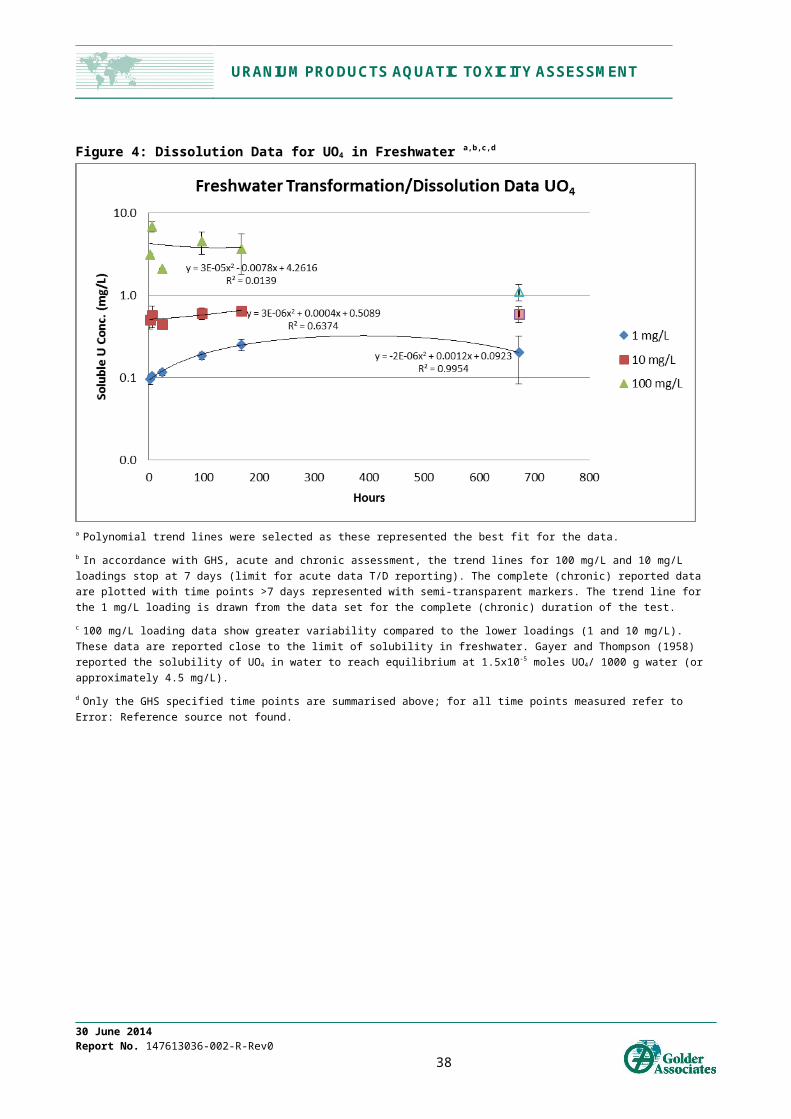
URANIUM PRODUCTS AQUATIC TOXICITY ASSESSMENT
summarises the solubility (T/D) data with regard to the aquatic toxicity benchmarks for the lowest loading (1 mg/L) (i.e. the basis of the Category 1 classification).
30 June 2014Report No. 147613036-002-R-Rev0
38

URANIUM PRODUCTS AQUATIC TOXICITY ASSESSMENT
Table 10: Summary of T/D Data Against Aquatic Toxicity BenchmarksLoadin
g Time Freshwater Dissolution Results Marine Water Dissolution Results
Loading
Time UO4 (Average mg/L)
U3O8 (Average mg/L)
UO4 (Average mg/L)
U3O8 (Average mg/L)
1 mg/L 2 0.096 a 0.076 0.411 0.050 b
1 mg/L 6 0.104 0.072 0.481 0.050 b
1 mg/L 24 (1 d) 0.116 0.101 0.641 0.050 b
1 mg/L 96 (4 d) 0.185 0.206 0.777 0.174
1 mg/L 168 (7 d) 0.252 0.254 0.661 0.252
1 mg/L 672 (28 d) 0.202 0.524 0.713 0.568a Grey shading for time points exceeding both acute (55 µg U/L or 0.055 mg U/L) and chronic (25 µg U/L or 0.025 mg/L) aquatic toxicity benchmarks.b Samples reported as <0.1 mg/L are below the limit of reporting (LOR). Average concentrations were calculated using 1/2 x LOR (i.e. 0.05 mg/L).
Based on the results of the T/D testing, and the derived aquatic toxicity benchmarks, both UO4 and U3O8 classify under GHS as Acute and Chronic Category 1 substances, i.e., very toxic to aquatic life with long-lasting effects in both fresh and marine water.
Additive toxicity classification rules (from GHS) were not applied to the uranium products as the solubility of uranium alone resulted in the highest (Category 1) classification.
6.2 Class 9 Dangerous Goods ClassificationAccording to the Transport Guide (CoA 2012), uranium is currently classified under ADG and IMDG as both radioactive (Class 7) and an aquatic toxicant (Class 9). The classification enables appropriate management actions and controls to be identified to minimise short-term (acute) and long-term (chronic) environmental impacts to aquatic ecosystems should an accidental spill or release occur during transport.
The ADG (chapter 2.9, 2011) defines Class 9 as:
“substances and articles (miscellaneous dangerous substances and articles) are substances and articles which, during transport present a danger not covered by other classes.”
The aquatic toxicant (Class 9) designation is based on comparison of the T/D test results to the aquatic toxicity benchmarks. The classification of uranium products presented herein is based on the T/D test results for Sample 1 (UO4) and Sample 2 (U3O8) as presented in Error: Reference source not found and Error: Reference source not found and discussed below.
30 June 2014Report No. 147613036-002-R-Rev0
39

URANIUM PRODUCTS AQUATIC TOXICITY ASSESSMENT
Figure 8: UO4 Dangerous Goods Classification Overview
30 June 2014Report No. 147613036-002-R-Rev0
40

URANIUM PRODUCTS AQUATIC TOXICITY ASSESSMENT
Figure 9: U3O8 Hazard/ Dangerous Goods Classification Overview
30 June 2014Report No. 147613036-002-R-Rev0
41

URANIUM PRODUCTS AQUATIC TOXICITY ASSESSMENT
The ADG and IMDG codes are concerned with hazard classification of substances for transportation within Australia by road and rail, and internationally by sea.
The basic elements for classification of environmentally hazardous substances (aquatic environment) as Class 9 dangerous goods are:
acute aquatic toxicity;
potential for or actual bioaccumulation; degradation (biotic or abiotic) for organic chemicals; and
chronic aquatic toxicity.
Substances must be classified as “environmentally hazardous substances (aquatic environment)”, if they satisfy the criteria for Acute Category I, Chronic Category I or Chronic Category 2, according to GHS classification criteria.
Based on the data reviewed and collected for this report, both UO4 and U3O8 uranium products classify as Class 9 environmentally hazardous substances (aquatic environment) under the ADG and IMDG codes for the purpose of transport by road, rail and sea. The conclusions are based on the T/D studies conducted in freshwater and marine water and their hazardous classification based on GHS classification principles.
7.0 UNCERTAINTIESThe following uncertainties should be noted:
1) The environmental hazard classification for marine ecosystems has been prepared using freshwater acute and chronic aquatic toxicity benchmarks in the absence of marine aquatic toxicity data. It is recommended that the classification is reviewed when marine aquatic toxicity data become available.
2) The environmental hazard classifications presented herein are based on the uranium products tested under this project for UO4 (Sample 1) and U3O8 (Sample 2). The representativeness (or otherwise) of these samples for the uranium products is expected to vary spatially (from other mines) and temporally (processing batches).
3) Replicate T/D testing of the uranium products UO4 and U3O8 from different processing batches or mines may generate different solubilities to the results presented herein. However, the results were found to be similar to solubility data from the literature and it is considered unlikely that uranium from different processing batches or mines would result in a different environmental hazard classification for the uranium products.
4) There are a variety of approaches that may be justifiably used to derive toxicity benchmarks (e.g., the SSD approach described in Appendix B). The different approaches will result in different reference toxicity benchmarks. However, it is considered unlikely that the application of other standard approaches to toxicity benchmarks would result in a different environmental hazard classification of the uranium products (especially given that all the SSD-based toxicity benchmarks reviewed and derived in Appendix B were more conservative (lower) than those derived using the GHS approach).
5) The environmental hazard classifications presented are based on the results of T/D testing of the uranium products and review of the aquatic toxicology data available at time of preparation of this report.
8.0 CONCLUSIONSAccording to the Guide to Safe Transport of Uranium Oxide Concentrate (CoA 2012), uranium oxides are currently classified as Dangerous Goods (DG) for transport (via road/rail and ship) under Classes 7 (radioactive) and 9 (aquatic toxicant; Chronic Category 4. This report concludes that the current classification is inappropriate. Based on the information contained in this report, both uranium oxides tested (UO4 and U3O8) were considered very toxic to the aquatic environment with long lasting effects and should thus be classified as DG Class 9; Acute Category 1 and Chronic Category 1.
30 June 2014Report No. 147613036-002-R-Rev0
42

URANIUM PRODUCTS AQUATIC TOXICITY ASSESSMENT
The uranium products UO4 and U3O8 were considered to be environmentally hazardous substances under the Australian Dangerous Goods (ADG) and International Maritime Dangerous Goods (IMDG) codes. These classifications are based on the results of T/D testing and review of the aquatic toxicity data at time of preparation of this report.
In the absence of marine aquatic toxicity data the environmental hazard classification for marine ecosystems is based on freshwater toxicity benchmarks (as per GHS A9.3.2.1). It is suggested that the classification for marine transportation is reviewed when a marine toxicity benchmark is derived.
30 June 2014Report No. 147613036-002-R-Rev0
43

URANIUM PRODUCTS AQUATIC TOXICITY ASSESSMENT
9.0 REFERENCES14
ADG7 (2011). Australian Code for the Transport of Dangerous Goods by Road & Rail, Seventh Edition. Commonwealth of Australia. ISBN 1 921168 57 9
ANZECC and ARMCANZ 2000. Australian and New Zealand Environment and Conservation Council (ANZECC) and Agriculture and Resource Management Council of Australia and New Zealand (ARMCANZ), National Water Quality Management Strategy, Australian and New Zealand Guidelines for Fresh and Marine Water Quality, Canberra, ACT.
Alves, L.C., Borgmann, U. and D.G. Dixon. 2008. Water-sediment interactions for Hyalella azteca exposed to uranium-spiked sediment. Aquatic Toxicology 87: 187-199.
Barillet, S., Adam, C., Palluel, O. and A. Devaux. 2007. Bioaccumulation, oxidative stress, and neurotoxicity in Danio rerio exposed to different isotopic compositions of uranium. Environmental Toxicology and Chemistry 26: 497-505.
Bleise A., Danesi P.R., and W. Burkart. 2003. Properties, use and health effects of depleted uranium (DU): A general overview. Journal of Environmental Radioactivity. 64: 93-112.
Bourrachot, S., Simon, O. and R. Gilbin. 2008. The effects of waterborne uranium on the hatching success, development, and survival of early life stages of zebrafish (Danio rerio). Aquatic Toxicology 90: 29-36.
CCME. 2011. Scientific Criteria Document for the Development of the Canadian Water Quality Guidelines for the Protection of Aquatic Life – Uranium. Canadian Council of Ministers for the Environment, Ottawa, Canada.
Charles, A.M., Markich, S.J., Stauber J.L. and L.F. De Filippis. 2002. The effect of water hardness on the toxicity of uranium to a tropical freshwater alga (Chlorella sp.). Aquatic Toxicology 60: 61-73.
CoA. 2012. Guide to the Safe Transport of Uranium Oxide Concentrate. Uranium Council Transport Working Group. Department of Resources, Energy and Tourism, Commonwealth of Australia.
Fortin, C., Dutel, L. and J. Garnier-Laplace. 2004. Uranium complexation and uptake by a green alga in relation to chemical speciation: the importance of the free uranyl ion. Environmental Toxicology and Chemistry 23: 974-981.
Fournier E., Tran, D., Denison, F., Massabuau, J. and J. Garnier-Laplace. 2004. Valve closure response to uranium exposure for a freshwater bivalve (Corbicula fluminea): quantification of the influence of pH. Environmental Toxicology and Chemistry 23: 1108-1114.
Franklin, N.M., Stauber, J.L., Markich, S.J. and R.P. Lim. 2000. pH-dependent toxicity of copper and uranium to a tropical freshwater alga (Chlorella sp.). Aquatic Toxicology 48: 275-289.
Gayer K.H. and Thompson L.C. 1958. The solubility of uranium peroxide in acidic and basic media at 25º C. Canadian Journal of Chemistry 36: 1213-1216.
Gayer K.H., Haas R.M. and, Thompson L.C. 1964. The solubility of U3O8.x H2O in perchloric acidic at 25º C. Journal of Inorganic and Nuclear Chemistry 26: 1401-1403.
Hogan, A.C., Van Dam, R.A, Markich, S.J. and C. Camilleri. 2005. Chronic toxicity of uranium to a tropical alga (Chlorella sp.) in natural waters and the influence of dissolved organic carbon. Aquatic Toxicology 75: 343-353.
HRL 2014a. Transformation/ Dissolution Testing of Uranium Oxide. Report No. CMM/14/0453-01. Dated 10 June 2014.
HRL 2014b. Transformation/ Dissolution Testing of Uranium Oxide. Report No. CMM/14/0453-02. Dated 20 June 2014.
IMDG 2013. IMDG Code on the Web (Version 11) incorporating Errata & Corrigenda.
14 This reference list includes the references cited in Appendix B - Aquatic Toxicity Data (Raw Acute and Chronic Data)
30 June 2014Report No. 147613036-002-R-Rev0
44

URANIUM PRODUCTS AQUATIC TOXICITY ASSESSMENT
Labrot F., Narbonee, J.F., Ville, P., Saint Denis, M. and D. Ribera. 1999. Acute toxicity, toxicokinetics, and tissue target of lead and uranium in the clam Corbicula fluminea and the worm Eisenia fetida: Comparison with the fish Brachydanio rerio. Archives of Environmental Contamination and Toxicology 36: 167-178.
Lavoie, M., Sabatier, S., Garnier-Laplace, J. and C. Fortin. 2014. Uranium accumulation and toxicity in the green alga Chlamydomonas reinhardtii is modulated by pH. Environmental Toxicology and Chemistry. Accepted 28 February 2014.
Markich, S.J., Brown, P.L., Jeffree, R.A. and R.P. Lim. 2000. Valve movement responses of Velesunio angasi (Bivalvia: Hyriidae) to manganese and uranium: An exception to the free ion activity model. Aquatic Toxicology 51: 155-175.
Massarin, S., Alonzo, F., Garcia-Sachez, L., Gilbin, R., Garnier-Laplace, J. and J.C. Poggiale. 2010. Effects of chronic uranium exposure on life history and physiology of Daphnia magna over three successive generations. Aquatic Toxicology 99: 309-319.
Mathews, T., Beaugelin-Seiller, K., Garnier-Laplace, J., Gilbin, R., Adam, D. and C. Della-Vedova. 2009. A probabilistic assessment of the chemical and radiological risks of chronic exposure to uranium in freshwater ecosystems. Environmental Science and Technology 43: 6684-6690.
Millero, F. (2001). Speciation of metals in natural waters. Geochemical Transactions 8. DOI: 10.1039/b104809k. International Maritime Organization Virtual Publications
Parkhurst, B.R., Elder, R.G., Meyer, J.S., Sanchez, D.A, Pennak, R.W. and W.T. Waller. 1984. An environmental hazard evaluation of uranium in a rocky mountain stream. Environmental Toxicology and Chemistry 3: 113-124.
Poston, T.M. Hanf, R.W. and M.A. Simmons. 1984. Toxicity of uranium to Daphnia magna. Water, Air and Soil Pollution 22: 289-298.
Riethmuller, N., Markich, S.J., Van Dam, R.A. and D. Parry. 2001. Effects of water hardness and alkalinity on the toxicity of uranium to a tropical freshwater hydra (Hydra viridissima). Biomarkers 6: 45-51.
Sheppard, S.C., Sheppard, M.I., Gallerand, M.O. and B. Sanipelli. 2005. Derivation of ecotoxicity thresholds to uranium. Journal of Environmental Radioactivity 79: 55-83.
Simon, O. and J. Garnier-Laplace. 2004. Kinetic analysis of uranium accumulation in the bivalve Corbicula fluminea: effect of pH and direct exposure levels. Aquatic Toxicology 68: 95-108.
Tarzwell, C.M. and C. Henderson. 1960. Toxicity of less common metals to fishes. Industrial Wastes 5: 12.
UN 2008. UN Manual of Tests and Criteria, Fourth Revised Edition. United Nations.
UNECE 2009. Globally Harmonised System (GHS) of Classification and Labelling of Chemicals. Third Revised Edition. United Nations, New York and Geneva.
UNECE 2013. Globally Harmonised System (GHS) of Classification and Labelling of Chemicals. Fifth Revised Edition. United Nations, New York and Geneva.
US EPA, 2014. Technical Guidance Manual, EPA Region 3 Guidance on Handling Chemical Concentration Data Near the Detection Limit in Risk Assessments. Accessed online June 2014 from US EPA website: http://www.epa.gov/reg3hscd/risk/human/info/guide3.htm
Van Dam, R.A., Trenfield, M.A., Markich, S.J., Harford, A.J., Humphrey, A.C. and J.L. Stauber. 2012. Re-analysis of uranium toxicity data for freshwater organisms and the influence of dissolved organic carbon. Environmental Toxicology and Chemistry 31: 2606-2614.
Van Dam, R. 2013. Bioavailability and toxicology of uranium in the aquatic environment. In: Determining the hydrogeochemistry, biogeochemistry, transport and fate of uranium in the context of environmental outcomes. A CSIRO Cutting edge Science Symposium. 21st – 22nd September 2013. CSIRO Centre for Environment and Life Sciences, Floreat, Western Australia, pp. 36-44.
Vizon SciTec Inc. 2004. Final report on the toxicity investigation of uranium to aquatic organisms. CNSC Project No: R205.1.
30 June 2014Report No. 147613036-002-R-Rev0
45

URANIUM PRODUCTS AQUATIC TOXICITY ASSESSMENT
Whicker F.W., and V.S. Schultz. 1982. Radioecology: nuclear energy and the environment. Volume 1. Boca Raton (FL): CRC Press.
30 June 2014Report No. 147613036-002-R-Rev0
46

URANIUM PRODUCTS AQUATIC TOXICITY ASSESSMENT
10.0 LIMITATIONSYour attention is drawn to the document - “Limitations”, which is included in Error: Reference source not found of this document. The statements presented in this document are intended to advise you of what your realistic expectations of this report should be. The document is not intended to reduce the level of responsibility accepted by Golder, but rather to ensure that all parties who may rely on this report are aware of the responsibilities each assumes in so doing.
30 June 2014Report No. 147613036-002-R-Rev0
47

URANIUM PRODUCTS AQUATIC TOXICITY ASSESSMENT
Report Signature Page
GOLDER ASSOCIATES PTY LTD
Antti Mikkonen
Environmental Scientists
Kirsten Broadgate
Principal Environmental Toxicologist
KEB-AM/CMB/am
ABN. 64 006 107 857
Golder, Golder Associates and the GA globe design are trademarks of Golder Associates Corporation
/tt/file_convert/5c97f76909d3f2bd028d0863/document.docx
30 June 2014Report No. 147613036-002-R-Rev0
48

URANIUM PRODUCTS AQUATIC TOXICITY ASSESSMENT
APPENDIX A
1.0 STATEMENT OF REVIEWDr Graeme Batley, Chief Research Scientist of Commonwealth Scientific and Industrial Research Organisation (CSIRO) Land and Water.
I have comprehensively reviewed this report and am satisfied that it presents results that are based on quality experimentation, that the data interpretation uses sound, state-of-the-art science, and that the conclusions with respect to the hazard classification of the uranium concentrates are fully supported by the findings.
30 June 2014Report No. 147613036-002-R-Rev0
49

URANIUM PRODUCTS AQUATIC TOXICITY ASSESSMENT
APPENDIX B
1.0 Aquatic Toxicity Data – Raw Acute and Chronic Data
30 June 2014Report No. 147613036-002-R-Rev0
50

Table B1: Hyalella
ReferenceTaxonomic group Common name Scientific name Life stage
Exposure Duration Test Medium Uranium Test Endpoint
Toxicity Estimate (ug/L)
Effective U conc (ug/L)
Toxicity Estimate Range (ug/L) pH
Hardness (mg/L CaCO3) Temp (oC)
Toxicity Endpoint
Alves et al. 2009 Invertebrate Amphipod Hyalella azteca Adult 7 d UO2(NO3)2.6H20 LC25 2100 6.9-7.2 120 25 ChronicAlves et al. 2009 Invertebrate Amphipod Hyalella azteca Adult 7 d UO2(NO3)2.6H20 LC50 4000 6.9-7.2 120 25 ChronicAlves et al. 2009 Invertebrate Amphipod Hyalella azteca Adult 7 d UO2(NO3)2.6H20 LC10 1200 6.9-7.2 120 25 ChronicAlves et al. 2009 Invertebrate Amphipod Hyalella azteca Juvenile 7 d UO2(NO3)2.6H20 LC25 540 6.9-7.2 120 25 ChronicAlves et al. 2009 Invertebrate Amphipod Hyalella azteca Juvenile 7 d UO2(NO3)2.6H20 LC50 1100 6.9-7.2 120 25 ChronicAlves et al. 2009 Invertebrate Amphipod Hyalella azteca Juvenile 7 d UO2(NO3)2.6H20 LC10 300 6.9-7.2 120 25 ChronicBorgmann et al. 2005 Invertebrate Amphipod Hyalella azteca 1-11 d 7d Lab Water - soft water Uranium LC50 21 21 7.37-8.27 18 24-25 ChronicBorgmann et al. 2005 Invertebrate Amphipod Hyalella azteca 1-11 d 7d Lab Water - tap water Uranium LC50 1651 1651 7.37-8.27 124 24-25 ChronicVizon Scitech Invertebrate Amphipod Hyalella azteca 14 d UO2(NO3)2.6H20 LC50 17 8.8-38 17 ChronicVizon Scitech Invertebrate Amphipod Hyalella azteca 14 d UO2(NO3)2.6H20 LC50 140 120-160 61 ChronicVizon Scitech Invertebrate Amphipod Hyalella azteca 14 d UO2(NO3)2.6H20 LC50 200 170-240 123 ChronicVizon Scitech Invertebrate Amphipod Hyalella azteca 14 d UO2(NO3)2.6H20 LC50 340 190-1800 238 ChronicVizon Scitech Invertebrate Amphipod Hyalella azteca 14 d UO2(NO3)2.6H20 LC25 100-130 ChronicVizon Scitech Invertebrate Amphipod Hyalella azteca 14 d UO2(NO3)2.6H20 LC10 55-88 ChronicVizon SciTec 2004 Invertebrate Amphipod Hyalella azteca 14 d UO2(NO3)2.6H20 MATC 90-130 6.4-7.1 17-238 21.4-23.2 ChronicVizon SciTec 2004 Invertebrate Amphipod Hyalella azteca 14 d UO2(NO3)2.6H20 MATC 66 6.4-7.1 238 21.4-23.2 ChronicVizon SciTec 2004 Invertebrate Amphipod Hyalella azteca 14 d UO2(NO3)2.6H20 LC10 55-80 6.4-7.1 17-238 21.4-23.2 ChronicLiber et al. 2007 Invertebrate Amphipod Hyalella azteca 2-9 days 28 d Lab Water UO2(NO3)2.6H20 EC10 (Growth) 12 12 8.2 73 23 ChronicLiber et al. 2007 Invertebrate Amphipod Hyalella azteca 2-9 days 28 d Lab Water UO2(NO3)2.6H20 EC50 67 67 8.2 73 23 ChronicLiber et al. 2007 Invertebrate Amphipod Hyalella azteca 2-9 days 28 d Lab Water UO2(NO3)2.6H20 EC25 27 27 8.2 73 23 ChronicLiber et al. 2007 Invertebrate Amphipod Hyalella azteca 2-9 days 28 d Lab Water UO2(NO3)2.6H20 LC50 30 8.2 73 23 ChronicLiber et al. 2007 Invertebrate Amphipod Hyalella azteca 2-9 days 28 d Lab Water UO2(NO3)2.6H20 NOEC 57 8.2 73 23 ChronicLiber et al. 2007 Invertebrate Amphipod Hyalella azteca 2-9 days 28 d Lab Water UO2(NO3)2.6H20 LOEC 156 8.2 73 23 ChronicAlves et al. 2008 Invertebrate Amphipod Hyalella azteca 13-14 d 28 d Lab Water Uranyl nitrate LC50 664 565-781 7.93-8.00
MH - high alk (SAM) 25 Chronic
Alves et al. 2008 Invertebrate Amphipod Hyalella azteca 13-14 d 28 d Lab Water Uranyl nitrate LC50 44 31-65 7.97MH - low alk
(MHSAM) 25 ChronicAlves et al. 2008 Invertebrate Amphipod Hyalella azteca 13-14 d 28 d Lab Water Uranyl nitrate LC50 198 172-227 7.58
Int hard - int alk (50SAM) 25 Chronic
Alves et al. 2008 Invertebrate Amphipod Hyalella azteca 13-14 d 28 d Lab Water Uranyl nitrate LC50 132 112-175 7.23Soft - high alk
(MSSAM) 25 ChronicAlves et al. 2008 Invertebrate Amphipod Hyalella azteca 13-14 d 28 d Lab Water Uranyl nitrate LC50 15-47 11.8-55 6.91-7.16
Soft low alk (10Sam) 25 Chronic
Alves et al. 2008 Invertebrate Amphipod Hyalella azteca 14-15 wks 28 d Lab Water Uranyl nitrate LC50 1042-2066 7.93-8.00MH - high alk
(SAM) 25 ChronicAlves et al. 2008 Invertebrate Amphipod Hyalella azteca 14-15 wks 28 d Lab Water Uranyl nitrate LC50 30 7.97
MH - low alk (MHSAM) 25 Chronic
Alves et al. 2008 Invertebrate Amphipod Hyalella azteca 14-15 wks 28 d Lab Water Uranyl nitrate LC50 48 7.58Int hard - int alk
(50SAM) 25 ChronicAlves et al. 2008 Invertebrate Amphipod Hyalella azteca 14-15 wks 28 d Lab Water Uranyl nitrate LC50 94 7.23
Soft - high alk (MSSAM) 25 Chronic
Alves et al. 2008 Invertebrate Amphipod Hyalella azteca 14-15 wks 28 d Lab Water Uranyl nitrate LC50 15-42 6.91-7.16Soft low alk
(10Sam) 25 Chronic
In Table 11 CCME (2011)In Table 15 in CCME (2011) - Acute AsessmentIn Table 17 in CCME (2011) - Chronic Assessment
# further notes in Table 11 (CCME, 2011)Global note for ecological toxicity data - some species deemed un-acceptable (non-resident) for CCME (2011) purposes could be used for our data as they are Australian species.

Table B2: Cladocerans
ReferenceTaxonomic group Common name Scientific name Life stage
Exposure Duration Test Medium Uranium Test Endpoint
Toxicity Estimate (ug/L) pH Temp (oC)
Toxicity Endpoint
Pickett et al. 1993 Invertebrate Cladoceran Ceriodaphnia dubia <24 h 48 h Lab Water Uranyl nitrate LC50 73 6.2-7.6 Soft - 3.9-6.1 25oC AcutePickett et al. 1993 Invertebrate Cladoceran Ceriodaphnia dubia <24 h 48 h Lab Water Uranium dioxide LC50 50 6.1-6.5 Soft - 3.4-4.0 25oC AcutePickett et al. 1993 Invertebrate Cladoceran Ceriodaphnia dubia <24 h 48 h Lab Water Uranyl nitrate LC50 89 89 6.87-7.76 6.1 25.8-26.0 AcutePickett et al. 1993 Invertebrate Cladoceran Ceriodaphnia dubia <24 h 48 h Lab Water Uranium dioxide LC50 60 60 6.87-7.76 6.1 25.8-26.0 AcutePickett et al. 1993 Invertebrate Cladoceran Ceriodaphnia dubia <24 h 48 h Uranyl nitrate LC50 72 AcuteZeman et al. 2008 Invertebrate Cladoceran Ceriodaphnia dubia Neonates 48 h Lab Water Uranyl nitrate hexahydrate EC50 390 350-430 7 250 20 AcuteZeman et al. 2008 Invertebrate Cladoceran Ceriodaphnia dubia Neonates 48 h Lab Water Uranyl nitrate hexahydrate EC50 7.8 4.6-11.0 8 250 20 AcuteZeman et al. 2008 Invertebrate Cladoceran Ceriodaphnia dubia Neonates 48 h Lab Water Uranyl nitrate hexahydrate EC10 170 130-210 7 250 20 AcuteVizon Scitech Invertebrate Cladoceran Ceriodaphnia dubia 96 h Lab Water UO2(NO3)2.6H2O LC50 160 120-170 5 AcuteVizon Scitech Invertebrate Cladoceran Ceriodaphnia dubia 96 h Lab Water UO2(NO3)2.6H2O LC50 140 120-180 17 AcuteVizon Scitech Invertebrate Cladoceran Ceriodaphnia dubia 96 h Lab Water UO2(NO3)2.6H2O LC50 100 14-120 124 AcuteVizon Scitech Invertebrate Cladoceran Ceriodaphnia dubia 96 h Lab Water UO2(NO3)2.6H2O LC50 110 68-210 252 AcuteLiber et al. 2007 Invertebrate Cladoceran Ceriodaphnia dubia 7 d Lab Water UO2(NO3)2.6H20 IC10 (reproduction) 73 ChronicPickett et al. 1993 Invertebrate Cladoceran Ceriodaphnia dubia <24 h 7 d Lab Water Uranyl nitrate NOEC (repro) 1.5 ChronicPickett et al. 1993 Invertebrate Cladoceran Ceriodaphnia dubia <24 h 7 d Lab Water Uranium dioxide LOEC (repro) 2.7 ChronicPickett et al. 1993 Invertebrate Cladoceran Ceriodaphnia dubia <24 h 7 d Lab Water Uranyl nitrate NOEC 4 6.9-8.0 Soft - 6.1 25oC ChronicPickett et al. 1993 Invertebrate Cladoceran Ceriodaphnia dubia <24 h 7 d Lab Water Uranyl nitrate LOEC 5 6.9-8.0 Soft - 6.1 25oC ChronicPickett et al. 1993 Invertebrate Cladoceran Ceriodaphnia dubia <24 h 7 d Lab Water Uranium dioxide NOEC 30 6.0-6.5 Soft - 3.4 25oC ChronicPickett et al. 1993 Invertebrate Cladoceran Ceriodaphnia dubia <24 h 7 d Lab Water Uranium dioxide LOEC 50 6.0-6.5 Soft - 3.4 25oC ChronicPickett et al. 1993 Invertebrate Cladoceran Ceriodaphnia dubia 7 d UO2(NO3)2 MATC 2 6.7-7.5 6.1 24.5-26Liber et al. 2007 Invertebrate Cladoceran Ceriodaphnia dubia 7 d UO2(NO3)2.6H20 EC25 (reproduction) 2700 2700 ChronicLiber et al. 2007 Invertebrate Cladoceran Ceriodaphnia dubia 7 d UO2(NO3)2.6H20 EC50 (reproduction) 3970 3970 ChronicLiber et al. 2007 Invertebrate Cladoceran Ceriodaphnia dubia 7 d UO2(NO3)2.6H20 EC10 (reproduction) 1900 1900 ChronicLiber et al. 2007 Invertebrate Cladoceran Ceriodaphnia dubia 7 d UO2(NO3)2.6H20 NOEC 1540Liber et al. 2007 Invertebrate Cladoceran Ceriodaphnia dubia 7 d UO2(NO3)2.6H20 LOEC 6400Vizon Scitech Invertebrate Cladoceran Ceriodaphnia dubia 7 d Lab Water UO2(NO3)2.6H2O IC50 92 79-100 5 ChronicVizon Scitech Invertebrate Cladoceran Ceriodaphnia dubia 7 d Lab Water UO2(NO3)2.6H2O IC50 110 110-110 17 ChronicVizon Scitech Invertebrate Cladoceran Ceriodaphnia dubia 7 d Lab Water UO2(NO3)2.6H2O IC50 53 36-98 142 ChronicVizon Scitech Invertebrate Cladoceran Ceriodaphnia dubia 7 d Lab Water UO2(NO3)2.6H2O IC50 95 62-110 252 ChronicVizon Scitech 2004 Invertebrate Cladoceran Ceriodaphnia dubia 7 d Lab Water UO2(NO3)2.6H2O LC25 54-150 5-252 ChronicVizon Scitech 2004 Invertebrate Cladoceran Ceriodaphnia dubia 7 d Lab Water UO2(NO3)2.6H2O NOEC (repro) 1970 ChronicVizon Scitech 2004 Invertebrate Cladoceran Ceriodaphnia dubia 7 d Lab Water UO2(NO3)2.6H2O LOEC (repro) 3910 ChronicVizon Scitech 2004 Invertebrate Cladoceran Ceriodaphnia dubia 7 d Lab Water UO2(NO3)2.6H2O IC10 (repro) 33 33 6.5-7.3 5 21.4-26.2 ChronicVizon Scitech 2004 Invertebrate Cladoceran Ceriodaphnia dubia 7 d Lab Water UO2(NO3)2.6H2O IC10 (repro) 59 59 6.5-7.3 17 21.4-26.2 ChronicVizon Scitech 2004 Invertebrate Cladoceran Ceriodaphnia dubia 7 d Lab Water UO2(NO3)2.6H2O IC10 (repro) 22 22 6.5-7.3 124 21.4-26.2 ChronicVizon Scitech 2004 Invertebrate Cladoceran Ceriodaphnia dubia 7 d Lab Water UO2(NO3)2.6H2O IC10 (repro) 25 25 6.5-7.3 252 21.4-26.2 ChronicVizon Scitech 2004 Invertebrate Cladoceran Ceriodaphnia dubia 7 d Lab Water UO2(NO3)2.6H2O IC10 (reproduction) 22-59 ChronicVizon Scitech 2004 Invertebrate Cladoceran Ceriodaphnia dubia 7 d UO2(NO3)2.6H2O MATC (repro) 37-100 6.5-7.3 5-252 21.4-26.2 ChronicVizon Scitech 2004 Invertebrate Cladoceran Ceriodaphnia dubia 7 d UO2(NO3)2.6H2O MATC (survival) 96-270 6.5-7.3 5-252 21.4-26.2 ChronicVizon Scitech 2004 Invertebrate Cladoceran Ceriodaphnia dubia 7 d UO2(NO3)2.6H2O LC10 28-140 6.5-7.3 5-252 21.4-26.2 ChronicLiber et al. 2007 Invertebrate Cladoceran Ceriodaphnia dubia 21 d UO2(NO3)2.6H20 LC50 3860 8.0-8.4 78 17.2 ChronicLiber et al. 2007 Invertebrate Cladoceran Ceriodaphnia dubia 21 d UO2(NO3)2.6H20 NOEC 460 8.0-8.4 78 17.2 ChronicLiber et al. 2007 Invertebrate Cladoceran Ceriodaphnia dubia 21 d UO2(NO3)2.6H20 LOEC 1820 8.0-8.4 78 17.2 ChronicLiber et al. 2007 Invertebrate Cladoceran Ceriodaphnia dubia 21 d UO2(NO3)2.6H20 EC50 (reproduction) 1900 8.0-8.4 78 17.2 ChronicLiber et al. 2007 Invertebrate Cladoceran Ceriodaphnia dubia 21 d UO2(NO3)2.6H20 EC25 (reproduction) 920 8.0-8.4 78 17.2 ChronicLiber et al. 2007 Invertebrate Cladoceran Ceriodaphnia dubia 21 d UO2(NO3)2.6H20 EC10 (reproduction) 480 8.0-8.4 78 17.2 ChronicZeman et al. 2008 Invertebrate Cladoceran Ceriodaphnia dubia Neonates 21 d Lab Water Uranyl nitrate hexahydrate EC50 (repro) 91 76-106 8 250 20 ChronicZeman et al. 2008 Invertebrate Cladoceran Ceriodaphnia dubia Neonates 21 d Lab Water Uranyl nitrate hexahydrate EC10 (repro) 14 7.0-12.0 7 250 20 Chronic
Vino and Larpant 1984 Invertebrate Daphnia magna Daphnia magna 24 h Lab Water Uranium LC50 32700 AcuteTrapp 1986 Invertebrate Cladoceran Daphnia pulex 48 h UO2(NO3)2.6H2O LC50 220 220 5.10-5.64 2.3-3.3 20-21 AcuteBarata et al. 1998 and Poston et al. 1984Invertebrate Cladoceran Daphnia magna 48 h UO2SO4.3H2O / UO2(NO3)2.6H20LC50 6400 AcuteBarata et al. 1998 Invertebrate Cladoceran Daphnia magna <24 h 48 h Lab MH Water UO2SO4.3H2O LC50 9360 8254 6900-15500 7.73 Mod hard 20oC AcuteBarata et al. 1998 Invertebrate Cladoceran Daphnia magna < 24 h 48 h Lab MH Water UO2SO4.3H2O LC50 5870 5176 4120-8360 7.73 Mod hard 20oC AcuteBarata et al. 1998 Invertebrate Cladoceran Daphnia magna < 24 h 48 h Lab H Water UO2SO4.3H2O LC50 25400 22400* 15900-27300 8.07 Hard 20oC AcuteBarata et al. 1998 Invertebrate Cladoceran Daphnia magna < 24 h 48 h Lab H Water UO2SO4.3H2O LC50 17300 15250 10300-25500 8.07 Hard 20oC AcuteBarata et al. 1998 Invertebrate Cladoceran Daphnia magna 48 h UO2SO4.3H2O LC50 6530 6530 Acute
Effective U conc (ug/L)
Toxicity Estimate Range (ug/L)
Hardness (mg/L CaCO3)

ReferenceTaxonomic group Common name Scientific name Life stage
Exposure Duration Test Medium Uranium Test Endpoint
Toxicity Estimate (ug/L) pH Temp (oC)
Toxicity Endpoint
Poston et al. 1984 Invertebrate Cladoceran Daphnia magna First instar 48 h Lab MH Water UO2(NO3)2.6H2O LC50 37505 36830 24450-38580 7.9-8.0 126-140 20oC AcutePoston et al. 1984 Invertebrate Cladoceran Daphnia magna First instar 48 h Lab H Water UO2(NO3)2.6H2O LC50 51950 46870 25660-80970 7.9-8.0 188-205 20oC AcutePoston et al. 1984 Invertebrate Cladoceran Daphnia magna 48 h UO2(NO3)2.6H2O LC50 6320 6320 66.6-72.9 AcutePoston et al. 1984 Invertebrate Cladoceran Daphnia magna 21 d UO2(NO3)2.6H20 LOEC (repro) 520-2250 ChronicPoston et al. 1984 Invertebrate Cladoceran Daphnia magna 21 d UO2(NO3)2.6H2O MATC (repro) 1700 ChronicPoston et al. 1984 Invertebrate Cladoceran Daphnia magna 21 d UO2(NO3)2.6H2O LC10 319-683 ChronicPoston et al. 1984 Invertebrate Cladoceran Daphnia magna 21 d UO2(NO3)2.6H2O EC10 (reproduction) 123 ChronicPoston et al. 1984 Invertebrate Cladoceran Daphnia magna 21 d UO2(NO3)2.6H2O EC10 (reproduction) 373 ChronicPoston et al. 1984 Invertebrate Cladoceran Daphnia magna 21 d UO2(NO3)2.6H2O EC10 (reproduction) 1160 ChronicPoston et al. 1984 Invertebrate Cladoceran Daphnia magna 21 d UO2(NO3)2.6H20 EC10 (reproduction) 1360 ChronicLiber et al. 2007 Invertebrate Cladoceran Daphnia magna 21 d Lab Water UO2(NO3)2.6H20 EC10 (reproduction) 530 ChronicLiber et al. 2007 Invertebrate Cladoceran Daphnia magna 21 d UO2(NO3)2.6H20 LC50 850 8.0-8.4 75 22 ChronicLiber et al. 2007 Invertebrate Cladoceran Daphnia magna 21 d UO2(NO3)2.6H20 NOEC 450 8.0-8.4 75 22 ChronicLiber et al. 2007 Invertebrate Cladoceran Daphnia magna 21 d UO2(NO3)2.6H20 LOEC 1810 8.0-8.4 75 22 ChronicLiber et al. 2007 Invertebrate Cladoceran Daphnia magna 21 d UO2(NO3)2.6H20 EC50 (reproduction) 1250 8.0-8.4 75 22 ChronicLiber et al. 2007 Invertebrate Cladoceran Daphnia magna 21 d UO2(NO3)2.6H20 EC25 (reproduction) 830 8.0-8.4 75 22 ChronicLiber et al. 2007 Invertebrate Cladoceran Daphnia magna 21 d UO2(NO3)2.6H2O EC10 (reproduction) 570 8.0-8.4 75 22 Chronic
Bywater et al. 1991 Invertebrate Cladoceran Daiphanosoma excisum < 6 h 24 h Creek water UO2SO4 LC50 1000 1000 690-1380 6.57 4.56 27oC AcuteBywater et al. 1991 Invertebrate Cladoceran Daiphanosoma excisum < 6 h 24 h Creek water UO2SO4 LC1 900 6.57 4.56 27 Acute
Bywater et al. 1991 Invertebrate Cladoceran Latonopsis fasciculata < 6 h 24 h Creek water UO2SO4 LC50 410 410 320-520 6.57 4.56 27oC AcuteBywater et al. 1991 Invertebrate Cladoceran Latonopsis fasciculata < 6 h 24 h Creek water UO2SO4 LC1 170 6.57 4.56 27 Acute
Bywater et al. 1991 Invertebrate Cladoceran Dadaya macrops < 6 h 24 h Creek water UO2SO4 LC50 1100 1100 810-1460 6.57 4.56 27oC AcuteBywater et al. 1991 Invertebrate Cladoceran Dadaya macrops < 6 h 24 h Creek water UO2SO4 LC1 140 6.57 4.46 27 Acute
Bywater et al. 1991 Invertebrate Cladoceran Moinodaphnia macleayi < 6 h 24 h Creek water UO2SO4 LC50 1290 1290 1060-1550 6.57 4.46 27oC AcuteBywater et al. 1991 Invertebrate Cladoceran Moinodaphnia macleayi < 6 h 24 h Creek water UO2SO4 LC1 490 6.57 4.46 27 AcuteSemaan et al. 2001 Invertebrate Cladoceran Moinodaphnia macleayi < 6 h 48 h UO2SO4 EC50 (death) 160-390 6.63-6.92 27 AcuteSemaan et al. 2001 Invertebrate Cladoceran Moinodaphnia macleayi < 6 h 48 h UO2SO4 NOEC 100-270 6.63-6.92 27 AcuteSemaan et al. 2001 Invertebrate Cladoceran Moinodaphnia macleayi < 6 h 48 h UO2SO4 LOEC 180-370 6.63-6.92 27 AcuteSemaan et al. 2001 Invertebrate Cladoceran Moinodaphnia macleayi < 6 h 5-6 d UO2SO4 NOEC (survival) 4.0-46 6.85-7.14 27 AcuteSemaan et al. 2001 Invertebrate Cladoceran Moinodaphnia macleayi < 6 h 5-6 d UO2SO4 LOEC (survival) 7.0-49 6.85-7.14 27 Acute
Liber et al. 2007 and Poston et al. 1984 geomeanInvertebrate Cladoceran Simocephalus serrulatus 7 d Lab Water UO2(NO3)2.6H20 EC10 (reproduction) 480 ChronicLiber et al. 2007 Invertebrate Cladoceran Simocephalus serrulatus 21 d UO2(NO3)2.6H20 LC50 3860 8.0-8.4 78 17.2 ChronicLiber et al. 2007 Invertebrate Cladoceran Simocephalus serrulatus 21 d UO2(NO3)2.6H20 NOEC 460 8.0-8.4 78 17.2 ChronicLiber et al. 2007 Invertebrate Cladoceran Simocephalus serrulatus 21 d UO2(NO3)2.6H20 LOEC 1820 8.0-8.4 78 17.2 ChronicLiber et al. 2007 Invertebrate Cladoceran Simocephalus serrulatus 21 d UO2(NO3)2.6H20 EC50 1900 8.0-8.4 78 17.2 ChronicLiber et al. 2007 Invertebrate Cladoceran Simocephalus serrulatus 21 d UO2(NO3)2.6H20 EC25 920 8.0-8.4 78 17.2 ChronicLiber et al. 2007 Invertebrate Cladoceran Simocephalus serrulatus 21 d UO2(NO3)2.6H20 EC10 (reproduction) 480 8.0-8.4 78 17.2 Chronic
In Table 11 CCME (2011)In Table 15 in CCME (2011) - Acute AsessmentIn Table 17 in CCME (2011) - Chronic Assessment
# further notes in Table 11 (CCME, 2011)
Effective U conc (ug/L)
Toxicity Estimate Range (ug/L)
Hardness (mg/L CaCO3)

Table B3: Fish
ReferenceTaxonomic group Common name Scientific name Life stage
Exposure Duration Test Medium Uranium Test Endpoint
Toxicity Estimate
(ug/L) pH Temp (oC)
Toxicity Endpoint
Vino and Larpant 1984 Fish Zebrafish Danio rerio 24h Lab Water Uranium LC50 6400 2100-4000 7.86 178 AcuteLabrot et al. 1999 Fish Zebrafish Brachyodanio rerio Adults 96 h Lab Water Uranyl acetate LC50 3050 3050 7.86 178 AcuteLabrot et al. 1999 Fish Zebrafish Brachyodanio rerio Adults 28 d Lab Water Uranyl acetate BCF 8.87 x 10⁻³ Chronic
Vizon Scitec (2004) and Davies (1980) - combined geomeans Fish Rainbow Trout Oncorynchus mykiss 96 h Lab Water UO2(NO3)2.6H20 LC50 4000 AcuteVizon Scitec Fish Rainbow Trout Oncorynchus mykiss Fry 96 h Lab Water UO2(NO3)2.6H20 LC50 4200 4200 2600-6700 20 AcuteVizon Scitec Fish Rainbow Trout Oncorynchus mykiss Fry 96 h Lab Water UO2(NO3)2.6H20 LC50 3900 3900 2400-6300 68 AcuteVizon Scitec Fish Rainbow Trout Oncorynchus mykiss Fry 96 h Lab Water UO2(NO3)2.6H20 LC50 4000 4000 2500-6300 126 AcuteVizon Scitec Fish Rainbow Trout Oncorynchus mykiss Fry 96 h Lab Water UO2(NO3)2.6H20 LC50 3800 3800 2400-5900 243 AcuteDavies 1980 Fish Rainbow Trout Oncorhynchus mykiss 96 h Lab Water Not stated LC50 6200 6200 AcuteVizon Scitech 2004 Fish Rainbow Trout Oncorynchus mykiss 30 d Lab Water UO2(NO3)2.6H20 EC10 (non viable embryos) 350 ChronicVizon Scitec Fish Rainbow Trout Oncorynchus mykiss Embryos 30 d Lab Water UO2(NO3)2.6H20 EC50 460 500-510 6 ChronicVizon Scitec Fish Rainbow Trout Oncorynchus mykiss Embryos 31 d Lab Water UO2(NO3)2.6H20 EC50 640 630-650 61 ChronicVizon Scitech 2004 Fish Rainbow Trout Oncorynchus mykiss Embryos 30 d Lab Water UO2(NO3)2.6H20 LOEC 280 280 6.3-7.2 6 13.3-15.2 ChronicVizon Scitech 2004 Fish Rainbow Trout Oncorynchus mykiss Embryos 30 d Lab Water UO2(NO3)2.6H20 LOEC 610 610 6.3-7.2 61 13.3-15.2Vizon Scitech 2004 Fish Rainbow Trout Oncorynchus mykiss Embryos 30 d Lab Water UO2(NO3)2.6H20 EC25 340 ChronicVizon Scitech 2004 Fish Rainbow Trout Oncorynchus mykiss Embryos 30 d Lab Water UO2(NO3)2.6H20 EC10 260 260 6.3-7.2 6 13.3-15.2 ChronicVizon Scitch 2004 Fish Rainbow Trout Oncorynchus mykiss Embryos 30 d Lab Water UO2(NO3)2.6H20 EC10 480 480 6.3-7.2 61 13.3-15.2
Parkhurst et al. 2004 Fish Brook Trout Salvelinus fontinalis 48 h Lab - harness matching creek waterUO2SO4.3H2O LC50 59000 59000 7.4 184 13 AcuteParkhurst et al. 2004 Fish Brook Trout Salvelinus fontinalis 96 h Lab - soft water UO2SO4.3H2O LC50 5500 5500 6.7 35 13 AcuteParkhurst et al. 2004 Fish Brook Trout Salvelinus fontinalis 96 h Lab - hard water UO2SO4.3H2O LC50 23000 23000 7.5 208 13 AcuteParkurst et al. (1984) and Davies (1980)Fish Brook Trout Salvelinus fontinalis 96 h Lab Water UO2SO4.3H2O LC50 6600 6600 AcuteParkurst et al. (1984) Fish Brook Trout Salvelinus fontinalis 60 d UO2SO4.3H2O NOEC >9080 >9080 8 201 13.5 AcuteDavies 1980 Fish Brook Trout Salvelinus fontinalis 96 h Lab Water Not stated LC50 8000 8000 6.8-7.0 30.8 14.2 AcuteDavies 1980 Fish Brook Trout Salvelinus fontinalis 120 h Lab Water Not stated LC50 7200 6.8-7.0 30.8 14.2 Acute
Liber et al. 2004 Fish Lake Trout Salvenlinus namaycush Eggs 141 d Lab Water U02(NO3)2.6H20 NOEC 6050 ChronicLiber et al. 2004 Fish Lake Trout Salvenlinus namaycush Eggs 141 d Lab Water UO2(NO3)2.6H2O LOEC 29780 ChronicLiber et al. 2004 Fish Lake Trout Salvenlinus namaycush Eggs 141 d Lab Water UO2(NO3)2.6H2O MATC 13400 ChronicLiber et al. 2004a Fish Lake Trout S. namaycush 141 d Lab Water UO2(NO3)2.6H2O MATC (survival) 13400 13400 Chronic
Liber et al. 2004 Fish White sucker fry Catostomus commersoni Fry - 52 d old 30 d Lab Water UO2(NO3)2.6H20 LC50 > 27860 > 27860 7.9 72 14.3 ChronicLiber et al. 2004 Fish White sucker Catostomus commersoni Fry - 52 d old 30 d Lab Water UO2(NO3)2.6H20 MATC 14300 14300 7.9 72 14.3 ChronicLiber et al. 2004 Fish White sucker Catostomus commersoni Fry - 52 d old 30 d Lab Water UO2(NO3)2.6H20 LOEC 27860 27860 7.9 72 14.3 ChronicLiber et al. 2004 Fish White sucker Catostomus commersoni Fry - 52 d old 30 d Lab Water UO2(NO3)2.6H20 NOEC 7330 7330 7.9 72 14.3 ChronicLiber et al. 2004b Fish White sucker Catostomus commersoni 30 d Lab Water UO2(NO3)2.6H2O MATC (growth) 14300 Chronic
Hamilton and Buhl 1997 Fish Flannelmouth Sucker Catostomus latipinnis Larval 96 h Lab Water Uranyl nitrate LC50 43500 43500 34800-534007.9 (7.6-8.2) 144 34800-53400 Acute
Tarzwell and Henderson 1960Fish Fathead minnows Pimephales promelas - 96 h UO2SO4.3H2O LC50 2800 7.4 20 AcuteTarzwell and Henderson 1960Fish Fathead minnows Pimephales promelas - 96 h UO2SO4.3H2O LC50 135000 8.2 400 AcuteVizon Scitec (2004) Fish Fathead minnows Pimephales promelas 96 h Lab Water UO2(NO3)2.6H20 LC50 2000 2000 6.3-7.0 23 24.0-25.8 AcuteVizon Scitec (2004) Fish Fathead minnows Pimephales promelas 96 h UO2(NO3)2.6H20 LC25 2000 2000 6.3-7.0 72 24.0-25.8 AcuteVizon Scitec (2004) Fish Fathead minnows Pimephales promelas 96 h UO2(NO3)2.6H20 LOEC 2100 2100 6.3-7.0 131 24.0-25.8 AcuteVizon Scitech 2004 Fish Fathead minnows Pimephales promelas 96 h UO2(NO3)2.6H20 NOEC 1800 1800 6.3-7.0 244 24.0-25.8 AcuteVizon Scitec Fish Fathead minnows Pimephales promelas Embryo 7 d Lab Water UO2(NO3)2.6H20 LC50 1600 1500-1800 23 ChronicVizon Scitec Fish Fathead minnows Pimephales promelas Embryo 7 d Lab Water UO2(NO3)2.6H20 LC50 2100 2000-2100 72 ChronicVizon Scitec Fish Fathead minnows Pimephales promelas Embryo 7 d Lab Water UO2(NO3)2.6H20 LC50 2000 2000-2100 131 ChronicVizon Scitec Fish Fathead minnows Pimephales promelas Embryo 7 d Lab Water UO2(NO3)2.6H20 LC50 1500 1300-1700 244 ChronicVizon Scitech Fish Fathead minnows Pimephales promelas Embryo 7 d Lab Water UO2(NO3)2.6H20 NOEC 810-1200 ChronicVizon Scitech 2004 Fish Fathead minnows Pimephales promelas 7 d Lab Water UO2(NO3)2.6H20 LC10 1040 ChronicVizon Scitech 2004 Fish Fathead minnows Pimephales promelas Embryo 7 d UO2(NO3)2.6H20 LOEC 1300-2000 1300-2000 6.3-7.0 24.0-25.8 ChronicVizon Scitech 2004 Fish Fathead minnows Pimephales promelas Embryo 7 d UO2(NO3)2.6H20 MATC 990-1500 990-1500 6.3-7.0 24.0-25.8 ChronicVizon Scitech 2004 Fish Fathead minnows Pimephales promelas Embryo 7 d UO2(NO3)2.6H20 LC10 1200 1200 6.3-7.0 23 24.0-25.8 ChronicVizon Scitech 2004 Fish Fathead minnows Pimephales promelas Embryo 7 d UO2(NO3)2.6H20 LC10 1300 1300 6.3-7.0 72 24.0-25.8 ChronicVizon Scitech 2004 Fish Fathead minnows Pimephales promelas Embryo 7 d UO2(NO3)2.6H20 LC10 760 760 6.3-7.0 131 24.0-25.8 ChronicVizon Scitech 2004 Fish Fathead minnows Pimephales promelas Embryo 7 d UO2(NO3)2.6H20 LC10 980 980 6.3-7.0 244 24.0-25.8 Chronic
Liber et al. 2005 Fish Fish Esox lucius Embryos 65 d Lab Water UO2(NO3)2.6H20 NOEC 4320 ChronicLiber et al. 2005 Fish Fish Esox lucius Embryos 65 d Lab Water UO2(NO3)2.6H20 MATC 2550 Chronic
Effective U conc (ug/L)
Toxicity Estimate Range (ug/L)
Hardness (mg/L CaCO3)
ReferenceTaxonomic group Common name Scientific name Life stage
Exposure Duration Test Medium Uranium Test Endpoint
Toxicity Estimate
(ug/L) pH Temp (oC)
Toxicity Endpoint
Bywater et al. 1991 Fish Black-banded rainbowfish Melanotaenia nigrans 7 d 96 h UO2SO4 LC1 370 370 6.57 4.56 27 AcuteBywater et al. 1991 Fish Black-banded rainbowfish Melanotaenia nigrans 90 d 96 h Lab Water UO2SO4 LC50 1900 1900 1530-2280 6.57 4.56 27 AcuteBywater et al. 1991 Fish Black-banded rainbowfish Melanotaenia nigrans 90 d 96 h UO2SO4 LC1 920 920 6.57 4.56 27 Acute
Bywater et al. 1991 Fish Chequered rainbowfish M. splendida inornata 7 d 96 h Lab Water UO2SO4 LC50 2660 2660 2170-3280 6.57 4.56 27 AcuteBywater et al. 1991 Fish Chequered rainbowfish M. splendida inornata 7 d 96 h UO2SO4 LC1 880 880 6.57 4.56 27 AcuteBywater et al. 1991 Fish Chequered rainbowfish M. splendida inornata 90 d 96 h Lab Water UO2SO4 LC50 3460 3460 2350-6570 6.57 4.56 27 AcuteBywater et al. 1991 Fish Chequered rainbowfish M. splendida inornata 90 d 96 h UO2SO4 LC1 260 260 6.57 4.56 27 AcuteHoldway 1992 Fish Chequered rainbowfish M. splendida inornata 14 d 96 h U(SO4)2.4H2O LC50 1390 1390 6.56 3.97 30 AcuteHoldway 1992 Fish Chequered rainbowfish M. splendida inornata 14 d 96 h U(SO4)2.4H2O LC1 320 320 6.56 3.97 30 AcuteHoldway 1992 Fish Chequered rainbowfish M. splendida inornata 31 d 7 d U(SO4)2.4H2O LC50 1570 1570 6.3 4.07 30 ChronicHoldway 1992 Fish Chequered rainbowfish M. splendida inornata 31 d 7 d U(SO4)2.4H2O LC1 420 420 6.3 4.07 30 Chronic
Bywater et al. 1991 Fish Northern purple spotted gudgeon Mogurnda mogurnda 7 d 96 h Lab Water UO2SO4 LC50 1110 1110 1120-1900 6.58-6.64 27 AcuteBywater et al. 1991 Fish Northern purple spotted gudgeon Mogurnda mogurnda 7 d 96 h UO2SO4 LC1 158 158Bywater et al. 1991 Fish Northern purple spotted gudgeon Mogurnda mogurnda 90 d 96 h Lab Water UO2SO4 LC50 1460 1460 1120-1900 6.58-6.64 27 AcuteBywater et al. 1991 Fish Northern purple spotted gudgeon Mogurnda mogurnda 90 d 96 h UO2SO4 LC1 230 230Holdway 1992 Fish Northern purple spotted gudgeon Mogurnda mogurnda 6 d 96 h U(SO4)2.4H2O LC50 1570 1570 6.56 3.2 30 AcuteHoldway 1992 Fish Northern purple spotted gudgeon Mogurnda mogurnda 6 d 96 h U(SO4)2.4H2O LC1 700 700 6.56 3.2 30 AcuteHoldway 1992 Fish Northern purple spotted gudgeon Mogurnda mogurnda 40 d 96 h U(SO4)2.4H2O LC50 3290 3290 6.56 3.2 30 AcuteHoldway 1992 Fish Northern purple spotted gudgeon Mogurnda mogurnda 70 d 96 h U(SO4)2.4H2O LC50 3290 3290 6.56 3.2 30 AcuteMarkich and Camilleri 1997Fish Gudgeon fish Mogurnda mogurnda 96 h Unknown BEC10 1270 1270 6 4 AcuteMarkich and Camilleri 1997Fish Gudgeon fish Mogurnda mogurnda 96 h Unknown MDEC 1298 1298 6 4 AcuteMarkich and Camilleri 1997Fish Gudgeon fish Mogurnda mogurnda 96 h Unknown LC50 1570 1570 6 4 AcuteMarkich and Camilleri 1997Fish Gudgeon fish Mogurnda mogurnda 96 h Unknown LC50 1360 1360 6 4 AcuteHoldway 1992 Fish Purple spotted gudgeon fish Mogurnda mogurnda 1 d 14 d U(SO4)2.4H2O LC50 > 1790 > 1790 6.43 3.12 27.1 ChronicHoldway 1992 Fish Purple spotted gudgeon fish Mogurnda mogurnda 1 d 14 d U(SO4)2.4H2O LC1 750 750 6.43 3.12 27.1 ChronicHoldway 1992 Fish Purple spotted gudgeon fish Mogurnda mogurnda 1 d 14 d U(SO4)2.4H2O NOEC 880 880 6.43 3.12 27.1 ChronicHoldway 1992 Fish Purple spotted gudgeon fish Mogurnda mogurnda 1 d 14 d U(SO4)2.4H2O LOEC 1790 1790 6.43 3.12 27.1 ChronicHoldway 1992 Fish Purple spotted gudgeon fish Mogurnda mogurnda 1 d 14 d U(SO4)2.4H2O MATC 1255 1255 6.43 3.12 27.1 ChronicHoldway 1992 Fish Purple spotted gudgeon fish Mogurnda mogurnda 1 d 7 d U(SO4)2.4H2O LC50 1590 1590 6.3 4.07 30 ChronicHoldway 1992 Fish Purple spotted gudgeon fish Mogurnda mogurnda 1 d 7 d U(SO4)2.4H2O LC1 1270 1270 6.3 4.07 30 ChronicHoldway 1992 Fish Purple spotted gudgeon fish Mogurnda mogurnda 40 d 7 d U(SO4)2.4H2O LC50 2690 2690Holdway 1992 Fish Purple spotted gudgeon fish Mogurnda mogurnda 40 d 7 d U(SO4)2.4H2O LC1 910 910Holdway 1992 Fish Purple spotted gudgeon fish Mogurnda mogurnda 70 d 7 d U(SO4)2.4H2O LC50 3290 3290
Bywater et al. 1991 Fish Mariana's hardyhead Craterocephalus marianae Juvenile 96 h Lab Water UO2SO4 LC50 1220 1220 820-1610 6.57 4.56 27 AcuteBywater et al. 1991 Fish Mariana's hardyhead Craterocephalus marianae 96 h UO2SO4 LC1 260 260 6.57 4.56 27 Acute
Bywater et al. 1991 Fish Delicate blue-eyes Pseudomugil tenellus Juvenile 96 h Lab Water UO2SO4 LC50 730 730 500-990 6.57 4.56 27 AcuteBywater et al. 1991 Fish Delicate blue-eyes Pseudomugil tenellus 96 h UO2SO4 LC1 71 71 6.57 4.56 27 Acute
Bywater et al. 1991 Fish Reticulated perchlet Ambassis macleayi Juvenile 96 h Lab Water UO2SO4 LC50 800 800 550-1080 6.57 4.56 27 Acute
Bywater et al. 1991 Fish Reticulated perchlet Ambassis macleayi 96 h UO2SO4 LC1 73 73 6.57 4.56 27 Acute
Trapp 1986 Fish Bluegill Lepomis macrochirus 96 h Lab Water UO2(NO3)2.6H2O LC50 1670 1670 Acute
Effective U conc (ug/L)
Toxicity Estimate Range (ug/L)
Hardness (mg/L CaCO3)

ReferenceTaxonomic group Common name Scientific name Life stage
Exposure Duration Test Medium Uranium Test Endpoint
Toxicity Estimate
(ug/L) pH Temp (oC)
Toxicity Endpoint
Hamilton 1995 Fish Razorback sucker Xyrauchen texanus Fry 96 h Lab Water Uranyl nitrate LC50 46000 46000 36000-60000 7.8 196 25 Acute
Hamilton 1995 Fish Fish - Bonytail Gila elegans Fry 96 h Lab Water Uranyl nitrate LC50 46000 46000 36000-600007.8 (7.3-8.2) 196 (182-201) 23 (21-25) Acute
Liber et al. 2005 Fish Northern Pike Esox lucius 7 d Lab Water UO2(NO3)2.6H2O LC10 2550 ChronicLiber et al. 2005 Fish Northern Pike Esox lucius 65 d UO2(NO3)2.6H2O NOEC 1510 1510 7.9 63 8.1 ChronicLiber et al. 2005 Fish Northern Pike Esox lucius 65 d UO2(NO3)2.6H2O LOEC 4320 4320 7.9 63 8.1 ChronicLiber et al. 2005 Fish Northern Pike Esox lucius 65 d UO2(NO3)2.6H2O MATC 2550 2550 7.9 63 8.1 Chronic
Keklak et al. 1994 Fish Eastern Mosquitofish Gambusia holbrooki 7 d UO2(NO3)2 LC50 2570 6.87-6.92 5.8-6.1 19.0-19.7 Chronic
In Table 11 CCME (2011)In Table 15 in CCME (2011) - Acute AsessmentIn Table 17 in CCME (2011) - Chronic Assessment
# further notes in Table 11 (CCME, 2011)
Effective U conc (ug/L)
Toxicity Estimate Range (ug/L)
Hardness (mg/L CaCO3)
(Part A)
Table B4: Algae-Plants
Reference Taxonomic group Common name Scientific name Life stageExposure Duration Test Medium Uranium Test Endpoint
Toxicity Estimate (ug/L)
Effective U conc (ug/L) pH Temp (oC)
Toxicity Endpoint
Vizon Scitech 2004 geomeanAlgae Algae Pseudokirchneriella subcapitata 72 h UO2(NO3)2.6H20 IC10 (growth) 40 AcuteVizon Scitech 2004 Algae Algae Pseudokirchneriella subcapitata 72 h UO2(NO3)2.6H20 IC25 27-150 AcuteVizon Scitech 2004 Algae Algae Pseudokirchneriella subcapitata 72 h UO2(NO3)2.6H20 NOEC 14-220 AcuteVizon Scitech 2004 Algae Algae Pseudokirchneriella subcapitata 72 h UO2(NO3)2.6H20 LOEC 29-430 AcuteVizon Scitech 2004 Algae Algae Pseudokirchneriella subcapitata 72 h UO2(NO3)2.6H20 IC10 5.4-120 AcuteLiber et al. 2007 Algae Algae Pseudokirchneriella subcapitata 72 h UO2(NO3)2.6H20 NOEC 570 7.8-9.7 70 22 AcuteLiber et al. 2007 Algae Algae Pseudokirchneriella subcapitata 72 h UO2(NO3)2.6H20 LOEC 1110 7.8-9.7 70 22 AcuteLiber et al. 2007 Algae Algae Pseudokirchneriella subcapitata 72 h UO2(NO3)2.6H20 IC50 730 7.8-9.7 70 22 AcuteLiber et al. 2007 Algae Algae Pseudokirchneriella subcapitata 72 h UO2(NO3)2.6H20 IC25 190 7.8-9.7 70 22 AcuteLiber et al. 2007 Algae Algae Pseudokirchneriella subcapitata 72 h UO2(NO3)2.6H20 IC10 57 7.8-9.7 70 22 AcuteVizon Sci Tech 2004 Algae Algae Pseudokirchneriella subcapitata 72 h UO2(NO3)2.6H20 MATC 20-310 6.8-8.2 5-228 24.3-25.8 AcuteVizon Sci Tech 2004 Algae Algae Pseudokirchneriella subcapitata 72 h UO2(NO3)2.6H20 IC10 5.4 6.8-8.2 15 24.3-25.8 Acute
IC10 38Vizon Sci Tech 2004 Algae Algae Pseudokirchneriella subcapitata 72 h UO2(NO3)2.6H20 IC10 55 6.8-8.2 64 24.3-25.8 AcuteVizon Sci Tech 2004 Algae Algae Pseudokirchneriella subcapitata 72 h UO2(NO3)2.6H20 IC10 54 6.8-8.2 122 24.3-25.8 AcuteVizon Sci Tech 2004 Algae Algae Pseudokirchneriella subcapitata 72 h UO2(NO3)2.6H20 IC10 120 6.8-8.2 228 24.3-25.8 Acute
Charles et al. 2002 Algae Algae Chlorella sp. (Australian) 72 h Lab Water UO2SO4.3H2O EC50 (growth) 56 7 8 soft 27 AcuteCharles et al. 2002 Algae Algae Chlorella sp. (Australian) 72 h Lab Water UO2SO4.3H2O EC50 (growth) 270 7 400 very hard 27 AcuteCharles et al. 2002 Algae Algae Chlorella sp. (Australian) 4-5 days 72 h UO2SO4.3H2O MDEC (growth) 1.6-12 7 8-400 27 AcuteFranklin et al. 2000 Algae Algae Chlorella sp. (Australian) 72 h Lab Water UO2SO4.3H2O Growth 78 5.7 27 AcuteFranklin et al. 2000 Algae Algae Chlorella sp. (Australian) 72 h Lab Water UO2SO4.3H2O Growth 44 6.5 27 AcuteFranklin et al. 2000 Algae Algae Chlorella sp. (Australian) 72 h UO2SO4.3H2O MDEC (growth) 34 5.7Franklin et al. 2000 Algae Algae Chlorella sp. (Australian) 72 h UO2SO4.3H2O MDEC (growth) 13 6.5Hogan et al. 2005 Algae Algae Chlorella sp. (Australian) 72 h Synthetic creek water Uranium IC50 (growth) 74 6.2 27 AcuteHogan et al. 2005 Algae Algae Chlorella sp. (Australian) 72 h Synthetic creek water Uranium NOEC (growth) 38 6.2 27 AcuteHogan et al. 2005 Algae Algae Chlorella sp. (Australian) 72 h Synthetic creek water Uranium LOEC (growth) 70 6.2 27 AcuteHogan et al. 2005 Algae Algae Chlorella sp. (Australian) 72 h Magela Creek Water Uranium IC50 (growth) 137 6.2 27 AcuteHogan et al. 2005 Algae Algae Chlorella sp. (Australian) 72 h Magela Creek Water Uranium NOEC (growth) 72 6.2 27 AcuteHogan et al. 2005 Algae Algae Chlorella sp. (Australian) 72 h Magela Creek Water Uranium LOEC (growth) 120 6.2 27 Acute
Vizon Scitech Algae Algae Selenstrum capricornutum 72 h UO2(NO3)2.6H20 IC50 (growth inhibition) 160 5 AcuteVizon Scitech Algae Algae Selenstrum capricornutum 72 h UO2(NO3)2.6H20 IC50 (growth inhibition) 170 15 AcuteVizon Scitech Algae Algae Selenstrum capricornutum 72 h UO2(NO3)2.6H20 IC50 (growth inhibition) 100 64 AcuteVizon Scitech Algae Algae Selenstrum capricornutum 72 h UO2(NO3)2.6H20 IC50 (growth inhibition) 220 122 AcuteVizon Scitech Algae Algae Selenstrum capricornutum 72 h UO2(NO3)2.6H20 IC50 (growth inhibition) 200 Acute
Fortin et al. 2004 and Gilbin et al. 2003Algae Algae Chlamydomas reinhardtii 48 h Unknown IC50 68.3 5 AcuteFortin et al. 2004 and Gilbin et al. 2003Algae Algae Chlamydomas reinhardtii 48h Unknown IC50 4000 7 AcuteLavoie et al. 2014 Algae Algae Chlamydomas reinhardtii 96 h Lab Water UO2(NO3)2 EC50 (growth) 1.8 x 10⁻⁹ M UO2 2 7 20Lavoie et al. 2014 Algae Algae Chlamydomas reinhardtii 96 h Lab Water UO2(NO3)2 EC50 (growth) 1.2 x 10⁻⁷ M UO2 2 5 20
Vino and Larpant 1984 Algae Algae Scenedesmus subspicatus 120 h Lab Water Uranium LC50 (population growth) 36300 Chronic
Vizon Scitech 2004 Algae Algae Cryptomonas erosa 6 d UO2(NO3)2.6H20 IC10 (growth) 172 7.1-9.1 101 20.8 ChronicVizon Scitech 2004 Algae Algae Cryptomonas erosa 6 d UO2(NO3)2.6H20 NOEC 1310 7.1-9.1 101 20.8 ChronicVizon Scitech 2004 Algae Algae Cryptomonas erosa 6 d UO2(NO3)2.6H20 LOEC 1970 7.1-9.1 101 20.8 ChronicVizon Scitech 2004 Algae Algae Cryptomonas erosa 6 d UO2(NO3)2.6H20 IC50 1260 7.1-9.1 101 20.8 ChronicVizon Scitech 2004 Algae Algae Cryptomonas erosa 6 d UO2(NO3)2.6H20 IC25 440 7.1-9.1 101 20.8 Chronic
Liber et al. 2007 Macrophyte Duckweed Lemna minor 7 d UO2(NO3)2.6H2O IC10 (dry weight) 3100 ChronicVizon Scitech Macrophyte Duckweed Lemna minor 7 d UO2(NO3)2.6H20 IC50 (growth inhibition - front number) 7400 6400-9200 35 ChronicVizon Scitech Macrophyte Duckweed Lemna minor 7 d UO2(NO3)2.6H20 IC50 (growth inhibition - front number)16400 14800-18200 137 ChronicVizon Scitech Macrophyte Duckweed Lemna minor 7 d UO2(NO3)2.6H20 IC50 (dry weight) 13100 9100-15600 35 ChronicVizon Scitech Macrophyte Duckweed Lemna minor 7 d UO2(NO3)2.6H20 IC50 (dry weight) 35500 5600-53200 137 ChronicVizon Scitech Macrophyte Duckweed Lemna minor 7 d UO2(NO3)2.6H20 IC25 (frond number) 4700-12300 ChronicVizon Scitech Macrophyte Duckweed Lemna minor 7 d UO2(NO3)2.6H20 IC25 (dry weight) 6400-13300 ChronicVizon Scitech Macrophyte Duckweed Lemna minor 7 d UO2(NO3)2.6H20 IC10 (frond number) 3400 5.7-6.8 3 to 4 ChronicVizon Scitech Macrophyte Duckweed Lemna minor 7 d UO2(NO3)2.6H20 IC10 (dry weight) 3100 5.7-6.8 3 to 4 ChronicHogan et al. 2010 Macrophyte Duckweed Lemna aequinoctialis 96 h Creek water UO2SO4.3H2O IC10 (frond number) 234 5.7-6.8 3 to 4 ChronicHogan et al. 2010 Macrophyte Duckweed Lemna aequinoctialis 96 h Creek water UO2SO4.3H2O IC10 (frond number) 244 5.7-6.8 3 to 4 ChronicHogan et al. 2010 Macrophyte Duckweed Lemna aequinoctialis 96 h Creek water UO2SO4.3H2O IC10 (frond number) 191 5.7-6.8 3 to 4 Chronic
In Table 11 CCME (2011)In Table 15 in CCME (2011) - Acute AsessmentIn Table 17 in CCME (2011) - Chronic Assessment
# further notes in Table 11 (CCME, 2011)
Toxicity Estimate Range (ug/L)
Hardness (mg/L
CaCO3)

Table B5: Other inverterbrates
ReferenceTaxonomic group Common name Scientific name Life stage
Exposure Duration Test Medium Uranium Test Endpoint
Toxicity Estimate
(ug/L) pHTemp
(oC)
Toxicity Endpoint
Labrot et al. 1999 Invertebrate Asian clam Corbicula fluminea Adults 96 h Lab Water Uranyl acetate LC50 1872080 228000-3516000 7.86 178 ChronicLabrot et al. 1999 Invertebrate Asian clam Corbicula fluminea Adults 96 h Lab Water Uranyl acetate BCF 7.86 178 NAFournier et al. 2004 Invertebrate Asian clam Corbicula fluminea Adults 96 h Lab Water UO2(NO3)2.6H20 EC50 (Valve closure) 12 5.5 AcuteFournier et al. 2004 Invertebrate Asian clam Corbicula fluminea Adults 96 h Lab Water UO2(NO3)2.6H20 EC50 (Valve closure) 31 6.5 Acute
Markich et al. 2000 Invertebrate Bivalve Velesunio angasi 0.1-30 years 48 h UO2SO4.3H2O BEC10 81-805 5.0-6.0 3.71 28 AcuteMarkich et al. 2000 Invertebrate Bivalve Velesunio angasi 0.1-30 years 48 h UO2SO4.3H2O MDEC 84-845 5.0-6.0 3.71 28 AcuteMarkich et al. 2000 Invertebrate Bivalve Velesunio angasi 0.1-30 years 48 h UO2SO4.3H2O EC50 103-1080 5.0-6.0 3.71 28 Acute
Labrot et al. 1999 Invertebrate Eisenia fetida Eisenia fetida Adults 96 h Lab Water Uranyl acetate LC50 13480 2630-22900 7.86 178 AcuteLabrot et al. 1999 Invertebrate Eisenia fetida Eisenia fetida Adults 96 h Lab Water Uranyl acetate BCF 882 x 10-3 7.86 178 NA
Riethmuller et al. 2001 Invertebrate Hydra Hydra viridissima 96 h Lab Water Uranium stock solution Population growth - soft 114 107-121 6 6.6 27 AcuteRiethmuller et al. 2001 Invertebrate Hydra Hydra viridissima 96 h Lab Water Uranium stock solution Population growth - mod hard 174 150-192 6 165 27 AcuteRiethmuller et al. 2001 Invertebrate Hydra Hydra viridissima 96 h Lab Water Uranium stock solution Population growth - hard 219 192-246 6 330 27 AcuteRiethmuller et al. 2001 Invertebrate Hydra Hydra viridissima 96 h Unknown MDEC (popn growth) 32-90 6 6.6-330 27Riethmuller et al. 2001 Invertebrate Hydra Hydra viridissima 96 h Unknonw EC50 (popn growth) 114-219 6 6.6-330 27Hyne et al. 1992 Invertebrate Hydra Hydra viridissima Mature 96 h U in envl sample NOEC (growth) > 3900 8.6 or 8.0 30 AcuteHyne et al. 1992 Invertebrate Hydra Hydra viridissima 120 h UO2SO4.3H2O LOEC (growth) 150 or 200 6.3 30 ChronicHyne et al. 1992 Invertebrate Hydra Hydra vulgaris 120 h UO2SO4.3H2O LOEC (growth) 0.4-0.55 6.3 30 Chronic
Markich and Camilleri 1997 Invertebrate Hydra Hydra viridissima 96 h Unknown BEC10 as UO2 56 6 4 AcuteMarkich and Camilleri 1997 Invertebrate Hydra Hydra viridissima 96 h Unknown MDEC as UO2 61 6 4 Acute
Khangarot Invertebrate Freshwater Oligochaete Tubifex tubifex 96 h UO2(CH3COO)2.2H2O LC50 2050 7.6 245 30 Acute
Hogan et al. 2010 Invertebrate Snail Amerianna cumingi 96 h Creek water UO2SO4.3H2O IC10 (egg production) 20 5.7-6.8 2 to 6 ChronicHogan et al. 2010 Invertebrate Snail Amerianna cumingi 96 h Creek water UO2SO4.3H2O IC10 (egg production) 5 5.7-6.8 2 to 6 ChronicHogan et al. 2010 Invertebrate Snail Amerianna cumingi 96 h Creek water UO2SO4.3H2O IC10 (egg production) 13 5.7-6.8 2 to 6 ChronicHogan et al. 2010 Invertebrate Snail Amerianna cumingi 96 h Creek water UO2SO4.3H2O IC10 (egg production) 15 5.7-6.8 2 to 6 Chronic
Burnett and Liber 2006 Invertebrate Chironomid Chironomus tentans 10 d UO2(NO3)2.6H20 LC50 6400 ChronicBurnett and Liber 2006 Invertebrate Chironomid Chironomus tentans 10 d UO2(NO3)2.6H20 LOEC 1519 ChronicBurnett and Liber 2006 Invertebrate Chironomid Chironomus tentans 10 d UO2(NO3)2.6H20 NOEC 421 ChronicBurnett and Liber 2006 Invertebrate Chironomid Chironomus tentans 10 d UO2(NO3)2.6H20 MATC 800 7.18 125 23.1 ChronicBurnett and Liber 2006 Invertebrate Chironomid Chironomus tentans 10 d UO2(NO3)2.6H20 IC50 (growth) 10200 7.18 125 23.1 ChronicMuscatello and Liber 2009 Invertebrate Chironomid Chironomus tentans 10 d 10 d Lab Water UO2(NO3)2.6H20 NOEC (growth) 39 8.2 131 23 ChronicMuscatello and Liber 2009 Invertebrate Chironomid Chironomus tentans Larvae 10 d Lab Water UO2(NO3)2.6H20 LOEC (growth) 157 7.8 134 23 ChronicMuscatello and Liber 2009 Invertebrate Chironomid Chironomus tentans Larvae 10 d UO2(NO3)2.6H20 NOEC (growth) 39 7.8 134 23 ChronicMuscatello and Liber 2009 Invertebrate Chironomid Chironomus tentans Larvae 10 d UO2(NO3)2.6H20 MATC (growth) 78 7.8 134 23 ChronicLiber et al. 2007 Invertebrate Chironomid Chironomus tentans 28 d UO2(NO3)2.6H20 EC10 (growth) 930 ChronicLiber et al. 2007 Invertebrate Chironomid Chironomus tentans 28 d UO2(NO3)2.6H20 EC50 (growth) 1250 ChronicLiber et al. 2007 Invertebrate Chironomid Chironomus tentans 28 d UO2(NO3)2.6H20 EC25 (growth) 830 ChronicLiber et al. 2007 Invertebrate Chironomid Chironomus tentans 28 d UO2(NO3)2.6H20 LC50 5010 8 80 23.1 ChronicLiber et al. 2007 Invertebrate Chironomid Chironomus tentans 28 d UO2(NO3)2.6H20 NOEC 2240 8 80 23.1 ChronicLiber et al. 2007 Invertebrate Chironomid Chironomus tentans 28 d UO2(NO3)2.6H20 LOEC 9560 8 80 23.1 ChronicLiber et al. 2007 Invertebrate Chironomid Chironomus tentans 28 d UO2(NO3)2.6H20 EC50 (growth) 4320 8 80 23.1 ChronicLiber et al. 2007 Invertebrate Chironomid Chironomus tentans 28 d UO2(NO3)2.6H20 EC25 (growth) 1930 8 80 23.1 ChronicLiber et al. 2007 Invertebrate Chironomid Chironomus tentans 28 d UO2(NO3)2.6H20 EC10 (growth) 930 8 80 23.1 Chronic
In Table 11 CCME (2011)In Table 15 in CCME (2011) - Acute AsessmentIn Table 17 in CCME (2011) - Chronic Assessment
# further notes in Table 11 (CCME, 2011)
Effective U conc (ug/L)
Toxicity Estimate Range (ug/L)
Hardness (mg/L CaCO3)

Table B6: Selected Acute Endpoints (EC50 and LC50)Part A
Taxonomic group Common name Scientific name Life stageExposure duration
Test Medium Uranium Test EndpointToxicityEstimate
(ug/L)
Conversion factor*
Effective U Conc (ug/L)
Toxicity Estimate Range (ug/L)
pHHardness
(mg/L CaCO3)Temp.
Toxicity Endpoint
Invertebrate Cladoceran Ceriodaphnia dubia <24 h 48-h Lab Water Uranyl nitrate LC50 73 0.603999594 44 6.2-7.6 Soft - 3.9-6.1 25oC AcuteInvertebrate Cladoceran Ceriodaphnia dubia <24 h 48-h Lab Water Uranium dioxide LC50 50 0.88138355 44 6.1-6.5 Soft - 3.4-4.0 25oC AcuteInvertebrate Cladoceran Ceriodaphnia dubia <24 h 48-h Lab Water Uranyl nitrate LC50 89 0.603999594 89 6.87-7.76 6.1 25.8-26.0 AcuteInvertebrate Cladoceran Ceriodaphnia dubia <24 h 48-h Lab Water Uranium dioxide LC50 60 0.88138355 60 6.87-7.76 6.1 25.8-26.0 AcuteInvertebrate Cladoceran Ceriodaphnia dubia <24 h 48-h Uranyl nitrate LC50 72 0.603999594 43 AcuteInvertebrate Cladoceran Ceriodaphnia dubia Neonates 48-h Lab Water Uranyl nitrate hexahydrate EC50 (death) 390 NA 390 350-430 7 250 20 AcuteInvertebrate Cladoceran Ceriodaphnia dubia Neonates 48-h Lab Water Uranyl nitrate hexahydrate EC50 (death) 7.8 NA 8 4.6-11.0 8 250 20 AcuteInvertebrate Cladoceran Ceriodaphnia dubia 96-h Lab Water UO2(NO3)2.6H2O LC50 160 0.473980842 76 120-170 5 AcuteInvertebrate Cladoceran Ceriodaphnia dubia 96-h Lab Water UO2(NO3)2.6H2O LC50 140 0.473980842 66 120-180 17 AcuteInvertebrate Cladoceran Ceriodaphnia dubia 96-h Lab Water UO2(NO3)2.6H2O LC50 100 0.473980842 47 14-120 124 AcuteInvertebrate Cladoceran Ceriodaphnia dubia 96-h Lab Water UO2(NO3)2.6H2O LC50 110 0.473980842 52 68-210 252 AcuteInvertebrate Daphnia magna Daphnia magna 24-h Lab Water Uranium LC50 32700 NA 32700 AcuteInvertebrate Cladoceran Daphnia pulex 48-h UO2(NO3)2.6H2O LC50 220 NA 220 5.10-5.64 2.3-3.3 20-21 Acute
Invertebrate Cladoceran Daphnia magna 48-h UO2(NO3)2.6H2O LC50 6400 0.473980842 3033 AcuteInvertebrate Cladoceran Daphnia magna <24 h 48-h Lab MH Water UO2SO4.3H2O LC50 9360 NA 8254 6900-15500 7.73 Mod hard 20oC AcuteInvertebrate Cladoceran Daphnia magna < 24 h 48-h Lab MH Water UO2SO4.3H2O LC50 5870 NA 5176 4120-8360 7.73 Mod hard 20oC AcuteInvertebrate Cladoceran Daphnia magna < 24 h 48-h Lab H Water UO2SO4.3H2O LC50 25400 NA 22400 15900-27300 8.07 Hard 20oC AcuteInvertebrate Cladoceran Daphnia magna < 24 h 48-h Lab H Water UO2SO4.3H2O LC50 17300 NA 15250 10300-25500 8.07 Hard 20oC AcuteInvertebrate Cladoceran Daphnia magna 48-h UO2SO4.3H2O LC50 6530 NA 6530 AcuteInvertebrate Cladoceran Daphnia magna First instar 48-h Lab Soft Water UO2(NO3)2.6H2O LC50 6383 NA 6320 4840-8730 7.9-8.0 66.6-72.9 20oC AcuteInvertebrate Cladoceran Daphnia magna First instar 48-h Lab MH Water UO2(NO3)2.6H2O LC50 37505 NA 36830 24450-38580 7.9-8.0 126-140 20oC AcuteInvertebrate Cladoceran Daphnia magna First instar 48-h Lab H Water UO2(NO3)2.6H2O LC50 51950 NA 46870 25660-80970 7.9-8.0 188-205 20oC AcuteInvertebrate Cladoceran Daphnia magna 48-h UO2(NO3)2.6H2O LC50 6320 NA 6320 66.6-72.9 AcuteInvertebrate Cladoceran Daiphanosoma excisum < 6 h 24-h Creek water UO2SO4 LC50 1000 NA 1000 690-1380 6.57 4.56 27oC AcuteInvertebrate Cladoceran Latonopsis fasciculata < 6 h 24-h Creek water UO2SO4 LC50 410 NA 410 320-520 6.57 4.56 27oC AcuteInvertebrate Cladoceran Dadaya macrops < 6 h 24-h Creek water UO2SO4 LC50 1100 NA 1100 810-1460 6.57 4.56 27oC AcuteInvertebrate Cladoceran Moinodaphnia macleayi < 6 h 24-h Creek water UO2SO4 LC50 1290 NA 1290 1060-1550 6.57 4.46 27oC AcuteInvertebrate Cladoceran Moinodaphnia macleayi < 6 h 48-h UO2SO4 EC50 (death) NA 160 6.63-6.92 27 AcuteInvertebrate Cladoceran Moinodaphnia macleayi < 6 h 48-h UO2SO4 EC50 (death) NA 390 Acute

Part BTaxonomic group Common name Scientific name Life stage
Exposure duration
Test Medium Uranium Test EndpointToxicityEstimate
(ug/L)
Conversion factor*
Effective U Conc (ug/L)
Toxicity Estimate Range (ug/L)
pHHardness
(mg/L CaCO3)Temp.
Toxicity Endpoint
Fish Zebrafish Danio rerio 24-h Lab Water Uranium LC50 6400 NA 6400 2100-4000 7.86 178 AcuteFish Zebrafish Brachyodanio rerio Adults 96-h Lab Water Uranyl acetate LC50 3050 NA 3050 7.86 178 AcuteFish Rainbow Trout Oncorynchus mykiss Fry 96-h Lab Water UO2(NO3)2.6H2O LC50 4200 NA 4200 2600-6700 20 AcuteFish Rainbow Trout Oncorynchus mykiss Fry 96-h Lab Water UO2(NO3)2.6H2O LC50 3900 NA 3900 2400-6300 68 AcuteFish Rainbow Trout Oncorynchus mykiss Fry 96-h Lab Water UO2(NO3)2.6H2O LC50 4000 NA 4000 2500-6300 126 AcuteFish Rainbow Trout Oncorynchus mykiss Fry 96-h Lab Water UO2(NO3)2.6H2O LC50 3800 NA 3800 2400-5900 243 AcuteFish Rainbow Trout Oncorhynchus mykiss 96-h Lab Water Not stated LC50 6200 NA 6200 AcuteFish Brook Trout Salvelinus fontinalis 48-h Lab - harness matching creek waterUO2SO4.3H2O LC50 59000 NA 59000 7.4 184 13 AcuteFish Brook Trout Salvelinus fontinalis 96-h Lab - soft water UO2SO4.3H2O LC50 5500 NA 5500 6.7 35 13 AcuteFish Brook Trout Salvelinus fontinalis 96-h Lab - hard water UO2SO4.3H2O LC50 23000 NA 23000 7.5 208 13 AcuteFish Brook Trout Salvelinus fontinalis 96-h Lab Water Not stated LC50 8000 NA 8000 6.8-7.0 30.8 14.2 AcuteFish Brook Trout Salvelinus fontinalis 120-h Lab Water Not stated LC50 7200 NA 7200 6.8-7.0 30.8 14.2 AcuteFish Flannelmouth Sucker Catostomus latipinnis Larval 96-h Lab Water Uranyl nitrate LC50 43500 NA 43500 34800-53400 7.9 (7.6-8.2) 144 34800-53400 AcuteFish Fathead minnows Pimephales promelas 96-h Lab Water UO2(NO3)2.6H2O LC50 2000 NA 2000 AcuteFish Fathead minnows Pimephales promelas 96-h Lab Water UO2(NO3)2.6H2O LC50 2000 NA 2000 AcuteFish Fathead minnows Pimephales promelas 96-h Lab Water UO2(NO3)2.6H2O LC50 2100 NA 2100 AcuteFish Fathead minnows Pimephales promelas 96-h Lab Water UO2(NO3)2.6H2O LC50 1800 NA 1800 6.3-7.0 23 24.0-25.8 AcuteFish Black-banded rainbowfish Melanotaenia nigrans 7 d 96-h Lab Water UO2SO4 LC50 1700 NA 1700 1240-2390 6.57 4.56 27 AcuteFish Black-banded rainbowfish Melanotaenia nigrans 90 d 96-h Lab Water UO2SO4 LC50 1900 NA 1900 1530-2280 6.57 4.56 27 AcuteFish Chequered rainbowfish M. splendida inornata 7 d 96-h Lab Water UO2SO4 LC50 2660 NA 2660 2170-3280 6.57 4.56 27 AcuteFish Chequered rainbowfish M. splendida inornata 90 d 96-h Lab Water UO2SO4 LC50 3460 NA 3460 2350-6570 6.57 4.56 27 AcuteFish Chequered rainbowfish M. splendida inornata 14 d 96-h U(SO4)2.4H2O LC50 1390 NA 1390 6.56 3.97 30 AcuteFish Northern purple spotted gudgeon Mogurnda mogurnda 7 d 96-h Lab Water UO2SO4 LC50 1110 NA 1110 1120-1900 6.58-6.64 27 AcuteFish Northern purple spotted gudgeon Mogurnda mogurnda 90 d 96-h Lab Water UO2SO4 LC50 1460 NA 1460 1120-1900 6.58-6.64 27 AcuteFish Northern purple spotted gudgeon Mogurnda mogurnda 6 d 96-h U(SO4)2.4H2O LC50 1570 NA 1570 6.56 3.2 30 AcuteFish Northern purple spotted gudgeon Mogurnda mogurnda 40 d 96-h U(SO4)2.4H2O LC50 3290 NA 3290 6.56 3.2 30 AcuteFish Northern purple spotted gudgeon Mogurnda mogurnda 70 d 96-h U(SO4)2.4H2O LC50 3290 NA 3290 6.56 3.2 30 AcuteFish Gudgeon fish Mogurnda mogurnda 96-h Unknown LC50 1570 NA 1570 6 4 AcuteFish Gudgeon fish Mogurnda mogurnda 96-h Unknown LC50 1360 NA 1360 6 4 AcuteFish Purple spotted gudgeon fish Mogurnda mogurnda 40 d 7-day U(SO4)2.4H2O LC50 2690 NA 2690 AcuteFish Purple spotted gudgeon fish Mogurnda mogurnda 70 d 7-day U(SO4)2.4H2O LC50 3290 NA 3290 AcuteFish Mariana's hardyhead Craterocephalus marianae Juvenile 96-h Lab Water UO2SO4 LC50 1220 NA 1220 820-1610 6.57 4.56 27 AcuteFish Delicate blue-eyes Pseudomugil tenellus Juvenile 96-h Lab Water UO2SO4 LC50 730 NA 730 500-990 6.57 4.56 27 AcuteFish Reticulated perchlet Ambassis macleayi Juvenile 96-h Lab Water UO2SO4 LC50 800 NA 800 550-1080 6.57 4.56 27 AcuteFish Bluegill Lepomis macrochirus 96-h Lab Water UO2(NO3)2.6H2O LC50 1670 NA 1670 AcuteFish Colorado squawfish Ptychocheilus lucius Fry 96-h Lab Water Uranyl nitrate LC50 46000 NA 46000 36000-60000 7.8 (7.3-8.2) 196 (182-201) 23 (21-25) AcuteFish Razorback sucker Xyrauchen texanus Fry 96-h Lab Water Uranyl nitrate LC50 46000 NA 46000 36000-60000 7.8 196 25 AcuteFish Fish - Bonytail Gila elegans Fry 96-h Lab Water Uranyl nitrate LC50 46000 NA 46000 36000-60000 7.8 (7.3-8.2) 196 (182-201) 23 (21-25) AcuteInvertebrate Freshwater Oligochaete Tubifex tubifex 96-h UO2(CH3COO)2.2H2O LC50 NA 2050 7.6 245 30 Acute
* Conversion factor - where U was not reported as "effective U" a conversion factor was applied according to the percentage uranium in the tested compound (by molecular weight)

Table B7: Selected Chronic Endpoints (EC10 and IC10)
Reference Taxonomic group
Common name Scientific name Life stage Exposure
durationTest
Medium Uranium Test EndpointToxicity Estimate
(ug/L)
Conversion factor
Effective U conc (ug/L)
Toxicity Estimate Range (ug/L)
pHHardness
(mg/L CaCO3)
Temp (oC)
Toxicity Endpoint
Liber et al. 2007 Invertebrate Amphipod Hyalella azteca 2-9 days 28-day Lab Water UO2(NO3)2.6H2O EC10 (Growth) 12 NA 12 8.2 73 23 ChronicLiber et al. 2007 Invertebrate Cladoceran Ceriodaphnia dubia 7-day Lab Water UO2(NO3)2.6H2O IC10 (reproduction) 73 NA 35 ChronicLiber et al. 2007 Invertebrate Cladoceran Ceriodaphnia dubia 7-day UO2(NO3)2.6H2O EC10 (reproduction) 1900 NA 1900 ChronicVizon Scitech 2004 Invertebrate Cladoceran Ceriodaphnia dubia 7-day Lab Water UO2(NO3)2.6H2O IC10 (repro) 33 NA 33 6.5-7.3 5 21.4-26.2 ChronicVizon Scitech 2004 Invertebrate Cladoceran Ceriodaphnia dubia 7-day Lab Water UO2(NO3)2.6H2O IC10 (repro) 59 NA 59 6.5-7.3 17 21.4-26.2 ChronicVizon Scitech 2004 Invertebrate Cladoceran Ceriodaphnia dubia 7-day Lab Water UO2(NO3)2.6H2O IC10 (repro) 22 NA 22 6.5-7.3 124 21.4-26.2 ChronicVizon Scitech 2004 Invertebrate Cladoceran Ceriodaphnia dubia 7-day Lab Water UO2(NO3)2.6H2O IC10 (repro) 25 NA 25 6.5-7.3 252 21.4-26.2 Chronic
Zeman et al. 2008 Invertebrate Cladoceran Ceriodaphnia dubia Neonates 21-day Lab WaterUranyl nitrate hexahydrate EC10 (repro) 14 0.47398084 7 7.0-12.0 7 250 20 Chronic
Poston et al. 1984 Invertebrate Cladoceran Daphnia magna 21-day UO2(NO3)2.6H2O EC10 (reproduction) 123 NA 123 ChronicPoston et al. 1984 Invertebrate Cladoceran Daphnia magna 21-day UO2(NO3)2.6H2O EC10 (reproduction) 373 NA 373 ChronicPoston et al. 1984 Invertebrate Cladoceran Daphnia magna 21-day UO2(NO3)2.6H2O EC10 (reproduction) 1160 NA 1160 ChronicPoston et al. 1984 Invertebrate Cladoceran Daphnia magna 21-day UO2(NO3)2.6H2O EC10 (reproduction) 1360 NA 1360 ChronicLiber et al. 2007 Invertebrate Cladoceran Daphnia magna 21-day Lab Water UO2(NO3)2.6H2O EC10 (reproduction) 530 0.47398084 251 ChronicLiber et al. 2007 Invertebrate Cladoceran Daphnia magna 21-day UO2(NO3)2.6H2O EC10 (reproduction) 570 NA 570 8.0-8.4 75 22 Chronic
Liber et al. 2007 and Poston et al. 1984 geomean Invertebrate Cladoceran Simocephalus serrulatus 7-day Lab Water UO2(NO3)2.6H2O EC10 (reproduction) 480 0.47398084 228 ChronicLiber et al. 2007 Invertebrate Cladoceran Simocephalus serrulatus 21-day UO2(NO3)2.6H2O EC10 (reproduction) 480 NA 480 8.0-8.4 78 17.2 ChronicLiber et al. 2007 Invertebrate Chironomid Chironomus tentans 28-day UO2(NO3)2.6H2O EC10 (growth) 441 NA 441 ChronicLiber et al. 2007 Invertebrate Chironomid Chironomus tentans 28-day UO2(NO3)2.6H2O EC10 (growth) 930 NA 930 8 80 23.1 ChronicVizon Scitech 2004 Fish Rainbow Trout Oncorynchus mykiss Embryos 30-day Lab Water UO2(NO3)2.6H2O EC10 260 NA 260 6.3-7.2 6 13.3-15.2 ChronicVizon Scitch 2004 Fish Rainbow Trout Oncorynchus mykiss Embryos 30-day Lab Water UO2(NO3)2.6H2O EC10 480 NA 480 6.3-7.2 61 13.3-15.2 ChronicVizon Scitech Fish Fathead minnows Pimephales promelas Embryo 7-day Lab Water UO2(NO3)2.6H2O EC10 760 NA 760 ChronicVizon Scitech Fish Fathead minnows Pimephales promelas Embryo 7-day Lab Water UO2(NO3)2.6H2O EC10 980 NA 980 ChronicVizon Scitech Fish Fathead minnows Pimephales promelas Embryo 7-day Lab Water UO2(NO3)2.6H2O EC10 1200 NA 1200 ChronicVizon Scitech Fish Fathead minnows Pimephales promelas Embryo 7-day Lab Water UO2(NO3)2.6H2O EC10 1300 NA 1300 ChronicLiber et al. 2007 Algae Algae Pseudokirchneriella subcapitata 72-h UO2(NO3)2.6H2O IC10 57 NA 57 7.8-9.7 70 22 ChronicVizon Sci Tech 2004 Algae Algae Pseudokirchneriella subcapitata 72-h UO2(NO3)2.6H2O IC10 5.4 NA 5 6.8-8.2 15 24.3-25.8 ChronicVizon Sci Tech 2004 Algae Algae Pseudokirchneriella subcapitata 72-h UO2(NO3)2.6H2O IC10 38 NA 38 ChronicVizon Sci Tech 2004 Algae Algae Pseudokirchneriella subcapitata 72-h UO2(NO3)2.6H2O IC10 55 NA 55 6.8-8.2 64 24.3-25.8 ChronicVizon Sci Tech 2004 Algae Algae Pseudokirchneriella subcapitata 72-h UO2(NO3)2.6H2O IC10 54 NA 54 6.8-8.2 122 24.3-25.8 ChronicVizon Sci Tech 2004 Algae Algae Pseudokirchneriella subcapitata 72-h UO2(NO3)2.6H2O IC10 120 NA 120 6.8-8.2 228 24.3-25.8 ChronicVizon Scitech 2004 Algae Algae Cryptomonas erosa 6-day UO2(NO3)2.6H2O IC10 (growth) 172 NA 172 7.1-9.1 101 20.8 ChronicLiber et al. 2007 Macrophyte Duckweed Lemna minor 7-day UO2(NO3)2.6H2O IC10 (dry weight) 3100 0.47398084 1469 ChronicVizon Scitech Macrophyte Duckweed Lemna minor 7-day UO2(NO3)2.6H2O IC10 (frond number) 3400 NA 3400 ChronicVizon Scitech Macrophyte Duckweed Lemna minor 7-day UO2(NO3)2.6H2O IC10 (dry weight) 3100 NA 3100 ChronicHogan et al. 2010 Invertebrate Snail Amerianna cumingi 96 h Creek water UO2SO4.3H2O IC10 (egg production) 20 5.7-6.8 2 to 6 ChronicHogan et al. 2010 Invertebrate Snail Amerianna cumingi 96 h Creek water UO2SO4.3H2O IC10 (egg production) 5 5.7-6.8 2 to 6 ChronicHogan et al. 2010 Invertebrate Snail Amerianna cumingi 96 h Creek water UO2SO4.3H2O IC10 (egg production) 13 5.7-6.8 2 to 6 ChronicHogan et al. 2010 Invertebrate Snail Amerianna cumingi 96 h Creek water UO2SO4.3H2O IC10 (egg production) 15 5.7-6.8 2 to 6 ChronicHogan et al. 2010 Macrophyte Duckweed Lemna aequinoctialis 96 h Creek water UO2SO4.3H2O IC10 (frond number) 234 5.7-6.8 3 to 4 ChronicHogan et al. 2010 Macrophyte Duckweed Lemna aequinoctialis 96 h Creek water UO2SO4.3H2O IC10 (frond number) 244 5.7-6.8 3 to 4 ChronicHogan et al. 2010 Macrophyte Duckweed Lemna aequinoctialis 96 h Creek water UO2SO4.3H2O IC10 (frond number) 191 5.7-6.8 3 to 4 Chronic
* Conversion factor - where U was not reported as "effective U" a conversion factor was applied according to the percentage uranium in the tested compound (by molecular weight)

Appendix C Factors Affecting Aquatic Toxicity of Uranium
APPENDIX C
1.0 FACTORS AFFECTING AQUATICTOXICITY/BIOAVAILABILITYUranium is a naturally occurring element that is ubiquitous throughout the natural environment, being found in soil, water, air, plants, animals and humans (Simon and Garnier-Laplace 2004; Barillet et al. 2007; Bourrachot et al. 2008). Natural concentrations of uranium in surface waters have been found to range from a few nanograms per litre to 6 µg/L. Concentrations up to 2 mg/L have been found in waters affected by anthropogenic activities including mining, agriculture, research and military use (Simon and Garnier-Laplace 2004; Bourrachot et al. 2008; Massarin et al. 2010).
Uranium exists in the freshwater environment in a number of soluble forms, including the free uranyl ion, UO2
2+, and in complexes with inorganic and organic ligands (Hogan et al. 2005). Similar to many other metals, the environmental fate, behaviour and toxicity of uranium are dependent on abiotic factors including pH, alkalinity, hardness and dissolved organic carbon (DOC) (Markich et al. 2000; Alves et al. 2008; Sheppard et al. 2005; CCME 2011; Van Dam et al. 2012). The influence of these factors on toxicity to aquatic organisms is discussed in detail below.
1.1 pHThe effect of water pH on the toxicity of metals to aquatic organisms is inconsistent and, as a result, poorly understood (Franklin et al. 2000). Increasing water pH can result in enhanced binding/complexation of the uranyl ion by hydroxides and carbonates resulting in decreased bioavailability. On the other hand, the same increase in pH could decrease uranyl ion competition with protons for the physiologically active sites on the organism membranes (Fortin et al. 2004; CCME 2011).
Previous investigations on freshwater bivalves (Velesunio angasi and Corbicula fluminea), indicate that reductions in pH result in increased uranium toxicity (Labrot et al. 1999; Fournier et al. 2004). The authors suggest the increased toxicity may be a result of the increased abundance of the toxic free ion (UO2
2+).
The influence on varying pH has also been assessed in freshwater algae. Franklin et al. (2000) determined that decreases in pH (from 6.5 to 5.7) reduced uranium toxicity to the Australian Chlorella species.
This trend was also observed in the freshwater green alga (Chlamydomonas reinhardtii) with toxicity of the free uranyl ion at pH 5 being significantly lower than at pH 7 (Lavoie et al. 2014).
Due to the conflicting findings, the effect of pH on the toxicity of uranium to aquatic flora and fauna cannot be readily predicted.
1.2 Dissolved Organic MatterThe bioavailability, and hence toxicity, of metals is largely dependent on the physicochemical form (speciation of the metal). Free metal ions and metals in weak complexes are considered more available (and therefore more toxic) than those in strong complexes or adsorbed to colloidal and/or particulate matter (CCME 2011).
In freshwater, the uranyl ion can exist in the free form or in complexes with inorganic and organic matter in the water column. Current data on the effects of dissolved organic matter (DOM) on uranium toxicity are limited, although it is generally acknowledged that increases in DOM result in increased binding of the free ion resulting in decreased bioavailability and toxicity to freshwater organisms (CCME 2011).
Trenfield et al. (2011) found that uranium toxicity to three Australian tropical freshwater species (a fish (Mogurnda mogurnda), a hydra (Hydra viridissima) and a unicellcular green alga (Chlorella sp.)) was up to 20-times less in water containing 20 mg/L dissolved organic carbon (DOC), relative to DOC-free test waters. The decreased uranium toxicity was primarily due to a decrease in the free uranyl ion (UO2
2+. Similarly, Trenfield et al. (2012) found that the addition of 20 mg/L DOC reduced uranium toxicity 4- to 5-fold in the unicellular eukaryote Euglena gracilis.
23 June 2014Project No. 147613036-002-R-RevA
62

Appendix C Factors Affecting Aquatic Toxicity of Uranium
Markich et al. (2000) determined that increased DOM from 0 to 7.91 mg/L resulted in decreased uranium toxicity to an Australian freshwater bivalve (Velesunio angasi) by a factor of two to three. In a study on freshwater Australian algae (Chlorella sp.), Hogan et al. (2005) determined that toxicity in an artificial stream water containing limited DOM resulted in increased toxicity by two to four times that seen in natural stream water. The results of both of these studies indicate that bioavailability and toxicity of uranium is influenced by DOM.
Van Dam et al. (2012) synthesised and further analysed much of the data (including Markich et al. (2000) and Trenfield et al. (2011, 2012)) in relation to DOC effects on uranium toxicity. He found that DOC significantly reduced uranium toxicity to all species for which it had been assessed, and was consistently the best predictor of uranium toxicity based on 10% inhibitory concentration (IC10) and median inhibitory concentration (IC50), with water hardness being a significant co-predictor of IC50 concentrations.
1.3 HardnessHardness is defined as the sum of calcium and magnesium cations in solution. In the environment, one main source of hardness is dissolved limestone (CaCO3). Numerous studies have reported that as the hardness of water increases, the toxicity of uranium decreases, however, in many of these studies, true hardness is confounded with alkalinity. For example, for the cladoceran Daphnia magna, increases in water hardness and alkalinity reduce the toxicity of uranium by a factor of 7.5 (Poston et al. 1984). Riethmuller et al. (2001) determined that increasing water hardness by 50-fold resulted in a 92% decrease in uranium toxicity in the green hydra (Hydra viridissima). However, with this study, again the effect of alkalinity could not be excluded.
Charles et al. (2002) observed similar results in an Australian freshwater alga (Chlorella sp.), with a 50-fold increase in water hardness resulting in a 21% decrease in uranium toxicity. The authors suggested that the reduction in toxicity with increasing water hardness was most likely due to competition between uranium and calcium/magnesium ions for binding sites on the algal cell surface.
For fish, the effect of hardness on uranium toxicity is varied. Some evidence from older studies suggests that increased hardness results in improved short-term survival in fish exposed to uranium. For example, Tarzwell and Henderson (1960) observed 96-h LC5015 values in fathead minnows (Pimephales promelas) ranging from 2.8 mg U/L in soft water (20 mg/L as CaCO3) to 135 mg/L in hard water (400 mg/L as CaCO3). Similar results were observed in a short term study undertaken by Parkhurst et al. (1984) on toxicity of uranium to brook trout (Salvenilus fontinalis), with LC50 values ranging from 5.5 to 230 mg/L uranium in soft and hard water respectively.
More recent studies (e.g., Vizon SciTech 2004) have found conflicting results, with some tests supporting the concept that uranium toxicity is reduced by hardness and others showing the opposite. The cause of this discrepancy is likely a result of other confounding water quality parameters, including pH and alkalinity, having an influence on the results. When hardness is the only variable, it appears that true hardness has little effect on ameliorating uranium toxicity in fish species. For the amphipod Hyalella azteca, Alves et al. (2008) found that decreases in hardness alone resulted in increased toxcity.
1.4 AlkalinityCurrent data on the effect of alkalinity of the toxicity of uranium to freshwater organisms is limited. One study undertaken by Alves et al. (2008) found limited influence of alkalinity on uranium toxicity to the amphipod Hyalella azteca, compared to the influence of both pH and hardness. A study assessing the individual effects of water chemistry on uranium toxicity to green hydra (Hydra viridissima) found that at constant pH and hardness, a 25-fold increase in alkalinity (from 4 mg/L CaCO3 to 102 mg/L CaCO3) did not change uranium toxicity (EC5016 values of 177 and 171 µg/L respectively) (Riethmuller et al. 2001). The authors determined that changes in the alkalinity did not alter the concentration of the free uranyl ion and therefore toxicity was unaffected. Other studies have, however, shown that that under conditions of high alkalinity, carbonate or hydroxide-carbonate complexes do occur which result in ameliorating effects. Unfortunately, in these studies
15 LC50 = The concentration of a substance that kills 50% of the tested organisms. Higher LC50 values indicate lower toxicity.16 EC50 = the “effective concentration” that affects 50% of tested organisms. The effect endpoint varies between test species. Typical effect endpoints include those related to reproduction and growth.
23 June 2014Project No. 147613036-002-R-RevA
63

Appendix C Factors Affecting Aquatic Toxicity of Uranium
other water chemistry parameters were not constant and therefore the effects of alkalinity alone could not be determined.
23 June 2014Project No. 147613036-002-R-RevA
64

Appendix C Factors Affecting Aquatic Toxicity of Uranium
2.0 REFERENCESAlves, L.C., Borgmann, U. and D.G. Dixon. 2008. Water-sediment interactions for Hyalella azteca exposed to uranium-spiked sediment. Aquatic Toxicology 87: 187-199.
Barillet, S., Adam, C., Palluel, O. and A. Devaux. 2007. Bioaccumulation, oxidative stress, and neurotoxicity in Danio rerio exposed to different isotopic compositions of uranium. Environmental Toxicology and Chemistry 26: 497-505.
Bourrachot, S., Simon, O. and R. Gilbin. 2008. The effects of waterborne uranium on the hatching success, development, and survival of early life stages of zebrafish (Danio rerio). Aquatic Toxicology 90: 29-36.
CCME. 2011. Scientific Criteria Document for the Development of the Canadian Water Quality Guidelines for the Protection of Aquatic Life – Uranium. Canadian Council of Ministers of the Environment, Ottawa, Canada.
Charles, A.M., Markich, S.J., Stauber J.L. and L.F. De Filippis. 2002. The effect of water hardness on the toxicity of uranium to a tropical freshwater alga (Chlorella sp.). Aquatic Toxicology 60: 61-73.
Fortin, C., Dutel, L. and J. Garnier-Laplace. 2004. Uranium complexation and uptake by a green alga in relation to chemical speciation: the importance of the free uranyl ion. Environmental Toxicology and Chemistry 23: 974-981.
Fournier E., Tran, D., Denison, F., Massabuau, J. and J. Garnier-Laplace. 2004. Valve closure response to uranium exposure for a freshwater bivalve (Corbicula fluminea): quantification of the influence of pH. Environmental Toxicology and Chemistry 23: 1108-1114.
Franklin, N.M., Stauber, J.L., Markich, S.J. and R.P. Lim. 2000. pH-dependent toxicity of copper and uranium to a tropical freshwater alga (Chlorella sp.). Aquatic Toxicology 48: 275-289.
Hogan, A.C., Van Dam, R.A, Markich, S.J. and C. Camilleri. 2005. Chronic toxicity of uranium to a tropical alga (Chlorella sp.) in natural waters and the influence of dissolved organic carbon. Aquatic Toxicology 75: 343-353.
Labrot F., Narbonee, J.F., Ville, P., Saint Denis, M. and D. Ribera. 1999. Acute toxicity, toxicokinetics, and tissue target of lead and uranium in the clam Corbicula fluminea and the worm Eisenia fetida: Comparison with the fish Brachydanio rerio. Archives of Environmental Contamination and Toxicology 36: 167-178.
Lavoie, M., Sabatier, S., Garnier-Laplace, J. and C. Fortin. 2014. Uranium accumulation and toxicity in the green alga Chlamydomonas reinhardtii is modulated by pH. Environmental Toxicology and Chemistry. Accepted 28 February 2014.
Markich, S.J., Brown, P.L., Jeffree, R.A. and R.P. Lim. 2000. Valve movement responses of Velesunio angasi (Bivalvia: Hyriidae) to manganese and uranium: An exception to the free ion activity model. Aquatic Toxicology 51: 155-175.
Massarin, S., Alonzo, F., Garcia-Sachez, L., Gilbin, R., Garnier-Laplace, J. and J.C. Poggiale. 2010. Effects of chronic uranium exposure on life history and physiology of Daphnia magna over three successive generations. Aquatic Toxicology 99: 309-319.
Parkhurst, B.R., Elder, R.G., Meyer, J.S., Sanchez, D.A, Pennak, R.W. and W.T. Waller. 1984. An environmental hazard evaluation of uranium in a rocky mountain stream. Environmental Toxicology and Chemistry 3: 113-124.
Poston, T.M., Hanf, R.W. and M.A. Simmons. 1984. Toxicity of uranium to Daphnia magna. Water Air and Soil Pollution, 22, 289-298.
Riethmuller, N., Markich, S.J., Van Dam, R.A. and D. Parry. 2001. Effects of water hardness and alkalinity on the toxicity of uranium to a tropical freshwater hydra (Hydra viridissima). Biomarkers 6: 45-51.
Sheppard, S.C., Sheppard, M.I., Gallerand, M.O. and B. Sanipelli. 2005. Derivation of ecotoxicity thresholds to uranium. Journal of Environmental Radioactivity 79: 55-83.
Simon, O. and J. Garnier-Laplace. 2004. Kinetic analysis of uranium accumulation in the bivalve Corbicula fluminea: effect of pH and direct exposure levels. Aquatic Toxicology 68: 95-108.
23 June 2014Project No. 147613036-002-R-RevA
65

Appendix C Factors Affecting Aquatic Toxicity of Uranium
Tarzwell, C.M. and C. Henderson. 1960. Toxicity of less common metals to fishes. Industrial Wastes 5: 12.
Trenfield M.A., Ng, J.C., Noller, B.N., Markich, S.J. and R.A. Van Dam. 2011. Dissolved organic carbon reduces uranium bioavailability and toxicity. 2. Uranium(VI) speciation and toxicity to three tropical freshwater organisms. Environmental Science Technology 45: 3082-3089.
Trenfield M.A., Ng, J.C., Noller, B.N., Markich, S.J. and R.A. Van Dam. 2012. Dissolved organic carbon reduced uranium toxicity to the unicellular eukaryote Euglena gracilis. Ecotoxicology 21: 1013-1023.
Van Dam, R.A., Trenfield, M.A., Markich, S.J., Harford, A.J., Humphrey, A.C. and J.L. Stauber. 2012. Re-analysis of uranium toxicity data for freshwater organisms and the influence of dissolved organic carbon. Environmental Toxicology and Chemistry 31: 2606-2614.
Vizon SciTec Inc. 2004. Final report on the toxicity investigation of uranium to aquatic organisms. CNSC Project No: R205.1.
23 June 2014Project No. 147613036-002-R-RevA
66
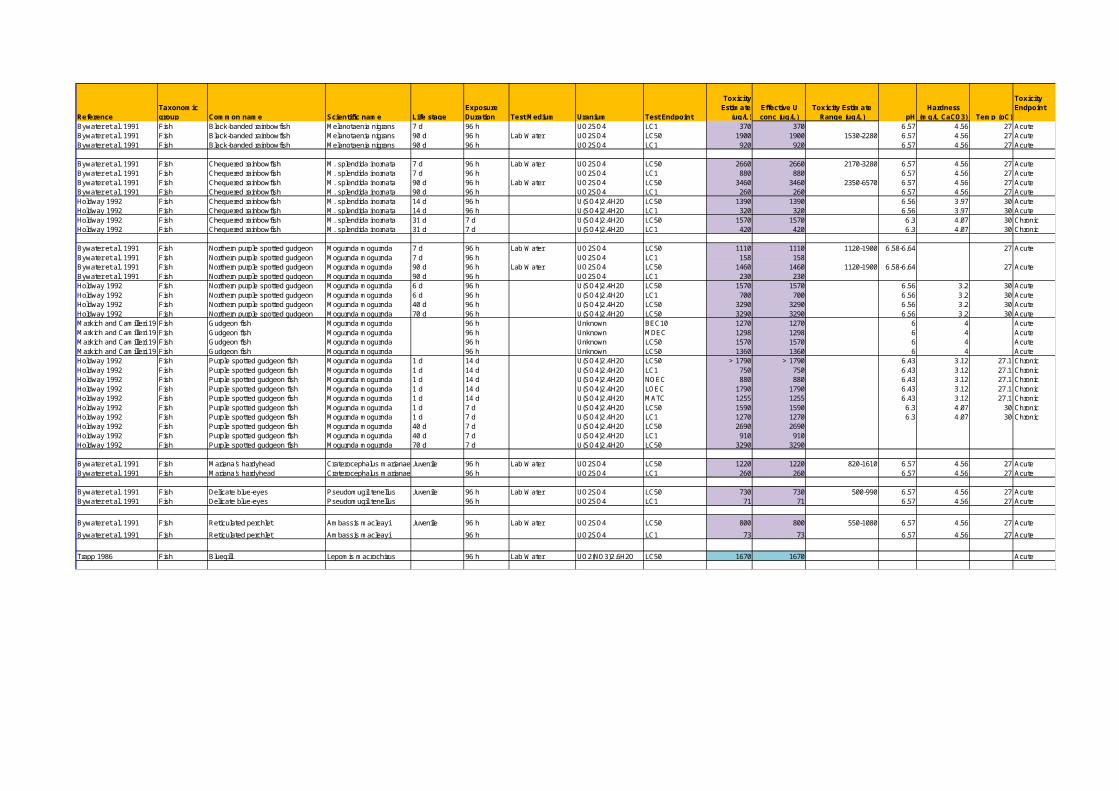
APPENDIX D
1.0 SPECIES SENSITIVITY DISTRIBUTION FOR URANIUM TOXICITYAn alternative approach to the derivation of aquatic toxicity values for uranium was undertaken. The alternative approach involved the derivation of uranium toxicity values for different levels of species protection using the EC10 chronic toxicity data17 collated for this report. A species sensitivity distribution (SSD) cumulative plot of the EC10 data was generated using BurrliOZ software made available via ANZECC and ARMCANZ (2000). Many of the water quality guideline values for protection of aquatic ecosystems in ANZECC and ARMCANZ (2000) are derived using this method.
The derived uranium toxicity values (based on chronic toxicity) for protection of different percentages of species are summarised in Table 11. Two sets of chronic toxicity values were derived: one set included all the EC10 values from the chronic toxicity dataset, and the other set included EC10 values only from studies that used soft water in the testing.
The derived uranium toxicity values were compared to toxicity values also derived using SSD plots (CCME 2011 and Van Dam 2013). Derivation and comparison of the SSD derived toxicity values was intended to benchmark the appropriateness of the acute and chronic toxicology benchmarks (55 and 25 µg/L, respectively) derived in Section 4 of the main report.
As can be seen in Table 11, the chronic SSD toxicity values for 90% and 95% protection derived using the toxicity data collated for this report are span the toxicity values derived by Van Dam (2013) and the long-term toxicity value of CCME (2011). The toxicity values derived in this report for higher (99%) and lower (80%) levels of protection differ from those of Van Dam (2013), depending on the dataset used (soft water only EC10s, or all chronic EC10s). The acute and chronic toxicity benchmarks (55 and 25 µg/L) derived for GHS classification in Section 4 of this report are similar to the acute and chronic benchmarks of CCME (2011) and the 80% protection level toxicity values derived in this report using the SSD method.
Table 11: Species Sensitivity Distribution Toxicity Values (µg/L)
BenchmarksShort-term
SSD (CCME 2011)
Long-term SSD
(CCME 2011)
Van Dam SSD (2013)
Chronic SSD (this report)
Soft Water* Chronic SSD (this report)
Endpoints used LC(EC)50s EC10s NOECs, EC10s EC10s EC10sSample size (n) 11 13 23 13 899% protection - - 2.3 0.08 5.195% protection 33 15 5.2 2.0 9.190% protection - - 8.5 7.9 1380% protection - - 17 31 21
* Soft water only studies used test water with <150 mg/L CaCO3
EC10 = the effective concentration that affects 10% of tested organisms in a laboratory toxicity testLC(EC)50 = the lethal (or effective) concentration that kills (or otherwise affects) 50% of tested organisms in a laboratory toxicity test. NOEC = no observed effect concentration from a laboratory toxicity testSSD = species sensitivity distribution.
Plots of the SSDs derived in this report are shown in Figure 101 and Figure 2 below.
17 EC10 = the effective concentration that affects 10% of tested organisms in a laboratory toxicity test
23 June 2014Project No. 147613036-002-R-RevA
67

Figure 10: Species-sensitivity distribution of uranium toxicity in freshwater
Figure 11: Species sensitivity distribution of uranium toxicity in soft freshwater (CaCO3 <150 mg/L)
23 June 2014Project No. 147613036-002-R-RevA
68

The differences in the benchmarks derived can be in part explained by the differences in the selection and treatment of raw data. Some of the differences in the alternative benchmarks reviewed are described below:
The CCME (2011) short-term SSD was based on LC(EC)50s, and the long-term SSD was based on EC10 studies. The SSD was plotted using species-specific geomeans where there were sufficient data. The chronic SSD was generated using EC10 data only. Studies using hard water were excluded.
Van Dam (2013) used NOECs and EC10s endpoints in an SSD for deriving a chronic guideline.
Both Van Dam (2013) and this report included data from a study by Trenfield et al. (2012) using the unicellular eukaryote Euglena gracilis. This organism appears to be particularly sensitivity to uranium, with an EC10 value of 5 µg/L; which is less than half the lowest toxicity value used by CCME (2011) in their derivation of the long-term toxicity value.
Overall, the alternative approach indicates that the uranium toxicity benchmarks reported in Section 4 of the main report indicate a level of species protection of around 80% or slightly higher. While it is noted that this level of protection is lower than is typically applied for the derivation of water quality guidelines, the intent of the toxicity benchmarks was to classify uranium toxicity according to GHS guidelines.
23 June 2014Project No. 147613036-002-R-RevA
69

2.0 REFERENCESANZECC and ARMCANZ 2000. Australian and New Zealand Environment and Conservation Council (ANZECC) and Agriculture and Resource Management Council of Australia and New Zealand (ARMCANZ), National Water Quality Management Strategy, Australian and New Zealand Guidelines for Fresh and Marine Water Quality, October 2000.
CCME. 2011. Scientific Criteria Document for the Development of the Canadian Water Quality Guidelines for the Protection of Aquatic Life – Uranium. Canadian Council of Ministers of the Environment, Ottawa, Canada.
Trenfield M.A., Ng, J.C., Noller, B.N., Markich S.J. and R.A. Van Dam. 2012. Dissolved organic carbon reduces uranium toxicity to the unicellular eukaryote Euglena gracilis. Ecotoxicology 21: 1013-1023.
Van Dam R. 2013. Bioavailability and toxicology of uranium in the aquatic environment. In: Determining the hydrogeochemistry, biogeochemistry, transport and fate of uranium in the context of environmental outcomes. A CSIRO Cutting edge Science Symposium. 21st – 22nd September 2013. CSIRO Centre for Environment and Life Sciences, Floreat, Western Australia, pp. 36-44.
23 June 2014Project No. 147613036-002-R-RevA
70

APPENDIX E
1.0 GOLDER ASSOCIATES TECHNICAL MEMORDANUM1.1 IntroductionThis technical memorandum prepared by Golder Associates Pty Ltd (Golder) for the Department of Industry (hereafter referred to as the Department) presents the additional testing that is recommended to support the environmental hazard classification (aquatic toxicity) for uranium products.
This document is the first deliverable for the scope of work described in Golders’ proposal (P47613016-001-P-Rev0 dated 26 February 2014) and the Department’s contract (007960, Schedule 2), and entails:
a) Written advice recommending additional testing that is recommended to meet the requirements of the Globally Harmonized System (GHS) with respect to uranium products and their aquatic toxicology classification. This advice contains:
a rationale for the additional tests;
scope of works; and
cost estimation.
b) Where the aquatic toxicity review identified evidence to distinguish between adverse chemical effects from radiological effects for uranium products this information has been summarised.
This document has been reviewed by Dr. Graeme Batley, Chief Research Scientist of Commonwealth Scientific and Industrial Research Organisation (CSIRO) Land and Water.
1.2 ObjectivesThe overarching objective of the work is to determine the environmental hazard classification (aquatic toxicity) for uranium products U3O8 and UO4 in accordance with Australian Dangerous Goods (ADG) and International Maritime Dangerous Goods (IMDG) codes.
This technical memorandum presents a cost estimate for additional aquatic ecotoxicological testing recommended to support the environmental hazard classification (aquatic toxicity) for uranium products U3O8
and UO4 in accordance with IMDG codes. As requested by the Department these tests have been identified following preliminary review of the available literature on the aquatic toxicity of uranium products in fresh and marine waters.
1.3 BackgroundUranium is currently labelled under IMDG radioactive (Class 7) and an aquatic toxicant (Class 9).
There is a widely held belief, within the uranium industry, that uranium products are most probably insoluble and therefore do not present the risk attached to the current aquatic classification. The classification determines the manner in which any spill or accident is managed and the flow of public information.
This project aims to clarify the classification and identify the “real” risk of transporting uranium products.
If uranium products are found not to be an aquatic toxicant, the United Nations Globally Harmonized System (GHS) for classifying substances (UNECE 2009) could be approached for a reclassification. If uranium products are aquatic toxicants, the current classification will remain underpinned by scientific data to support the classification.
The result will be a more informed approach to the management of spills and accidents based on scientific knowledge. This should assist in communicating ‘actual’ risks associated with uranium mining and is consistent with the Australian Government “best practice” approach to uranium mining.
23 June 2014Project No. 147613036-002-R-RevA
71

2.0 AQUATIC TOXICOLOGY DATASummarised information relating to the extent and suitability of available aquatic toxicology data for GHS classification of uranium products is presented in sections Error: Reference source not found and Error: Reference source not found. The assessment of the aquatic toxicology of uranium in accordance with GHS will be presented in the Draft Report.
2.1 Availability of Data2.1.1 Plants and AlgaeFreshwaterData on the effects from uranium on freshwater plants found during the aquatic toxicology review comprised over 10 acute and chronic studies representing over five species. No further freshwater plant data are sought to support classification of the environmental hazard of uranium products in freshwaters in accordance with GHS.
Marine waterNo studies of uranium effects on marine plants were found during the aquatic toxicology review. These data are recommended to support the environmental hazard classification of uranium products in marine waters in accordance with GHS.
2.1.2 InvertebratesFreshwaterOver 15 acute and chronic studies (representing over 10 species) of effects from uranium on freshwater invertebrates were found during the aquatic toxicology review. No further freshwater invertebrate data are sought to support classification of the environmental hazard of uranium products in freshwaters in accordance with GHS.
The available data indicate that invertebrates are the most sensitive receptor group out of plants, invertebrates and fish.
Marine waterOne study of uranium effects to a marine invertebrate was found during the aquatic toxicology review, but the data were incomplete and inadequate. This is considered to be insufficient to support the environmental hazard classification of uranium products in marine waters in accordance with GHS. Additional marine invertebrate data are recommended.
2.1.3 FishFreshwaterOver 15 acute and chronic studies representing over 10 species on freshwater fish were found during the aquatic toxicology review. No further freshwater fish data are sought to support classification of the environmental hazard of uranium products in freshwaters in accordance with GHS.
Preliminary review of the data indicates effect concentrations for fish are at the higher end of the concentration range when compared to plants and invertebrates. The available data indicate that fish are the least sensitive receptor group.
MarineNo studies of uranium effects on marine fish were found during the aquatic toxicology review. These data are recommended to support the environmental hazard classification of uranium products in marine waters in accordance with GHS
2.2 Bioaccumulation PotentialTwo bioaccumulation studies of uranium were found. One 28-day bioaccumulation study in a freshwater fish, and one study of dietary uptake of uranium in a marine crab and marine winkle. It is considered that there
23 June 2014Project No. 147613036-002-R-RevA
72

are sufficient bioaccumulation data available to support classification of the bioaccumulation potential for uranium for environmental hazard of uranium products in accordance with GHS.
2.3 Radiological EffectsAquatic ecotoxicological studies are designed to assess the effects of chemical hazards, rather than radiological (radiotoxicity) hazards. The aquatic toxicology review did not identify studies that distinguished between adverse chemical effects of uranium products from radiological effects. However, some information was found that pertained to the radiological effects of uranium on aquatic organisms. Sheppard et al. (2005) states that the chemical hazards of uranium are greater than the radioactive hazards, for both human and non-human biota (Sheppard et al. 2005). This is discussed further below.
The hazards or toxicity of chemicals to aquatic organisms are typically measured as acute effects (such as mortality) and chronic effects (such as reproduction and growth). Radiological hazards (or radiotoxicity) to aquatic organisms occur via internal radiation exposure following absorption or ingestion of radioactive media (e.g., dietary exposure from radioactive food, ingestion of radioactive water or sediment) or external radiation. Although radiological effects assessments are similarly based on acute and chronic effects, a key difference compared to chemical hazard assessments (which are based on exposure-effect) is that radionuclides are based on exposure represented by activity concentrations in a given medium-dose followed by dose–effect. Radiation dosimetry (estimation of absorbed dose) is recommended to convert activity concentrations in a given medium or biota into the quantity of energy absorbed by an organism from both internal and external sources (Garnier-Laplace et al. 2008).
Uranium has a long half-life (i.e., is a weak emitter of radiation) and natural uranium poses relatively low radioactivity (CCME, 2011). Uranium emits alpha particles which have low penetrating power. Ionizing radiation from uranium is attenuated at approximately 50 µm in water or tissue (Bleise et al. 2003; Whicker and Schultz 1982a cited in CCME, 2011). CCME (2011) states that “the radiotoxicity of uranium in the aquatic environment is expected to be minimal. Radiological effects could be expected in aquatic organisms that ingest sediment or food contaminated with uranium. However, the radiological hazard will be greater than the chemical hazard only where large amounts of uranium are ingested”.
2.4 Data GapsThe aquatic toxicological review indicates there are insufficient acute and chronic marine aquatic toxicological data available to classify the environmental hazard of uranium products for marine environments.
3.0 PROPOSED TESTINGIt is recommended that acute and chronic aquatic toxicological testing of uranium on marine species (both temperate and tropical) is performed to support GHS classification of uranium products in marine waters. This is discussed below.
3.1 RationaleEcotoxicological tests for the receptor groups algae (plants), crustacea (invertebrates) and fish are proposed, consistent with the requirements of GHS.
Testing on a mixture of temperate and tropical species is recommended because uranium products may be transported by sea in both temperate and tropical waters.
3.2 EcotoxicologicalAcute and chronic aquatic toxicological testing of uranium on marine species (both temperate and tropical) is recommended to classify the environmental hazard of uranium products in accordance with GHS. Error: Reference source not found presents the proposed aquatic toxicological recommended.
The below proposed tests reflect those available at time of preparation of this technical memorandum. Tests species can vary with season, and new tests are under development. It is recommended that the available
23 June 2014Project No. 147613036-002-R-RevA
73

tests are reviewed at time the work is commissioned, should it proceed. Tests may be substituted provided that they are consistent with GHS requirements for trophic groups, test durations and effect endpoints.
Table 1: Proposed Ecotoxicological TestsTest Type
Receptor Group
Test Organism Expose Duration
Measurement Endpoint
Effect Measured
Acute Alga Microalga (Nitzschia closterium) 72 h EC10
Algal growth /cell division test
AcuteInvertebrate
Amphipod (Melita plumulosa) 96 h L(E)C50 Survival
Acute18 Invertebrate *Copepod (Parvocalanus crassirostris) 48 h L(E)C50 Survival
Acute
Fish
Damselfish (Acanthochromis polyacanthus)
96 h L(E)C50 Imbalance
Acute Fish *Barramundi (Lates calcarifer) 96 h L(E)C50 Imbalance
Chronic Alga *Marcoalga (Hormosia banksii) 72 h EC10 Germination
ChronicInvertebrate
*Sea urchin (Heliocidaris turberculata) 72 h EC10 Larval development
Chronic19 Invertebrate *Oyster (Saccostrea echinata or glomerata) 48 h EC10 Larval development
Chronic
Fish
*Damselfish (Acanthochromis polyacanthus)
7 d EC10 Imbalance
Chronic Fish Barramundi (Lates calcarifer) 7 d EC10 Imbalance
Notes* Tests which are NATA endorsed.
3.3 ChemicalMeasurement of the concentration of uranium in test waters is recommended at time points before, during and at completion of the aquatic toxicological tests. The chemical analysis for uranium concentrations in marine water should be performed by a NATA-accredited chemical laboratory.
Concentrated solutions of uranium are needed to dose the marine water used in the aquatic toxicological tests. Uranium solutions of uranyl nitrate should be prepared by a NATA-accredited chemical laboratory and the concentrations confirmed by chemical analysis.
3.4 Proposed Laboratories3.4.1 Ecotoxicological TestingEcotox Services Australia Pty Ltd (ESA) has the capability to offer a full suite of acute and chronic marine tests for uranium in seawater. ESA perform ecotoxicological tests consistent with standard methods based on Organisation for Economic Co-operation and Development (OECD) or United States Environmental Protection Agency (USEPA) protocol. ESA are NATA accredited for a selection of the ecotoxicological tests as indicated in Error: Reference source not found.
18 As defined by GHS19 As defined by GHS
23 June 2014Project No. 147613036-002-R-RevA
74

ESA has sought advice from a radiation specialist with respect to the appropriate licencing/permitting for handing of radioactive materials and expect that the appropriate licences/permits would be granted should the marine testing proceed.
3.4.2 Preparation of Uranium Solutions for Ecotoxicological TestingStandard solutions of uranyl nitrate in artificial seawater can be prepared by CSIRO. These standards solutions would be transported from CSIRO to ESA according to applicable legislation and codes or practice for the safe transportation of radioactive materials. CSIRO are NATA-accredited for chemical testing.
CSIRO have the appropriate licencing/permitting for handing of radioactive materials should the work proceed.
4.0 COSTSThe proposed cost estimate for the work is presented in Attachment A.
The cost estimate is broken down as follows:
Ecotoxicological testing
Preparation of uranium solutions for ecotoxicological testing
The cost estimate excludes:
Disbursements associated with attainment of appropriate licences/permitting for handing of radioactive materials, including purchase of equipment, waste disposal, development of protocol and training of personnel in radiation safety for ESA and CSIRO.
Chemical analyses to confirm dissolved uranium concentrations at applicable timeframes during the ecotoxicological testing. Indicative costs are approximately $30-$75 per analysis (excluding GST), depending on the chemical laboratory selected. It is estimated that three uranium analyses per test (test-start, midpoint and test-end), plus QA/QC samples, would be required.
Project management, administration and handling charges should Golder manage the work.
Reporting to classify uranium products for marine effects according to GHS.
4.1 Co-funding OptionsThere is interest in marine ecotoxicological data for uranium to support derivation of a national marine water quality guideline in Australia. Dr. Graeme Batley (Chief Research Scientist at CSIRO Land and Water) has indicated that CSIRO may offer in-kind support for a limited number of ecotoxicological tests by performing these tests in-house. This could reduce the number of tests performed by ESA and therefore the cost. CSIRO perform ecotoxicological tests consistent with standard methods and protocol, and have developed a number of ecotoxicological tests for Australasian species that have been used in the derivation of national guidelines. CSIRO are not NATA-accredited for ecotoxicological testing.
The below organisations may be potential partners to consider in seeking co-funding or offering in-kind support:
Australian Institute of Marine Science (AIMS) located in Townsville, Queensland. AIMS are developing a number of tropical marine ecotoxicological tests.
Australian Nuclear Science and Technology Organisation (ANSTO) located in Lucas Heights, New South Wales. ANSTO can do a limited number of marine ecotoxicological tests.
Uranium mining companies in Australia.
23 June 2014Project No. 147613036-002-R-RevA
75

5.0 REFERENCESAlves. L.C., Borgmann, U. and D.G. Dixon. 2008. Water-sediment interactions for Hyalella azteca exposed to uranium-spiked sediment. Aquatic Toxicology 87: 187-199.
Bleise, A., P.R. Danesi, and W. Burkart. 2003. Properties, use and health effects of depleted uranium (DU): a general overview. J. Environ. Radioactivity. 64:93-112
CCME 2011. Canadian Council of Ministers of the Environment (CCME). Scientific Criteria Document for the Development of the Canadian Water Quality Guidelines for the Protection of Aquatic Life, Uranium. PN 1451, ISBN 978-1-896997- 97-1 PDF.
DRET 2012. Department of Resources, Energy and Tourism (DRET) and the Uranium Council. Guide to the Safe Transport of Uranium Oxide Concentrate. Commonwealth of Australia.
Garnier-Laplace, J., Copplestone, Gilbin, R., Alonzo, F., Ciffroy, P., Gilek, M., Agüero, A., Björk, M., Oughton, D. H., Jaworska, A., Larsson, C.M., Hingston, J. 2008. Issues and practices in the use of effects data from FREDERICA in the ERICA Integrated Approach. J. of Environ. Radioactivity. 99 (2008), 1474–1483.
IAEA 2011. Sources and Effects of Ionizing Radiation. United Nations Scientific Committee on the Effects of Atomic Radiation UNSCEAR 2008 Report to the General Assembly with Scientific Annexes VOLUME II Scientific Annexes C, D and E.
Markich, S.J., P.L. Brown, R.A. Jeffree, and R.P. Lim. 2000. Valve movement responses of elesunio angasi (Bivalvia: Hyriidae) to manganese and uranium: An exception to the free ion activity model. Aquat. Toxicol. 51:155-175.
Sheppard, S.C., Sheppard, M.I., Gallerand, M.O. and B. Sanipelli. 2005. Derivation of ecotoxicity thresholds to uranium. Journal of Environmental Radioactivity 79: 55-83.
van Dam, R.A., Trenfield, M.A., Markich, S.J., Harford, A.J., Humphrey, C.L., Hogan, A.C. and J.L. Stauber. 2012. Reanalysis of uranium toxicity data for selected freshwater organisms and the influence of dissolved organic carbon. Environmental Toxicology and Chemistry 31: 2606-2614.
Whicker, F.W. and V.S. Schultz. 1982. Radioecology: Nuclear Energy and the Environment. Volume 1. CRC Press.
6.0 LIMITATIONSYour attention is drawn to the document - “Limitations”, which is included in Attachment B of this technical memorandum. The statements presented in this document are intended to advise you of what your realistic expectations of this report should be. The document is not intended to reduce the level of responsibility accepted by Golder, but rather to ensure that all parties who may rely on this report are aware of the responsibilities each assumes in so doing.
7.0 CLOSINGWe trust this meets your requirements. Should you have any queries on the above memorandum please do not hesitate to contact the undersigned.
Yours Faithfully
Golder Associates Pty Ltd
23 June 2014Project No. 147613036-002-R-RevA
76

23 June 2014Project No. 147613036-002-R-RevA
77

APPENDIX F
1.0 TRANSFORMATION / DISSOLUTION TEST – LABORATORY CERTIFICATES
Please see separate attachment document for this information.
23 June 2014Project No. 147613036-002-R-RevA
78

APPENDIX G
1.0 LIMITATIONSThis Document has been provided by Golder Associates Pty Ltd (“Golder”) subject to the following limitations:
This Document has been prepared for the particular purpose outlined in Golder’s proposal and no responsibility is accepted for the use of this Document, in whole or in part, in other contexts or for any other purpose.
The scope and the period of Golder’s Services are as described in Golder’s proposal, and are subject to restrictions and limitations. Golder did not perform a complete assessment of all possible conditions or circumstances that may exist at the site referenced in the Document. If a service is not expressly indicated, do not assume it has been provided. If a matter is not addressed, do not assume that any determination has been made by Golder in regards to it.
Conditions may exist which were undetectable given the limited nature of the enquiry Golder was retained to undertake with respect to the site. Variations in conditions may occur between investigatory locations, and there may be special conditions pertaining to the site which have not been revealed by the investigation and which have not therefore been taken into account in the Document. Accordingly, additional studies and actions may be required.
In addition, it is recognised that the passage of time affects the information and assessment provided in this Document. Golder’s opinions are based upon information that existed at the time of the production of the Document. It is understood that the Services provided allowed Golder to form no more than an opinion of the actual conditions of the site at the time the site was visited and cannot be used to assess the effect of any subsequent changes in the quality of the site, or its surroundings, or any laws or regulations.
Any assessments made in this Document are based on the conditions indicated from published sources and the investigation described. No warranty is included, either express or implied, that the actual conditions will conform exactly to the assessments contained in this Document.
Where data supplied by the client or other external sources, including previous site investigation data, have been used, it has been assumed that the information is correct unless otherwise stated. No responsibility is accepted by Golder for incomplete or inaccurate data supplied by others.
Golder may have retained subconsultants affiliated with Golder to provide Services for the benefit of Golder. To the maximum extent allowed by law, the Client acknowledges and agrees it will not have any direct legal recourse to, and waives any claim, demand, or cause of action against, Golder’s affiliated companies, and their employees, officers and directors.
This Document is provided for sole use by the Client and is confidential to it and its professional advisers. No responsibility whatsoever for the contents of this Document will be accepted to any person other than the Client. Any use which a third party makes of this Document, or any reliance on or decisions to be made based on it, is the responsibility of such third parties. Golder accepts no responsibility for damages, if any, suffered by any third party as a result of decisions made or actions based on this Document.
GOLDER ASSOCIATES PTY LTD GAP Form No. LEG 04 RL 1
79
Related Documents