Welcome message from author
This document is posted to help you gain knowledge. Please leave a comment to let me know what you think about it! Share it to your friends and learn new things together.
Transcript

2
TABLE OF CONTENTS
Introduction ..................................................................................................................................... 3
Needs-Based Funding Formulas ..................................................................................................... 3
Performance-Based Funding ........................................................................................................... 5
Revenue versus Cost in Higher Education...................................................................................... 9
Funds per FTE Student from All Sources ..................................................................................... 12
The Reason for the Volume of Construction ................................................................................ 14
Arkansas Faculty Salaries ............................................................................................................. 16
Why Research Is Important .......................................................................................................... 19
Tuition and Fees ............................................................................................................................ 20
Operating Margins ........................................................................................................................ 22
Fund Balances ............................................................................................................................... 23
Institutional Scholarship Expenditures ......................................................................................... 25
Educational and General Facilities ............................................................................................... 27
Auxiliaries ..................................................................................................................................... 28
Athletics ........................................................................................................................................ 33
RECOMMENDATIONS .............................................................................................................. 38
Appendices .................................................................................................................................... 39
Appendix A: Operating Margins and Fund Balances ............................................................... 40
Appendix B: Net Tuition and Fee Income ............................................................................... 47
Appendix C: Expenditures per FTE by Function .................................................................... 52
Appendix D: Scholarships ........................................................................................................ 59
Appendix E: FAP Summary ..................................................................................................... 63
Appendix F: Bonds and Loans Approved by AHECB 2007-2017 .......................................... 65
3
The Financial Condition of Arkansas Institutions of Higher Education
Introduction The purpose of this report is to describe the financial condition as well as the challenges
experienced by Arkansas’s Public Institutions of Higher Education. These challenges have been
brought on by a number of competing, and often conflicting demands: fluctuations in
enrollments; lagging or declining state support; increasing public and political pressure to hold
tuition down; underprepared students; and students who come to college with the expectations of
new amenities and programs from the institutions.
This financial conditions report will address several topics including the equity of the needs-
based funding formulas, performance-based funding, revenues versus costs in higher education,
funds per full-time equivalent (FTE) student, the increased volume of construction on campuses,
a comparison of Arkansas faculty salaries to other Southern Regional Education Board (SREB)
states and various charts and graphs on tuition and fees by institution, expenditures by function,
fund balances, operating margins, athletic incomes and expenditures, scholarship expenditures
and measures of performance. It will also include some recommendations for future financial
policies of the Arkansas Higher Education Coordinating Board.
Needs-Based Funding Formulas – A Means for Funding Equity The needs-based funding formulas are an effort to provide an equitable means of determining
funding needs based on student semester credit hours (SSCH) by course cost and degree level.
The funding formulas also take into account the amount of square footage needed to
accommodate these hours. There are several points regarding funding formulas that must be
clarified. First, dollars per FTE is not a reasonable measure of equity since FTEs do not cost
the same to produce – nursing is more expensive to teach than history. Many people look at cost
per FTE student because it is easy to understand, but it is not a good or fair comparison for state
funding among institutions. The credit hour productions among the various disciplines and
degree levels differ significantly in terms of the cost of producing those hours. An expensive
program, such as engineering, does not increase the need for funding unless there are a

4
significant number of credit hours produced from the engineering program. Similarly having a
doctoral program does not increase funding need unless the institution is producing credit hours
at the doctoral level. The level of a course is determined by the content of the course and not
determined by the classification of the student taking the course. An upper level undergraduate
course taken by a doctoral student does not become doctoral credit hours just because the student
enrolled is pursuing a doctorate. Also, an institution’s funding does not increase automatically
when the institution moves to a higher SREB classification, i.e. from bachelor to masters.
As we learned from the Lakeview case and the associated public school formula litigation, some
recognition must be given to schools in economically depressed regions of the state. Studies
show that students entering college from economically depressed areas generally require
additional academic support staff in the form of counselors and tutors in special labs. This
results in additional costs to the institutions and must be supported in the funding formula.
A.C.A. §6-61-223 & 224 requires the funding formulas to consider economies-of-scale. The
economies-of-scale adjustment serves to recognize cost savings that benefit larger schools. The
additional funds are not needed at the same rate for each additional FTE as they were for the first
student enrolled. All colleges must have a core staff regardless of the number of students who
are enrolled – a registrar, a financial aid officer, a chief financial officer, a chief academic
officer, a chief student affairs officer, an accounting staff, a computing staff and a minimum
number of full-time faculty in each of the general education disciplines. These costs are the
same for each school, but when the costs are divided by a smaller number of FTE, the result is a
higher expenditure per FTE.
Another point to clarify is that small schools are expensive to operate; however, that does not
mean they are inefficient. In looking into efficiency it is more appropriate to look at the ratio of
students-to-authorized administrative positions based on headcount rather than the funds per
FTE.
Most funding formulas recognize differences in costs among schools and among programs. In
Arkansas, cost differences occur due to the institution’s location, size, age and number of
5
buildings, mission, and demographics. Although the current funding formula addresses many of
these areas, there are some differences that are difficult to address. In an attempt to address the
state’s goals for higher education and focus more on graduating more students, the funding
formula was changed for the 2009-11 biennium so that the ratio of SSCH used in the formula
was based on 90 percent census-date enrollment data and 10 percent end-of-term (EOT)
enrollment data. The next step of that phase was for the 2011-13 biennium in which the 90
percent was decreased to 80 percent census-date enrollment data and increased from 10 percent
to 20 percent EOT enrollment data. Along with Act 1203 of 2011 and Arkansas Higher
Education Coordinating Board (AHECB) Policy, the State’s goals for graduating students are
addressed by a performance-based funding component that began in 2013-14, and the needs-
based component will address need based on 100 percent census-date enrollment data. With this
change, the 80 percent census and 20 percent end-of-term enrollment data will no longer be used
in the needs-based component.
Performance-Based Funding From the early 1990s to the present, Arkansas has experienced a more positive pattern of growth
than the nation as a whole. Unfortunately, because of lower rates of educational growth and
development throughout most of the 20th century, Arkansas still lags significantly behind the
region and the nation. Former Governor Mike Beebe recognized the importance of Arkansas’s
educational attainment for the future economic growth and the prosperity of its people. On
January 11, 2011, Governor Beebe issued a challenge to the State and to its institutions of higher
education by stating: “We can and must double the number of college graduates in Arkansas by
2025 if we are to stay competitive. This is a lofty goal aimed at the future, but we must begin
implementing it today.” More recently, Governor Asa Hutchinson has established a goal of 60%
of Arkansans with a post-secondary credential by 2025.
In response to former Governor Beebe’s challenge of doubling the number of college graduates,
the Arkansas General Assembly, ADHE and the state’s public institutions of higher education
accepted the challenge by supporting Act 1203 of 2011 (AN ACT TO PROMOTE
ACCOUNTABILITYAND EFFICIENCY AT STATE-SUPPORTED INSTITUTIONS OF
HIGHER EDUCATION; TO CLARIFY FUNDING FORMULA CALCULATIONS FOR
6
STATE-SUPPORTED INSTITUTIONS OF HIGHER EDUCATION). Act 1203 of 2011 was
enacted by the Arkansas General Assembly and on April 5, 2011, former Governor Beebe signed
it into law. Over a period of five years starting with FY 2014, 25 percent of an institution’s base
funding will be allocated according to performance or outcomes.
Significant time and effort from ADHE and all of the public institutions was put into developing
models for implementing the performance-based funding component of Act 1203. Some of the
guiding principles in developing the models included increasing credentials without
compromising academic rigor; missions, role and scope; economic development; need for
flexibility; keeping it simple; and data-driven decision making.
The performance-based funding models were designed to assist Arkansas students to succeed in
their higher education goals, and in doing so to reach the statewide goal of doubling the number
of graduates by 2025. In the first two years of implementation of the performance-based
funding, all universities and colleges successfully maintained 100 percent of the portion of their
base funding allocated to performance or outcomes. Additionally, during the 2013 Regular
Session of the 89th General Assembly A.C.A. § 6-61-233 changed the way in which the
performance-based funding would be implemented in that the implementation of the funding
component shall not progress beyond the 2014-15 school year until such time as the ADHE
determines all institutions are funded at the minimum standard of equity defined as seventy-five
percent (75%) of needed state funding, as determined by the needs-based component of the
funding formula models. Also, in any fiscal year that the general revenue funding available for
higher education institutions is less than the amount in the 2012-13 fiscal year, the ADHE will
not further implement the funding component until such time as the general revenue for higher
education institutions is restored to the 2012-13 fiscal year level.
As described above, Arkansas has historically funded higher education loosely based on
enrollment-based formulas, with a performance component introduced in 2011 which penalizes
institutions that do not meet predetermined performance measures. Most research around state
funding formulas suggest that both approaches can be problematic. Additionally, funding has
fallen short of the amounts recommended by the formulas due to limitations on the state’s
7
budget. As a result, only a small number of institutions have received the full amount
recommended by the formula.
A fully outcomes-based model was proposed in the Closing the Gap 2020: A Master Plan for
Arkansas Higher Education to address these concerns. Substantial efforts to adopt such a model
began through an established Institutional Funding work group. The group held an initial
meeting in October 2015 and continued to work since that time to develop the model. The
Arkansas Higher Education Coordinating Board (AHECB) adopted a framework for the
outcomes-based model at its meeting on July 29, 2016 and the new funding policy was enacted
with the passage of Act 148 of 2017.
Act 148 of 2017 repealed the needs-based and outcome-centered funding formulas that were
created by Act 1203 of 2011. This act directs the AHECB to adopt policies developed by the
Department of Higher Education necessary to implement a productivity-based funding model for
state supported institutions.
Productivity-based funding is a mechanism to align institutional funding with statewide priorities
for higher education by incentivizing progress toward statewide goals. At the same time, such
models encourage accountability to students and policymakers by focusing on the success of
students through the achievement of their educational goals. The new funding model is built
around a set of shared principles developed by institutions and aligned with goals and objectives
for post-secondary attainment in our state.
The productivity measures consist of four categories: (1) Effectiveness; (2) Affordability; (3)
Adjustments; and (4) Efficiency. Each of these categories contain certain metrics. Effectiveness
(Credentials, Progression, Transfer Success, Gateway Course Success) makes up eighty percent
(80%) of the formula. Affordability (Time to Degree, Credits at Completion) makes up twenty
percent (20%). Adjustments are applied for Research (4-year only) and Diseconomies of Scale
(2-year only). And, Efficiency (Core Expense Ratio, Faculty to Administrator Salary Ratio)
applies a plus/minus two percent (2%) change to the formula.

8
For the 2-year colleges, the Post-Completion Success metric is not included in the formula but
will be when adequate data is available. The Non-Credit Workforce Training and Education
metric will be incorporated into the productivity funding model for the funding recommendations
made for the 2019-2020 fiscal year; and thereafter. Other future technical modifications, such as
an addition of an inflationary index and refining of existing metrics will be considered when
necessary.
For the 4-year universities, Non-Credit Workforce Training and Post-Completion Success
metrics are not included in the formula but will be when adequate data is available. Other future
technical modifications, such as an addition of an inflationary index and refining of existing
metrics will be considered when necessary.
In the formula, institutions receive points based on the requirements of each metric. Points are
totaled and applied according to the weight of the metric. Once the points for the Effectiveness
and Affordability measures are totaled, the Adjustments will be applied to the points
accordingly. Finally, the Efficiency measure will be applied against the adjusted total. This final
total of points will become the institution’s Productivity Index. That Productivity Index will be
compared to the prior year’s index for that institution. For example, in 2017 the Productivity
Index uses data averages from the Baseline subset of AY2013, AY2014, and AY2015 and
compares it to the 3-year average from the Comparative subset of AY2014, AY2015, and
AY2016. The difference in the Baseline Index and the Comparative Index is the Change in
Productivity Index. This percent change determines the distribution of funding.
The AHECB will limit the funding recommendation generated by the productivity-based funding
model to no more than a 2% growth over the prior year’s Revenue Stabilization Act (RSA)
general revenue funding amount for four- and two-year institutions. The total RSA general
revenue recommendation for each four- and two-year institution will include any new state
funding recommendation and reallocated funding recommendation. If an institution’s funding
recommendation is greater than a 1% increase in 2018-2019; 1.5% increase in 2019-20; 2%
increase thereafter over its existing RSA general revenue funding, the Board will recommend
that the amount of funding recommendation up to 2% based on the graduated scale would be

9
added to an institutions existing RSA general revenue and any funding recommendation in
excess would be one-time incentive funding for that institution. The AHECB will recommend
redistribution of one-time incentive funding in the following year based on productivity index
changes.
Within each four- and two-year institution group, RSA general revenue funding will be
recommended for reallocation from institutions with productivity index declines to institutions
with productivity index increases. Reallocation of RSA general revenue funding to institutions
with productivity increases will be calculated as a percentage of the contribution to the overall
four- or two-year institution productivity index increases. Reallocation for institutions with
productivity index declines will be based on their percentage of productivity index decline.
Recommended reallocation will be introduced on a graduated scale starting with 1% of an
institution’s RSA general revenue funding being reallocated in 2019-2020; up to 1.5% in 2020-
2021; and up to 2% in 2021-2022 and thereafter.
Revenue versus Cost in Higher Education Every organization – whether it is for-profit, nonprofit or government – faces the same financial
imperative: It must cover its financial outflows (costs or expenditures) with financial inflows
(revenues). Although deficits can occur, they cannot be maintained forever. The one exception
to this rule may be the federal government, which has the power to tax and print currency – even
these actions have political limits. “Every other type of organization must choose a cash-flow
strategy that ensures that revenues will at least cover its expenditures and debt service.” – Robert
E. Martin, “Revenue-to-Cost Spiral in Higher Education”
Colleges and universities represent a specific type of nongovernment cash-flow strategy. Higher
education is composed of state-supported colleges and universities, private nonprofit schools,
and a number of for-profit schools. State-supported schools are the largest component. While
they are part of state governments, they are very similar to private higher education in terms of
their cash-flow management challenges, governance structures, role of third-party payers and the
services they provide.

10
The foregoing was presented to establish that colleges and universities, whether state-supported
or private non-profit institutions, must make certain that their revenues cover their expenditures
and debt service, which presents unique challenges for state-supported colleges and universities.
Unlike businesses which see their sales and profits decline during an economic downturn, state-
supported colleges and universities may experience enrollment increases due to layoffs and
unemployment, thereby increasing cost to educate additional students; along with state revenue
decline causing a reduction, thereby creating the need to increase tuition and fees to cover the
lost state support.
This demand for services experienced by colleges and universities during an economic down-
turn is the inverse of the lack of demand for services from for-profit businesses. While
businesses are laying off employees, colleges and universities are forced to hire new faculty and
support staff (admissions staff, financial aid staff, etc.) to meet the demands of new enrollment.
As businesses are cutting expenses, state-supported colleges and universities must increase
expenditures if they are to provide services to the larger student body. For example, if state
support makes up 50 percent of the funding for higher education and tuition and fees make up
the other 50 percent, and no new state dollars are received for higher education, then any cost of
living increases or inflation must be balanced by reducing costs/services or by increasing tuition
and fees. If inflation increases by 3 percent, costs/services must be cut by 3 percent or tuition
and fees must increase 6 percent.
Often, the response is to encourage institutions to seek private funds to replace lost state support.
However, many times private donors are unwilling to give to support the ordinary operating
expenses associated with educating the students (unrestricted educational and general funds)
because they consider those things the responsibility of the state and there is no notoriety or
recognition associated with donations for operating expenses. Donors are willing to give to a
building fund (to be able to name the building or a room) and to sponsor a specific type of
research program that has the potential of benefitting their business, or them personally, but such
funds are considered restricted funds since their use is designated by the donor. These funds
provide no relief for the overburdened unrestricted educational and general needs of the
institution.
11
Successive economic downturns such as that experienced after Sept. 11, 2001, and during the
Great Recession have been devastating for Arkansas higher education, in that institutions are
spending less per student from all sources of revenue. During that same time period the
enrollment growth in Arkansas has been one of the highest in the SREB and in the nation. The
Delta Cost Study summed it up this way – students are paying more and getting less. Higher
education is losing the battle with the combination of more students, less state funding and
tuition rates that exceed inflation. Several recent studies show that the institutions are actually
spending less per student than they did 10 or 20 years ago in constant dollars, which makes the
idea of cutting expenditures less than plausible.
The cost cutting that has occurred has been in the form of using adjunct faculty to replace full-
time faculty and the postponement of maintenance of facilities. The shift towards adjunct faculty
may cause unintended consequences. Research has shown that an increase in adjunct faculty has
negatively impacted graduation and retention rates. More specifically, the impact can be seen on
first- to second-year retention because adjuncts are more likely to teach introductory courses.
Many of these negative outcomes are caused by lack of professional development for adjunct
faculty, adjunct faculty are not paid for office hours which results in students receiving less out
of the classroom support, and typically institutional policies are created around full-time faculty.
Another undesirable action is to forego the maintenance of facilities allowing for huge deferred
maintenance accumulations that represent a high percentage of the replacement value of the
facilities. These things are not only true for Arkansas; they are true nationally as well. Impacts
of declining state funds on Arkansas Higher Education include:
Tuition and fee increases
Reduced access
No progress on equity funding issues
Outdated instructional equipment
Reduced ability to attract external funding
Inability to recruit and retain faculty/staff
Further deterioration of facilities
Worst case scenarios: enrollment caps, loss of accreditation, no new programs, lost jobs
Program eliminations and reduction in public service.

12
As the economic recovery has strengthened, enrollments have declined (particularly at
community colleges), as jobs have been created and individuals have gone back to work.
Though state revenues have recovered, colleges and universities have not seen reinvestment in
their funding due to competing demands from K-12, health care and other priorities.
Funds per FTE Student from All Sources Table 90 of the SREB Factbook on Higher Education published in November 2015 shows that
the total funds available per FTE student in Arkansas’s universities increased by 6.7 percent in
the five year period from 2008-09 to 2013-14. Louisiana experienced the greatest decrease for
this period at around 11 percent. Delaware has continued to have the greatest gain in funding
available per FTE student, a 25.8 percent increase. For 2013-14, Arkansas’s universities ranked
ninth (9th) in state funding and tenth (10th) in tuition and fee revenues per FTE student in the
SREB region.
13
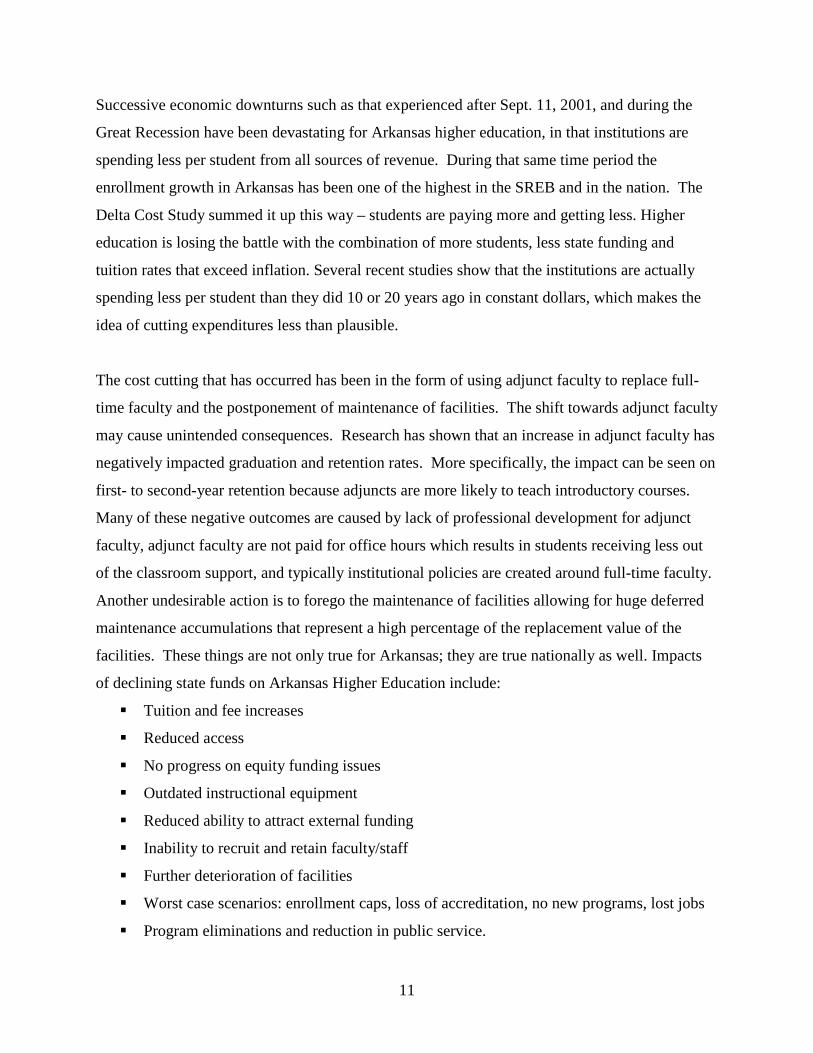
Table 91 of the SREB Factbook on Higher Education contains the comparable data for Two-
Year Colleges. Arkansas’s two-year schools funds per FTE student increased approximately 7.3
percent over the same five year period. Louisiana experienced the greatest loss for this period
with a 19 percent decrease. North Carolina has continued to have the greatest gain in funding
available per FTE student, a 29.8 percent increase.
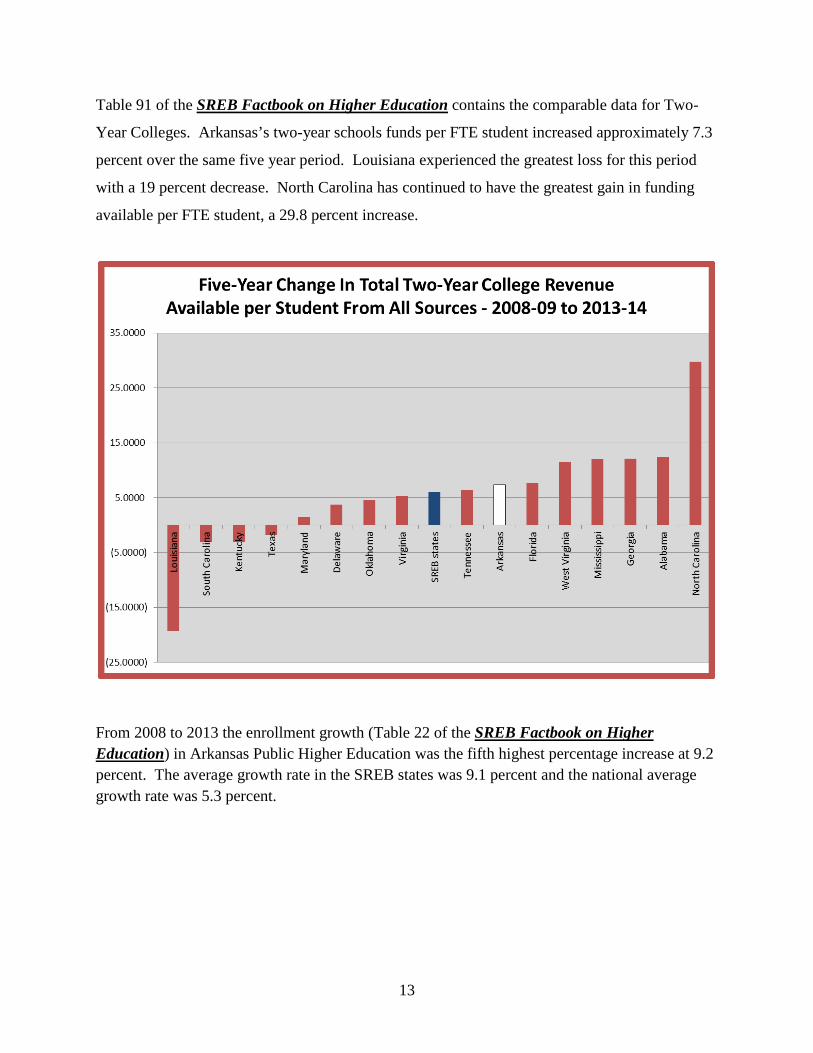
From 2008 to 2013 the enrollment growth (Table 22 of the SREB Factbook on Higher Education) in Arkansas Public Higher Education was the fifth highest percentage increase at 9.2 percent. The average growth rate in the SREB states was 9.1 percent and the national average growth rate was 5.3 percent.
14
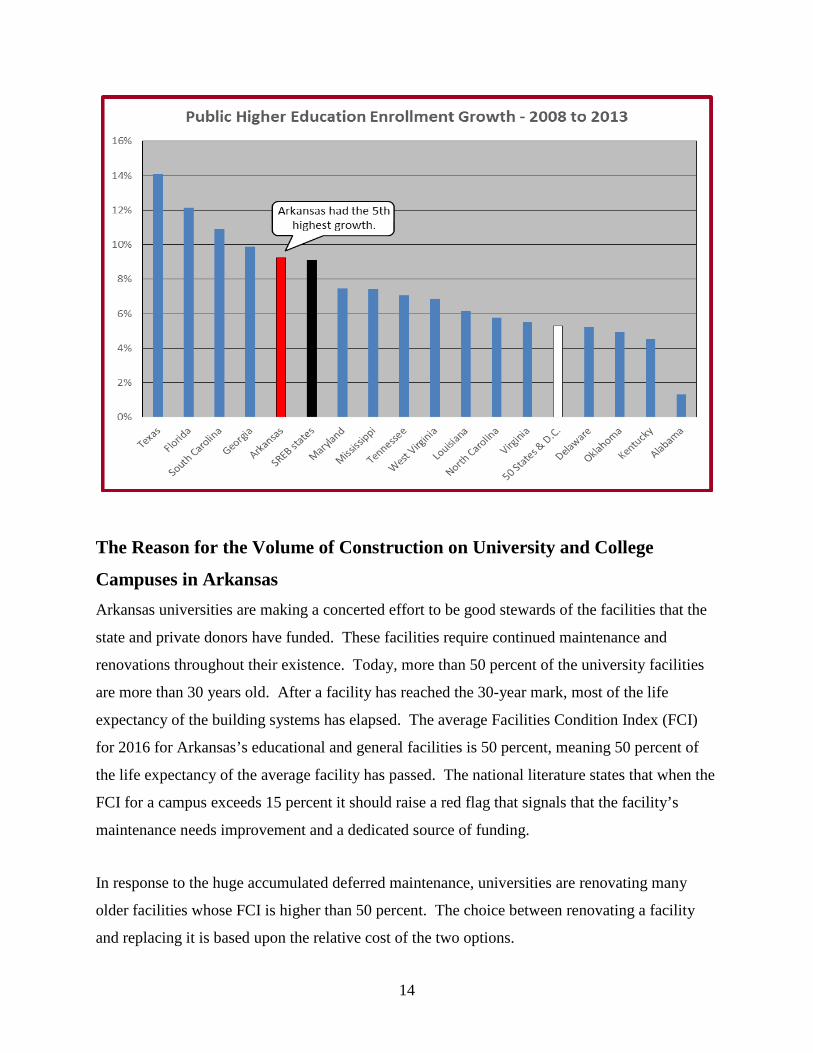
The Reason for the Volume of Construction on University and College
Campuses in Arkansas Arkansas universities are making a concerted effort to be good stewards of the facilities that the
state and private donors have funded. These facilities require continued maintenance and
renovations throughout their existence. Today, more than 50 percent of the university facilities
are more than 30 years old. After a facility has reached the 30-year mark, most of the life
expectancy of the building systems has elapsed. The average Facilities Condition Index (FCI)
for 2016 for Arkansas’s educational and general facilities is 50 percent, meaning 50 percent of
the life expectancy of the average facility has passed. The national literature states that when the
FCI for a campus exceeds 15 percent it should raise a red flag that signals that the facility’s
maintenance needs improvement and a dedicated source of funding.
In response to the huge accumulated deferred maintenance, universities are renovating many
older facilities whose FCI is higher than 50 percent. The choice between renovating a facility
and replacing it is based upon the relative cost of the two options.
15
Why is all this renovation and new construction necessary? Today’s students are coming to
the universities to learn that their high schools had better and more modern labs and equipment
than the universities. Many universities’ laboratory facilities have been seriously outdated for
many years and were not or could not be brought into compliance with Environmental Protection
Agency (EPA) regulations. Students come to a university expecting to receive instruction on the
latest technology available, but are finding labs with outdated equipment and technology.
If universities are to produce graduates in the sciences and engineering programs who can
compete in future economies, facilities must be renovated, updated or replaced, which is why
much of the construction activity is taking place on college and university campuses.
Not surprisingly, systems including electrical, in the older facilities are not adequate to handle all
the new computing equipment, which was not even contemplated when the buildings were
designed. Computer equipment also places stress on outdated air conditioning systems. In
addition, EPA regulations necessitate new plumbing for labs in the sciences and engineering
programs. Unless these renovations are completed, graduates will find their degrees have not
prepared them for the careers they have chosen.
Lack of dedicated capital improvement funding means that institutions have increasingly turned
to bond indebtedness to finance essential improvements, leading to rising tuition or fees. SREB
recently surveyed its member states to learn more about state supported funding for capital
needs. Only two states, Alabama and Oklahoma, indicated that higher education received no
state support for capital needs. The remaining fourteen SREB states do receive state funding to
address capital needs either as recurring/designated funding, surplus/non-recurring funding or
some combination of the two. In 2006, Arkansas did designate funding for higher education
capital needs through General Obligation (GO) Bonds, but institutions have had to rely on
surplus/non-recurring funds in more recent years. Lack of dedicated capital improvement
funding is a common challenge across SREB states and you can find more detail for each SREB
state in Appendix A. Eight of the sixteen SREB states are currently considering GO Bonds to
address this challenge. Arkansas is not currently considering GO Bonds.
16
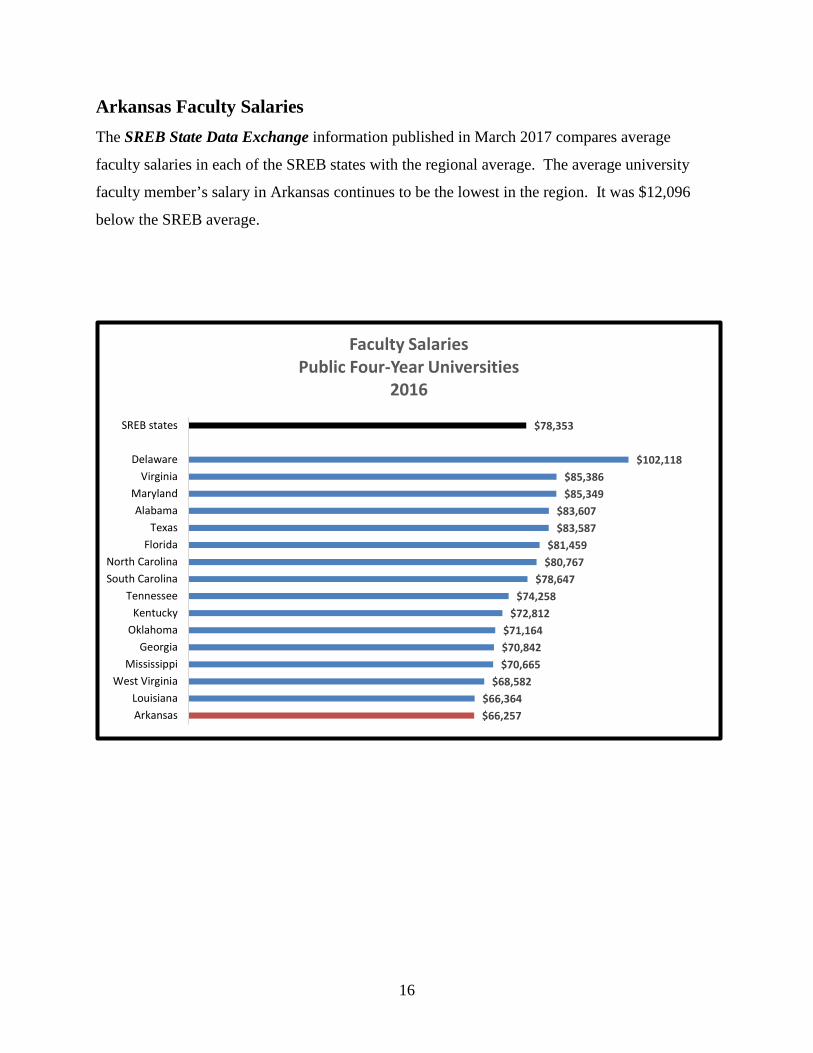
Arkansas Faculty Salaries The SREB State Data Exchange information published in March 2017 compares average
faculty salaries in each of the SREB states with the regional average. The average university
faculty member’s salary in Arkansas continues to be the lowest in the region. It was $12,096
below the SREB average.
$78,353
$102,118$85,386$85,349
$83,607$83,587
$81,459$80,767
$78,647$74,258
$72,812$71,164$70,842$70,665
$68,582$66,364$66,257
SREB states
DelawareVirginia
MarylandAlabama
TexasFlorida
North CarolinaSouth Carolina
TennesseeKentucky
OklahomaGeorgia
MississippiWest Virginia
LouisianaArkansas
Faculty SalariesPublic Four-Year Universities
2016

17
Two-year college salaries moved up two ranks from next to lowest in the SREB region. The
average faculty salary in Arkansas for two-year colleges of $44,892 was $9,126 below the SREB
average.
Even more troubling is the comparison of two-year college faculty salaries with Arkansas
average public school teachers’ salaries. In Arkansas the average public school teacher’s salary
was $3,326 higher than that of the two-year college faculty, who are required to have at least a
master’s degree and 18 graduate hours in their teaching field if teaching general education core
courses.
$54,018
$62,854$61,441
$60,652$59,746
$56,280$51,751
$50,594$50,185
$48,951$47,724$47,384
$46,106$44,892$44,813
$44,066$43,317
SREB states
MarylandDelaware
VirginiaFlorida
TexasAlabama
TennesseeMississippiOklahoma
North CarolinaWest Virginia
KentuckyArkansas
South CarolinaLouisiana
Georgia
Faculty SalariesPublic Two-Year Colleges
2016

18
How is Arkansas to remain competitive in higher education with salaries so far below the
regional and national average?
Closing the Gap 2020: A Master Plan for Arkansas Higher Education addresses the need to
increase faculty salaries to the regional average. Considering the goals set forth in the master
plan, raising salaries to attract and retain quality faculty are essential to improving student
retention and completion. In order to remain competitive and affordable, resource allocation
decisions are very important. It will be imperative going forward to examine resource allocation
by analyzing expenditures per full-time equivalent (FTE) student in the following functional
expense categories - Instruction (includes faculty salaries), Academic Support, Student Services
and Institutional Support. Institutions must make decisions that will maximize their core
functional expenses in a way that will improve student success. One potential study that is being
considered to help in further analyzing resource allocation is the annual SACUBO
SREB States
Public School
Teachers
Two-Year College Faculty
Maryland 66,456$ 62,854$ MarylandDelaware 59,960$ 61,441$ DelawareGeorgia 54,190$ 60,652$ VirginiaKentucky 52,134$ 59,746$ FloridaTexas 51,890$ 56,280$ TexasSREB States 50,955$ 54,018$ SREB statesVirginia 50,834$ 51,751$ AlabamaLouisiana 49,745$ 50,594$ TennesseeFlorida 49,199$ 50,185$ MississippiSouth Carolina 48,769$ 48,951$ OklahomaAlabama 48,518$ 47,724$ North CarolinaArkansas 48,218$ 47,384$ West VirginiaTennessee 48,217$ $3,326 46,106$ KentuckyNorth Carolina 47,941$ 44,892$ ArkansasWest Virginia 45,622$ 44,813$ South CarolinaOklahoma 45,276$ 44,066$ LouisianaMississippi 42,744$ 43,317$ Georgia
Salary Comparisons2015-16
19
Benchmarking Study. Appendix C will provide further details for each institution’s expenditures
per FTE by functional expense category.
Why Research Is Important Research, the pursuit of knowledge, is the life blood of a university. It is the key to economic
development and new higher paying jobs in the state. New developing cutting-edge industries
tend to locate near universities that are heavily involved in research related to their industry.
Research is the basis for some of the most important parts of the upper level undergraduate and
graduate level instruction. It provides students with cutting edge knowledge, problem-solving
skills and familiarity with the latest technology which prepare them to be leaders in their chosen
field. In addition, research results in a better quality of life for all citizens of Arkansas through
the development of better medications, diagnostic equipment, methods of diagnosis and
treatment of illness.
Commitment to research is a necessity in attracting the best faculty to a university. Faculty
members who are involved in research are also a necessity for quality doctoral programs.
Doctoral candidates are required to do research for dissertations and the guidance for both
research ideas and methodology can only be provided by faculty who are actively involved in
research.
The Nanotechnology research currently being conducted at several of Arkansas’s doctoral
institutions seems to have almost unlimited potential in numerous fields of human endeavor.
This is particularly true in the developments in medicine.
Logistics research has allowed a number of Arkansas trucking firms to be leaders in the nation in
their ability to deliver goods across America efficiently, economically and on time. The
Arkansas Research and Education Optical Network (ARE-ON) is making the latest medical
diagnosis and treatment capabilities available to rural hospitals and improving the health and
longevity of those citizens who have not had access before without the expense of traveling a
great distance. Research is improving the quality of life for Arkansans in terms of health care,
better jobs, and a quality education.

20
It is incumbent on Land Grant institutions (University of Arkansas & University of Arkansas at
Pine Bluff) to have a commitment to research and to public service. Failure to be involved in
both would result in the loss of significant federal funding. The research and public service
functions of these Land Grant universities have resulted in our nation’s farmers being the most
productive in the world and our food supply exceeding our consumption.
Much of the research that has resulted in our major advancements have often started out as
theoretical (basic) research, what some may have labeled “pie-in-the-sky,” rather than applied
research. This simply illustrates that the major thrust of research should not be only on applied
research – research with immediate practical outcomes or seeking solutions to existing problems.
In summary, research improves the quality of life, attracts knowledge-based business and
industry, improves economic development in the state, and creates better paying jobs in the state.
Tuition and Fees Certainly, tuition and fee increases at colleges and universities, both public and private, have
been under scrutiny in Arkansas and the nation. Some of the major factors responsible for
tuition inflation has been rising cost in technology, employee benefits, and campus security.
State funding for higher education has been relatively flat. With no growth in state support,
institutions have implemented several cost saving initiatives in order to help keep tuition and fees
increases at a minimum. Even with these cost saving measures, four-year institutions and two-
year colleges found it necessary to increase tuition and fees on average by 4.0 percent for fiscal
year 2017-18 which is reflected in the charts below.

21
RESIDENT
Institution 2012-13 2013-14 2014-15 2015-16 2016-17 2017-181 YR
Increase5 YR
Increase
5 YR Average Increase
ASUJ 7,180 7,510 7,720 8,050 8,200 8,478 3.4% 18.1% 3.4%
ATU 6,528 6,918 7,248 7,740 8,280 8,880 7.2% 32.3% 6.4%
HSU 6,984 7,284 7,561 7,809 8,116 8,311 2.4% 20.9% 3.5%
SAUM 7,146 7,386 7,656 7,896 8,196 8,346 1.8% 20.8% 3.2%
UAF 7,553 7,818 8,208 8,521 8,819 9,062 2.8% 23.0% 3.7%
UAFS 5,436 5,625 5,962 6,322 6,701 6,935 3.5% 27.2% 5.0%
UALR 7,343 7,601 8,045 8,165 8,633 8,936 3.5% 22.6% 4.0%
UAM 5,560 5,793 6,082 6,447 7,210 7,462 3.5% 36.3% 6.1%
UAPB 5,517 5,754 5,956 6,271 6,676 7,212 8.0% 25.3% 5.5%
UCA 7,332 7,595 7,889 7,889 8,224 8,524 3.6% 14.5% 3.1%Average 6,658 6,928 7,233 7,511 7,906 8,214 4.0% 24.1% 4.3%
SOURCE: ADHE FORM 18-1** Mandatory Fees include both E&G and Auxiliary
Annual Full-time Undergraduate Tuition and Mandatory Fees for Four-Year Institutions (2012-13 through 2017-18)
RESIDENT
Institution 2012-13 2013-14 2014-15 2015-16 2016-17 2017-181 YR
Increase5 YR
Increase
5 YR Average Increase
ANC 2,300 2,390 2,390 2,600 2,660 2,750 3.3% 19.6% 3.7%ASUB 3,060 3,120 3,270 3,420 3,480 3,540 1.7% 15.7% 3.0%
ASUMH 3,150 3,240 3,330 3,420 3,480 3,540 1.7% 12.4% 2.4%ASUMS 3,270 3,670 3,790 3,790 3,880 4,000 3.0% 22.3% 4.2%
ASUN 2,850 3,000 3,150 3,270 3,330 3,450 3.5% 21.1% 3.9%BRTC 2,790 2,850 3,060 3,240 3,330 3,600 7.5% 29.0% 5.3%
CCCUA 2,302 2,512 2,647 3,030 3,405 3,600 5.4% 56.4% 9.4%COTO 2,507 3,182 3,310 3,620 3,620 3,680 1.6% 46.8% 8.4%EACC 2,700 2,790 2,880 3,090 3,150 3,150 0.0% 16.7% 3.2%
NAC 2,910 3,090 3,090 3,270 3,330 3,510 5.1% 20.6% 3.9%NPC 3,050 3,320 3,490 3,460 3,460 3,780 8.5% 23.9% 4.5%
NWACC 4,348 4,513 4,513 4,633 4,633 4,683 1.1% 7.7% 1.5%OZC 2,810 3,005 3,325 3,445 3,445 3,640 5.4% 29.5% 5.4%
PCCUA 2,735 2,855 2,968 2,968 3,110 3,200 2.8% 17.0% 3.2%SACC 3,010 3,140 3,290 3,380 3,510 3,660 4.1% 21.6% 4.0%SAUT 3,630 4,050 4,050 4,140 4,140 4,500 8.0% 24.0% 4.5%SEAC 2,980 3,010 3,070 3,070 3,220 3,460 6.9% 16.1% 3.1%
UACCB 2,900 3,060 3,195 3,195 3,375 3,480 3.0% 20.0% 3.7%UACCH 2,346 2,421 2,560 2,650 2,890 2,980 3.0% 27.0% 4.9%UACCM 3,360 3,500 3,635 3,785 3,980 4,130 3.6% 22.9% 4.2%
UACCRM 2,670 3,180 3,360 3,480 3,630 3,780 4.0% 41.6% 7.4%UAPTC 3,183 3,563 4,013 4,650 5,280 5,460 3.3% 71.5% 11.5%
Average 2,950 3,136 3,251 3,374 3,471 3,617 4.0% 23.5% 4.5%SOURCE: ADHE FORM 18-1**Mandatory Fees include both E&G and Auxiliary
Annual Full-time Undergraduate Tuition and Mandatory Feesfor Two-Year Institutions (2012-13 through 2017-18)

22
As tuition and fees continue to rise, many students are finding relief with state and federal aid,
including veteran’s benefits. For now, government subsidies and aid from schools are serving to
hold down net tuition and fees – the actual cost students pay when grants and scholarships are
taken into consideration.
Operating Margins Operating Margins are used to measure an institutions operating efficiency. It is a measurement
of what proportion of a college or university's revenue is left over after expenses. The operating
margin shows what an institution makes per each dollar of revenue.
Two graphs comparing 2012-13 operating margins to the 2016-17 margins are presented below.
The more detailed historical operating margins by institutions are in Appendix B.
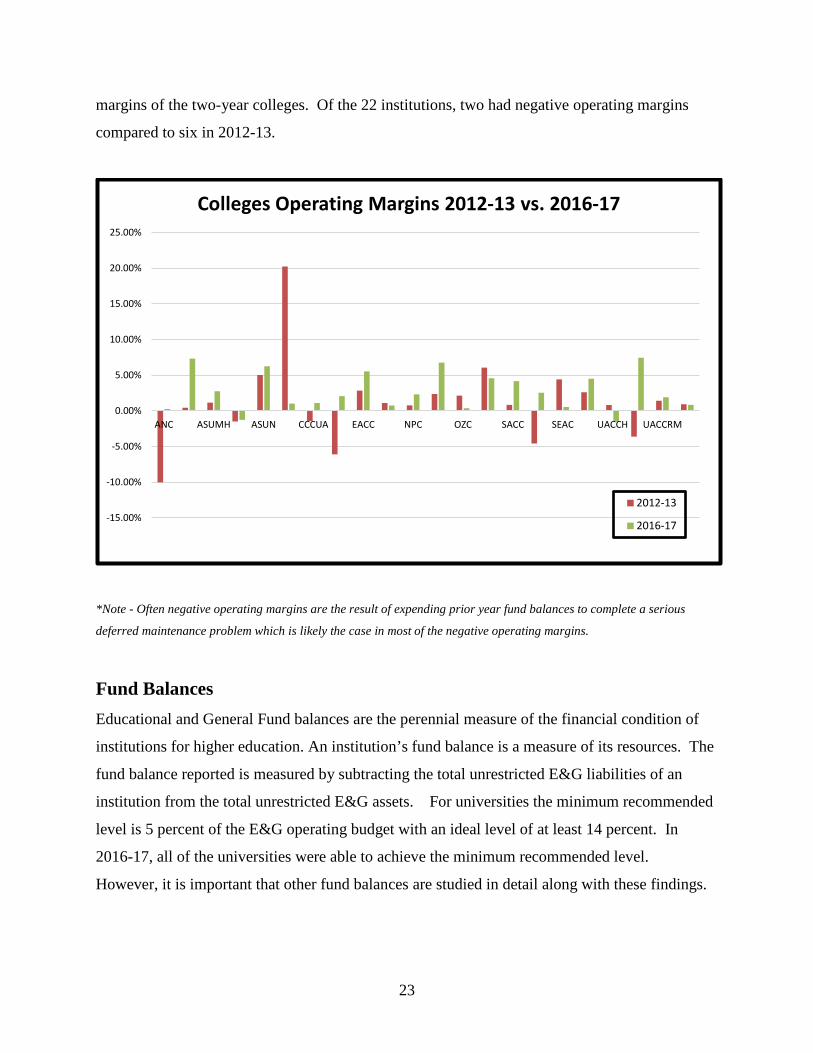
Often negative operating margins are the result of expending prior year fund balances to
complete a serious deferred maintenance problem which is likely the case in most of the negative
operating margins. The graph below contains the comparison of 2012-13 and 2016-17 operating
-10.00%
-5.00%
0.00%
5.00%
10.00%
15.00%
20.00%
ASUJ ATU HSU SAUM UAF UAFS UALR UAM UAPB UCA
Universities Operating Margins 2012-13 vs. 2016-17
2012-13
2016-17
23
margins of the two-year colleges. Of the 22 institutions, two had negative operating margins
compared to six in 2012-13.
*Note - Often negative operating margins are the result of expending prior year fund balances to complete a serious
deferred maintenance problem which is likely the case in most of the negative operating margins.
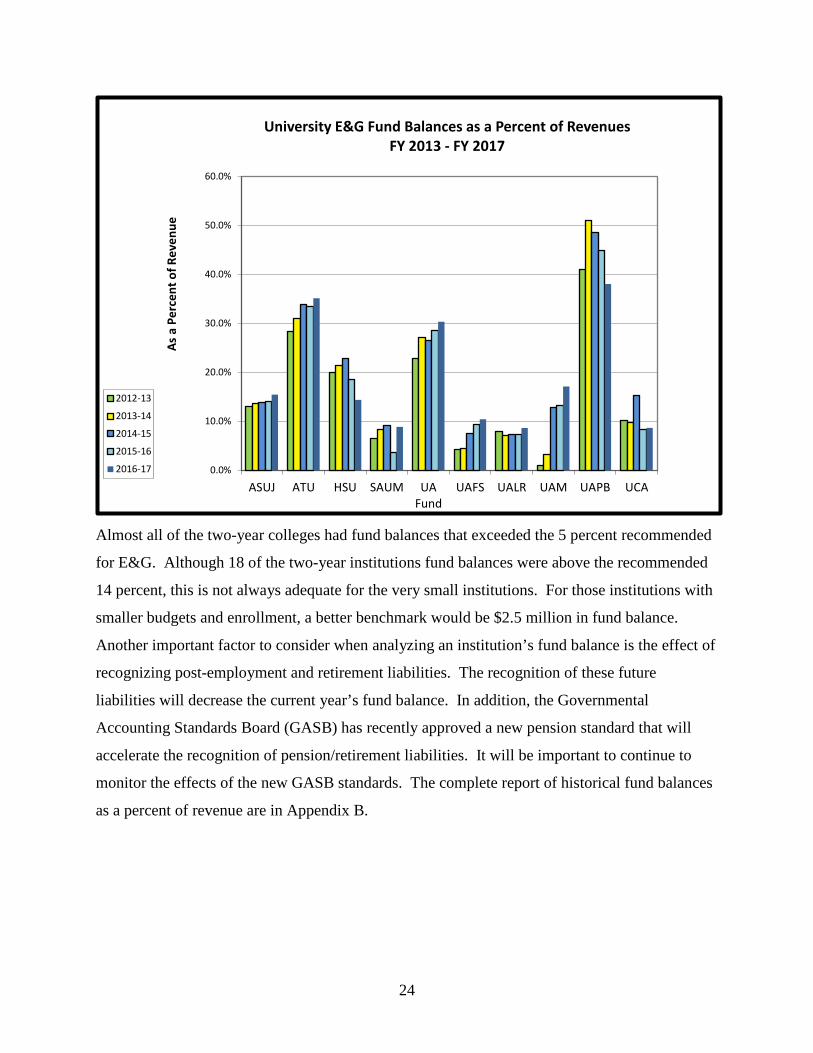
Fund Balances Educational and General Fund balances are the perennial measure of the financial condition of
institutions for higher education. An institution’s fund balance is a measure of its resources. The
fund balance reported is measured by subtracting the total unrestricted E&G liabilities of an
institution from the total unrestricted E&G assets. For universities the minimum recommended
level is 5 percent of the E&G operating budget with an ideal level of at least 14 percent. In
2016-17, all of the universities were able to achieve the minimum recommended level.
However, it is important that other fund balances are studied in detail along with these findings.
-15.00%
-10.00%
-5.00%
0.00%
5.00%
10.00%
15.00%
20.00%
25.00%
ANC ASUMH ASUN CCCUA EACC NPC OZC SACC SEAC UACCH UACCRM
Colleges Operating Margins 2012-13 vs. 2016-17
2012-13
2016-17
24
Almost all of the two-year colleges had fund balances that exceeded the 5 percent recommended
for E&G. Although 18 of the two-year institutions fund balances were above the recommended
14 percent, this is not always adequate for the very small institutions. For those institutions with
smaller budgets and enrollment, a better benchmark would be $2.5 million in fund balance.
Another important factor to consider when analyzing an institution’s fund balance is the effect of
recognizing post-employment and retirement liabilities. The recognition of these future
liabilities will decrease the current year’s fund balance. In addition, the Governmental
Accounting Standards Board (GASB) has recently approved a new pension standard that will
accelerate the recognition of pension/retirement liabilities. It will be important to continue to
monitor the effects of the new GASB standards. The complete report of historical fund balances
as a percent of revenue are in Appendix B.
0.0%
10.0%
20.0%
30.0%
40.0%
50.0%
60.0%
ASUJ ATU HSU SAUM UAFund
UAFS UALR UAM UAPB UCA
As a
Per
cent
of R
even
ue
University E&G Fund Balances as a Percent of RevenuesFY 2013 - FY 2017
2012-13
2013-14
2014-15
2015-16
2016-17

25
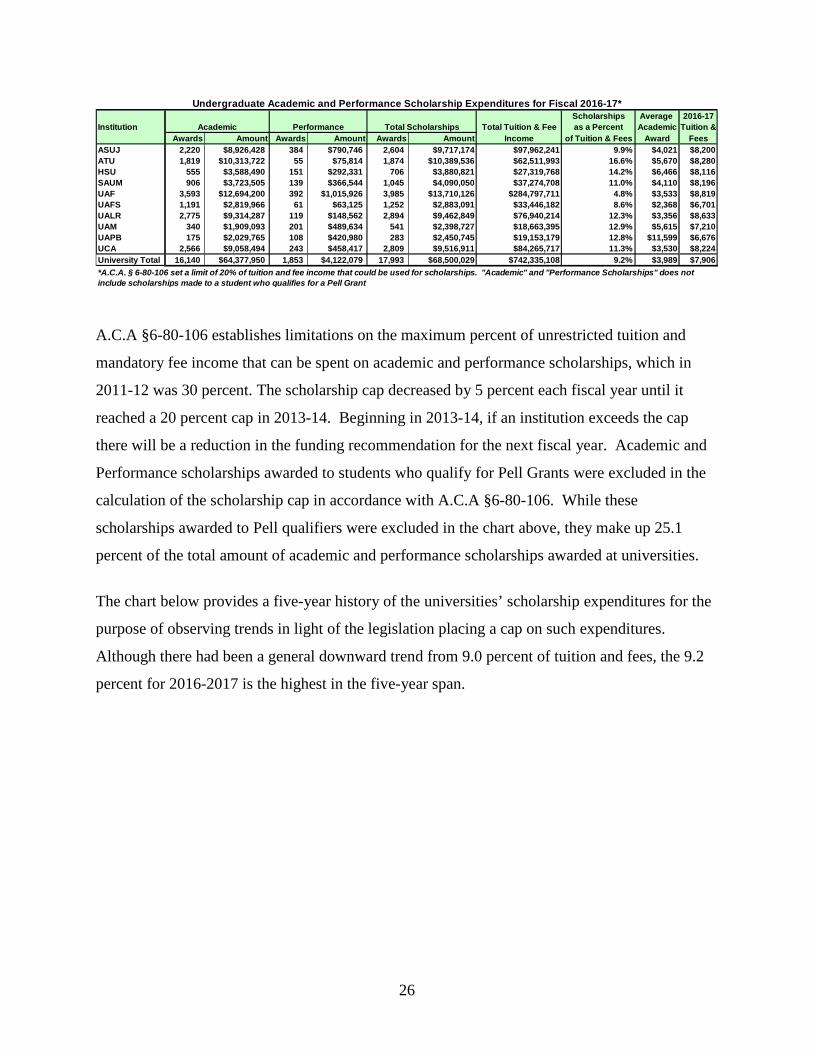
Institutional Scholarship Expenditures The report for Institutional Scholarship Expenditures for 2016-17 indicates that the average
university’s expenditure for scholarships represented 9.2 percent of their total educational and
general tuition and mandatory fee revenue. For 2016-17, the legislatively mandated cap on
Academic and Performance Scholarships was 20 percent of educational and general tuition and
fee revenue. All institutions reported scholarships below this mandated amount.
-25%
-15%
-5%
5%
15%
25%
35%
45%
55%
65%
ANC
ASU
B
ASU
MH
ASU
MS
ASU
N
BRTC
CCCU
A
COTO
EACC
NAC NPC
NW
ACC
OZC
PCCU
A
SACC
SAU
T
SEAC
UAC
CB
UAC
CH
UAC
CM
UAC
CRM
UAP
TC
As a
Per
cent
of R
even
ue
Colleges E&G Fund balances as a Percent of Revenues FY 2013 - FY 2017
2012-13
2013-14
2014-15
2015-16
2016-17
26
A.C.A §6-80-106 establishes limitations on the maximum percent of unrestricted tuition and
mandatory fee income that can be spent on academic and performance scholarships, which in
2011-12 was 30 percent. The scholarship cap decreased by 5 percent each fiscal year until it
reached a 20 percent cap in 2013-14. Beginning in 2013-14, if an institution exceeds the cap
there will be a reduction in the funding recommendation for the next fiscal year. Academic and
Performance scholarships awarded to students who qualify for Pell Grants were excluded in the
calculation of the scholarship cap in accordance with A.C.A §6-80-106. While these
scholarships awarded to Pell qualifiers were excluded in the chart above, they make up 25.1
percent of the total amount of academic and performance scholarships awarded at universities.
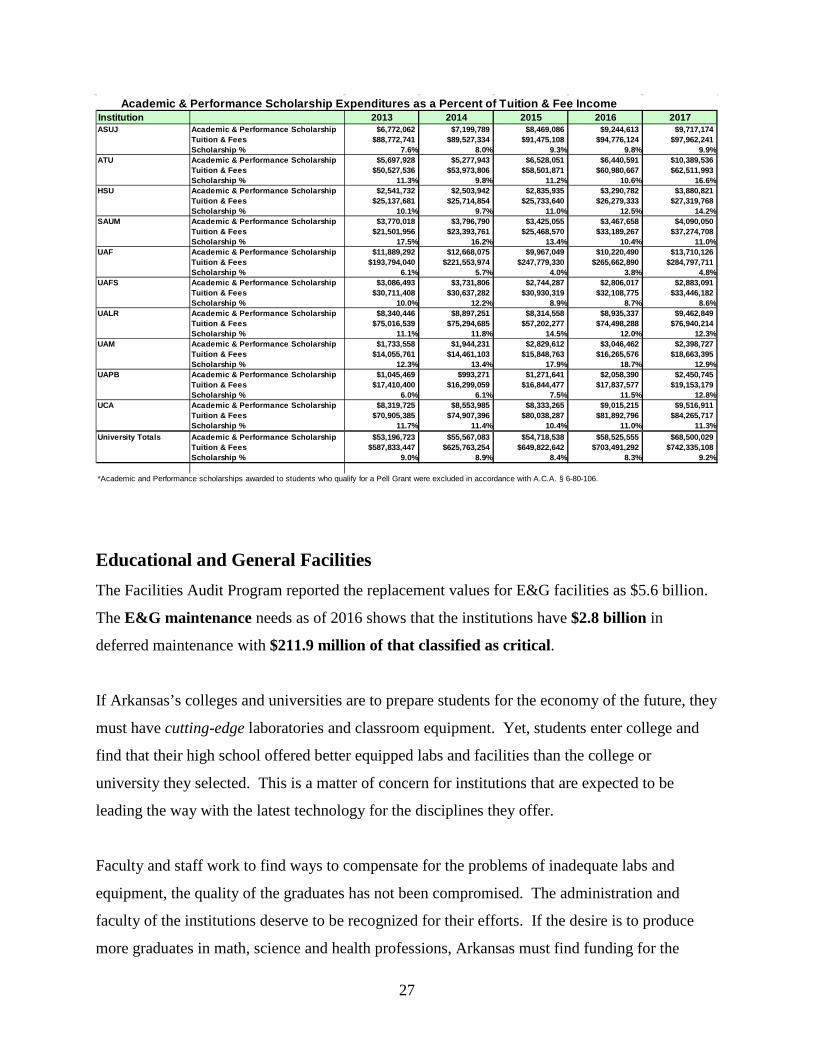
The chart below provides a five-year history of the universities’ scholarship expenditures for the
purpose of observing trends in light of the legislation placing a cap on such expenditures.
Although there had been a general downward trend from 9.0 percent of tuition and fees, the 9.2
percent for 2016-2017 is the highest in the five-year span.
Scholarships Average 2016-17Institution Total Scholarships Total Tuition & Fee as a Percent Academic Tuition &
Awards Amount Awards Amount Awards Amount Income of Tuition & Fees Award FeesASUJ 2,220 $8,926,428 384 $790,746 2,604 $9,717,174 $97,962,241 9.9% $4,021 $8,200ATU 1,819 $10,313,722 55 $75,814 1,874 $10,389,536 $62,511,993 16.6% $5,670 $8,280HSU 555 $3,588,490 151 $292,331 706 $3,880,821 $27,319,768 14.2% $6,466 $8,116SAUM 906 $3,723,505 139 $366,544 1,045 $4,090,050 $37,274,708 11.0% $4,110 $8,196UAF 3,593 $12,694,200 392 $1,015,926 3,985 $13,710,126 $284,797,711 4.8% $3,533 $8,819UAFS 1,191 $2,819,966 61 $63,125 1,252 $2,883,091 $33,446,182 8.6% $2,368 $6,701UALR 2,775 $9,314,287 119 $148,562 2,894 $9,462,849 $76,940,214 12.3% $3,356 $8,633UAM 340 $1,909,093 201 $489,634 541 $2,398,727 $18,663,395 12.9% $5,615 $7,210UAPB 175 $2,029,765 108 $420,980 283 $2,450,745 $19,153,179 12.8% $11,599 $6,676UCA 2,566 $9,058,494 243 $458,417 2,809 $9,516,911 $84,265,717 11.3% $3,530 $8,224University Total 16,140 $64,377,950 1,853 $4,122,079 17,993 $68,500,029 $742,335,108 9.2% $3,989 $7,906
Academic Performance
*A.C.A. § 6-80-106 set a limit of 20% of tuition and fee income that could be used for scholarships. "Academic" and "Performance Scholarships" does not include scholarships made to a student who qualifies for a Pell Grant
Undergraduate Academic and Performance Scholarship Expenditures for Fiscal 2016-17*
27
Educational and General Facilities The Facilities Audit Program reported the replacement values for E&G facilities as $5.6 billion.
The E&G maintenance needs as of 2016 shows that the institutions have $2.8 billion in
deferred maintenance with $211.9 million of that classified as critical.
If Arkansas’s colleges and universities are to prepare students for the economy of the future, they
must have cutting-edge laboratories and classroom equipment. Yet, students enter college and
find that their high school offered better equipped labs and facilities than the college or
university they selected. This is a matter of concern for institutions that are expected to be
leading the way with the latest technology for the disciplines they offer.
Faculty and staff work to find ways to compensate for the problems of inadequate labs and
equipment, the quality of the graduates has not been compromised. The administration and
faculty of the institutions deserve to be recognized for their efforts. If the desire is to produce
more graduates in math, science and health professions, Arkansas must find funding for the
Institution 2013 2014 2015 2016 2017ASUJ Academic & Performance Scholarship $6,772,062 $7,199,789 $8,469,086 $9,244,613 $9,717,174
Tuition & Fees $88,772,741 $89,527,334 $91,475,108 $94,776,124 $97,962,241Scholarship % 7.6% 8.0% 9.3% 9.8% 9.9%
ATU Academic & Performance Scholarship $5,697,928 $5,277,943 $6,528,051 $6,440,591 $10,389,536Tuition & Fees $50,527,536 $53,973,806 $58,501,871 $60,980,667 $62,511,993Scholarship % 11.3% 9.8% 11.2% 10.6% 16.6%
HSU Academic & Performance Scholarship $2,541,732 $2,503,942 $2,835,935 $3,290,782 $3,880,821Tuition & Fees $25,137,681 $25,714,854 $25,733,640 $26,279,333 $27,319,768Scholarship % 10.1% 9.7% 11.0% 12.5% 14.2%
SAUM Academic & Performance Scholarship $3,770,018 $3,796,790 $3,425,055 $3,467,658 $4,090,050Tuition & Fees $21,501,956 $23,393,761 $25,468,570 $33,189,267 $37,274,708Scholarship % 17.5% 16.2% 13.4% 10.4% 11.0%
UAF Academic & Performance Scholarship $11,889,292 $12,668,075 $9,967,049 $10,220,490 $13,710,126Tuition & Fees $193,794,040 $221,553,974 $247,779,330 $265,662,890 $284,797,711Scholarship % 6.1% 5.7% 4.0% 3.8% 4.8%
UAFS Academic & Performance Scholarship $3,086,493 $3,731,806 $2,744,287 $2,806,017 $2,883,091Tuition & Fees $30,711,408 $30,637,282 $30,930,319 $32,108,775 $33,446,182Scholarship % 10.0% 12.2% 8.9% 8.7% 8.6%
UALR Academic & Performance Scholarship $8,340,446 $8,897,251 $8,314,558 $8,935,337 $9,462,849Tuition & Fees $75,016,539 $75,294,685 $57,202,277 $74,498,288 $76,940,214Scholarship % 11.1% 11.8% 14.5% 12.0% 12.3%
UAM Academic & Performance Scholarship $1,733,558 $1,944,231 $2,829,612 $3,046,462 $2,398,727Tuition & Fees $14,055,761 $14,461,103 $15,848,763 $16,265,576 $18,663,395Scholarship % 12.3% 13.4% 17.9% 18.7% 12.9%
UAPB Academic & Performance Scholarship $1,045,469 $993,271 $1,271,641 $2,058,390 $2,450,745Tuition & Fees $17,410,400 $16,299,059 $16,844,477 $17,837,577 $19,153,179Scholarship % 6.0% 6.1% 7.5% 11.5% 12.8%
UCA Academic & Performance Scholarship $8,319,725 $8,553,985 $8,333,265 $9,015,215 $9,516,911Tuition & Fees $70,905,385 $74,907,396 $80,038,287 $81,892,796 $84,265,717Scholarship % 11.7% 11.4% 10.4% 11.0% 11.3%
University Totals Academic & Performance Scholarship $53,196,723 $55,567,083 $54,718,538 $58,525,555 $68,500,029Tuition & Fees $587,833,447 $625,763,254 $649,822,642 $703,491,292 $742,335,108Scholarship % 9.0% 8.9% 8.4% 8.3% 9.2%
*Academic and Performance scholarships awarded to students who qualify for a Pell Grant were excluded in accordance with A.C.A. § 6-80-106.
Academic & Performance Scholarship Expenditures as a Percent of Tuition & Fee Income
28
equipment and facilities to support these disciplines. If not, Arkansas will find it difficult to
compete in the economy of the 21st century.
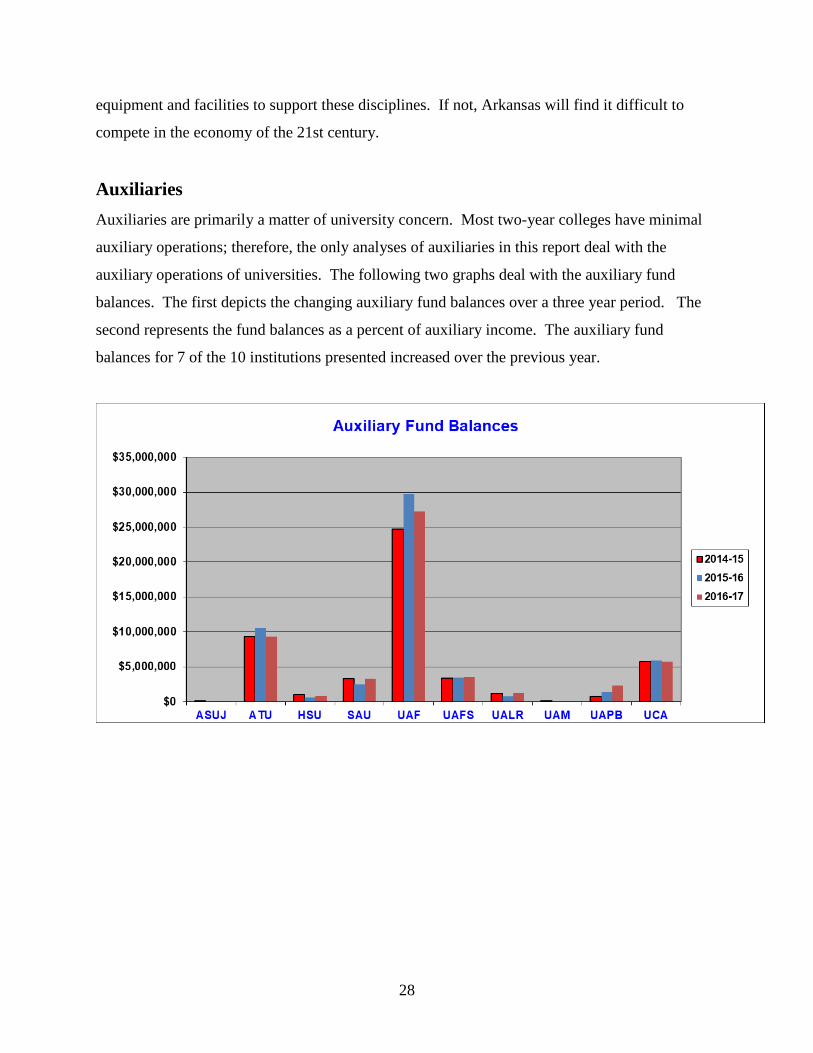
Auxiliaries Auxiliaries are primarily a matter of university concern. Most two-year colleges have minimal
auxiliary operations; therefore, the only analyses of auxiliaries in this report deal with the
auxiliary operations of universities. The following two graphs deal with the auxiliary fund
balances. The first depicts the changing auxiliary fund balances over a three year period. The
second represents the fund balances as a percent of auxiliary income. The auxiliary fund
balances for 7 of the 10 institutions presented increased over the previous year.

29
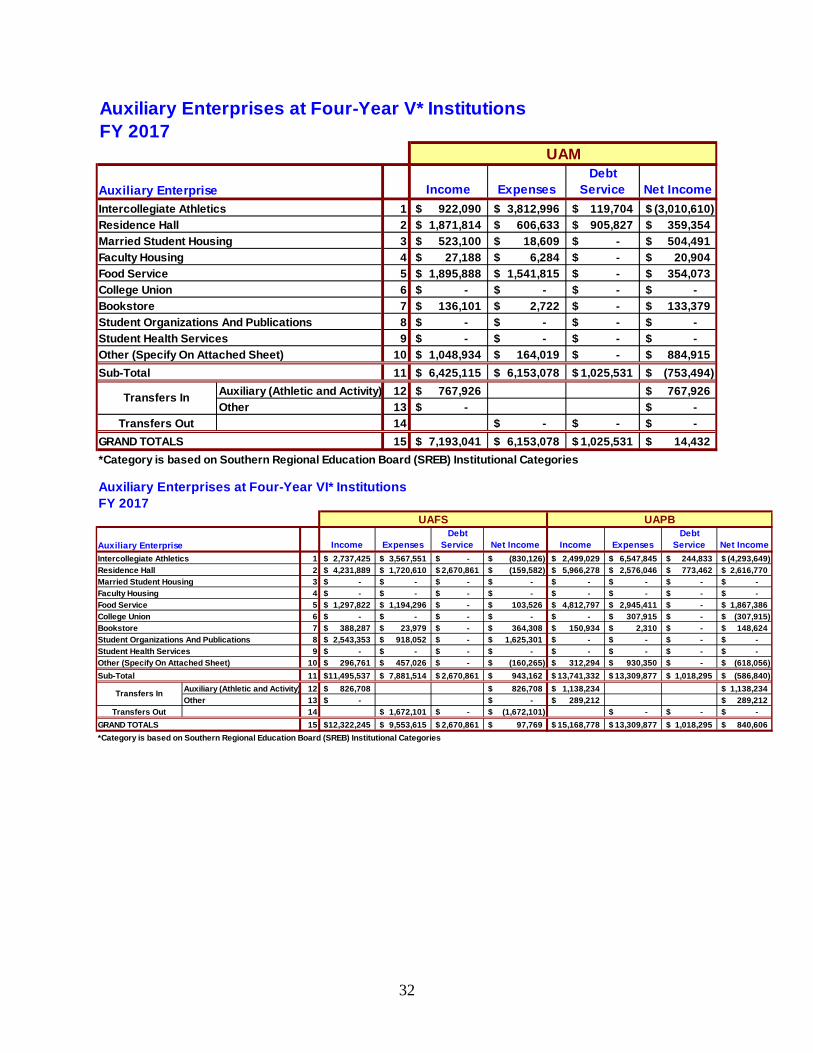
Below is a series of spreadsheets that give the income and expenditures for institution by each
type of auxiliary enterprise for 2016-17. The spreadsheets group the same category of
institutions together for a better comparison of the profits and losses of each type of auxiliary
enterprise.
From these spreadsheets it is obvious that bookstores are not “cash cows” as commonly believed.
The difference you will notice in bookstores and food service are generally due to whether or not
an institution has out-sourced/privatized its bookstore or food service operation. Modest income
and very low expenditures usually indicate an institution that has out-sourced that operation.
Losses in bookstore operations and food service are usually an indicator that the institution is
operating its own bookstore and/or food service. As you can see in the graphs, another drain on
Auxiliary funds is from the College Unions and/or Student Organizations and Publications.

30
Auxiliary Enterprises at Four-Year I* InstitutionFY 2017
Auxiliary Enterprise Income ExpensesDebt
Service Net IncomeIntercollegiate Athletics 1 109,506,512$ 80,691,950$ 11,370,046$ 17,444,516$ Residence Hall 2 65,717,121$ 38,601,605$ 13,835,406$ 13,280,110$ Married Student Housing 3 -$ -$ -$ -$ Faculty Housing 4 -$ -$ -$ -$ Food Service 5 -$ -$ -$ -$ College Union 6 10,854$ 624,989$ -$ (614,135)$ Bookstore 7 15,130,837$ 14,677,520$ 1,028,749$ (575,432)$ Student Organizations And Publications 8 2,358,906$ 1,877,764$ -$ 481,142$ Student Health Services 9 9,757,962$ 8,474,192$ 145,036$ 1,138,734$ Other (Specify On Attached Sheet) 10 11,840,759$ 6,279,091$ 4,808,673$ 752,995$ Sub-Total 11 214,322,951$ 151,227,111$ 31,187,910$ 31,907,930$
Auxiliary (Athletic and Activity) 12 -$ -$ Other 13 -$ -$
Transfers Out 14 34,463,066$ -$ (34,463,066)$ GRAND TOTALS 15 214,322,951$ 185,690,177$ 31,187,910$ (2,555,136)$ *Category is based on Southern Regional Education Board (SREB) Institutional Categories
Transfers In
UAF
Auxiliary Enterprises at Four-Year II* InstitutionsFY 2017
Auxiliary Enterprise Income ExpensesDebt
Service Net IncomeIntercollegiate Athletics 1 7,204,276$ 9,050,650$ -$ (1,846,374)$ Residence Hall 2 6,965,001$ 2,752,696$ -$ 4,212,305$ Married Student Housing 3 -$ -$ -$ -$ Faculty Housing 4 -$ -$ -$ -$ Food Service 5 3,092,291$ 3,127,610$ -$ (35,319)$ College Union 6 585,850$ 1,762,560$ -$ (1,176,710)$ Bookstore 7 375,587$ -$ -$ 375,587$ Student Organizations And Publications 8 435,215$ 362,189$ -$ 73,026$ Student Health Services 9 -$ -$ -$ -$ Other (Specify On Attached Sheet) 10 815,074$ 875,293$ 20,274$ (80,493)$ Sub-Total 11 19,473,294$ 17,930,998$ 20,274$ 1,522,022$
Transfers In Auxiliary (Athletic and Activity) 12 3,734,466$ 3,734,466$ Other 13 544,818$ 544,818$
Transfers Out 14 1,364,981$ 3,916,078$ (5,281,059)$ GRAND TOTALS 15 23,752,578$ 19,295,979$ 3,936,352$ 520,247$ *Category is based on Southern Regional Education Board (SREB) Institutional Categories
UALR

31
Auxiliary Enterprises at Four-Year III* InstitutionsFY 2017
Auxiliary Enterprise Income ExpensesDebt
Service Net Income Income ExpensesDebt
Service Net IncomeIntercollegiate Athletics 1 12,560,353$ 19,060,009$ -$ (6,499,657)$ 4,028,652$ 5,343,755$ 255,198$ (1,570,300)$ Residence Hall 2 13,571,851$ 5,275,538$ 5,827,653$ 2,468,659$ 9,604,428$ 5,705,201$ 2,702,364$ 1,196,863$ Married Student Housing 3 1,285,971$ 529,762$ 870,694$ (114,484) -$ -$ -$ -$ Faculty Housing 4 18,300$ 15,758$ -$ 2,542 -$ -$ -$ -$ Food Service 5 1,897,711$ 342,641$ -$ 1,555,071$ 7,142,333$ 5,232,634$ 428,057$ 1,481,642$ College Union 6 2,644,803$ 1,260,152$ 1,200,922$ 183,729$ -$ -$ -$ -$ Bookstore 7 365,683$ 12,713$ -$ 352,970$ 1,841,665$ 1,390,256$ -$ 451,409$ Student Organizations And Publications 8 140,361$ 136,991$ -$ 3,370$ 464,343$ 485,793$ -$ (21,450)$ Student Health Services 9 -$ -$ -$ -$ 1,383,899$ 1,189,097$ -$ 194,802$ Other (Specify On Attached Sheet) 10 2,867,161$ 2,241,934$ 409,216$ 216,011$ 215,001$ 549,309$ -$ (334,308)$ Sub-Total 11 35,352,194$ 28,875,498$ 8,308,485$ (1,831,789)$ 24,680,321$ 19,896,045$ 3,385,619$ 1,398,658$
Auxiliary (Athletic and Activity) 12 2,292,378$ 2,292,378$ 1,621,877$ 1,621,877$ Other 13 (435,589)$ (435,589)$ -$ -$
Transfers Out 14 -$ -$ -$ 4,173,979$ -$ (4,173,979)$ GRAND TOTALS 15 37,208,983$ 28,875,498$ 8,308,485$ 25,000$ 26,302,198$ 24,070,024$ 3,385,619$ (1,153,444)$
Auxiliary Enterprise Income ExpensesDebt
Service Net IncomeIntercollegiate Athletics 1 8,927,982$ 11,670,270$ 674,447$ (3,416,735)$ Residence Hall 2 17,574,732$ 8,554,695$ 5,885,104$ 3,134,933$ Married Student Housing 3 -$ -$ -$ -$ Faculty Housing 4 -$ -$ -$ -$ Food Service 5 9,351,261$ 6,571,529$ -$ 2,779,732$ College Union 6 1,313,040$ 951,410$ 226,598$ 135,032$ Bookstore 7 418,587$ 69,385$ -$ 349,202$ Student Organizations And Publications 8 -$ -$ -$ -$ Student Health Services 9 1,622,409$ 1,397,587$ 330,061$ (105,239)$ Other (Specify On Attached Sheet) 10 3,575,866$ 2,015,810$ 1,124,718$ 435,338$ Sub-Total 11 42,783,877$ 31,230,686$ 8,240,928$ 3,312,263$
Auxiliary (Athletic and Activity) 12 1,272,925$ 1,272,925$ Other 13 1,934,498$ 1,934,498$
Transfers Out 14 6,719,390$ -$ (6,719,390)$ GRAND TOTALS 15 45,991,300$ 37,950,076$ 8,240,928$ (199,704)$ *Category is based on Southern Regional Education Board (SREB) Institutional Categories
Transfers In
ASU
UCA
ATU
Transfers In
Auxiliary Enterprises at Four-Year IV* InstitutionsFY 2017
Auxiliary Enterprise Income ExpensesDebt
Service Net Income Income ExpensesDebt
Service Net IncomeIntercollegiate Athletics 1 1,810,389$ 4,567,223$ -$ (2,756,834)$ 1,990,088$ 4,044,498$ 86,786$ (2,141,196)$ Residence Hall 2 7,089,071$ 2,232,354$ 1,440,044$ 3,416,673$ 6,314,065$ 3,107,176$ 1,768,076$ 1,438,813$ Married Student Housing 3 -$ -$ -$ -$ -$ -$ -$ -$ Faculty Housing 4 -$ -$ -$ -$ 17,071$ 7,784$ -$ 9,287$ Food Service 5 4,425,166$ 3,625,157$ 148,519$ 651,490$ 4,361,736$ 3,449,308$ -$ 912,429$ College Union 6 145,852$ 243,188$ 43,504$ (140,840)$ 19,348$ 301,099$ -$ (281,750)$ Bookstore 7 94,252$ -$ -$ 94,252$ 181,111$ 11,421$ -$ 169,689$ Student Organizations And Publications 8 88,341$ 98,478$ -$ (10,137)$ 667,981$ 376,557$ -$ 291,424$ Student Health Services 9 295,948$ 280,613$ -$ 15,335$ 361,375$ 317,851$ -$ 43,524$ Other (Specify On Attached Sheet) 10 1,247,041$ 503,628$ 427,031$ 316,382$ 283,425$ 232,409$ -$ 51,016$ Sub-Total 11 15,196,060$ 11,550,641$ 2,059,098$ 1,586,321$ 14,196,200$ 11,848,102$ 1,854,862$ 493,236$
Auxiliary (Athletic and Activity) 12 1,393,618$ 1,393,618$ 1,304,748$ 1,304,748$ Other 13 -$ -$ 18,500$ 18,500$
Transfers Out 14 930,702$ 1,832,227$ (2,762,929)$ 458,398$ -$ (458,398)$ GRAND TOTALS 15 16,589,678$ 12,481,343$ 3,891,325$ 217,010$ 15,519,448$ 12,306,500$ 1,854,862$ 1,358,086$ *Category is based on Southern Regional Education Board (SREB) Institutional Categories
Transfers In
HSU SAUM
32
Auxiliary Enterprises at Four-Year V* InstitutionsFY 2017
Auxiliary Enterprise Income ExpensesDebt
Service Net IncomeIntercollegiate Athletics 1 922,090$ 3,812,996$ 119,704$ (3,010,610)$ Residence Hall 2 1,871,814$ 606,633$ 905,827$ 359,354$ Married Student Housing 3 523,100$ 18,609$ -$ 504,491$ Faculty Housing 4 27,188$ 6,284$ -$ 20,904$ Food Service 5 1,895,888$ 1,541,815$ -$ 354,073$ College Union 6 -$ -$ -$ -$ Bookstore 7 136,101$ 2,722$ -$ 133,379$ Student Organizations And Publications 8 -$ -$ -$ -$ Student Health Services 9 -$ -$ -$ -$ Other (Specify On Attached Sheet) 10 1,048,934$ 164,019$ -$ 884,915$ Sub-Total 11 6,425,115$ 6,153,078$ 1,025,531$ (753,494)$
Auxiliary (Athletic and Activity) 12 767,926$ 767,926$ Other 13 -$ -$
Transfers Out 14 -$ -$ -$ GRAND TOTALS 15 7,193,041$ 6,153,078$ 1,025,531$ 14,432$ *Category is based on Southern Regional Education Board (SREB) Institutional Categories
Transfers In
UAM
Auxiliary Enterprises at Four-Year VI* InstitutionsFY 2017
Auxiliary Enterprise Income ExpensesDebt
Service Net Income Income ExpensesDebt
Service Net IncomeIntercollegiate Athletics 1 2,737,425$ 3,567,551$ -$ (830,126)$ 2,499,029$ 6,547,845$ 244,833$ (4,293,649)$ Residence Hall 2 4,231,889$ 1,720,610$ 2,670,861$ (159,582)$ 5,966,278$ 2,576,046$ 773,462$ 2,616,770$ Married Student Housing 3 -$ -$ -$ -$ -$ -$ -$ -$ Faculty Housing 4 -$ -$ -$ -$ -$ -$ -$ -$ Food Service 5 1,297,822$ 1,194,296$ -$ 103,526$ 4,812,797$ 2,945,411$ -$ 1,867,386$ College Union 6 -$ -$ -$ -$ -$ 307,915$ -$ (307,915)$ Bookstore 7 388,287$ 23,979$ -$ 364,308$ 150,934$ 2,310$ -$ 148,624$ Student Organizations And Publications 8 2,543,353$ 918,052$ -$ 1,625,301$ -$ -$ -$ -$ Student Health Services 9 -$ -$ -$ -$ -$ -$ -$ -$ Other (Specify On Attached Sheet) 10 296,761$ 457,026$ -$ (160,265)$ 312,294$ 930,350$ -$ (618,056)$ Sub-Total 11 11,495,537$ 7,881,514$ 2,670,861$ 943,162$ 13,741,332$ 13,309,877$ 1,018,295$ (586,840)$
Auxiliary (Athletic and Activity) 12 826,708$ 826,708$ 1,138,234$ 1,138,234$ Other 13 -$ -$ 289,212$ 289,212$
Transfers Out 14 1,672,101$ -$ (1,672,101)$ -$ -$ -$ GRAND TOTALS 15 12,322,245$ 9,553,615$ 2,670,861$ 97,769$ 15,168,778$ 13,309,877$ 1,018,295$ 840,606$ *Category is based on Southern Regional Education Board (SREB) Institutional Categories
Transfers In
UAFS UAPB
33
Athletics Athletics are a major component of the auxiliary operations at universities. The athletic report
details revenues and expenditures for each institution. Athletic revenues will equal athletic
expenditures unless there is an ending fund balance. A.C.A. § 6-62-804 prohibits athletic
deficits. A designated athletic fee must be charged to the students by the institution if athletic-
generated revenues (i.e., ticket sales, media/tournament/bowl, concessions/program sales, and
game guarantees), foundations/clubs and other private gifts, other athletic income, auxiliary
profits, and the allowable educational and general transfer do not cover the total expenditures for
athletics.
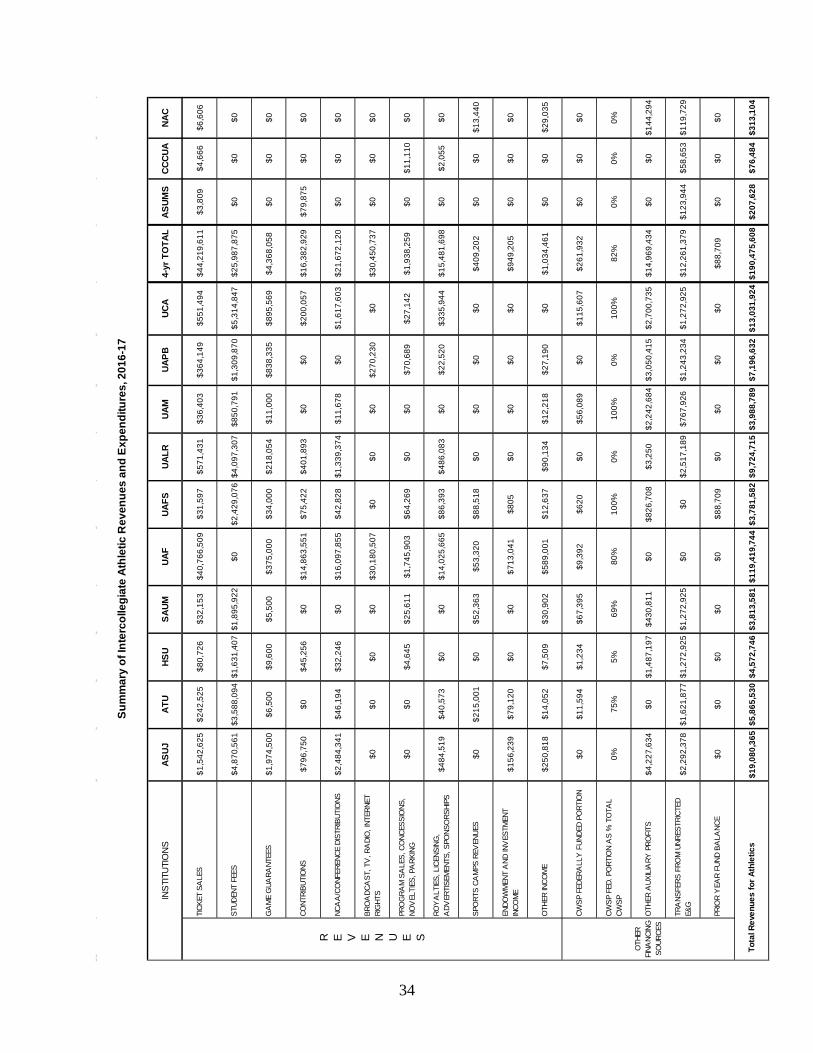
The 2016-17 total amount of athletic expenditures reported by state supported universities is
$176,065,898 and two-year colleges is $597.216. The statewide total is $176,663,114 – an
increase of $10,959,533 (6.6%) from $165,703,581 in 2015-16.
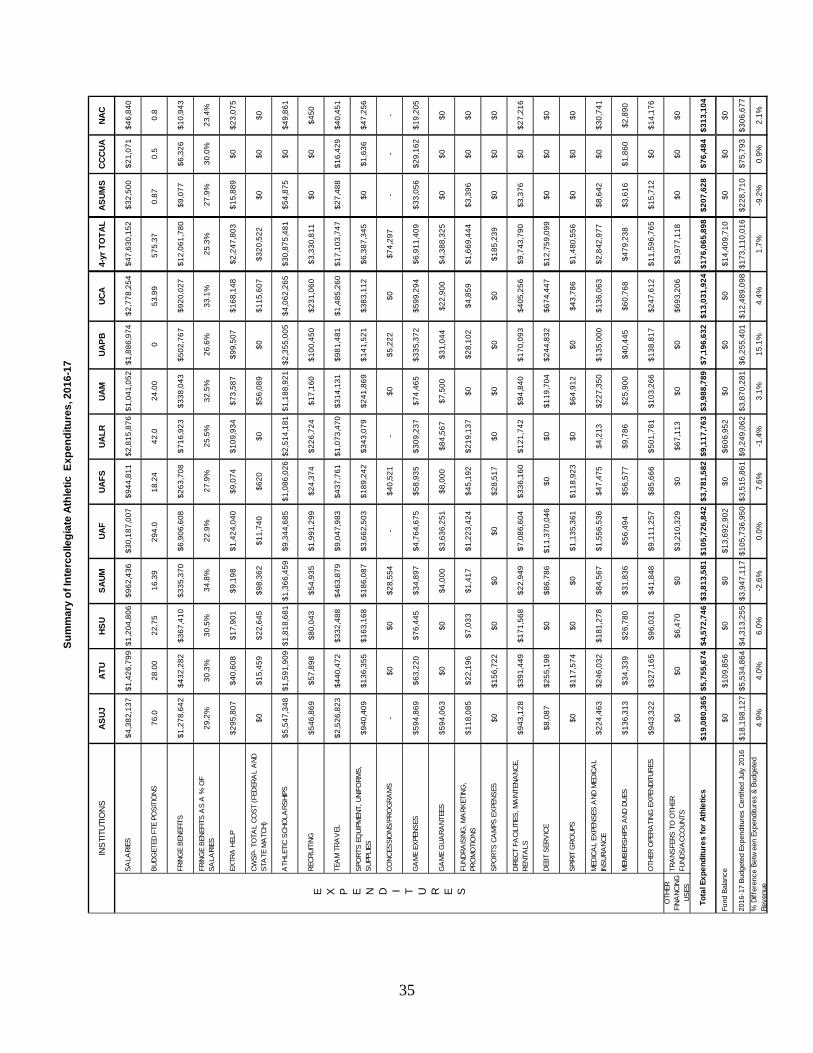
A comparison of 2016-17 actual expenditures to 2016-17 budgeted revenues certified to the
Coordinating Board in July 2016 is also illustrated at the bottom of the summary chart. Certified
budgeted expenditures for 2016-17 totaled $173,721,196 for all institutions. Total actual
expenditures for 2016-17 for all institutions exceeded this budgeted amount by 1.7% percent.
Actual expenditures varied from the Board of Trustees certified budgeted expenditures by a
range of 15 percent over the budgeted amount to 9 percent under the budgeted amount.
Athletic expenditures since the 1990s have often grown faster than many institutions’ overall
budget. However, when athletics’ expenditures and their interaction with educational and
general income are examined together, a different perspective emerges. The importance of
athletics to the educational and general budget becomes evident. Regrettably, such an analysis is
beyond the scope and time constraints of this report.
34
ASUJ
ATU
HSU
SAUM
UAF
UAFS
UALR
UA
MUA
PBUC
A4-
yr T
OTA
LAS
UMS
CCCU
ANA
C
TICK
ET S
ALE
S
$1
,542
,625
$242
,525
$80,
726
$32,
153
$40,
766,
509
$31,
597
$571
,431
$36,
403
$364
,149
$551
,494
$44,
219,
611
$3,8
09$4
,666
$6,6
06
STUD
ENT
FEES
$4,8
70,5
61$3
,588
,094
$1,6
31,4
07$1
,895
,922
$0$2
,429
,076
$4,0
97,3
07$8
50,7
91$1
,309
,870
$5,3
14,8
47$2
5,98
7,87
5$0
$0$0
GA
ME
GUA
RANT
EES
$1,9
74,5
00$6
,500
$9,6
00$5
,500
$375
,000
$34,
000
$218
,054
$11,
000
$838
,335
$895
,569
$4,3
68,0
58$0
$0$0
CONT
RIBU
TIO
NS$7
96,7
50$0
$45,
256
$0$1
4,86
3,55
1$7
5,42
2$4
01,8
93$0
$0$2
00,0
57$1
6,38
2,92
9$7
9,87
5$0
$0
NCA
A/C
ONF
EREN
CE D
ISTR
IBUT
IONS
$2,4
84,3
41$4
6,19
4$3
2,24
6$0
$16,
097,
855
$42,
828
$1,3
39,3
74$1
1,67
8$0
$1,6
17,6
03$2
1,67
2,12
0$0
$0$0
BRO
ADC
AST
, TV
, RA
DIO
, INT
ERNE
T RI
GHT
S$0
$0$0
$0$3
0,18
0,50
7$0
$0$0
$270
,230
$0$3
0,45
0,73
7$0
$0$0
PRO
GRA
M S
ALE
S, C
ONC
ESSI
ONS
, NO
VEL
TIES
, PA
RKIN
G$0
$0$4
,645
$25,
611
$1,7
45,9
03$6
4,26
9$0
$0$7
0,68
9$2
7,14
2$1
,938
,259
$0$1
1,11
0$0
ROY
ALT
IES,
LIC
ENSI
NG,
ADV
ERTI
SEM
ENTS
, SPO
NSO
RSHI
PS$4
84,5
19$4
0,57
3$0
$0$1
4,02
5,66
5$8
6,39
3$4
86,0
83$0
$22,
520
$335
,944
$15,
481,
698
$0$2
,055
$0
SPO
RTS
CAM
PS R
EVEN
UES
$0$2
15,0
01$0
$52,
363
$53,
320
$88,
518
$0$0
$0$0
$409
,202
$0$0
$13,
440
ENDO
WM
ENT
AND
INV
ESTM
ENT
INCO
ME
$156
,239
$79,
120
$0$0
$713
,041
$805
$0$0
$0$0
$949
,205
$0$0
$0
OTH
ER IN
COM
E
$2
50,8
18$1
4,05
2$7
,509
$30,
902
$589
,001
$12,
637
$90,
134
$12,
218
$27,
190
$0$1
,034
,461
$0$0
$29,
035
CWSP
FED
ERA
LLY
FUN
DED
PORT
ION
$0$1
1,59
4$1
,234
$67,
395
$9,3
92$6
20$0
$56,
089
$0$1
15,6
07$2
61,9
32$0
$0$0
CWSP
FED
. PO
RTIO
N A
S %
TO
TAL
CWSP
0%75
%5%
69%
80%
100%
0%10
0%0%
100%
82%
0%0%
0%
OTH
ER A
UXIL
IARY
PRO
FITS
$4,2
27,6
34$0
$1,4
87,1
97$4
30,8
11$0
$826
,708
$3,2
50$2
,242
,684
$3,0
50,4
15$2
,700
,735
$14,
969,
434
$0$0
$144
,294
TRA
NSFE
RS F
ROM
UNR
ESTR
ICTE
D E&
G
$2,2
92,3
78$1
,621
,877
$1,2
72,9
25$1
,272
,925
$0$0
$2,5
17,1
89$7
67,9
26$1
,243
,234
$1,2
72,9
25$1
2,26
1,37
9$1
23,9
44$5
8,65
3$1
19,7
29
PRIO
R Y
EAR
FUND
BA
LANC
E$0
$0$0
$0$0
$88,
709
$0$0
$0$0
$88,
709
$0$0
$0
$19,
080,
365
$5,8
65,5
30$4
,572
,746
$3,8
13,5
81$1
19,4
19,7
44$3
,781
,582
$9,7
24,7
15$3
,988
,789
$7,1
96,6
32$1
3,03
1,92
4$1
90,4
75,6
08$2
07,6
28$7
6,48
4$3
13,1
04
Sum
mar
y of
Inte
rcol
legi
ate
Athl
etic
Rev
enue
s an
d Ex
pend
iture
s, 2
016-
17
R E V E N U E S
OTH
ER
FINA
NCIN
G
SOUR
CES
To
tal R
even
ues
for A
thle
tics
INS
TITU
TIO
NS
35
ASUJ
ATU
HSU
SAUM
UAF
UAFS
UALR
UA
MUA
PBUC
A4-
yr T
OTA
LAS
UMS
CCCU
ANA
C
SALA
RIES
$4
,382
,137
$1,4
26,7
99$1
,204
,806
$962
,436
$30,
187,
007
$944
,811
$2,8
15,8
76$1
,041
,052
$1,8
86,9
74$2
,778
,254
$47,
630,
152
$32,
500
$21,
071
$46,
840
BUDG
ETED
FTE
PO
SITI
ONS
76.0
28.0
022
.75
16.3
929
4.0
18.2
442
.024
.00
053
.99
575.
370.
870.
50.
8
FRIN
GE
BENE
FITS
$1
,278
,642
$432
,282
$367
,410
$335
,370
$6,9
06,6
08$2
63,7
08$7
16,9
23$3
38,0
43$5
02,7
67$9
20,0
27$1
2,06
1,78
0$9
,077
$6,3
26$1
0,94
3
FRIN
GE
BENE
FITS
AS
A %
OF
SALA
RIES
29.2
%30
.3%
30.5
%34
.8%
22.9
%27
.9%
25.5
%32
.5%
26.6
%33
.1%
25.3
%27
.9%
30.0
%23
.4%
EXTR
A H
ELP
$295
,807
$40,
608
$17,
901
$9,1
98$1
,424
,040
$9,0
74$1
09,9
34$7
3,58
7$9
9,50
7$1
68,1
48$2
,247
,803
$15,
889
$0$2
3,07
5
CWSP
- TO
TAL
COST
(FED
ERA
L A
ND
STA
TE M
ATC
H)$0
$15,
459
$22,
645
$98,
362
$11,
740
$620
$0$5
6,08
9$0
$115
,607
$320
,522
$0$0
$0
ATH
LETI
C SC
HOLA
RSHI
PS$5
,547
,348
$1,5
91,9
09$1
,818
,681
$1,3
66,4
59$9
,344
,685
$1,0
86,0
26$2
,514
,181
$1,1
88,9
21$2
,355
,005
$4,0
62,2
65$3
0,87
5,48
1$5
4,87
5$0
$49,
861
RECR
UITI
NG$5
46,8
69$5
7,89
8$8
0,04
3$5
4,93
5$1
,991
,299
$24,
374
$226
,724
$17,
160
$100
,450
$231
,060
$3,3
30,8
11$0
$0$4
50
TEA
M T
RAV
EL$2
,526
,823
$440
,472
$332
,488
$463
,879
$9,0
47,9
83$4
37,7
61$1
,073
,470
$314
,131
$981
,481
$1,4
85,2
60$1
7,10
3,74
7$2
7,48
8$1
6,42
9$4
0,45
1
SPO
RTS
EQUI
PMEN
T, U
NIFO
RMS,
SU
PPLI
ES$9
40,4
09$1
36,3
55$1
63,1
68$1
86,0
87$3
,662
,503
$189
,242
$343
,079
$241
,869
$141
,521
$383
,112
$6,3
87,3
45$0
$1,6
36$4
7,25
6
CONC
ESSI
ONS
/PRO
GRA
MS
-$0
$0$2
8,55
4-
$40,
521
-$0
$5,2
22$0
$74,
297
--
-
GA
ME
EXPE
NSES
$594
,869
$63,
220
$76,
445
$34,
897
$4,7
64,6
75$5
8,93
5$3
09,2
37$7
4,46
5$3
35,3
72$5
99,2
94$6
,911
,409
$33,
056
$29,
162
$19,
205
GA
ME
GUA
RANT
EES
$594
,063
$0$0
$4,0
00$3
,636
,251
$8,0
00$8
4,56
7$7
,500
$31,
044
$22,
900
$4,3
88,3
25$0
$0$0
FUND
RAIS
ING
, MA
RKET
ING
, PR
OM
OTI
ONS
$118
,085
$22,
196
$7,0
33$1
,417
$1,2
23,4
24$4
5,19
2$2
19,1
37$0
$28,
102
$4,8
59$1
,669
,444
$3,3
96$0
$0
SPO
RTS
CAM
PS E
XPEN
SES
$0$1
56,7
22$0
$0$0
$28,
517
$0$0
$0$0
$185
,239
$0$0
$0
DIRE
CT F
ACI
LITI
ES, M
AIN
TENA
NCE,
RE
NTA
LS$9
43,1
28$3
91,4
49$1
71,5
68$2
2,94
9$7
,086
,604
$336
,160
$121
,742
$94,
840
$170
,093
$405
,256
$9,7
43,7
90$3
,376
$0$2
7,21
6
DEBT
SER
VIC
E$8
,087
$255
,198
$0$8
6,78
6$1
1,37
0,04
6$0
$0$1
19,7
04$2
44,8
32$6
74,4
47$1
2,75
9,09
9$0
$0$0
SPIR
IT G
ROUP
S$0
$117
,574
$0$0
$1,1
35,3
61$1
18,9
23$0
$64,
912
$0$4
3,78
6$1
,480
,556
$0$0
$0
MED
ICA
L EX
PENS
ES A
ND M
EDIC
AL
INSU
RANC
E$2
24,4
63$2
46,0
32$1
81,2
78$8
4,56
7$1
,556
,536
$47,
475
$4,2
13$2
27,3
50$1
35,0
00$1
36,0
63$2
,842
,977
$8,6
42$0
$30,
741
MEM
BERS
HIPS
AND
DUE
S$1
36,3
13$3
4,33
9$2
6,78
0$3
1,83
6$5
6,49
4$5
6,57
7$9
,786
$25,
900
$40,
445
$60,
768
$479
,238
$3,6
16$1
,860
$2,8
90
OTH
ER O
PERA
TING
EXP
ENDI
TURE
S$9
43,3
22$3
27,1
65$9
6,03
1$4
1,84
8$9
,111
,257
$85,
666
$501
,781
$103
,266
$138
,817
$247
,612
$11,
596,
765
$15,
712
$0$1
4,17
6
TRA
NSFE
RS T
O O
THER
FU
NDS/
ACC
OUN
TS$0
$0$6
,470
$0$3
,210
,329
$0$6
7,11
3$0
$0$6
93,2
06$3
,977
,118
$0$0
$0
$19,
080,
365
$5,7
55,6
74$4
,572
,746
$3,8
13,5
81$1
05,7
26,8
42$3
,781
,582
$9,1
17,7
63$3
,988
,789
$7,1
96,6
32$1
3,03
1,92
4$1
76,0
65,8
98$2
07,6
28$7
6,48
4$3
13,1
04
$0$1
09,8
56$0
$0$1
3,69
2,90
2$0
$606
,952
$0$0
$0$1
4,40
9,71
0$0
$0$0
$18,
198,
127
$5,5
34,8
64$4
,313
,255
$3,9
47,1
17$1
05,7
36,9
50$3
,515
,861
$9,2
49,0
62$3
,870
,281
$6,2
55,4
01$1
2,48
9,09
8$1
73,1
10,0
16$2
28,7
10$7
5,79
3$3
06,6
77
4.9%
4.0%
6.0%
-2.6
%0.
0%7.
6%-1
.4%
3.1%
15.1
%4.
4%1.
7%-9
.2%
0.9%
2.1%
INS
TITU
TIO
NS
2016
-17
Budg
eted
Exp
endi
ture
s Ce
rtifie
d Ju
ly 2
016
OTH
ER
FINA
NCIN
G
USES
To
tal E
xpen
ditu
res
for A
thle
tics
Fund
Bal
ance
% D
iffer
ence
Bet
wee
n Ex
pend
iture
s &
Budg
eted
Re
venu
e
E X P E N D I T U R E S
Sum
mar
y of
Inte
rcol
legi
ate
Athl
etic
Exp
endi
ture
s, 2
016-
17
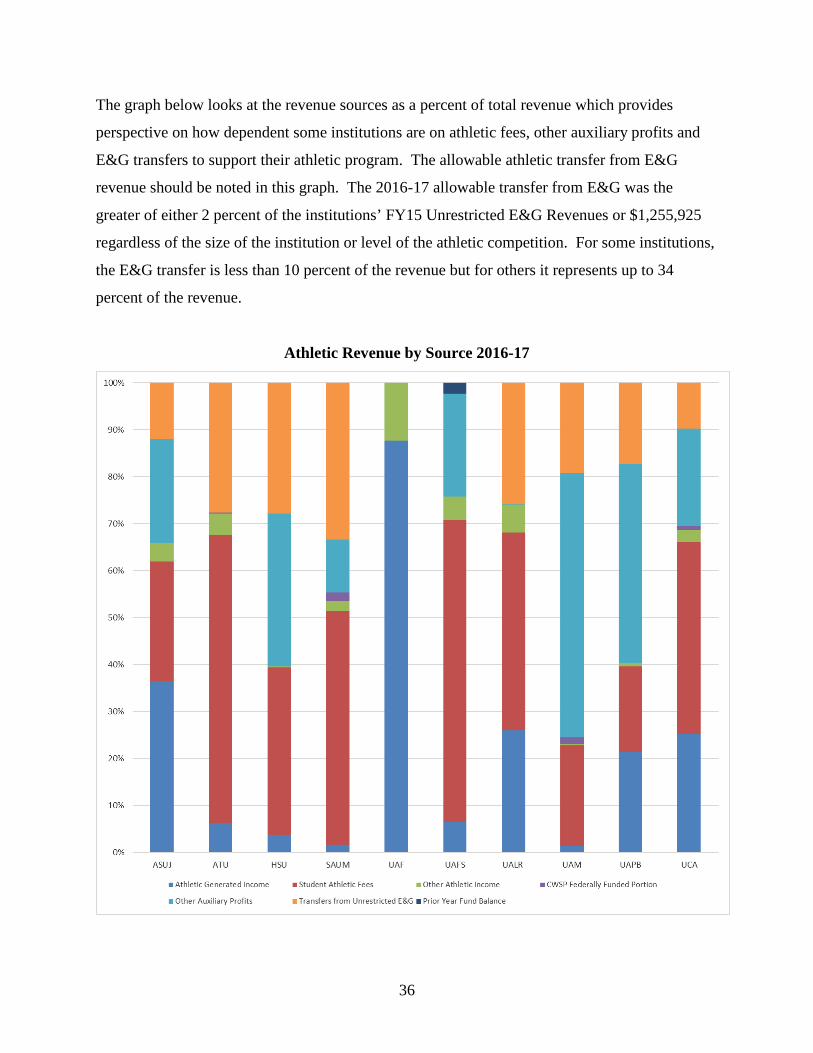
36
The graph below looks at the revenue sources as a percent of total revenue which provides
perspective on how dependent some institutions are on athletic fees, other auxiliary profits and
E&G transfers to support their athletic program. The allowable athletic transfer from E&G
revenue should be noted in this graph. The 2016-17 allowable transfer from E&G was the
greater of either 2 percent of the institutions’ FY15 Unrestricted E&G Revenues or $1,255,925
regardless of the size of the institution or level of the athletic competition. For some institutions,
the E&G transfer is less than 10 percent of the revenue but for others it represents up to 34
percent of the revenue.
Athletic Revenue by Source 2016-17

37
The following graph presents athletic expenditures as a percent of the total university
expenditures. The heavy yellow horizontal line represents the average for the universities. The
average athletic expenditure (excluding UAF) for 2016-17 represented only 5.3 percent of the
total of the universities’ expenditures.

38
RECOMMENDATIONS • Continue to work with institutions to monitor and refine the Productivity Funding Model
policies to ensure adequate funding is available to meet student needs, innovation is
encouraged, and that the policies continue to respond to attainment goals and priorities of
the state.
• AHECB, ADHE and institutions of higher education work with the legislature toward
alignment of institutional funding policies, state financial aid policies, and tuition policies
in a way that prioritizes higher education affordability.

39
Appendices

40
Appendix A:
Operating Margins and Fund
Balances

41
Table A-1. Universities Unrestricted E&G Operating Margins 2007-08 and 2012-13 to 2016-172007-08 2012-13 2013-14 2014-15 2015-16 2016-17
ASUJ Total Expenditures $121,812,532 $162,252,107 $156,359,312 $159,121,669 $165,677,597 $165,533,134 FTE Enrollment 9,382 12,368 12,168 12,020 12,450 12,928 Revenues:
Tuition & Fees $58,671,724 $88,772,741 $89,527,334 $91,475,108 $94,776,124 $97,962,241 Other $4,488,787 $5,856,891 $5,374,187 $5,471,501 $9,463,330 $6,812,777 State Funds $59,753,311 $60,630,797 $62,279,029 $62,825,495 $62,881,380 $63,157,177 Total Revenue $122,913,822 $155,260,429 $157,180,550 $159,772,104 $167,120,834 $167,932,195
Operating Margin $1,101,290 ($6,991,678) $821,238 $650,436 $1,443,237 $2,399,062Percent of Expenditures 0.90% -4.31% 0.53% 0.41% 0.87% 1.45%
ATU Total Expenditures $72,599,813 $80,985,165 $85,644,619 $89,523,873 $96,689,704 $96,458,354 FTE Enrollment 6,281 8,030 8,129 8,420 8,178 7,983 Revenues:
Tuition & Fees $30,816,813 $50,527,536 $53,973,806 $58,501,871 $60,980,667 $62,511,993 Other $5,350,350 $3,759,441 $3,499,320 $4,650,043 $4,012,150 $4,204,087 State Funds $30,762,139 $31,134,133 $31,560,998 $31,885,049 $31,908,441 $31,995,945Total Revenue $66,929,302 $85,421,110 $89,034,124 $95,036,963 $96,901,258 $98,712,025
Operating Margin ($5,670,511) $4,435,945 $3,389,505 $5,513,090 $211,554 $2,253,671 Percent of Expenditures -7.81% 5.48% 3.96% 6.16% 0.22% 2.34%
HSU Total Expenditures $40,392,167 $44,625,556 $46,617,486 $47,049,444 $50,062,623 $51,785,371FTE Enrollment 3,407 3,527 3,497 3,293 3,245 3,221 Revenues:
Tuition & Fees $18,923,291 $25,137,681 $25,714,854 $25,733,640 $26,279,333 $27,319,768Other $823,211 $940,372 $987,231 $883,544 $1,098,332 $1,481,204State Funds $20,695,056 $20,565,446 $20,595,470 $21,020,862 $21,034,398 $21,131,335Total Revenue $40,441,558 $46,643,499 $47,297,555 $47,638,046 $48,412,063 $49,932,307
Operating Margin $49,391 $2,017,943 $680,069 $588,602 ($1,650,560) ($1,853,064)Percent of Expenditures 0.12% 4.52% 1.46% 1.25% -3.30% -3.58%
SAUM Total Expenditures $32,897,296 $40,350,981 $40,165,622 $43,547,100 $51,669,131 $57,549,634FTE Enrollment 2,840 3,005 3,071 3,218 3,930 4,245 Revenues:
Tuition & Fees $15,106,815 $21,501,956 $23,393,761 $25,468,570 $33,189,267 $37,274,708Other $1,558,959 $1,562,808 $1,400,778 $1,821,893 $2,314,030 $2,351,998State Funds $16,546,673 $16,768,783 $16,825,687 $16,946,755 $16,983,378 $17,014,578Total Revenue $33,212,447 $39,833,547 $41,620,226 $44,237,218 $52,486,675 $56,641,285
Operating Margin $315,151 ($517,434) $1,454,604 $690,118 $817,544 ($908,349)Percent of Expenditures 0.96% -1.28% 3.62% 1.58% 1.58% -1.58%
UAF Total Expenditures $260,162,624 $332,349,189 $367,287,507 $388,767,774 $403,271,461 $417,833,923FTE Enrollment 16,855 22,733 23,486 24,201 24,456 24,666 Revenues:
Tuition & Fees $109,491,153 $193,794,040 $220,938,774 $247,779,330 $265,662,890 $284,797,711Other $28,979,981 $23,803,725 $26,387,488 $22,255,888 $24,663,501 $22,875,987State Funds $121,439,049 $122,833,189 $126,748,703 $127,319,008 $127,579,023 $127,851,983Total Revenue $259,910,183 $340,430,954 $374,074,965 $397,354,226 $417,905,414 $435,525,681
Operating Margin ($252,441) $8,081,765 $6,787,458 $8,586,452 $14,633,953 $17,691,758Percent of Expenditures -0.10% 2.43% 1.85% 2.21% 3.63% 4.23%
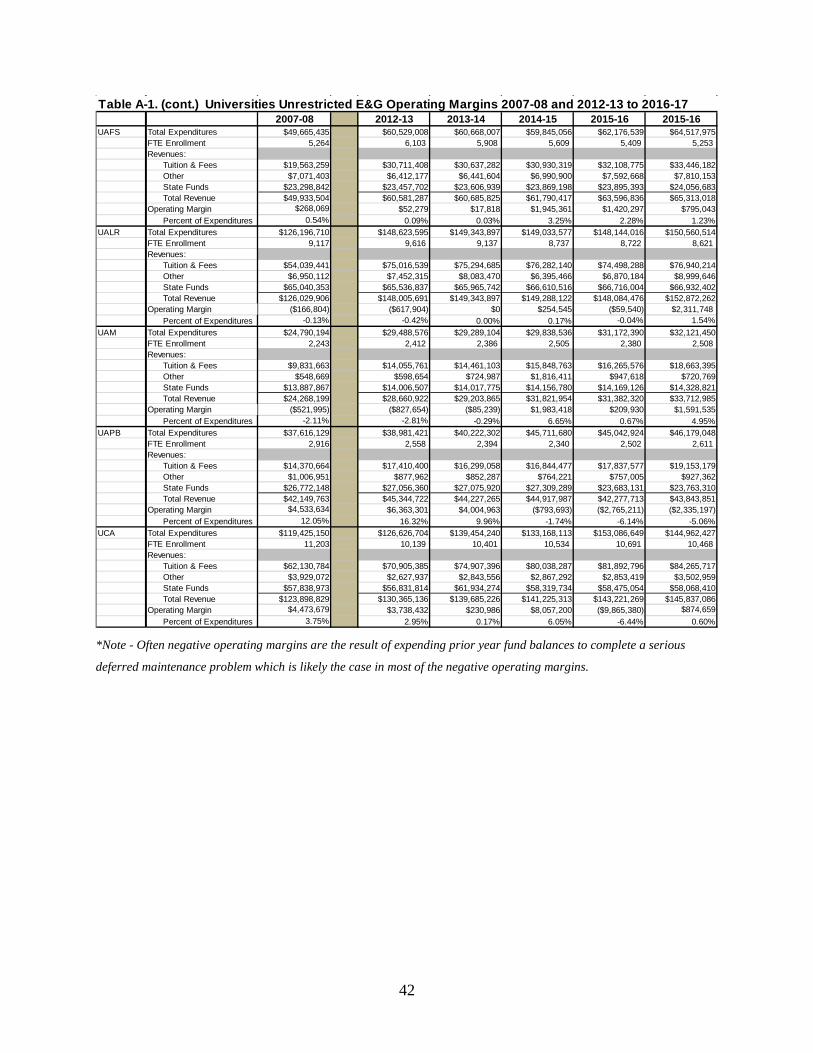
42
*Note - Often negative operating margins are the result of expending prior year fund balances to complete a serious
deferred maintenance problem which is likely the case in most of the negative operating margins.
Table A-1. (cont.) Universities Unrestricted E&G Operating Margins 2007-08 and 2012-13 to 2016-172007-08 2012-13 2013-14 2014-15 2015-16 2015-16
UAFS Total Expenditures $49,665,435 $60,529,008 $60,668,007 $59,845,056 $62,176,539 $64,517,975FTE Enrollment 5,264 6,103 5,908 5,609 5,409 5,253 Revenues:
Tuition & Fees $19,563,259 $30,711,408 $30,637,282 $30,930,319 $32,108,775 $33,446,182Other $7,071,403 $6,412,177 $6,441,604 $6,990,900 $7,592,668 $7,810,153State Funds $23,298,842 $23,457,702 $23,606,939 $23,869,198 $23,895,393 $24,056,683Total Revenue $49,933,504 $60,581,287 $60,685,825 $61,790,417 $63,596,836 $65,313,018
Operating Margin $268,069 $52,279 $17,818 $1,945,361 $1,420,297 $795,043Percent of Expenditures 0.54% 0.09% 0.03% 3.25% 2.28% 1.23%
UALR Total Expenditures $126,196,710 $148,623,595 $149,343,897 $149,033,577 $148,144,016 $150,560,514FTE Enrollment 9,117 9,616 9,137 8,737 8,722 8,621 Revenues:
Tuition & Fees $54,039,441 $75,016,539 $75,294,685 $76,282,140 $74,498,288 $76,940,214Other $6,950,112 $7,452,315 $8,083,470 $6,395,466 $6,870,184 $8,999,646State Funds $65,040,353 $65,536,837 $65,965,742 $66,610,516 $66,716,004 $66,932,402Total Revenue $126,029,906 $148,005,691 $149,343,897 $149,288,122 $148,084,476 $152,872,262
Operating Margin ($166,804) ($617,904) $0 $254,545 ($59,540) $2,311,748Percent of Expenditures -0.13% -0.42% 0.00% 0.17% -0.04% 1.54%
UAM Total Expenditures $24,790,194 $29,488,576 $29,289,104 $29,838,536 $31,172,390 $32,121,450FTE Enrollment 2,243 2,412 2,386 2,505 2,380 2,508 Revenues:
Tuition & Fees $9,831,663 $14,055,761 $14,461,103 $15,848,763 $16,265,576 $18,663,395Other $548,669 $598,654 $724,987 $1,816,411 $947,618 $720,769State Funds $13,887,867 $14,006,507 $14,017,775 $14,156,780 $14,169,126 $14,328,821Total Revenue $24,268,199 $28,660,922 $29,203,865 $31,821,954 $31,382,320 $33,712,985
Operating Margin ($521,995) ($827,654) ($85,239) $1,983,418 $209,930 $1,591,535Percent of Expenditures -2.11% -2.81% -0.29% 6.65% 0.67% 4.95%
UAPB Total Expenditures $37,616,129 $38,981,421 $40,222,302 $45,711,680 $45,042,924 $46,179,048FTE Enrollment 2,916 2,558 2,394 2,340 2,502 2,611 Revenues:
Tuition & Fees $14,370,664 $17,410,400 $16,299,058 $16,844,477 $17,837,577 $19,153,179Other $1,006,951 $877,962 $852,287 $764,221 $757,005 $927,362State Funds $26,772,148 $27,056,360 $27,075,920 $27,309,289 $23,683,131 $23,763,310Total Revenue $42,149,763 $45,344,722 $44,227,265 $44,917,987 $42,277,713 $43,843,851
Operating Margin $4,533,634 $6,363,301 $4,004,963 ($793,693) ($2,765,211) ($2,335,197)Percent of Expenditures 12.05% 16.32% 9.96% -1.74% -6.14% -5.06%
UCA Total Expenditures $119,425,150 $126,626,704 $139,454,240 $133,168,113 $153,086,649 $144,962,427FTE Enrollment 11,203 10,139 10,401 10,534 10,691 10,468 Revenues:
Tuition & Fees $62,130,784 $70,905,385 $74,907,396 $80,038,287 $81,892,796 $84,265,717Other $3,929,072 $2,627,937 $2,843,556 $2,867,292 $2,853,419 $3,502,959State Funds $57,838,973 $56,831,814 $61,934,274 $58,319,734 $58,475,054 $58,068,410Total Revenue $123,898,829 $130,365,136 $139,685,226 $141,225,313 $143,221,269 $145,837,086
Operating Margin $4,473,679 $3,738,432 $230,986 $8,057,200 ($9,865,380) $874,659 Percent of Expenditures 3.75% 2.95% 0.17% 6.05% -6.44% 0.60%

43
Table A-2. Two-Year College Operating Margins 2007-08 and 2012-13 to 2016-172007-08 2012-13 2013-14 2014-15 2015-16 2016-2017
ANC Total Expenditures $15,669,624 $15,240,674 $13,375,589 $12,509,808 $13,290,446 $13,806,050 FTE Enrollment 1,149 928 915 917 949
Revenues:Tuition & Fees $2,323,058 $2,703,220 $2,320,751 $2,300,672 $2,543,129 $2,692,338 Other $1,486,811 $825,215 $965,970 $530,603 $743,300 $902,702 State Funds $11,278,859 $10,185,137 $10,137,481 $10,200,353 $10,216,031 $10,247,170 Total Revenue $15,088,728 $13,713,572 $13,424,202 $13,031,628 $13,502,460 $13,842,210
Operating Margin ($580,896) ($1,527,102) $48,613 $521,820 $212,014 $36,160 Percent of Expenditures -3.71% -10.02% 0.36% 4.17% 1.60% 0.26%
ASUB Total Expenditures $24,777,338 $27,081,516 $26,389,424 $25,655,110 $26,668,240 $24,842,863 FTE Enrollment 3,387 3,119 3,029 2,899 2,860
Revenues:Tuition & Fees $8,537,213 $10,616,228 $10,223,764 $10,320,436 $10,298,303 $10,411,011 Other $2,375,935 $2,318,295 $2,266,540 $2,277,455 $2,021,982 $2,069,210 State Funds $13,889,307 $14,268,131 $14,071,729 $14,098,177 $14,122,727 $14,185,008 Total Revenue $24,802,455 $27,202,654 $26,562,033 $26,696,068 $26,443,012 $26,665,229
Operating Margin $25,117 $121,138 $172,609 $1,040,958 ($225,228) $1,822,366 Percent of Expenditures 0.10% 0.45% 0.65% 4.06% -0.84% 7.34%
ASUMH Total Expenditures $7,986,100 $10,282,608 $10,501,864 $10,408,921 $10,565,591 $10,330,667 FTE Enrollment 1,176 1,162 1,090 1,086 1,007
Revenues:Tuition & Fees $2,257,818 $4,212,013 $4,372,239 $4,260,792 $4,413,118 $4,292,653 Other $1,335,387 $1,530,618 $1,567,011 $1,525,314 $1,620,938 $1,599,549 State Funds $4,455,397 $4,658,624 $4,722,039 $4,713,921 $4,722,039 $4,722,039 Total Revenue $8,048,602 $10,401,255 $10,661,289 $10,500,027 $10,756,095 $10,614,241
Operating Margin $62,502 $118,647 $159,425 $91,106 $190,504 $283,575 Percent of Expenditures 0.78% 1.15% 1.52% 0.88% 1.80% 2.74%
ASUMS Total Expenditures $9,898,666 $13,341,909 $19,754,195 $13,631,127 $12,675,161 $12,993,824 FTE Enrollment 1,217 1,164 1,070 1,069 999
Revenues:Tuition & Fees $2,241,353 $4,952,909 $13,755,765 $5,000,464 $4,275,451 $3,888,782 Other $334,053 $1,742,888 $1,017,507 $1,282,730 $1,945,429 $1,364,850 State Funds $5,997,669 $6,448,841 $7,128,651 $7,554,867 $7,576,777 $7,578,471 Total Revenue $8,573,075 $13,144,639 $21,901,923 $13,838,061 $13,797,657 $12,832,103
Operating Margin ($1,325,591) ($197,270) $2,147,728 $206,934 $1,122,496 ($161,721)Percent of Expenditures -13.39% -1.48% 10.87% 1.52% 8.86% -1.24%
ASUN Total Expenditures $7,386,857 $12,777,005 $15,271,382 $14,449,610 $17,500,408 $15,038,337 FTE Enrollment 1,546 1,568 1,717 1,838 1,906
Revenues:Tuition & Fees $2,763,956 $4,925,264 $5,146,875 $6,175,804 $7,054,757 $7,419,734 Other $999,263 $1,081,481 $7,409,921 $1,088,413 $1,207,028 $1,149,292 State Funds $4,244,026 $7,414,175 $7,409,921 $7,395,954 $7,409,921 $7,409,921 Total Revenue $8,007,245 $13,420,920 $19,966,717 $14,660,171 $15,671,706 $15,978,947
Operating Margin $620,388 $643,915 $4,695,335 $210,561 ($1,828,702) $940,610 Percent of Expenditures 8.40% 5.04% 30.75% 1.46% -10.45% 6.25%
BRTC Total Expenditures $11,856,969 $13,658,354 $16,154,015 $14,644,357 $14,104,806 $14,387,873 FTE Enrollment 1,930 1,768 1,480 1,270 1,223
Revenues:Tuition & Fees $3,807,737 $6,421,256 $6,076,546 $5,900,337 $5,181,804 $5,103,976 Other $867,154 $1,701,632 $817,349 $137,368 $157,892 $1,073,339 State Funds $7,826,267 $8,301,351 $8,358,725 $8,336,564 $8,358,725 $8,358,725 Total Revenue $12,501,158 $16,424,239 $15,252,620 $14,374,269 $13,698,421 $14,536,040
Operating Margin $644,189 $2,765,885 ($901,395) ($270,088) ($406,385) $148,167 Percent of Expenditures 5.43% 20.25% -5.58% -1.84% -2.88% 1.03%
CCCUA Total Expenditures $7,312,492 $9,015,295 $9,595,788 $8,740,973 $9,570,044 $9,946,211 FTE Enrollment 1,011 1,027 961 965 914
Revenues:Tuition & Fees $1,894,234 $2,915,387 $3,265,170 $3,278,508 $3,640,662 $3,836,092 Other $1,431,759 $1,266,678 $1,283,677 $1,328,644 $1,403,000 $1,472,797 State Funds $4,432,711 $4,706,016 $4,746,139 $4,732,835 $4,746,139 $4,747,973 Total Revenue $7,758,704 $8,888,081 $9,294,986 $9,339,987 $9,789,801 $10,056,862
Operating Margin $446,212 ($127,214) ($300,802) $599,014 $219,757 $110,651 Percent of Expenditures 6.10% -1.41% -3.13% 6.85% 2.30% 1.11%
COTO Total Expenditures $6,295,352 $7,565,580 $7,534,639 $7,498,204 $7,816,115 $8,054,089 FTE Enrollment 923 958 917 805 802
Revenues:Tuition & Fees $2,316,165 $2,364,539 $2,883,039 $3,145,923 $3,120,200 $3,210,350 Other $198,110 $57,066 $410,793 $115,090 $282,864 $328,302 State Funds $4,579,855 $4,683,973 $4,683,647 $4,672,254 $4,683,647 $4,683,647 Total Revenue $7,094,130 $7,105,578 $7,977,479 $7,933,267 $8,086,711 $8,222,299
Operating Margin $798,778 ($460,002) $442,840 $435,063 $270,596 $168,210 Percent of Expenditures 12.69% -6.08% 5.88% 5.80% 3.46% 2.09%
EACC Total Expenditures $8,115,964 $9,667,572 $9,350,908 $9,074,397 $9,036,488 $8,838,254 FTE Enrollment 962 864 795 751 675
Revenues:Tuition & Fees $2,430,986 $2,952,355 $2,760,293 $2,576,262 $2,717,009 $2,545,344 Other $335,493 $248,656 $53,414 $193,350 $205,776 $185,708 State Funds $6,553,009 $6,740,849 $6,538,536 $6,556,511 $6,565,224 $6,597,817 Total Revenue $9,319,488 $9,941,860 $9,352,243 $9,326,123 $9,488,009 $9,328,869
Operating Margin $1,203,524 $274,288 $1,335 $251,726 $451,521 $490,615 Percent of Expenditures 14.83% 2.84% 0.01% 2.77% 5.00% 5.55%
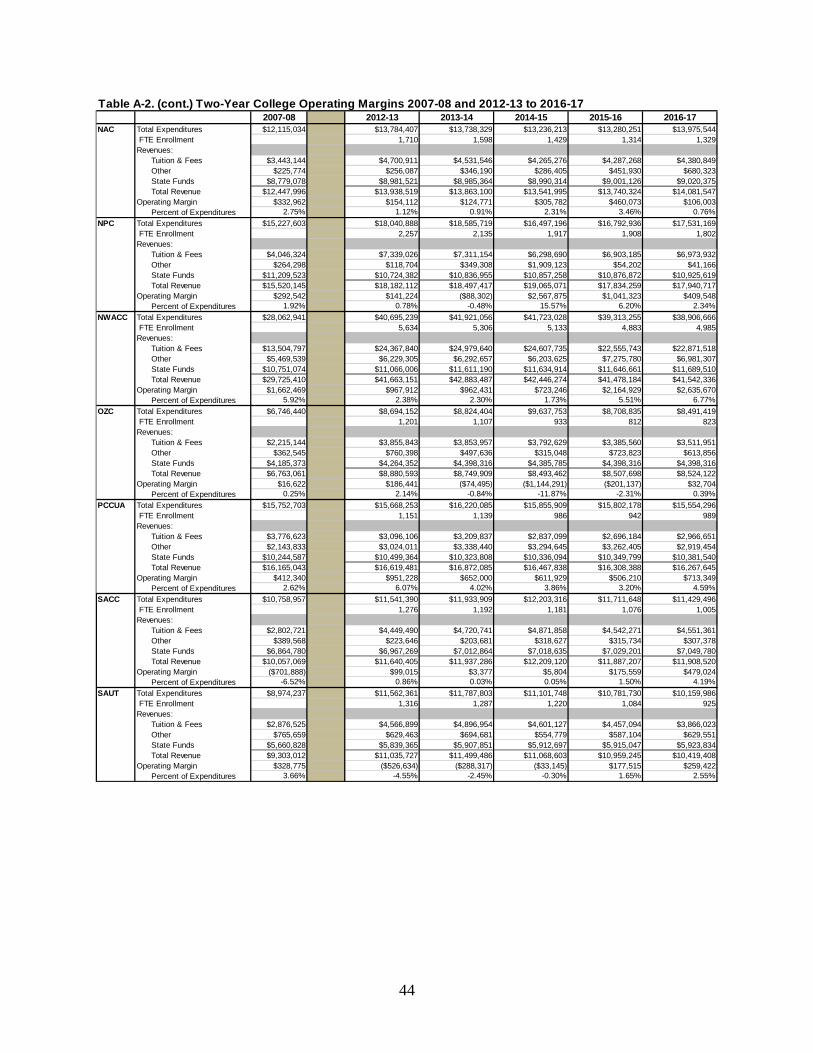
44
Table A-2. (cont.) Two-Year College Operating Margins 2007-08 and 2012-13 to 2016-172007-08 2012-13 2013-14 2014-15 2015-16 2016-17
NAC Total Expenditures $12,115,034 $13,784,407 $13,738,329 $13,236,213 $13,280,251 $13,975,544 FTE Enrollment 1,710 1,598 1,429 1,314 1,329
Revenues:Tuition & Fees $3,443,144 $4,700,911 $4,531,546 $4,265,276 $4,287,268 $4,380,849 Other $225,774 $256,087 $346,190 $286,405 $451,930 $680,323 State Funds $8,779,078 $8,981,521 $8,985,364 $8,990,314 $9,001,126 $9,020,375 Total Revenue $12,447,996 $13,938,519 $13,863,100 $13,541,995 $13,740,324 $14,081,547
Operating Margin $332,962 $154,112 $124,771 $305,782 $460,073 $106,003 Percent of Expenditures 2.75% 1.12% 0.91% 2.31% 3.46% 0.76%
NPC Total Expenditures $15,227,603 $18,040,888 $18,585,719 $16,497,196 $16,792,936 $17,531,169 FTE Enrollment 2,257 2,135 1,917 1,908 1,802
Revenues:Tuition & Fees $4,046,324 $7,339,026 $7,311,154 $6,298,690 $6,903,185 $6,973,932 Other $264,298 $118,704 $349,308 $1,909,123 $54,202 $41,166 State Funds $11,209,523 $10,724,382 $10,836,955 $10,857,258 $10,876,872 $10,925,619 Total Revenue $15,520,145 $18,182,112 $18,497,417 $19,065,071 $17,834,259 $17,940,717
Operating Margin $292,542 $141,224 ($88,302) $2,567,875 $1,041,323 $409,548 Percent of Expenditures 1.92% 0.78% -0.48% 15.57% 6.20% 2.34%
NWACC Total Expenditures $28,062,941 $40,695,239 $41,921,056 $41,723,028 $39,313,255 $38,906,666FTE Enrollment 5,634 5,306 5,133 4,883 4,985
Revenues:Tuition & Fees $13,504,797 $24,367,840 $24,979,640 $24,607,735 $22,555,743 $22,871,518 Other $5,469,539 $6,229,305 $6,292,657 $6,203,625 $7,275,780 $6,981,307 State Funds $10,751,074 $11,066,006 $11,611,190 $11,634,914 $11,646,661 $11,689,510Total Revenue $29,725,410 $41,663,151 $42,883,487 $42,446,274 $41,478,184 $41,542,336
Operating Margin $1,662,469 $967,912 $962,431 $723,246 $2,164,929 $2,635,670 Percent of Expenditures 5.92% 2.38% 2.30% 1.73% 5.51% 6.77%
OZC Total Expenditures $6,746,440 $8,694,152 $8,824,404 $9,637,753 $8,708,835 $8,491,419 FTE Enrollment 1,201 1,107 933 812 823
Revenues:Tuition & Fees $2,215,144 $3,855,843 $3,853,957 $3,792,629 $3,385,560 $3,511,951 Other $362,545 $760,398 $497,636 $315,048 $723,823 $613,856 State Funds $4,185,373 $4,264,352 $4,398,316 $4,385,785 $4,398,316 $4,398,316 Total Revenue $6,763,061 $8,880,593 $8,749,909 $8,493,462 $8,507,698 $8,524,122
Operating Margin $16,622 $186,441 ($74,495) ($1,144,291) ($201,137) $32,704 Percent of Expenditures 0.25% 2.14% -0.84% -11.87% -2.31% 0.39%
PCCUA Total Expenditures $15,752,703 $15,668,253 $16,220,085 $15,855,909 $15,802,178 $15,554,296 FTE Enrollment 1,151 1,139 986 942 989
Revenues:Tuition & Fees $3,776,623 $3,096,106 $3,209,837 $2,837,099 $2,696,184 $2,966,651 Other $2,143,833 $3,024,011 $3,338,440 $3,294,645 $3,262,405 $2,919,454 State Funds $10,244,587 $10,499,364 $10,323,808 $10,336,094 $10,349,799 $10,381,540 Total Revenue $16,165,043 $16,619,481 $16,872,085 $16,467,838 $16,308,388 $16,267,645
Operating Margin $412,340 $951,228 $652,000 $611,929 $506,210 $713,349 Percent of Expenditures 2.62% 6.07% 4.02% 3.86% 3.20% 4.59%
SACC Total Expenditures $10,758,957 $11,541,390 $11,933,909 $12,203,316 $11,711,648 $11,429,496 FTE Enrollment 1,276 1,192 1,181 1,076 1,005
Revenues:Tuition & Fees $2,802,721 $4,449,490 $4,720,741 $4,871,858 $4,542,271 $4,551,361 Other $389,568 $223,646 $203,681 $318,627 $315,734 $307,378 State Funds $6,864,780 $6,967,269 $7,012,864 $7,018,635 $7,029,201 $7,049,780 Total Revenue $10,057,069 $11,640,405 $11,937,286 $12,209,120 $11,887,207 $11,908,520
Operating Margin ($701,888) $99,015 $3,377 $5,804 $175,559 $479,024 Percent of Expenditures -6.52% 0.86% 0.03% 0.05% 1.50% 4.19%
SAUT Total Expenditures $8,974,237 $11,562,361 $11,787,803 $11,101,748 $10,781,730 $10,159,986 FTE Enrollment 1,316 1,287 1,220 1,084 925
Revenues:Tuition & Fees $2,876,525 $4,566,899 $4,896,954 $4,601,127 $4,457,094 $3,866,023 Other $765,659 $629,463 $694,681 $554,779 $587,104 $629,551 State Funds $5,660,828 $5,839,365 $5,907,851 $5,912,697 $5,915,047 $5,923,834 Total Revenue $9,303,012 $11,035,727 $11,499,486 $11,068,603 $10,959,245 $10,419,408
Operating Margin $328,775 ($526,634) ($288,317) ($33,145) $177,515 $259,422 Percent of Expenditures 3.66% -4.55% -2.45% -0.30% 1.65% 2.55%

45
*Note - Often negative operating margins are the result of expending prior year fund balances to complete a serious
deferred maintenance problem which is likely the case in most of the negative operating margins.
Table A-2. (cont.) Two-Year College Operating Margins 2007-08 and 2012-13 to 2016-172007-08 2012-13 2013-14 2014-15 2015-16 2016-17
SEAC Total Expenditures $11,366,968 $11,315,785 $13,338,396 $10,966,682 $11,513,495 $11,137,253 FTE Enrollment 1,258 1,178 1,049 1,029 952
Revenues:Tuition & Fees $3,011,464 $4,012,649 $3,852,944 $3,543,554 $3,610,512 $3,438,456 Other $121,153 $185,842 $268,012 $218,850 $296,722 $149,800 State Funds $7,225,061 $7,617,924 $7,611,997 $7,592,536 $7,611,997 $7,611,997 Total Revenue $10,357,678 $11,816,415 $11,732,953 $11,354,940 $11,519,231 $11,200,253
Operating Margin ($1,009,290) $500,630 ($1,605,443) $388,258 $5,736 $63,000 Percent of Expenditures -8.88% 4.42% -12.04% 3.54% 0.05% 0.57%
UACCB Total Expenditures $7,667,125 $9,324,507 $9,499,728 $9,842,814 $9,303,392 $9,342,443 FTE Enrollment 1,051 969 944 963 891
Revenues:Tuition & Fees $2,606,272 3,313,275 3,168,356 3,320,029 3,320,452 3,193,719 Other $1,344,699 $1,334,993 $1,507,558 $1,376,391 $1,518,241 $1,572,870 State Funds $4,813,625 $4,920,469 $4,997,821 $4,989,281 $4,997,821 $4,997,821 Total Revenue $8,764,596 $9,568,737 $9,673,735 $9,685,701 $9,836,514 $9,764,410
Operating Margin $1,097,471 $244,230 $174,007 ($157,113) $533,122 $421,967 Percent of Expenditures 14.31% 2.62% 1.83% -1.60% 5.73% 4.52%
UACCH Total Expenditures $8,674,450 $9,678,359 $10,532,573 $10,405,991 $10,299,611 $10,577,520 FTE Enrollment 1,054 990 916 948 1,024
Revenues:Tuition & Fees $1,909,987 $2,571,362 $2,471,235 $2,456,601 $2,658,467 $3,050,172 Other $546,296 $731,387 $1,592,684 $1,393,804 $1,223,131 $916,404 State Funds $6,199,311 $6,456,823 $6,450,944 $6,431,644 $6,450,944 $6,450,944 Total Revenue $8,655,594 $9,759,572 $10,514,863 $10,282,049 $10,332,542 $10,417,520
Operating Margin ($18,856) $81,213 ($17,710) ($123,942) $32,931 ($160,000)Percent of Expenditures -0.22% 0.84% -0.17% -1.19% 0.32% -1.51%
UACCM Total Expenditures $10,080,625 $13,323,891 $13,653,094 $12,835,782 $14,564,110 $12,865,515 FTE Enrollment 1,695 1,668 1,531 1,545 1,552
Revenues:Tuition & Fees $3,791,736 $5,871,745 $6,204,034 $5,969,541 $6,247,346 $6,630,234 Other $1,056,712 $890,839 $1,168,499 $1,042,200 $1,133,289 $880,995 State Funds $5,700,883 $6,082,071 $6,313,341 $6,300,620 $6,313,341 $6,313,341 Total Revenue $10,549,331 $12,844,655 $13,685,875 $13,312,361 $13,693,976 $13,824,570
Operating Margin $1,097,471 ($479,236) $32,781 $476,579 ($870,134) $959,055 Percent of Expenditures 14.31% -3.60% 0.24% 3.71% -5.97% 7.45%
UACCRM Total Expenditures $6,115,757 $5,307,394 $5,599,907 $5,737,113 $5,598,973 $5,540,838 FTE Enrollment 636 602 565 551 521
Revenues:Tuition & Fees $1,170,731 $1,904,418 $2,131,112 $2,113,976 $2,132,131 $2,118,220 Other $349,617 $81,786 $152,996 $113,204 $100,515 $108,202 State Funds $3,403,996 $3,397,250 $3,404,968 $3,409,713 $3,412,013 $3,420,616 Total Revenue $4,924,344 $5,383,454 $5,689,076 $5,636,893 $5,644,659 $5,647,038
Operating Margin ($1,191,413) $76,060 $89,169 ($100,220) $45,686 $106,200 Percent of Expenditures -19.48% 1.43% 1.59% -1.75% 0.82% 1.92%
UAPTC Total Expenditures $31,931,849 $47,582,449 $48,010,015 $42,068,396 $41,497,477 $42,856,615 FTE Enrollment 8,400 7,304 6,292 5,150 4,340
Revenues:Tuition & Fees $17,377,259 $29,787,525 $28,982,515 $28,310,660 $25,985,310 $25,066,842 Other $597,418 $1,507,953 $1,439,803 $1,410,997 $749,578 $740,887 State Funds $16,622,008 $16,737,684 $17,411,209 $17,388,807 $17,411,209 $17,411,209 Total Revenue $34,596,685 $48,033,162 $47,833,527 $47,110,464 $44,146,097 $43,218,938
Operating Margin $2,664,836 $450,713 ($176,488) $5,042,068 $2,648,620 $362,323 Percent of Expenditures 8.35% 0.95% -0.37% 11.99% 6.38% 0.85%
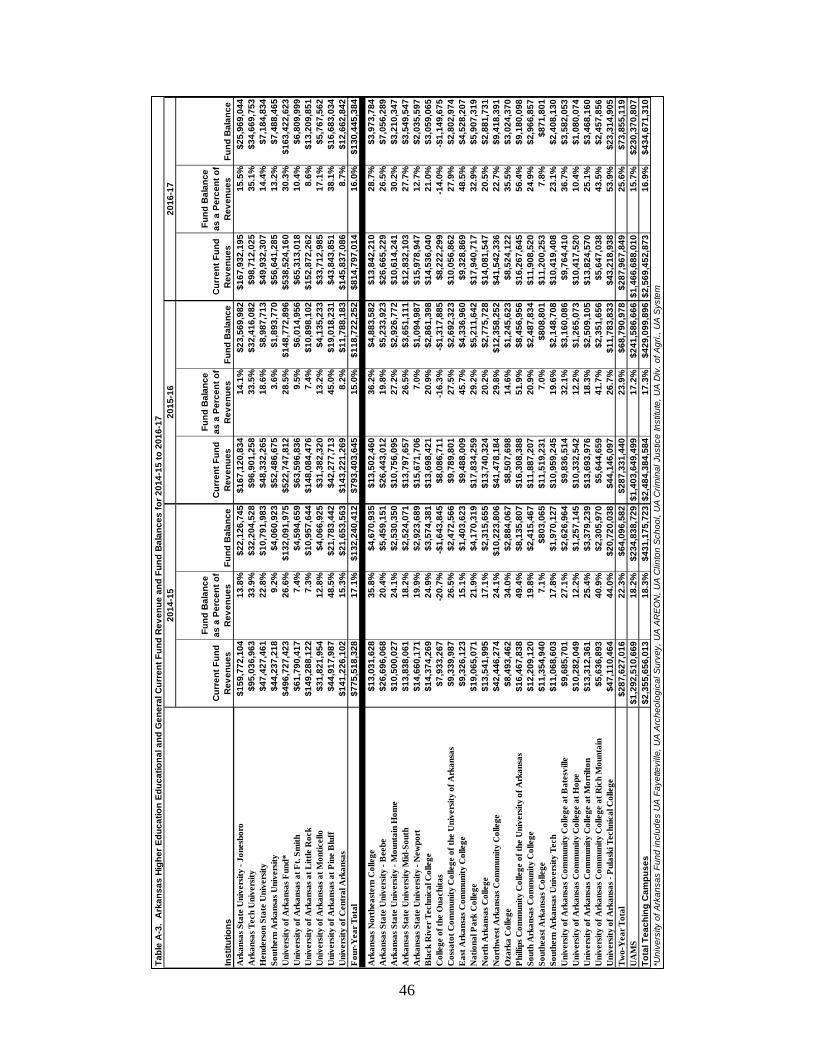
46
Tabl
e A-
3. A
rkan
sas
High
er E
duca
tion
Educ
atio
nal a
nd G
ener
al C
urre
nt F
und
Reve
nue
and
Fund
Bal
ance
s fo
r 201
4-15
to 2
016-
17
Inst
itutio
nsCu
rren
t Fun
d Re
venu
es
Fund
Bal
ance
as
a P
erce
nt o
f Re
venu
esFu
nd B
alan
ceCu
rren
t Fun
d Re
venu
es
Fund
Bal
ance
as
a P
erce
nt o
f Re
venu
esFu
nd B
alan
ceCu
rren
t Fun
d Re
venu
es
Fund
Bal
ance
as
a P
erce
nt o
f Re
venu
esFu
nd B
alan
ceA
rkan
sas S
tate
Uni
vers
ity -
Jone
sbor
o$1
59,7
72,1
0413
.8%
$22,
126,
745
$167
,120
,834
14.1
%$2
3,56
9,98
2$1
67,9
32,1
9515
.5%
$25,
969,
044
Ark
ansa
s Tec
h U
nive
rsity
$95,
036,
963
33.9
%$3
2,20
4,52
8$9
6,90
1,25
833
.5%
$32,
416,
082
$98,
712,
025
35.1
%$3
4,66
9,75
3H
ende
rson
Sta
te U
nive
rsity
$47,
427,
461
22.8
%$1
0,79
1,98
3$4
8,33
2,26
518
.6%
$8,9
87,7
13$4
9,93
2,30
714
.4%
$7,1
84,8
34So
uthe
rn A
rkan
sas U
nive
rsity
$44,
237,
218
9.2%
$4,0
60,9
23$5
2,48
6,67
53.
6%$1
,893
,770
$56,
641,
285
13.2
%$7
,488
,465
Uni
vers
ity o
f Ark
ansa
s Fun
d*$4
96,7
27,4
2326
.6%
$132
,091
,975
$522
,747
,812
28.5
%$1
48,7
72,8
96$5
38,5
24,1
6030
.3%
$163
,422
,623
Uni
vers
ity o
f Ark
ansa
s at F
t. Sm
ith$6
1,79
0,41
77.
4%$4
,594
,659
$63,
596,
836
9.5%
$6,0
14,9
56$6
5,31
3,01
810
.4%
$6,8
09,9
99U
nive
rsity
of A
rkan
sas a
t Litt
le R
ock
$149
,288
,122
7.3%
$10,
957,
644
$148
,084
,476
7.4%
$10,
898,
102
$152
,872
,262
8.6%
$13,
209,
851
Uni
vers
ity o
f Ark
ansa
s at M
ontic
ello
$31,
821,
954
12.8
%$4
,066
,925
$31,
382,
320
13.2
%$4
,135
,233
$33,
712,
985
17.1
%$5
,767
,562
Uni
vers
ity o
f Ark
ansa
s at P
ine
Blu
ff$4
4,91
7,98
748
.5%
$21,
783,
442
$42,
277,
713
45.0
%$1
9,01
8,23
1$4
3,84
3,85
138
.1%
$16,
683,
034
Uni
vers
ity o
f Cen
tral
Ark
ansa
s$1
41,2
26,1
0215
.3%
$21,
653,
563
$143
,221
,269
8.2%
$11,
788,
183
$145
,837
,086
8.7%
$12,
662,
842
Fou
r-Y
ear T
otal
$775
,518
,328
17.1
%$1
32,2
40,4
12$7
93,4
03,6
4515
.0%
$118
,722
,252
$814
,797
,014
16.0
%$1
30,4
45,3
84
Ark
ansa
s Nor
thea
ster
n C
olle
ge$1
3,03
1,62
835
.8%
$4,6
70,9
35$1
3,50
2,46
036
.2%
$4,8
83,5
82$1
3,84
2,21
028
.7%
$3,9
73,7
84A
rkan
sas S
tate
Uni
vers
ity -
Bee
be$2
6,69
6,06
820
.4%
$5,4
59,1
51$2
6,44
3,01
219
.8%
$5,2
33,9
23$2
6,66
5,22
926
.5%
$7,0
56,2
89A
rkan
sas S
tate
Uni
vers
ity -
Mou
ntai
n H
ome
$10,
500,
027
24.1
%$2
,530
,350
$10,
756,
095
27.2
%$2
,926
,772
$10,
614,
241
30.2
%$3
,210
,347
Ark
ansa
s Sta
te U
nive
rsity
Mid
-Sou
th$1
3,83
8,06
118
.2%
$2,5
24,0
71$1
3,79
7,65
726
.5%
$3,6
51,1
11$1
2,83
2,10
327
.7%
$3,5
49,5
47A
rkan
sas S
tate
Uni
vers
ity -
New
port
$14,
660,
171
19.9
%$2
,923
,689
$15,
671,
706
7.0%
$1,0
94,9
87$1
5,97
8,94
712
.7%
$2,0
35,5
97B
lack
Riv
er T
echn
ical
Col
lege
$14,
374,
269
24.9
%$3
,574
,381
$13,
698,
421
20.9
%$2
,861
,398
$14,
536,
040
21.0
%$3
,059
,065
Col
lege
of t
he O
uach
itas
$7,9
33,2
67-2
0.7%
-$1,
643,
845
$8,0
86,7
11-1
6.3%
-$1,
317,
885
$8,2
22,2
99-1
4.0%
-$1,
149,
675
Cos
sato
t Com
mun
ity C
olle
ge o
f the
Uni
vers
ity o
f Ark
ansa
s$9
,339
,987
26.5
%$2
,472
,566
$9,7
89,8
0127
.5%
$2,6
92,3
23$1
0,05
6,86
227
.9%
$2,8
02,9
74E
ast A
rkan
sas C
omm
unity
Col
lege
$9,3
26,1
2315
.1%
$1,4
03,6
23$9
,488
,009
45.7
%$4
,336
,960
$9,3
28,8
6948
.5%
$4,5
28,2
07N
atio
nal P
ark
Col
lege
$19,
065,
071
21.9
%$4
,170
,319
$17,
834,
259
29.2
%$5
,211
,642
$17,
940,
717
32.9
%$5
,907
,319
Nor
th A
rkan
sas C
olle
ge$1
3,54
1,99
517
.1%
$2,3
15,6
55$1
3,74
0,32
420
.2%
$2,7
75,7
28$1
4,08
1,54
720
.5%
$2,8
81,7
31N
orth
wes
t Ark
ansa
s Com
mun
ity C
olle
ge$4
2,44
6,27
424
.1%
$10,
223,
806
$41,
478,
184
29.8
%$1
2,35
8,25
2$4
1,54
2,33
622
.7%
$9,4
18,3
91O
zark
a C
olle
ge$8
,493
,462
34.0
%$2
,884
,067
$8,5
07,6
9814
.6%
$1,2
45,6
23$8
,524
,122
35.5
%$3
,024
,370
Phi
llips
Com
mun
ity C
olle
ge o
f the
Uni
vers
ity o
f Ark
ansa
s$1
6,46
7,83
849
.4%
$8,1
35,8
07$1
6,30
8,38
851
.9%
$8,4
56,9
56$1
6,26
7,64
556
.4%
$9,1
80,0
98So
uth
Ark
ansa
s Com
mun
ity C
olle
ge$1
2,20
9,12
019
.8%
$2,4
15,4
67$1
1,88
7,20
720
.9%
$2,4
87,8
34$1
1,90
8,52
024
.9%
$2,9
66,8
57So
uthe
ast A
rkan
sas C
olle
ge$1
1,35
4,94
07.
1%$8
03,0
65$1
1,51
9,23
17.
0%$8
08,8
01$1
1,20
0,25
37.
8%$8
71,8
01So
uthe
rn A
rkan
sas U
nive
rsity
Tec
h$1
1,06
8,60
317
.8%
$1,9
70,1
27$1
0,95
9,24
519
.6%
$2,1
48,7
08$1
0,41
9,40
823
.1%
$2,4
08,1
30U
nive
rsity
of A
rkan
sas C
omm
unity
Col
lege
at B
ates
ville
$9,6
85,7
0127
.1%
$2,6
26,9
64$9
,836
,514
32.1
%$3
,160
,086
$9,7
64,4
1036
.7%
$3,5
82,0
53U
nive
rsity
of A
rkan
sas C
omm
unity
Col
lege
at H
ope
$10,
282,
049
12.2
%$1
,257
,145
$10,
332,
542
12.2
%$1
,265
,073
$10,
417,
520
10.4
%$1
,080
,074
Uni
vers
ity o
f Ark
ansa
s Com
mun
ity C
olle
ge a
t Mor
rilto
n$1
3,31
2,36
125
.4%
$3,3
79,2
39$1
3,69
3,97
618
.3%
$2,5
09,1
05$1
3,82
4,57
025
.1%
$3,4
68,1
60U
nive
rsity
of A
rkan
sas C
omm
unity
Col
lege
at R
ich
Mou
ntai
n$5
,636
,893
40.9
%$2
,305
,970
$5,6
44,6
5941
.7%
$2,3
51,6
56$5
,647
,038
43.5
%$2
,457
,856
Uni
vers
ity o
f Ark
ansa
s - P
ulas
ki T
echn
ical
Col
lege
$47,
110,
464
44.0
%$2
0,72
0,03
8$4
4,14
6,09
726
.7%
$11,
783,
833
$43,
218,
938
53.9
%$2
3,31
4,90
5Tw
o-Y
ear T
otal
$287
,627
,016
22.3
%$6
4,09
6,58
2$2
87,3
31,4
4023
.9%
$68,
790,
978
$287
,967
,849
25.6
%$7
3,85
5,11
9U
AM
S$1
,292
,510
,669
18.2
%$2
34,8
38,7
29$1
,403
,649
,499
17.2
%$2
41,5
86,6
66$1
,466
,688
,010
15.7
%$2
30,3
70,8
07To
tal T
each
ing
Cam
puse
s$2
,355
,656
,013
18.3
%$4
31,1
75,7
23$2
,484
,384
,584
17.3
%$4
29,0
99,8
96$2
,569
,452
,873
16.9
%$4
34,6
71,3
10*U
nive
rsity
of A
rkan
sas
Fund
incl
udes
UA
Fay
ette
ville
, UA
Arc
heol
ogic
al S
urve
y, U
A A
RE
ON
, UA
Clin
ton
Sch
ool,
UA
Crim
inal
Jus
tice
Inst
itute
, UA
Div
. of A
gri.,
UA
Sys
tem
2016
-17
2015
-16
2014
-15

47
Appendix B:
Net Tuition and Fee Income
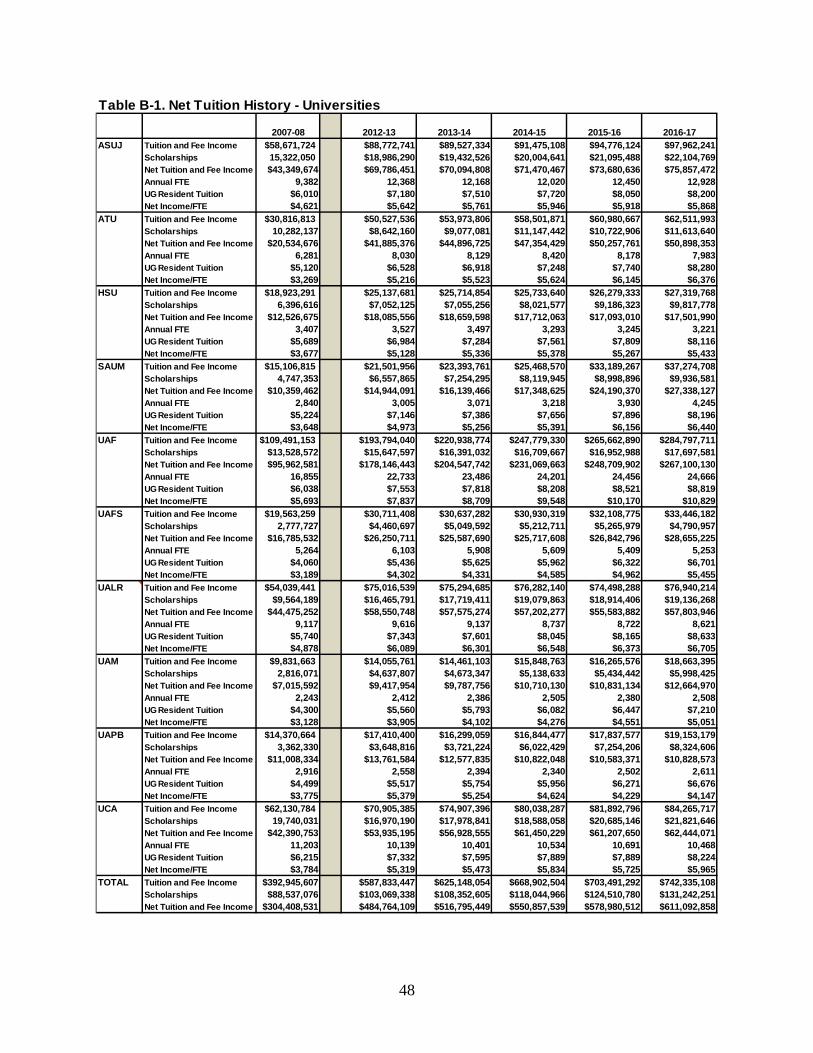
48
Table B-1. Net Tuition History - Universities
2007-08 2012-13 2013-14 2014-15 2015-16 2016-17ASUJ Tuition and Fee Income $58,671,724 $88,772,741 $89,527,334 $91,475,108 $94,776,124 $97,962,241
Scholarships 15,322,050 $18,986,290 $19,432,526 $20,004,641 $21,095,488 $22,104,769Net Tuition and Fee Income $43,349,674 $69,786,451 $70,094,808 $71,470,467 $73,680,636 $75,857,472Annual FTE 9,382 12,368 12,168 12,020 12,450 12,928UG Resident Tuition $6,010 $7,180 $7,510 $7,720 $8,050 $8,200Net Income/FTE $4,621 $5,642 $5,761 $5,946 $5,918 $5,868
ATU Tuition and Fee Income $30,816,813 $50,527,536 $53,973,806 $58,501,871 $60,980,667 $62,511,993Scholarships 10,282,137 $8,642,160 $9,077,081 $11,147,442 $10,722,906 $11,613,640Net Tuition and Fee Income $20,534,676 $41,885,376 $44,896,725 $47,354,429 $50,257,761 $50,898,353Annual FTE 6,281 8,030 8,129 8,420 8,178 7,983UG Resident Tuition $5,120 $6,528 $6,918 $7,248 $7,740 $8,280Net Income/FTE $3,269 $5,216 $5,523 $5,624 $6,145 $6,376
HSU Tuition and Fee Income $18,923,291 $25,137,681 $25,714,854 $25,733,640 $26,279,333 $27,319,768Scholarships 6,396,616 $7,052,125 $7,055,256 $8,021,577 $9,186,323 $9,817,778Net Tuition and Fee Income $12,526,675 $18,085,556 $18,659,598 $17,712,063 $17,093,010 $17,501,990Annual FTE 3,407 3,527 3,497 3,293 3,245 3,221UG Resident Tuition $5,689 $6,984 $7,284 $7,561 $7,809 $8,116Net Income/FTE $3,677 $5,128 $5,336 $5,378 $5,267 $5,433
SAUM Tuition and Fee Income $15,106,815 $21,501,956 $23,393,761 $25,468,570 $33,189,267 $37,274,708Scholarships 4,747,353 $6,557,865 $7,254,295 $8,119,945 $8,998,896 $9,936,581Net Tuition and Fee Income $10,359,462 $14,944,091 $16,139,466 $17,348,625 $24,190,370 $27,338,127Annual FTE 2,840 3,005 3,071 3,218 3,930 4,245UG Resident Tuition $5,224 $7,146 $7,386 $7,656 $7,896 $8,196Net Income/FTE $3,648 $4,973 $5,256 $5,391 $6,156 $6,440
UAF Tuition and Fee Income $109,491,153 $193,794,040 $220,938,774 $247,779,330 $265,662,890 $284,797,711Scholarships $13,528,572 $15,647,597 $16,391,032 $16,709,667 $16,952,988 $17,697,581Net Tuition and Fee Income $95,962,581 $178,146,443 $204,547,742 $231,069,663 $248,709,902 $267,100,130Annual FTE 16,855 22,733 23,486 24,201 24,456 24,666UG Resident Tuition $6,038 $7,553 $7,818 $8,208 $8,521 $8,819Net Income/FTE $5,693 $7,837 $8,709 $9,548 $10,170 $10,829
UAFS Tuition and Fee Income $19,563,259 $30,711,408 $30,637,282 $30,930,319 $32,108,775 $33,446,182Scholarships 2,777,727 $4,460,697 $5,049,592 $5,212,711 $5,265,979 $4,790,957Net Tuition and Fee Income $16,785,532 $26,250,711 $25,587,690 $25,717,608 $26,842,796 $28,655,225Annual FTE 5,264 6,103 5,908 5,609 5,409 5,253UG Resident Tuition $4,060 $5,436 $5,625 $5,962 $6,322 $6,701Net Income/FTE $3,189 $4,302 $4,331 $4,585 $4,962 $5,455
UALR Tuition and Fee Income $54,039,441 $75,016,539 $75,294,685 $76,282,140 $74,498,288 $76,940,214Scholarships $9,564,189 $16,465,791 $17,719,411 $19,079,863 $18,914,406 $19,136,268Net Tuition and Fee Income $44,475,252 $58,550,748 $57,575,274 $57,202,277 $55,583,882 $57,803,946Annual FTE 9,117 9,616 9,137 8,737 8,722 8,621UG Resident Tuition $5,740 $7,343 $7,601 $8,045 $8,165 $8,633Net Income/FTE $4,878 $6,089 $6,301 $6,548 $6,373 $6,705
UAM Tuition and Fee Income $9,831,663 $14,055,761 $14,461,103 $15,848,763 $16,265,576 $18,663,395Scholarships 2,816,071 $4,637,807 $4,673,347 $5,138,633 $5,434,442 $5,998,425Net Tuition and Fee Income $7,015,592 $9,417,954 $9,787,756 $10,710,130 $10,831,134 $12,664,970Annual FTE 2,243 2,412 2,386 2,505 2,380 2,508UG Resident Tuition $4,300 $5,560 $5,793 $6,082 $6,447 $7,210Net Income/FTE $3,128 $3,905 $4,102 $4,276 $4,551 $5,051
UAPB Tuition and Fee Income $14,370,664 $17,410,400 $16,299,059 $16,844,477 $17,837,577 $19,153,179Scholarships 3,362,330 $3,648,816 $3,721,224 $6,022,429 $7,254,206 $8,324,606Net Tuition and Fee Income $11,008,334 $13,761,584 $12,577,835 $10,822,048 $10,583,371 $10,828,573Annual FTE 2,916 2,558 2,394 2,340 2,502 2,611UG Resident Tuition $4,499 $5,517 $5,754 $5,956 $6,271 $6,676Net Income/FTE $3,775 $5,379 $5,254 $4,624 $4,229 $4,147
UCA Tuition and Fee Income $62,130,784 $70,905,385 $74,907,396 $80,038,287 $81,892,796 $84,265,717Scholarships 19,740,031 $16,970,190 $17,978,841 $18,588,058 $20,685,146 $21,821,646Net Tuition and Fee Income $42,390,753 $53,935,195 $56,928,555 $61,450,229 $61,207,650 $62,444,071Annual FTE 11,203 10,139 10,401 10,534 10,691 10,468UG Resident Tuition $6,215 $7,332 $7,595 $7,889 $7,889 $8,224Net Income/FTE $3,784 $5,319 $5,473 $5,834 $5,725 $5,965
TOTAL Tuition and Fee Income $392,945,607 $587,833,447 $625,148,054 $668,902,504 $703,491,292 $742,335,108Scholarships $88,537,076 $103,069,338 $108,352,605 $118,044,966 $124,510,780 $131,242,251Net Tuition and Fee Income $304,408,531 $484,764,109 $516,795,449 $550,857,539 $578,980,512 $611,092,858
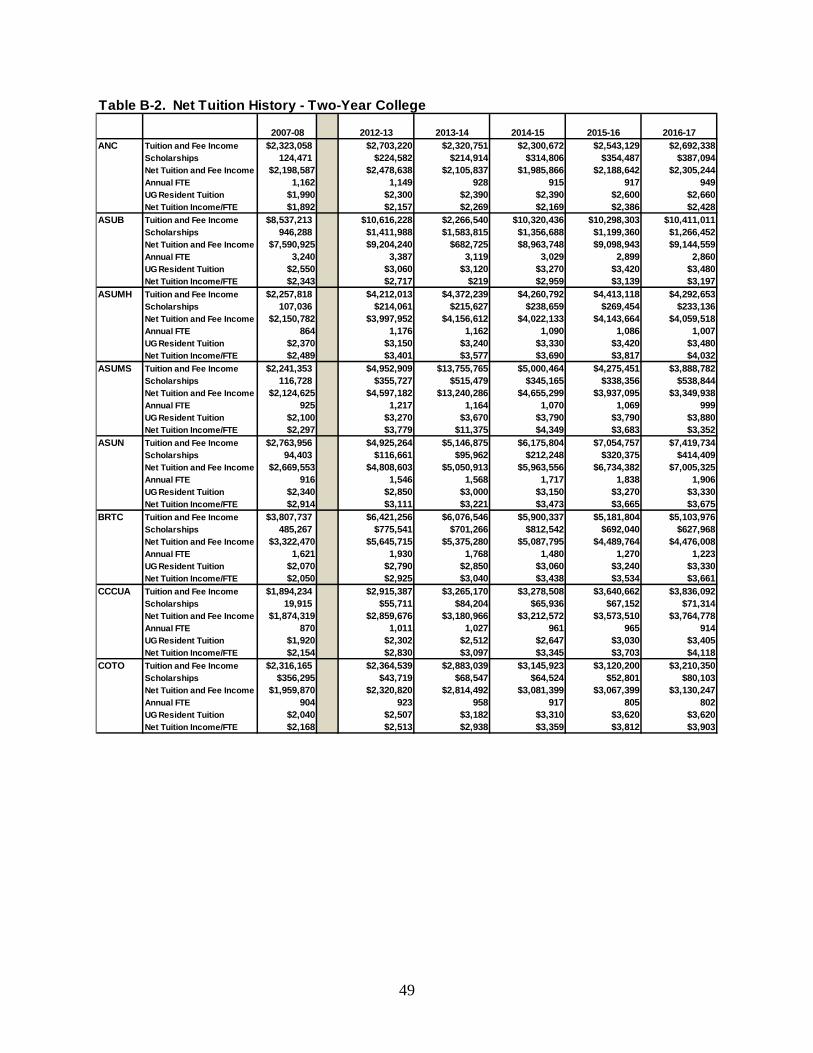
49
Table B-2. Net Tuition History - Two-Year College
2007-08 2012-13 2013-14 2014-15 2015-16 2016-17ANC Tuition and Fee Income $2,323,058 $2,703,220 $2,320,751 $2,300,672 $2,543,129 $2,692,338
Scholarships 124,471 $224,582 $214,914 $314,806 $354,487 $387,094Net Tuition and Fee Income $2,198,587 $2,478,638 $2,105,837 $1,985,866 $2,188,642 $2,305,244Annual FTE 1,162 1,149 928 915 917 949UG Resident Tuition $1,990 $2,300 $2,390 $2,390 $2,600 $2,660Net Tuition Income/FTE $1,892 $2,157 $2,269 $2,169 $2,386 $2,428
ASUB Tuition and Fee Income $8,537,213 $10,616,228 $2,266,540 $10,320,436 $10,298,303 $10,411,011Scholarships 946,288 $1,411,988 $1,583,815 $1,356,688 $1,199,360 $1,266,452Net Tuition and Fee Income $7,590,925 $9,204,240 $682,725 $8,963,748 $9,098,943 $9,144,559Annual FTE 3,240 3,387 3,119 3,029 2,899 2,860UG Resident Tuition $2,550 $3,060 $3,120 $3,270 $3,420 $3,480Net Tuition Income/FTE $2,343 $2,717 $219 $2,959 $3,139 $3,197
ASUMH Tuition and Fee Income $2,257,818 $4,212,013 $4,372,239 $4,260,792 $4,413,118 $4,292,653Scholarships 107,036 $214,061 $215,627 $238,659 $269,454 $233,136Net Tuition and Fee Income $2,150,782 $3,997,952 $4,156,612 $4,022,133 $4,143,664 $4,059,518Annual FTE 864 1,176 1,162 1,090 1,086 1,007UG Resident Tuition $2,370 $3,150 $3,240 $3,330 $3,420 $3,480Net Tuition Income/FTE $2,489 $3,401 $3,577 $3,690 $3,817 $4,032
ASUMS Tuition and Fee Income $2,241,353 $4,952,909 $13,755,765 $5,000,464 $4,275,451 $3,888,782Scholarships 116,728 $355,727 $515,479 $345,165 $338,356 $538,844Net Tuition and Fee Income $2,124,625 $4,597,182 $13,240,286 $4,655,299 $3,937,095 $3,349,938Annual FTE 925 1,217 1,164 1,070 1,069 999UG Resident Tuition $2,100 $3,270 $3,670 $3,790 $3,790 $3,880Net Tuition Income/FTE $2,297 $3,779 $11,375 $4,349 $3,683 $3,352
ASUN Tuition and Fee Income $2,763,956 $4,925,264 $5,146,875 $6,175,804 $7,054,757 $7,419,734Scholarships 94,403 $116,661 $95,962 $212,248 $320,375 $414,409Net Tuition and Fee Income $2,669,553 $4,808,603 $5,050,913 $5,963,556 $6,734,382 $7,005,325Annual FTE 916 1,546 1,568 1,717 1,838 1,906UG Resident Tuition $2,340 $2,850 $3,000 $3,150 $3,270 $3,330Net Tuition Income/FTE $2,914 $3,111 $3,221 $3,473 $3,665 $3,675
BRTC Tuition and Fee Income $3,807,737 $6,421,256 $6,076,546 $5,900,337 $5,181,804 $5,103,976Scholarships 485,267 $775,541 $701,266 $812,542 $692,040 $627,968Net Tuition and Fee Income $3,322,470 $5,645,715 $5,375,280 $5,087,795 $4,489,764 $4,476,008Annual FTE 1,621 1,930 1,768 1,480 1,270 1,223UG Resident Tuition $2,070 $2,790 $2,850 $3,060 $3,240 $3,330Net Tuition Income/FTE $2,050 $2,925 $3,040 $3,438 $3,534 $3,661
CCCUA Tuition and Fee Income $1,894,234 $2,915,387 $3,265,170 $3,278,508 $3,640,662 $3,836,092Scholarships 19,915 $55,711 $84,204 $65,936 $67,152 $71,314Net Tuition and Fee Income $1,874,319 $2,859,676 $3,180,966 $3,212,572 $3,573,510 $3,764,778Annual FTE 870 1,011 1,027 961 965 914UG Resident Tuition $1,920 $2,302 $2,512 $2,647 $3,030 $3,405Net Tuition Income/FTE $2,154 $2,830 $3,097 $3,345 $3,703 $4,118
COTO Tuition and Fee Income $2,316,165 $2,364,539 $2,883,039 $3,145,923 $3,120,200 $3,210,350Scholarships $356,295 $43,719 $68,547 $64,524 $52,801 $80,103Net Tuition and Fee Income $1,959,870 $2,320,820 $2,814,492 $3,081,399 $3,067,399 $3,130,247Annual FTE 904 923 958 917 805 802UG Resident Tuition $2,040 $2,507 $3,182 $3,310 $3,620 $3,620Net Tuition Income/FTE $2,168 $2,513 $2,938 $3,359 $3,812 $3,903

50
Table B-2. (cont.) Net Tuition History - Two-Year College
2007-08 2012-13 2013-14 2014-15 2015-16 2016-174EACC Tuition and Fee Income $2,430,986 $2,952,355 $2,760,293 $2,576,262 $2,717,009 $2,545,344
Scholarships 278,663 $230,333 $244,890 $253,128 $267,219 $217,730Net Tuition and Fee Income $2,152,323 $2,722,022 $2,515,403 $2,323,134 $2,449,790 $2,327,614Annual FTE 1,111 962 864 795 751 675UG Resident Tuition $2,010 $2,700 $2,790 $2,880 $3,090 $3,150Net Tuition Income/FTE $1,937 $2,829 $2,911 $2,923 $3,262 $3,450
NAC Tuition and Fee Income $3,443,144 $4,700,911 $4,531,546 $4,265,276 $4,287,268 $4,380,849Scholarships 266,506 $410,218 $402,141 $340,092 $430,047 $501,064Net Tuition and Fee Income $3,176,638 $4,290,693 $4,129,405 $3,925,184 $3,857,221 $3,879,785Annual FTE 1,534 1,710 1,598 1,429 1,314 1,329UG Resident Tuition $2,340 $2,910 $3,090 $3,090 $3,270 $3,330Net Tuition Income/FTE $2,071 $2,509 $2,584 $2,747 $2,935 $2,920
NPC Tuition and Fee Income $4,046,324 $7,339,026 $7,311,154 $6,298,690 $6,903,185 $6,973,932Scholarships $372,196 $1,192,989 $1,117,611 $1,123,261 $1,325,412 $1,117,992Net Tuition and Fee Income $3,674,128 $6,146,037 $6,193,543 $5,175,429 $5,577,773 $5,855,940Annual FTE 2,005 2,257 2,135 1,917 1,908 1,802UG Resident Tuition $2,130 $3,050 $3,320 $3,490 $3,460 $3,460Net Tuition Income/FTE $1,832 $2,724 $2,902 $2,699 $2,923 $3,250
NWACC Tuition and Fee Income $13,504,797 $24,367,840 $24,979,640 $24,607,735 $23,818,087 $22,871,518Scholarships $452,805 $1,008,584 $961,827 $1,170,030 $1,262,344 $1,486,929Net Tuition and Fee Income $13,051,992 $23,359,256 $24,017,813 $23,437,705 $22,555,743 $21,384,589Annual FTE 4,161 5,634 5,306 5,133 4,883 4,985UG Resident Tuition $3,085 $4,348 $4,513 $4,513 $4,633 $4,633Net Tuition Income/FTE $3,137 $4,146.34 $4,526.20 $4,565.82 $4,619 $4,290
OZC Tuition and Fee Income $2,215,144 $3,855,843 $3,853,957 $3,792,629 $3,385,560 $3,511,951Scholarships $183,677 $386,666 $493,334 $542,418 $530,501 $529,023Net Tuition and Fee Income $2,031,467 $3,469,177 $3,360,623 $3,250,212 $2,855,059 $2,982,928Annual FTE 871 1,201 1,107 933 812 823UG Resident Tuition $2,040 $2,810 $3,005 $3,325 $3,445 $3,445Net Tuition Income/FTE $2,332 $2,889 $3,035 $3,482 $3,518 $3,626
PCCUA Tuition and Fee Income $3,776,623 $3,096,106 $3,209,837 $2,837,099 $2,696,184 $2,966,651Scholarships $369,442 $328,502 $340,151 $313,209 $309,235 $754,097Net Tuition and Fee Income $3,407,181 $2,767,604 $2,869,686 $2,523,890 $2,386,949 $2,212,554Annual FTE 1,345 1,151 1,139 986 942 989UG Resident Tuition $2,180 $2,735 $2,855 $2,968 $2,968 $3,110Net Tuition Income/FTE $2,533 $2,404 $2,519 $2,559 $2,533 $2,236
SACC Tuition and Fee Income $2,802,721 $4,449,490 $4,896,954 $4,871,858 $4,542,271 $4,551,361Scholarships $44,852 $296,919 $261,359 $370,270 $297,214 $322,808Net Tuition and Fee Income $2,757,869 $4,152,571 $4,635,595 $4,501,588 $4,245,057 $4,228,553Annual FTE 1,085 1,276 1,192 1,181 1,076 1,005UG Resident Tuition $2,230 $3,010 $3,140 $3,290 $3,380 $3,510Net Tuition Income/FTE $2,542 $3,255 $3,888 $3,812 $3,946 $4,207

51
Table B-2. (cont.) Net Tuition History - Two-Year College
2007-08 2012-13 2013-14 2014-15 2015-16 2016-17SAUT Tuition and Fee Income $2,876,525 $4,566,899 $3,852,944 $4,601,127 $4,457,094 $3,866,023
Scholarships $506,196 $1,115,817 $1,371,938 $1,475,057 $1,239,735 $1,375,253Net Tuition and Fee Income $2,370,329 $3,451,082 $2,481,006 $3,126,070 $3,217,359 $2,490,770Annual FTE 1,397 1,316 1,287 1,220 1,084 925UG Resident Tuition $2,520 $3,630 $4,050 $4,050 $4,140 $4,140Net Tuition Income/FTE $1,697 $2,622 $1,928 $2,562 $2,969 $2,693
SEAC Tuition and Fee Income $3,011,464 $4,012,649 $3,852,944 $3,543,554 $3,610,512 $3,438,456Scholarships $78,377 $181,813 $170,518 $128,075 $245,198 $258,126Net Tuition and Fee Income $2,933,087 $3,830,836 $3,682,426 $3,415,479 $3,365,314 $3,180,330Annual FTE 1,563 1,258 1,178 1,049 1,029 952UG Resident Tuition $1,780 $2,980 $3,010 $3,070 $3,070 $3,220Net Tuition Income/FTE $1,877 $3,045 $3,126 $3,257 $3,271 $3,342
UACCB Tuition and Fee Income $2,606,272 $3,313,275 $3,168,356 $3,320,029 $3,320,452 $3,193,719Scholarships $157,328 $289,126 $273,783 $300,567 $395,152 $352,241Net Tuition and Fee Income $2,448,944 $3,024,149 $2,894,573 $3,019,462 $2,925,300 $2,841,478Annual FTE 1,136 1,051 969 944 963 891UG Resident Tuition $2,290 $2,900 $3,060 $3,195 $3,195 $3,375Net Tuition Income/FTE $2,156 $2,878 $2,989 $3,198 $3,038 $3,190
UACCH Tuition and Fee Income $1,909,987 $2,571,362 $2,471,235 $2,456,601 $2,658,467 $3,050,172Scholarships $359,306 $200,293 $222,366 $242,184 $326,698 $359,609Net Tuition and Fee Income $1,550,681 $2,371,069 $2,248,869 $2,214,417 $2,331,769 $2,690,563Annual FTE 921 1,054 990 916 948 1,024UG Resident Tuition $2,016 $2,346 $2,421 $2,560 $2,650 $2,890Net Tuition Income/FTE $1,684 $2,249 $2,273 $2,417 $2,461 $2,629
UACCM Tuition and Fee Income $3,791,736 $5,871,745 $13,653,094 $5,969,541 $6,247,346 $6,630,234Scholarships $336,152 $361,676 $350,412 $381,479 $402,926 $555,113Net Tuition and Fee Income $3,455,584 $5,510,069 $13,302,683 $5,588,062 $5,844,420 $6,075,121Annual FTE 1,381 1,695 1,668 1,531 1,545 1,552UG Resident Tuition $2,610 $3,360 $3,500 $3,635 $3,785 $3,980Net Tuition Income/FTE $2,502 $3,250 $7,977 $3,650 $3,784 $3,914
UACCRM Tuition and Fee Income $1,170,731 $1,904,418 $2,131,112 $2,113,976 $2,132,131 $2,118,220Scholarships $197,162 $261,801 $292,886 $370,109 $383,006 $375,210Net Tuition and Fee Income $973,569 $1,642,617 $1,838,226 $1,743,867 $1,749,125 $1,743,010Annual FTE 592 636 602 565 551 521UG Resident Tuition $1,800 $2,670 $3,180 $3,360 $3,480 $3,630Net Tuition Income/FTE $1,644 $2,584 $3,054 $3,087 $3,173 $3,344
UAPTC Tuition and Fee Income $17,377,259 $29,787,525 $28,982,515 $28,310,660 $25,985,310 $25,066,842Scholarships $897,292 $1,458,550 $1,941,223 $1,760,011 $1,645,095 $1,465,864Net Tuition and Fee Income $16,479,967 $28,328,975 $27,041,292 $26,550,649 $24,340,215 $23,600,978Annual FTE 6,267 8,400 7,304 6,292 5,150 4,340UG Resident Tuition $2,520 $3,183 $3,563 $4,013 $4,650 $5,280Net Tuition Income/FTE $2,630 $3,373 $3,702 $4,220 $4,726 $5,438
TOTAL Tuition and Fee Income $91,105,246 $141,900,260 $149,742,507 $139,947,974 $137,288,300 $136,020,209Scholarships $6,750,357 $10,921,277 $11,924,252 $12,180,458 $12,353,807 $13,290,378Net Tuition and Fee Income $84,354,890 $130,978,983 $137,818,255 $127,767,516 $124,934,493 $122,729,831
52
Appendix C:
Expenditures per FTE by
Function

53
Tabl
e C-
1. E
xpen
ditu
res
per F
TE b
y Ex
pend
iture
Fun
ctio
n fo
r 201
6-17
Colle
ge
Inst
ruct
ion
Rese
arch
Publ
ic
Serv
ice
Acad
emic
Su
ppor
tSt
uden
t Se
rvic
esIn
stitu
tiona
l Su
ppor
t
Ope
ratio
n an
d M
aint
enan
ce
of P
lant
Scho
lars
hips
&
Fello
wsh
ips
Oth
er
Tota
l
$4,8
52$2
30$2
87$1
,155
$768
$1,1
62$1
,067
$1,7
10$1
00$1
1,33
1$4
,785
$206
$1$1
,168
$822
$1,6
33$1
,060
$1,4
55$8
0$1
1,21
0$5
,641
$30
$75
$1,3
29$1
,102
$2,1
88$1
,558
$3,0
48$1
04$1
5,07
4$4
,291
$76
$52
$995
$945
$1,4
79$1
,750
$2,3
41$2
1$1
1,94
9$6
,967
$1,0
47$3
90$1
,648
$1,1
19$1
,828
$991
$717
$331
$15,
038
$4,0
88$0
$41
$1,4
10$9
11$1
,862
$1,0
53$9
12$0
$10,
279
$5,8
98$5
79$2
60$2
,279
$926
$1,8
34$1
,286
$2,2
20$3
92$1
5,67
3$5
,048
$16
$121
$676
$859
$1,7
12$1
,419
$2,3
92$0
$12,
243
$5,2
14$2
25$1
04$1
,783
$1,4
42$2
,639
$2,4
29$3
,188
$0$1
7,02
4$5
,928
$118
$248
$1,2
37$6
80$1
,280
$1,3
12$2
,085
-$1
$12,
886
Aver
age
$5,2
71$2
53$1
58$1
,368
$957
$1,7
62$1
,392
$2,0
07$1
03$1
3,27
1
Tabl
e C-
2. E
xpen
ditu
res
per F
TE b
y Ex
pend
iture
Fun
ctio
n fo
r 201
6-17
Colle
ge
Inst
ruct
ion
Rese
arch
Publ
ic
Serv
ice
Acad
emic
Su
ppor
tSt
uden
t Se
rvic
esIn
stitu
tiona
l Su
ppor
t
Ope
ratio
n an
d M
aint
enan
ce
of P
lant
Scho
lars
hips
&
Fello
wsh
ips
Oth
er
Tota
l
ANC
$7,5
19$0
$854
$149
$765
$1,9
47$1
,867
$408
$0$1
3,50
9AS
UB$3
,544
$0$0
$465
$715
$1,7
25$9
80$4
43$3
0$7
,904
ASUM
H$3
,620
$30
$131
$686
$698
$1,9
35$1
,438
$232
$0$8
,770
ASUM
S$3
,808
$0$1
,388
$1,3
34$8
72$3
,220
$1,8
54$5
39$0
$13,
015
ASUN
$3,5
71$0
$0$5
53$6
94$1
,874
$684
$217
$0$7
,594
BRTC
$5,7
33$0
$371
$686
$1,0
34$1
,883
$2,1
17$5
14$0
$12,
337
CCCU
A$4
,764
$0$0
$990
$1,5
64$1
,848
$1,0
14$7
8$1
78$1
0,43
7CO
TO$3
,912
$0$0
$1,2
87$8
06$2
,129
$1,4
89$1
00$0
$9,7
23EA
CC$4
,363
$0$1
,015
$2,0
49$1
,697
$2,6
19$1
,341
$323
$0$1
3,40
7NA
C$4
,326
$0$0
$1,3
88$6
06$2
,345
$1,2
38$3
77$1
06$1
0,38
6NP
CC$4
,134
$0$0
$571
$991
$1,7
07$8
48$6
20$0
$8,8
72NW
ACC
$3,6
98$0
$0$6
66$7
94$1
,242
$993
$0$5
40$7
,934
OZC
$3,6
47$0
$231
$177
$656
$2,9
32$1
,946
$643
$0$1
0,23
2PC
CUA
$5,1
14$0
$542
$1,6
32$1
,215
$2,7
29$1
,699
$762
$0$1
3,69
4SA
CC$4
,548
$0$6
3$1
,265
$640
$2,6
60$1
,322
$321
$0$1
0,81
8SA
UT$2
,772
$0$0
$1,2
75$1
,010
$2,4
56$1
,416
$1,4
87$0
$10,
416
SEAC
$4,1
20$0
$0$1
,060
$998
$3,3
05$1
,543
$271
$0$1
1,29
8UA
CCB
$3,9
21$0
$0$1
,590
$1,0
95$1
,838
$1,0
94$3
95$0
$9,9
33UA
CCH
$3,7
22$0
$538
$620
$892
$2,1
74$1
,281
$351
$781
$10,
359
UACC
M$3
,568
$0$8
$1,1
38$8
75$1
,466
$959
$358
$0$8
,372
UACC
RM$3
,476
$0$1
67$6
42$1
,249
$3,3
46$1
,330
$720
$0$1
0,92
9UA
PTC
$3,2
57$0
$0$9
64$6
83$1
,705
$857
$338
$103
$7,9
07$4
,220
$2$2
57$9
79$9
31$2
,202
$1,3
56$4
22$8
2$1
0,45
0
UALR
UAM
UAPB
UCA
Aver
age
UAFS
ASUJ
ATU
HSU
SAU
UAF

54
*Category is based on Southern Regional Education Board (SREB) Institutional Categories
Table C-3. Expenditure Shifts 2012-13 to 2016-17 by Institution Category*
Expenditure Function 2012-13 % of Total 2016-17 % of Total5-YR
% Change 2012-13 % of Total 2016-17 % of Total5-YR%
Change
Instruction $5,752 42.5% $6,805 46.6% 9.8% $5,589 40.7% $5,933 38.7% -4.9%Research $663 4.9% $1,007 6.9% 41.0% $501 3.6% $571 3.7% 2.1%Public Service $470 3.5% $399 2.7% -21.3% $338 2.5% $271 1.8% -28.2%Academic Support $1,565 11.6% $1,639 11.2% -2.9% $2,185 15.9% $2,325 15.2% -4.6%Student Services $1,028 7.6% $1,068 7.3% -3.7% $821 6.0% $917 6.0% 0.1%Institutional Support $1,827 13.5% $1,684 11.5% -14.5% $1,343 9.8% $1,587 10.3% 5.8%Operation and Maintenance of Plant $1,260 9.3% $983 6.7% -27.6% $1,105 8.0% $1,246 8.1% 1.0%Scholarships & Fellowships $677 5.0% $693 4.8% -4.9% $1,452 10.6% $2,171 14.2% 34.0%Other $292 2.2% $310 2.1% -1.3% $401 2.9% $312 2.0% -30.4% Total $13,536 100% $14,587 100% $13,735 100% $15,334 100%
Four-Year I*UALR
Four-Year II*UAF
Expenditure Function 2012-13 % of Total 2016-17 % of Total5-YR
% Change 2012-13 % of Total 2016-17 % of Total5-YR
% ChangeInstruction $4,281 39.9% $4,909 42.5% 6.6% $3,726 42.8% $4,291 40.4% -5.8%Research $280 2.6% $224 1.9% -25.8% $98 1.1% $140 1.3% 16.5%Public Service $247 2.3% $239 2.1% -10.0% $1 0.0% $23 0.2% 2310.6%Academic Support $1,185 11.0% $1,341 11.6% 5.2% $840 9.7% $1,099 10.3% 7.1%Student Services $800 7.5% $812 7.0% -5.8% $559 6.4% $852 8.0% 24.7%Institutional Support $1,132 10.6% $1,118 9.7% -8.2% $1,567 18.0% $1,908 17.9% -0.3%Operation and Maintenance of Plant $1,165 10.9% $1,126 9.7% -10.2% $678 7.8% $921 8.7% 11.1%Scholarships & Fellowships $1,531 14.3% $1,703 14.8% 3.4% $1,193 13.7% $1,311 12.3% -10.1%Other $107 1.0% $74 0.6% -35.9% $39 0.4% $87 0.8% 83.4% Total $10,727 100% $11,544 100% $8,701 100% $10,633 100%
Expenditure Function 2012-13 % of Total 2016-17 % of Total5-YR
% ChangeInstruction $5,323 46.7% $5,642 45% -2.8%Research $114 1.0% $104 0.8% -16.2%Public Service $267 2.3% $258 2.1% -11.4%Academic Support $1,110 9.7% $1,258 10.1% 4.0%Student Services $599 5.3% $644 5.2% -1.4%Institutional Support $1,046 9.2% $1,262 10.1% 10.7%Operation and Maintenance of Plant $1,219 10.7% $1,315 10.6% -1.1%Scholarships & Fellowships $1,730 15.2% $1,956 15.7% 3.7%Other $0 0.0% $0 0.0% -100.0% Total $11,409 100% $12,440 100%
ASUJ ATU
UCA
Four-Year III*

55
HSU
Expenditure Function 2012-13 % of Total 2016-17 % of Total5-YR
% Change 2012-13 % of Total 2016-17 % of Total5-YR
% ChangeInstruction $4,869 42.77% $5,959 40.7% -4.9% $4,586 40.0% $4,280 37.4% -6.7%Research $90 0.79% $7 0.0% -93.6% $107 0.9% $80 0.7% -25.4%Public Service $27 0.24% $66 0.5% 91.2% $72 0.6% $55 0.5% -24.2%Academic Support $578 5.08% $892 6.1% 19.8% $961 8.4% $944 8.2% -1.8%Student Services $668 5.87% $948 6.5% 10.2% $951 8.3% $946 8.3% -0.6%Institutional Support $1,881 16.52% $2,502 17.1% 3.3% $1,394 12.2% $1,404 12.3% 0.7%Operation and Maintenance of Plant $1,210 10.63% $1,449 9.9% -7.0% $1,187 10.4% $1,833 16.0% 54.4%Scholarships & Fellowships $2,061 18.10% $2,831 19.3% 6.7% $2,190 19.1% $2,290 20.0% 4.6%Other $0 0.00% $0 0.0% 0.0% $3 0.0% $42 0.4% 0.0% Total $11,384 100% $14,655 100% $11,452 100% $11,873 104%
Four-Year IV*SAUM
Expenditure Function 2012-13 % of Total 2016-17 % of Total5-YR
% ChangeInstruction $4,720 43.7% $5,358 43.1% -1.3%Research $8 0.1% $15 0.1% 64.2%Public Service $103 0.9% $143 1.1% 20.8%Academic Support $689 6.4% $769 6.2% -3.1%Student Services $660 6.1% $752 6.1% -0.9%Institutional Support $1,638 15.2% $1,706 13.7% -9.5%Operation and Maintenance of Plant $1,249 11.6% $1,391 11.2% -3.2%Scholarships & Fellowships $1,726 16.0% $2,283 18.4% 15.0%Other $0 0.0% $0 0.0% 0.0% Total $10,793 100% $12,417 100%*Category is based on Southern Regional Education Board (SREB) Institutional Categories
UAMFour-Year V*
2012-13 % of Total 2016-17 % of Total5-YR
% Change 2012-13 % of Total 2016-17 % of Total5-YR
% Change$3,599 41.0% $4,039 40.3% -1.9% $4,173 31.7% $5,197 30.4% -4.1%
$0 0.0% $0 0.0% 0.0% $734 5.6% $301 1.8% -68.5%$92 1.1% $60 0.6% -43.0% $617 4.7% $140 0.8% -82.6%
$1,301 14.8% $1,276 12.7% -14.3% $1,514 11.5% $1,818 10.6% -7.5%$665 7.6% $842 8.4% 10.8% $1,021 7.8% $1,456 8.5% 9.9%
$1,432 16.3% $1,805 18.0% 10.2% $1,793 13.6% $2,743 16.1% 17.8%$1,057 12.1% $1,032 10.3% -14.6% $1,963 14.9% $2,515 14.7% -1.4%
$622 7.1% $974 9.7% 36.9% $1,329 10.1% $2,899 17.0% 67.9%$0 0.0% $0 0.0% 0.0% $0 0.0% $0 0.0% 0.0%
$8,769 100% $10,029 100% $13,145 100% $17,069 100%
UAFS UAPBFour-Year VI*

56
Table C-4. Expenditure Shifts 2012-13 to 2016-17 by Institution
Expenditure Function 2012-13 % of Total 2016-17 % of Total5-YR
% Change 2012-13 % of Total 2016-17 % of Total5-YR
% ChangeInstruction $6,619 55.9% $7,519 55.7% -0.5% $3,246 45.2% $3,544 44.8% -0.8%Research $0 0.0% $0 0.0% 0.0% $0 0.0% $0 0.0% 0.0%Public Service $639 5.4% $854 6.3% 17.1% $0 0.0% $0 0.0% 0.0%Academic Support $330 2.8% $149 1.1% -60.5% $417 5.8% $465 5.9% 1.4%Student Services $622 5.3% $765 5.7% 7.8% $616 8.6% $715 9.1% 5.6%Institutional Support $1,724 14.6% $1,947 14.4% -1.1% $1,462 20.4% $1,725 21.8% 7.2%Operation and Maintenance of Plant $1,774 15.0% $1,867 13.8% -7.7% $875 12.2% $980 12.4% 1.7%Scholarships & Fellowships $127 1.1% $408 3.0% 181.5% $417 5.8% $443 5.6% -3.5%Other $0 0.0% $0 0.0% 0.0% $148 2.1% $30 0.4% -81.3% Total $11,835 100% $13,509 100% $7,180 100% $7,904 100%
Expenditure Function 2012-13 % of Total 2016-17 % of Total5-YR
% Change 2012-13 % of Total 2016-17 % of Total5-YR
% ChangeInstruction $3,379 45.5% $3,620 41.3% -9.2% $3,773 34.1% $3,808 29.3% -14%Research $0 0.0% $30 0.3% 0.0% $0 0.0% $0 0.0% 0%Public Service $160 2.1% $131 1.5% -30.6% $439 4.0% $1,388 10.7% 169%Academic Support $346 4.7% $686 7.8% 68.0% $1,265 11.4% $1,334 10.2% -10%Student Services $695 9.4% $698 8.0% -14.9% $1,024 9.2% $872 6.7% -28%Institutional Support $1,589 21.4% $1,935 22.1% 3.2% $2,886 26.1% $3,220 24.7% -5%Operation and Maintenance of Plant $1,079 14.5% $1,438 16.4% 12.9% $1,393 12.6% $1,854 14.2% 13%Scholarships & Fellowships $182 2.5% $232 2.6% 7.7% $292 2.6% $539 4.1% 57%Other $0 0.0% $0 0.0% 0.0% $0 0.0% $0 0.0% 0% Total $7,430 100% $8,770 100% $11,073 100% $13,015 100%
Expenditure Function 2012-13 % of Total 2016-17 % of Total5-YR
% Change 2012-13 % of Total 2016-17 % of Total5-YR
% ChangeInstruction $3,810 48.6% $3,571 47.0% -3.3% $3,392 47.9% $5,733 46.5% -3.1%Research $0 0.0% $0 0.0% 0.0% $0 0.0% $0 0.0% 0.0%Public Service $0 0.0% $0 0.0% 0.0% $279 3.9% $371 3.0% -23.7%Academic Support $502 6.4% $553 7.3% 13.6% $377 5.3% $686 5.6% 4.5%Student Services $806 10.3% $694 9.1% -11.2% $546 7.7% $1,034 8.4% 8.6%Institutional Support $1,663 21.2% $1,874 24.7% 16.3% $1,204 17.0% $1,883 15.3% -10.3%Operation and Maintenance of Plant $982 12.5% $684 9.0% -28.0% $878 12.4% $2,117 17.2% 38.4%Scholarships & Fellowships $75 1.0% $217 2.9% 197.2% $402 5.7% $514 4.2% -26.7%Other $0 0.0% $0 0.0% 0.0% $0 0.0% $0 0.0% 0.0% Total $7,838 100% $7,594 100% 0 $7,077 100% $12,337 100% $0
Expenditure Function 2012-13 % of Total 2016-17 % of Total5-YR
% Change 2012-13 % of Total 2016-17 % of Total5-YR
% ChangeInstruction $3,367 39.8% $4,764 45.6% 14.8% $3,524 43.7% $3,912 40.2% -7.9%Research $0 0.0% $0 0.0% 0.0% $0 0.0% $0 0.0% 0.0%Public Service $2 0.0% $0 0.0% -100.0% $0 0.0% $0 0.0% 0.0%Academic Support $1,261 14.9% $990 9.5% -36.3% $443 5.5% $1,287 13.2% 140.8%Student Services $1,032 12.2% $1,564 15.0% 22.9% $819 10.2% $806 8.3% -18.3%Institutional Support $1,238 14.6% $1,848 17.7% 21.1% $2,121 26.3% $2,129 21.9% -16.7%Operation and Maintenance of Plant $1,252 14.8% $1,014 9.7% -34.3% $1,110 13.8% $1,489 15.3% 11.3%Scholarships & Fellowships $55 0.7% $78 0.7% 14.8% $47 0.6% $100 1.0% 75.0%Other $258 3.0% $178 1.7% -44.0% $0 0.0% $0 0.0% 0.0% Total $8,464 100% $10,437 100% $8,065 100% $9,723 100% $0
CCCUA COTO
ANC ASUB
ASUMH ASUMS
ASUN BRTC
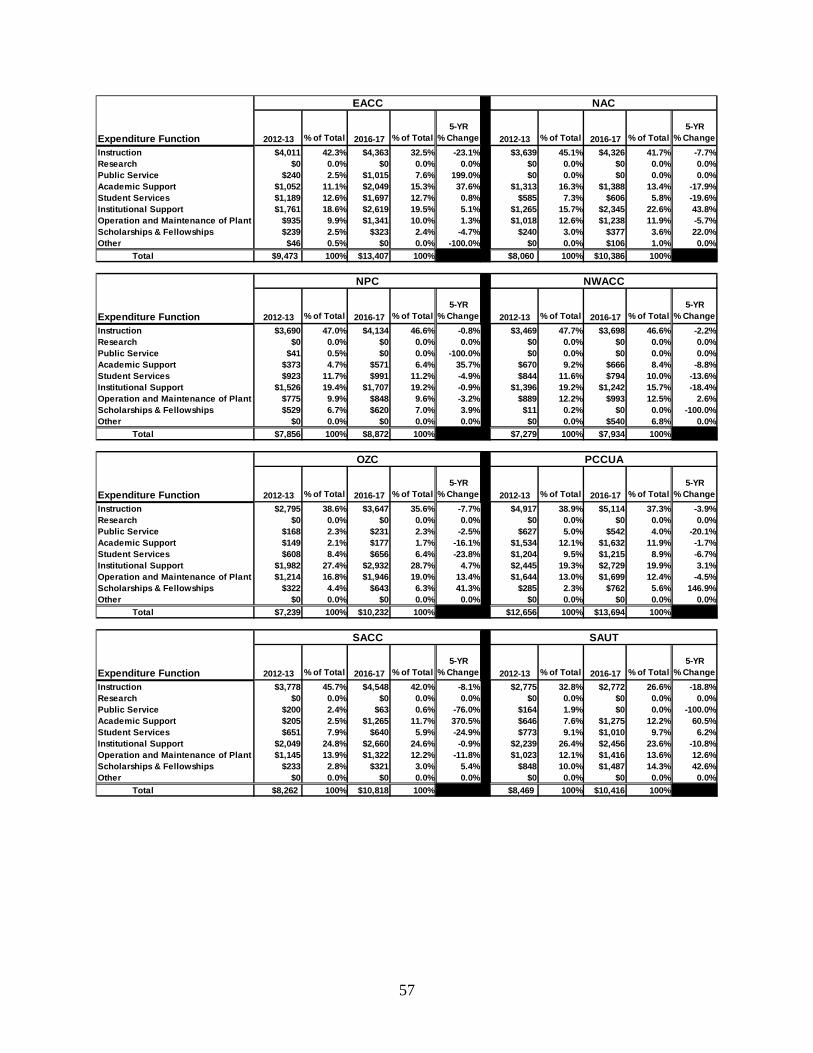
57
Expenditure Function 2012-13 % of Total 2016-17 % of Total5-YR
% Change 2012-13 % of Total 2016-17 % of Total5-YR
% ChangeInstruction $4,011 42.3% $4,363 32.5% -23.1% $3,639 45.1% $4,326 41.7% -7.7%Research $0 0.0% $0 0.0% 0.0% $0 0.0% $0 0.0% 0.0%Public Service $240 2.5% $1,015 7.6% 199.0% $0 0.0% $0 0.0% 0.0%Academic Support $1,052 11.1% $2,049 15.3% 37.6% $1,313 16.3% $1,388 13.4% -17.9%Student Services $1,189 12.6% $1,697 12.7% 0.8% $585 7.3% $606 5.8% -19.6%Institutional Support $1,761 18.6% $2,619 19.5% 5.1% $1,265 15.7% $2,345 22.6% 43.8%Operation and Maintenance of Plant $935 9.9% $1,341 10.0% 1.3% $1,018 12.6% $1,238 11.9% -5.7%Scholarships & Fellowships $239 2.5% $323 2.4% -4.7% $240 3.0% $377 3.6% 22.0%Other $46 0.5% $0 0.0% -100.0% $0 0.0% $106 1.0% 0.0% Total $9,473 100% $13,407 100% $0 $8,060 100% $10,386 100% 2.22E-16
Expenditure Function 2012-13 % of Total 2016-17 % of Total5-YR
% Change 2012-13 % of Total 2016-17 % of Total5-YR
% ChangeInstruction $3,690 47.0% $4,134 46.6% -0.8% $3,469 47.7% $3,698 46.6% -2.2%Research $0 0.0% $0 0.0% 0.0% $0 0.0% $0 0.0% 0.0%Public Service $41 0.5% $0 0.0% -100.0% $0 0.0% $0 0.0% 0.0%Academic Support $373 4.7% $571 6.4% 35.7% $670 9.2% $666 8.4% -8.8%Student Services $923 11.7% $991 11.2% -4.9% $844 11.6% $794 10.0% -13.6%Institutional Support $1,526 19.4% $1,707 19.2% -0.9% $1,396 19.2% $1,242 15.7% -18.4%Operation and Maintenance of Plant $775 9.9% $848 9.6% -3.2% $889 12.2% $993 12.5% 2.6%Scholarships & Fellowships $529 6.7% $620 7.0% 3.9% $11 0.2% $0 0.0% -100.0%Other $0 0.0% $0 0.0% 0.0% $0 0.0% $540 6.8% 0.0% Total $7,856 100% $8,872 100% $7,279 100% $7,934 100%
Expenditure Function 2012-13 % of Total 2016-17 % of Total5-YR
% Change 2012-13 % of Total 2016-17 % of Total5-YR
% ChangeInstruction $2,795 38.6% $3,647 35.6% -7.7% $4,917 38.9% $5,114 37.3% -3.9%Research $0 0.0% $0 0.0% 0.0% $0 0.0% $0 0.0% 0.0%Public Service $168 2.3% $231 2.3% -2.5% $627 5.0% $542 4.0% -20.1%Academic Support $149 2.1% $177 1.7% -16.1% $1,534 12.1% $1,632 11.9% -1.7%Student Services $608 8.4% $656 6.4% -23.8% $1,204 9.5% $1,215 8.9% -6.7%Institutional Support $1,982 27.4% $2,932 28.7% 4.7% $2,445 19.3% $2,729 19.9% 3.1%Operation and Maintenance of Plant $1,214 16.8% $1,946 19.0% 13.4% $1,644 13.0% $1,699 12.4% -4.5%Scholarships & Fellowships $322 4.4% $643 6.3% 41.3% $285 2.3% $762 5.6% 146.9%Other $0 0.0% $0 0.0% 0.0% $0 0.0% $0 0.0% 0.0% Total $7,239 100% $10,232 100% $12,656 100% $13,694 100%
Expenditure Function 2012-13 % of Total 2016-17 % of Total5-YR
% Change 2012-13 % of Total 2016-17 % of Total5-YR
% ChangeInstruction $3,778 45.7% $4,548 42.0% -8.1% $2,775 32.8% $2,772 26.6% -18.8%Research $0 0.0% $0 0.0% 0.0% $0 0.0% $0 0.0% 0.0%Public Service $200 2.4% $63 0.6% -76.0% $164 1.9% $0 0.0% -100.0%Academic Support $205 2.5% $1,265 11.7% 370.5% $646 7.6% $1,275 12.2% 60.5%Student Services $651 7.9% $640 5.9% -24.9% $773 9.1% $1,010 9.7% 6.2%Institutional Support $2,049 24.8% $2,660 24.6% -0.9% $2,239 26.4% $2,456 23.6% -10.8%Operation and Maintenance of Plant $1,145 13.9% $1,322 12.2% -11.8% $1,023 12.1% $1,416 13.6% 12.6%Scholarships & Fellowships $233 2.8% $321 3.0% 5.4% $848 10.0% $1,487 14.3% 42.6%Other $0 0.0% $0 0.0% 0.0% $0 0.0% $0 0.0% 0.0% Total $8,262 100% $10,818 100% $8,469 100% $10,416 100%
NPC NWACC
OZC PCCUA
EACC NAC
SACC SAUT

58
Expenditure Function 2012-13 % of Total 2016-17 % of Total5-YR
% Change 2012-13 % of Total 2016-17 % of Total5-YR
% ChangeInstruction $3,285 38.0% $4,120 36.5% -4.1% $3,659 44.6% $3,921 39.5% -11.4%Research $0 0.0% $0 0.0% 0.0% $0 0.0% $0 0.0% 0.0%Public Service $0 0.0% $0 0.0% 0.0% $0 0.0% $0 0.0% 0.0%Academic Support $437 5.1% $1,060 9.4% 85.3% $1,065 13.0% $1,590 16.0% 23.5%Student Services $693 8.0% $998 8.8% 10.1% $860 10.5% $1,095 11.0% 5.2%Institutional Support $3,026 35.0% $3,305 29.3% -16.5% $1,378 16.8% $1,838 18.5% 10.2%Operation and Maintenance of Plant $1,050 12.2% $1,543 13.7% 12.4% $966 11.8% $1,094 11.0% -6.4%Scholarships & Fellowships $145 1.7% $271 2.4% 43.4% $275 3.4% $395 4.0% 18.8%Other $0 0.0% $0 0.0% 0.0% $9 0.1% $0 0.0% 0.0% Total $8,635 100% $11,298 100% $8,212 100% $9,933 100%
Expenditure Function 2012-13 % of Total 2016-17 % of Total5-YR
% Change 2012-13 % of Total 2016-17 % of Total5-YR
% ChangeInstruction $3,656 39.9% $3,722 35.9% -10.0% $3,292 43.6% $3,568 42.6% -2.2%Research $0 0.0% $0 0.0% 0.0% $0 0.0% $0 0.0% 0.0%Public Service $291 3.2% $538 5.2% 63.4% $4 0.1% $8 0.1% 78.5%Academic Support $502 5.5% $620 6.0% 9.1% $891 11.8% $1,138 13.6% 15.3%Student Services $800 8.7% $892 8.6% -1.4% $819 10.8% $875 10.4% -3.6%Institutional Support $1,793 19.6% $2,174 21.0% 7.2% $1,058 14.0% $1,466 17.5% 25.1%Operation and Maintenance of Plant $1,183 12.9% $1,281 12.4% -4.2% $881 11.7% $959 11.5% -1.8%Scholarships & Fellowships $190 2.1% $351 3.4% 63.5% $213 2.8% $358 4.3% 51.3%Other $741 8.1% $781 7.5% -6.8% $397 5.3% $0 0.0% -100.0% Total $9,155 100% $10,359 100% $7,555 100% $8,372 100%
Expenditure Function 2012-13 % of Total 2016-17 % of Total5-YR
% Change 2012-13 % of Total 2016-17 % of Total5-YR
% ChangeInstruction $3,281 38.2% $3,476 31.8% -16.7% $2,303 47.8% $3,257 41.2% -13.8%Research $0 0.0% $0 0.0% 0.0% $0 0.0% $0 0.0% 0.0%Public Service $124 1.4% $167 1.5% 0.0% $0 0.0% $0 0.0% #DIV/0!Academic Support $761 8.9% $642 5.9% -33.7% $676 14.0% $964 12.2% -13.1%Student Services $772 9.0% $1,249 11.4% 27.1% $453 9.4% $683 8.6% -8.2%Institutional Support $2,438 28.4% $3,346 30.6% 7.9% $842 17.5% $1,705 21.6% 23.3%Operation and Maintenance of Plant $802 9.3% $1,330 12.2% 30.3% $361 7.5% $857 10.8% 44.7%Scholarships & Fellowships $412 4.8% $720 6.6% 37.4% $174 3.6% $338 4.3% 18.6%Other $0 0.0% $0 0.0% 0.0% $10 0.2% $103 1.3% 0.0% Total $8,592 100% $10,929 100% $4,820 100% $7,907 100%
UACCH UACCM
UACCRM UAPTC
SEAC UACCB

59
Appendix D: Scholarships
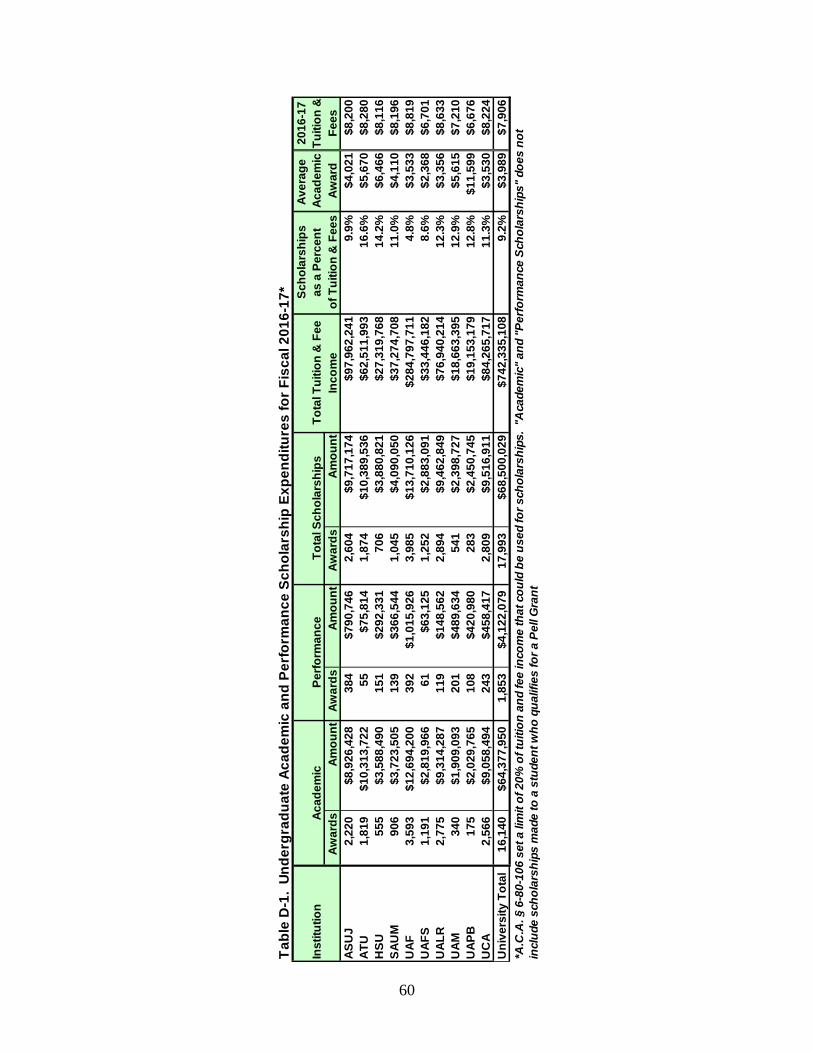
60
Tabl
e D
-1.
Unde
rgra
duat
e Ac
adem
ic a
nd P
erfo
rman
ce S
chol
arsh
ip E
xpen
ditu
res
for F
isca
l 201
6-17
* Scho
lars
hips
Aver
age
2016
-17
Inst
itutio
nTo
tal S
chol
arsh
ips
Tota
l Tui
tion
& F
eeas
a P
erce
ntAc
adem
icTu
ition
&Aw
ards
Amou
ntAw
ards
Amou
ntAw
ards
Amou
ntIn
com
eof
Tui
tion
& F
ees
Awar
dFe
esAS
UJ
2,22
0
$8
,926
,428
384
$7
90,7
462,
604
$9,7
17,1
74$9
7,96
2,24
19.
9%$4
,021
$8,2
00AT
U1,
819
$10,
313,
722
55
$7
5,81
41,
874
$10,
389,
536
$62,
511,
993
16.6
%$5
,670
$8,2
80H
SU55
5
$3,5
88,4
9015
1
$292
,331
706
$3
,880
,821
$27,
319,
768
14.2
%$6
,466
$8,1
16SA
UM
906
$3
,723
,505
139
$3
66,5
441,
045
$4,0
90,0
50$3
7,27
4,70
811
.0%
$4,1
10$8
,196
UAF
3,59
3
$1
2,69
4,20
039
2
$1,0
15,9
263,
985
$13,
710,
126
$284
,797
,711
4.8%
$3,5
33$8
,819
UAF
S1,
191
$2,8
19,9
6661
$63,
125
1,25
2
$2
,883
,091
$33,
446,
182
8.6%
$2,3
68$6
,701
UAL
R2,
775
$9,3
14,2
8711
9
$148
,562
2,89
4
$9
,462
,849
$76,
940,
214
12.3
%$3
,356
$8,6
33U
AM34
0
$1,9
09,0
9320
1
$489
,634
541
$2
,398
,727
$18,
663,
395
12.9
%$5
,615
$7,2
10U
APB
175
$2
,029
,765
108
$4
20,9
8028
3
$2,4
50,7
45$1
9,15
3,17
912
.8%
$11,
599
$6,6
76U
CA
2,56
6
$9
,058
,494
243
$4
58,4
172,
809
$9,5
16,9
11$8
4,26
5,71
711
.3%
$3,5
30$8
,224
Uni
vers
ity T
otal
16,1
40
$64,
377,
950
1,85
3
$4
,122
,079
17,9
93
$6
8,50
0,02
9$7
42,3
35,1
089.
2%$3
,989
$7,9
06
Acad
emic
Perfo
rman
ce
*A.C
.A. §
6-8
0-10
6 se
t a li
mit
of 2
0% o
f tui
tion
and
fee
inco
me
that
cou
ld b
e us
ed fo
r sch
olar
ship
s. "
Aca
dem
ic" a
nd "P
erfo
rman
ce S
chol
arsh
ips"
doe
s no
t in
clud
e sc
hola
rshi
ps m
ade
to a
stu
dent
who
qua
lifie
s fo
r a P
ell G
rant
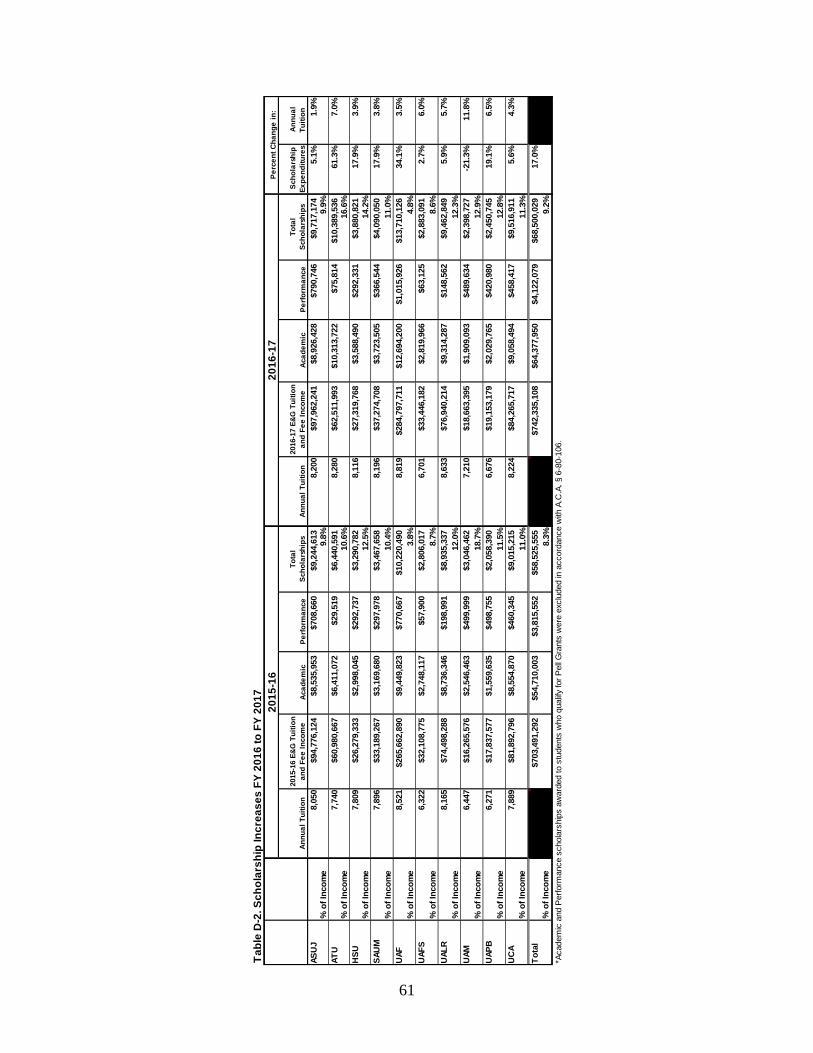
61
Tabl
e D
-2. S
chol
arsh
ip In
crea
ses
FY 2
016
to F
Y 20
17Pe
rcen
t Cha
nge
in:
Annu
al T
uitio
n20
15-1
6 E&
G T
uitio
n an
d Fe
e In
com
eAc
adem
icPe
rform
ance
Tota
l Sc
hola
rshi
psAn
nual
Tui
tion
2016
-17
E&G
Tui
tion
and
Fee
Inco
me
Acad
emic
Perfo
rman
ceTo
tal
Scho
lars
hips
Sch
olar
ship
Ex
pend
iture
s A
nnua
l Tu
ition
ASU
J 8,
050
$94,
776,
124
$8,5
35,9
53$7
08,6
60$9
,244
,613
8,20
0$9
7,96
2,24
1$8
,926
,428
$790
,746
$9,7
17,1
745.
1%1.
9%
% o
f Inc
ome
9.8%
9.9%
ATU
7,
740
$60,
980,
667
$6,4
11,0
72$2
9,51
9$6
,440
,591
8,28
0$6
2,51
1,99
3$1
0,31
3,72
2$7
5,81
4$1
0,38
9,53
661
.3%
7.0%
%
of I
ncom
e10
.6%
16.6
%H
SU
7,80
9$2
6,27
9,33
3$2
,998
,045
$292
,737
$3,2
90,7
828,
116
$27,
319,
768
$3,5
88,4
90$2
92,3
31$3
,880
,821
17.9
%3.
9%
% o
f Inc
ome
12.5
%14
.2%
SAU
M
7,89
6$3
3,18
9,26
7$3
,169
,680
$297
,978
$3,4
67,6
588,
196
$37,
274,
708
$3,7
23,5
05$3
66,5
44$4
,090
,050
17.9
%3.
8%
% o
f Inc
ome
10.4
%11
.0%
UAF
8,52
1$2
65,6
62,8
90$9
,449
,823
$770
,667
$10,
220,
490
8,81
9$2
84,7
97,7
11$1
2,69
4,20
0$1
,015
,926
$13,
710,
126
34.1
%3.
5%
% o
f Inc
ome
3.8%
4.8%
UAF
S6,
322
$32,
108,
775
$2,7
48,1
17$5
7,90
0$2
,806
,017
6,70
1$3
3,44
6,18
2$2
,819
,966
$63,
125
$2,8
83,0
912.
7%6.
0%
% o
f Inc
ome
8.7%
8.6%
UAL
R
8,16
5$7
4,49
8,28
8$8
,736
,346
$198
,991
$8,9
35,3
378,
633
$76,
940,
214
$9,3
14,2
87$1
48,5
62$9
,462
,849
5.9%
5.7%
%
of I
ncom
e12
.0%
12.3
%U
AM
6,44
7$1
6,26
5,57
6$2
,546
,463
$499
,999
$3,0
46,4
627,
210
$18,
663,
395
$1,9
09,0
93$4
89,6
34$2
,398
,727
-21.
3%11
.8%
%
of I
ncom
e18
.7%
12.9
%U
APB
6,
271
$17,
837,
577
$1,5
59,6
35$4
98,7
55$2
,058
,390
6,67
6$1
9,15
3,17
9$2
,029
,765
$420
,980
$2,4
50,7
4519
.1%
6.5%
%
of I
ncom
e11
.5%
12.8
%U
CA
7,
889
$81,
892,
796
$8,5
54,8
70$4
60,3
45$9
,015
,215
8,22
4$8
4,26
5,71
7$9
,058
,494
$458
,417
$9,5
16,9
115.
6%4.
3%
% o
f Inc
ome
11.0
%11
.3%
Tota
l$7
5,10
9$7
03,4
91,2
92$5
4,71
0,00
3$3
,815
,552
$58,
525,
555
$79,
056
$742
,335
,108
$64,
377,
950
$4,1
22,0
79$6
8,50
0,02
917
.0%
%
of I
ncom
e8.
3%9.
2%*A
cade
mic
and
Per
form
ance
sch
olar
ship
s aw
arde
d to
stu
dent
s w
ho q
ualify
for P
ell G
rant
s w
ere
excl
uded
in a
ccor
danc
e w
ith A
.C.A
. § 6
-80-
106.
2015
-16
2016
-17
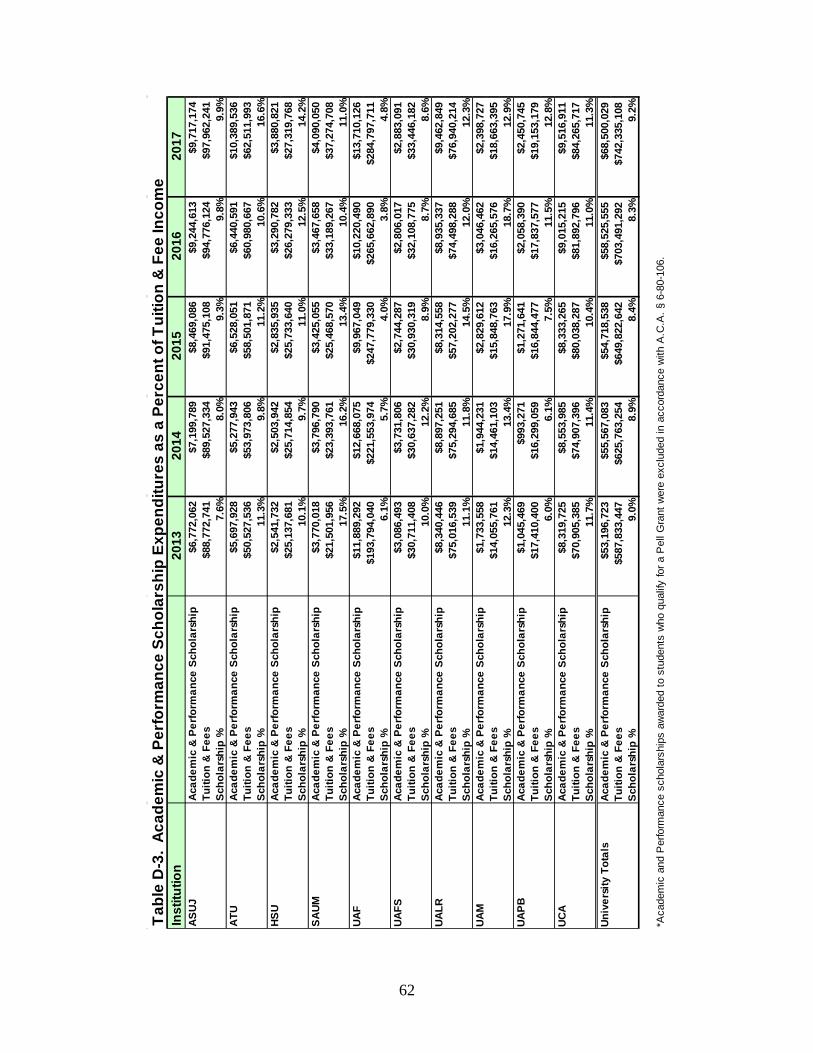
62
Inst
itutio
n20
1320
1420
1520
1620
17AS
UJAc
adem
ic &
Per
form
ance
Sch
olar
ship
$6,7
72,0
62$7
,199
,789
$8,4
69,0
86$9
,244
,613
$9,7
17,1
74Tu
ition
& F
ees
$88,
772,
741
$89,
527,
334
$91,
475,
108
$94,
776,
124
$97,
962,
241
Scho
lars
hip
%7.
6%8.
0%9.
3%9.
8%9.
9%AT
UAc
adem
ic &
Per
form
ance
Sch
olar
ship
$5,6
97,9
28$5
,277
,943
$6,5
28,0
51$6
,440
,591
$10,
389,
536
Tuiti
on &
Fee
s$5
0,52
7,53
6$5
3,97
3,80
6$5
8,50
1,87
1$6
0,98
0,66
7$6
2,51
1,99
3Sc
hola
rshi
p %
11.3
%9.
8%11
.2%
10.6
%16
.6%
HSU
Acad
emic
& P
erfo
rman
ce S
chol
arsh
ip$2
,541
,732
$2,5
03,9
42$2
,835
,935
$3,2
90,7
82$3
,880
,821
Tuiti
on &
Fee
s$2
5,13
7,68
1$2
5,71
4,85
4$2
5,73
3,64
0$2
6,27
9,33
3$2
7,31
9,76
8Sc
hola
rshi
p %
10.1
%9.
7%11
.0%
12.5
%14
.2%
SAUM
Acad
emic
& P
erfo
rman
ce S
chol
arsh
ip$3
,770
,018
$3,7
96,7
90$3
,425
,055
$3,4
67,6
58$4
,090
,050
Tuiti
on &
Fee
s$2
1,50
1,95
6$2
3,39
3,76
1$2
5,46
8,57
0$3
3,18
9,26
7$3
7,27
4,70
8Sc
hola
rshi
p %
17.5
%16
.2%
13.4
%10
.4%
11.0
%UA
FAc
adem
ic &
Per
form
ance
Sch
olar
ship
$11,
889,
292
$12,
668,
075
$9,9
67,0
49$1
0,22
0,49
0$1
3,71
0,12
6Tu
ition
& F
ees
$193
,794
,040
$221
,553
,974
$247
,779
,330
$265
,662
,890
$284
,797
,711
Scho
lars
hip
%6.
1%5.
7%4.
0%3.
8%4.
8%UA
FSAc
adem
ic &
Per
form
ance
Sch
olar
ship
$3,0
86,4
93$3
,731
,806
$2,7
44,2
87$2
,806
,017
$2,8
83,0
91Tu
ition
& F
ees
$30,
711,
408
$30,
637,
282
$30,
930,
319
$32,
108,
775
$33,
446,
182
Scho
lars
hip
%10
.0%
12.2
%8.
9%8.
7%8.
6%UA
LRAc
adem
ic &
Per
form
ance
Sch
olar
ship
$8,3
40,4
46$8
,897
,251
$8,3
14,5
58$8
,935
,337
$9,4
62,8
49Tu
ition
& F
ees
$75,
016,
539
$75,
294,
685
$57,
202,
277
$74,
498,
288
$76,
940,
214
Scho
lars
hip
%11
.1%
11.8
%14
.5%
12.0
%12
.3%
UAM
Acad
emic
& P
erfo
rman
ce S
chol
arsh
ip$1
,733
,558
$1,9
44,2
31$2
,829
,612
$3,0
46,4
62$2
,398
,727
Tuiti
on &
Fee
s$1
4,05
5,76
1$1
4,46
1,10
3$1
5,84
8,76
3$1
6,26
5,57
6$1
8,66
3,39
5Sc
hola
rshi
p %
12.3
%13
.4%
17.9
%18
.7%
12.9
%UA
PBAc
adem
ic &
Per
form
ance
Sch
olar
ship
$1,0
45,4
69$9
93,2
71$1
,271
,641
$2,0
58,3
90$2
,450
,745
Tuiti
on &
Fee
s$1
7,41
0,40
0$1
6,29
9,05
9$1
6,84
4,47
7$1
7,83
7,57
7$1
9,15
3,17
9Sc
hola
rshi
p %
6.0%
6.1%
7.5%
11.5
%12
.8%
UCA
Acad
emic
& P
erfo
rman
ce S
chol
arsh
ip$8
,319
,725
$8,5
53,9
85$8
,333
,265
$9,0
15,2
15$9
,516
,911
Tuiti
on &
Fee
s$7
0,90
5,38
5$7
4,90
7,39
6$8
0,03
8,28
7$8
1,89
2,79
6$8
4,26
5,71
7Sc
hola
rshi
p %
11.7
%11
.4%
10.4
%11
.0%
11.3
%Un
iver
sity
Tot
als
Acad
emic
& P
erfo
rman
ce S
chol
arsh
ip$5
3,19
6,72
3$5
5,56
7,08
3$5
4,71
8,53
8$5
8,52
5,55
5$6
8,50
0,02
9Tu
ition
& F
ees
$587
,833
,447
$625
,763
,254
$649
,822
,642
$703
,491
,292
$742
,335
,108
Scho
lars
hip
%9.
0%8.
9%8.
4%8.
3%9.
2%
*Aca
dem
ic a
nd P
erfo
rman
ce s
chol
arsh
ips
awar
ded
to s
tude
nts
who
qua
lify
for a
Pel
l Gra
nt w
ere
excl
uded
in a
ccor
danc
e w
ith A
.C.A
. § 6
-80-
106.
Tabl
e D
-3.
Acad
emic
& P
erfo
rman
ce S
chol
arsh
ip E
xpen
ditu
res
as a
Per
cent
of T
uitio
n &
Fee
Inco
me

63
Appendix E: FAP Summary

64
Institution E&G Sq Ft
E&G Replacement
Value
E&G Maintenance
NeedsE&G Critical Maintenance E&G FCI
ASUJ 2,255,000 $426,228,969 $246,840,637 $18,353,149 57.9%ATU 1,115,770 216,562,207 $122,897,259 $2,984,742 56.7%HSU 712,896 $139,704,585 $91,198,570 $8,027,364 65.3%SAUM 821,252 $167,334,641 $88,897,799 $4,219,081 53.1%UAF 4,360,349 $837,693,619 $454,268,430 $33,940,925 54.2%UAFS 875,121 $171,336,619 $73,041,151 $2,916,322 42.6%UALR 2,090,352 $410,036,228 $264,884,133 $66,237,148 64.6%UAM 717,626 135,620,565 $85,619,525 $13,425,605 63.1%UAPB 958,085 $190,228,349 $75,181,873 $1,510,729 39.5%UCA 1,482,314 $287,181,991 $182,678,520 $13,365,000 63.6%UNIV TOTAL 15,388,765 $2,981,927,773 $1,685,507,896 $164,980,063 56.5%
ANC 346,470 $65,575,432 $17,783,280 $3,469,198 27.1%ASUB 613,260 $111,538,827 $53,665,711 $1,067,000 48.1%ASUMH 218,842 $41,643,311 $11,042,520 $915,834 26.5%ASUMS 366,659 $69,828,055 $22,901,060 $200,000 32.8%ASUN 317,945 $61,164,158 $16,960,060 $225,000 27.7%BRTC 354,991 $66,865,455 $19,254,235 $145,000 28.8%CCCUA 219,869 $41,271,223 $14,809,423 $516,119 35.9%CotO 152,532 $29,445,959 $10,129,385 $464,644 34.4%EACC 209,306 $40,014,531 $14,491,732 $323,471 36.2%NAC 282,036 $54,536,233 $23,310,320 $5,155,368 42.7%NPC 341,805 $64,717,494 $23,489,753 $1,051,127 36.3%NWACC 466,147 $95,368,516 $24,373,135 $0 25.6%OZC 170,690 $34,209,915 $11,810,421 $21,802 34.5%PCCUA 460,622 $86,179,506 $45,649,445 $1,578,500 53.0%PTC 777,152 $152,842,556 $27,878,886 $2,144,273 18.2%RMCC 143,107 $26,573,165 $4,431,788 $434,297 16.7%SACC 250,677 $46,327,935 $21,617,187 $690,483 46.7%SAUT 395,950 67,268,373 $37,507,702 $648,831 55.8%SEAC 247,883 $48,210,810 $16,338,991 $895,346 33.9%UACCB 163,141 $30,804,971 $8,483,132 $3,285,334 27.5%UACCH 261,986 $52,141,972 $11,638,166 $580,120 22.3%UACCM 272,118 $50,580,049 $20,150,974 $449,689 39.8%COLLEGE TOTAL 7,033,188 $1,337,108,446 $457,717,306 $24,261,436 34.2%
ATU-Ozark 120,917 $23,465,896 $9,663,496 $251,000 41.2%UAM-Crosset 50,679 $10,117,207 $5,340,843 $426,403 52.8%UAM-McGehee 54,667 $10,303,092 $6,833,905 $738,484 66.3%TECH INST TOTAL 226,263 $43,886,195 $21,838,245 $1,415,887 49.8%
UAMS 4,821,791 $1,020,595,713 $536,287,804 $20,295,000 52.5%AES 1,181,199 $145,991,242 $69,170,952 $451,922 47.4%CES 166,379 $24,117,073 $10,704,612 $261,942 44.4%UA-AAS 29,000 $6,670,000 $3,802,627 $43,500 57.0%UA-SYS 31,838 $5,194,636 $2,060,156 $114,500 39.7%SAUT-ECA 12,200 $2,403,400 $750,359 $6,902 31.2%SAUT-FTA 64,947 $8,648,278 $2,726,340 $34,512 31.5%NON-FORMULA TOTAL 6,307,354 $1,213,620,342 $625,502,850 $21,208,278 51.5%
GRAND TOTAL 28,955,570 5,576,542,756 2,790,566,297 211,865,665 50.0%
Facilities Audit 2016 Summary

65
Appendix F:
Bonds and Loans Approved by
AHECB 2007-2017

66
Institution
Date of AHECB
Approval Maximum Total of Issue Terms Project Description Type of ProjectASU Oct-07 $10,000,000 25 yrs / 5.25% E&G purposes on the campuses at Searcy, Mountain Home, and Newport. E&G
NAC Oct-07 $4,700,000 30 yrs / 4.85%E&G purposes to constructrefund outstanding bonds, renovate the L.E. “Gene” Durand Conference Center and for various other capital improvements. E&G
SAUM Oct-07 $14,000,000 30 yrs / 4.5%E&G purposes to construct a new science facility and for various other academic and administrative construction needs. E&G
ATU Feb-08 $3,300,000 30 yrs / 5% E&G purposes for the Physical Plant. E&GATU Feb-08 $2,000,000 30 yrs / 4.6% Auxiliary purposes for Campus Courts Housing. Auxiliary
CCCUA Feb-08 $2,000,000 15 yrs / 3.2%Loan for E&G purposes to construct the Ashdown Center, agriculture facility, Fine Arts classroom facility. E&G
NPCC Feb-08 $3,800,000 30 yrs / 4.75% E&G purposes to construct Nursing & Health Sciences Building. E&G
ATU-Ozark Apr-08 $2,130,000 30 yrs / 5%E&G purposes to construct student services facility and for various other capital improvements on the Ozark Campus. E&G
ATU Apr-08 $8,000,000 30 yrs / 5%E&G purposes to construct an academic/advising facility and for various other capital improvements. E&G
UAF Apr-08 $6,150,000 20 yrs/ 5.1% E&G purposes to renovate space for KUAF and for the purchase of property. E&G
UAF Apr-08 $44,850,0000-30 yrs/ 5.1-5.9%
Auxiliary purposes to construct a 1500-space parking garage with student-oriented retail space and a surface parking lot; to finance improvements to the Harmon Avenue Parking Garage; and to purchase properties for the facilities. Auxiliary
SAU May-08 $6,345,000 30 yrs./ 5.5%E&G purposes to construct a new student activity/recreation center and for various other academic and administrative construction needs. E&G
ATU Jul-08 $2,150,000 30 yrs / 5% Auxiliary purposes to fund the renovation of Critz and Hughes Hall. AuxiliaryUACCH Jul-08 $2,700,000 30 yrs / 5% E&G purposes to complete financing for the Science/Technology Center. E&G
PCCUA Jul-08 $12,305,000 30 yrs / 5%E&G purposes to refund the 1997 bond issue and complete financing for the Grand Prairie Center on the Stuttgart campus. E&G
UAF Jul-08 $5,000,000 5 yrs/ 5% Auxiliary loan used for renovations to various athletic facilities. AuxiliaryUCA Oct-08 $6,000,000 1 yr/ 4.59% E&G loan/line-of-credit for operational purposes. E&G
ASU-SYS Jan-09 $9,500,000 30 yrs/ 5.5%
Auxiliary purposes to construct and furnish two new 50-bed residence halls, construct a commons building for an existing campus apartment complex, and deferred maintenance projects in existing residence halls. Auxiliary
UAFS Jan-09 $24,540,000 25 yrs/ 6.05% Auxiliary purposes to construct and equip a 400-bed student housing complex. Auxiliary
UAM Jan-09 $1,000,000 10 yrs/ .53%E&G purposes to fund deferred maintenance and energy savings projects on the Monticello campus. E&G
ATU Apr-09 $5,120,000 30 yrs/ 5.25%E&G purposes to expand the engineering building, purchase academic facilities, expand the science building, and various other capital improvements. E&G
SAU Apr-09 $2,000,000 30 yrs/ 5.5% E&G purposes to renovate and update current academic and administrative facilities. E&GUCA May-09 $6,000,000 1 yr/ 4.96% E&G loan/line-of-credit for operational purposes. E&GSACC Jul-09 $3,590,000 30 yrs / 5% E&G purposes to construct a Health Sciences building. E&GASUMH Jul-09 $2,500,000 20 yrs/ 5.5% E&G purposes to construct a Community Development Center. E&G
NWACC Jul-09 $10,660,000 30 yrs / 5%E&G purposes to purchase property adjacent to the main campus as an extension of education and general instructional space and offices. E&G
UALR Sep-09 $34,750,000 20 yrs/ 5.5%
E&G purposes to acquire, construct, and equip a variety of capital improvements at UALR, including (i) completion of the Engineering and Information Technology Building, (ii) elevator upgrades; (iii) renovations to the Stella Boyle Smith Concert Hall, (iv) construction of a Nanotechnology Sciences Center, (v) construction of a Student Services One-Stop Center, (vi) renovation of an existing building for Health and Wellness Academic Programs. E&G
UALR Oct-09 $30,000,000 25 yrs/ 4.5%Auxiliary purposes to construct and equip a housing complex and construct a student recreation and sports complex. Auxiliary
SAU Oct-09 $10,310,000 30 yrs/ 4.85%Auxiliary purposes to refund the 1999, 2001 and 2003 auxiliary issues, auxiliary construction purposes and other various capital improvements. Auxiliary
OZC Oct-09 $3,600,000 30 yrs/ 4.8%E&G purposes to refund a previous bond issue and construct an educational facility at the Mtn. View location. E&G
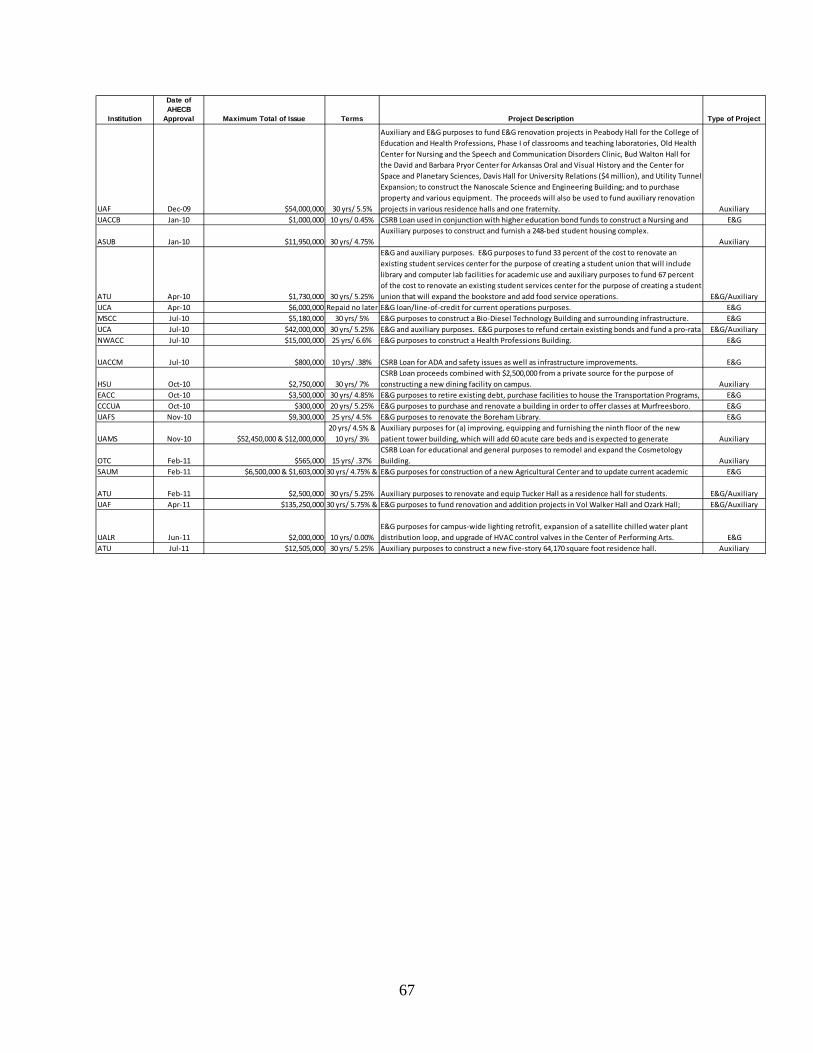
67
Institution
Date of AHECB
Approval Maximum Total of Issue Terms Project Description Type of Project
UAF Dec-09 $54,000,000 30 yrs/ 5.5%
Auxiliary and E&G purposes to fund E&G renovation projects in Peabody Hall for the College of Education and Health Professions, Phase I of classrooms and teaching laboratories, Old Health Center for Nursing and the Speech and Communication Disorders Clinic, Bud Walton Hall for the David and Barbara Pryor Center for Arkansas Oral and Visual History and the Center for Space and Planetary Sciences, Davis Hall for University Relations ($4 million), and Utility Tunnel Expansion; to construct the Nanoscale Science and Engineering Building; and to purchase property and various equipment. The proceeds will also be used to fund auxiliary renovation projects in various residence halls and one fraternity. Auxiliary
UACCB Jan-10 $1,000,000 10 yrs/ 0.45% CSRB Loan used in conjunction with higher education bond funds to construct a Nursing and E&G
ASUB Jan-10 $11,950,000 30 yrs/ 4.75%Auxiliary purposes to construct and furnish a 248-bed student housing complex.
Auxiliary
ATU Apr-10 $1,730,000 30 yrs/ 5.25%
E&G and auxiliary purposes. E&G purposes to fund 33 percent of the cost to renovate an existing student services center for the purpose of creating a student union that will include library and computer lab facilities for academic use and auxiliary purposes to fund 67 percent of the cost to renovate an existing student services center for the purpose of creating a student union that will expand the bookstore and add food service operations. E&G/Auxiliary
UCA Apr-10 $6,000,000 Repaid no later E&G loan/line-of-credit for current operations purposes. E&GMSCC Jul-10 $5,180,000 30 yrs/ 5% E&G purposes to construct a Bio-Diesel Technology Building and surrounding infrastructure. E&GUCA Jul-10 $42,000,000 30 yrs/ 5.25% E&G and auxiliary purposes. E&G purposes to refund certain existing bonds and fund a pro-rata E&G/AuxiliaryNWACC Jul-10 $15,000,000 25 yrs/ 6.6% E&G purposes to construct a Health Professions Building. E&G
UACCM Jul-10 $800,000 10 yrs/ .38% CSRB Loan for ADA and safety issues as well as infrastructure improvements. E&G
HSU Oct-10 $2,750,000 30 yrs/ 7%CSRB Loan proceeds combined with $2,500,000 from a private source for the purpose of constructing a new dining facility on campus. Auxiliary
EACC Oct-10 $3,500,000 30 yrs/ 4.85% E&G purposes to retire existing debt, purchase facilities to house the Transportation Programs, E&GCCCUA Oct-10 $300,000 20 yrs/ 5.25% E&G purposes to purchase and renovate a building in order to offer classes at Murfreesboro. E&GUAFS Nov-10 $9,300,000 25 yrs/ 4.5% E&G purposes to renovate the Boreham Library. E&G
UAMS Nov-10 $52,450,000 & $12,000,00020 yrs/ 4.5% &
10 yrs/ 3%Auxiliary purposes for (a) improving, equipping and furnishing the ninth floor of the new patient tower building, which will add 60 acute care beds and is expected to generate Auxiliary
OTC Feb-11 $565,000 15 yrs/ .37%CSRB Loan for educational and general purposes to remodel and expand the Cosmetology Building. Auxiliary
SAUM Feb-11 $6,500,000 & $1,603,000 30 yrs/ 4.75% & E&G purposes for construction of a new Agricultural Center and to update current academic E&G
ATU Feb-11 $2,500,000 30 yrs/ 5.25% Auxiliary purposes to renovate and equip Tucker Hall as a residence hall for students. E&G/AuxiliaryUAF Apr-11 $135,250,000 30 yrs/ 5.75% & E&G purposes to fund renovation and addition projects in Vol Walker Hall and Ozark Hall; E&G/Auxiliary
UALR Jun-11 $2,000,000 10 yrs/ 0.00%E&G purposes for campus-wide lighting retrofit, expansion of a satellite chilled water plant distribution loop, and upgrade of HVAC control valves in the Center of Performing Arts. E&G
ATU Jul-11 $12,505,000 30 yrs/ 5.25% Auxiliary purposes to construct a new five-story 64,170 square foot residence hall. Auxiliary

68
Institution
Date of AHECB
Approval Maximum Total of Issue Terms Project Description Type of Project
PTC Sep-11 $71,000,000 30 yrs/ 4.65%
E&G purposes to refund approximately $26million in existing debt & to construct and equip a 100,000 square foot Fine and Performing Arts/Humanities Center and a 30,000 square foot Culinary Arts and Hospitality Management Center. E&G
UACCH Oct-11 $1,100,000 10 yrs/ .20% E&G purposes for the construction of an Instruction Services Center at Texarkana, Arkansas. E&G
UAFS Oct-11 $2,200,000 10 yrs/ 0.00%
E&G purposes of the loan will be used to fund infrastructure upgrades an the UAFS campus, including the creation of a central energy plant to provide district cooling and district heating to various campus facilities and a campus lighting retrofit. E&G
UCA Oct-11 $15,500,000 30 yrs/ 5.50%Auxiliary purposes for the expansion of the Health, Physical Education, and Recreation Center (HPER). Auxiliary
ASUJ Jan-12 $19,640,000 30 yrs/ 5.50%
Auxiliary purposes of acquiring, constructing and equipping new housing facilities including Greek housing facilities and a new honors dormitory and for improvements to Kays Hall dormitory including heating, ventilation and air conditioning (HVAC) system. Auxiliary
ASUN Jan-12 $2,000,000 15 yrs/ 4.00%E&G purposes to fund the construction of a classroom building on the Arkansas State University - Newport Technical Center - Jonesboro campus. E&G
MSCC Apr-12 $19,500,000 30 yrs/ 3.75%
E&G purposes to refund Series 2007 bond issue and to use balance of proceeds in the acquisition, construction, equipping and furnishing a Wellness Center and FEMA Storm Shelter at the college. E&G
UALR Apr-12 $16,000,000 25 yrs/ 4.50%Auxiliary purposes to acquire a 420-bed apartment complex located adjacent to the university's sports and recreation complex. Auxiliary
UAMS Apr-12 $10,650,000 30 yrs/ 4.25%Auxiliary purposes to acquire Central Arkansas Radiation Therapy Institute's Facilities and equipment located on the campus of UAMS. Auxiliary
ATU Apr-12 $1,500,000 30 yrs/ 5.00%Auxiliary purposes to construct, equip and rehabilitate various athletic facilities on the campus of Arkansas Tech University in Russellville, Arkansas. Auxiliary
SAUM Apr-12 $6,000,000 30 yrs/ 5.00%Auxiliary purposes for the construction of a 60 bed apartment complex and for other auxiliary purposes. Auxiliary
SAUT Apr-12 $6,000,000 30 yrs/ 5.00%E&G purposes to acquire, construct, and equip a multipurpose student facility and to make additional renovations to educational and general facilities on the East-Camden campus. E&G
RMCC Jun-12 $6,700,000 30 yrs/ 4.95%E&G purposes to retire existing debt and construct library, classroom, lab and meeting space on the campus of Rich Mountain Community College in Mena, Arkansas. E&G
UAF Jun-12 $72,000,000 30 yrs/ 5.50% Various E&G and auxiliary purposes. E&G/AuxiliaryUAMS Jun-12 $60,000,000 7 yrs/ 2.00% Loan - to acquire the Epic integrated clinical information system. E&G/Auxiliary
NAC Jul-12 $3,500,000 25 yrs/ 4.75% E&G purposes to construct, equip and furnish a science building. E&G
UCA Jul-12 $12,500,000 24 yrs/ 4.50%Auxiliary purposes to purchase Bear Village, a 600-bed apartment complex owned by the UCA Foundation and leased by UCA. Auxiliary
ASUJ Oct-12 $7,300,000 30 yrs/ 5.00%Auxiliary purposes for the completion of new housing facilities including Greek housing facilities and a new honors dormitory and for improvements to the Kays Hall dormitory, Auxiliary
ATU Oct-12 $6,000,000 30 yrs/ 5.25% Auxiliary purposes to renovate and expand Chambers Cafeteria. Auxiliary
OZC Oct-12 $3,000,000 30 yrs/ 4.50%E&G purposes to construct, equip and furnish a student services building on the Melbourne campus, establish pedestrian walkways and additional parking facilities. E&G
UAM Oct-12 $8,990,000 25 yrs/ 4.50% Auxiliary purposes to renovate residence halls. Auxiliary
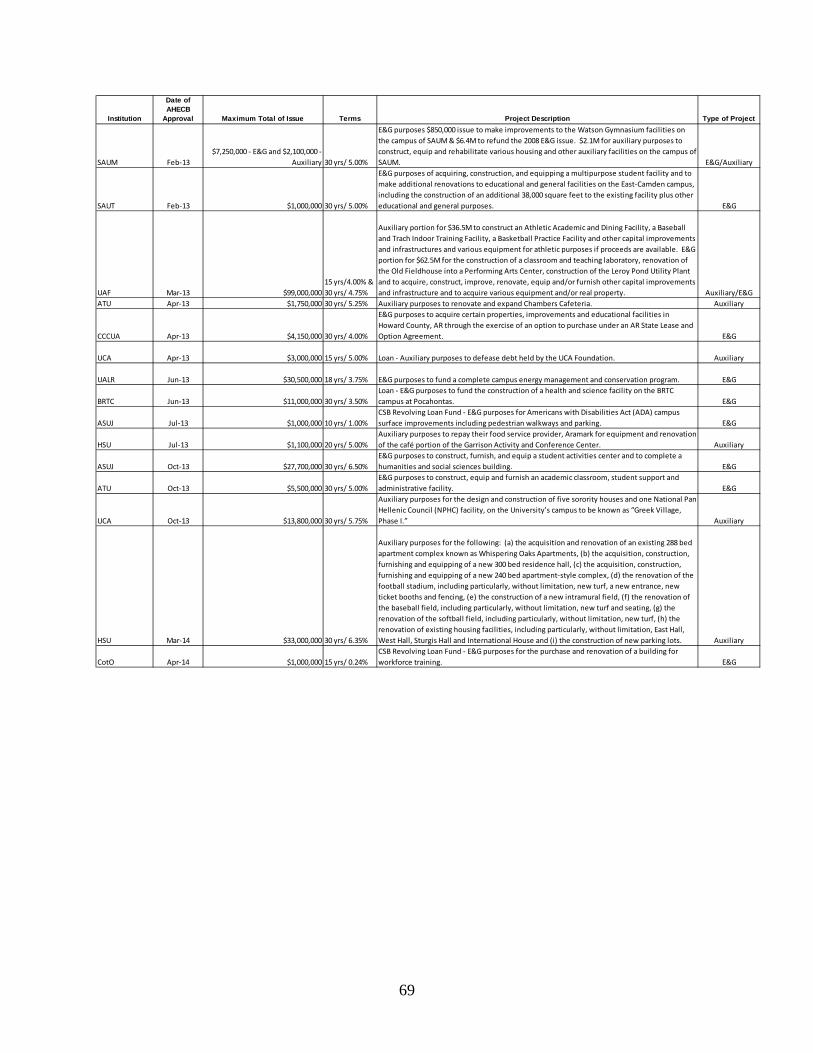
69
Institution
Date of AHECB
Approval Maximum Total of Issue Terms Project Description Type of Project
SAUM Feb-13$7,250,000 - E&G and $2,100,000 -
Auxiliary 30 yrs/ 5.00%
E&G purposes $850,000 issue to make improvements to the Watson Gymnasium facilities on the campus of SAUM & $6.4M to refund the 2008 E&G issue. $2.1M for auxiliary purposes to construct, equip and rehabilitate various housing and other auxiliary facilities on the campus of SAUM. E&G/Auxiliary
SAUT Feb-13 $1,000,000 30 yrs/ 5.00%
E&G purposes of acquiring, construction, and equipping a multipurpose student facility and to make additional renovations to educational and general facilities on the East-Camden campus, including the construction of an additional 38,000 square feet to the existing facility plus other educational and general purposes. E&G
UAF Mar-13 $99,000,00015 yrs/4.00% & 30 yrs/ 4.75%
Auxiliary portion for $36.5M to construct an Athletic Academic and Dining Facility, a Baseball and Trach Indoor Training Facility, a Basketball Practice Facility and other capital improvements and infrastructures and various equipment for athletic purposes if proceeds are available. E&G portion for $62.5M for the construction of a classroom and teaching laboratory, renovation of the Old Fieldhouse into a Performing Arts Center, construction of the Leroy Pond Utility Plant and to acquire, construct, improve, renovate, equip and/or furnish other capital improvements and infrastructure and to acquire various equipment and/or real property. Auxiliary/E&G
ATU Apr-13 $1,750,000 30 yrs/ 5.25% Auxiliary purposes to renovate and expand Chambers Cafeteria. Auxiliary
CCCUA Apr-13 $4,150,000 30 yrs/ 4.00%
E&G purposes to acquire certain properties, improvements and educational facilities in Howard County, AR through the exercise of an option to purchase under an AR State Lease and Option Agreement. E&G
UCA Apr-13 $3,000,000 15 yrs/ 5.00% Loan - Auxiliary purposes to defease debt held by the UCA Foundation. Auxiliary
UALR Jun-13 $30,500,000 18 yrs/ 3.75% E&G purposes to fund a complete campus energy management and conservation program. E&G
BRTC Jun-13 $11,000,000 30 yrs/ 3.50%Loan - E&G purposes to fund the construction of a health and science facility on the BRTC campus at Pocahontas. E&G
ASUJ Jul-13 $1,000,000 10 yrs/ 1.00%CSB Revolving Loan Fund - E&G purposes for Americans with Disabilities Act (ADA) campus surface improvements including pedestrian walkways and parking. E&G
HSU Jul-13 $1,100,000 20 yrs/ 5.00%Auxiliary purposes to repay their food service provider, Aramark for equipment and renovation of the café portion of the Garrison Activity and Conference Center. Auxiliary
ASUJ Oct-13 $27,700,000 30 yrs/ 6.50%E&G purposes to construct, furnish, and equip a student activities center and to complete a humanities and social sciences building. E&G
ATU Oct-13 $5,500,000 30 yrs/ 5.00%E&G purposes to construct, equip and furnish an academic classroom, student support and administrative facility. E&G
UCA Oct-13 $13,800,000 30 yrs/ 5.75%
Auxiliary purposes for the design and construction of five sorority houses and one National Pan-Hellenic Council (NPHC) facility, on the University’s campus to be known as “Greek Village, Phase I.” Auxiliary
HSU Mar-14 $33,000,000 30 yrs/ 6.35%
Auxiliary purposes for the following: (a) the acquisition and renovation of an existing 288 bed apartment complex known as Whispering Oaks Apartments, (b) the acquisition, construction, furnishing and equipping of a new 300 bed residence hall, (c) the acquisition, construction, furnishing and equipping of a new 240 bed apartment-style complex, (d) the renovation of the football stadium, including particularly, without limitation, new turf, a new entrance, new ticket booths and fencing, (e) the construction of a new intramural field, (f) the renovation of the baseball field, including particularly, without limitation, new turf and seating, (g) the renovation of the softball field, including particularly, without limitation, new turf, (h) the renovation of existing housing facilities, including particularly, without limitation, East Hall, West Hall, Sturgis Hall and International House and (i) the construction of new parking lots. Auxiliary
CotO Apr-14 $1,000,000 15 yrs/ 0.24%CSB Revolving Loan Fund - E&G purposes for the purchase and renovation of a building for workforce training. E&G
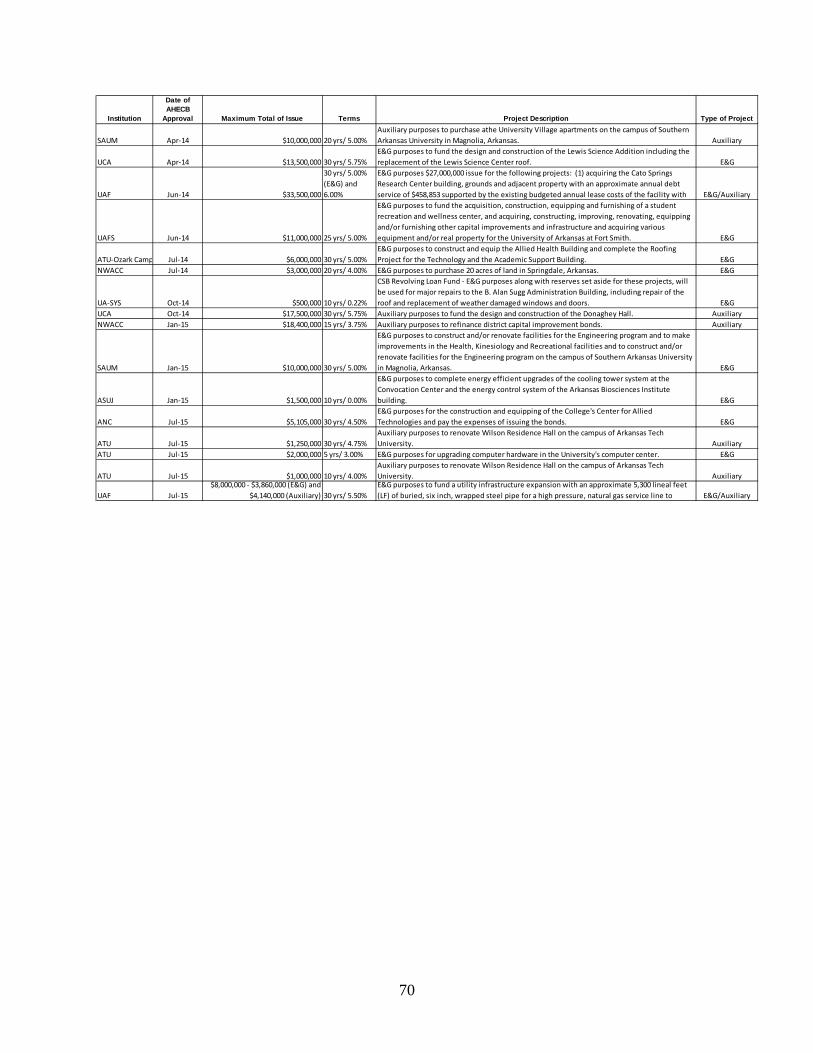
70
Institution
Date of AHECB
Approval Maximum Total of Issue Terms Project Description Type of Project
SAUM Apr-14 $10,000,000 20 yrs/ 5.00%Auxiliary purposes to purchase athe University Village apartments on the campus of Southern Arkansas University in Magnolia, Arkansas. Auxiliary
UCA Apr-14 $13,500,000 30 yrs/ 5.75%E&G purposes to fund the design and construction of the Lewis Science Addition including the replacement of the Lewis Science Center roof. E&G
UAF Jun-14 $33,500,000
30 yrs/ 5.00% (E&G) and 6.00%
E&G purposes $27,000,000 issue for the following projects: (1) acquiring the Cato Springs Research Center building, grounds and adjacent property with an approximate annual debt service of $458,853 supported by the existing budgeted annual lease costs of the facility with E&G/Auxiliary
UAFS Jun-14 $11,000,000 25 yrs/ 5.00%
E&G purposes to fund the acquisition, construction, equipping and furnishing of a student recreation and wellness center, and acquiring, constructing, improving, renovating, equipping and/or furnishing other capital improvements and infrastructure and acquiring various equipment and/or real property for the University of Arkansas at Fort Smith. E&G
ATU-Ozark Camp Jul-14 $6,000,000 30 yrs/ 5.00%E&G purposes to construct and equip the Allied Health Building and complete the Roofing Project for the Technology and the Academic Support Building. E&G
NWACC Jul-14 $3,000,000 20 yrs/ 4.00% E&G purposes to purchase 20 acres of land in Springdale, Arkansas. E&G
UA-SYS Oct-14 $500,000 10 yrs/ 0.22%
CSB Revolving Loan Fund - E&G purposes along with reserves set aside for these projects, will be used for major repairs to the B. Alan Sugg Administration Building, including repair of the roof and replacement of weather damaged windows and doors. E&G
UCA Oct-14 $17,500,000 30 yrs/ 5.75% Auxiliary purposes to fund the design and construction of the Donaghey Hall. AuxiliaryNWACC Jan-15 $18,400,000 15 yrs/ 3.75% Auxiliary purposes to refinance district capital improvement bonds. Auxiliary
SAUM Jan-15 $10,000,000 30 yrs/ 5.00%
E&G purposes to construct and/or renovate facilities for the Engineering program and to make improvements in the Health, Kinesiology and Recreational facilities and to construct and/or renovate facilities for the Engineering program on the campus of Southern Arkansas University in Magnolia, Arkansas. E&G
ASUJ Jan-15 $1,500,000 10 yrs/ 0.00%
E&G purposes to complete energy efficient upgrades of the cooling tower system at the Convocation Center and the energy control system of the Arkansas Biosciences Institute building. E&G
ANC Jul-15 $5,105,000 30 yrs/ 4.50%E&G purposes for the construction and equipping of the College's Center for Allied Technologies and pay the expenses of issuing the bonds. E&G
ATU Jul-15 $1,250,000 30 yrs/ 4.75%Auxiliary purposes to renovate Wilson Residence Hall on the campus of Arkansas Tech University. Auxiliary
ATU Jul-15 $2,000,000 5 yrs/ 3.00% E&G purposes for upgrading computer hardware in the University's computer center. E&G
ATU Jul-15 $1,000,000 10 yrs/ 4.00%Auxiliary purposes to renovate Wilson Residence Hall on the campus of Arkansas Tech University. Auxiliary
UAF Jul-15$8,000,000 - $3,860,000 (E&G) and
$4,140,000 (Auxiliary) 30 yrs/ 5.50%E&G purposes to fund a utility infrastructure expansion with an approximate 5,300 lineal feet (LF) of buried, six inch, wrapped steel pipe for a high pressure, natural gas service line to E&G/Auxiliary

71
Institution
Date of AHECB
Approval Maximum Total of Issue Terms Project Description Type of Project
ASUJ Sep-15 $8,000,000 8 yrs/ 5.0%
Proceeds from the loan will be used to renovate and modernize Wilson Hall including the reconfiguration of building infrastructure for new laboratories and learning environments and safety, technology, and ADA improvements. E&G
UACCM Jan-16 $10,000,000 30 yrs/ 5.50%
E&G purposes to construct a Workforce Training Center (WTC) allowing UACCM to increase the capacity of several technical training programs including Welding, Automotive Technology, HVAC, Industrial Maintenance and add options that industry partners have suggested including Diesel Engine Technology. E&G
UAF Feb-16 $30,000,000 30 yrs/ 5.50%
E&G purposes to (1) fund the initial stage of the construction of an approximately 20,000 sq. ft. library storage facility; (2) continue the renovation of an addition of approximately 3,500 sq. ft. to Kimpel Hall; (3) to fund the initial stage of the construction of an approximately 25,000 sq. ft. Civil Engineering Research and Education Center; (4) complete the renovation of Discovery Hall with the addition of no new square footage; (5) construct five new campus entrance signs (no square footage); (6) pay for the initial design of the new University Recreation Intramural Sports Playing Fields with no new square footage constructed with this stage; and (7) fund the acquisition, construction, improvement, renovation, equipping and/or furnishing of other capital improvements and infrastructure and the acquisition of various equipment and/or real property if proceeds are available.
Auxiliary purposes to (1) renovate and construct an addition of approximately 5,668 sq. ft. to the Sigma Alpha Epsilon Fraternity; (2) fund the initial stage of construction of an approximately 20,000 sq. ft. addition to the Pat Walker Health Center; and (3) other capital improvements and infrastructure and various equipment for auxiliary purposes if proceeds are available. E&G/Auxiliary
NAC May-16 $1,800,000 15 yrs/2.7%E&G loan to finance an Energy Performance Project under the guidelines of the Arkansas Energy Performance Contracting (AEPC) Program overseen by the Arkansas Energy Office. E&G
UACCB Sep-16 $2,000,000 10 yrs/0.68%
CSB Revolving Loan Fund - E&G purposes to construct a Workforce Training Center including classrooms, offices, student lounge, clean lab, conference room, innovation hub, rest rooms, and a large open area for teaching workforce training courses/programs. E&G
SACC Sep-16 $2,500,000 15 yrs/2.05%E&G loan to finance an Energy Performance Project under the guidelines of the Arkansas Energy Performance Contracting (AEPC) Program overseen by the Arkansas Energy Office. E&G
UAF Sep-16 $120,000,000 20 yrs/5.50%
Auxiliary purposes to fund the Donald W. Reynolds Razorback Stadium project, which includes a north end zone expansion, improvements and updates to existing areas in the stadium, and replacement of the Broyles Athletic Center. Auxiliary
UALR Jan-17 $2,000,000 10 yrs/0.00%
E&G loan from the Arkansas Sustainable Building Design Revolving Loan Fund which is managed by the Arkansas Building Authority to complete energy efficient upgrades by expanding the campus-wide heated and chilled water loops. E&G
UAM Jan-17 $14,500,000 25 yrs/ 6.0%
E&G purposes $10.75M issue to fund the construction of a new Student Success Center needed for academic advising, career advising, counseling, testing, and enrollment services. As well as a new Police Station for the Monticello campus, a new Workforce Building on the Crossett campus, various ADA upgrades, roof repairs, and other critical maintenance needs for the Monticello campus.
$3.75M for auxiliary purposes will be used to renovate Horsfall Hall, to construct space for the relocation of the UAM Bookstore and to provide space for retail food service, which will also be housed in the new Student Success Center. E&G/Auxiliary
SAUM Jan-17 $8,000,000 30 yrs/ 4.50%
Auxiliary purposes to renovate and repurpose an existing building into a living/learning community style residence hall, and to construct and equip an additional residence hall, and other related auxiliary projects. Auxiliary
SAUM May-17 $1,060,000 10 yrs/ 3.60%
E&G purposes $500,000 issue to construct a facility that will serve as the president’s residence and official event’s facility.
$560,000 for auxiliary purposes will be used to purchase an apartment complexpreviously leased by the university at an annual rate of $103,398. E&G/Auxiliary
UAF Jun-17 $113,000,000 30 yrs/5.50%
E&G purposes $27.5 million to (1) continue the construction of an approximately 20,000 sq. ft. library storage facility; (2) continue the renovation of an addition of approximately 3,500 sq. ft. to Kimpel Hall; (3) begin the construction phase of an approximately 25,000 sq. ft. Civil Engineering Research and Education Center; (4) proceed with the first phase of construction of new intramural playing fields; (5) acquire, construct and equip improvements to the south campus steam and utility systems; and (6) fund the acquisition, construction, improvement, renovation, equipping and/or furnishing of other capital improvements and infrastructure and the acquisition of various equipment and/or real property if proceeds are available.
$85.5 million for auxiliary purposes to (1) construct, furnish and equip a 200,000 sq. ft. residence hall complex on the south side of campus; (2) continue with the construction of an approximately 20,000 sq. ft. addition to the Pat Walker Health Center; (3) complete the renovation of and construction of an addition of approximately 5,668 sq. ft. to the Sigma Alpha Epsilon Fraternity house; and (4) other capital improvements and infrastructure and various equipment for auxiliary purposes if proceeds are available. E&G/Auxiliary
UALR Jun-17 $7,500,000 25 yrs/5.50%
E&G purposes $27.5 milliom issue will be used for (1) the acquisition, construction, renovation, and equipping of the University Physics Building, (2) the acquisition, construction, renovation, and equipping campus-wide infrastructure upgrades, including particularly, without limitation, roof repairs and critical maintenance on the UA Little Rock campus, and (3) the acquisition, construction, improvement, renovation, equipping and/or real property for UA Little Rock. E&G
ASU-System Jul-17 $1,100,000 15 yrs/1.31%E&G purposes for ASUB and ASUN to construct a facility that will serve as the president’s residence and official event’s facility. E&G
ASU-System Jul-17 $1,250,000 10 yrs/ 0.00%
E&G purposes for ASUB and ASUN to provide needed campus-wide energy improvements to include lighting retrofits, water and waste management strategies, chiller upgrades as well as installation of other energy control mechanisms. E&G
UCA Jul-17 $8,500,000 30 yrs /5.50% Auxiliary purposes to fund the design and renovation of two housing facilities. Auxiliary
UA-RM Oct-17 $825,000 5 yrs/1.00%E&G purposes for renovation of the Abernathy Building (currently ongoing) and two (2) science labs (next summer). E&G
UAMS Oct-17 $30,000,000 10 yrs/ 5.00%Auxiliary purposes for capital renewal and deferred maintenance to replace electrical, mechanical, HVAC, elevators, and other equipment in buildings at the Little Rock campus. Auxiliary
Related Documents