1 Where Have All the Metals Gone? L. David Roper Department of Physics Virginia Polytechnic Institute and State University Blacksburg, Virginia 24060-0435 [email protected] 1976 TABLE OF CONTENTS Tables Figures Preface Chapter 1: The Minerals Crisis CHAPTER 2: Highly Depleted United States Metals Gold Platinum Group Mercury Manganese Ore Chromite Silver Lead Cadmium Zinc Tin Beryl Niobium-tantalum CHAPTER 3: Moderately Depleted United States Metals Tungsten Ore Selenium Tellurium Iron Ore Bauxite Titanium (Rutile) Titanium (Ilmenite) Vanadium Nickel CHAPTER 4: Depletion of United States Mineral Fuels Crude Oil Natural Gas Coal CHAPTER 5: Overview of United States Metals and Mineral-Fuels Depletion CHAPTER 6: Possible Futures for the United States Energy Materials Population References

Welcome message from author
This document is posted to help you gain knowledge. Please leave a comment to let me know what you think about it! Share it to your friends and learn new things together.
Transcript

1
Where Have All the Metals Gone?
L. David RoperDepartment of Physics
Virginia Polytechnic Institute and State UniversityBlacksburg, Virginia 24060-0435
TABLE OF CONTENTSTablesFiguresPreface
Chapter 1: The Minerals Crisis
CHAPTER 2: Highly Depleted United States MetalsGoldPlatinum GroupMercuryManganese OreChromiteSilverLeadCadmiumZincTinBerylNiobium-tantalum
CHAPTER 3: Moderately Depleted United States MetalsTungsten OreSeleniumTelluriumIron OreBauxiteTitanium (Rutile)Titanium (Ilmenite)VanadiumNickel
CHAPTER 4: Depletion of United States Mineral FuelsCrude OilNatural GasCoal
CHAPTER 5: Overview of United States Metals and Mineral-Fuels Depletion
CHAPTER 6: Possible Futures for the United StatesEnergyMaterialsPopulation
References

2
3
TablesTable 1. United States mineral reserves and identified resourcesTable 2. Depletion parameters for highly depleted United States metalsTable 3. Asymmetry classes for United States metals production dataTable 4. Depletion parameters for moderately depleted United States metalsTable 5. Depletion parameters for United States mineral fuelsTable 6. United States metals and mineral-fuels depletion parametersTable 7. United States minerals production and consumption percentages
FiguresFigure 1. World energy use rate versus time for exponential growth.Figure 2 Gold production data, fits and predictions.Figure 3 Platinum group production data, fits and predictions.Figure 4. Mercury production data, fit and prediction.Figure 5. Manganese ore production data, fits and predications.Figure 6. Chromite production data, fit, and prediction.Figure 7. Silver production data, fits and predications.Figure 8. Lead production data, fits and predictions.Figure 9. Cadmium production data, fits and predictions.Figure 10. Zinc production data, fits and predictions.Figure 11. Tungsten Ore production data, fits and predictions.Figure 12. Selenium production data, fit, and predictions.Figure 13. Tellurium production data, fits and predictions.Figure 14. Iron Ore production data, fits and predctions.Figure 15. Bauxite production data, fits and predictions.Figure 16. Titanium (futile) production data, fits and predictions.Figure 17. Titanium (ilmenite) production data, fits and predictionsFigure 18. Vanadium production data, fits and predictions.Figure 19. Nickel production data, fits and predictions.Figure 20. Crude-Oil production data, fits and predictions.Figure 21. Predicted crude-oil peak date as a function of data-cutoff date.Figure 22. Comparison of crude-oil predictions for different data-cutoff dates.Figure 23. Natural-gas production data, fits and predictions.Figure 24. Coal production data, fits and predictions.Figure 25. United States metals and mineral fuels peak dates.Figure 26. United States minerals import and recycle percentages.Figure 27. Exponential extrapolation of world populationFigure 28. Fits to world population.
4
PrefaceThis book is an interpretation and a simplification for a general audience of recently published metals and
minerals-fuels depletion research by Dr. Richard A. Arndt and myself.* While teaching a university course onenergy, I became uneasy about the methods authors of books and journal articles on energy were using toestimate the future availability of mineral fuels (crude oil, natural gas, and coal). Some were extrapolatingpresent production rates into the far distant future while others assumed that recent exponential growth inproduction rates would continue into the far distant future. Both methods are obviously wrong. Some authorshave more realistically assumed that production-rate growth must eventually slow, stop, and then productionrate will begin to decline as the mineral becomes harder to extract from the earth, i.e., as more energy andmaterials are required and more environmental degradation occurs in the extraction process.
But even in the realistic projections it was usually not obvious how the authors had arrived at their predictions.Some had used reserves estimates to delimit the amount of the mineral that would eventually be extracted.Since reserves estimates are notoriously variable depending on the methods of estimation, time of estimation,and the estimator; I was not satisfied with this approach either. It appeared to me that the best method is to fitthe yearly production-rate data with mathematical functions of time that have the kind of behavior that realismrequires, namely that the production rate must rapidly rise (probably exponentially), eventually peak, and thenfall (but probably not so rapidly as the original rise) asymptotically until the mineral is effectively depleted. Itwas not clear to me then that anyone had actually fitted production-rate data by means of standard statisticalleast-square-fit procedures, although Hubbert had for crude oil and natural gas. Being of independent minds,my colleague, Dr. Richard A. Arndt, and I used his highly refined computer least-square-fit code to fit UnitedStates oil and gas production-rate data.
The results of the oil and gas fits whetted our appetites and thus led us to fit United States metalsproduction-rates data and finally the world metals and mineral fuels production-rates data.
Having originally had very little knowledge about minerals depletion, we were greatly surprised to find thatapproximately three-fourths of the metals have apparently already peaked in production rate in the UnitedStates and one-fourth of the world metals have peaked. On the other hand, neither oil nor gas have peaked foreither the United States or the world, although oil and gas will peak very soon for the United States.
Some minerals specialists have regularly warned, beginning at east twenty-five years ago, that the UnitedStates was rapidly approaching a minerals-depletion crisis. The United States public has finally been shockedinto accepting this fact for oil and gas, thanks to some timely help from the Arabian oil producers. The fact thatthe United States is in a much more severe, in terms of production rates, metals “crisis” than it is in amineral-fuels crisis has not yet registered with the average citizen. And there does not appear to be a suddenshocker on the horizon to apprise the American public of this fact because the world metals producers are not sostrongly bound to concerted action by religion, conflict, or geography as are the world oil producers. Soperhaps it would be more faithful to the English language to use the term “metals-depletion problem” instead of“metals crisis” at least until the general public recognizes the severity of the problem.
There is perhaps another reason, besides the one given above, why the metals-depletion problem has notregistered in the public mind as much as the mineral-fuels depletion problem has. The crucial importance ofenergy to all motions and transformations of matter, including mining and processing of metals, and the lack ofa wide variety of mineral fuels and other presently available energy substitutes make the early stages ofmineral-fuels depletion much more traumatic than similar stages of metals depletion.
5
The current economic malaise in the United States, which must be strongly linked to decreasing productionrates of metals in the United States, would not be easily connected in the public mind to the metals-depletionproblem even if the public knew about the problem. I hope that this book will make some small contributiontoward making the general public aware of the metals-depletion problem and that some public spiritedeconomists or economic geologists will spend some effort at ferreting out, in terms the layman can understand,the connections between the metals depletion problem and the economic difficulties.
The author is grateful for the constant encouragement and help of Dr. Madan Gupta and for the help of Dr.Selim Sancactar in collecting the data.
* The mathematical details of the theory involved and the data used in carrying out this research are in Depletion of United Statesand World Mineral Resources. An abbreviated version of this research is available in paperback form, The Metals and Mineral FuelsCrises, Facts and Predictions. Both are published by University Publications, Blacksburg VA.
L. David Roper
6
Chapter 1. The Minerals CrisisIf this cycle continues long enough, basic resources will come into such short supply that rising costs will make their use in
additional production unprofitable, industrial expansion will cease, and we shall have reached the limit of growth. If this limit isreached unexpectedly, irreparable injury will have been done to the social order. – S. H. Ordway, Jr., Resources and the AmericanDream, The Ronald Press Co., New York, 1953.
DEPLETION DEBATE
About two decades ago a quiet, but very important, controversy concerning the amount of crude oil availablefor extraction in the United States began among geologists.1 A few, notably Hubbert2, warned that the UnitedStates was dangerously near the inevitable peak in oil production while most held to the conventional mineralsplatitude that, if prices are allowed to continually rise, the amount available for extraction will continually rise.
Hubbert presented quantitative predictions for U. S. crude oil production that have proved to be quite accurate.Others besides Hubbert also sounded alarms concerning minerals depletion. For example, Steidle3 wrote in1952
It appears unlikely, therefore, that domestic petroleum products will a major factor in the overall energy supply 50 years hence oreven 25 years hence.
and
In times of national emergency it would seem politically unwise to place much dependence on the importation of oil from Asia.
and
Domestic resources of the principal alloying elements in steel production will have reached a state of serious near-depletion inanother 50 years, with the exception of silicon and molybdenum.
In Chapter 4 are presented the recent crude oil and natural gas predictions of Arndt and Roper4 which are verysimilar to, although slightly more optimistic than, Hubbert's original predictions. Hubbert warned us twentyyears ago of the impending energy crisis, but we failed to listen.
Now a similar controversy is underway concerning depletion of metals and other nonfuel minerals. Forexample, Cook5 states
Depletion of geologic resources is real.
and
There is no endlessly retreating interface between ore and almost-ore which some optimists have described.
and
… without a substantial energy surplus that can be allocated to their exploitation, the nonenergy mineral resources do not exist, nomatter how much mineral is in the ground.
On the other side, which seems to be populated mostly by economists rather than geologists, Page6, forexample, states
There are no physical limits in resource extraction equivalent to 100 percent thermal efficiency in energy production.
and
7
The relative cost of minerals has remained roughly constant, and has not increased over the past eighty years as a consequence ofdiminishing returns. And new economically exploitable reserves are being discovered all the time.
This book contains a condensed version of the recent predictions7 concerning the depletion of metals andmineral fuels in the United States made by Arndt and Roper4. Only the reasonably certain U.S. predictions areincluded here. Also, the predictions labeled “pessimistic” in Arndt and Roper are redone into what might becalled “optimistic” predictions.
Before presenting the Arndt and Roper metals and mineral-fuels depletion predictions in the next threechapters, a brief discussion of minerals depletion is in order. There are two underlying basic irrefutible facts:
1. The earth (or any portion of the earth) is a finite source of any mineral.2. As an increasing amount of any mineral is extracted from the earth it becomes steadily more difficult to
extract the remainder. By “more difficult” is meant that more materials and energy are required and moreenvironmental degradation occurs.
In the elaboration of fact (2) above is where the controversy over minerals depletion lies. Some claim thattechnology will always come up with more energy and new techniques to mine less rich ores, includingeventually the ocean and ordinary rocks. For example, Maddox8 states
The crust of the earth is much more lavishly supplied with minerals (than the oceans). Sheer physical exhaustion of the resources ofspaceship earth is obviously an exceedingly remote possibility.
and
…the contributions which science and technology have made in recent years to the improvement of natural resources have meantthat nations no longer need to fear that their survival will be threatened by a lack of essential raw materials.
These people, whom Cook5 calls “continuous creationists,” do not seem to realize that “new techniques”simply means more energy and materials and that the restrictions of the laws of thermodynamics apply.
A mining engineer's new idea for a more efficient way to mine an ore came about because muchenergy-matter investment was made in printing, in other informational exchange, and in the rearrangement ofthe energy-matter of his mind. If all of the energy utilized in these processes were obtained from mineral fuels,then there is a foreseeable limit to new ideas for new technology. Of course, we know that a small fraction ofthe energy came from the sun through photosyntheses processes in the crops that are primary and secondary(plant->animal->man) foods for man. However, in our modern technological society most of the energy now comes frommineral fuels. And, of course, bringing the engineer's idea to fruition will usually require an enormous amount ofenergy-matter investment.
When you pin the continuous creationists down with the argument given above, they counter that nuclearenergy9 will take over when mineral fuels bow out. There are tremendous problems associated with usingnuclear fission reactors for power production, not the least of which is the public fear of the unknown. Even ifthese tremendous problems are “solved,” it is clear that there is not enough uranium-235 available in the earthto regard uranium fission energy as a long-term solution. So the hope is for breeder fission reactors and nuclearfusion reactors to supply the needed energy9. It is not clear that the many severe problems with breeder reactorscan be satisfactorily managed; however, if they can be, this energy source will provide a huge amount of energyby utilizing the uranium-238, and perhaps thorium, available in the earth's crust. The long-range plannersregard breeder reactors as the necessary link between mineral fuels and eventual-fusion reactors. Fusionreactors are far from operational; however, if and when they are “perfected,” they certainly will provide atremendous amount of energy for use by man.
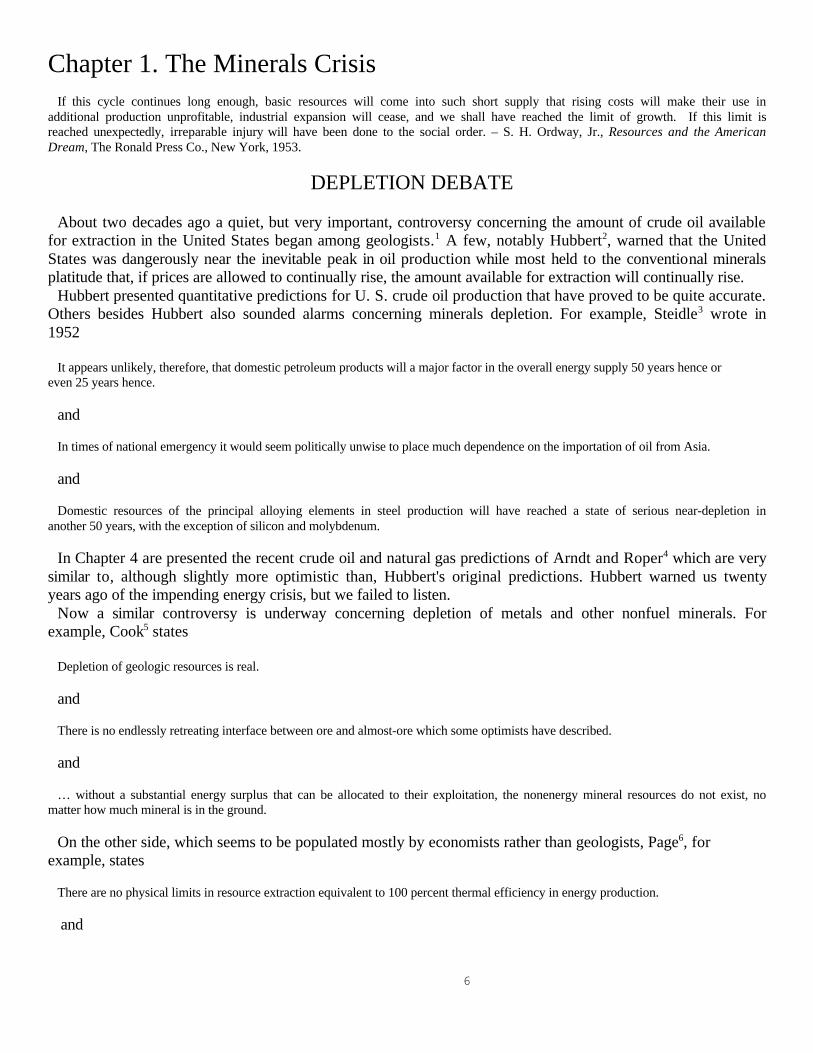
In order to be optimistic let us assume that breeder reactors and finally fusion reactors will come intooperation at the appropriate times to allow the present exponential growth (~5 percent per year) in world energyuse to continue. Figure 1 shows the world energy use rate versus time for this assumption. We see that about
8
the year 2070 the world rate of energy use from earth resources would be one percent of the power (energy pertime) supplied to the surface of the earth by the sun (26.5 Q/yr = 26.5×10¹⁸ BTU/yr).10 It appears certain thatthis level of eventual heat production from earth energy sources will drastically effect the earth’s weather11.Thus, we can view this as an upper limit for eventual energy production from earth sources, although otherenvironmental considerations will surely halt addition to the “heat burden” long before the one-percent limit.(Some would propose that we escape this limit by learning to control the weather on a global scale11. Thechance of this occurring within the next century seems to be very small.) We must either soon begin to reducethe rate of growth of energy use or quickly learn to use solar energy for individual and industrial consumption(Solar energy that hits the earth, of course, does not add to the heat burden.) That is, we must use a considerableamount of the remaining mineral fuels to develop systems for utilizing solar energy that hits the earth if weexpect growth in energy use to continue for more than another century.
But, of course, the growth cannot continueindefinitely; it can be shown by extrapolatingFigure 1 that a continued exponential growthin energy use at the present growth ratewould reach the amount of power supplied tothe surface of the earth by the sun by aboutthe year 2165. Of course, we cannot expectto utilize for industrial purposes more than afraction of one percent of the sun's energythat reaches the earth's surface. So, longbefore 2165 a leveling off must occur. Thatis sufficiently far in the future that weprobably should not worry too much about it;we have enough worries in converting frommineral fuels to solar energy!
So the continuous creationists are wrong.Energy considerations alone are enough toput severe limits on ore mining andprocessing. And there are other limitsbesides energy limits that restrict the miningand processing of mineral ores.Environmental degradation and the hugematerials investment required will probablyimpose equal or more restrictive limitationson mining and ore processing compared tothose imposed by limited energy.
Figure 1. World energy use rate versus time forexponential growth.
There is no doubt that the currentexponential growth of world production of many minerals must soon stop. Those interested in the worldminerals-depletion situation should consult the recent book by Arndt and Roper4.

9
10
MINERALS DEPLETION
Here we shall restrict our attention to the minerals-depletion situation of the United States. We shall see thatapparently about three-fourths of the metals of the metals have already passed their production peak in the U.S.In order to be able to discuss the U.S. situation we need to consider the dynamics of depletion.
Common sense tells one the kind of long-term “average” production-rate behavior to expect for any mineral.Components of both technology and sociology play a role in that behavior.
1. In the earliest stage the mineral is relatively readily available, but the technology for its extraction andsociety's need for it are undeveloped. Therefore, the production rate will increase slowly at first. However, asthe extracted mineral enters into the mainstream of the society its presence will generate more demand for itand thereby generate more advanced extraction technology. Thus, it is reasonable to assume that the productionrate at earliest times will be some increasing function of the amount already extracted at that time.
2. At the latest stage when the mineral is almost completely depleted the principal limitation on theproduction rate will be the amount left to be extracted at that time. That is, the production rate at latest timeswill be some decreasing function of the amount left to be extracted at that time.
3. At intermediate times one, therefore, expects the following behavior: After rising slowly at earliest times,the production rate should begin to accelerate, and later decelerate until it peaks at some time. Then the ratewill begin to decline in a similar, but not necessarily symmetrical, fashion.
Of course, in reality the long-term average behavior described above will not precisely describe theproduction-rate behavior for a particular mineral. There are short-term social phenomena, such as wars anddepressions, that can and often do cause rather large fluctuations in the production rate. (A detailed study of thecorrelations of these mineral-production fluctuations with specific social phenomena would be interesting. Wehave not attempted this study in our work.) There are two situations that could exist:
1. The short-term fluctuations have little or no effect on the long-term background behavior.2. The short-term fluctuations are evidence of changes in long-term social phenomena or of new mineral
technology (e.g., substitution of another mineral for it in its major use).
Also, one would think that after a mineral has become an integral part of a society's modus operandi that thesociety will make a large effort to keep its production rate up after it begins to decline. This will cause theproduction-rate curve to be asymmetrically skewed toward large times; we shall see later that most nearlydepleted United States minerals have such skewed production-rate curves. Arndt and Roper4 fitted the U.S. andworld metals and mineral-fuels production-rate data with several mathematical functions, some symmetric andsome asymmetric about the production peak, that have the properties described above. Since the quality of themathematical fits depends upon the quality of the data, we attempted to obtain the most reliable production-ratedata. The details of the data and the fits are presented in our more technical work4. We shall focus here only onthe results of the U.S. fits that yielded the most certain predictions. The fits predict the future production of themineral. This prediction method is called the “production-history projections” method5. There are otherdepletion prediction methods, but according to Cook5,
The production-history method of forecasting depletion may be a better guide to national policy than are the geologic-economicmethods, for it yields a direct and continuous forecast of supply rates. In addition, its errors will fall on the side of prudence ratherthan on the side of flatulent optimism.
There is, a priori, no way to tell how much asymmetry will occur in the production rates of those mineralswhich have not yet reached their production peak. Therefore, we do not expect the production-historyprojections method to give very precise predictions for those minerals which have not yet reached their

11
production peak. This includes about one-fourth of the U.S. metals and about three-fourths of the worldmetals4. However, in the next chapter we shall see that most U.S. metals that are highly depleted show similaramounts of asymmetry. In Chapter 3 we shall use this amount of asymmetry to make what we shall call“optimistic” predictions and we shall use symmetric fits to make what we shall call “pessimistic” predictionsfor the moderately depleted U.S. metals. In Chapter 4 we shall do the same for U.S. mineral fuels.
It is convenient to condense the predictions for each mineral in terms of the following “depletion parameters”:
1. The date when production peaks (tp = peak date).2. The date when the mineral is one-half extracted (t1/2 = half date).3. The percent already extracted by 1975. 4. The total amount to be eventually extracted (Q∞).
The peak date is probably the most important parameter because it is the traumatic event that signals the endto exponential growth in production. For the reader who wants a quick answer for the depletion situations ofthe various U.S. metals and mineral fuels, Table 6 and Figure 25 in Chapter 5 give the depletion parametersdefined above.
Although only production-rate data were used in making the predictions that follow, it is useful to comparethe predictions with mineral-reserves and resources estimates at different dates. One should realize, however,that5
It is not at all certain that ultimate recovery will extend to the limit of possible reserves.
Also, there are many methods for calculating reserves and resources that yield vastly different numbers. Themost complete set of United States and world reserves estimates are given by Frasché12 for 1960. However,with some effort one can collect a fairly complete, more recent, set of reserves and resources estimates fromBrobst and Pratt13. Both sets are given in Table 1. We indicate these Table 1 values by the symbol • forreserves and by the symbol ⊗ for identified resources in the “amount left” graphs in the next three chapters.(See Table 1 for the definitions of these terms.)
Also, in the discussions of individual minerals in the next three chapters, we shall refer to the percentagesimported and recycled for U.S. consumption (the production shortfall). (By “recycle” we also include materialstaken from stockpiles.) These values are extracted or estimated from data given in Brobst and Pratt13. A tableand graph of these values are given in Chapter 5 (Table 7 and Figure 26 ).
12
TABLE 1United States reserves and identified resources.
R. = reserves, I.R. = identified resources.*
Mineral Frasché (1960) (reserves) Brobstand Pratt Type and date
Antimony 50×103 S.T.100×109 S.T. I.R. 1972Arsenic 2.5×10⁶ S.T. (As2O3)1.3×10⁶ S.T. (As2O3) I.R. 1972Asbestos 1×10⁶ S.T.3.7×106 S.T. I.R. 1972Bauxite 50×106 L.T. 36×106
L.T. R. 1972Barite 100×106 S.T.
99×106 S.T. I.R. 1972Beryllium 10×103 S.T. (Beryl)60.3×10³ S.T. (Beryl) I.R. 1972Bismuth 15×103 S.T.13.2×103 S.T. R. 1970Cadmium 100×106 1b.650×106 1b. I.R. 1972Chromite 500×103 S.T. 0
R. 1972Coal —
1.58×10¹² S.T. I.R. 1971Cobalt 50×103 S.T.
842×103 S.T. I.R. 1972Copper 32.5×10⁶ S.T.
76×106 S.T. I.R. 1972Fluorine 15×106 S.T. (Fluorspar) 25×106 S.T. (Fluorspar) I.R. 1972Gold 50×106 T.O.
82×106 T.O. R. 1972Iron Ore 5.5×10⁹ L.T.9.0×109 L.T. R. 1970Lead 7.7×10⁶ S.T.
39.2×10⁶ S.T. R. 1968Manganese 1×10⁶ S.T. (ore >35% Mn) 0 (ore>35% Mn) R. 1972Mercury 300×103 76 lb. flasks490×103 76 lb. flasks I.R. 1972Molybdenum 3.0×10⁹ lb.35.1×109 lb. I.R. 1972
13
Nickel 400×103 S.T.— — —
Niobium-Tantalum Oxide 50×103 S.T. (Nb only) 110X103 S.T. I.R.1972
Phosphate Rock 15×109 S.T. 12×109 S.T.I.R. 1972
Platinum Group 150×103 T.O. (Pt only) 3×10⁶ T.O.I.R. 1970
Selenium — 4.8×10⁹ 1b. I.R. 1972Silver 750×106 T.O.
1.44×10⁹ T.O. R. 1968Sulfur 125×106 L.T.
200×106 L.T. I.R. 1972Tellurium — 63.9×10⁶ 1b. I.R. 1972Thallium — 266 S.T. R. 1972Thorium Oxide — 153×103 S.T.
I.R. 1972Tin 5×10³ L.T.
41,535 L.T. R. 1972Titanium, Ilmenite 64×106 S.T. 100×106 S.T.
R. 1970Titanium, Rutile combined with Ilmenite 500×103 S.T.
R. 1970Tungsten 147×103 S.T. 60% WO3
250×103 S.T. 60% WO3 R. 1972Uranium Oxide — 273×103 S.T.
I.R. 1971Vanadium 680×103 S.T.115×103 S.T. R. 1970Zinc 25×106 S.T.
45×106 S.T. I.R. 1972Zirconium 12×106 S.T.10.8×106 S.T. I.R. 1972
*Reserves: Identified deposits from which minerals can be extracted profitably with existing technology and under present economicconditions.
Identified resrouces: Specific, identified mineral deposits that may or may not be evaluated as to extent and grade, and whosecontained minerals may or may not be profitably recoverable with existing technology and economic conditions.
14
Chapter 2. Highly Depleted United States MetalsDomestic resources of the principal alloying elements in steel production will have reached a state of serious near-depletion in
another 50 years, with the exception of silicon and molybdenum. —E. Steidl, Mineral Forecast 2000 A.D., Pennsylvania StateCollege, State College, Pa., 1952.
There are about one dozen metals that are depleted enough in the United States to show whether there is anyasymmetry in their production rates. That is, each has gone far enough past its production peak such that onecan test to see if the best fit to the data is by means of a peaked mathematical function that is skewed towardlarge times rather than by a symmetric peaked function. We shall discuss each metal separately and then makesome general comments about all of them. Note that some of the comments in the caption of the first graph(gold) apply to many of the remaining graphs in this book.
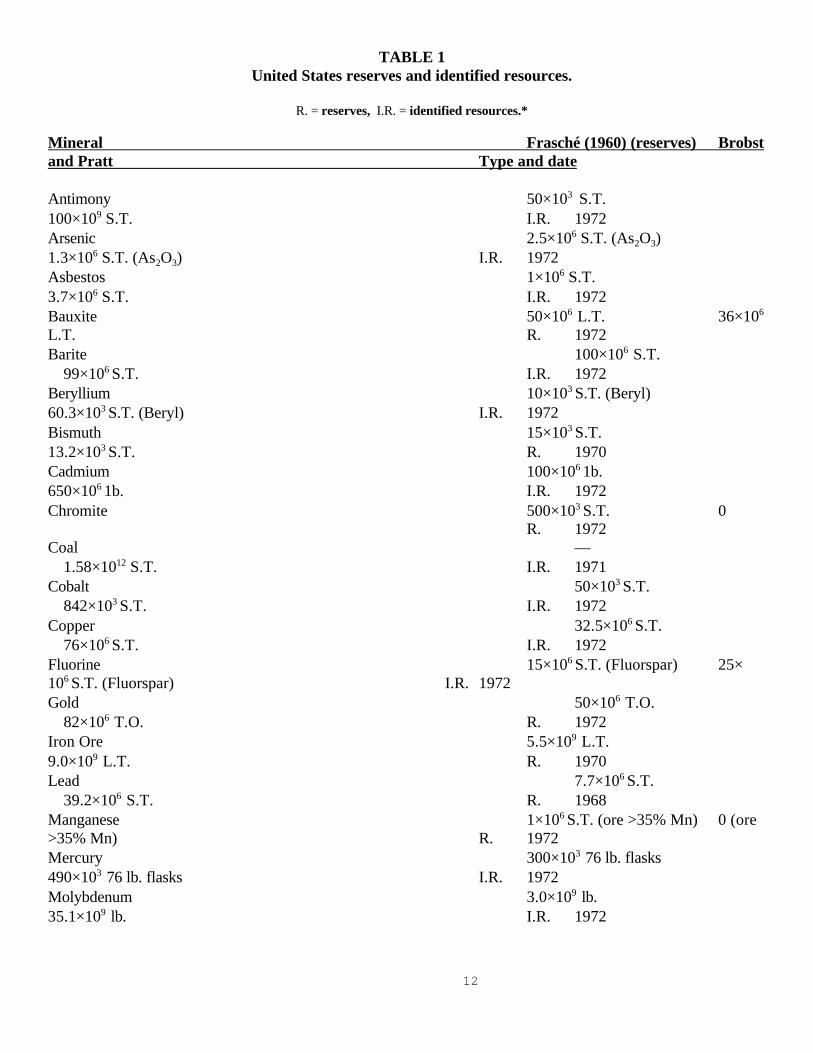
GOLDThe only highly depleted metal that is symmetrical is gold, as shown in
Figure 2. The short-term fluctuations are quite large, so our prediction forfuture gold production is not touted as an accurate year-by-year prediction,but rather as a prediction of “average” or “background” production. The1960 and 1972 reserves estimates are indicated by • and are in fairly goodagreement with our curve. There is little room for doubt that gold is verynear total depletion in the United States. The U.S. now imports or obtainsfrom private holdings about 75 percent of the gold it consumes. Gold can,with difficulty, be replaced by other metals in most of its uses. However, itdoes hold a unique place in men's minds as a monetary standard.
Peak date — Half date — 1916, 90% gone in 1975.
Figure 2. Gold production data, fits and predictions. In this and the next two chaptersthe graphs of production rates have produetion-rate data points with error bars. The errorbars are technical devices used to make the fits, as explained in Arndt and Roper4. Thereader can regard them as a measure of the average deviations of the data points from thesmooth curve that is fitted to the data points. Also, in the graphs ot “amount left”, a curveis often flanked by lighter error curves calculated using the data error bars. Also, in thegraphs a solid curve is usually our preferred fit and a dashed or dotted curve is analternate fit. Here, for gold, the solid curve is the symmetric fit, the dashed curve is a fitusing a sum of four peaked functions, and the dotted curve is an attempt at an asymmetricfit.
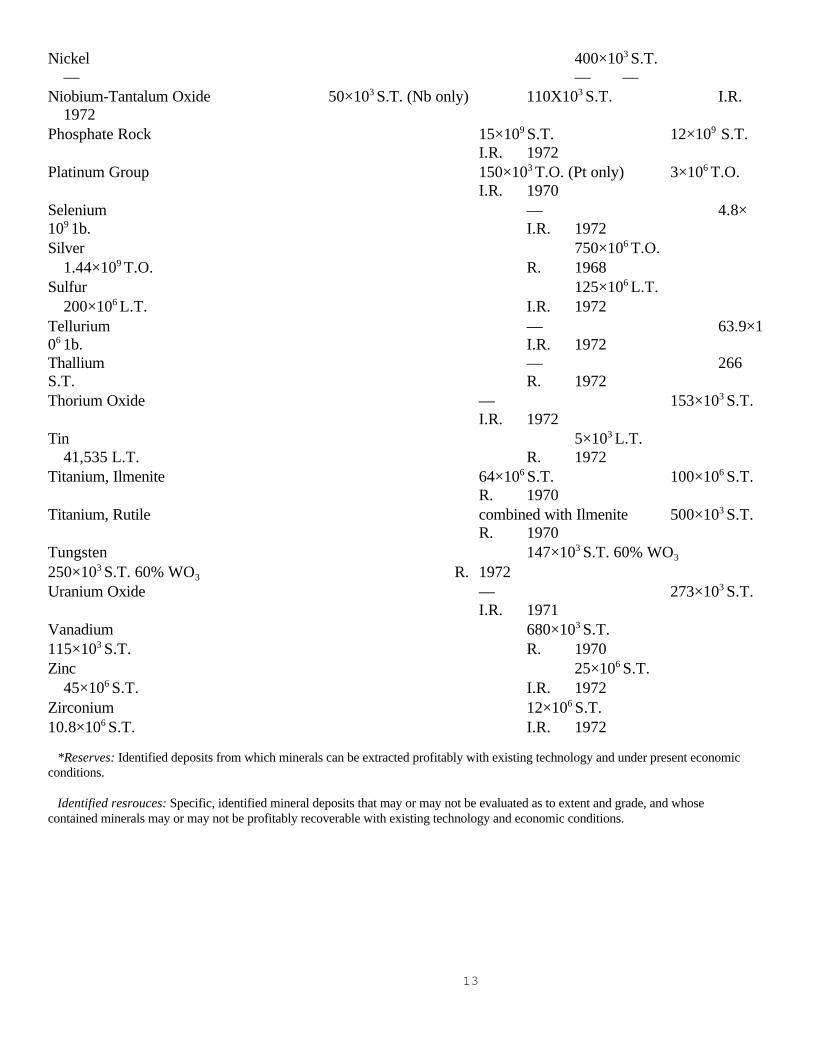
PLATINUM GROUPFigure 3 shows the depletion situation for the platinum group (platinum,
palladium, iridium, osmium, rhodium, and ruthenium). Platinum groupshares with mercury the largest asymmetry of all the U. S. metals. Asseen in the figure there are large fluctuations in the production rate. The1960 platinum-only reserves estimate is indicated by o, but the 1970identified resources (see Table 1) estimate of 3×10⁶ troy ounces is too
15
large to be put on the graph. Despite this disagreement between our prediction and the recentidentified-resources estimate, there is little room for doubt that the platinum group of metals is very near totaldepletion in the United States. The U. S. now imports about 78 percent and recycles 20 percent of theplatinum-group metals that it consumes. These metals are essential in the chemical and electrical industries.
Peak date—1923, Half date—1941, 82% gone in 1975.
Figure 3. Platinum group production data, fits and predictions. The solid curve is the asymmetric fit and the dashed curve is thesymmetric fit.
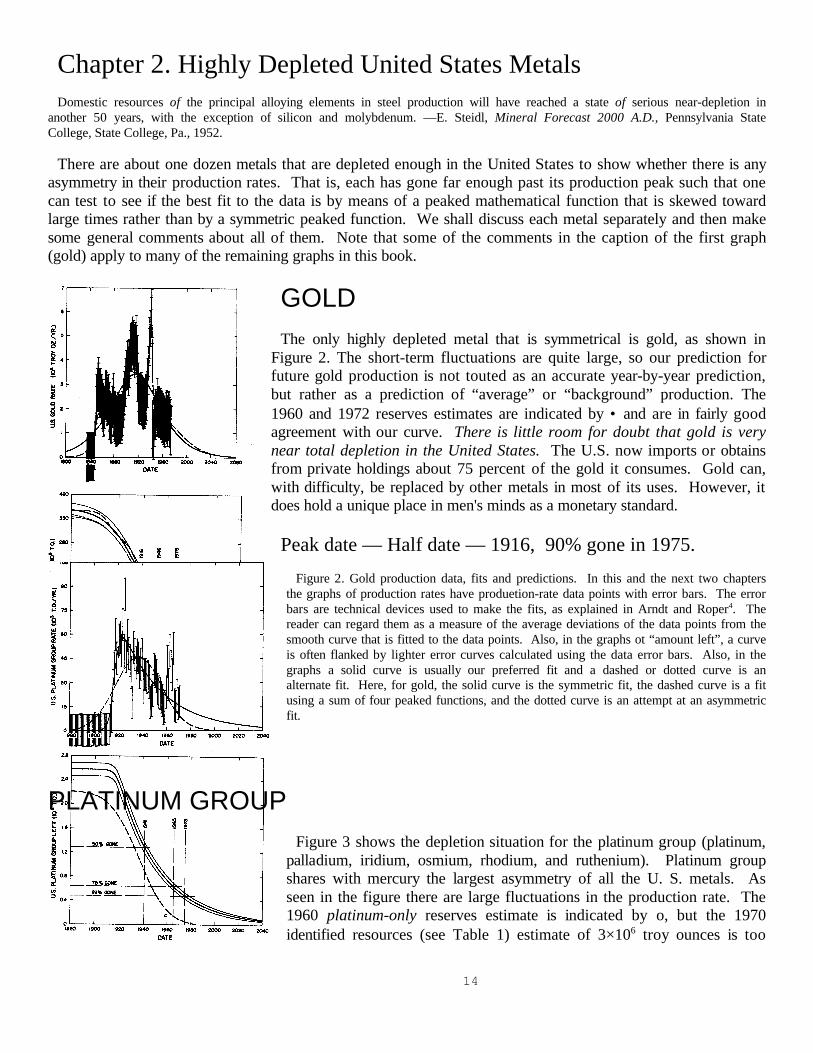
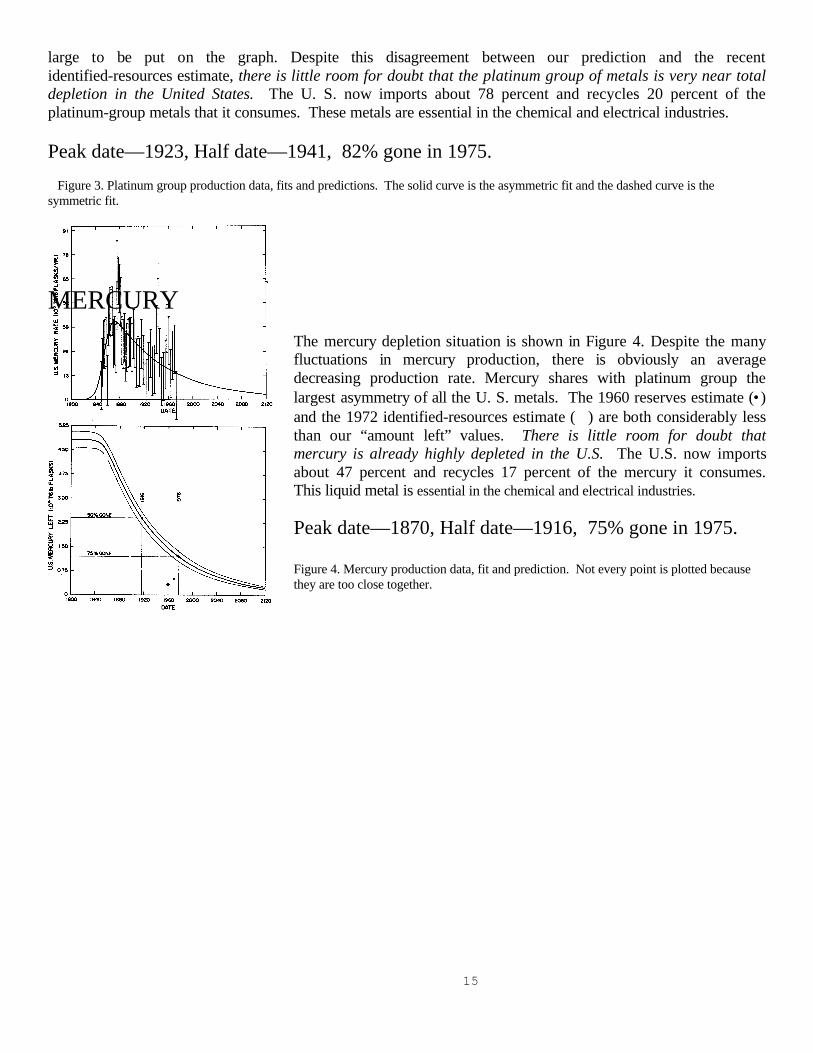
MERCURYThe mercury depletion situation is shown in Figure 4. Despite the manyfluctuations in mercury production, there is obviously an averagedecreasing production rate. Mercury shares with platinum group thelargest asymmetry of all the U. S. metals. The 1960 reserves estimate (•)and the 1972 identified-resources estimate (⊗) are both considerably lessthan our “amount left” values. There is little room for doubt thatmercury is already highly depleted in the U.S. The U.S. now importsabout 47 percent and recycles 17 percent of the mercury it consumes.This liquid metal is essential in the chemical and electrical industries.
Peak date—1870, Half date—1916, 75% gone in 1975.
Figure 4. Mercury production data, fit and prediction. Not every point is plotted becausethey are too close together.
16
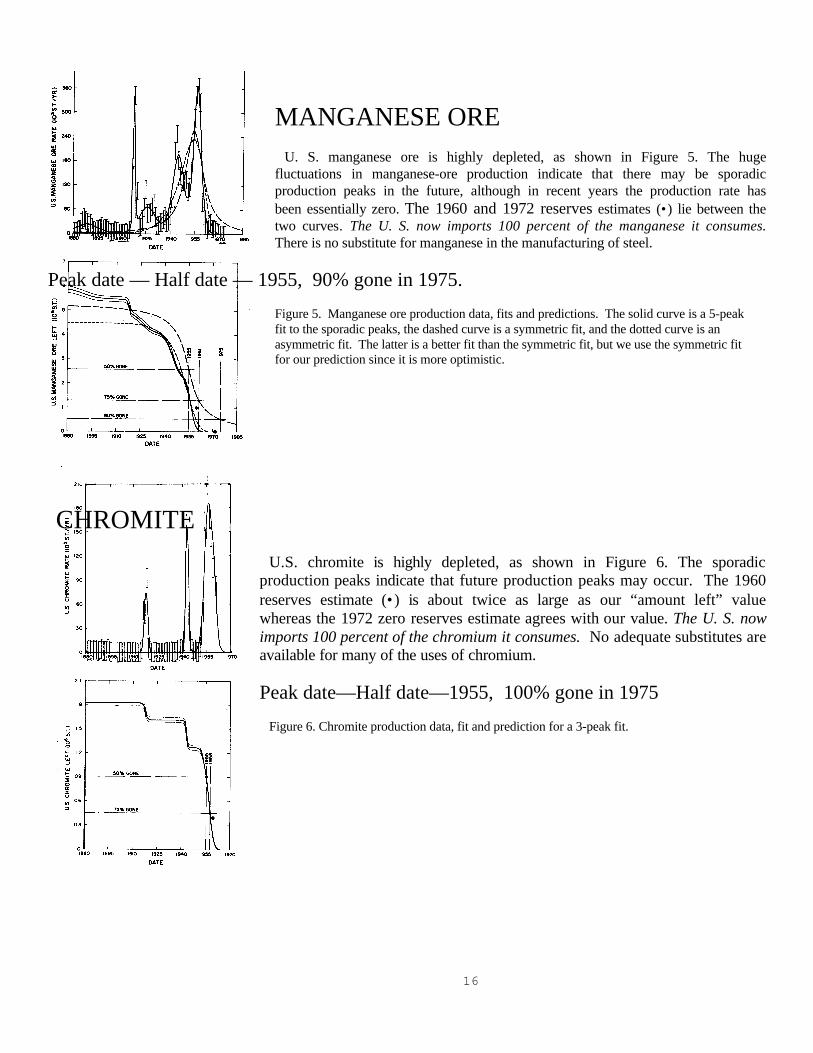
MANGANESE OREU. S. manganese ore is highly depleted, as shown in Figure 5. The huge
fluctuations in manganese-ore production indicate that there may be sporadicproduction peaks in the future, although in recent years the production rate hasbeen essentially zero. The 1960 and 1972 reserves estimates (•) lie between thetwo curves. The U. S. now imports 100 percent of the manganese it consumes.There is no substitute for manganese in the manufacturing of steel.
Peak date — Half date — 1955, 90% gone in 1975.
Figure 5. Manganese ore production data, fits and predictions. The solid curve is a 5-peakfit to the sporadic peaks, the dashed curve is a symmetric fit, and the dotted curve is anasymmetric fit. The latter is a better fit than the symmetric fit, but we use the symmetric fitfor our prediction since it is more optimistic.
CHROMITEU.S. chromite is highly depleted, as shown in Figure 6. The sporadic
production peaks indicate that future production peaks may occur. The 1960reserves estimate (•) is about twice as large as our “amount left” valuewhereas the 1972 zero reserves estimate agrees with our value. The U. S. nowimports 100 percent of the chromium it consumes. No adequate substitutes areavailable for many of the uses of chromium.
Peak date—Half date—1955, 100% gone in 1975
Figure 6. Chromite production data, fit and prediction for a 3-peak fit.
17
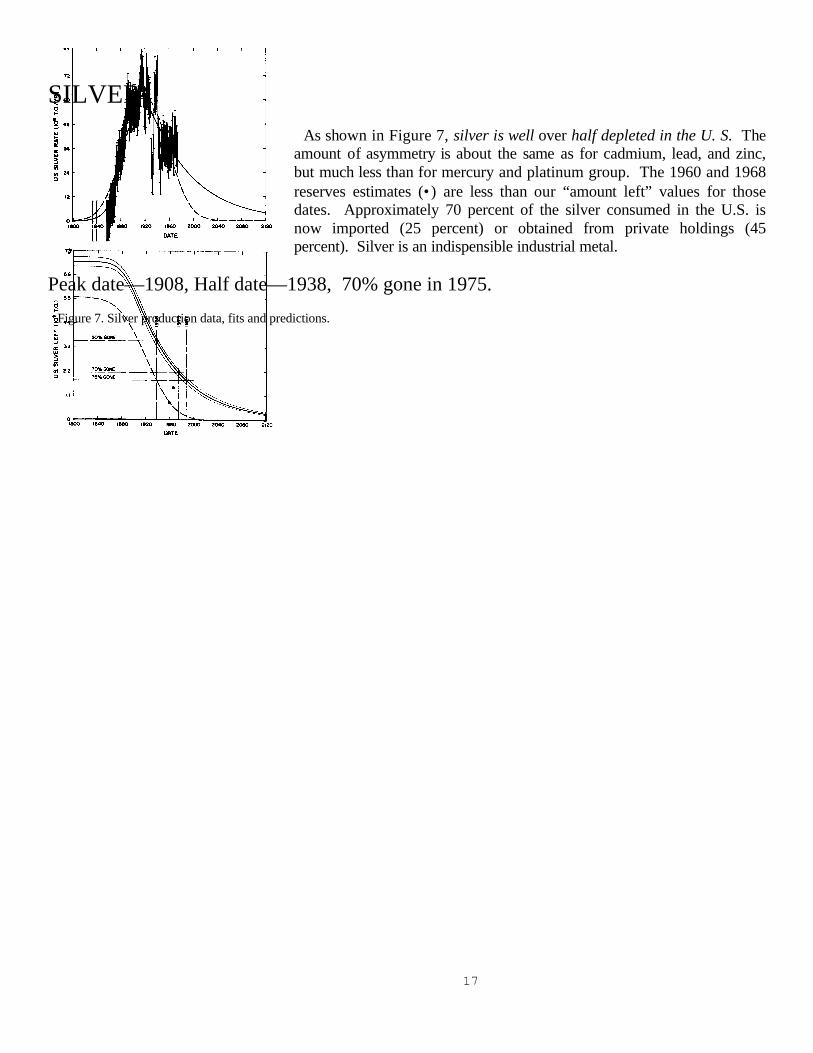
SILVERAs shown in Figure 7, silver is well over half depleted in the U. S. The
amount of asymmetry is about the same as for cadmium, lead, and zinc,but much less than for mercury and platinum group. The 1960 and 1968reserves estimates (•) are less than our “amount left” values for thosedates. Approximately 70 percent of the silver consumed in the U.S. isnow imported (25 percent) or obtained from private holdings (45percent). Silver is an indispensible industrial metal.
Peak date—1908, Half date—1938, 70% gone in 1975.
Figure 7. Silver production data, fits and predictions.

18
LEADThe U.S. lead situation is shown in Figure 8. The amount of asymmetryis about the same as for silver, cadmium, and zinc, but much less than formercury and platinum group. Our “amount left” value is considerablyhigher than the 1960 reserves estimate (•) but somewhat lower than the1968 reserves estimate (•). About 43 percent of the lead consumed in theU. S. is now recycled lead and about 20 percent is imported. Lead is thefifth ranking metal of trade and consumption after iron, aluminum,copper, and zinc.
Peak date—1925, Half date—1958, 60% gone in 1975.
Figure 8. Lead production data, fits and predictions. Not every data point is plottedbecause they are too close together. The best fit is asymmetric (solid curve). We alsoshow the asymmetric fit to a slightly different set of data (dotted curve). The differencesbetween these two conflicting sets of data are not signifieant for our purposes. Forcomparison we show a less probable symmetric fit (dashed curve). We expect that therecent large rise in production rate due to the large discoveries in the Missouri-Kansasarea will be followed soon by a drop as that area is depleted. Our curve will probablyget shifted toward larger asymmetry as the next few years go by.
19
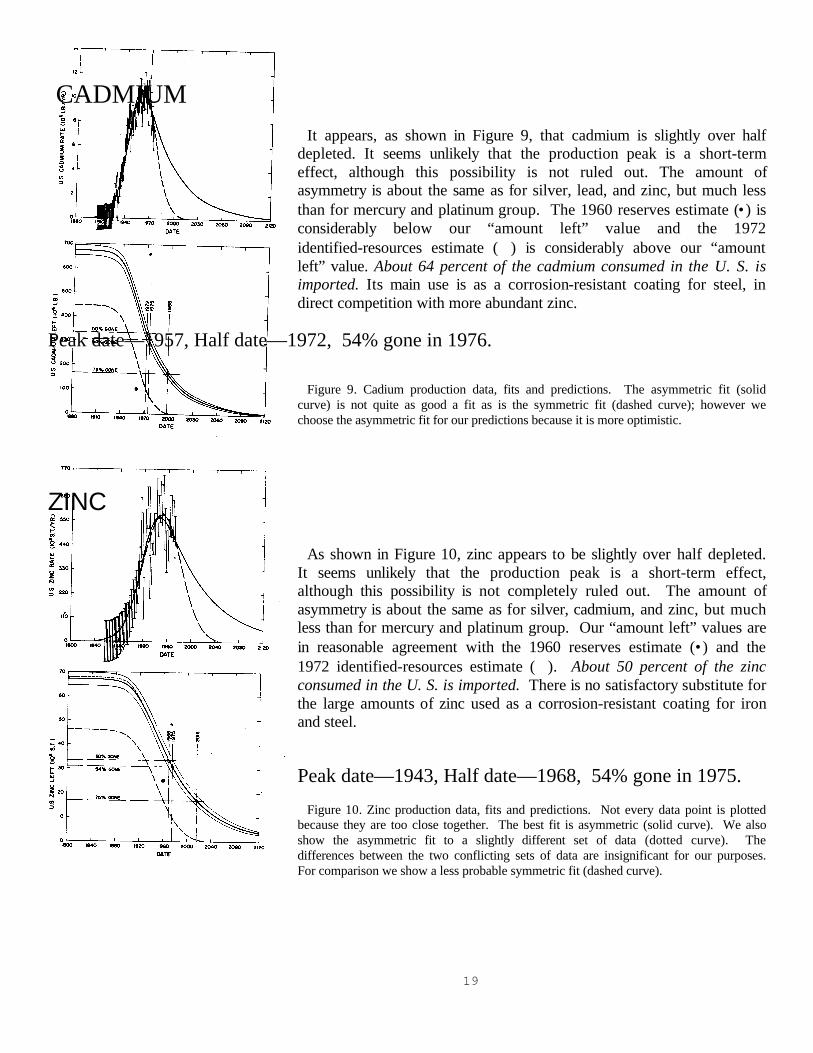
CADMIUMIt appears, as shown in Figure 9, that cadmium is slightly over half
depleted. It seems unlikely that the production peak is a short-termeffect, although this possibility is not ruled out. The amount ofasymmetry is about the same as for silver, lead, and zinc, but much lessthan for mercury and platinum group. The 1960 reserves estimate (•) isconsiderably below our “amount left” value and the 1972identified-resources estimate (⊗) is considerably above our “amountleft” value. About 64 percent of the cadmium consumed in the U. S. isimported. Its main use is as a corrosion-resistant coating for steel, indirect competition with more abundant zinc.
Peak date—1957, Half date—1972, 54% gone in 1976.
Figure 9. Cadium production data, fits and predictions. The asymmetric fit (solidcurve) is not quite as good a fit as is the symmetric fit (dashed curve); however wechoose the asymmetric fit for our predictions because it is more optimistic.
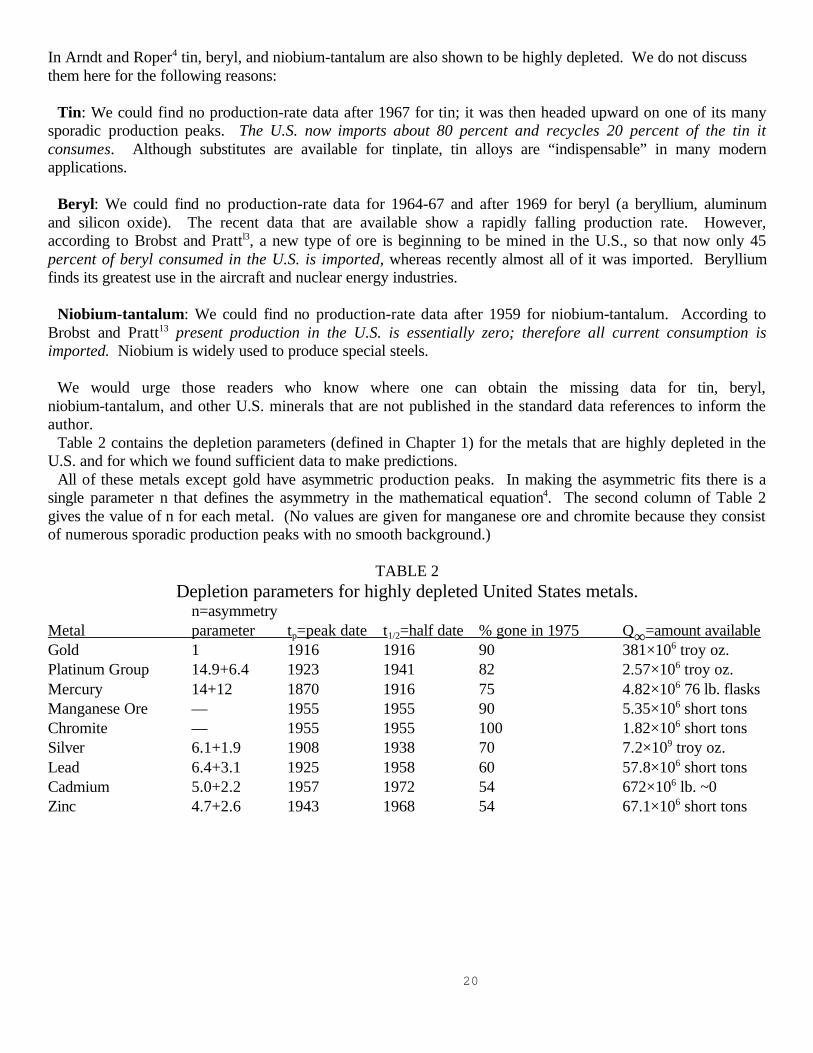
ZINC
As shown in Figure 10, zinc appears to be slightly over half depleted.It seems unlikely that the production peak is a short-term effect,although this possibility is not completely ruled out. The amount ofasymmetry is about the same as for silver, cadmium, and zinc, but muchless than for mercury and platinum group. Our “amount left” values arein reasonable agreement with the 1960 reserves estimate (•) and the1972 identified-resources estimate (⊗). About 50 percent of the zincconsumed in the U. S. is imported. There is no satisfactory substitute forthe large amounts of zinc used as a corrosion-resistant coating for ironand steel.
Peak date—1943, Half date—1968, 54% gone in 1975.
Figure 10. Zinc production data, fits and predictions. Not every data point is plottedbecause they are too close together. The best fit is asymmetric (solid curve). We alsoshow the asymmetric fit to a slightly different set of data (dotted curve). Thedifferences between the two conflicting sets of data are insignificant for our purposes.For comparison we show a less probable symmetric fit (dashed curve).
20
In Arndt and Roper4 tin, beryl, and niobium-tantalum are also shown to be highly depleted. We do not discussthem here for the following reasons:
Tin: We could find no production-rate data after 1967 for tin; it was then headed upward on one of its manysporadic production peaks. The U.S. now imports about 80 percent and recycles 20 percent of the tin itconsumes. Although substitutes are available for tinplate, tin alloys are “indispensable” in many modernapplications.
Beryl: We could find no production-rate data for 1964-67 and after 1969 for beryl (a beryllium, aluminumand silicon oxide). The recent data that are available show a rapidly falling production rate. However,according to Brobst and Prattl3, a new type of ore is beginning to be mined in the U.S., so that now only 45percent of beryl consumed in the U.S. is imported, whereas recently almost all of it was imported. Berylliumfinds its greatest use in the aircraft and nuclear energy industries.
Niobium-tantalum: We could find no production-rate data after 1959 for niobium-tantalum. According toBrobst and Pratt13 present production in the U.S. is essentially zero; therefore all current consumption isimported. Niobium is widely used to produce special steels.
We would urge those readers who know where one can obtain the missing data for tin, beryl,niobium-tantalum, and other U.S. minerals that are not published in the standard data references to inform theauthor.
Table 2 contains the depletion parameters (defined in Chapter 1) for the metals that are highly depleted in theU.S. and for which we found sufficient data to make predictions.
All of these metals except gold have asymmetric production peaks. In making the asymmetric fits there is asingle parameter n that defines the asymmetry in the mathematical equation4. The second column of Table 2gives the value of n for each metal. (No values are given for manganese ore and chromite because they consistof numerous sporadic production peaks with no smooth background.)
TABLE 2Depletion parameters for highly depleted United States metals.
n=asymmetryMetal parameter tp=peak date t1/2=half date % gone in 1975 Q∞=amount availableGold 1 1916 1916 90 381×106 troy oz.Platinum Group 14.9+6.4 1923 1941 82 2.57×10⁶ troy oz.Mercury 14+12 1870 1916 75 4.82×10⁶ 76 lb. flasksManganese Ore — 1955 1955 90 5.35×10⁶ short tonsChromite — 1955 1955 100 1.82×10⁶ short tonsSilver 6.1+1.9 1908 1938 70 7.2×10⁹ troy oz.Lead 6.4+3.1 1925 1958 60 57.8×10⁶ short tonsCadmium 5.0+2.2 1957 1972 54 672×106 lb. ~0Zinc 4.7+2.6 1943 1968 54 67.1×10⁶ short tons
21
Symmetry of Production Peaks:
There appear to be three classes of asymmetry as shown in Table 3. Perhaps the large asymmetry forplatinum group and mercury is connected with the fact that they both peaked so early in the development of thecountry. The four moderately asymmetric metals yield an average n value of 5.6 with a 0.8 standard deviation.It seems reasonable to assume that this moderate asymmetry should be more prevalent than either noasymmetry or high asymmetry. Therefore, in the next two chapters, which deal with metals and mineral fuelsthat are so near their production peak that one cannot yet discern the amount of asymmetry, we shall developpredictions for both symmetric production peaks and moderately asymmetric (n=5) production peaks. Thesepredictions will be labeled “pessimistic” and “optimistic” as shown in Table 3.
TABLE 3Asymmetry Classes
Asymmetry Parameter (n) Name Prediction Label≈1 asymmetric pessimistic≈5 moderately asymmetric optimistic≈16 highly asymmetric
Summary:
In this chapter we have seen that many metals that are very important to the United States industrial economyare highly depleted in the U.S. There is no doubt that this fact is currently having, and will have even more inthe future, drastic effects on the United States economy and political stance. It is no spiritual conversion thathas recently caused staunch big-business-oriented conservative politicians in the U.S. to embrace worldpolitical leaders of opposite ideologies. They know that the United States cannot remain a leading industrialstate, let alone a growing industrial state, without enormous imports of these metals from many other nations ofthe world

22
Chapter 3. Moderately Depleted United States MetalsThe end of expansion, if unexpected and involuntary, would mean the reversal of a major facet of our faith; it would mean massdiscouragement and unemployment; it would mean revolution and dictatorship. — S. H. Ordway, Jr., Resources and the AmericanDream, The Ronald Press Co., New York, 1953.
We saw in the last chapter that about a dozen metals are highly depleted in the United States; that is, they areover seventy percent depleted or are far enough past their production peaks such that the amount of asymmetryof the peak can be determined. Of the seven metals for which the asymmetry could be ascertained, four hadsimilar moderate asymmetries.
Now we want to discuss the remaining metals which have either not yet peaked or are too near their peak fordetecting any asymmetry. Three (copper, magnesium, and molybdenum) appear to be far from peaking; werefer the reader to Arndt and Roper4 for somewhat uncertain predictions for them. For antimony we were notable to obtain a good set of data4, so we do not include it here. The remaining nine for which we found dataappear to be very near peaking. In Arndt and Roper4 the future production of all of these is predicted by meansof symmetric production peaks. We call such predictions “pessimistic” predictions.
It appears reasonable to assume that most of these nine metals will eventually show an asymmetry in theirproduction peaks similar to the production peaks of the highly-depleted metals considered in the last chapter. There we found that four out of seven had moderate asymmetries while two had high asymmetries and one(gold) was symmetric (see Table 3). So, we shall assume that a more realistic prediction can be obtained for thenine moderately-depleted metals considered in this chapter by fixing their asymmetries at n=5. We call thesepredictions “optimistic” predictions.
We shall see that some of the depletion parameters defined in Chapter 1 can be quite different for the twodifferent predictions. However, the most important depletion parameter, the peak date, varies the least of any ofthe parameters. It varies from one year to fifteen years between the two predictions for the nine metals.
We shall discuss each metal separately and then make some general comments about all of them.

23
TUNGSTEN ORE
Figure 11 shows the tungsten ore (60%WO3) pessimistic and optimistic(n=5) predictions. The two peak dates differ by only one year. It appearsunlikely that the fall in production since the mid-1950's is a short-termeffect. However, large fluctuations at future times of national emergenciesseem probable. The 1960 reserves estimate (•) is less than both of our“amount left” values while the 1972 reserves estimate (•) lies between thetwo curves. The U.S. imports about 25 percent of the tungsten it consumes.Some adequate substitutes are available for some of the uses of tungsten.
Peak date—1961-1962
Figure 11. Tungsten ore production data, fits and predictions for symmetric andasymmetric (n=5) fits.
24
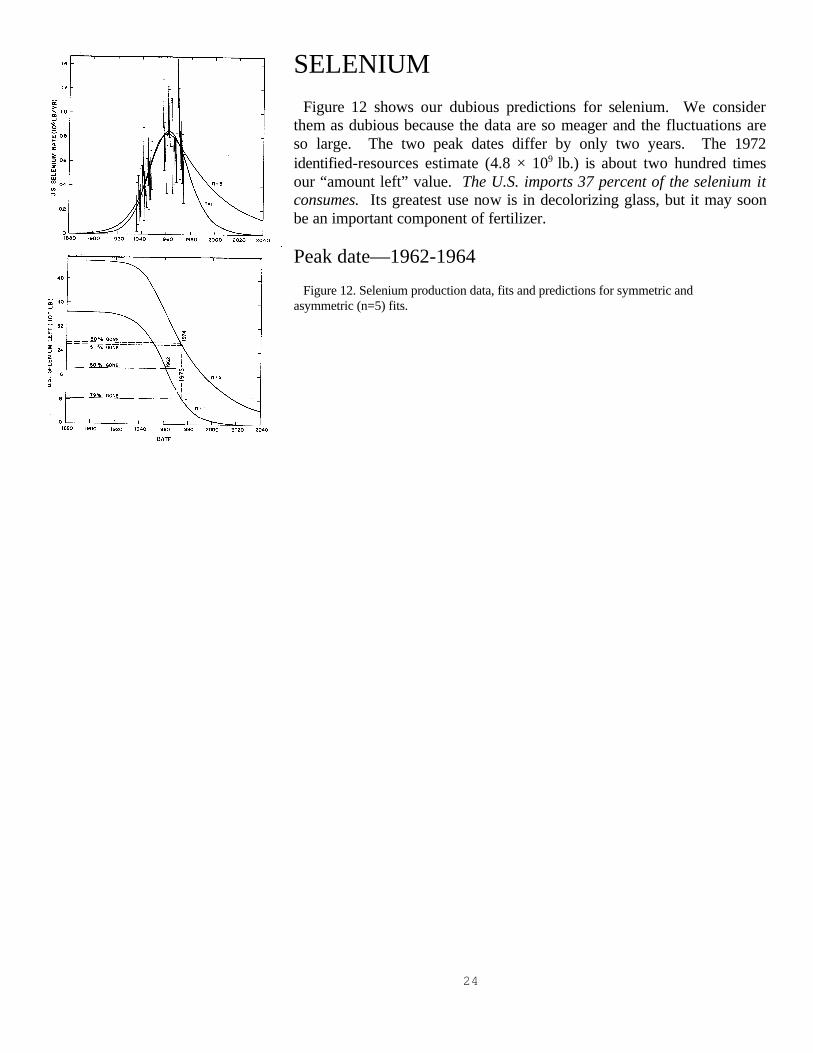
SELENIUMFigure 12 shows our dubious predictions for selenium. We consider
them as dubious because the data are so meager and the fluctuations areso large. The two peak dates differ by only two years. The 1972identified-resources estimate (4.8 × 10⁹ lb.) is about two hundred timesour “amount left” value. The U.S. imports 37 percent of the selenium itconsumes. Its greatest use now is in decolorizing glass, but it may soonbe an important component of fertilizer.
Peak date—1962-1964
Figure 12. Selenium production data, fits and predictions for symmetric andasymmetric (n=5) fits.

25
TELLURIUM
Our predictions for tellurium are in Figure 13. The data are meager, butit appears that tellurium has already peaked. The two peak dates differby only one year. The 1972 identified-resources estimate (63.9 × 10⁶ lb)is about ten times our “amount left” value. The U. S. imports 32 percentof the tellurium it consumes. The main use of tellurium is to increase themachinability of metals. Selenium and lead can be substituted fortellurium in many of its uses.
Peak date—1964-1965
Figure 13. Tellurium production data, fits and predictions for symmetric andasymmetric (n=5) fits.
26
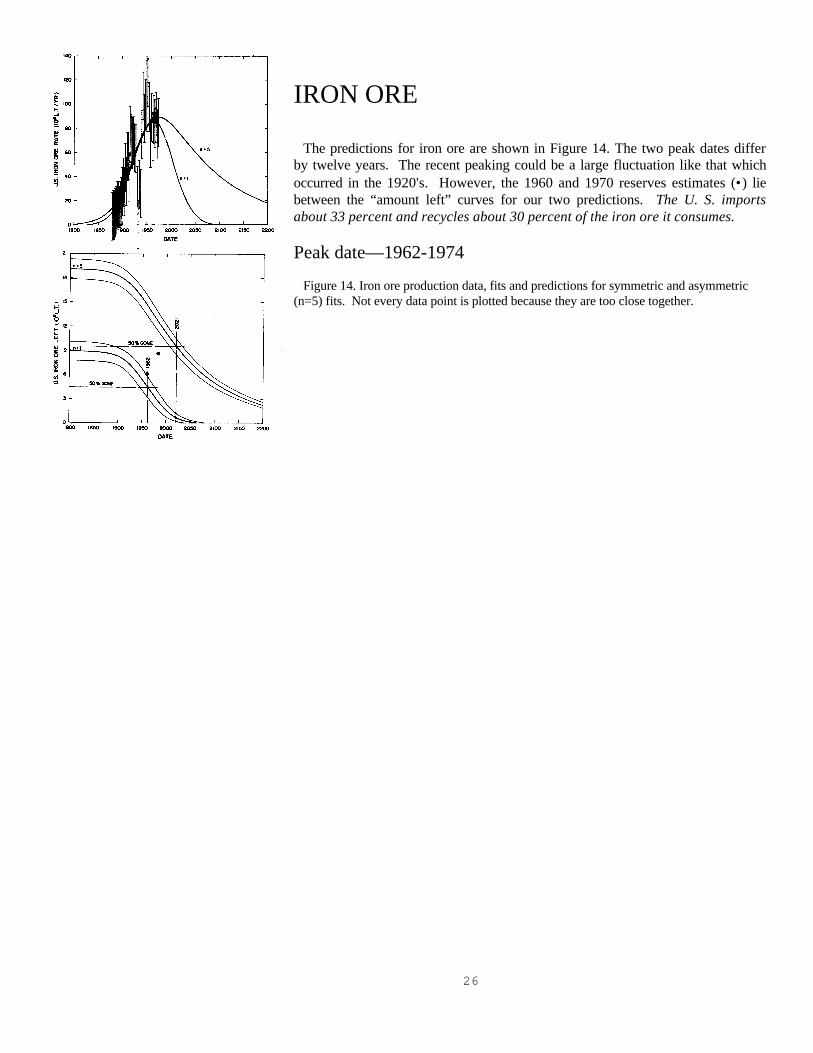
IRON ORE
The predictions for iron ore are shown in Figure 14. The two peak dates differby twelve years. The recent peaking could be a large fluctuation like that whichoccurred in the 1920's. However, the 1960 and 1970 reserves estimates (•) liebetween the “amount left” curves for our two predictions. The U. S. importsabout 33 percent and recycles about 30 percent of the iron ore it consumes.
Peak date—1962-1974
Figure 14. Iron ore production data, fits and predictions for symmetric and asymmetric(n=5) fits. Not every data point is plotted because they are too close together.
27
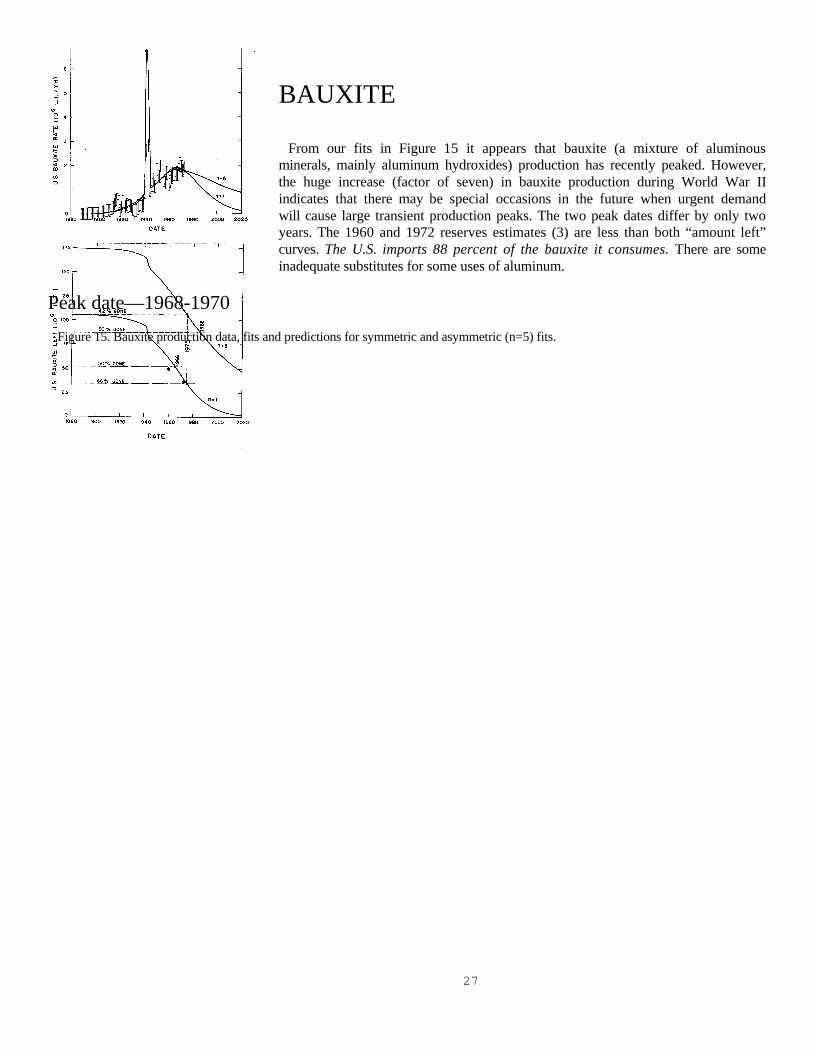
BAUXITE
From our fits in Figure 15 it appears that bauxite (a mixture of aluminousminerals, mainly aluminum hydroxides) production has recently peaked. However,the huge increase (factor of seven) in bauxite production during World War IIindicates that there may be special occasions in the future when urgent demandwill cause large transient production peaks. The two peak dates differ by only twoyears. The 1960 and 1972 reserves estimates (3) are less than both “amount left”curves. The U.S. imports 88 percent of the bauxite it consumes. There are someinadequate substitutes for some uses of aluminum.
Peak date—1968-1970
Figure 15. Bauxite production data, fits and predictions for symmetric and asymmetric (n=5) fits.
28
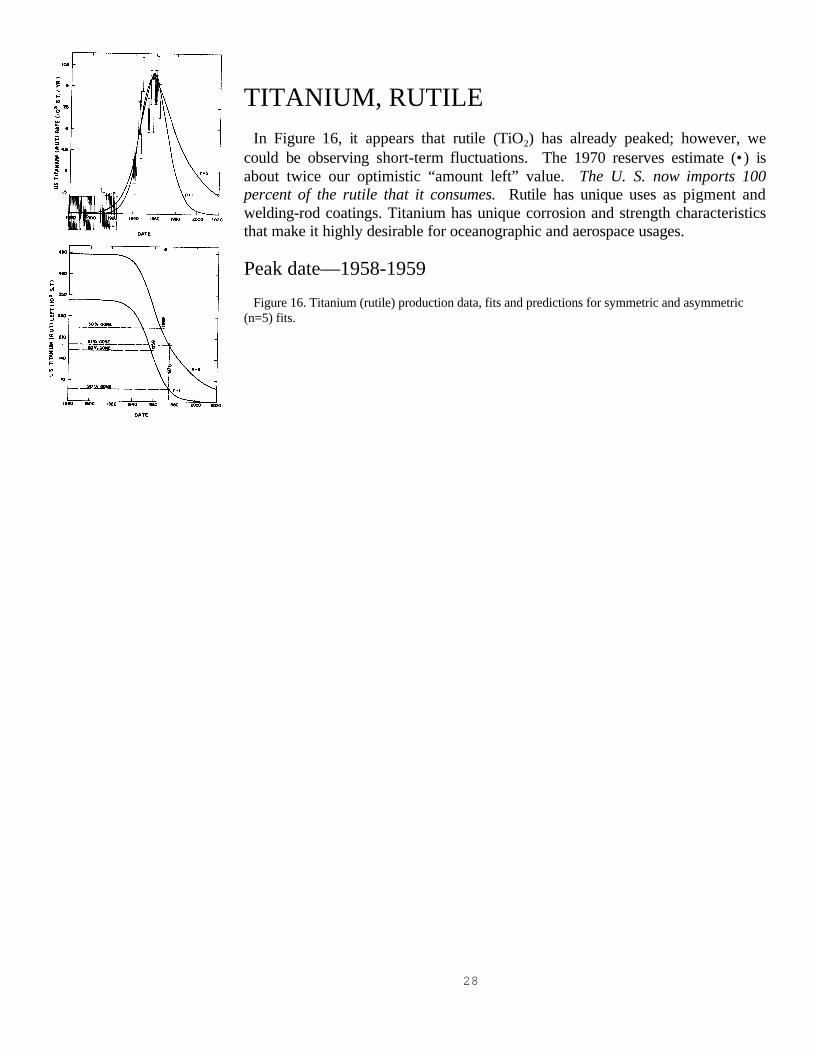
TITANIUM, RUTILEIn Figure 16, it appears that rutile (TiO2) has already peaked; however, we
could be observing short-term fluctuations. The 1970 reserves estimate (•) isabout twice our optimistic “amount left” value. The U. S. now imports 100percent of the rutile that it consumes. Rutile has unique uses as pigment andwelding-rod coatings. Titanium has unique corrosion and strength characteristicsthat make it highly desirable for oceanographic and aerospace usages.
Peak date—1958-1959
Figure 16. Titanium (rutile) production data, fits and predictions for symmetric and asymmetric(n=5) fits.

29
TITANIUM, ILMENITEIn Figure 17 it appears that ilmenite (FeTiO2 ) has already peaked. It seems
unlikely that the drop in production since the mid-1960's could be ashort-term fluctuation. However, the 1970 reserves estimate (100×106 S.T.)is about 3.5 times our optimistic “amount left” value. The U. S. importsabout 25 percent of the ilmenite that it consumes.
Peak date—1966-1967
Figure 17. Titanium (ilmenite) production data, fits and predictions for symmetric and asymmetric (n=5) fits.
30
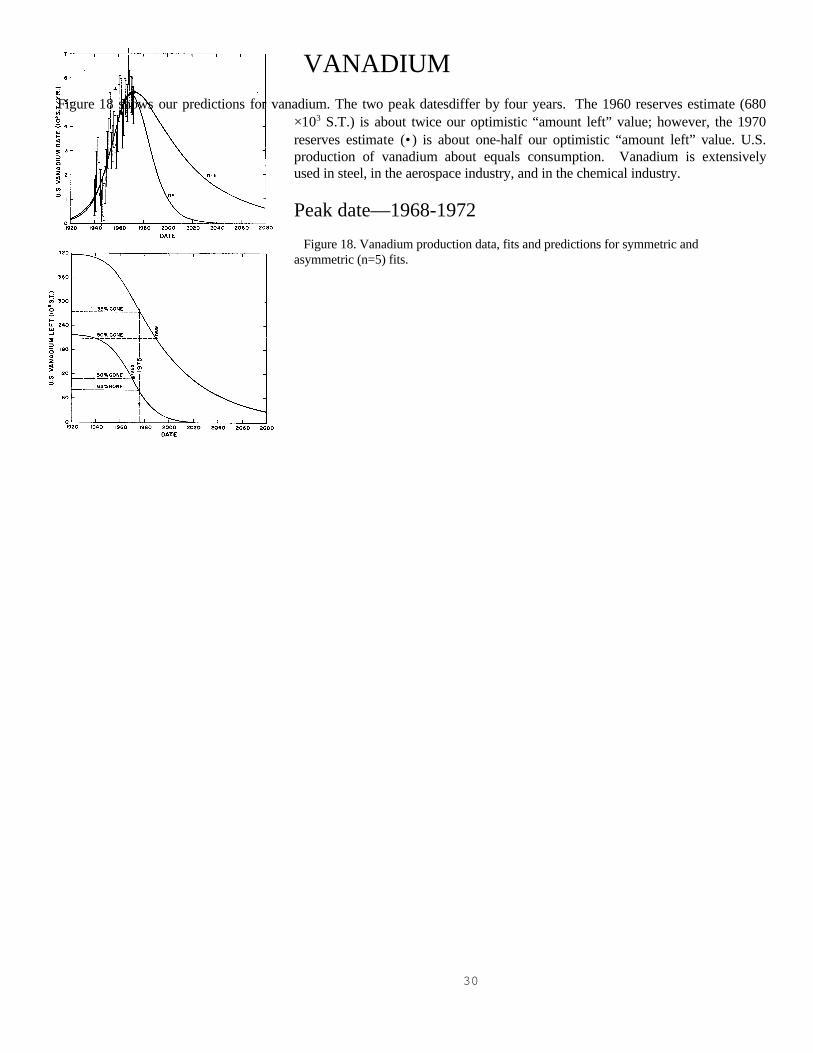
VANADIUMFigure 18 shows our predictions for vanadium. The two peak datesdiffer by four years. The 1960 reserves estimate (680
×103 S.T.) is about twice our optimistic “amount left” value; however, the 1970reserves estimate (•) is about one-half our optimistic “amount left” value. U.S.production of vanadium about equals consumption. Vanadium is extensivelyused in steel, in the aerospace industry, and in the chemical industry.
Peak date—1968-1972
Figure 18. Vanadium production data, fits and predictions for symmetric andasymmetric (n=5) fits.

31
NICKELOur prediction for nickel is given in Figure 19. The two peak dates differ by fifteen years. The 1960 reserves
estimate (•) is less than both of our “amount left” values. The U. S.imports 68 percent and recycles 20 percent of the nickel it consumes.Nickel is indispensible in steel, alloys, and electroplating.
Peak date—1962-1987
Figure 19. Nickel production data, fits and predictions for symmetric and asymmetric (n=5) fits.
32
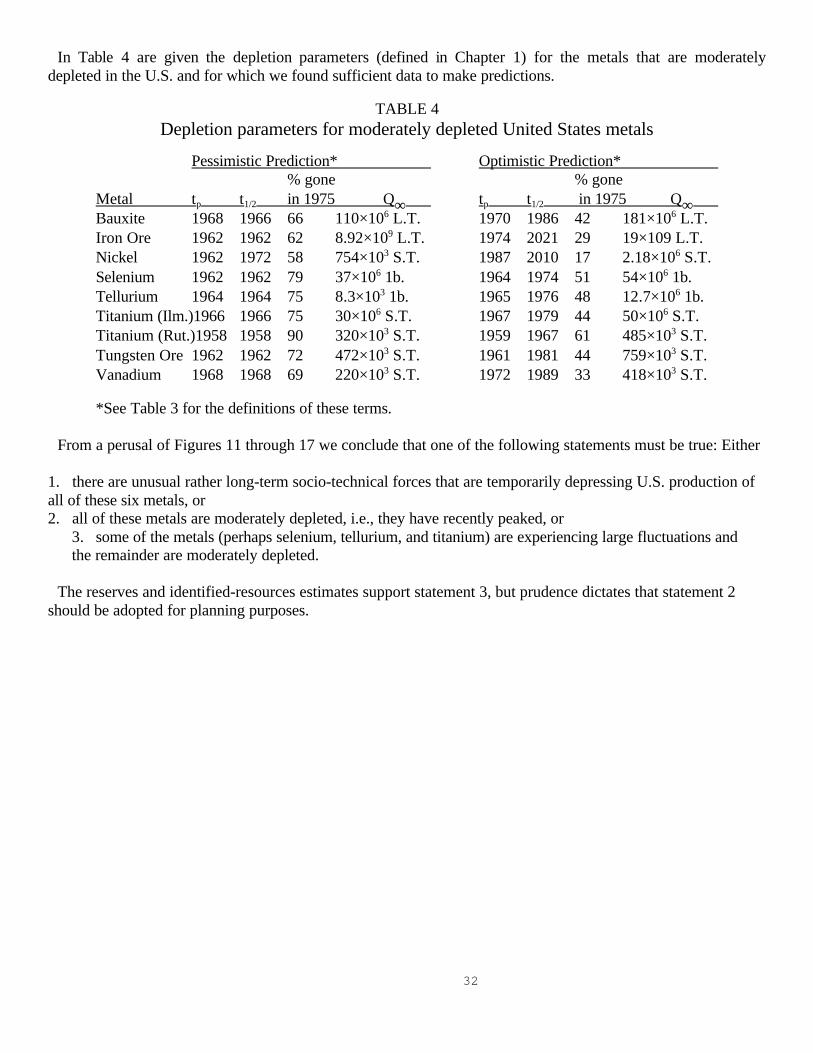
In Table 4 are given the depletion parameters (defined in Chapter 1) for the metals that are moderatelydepleted in the U.S. and for which we found sufficient data to make predictions.
TABLE 4Depletion parameters for moderately depleted United States metals
Pessimistic Prediction* Optimistic Prediction*% gone % gone
Metal tp t1/2 in 1975 Q∞ tp t1/2 in 1975 Q∞ Bauxite 1968 1966 66 110×106 L.T. 1970 1986 42 181×106 L.T.Iron Ore 1962 1962 62 8.92×10⁹ L.T. 1974 2021 29 19×109 L.T.Nickel 1962 1972 58 754×103 S.T. 1987 2010 17 2.18×10⁶ S.T.Selenium 1962 1962 79 37×106 1b. 1964 1974 51 54×106 1b.Tellurium 1964 1964 75 8.3×10³ 1b. 1965 1976 48 12.7×10⁶ 1b.Titanium (Ilm.)1966 1966 75 30×106 S.T. 1967 1979 44 50×106 S.T.Titanium (Rut.)1958 1958 90 320×103 S.T. 1959 1967 61 485×103 S.T.Tungsten Ore 1962 1962 72 472×103 S.T. 1961 1981 44 759×103 S.T.Vanadium 1968 1968 69 220×103 S.T. 1972 1989 33 418×103 S.T.
*See Table 3 for the definitions of these terms.
From a perusal of Figures 11 through 17 we conclude that one of the following statements must be true: Either
1. there are unusual rather long-term socio-technical forces that are temporarily depressing U.S. production ofall of these six metals, or2. all of these metals are moderately depleted, i.e., they have recently peaked, or
3. some of the metals (perhaps selenium, tellurium, and titanium) are experiencing large fluctuations andthe remainder are moderately depleted.
The reserves and identified-resources estimates support statement 3, but prudence dictates that statement 2should be adopted for planning purposes.

33
Chapter 4. Depletion of United States Mineral Fuels It is logical to believe, therefore, that the transition from a mineral fuel economy to one relying upon other sources will be a gradual
process occurring in an orderly fashion over the next hundred years, as a result of technical developments and economic pressure. -E.Steidle, Mineral Forecast 2000 A.D., Pennsylvania State College, State College, PA., 1952.
The metals are in a severe state of depletion in the United States— that is the message of the last two chapters.Surely the U.S. mineral fuels must be in a similar situation. Not so! We shall see below that crude oil andnatural gas are very near their production peaks, but coal is far from peaking. However, indications are thatcoal production rate will rise rapidly to a peak in about seventy years. None of these mineral fuels are pastpeaking, whereas we concluded in the last two chapters that about sixteen metals are past peaking with about adozen of them far past peaking.
Since none of the mineral fuels have peaked yet, we can only conjecture on the extent of asymmetry to expectfor the production curves of the mineral fuels. Hubbert2 assumed that they are symmetric. We shall also makesuch “pessimistic” predictions, but we shall, in addition, assume an asymmetry similar to that of the highlydepleted metals (n=asymmetry parameter=5) to obtain an “optimistic” prediction.
CRUDE OILThe mineral fuel that has been given the most attention in the popular press is crude oil. There have been
many predictions of when we will “run out” of crude oil. A moredefinable prediction to make is the date when crude-oil production willpeak. The oil-production data given in Figure 20 show a recent sharppeak very similar to the sharp peak that occurred at about 1929. Ouranalysis indicates that both of these sharp peaks are short-termfluctuations, but that U.S. crude oil will peak very soon.
Peak date — Half date — 1984, 40% gone in 1975.
Figure 20. Crude oil production data, fits and predictions for symmetric and asymmetric (n=5) fits.
The “optimistic” prediction (n=5) given in Figure 20 is a much poorer fit to the data than is the “pessimistic”prediction, because of a poorer fit to the early-time data. Also, theNational Academy of Sciences 1975 reserves estimatel4 (•) agrees withthe pessimistic prediction. It is reasonable to conclude that the pessimisticprediction is probably nearer the truth than is the optimistic prediction.
An interesting question to ask now is: How early could the production-history prediction method havepredicted the production peak? To test for this, we fitted data only up to a specific date (data-cutoff date)according to the procedure described by Arndt and Roper4.

34
Figure 21. Crude oil peak dates for different data-cutoff dates.
In Figure 21 is shown the predicted peak date as a function of the data-cutoff date. It is seen that the predictedpeak date was too small until about1950. After that date the predictedpeak date was fairly stable withincreasing data-cutoff date; it variedonly by about ten years between 1947and 1974. This result gives usconfidence that our peak-dateprediction is fairly accurate. Also, ittells us that Hubbert2 could have madehis unheeded oil-depletion predictionmuch earlier than 1956. (This methodof testing for peak-date stability couldbe profitably used for other U.S. andworld minerals, which is the subject offurther work in progress.)
Figure 22 is a comparison of the symmetric predictions for data cutoff dates of 1953 (dotted curve), 1963(dashed curve), and 1974 (solid curve). The National Academy ofSciences 1975 reserves estimated (•) is also shown.
We feel that our prediction will turn out to be fairly accurate for U.S.crude oil. There may occur some asymmetry, but we expect that itwill not be very large. It is important to point out that, even if there issome asymmetry, it would change the peak date very little. A majorfactor in the “energy crisis” in which the United States is nowimbedded is the fact that crude oil is very near its production peak.
Figure 22. Crude oil symmetric predictions for data-cutoff dates of 1953 (dottedcurve), 1963 (dashed curve) and 1974 (solid curve).
One interesting general question to ask for this very importantmineral, or for any other mineral, is: Could the United States decide torapidly reduce its crude-oil production rate to, say, half the presentproduction rate and then tail-off the production rate at a much slowerdeceleration than our Figure 22 shows, in order to have a slowertransition from crude oil to other energy sources, or is the shape of thecurve in Figure 22 an inexorable socio-technical “law”?

35
NATURAL GAS
Figure 23 shows our pessimistic (n=1) and optimistic (n=5) adictions fornatural gas for the United States. The two fits are almost equally good.The National Academy of Sciences 1975 reserves estimate14 (•) is onlyslightly larger than the pessimistic prediction and is much smaller than theoptimistic prediction. Indlications are that we should not expect verymuch asymmetry in the production peak.
Peak date — Half date — 1981, 38% gone in 1975.
Figure 23. Natural gas production data, fits and predictions for symmetric andasymmetric (n=5) fits.
36
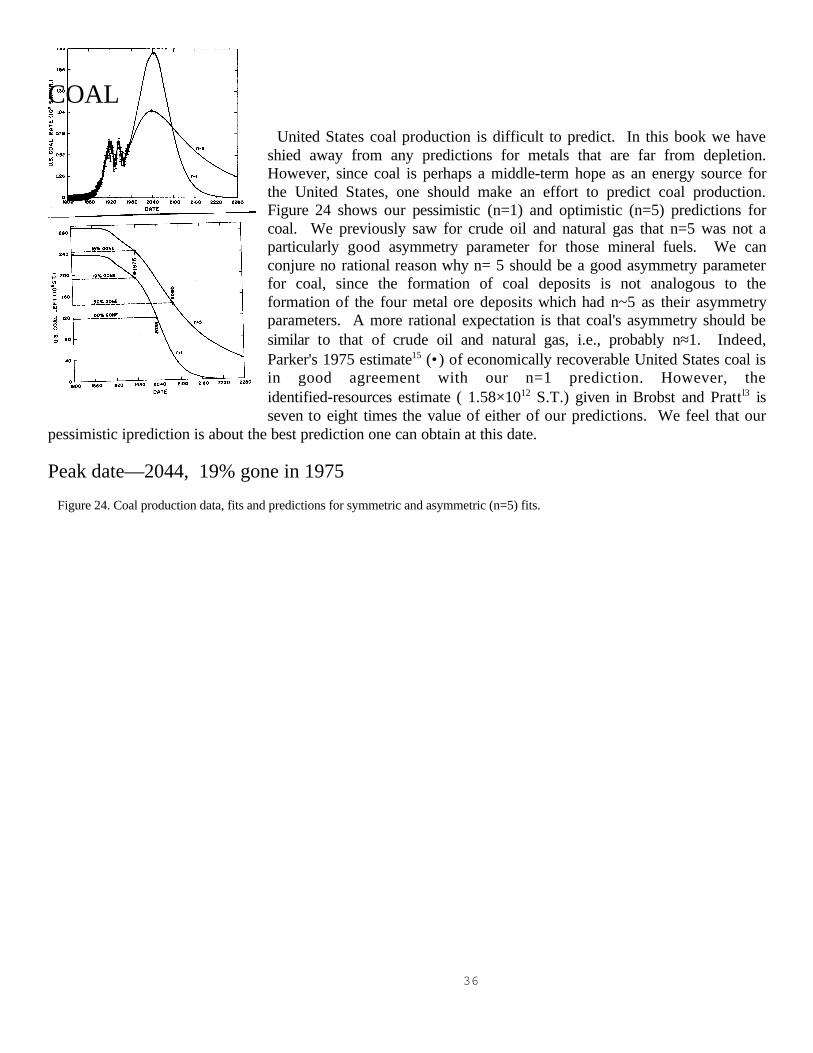
COALUnited States coal production is difficult to predict. In this book we have
shied away from any predictions for metals that are far from depletion.However, since coal is perhaps a middle-term hope as an energy source forthe United States, one should make an effort to predict coal production.Figure 24 shows our pessimistic (n=1) and optimistic (n=5) predictions forcoal. We previously saw for crude oil and natural gas that n=5 was not aparticularly good asymmetry parameter for those mineral fuels. We canconjure no rational reason why n= 5 should be a good asymmetry parameterfor coal, since the formation of coal deposits is not analogous to theformation of the four metal ore deposits which had n~5 as their asymmetryparameters. A more rational expectation is that coal's asymmetry should besimilar to that of crude oil and natural gas, i.e., probably n≈1. Indeed,Parker's 1975 estimate15 (•) of economically recoverable United States coal isin good agreement with our n=1 prediction. However, theidentified-resources estimate ( 1.58×10¹² S.T.) given in Brobst and Prattl3 isseven to eight times the value of either of our predictions. We feel that our
pessimistic iprediction is about the best prediction one can obtain at this date.
Peak date—2044, 19% gone in 1975
Figure 24. Coal production data, fits and predictions for symmetric and asymmetric (n=5) fits.
37
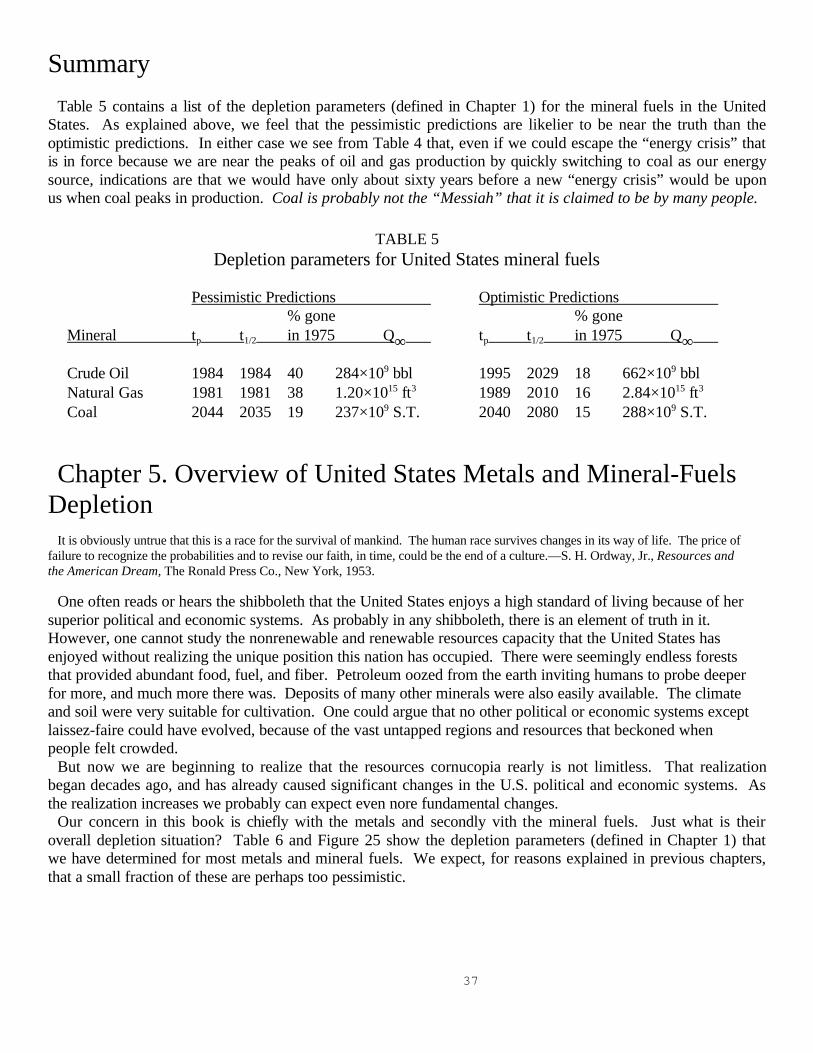
SummaryTable 5 contains a list of the depletion parameters (defined in Chapter 1) for the mineral fuels in the United
States. As explained above, we feel that the pessimistic predictions are likelier to be near the truth than theoptimistic predictions. In either case we see from Table 4 that, even if we could escape the “energy crisis” thatis in force because we are near the peaks of oil and gas production by quickly switching to coal as our energysource, indications are that we would have only about sixty years before a new “energy crisis” would be uponus when coal peaks in production. Coal is probably not the “Messiah” that it is claimed to be by many people.
TABLE 5Depletion parameters for United States mineral fuels
Pessimistic Predictions Optimistic Predictions% gone % gone
Mineral tp t1/2 in 1975 Q∞ tp t1/2 in 1975 Q∞
Crude Oil 1984 1984 40 284×109 bbl 1995 2029 18 662×109 bblNatural Gas 1981 1981 38 1.20×1015 ft3 1989 2010 16 2.84×1015 ft3
Coal 2044 2035 19 237×109 S.T. 2040 2080 15 288×109 S.T.
Chapter 5. Overview of United States Metals and Mineral-FuelsDepletion
It is obviously untrue that this is a race for the survival of mankind. The human race survives changes in its way of life. The price offailure to recognize the probabilities and to revise our faith, in time, could be the end of a culture.—S. H. Ordway, Jr., Resources andthe American Dream, The Ronald Press Co., New York, 1953.
One often reads or hears the shibboleth that the United States enjoys a high standard of living because of hersuperior political and economic systems. As probably in any shibboleth, there is an element of truth in it. However, one cannot study the nonrenewable and renewable resources capacity that the United States hasenjoyed without realizing the unique position this nation has occupied. There were seemingly endless foreststhat provided abundant food, fuel, and fiber. Petroleum oozed from the earth inviting humans to probe deeperfor more, and much more there was. Deposits of many other minerals were also easily available. The climateand soil were very suitable for cultivation. One could argue that no other political or economic systems exceptlaissez-faire could have evolved, because of the vast untapped regions and resources that beckoned whenpeople felt crowded.
But now we are beginning to realize that the resources cornucopia rearly is not limitless. That realizationbegan decades ago, and has already caused significant changes in the U.S. political and economic systems. Asthe realization increases we probably can expect even nore fundamental changes.
Our concern in this book is chiefly with the metals and secondly vith the mineral fuels. Just what is theiroverall depletion situation? Table 6 and Figure 25 show the depletion parameters (defined in Chapter 1) thatwe have determined for most metals and mineral fuels. We expect, for reasons explained in previous chapters,that a small fraction of these are perhaps too pessimistic.

38
TABLE 6United States metals and mineral fuels depletion parameters.
Uncertainty level (column two) of 1 indicates the highest certainty and of 4 indicates the highest uncertainty.
Pessimistic Prediction: Optimistic Prediction:
Uncertainty % gone % goneResource Level tp t1/2 in 1975 Q∞ tp t1/2 in 1975 Q∞
Antimony 4 2000 1978 48 180×103 S.T. ————Bauxite 3 1968 1966 66 110×106 L.T. 1970 1986 42 181×106 L .T.Cadmium 2 1957 1972 54 672×106 1b —Same—Chromite 2 1955 1955 100 1.82×10⁶ S.T. ————Copper 3 2020 2017 20 46.6×10⁶ S.T. ————Gold 1 1916 1916 90 381×106 T.O. —Same—Iron Ore 2 1962 1962 62 8.92×10⁹ L.T. 1974 2021 29 19×109 L.T.Lead 3 1925 1958 60 57.8×10⁶ S.T. —Same—Magnesium 4 2004 2004 20 27×106 S.T. ————Manganese Ore 2 1955 1955 90 5.35×10⁶ S.T. ————Mercury 1 1870 1916 75 4.82×10⁶ (76 lb) —Same—Molybdenum 4 2020 2020 10 25.1×10⁹ 1b ————Nickel 3 1972 1972 58 754×103 S.T. 1987 2010 17 2.18×10⁶ S .T.Niobium-Tantalum 3 1957 1957 100 1.34×10⁶ 1b ————Platinum Group 1 1923 1941 82 2.57×10⁶ T.O. —Same—Selenium 2 1962 1962 79 37×1061b 1964 1974 51 54×1061bSilver 1 1908 1938 70 7.2×10⁹ T.O. —Same—Tellurium 2 1964 1964 75 8.3×10³ 1b 1965 1976 48 12.7×10⁶ 1bTitanium(Ilm.) 2 1966 1966 75 30×106 S.T. 1967 1979 44 50×106 S.T.Titanium (Rut.) 3 1958 1958 90 320×103 S.T. 1959 1967 61 485×103 S.T.Tungsten Ore 3 1962 1962 72 472×103 S.T. 1961 1981 44 759×103 S.T.Vanadium 3 1968 1968 69 220×103 S.T. 1972 1989 33 418×103 S.T.Zinc 2 1943 1968 54 67.1×10⁶ S.T. —Same—Crude Oil 3 1984 1984 40 284×109 bbl 1995 2029 18 662×109 bblNatural Gas 3 1981 1981 38 1.20×1015 ft3 1989 2010 16 2.84×1015 ft3
Coal 4 2040 2035 19 237×109 S.T. 2044 2080 15 288×109 S.T.
39
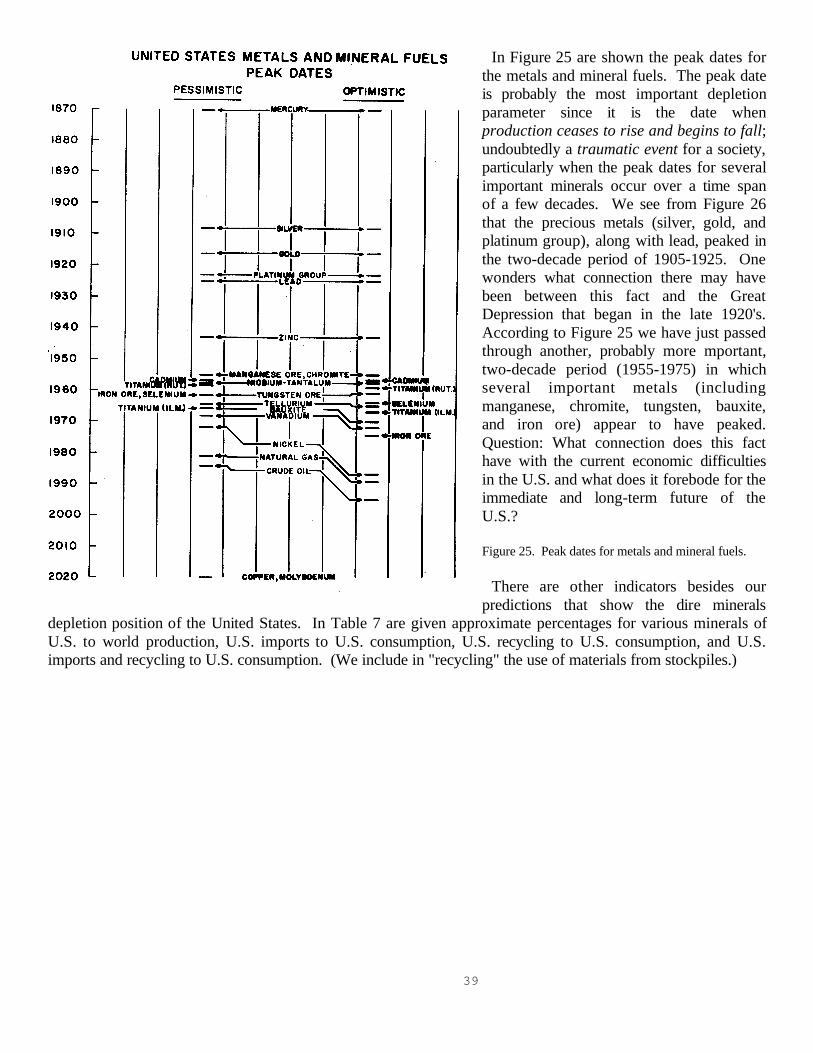
In Figure 25 are shown the peak dates forthe metals and mineral fuels. The peak dateis probably the most important depletionparameter since it is the date whenproduction ceases to rise and begins to fall;undoubtedly a traumatic event for a society,particularly when the peak dates for severalimportant minerals occur over a time spanof a few decades. We see from Figure 26that the precious metals (silver, gold, andplatinum group), along with lead, peaked inthe two-decade period of 1905-1925. Onewonders what connection there may havebeen between this fact and the GreatDepression that began in the late 1920's.According to Figure 25 we have just passedthrough another, probably more mportant,two-decade period (1955-1975) in whichseveral important metals (includingmanganese, chromite, tungsten, bauxite,and iron ore) appear to have peaked.Question: What connection does this facthave with the current economic difficultiesin the U.S. and what does it forebode for theimmediate and long-term future of theU.S.?
Figure 25. Peak dates for metals and mineral fuels.
There are other indicators besides ourpredictions that show the dire minerals
depletion position of the United States. In Table 7 are given approximate percentages for various minerals ofU.S. to world production, U.S. imports to U.S. consumption, U.S. recycling to U.S. consumption, and U.S.imports and recycling to U.S. consumption. (We include in "recycling" the use of materials from stockpiles.)

40
TABLE 7
United States Mineral Production and Consumption Percentages(See footnote 16.)
%of % % % importedMineral World Production imported recycled* or recycled*Antimony 1 30 55 85Arsenic — 89 0 89Asbestos 3 85 0 85Barite 22 40 0 40Bauxite 3 88 0** 88Beryl — 45 1 46Bismuth 11 50 0 50Cadmium 27 54 6 60Chromite 0 97 3 100Coal 18 -10 0 -10Cobalt 5 80 20 100Copper 23 6 40 46Crude Oil 15 40 0 40Fluorine 6 80 0 80Gold 4 15 60 75Helium 98 0 0 0Iron Ore 11 33 30 63Lead 14 20 43 63Manganese Ore 0 — — 100Mercury 6 47 17 64Mica Sheet 0 — — 100Molybdenum 67 -55 0 -55NaturalGas 47 5 0 5Nickel 3 68 20 88Niobium-Tantalum 0 100 0 100Peat 0.2 35 0 35Phosphate Rock 40 -29 0 -29Platinum Group 0.5 78 20 98Selenium 26 37 3 40Silver 17 25 45 70Tellurium 48 32 13 45Thorium 14 0 0 0Tin 0 80 20 100Titanium (Ilm.) 19 25 0 25Titanium (Rut.) 0 100 0 100Tungsten 8 25 0 25Uranium Oxide 55 0 — —Vanadium 22 0 0 0 Zinc 9 50 5 55Zirconium 16 42 4 46
*Including amounts released from private, government, and industry holdings.**Used for other purpose besides metal production. No attempt is made to include metal recycling.
41
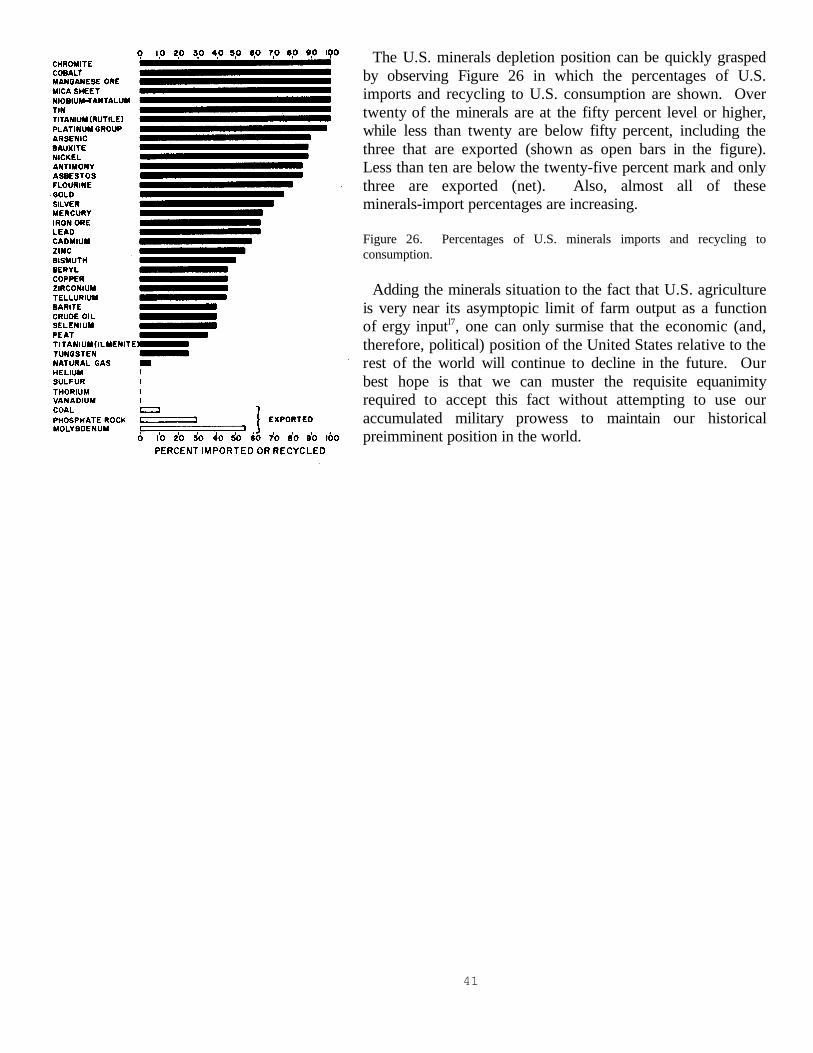
The U.S. minerals depletion position can be quickly graspedby observing Figure 26 in which the percentages of U.S.imports and recycling to U.S. consumption are shown. Overtwenty of the minerals are at the fifty percent level or higher,while less than twenty are below fifty percent, including thethree that are exported (shown as open bars in the figure).Less than ten are below the twenty-five percent mark and onlythree are exported (net). Also, almost all of theseminerals-import percentages are increasing.
Figure 26. Percentages of U.S. minerals imports and recycling toconsumption.
Adding the minerals situation to the fact that U.S. agricultureis very near its asymptopic limit of farm output as a functionof ergy inputl7, one can only surmise that the economic (and,therefore, political) position of the United States relative to therest of the world will continue to decline in the future. Ourbest hope is that we can muster the requisite equanimityrequired to accept this fact without attempting to use ouraccumulated military prowess to maintain our historicalpreimminent position in the world.
42
Chapter 6. Possible Futures for the United StatesNo one has yet given extended thought to items it would be desirable to curtail. Limitations of industrial expansion and consumption
can obviate the day of reckoning and will help us all to reevaluate the quality of the Good Life. -S. H. Ordway, Jr., Resources and theAmerican Dream, The Ronald Press Co., New York, 1953.
Our main point of emphasis in discussing possible futures for the United States is in devising possible waysfor the U.S. to meet the challenge of diminishing domestic sources for minerals to be used for energy andmaterial needs. Because of the central importance of energy, the first question to be asked is: Where will weget energy and how will energy production change with time?
Energy: We showed in Chapter 1 that growth in world energy use from sources other than the sun's energythat presently strikes the earth must level off to zero in about a century from now, if we do not wish todrastically affect the world's weather. It must level off sooner in the U.S. So we are talking about a hugeincrease in energy use over the next century, but not about an indefinite growth in energy use. (See Lapp'sprediction18 of how the growth will subside.) It will not be easy for us to adjust to diminishing growth, let aloneeventual zero growth.
The most stable energy scenario is one in which many variedsources are approximately equally developed, sothat the nation is not subject to unpleasant surprises when the main source of supply goes “sour” in some way.We are facing just such unpleasantness now because we have relied too much on petroleum as our major energysource. We should have learned from this experience not to place our hope in one source again. Yet most ofthe federal energy-research funds have been and are being funneled into nuclear-energy research. A wisercourse would be to channel approximately equal effort and resources into research and development in directsolar energy and waste-derived energy, geothermal and wind energy, petroleum and coal, along with nuclearenergy. It appears fairly certain that if we continue to emphasize mainly nuclear energy, or even both nuclearenergy and coal, we will sentence our descendants to future “energy crises”. This appears to be the most likelyprospect, since the political tendency seems to be to look for single or a few large sources to supply our energy,rather than a large number of small sources. However, I would suggest a more rational, stability-enhancingenergy development program:
1. Use some of the remaining petroleum energy to develop mass-produced wind electric generators, solarheating systems, solar electric cells, and methane gas generators (using organic wastes) to be used in individualhomes, apartment houses, public buildings, and factories.
2. Design the national electric power grids to accept as well asdistribute power at each point in the grid, sothat the many wind, solar cell, and methane-powered electric generators can “store” their produced energy by“loaning” it to someone else in the grid that needs it at the time of production.
3. Develop coal energy with maximum environmentalrestoration and protection and extreme safety and healthprecautions for the workers so that public opinion will support coal as a source of energy over the long haul.(This energy will add to the earth's heat burden.)
4. Slowly and carefully develop nuclear power, making every effort to assure the public of its safety (eliminateinsurance liability limits for nuclear accidents, develop safe storage for radioactive wastes before starting to accumulatelarge amounts of waste, develop and test emergency procedures before proceeding with large-scale power-plantdevelopment, develop and test security for nuclear materials before producing them in large amounts, etc.). (This energywill add to the earth's heat burden.)
5. Develop large-scale solar power stations on earth to be incorporated into the power grid.6. Carefully develop, where possible and with extreme environmental precautions, large-scale geothermal
power stations to be incorporated into the power grid. (This energy will add to the atmosphere's heat burden.)7. Carefully develop, where possible and with extreme environmental precautions, large scale wind power
stations to be incorporated into the power grid.
43
8. Legislate extreme energy conservation measures19 in manufacturing processes and in design ofmanufactured products.
9. Develop multihybrid electric cars, buses, trucks, and tractors whose batteries or other energy storagedevices can be recharged by an onboard small highly efficient engine, by onboard solar cells, by regenerativebraking, or by external electric power sources.
10. Experiment with solar power stations in space. These stations may be able to transmit some energy backto earth, but their greatest use may be for space colonization. Any energy that they transmit to the earth willadd to the earth's heat burden. (The only way that population and economic growth can continue past anothercentury or two is by man colonizing the solar system20. )
This multifaceted energy system described above can be summarized by three characteristics:
1. Maximum use of the solar energy that impinges on the earth, since it does not add to the earth's heat burden.Probably not more than a fraction of a percent of this energy can be utilized.
2. A constant power level from heat-burdening power sources (coal, nuclear, geothermal, space solar) that ismuch less than one percent of the solar energy that impinges on the earth.
3. A power grid with independent individual and large-scale components that can continue to function whensome “energy crisis” occurs in a component of the system. For example, when power lines are severed or largepower plants have troubles, the individual small generators partially carry the load; or when a major nuclearaccident occurs and all nuclear plants must be closed for inspection, coal and solar power stations increase theirshare of the load.
Proponents of “all apples in the nuclear barrel” instead of a multifaceted system argue that there is not time todevelop all of the systems if we are going to maintain our rate of energy growth. They further argue that wemust maintain our rate of energy growth or we will have social upheaval because of the lack of jobs and theconcomitant lack of the material for human survival. We have shown in Chapter 1 that the rate of energygrowth must approach zero within the next century. It is not too soon to begin the decline; the sooner webegin the decline the less sudden the decline will be and the easier will be our adjustment to it. We mustsoon learn how to distribute the necessary material resources among the populace without depending ongrowth in energy and material usage on earth. (Of course, growth could continue by humans colonizingsome other part of the solar system20.)
Materials: So much for energy. What should we do as the metals and other minerals require huge amounts ofenergy and materials investment in order to mine the remaining dregs? There is little choice: We have todevelop efficient recycling, a small amount of which is already occurring (see Table 7).
There are large energy and materials costs to recycling; it would take an enormous amount of energy andmaterials investment to achieve near total recycling. The metals that are dispersed as “dust” in machining,wearing, and rusting and other chemical reactions are usually lost to further use. According to a recent report21
the amount of recycling will be very difficult to get above 60 percent. Let us be generous and assume that weshall manage to recycle 90 percent of all metals. Assume that at some future time we shall completely use allof the metals that are available in the course of one year. At a 90 percent recycling rate, ten years later only 35percent of the original amount will be left for use and twenty years later only 12 percent will be left. Even thisunrealistically generous recycling rate leads to rapid disappearance of mineral resources. If we insist oncontinued industrial growth leading to huge increases in uses of minerals we shall very soon face the problemof equal or greater rapid decline in minerals use. It would be much more desirable to intentionally andgradually slow down the rate of minerals usage growth now to give us more time to adjust to mineralsdepletion. Is such a course of action possible or is there a sociotechnical law that mandates a rapid risefollowed by a rapid fall in minerals usage?
44
I would not counsel despair. It will be an exciting humanistic and technological challenge to work towarddeveloping a society that simultaneously maximizes personal independence, societal stability, and harmonywith the rest of nature.
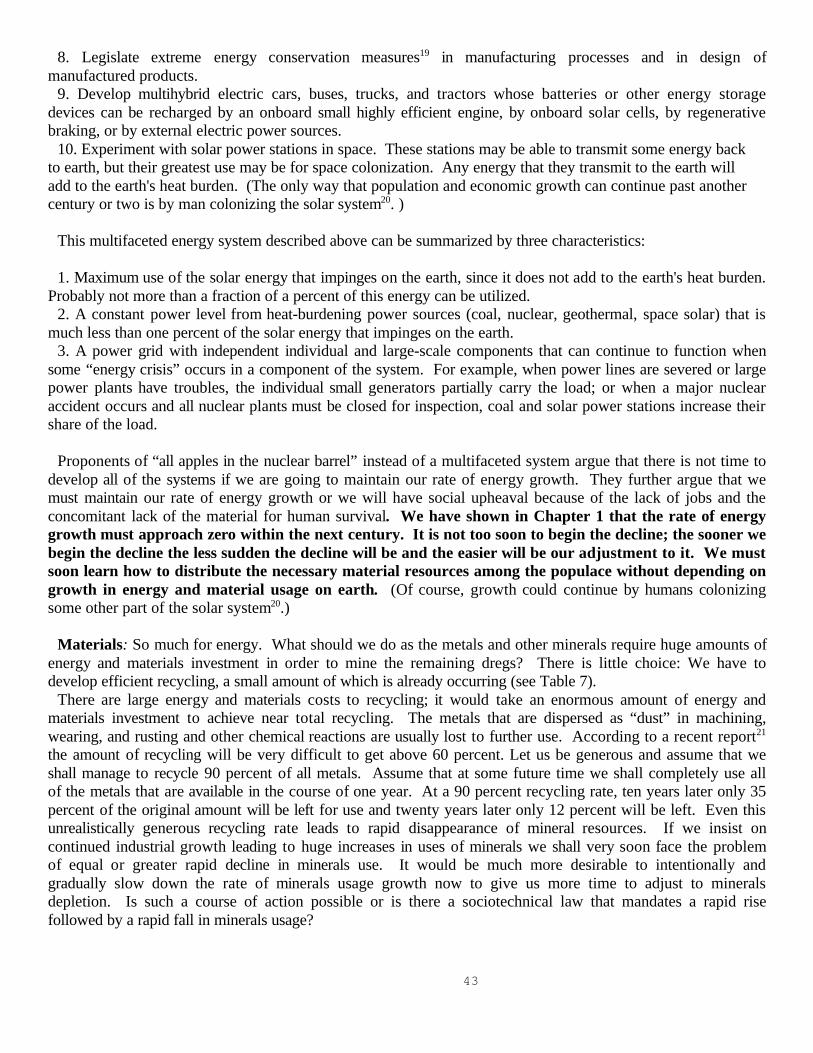
Population: We have mentioned the needfor gradually slowing energy and mineralsusage growth to zero within the nextcentury. This would not seem such aformidable task if world population wereconstant or even if world populationgrowth could be gradually diminished overthe next century. There are no indicationsin the world population statistics that suchdiminishment will occur. As shown inFigure 27, world population22 is currentlygrowing at least exponentially (a straightline in the figure) and is extrapolated tocontinue such growth to the year 2000.
Figure 27. World population for exponentialgrowth extrapolation.
Further exponential extrapolation of thepresent growth rate yields one person persquare meter (149×1012 people) by aboutthe year 2550. It is obvious that the growthrate has to considerably slow down in thenext few centuries. However, to solve ourenergy and minerals problems we need toslow down population growth in the nextcentury. Poleman23 claims that worldpopulation will mimic the slowing of theU.S. population as material abundanceenables adequate per capita healthfacilities, social security, and education.
45
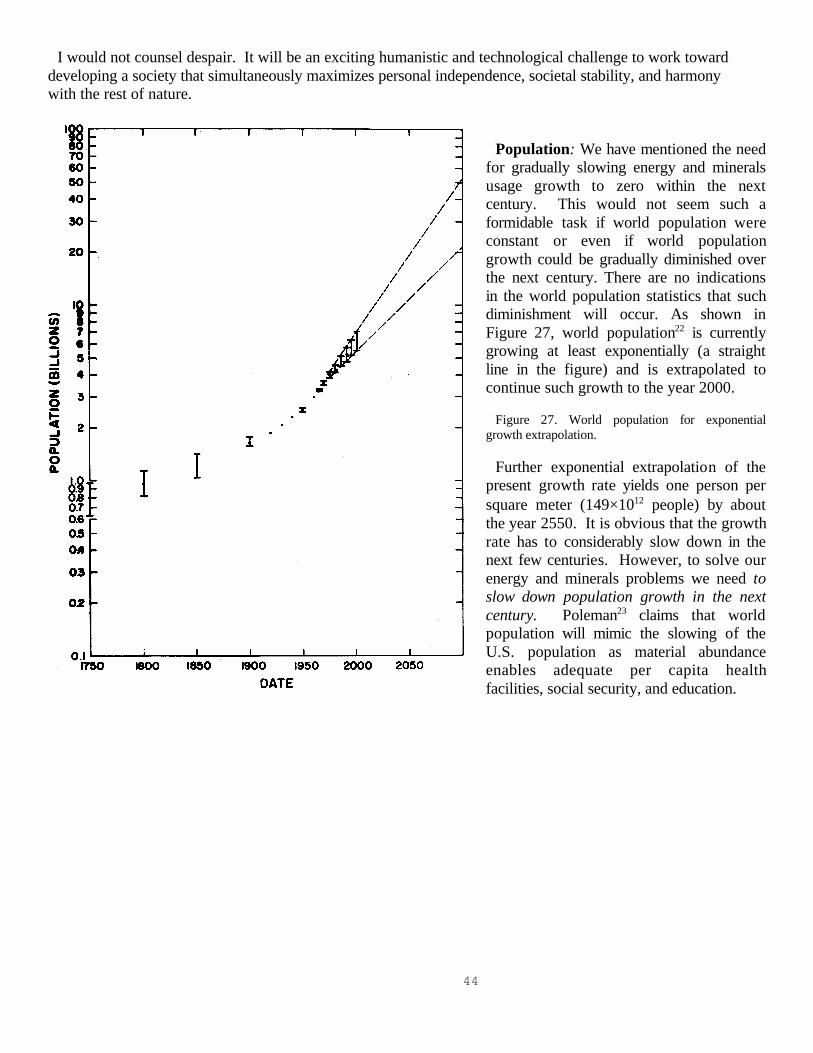
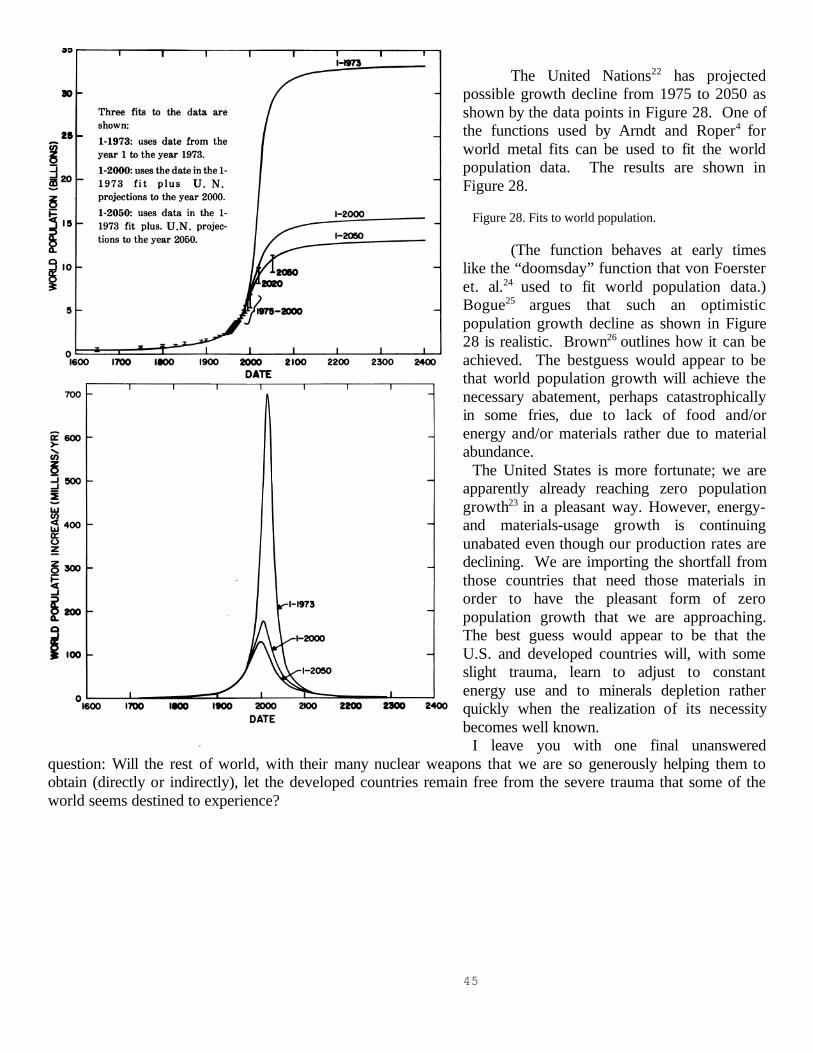
The United Nations22 has projectedpossible growth decline from 1975 to 2050 asshown by the data points in Figure 28. One ofthe functions used by Arndt and Roper4 forworld metal fits can be used to fit the worldpopulation data. The results are shown inFigure 28.
Figure 28. Fits to world population.
(The function behaves at early timeslike the “doomsday” function that von Foersteret. al.24 used to fit world population data.)Bogue25 argues that such an optimisticpopulation growth decline as shown in Figure28 is realistic. Brown26 outlines how it can beachieved. The bestguess would appear to bethat world population growth will achieve thenecessary abatement, perhaps catastrophicallyin some fries, due to lack of food and/orenergy and/or materials rather due to materialabundance.
The United States is more fortunate; we areapparently already reaching zero populationgrowth23 in a pleasant way. However, energy-and materials-usage growth is continuingunabated even though our production rates aredeclining. We are importing the shortfall fromthose countries that need those materials inorder to have the pleasant form of zeropopulation growth that we are approaching.The best guess would appear to be that theU.S. and developed countries will, with someslight trauma, learn to adjust to constantenergy use and to minerals depletion ratherquickly when the realization of its necessitybecomes well known.
I leave you with one final unansweredquestion: Will the rest of world, with their many nuclear weapons that we are so generously helping them toobtain (directly or indirectly), let the developed countries remain free from the severe trauma that some of theworld seems destined to experience?
46
References1. By “available amount” is meant the amount that man finally deems worthwhile to extract. As the energy, material investment, and
environmental degradation for further extraction of a given mineral increases, society gradually decides that there are other pursuitsmore worth the expenditure, even though there still may be huge amounts of the mineral left somewhere in the earth's crust.
2. M. King Hubbert. 1956. Nuclear Energy and Fossil Fuels: American Petroleum Institute, Drilling and Production Practice, 7-25.Hubbert describes this early work and his later work in an article in the reference given in footnote 9 below.
3. E. Steidle. 1952. Mineral Forecast 2000 A.D., The Pennsylvania State College, State College, Pa.4. R. A. Arndt and L. D. Roper. 1976. Depletion of United States and World Mineral Resources, University Publication, Box 47,
Blacksburg, Virginia 24060. An abbreviated version of this work, which omits the data tables and mathematics of depletion theory, isavailable: The Metals and Mineral Fuels Crises: Facts and Predictions.
5. E. Cook. 1975. Tech. Rev. 77, No. 7, p. 15.6. R. W. Page. 1973. Models of Doom: A Critique of the Limits to Growth, ed. by H. S. D. Cole, C. Freeman, M. Jahoda, and K. L.
R. Pavitt, Universe Books, N.Y., p. 33.7. Geologists usually prefer the word “projections” which implies somewhat uncertain predictions, rather than “predictions.” We use
the word “predictions” and then assign levels of uncertainty to the predictions.8. J. Maddox. 1972. The Doomsday Syndrome, McGraw-Hill Book Co., N.Y.9. Several excellent articles on many aspects of energy, including nuclear energy, are collected in L. C. Ruedisili and M. W.
Firebaugh. 1975. Perspectives on Energy: Issues, Ideas, and Environmental Dilemmas Oxford Univ. Press, N.Y.10. See p. 41 of the reference given in footnote 9.11. L. C. Cole. 1969. Bioscience, 19, 989. Also, see F. J. Dyson. 1975. Bull. of Atom. Sci, (June), p. 23 for an optimistic view of man
eventuallycontrolling the earth's weather.12. D. F. Frasché. 1962. Mineral Resources, A Report to the Committee on Natural Resources of the National Academy of Sciences
—National Research Council, Pub. 1000-C, Nat. Acad. of Sci.—Nat. Res. Counc., Wash., D. C.13. D. A. Brobst and W. P. Pratt, Ed. 1973. Geological Survey Professional Paper 820, U. S. Gov, Printing Off., Wash., D. C.14. National Academy of Sciences—National Research Council. 1975. News Report XXV, No. 2, February.15. A. Parker. 1975. Energy Policy, (March), p. 58.16. These data are taken or calculated from the reference given in footnote 13 and from Mineral Facts and Problems, 1970 edition,
Bureau of Mines Bul. 650, U.S. Gov. Printing Off., Wash., D C. Some of the values given may be as much as ten percent incorrect,because of lack of recent data and different methods of calculation.
17. See p. 50 of the reference given in footnote 9.18. See p. 17 of the reference given in footnote 9.19. D. Hayes. 1976. Energy: The Case for Conservation. Worldwatch Institute, Wash., D. C.20. G. K. O'Neill. 1974. Phys. Today, 27, No. 9 (Sept.), p. 32; E. Burgess, 1976. Astronomy, 4, No. 1 (January), p. 18.21. National Advisory Council for Development Cooperation—Netherands. 1975. Report No. 53, “Recommendations on the Future
Availability of Metallic Minerals,” The Hague, Netherlands.22. Population data and projections are taken from United Nations Statistical Yearbook. 1949-1974. United Nations, N.Y.; P.S.
Putnam. 1953. Energy in the Future, D. Van Nostrand, N.Y.; H. Kahn and A. J. Wiener. 1967. The Year 2000, Macmillan, N.Y.; J. D.Durand. 1967. Proc. of Amer. Phil. Soc., 111, No.3, 136; P. R. Ehrlich and A. H. Ehrlich. 1970. Population Resources Environment, V,Appendix 2, W. H. Freeman and Co., San Francisco.
23.T. T. Poleman. 1975. Science, 188, 510.24. H. von Foerster, P. M. Mora, and L. W. Amiot. 1960. Science, 132, 1291 see also S. von Hoerner. 1975. J. Brit. Plan. Soc., 28,
691.25. D. J. Bogue. 1967. The Public Interest, No. 7 (Spring), 11.
26. L. R. Brown. 1974. In the Human Interest, W. W. Norton and Co., N.Y.
Related Documents