Welcome message from author
This document is posted to help you gain knowledge. Please leave a comment to let me know what you think about it! Share it to your friends and learn new things together.
Transcript
2
TABLE OF CONTENTS
1. Indian Alcoholic Beverages Market Introduction
2. Indian Alcoholic Beverages Market Size, FY’2005 – FY’2010
3. Indian Alcoholic Beverage Government Licensing and Regulations
4. Indian Alcoholic Beverage Market Segmentation by Product, FY’2005 – FY’2010
5. Indian Country Liquor Industry Market Introduction
5.1. Indian Country Liquor Market Size, FY’2005-FY’2010
5.2. Indian Country Liquor Market Trends and Developments
5.3. Indian Country Liquor Future Outlook
5.3.1. Cause and Effect Relationship between Dependent and independent factors prevailing in Indian Country Liquor Industry
5.3.2. Indian Country Liquor Industry Projections, FY’2011 – FY’2015
6. Indian Beer Industry Market Introduction
6.1. Indian Beer Industry Market Size, FY’2005-FY’2010
6.2. Indian Beer Industry Market Segmentation
6.2.1. By Alcohol Content, FY’2010
6.2.2. By Brews, FY’2010
6.3. Indian Beer Industry Trends and Developments
6.4. Indian Beer Industry Competitive Landscape
6.5. Beer Company Profiles
6.5.1. United Breweries Ltd (UBL)
Company Overview
Business Strategies
Financial Performance
6.5.2. Sab Miller
Company Overview
Business Strategies
Financial Performance

3
6.5.3. Mohan Meakins
Company Overview
6.6. Indian Beer Market Future Outlook
6.6.1. Cause and Effect Relationship between dependent and independent factors prevailing in Indian Beer Industry
6.6.2. Indian Beer Industry Projections, FY’2011 – FY’2015
7. Indian Made Foreign Liquor (IMFL) Industry Market Introduction
7.1. IMFL Market Size, FY’2005-FY’2010
7.2. IMFL Market Segmentation, FY’2010 – FY’2015
7.2.1. Indian Whisky Market Size, FY’2005-FY’2010
7.2.2. Indian Brandy Market Size, FY’2005-FY’2010
7.2.3. Indian Rum Market Size, FY’2005-FY’2010
7.2.4. Indian Vodka Market Size, FY’2005-FY’2010
7.2.5. Indian Gin Market Size, FY’2005-FY’2010
7.2.6. IMFL Industry Trends and Developments
7.3. IMFL Market Competitive Landscape
7.4. IMFL Company Profiles
7.4.1. United Spirits Ltd (USL)
Business Strategies
Financial performance
7.4.2. Pernod Ricard (India)
Company Overview
Business Strategies
7.4.3. Radico Khaitan
Company overview
Business Strategy
Financial Performance
7.4.4. Allied Blenders & Distillers (ABD)

4
Company Overview
Business Strategies
Financial Performance
7.5. IMFL Market Future Outlook
7.5.1. Cause and Effect Relationship between dependent and independent factors prevailing in IMFL Industry
7.5.2. IMFL Industry Projections, FY’2011 – FY’2015
7.5.2.1. Whisky Industry Projections, FY’2011 – FY’2015
7.5.2.2. Brandy Industry Projections, FY’2011 – FY’2015
7.5.2.3. Rum Industry Projections, FY’2011 – FY’2015
7.5.2.4. Vodka Industry Projections, FY’2011 – FY’2015
7.5.2.5. Gin Industry Projections, FY’2011 – FY’2015
8. Indian Wine Industry Market Introduction
8.1. Indian Wine Market Size, FY’2005-FY’2010
8.2. Indian Wine Market Segmentation
8.2.1. By Product, FY’2010
8.2.2 By Place, FY’2010
8.2.3 By Type of trade, FY’2010
8.3. Indian Wine Industry Trends and Developments
8.4. Indian Wine Market Competitive Landscape
8.5. Indian Wine Market Future Outlook
8.6.1. Cause and Effect Relationship between dependent and independent factors prevailing in Indian Wine Industry
8.6.2. Indian Wine Industry Projections, FY’2011 – FY’2015
9. Indian Alcoholic Beverages Industry Trends and Developments
10. Indian Alcoholic Beverage Industry SWOT Analysis
Strengths
Weakenesses
Opportunities
5
Threats
11. Indian Alcoholic Beverages Market Future Outlook
11.1. Indian Alcoholic Beverages Industry Projections, FY’2011 – FY’2015
12. India Macro Economic Indicators: Current and Projections
12.1. Population of 20 years and above, 2005-2015
12.2. Consumer Expenditure on Food, Beverage and Tobacco, 2007-2015
13. Appendix
13.1. Market Definition
13.2. Abbreviations
13.3. Research Methodology
Data Collection Methods
Approach
Variables (Dependent and Independent)
Multi Factor Based Sensitivity Model
Scenario Analysis
Final Conclusion
13.4. Disclaimer
6
LIST OF FIGURES
Figure 1: Indian Alcoholic Beverages Market Consumption in Million Cases and Consumption per Capita in Litres, FY’2005-FY’2010
Figure 2: Indian Alcoholic Beverage Market Segmentation by Product on the basis of Consumption, in Percentage, FY’2005-FY’2010
Figure 3: Indian Country Liquor Market Consumption in Million Cases and Consumption per Capita in Litres, FY’2005-FY’2010
Figure 4: Indian Country Liquor Industry Projections in terms of Consumption in Million Cases, FY’2011-FY’2015
Figure 5: Indian Country Liquor Industry Projections in terms of Consumption per Capita in Litres, FY’2011-FY’2015
Figure 6: Indian Beer Industry Market Consumption in Million Cases and Consumption per Capita in Litres, FY’2005 - FY’2010
Figure 7: Indian Beer Industry Segmentation by Product on the basis of Alcohol Content in Percentage, FY’2010
Figure 8: Indian Beer Industry Segmentation by Type of Brews, in Percentage, FY’2005-FY’2010
Figure 9: Beer Consumption Trends by Gender in Percentage, FY’2010
Figure 10: Beer Consumption Trends among Urban and Rural Population in Percentage, FY’2010
Figure 11: Beer Consumption Trends by Age Group in Percentage, FY’2010
Figure 12: Indian Beer Companies’ Market Share in Percentage, FY’2010
Figure 13: Indian Beer Companies’ Sales in Million Cases, FY’2010
Figure 14: United Breweries’ Beer Sales Volume in Million Cases and Sales Value in USD Million, FY’2006 –FY’2011
Figure 15: United Breweries’ Major Brands (Kingfisher Strong and Premium) Sales in Million Cases, FY’2006-FY’2010
Figure 16: SABMiller’s Beer volume Sales in Million Cases, Value sales in USD million, FY’2006 –FY’2011
Figure 17: Indian Beer Industry Market Projections in terms of Consumption in Million Cases, FY’2011-FY’2015

7
Figure 18: Indian Beer Industry Projections in terms of Consumption in Million Cases, FY’2011-FY’2015
Figure 19: Indian Beer Industry Projections in terms of Consumption per Capita in Litres, FY’2011-FY’2015
Figure 20: IMFL Market Consumption in Million Cases and Consumption per Capita in Litres, FY’2005-FY’2010
Figure 21: IMFL Market Segmentation by Product on the basis of Consumption in Percentage, FY’2005-FY’2010
Figure 22: Whisky Market Consumption in Million Cases and Consumption per Capita in Litres, FY’2005-FY’2010
Figure 23: Indian Whisky Market Share of Major Brands, in Percentage, FY’2011
Figure 24: Brandy Market Consumption in Million Cases and Consumption per Capita in Litres, FY’2005-FY’2010
Figure 25: Brandy Consumption Market Segmentation by Location in Percentage, FY’2010
Figure 26: Indian Brandy Market Share of Major Brands, in Percentage, FY’2010
Figure 27: Rum Market Consumption in Million Cases and Consumption per Capita in Litres, FY’2005-FY’2010
Figure 28: Indian Vodka Market Consumption in Million Cases and Consumption per Capita in Milliliters, FY’2005-FY’2010
Figure 29: Indian Gin Market Consumption in Million Cases and Consumption per Capita in Milliliters, FY’2005-FY’2010
Figure 30: IMFL Companies’ Market Share in Percentage, FY’2010
Figure 31: United Spirits Ltd’s Sales in Million Cases, FY’2006 –FY’2011
Figure 32: Radico Khaitan’s Sales in Volume in Million Cases and in Value in USD Million, FY’2009- FY’2011
Figure 33: Allied Blenders & Distillers’ IMFL Sales in Million Cases, FY’2007 –FY’2011
Figure 34: IMFL Industry Projections in terms of Consumption in Million Cases, FY’2011-FY’2015
Figure 35: IMFL Industry Projections in terms of Consumption per Capita in Litres, FY’2011-FY’2015
Figure 36: Whisky Industry Projections in terms of Consumption in Million Cases, FY’2011-FY’2015

8
Figure 37: Whisky Industry Projections in terms of Consumption per Capita in Litres, FY’2011-FY’2015
Figure 38: Brandy Industry Projections in terms of Consumption in Million Cases, FY’2011-FY’2015
Figure 39: Brandy Industry Projections in terms of Consumption per Capita in Litres, FY’2011-FY’2015
Figure 40: Rum Industry Projections in terms of Consumption in Million Cases, FY’2011-FY’2015
Figure 41: Rum Industry Projections in terms of Consumption per Capita in Litres, FY’2011-FY’2015
Figure 42: Vodka Industry Projections in terms of Consumption in Million Cases, FY’2011-FY’2015
Figure 43: Vodka Industry Projections in terms of Consumption per Capita in Milliliters, FY’2011-FY’2015
Figure 44: Gin Industry Projections in terms of Consumption in Million Cases, FY’2011-FY’2015
Figure 45: Gin Industry Projections in terms of Consumption per Capita in Milliliters, FY’2011-FY’2015
Figure 46: Indian Wine Market Consumption in Million Cases, and Consumption per Capita in Milliliters, FY’2005-FY’2010
Figure 47: Indian Wine Industry Market Consumption by Product Type in Percentage, FY’2010
Figure 48: Indian Wine Market Consumption by Place, in Percentage, FY’2010
Figure 49: Indian Wine Sales by Type of Trade, in Percentage, FY’2010
Figure 50: Wines Manufacturing Companies’ Market Share in India in Percentage, FY’2010
Figure 51: Indian Wine Industry Projections in terms of Consumption in Million Cases, FY’2011-FY’2015
Figure 52: Indian Wine Industry Projections in terms of Consumption per Capita in Milliliters, FY’2011-FY’2015
Figure 53: Indian Alcoholic Beverages Market Future Projections in terms of Consumption in Million Cases, FY’2011-FY’2015
9
Figure 54: Indian Alcohol Beverage Industry Projections in terms of Consumption per Capita in Litres, FY’2011-FY’2015
Figure 55: Population of 20 years and above in Million, 2005-2015
Figure 56: Consumer Expenditure on Food, Beverage and Tobacco in USD Million, 2007-2015

10
LIST OF TABLES
Table 1: Indian Governments’ Alcoholic Beverages Regulations Present Scenario and Impact
Table 2: Cause and Effect Relationship Analysis between Industry Factors and Expected Country Liquor Market Prospects
Table 3: Indian Country Liquor Industry Projections in terms of Consumption in Million Cases, FY’2011-FY’2015
Table 4: United Breweries’ Major Brands and their Performance
Table 5: SABMiller’s Major Brands and their Performance
Table 6: Mohan Meakins’ Major brands in Each Segment
Table 7: Cause and Effect Relationship Analysis between Industry Factors and Expected Beer Market Prospects
Table 8: Indian Whisky Market Sales of Major Brands, in Million Cases, FY’2011
Table 9: IMFL Companies’ Sales in Million Cases, FY’2010
Table 10: USL Key Brands Sales for Whisky Segment in Million Cases, CY’2006-CY’2010
Table 11: USL Key Brands Sales for Brandy Segment in Million Cases, CY’2006-CY’2010
Table 12: USL Key Brands Sales for Rum Segment in Million Cases, CY’2006-CY’2010
Table 13: USL Key Brands Sales for Gin Segment in Million Cases, CY’2006-CY’2010
Table 14: USL Key Brands Sales for Vodka Segment in Million Cases, CY’2006-CY’2010
Table 15: USL’s Key Brands and their Performance Indicators
Table 16: Pernod Ricard’s Key Brands and their Performance Indicators
Table 17: Radico Khaitan’s Key Brands and their Performance Indicators
Table 18: Allied Blenders & Distillers’ Key Brands and Performance Indicators
Table 19: Cause and Effect Relationship Analysis between Industry Factors and Expected IMFL industry Prospects
Table 20: IMFL Industry Projections in terms of Consumption in Million Cases, FY’2011-FY’2015
Table 21: Whisky Industry Projections in terms of Consumption in Million Cases, FY’2011-FY’2015
11
Table 22: Brandy Industry Projections in terms of Consumption in Million Cases, FY’2011-FY’2015
Table 23: Rum Industry Projections in terms of Consumption in Million Cases, FY’2011-FY’2015
Table 24: Vodka Industry Projections in terms of Consumption in Million Cases, FY’2011-FY’2015
Table 25: Wines Manufacturing Companies’ Sales in India in Million Cases, FY’2010
Table 26: Competitive Landscape of Major Players in the Indian Wine Industry
Table 27: Cause and Effect Relationship Analysis between Industry Factors and Expected Wine Market Prospects
Table 28: Indian Wine Industry Projections in terms of Consumption in Million Cases, FY’2011-FY’2015
Table 29: Indian Alcoholic Beverages Market Future Projections in terms of Consumption in Million Cases, FY’2011-FY’2015
Table 30: Correlation Matrix
Table 31: Regression Coefficients Output
12
LIST OF TABLES
Table 1: Indian Governments’ Alcoholic Beverages Regulations Present Scenario and Impact
Table 2: Cause and Effect Relationship Analysis between Industry Factors and Expected Country Liquor Market Prospects
Table 3: Indian Country Liquor Industry Projections in terms of Consumption in Million Cases, FY’2011-FY’2015
Table 4: United Breweries’ Major Brands and their Performance
Table 5: SABMiller’s Major Brands and their Performance
Table 6: Mohan Meakins’ Major brands in Each Segment
Table 7: Cause and Effect Relationship Analysis between Industry Factors and Expected Beer Market Prospects
Table 8: Indian Whisky Market Sales of Major Brands, in Million Cases, FY’2011
Table 9: IMFL Companies’ Sales in Million Cases, FY’2010
Table 10: USL Key Brands Sales for Whisky Segment in Million Cases, CY’2006-CY’2010
Table 11: USL Key Brands Sales for Brandy Segment in Million Cases, CY’2006-CY’2010
Table 12: USL Key Brands Sales for Rum Segment in Million Cases, CY’2006-CY’2010
Table 13: USL Key Brands Sales for Gin Segment in Million Cases, CY’2006-CY’2009
Table 14: USL Key Brands Sales for Vodka Segment in Million Cases, CY’2006-CY’2009
Table 15: USL’s Key Brands and their Performance Indicators
Table 16: Pernod Ricard’s Key Brands and their Performance Indicators
Table 17: Radico Khaitan’s Key Brands and their Performance Indicators
Table 18: Allied Blenders & Distillers’ Key Brands and Performance Indicators
Table 19: Cause and Effect Relationship Analysis between Industry Factors and Expected IMFL industry Prospects
Table 20: IMFL Industry Projections in terms of Consumption in Million Cases, FY’2011-FY’2015
Table 21: Whisky Industry Projections in terms of Consumption in Million Cases, FY’2011-FY’2015

13
Table 22: Brandy Industry Projections in terms of Consumption in Million Cases, FY’2011-FY’2015
Table 23: Rum Industry Projections in terms of Consumption in Million Cases, FY’2011-FY’2015
Table 24: Vodka Industry Projections in terms of Consumption in Million Cases, FY’2011-FY’2015
Table 25: Wines Manufacturing Companies’ Sales in India in Million Cases, FY’2010
Table 26: Competitive Landscape of Major Players in the Indian Wine Industry
Table 27: Cause and Effect Relationship Analysis between Industry Factors and Expected Wine Market Prospects
Table 28: Indian Wine Industry Projections in terms of Consumption in Million Cases, FY’2011-FY’2015
Table 29: Indian Alcoholic Beverages Market Future Projections in terms of Consumption in Million Cases, FY’2011-FY’2015
Table 30: Correlation Matrix
Table 31: Regression Coefficients Output
14
INDIAN ALCOHOLIC BEVERAGES MARKET
INDIAN ALCOHOLIC BEVERAGES MARKET SIZE, FY’2005 – FY’2010
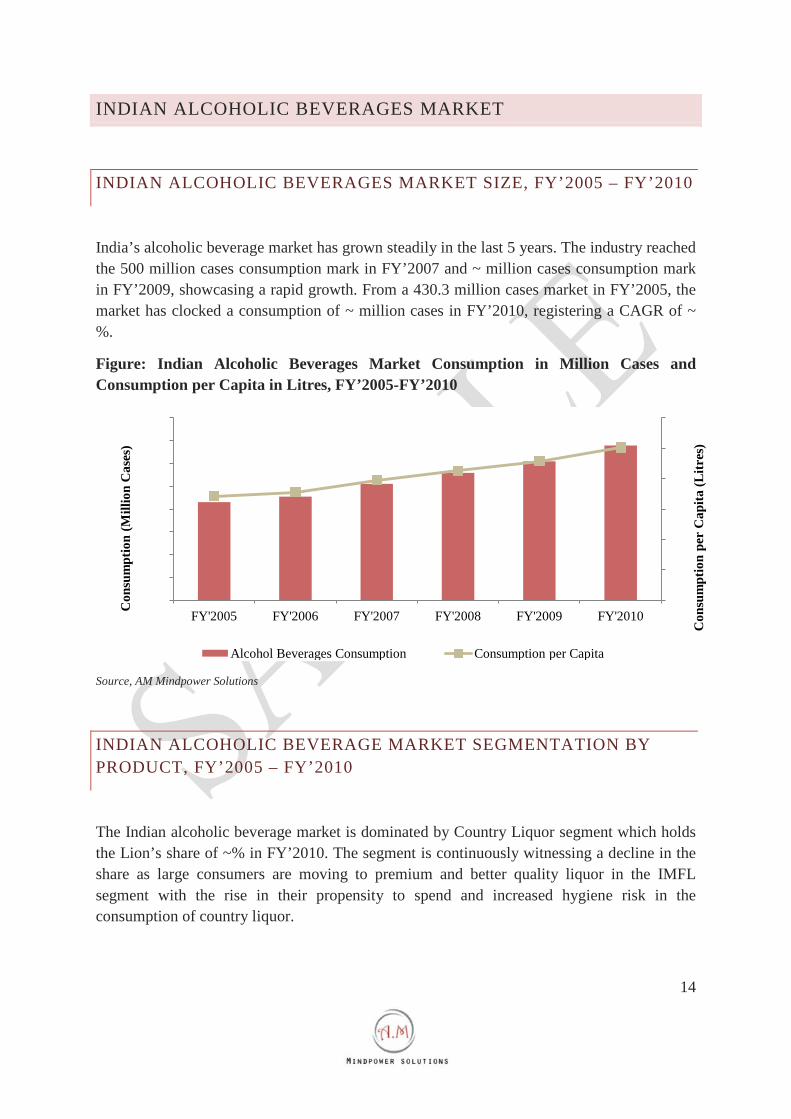
India’s alcoholic beverage market has grown steadily in the last 5 years. The industry reached the 500 million cases consumption mark in FY’2007 and ~ million cases consumption mark in FY’2009, showcasing a rapid growth. From a 430.3 million cases market in FY’2005, the market has clocked a consumption of ~ million cases in FY’2010, registering a CAGR of ~ %.
Figure: Indian Alcoholic Beverages Market Consumption in Million Cases and Consumption per Capita in Litres, FY’2005-FY’2010
Source, AM Mindpower Solutions
INDIAN ALCOHOLIC BEVERAGE MARKET SEGMENTATION BY PRODUCT, FY’2005 – FY’2010
The Indian alcoholic beverage market is dominated by Country Liquor segment which holds the Lion’s share of ~% in FY’2010. The segment is continuously witnessing a decline in the share as large consumers are moving to premium and better quality liquor in the IMFL segment with the rise in their propensity to spend and increased hygiene risk in the consumption of country liquor.
0.0
1.0
2.0
3.0
4.0
5.0
6.0
0.0
100.0
200.0
300.0
400.0
500.0
600.0
700.0
800.0
FY'2005 FY'2006 FY'2007 FY'2008 FY'2009 FY'2010
Con
sum
ptio
n pe
r C
apita
(Litr
es)
Con
sum
ptio
n (M
illio
n C
ases
)
Alcohol Beverages Consumption Consumption per Capita

15
Figure: Indian Alcoholic Beverage Market Segmentation by Product on the basis of Consumption, in Percentage, FY’2005-FY’2010
Source: AM Mindpower Solutions
CAUSE AND EFFECT RELATIONSHIP BETWEEN DEPENDENT AND INDEPENDENT FACTORS PREVAILING IN INDIAN COUNTRY LIQUOR INDUSTRY
Table: Cause and Effect Relationship Analysis between Industry Factors and Expected Country Liquor Market Prospects
Industry Factors Market Impact Comments
Government regulations and licensing requirement
Increasing taxes on liquor
0%
10%
20%
30%
40%
50%
60%
70%
80%
90%
100%
FY'2005 FY'2006 FY'2007 FY'2008 FY'2009 FY'2010
Mar
ket S
egm
enta
tion
(in %
)
Wine Beer Indian Made Foreign Liquor (IMFL) Country Liquor

16
Changing consumer tastes and preferences; Brand Consciousness
Increasing Personal Disposable Income
Mounting Inflation
Source: AM Mindpower Solutions
Note: Shaded region represents the degree of impact on the market
INDIAN BEER INDUSTRY MARKET SEGMENTATION
BY ALCOHOL CONTENT, FY’2010
Beer market has been segmented into strong beer and mild beer on the basis of their alcohol content. Strong beer which has alcohol content more than 5%, dominates the Indian market accounting for ~ % of the total beer consumed in India, stating its popularity and preference. Mild beer which has less than 5% alcohol content holds ~ % of the beer consumption market share in FY’2010.
Figure: Indian Beer Industry Segmentation by Product on the basis of Alcohol Content in Percentage, FY’2010
FY'2010
Strong Beer
Mild Beer

17
BY BREWS, FY’2010
Lager Beer dominates the beer market segment in India. Almost ~ % beer consumed in India is Lager beer while the rest three types contributed a marginal market share of ~ %. Most of the beer consumed in India is either mild Lager beer or strong Lager beer. It is followed by Ale, Stouts & Bitter Beer which accounted for more than ~ % of the market. Specialty beers accounted for below ~ % of the market total consumption while Low/no alcohol beers contributed ~ % of the market in FY’2010.
Figure: Indian Beer Industry Segmentation by Type of Brews, in Percentage, FY’2005-FY’2010
Source: AM Mindpower Solutions
BEER COMPANY PROFILES
UNITED BREWERIES LTD (UBL)
COMPANY OVERVIEW
United breweries Ltd. is the leading player in the Indian beer industry. Over the period, due to innovations, acquisitions and an extensive distribution network, UBL has become the
FY'2010
Lager
Ales, Stouts and Bitters
Specialty
Low/No Alcohol

18
largest player in India in the beer segment accounting for more than ~ % of the beer consumed in India
The Company has showcased exceptional growth over the years. UBL in conjunction with its associates holds over ~ % of the mild beer market and ~ % of the strong beer market in India.
FINANCIAL PERFORMANCE
United Breweries is the leading player in the Indian beer industry. The Company has achieved several sales milestones over the past years. From a USD 150 million sales in FY’2006, UBL currently has registered sales of over USD ~ million in 2011.
UBL beer sales have grown from 43.4 million cases in FY’2005 to ~ million cases in FY’2011 growing at a CAGR of ~ %.
Figure: United Breweries’ Beer Sales Volume in Million Cases and Sales Value in USD Million, FY’2006 –FY’2011
Source: Company reports
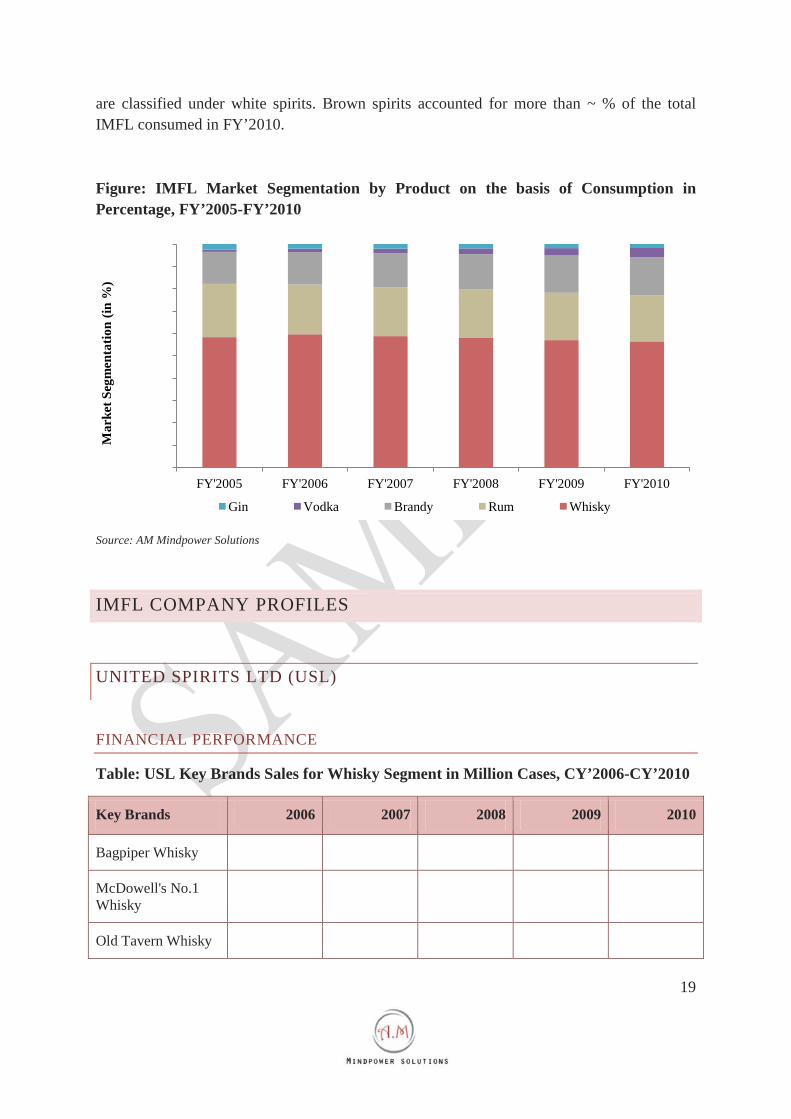
IMFL MARKET SEGMENTATION, FY’2010 – FY’2015
IMFL market is mainly comprised of five types of spirits, Whisky, Rum, Brandy, Gin and Vodka. This industry can also be divided into Brown Spirits and White Spirits, where whisky, rum and brandy are generally categorized under brown spirits while vodka and gin
0.0
20.0
40.0
60.0
80.0
100.0
120.0
140.0
0
100
200
300
400
500
600
FY'2006 FY'2007 FY'2008 FY'2009 FY'2010 FY'2011
Sale
s vol
ume
(Mill
ion
Cas
es)
Sale
s val
ue (U
SD m
illio
n)
Sales value Sales volume
19
are classified under white spirits. Brown spirits accounted for more than ~ % of the total IMFL consumed in FY’2010.
Figure: IMFL Market Segmentation by Product on the basis of Consumption in Percentage, FY’2005-FY’2010
Source: AM Mindpower Solutions
IMFL COMPANY PROFILES
UNITED SPIRITS LTD (USL)
FINANCIAL PERFORMANCE
Table: USL Key Brands Sales for Whisky Segment in Million Cases, CY’2006-CY’2010
Key Brands 2006 2007 2008 2009 2010
Bagpiper Whisky
McDowell's No.1 Whisky
Old Tavern Whisky
0%
10%
20%
30%
40%
50%
60%
70%
80%
90%
100%
FY'2005 FY'2006 FY'2007 FY'2008 FY'2009 FY'2010
Mar
ket S
egm
enta
tion
(in %
)
Gin Vodka Brandy Rum Whisky

20
Haywards Fine Whisky
Director's Special Whisky
DSP Black Whisky
McDowell's Green Label Whisky
Gold Riband Whisky
Signature Rare Whisky
Royal Challenge Whisky
Black Dog Scotch Whisky
McDowell's No.1 Platinum Whisky
Source: Company Reports
Table: USL Key Brands Sales for Brandy Segment in Million Cases, CY’2006-CY’2010
Key Brands 2006 2007 2008 2009 2010
McDowell's No.1 Brandy
Honey Bee Brandy
John Ex Shaw Brandy
Golconda Brandy
Source: Company Reports
21
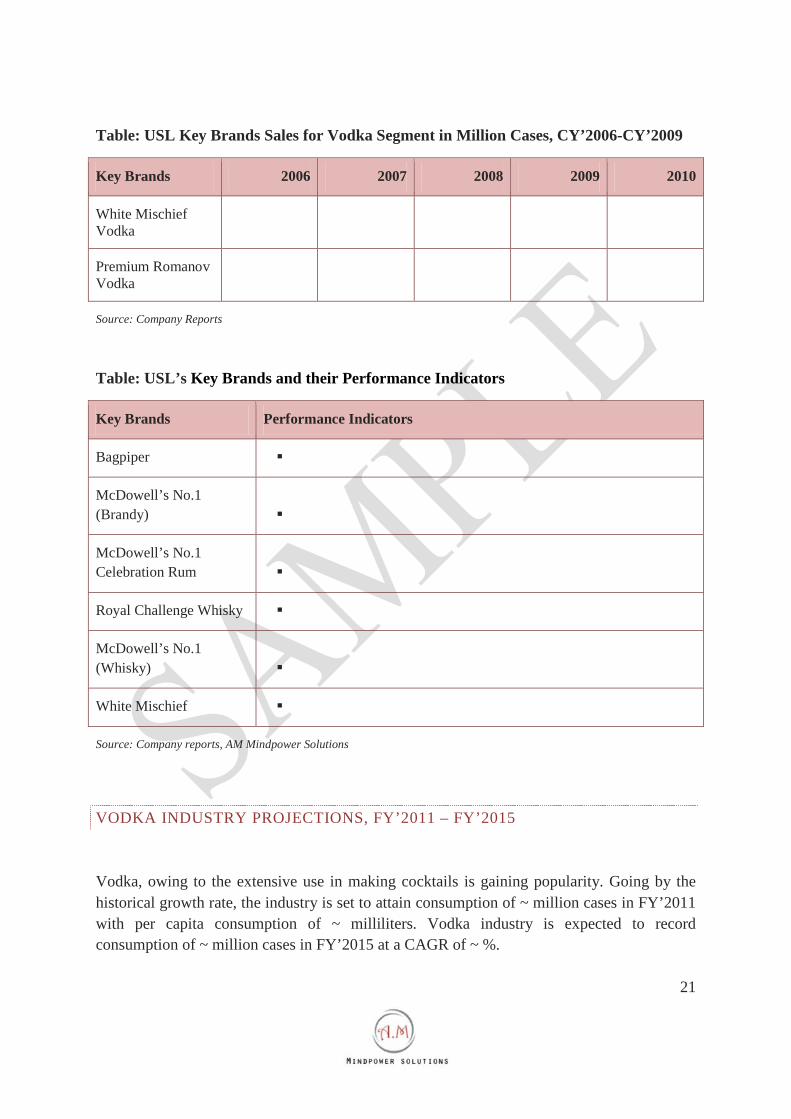
Table: USL Key Brands Sales for Vodka Segment in Million Cases, CY’2006-CY’2009
Key Brands 2006 2007 2008 2009 2010
White Mischief Vodka
Premium Romanov Vodka
Source: Company Reports
Table: USL’s Key Brands and their Performance Indicators
Key Brands Performance Indicators
Bagpiper
McDowell’s No.1 (Brandy)
McDowell’s No.1 Celebration Rum
Royal Challenge Whisky
McDowell’s No.1 (Whisky)
White Mischief
Source: Company reports, AM Mindpower Solutions
VODKA INDUSTRY PROJECTIONS, FY’2011 – FY’2015
Vodka, owing to the extensive use in making cocktails is gaining popularity. Going by the historical growth rate, the industry is set to attain consumption of ~ million cases in FY’2011 with per capita consumption of ~ milliliters. Vodka industry is expected to record consumption of ~ million cases in FY’2015 at a CAGR of ~ %.
22
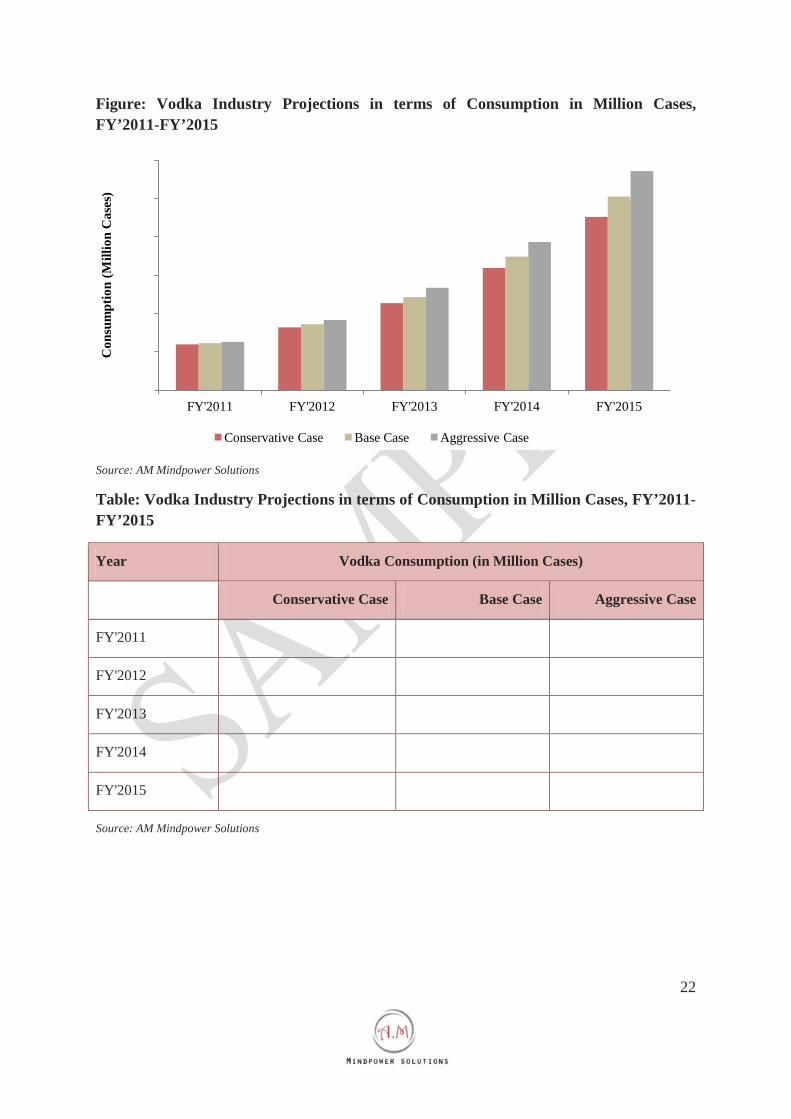
Figure: Vodka Industry Projections in terms of Consumption in Million Cases, FY’2011-FY’2015
Source: AM Mindpower Solutions
Table: Vodka Industry Projections in terms of Consumption in Million Cases, FY’2011-FY’2015
Year Vodka Consumption (in Million Cases)
Conservative Case Base Case Aggressive Case
FY'2011
FY'2012
FY'2013
FY'2014
FY'2015
Source: AM Mindpower Solutions
-
10.0
20.0
30.0
40.0
50.0
60.0
FY'2011 FY'2012 FY'2013 FY'2014 FY'2015
Con
sum
ptio
n (M
illio
n C
ases
)
Conservative Case Base Case Aggressive Case
23
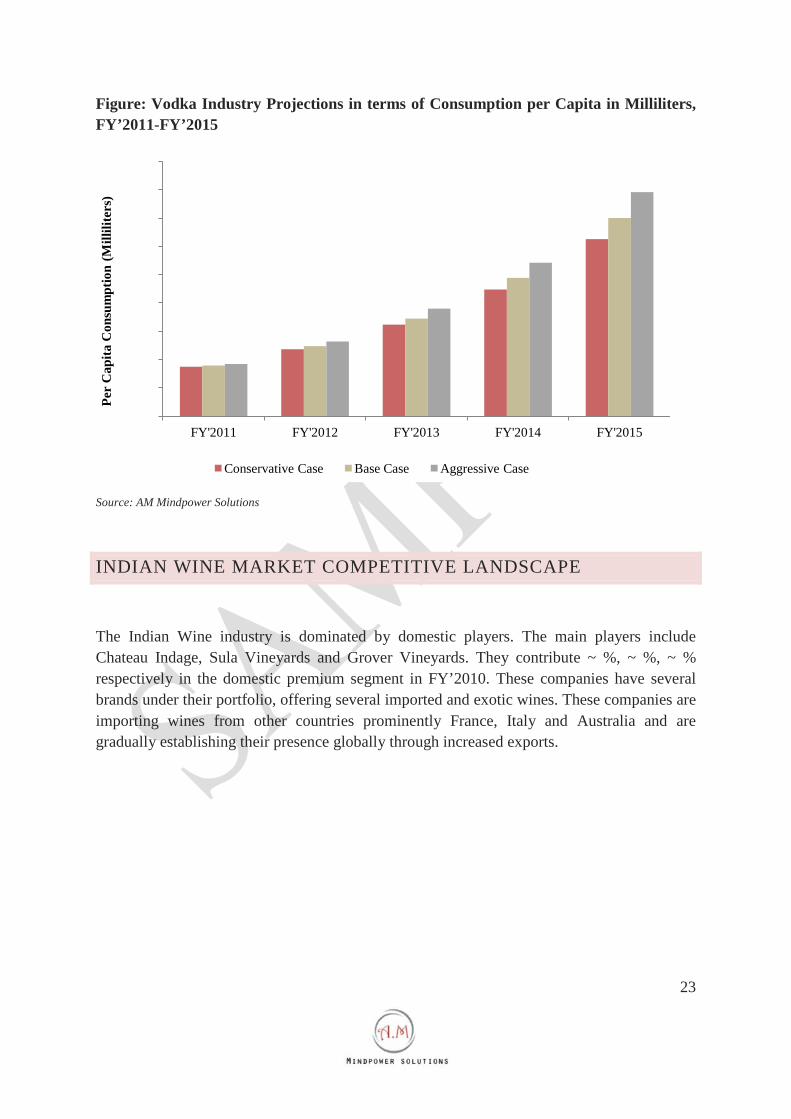
Figure: Vodka Industry Projections in terms of Consumption per Capita in Milliliters, FY’2011-FY’2015
Source: AM Mindpower Solutions
INDIAN WINE MARKET COMPETITIVE LANDSCAPE
The Indian Wine industry is dominated by domestic players. The main players include Chateau Indage, Sula Vineyards and Grover Vineyards. They contribute ~ %, ~ %, ~ % respectively in the domestic premium segment in FY’2010. These companies have several brands under their portfolio, offering several imported and exotic wines. These companies are importing wines from other countries prominently France, Italy and Australia and are gradually establishing their presence globally through increased exports.
-
50
100
150
200
250
300
350
400
450
FY'2011 FY'2012 FY'2013 FY'2014 FY'2015
Per
Cap
ita C
onsu
mpt
ion
(Mill
ilite
rs)
Conservative Case Base Case Aggressive Case

24
Figure: Wines Manufacturing Companies’ Market Share in India in Percentage, FY’2010
Source: AM Mindpower Solutions
Table: Wines Manufacturing Companies’ Sales in India in Million Cases, FY’2010
Company FY’2010 Sales (Million Cases)
Chateau Indage
Sula Vineyards
Grover Vineyards
Vinsura
Vintage Wines
Others
Source: AM Mindpower Solutions
FY'2010
Chateau Indage
Sula Vineyards
Grover Vineyards
Vinsura
Vintage Wines
Others

25
Table: Competitive Landscape of Major Players in the Indian Wine Industry
Major Players Business Overview
Key Business Segments
(Revenue Contribution) Geographical Reach
Source: Company Reports, AM Mindpower Solutions

26
DISCLAIMER
The research reports provided by AM Mindpower Solutions are for the personal information of the authorized recipient and is not for public distribution and should not be reproduced or redistributed without prior permission. You are permitted to print or download extracts from this material for your personal use only. None of this material may be used for any commercial or public use.
The information provided in the research documents is from publicly available data and other sources, which are reliable. Efforts are made to try and ensure accuracy of data. With respect to documents available, neither the company nor any of its employees makes any warranty, express or implied, including the warranties of merchantability and fitness for a particular purpose, or assumes any legal liability or responsibility for the accuracy, completeness, or usefulness of any information, apparatus, product, or process disclosed, or represents that its use will not infringe privately owned rights.
The report also includes analysis and views expressed by our research team. The research reports are purely for information purposes. The opinions expressed are our current opinions as of the date appearing in the material and may be subject to change from time to time without notice. Investors should not solely rely on the information contained in the research documents and must make investment decisions based on their own investment objectives, risk profile and financial position. The recipients of this material should take their own professional advice before acting on this information.
AM Mindpower Solutions will not accept returns of reports once dispatched due to the confidentiality of information provided in our reports. In case, a report qualify for return, we will issue a credit, minus shipping charges, of equal value to the original purchase price, toward a future purchase—no refunds. The decision about whether the product return can be accepted or not is solely at our discretion. Any dispute will be subject to laws of India and exclusive jurisdiction of Indian Courts.
No part of this manual or any material appearing may be reproduced, stored in or transmitted on any other Web site without written permission of AM Mindpower Solutions and any payments of a specified fee. Requests to republish any material may be sent to us.
Related Documents


![PowerPoint Presentation...[1]"Pharmaceutical Drugs Global Market Report 2018", Marketresearch.com, 2019. [Online]. Available: ...](https://static.cupdf.com/doc/110x72/5ff0c2a88540c36b5543be69/powerpoint-1pharmaceutical-drugs-global-market-report-2018-marketresearchcom.jpg)