Welcome message from author
This document is posted to help you gain knowledge. Please leave a comment to let me know what you think about it! Share it to your friends and learn new things together.
Transcript
Table of contents1 Overview 21.1 Message from the CEO 22 Company Profile 42.1 Ownership and Operating Structure 42.2 Shareholder and Stakeholder Information 52.3 SBM Offshore World Map 72.4 Position within the Value Chain 82.5 Activities and Markets 102.6 Competitive Landscape and Market Positioning 133 Corporate Strategy & Sustainability 163.1 Introduction 163.2 Corporate Strategy 163.3 Sustainability Strategy 284 Report of the Management Board 384.1 Introduction 384.2 Management Board Profiles 404.3 Compliance 434.4 Risk Management and Internal Control 464.5 Compliance Statement / In Control Statement 564.6 Fleet and Offshore Operations 574.7 Technology Development 624.8 HSSE 664.9 Human Resources 714.10 Company Tax Policy 744.11 Group Management Systems 754.12 Compliance Table 765 Report of the Supervisory Board - Governance and Compliance 775.1 Report of the Supervisory Board 775.2 Supervisory Board Profiles 845.3 Remuneration Report 935.4 Corporate Governance 1066 Financial Report 2014 1146.1 Company Overview and Financial Review 1146.2 Consolidated Financial Statements 1306.3 Statutory Financial Statements 2026.4 Other Information 2066.5 Key Figures 2187 Performance Indicators 2197.1 Scope of Sustainability Information 2197.2 Performance Indicators 2257.3 Independent Auditor's Report 2317.4 Notes & GRI Table 2368 Disclaimer 258
SBM Offshore N.V. 2014 Annual Report 2
1 Overview1.1 Message from the CEOWith 2014 coming to a close and despite an extremely difficult business environment, I feel much more confident aboutSBM Offshore today than at any other point in my tenure as CEO. The Company has undertaken a number of positivesteps during 2014 to better position itself for the future, and despite a challenging period for the offshore servicesindustry we have produced a sound financial result and consistently met expectations through the year.
We have worked together to deliver excellent operational performance for clients, achieved significant resolution of ourlast remaining legacy issues, furthered our governance and compliance goals and announced a reorganisation aimed atbetter meeting clients’ needs in response to changing market conditions. Although advances were made in our Healthand Safety performance, I deeply regret that SBM Offshore had to report two fatalities of yard contractor staff onconstruction projects in Singapore.
Three years ago I was brought in as CEO to steer the transformation of SBM Offshore. Today I believe that significantstrides have been taken to accomplish that mission, mostly thanks to the entire Company rising to the mammothchallenge. With a clear path to the future, combined with SBM Offshore’s reorganisation, our dynamic andentrepreneurial team will grow the business in collaboration with our clients and take proactive action to meet an evolvingmarket.
Sustainability will be at the heart of that growth. SBM Offshore does not stop at reporting and inclusion in the Dow JonesSustainability Index. It pertains to how we deal with all our stakeholders and how we win, build and operate our FPSO'sand other products. A number of initiatives have been started on developing eco-solutions with our clients and throughsocial impact assessment truly enhancing the local communities in which we operate.
Three years ago I was also determined that SBM Offshore should have outstanding governance and compliance. I amnow proud of the culture of zero tolerance for non-compliant behaviours embedded at every level. SBM Offshore isdedicated to operating its worldwide business activities in an open and transparent manner. This was not an easy orquick task. It has been achieved through extensive remedial actions since 2012, a strengthening of our policies andcontrols and by every employee embracing the Company’s compliance policy under the guidance of the currentManagement Board. My commitment to our stakeholders is that we will remain vigilant and uphold our compliantstandards.
This year we secured an out-of-court settlement with the Dutch Public Prosecutor's Office related to the complianceinvestigation. In addition, the US Department of Justice informed the Company that it is not prosecuting and has closedits inquiry into the matter. This development should help SBM Offshore to turn the page and to look to the future. Thesituation in Brazil is complicated, topped by a challenging political environment. However, we continue to engage andcooperate with the authorities and look forward to coming to achieving a resolution.
SBM Offshore plays an essential role in the Brazilian offshore sector and we are committed to the country. The Companyemploys almost 5,000 people in its Regional Centre in Rio, onshore bases, offshore on our vessels and in our JointVenture yard at Brasa. This year we demonstrated to the industry our technological and project managementcapabilities, in addition to our excellent operational performance. Producing offshore Brazil since November, FPSOCidade de Ilhabela is an outstanding example of the standards to which we aspire. The Company worked as one tosuccessfully deliver the vessel within a demanding schedule and local content requirements. The FPSO is the deepest inSBM’s operating fleet at 2,140m and has the largest capacity at 150,000 bpd of oil. Out of the total of 18 complexmodules weighing 24,000 tonnes, 10 of the modules representing 12,500 tonnes were built in our Joint Venture shipyardin Brazil.
Our recent past is the foundation for a bright future for SBM Offshore. By giving absolute attention to client needs andcollaborating with them at every stage, we will leverage our worldwide know-how and capabilities to engineer, build andoperate high-performance, state-of-the-art vessels. This will power forward our clients’ projects and contribute to their
SBM Offshore N.V. 2014 Annual Report 3
production targets as well as pacify their concerns regarding costs.
This brings our attention to the present and the future – the recent downturn in oil price will prompt a period of soulsearching for the offshore services sector. The industry’s key focus for the coming few years will be increased quality andreduced costs. It has been refreshing to note that the major oil companies are open to increased collaboration with theoffshore services providers. It is something that I have spoken about on numerous occasions and that we advocate inorder to reverse the unsustainable, downward trend of reduced returns experienced by the majors. In the currentenvironment, this will be a decisive factor for many companies. A sharply reduced oil price can only add pressure forfurther project delays and we should not be surprised if the lower order intake in turnkey contracts is sustained. Yet thepotential deepwater reserves, combined with the need to go deeper as other reserves are depleted, are strong indicatorsof the potential growth in the medium to long term. SBM Offshore is well equipped for a continued downturn andprepared to capitalise in the subsequent up-cycle.
From January 1, 2015 our five Regional Centres will each be dedicated to a specific product line. The move will heightenour specialisation and place decision-making and problem-solving significantly closer to clients. Three years ago, wefocused the business solely on FPSOs and now we are ready to revisit our wealth of technologies and expand our coreFPSO skills where needs emerge.
We are relocating our headquarters to the Amsterdam region during 2015. The international orientation, presence ofmany other stakeholders in the Netherlands, the Company’s Euronext Amsterdam listing and the proximity to the industryare expected to provide many advantages to SBM Offshore as a global player.
While we believe that we have created a strong defensive position, we remain proactive in today’s market environment toprotect and create value. A prime example of this is our intention to pursue the development of a U.S. listed MasterLimited Partnership, which will improve our competitive advantage in the short, medium and long term. Additionally, ithas been an excellent year for funding whereby project financing was secured for US$1.9 billion and a new RevolvingCredit Facility for US$1.0 billion. The former included a US$450 million US Private Placement for the Deep PanukeProduction Field Centre and US$1.45 billion of project financing for FPSO Cidade de Maricá.
Finally, we continue to focus on our cost base, allowing us to maintain our core competencies and technological edgedespite the headcount reductions.
SBM Offshore is structurally equipped to face headwinds and can draw from its practical strengths to carry the Companythrough a difficult 2015. We enter the period with a near record backlog of over US$21 billion, which consists of futurelease and operate income with day rates that are not dependent on oil prices or on production levels. This will continue togenerate income and liquidity for many years to come.
Whatever the short-term circumstances, the Management Board looks forward with confidence. We continue to beconvinced that FPSOs and related floating production products have outstanding potential to deliver rewards forinvestors.
Yours faithfully,
Bruno Chabas
SBM Offshore N.V. 2014 Annual Report 4
2 Company Profile2.1 Ownership and Operating Structure
SBM Offshore’s business is the provision of floating production solutions to the offshore energy industry, over the fullproduct life-cycle.
The Company’s main activity is the design, supply, installation and operation of Floating Production, Storage andOffloading (FPSO) vessels.
These are either owned and operated by the Company and leased to its clients, in which case the project is financed bythe Company and in some cases joint venture partners. Alternatively, the Company undertakes FPSO projects for clientson a turnkey sale basis, where these vessels can either be operated by the client, or operated by the Company under aseparate service contract. In this case, financing is provided by the client.
With 11 FPSOs, two FSOs, one MOPU, one Semi-submersible in operation worldwide at year end, over 257 years ofcumulative FPSO operational experience within the industry, the Company is considered a market leader in providingleased production floating systems.
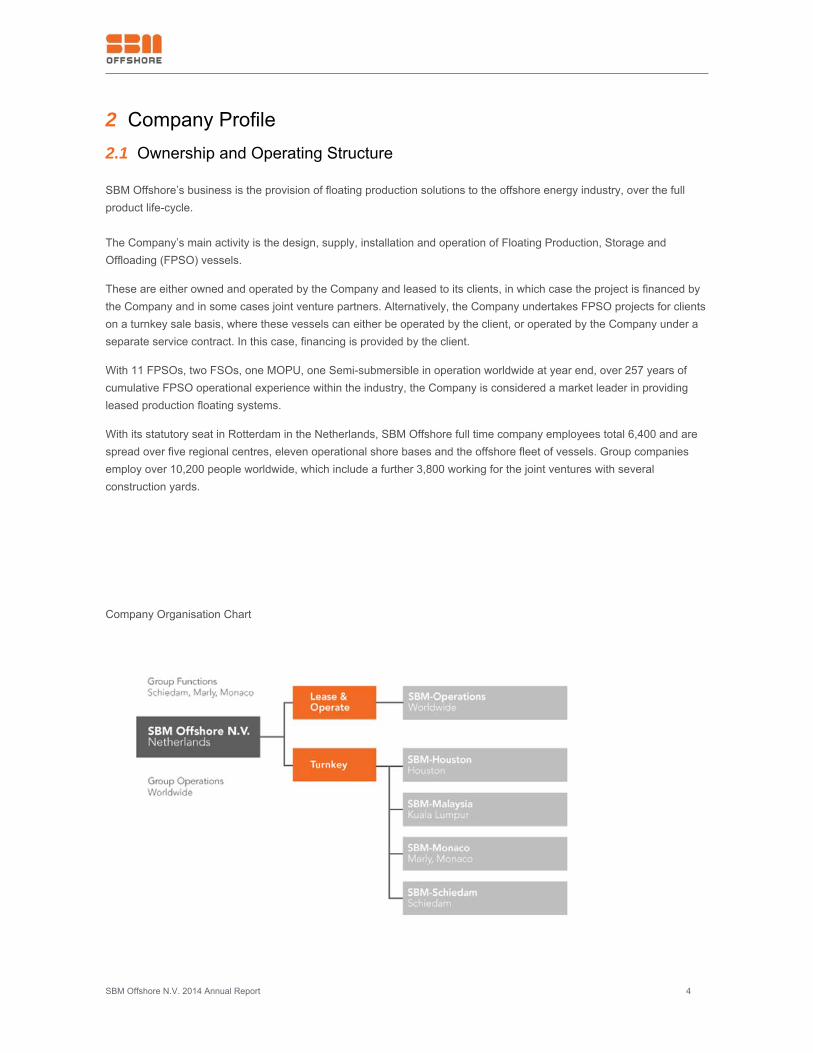
With its statutory seat in Rotterdam in the Netherlands, SBM Offshore full time company employees total 6,400 and arespread over five regional centres, eleven operational shore bases and the offshore fleet of vessels. Group companiesemploy over 10,200 people worldwide, which include a further 3,800 working for the joint ventures with severalconstruction yards.
Company Organisation Chart
SBM Offshore N.V. 2014 Annual Report 5
2.2 Shareholder and Stakeholder Information
The Company’s vision can be summarised as follows:
To be the trusted partner of choice, delivering reliable, complete floating production solutions that create value for SBMOffshore’s clients, by sustainably and passionately leveraging the Company’s technology and operating experience.
2.2.1 Shareholder Information
The Company encourages and actively maintains open, respectful engagement with its stakeholders, including employeedelegates,non-governmental organisations( NGOs ) and clients during the year and at the annual shareholders meeting.
The Company strives for internal and external stakeholder engagement. The Company hosts Town Hall sessions whereemployees can interact and learn about the Company's objectives and strategy relevant to their Execution Centre.
The Company hosts one-on-one stakeholder engagement interviews with clients, peers, NGOs and suppliers. Throughthese interviews the Company seeks to understand its clients' expectations, identify areas for improvement and createlong term relationships with the focus on sustainable development.
Please refer to chapter 5.4 Corporate Governance for information on share listing, share price performance andshareholder dividends.
2.2.2 Stakeholders engagement
SBM Offshore is fully aware that it has an impact on many stakeholders, that all have different expectations towards theCompany. To shape stakeholder engagement SBM Offshore identified key stakeholders by mapping the level ofinfluence on and level of interest in the Company.
Main stakeholders are its employees, shareholders, the investor community, clients, business partners, export creditagencies and suppliers. Other important stakeholders are lenders, governments in operating areas, Oil & Gas industryassociations, NGOs, universities and researchers and potential investors.
The Company strives for internal and external stakeholder engagement. The Company hosts Town Hall sessions whereemployees can interact and learn about the Company's objectives and strategy relevant to their Execution Centre.TheCompany hosts one-on-one stakeholder engagement interviews with clients, peers, NGOs and suppliers. Through theseinterviews the Company seeks to understand its clients' expectations, identify areas for improvement and create longterm relationships with the focus on sustainable development.
Throughout the year, SBM Offshore employed a range of methods to engage with its stakeholders, such as meetings,interviews, conferences, surveys, technology days, investor roadshows, press releases, website updates and desktopresearch. Some stakeholders were asked to elaborate on several topics, such as SBM Offshore’s added value to societyat large and relevant sustainability themes for the Company. Stakeholders were also invited to reflect on SBM Offshore’scorporate strategy and performance and their information needs. Valuable input was captured from the responses, whichwas used in determining the material topics.
Moreover, SBM Offshore Management Board organises several stakeholder engagement activities throughout the year,of which a few are mentioned here. Each year there is a Capital Markets Day in which its shareholders and financialanalysts are invited for a two day session in which the Management Board shares and discusses detailed insights intothe Company strategies, performance and outlook. The Management Board hosts Town Hall sessions where employeescan interact and learn about the objectives and strategy relevant to their Regional Centre. And there are TechnologyDays with clients where SBM Offshore presents its newest offshore solutions and sustainable innovations. The Company
SBM Offshore N.V. 2014 Annual Report 6
also addresses shareholders face-to-face during the AGM, at investor meetings, by analyst webcast presentations andvia conference calls.
2.2.3 Financial Goals
SBM Offshore’s financial objectives consist of safeguarding the Company’s ability to provide sustainable returns toshareholders, benefits for other stakeholders and maintenance of an optimal capital structure allowing for the financing oflong-term investments at a reduced cost of capital.
In the medium term, the Company’s objective is to continue focusing on strengthening the consolidated statement offinancial position in order to obtain an investment grade credit rating. Attaining this objective would eventually provideSBM Offshore with access to the corporate bond market. Furthermore, as is consistent with the industry peer group, theCompany monitors the health of its capital on the basis of the gearing ratio. The definition of which is function of a simplecalculation: net debt divided by total equity plus net debt. The strategy remains to target a gearing ratio between 50%and 60%, subject to maintaining headroom of 20% of all banking covenants.
Supporting elements of the Company’s efforts to achieve the medium term objective have been demonstrated in severalways. Of note are the growth of the Company’s underlying financial results, a diligent focus on cash generation,diversification of sources of funding with potential access to the US Private Placement market as well as Export CreditAgencies, the proceeds from the disposal of non-core assets and the continued abstention of dividend payments.
SBM Offshore N.V. 2014 Annual Report 7
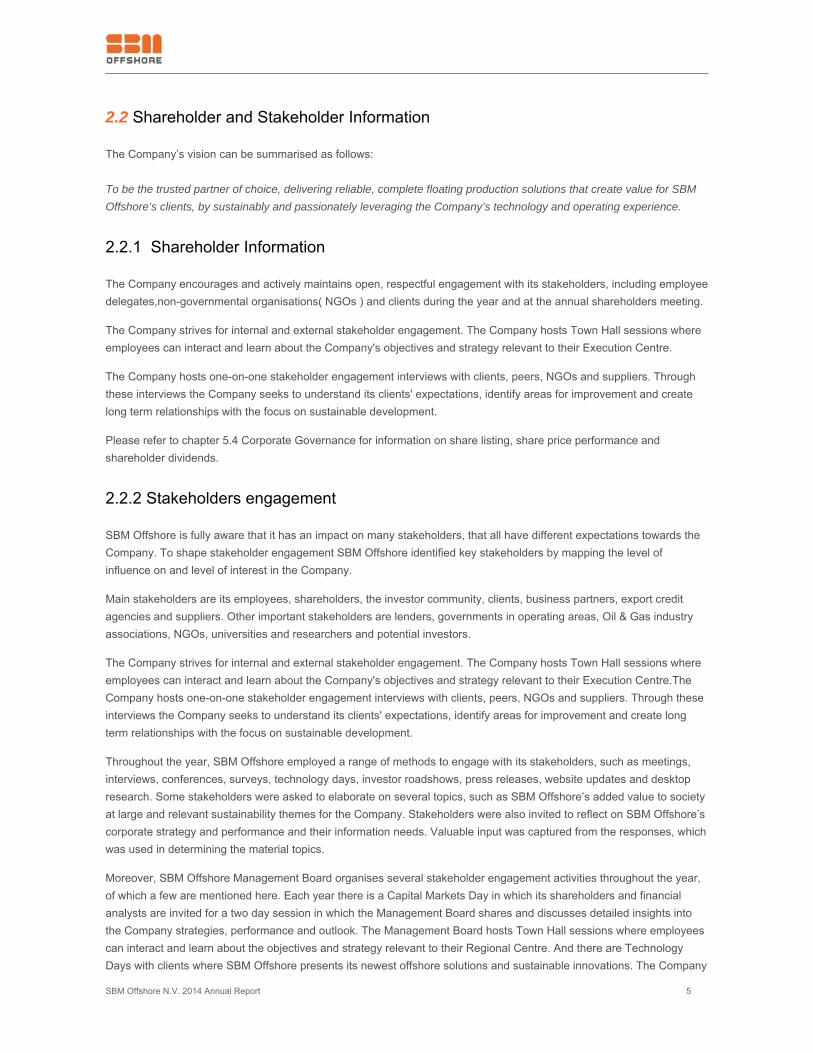
2.3 SBM Offshore World Map
SBM Offshore N.V. 2014 Annual Report 8
2.4 Position within the Value Chain
Value chain
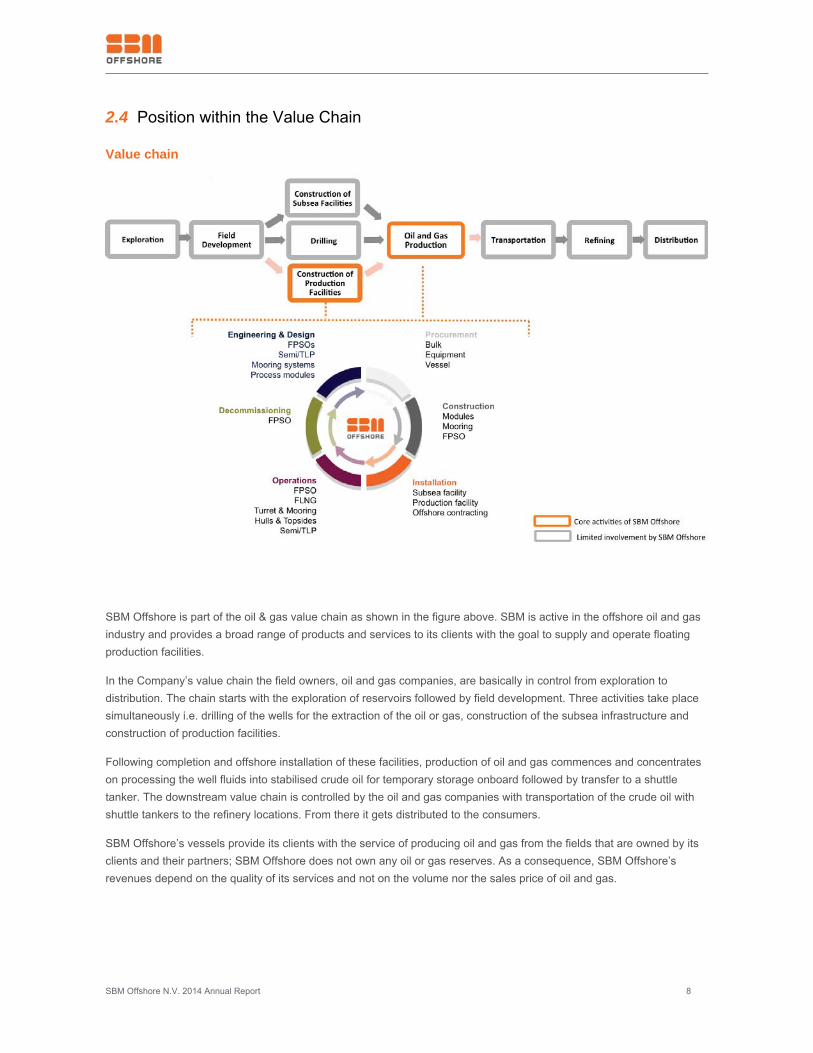
SBM Offshore is part of the oil & gas value chain as shown in the figure above. SBM is active in the offshore oil and gasindustry and provides a broad range of products and services to its clients with the goal to supply and operate floatingproduction facilities.
In the Company’s value chain the field owners, oil and gas companies, are basically in control from exploration todistribution. The chain starts with the exploration of reservoirs followed by field development. Three activities take placesimultaneously i.e. drilling of the wells for the extraction of the oil or gas, construction of the subsea infrastructure andconstruction of production facilities.
Following completion and offshore installation of these facilities, production of oil and gas commences and concentrateson processing the well fluids into stabilised crude oil for temporary storage onboard followed by transfer to a shuttletanker. The downstream value chain is controlled by the oil and gas companies with transportation of the crude oil withshuttle tankers to the refinery locations. From there it gets distributed to the consumers.
SBM Offshore’s vessels provide its clients with the service of producing oil and gas from the fields that are owned by itsclients and their partners; SBM Offshore does not own any oil or gas reserves. As a consequence, SBM Offshore’srevenues depend on the quality of its services and not on the volume nor the sales price of oil and gas.
SBM Offshore N.V. 2014 Annual Report 9
Full Product Life-Cycle
SBM Offshore supplies floating production solutions for the full product lifecycle with several distinct phases:
1) Engineering and design phase: engineering teams develop procedures and techniques for analysis and design ofsystems through all stages of projects from concept to delivery, with safety as an inherent part of the design. This phaseoften leads to technology innovation. In addition, the Company has the in-house capability for conceptual studies, basicdesign and detailed design.
2) Construction phase: Main activities related to procurement, construction and offshore commissioning of the FloatingProduction Systems (mainly FPSOs) and mooring systems in preparation for oil and gas production.
3) Installation phase: SBM Offshore has the in-house means to install complete FPSOs and although subsea installationactivities are not among its key product portfolio offering, the Company’s dedicated installation vessels have thecapability.
4) Operations phase: SBM Offshore operates the process plant offshore and produces oil and gas for its client andoffloads it to shuttle tankers.
5) Decommissioning phase: The end of life-cycle when the facilities need to be retired.
Variations in the Value Chain
Some of SBM Offshore’s product lines operate in a slightly different value chain. Even though the majority of theCompany’s contracts are based on the lease and operate structure, it also supplies FPSOs and specific FPSOequipment, like turret mooring systems, on a turnkey supply basis. The Company sells directly to oil companies, but alsoto other FPSO providers, if appropriate.
Part of the operating activities are devoted to the modification of existing floating offshore installations, to enable theCompany’s clients to extend the production life of the facility, to tie-in smaller fields nearby or to upgrade with newtechnology.
The Company has only one facility in operation, the Thunder Hawk semi-submersible, under a production handlingagreement in which the Company is paid for the service of producing oil and gas against a certain fee per barrel orequivalent in gas produced.
For Floating Liquefied Natural Gas (FLNG) the value chain potentially extends to the end user by including transportationof LNG to the gas company to secure supply, as FLNG investments are often based on 15 to 20 years supply contracts.SBM Offshore has a partnership with Linde Engineering for LNG topsides and with NYK for the supply of LNG carriers.
SBM Offshore N.V. 2014 Annual Report 10
2.5 Activities and Markets
Oliver Kassam – Group Sales & Marketing Director
“At SBM Offshore, we understand the importance of listening to and working closely with our clients worldwide, ensuringthat we fully comprehend their challenges and needs, in order to provide solutions tailored to meet these. With arenewed commitment to our core Product Lines, SBM Offshore is able to offer a far more focused and efficient service,dedicating the best technical, financial and operational personnel to specific areas, each retaining the vast knowledgeand experience of past projects. We believe this will offer significant benefits to our clients in terms of highly competitive,technical and commercial solutions, backed by our strong technical competencies, operational experience and EPCIdelivery track record. We will only succeed if our clients meet their goals and this is our number one priority.”
Markets
During the last few years, flat oil prices and ever increasing costs saw clients experiencing a lack of free cash flow. Theconsequence was CAPEX compression in 2014 with clients rethinking their investment strategies and opting to scaledown projects or revisit less costly options. The pressure by clients to reduce development costs and in particularcounteract the increased drilling costs due to reservoirs in deeper water has cascaded down to the oil service providers.With oil prices plummeting at the end of the year and gas prices also adversely affected, the situation has beenexacerbated. All these elements combined render the outlook for future project economics even more critical. Thesemarket dynamics had already translated into delays for awards of projects to service providers such as SBM Offshore, aswell as requests from clients to reduce the cost of proposed floating production solutions. This trend is set to continue.
Despite this short-term, pessimistic outlook, oil companies continue to search for access to new production and have astrong appetite to develop new areas and territories such as the Lower Tertiary in the Gulf of Mexico and also Mexico,where the government’s energy reform bill will allow foreign operators to participate in the future development of thelarge reserves in shallow and deep water.
Other key growth areas include East African countries (e.g. Mozambique, Tanzania), West African countries (e.g. IvoryCoast, Ghana), Asia (where many countries are preparing for deepwater exploration) .
SBM Offshore continues to build closer relationships with clients and engage with them at an early stage. By betterunderstanding their needs and challenges, it enables the Company to offer better solutions.
For the years to come SBM Offshore believes that client needs can be summarised as follows;
Technologies to open up new frontiers such as the Lower Tertiary in the Gulf of Mexico with reservoirs in very deepwater and with very●
high temperatures and high pressures
Experience in new oil and gas producing countries such Mozambique and Tanzania●
Local industry development and local content capacity as part of local development regulations●
Reliable and predictable project delivery and operations●
Economical solutions across the full life-cycle of projects from concept through delivery, installation, and sustainable operations and●
decommissioning.
SBM Offshore N.V. 2014 Annual Report 11
SBM Offshore activities
SBM Offshore is a leader in Floating Production and Mooring Systems, Production Operations as well as Terminals andServices. One of the world’s foremost suppliers and operators of Floating Production, Storage and Offloading (FPSO)facilities, the Company has operating experience of over 257 contract years.
See chapter 3.2 on Corporate Strategy for more detail on the Industry in which SBM Offshore operates.
Since 2012 SBM has put a strong focus on its core competencies of FPSOs and Turret Mooring Systems in order tocreate a stable and predictable workload and restore confidence with all stakeholders. At the beginning of 2014 after twoyears of efforts to stabilise the Company’s financial position, the time was considered right to widen the product portfolioand gain access to a larger pool of floating production prospects in the future. The existing Tension Leg Platforms/Semi-submersibles technology and the design concept for Floating Liquefied Natural Gas (FLNG) were re-introducedand the traditional Terminals business was rejuvenated via a separate structure.
Tension Leg Platforms (TLPs) and Semi-submersibles (Semis)
SBM Offshore still possesses a significant amount of intellectual capital in this domain, both in terms of proprietarysolutions and human capital.SBM Offshore successfully delivered several TLP and Semi projects in the Gulf of Mexicoduring the years 2000 to 2010. The expertise was gained with the acquisition of Atlantia in 2001. SBM Offshore holds therecord for the deepest water depth semi-submersible Floating Production Unit (FPU) in the world: the IndependenceHub, which was installed in 2007 at a depth of 2,469 metres in the Gulf of Mexico. It is expected that there will be acontinuous demand for these concepts in the Gulf of Mexico, whilst the Company has also seen several opportunitiesemerge in other areas in recent years.
Floating Liquefied Natural Gas (FLNG)
SBM Offshore has been pioneering the development of FLNG (sometimes referred to as LNG FPSO) for a number ofyears. With the new technology now gaining wide acceptance and SBM Offshore’s involvement in the design andconstruction of the turret for Prelude, the world’s first FLNG facility, the Company believes that it is in a strong position tomarket its own FLNG concept. Building on its extensive experience in designing, executing and operating FPSOs, SBMOffshore, in conjunction with its partner Linde Engineering, has developed a mid-scale FLNG option, which convertsexisting LNG tankers into FLNG facilities – in a similar manner that SBM Offshore has successfully accomplished for oilFPSOs. The advantage of this concept includes lower costs and a shorter schedule than a new-build model. Goingforward, this new market for gas will be a focus for the Company.
Terminals
To meet the challenges of the dynamic market for Terminals and After Sales Services, two independent entities fullydedicated to this business were created in October 2014, Imodco Terminals S.A. and Imodco Services S.A.
Clients will benefit from a more proactive partner in this area, a highly experienced and dedicated team, as well as awealth of terminal technology. In its role as shareholder, SBM Offshore will strengthen its leadership on its historicalbusiness of CALM Buoys (the most widely-used offshore offloading Terminal) and relevant After Sales Services. TheImodco companies’ objective is to become the recognised leader on the relevant technical and commercial innovationsby providing bespoke solutions over the full life-cycle for Terminals.
Imodco is already the trusted partner of choice for mooring technology worldwide and builds upon SBM's offshoretechnology and relies on an accumulative experience of 87 years in the supply of Terminals worldwide.
SBM Offshore N.V. 2014 Annual Report 12
Key achievements
FPSO Cidade de Ilhabela
November 2014 marked one of the Company’s major achievements with the delivery and first oil of FPSO Cidade deIlhabela for Petrobras offshore Brazil – in 2,140 metres water depth, the vessel is the deepest in the operating fleet; at150,000 bpd of oil it has the largest capacity. The topsides weight totals 24,000 tonnes of which 12,500 tonnes (10 of the18 modules) were built in the Company’s Joint Venture Brasa yard in Brazil to satisfy local content regulations.
N’Goma FPSO
November 2014 marked the successful completion of the life extension and relocation of N’Goma FPSO, which startedproducing offshore Angola for Eni. Formerly the FPSO Xikomba– operating for Exxon for eight years, also offshoreAngola – it was disconnected in 2011. SBM Offshore converted the large FPSO – which included a major upgrade of thehall, processing equipment, topsides and turret and new module integration. The construction and integration onboard oftwo complex modules took place at Paenal, the Company’s Joint Venture shipyard in Angola. The vessel is operated byOPS – an equal joint venture company between Sonangol and SBM Offshore.
The two above FPSO projects demonstrate SBM’s worldwide expertise and its EPCI capacity across the life-cycle, (seeChapter 2.4 Value chain for context) as well as illustrating the bespoke nature of FPSOs. The substantial investmentsassociated with such complex facilities are an excellent example of SBM Offshore specialist position in the largeconversion FPSO market.
FPSO Cidade de Maricá and FPSO Cidade de Saquarema
The twin FPSOs Cidade de Maricá and Cidade de Saquarema are undergoing construction and conversion work at theChengxi (CXG) yard in China; the same yard that successfully completed the equivalent scope on FPSO Cidade deIlhabela. The execution plan for the twin FPSOs will mirror that for Ilhabela. The vessels will be transferred in 2015 fromChina to the Brasa yard in Rio where integration of the hulls and the remaining topsides will take place. A significantnumber of the modules are being fabricated at Brasa. Progress was made according to schedule in 2014.
FPSO Turritella
SBM Offshore is currently constructing a state-of-the-art FPSO that will produce at record-breaking depth of 2,900m forShell’s Stones development in the Gulf of Mexico. Its pioneering, disconnectable, internal turret and mooring system aredesigned for the tropical storm conditions of the region. Once in operation in 2016, the FPSO will hold several worldrecords, including deepest floating production unit ever installed, deepest FPSO and the first disconnectable system withSteel Catenary Risers.
With the delivery of two FPSO projects in 2014 and taking into account the construction of three FPSOs – FPSO Cidadede Maricá, FPSO Cidade de Saquarema and FPSO Turritella, SBM Offshore retains its position as leader in the industryof FPSO units in terms of Total / Average capacity in bpd.
Turret projects
The Company accomplished major progress as planned on three of the world’s largest and most sophisticated turrets –1) the Quad 204 turret mooring system for BP’s FPSO Glen Lyon, 2) the turret for the Prelude FLNG for Shell in Australiaand 3) the turret for the Ichthys FPSO for Inpex in Australia.
Semi-submersibles
The Thunder Hawk DeepDraft™ Semi – installed in July 2009 and located in just over 560 metres of water in the Gulf ofMexico – is producing for the Company’s client Murphy. In July 2014, SBM Offshore signed a Production HandlingAgreement (PHA) with Noble Energy to produce the Big Bend and Dantzler fields to the Thunder Hawk DeepDraft™Semi. These additional tie-backs confirm the strategic value of the platform for deepwater Gulf of Mexico production. The
SBM Offshore N.V. 2014 Annual Report 13
Thunder Hawk platform provides client Noble and its partners with a cost effective development solution.
FPSO Kikeh
Finally, 2014 marked the successful completion of a brownfiled project the Siakap North-Petai (SNP) tie-back to FPSOKikeh offshore Malaysia. Since August 2007 FPSO Kikeh has successfully operated the Kikeh development on behalf ofClient Murphy Oil. In February 2014, the successful tie-back to the SNP field for Murphy and its partners was completed.This resulted in the FPSO increasing production for the customer by accommodating two fields simultaneously –representing an economical and fast route to production for the customer. The modifications made to the FPSO werecompleted while minimising conversion time and CAPEX, as well as limiting any disruptions to the existing operation inthe Kikeh field.
2.6 Competitive Landscape and Market Positioning
Segmentation in the FPSO Market
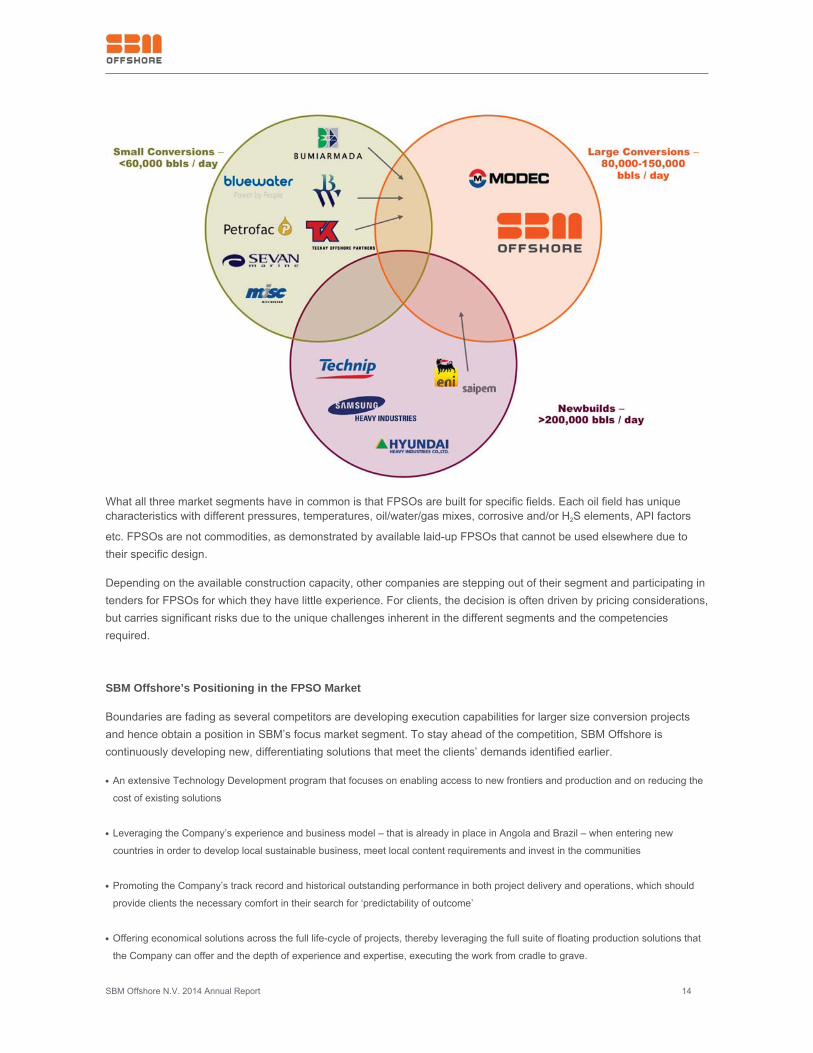
The global market for FPSOs can be roughly split into three segments, with SBM Offshore most active in largeconversions:
a) Newbuild FPSOs: Capable of production volumes of over 200,000 barrels per day. This market is dominated byKorean shipyards with general contractors such as Saipem and Technip providing overall contract managementservices. SBM Offshore is involved in this segment as a supplier of large turret and mooring systems, such as Quad204, Prelude and Ichthys. A new build FPSO project typically takes at least four years, at a cost of $2.5-3.0 billion.
b) Large conversion FPSOs: Usually converted oil tankers known as Very Large Crude Carriers (VLCCs), with typicalproduction capabilities of 60,000 to 150,000 barrels of oil per day. This is SBM Offshore’s main market. The Company’skey competitor in this market is MODEC and to a lesser extent BW Offshore. A typical Generation 3 FPSO – what SBMOffshore calls its latest design for the complex, pre-salt fields – takes approximately three years to complete, at a cost of$1.5-2.0 billion.
a) Small conversion FPSOs: Based on smaller crude oil tankers, with production rates up to 60,000 barrels per day. SBMOffshore is not currently active in this market, which is served by companies such as Bumi Armada, Bluewater, BWOffshore, Sevan, Petrofac and others.
SBM Offshore N.V. 2014 Annual Report 14
What all three market segments have in common is that FPSOs are built for specific fields. Each oil field has uniquecharacteristics with different pressures, temperatures, oil/water/gas mixes, corrosive and/or H2S elements, API factors
etc. FPSOs are not commodities, as demonstrated by available laid-up FPSOs that cannot be used elsewhere due totheir specific design.
Depending on the available construction capacity, other companies are stepping out of their segment and participating intenders for FPSOs for which they have little experience. For clients, the decision is often driven by pricing considerations,but carries significant risks due to the unique challenges inherent in the different segments and the competenciesrequired.
SBM Offshore’s Positioning in the FPSO Market
Boundaries are fading as several competitors are developing execution capabilities for larger size conversion projectsand hence obtain a position in SBM’s focus market segment. To stay ahead of the competition, SBM Offshore iscontinuously developing new, differentiating solutions that meet the clients’ demands identified earlier.
An extensive Technology Development program that focuses on enabling access to new frontiers and production and on reducing the●
cost of existing solutions
Leveraging the Company’s experience and business model – that is already in place in Angola and Brazil – when entering new●
countries in order to develop local sustainable business, meet local content requirements and invest in the communities
Promoting the Company’s track record and historical outstanding performance in both project delivery and operations, which should●
provide clients the necessary comfort in their search for ‘predictability of outcome’
Offering economical solutions across the full life-cycle of projects, thereby leveraging the full suite of floating production solutions that●
the Company can offer and the depth of experience and expertise, executing the work from cradle to grave.
SBM Offshore N.V. 2014 Annual Report 15
Looking forward
Although the company signed a few key contracts, 2014 was a slow year for the entire industry. With the low oil price andthe pressure on capital spending by its clients, SBM Offshore predicts that this trend will continue for the short term.
In response to the current climate and to re-ignite SBM’s presence in the market, the Company has adjusted itsorganisation with effect from January 2015, with the aim to further improve its client-focus for a more collaborative,solution-driven approach.
To further match its clients’ expectations as well as increase the Company’s competitiveness, SBM Offshore revised itsbusiness development and acquisition approach in closer coordination with project execution, in addition to creatingRegional Centres with a specialisation on a set of Product Lines.
With dedicated teams focused on providing best possible technical and commercial solutions and by leveraging its corecompetencies with a more efficient and responsive organisation, SBM Offshore expects to be able to capitalise upon newopportunities and prospects.
SBM Offshore N.V. 2014 Annual Report 16
3 Corporate Strategy & Sustainability3.1 Introduction Oivind Tangen – Group Strategy Director
“Feeding into the development of SBM Offshore’s strategy and integrated business model are its growth drivers, its short,medium and long-term market views, the competitive environment, its people and its means of financing. By partneringwith our clients at every stage, we can provide customised strategic solutions to allow them to exploit their fields in a costeffective and optimum manner. SBM Offshore strives to offer the greatest return on investment through the pursuit ofcollaborative opportunities.”
SBM Offshore’s Operating Model
SBM Offshore is the world’s foremost supplier and operator of floating production solutions, predominantly FPSOs. TheCompany’s clients are national and international oil companies that are active in deepwater offshore exploration andproduction activities. Where oil is discovered in commercially attractive volumes too far from the coast, or in waters toodeep to have a pipeline infrastructure, oil companies need floating infrastructure to produce the oil at sea, separate theoil from the co-produced water and gas, re-inject the gas and water back into the reservoir when required and store thecrude oil temporarily until a shuttle tanker arrives to offload it. SBM Offshore builds FPSOs by converting large crude oiltankers into floating production facilities, which comprises of strengthening the hulls, adding processing and compressionequipment and mooring systems, allowing the vessels to stay above the fields for periods of up to 25 years – dependingon the design life of the FPSO.
3.2 Corporate Strategy
SBM Offshore either builds the vessels for outright sale as a turnkey project or for long-term lease. The lease optionoffers clients a cost effective and flexible way to produce their reservoirs and allows them to benefit from SBM Offshore’s257 contract years of operating experience. Additionally, leasing saves the client the capital expenditures related to thevessel’s construction, as it remains under SBM Offshore ownership or part ownership.
If the client requests the lease option, SBM Offshore will then enter into an ‘operate and maintenance’ contract with theclient. Most long-term lease and operate contracts have further extension options, allowing the client to continueproduction if the field remains economically viable. When a contract ends, the vessel is either converted for a newcontract or it is decommissioned and scrapped.
In addition to FPSOs, SBM Offshore has a track record in other solutions and products for the oil industry, includingTurrets & Turret Mooring Systems, Semi-Submersible & Tension Leg Platform (TLP) production units, Topsides and alsoTurrets for FLNG units, as well as brownfield activities.
SBM Offshore N.V. 2014 Annual Report 17
No Volume or Oil Price Exposure
At the end of 2014, SBM Offshore had a fleet of 11 FPSOs, 2 FSOs, 1 Semi-sub and 1 MOPU on-hire and a further threeFPSOs under construction. A unique feature of the lease and operate contracts is that they provide a stable source ofincome. A daily lease rate is negotiated at the beginning of the contract, and this rate will remain fixed for the entirelength of the contract, irrespective of actual production volume or the price of oil. In the case where the oil reservoirdisappoints, the oil company bears the risk[1]; in the case where the oil price drops, the oil company bears theconsequences – not SBM Offshore. The Company is incentivised to maintain high uptimes through bonus payments.Built-in equipment redundancies allow the Company to continuously maintain the facilities, while production continues.Throughout SBM Offshore’s history of operating floating facilities, it has achieved an uptime of more than 99%. Theexperience gained in operating the vessels, in often harsh offshore environments, is translated into the design of thelatest vessels and into life extension upgrades.
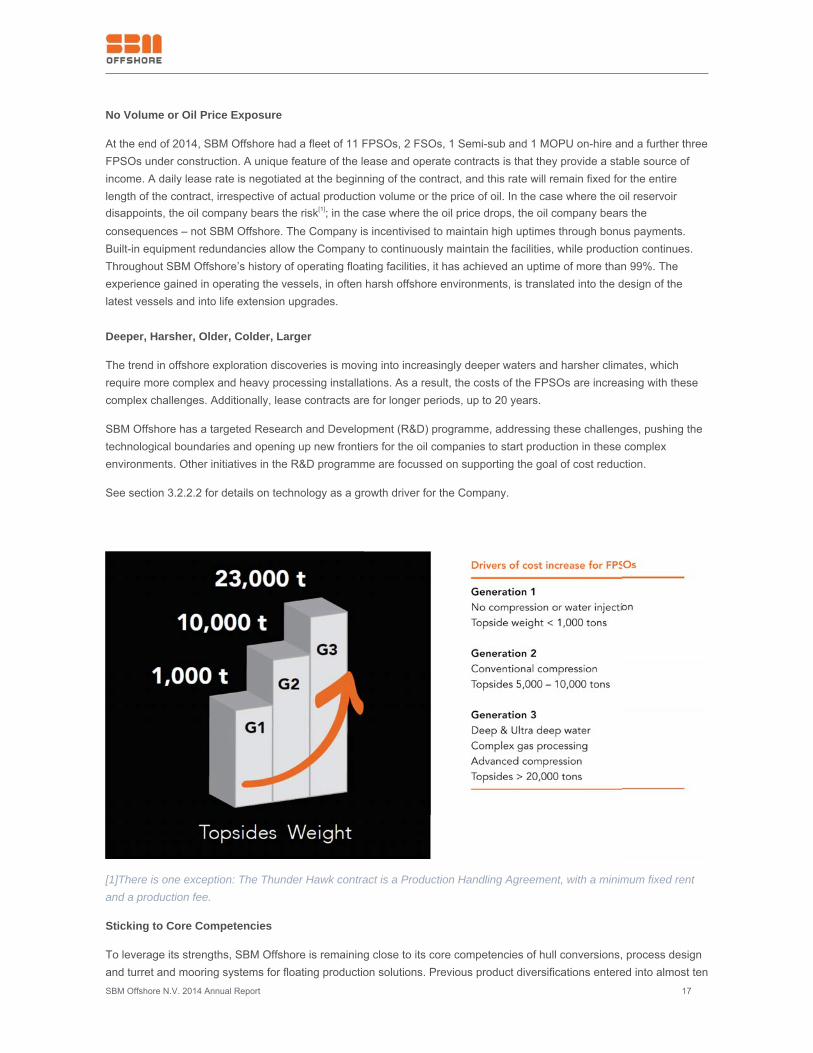
Deeper, Harsher, Older, Colder, Larger
The trend in offshore exploration discoveries is moving into increasingly deeper waters and harsher climates, whichrequire more complex and heavy processing installations. As a result, the costs of the FPSOs are increasing with thesecomplex challenges. Additionally, lease contracts are for longer periods, up to 20 years.
SBM Offshore has a targeted Research and Development (R&D) programme, addressing these challenges, pushing thetechnological boundaries and opening up new frontiers for the oil companies to start production in these complexenvironments. Other initiatives in the R&D programme are focussed on supporting the goal of cost reduction.
See section 3.2.2.2 for details on technology as a growth driver for the Company.
[1]There is one exception: The Thunder Hawk contract is a Production Handling Agreement, with a minimum fixed rentand a production fee.
Sticking to Core Competencies
To leverage its strengths, SBM Offshore is remaining close to its core competencies of hull conversions, process designand turret and mooring systems for floating production solutions. Previous product diversifications entered into almost ten
SBM Offshore N.V. 2014 Annual Report 18
years ago led to significant losses. In addition, SBM Offshore is investing heavily in enhancing its systems andprocedures in order to deliver its complex products to clients on time and on budget.
The FPSO Market
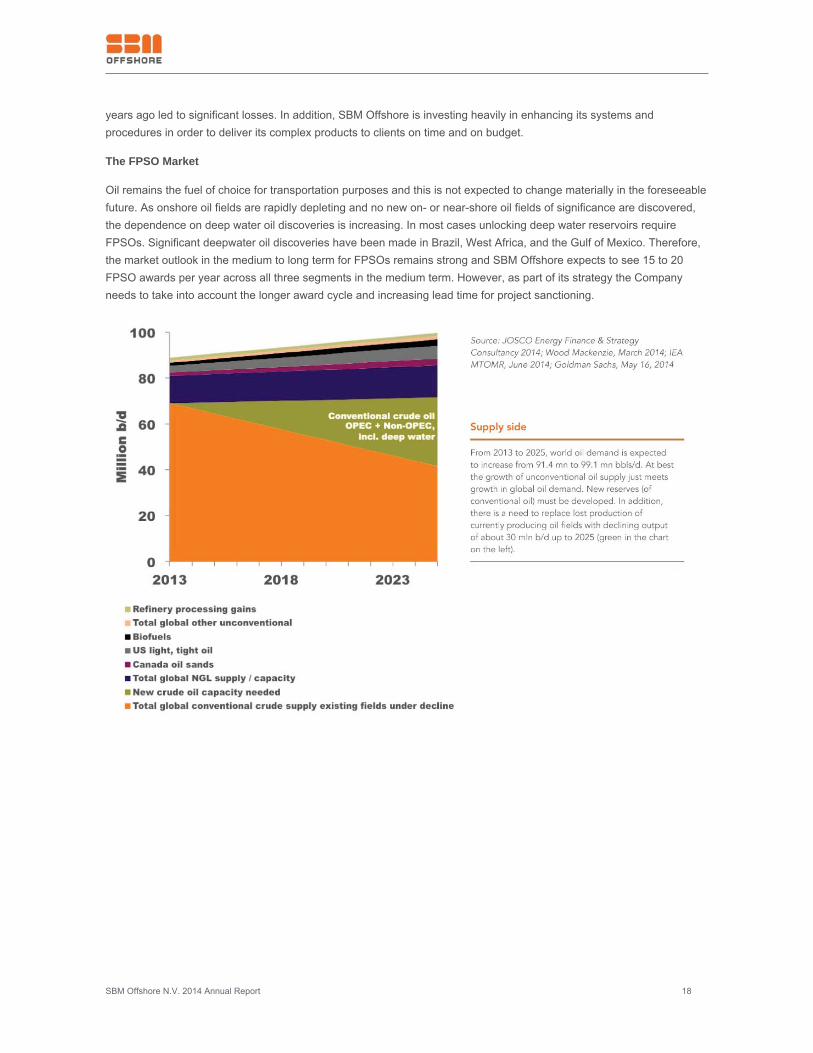
Oil remains the fuel of choice for transportation purposes and this is not expected to change materially in the foreseeablefuture. As onshore oil fields are rapidly depleting and no new on- or near-shore oil fields of significance are discovered,the dependence on deep water oil discoveries is increasing. In most cases unlocking deep water reservoirs requireFPSOs. Significant deepwater oil discoveries have been made in Brazil, West Africa, and the Gulf of Mexico. Therefore,the market outlook in the medium to long term for FPSOs remains strong and SBM Offshore expects to see 15 to 20FPSO awards per year across all three segments in the medium term. However, as part of its strategy the Companyneeds to take into account the longer award cycle and increasing lead time for project sanctioning.
SBM Offshore N.V. 2014 Annual Report 19
Cyclical Challenges in the Short term
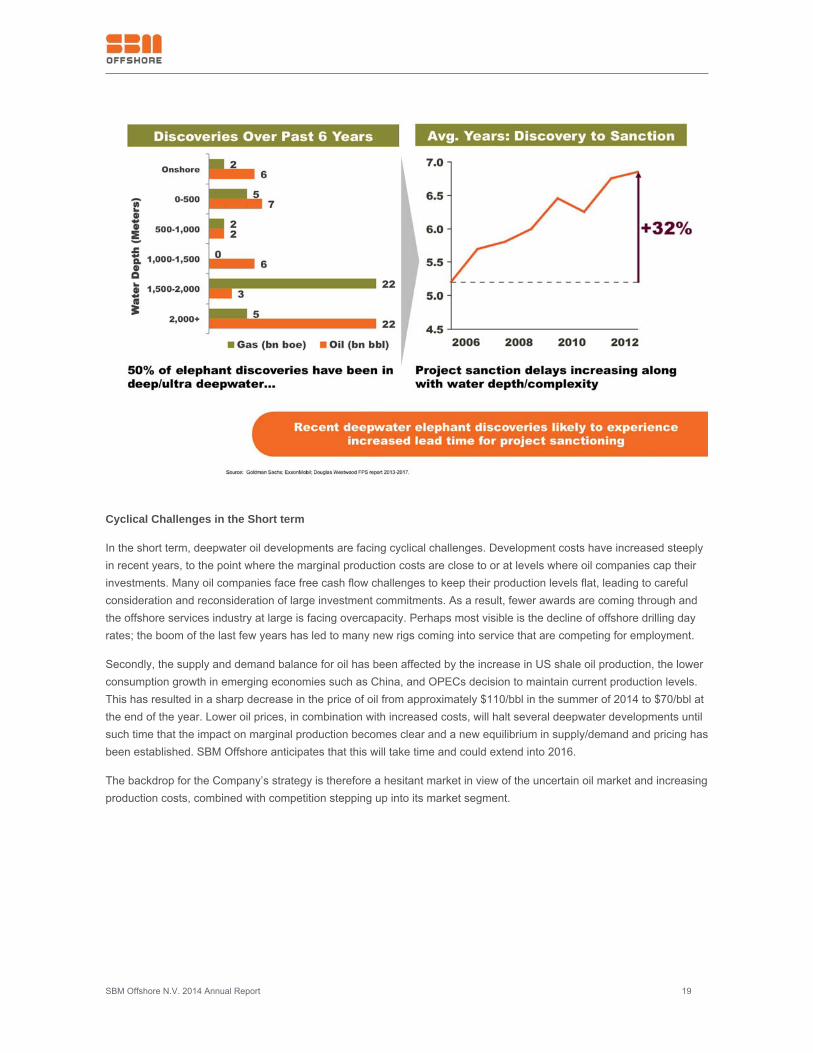
In the short term, deepwater oil developments are facing cyclical challenges. Development costs have increased steeplyin recent years, to the point where the marginal production costs are close to or at levels where oil companies cap theirinvestments. Many oil companies face free cash flow challenges to keep their production levels flat, leading to carefulconsideration and reconsideration of large investment commitments. As a result, fewer awards are coming through andthe offshore services industry at large is facing overcapacity. Perhaps most visible is the decline of offshore drilling dayrates; the boom of the last few years has led to many new rigs coming into service that are competing for employment.
Secondly, the supply and demand balance for oil has been affected by the increase in US shale oil production, the lowerconsumption growth in emerging economies such as China, and OPECs decision to maintain current production levels.This has resulted in a sharp decrease in the price of oil from approximately $110/bbl in the summer of 2014 to $70/bbl atthe end of the year. Lower oil prices, in combination with increased costs, will halt several deepwater developments untilsuch time that the impact on marginal production becomes clear and a new equilibrium in supply/demand and pricing hasbeen established. SBM Offshore anticipates that this will take time and could extend into 2016.
The backdrop for the Company’s strategy is therefore a hesitant market in view of the uncertain oil market and increasingproduction costs, combined with competition stepping up into its market segment.
SBM Offshore N.V. 2014 Annual Report 20
3.2.1 Company Values
The vision and values were created in collaboration with SBM Offshore’s Executive Committee and are considered thekey elements that will drive the successful implementation of the Company’s strategy. They will be communicated to theentire Company in the first quarter of 2015.
Values
Entrepreneurship
SBM Offshore delivers innovative, fit-for-purpose solutions with passion to exceed customer needs and proactivelystrives to achieve sustainable growth. The Company enables people to take a risk-based approach to winning businessand do the right thing for the Company.
Care
SBM Offshore respects others, values teamwork and diversity, and cares for its clients and community.
Integrity
SBM Offshore does the right thing and acts professionally.
Ownership
Each employee at SBM Offshore is accountable for contributing to delivering on the Company’s commitments andpursuing its goals with energy and tenacity.
Guiding Principles
To SBM Offshore’s clients: We listen
We understand the offshore production business in its entirety and can leverage our unrivalled experience and expertiseto supply exactly what our clients’ need, whatever the demands of the offshore environment.
To SBM Offshore’s shareholders: The Company will use its expertise and technological know-how to create sustainablevalue.
SBM Offshore is the most experienced solutions provider in the offshore energy production market – a position that givesthe Company a ‘preferred supplier’ status, and enables SBM Offshore to deliver superior financial returns whilstmaintaining a good risk/reward balance.
To SBM Offshore’s business partners: Building long-term partnerships will remain key to the Company’s success andability to deliver.
SBM Offshore is dedicated to building deep, long-term relationships with its business partners so, together, we canconfidently supply the needs of all our clients throughout the entire product life-cycle.
To SBM Offshore employees: A safe and stimulating working environment.
The Company aims to attract and retain a diverse and highly talented workforce, and will maximise their opportunities forsuccess by providing stimulating challenges, excellent training and reward – all in an incident free workplace.
SBM Offshore N.V. 2014 Annual Report 21
3.2.2 Growth Drivers
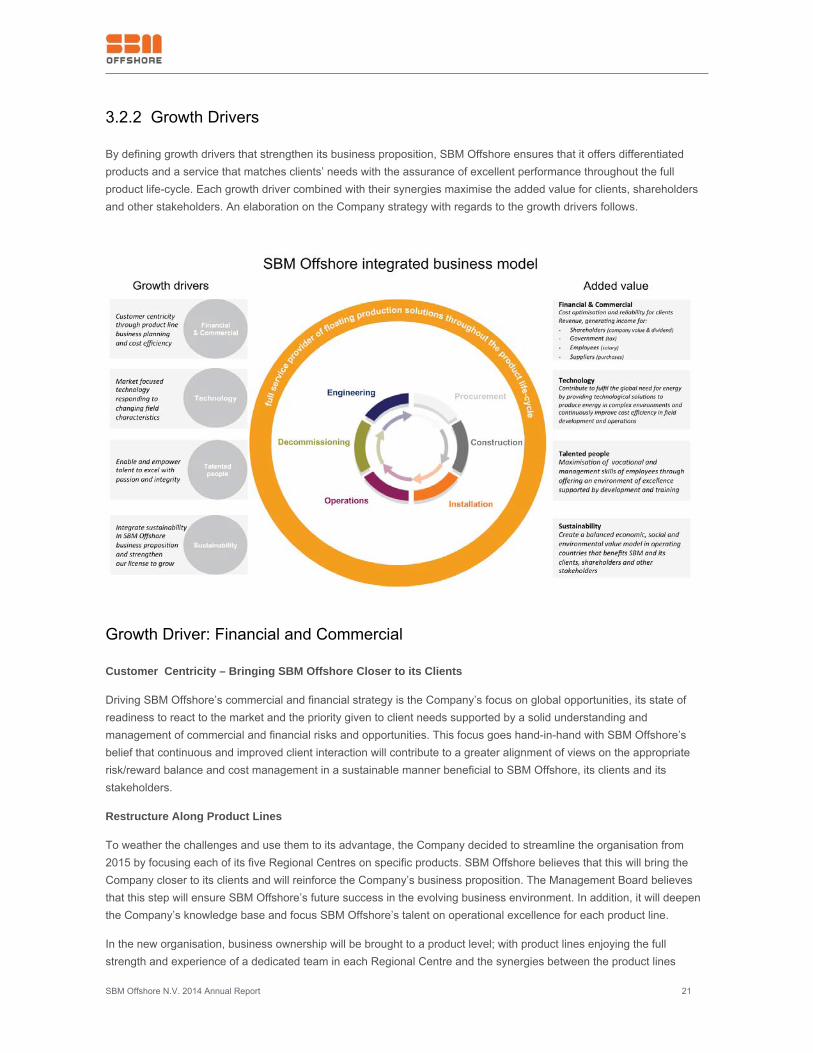
By defining growth drivers that strengthen its business proposition, SBM Offshore ensures that it offers differentiatedproducts and a service that matches clients’ needs with the assurance of excellent performance throughout the fullproduct life-cycle. Each growth driver combined with their synergies maximise the added value for clients, shareholdersand other stakeholders. An elaboration on the Company strategy with regards to the growth drivers follows.
Growth Driver: Financial and Commercial Customer Centricity – Bringing SBM Offshore Closer to its Clients
Driving SBM Offshore’s commercial and financial strategy is the Company’s focus on global opportunities, its state ofreadiness to react to the market and the priority given to client needs supported by a solid understanding andmanagement of commercial and financial risks and opportunities. This focus goes hand-in-hand with SBM Offshore’sbelief that continuous and improved client interaction will contribute to a greater alignment of views on the appropriaterisk/reward balance and cost management in a sustainable manner beneficial to SBM Offshore, its clients and itsstakeholders.
Restructure Along Product Lines
To weather the challenges and use them to its advantage, the Company decided to streamline the organisation from2015 by focusing each of its five Regional Centres on specific products. SBM Offshore believes that this will bring theCompany closer to its clients and will reinforce the Company’s business proposition. The Management Board believesthat this step will ensure SBM Offshore’s future success in the evolving business environment. In addition, it will deepenthe Company’s knowledge base and focus SBM Offshore’s talent on operational excellence for each product line.
In the new organisation, business ownership will be brought to a product level; with product lines enjoying the fullstrength and experience of a dedicated team in each Regional Centre and the synergies between the product lines
SBM Offshore N.V. 2014 Annual Report 22
maximised by top management.
The products are derived from the core competencies already existing in the Company. In place will be a more agileorganisation with a more diversified product offering focused on operational excellence and an improved management ofthe cost base. This will be combined with stronger means to develop tomorrow’s managers through an increasedportfolio of leadership roles that empower them to grow the business.
The new organisational model along Product Lines involves implementation of the following improvements:
Revision of the business development and acquisition approach in closer coordination with project execution●
Specialisation of each Regional Centre along a set of product lines with clear ownership and accountability●
Further development of integrated project teams●
A Product Line is defined as a distinct product sold or marketed to an external or an internal client. Product Lines asorganisational units (i.e. Regional Centres) will have responsibility over their own profit and loss. The centres will also bein charge of acquiring business through their own Sales team with the support of a central Marketing & BusinessDevelopment function, and to capture, further refine and maintain the product memory of the respective products. Forexample, one central product line will be totally dedicated to FPSOs, the Company’s key offering. The product lines willbe managed by the five Regional Centres in Monaco, Schiedam, Kuala Lumpur, Houston and Rio de Janeiro. GroupSales and Marketing will remain accountable for Business Development including functional responsibility for BusinessAcquisition & Proposals.
Reposition Strategic Product Portfolio
Rejuvenating its strategic product portfolio – while keeping its focus firmly on the high-end, high-technology FPSOsegment – ensures that SBM Offshore offers a complete spectrum of products to accommodate all floating productionneeds. Based on its know-how and strong historical track record in other segments, such as Semisubmersible & TLPproduction units, turret & mooring systems, topsides and brownfield projects, the Company will reposition its portfolio byenlarging the envelope and explicitly including these trusted solutions. In addition, SBM Offshore will continue toleverage its expertise in turrets for the new FLNG segment and will commercialise its own FLNG design for production.
Risk Reward Balance
One way to counter the trend of a hesitant market in view of slow demand for oil and increasing production costs,combined with competitors encroaching on SBM Offshore’s market segment, is to step away from the risk-rewardambitions that the company has set itself. However, this is not a responsible solution in the Management Board’s view.Given the inherent risks in project construction, the long construction period and the one-off nature of the projects, therisks of being saddled with loss making projects for years to come is clearly not in the interest of shareholders. Therefore,the company will maintain its pricing discipline when participating in the ongoing tenders.
The low order intake momentum affects SBM Offshore’s turnkey business and the Company has had to take toughmeasures to reduce its engineering capacity. By retaining the core staff capable of handling the large complex projects,the Company has taken great care not to weaken its position in the medium term, when it expects the market to comeback with a strong demand for FPSOs.
Focus on Cost Efficiency
The technical solutions required to develop deepwater fields are complex, expensive and require substantial amounts ofupfront investment before any production is achieved. An increasing number of parties participate in field development,adding complexity to contractual agreements and liabilities. The investments in FPSOs are financed from a diversefinancial base and are mostly shared with SBM Offshore’s joint venture partners. From the client’s perspective, there isincreasing involvement from partners in the field and national oil companies on how the fields are developed. These
SBM Offshore N.V. 2014 Annual Report 23
complexities have led to higher CAPEX levels, local content development and generally longer lead times to production,putting pressure on the returns of SBM Offshore’s clients who now seek solutions to reduce costs.
The temporary drop in engineering activities also provides an opportunity to focus SBM Offshore’s attention on costs andquality improvement projects, as well as on R&D. In 2013, the Company started a project called Odyssey 24, with thetask to transform the Company’s ways of working in critical areas, such as project supply chain and cash flowmanagement, as well as putting in place improved formal management systems. This project is expected to result insignificant cost savings for SBM Offshore’s future FPSOs. Continued investment in R&D is expected to open up newcommercial opportunities such as for FLNG.
Risk Concentration
SBM Offshore operates predominantly in deepwater areas. The primary areas of development for oil in deepwater areconcentrated in Brazil, West Africa and the Gulf of Mexico. SBM Offshore aspires to a well-balanced regional portfolio,but is currently heavily concentrated in Brazil, as that is where most deepwater developments are taking place.Medium-term prospects outside Brazil are attractive and offer opportunities to build upon a better spread for theCompany’s portfolio of activities. Mexico is a clear example of this. See chapter 4.4 for the full outline of SBM Offshore’srisk and opportunity management strategy.
Reliability
Reliability goes hand in hand with superior financial results by guaranteeing safe, high level performance during offshoreoperations and timely delivery of FPSOs and other products. World-class operational excellence is determined by theCompany’s high-quality products and talented, high-achieving personnel.
SBM Offshore relentlessly focuses on quality, health, safety and environment as is evidenced by increased training,supervision, measurements of relevant lagging and leading indicators, as well as close collaboration with clients andcontractors at the yards and offices where the execution of activities takes place.
One area of particular attention is the focus given to a strong compliance culture. Following the discovery of potentiallyimproper sales practices some years ago, SBM Offshore has put in place a comprehensive compliance programme,which has been independently tested and verified in the course of 2013 and again in 2014, and is judged to be betterthan industry average. As there is no room for complacency in this respect, the programmes remain in full force. Seechapter 4.5 for a full outline of the Company’s Compliance strategy.
With its focus on reliability the Company has laid a strong foundation to comply with requirements for the ESG(Environment, Social and Governance) criteria of lenders and investors.
Funding
The lease and operate model, where SBM Offshore owns the FPSOs, leases them to clients, and operates them for theduration of the project puts significant pressure on the Company’s balance sheet. SBM Offshore uses both corporate andproject finance products. Recently, the Company tapped new sources of funding to diversify and reduce its dependenceon traditional project finance provided by international banks.
Joint Venture Structures
When SBM Offshore signs a new FPSO contract, it generally sets up a joint venture (JV) with one or several partners,while maintaining at least 50% ownership. The JV is the formal contracting party that contracts with the client and placesthe purchase order for the FPSO with SBM Offshore serving as project contractor. In this set-up, the project risk remainsmostly with SBM Offshore, while the partners co-fund their share of the construction lump-sum cost. The JV alsoarranges project finance, with a pre-completion guarantee from the parents and a non-recourse structure once the FPSO
SBM Offshore N.V. 2014 Annual Report 24
is on hire. JV partners include local national oil companies such as Sonangol in Angola, industry partners such asQueiroz Galvão Óleo e Gás S.A. (QGOG), MISC Bhd and Nippon Yusen Kaisha (NYK) and financial partners such asMitsubishi Corporation.
Borrowing
At the corporate level, SBM Offshore has a revolving credit facility (RCF) of $1 billion, which can be drawn and repaid asneeded. It is a source of flexibility, renewed end 2014 for a five-year term with two extensions of one year. The RCFcontains financial covenants that are specified elsewhere in this report. In principle, the company intends to use, onaverage, 50% or less of the RCF’s capacity. The Company has a medium-term objective to issue corporate bonds, whichwould require a credit rating. In view of the close out of several legacy issues as well as the current low order intakeenvironment, it is not possible to specify when this objective will be achieved. In 2014, a US Private Placement wassecured for the Deep Panuke Production Field Centre and project financing for FPSO Cidade de Maricá.
Master Limited Partnership
In November 2014, SBM Offshore announced its intention to launch another financing instrument, a master limitedpartnership or MLP. This US-listed instrument will include some or part of SBM Offshore’s equity in a number of FPSOsand is attractive due to the strong valuation characteristics and the opportunity for follow-on issuances to fund the growthof the portfolio in the medium to long term. The instrument is immediately value accretive for SBM Offshore’sshareholders and the initial offering is expected for later in 2015.
Scenario Analysis
As part of the annual strategy review, SBM Offshore creates a three-year financial plan to quantify financial targets andto test its financial ambitions against a number of scenarios. As the current market situation makes abundantly clear, thefuture, even in the short term is uncertain, and the company needs to be ready to deal with all eventualities. The scenarioanalysis highlights the following distinct features that are important in the assessment of SBM Offshore’s strengths andweaknesses.
Growth Driver: Technology
Market focused technology
SBM Offshore has a long, proud history of innovative technology and the Company continues this strong focus andinvestment with a targeted Research and Development programme to maintain its recognised position as a leadingpioneer. In an ongoing process the Company develops technologies that enable clients to develop and operate fieldsunder increasingly complex circumstances as well as breaking through barriers to develop new frontiers. Several globaltrends in the location and types of reservoirs give SBM Offshore the impetus to innovate and meet the clients’ needs:
Exploration in ever deeper waters●
Deeper reservoirs being discovered and developed●
Demand for cleaner energy such as gas●
Frontier areas being explored●
Harsher environmental conditions for some new fields●
A good example is the FPSO that SBM Offshore is currently constructing for Shell’s Stones ultra-deepwater developmentin the Gulf of Mexico. The project presents several world first developments, and SBM Offshore is proud to have theconfidence of its client and contribute to this ground-breaking project.
Other ongoing projects in the R&D programme include:
SBM Offshore N.V. 2014 Annual Report 25
Process minimisation, to reduce the weight of the process facilities●
Standardisation to speed up the typical construction time of an FPSO●
Very High Pressure (VHP) Fluid Swivel for the Company’s turrets to deal with the very high pressure and high temperatures in certain●
ultra-deep reservoirs
Mid-scale FLNG●
Technologies that enable permanent mooring in cyclonic areas.●
A specific project for design optimisation to reduce FPSO topsides weight and the associated costs was launched bySBM Offshore in 2014. An element linked to this in field operations is the strong drive towards cost reduction, resulting inthe need for technology that enables enhanced oil recovery and the extension of life of equipment.
SBM Offshore’s ambition is to focus even more on clients’ technology needs by obtaining more input on market trendsthrough its new Product Line organisation enabling the Company to respond more quickly to developments and toprovide for even more bespoke solutions. SBM Offshore will continue to share its latest innovations with clients during its‘Technology days’ and embrace their input to the dialogue in order to tailor solutions to the client’s exact needs.
SBM Offshore sees an increasing importance in the development of innovative, sustainable technology that createsadded value for stakeholders. For more information see chapter 3.3 on sustainability.
SBM Offshore N.V. 2014 Annual Report 26
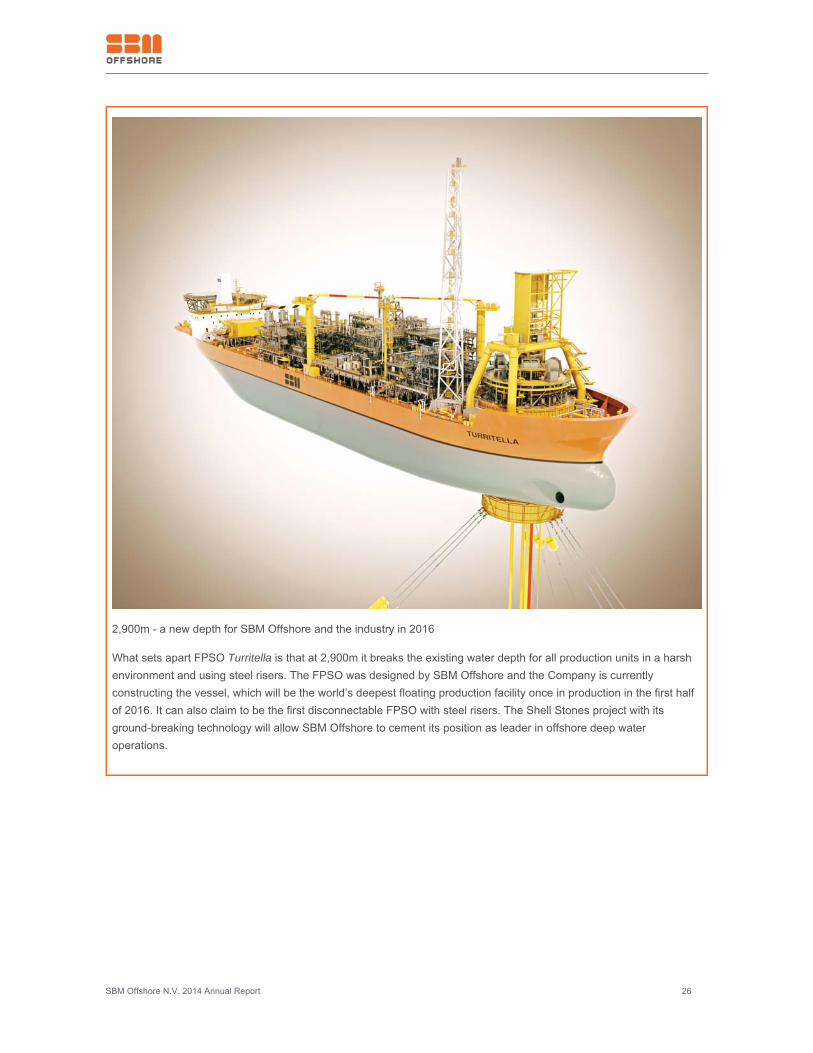
2,900m - a new depth for SBM Offshore and the industry in 2016
What sets apart FPSO Turritella is that at 2,900m it breaks the existing water depth for all production units in a harshenvironment and using steel risers. The FPSO was designed by SBM Offshore and the Company is currentlyconstructing the vessel, which will be the world’s deepest floating production facility once in production in the first halfof 2016. It can also claim to be the first disconnectable FPSO with steel risers. The Shell Stones project with itsground-breaking technology will allow SBM Offshore to cement its position as leader in offshore deep wateroperations.
SBM Offshore N.V. 2014 Annual Report 27
Growth Driver: Talented people
Enable and Empower Talent
SBM Offshore is ultimately defined by the capabilities of its people. The Company has grown significantly over the lastfive years and it is catching up by putting in place fit-for-purpose people management systems, such as talentmanagement, training and recruitment programmes, appraisal programmes, broad staff communication tools and clientengagement skills. Also, SBM Offshore has invested heavily in professionalising its non-engineering positions over thepast few years.
In conducting its business activities, SBM Offshore strives to maintain an employment policy focusing on ethics,transparency and equity. The Company wants to promote equal opportunities and social responsibility in order tocultivate a diverse, multi-cultural and respectful workforce whose principal drivers are entrepreneurialism, team energyand pride. Since its employees are key to the success of the Company it is continuously working on the attraction,retention and development of talent and encouraging an environment of excellence and ambition within which eachemployee can maximise his/her skills. See chapter 4.10 Human Resources for a full outline of the strategy andprogrammes.
SBM Offshore’s global talent strategy is of a great importance as it underpins all activities. It adds value byunderstanding where the business is going and linking human capital requirements to deliver the business results for theshort and long term. To strengthen its talent strategy, the Company has performed an external best-in-class benchmarkacross talent acquisition, development, deployment and retention practices. In the benchmark, SBM Offshore needswere identified in order to attract and select the best talent, develop overall employee capability, and develop successorsto the Company’s key leadership roles. Well thought out methodologies and effectively trained leaders will increase SBMOffshore’s competitive edge in securing its global talent pipeline.
Growth Driver: Sustainability License to Grow
SBM Offshore believes in doing business that benefits clients, employees, shareholders and society in general. SBMOffshore considers this to be its fundamental ’License to Operate’ and is well embedded in the Group’s operations andfunctions and plays an essential part in its continuous improvement programs.
Carrying the Company beyond compliance, SBM Offshore believes that sustainability creates its ‘License to Grow’ andwill provide the Company with a competitive edge for future business. The Company’s ambition is to fully integratesustainability into its business proposition and to create a balanced economic, social and environmental value model inall of the countries in which it operates.
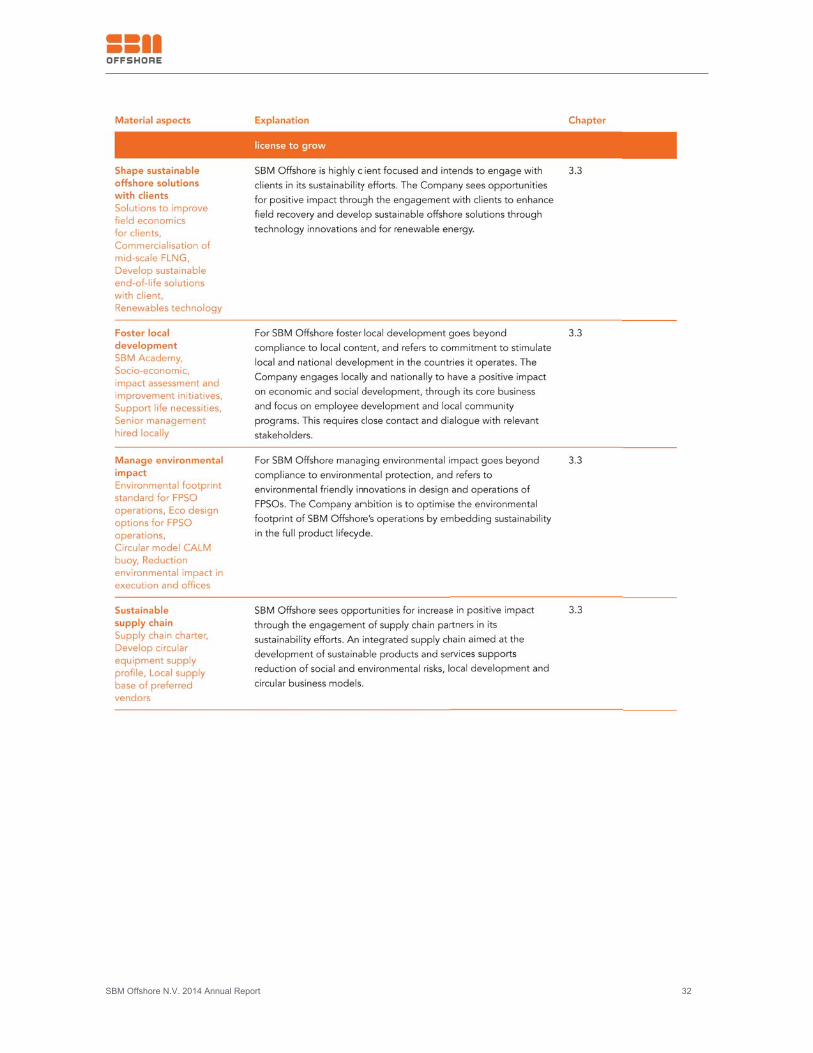
The Company’s strategy for sustainability is focused at its License to Grow for which four material themes have beendefined:
Manage the environmental impact of all activities by optimising the footprint of SBM Offshore’s operations and embed sustainability in●
the full product lifecycle
Shape sustainable offshore solutions with the clients and engage with them to enhance field recovery through technology innovations●
Create a sustainable, integrated supply chain aimed at the development of sustainable products, services and business models●
Foster local development and enhance the positive socio-economic impact in the countries in which the Company operates through●
employee development and local community programs
See chapter 3.3 Sustainability Strategy for a full outline. See chapter 7.0 Performance Indicators, which gives anall-encompassing overview of the non-financial performance in the context of the GRI G4 standard and guidelines.
SBM Offshore N.V. 2014 Annual Report 28
3.3 Sustainability Strategy
3.3.1 Introduction
Sebastiaan de Ronde Bresser - Group Sustainability Director
“SBM Offshore aims to be the industry frontrunner on sustainability as reflected in the Company’s vision. To achieve thisambition, SBM Offshore continuously strives to promote sustainability awareness, develop talent within the company andincorporate ethics and integrity in all its activities. Sustainable development is an important growth driver for SBMOffshore’s business and operations. It distinguishes its sustainability policies between ‘license to operate’ and ‘license togrow.”
Embedding sustainability as a way of working in SBM Offshore is founded on continuous engagement with its employeesvia special events in all locations and through Company-wide communications. In addition, reporting on successfulsustainable initiatives, charity projects and donations will improve awareness and further encourage engagement. Forthis purpose and with the support of Odyssey 24 transformation program, Sustainability processes have been createdand represent one of the 19 key processes, with which SBM Offshore runs its business.
A community of employees promoting sustainability principles within the company has been initiated with “champions”taking on sustainability roles alongside their regular jobs. At a management level, the Chief Governance and ComplianceOfficer is responsible for the sustainability strategy with implementation under responsibility of the Group SustainabilityDirector. In Brazil, a country based Sustainability Manager was appointed this year to focus on the Brazilian activities –including the Brasa shipyard – and to increase their local impact.
In 2015 the Company will start the implementation of its new policies and develop performance indicators. In next year’sAnnual Report SBM Offshore will report on performance, including several key performance indicators.
Sustainable development is an important growth driver for SBM Offshore’s business and operations. The Companydistinguishes its sustainability policies between ‘license to operate’ and ‘license to grow:
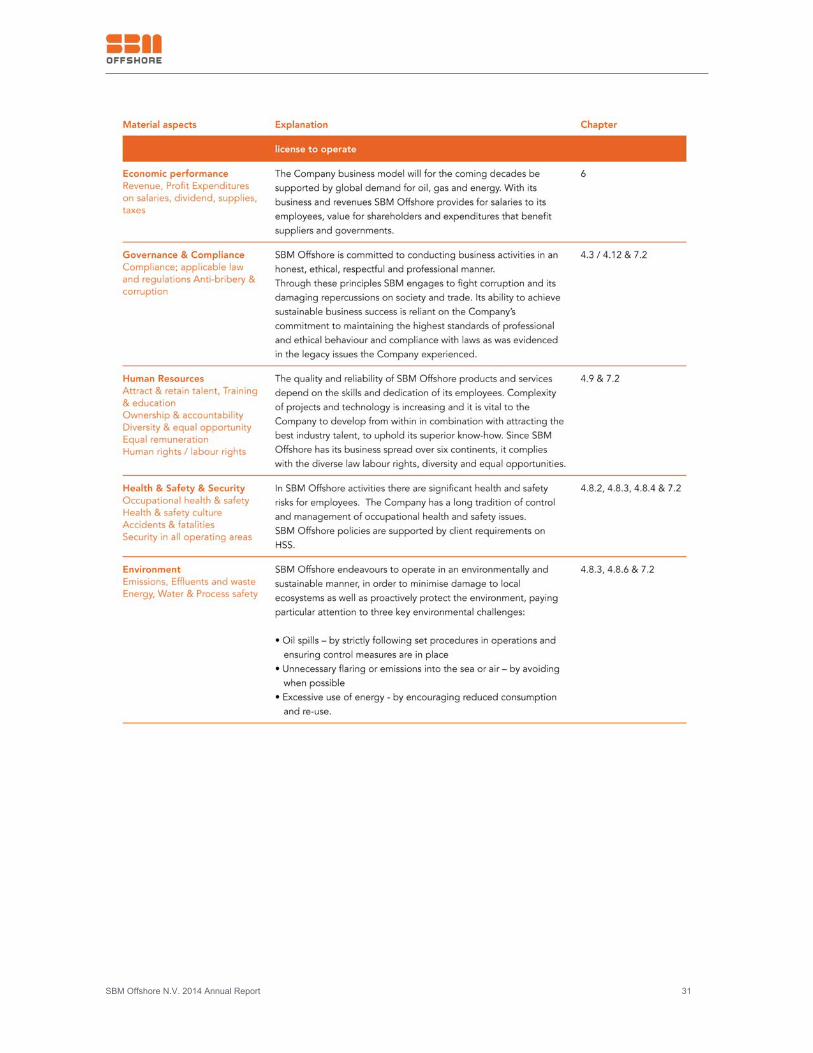
License to operate refers to the standards required to operate in accordance with the law and regulations on ethics,safety, health, quality, labour standards, environmental standards, governance, and client specifications. SBM Offshorehas a long history on managing and reporting its performance on the license to operate aspects. See Chapters 4.0 and7.0 for more information.
Licence to grow requires SBM Offshore to look above and beyond the rules and regulations, to grow its business in asustainable manner, while creating a competitive edge and in parallel maintaining a healthy balance in theenvironmental, social and economic impact of its activities. The elements in the license to grow have been newlydeveloped this year and are explained in more detail in this section. In 2015 the Company will start the implementation ofits new policies and develop performance indicators. In next year’s Annual Report SBM Offshore will report onperformance, including some performance indicators.
SBM Offshore N.V. 2014 Annual Report 29
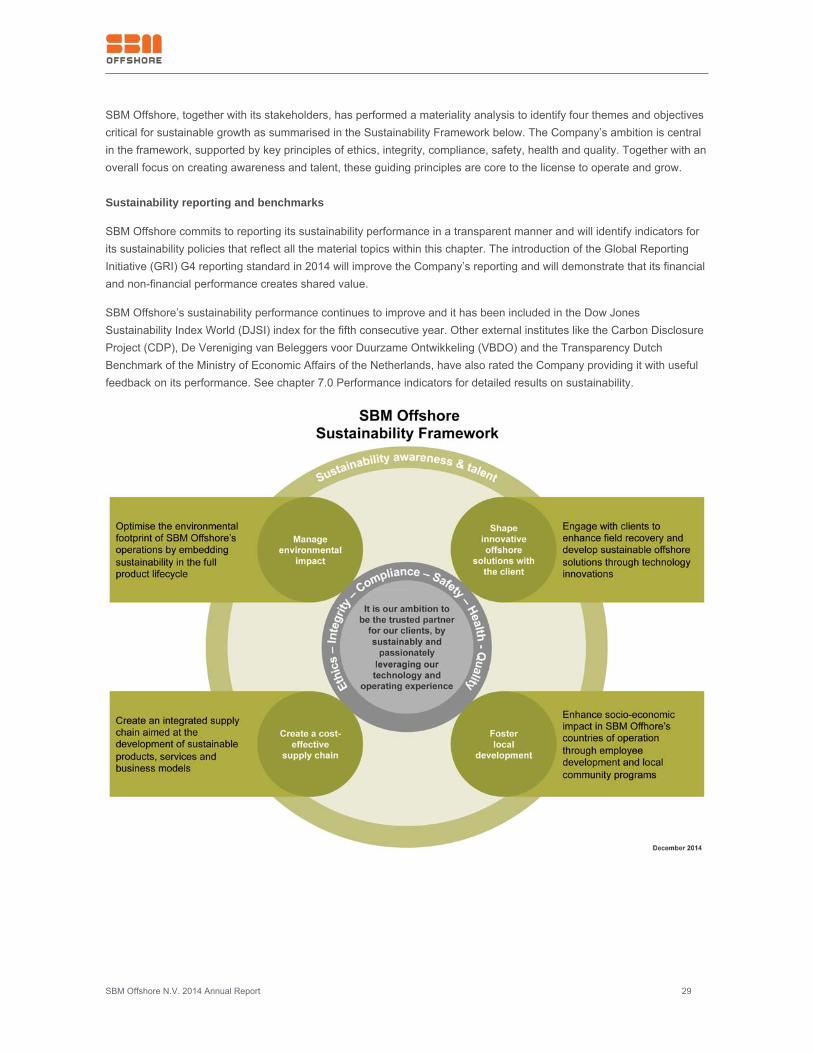
SBM Offshore, together with its stakeholders, has performed a materiality analysis to identify four themes and objectivescritical for sustainable growth as summarised in the Sustainability Framework below. The Company’s ambition is centralin the framework, supported by key principles of ethics, integrity, compliance, safety, health and quality. Together with anoverall focus on creating awareness and talent, these guiding principles are core to the license to operate and grow.
Sustainability reporting and benchmarks
SBM Offshore commits to reporting its sustainability performance in a transparent manner and will identify indicators forits sustainability policies that reflect all the material topics within this chapter. The introduction of the Global ReportingInitiative (GRI) G4 reporting standard in 2014 will improve the Company’s reporting and will demonstrate that its financialand non-financial performance creates shared value.
SBM Offshore’s sustainability performance continues to improve and it has been included in the Dow JonesSustainability Index World (DJSI) index for the fifth consecutive year. Other external institutes like the Carbon DisclosureProject (CDP), De Vereniging van Beleggers voor Duurzame Ontwikkeling (VBDO) and the Transparency DutchBenchmark of the Ministry of Economic Affairs of the Netherlands, have also rated the Company providing it with usefulfeedback on its performance. See chapter 7.0 Performance indicators for detailed results on sustainability.
SBM Offshore N.V. 2014 Annual Report 30
The framework addresses both “license to operate” and “license to grow” elements of the company with a focus on fourthemes:
- Shape innovative offshore solutions with the client
- Foster local development
- Manage environmental impact
- Create a cost-effective supply chain
3.3.2 Materiality
In 2014, SBM Offshore conducted a materiality assessment to focus its strategy and policies and to report on theactivities that matter most to the Company and its stakeholders. See chapter 2.2 Shareholder Information andStakeholder engagement for more details.
A list of potential material topics based on GRI aspects, desk research on industry topics and a peer review werecompiled and further cross-checked with internal and external stakeholders before a short-list was discussed andfinalised with SBM Offshore’s Management Board and Executive Committee for integration into the company’ssustainability strategy framework.
The table below further embeds the material topics along the sustainability policies of license to operate’ and ‘license togrow’.
SBM Offshore N.V. 2014 Annual Report 31
SBM Offshore N.V. 2014 Annual Report 32
SBM Offshore N.V. 2014 Annual Report 33
3.3.3 Shape Innovative Offshore Solutions with the Client
Engage with clients to enhance field recovery and develop sustainable offshore solutions through technologyinnovations.
SBM Offshore strives to be client focused and works together with its clients on its sustainability efforts. The Companyfocuses on providing services from or on the FPSO, which improve production recovery and/or reduce overall costs forthe operator. Solutions focus on the complete lifecycle of the oil and gas field including liaising with drilling and subseaactivities, which are not directly in the Company’s scope; lower carbon footprint solutions to help offset potential costs(e.g. taxation on greenhouse gas emissions) and which could improve marginal field economics.
Decommissioning, demobilisation and consequent disposal of the FPSO have an effect on the environment and society,and needs to be managed whilst minimising the impact. Together with its partners, SBM Offshore is currently working ondecommissioning two vessels. The execution of these decommissioning contracts will be analysed with the intention toidentify further sustainable options for future contracts.
Policy for decommissioning
A Company-wide Vessel Recycling Policy is under final review and aims to recycle safely and environmentallyresponsible all vessels and structures at the end of their useful life. The Company adheres not only to applicable laws,rules and regulations, but also to international guidelines such as the International Convention for the Safe andEnvironmentally Sound Recycling of Ships (the ‘Hong Kong Convention’) of the International Maritime Organizationof theUnited Nations. SBM Offshore will discuss with all joint venture partners involved its aim to minimise the social impactand environmental footprint related to all recycling activities at the end of life. Under the Odyssey 24 transformationprogram the process for decommissioning of FPSOs is being developed as part of SBM Offshore’s new GlobalEnterprise Management System (GEMS).
LNG is considered to be a more sustainable energy resource than oil and currently stranded offshore gas fields are beingcommercialised by enabling FLNG technology. FLNG vessels based on LNG tanker conversions can replicate thesuccess of converted FPSOs. Drawing on the experience from the global FPSO fleet, SBM Offshore has developed itsown solution, called the mid-scale FLNG Twin Hull concept. The intention is to measure the environmental and socialimpact of using a FLNG solution compared to traditional oil producing FPSOs, to support sustainability claims.
“We can transfer the knowledge and experience we have on FPSOs to FLNG, for SBM Offshore it is a natural evolution.”
Mike Wyllie - Group Technology Director
The world is seeking cleaner energy to reduce carbon emissions and this is reflected in the huge growth in demand forLNG as a fuel. In the last years the technology for floating LNG has steadily matured. SBM is already involved insupplying mooring systems for floating LNG vessels. Our ambition is to progress into the full lease & operate of midscaleFLNG, in the same way that we do for FPSOs. It is a natural evolution for SBM to transfer the knowledge and experiencewe have on FPSO design, construction, operations and maintenance to Floating LNG. We are partnering with others tocover the specific gaps in our technical expertise and with the different market of long term offtake contracts. SBMOffshore is ready to step into the growing FLNG market where it sees a number of exciting prospects. In terms of localdevelopment, SBM sees FLNG as a way to offer development opportunities in areas where there is no oil, but significantgas reserves offshore to be developed. SBM Offshore will be able to rely on its local content track record, and hope toreplicate the local infrastructure projects in new areas, as we have done in countries such as Angola and Brazil andcontribute to sound national development driven by FLNG.
SBM Offshore N.V. 2014 Annual Report 34
Renewable Energy at SBM Offshore
SBM Offshore, with its extensive experience of offshore systems, is pursuing initiatives to leverage its in-house expertiseand has developed renewables technology with several R&D programmes for alternative energy. Wave energy isdeemed to be the most important source of marine renewable energy (before offshore wind, tidal and Ocean ThermalEnergy Conversions), however it is also the most difficult to capture.SBM Offshore has developed a breakthrough technology with the design of a Wave Energy Converter (WEC). The WECworks with electro-active polymers (EAP) that convert energy from waves directly to electricity without any mechanicalmoving parts. During the last few years SBM Offshore has made steady progress, both in the overall system design andin the performance of the EAP material. In the past year the Company achieved the step-change in performance whichwas required to move into the commercialisation phase. The Company is now exploring ways to bring this technology tothe market.
3.3.4 Foster Local Development
Enhance socio-economic impact in SBM Offshore’s countries of operation through employee development and localcommunity programs.
SBM Offshore has a long tradition of working with developing countries that are keen to explore the use of their naturalresources to stimulate national economic development. Alignment of business and national interests by way ofstructuring investments can offer the host country maximum benefit and opportunities to leverage from in the longer term.In doing so SBM Offshore focusses beyond local content requirements to contribute to sustained national and localdevelopment.
The lease and operate contracting structure provides possibilities for shared ownership and joint ventures includinginvestments in project construction and development, thereby addressing and supporting national economicdevelopment. Practical applications include local supply bases, interests in local construction yards and training ofnational employees. All this require close contact and dialogue with relevant stakeholders.
SBM Education Centre
“We want to become an exporter of local talent instead of an importer of expatriate skills”
Richard Demblon - Group Human Resources Director
Within SBM Offshore, HR is a business partner for the organisation. Part of fulfilling this role is empowering andenabling the local business to be able to deliver to clients while creating a positive impact on local development. We arecurrently implementing the SBM Education Centre in local development areas for SBM Offshore employees. The conceptof the SBM Education Centre is developed in order to address not only the development of local professional andmanagement staff. All initiatives of the Education Centre are focused on creating local employment and fostering talent,such as local graduate recruiting, development of non-management high potentials, training local communities in theyards and engaging in local partnerships. Local skills could be further leveraged, which will reduce our dependency onthe import of expats.
SBM Offshore is currently implementing local management talent development programmes. The aim is to increase thepercentage of local professional and management staff, while maintaining a high level of vocational training for localemployees.
SBM Offshore N.V. 2014 Annual Report 35
Angola, training and stakeholder engagement
Training Facilities at the Paenal yard in Angola
In parallel with the construction activities, a dedicated school was established at the yard to educate local nationalsemployed in the technical skills required at Paenal. Training was undertaken by experienced personnel specially broughtin to transfer their expertise and now the trainers themselves are Angolan nationals. To date, over 600 workers from theKwansa Sul region have received training to ensure a first-rate service. On a broader scale, SBM Offshore has helped tocontribute to the knowledge base of Angola’s oil and gas industry and complements the formal education gained bystudents at Angola’s National Petroleum Institute (INP) in nearby Sumbe.
The Future Generation in Porto Amboim
Concern and awareness for the needs of the local community of Porto Amboim is of great importance to themanagement at Paenal. When the local school was found to be unsafe and in a severe state of disrepair, Paenalimmediately committed to building from scratch a brand new building with educational facilities that could accommodate350 local children, with the support of partner companies in the area.
As the town of Porto Amboim continues to prosper, more families will arrive in the area to take advantage of theemployment opportunities and the need for properly equipped and safe schools will increase.
By performing socio-economic impact assessments SBM Offshore measures and demonstrates the value it creates interms of social, environmental and economic impact on the local society. The assessments will be based on a sound andtransparent methodology in which stakeholder opinions will be included. The results will be discussed with localstakeholders with the aim to jointly define improvement plans.
Brazil, socio-economic impact study
In 2014 SBM Offshore performed the first socio-economic impact assessment in Brazil. It was a pilot to develop themethodology in which 2013 data has been used. The assessment included the construction activities at the Brasa yard,the project execution at the office in Rio de Janeiro and the operations of the fleet of SBM Offshore FPSOs offshoreBrazil. The results were as follows:
4,211 jobs generated at Brasa yard, SBM Offshore offices and operations48,221 jobs generated in Brazil as a consequence of SBM Offshore’s activitiesUS$ 775 mln total added value of SBM Offshore activities to Brazil production
There is a very significant impact on jobs, as each SBM Offshore job supports additional jobs in the supply chain throughan indirect impact (purchases of products and services) and induced impact (there is an increase in family income thatgenerates an increase in consumption that in turn generates an increase in job demand). The analysis has taken intoaccount the effect on all sectors in the economy, including informal jobs.
SBM Offshore’s activities generated 4,211 direct jobs and relate to a total of 48,221 jobs in Brazil due to the indirect andinduced impacts. In terms of added value to business generated in the Brazilian economy, SBM Offshore activitiesgenerate a direct business activity of US$ 465 milllions a total business activity in the Brazilian economy of US$ 775millions; the latter includes purchases of products and services and margins in the supply chain.
The data provided in above section, in relation to the Social Impact Assessment in Brazil, have not been verified as partof PwC's scope in the review of Sustainability Information. The data are the result of a Social Impact Study performed byDialog Consultoria out of Brazil.
SBM Offshore N.V. 2014 Annual Report 36
3.3.5 Cost-effective Supply Chain
Creation of an integrated supply chain aimed at the development of sustainable products, services and business models
Bernard van Leggelo - Group Executive Managing Director
“We aim to have an integrated supply chain that is prepared for our future perspective which will combine the commercialedge with the sustainability edge.”
Embarking on the journey 20 years ago, SBM Offshore has a history of assessing the direct impact of its actions, such assafety in operations and the reduction of emissions, long before it became an issue for the industry. The Companycontinues its forward thinking by addressing the issue of sustainability within the supply chain. Beginning the processwith awareness for the topic within the Company and among its stakeholders, the aim is to engage the voluntaryparticipation of the Company’s vendors by adopting this philosophy and implementing it in the future. SBM Offshore willseek discussion on concepts such as circular supply chains and building on the experiences that it already has withrefurbishment of equipment. The Company aims to have an integrated supply chain that is aligned to the set goals onHSSE and that will in future combine the commercial edge with the sustainability edge.
SBM Offshore has recently developed and implemented a Supply Chain Sustainability Charter. This charter looks tosuppliers and construction yards to voluntarily commit to continuous improvement in social and environmentalperformance and full adherence to SBM Offshore’s ethics standard as per Code of Conduct.
SBM Offshore engages with key equipment suppliers to develop a circular equipment supply profile. Today, SBMOffshore works with some suppliers in refurbishment of certain key components of its topsides. The intention is to furtherdevelop the concept of circularity with all suppliers and create circular business models.
SBM Offshore has a local supply base and is looking for ways to further strengthen it by investing in the development oflocal skills through training and by encouraging local vendors to meet SBM Offshore (sustainability) standards. This willallow local vendors to increase their capacity and expand their business with the benefits being captured by the localeconomy and population.
SBM Offshore N.V. 2014 Annual Report 37
3.3.6 Manage Environmental Impact
Optimise the environmental footprint of SBM Offshore’s operations by embedding sustainability in the full productlifecycle
“We believe that managing our environmental impact will help us to be more cost effective in the long term and helps usto gain credibility in communities where SBM Offshore operates.”
Peter Senkbeil - Managing Director Operations
For SBM Offshore, managing environmental impact goes beyond compliance to environmental protection, and refers toenvironmentally friendly innovations in operations of FPSOs. The Company sees clients’ behaviour directed byenvironmental considerations. SBM Offshore operation’s environmental footprint goes hand in hand with good operatingpractice, for example the efficient running of gas injection compressors or oil in water treatment plants.
SBM Offshore has implemented initiatives to reduce its environmental impact caused by flaring, spills, GHG emissionsand energy consumption. Performance in 2014 is presented in Chapter 7.2. The Company intends to go a step furtherand is developing a standard for the environmental footprint of FPSOs in operation, by establishing a baseline forenvironmental performance of its existing fleet. The baseline is the first step in developing an environmental standard,which will cover the full spectrum of both offshore operations as well as onshore support from the shore base. Theenvironmental standard will not only set the standard for new FPSOs, but will also allow benchmarking of existingFPSOs’ performance and indicate options for improvements.
In SBM Offshore’s Regional Centres, construction yards and offices, focus will be on managing environmental impactsby reducing waste, energy consumption, transportation and travel. An additional aim of this activity is to raisesustainability awareness with employees to actively incorporate sustainability in their daily work.
SBM Offshore already has several sustainable and eco design options for FPSO operations that are discussed withclients. These options will be incorporated in its proposals to enable clients to make a choice regarding the level ofenvironmental and social impact of the FPSO over its lifecycle. In its offerings SBM Offshore will compare a base caseFPSO, which is compliant with client specification, with a solution that reduces the environmental and/or social impact.The options can be related to the construction, operations and/or decommissioning phase and will include data tosupport the sustainability claim.
Sustainable technology and operationsOne of the examples where operational efficiency goes hand in hand with sustainability is SBM Offshore’s effort toreduce flaring during the start of production. Regularly there is a period of three to seven months at the start ofproduction where gas compressors need to get optimised and flaring is needed. In the case of FPSO Cidade de Paraty,SBM Offshore limited the period with flaring to less than two months.
SBM Offshore N.V. 2014 Annual Report 38
4 Report of the Management Board4.1 Introduction
2014 was a challenging year for SBM Offshore with the Company impacted by a slow market and the investigation intoalleged improper sales practices. The Management Board’s focus was balanced between seeking new businessopportunities, continuing to transform the Company and working towards closure of legacy issues, while delivering on itscontract commitments to clients in a safe and sustainable manner.
SBM Offshore deeply regrets having to report, in early 2014, two fatalities of yard contractor staff on construction projectsin Singapore. A thorough investigation has been conducted and appropriate measures have since been put in place at allcontractor facilities. The fatalities were all the more regrettable because over the course of the year, SBM Offshoreachieved an improved safety performance. This was due in part to the focused drive, commitment and involvement of allemployees and contractors alike. It also included the positive impact of the Company’s first dedicated ‘Life Day’ -focusing everyone involved in SBM Offshore’s worldwide projects on health and safety for 24 hours.
Business activities
SBM Offshore’s Operations recorded high levels of production uptime and a key highlight was the addition of two FPSOsto the producing fleet.
Notable achievements included:
N’Goma FPSO (Eni Angola S.p.A.): First oil from Block 15/06 offshore Angola achieved in November and on a 12-year lease and●
operate contract
FPSO Cidade de Ilhabela (Petrobras): First oil from the Sapinhoá field offshore Brazil in November and on a 20 year charter●
agreement
FPSO Kikeh (Murphy Oil): A brownfield project offshore Malaysia, adding production capacity, was brought online in February●
FPSO Turritella (Shell Offshore Inc.): Operations and Maintenance contract signed in May for the Stones development in the Gulf of●
Mexico .
In September the Company was awarded a Production Handling Agreement with Noble Energy for the Thunder HawkDeepDraftTMSemi in the US Gulf of Mexico. Production fees associated with produced volumes are estimated to lead upto projected revenue of US$400 million to be delivered over the ten-year primary contract period.
SBM Offshore received the Spotlight on New Technology award at the OTC conference in Houston. The award was forthe Company’s development of the Very High Pressure Fluid Swivel (VHP Fluid Swivel). The patented technologypioneers the industry’s efforts for full field development with FPSOs of reservoirs with high pressure high temperatureconditions, such as in the Lower Tertiary of the Gulf of Mexico.
Cash and Balance Sheet
Diversification of SBM Offshore’s funding sources remains a key strategy with a US Private Placement bond and saleand leaseback activities were successfully completed in 2014. The conclusion of the sale and leaseback of SBMOffshore’s real estate portfolio in Monaco in August raised US$62 million resulting in a book profit of US$58 million. InDecember, the Company announced the US$150 million sale and leaseback, and subsequent closing, of the DivingSupport and Construction Vessel (DSCV) SBM Installer to OS Installer AS. Under the terms of the agreement with OSInstaller AS, SBM Offshore will retain a 25% equity interest in the newly established joint venture and charter the DSCVunder a long-term bareboat charter for a fixed period of 12 years.
Following regulatory approval and subject to market conditions, SBM offshore expects to file a registration statement withthe US Securities and Exchange Commission for an Initial Public Offering of a Master Limited Partnership (MLP) in the
SBM Offshore N.V. 2014 Annual Report 39
third quarter of 2015. The MLP would initially cover interests in select Company FPSOs. This will, in the near term, allowthe Company to maximise the value of the lease fleet, while further optimising the balance sheet and providing along-term funding vehicle at a lower cost of capital.
Improper Sales Practice Settlement
An out-of-court settlement with the Dutch Public Prosecutor’s Office related to the inquiry into alleged improper salespractices was reached in November. Under the terms of the settlement the Company will pay the Dutch authoritiesUS$240 million in three instalments, the last of which is due in December 2016. Separately the US Department of Justicehas declined to prosecute the Company over the alleged charges.
SBM Offshore has made it clear that it has zero tolerance for the practices alleged to have taken place in the past. Astronger corporate governance structure and compliance programme has been put in place and been part of SBMOffshore’s structure and culture for several years now.
Company Transformation Programme
In 2013 SBM Offshore embarked on a two-year transformation programme (Odyssey 24) to maintain its position as acompetitive and efficient market leader. The programme was split into three parts:
Strengthening foundations: Improving processes, and associated Information Systems (IS) architecture●
Create & Protect Value: Better financial control of projects through win, execute and operate phases●
Adopt new ways of working: Re-aligning the role and responsibility matrix to achieve strategic goals●
Over the past 15 months, eight work streams (divided into 23 projects) have been defined and the Company hasengaged the entire business and drawn on best practices from the industry to design robust solutions, which will addressrisks and deliver cash savings. In 2014 the streams moved from the design phase into the pilot phase and deploymenthas started in order to realise maximum benefits for the 2015/2016 financial year and beyond.
A major emphasis has been placed on supporting the Company’s employees through the Odyssey 24 changes:
Training and coaching of middle management to guide their staff through change●
Wider communication to all employees so they understand the need for change●
Develop sponsorship from all regional centres’ top management●
Odyssey 24 aims to improve the way SBM Offshore operates; to optimise and consolidate what was a centrally managedbusiness to a decentralised model with accountable business units. The aim is to improve project management andcontrols as project costs have grown in size from around US$500 million a few years ago, to close to US$2 billion today.Costs are targeted to be reduced by at least 5% for each project through enhanced project management, supply chainand materials management, improving both profitability and competitive edge. Increased investments in R&D will ensureSBM Offshore stays at the forefront of floating solutions technology, such as complex large turret and swivel systems,which could open up new frontiers in deeper water for the industry. Finally, a focused increase in offshore maintenancewill ensure that the Company is better prepared for long duration lease contracts and contract extensions.
SBM Offshore N.V. 2014 Annual Report 40
4.2 Management Board Profiles
Bruno Chabas (French, 1964)Chief Executive Officer
Bruno Chabas joined SBM Offshore as Chief Operating Officer and Member of the Management Board in May 2011 andbecame CEO in January 2012. Prior to joining, he worked for 18 years with Acergy S.A. (now Subsea 7 SA). FromNovember 2002 until January 2011, he served as the Chief Operating Officer of Acergy S.A., responsible for all theday-to-day commercial and operational activity worldwide. From June 1999 through October 2002, he served as ChiefFinancial Officer. Between 1992 and 2002, Bruno held various management positions within preceding companies in theUnited Kingdom, France and the United States. He has been an Independent Director of FORACO International S.A.since August 2007 and holds an MBA from Babson College, Massachusetts.
SBM Offshore N.V. 2014 Annual Report 41
Peter van Rossum (Dutch, 1956)Chief Financial Officer
Peter van Rossum joined the Company as Chief Financial Officer in 2012. Prior to joining SBM Offshore he was CFO ofRodamco Europe, and following the merger with Unibail of France, of Unibail-Rodamco SE. Prior to that, he was withShell for 23 years in different positions in all key sectors (Upstream, Downstream, Chemicals and Corporate) and inmany different countries. Between April 2004 and March 2006 he was a Non-Executive Director of Woodside, anUpstream company. He has a Masters in Business Economics from the Free University of Amsterdam.
SBM Offshore N.V. 2014 Annual Report 42
Sietze Hepkema (Dutch, 1953)Chief Governance and Compliance Officer
Sietze Hepkema joined SBM Offshore as Chief Governance and Compliance Officer in May 2012. Prior to joining, hewas a partner of Allen & Overy, an international law firm, from 1987 to 2011 and before that of Graham & James (SanFrancisco & Singapore). Sietze Hepkema has over three decades of experience advising companies, specialising ininternational corporate law, with a particular focus on corporate governance and corporate finance. He was educated atHarvard Law School and the Erasmus Universiteit Rotterdam.
SBM Offshore N.V. 2014 Annual Report 43
4.3 Compliance
Mirjam Bakker - Group Compliance Director
“SBM Offshore is committed to conducting its business activities in an open and transparent manner. Learning from itslegacies, the company has used the extensive remedial actions in place since 2012 as the foundation to develop anethics and compliance programme that aspires to become a leading example in the industry. The commitment toconducting its business activities in an honest, ethical, respectful and professional manner constitutes the DNA of SBM’sculture and is essential to its license to operate and reputation. This commitment continues at every opportunity tocascade down from top management.”
4.3.1 Compliance Objectives
To be committed to conducting the Company’s business activities in an honest, ethical, respectful, and professional manner●
To achieve sustainable business by compliance with laws and regulations in the countries where SBM Offshore is active●
Key achievements :
Creation of the Group Compliance Director (GCD) position to manage the compliance programme within the Company – the role was●
filled in June 2014 and reports directly to the Chief Governance and Compliance Officer (CGCO) - meeting periodically with the
Management Board and Supervisory Board
Chairmanship by the GCD of one initiative under Odyssey 24 - the company-wide transformation programme. The Governance, Risk●
and Compliance (GRC) stream aims at establishing an integrated GRC oversight and control framework and integrated board
reporting, increasing the interaction between the second line of defense functions of the Company, developing consistent
methodologies as well as introducing an integrated company wide system for capturing and mitigating risks and managing incidents.
First results of this initiative are expected to be visible by the end of 2015
Strengthening of the compliance department●
A total of 3,047 employees, around 30% of the total head count completed annual internal training courses with specific focus on●
employees working in the more sensitive areas of the Company’s operations
4.3.2 Compliance Programme and Organisation
The Company continues to enhance its Corporate Compliance Programme under the leadership of the CGCO – aposition created in 2012. The CGCO is a member of the Management Board (MB) and regularly reports to theManagement Board and Supervisory Board on the current status of the Company’s compliance activities.
Now that a culture of transparency and ownership has been instilled at the very core of the organisation, management’sobjective going forward is to move from a rules-driven approach to a values-driven approach. SBM Offshore’s CoreValues and Code of Conduct set out the overall principles and rules for expected behavior from the Company’s
SBM Offshore N.V. 2014 Annual Report 44
employees and various business partners, such as within its joint ventures and the supply chain. The complianceprogramme and organisation enables reasonable oversight and control by the Company of all elements of the Code ofConduct.
The seven-member strong team in the compliance department leads the oversight, control and implementation of theCompany’s compliance programme. Within the Company’s worldwide centers and operations, the top tier managementon-site is held accountable for ethics and compliance and acts as business partner to the GCD.
Key elements of the programme include:
Driving the systematic integration of compliance and a ‘doing the right thing’ behavior and controls in the DNA of the organisation and●
the Company’s business processes
Leading a communications and training programme to strengthen ethics and compliance awareness and competences of all●
employees
4.3.3 Anti-corruption Initiatives
Proactively approaching anti-corruption risks within the framework of its compliance programme since 2012, theCompany’s improved procedure for identifying and mitigating integrity risks with regard to sales intermediaries, businesspartners and third parties continues to ensure that SBM Offshore’s core values are adhered to and that the law isfollowed.
The procedure includes:
Due diligence on existing and new sales intermediaries, as well as tightened internal controls around transactions involving sales●
intermediaries and key suppliers. The due diligence on sales intermediaries is approved by a Validation Committee consisting of
members of the Management Board and the Sales Director, the Group Compliance Director and the Group Controller. This procedure
is a key element of the Company’s third party integrity management.
An overview of the key elements of the anti-corruption initiatives is set out below:
Annual Code of Conduct certification●
Quarterly updates/reports to the Management board and Supervisory board●
An independent compliance department and external resources to further embed the compliance programme●
Anti-Corruption Policy and Compliance guide●
Third Party Integrity Management, including due diligence, vetting of third parties and continuous monitoring●
A Policy on the Rules of conduct to report suspected irregularities, including use of the ‘SBM Offshore Integrity Line’ available 24●
hours per day, seven days per week in 16 different languages for employees to voice their concerns
An Integrity Panel to review and assess reports received through the Integrity Line●
Investigations and risk assessment procedures●
Internal Audit anti-corruption modules for third party audits●
Internal training sessions and e-learning courses●
The use of standard contracts and anti-corruption and conflict of interest clauses in contracts●
Increase of internal controls, following ICOFR principles●
Today, the Company strives to move beyond compliance with laws and regulations. Continuous improvement andenhancement of its ethics and compliance programme in terms of oversight, risk management and internal control is inplace. The next step is to build on this solid foundation to promote and instill a culture whereby doing the right thing isdriven by passion for the organisation and its key stakeholders and by benchmarking best practices in the Company andin the industry.
SBM Offshore N.V. 2014 Annual Report 45
4.3.4 Regulatory Compliance
The Regulatory Compliance Function has implemented processes to ensure that the projects executed and offshorefacilities operated by the Company comply with all applicable regulations including notably those imposed byinternational conventions (through flag states) and by host countries. The Regulatory Compliance function reports to theGCD.
Regulatory Compliance processes include:
Regulatory watch●
Input to bidding activities●
Systematic identification of applicable regulatory requirements for a given project/operation/country●
Assignment and tracking of corresponding actions within the project and/or operations organisation●
Verification of actual compliance as part of delivery protocols●
Management of official surveys and acceptance by Regulators●
Maintenance of corresponding permits and licenses throughout the project/operation life-cycle●
The Regulatory Compliance Function also has responsibility for coordinating the classification process. Compliance withClassification Society Rules in accordance with assigned Class notations is defined and achieved according toestablished Company standards and Project-specific terms and conditions.
The Regulatory Compliance team is divided between the Group function and the Company’s various execution centersand this discipline is acknowledged throughout the cycle of the Company’s activities.
4.3.5 Investigation
Key event in 2014:
On November 12, SBM Offshore and the Dutch Public Prosecutor’s Office (Openbaar Ministerie) announced that theyhad reached an out-of-court settlement that consists of a payment by SBM Offshore N.V. to the Openbaar Ministerie ofUS$ 240 million. Furthermore the United States Department of Justice informed SBM Offshore that it declinedprosecuting the Company and has closed its inquiry into the matter.
Background:
In April 2012 the Company reported that it had become aware of certain sales practices involving third parties which mayhave been improper. As reported in the Company's press release published on April 2 2014, the Company announcedthe conclusion of its investigation activities and the outcome. Outside counsel and forensic accountants had beenengaged to investigate these practices thoroughly and the Company had also taken the necessary steps designed toterminate any such practices.
Ongoing:
While SBM Offshore continues to cooperate with the Brazilian authorities, it takes the position that with the out-of-courtsettlement with the Dutch Public Prosecutor’s Office marks a big step forward in putting the Company's legacy issues torest, aiding SBM Offshore to turn the page and to look to the future.
SBM Offshore N.V. 2014 Annual Report 46
4.4 Risk Management and Internal Control
Erica Cecchi - Group Risk & Opportunity Officer
“We need to take a number of calculated risks to create value for our clients, our shareholders and our employees. Ourability to manage those risks will protect that value and our determination to seek and pursue the right opportunities willultimately increase it.”
Company Appetite for Risks
SBM Offshore’s strategy to be the trusted partner of choice in the development of complete floating production solutionsfor the world’s energy companies remains unchanged. The Company’s experience in the offshore energy productionmarket enables SBM Offshore to pursue superior financial returns and uptime in operations, whilst maintaining a goodrisk/reward balance.
The Oil & Gas industry is evolving and innovation is key to capturing new growth opportunities. SBM Offshore willcontinue to lead the industry with state-of-the-art technologies, which will strengthen the Company’s position as a leaderin its niche market. However, as SBM Offshore seeks to provide customers with technology solutions, it requires headinginto unknown territory. The Company is prepared to accept a well calculated and understood amount of risk if there is ahigh probability that these prospects will contribute to the achievement of the Company’s strategic, operational andfinancial goals. Risk management ensures that there is consistency and control in the review of potential opportunitiesand ensures that the Company does not over extend itself. SBM Offshore has a clear strategy and its CEO has beenvocal to the industry players regarding the amount of risk that the Company is willing to accept and the ownership of thatrisk. In addition, combined with opportunity management the Company ensures that it targets projects that best fit itsgoals and which best leverage its expertise.
Design and Effectiveness of the Internal Risk Management and Control System
Based on strategic objectives, risks are identified – within defined risk tolerances - while key financial controls aredefined and implemented. An integrated approach ensures that the Company’s strategic, operational and financialobjectives are set within this framework. It is fundamental to the day-to-day management of the Company and a vitalfactor in ensuring that SBM Offshore’s strategy is successfully executed in a controlled and compliant manner.
Once management establishes and cascades financial reporting objectives, a uniform set of operational and financialprocedures is applied, including those related to the Company’s financial reporting and closing process. The risk ofisolated decision making is minimised by the clear segregation of roles and responsibilities.
The fundamental objective of Risk Management Systems is to manage rather than eliminate risks. The internal riskmanagement and control systems at SBM Offshore provide a reasonable assurance that the Company’s financialreporting does not contain any errors of material importance and that the risk management and control systems workedproperly in the year under review. The systems in place at SBM Offshore can provide reasonable but not complete
SBM Offshore N.V. 2014 Annual Report 47
assurance against the risks that could contribute to the Company’s failure to meet its business objectives. However,maximum safeguards are in place and the effectiveness of the Risk Management framework has been validated byputting the Company’s process through two independent audits; one by Det Norske Veritas (DNV) under the InternationalSustainability Rating System (ISRS) stream of the Odyssey 24 programme and the other by the EngineeringConstruction Risk Institute (ECRI). In addition, the Risk Management system has been audited by several independentverification bodies designated by investors prior to providing project financing for some of the Company’s vessels. Theoutcome has been positive - positioning the Company clearly within the industry standards and defining SBM OffshoreGovernance arrangements fit for purpose.
Company Governance
The Board of Management is the executive body responsible for the day-to-day management of the company’soperations, under the supervision of the Supervisory Board. The Audit Committee assists the latter in fulfilling itsresponsibility for the integrity of the Company’s financial statements, its financial reporting process, and the riskmanagement internal control systems, the internal and external audit processes, the internal and external auditor’squalifications, independence and performance, as well as the Company’s monitoring process for compliance within thelaw and international regulations. Three lines of defence are in place:
As the first line of defence, operational managers own and manage risks. They also are responsible for implementing corrective●
actions to address process and control deficiencies
The second line is the support that management can lean on in designing and implementing management policies, defining roles and●
responsibilities and providing risk management frameworks
The third line is the Internal Audit, which brings a systematic approach to the evaluation and improvement of the risk management,●
internal control, and governance processes, which ultimately enhance their effectiveness. The Internal Audit team directly reports to
the Audit Committee of the Supervisory Board
Key Achievements
Consolidation of the Company’s Risk Management framework in line with ISO31000 standards with a focus on Strategic, Tactical and●
Operational risk management and the implementation of a more stringent Internal Control framework
Detailed risk review and analysis of all tenders, projects and FPSO fleet operations which are part of the Company’s portfolio●
Enhancement of strategic risk management processes with particular attention to the Company’s project and product portfolio risks●
Quarterly Risk reports are discussed with management, providing a consolidated view and improving transparency of the processes●
Quantitative risk analysis is performed consistently for the Company’s tenders and projects with the objective to assess contingencies●
Major Improvements Planned
During 2015 as part of the Odyssey 24 programme – the Governance Risk and Compliance (GRC) focus will be given to improving the●
integration of risk, control and compliance activities as well as the enhancement of the quality of control documentation. The need for
these improvements was highlighted during the Odyssey 24 assessment in 2014 and discussed with the Supervisory Board. The
result will be an optimisation of management’s strategic vision by balancing risk and business opportunities, leading to superior
performance.
Significant Risks facing the Business
The combination of the nature of the Oil & Gas industry and the Company’s strategy exposes SBM Offshore to a numberof business risks. The table below summarises the significant risks identified and the Company’s response to it.
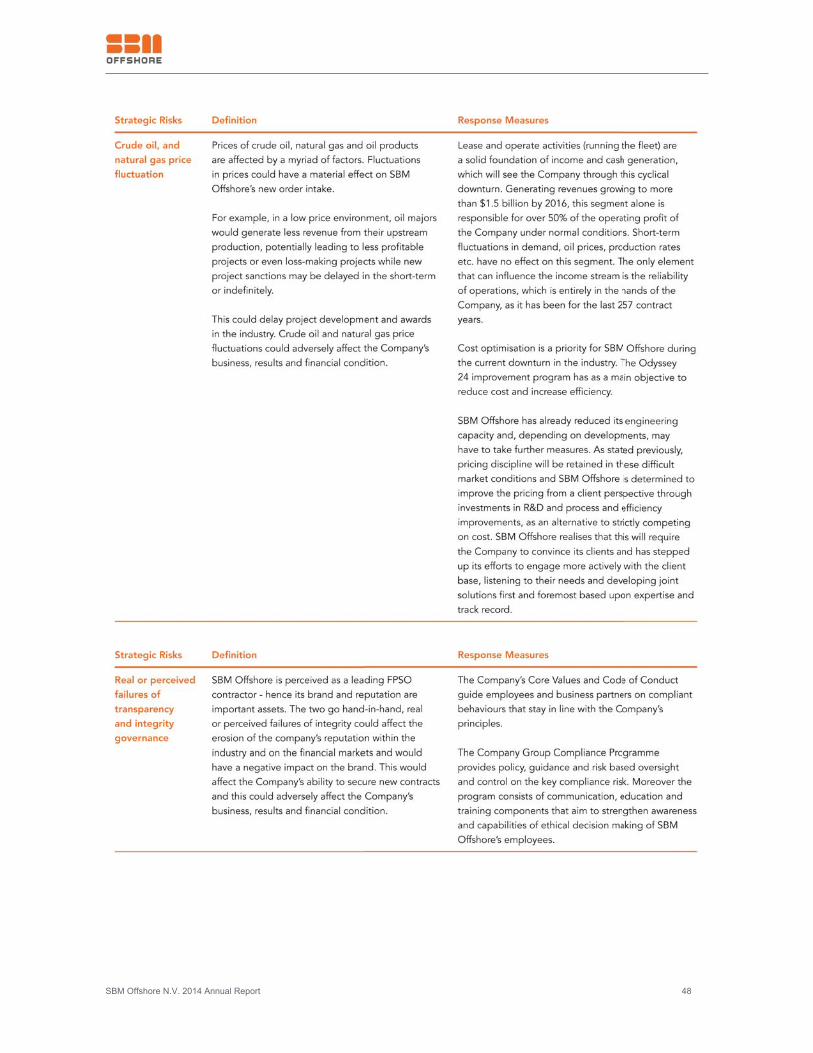
SBM Offshore N.V. 2014 Annual Report 48
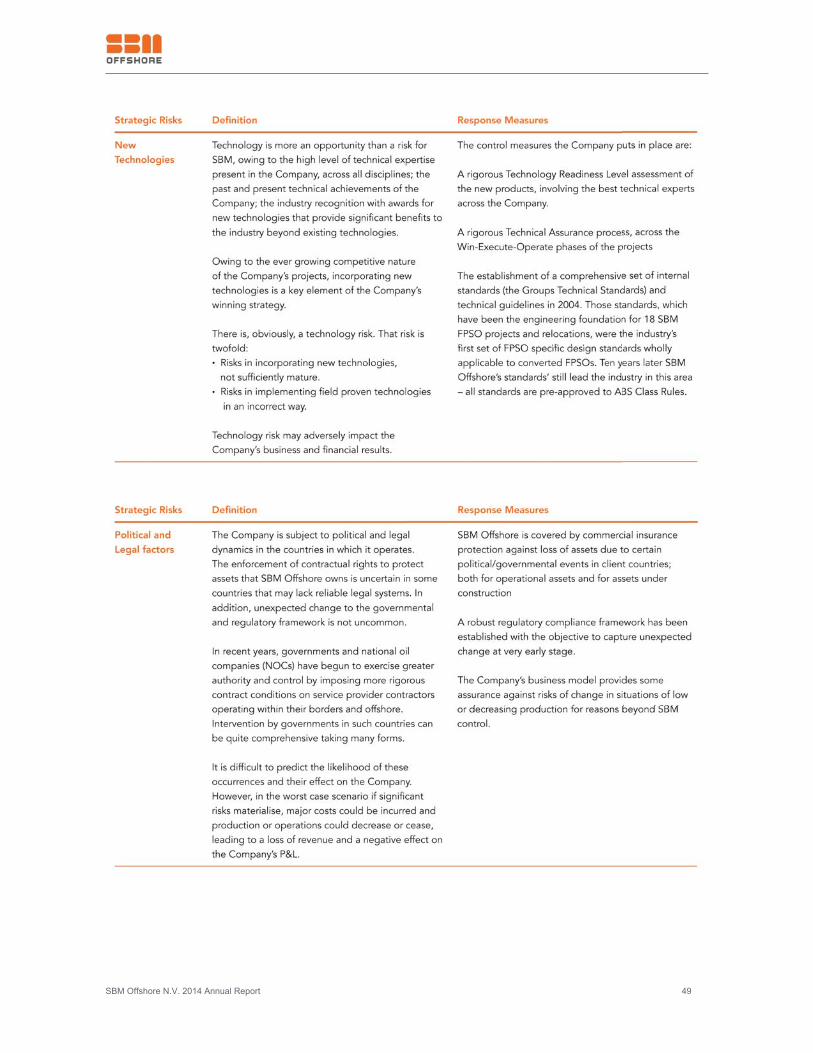
SBM Offshore N.V. 2014 Annual Report 49
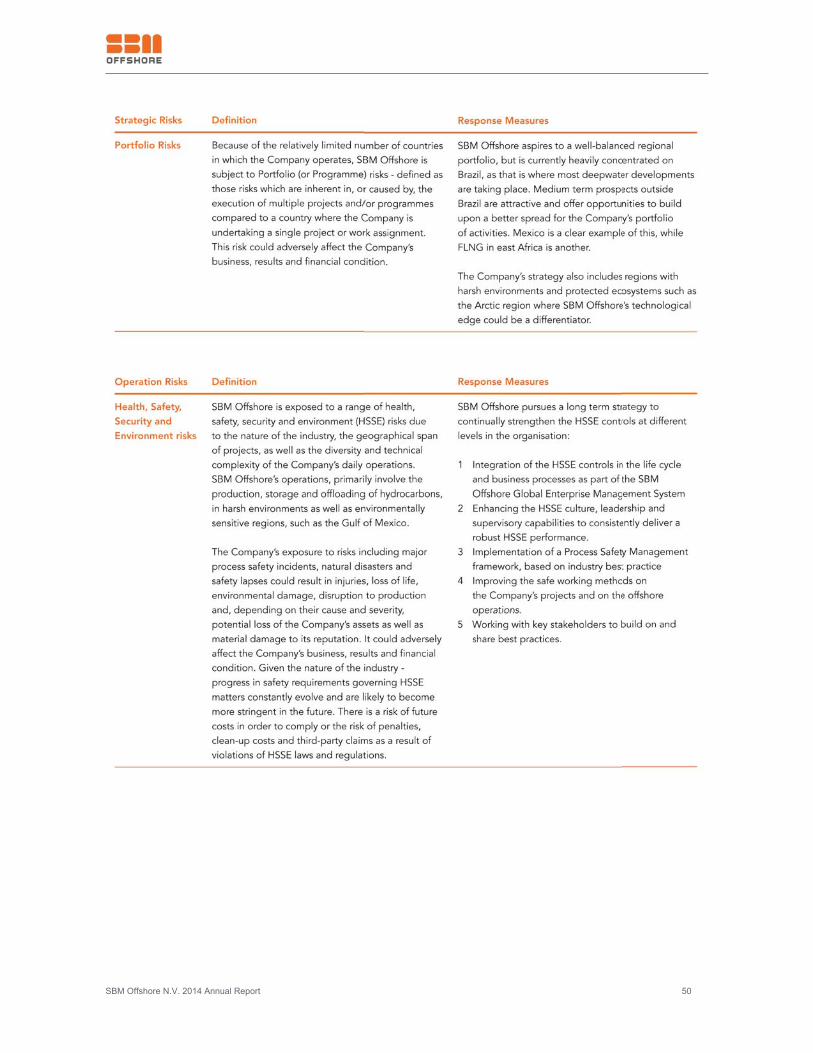
SBM Offshore N.V. 2014 Annual Report 50
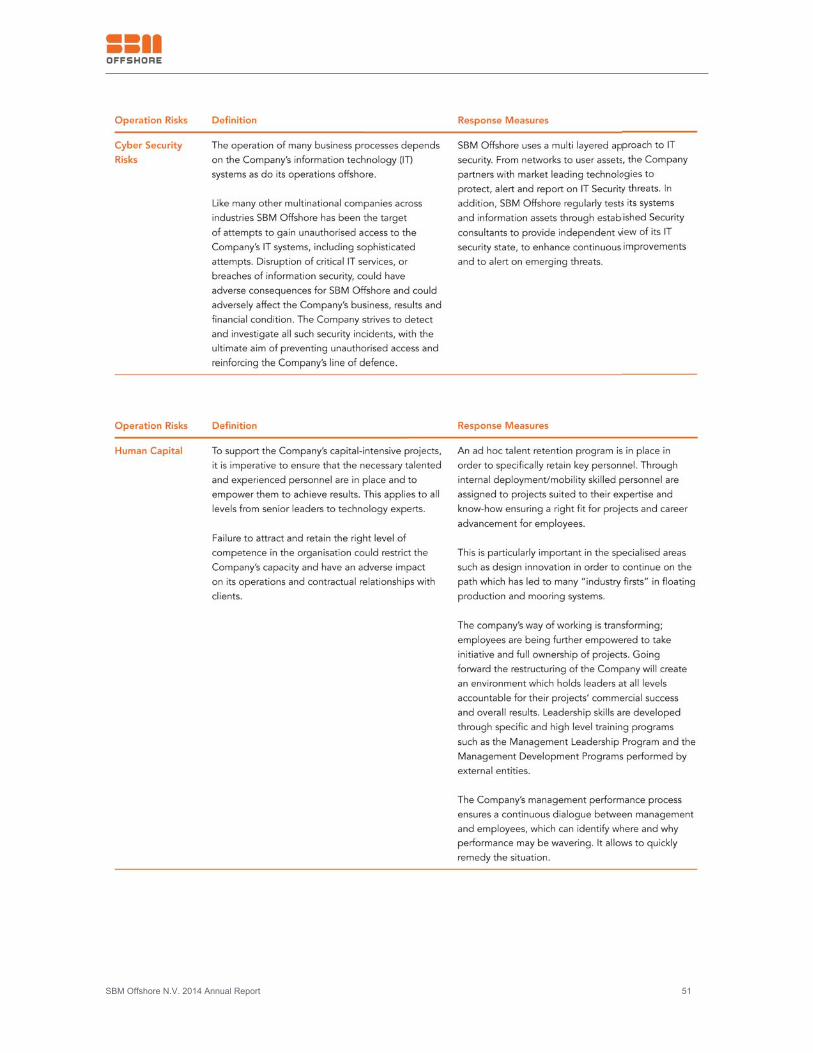
SBM Offshore N.V. 2014 Annual Report 51
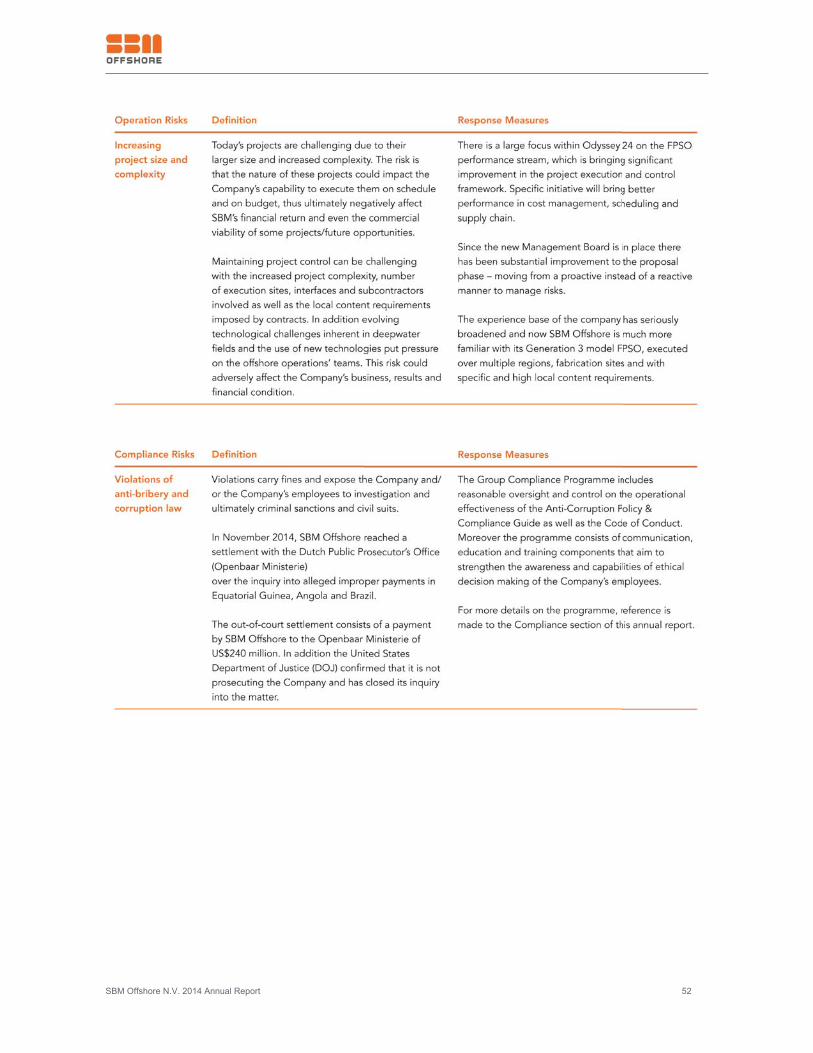
SBM Offshore N.V. 2014 Annual Report 52
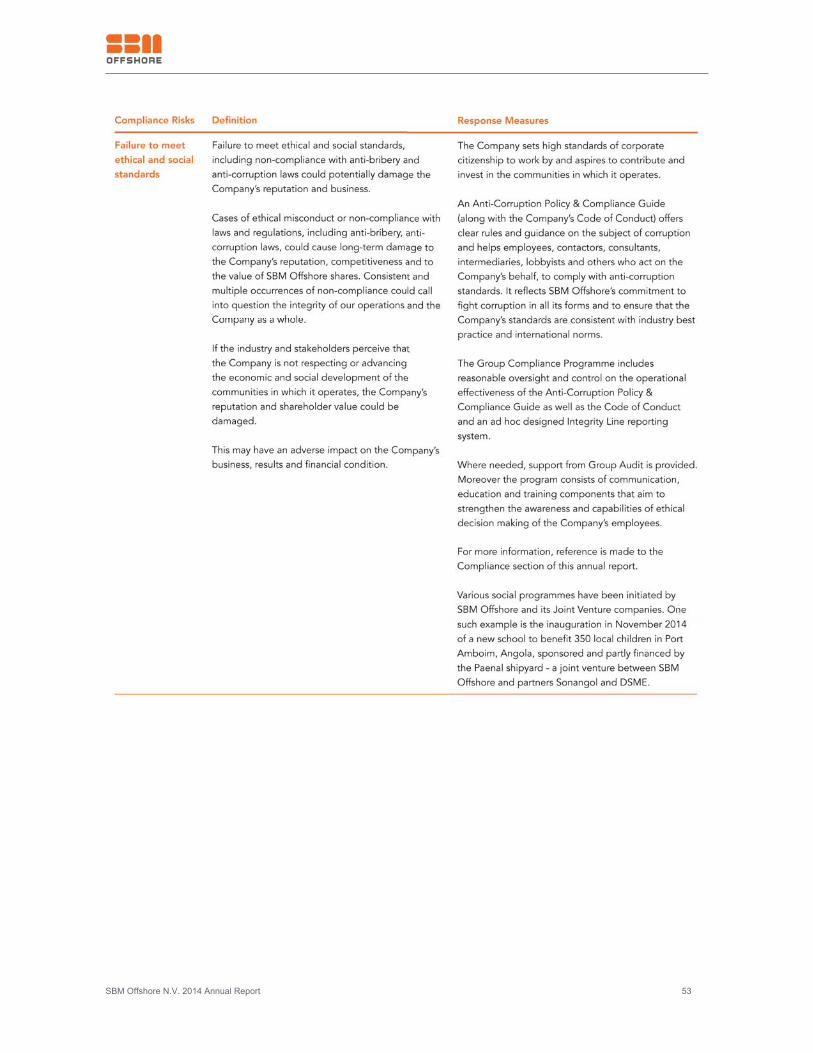
SBM Offshore N.V. 2014 Annual Report 53
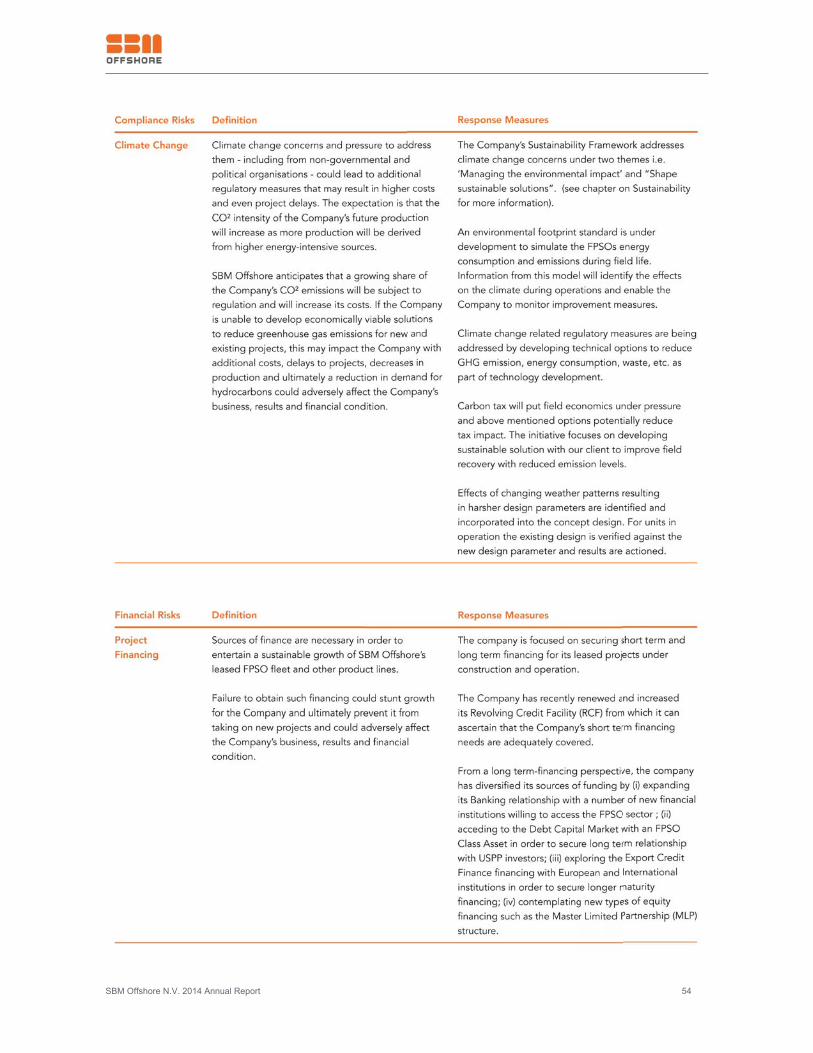
SBM Offshore N.V. 2014 Annual Report 54
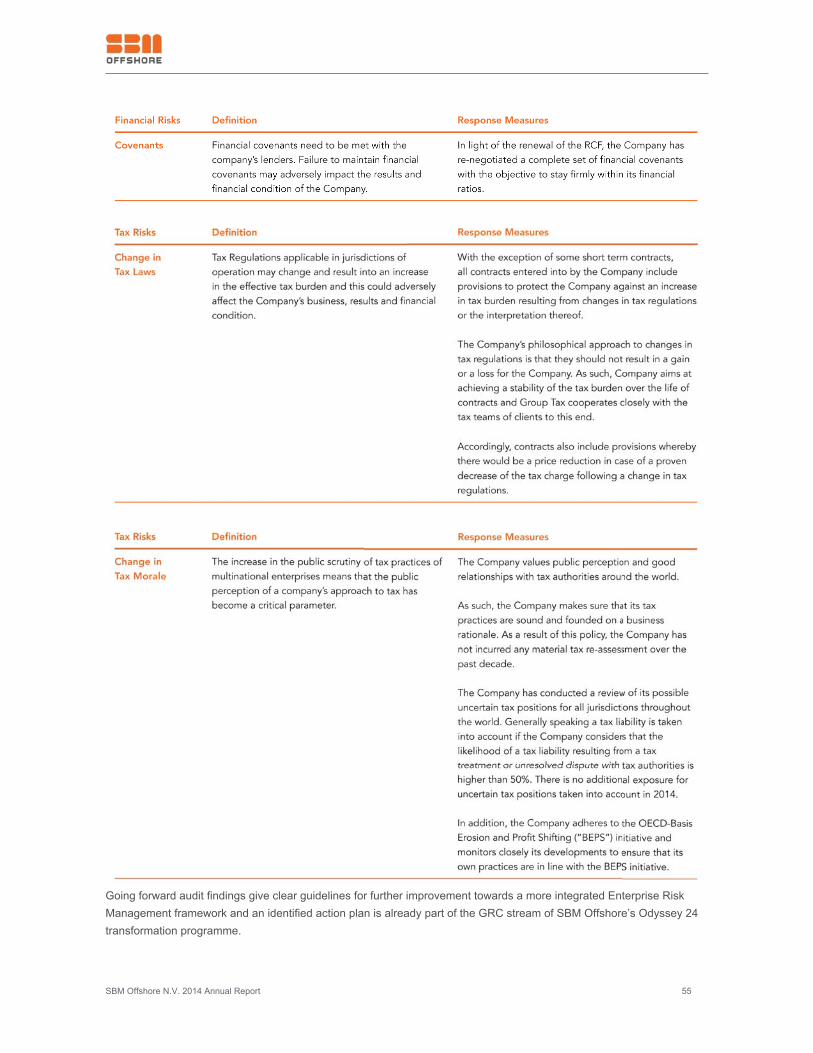
SBM Offshore N.V. 2014 Annual Report 55
Going forward audit findings give clear guidelines for further improvement towards a more integrated Enterprise RiskManagement framework and an identified action plan is already part of the GRC stream of SBM Offshore’s Odyssey 24transformation programme.
SBM Offshore N.V. 2014 Annual Report 56
4.5 Compliance Statement / In Control Statement
The Management Board is responsible for establishing and maintaining adequate internal risk management and controlsystems. The implementation of the internal risk management and control framework at SBM Offshore focuses onmanaging both financial risks and operational risks. As key part of its scope, Risk Management is responsible for thedesign, monitoring and reporting on the internal control framework.
During 2014, various aspects of risk management were discussed by the Management Board. The responsibilitiesconcerning risk management, as well as the lines of defence were also discussed with senior management. In addition,discussion on the internal risk management and control systems with the Audit Committee, the Supervisory Board andwith the Company’s external auditors took place.
In line with the adoption of the Dutch Corporate Governance Code, SBM Offshore prepared the In Control Statement2014 in accordance with the best practice provision II.1.5. With due consideration to the above, the Company believesthat its internal risk management and control systems provide reasonable assurance that the financial reporting does notcontain any errors of material importance and that the internal risk management and control systems relating to financialreporting risks worked properly in 2014.
However, the Company cannot provide certainty that its business and financial strategic objectives will be realised or thatits approach to internal control over financial reporting can prevent or detect all misstatements, errors, fraud or violationof law or regulations. Financial reporting over 2014 was based upon the best operational information availablethroughout the year and the Company makes a conscious effort at all times to weigh the potential impact of risk and thecost of control in a balanced manner.
With reference to section 5.25c paragraph 2, sub c of the Financial Markets Supervision Act (Wet op het financieeltoezicht), the Management Board states that, to the best of its knowledge:
The annual financial statements for 2014 give a true and fair view of the assets, liabilities, financial position and profit or loss of SBM●
Offshore and its consolidated companies
The Annual Report gives a true and fair view of the position as per December 31, 2014 and that SBM Offshore’s development during●
2014 and that of its affiliated companies is included in the annual financial statements, together with a description of the principal risks
facing SBM Offshore
Management Board
Mr. B.Y.R. Chabas
Mr. P.M. van Rossum
Mr. S. Hepkema
Schiedam, The Netherlands
February 11, 2015
SBM Offshore N.V. 2014 Annual Report 57
4.6 Fleet and Offshore Operations
Peter Senkbeil - Managing Director Operations
“Clients expect the highest level of productivity from our FPSOs and other floating production units. SBM’s dedicatedteams around the world ensure that their objectives are met. With over 257 years of accumulated experience in offshoreoperations, the Company’s vision is to continue to provide customer orientated solutions and to ensure reliableoperations, while constantly evolving. The value of listening to clients is of paramount importance and by staying close tothem the Company can anticipate their needs and respond quickly. Uptime and safety are key drivers and our operationsremain focused on its delivery every day of every year.”
Performance at a glance
This year SBM’s Operations division processed 236 Mboe and 399 successful and safe offloads. The remit in 2014spanned the entire product lifecycle with two FPSOs starting up, 12 other FPSOs in operation offshore across the globeand finally two FPSOs at the end of the lifecycle being demobilised. In addition, operations successfully continued on theMOPU (gas) offshore Canada for Encana and added an additional 35,000 bpd of oil to its processing capability via asuccessful tie-back to FPSO Kikeh from another field for Murphy Oil.
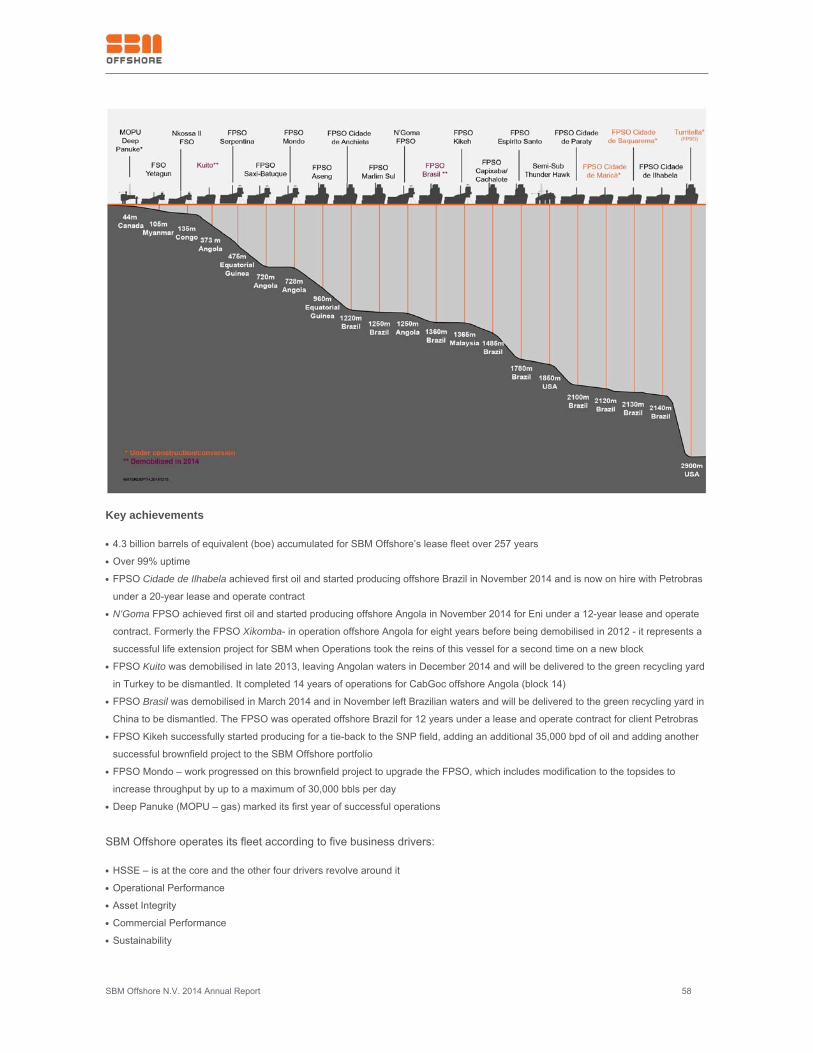
SBM Offshore N.V. 2014 Annual Report 58
Key achievements
4.3 billion barrels of equivalent (boe) accumulated for SBM Offshore’s lease fleet over 257 years●
Over 99% uptime●
FPSO Cidade de Ilhabela achieved first oil and started producing offshore Brazil in November 2014 and is now on hire with Petrobras●
under a 20-year lease and operate contract
N’Goma FPSO achieved first oil and started producing offshore Angola in November 2014 for Eni under a 12-year lease and operate●
contract. Formerly the FPSO Xikomba- in operation offshore Angola for eight years before being demobilised in 2012 - it represents a
successful life extension project for SBM when Operations took the reins of this vessel for a second time on a new block
FPSO Kuito was demobilised in late 2013, leaving Angolan waters in December 2014 and will be delivered to the green recycling yard●
in Turkey to be dismantled. It completed 14 years of operations for CabGoc offshore Angola (block 14)
FPSO Brasil was demobilised in March 2014 and in November left Brazilian waters and will be delivered to the green recycling yard in●
China to be dismantled. The FPSO was operated offshore Brazil for 12 years under a lease and operate contract for client Petrobras
FPSO Kikeh successfully started producing for a tie-back to the SNP field, adding an additional 35,000 bpd of oil and adding another●
successful brownfield project to the SBM Offshore portfolio
FPSO Mondo – work progressed on this brownfield project to upgrade the FPSO, which includes modification to the topsides to●
increase throughput by up to a maximum of 30,000 bbls per day
Deep Panuke (MOPU – gas) marked its first year of successful operations●
SBM Offshore operates its fleet according to five business drivers:
HSSE – is at the core and the other four drivers revolve around it●
Operational Performance●
Asset Integrity●
Commercial Performance●
Sustainability●
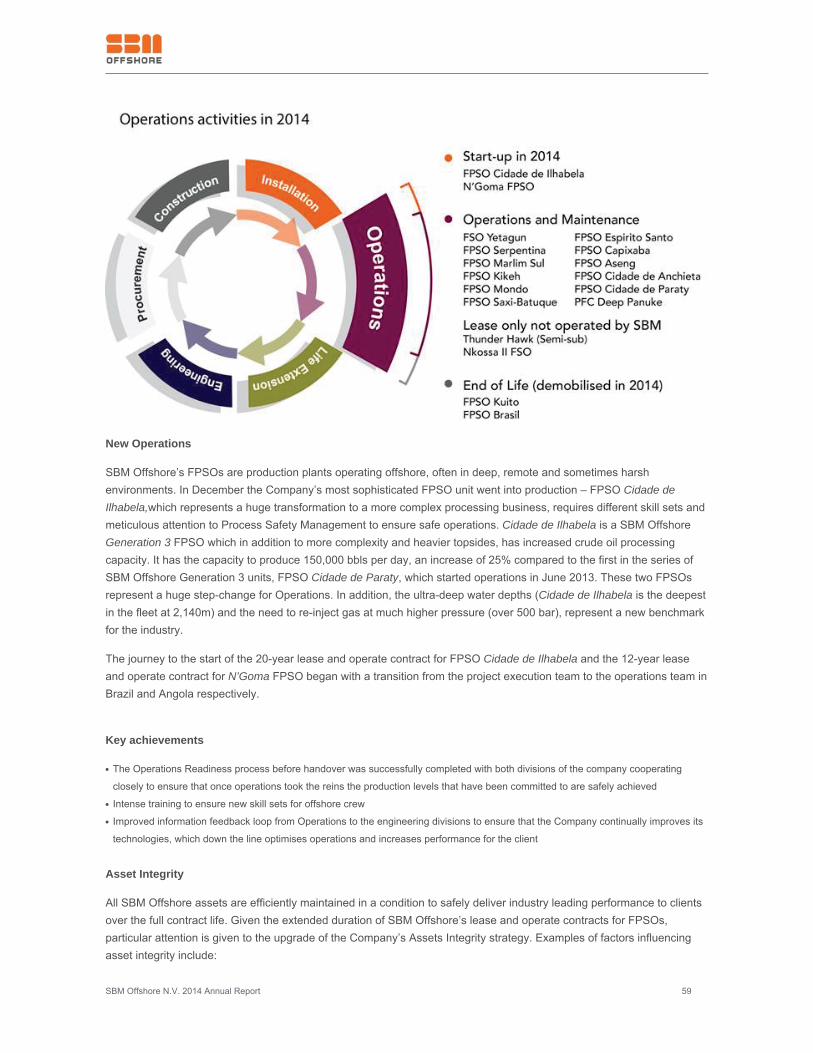
SBM Offshore N.V. 2014 Annual Report 59
New Operations
SBM Offshore’s FPSOs are production plants operating offshore, often in deep, remote and sometimes harshenvironments. In December the Company’s most sophisticated FPSO unit went into production – FPSO Cidade deIlhabela,which represents a huge transformation to a more complex processing business, requires different skill sets andmeticulous attention to Process Safety Management to ensure safe operations. Cidade de Ilhabela is a SBM OffshoreGeneration 3 FPSO which in addition to more complexity and heavier topsides, has increased crude oil processingcapacity. It has the capacity to produce 150,000 bbls per day, an increase of 25% compared to the first in the series ofSBM Offshore Generation 3 units, FPSO Cidade de Paraty, which started operations in June 2013. These two FPSOsrepresent a huge step-change for Operations. In addition, the ultra-deep water depths (Cidade de Ilhabela is the deepestin the fleet at 2,140m) and the need to re-inject gas at much higher pressure (over 500 bar), represent a new benchmarkfor the industry.
The journey to the start of the 20-year lease and operate contract for FPSO Cidade de Ilhabela and the 12-year leaseand operate contract for N’Goma FPSO began with a transition from the project execution team to the operations team inBrazil and Angola respectively.
Key achievements
The Operations Readiness process before handover was successfully completed with both divisions of the company cooperating●
closely to ensure that once operations took the reins the production levels that have been committed to are safely achieved
Intense training to ensure new skill sets for offshore crew●
Improved information feedback loop from Operations to the engineering divisions to ensure that the Company continually improves its●
technologies, which down the line optimises operations and increases performance for the client
Asset Integrity
All SBM Offshore assets are efficiently maintained in a condition to safely deliver industry leading performance to clientsover the full contract life. Given the extended duration of SBM Offshore’s lease and operate contracts for FPSOs,particular attention is given to the upgrade of the Company’s Assets Integrity strategy. Examples of factors influencingasset integrity include:
SBM Offshore N.V. 2014 Annual Report 60
prolonged operate contracts for FPSOs – currently at 20 years versus an average of 14 years in the recent past●
operating in corrosive pre-salt fields●
new technology on board to process toxic and flammable gases●
The Company’s first pre-salt FPSO with a 20-year contract - FPSO Cidade de Paraty- achieved first oil in June 2013 andthe second 20-year contract began in November 2014 with FPSO Cidade de Ilhabela.
Key achievements
Evolved and developed efficient maintenance strategies to ensure safe and reliable operations over the lifecycle of the units●
Improved monitoring systems to give a better and quick understanding of the Assets' actual condition●
Continued control to ensure implementation of best practices and standards●
FPSO Cidade de Ilhabela started operations under the Joint Venture company owned by SBM Offshore with Queiroz Galvao Oleo e●
Gas (QGOG) and Mitsubishi
N’Goma FPSO started producing and is operated by OPS, a 50/50 Joint Venture company between SBM Offshore and Sonangol. The●
FPSO is owned by Sonasing, a Joint Venture company between SBM Offshore, Sonangol and Angolan Offshore Services
FPSO Cidade de Paraty marked one year of successful operations as the Company’s first pre-salt unit. The FPSO is owned and●
operated by a consortium of affiliated companies of SBM Offshore, QGOG, Nippon Yusen Kabushiki Kaisha (NYK), and ITOCHU
Corporation (ITOCHU)
Looking forward with Joint Venture partners
FPSOs Cidade de Marica is scheduled to start operating in 4Q 2015. It is owned and will be operated by the JVCompany between SBM Offshore with Queiroz Galvao Oleo e Gas, NYK and Mitsubishi.
SBM Operations works within the applicable Shareholders Agreements to ensure that the Company delivers in respect ofOPEX, budgets, crewing and uptime.
Future plans
Operations aim to optimise the Company’s revenues by ensuring high uptime. This will be achieved by driving continued performance●
improvement and efficiencies. In addition proposed life cycle cost optimisation should make SBM Offshore’s operations even more
competitive, yielding benefits for SBM Offshore’s partners and customers
SBM Offshore plans to offer the services of its Operations division to other clients who own their own FPSOs i.e. go beyond the ‘lease●
and operate’ formula that SBM Offshore has traditionally offered for its own fleet by offering the ‘operate’ only option as part of its
portfolio of services
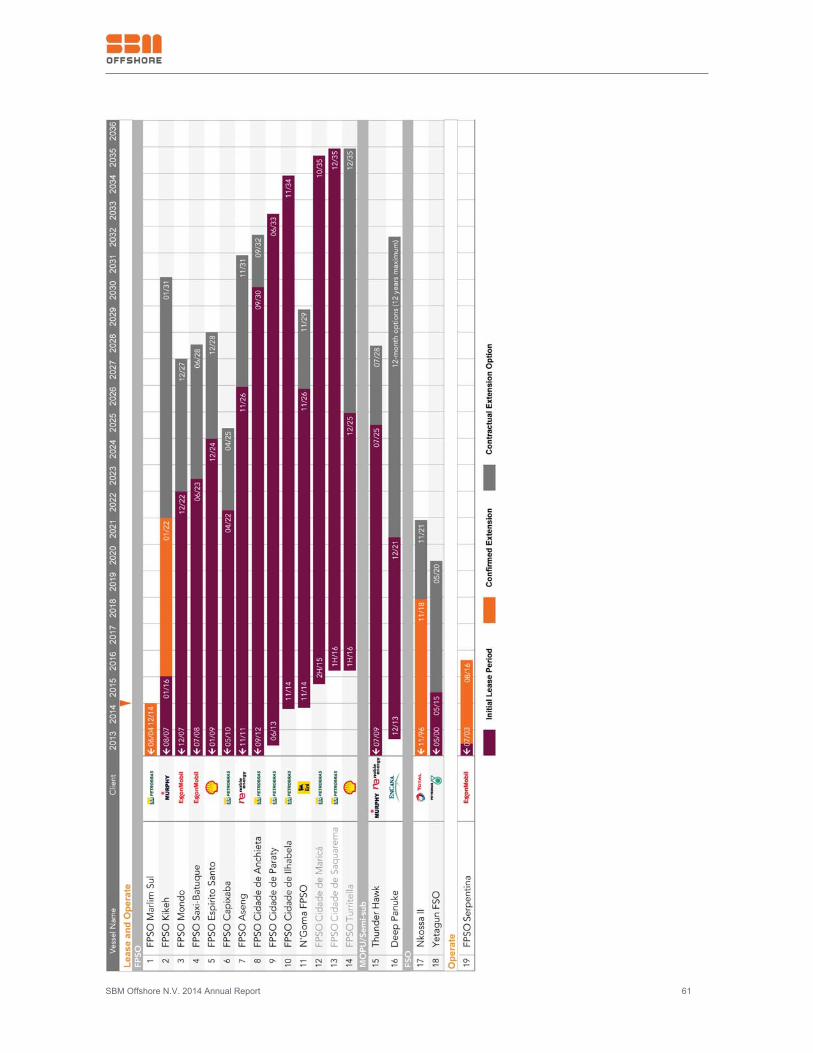
SBM Offshore N.V. 2014 Annual Report 61
SBM Offshore N.V. 2014 Annual Report 62
4.7 Technology Development
Mike Wyllie - Group Technology Director
“SBM Offshore has made good progress this year to enable the industry in its development of hydrocarbon reservoirslocated in deeper and harsher environments. Results combined with recognition sums up 2014 for SBM’s technologyteam. Highlights include the completion and start-up of FPSO Cidade de Ilhabela - the Company’s most complex anddeepest vessel - and completing the design for the most complex turret for the Stones FPSO, which has moved into theconstruction phase. In addition, 2014 saw SBM Offshore honored with an OTC Spotlight on New Technology award forits swivel technology – the fourth such award in four years – prestigious accolades that endorse our position as atechnology leader in the offshore industry that demonstrate that SBM’s innovation is successfully bridging the technologygaps identified with our clients.”
Performance at a glance
During 2014 the Company focused on enhancing its market-leading position in complex floating production systems, andtheir associated mooring systems. SBM Offshore continued to identify key technology trends in the offshore oil & gasmarket, prioritising development work to address gaps in key areas of demand and offer cost effective field developmentsolutions to clients. Total Expenditure for Technology development and upkeep of SBM Offshore’s technical standardsreach around $40 million. Development work was performed in the Company’s execution centres around the globe,sometimes in collaboration with technology partners, as well as in SBM Offshore’s dedicated Research & Developmentlaboratory located in Carros, France.
Key achievements
Completion and start-up of FPSO Cidade de Ilhabela, which represents SBM Offshore’s second pre-salt vessel in its fleet and the●
deepest at 2,140m
Industry award for Very High Pressure Fluid Swivel technology – which represents a step-change for the industry to allow full●
development of high pressure high temperature reservoirs with an FPSO, including water injection or gas re-injection
Completion of the Company’s design for the world’s largest turret, allowing construction to progress and the first elements to be●
delivered for Shell’s Prelude Floating Liquefied Natural Gas (FLNG) facility
Maturing the Company’s own mid-scale FLNG concept and commencing the marketing phase●
Progression of its technology for ARCA Chain Connector to Technology Readiness Level (TRL) 4 where the prototype is close to●
being project-ready
Progression on technology to optimise topside module design – focus on simplification and cost reduction while maintaining quality●
and improving inherent safety
Advancing a range of other new technologies through the Company’s Technology Readiness Level (TRL) stage gates towards●
maturity
SBM Offshore N.V. 2014 Annual Report 63
Technology strategy
The Company’s technology development continued in 2014 to be guided by three key objectives:
To be driven by market demand - SBM Offshore’s product development reflects the current and future challenges faced by its●
customers
To develop technology that inherently improves safety and increases the Company’s overall rate of return on investment through●
reduced costs, increased efficiency and/or improved performance
To retain its technology leadership position in the offshore market and building its competitive advantage by offering unique and●
bespoke solutions to customers
FPSO TechnologySBM Offshore positions itself at the premium end of the leased FPSO market, focusing on the largest and most complexprojects. Over the years, the complexity of the Company’s FPSO fleet has grown significantly – the latest model is called‘Generation 3’ and will represent the core of future business activity based on market demand.
Pre-salt
The Company has seen a major step-change in the scale and complexity of its latest flagship FPSO projects and hasdeveloped an optimised and cost effective design - the Generation 3 FPSO – to produce in the ultra-deep water, pre-saltfields in Brazil. The Company’s first pre-salt FPSO, the Cidade de Paraty, reached its first year in operation in June 2014.Her successor, the FPSO Cidade de Ilhabela, which has even higher capacity, achieved first-oil in November 2014. Thistechnology and experience can be leveraged to meet the future needs of pre-salt Angola – a new player in pre-salt oiland gas exploration, with offshore blocks indicating a significant potential. SBM Offshore’s technology and latestgeneration of FPSO are specifically designed for this type of reservoir and ideally placed to tap into this future growth.
Increased capacity – more barrels
What particularly marks FPSO Cidade de Paraty and FPSO Cidade de Ilhabela as a new league of vessel is the increasein the production rate handled and the far greater level of sophisticated gas processing and compression technology theycarry. This has resulted in topsides increasing in complexity and size from 14,000 to 24,000 tonnes. In terms of oilproduction, Cidade de Paraty is designed to produce 120,000 barrels per day (bpd) of oil and Cidade de Ilhabela’scapacity has significantly increased the Generation 3 FPSO daily rate to 150,000 bpd of oil and compress 6 million Nm3/d(212 MMSCFD) of gas.
Deep, deeper and industry’s deepest
Industry forecasts that ‘the ‘Golden Triangle’ of deepwater will dominate deepwater expenditure over the next five yearswith activity in West Africa, the Gulf of Mexico and Brazil. SBM Offshore has been researching and developingtechnology to meet the challenges of these key regions. In particular the harsh Gulf of Mexico environment is an areathat the Company is targeting, having identified several technology gaps and now making significant progress to providesolutions for this harsh environment. The result is FPSO Turritella for the Shell development, which when in operation in2016 will be the world’s deepest floating production unit and FPSO and only the second FPSO to exploit the HighPressure High Temperature (HPHT) Lower Tertiary reservoirs.
Full field development technology - disconnectable FPSO with Steel Risers
Typically, full field developments require a larger number of risers and umbilicals when this is coupled with HPHTconditions, which may require steel risers and this can be beyond the capacity of a disconnectable turret. SBMOffshore’s solution was to develop the MoorSpar™ system, where the risers and umbilicals are supported by a novel,slender spar type structure, with the capacity to support more risers and umbilicals. Moreover, when connected the yokedecouples the FPSO motion from the risers, enabling the use of simple steel catenary risers instead of the moreexpensive lazy wave configurations. The FPSO coupled with the MoorSpar™ technology represents a cost effective
SBM Offshore N.V. 2014 Annual Report 64
solution by avoiding the need for oil export pipelines over difficult terrain and expensive offshore hook-up works.
Following several years’ research and extensive model tests the MoorSpar™ concept reached the point this year ofbeing ready to enter a major project FEED.
Mooring System & Riser TechnologyThe Company is recognised as the world leader in complex mooring systems. Throughout 2014, it continued to developits mooring technology to further strengthen this position.
SBM Offshore designed the world’s largest ever internal turret mooring system, for the Shell Prelude FLNG, which iscurrently under construction. The turret weighs 11,000 tonnes and has been designed to enable the FLNG facility toresist the most extreme weather conditions, including category five cyclones, so allowing the facility to remain on locationin all conditions.
Two further complex turrets also made significant progress as planned – for the Ichthys FPSO and the FPSO Glen Lyonfor the U.K. Quad 204 development. All of these projects have very high mooring loads, and benefit from the Company’sproprietary technology for turret bearing systems and fluid swivels.
Disconnectable Turrets
The FPSO Turritella project for Shell in the Gulf of Mexico represents a significant step change in terms ofdisconnectable mooring systems. This project will achieve a number of industry firsts: - the first disconnectable FPSOwith steel risers;
the deepest production facility in the world at 2,900m water depth●
the largest ever disconnectable mooring buoy●
Very High Pressure Fluid Swivel
Recognition for one of SBM Offshore’s ground-breaking technologies was received this year when the Company wasawarded a prestigious ‘Spotlight on Technology’ Award for its ‘Very High Pressure Fluid Swivel’ technology. Thispioneering technology represents a step-change for the industry as it breaks the current industry high pressure barrier. Itincreases the operating range of high pressure swivels by using a patented technique to cascade the pressure drop overmultiple seals. The 12″ prototype toroidal swivel has been fully qualified to 830 barg (12,000 psig) – and is now beingre-qualified as a second step to operate at over 1000 barg (14,500 psig). This swivel is specifically aimed at gas or waterinjection from FPSOs into ultra-high pressure reservoirs, such as the lower tertiary fields of the US Gulf of Mexico.
ARCA Chain Connector
This year SBM Offshore accomplished a major break-through in its new technology for chain connectors to improve theintegrity of mooring lines. The new Articulated Rod Connecting Arm (ARCA) Chain Connector provides a solution to easethe installation, inspection and repair of mooring lines.
With vessels now looking to be on station for up to 40 years there is a need to inspect chain connector articulations,which is currently very difficult as these are built into the chain table.
The ARCA chain connector places the articulations on the mooring leg and connects into a static connector on the chaintable. This enables for the inspection of the articulations and for them to be replaced if required. This brings a significantadvantage in terms of integrity of the units, but also in terms of safety, as this system is fully diverless. As thearticulations are not in the chain table, the size of the chain table can be reduced, allowing for optimisation of the turret.Moreover, the connection and disconnection can be performed without the need for diver intervention, bringing significantsafety benefits. This year the ARCA has started full qualification testing and it is envisaged to have it ready to launch inearly 2015.
SBM Offshore N.V. 2014 Annual Report 65
Other Floating Production UnitsThe Company continued to develop its ‘dry tree’ configuration of the proven Deep Draft SemisubmersibleTM hull, in orderto allow the use of surface-mounted Christmas trees in ultra-deep water fields in Brazil and the Gulf of Mexico.Development work progressed, with further model basin testing performed during 2014 to refine the conceptual design.
This new product has the potential to overcome the inherent water depth limitation of TLP platforms and consequentlyoffers great potential for ultra-deep water fields, especially for High Pressure/High Temperature reservoirs, where drytrees may be preferred.
Gas Processing UnitsFLNG
2014 has seen a significant acceleration in the number of FLNG prospects emerging in the market. In tandem with thisdemand the Company’s solution for offshore gas monetisation is gaining momentum. SBM Offshore’s patented,innovative midscale FLNG concept, which draws on the Company’s expertise of tanker conversion, is based on theconversion of two LNG tankers. Known as the Twin HullTM, its unique design provides simultaneously adequate storagevolume and deck space for topsides. Further development and extensive model basin tests took place in 2014.
With a design capacity of 1.5 to 2.0 million tonnes per annum, this new concept enables a highly economical approachfor exploiting small and medium sized offshore gas fields, with faster delivery and lower investment than required forother concepts currently on the market.
Gas to Liquid (GTL)
Within the framework of the Company’s Commercial Development Agreement with UK based Compact GTL Ltd, bothcompanies continued to progress the development of modular gas-to-liquid solutions for FPSOs. The use of GTLtechnology can significantly reduce gas flaring, by transforming associated gas into synthetic crude oil, which can beblended in to the produced crude oil. This product is being actively marketed to clients.
Intellectual PropertyThe Company maintains a significant Intellectual Property (IP) portfolio including patents, trademarks, and copyrights.The Company’s extensive patent portfolio of over 200 patent families covers a wide range of items including FPSOmooring and turret systems, hydrocarbon transfer and processing systems including LNG and gas processing, drillingand riser technologies, and offshore installation. During 2014, the Company has made 20 new patent applications indifferent countries.
Technical StandardsIn 2003 the Company introduced a set of proprietary Technical Standards, which defined design, procurement,construction, commissioning and installation processes for FPSO products. These have continued to evolve over thepast decade, adopting the accumulated learnings from project execution and fleet operation. Today, the standards areunique in being the only set of FPSO-specific Technical Standards in the offshore industry. Capturing the accumulatedexperience from over 257 contract years of FPSO and FSO operations, they provide a valuable foundation for theCompany’s leased FPSO projects.
The Company continued to grow its team of Technical Authorities, who are responsible for the development of thesestandards, and to ensure that they are correctly applied on projects.
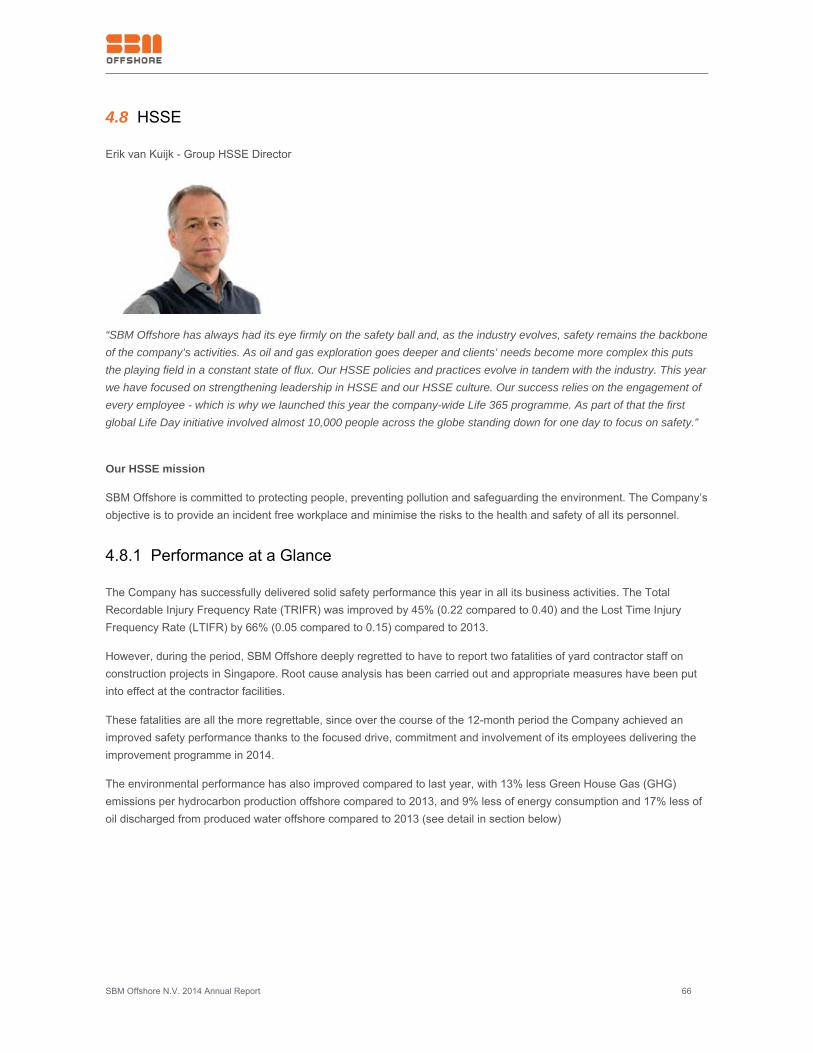
SBM Offshore N.V. 2014 Annual Report 66
4.8 HSSE
Erik van Kuijk - Group HSSE Director
“SBM Offshore has always had its eye firmly on the safety ball and, as the industry evolves, safety remains the backboneof the company’s activities. As oil and gas exploration goes deeper and clients’ needs become more complex this putsthe playing field in a constant state of flux. Our HSSE policies and practices evolve in tandem with the industry. This yearwe have focused on strengthening leadership in HSSE and our HSSE culture. Our success relies on the engagement ofevery employee - which is why we launched this year the company-wide Life 365 programme. As part of that the firstglobal Life Day initiative involved almost 10,000 people across the globe standing down for one day to focus on safety.”
Our HSSE mission
SBM Offshore is committed to protecting people, preventing pollution and safeguarding the environment. The Company’sobjective is to provide an incident free workplace and minimise the risks to the health and safety of all its personnel.
4.8.1 Performance at a Glance
The Company has successfully delivered solid safety performance this year in all its business activities. The TotalRecordable Injury Frequency Rate (TRIFR) was improved by 45% (0.22 compared to 0.40) and the Lost Time InjuryFrequency Rate (LTIFR) by 66% (0.05 compared to 0.15) compared to 2013.
However, during the period, SBM Offshore deeply regretted to have to report two fatalities of yard contractor staff onconstruction projects in Singapore. Root cause analysis has been carried out and appropriate measures have been putinto effect at the contractor facilities.
These fatalities are all the more regrettable, since over the course of the 12-month period the Company achieved animproved safety performance thanks to the focused drive, commitment and involvement of its employees delivering theimprovement programme in 2014.
The environmental performance has also improved compared to last year, with 13% less Green House Gas (GHG)emissions per hydrocarbon production offshore compared to 2013, and 9% less of energy consumption and 17% less ofoil discharged from produced water offshore compared to 2013 (see detail in section below)
SBM Offshore N.V. 2014 Annual Report 67
4.8.2 Occupational Health and Safety
Key results
The correlation between the Company’s efforts to drive a HSSE culture and the results of solid improvement in safetyperformance continues – improvements versus 2013 results were achieved both in yards and offshore with following2014 targets met:
The lowest number of injuries per exposure hours (Total Recordable Injury Frequency Rate) since 2009.●
A Total Recordable Injury Frequency Rate (TRIFR) of 0.22 compared to 0.40 in 2013. The 2014 performance was better than the●
target of 0.30.
The Lost Time Injury Frequency Rate (LTIFR) has improved by 66% compared to 2013 (0.05 in 2014 versus 0.15 in 2013). The 2014●
performance was better that the target of 0.09.
The Occupational Illness Frequency Rate (OIFR) has improved by 66% compared to 2013 (0.03 in 2014 versus 0.09 in 2013). (For●
SBM Offshore Employes only)
Offshore Operations recorded stable performance compared to 2013 in its Total Recordable Incident Frequency Rate (0.81 in 2014●
and 2013)
Onshore projects have improved these ratios by more than 50% in 2014 (TRIFR of 0.14 compared to 0.31 in 2013).●
The number of incidents with high potential to harm people has been reduced by 20% compared to 2013 and by 50% compared to●
2011.
Key achievements
During 2014, the Company continued to expand its occupational health and safety initiatives by enhancing existingprogrammes and development of new ones including:
The launch of a new HSSE Culture program called ‘Life 365’, which kicked off with the first company-wide ‘Life Day’ on April 28th. The●
objective of the worldwide stand-down from work was to dedicate the time for employees to concentrate on safety, security and health
for a day. The day was a universal success with all employees participating in workshops and being offered training in CPR. The three
key objectives were achieved: creating a sense of pride and belonging to a positive, rewarding and increasingly safe work
environment; involving and encouraging each employee to become a key player in the LIFE 365 programme, and creating awareness
and informing all personnel on the importance of HSSE to our organisation
Introduction of HSSE objectives for all SBM Offshore personnel as part of the annual appraisal system●
Monitoring of leading indicators to measure and benchmark safety performance and pro-actively take corrective actions, providing●
transparency on senior management engagement visits, training delivery and safety observation programs
The launch of monthly safety campaigns based on the Life Saving Rules●
Accreditation of five regional SBM Offshore offices as National Examination Board in Occupational Safety and Health (NEBOSH)●
examination centres
Upgrade of the medical and operational emergency response to address the potential impact of the Ebola outbreak in West Africa●
Developed the functional requirements for a new incident management tool and aligned with Governance, Risk and Compliance●
disciplines on risk management structure
Conducted an International Sustainability Rating System (ISRS), initial maturity assessment and developed an action plan for the●
coming years, which is integrated into the HSSE Strategy for 2015
Redesigned the HSSE control framework in the new Global Enterprise Management System (GEMS) - put in place within Odyssey24●
program and mapped the framework in the HSSE strategy for 2015
Identified key areas for HSSE improvement under ISRS Odyssey24 stream. Subsequent improvement plan developed with all●
impacted stakeholders
Maintenance of all safety certifications on marine units and shorebases (OHSAS 18001)●
Of particular note is the special merit award SBM Offshore received from a major client's CEO for the workers’ hazardrecognition programme on one of the Company’s major FPSO conversion projects, as well as recognition for consistently
SBM Offshore N.V. 2014 Annual Report 68
delivering on its HSSE vision throughout the project.
4.8.3 Process Safety Management
Following the launch in 2012 of a structured program to address the improvement areas in Process Safety Management(PSM), the Company has further developed a framework and associated tools for implementation of a comprehensivePSM Programme.
Key results
A total of 82 Loss of Primary Containment incidents were recorded, of which 46 were oil and gas releases. In total, sixwere classified as Tier 1 Process Safety events (of which five were gas releases) and six as Tier 2 Process Safetyevents, while the remaining 70 were of minor or insignificant consequences.
As reported in Section 4.8.5 Environmental Management, the majority of the liquid related Loss of Primary Containmentincidents resulted in spills contained onboard, only six resulted in release to the sea. This is an improvement comparedto 2013 during which 114 Loss of Containment incidents were reported, of which 62 were oil and gas releases.
The 2014 target for PSM awareness session attendance of 500 was exceeded●
Steps were initiated to strengthen the methodology and accuracy of Loss of Containment reporting and the identification process for●
improvement actions
Key achievements
Priority elements in the PSM programme have been defined. These elements consist of a set of activities and practices that will be●
embedded in the SBM Offshore Group Enterprise Management System (GEMS), the Group Technical Standards (GTS) and can be
assessed through the SBM Offshore International Sustainability Rating System (ISRS).
4.8.4 Security Management
Ensuring the security of the Company’s employees and assets is a key priority for management.
The Group’s Security Policy, procedures and controls are designed to provide the highest level of protection whereverthe Company operates in the world.
The Company embraces its ‘Duty of Care’ to employees and contractors regarding security matters. Relevant securityinformation is compiled and distributed from security information experts, as well as through a network of securitycontacts. This is particularly important when the Company’s vessels are operating in areas categorised as a ‘high risk’locations.
Key results
Fourteen security related incidents were reported across the entire organisation, of which three had the potential tocause physical harm to SBM Offshore personnel. None of these incidents resulted in any actual injury or physical harmto SBM Offshore personnel.
Key achievements
Security threat assessment on ‘high risk’ regions completed before the start of construction contracts for offshore units●
Daily Security reports issued to all SBM Offshore sites and operations●
Daily Threat Analysis for personnel operating in high risk locations with security alerts issued when applicable●
Face-to-face security briefings, as well as security awareness training in a number of locations. More than 670 people attended●
SBM Offshore N.V. 2014 Annual Report 69
Security Awareness briefing or information session
Specific security highlights and briefings were issued to all personnel working or traveling to Brazil during the World Cup.●
4.8.5 Environmental Management
The Company endeavours to operate in an environmentally responsible and sustainable manner, in order to minimisedamage to local ecosystems as well as proactively protect the environment, paying particular attention to three keyenvironmental challenges:
• Oil spills – by strictly following set procedures in operations and ensuring control measures are in place• Unnecessary flaring or emissions into the sea or air – by preventing when possible• Excessive use of energy and waste – by encouraging reduced consumption and re-use.
During 2014, The Company continued to undertake its environmental performance reporting in alignment with thereporting guidelines from the International Association of Oil & Gas Producers.
Key results
Offshore GHG[1]emissions from energy generation and gas flared decreased by 13% compared to 2013, remaining 19% better than●
the industry benchmark[2]
A total of 3.83 million tonnes of GHG have been produced in 2014, representing 128.8 tonnes of GHG per thousand tonnes of●
hydrocarbon produced
Total gas flared in 2014 was 16 tonnes per thousand tonnes of hydrocarbons produced, which is 13% less compared to 2013 (18.4●
tonnes) but 15% above the industry benchmark[3]. While 65% of the total gas flared was requested by clients or did not exceed the
client allowance, the percentage of the total volume flared recorded on the SBM Offshore account (35%) slightly decreased compared
to 2013. The Company has decided to implement strategies with a target to reduce flaring by 10% on the Company’s account in 2015
The rate of energy[4]used to produce oil and gas improved compared to 2013 (0.96 gigajoules of energy per tonnes of hydrocarbon●
produced compared to 1.05 in 2013), which is 31% better than the industry benchmark[5]
Reductions in the volume of oil discharged to sea per volume of hydrocarbon produced continued. The average volume of oil●
discharged was 3.3 tonnes per million tonnes of hydrocarbon produced, representing a 17% decrease compared to 2013 (3.98
tonnes) and 67% less than the industry benchmark[6]
A total of 39 liquid spills have been reported offshore in 2014, of which six spills resulted in release to sea and 33 were contained●
aboard the unit. Out of the six spills, three involved the release of hydrocarbons and three were chemicals spills. The total volume of
uncontained hydrocarbon spills is estimated at 1.06 cubic metres. Two spills were greater than one barrel in size (one oil spill of
condensate of approximately one cubic metre and one of an estimated 2.45 cubic metres of glycol into the sea). The spill of glycol was
an authorised release, as per the system’s design, which involves a release cooling medium to the flare system to alleviate
overpressure in the system. SBM Offshore reports in 2014 a normalised rate of 0.03 oil spill offshore per million tonnes of hydrocarbon
produced, compared to 0.19 in the industry benchmark[7]
[1]Greenhouse Gases are caused by energy generation and flaring during the production of oil and natural gas. GHG emissions recorded by the Company include emissions for theproduction of energy (from steam boilers, gas turbines and diesel engines) and emissions from gas flared. Emissions reported do not take into account any fugitive emissions noremissions from cargo venting.
[2]In 2014, SBM Offshore reported a total of 128.8 tonnes of GHG per thousand tonnes of hydrocarbon produced (compared to 148.5 tonnes in 2013). Companies participating in the2012 OGP benchmark reported 160 tonnes of GHG per thousand tonnes of hydrocarbon production in 2012. Report No. 2012e. November 2013. International Association of Oil &Gas Producers, page 10
[3]Companies participating in the OGP benchmark reported 13.9 tonnes of gas flared per hydrocarbon production. Report No. 2012e. November 2013. International Association of Oil& Gas Producers, page 16.
[4]Energy is required to produce oil and gas for example to produce steam, heat produced for oil separation, drive pumps producing the hydrocarbons or re-injected produced water,power compressors to re-inject produced gas, drive turbines to generate electricity, etc. Main source of energy consumption offshore is Fuel Gas and Marine Gas Oil.
[5]Companies participating in the OGP benchmark consumed 1.4 Gigajoules of energy for every tonnes of hydrocarbon produced, Report No. 2012e. November 2013. InternationalAssociation of Oil & Gas Producers, page 14.
[6]Companies participating in the OGP benchmark discharged 10 tonnes of oil to sea per million tonnes of hydrocarbon produced, Report No. 2012e. November 2013. InternationalAssociation of Oil & Gas Producers, page 17.
SBM Offshore N.V. 2014 Annual Report 70
[7]Companies participating in the OGP benchmark reported 0.19 oil spill offshore greater than one barrel per million tonnes of hydrocarbon produced, Report No. 2012e. November2013. International Association of Oil & Gas Producers, page 25.
Key achievements
Member of the World section of the Dow Jones Sustainability Index for the 5th consecutive year●
Maintenance of all existing environmental certifications (ISO14001) on marine units and shorebases●
Environmental certification (BREEAM) awarded for the refurbished Neptune office building in Monaco●
Initatives were introduced to improve monitoring of waste across the fleet●
Monthly monitoring of environmental emissions (GHG emissions, Flaring, Oil in Produced Water, Energy consumption, Waste Outputs●
and Loss of containments)
Specific environmental objectives set for 2015●
4.8.6 Looking Ahead
SBM Offshore Performance Targets for 2015 include:
0.27 for Total Recordable Injury Frequency Rate, which represents an objective to achieve a 10% reduction compared to 2014 target●
Reduce flaring on SBM Offshore account by 10% on each unit compared to 2014●
Reduce the number of Loss of Primary Containment by 10% on each unit compared to 2014●
Achieve better environmental performance (oil in produced water, GHG emissions, Flaring, energy consumption) than the 2013 OGP●
industry average benchmark
In line with its long term strategy, SBM Offshore will include the following elements in the HSSE programme for 2015:
Continue the company wide engagement on HSSE through the second annual Life Day and the Life 365 programme●
Introduce the new Safety and Process Safety Management leadership programmes for senior managers and discipline leads or●
specialists
Implementation of the identified 11 PSM priority elements, which include ‘Process Safety Culture’, ‘Hazard Identification & Risk●
Analysis’ and ‘Asset Integrity & Reliability’
Continue with the integration of HSSE and PSM in the SBM Offshore Life Cycle and leverage synergies with yards, key subcontractors●
and suppliers to align working practices with the Company’s standards and guidelines
SBM Offshore N.V. 2014 Annual Report 71
4.9 Human Resources
Richard Demblon - Group HR Director
“Ownership and accountability by all employees to actively deliver results drive our collective success and future as acompany. In light of current challenges our performance is a key factor for sustainable success. Key drivers to improveour ways of working were set in place in 2014 allowing us to begin transitioning to an organisation that is moreentrepreneurial, results oriented and client focused for future success. Recognition, development and advancement ofhigh performing, high potential employees within the Group will be an important enabler in the forthcoming period ofchange. Individual work needs to be aligned with the overall strategy to ensure we work as one, perform and shape ourfuture."
Human Resources’ mission
SBM Offshore is committed to empower and enable the Company’s people to deliver results to meet stakeholderexpectation. The Company strives to excel with passion and integrity - fueled by its ambition and team energy. The HRdepartment’s objective is to instill pride in every employee for their work and to maintain a superior and consistent way ofworking to world-class best practices. This is how SBM Offshore will achieve the desired results and sustainable growth.
Performance at a glance
This year was one of change as the organisation begins to transform and the commercial mindset is integrated. Byintroducing an entrepreneurial approach to conducting business, SBM Offshore has embarked on a more dynamic wayof working, which encourages employees to take initiative and rewards results. The three-year implementation of thisvision began in 2014 and is in response to the dynamics and difficulties that the industry is experiencing. Employees nowconsider the impact of their performance on the Company’s bottom line and they ask how they can contribute by beingproactive.
By aligning HR objectives with its objectives, the Company continues to deliver in a challenging time. Several projectswere completed this year including the start-up operations of two FPSOs in SBM Offshore’s key markets Brazil andAngola. The Company’s know-how resulted in SBM Offshore maintaining its reputation as the leading technology pioneerand this recognition was cemented by a prestigious industry award. The Company achieved an LTIFR of 0.05 and plansare being implemented to ensure headcount versus capacity is brought to a target of < 5% over. The Companycontinued to develop its talent and pave the way for the future leaders in the company. As an equal opportunity employerSBM Offshore continued its commitment to employing, retaining and developing the best talent in the industry as well asits commitment to its nationalisation programmes in the countries where it operates.
SBM Offshore N.V. 2014 Annual Report 72
Key achievements
Success objectives
Implementation of a programme to enhance an organisation culture that embraces ownership, accountability and a desire to deliver●
results
Linking performance and reward●
Training and Leadership development programmes undertaken – including the launch of the Project Management programmes, which●
are aimed at Project Managers and Discipline Lead Engineers
Continuation of commitment to industry best practice – with OPITO as a benchmark and thread throughout the training process and●
competence assurance system
Team energy objectives
Unplanned staff turnover at 8%●
Progressing initiatives to reduce headcount by 1,200 positions worldwide, over the period 2014 and 2015●
Improvements to shared best practices and strengthening of identical ways of working across the globe to ensure synergies and●
consistency of quality performance for customers
Identification and management of poor performance using KPIs and frequent manager/employee dialogue●
Ambition objectives
Expansion and development of leadership and management development programmes to build a robust succession pipeline●
Improved management of contractorsPerformance and Shape the Future objectives●
By cementing a strong, transparent compliant culture with controls and continual training undertaken to ensure that employees comply●
with competition law compliance and anti-corruption and regulatory compliance laws and regulations. The call for the integration of
these values has been embraced with open arms at every level and are deeply engrained in the company
Selection, training and recruitment programmes put in place to build next generation of SBM Offshore leaders at all levels●
Training courses undertaken focused on technical and HSSE topics●
Implementation of change programme - part of company-wide Odyssey 24 business improvement and transformation, delivering●
competency, skills matrix and working on refining the company processes for recruitment, development, appraisal of the
Company’s employees
Employee performance
SBM Offshore recognises that employees who are engaged in their work stay focused on the company’s goals and driveits future. Their well-being is an important issue for management and initiatives are promoted within the framework ofDuty of Care as an employer.
The energy and pride of the Company’s team-spirit is felt by SBM Offshore’s clients in the results that it delivers. TheCompany’s employees are empowered – encouraged by an environment of ambition as SBM Offshore opens the door tocreativity and innovation as well as focusing on the more traditional bottom-lines of responsibility and accountability.
SBM Offshore’s new way of working - implemented over a year ago – allows employees to achieve their objectives.Employees are rewarded for their individual performance and behaviour and their team actions. SBM Offshore’sperformance appraisal process increases the visibility of each employee’s own performance and rewards it in the contextof the company’s success.
Year-end appraisals provided the essential check-up to ensure that employees are engaged in the Work as one ethic ofthe Company as well as achieving the above mentioned Company objectives for 2014 plan.
Work as one
SBM Offshore N.V. 2014 Annual Report 73
By maximising the synergies and expertise of the five regional centres around the world●
By creating teams for a project that draw on the pool of specialised high calibre talent●
By promoting greater value interaction between managers and their teams●
By integrating new employees into the teams where their valuable experience and skills will be exploited for maximum results●
2014 in figures
Total headcount (including construction yards) has increased by 2.8% from 9,936 to 10,215. This is a net slow down compared to the●
33% increase in 2013 year on year
Headcount in Execution Centres decreased by 16.3% from 2,834 to 2,372 – this reflects the current low activity for projects in●
engineering phase
Headcount in SBM Operations has increased by 4.2% from 2,289 to 2,385●
Headcount in Group Project Execution has increased by 54.6% from 791 to 1,223, due to the most important projects being in the●
construction phase. The increase is explained by the hire of local contractors, with a two-fold increase at the yard in China,
increasing from 209 to 440
Permanent staff has experienced a slight decrease in proportion to total headcount from 84% last year to 81%●
At the end of 2014 Group companies employed 10,215 worldwide compared to 9,936 in 2013. This overall increase of2.8% is explained mainly by contractors and construction staff for projects at joint venture yards. However, permanentstaff experienced a decrease with a total of 8,234 employees in 2014 compared to a total of 8,358 employed in 2013(these figures exclude contractors). A bigger decrease will be reflected in 2015 in line with the workforce reduction plansas announced in the Press Release dated 11 December 2014. For detailed statistics on Human Resources, please seechapter 7.2 Performance Indicators.
Testimonials from employees demonstrate the business benefits of the training running throughout the year, whichinclude the Leadership programmes and the newly implemented Project Management programmes, which are aimed atProject Managers and Discipline Lead Engineers.
“I implemented the Earned Value Management techniques to optimise Engineering costs on my project.”
"By applying the project planning techniques to the two FEED projects in which I was involved this year I was able tosuccessfully execute the project within budget and deliver on time.”
SBM Offshore N.V. 2014 Annual Report 74
4.10 Company Tax Policy
Philippe Baffreau - Group Tax Director
“As a responsible corporate citizen, SBM Offshore is legally and morally committed to its tax obligations. The Company issensitive to public perception - the mindset is changing and SBM wants to be sure that our footprint goes beyond ourlegal obligations. For SBM to be perceived as a responsible taxpayer in all jurisdictions of operation is an objective. Whileat the same time, the Company is committed to deliver value to its shareholders and employees. As such, SBM Offshore’s tax policy has at its core the dual objectives to uphold these principles.”
SBM Offshore’s tax policy is summarised as follows:
The Company aims to minimise its overall tax burden to be cost competitive, while fully complying with local and international tax laws●
The Company aims to be a good corporate citizen in the countries it operates in, by complying with the law, and by contributing to the●
country’s progress and prosperity through employment, training and development, local spending, and through payment of the various
taxes it is subject to, including wage tax, personal income tax, withholding tax, sales tax and other state and national taxes as
appropriate
The Company operates in a global context, with global competitors, global clients, global suppliers and a globalworkforce. Some three quarters of the Company’s activities - measured by revenue - consist of large projectdevelopments, each project costing typically between US$0.5 and US$2.0 billion. A typical Floating, Production, Storageand Offloading (FPSO) project sees a hull conversion in Asia, topsides construction in Asia, Africa and South America,engineering in Europe, Asia or the USA and large scale procurement from dozens of companies in as many countriesacross the globe. In each of these countries the Company complies with local regulations, and pays direct and indirecttaxes on local value added, labour and profits, and in some cases pays a revenue based tax. To coordinate theinternational nature of its operations and its value flows and to consolidate its global activities, the Company created in1969 ‘Single Buoy Moorings Inc’, which continues to perform this function today from our offices in Marly, Switzerland.
The Company:
complies with the OECD transfer pricing guidelines●
has assessed its practices against the OECD Base Erosion Profit Shifting principles, and specifically the country-by-country reporting●
which fits into the increased tax transparency approach already adopted by the Company
makes use of the availability of international tax treaties to avoid double taxation●
does not use intellectual property as a means to shift profits, nor does it use digital sales. Furthermore, the Company does not apply●
aggressive intra-company financing structures such as hybrids. The Company treats tax as a cost, which needs to be managed and
optimised in order to compete effectively in the global competitive arena.
The Company reached an out-of-court settlement ex Article 74 of the Dutch Criminal Code with the Dutch PublicProsecutor’s Office (Openbaar Ministerie) over the inquiry into alleged improper payments. The out-of-court settlement
SBM Offshore N.V. 2014 Annual Report 75
consists of a payment by SBM Offshore to the Openbaar Ministerie. SBM Offshore will pay this out of its own funds andwill not claim any tax relief over the settlement amount.
In 2014, the Company had a corporate income tax liability of US$ 39.2 million (US$ 30.8 million in 2013). Due to thelarge losses incurred on the legacy projects, significant tax loss carry forward positions exist at the global contractingcompany which are limiting the current tax payments in Switzerland.
4.11 Group Management Systems
One of the Odyssey 24 transformation programme projects is the Global Enterprise Management System (GEMS).Based on industry practices, this renewed version of the SBM Offshore Management System will gradually replace thepresent system with full implementation scheduled for 2015. The new GEMS comprises one source of information for allthe Company’s business processes, supporting procedures and documentation.
Key achievements
The system supporting GEMS was implemented, populated with present Management System information●
The new structure of the management system has been defined, and the first series of new end-to-end processes has been●
developed.
Looking forward
In 2015 the remaining series of end-to-end processes will be developed. This will allow harmonisation wherediscrepancies or confusing inconsistencies have occurred to date.
Ongoing
The new Global Enterprise Management System for project execution and for FPSO operations remains based, asbefore, on the following internationally recognised codes and standards and regulations, while better facilitating theCompany’s compliance with them.
ISO 9001: 2008 Quality Management System●
ISO 14001: 2004 Environmental Management Systems●
OHSAS 18001: 2007 Occupational Health and Management Systems●
SBM Offshore Social Accountability Manual (compatible with SA8000 Social Accountability)●
MARPOL Regulations: 2002●
ISM/ISPS Codes (International Safety Management / International Ship and Port Facility Security)●
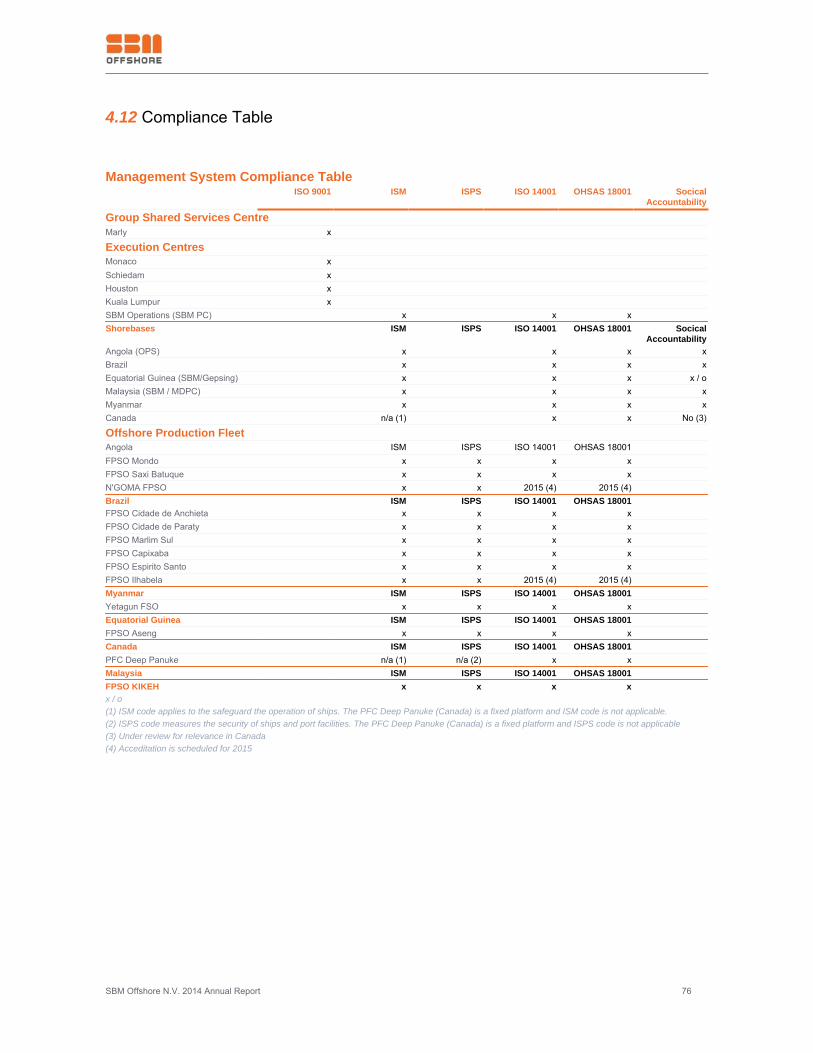
SBM Offshore N.V. 2014 Annual Report 76
4.12 Compliance Table
Management System Compliance Table ISO 9001 ISM ISPS ISO 14001 OHSAS 18001 Socical
Accountability
Group Shared Services CentreMarly x
Execution CentresMonaco x Schiedam x Houston x Kuala Lumpur x SBM Operations (SBM PC) x x x Shorebases ISM ISPS ISO 14001 OHSAS 18001 Socical
AccountabilityAngola (OPS) x x x xBrazil x x x xEquatorial Guinea (SBM/Gepsing) x x x x / oMalaysia (SBM / MDPC) x x x xMyanmar x x x xCanada n/a (1) x x No (3)
Offshore Production FleetAngola ISM ISPS ISO 14001 OHSAS 18001 FPSO Mondo x x x x FPSO Saxi Batuque x x x x N'GOMA FPSO x x 2015 (4) 2015 (4) Brazil ISM ISPS ISO 14001 OHSAS 18001 FPSO Cidade de Anchieta x x x x FPSO Cidade de Paraty x x x x FPSO Marlim Sul x x x x FPSO Capixaba x x x x FPSO Espirito Santo x x x x FPSO Ilhabela x x 2015 (4) 2015 (4) Myanmar ISM ISPS ISO 14001 OHSAS 18001 Yetagun FSO x x x x Equatorial Guinea ISM ISPS ISO 14001 OHSAS 18001 FPSO Aseng x x x x Canada ISM ISPS ISO 14001 OHSAS 18001 PFC Deep Panuke n/a (1) n/a (2) x x Malaysia ISM ISPS ISO 14001 OHSAS 18001 FPSO KIKEH x x x x x / o(1) ISM code applies to the safeguard the operation of ships. The PFC Deep Panuke (Canada) is a fixed platform and ISM code is not applicable.(2) ISPS code measures the security of ships and port facilities. The PFC Deep Panuke (Canada) is a fixed platform and ISPS code is not applicable(3) Under review for relevance in Canada(4) Acceditation is scheduled for 2015
SBM Offshore N.V. 2014 Annual Report 77
5 Report of the Supervisory Board - Governance and Compliance5.1 Report of the Supervisory Board
5.1.1 Message from the Chairman of the Supervisory Board
Dear Shareholders,
For the last time in my capacity as Chairman of the Supervisory Board of SBM Offshore N.V., I am pleased to presentyou this report of the Supervisory Board for 2014.
During the course of this challenging year, the key areas of attention of the Supervisory Board in its supervision of theManagement Board were the resolution of the alleged improper sales practices, the Company’s strategies, in particularas regards Brazil, oil and gas production operations, research, technology and project management and corporatefinance options, and the succession planning for the Supervisory Board and the Management Board.
Improper sales practices
At meetings and through direct communication the Supervisory Board was kept fully informed by the Management Boardthroughout the different stages of the internal investigation into improper sales practices and the Management Board’sdeliberations with the Dutch Public Prosecutor’s office. At an additional meeting held in June, the Supervisory Board metwith representatives of the Dutch Public Prosecutor’s office to confirm its firm resolution for a transparent governance ofthe Company under the Management Board’s leadership and to reassert its full support for the compliance enhancementactions taken by the Management Board. The Supervisory Board was pleased to note that the U.S. Department ofJustice closed out the matter and gave its full support for the terms of the settlement which the Management Boardreached on 12 November 2014 with the Dutch Public Prosecutor. As set out on page 174 of this Annual Report theComptroller General’s Office of Brazil has recently initiated an investigation.
Strategy
The difficult business environment caused by the low oil price situation and the ensuing cuts in our clients’ investmentprogrammes and the developments related into improper sales practices - amongst which regrettably the debarment forthe time being of tendering for Petrobras projects – has led the Supervisory Board and the Management Board tothoroughly review the Company strategy. As regards Brazil, the Supervisory Board welcomed the creation of an AdvisoryBoard to SBM Offshore do Brasil, the Management Board’s active dialogue with the Company’s key client Petrobras andthe deliberations with the relevant Brazilian authorities.
The December strategy meeting of the Supervisory Board was dedicated to an in depth review of the Company’sstrategic options, taking into account the prevailing low oil price and its effect on the investment plans of the oilcompanies, and the importance the Company’s R&D efforts should hold in addressing our clients’ aspirations in thedevelopment economics of their oil and gas fields. The strategy meeting also concluded on the paramount importance tothe Company’s success of the effective technical, commercial and sustainable execution of the oil and gas productionoperations of the Company’s fleet of FPSOs.
The Supervisory Board oversaw the restructuring which the Management Board announced in December 2014. Althoughthis restructuring involves a considerable number of redundancies, the Supervisory Board was fully aligned with theManagement Board on the necessity of these measures.
Succession Planning
At the Annual General Meeting of Shareholders I will step down as Chairman and member of the Supervisory Board,having reached the end of my third and last term of office. Mrs K. Rethy has reached the end of her first term of officeand has indicated that she would not stand for re-election.
SBM Offshore N.V. 2014 Annual Report 78
As announced in a press release on 17 December 2014, Mr Hepkema, Chief Governance and Compliance Officer, willstep down from the Management Board at the AGM of 15 April 2015. The Supervisory Board welcomes the decision ofMr Hepkema to continue to make his experience available to the Company in the capacity of Supervisory Board member.Mr Hepkema will be proposed as a member of the Supervisory Board at the AGM dd. 15 April 2014. A search for furthermembers of the Supervisory Board for the remaining vacancies is ongoing.
Mr. Hepkema’s anticipated retirement has been part of the Management Board succession planning process for the lastseveral months. The Supervisory Board is of the view that the CGCO function at Management Board level has createdsignificant value for the Company, and has decided to maintain it. At the AGM of 15 April 2015, the Supervisory Boardwill propose Mr Erik Lagendijk, to join the Management Board as CGCO. In addition it was decided to re-introduce theposition of Chief Operating Officer at Management Board level. In a Press Release SBM Offshore announced theproposed appointment of Philippe Barril as Chief Operating Officer (COO) effective March 1, 2015. Philippe Barril’sappointment as a member of the Management Board is subject to approval at the Annual General Meeting ofShareholders to be held on 15 April 2015.
These appointments will significantly strengthen the Management Board and allow Mr Bruno Chabas to add further focushis CEO role.
Also speaking on behalf of my colleagues in the Supervisory Board, I am confident that the positive results of thedetermined and diligent actions taken by the Management Board in addressing and managing the challenges anddifficulties they faced during the turnaround period, which started in 2012, will gain visibility in the year to come.
I wish to thank my fellow colleagues in the Supervisory Board for their dedication during the year 2014 and theManagement Board and all the staff for their sustained contribution to realising a culture change, making the Companymore transparent and enhancing its operational performance and success.
Yours sincerely,
H.C. Rothermund
Chairman of the Supervisory Board
SBM Offshore N.V. 2014 Annual Report 79
5.1.2 Activities of the Supervisory Board
During the course of the year under review, the Supervisory Board held five meetings according to a pre-set scheduleand two additional meetings. The last but one meeting of the year was for reasons of efficiency, a combined meeting ofthe Supervisory Board and of the Audit Committee. In addition the Supervisory Board held five conference calls with theManagement Board. These telephone conferences focused on specific subjects, more particularly, progress on theimproper sales practices and the strategic projects.The Management Board prepares detailed supporting documents and attends the formal meetings of the SupervisoryBoard. The regular meetings last about five hours. Pre-set meetings are usually spread over two days, starting on thefirst day with the meetings of the Audit Committee, the Technical and Commercial Committee and the Appointment andRemuneration Committee (A&RC). The Company secretary is the secretary of the Supervisory Board and itssub-committees. Each of the regular Supervisory Board meetings is preceded by a pre-meeting to which theManagement Board is invited. The pre-meeting is meant to enhance the effectiveness of the formal Supervisory Boardmeeting of the next day, taking into account the outcome of the sub-committee meetings which took place during the firstday.
With the exception of Mr. F. Cremers who was prevented from attending one meeting of the Audit Committee theSupervisory Board Members attended all of the regular Supervisory Board meetings and the sub-committee meetings.
Subjects reviewed at the sub-committee meetings cover the list of standard items set out in the Regulations of therespective committees. These regulations are published on the Company website. Standard items on the agenda of theSupervisory Board are:
A review of the Health, Safety, Security and Environment performance in the period under review●
An update of the Management Board on●
the operational and financial performance●
the commercial prospects●
corporate governance and compliance including risk management●
technology developments●
organisational developments●
A report by the chairpersons of the sub-committees on the review and discussions of the subjects handled in the sub-committee●
meetings
Approval of the minutes of the preceding meeting or the record note of conference calls and various housekeeping matters●
In addition to the review of these standard items, the following main topics were reviewed:
February meeting of the Supervisory Board and of the Audit Committee
A status update on the internal investigation into alleged improper payments●
2013 Financial statements and resolution to propose not paying a dividend●
2014 Budget●
March meeting
The meeting was dedicated to the matter of the investigation into alleged improper payments●
April meeting
A status update on the internal investigation into alleged improper payments with the Company’s General Counsel joining the meeting;●
AGM preparation and election of Mrs L. Armstrong as a new member of the Supervisory Board effective 1 July 2014. Re-election of Mr●
F.J.G.M Cremers and Mr F. Gugen as members of the Supervisory Board for a second term of office
SBM Offshore N.V. 2014 Annual Report 80
June meeting
A status update on the internal investigation into alleged improper payments●
The strategy with regard to Brazil●
August meeting
Interim Financial Statements 2014●
Update on a number of strategic projects●
November meeting
Q3 2013 Trading Update●
Visit to the Chengxi Shipyard Guangzhou, review of the Company’s main projects under construction in China and meeting with the●
yard’s Board member and senior management
Extensive review of the Management Board’s proposal to consider the creation of a Master Limited Partnership●
Review of the terms of the Settlement Agreement on the matter of the alleged improper payments to be entered into with the Dutch●
Public Prosecutor’s office
The Company’s reorganisation in Regional Centers and Product Lines●
December meeting
The strategy with regard to Brazil●
Strategy Plan 2015 – 2017●
5.1.3 The Supervisory Board Committees
Audit Committee
The Audit Committee convened for five regular meetings in 2014 of which one was combined with a meeting of theSupervisory Board. The regular Audit Committee meetings are held the day prior to the Supervisory Board meeting,where the Audit Committee Chairman reports on the principal issues discussed, on actions arising and the follow-up onsuch actions and makes recommendations on those matters requiring a decision by the Supervisory Board. Meetingslast three to four hours. The Management Board, the Group internal audit manager, the Group Controller and theexternal auditor attend the meetings. There were regular private meetings of the Audit Committee with the externalauditor without management being present.
The main items discussed during the year under review were, besides the standard topics:
The alleged improper sales practices●
The divestment of non-core assets●
Funding of projects, the U.S. Private Placement, the medium term financing plan and the Company’s new USD 1 Billion Revolving●
Credit Facility
The selection of the external auditor in view of the compulsory rotation of audit firms●
The project of creating a Master Limited Partnership●
The Group's tax structure, tax planning and transfer pricing policies●
The Audit Committee pays specific attention to risk management and discusses the quarterly Risk and Opportunityreport. The Audit Committee liaises with the Technical and Commercial Committee where the technical and projectexecution risks are discussed. Overall the standard of the audit team, the audit process and fees, and the interaction withthe Company’s personnel were all found satisfactory given the size, complexity and risk profile of the Company.
SBM Offshore N.V. 2014 Annual Report 81
In compliance with the new Dutch Audit Profession Act (WAB) the Management Board initiated in 2013 a selectionprocess with the aim to submit a proposal for appointment of a new external audit firm at the AGM of 2014. Theproposed firm, PWC Accountants N.V. with Mr W. Jansen as lead partner, was appointed at the AGM of 17 April 2014 fora period of four years.
Appointment and Remuneration Committee
The Appointment and Remuneration Committee met four times in 2014 in scheduled meetings. The meetings of theAppointment and Remuneration Committee are held prior to the Supervisory Board meetings. The respectivechairpersons report on the selection and appointment matters and on the remuneration matters reviewed by theCommittee, on actions arising and the follow-up of such actions. They make recommendations on those mattersrequiring a decision of the Supervisory Board. The meetings are attended by the Management Board and the Group HRDirector, except where the committee chooses to discuss matters in private. Meetings last approximately three hours.
The main subjects discussed by the Appointment and Remuneration Committee besides the standard topics were thefollowing:
Remuneration
Determination of Short Term and Long Term Incentive amounts by reference to the performance targets agreed with the Management●
Board for the year 2013 in accordance with the RP 2011 aa, and the determination of the Short Term Incentive performance targets
related to the year 2014 and of Long Term Incentive performance targets related to the vesting period 2014 to 2016 in accordance
with the Remuneration Policy (RP2011aa)
Share based incentives for senior management●
Recommendation to submit the proposal of a new Remuneration Policy (RP2015) to the AGM of 2014 to become effective on 1●
January 2015 (RP2015). At the AGM of 17 April 2014 the RP2015 was adopted
The Company’s organization and rightsizing actions proposed by the Management Board●
Selection and Appointments
The follow-up of the conclusions of the Supervisory Board Effectiveness Review conducted in 2013 by an external consultant●
The end of term resignation of Mr. F. Cremers and Mr F. Gugen and their re-election●
The proposal to appoint Mrs L. Armstrong OBE as a member of the Supervisory Board●
Succession planning of the Supervisory Board and proposal for appointment of Mr S. Hepkema as a member of the Supervisory Board●
to be submitted for approval by the AGM of 15 April 2015
Succession planning of the Supervisory Board and proposal for appointment of Mrs. [TBC] as a member of the Supervisory Board to●
be submitted for approval by the AGM of 15 April 2015
Selection and proposal for appointment of Mr E. Lagendijk as a CGCO and a member of the Management Board to be submitted for●
approval by the AGM of 15 April 2015
Selection and proposal for appointment of Mr P. Barril as a COO and a member of the Management Board to be submitted for●
approval by the AGM of 15 April 2015.
Technical and Commercial Committee
The Committee met formally four times. In addition, there was a one full day review of project performance and projectmanagement processes, initiated by the TCC and held in September in Monaco and a half day visit to the Carros(France) R&D facility, followed by an extraordinary TCC meeting focusing on fleet operations in December. The meetingsof the Technical and Commercial Committee last three to four hours and are held prior to the meetings of theSupervisory Board at which the chairman reports on the principal issues discussed, on actions arising and the follow-up
SBM Offshore N.V. 2014 Annual Report 82
of such actions and makes recommendations on those matters requiring a decision by the Supervisory Board. Themeetings are attended by the CEO, the Group Executive Managing Director, the Group Sales Director and the GroupTechnology Director. Other executives are asked to give presentations on specific topics within the remit of the TCC.
The TCC visited the Company’s R&D facility in Carros (France) and the chairman of the TCC addressed a projectmanagement seminar organized by the Company for project managers.
The main subjects discussed by the Technical and Commercial Committee were the following:
Quality improvement●
Health, Safety, Security and Environment performance●
Commercial prospects and the international competitive environment●
Fleet performance and asset integrity●
5.1.4 Performance Evaluation of the Supervisory Board
The Supervisory Board assessed its performance over 2013 on the basis of a questionnaire and followed-up on theconclusions of the Effectiveness Review conducted by an external consultant end of 2012/beginning of 2013.
The Supervisory Board resolved to entrust the performance evaluation of the Supervisory Board as a whole and itsindividual members in the year 2014 to a specialised external advisory firm. The resulting performance evaluation reportlisted a number of recommendations. The report and the recommendations were first discussed amongst the membersof the Supervisory Board privately early in 2015, and the recommendations and conclusions of the report which wererelevant to the Management Board were shared with the Management Board.
5.1.5 Conclusion
The Financial Statements have been audited by the external auditors, PwC Accountants N.V. Their findings have beendiscussed with the Audit Committee and the Supervisory Board in the presence of the Management Board. The auditorshave expressed an unqualified opinion on the Financial Statements.
The Supervisory Directors have signed the 2014 Financial Statements pursuant to their statutory obligations under article2:101 (2) of the Dutch Civil Code.
The members of the Management Board have signed the 2014 financial statements pursuant to their statutoryobligations under article 2: 101(2) of the Dutch Civil Code and article 5:25c (2) (c) of the Financial Market SupervisionAct.
The Supervisory Board of SBM Offshore N.V. recommends that the Annual General Meeting of Shareholders adopts theAnnual Report 2014 incorporating the Financial Statements for the year 2014 and the proposal not to pay out a dividend.
Schiedam, 4 February 2015
Supervisory Board
H.C. Rothermund, Chairman
F.J.G.M. Cremers, Vice-Chairman
L.A. Armstrong
F.G.H. Deckers

SBM Offshore N.V. 2014 Annual Report 83
T.M.E. Ehret
F.R. Gugen
K.A. Rethy
SBM Offshore N.V. 2014 Annual Report 84
5.2 Supervisory Board Profiles
The first term of office of Mr F.J.G.M. Cremers and of Mr F.R. Gugen expired at the AGM of 2014. Both members of theSupervisory Board indicated their willingness to stand for re-election and the Supervisory Board, upon therecommendation of the Appointment & Remuneration Committee, proposed to re-elect Mr F.J.G.M. Cremers and Mr F.R.Gugen for a second term of office expiring at the AGM of 2018. The Supervisory Board re-elected Mr F.J.G.M. Cremersas its vice-chairman.
Following a selection process conducted by the Appointment & Selection Committee with the assistance of a specialistconsultant, Mrs L.A. Armstrong was proposed by the Supervisory Board as a member of the Supervisory Board. At theAGM of 2014 Mrs L.A. Armstrong was elected as a member of the Supervisory Board effective July 1st, 2014. Her firstterm of office expires at the AGM of 2018.
The third and last term of office of Mr H.R. Rothermund expires at the AGM of 2015. SBM Offshore’s Supervisory Boardhas decided to appoint Mr. F.J.G.M. Cremers, currently Vice Chairman, as Chairman as of that date Mr. T.M.E. Ehret willsimultaneously be appointed as Vice Chairman replacing Mr. F.J.G.M. Cremers.
The first term of office of Mrs K.A. Rethy expires at the AGM of 2015. Mrs. K.A. Rethy indicated she would not stand forre-election.
SBM Offshore N.V. 2014 Annual Report 85
Supervisory Board
Mr. H.C. Rothermund (Chairman)Swiss, 1943Function: ChairmanCommittee: Member of the Technical and Commercial CommitteeFirst appointment: 2003Re-appointment: 2007Re-appointment: 2011Current term of office: 2011-2015A former Managing Director of Shell EP International B.V.
Other non-executive Board memberships:
Non-executive director, Petrotechnics Ltd.
SBM Offshore N.V. 2014 Annual Report 86
Mr F.J.G.M. CremersDutch, 1952Function: Vice ChairmanCommittee: Chairman Audit CommitteeFirst appointment: 2010Re-appointment: 2014Current term of office: 2014 – 2018A former CFO of Shell Expro UK and former CFO and member of the Board of Management of VNU N.V.
Other Supervisory Board memberships:
Listed companies:Vice Chairman of the Supervisory Board of Royal Imtech N.V.Member of the Supervisory Board of Vopak N.V.Member of the Supervisory Board of Unibail-Rodamco S.E.
Private Companies:Member of the Supervisory Board of Parcom Capital B.V.Member of the Supervisory Board of Luchthaven Schiphol N.V.
Other:Member of the Capital Markets Committee of the AFMMember of the Board of Stichting Preferente Aandelen HeijmansMember of the Board of Stichting Preferente Aandelen Philips

SBM Offshore N.V. 2014 Annual Report 87
Mrs. L.A. ArmstrongBritish, 1950Function: MemberCommittee: Member of the Technical and Commercial CommitteeFirst appointment: 2014Current term of office: 2014 – 2018A former Technical Vice President for Shell International.A former Exploration Director of Petroleum Development Oman.A former Director Shell UK Exploration.
Other non-executive Board memberships
Listed companies:Non-Executive Director of KAZ Minerals PlcPrivate companies: Non-Executive Director of Central Europe Oil CompanyChairperson of the Trustees of the British Safety Council
SBM Offshore N.V. 2014 Annual Report 88
Mr. F.G.H. DeckersDutch, 1950Function: MemberCommittee: Member Audit CommitteeMember of the Appointment & Remuneration CommitteeFirst appointment: 2008Current term of office: 2012-2016A former CEO of F. van Lanschot Bankiers N.V,
Other Supervisory Board memberships of private entities:
Chairman of the Supervisory Board of Deloitte Nederland B.V.Member of the Supervisory Board of IBM Nederland N.V.Member of the Supervisory Board of Springpaarden Fonds Nederland B.V.Member of the Board of the Netherlands Bankers’ Association
Other:
Member of Advisory Counsel Woman Capital
SBM Offshore N.V. 2014 Annual Report 89
Mr. T.M.E. EhretFrench, 1952Function: MemberCommittee: Chairman Technical and Commercial CommitteeFirst appointment: 2008Current term of office: 2012-2016A former President and Chief Executive Officer of Acergy S.A.
Private Companies
Chairman of Harkland Global Holdings Ltd.Non-Executive Director of Comex S.A., Green Holdings Corporation and ISM Komix Ltd.Member of the Supervisory Board of Huisman Equipment B.V.
SBM Offshore N.V. 2014 Annual Report 90
Mr F.R. GugenBritish, 1949Function: MemberCommittee: Chairman of the Appointment and Remuneration Committee dealing with remuneration matters and memberof the Appointment and Remuneration Committee dealing with selection and appointment matters. member of the AuditCommittee.First appointment: 2010Re-appointment: 2014Current term of office: 2014 – 2018A former Chief Executive of Amerada Hess Corporation in EuropeA former Finance Director of Amerada Hess Corporation in Europe
Listed Companies:
Chairman of the Board of Petroleum Geo-Services ASA and of IGas Energy plc
Private Companies:
Chairman of Chrysaor Limited, and Fraudscreen Limited
Charities:
Chairman of Raft, a medical research charity and Member of the Board of its biotech spin-out Smart Matrix Limited
SBM Offshore N.V. 2014 Annual Report 91
Mrs. K.A. RethyCanadian, 1956Function: MemberChairperson of the Appointment and Remuneration Committee dealing with selection and appointment matters andMember of the Appointment and Remuneration Committee dealing with remuneration mattersFirst appointment: 2011Current term of office: 2011-2015A former Senior Vice President, Global Services of Falconbridge Ltd.A former Director Material, Logistics and Services of DuPont Canada Inc.
Private Companies:
President of KAR Development Corporation, Toronto, Canada
Other:
Non-Executive Director of Equitable Bank and Equitable Group Inc., Canada
Non-Executive Director of Toromont Industries Ltd.
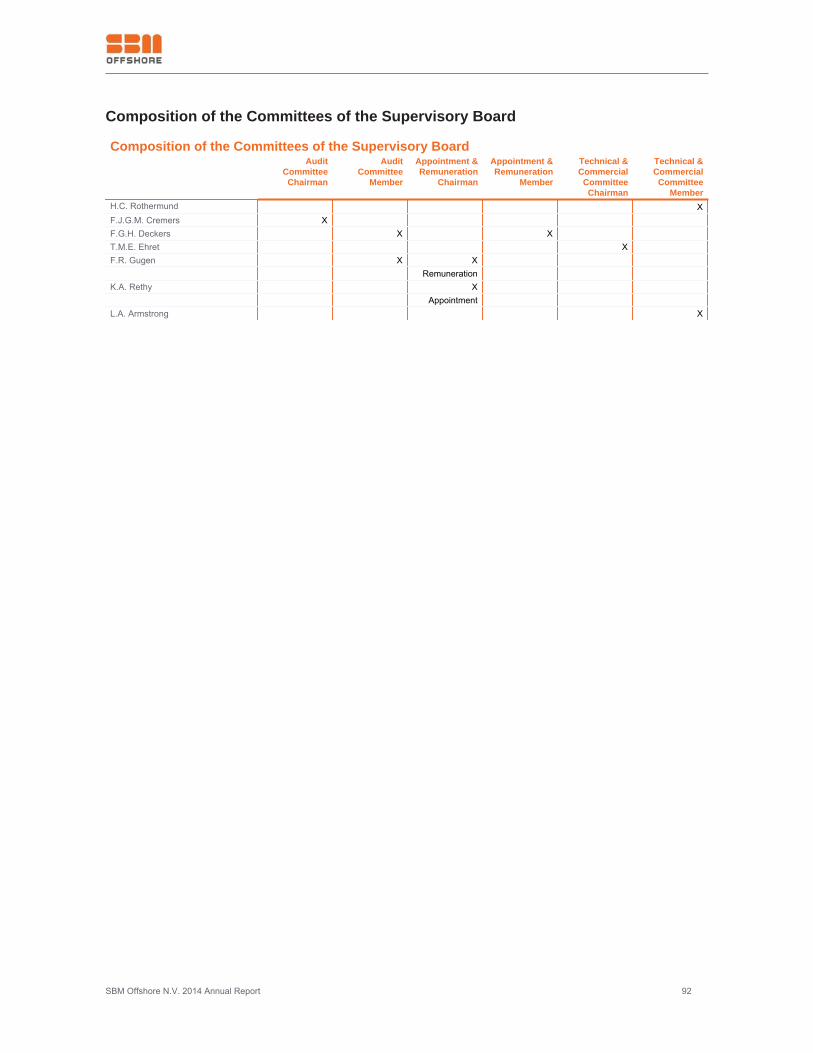
SBM Offshore N.V. 2014 Annual Report 92
Composition of the Committees of the Supervisory Board
Composition of the Committees of the Supervisory Board Audit
CommitteeChairman
AuditCommittee
Member
Appointment &Remuneration
Chairman
Appointment &Remuneration
Member
Technical &Commercial
CommitteeChairman
Technical &Commercial
CommitteeMember
H.C. Rothermund XF.J.G.M. Cremers X F.G.H. Deckers X X T.M.E. Ehret X F.R. Gugen X X Remuneration K.A. Rethy X Appointment L.A. Armstrong X
SBM Offshore N.V. 2014 Annual Report 93
5.3 Remuneration Report Dear Shareholders,
The Appointment and Remuneration Committee (A&RC) has introduced a new format to its report this year. Detailsrelated to the Members of the Management Board have now been split into two separate sections; one which describesthe remuneration policy effective from January 1, 2015 (RP2015) and for which shareholder approval was obtained at the2014 AGM, and the second section which details remuneration outcomes for 2014 under the policy that expires onDecember 31, 2014, RP2011aa.
With this change we aim to improve the transparency and clarity of our remuneration reporting. As a result readers willbe able to clearly identify our Management Board Remuneration Policy and separately the implementation of ourremuneration policy for the year under review, that will be subject to a separate discussion item at our 2015 AGM. Withthis change we are also anticipating and starting to prepare for the introduction of standardised remuneration reportingwhich is being proposed by the European Commission as part of the Shareholders' Rights Directive.
2014 has seen another year of very strong performance by our Management Board working in a challenging environmentto achieve the turnaround objectives that have been set for them. This is the final year of what the Supervisory Boardsaw as a three year turnaround period and as a result of Management efforts the Company is now better positioned tomove forward and to improve returns for our shareholders. The Management Board’s remuneration outcomes for 2014reflect their strong performance both during 2014 and in respect of the LTI awards vesting performance over the threeyear turnaround period. More detail regarding Management’s performance against the turnaround objectives set for themin advance is included on page 100.
The most significant development in terms of remuneration structure in 2014 was the successful introduction of our newexecutive remuneration policy, RP2015. We were pleased to receive, at last year's AGM, a vote of 94.7% in favour, fromthose shareholders who voted. Having spent the last three years focusing on the turnaround of the Company, theManagement Board is now able to devote its efforts to the future. The remuneration arrangements under RP2015 arebased on a robust and transparent incentive pay structure which will ensure that executive remuneration outcomes arestrongly linked to the attainment of the Company’s Strategy and Operating Plans in the interests of our shareholders.
During 2014 the A&RC reviewed the Supervisory Board’s fee structure, last revised in 2010. However, in the light of theeconomic conditions now prevailing in the oil industry, the Supervisory Board has decided not to ask shareholders now toapprove most of the recommendations from its compensation advisers. These recommendations concluded that thecurrent fee structure does not adequately reflect the expertise, experience and time commitment of our SupervisoryBoard members and could make it more difficult for the Company to attract and retain the highest quality andexperienced individuals, including internationally. However, the shareholders are asked to approve, at the 2015 AGM,revisions to the present fee structure to correct the two most significant anomalies, relating to intercontinental travel andthe remuneration of the Chairman.
I look forward to receiving your support at the AGM and to answering any questions which may arise from this Report.
Yours faithfully,
Francis R. Gugen
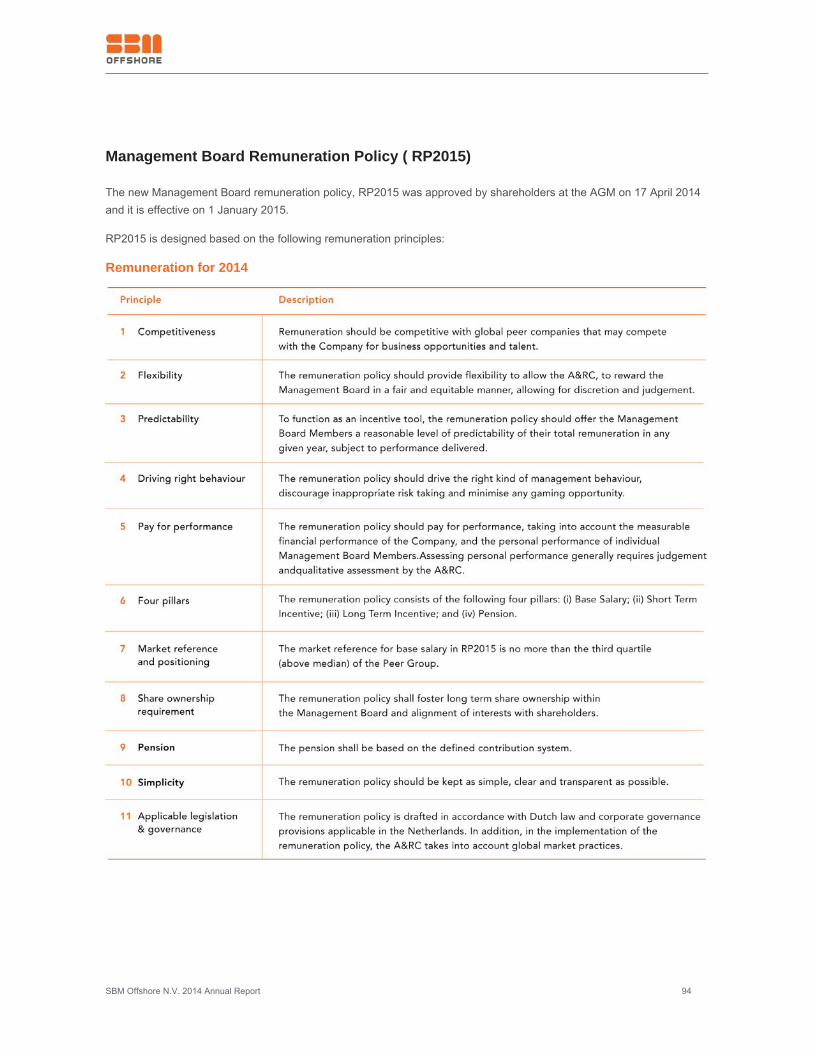
SBM Offshore N.V. 2014 Annual Report 94
Management Board Remuneration Policy ( RP2015)
The new Management Board remuneration policy, RP2015 was approved by shareholders at the AGM on 17 April 2014and it is effective on 1 January 2015.
RP2015 is designed based on the following remuneration principles:
Remuneration for 2014
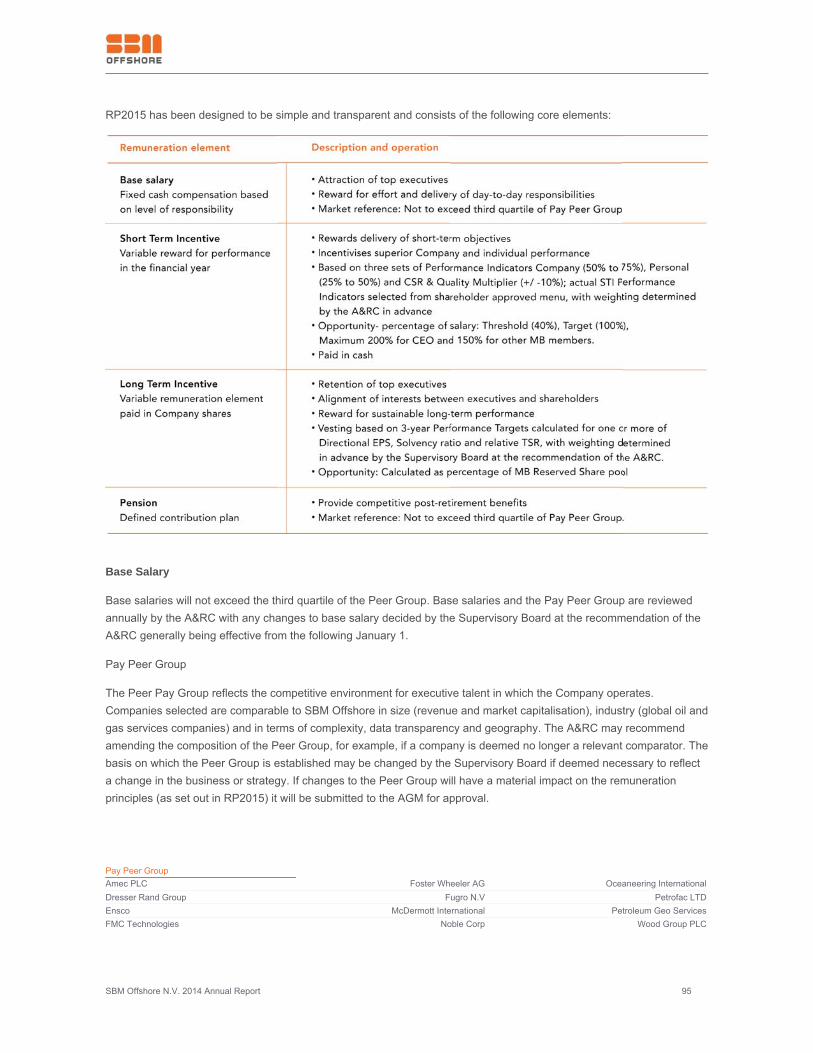
SBM Offshore N.V. 2014 Annual Report 95
RP2015 has been designed to be simple and transparent and consists of the following core elements:
Base Salary
Base salaries will not exceed the third quartile of the Peer Group. Base salaries and the Pay Peer Group are reviewedannually by the A&RC with any changes to base salary decided by the Supervisory Board at the recommendation of theA&RC generally being effective from the following January 1.
Pay Peer Group
The Peer Pay Group reflects the competitive environment for executive talent in which the Company operates.Companies selected are comparable to SBM Offshore in size (revenue and market capitalisation), industry (global oil andgas services companies) and in terms of complexity, data transparency and geography. The A&RC may recommendamending the composition of the Peer Group, for example, if a company is deemed no longer a relevant comparator. Thebasis on which the Peer Group is established may be changed by the Supervisory Board if deemed necessary to reflecta change in the business or strategy. If changes to the Peer Group will have a material impact on the remunerationprinciples (as set out in RP2015) it will be submitted to the AGM for approval.
Pay Peer GroupAmec PLC Foster Wheeler AG Oceaneering InternationalDresser Rand Group Fugro N.V Petrofac LTDEnsco McDermott International Petroleum Geo ServicesFMC Technologies Noble Corp Wood Group PLC
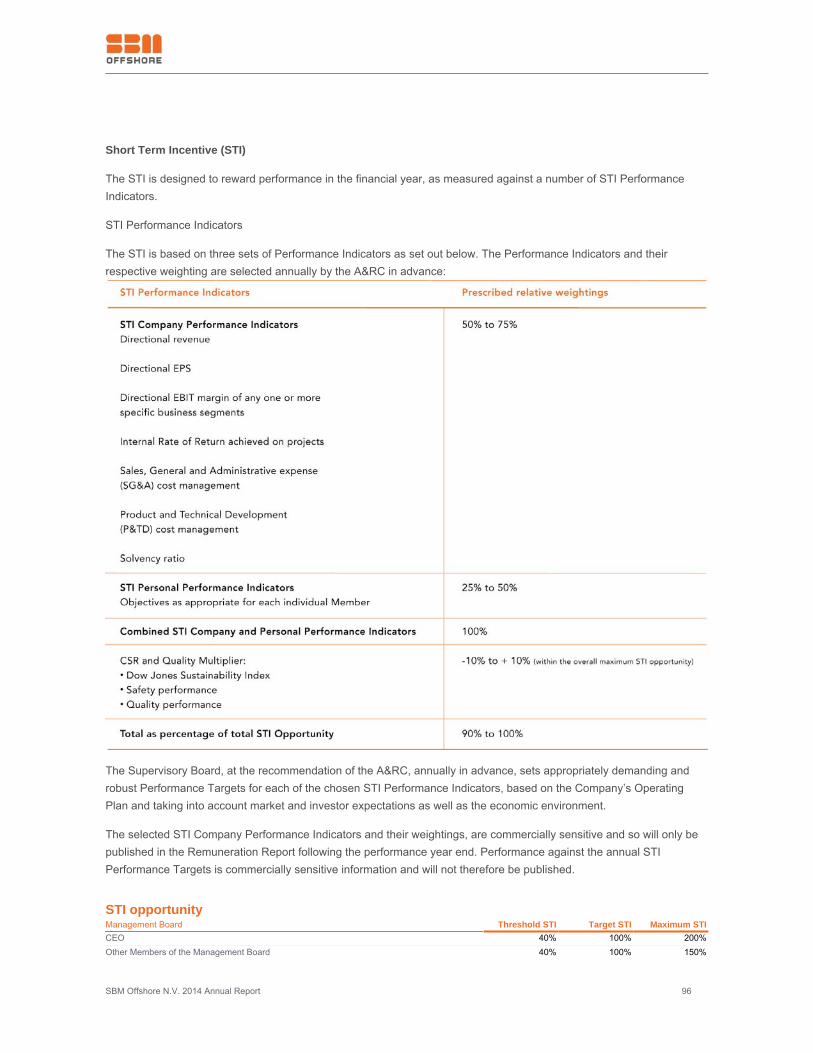
SBM Offshore N.V. 2014 Annual Report 96
Short Term Incentive (STI)
The STI is designed to reward performance in the financial year, as measured against a number of STI PerformanceIndicators.
STI Performance Indicators
The STI is based on three sets of Performance Indicators as set out below. The Performance Indicators and theirrespective weighting are selected annually by the A&RC in advance:
The Supervisory Board, at the recommendation of the A&RC, annually in advance, sets appropriately demanding androbust Performance Targets for each of the chosen STI Performance Indicators, based on the Company’s OperatingPlan and taking into account market and investor expectations as well as the economic environment.
The selected STI Company Performance Indicators and their weightings, are commercially sensitive and so will only bepublished in the Remuneration Report following the performance year end. Performance against the annual STIPerformance Targets is commercially sensitive information and will not therefore be published.
STI opportunityManagement Board Threshold STI Target STI Maximum STICEO 40% 100% 200%Other Members of the Management Board 40% 100% 150%
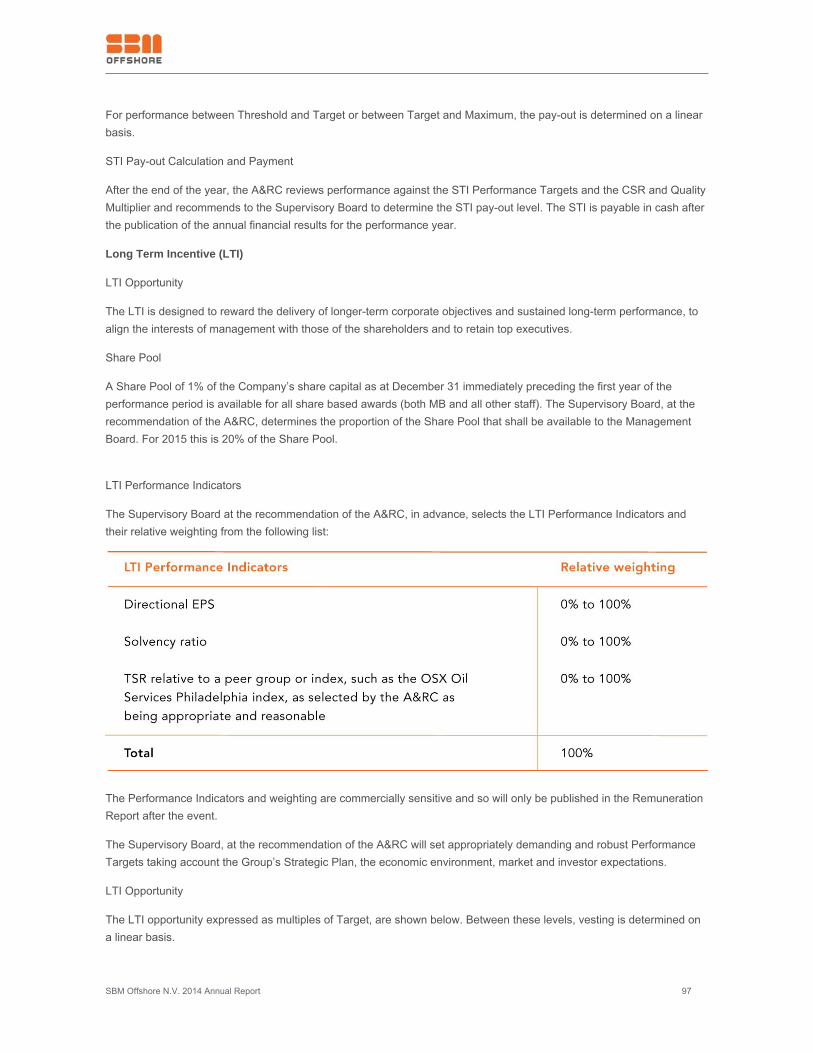
SBM Offshore N.V. 2014 Annual Report 97
For performance between Threshold and Target or between Target and Maximum, the pay-out is determined on a linearbasis.
STI Pay-out Calculation and Payment
After the end of the year, the A&RC reviews performance against the STI Performance Targets and the CSR and QualityMultiplier and recommends to the Supervisory Board to determine the STI pay-out level. The STI is payable in cash afterthe publication of the annual financial results for the performance year.
Long Term Incentive (LTI)
LTI Opportunity
The LTI is designed to reward the delivery of longer-term corporate objectives and sustained long-term performance, toalign the interests of management with those of the shareholders and to retain top executives.
Share Pool
A Share Pool of 1% of the Company’s share capital as at December 31 immediately preceding the first year of theperformance period is available for all share based awards (both MB and all other staff). The Supervisory Board, at therecommendation of the A&RC, determines the proportion of the Share Pool that shall be available to the ManagementBoard. For 2015 this is 20% of the Share Pool.
LTI Performance Indicators
The Supervisory Board at the recommendation of the A&RC, in advance, selects the LTI Performance Indicators andtheir relative weighting from the following list:
The Performance Indicators and weighting are commercially sensitive and so will only be published in the RemunerationReport after the event.
The Supervisory Board, at the recommendation of the A&RC will set appropriately demanding and robust PerformanceTargets taking account the Group’s Strategic Plan, the economic environment, market and investor expectations.
LTI Opportunity
The LTI opportunity expressed as multiples of Target, are shown below. Between these levels, vesting is determined ona linear basis.
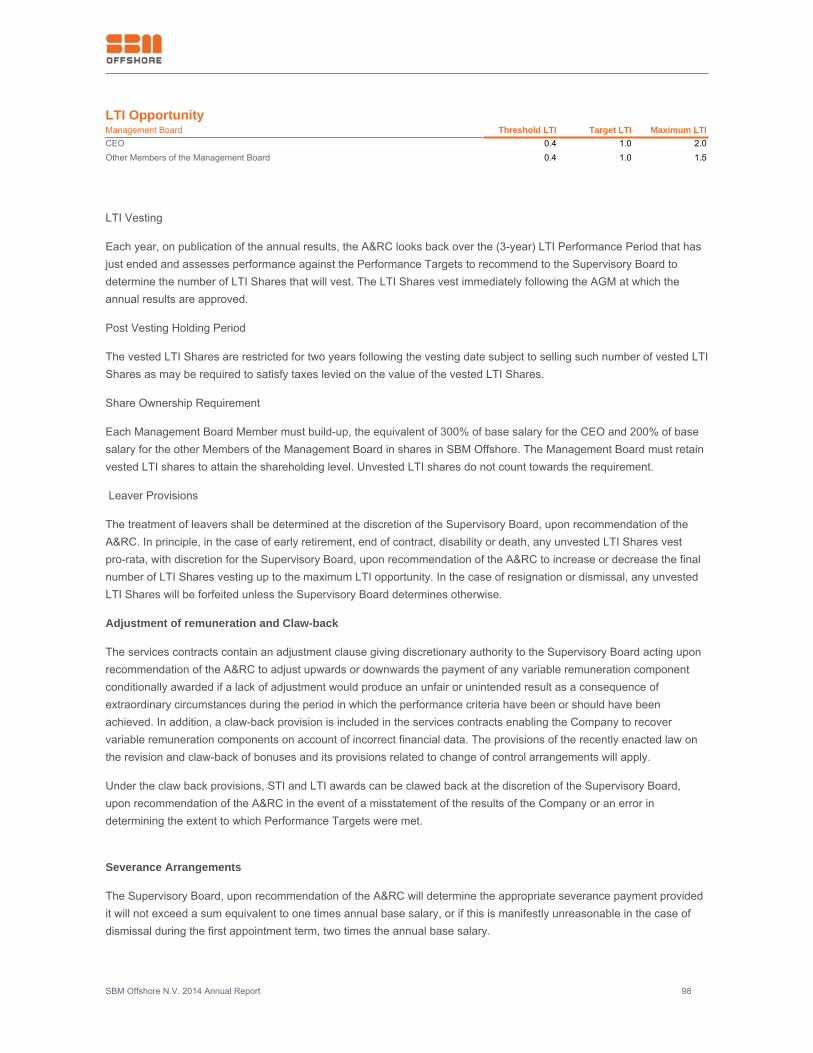
SBM Offshore N.V. 2014 Annual Report 98
LTI OpportunityManagement Board Threshold LTI Target LTI Maximum LTICEO 0.4 1.0 2.0Other Members of the Management Board 0.4 1.0 1.5
LTI Vesting
Each year, on publication of the annual results, the A&RC looks back over the (3-year) LTI Performance Period that hasjust ended and assesses performance against the Performance Targets to recommend to the Supervisory Board todetermine the number of LTI Shares that will vest. The LTI Shares vest immediately following the AGM at which theannual results are approved.
Post Vesting Holding Period
The vested LTI Shares are restricted for two years following the vesting date subject to selling such number of vested LTIShares as may be required to satisfy taxes levied on the value of the vested LTI Shares.
Share Ownership Requirement
Each Management Board Member must build-up, the equivalent of 300% of base salary for the CEO and 200% of basesalary for the other Members of the Management Board in shares in SBM Offshore. The Management Board must retainvested LTI shares to attain the shareholding level. Unvested LTI shares do not count towards the requirement.
Leaver Provisions
The treatment of leavers shall be determined at the discretion of the Supervisory Board, upon recommendation of theA&RC. In principle, in the case of early retirement, end of contract, disability or death, any unvested LTI Shares vestpro-rata, with discretion for the Supervisory Board, upon recommendation of the A&RC to increase or decrease the finalnumber of LTI Shares vesting up to the maximum LTI opportunity. In the case of resignation or dismissal, any unvestedLTI Shares will be forfeited unless the Supervisory Board determines otherwise.
Adjustment of remuneration and Claw-back
The services contracts contain an adjustment clause giving discretionary authority to the Supervisory Board acting uponrecommendation of the A&RC to adjust upwards or downwards the payment of any variable remuneration componentconditionally awarded if a lack of adjustment would produce an unfair or unintended result as a consequence ofextraordinary circumstances during the period in which the performance criteria have been or should have beenachieved. In addition, a claw-back provision is included in the services contracts enabling the Company to recovervariable remuneration components on account of incorrect financial data. The provisions of the recently enacted law onthe revision and claw-back of bonuses and its provisions related to change of control arrangements will apply.
Under the claw back provisions, STI and LTI awards can be clawed back at the discretion of the Supervisory Board,upon recommendation of the A&RC in the event of a misstatement of the results of the Company or an error indetermining the extent to which Performance Targets were met.
Severance Arrangements
The Supervisory Board, upon recommendation of the A&RC will determine the appropriate severance payment providedit will not exceed a sum equivalent to one times annual base salary, or if this is manifestly unreasonable in the case ofdismissal during the first appointment term, two times the annual base salary.
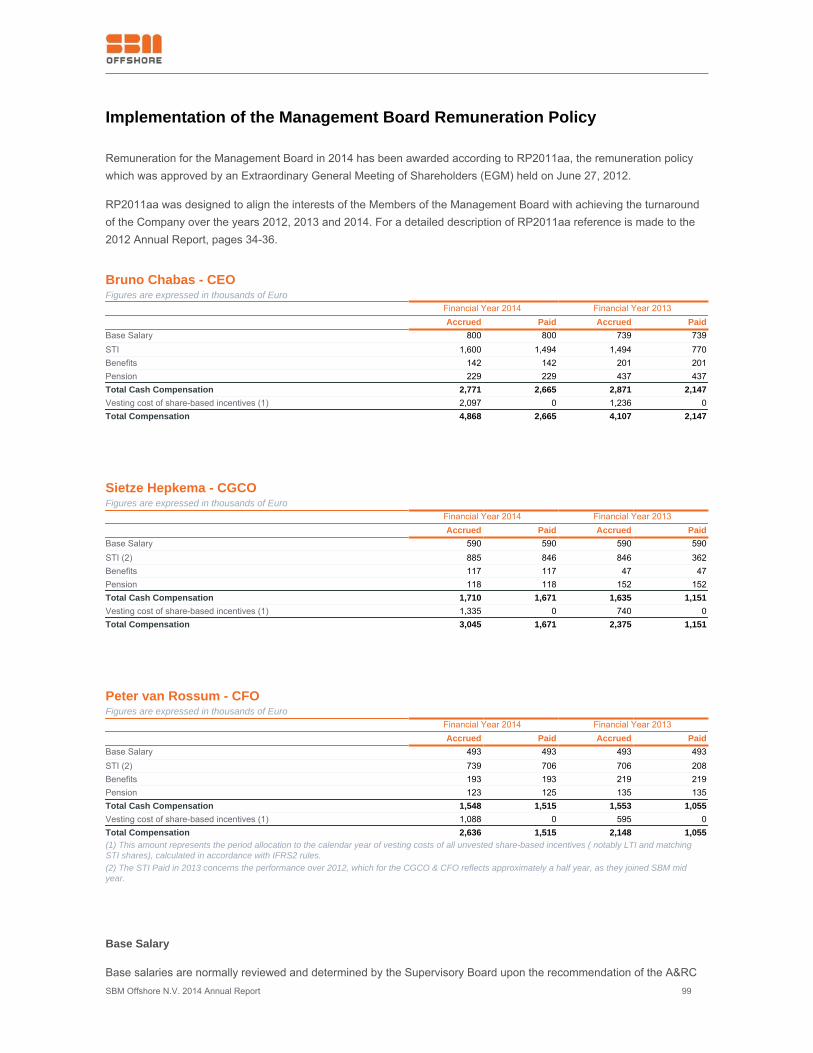
SBM Offshore N.V. 2014 Annual Report 99
Implementation of the Management Board Remuneration Policy
Remuneration for the Management Board in 2014 has been awarded according to RP2011aa, the remuneration policywhich was approved by an Extraordinary General Meeting of Shareholders (EGM) held on June 27, 2012.
RP2011aa was designed to align the interests of the Members of the Management Board with achieving the turnaroundof the Company over the years 2012, 2013 and 2014. For a detailed description of RP2011aa reference is made to the2012 Annual Report, pages 34-36.
Bruno Chabas - CEOFigures are expressed in thousands of Euro Financial Year 2014 Financial Year 2013
Accrued Paid Accrued PaidBase Salary 800 800 739 739STI 1,600 1,494 1,494 770Benefits 142 142 201 201Pension 229 229 437 437Total Cash Compensation 2,771 2,665 2,871 2,147Vesting cost of share-based incentives (1) 2,097 0 1,236 0Total Compensation 4,868 2,665 4,107 2,147
Sietze Hepkema - CGCOFigures are expressed in thousands of Euro Financial Year 2014 Financial Year 2013
Accrued Paid Accrued PaidBase Salary 590 590 590 590STI (2) 885 846 846 362Benefits 117 117 47 47Pension 118 118 152 152Total Cash Compensation 1,710 1,671 1,635 1,151Vesting cost of share-based incentives (1) 1,335 0 740 0Total Compensation 3,045 1,671 2,375 1,151
Peter van Rossum - CFOFigures are expressed in thousands of Euro Financial Year 2014 Financial Year 2013
Accrued Paid Accrued PaidBase Salary 493 493 493 493STI (2) 739 706 706 208Benefits 193 193 219 219Pension 123 125 135 135Total Cash Compensation 1,548 1,515 1,553 1,055Vesting cost of share-based incentives (1) 1,088 0 595 0Total Compensation 2,636 1,515 2,148 1,055(1) This amount represents the period allocation to the calendar year of vesting costs of all unvested share-based incentives ( notably LTI and matchingSTI shares), calculated in accordance with IFRS2 rules.(2) The STI Paid in 2013 concerns the performance over 2012, which for the CGCO & CFO reflects approximately a half year, as they joined SBM midyear.
Base Salary
Base salaries are normally reviewed and determined by the Supervisory Board upon the recommendation of the A&RC
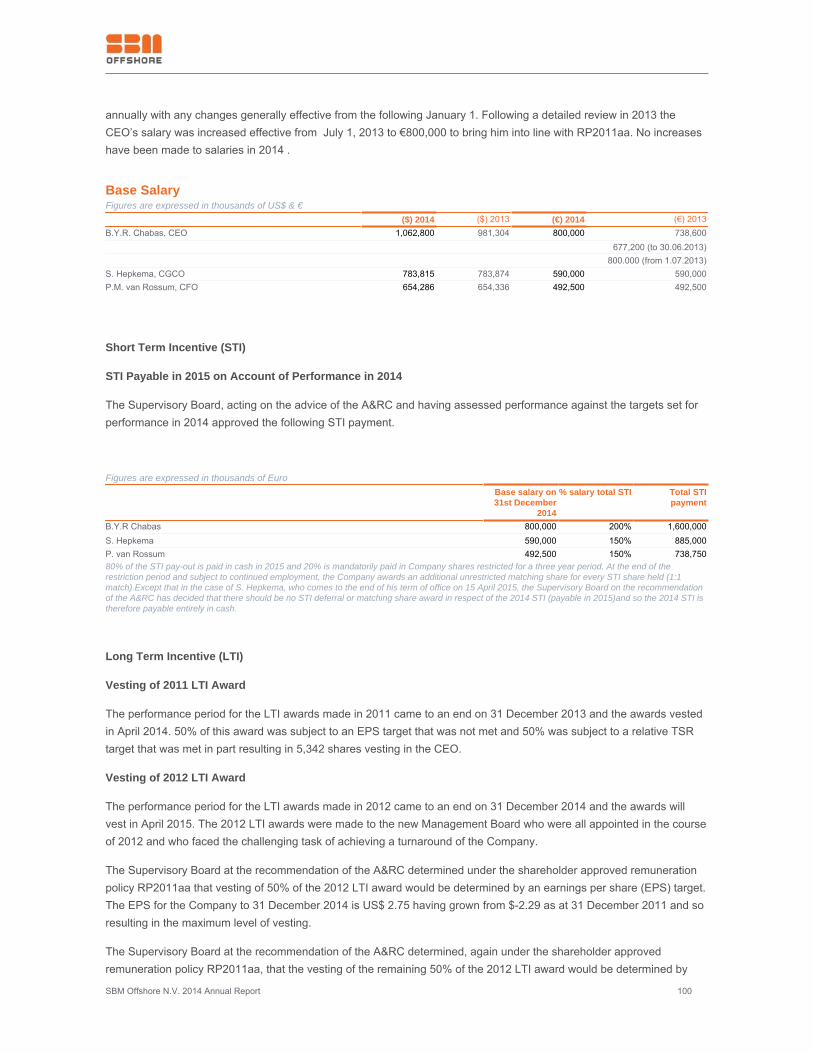
SBM Offshore N.V. 2014 Annual Report 100
annually with any changes generally effective from the following January 1. Following a detailed review in 2013 theCEO’s salary was increased effective from July 1, 2013 to €800,000 to bring him into line with RP2011aa. No increaseshave been made to salaries in 2014 .
Base SalaryFigures are expressed in thousands of US$ & €
($) 2014 ($) 2013 (€) 2014 (€) 2013B.Y.R. Chabas, CEO 1,062,800 981,304 800,000 738,600 677,200 (to 30.06.2013) 800.000 (from 1.07.2013)S. Hepkema, CGCO 783,815 783,874 590,000 590,000P.M. van Rossum, CFO 654,286 654,336 492,500 492,500
Short Term Incentive (STI)
STI Payable in 2015 on Account of Performance in 2014
The Supervisory Board, acting on the advice of the A&RC and having assessed performance against the targets set forperformance in 2014 approved the following STI payment.
Figures are expressed in thousands of Euro
Base salary on31st December
2014
% salary total STI Total STIpayment
B.Y.R Chabas 800,000 200% 1,600,000S. Hepkema 590,000 150% 885,000P. van Rossum 492,500 150% 738,75080% of the STI pay-out is paid in cash in 2015 and 20% is mandatorily paid in Company shares restricted for a three year period. At the end of therestriction period and subject to continued employment, the Company awards an additional unrestricted matching share for every STI share held (1:1match).Except that in the case of S. Hepkema, who comes to the end of his term of office on 15 April 2015, the Supervisory Board on the recommendationof the A&RC has decided that there should be no STI deferral or matching share award in respect of the 2014 STI (payable in 2015)and so the 2014 STI istherefore payable entirely in cash.
Long Term Incentive (LTI)
Vesting of 2011 LTI Award
The performance period for the LTI awards made in 2011 came to an end on 31 December 2013 and the awards vestedin April 2014. 50% of this award was subject to an EPS target that was not met and 50% was subject to a relative TSRtarget that was met in part resulting in 5,342 shares vesting in the CEO.
Vesting of 2012 LTI Award
The performance period for the LTI awards made in 2012 came to an end on 31 December 2014 and the awards willvest in April 2015. The 2012 LTI awards were made to the new Management Board who were all appointed in the courseof 2012 and who faced the challenging task of achieving a turnaround of the Company.
The Supervisory Board at the recommendation of the A&RC determined under the shareholder approved remunerationpolicy RP2011aa that vesting of 50% of the 2012 LTI award would be determined by an earnings per share (EPS) target.The EPS for the Company to 31 December 2014 is US$ 2.75 having grown from $-2.29 as at 31 December 2011 and soresulting in the maximum level of vesting.
The Supervisory Board at the recommendation of the A&RC determined, again under the shareholder approvedremuneration policy RP2011aa, that the vesting of the remaining 50% of the 2012 LTI award would be determined by
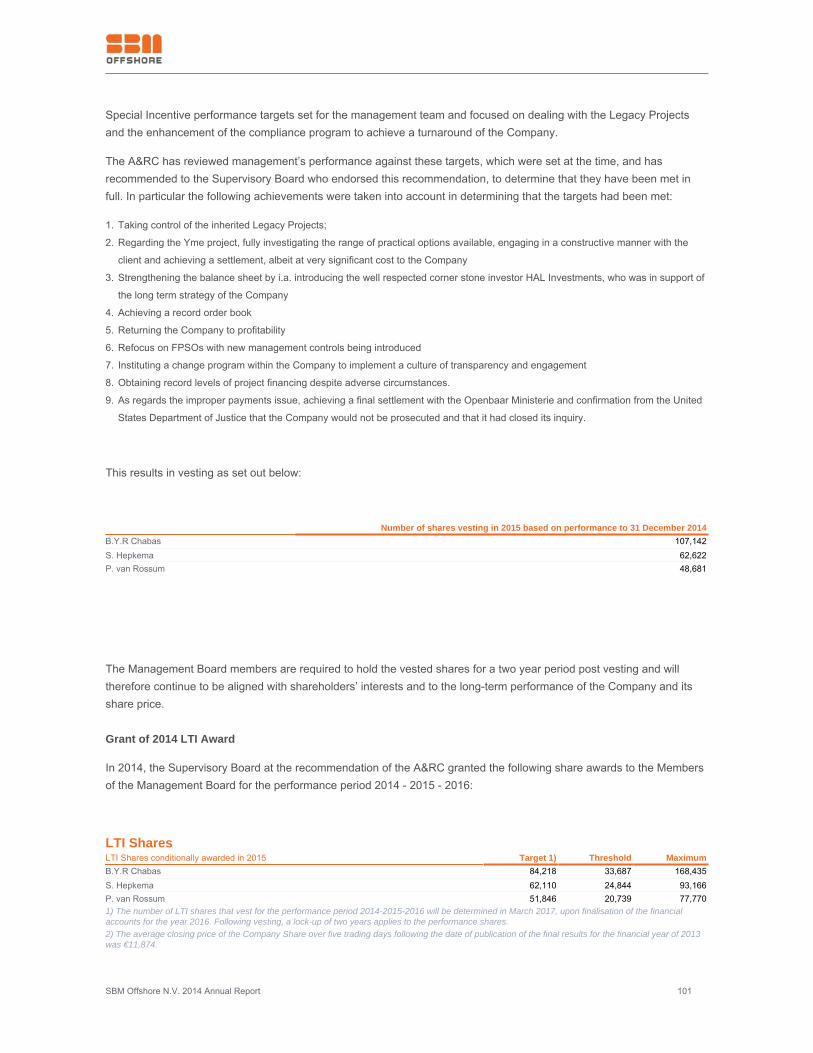
SBM Offshore N.V. 2014 Annual Report 101
Special Incentive performance targets set for the management team and focused on dealing with the Legacy Projectsand the enhancement of the compliance program to achieve a turnaround of the Company.
The A&RC has reviewed management’s performance against these targets, which were set at the time, and hasrecommended to the Supervisory Board who endorsed this recommendation, to determine that they have been met infull. In particular the following achievements were taken into account in determining that the targets had been met:
Taking control of the inherited Legacy Projects;1.
Regarding the Yme project, fully investigating the range of practical options available, engaging in a constructive manner with the2.
client and achieving a settlement, albeit at very significant cost to the Company
Strengthening the balance sheet by i.a. introducing the well respected corner stone investor HAL Investments, who was in support of3.
the long term strategy of the Company
Achieving a record order book4.
Returning the Company to profitability5.
Refocus on FPSOs with new management controls being introduced6.
Instituting a change program within the Company to implement a culture of transparency and engagement7.
Obtaining record levels of project financing despite adverse circumstances.8.
As regards the improper payments issue, achieving a final settlement with the Openbaar Ministerie and confirmation from the United9.
States Department of Justice that the Company would not be prosecuted and that it had closed its inquiry.
This results in vesting as set out below:
Number of shares vesting in 2015 based on performance to 31 December 2014B.Y.R Chabas 107,142S. Hepkema 62,622P. van Rossum 48,681
The Management Board members are required to hold the vested shares for a two year period post vesting and willtherefore continue to be aligned with shareholders’ interests and to the long-term performance of the Company and itsshare price.
Grant of 2014 LTI Award
In 2014, the Supervisory Board at the recommendation of the A&RC granted the following share awards to the Membersof the Management Board for the performance period 2014 - 2015 - 2016:
LTI SharesLTI Shares conditionally awarded in 2015 Target 1) Threshold MaximumB.Y.R Chabas 84,218 33,687 168,435S. Hepkema 62,110 24,844 93,166P. van Rossum 51,846 20,739 77,7701) The number of LTI shares that vest for the performance period 2014-2015-2016 will be determined in March 2017, upon finalisation of the financialaccounts for the year 2016. Following vesting, a lock-up of two years applies to the performance shares.2) The average closing price of the Company Share over five trading days following the date of publication of the final results for the financial year of 2013was €11,874.
SBM Offshore N.V. 2014 Annual Report 102
LTI Performance Indicators for 2014 LTI Award
The Performance Indicators and weightings for the 2014 LTI award are set in accordance with RP2011aa as set outbelow and will be disclosed at the time of vesting of the award.
50% of the LTI award vests based on EPS Growth adjusted for exceptional items and●
50% of the LTI award vests based on TSR relative to the 2011aa TSR Peer Group. Under 2011aa the Company uses the same Peer●
Group for benchmarking remuneration as well as for comparing the TSR performance.
Special Incentive (SI): the Supervisory Board was given the power to award SI’s to individual directors based on the achievement of●
predefined goals set by the Supervisory Board. The SI, introduced in 2012, only allows for vesting of LTI shares up to but not
exceeding the maximum LTI opportunity as set out in the table above.
Pensions
None of the members of the current Management Board has a defined benefits pension plan. Two of the three membersof the Management Board participate in defined contributions pension schemes the parameters of which have been setin the context of the base salary for each member of the Management Board taking into account the relevant countrycompetitive practice, tax and legal environment.
Scenario Analysis
As required by the Dutch Corporate Governance Code the Supervisory Board analysed during the year possibleoutcomes of the variable income components and the effect on the Management Board remuneration.
Remuneration for 2015
Retirement of the CGCO
Sietze Hepkema will be retiring as a Management Board member and CGCO at the Annual General Meeting ofShareholders of 15 April 2015 where his appointment to the Supervisory Board will be submitted for approval.
The Supervisory Board, acting upon the recommendation of the A&RC has resolved that he will be paid an STI amountrated at maximum on account of his performance in 2014, and that his STI matching shares will vest in full. MrHepkema's LTI shares as set out in the Share Based Incentives Outstanding as at 31 December 2014 table set out onpage 103 will vest at the usual time in accordance with the performance conditions without pro-rating, for the reasons asset out above.
Appointment of new CGCO
Eric Lagendijk has been nominated for appointment to the Management Board subject to approval by the AnnualGeneral Meeting of Shareholders on 15 April 2015 on a base salary of €409,500. Mr Lagendijk's other terms andconditions of service are in line with RP2015 and are disclosed in detail in the relevant AGM resolution.
Appointment of new COO
Philippe Barril has been nominated for appointment to the Management Board subject to approval by the Annual GeneralMeeting of Shareholders on 15 April 2015 on a base salary of EUR 550,800. Mr Barril’s other terms and conditions ofservice are in line with RP2015 and are disclosed in detail in the relevant AGM resolution.
2015 salaries
For 2015 no increases will be made to the base salaries of the Management Board.
Grant of 2015 LTI award (under RP2015)
SBM Offshore N.V. 2014 Annual Report 103
In accordance with the RP2015 which was approved at the Annual General Meeting of Shareholders of 17 April 2014,the maximum vesting opportunity of LTI Performance Shares is computed as follows:
Number of issued shares on 31 December 2014: 209,695,094
Share Pool 1%: 2,096,950
Management Board reserve 20%: 419,390
Maximum attributable to the CEO: 167,756
Maximum attributable to each of the three other MB members: 83,878
The number of conditional shares awarded to the Management Board in 2015 for the performance period2015-2016-2017 is as set out in the table below:
LTI Performance sharesLTI Shares conditionally awarded in 2014 Target Number of
PerformanceShares
conditionallyawarded in 2015
Threshold -Minimum Vesting
Opportunity(Number of
PerformanceShares)
MaximumVesting
Opportunity(Number of
PerformanceShares) (1)
B.Y.R Chabas 33,551 83,878 167,756S. Hepkema 0 0 0P. van Rossum 22,367 55,919 83,878P. Barril 22,367 55,919 83,878E. Lagendijk 22,367 55,919 83,8781) The number of LTI shares that vest for the performance period 2015-2016-2017 will be determined in 2018, upon finalisation of the financial accounts forthe year 2017. Following vesting, a lock-up of two years applies to the performance shares.
Vesting of 50% of the award will be determined by a Directional Earnings per share target and 50% by a relative TSRtarget.
SBM Offshore N.V. 2014 Annual Report 104
Share-based Incentives Outstanding as at 31 December 2014
Grant date No. of shares
conditionallygranted at target
level (1)
Value of sharesconditionally
granted €
Vesting date (2) No. of sharesvesting on the
vesting date
End of blockingperiod
Value ofunvested sharesas at 31.12 2014
€ (3)Bruno Chabas - CEO 2011 STI 1,520 23,400 2014 1,520 14,8672012 STI 14,831 154,000 2015 14,831 145,0622013 STI 25,171 298,880 2016 25,171 246,1982012 LTI 53,571 825,000 2015 2017 523,9782013 LTI 88,913 923,250 2016 2018 869,6582014 LTI 84,218 1,000,000 2017 2019 823,736 268,224 2,623,499Sietze Hepkema - CGCO 2012 STI 6,976 72,435 2015 6,976 68,2322013 STI 11,896 169,212 2016 11,896 116,3552012 LTI 41,748 642,940 2015 2017 408,3372013 LTI 71,024 737,500 2016 2018 694,6862014 LTI 62,110 737,500 2017 2019 607,498 193,754 1,895,108Peter van Rossum - CFO 2012 STI 4,006 41,600 2015 4,006 39,1832013 STI 14,251 141,249 2016 14,251 139,3892012 LTI 32,454 499,808 2015 2017 317,4332013 LTI 59,287 615,625 2016 2018 579,8862014 LTI 51,846 615,625 2017 2019 507,106 161,844 1,582,9971) Numbers mentioned for LTI awards are subject to vesting and are shown for on target performance. Depending on actual performance the number ofshares vesting may differ; numbers for STI awards refer to the Matching shares still subject to vesting2) For STI awards vesting is immediately following the end of the three year deferral period i.e. for the 2012 awards the deferral period ends on 31December 2014 (with issue in the subsequent year)3) This excludes the values of the already vested shares, which are still blocked, and which are included in the number of shares held by the ManagementBoard, as disclosed in note 21 in the Financial Report 2014
Remuneration of the Supervisory Board Paid in 2014None of the members of the Supervisory Board receive remuneration that is dependent on the financial performance ofthe Company. None of the current members of the Supervisory Board has reported holding shares (or other financialinstruments) in SBM Offshore N.V.
Current Board Fee Structure
The following fee level and structure was approved by the EGM on 6 July 2010, effective 1 July 2010:
Current Board Fee Structure€ Chairman Supervisory Board 90,000Vice-chairman Supervisory Board 80,000Member Supervisory Board 75,000Chairman Audit Committee 10,000Member Audit Committee 8,000Chairman Appointment & Remuneration Committee dealing with Appointment Matters 9,000Chairman Appointment & Remuneration Committee dealing with Remuneration Matters 9,000Member Appointment & Remuneration Committee 8,000Chairman Technical & Commercial Committee 10,000Member Technical & Commercial Committee 8,000
SBM Offshore N.V. 2014 Annual Report 105
Board Fees Paid in 2014
The total remuneration of the members of the Supervisory Board in 2014 amounted to €584 thousand (2013: €545thousand on a gross (i.e. before tax) basis. The table below shows the remuneration of individual Board members (seenote [4] to the consolidated financial statements for these figures in US$).
Figures are expressed in thousandsof Euro
Basic Remuneration Committees Total 2014 2013 2014 2013 2014 2013
H.C. Rothermund (Chairman) 90 90 13 23 103 113F.J.G.M Cremers ( Vice Chairman) 80 79 10 10 90 89F.G.H Deckers 75 75 14 8 89 83T.M.E. Ehret 75 75 10 10 85 85F.R. Gugen 75 75 15 9 90 84K.A. Rethy 75 75 11 16 86 91L.A. Armstrong ( from April 2014) 38 0 4 0 42 0Total 508 469 77 76 585 545
AGM Proposal to amend Supervisory Board Fees
Chairman of the SB
The SB remuneration policy for which shareholder approval is sought at the AGM of 15 April 2015 increases the fee ofthe Chairman of the SB from €90,000 to €120,000. In arriving at this fee level the Company has taken into account thebenchmarking which was carried out already in the course of 2014, and which was confirmed in a review by the A&RCearlier in 2015, including the time commitment of the current SB Chairman and the expected time commitment of the newSB Chairman as well as the skills and experience of the new Chairman.
Intercontinental travel
In order to be able to attract candidates from outside Europe and to compensate for the increased time commitment dueto intercontinental travel, when discharging Supervisory Board duties in another continent, shareholder approval will alsobe sought for payment of a lump sum compensation of € 5,000 for each Supervisory Board member each time they haveto undertake intercontinental travel in order to fulfill their board duties.
SBM Offshore N.V. 2014 Annual Report 106
5.4 Corporate Governance
5.4.1 Corporate Governance Structure
SBM Offshore N.V. is a limited liability company (“Naamloze Vennootschap”) incorporated under the laws of TheNetherlands with its statutory seat in Rotterdam and is listed on the Amsterdam NYSE Euronext exchange. TheCompany has a two tier board consisting of a Supervisory Board and a Management Board. Each Board has its specificrole and task regulated by laws, the articles of association, the Corporate Governance Code and the Supervisory andManagement Board rules. The articles of association and the Supervisory Board and Management Board rules arepublished on the Company’s website www.sbmoffshore.com.
SBM Offshore complies with all applicable principles and best practice provisions of the Dutch Corporate GovernanceCode, the full text of which can be found on www.mccg.nl.
Management Board
The Company is managed by the Management Board, under the supervision of the Supervisory Board. Each year theManagement Board presents to the Supervisory Board the strategy of the Company and the operational and financialobjectives designed to implement the strategy. The Company’s Strategy Plan 2015 – 2017 which includes the OperatingPlan for 2015 has been discussed with and received the support of the Supervisory Board at the meeting of 16December 2014. The 2015 budget was formally adopted at the February 2015 meeting of the Supervisory Board.
Appointment of a member of the Management Board (Managing Director)
Managing Directors are appointed by the General Meeting of Shareholders (GM). A Managing Director is appointed for amaximum period of four years, and unless a Managing Director resigns earlier, his/her appointment period shall end onthe day of the first Annual General Meeting (AGM) that will be held four years after the appointment. A Managing Directormay be reappointed for further consecutive terms of up to four years each.
In case of an appointment of one or more Managing Directors, the Supervisory Board may make a binding or anon-binding proposal to the GM. In case of a binding nomination, the Management Board shall invite the SupervisoryBoard to make a proposal for at least one alternative candidate within sixty days so that for each appointment a choicecan be made between at least two candidates.
The GM may at all times overrule the binding nature of a proposal by a resolution adopted by an absolute majority of thevotes cast, provided such majority represents at least one-third of the issued share capital. If one-third of the capital isnot represented at the meeting, but an absolute majority of the votes cast is in favour of a resolution to cancel the bindingnature of a nomination, a new meeting may be convened at which the resolution may be passed by an absolute majorityof the votes cast, regardless of the proportion of the capital represented at the meeting. If a binding nomination has notbeen made, the GM may appoint a Managing Director at its discretion upon the proposal of the Supervisory Board.
Suspension or Dismissal of a Managing Director
The GM may at any time suspend and dismiss Managing Directors. The resolution to suspend or dismiss a ManagingDirector requires an absolute majority of the votes cast at the GM, such majority representing more than one-third (1/3)of the issued share capital. If this majority does not represent at least one-third (1/3) of the issued share capital, a newmeeting can be convened enabling the resolution to be adopted by an absolute majority of the votes cast.
If either the GM or the Supervisory Board has suspended a Managing Director, then the GM must resolve within threemonths after the effective date of the suspension, either to remove the Managing Director, or to set aside or maintain thesuspension, failing which the suspension shall cease. A resolution to maintain the suspension may be adopted only once
SBM Offshore N.V. 2014 Annual Report 107
and the suspension may be maintained for a period not exceeding three months as from the day on which the GM haspassed the resolution to maintain the suspension. If the GM has not resolved within the period set for maintaining thesuspension, either to remove the Managing Director or to set aside the suspension, the suspension shall cease.
Supervisory BoardThe Supervisory Board currently consists of seven members and has three subcommittees: the Audit Committee, theAppointment & Remuneration Committee and the Technical & Commercial Committee.
The Supervisory Board supervises the management of the Company and its businesses, the effectiveness and theintegrity of the internal control and risk management systems and procedures implemented by the Management Boardas well as the general conduct of affairs of the Company and its businesses. The Supervisory Board assists theManagement Board with advice in accordance with the best practice of the Code and the Supervisory Board rules, whichare published on the Company’s website. In the performance of its duties the Supervisory Board is guided by theinterests of the stakeholders of the Company, and the enterprises connected therewith.
In addition, certain (material) decisions of the Management Board, as stipulated in the law or articles of association or theRules of the Supervisory Board, need prior approval of the Supervisory Board.
Appointment of Members of the Supervisory Board (Supervisory Directors)
Supervisory Directors are appointed by the GM. A Supervisory Director is appointed for a maximum period of four years,and, unless a Supervisory Director resigns earlier, his/her appointment period shall end on the day of the AGM, that willbe held four years following the appointment. A Supervisory Director may be reappointed. A Supervisory Director may bea member of the Supervisory Board for a maximum total period of twelve years. This period may or may not beinterrupted, unless the GM resolves otherwise. If one or more Supervisory Directors are to be appointed, the SupervisoryBoard may make a binding or a non-binding proposal, as referred to in the articles of association. As far as a bindingnomination is concerned, the proposal should offer the choice between at least two candidates.
In case a binding proposal is made, the GM may at all times overrule the binding nature thereof by a resolution adoptedby an absolute majority of the votes cast, provided such majority represents at least one-third of the issued share capital.If this proportion of the capital of at least one-third is not represented at the meeting, but an absolute majority of the votescast is in favour of a resolution to cancel the binding nature of a nomination, a new meeting may be convened. At thatmeeting, the resolution may be passed by an absolute majority of the votes cast, regardless of the proportion of thecapital represented at the meeting.
Suspension or Dismissal of a Supervisory Director
A resolution to suspend or dismiss a Supervisory Director may be passed only by the General Meeting with an absolutemajority of the votes cast, such majority representing more than one-third (1/3) of the issued share capital. If this majoritydoes not represent at least one-third (1/3) of the issued share capital, a new meeting can be convened in which meetingthe resolution can be adopted by an absolute majority of the votes cast.
If the General Meeting has suspended a Supervisory Director, then the GM must resolve within three months after theeffective date of the suspension, either to remove the Supervisory Director, or to set aside or maintain the suspension,failing which the suspension shall cease. A resolution to maintain the suspension may be adopted only once and thesuspension may be maintained for a period not exceeding three months as from the day on which the General Meetinghas passed the resolution to maintain the suspension. If the General Meeting has not resolved within the period set forthe maintaining of the suspension either to remove the Supervisory Director or to set aside the suspension, thesuspension shall cease.
SBM Offshore N.V. 2014 Annual Report 108
Board ComplianceRegulations concerning Ownership of and Transactions in Shares
The Supervisory Board and Management Board rules contain a provision with regard to the ownership of andtransactions in shares in the Company and in shares of Dutch listed companies other than SBM Offshore N.V. Thisprovision prohibits trading in shares of the Company and in shares other than those of the Company on the basis ofshare price sensitive information obtained in the course of managing or supervising the Company’s businesses. Forinformation about the shares (or other financial instruments) held in SBM Offshore N.V. by members of the ManagementBoard, refer to note [4] to the consolidated financial statements.
Conflicts of InterestManagement Board
The members of the Management Board have a services contract with SBM Offshore N.V. In these contracts it isstipulated that members of the Management Board may not compete with the Company. In addition, the ManagementBoard Rules and the Code of Conduct of the Company regulate conflict of interest matters and are applicable tomembers of the Management Board and other employees.
The Company’s Code of Conduct does not permit employees and directors to accept gifts of value for themselves or theirrelatives, to provide advantages to third parties to the detriment of the Company or to take advantage of businessopportunities to which SBM Offshore is entitled.
A recently enacted law further enhances the prevention of conflicts of interests and these provisions apply to theSupervisory Board and the Management Board of the Company.
The members of the Management Board did not report any conflict of interest during the year 2014.
Supervisory Board
All Supervisory Board members are independent from the Company within the meaning of best practice provision III.2.2of the Code. None of the members are on the Management Board of a Dutch listed company in which a member of theManagement Board of the Company is a Supervisory Board member. There are no interlocking directorships. None ofthe members represent directly or indirectly a shareholder of the Company or a supplier or customer of the Company.None of the members of the Supervisory Board provides any services to or has any direct or indirect ties with theCompany outside his/her Supervisory Board membership. Mr F. Deckers is Chairman of the supervisory board ofDeloitte Nederland B.V. and therefore the Audit Committee recommended, and the Supervisory Board resolved not toinvite Deloitte to participate in the tender to become the new external auditor of the Company, the appointment of whichwas submitted to the AGM of 2014.
Mandates with Third PartiesThe Company is fully compliant with Best Practice II.1.8 of the Dutch Corporate Governance Code. Acceptance by themembers of the Management Board of no more than two mandates as a Supervisory Board member of a listed companyrequires the prior approval of the Supervisory Board to prevent conflicts of interest and reputational risks. Otherappointments of material importance need to be notified to the Supervisory Board. Members of the Management Boardare also appointed to the statutory board of the Company’s operational entities.
Loans or GuaranteesNo loans or guarantees have been provided to members of the Management Board.
Code of Conduct and Reporting of Alleged IrregularitiesThe Company has a Code of Conduct, which was updated in March 2012 and is posted on the Company’s website. TheCompany also has a procedure allowing employees to report alleged irregularities with respect to the Code without
SBM Offshore N.V. 2014 Annual Report 109
jeopardising their employment position. Freephone or web-based reporting facility (the SBM Offshore Integrity Line) is inplace, which employees can use - anonymously if they wish - in their own language. The facility is operated by anexternal provider, People Intouch.
The Company continues to enhance a number of its anti-corruption initiatives, including:
Code of Conduct containing a section on the use of agents and commercial relations with Public Officials●
Anti-Corruption Policy and Compliance Guide●
Due diligence and third party vetting procedures●
Rules of conduct to report suspected irregularities, including a hotline “SBM Offshore Integrity Line”●
Internal Audit Anti-corruption modules for third party audits and SBM companies●
Internal training sessions and e-learning courses●
Use of standard contracts and anti-corruption and conflict of interest clause in contracts●
Increase of internal controls, notably ICOFR /IFRS system and new finance and accounting policies●
Diversity
The Supervisory Board rules state that the composition of the Supervisory Board shall be such that the combinedexperience, expertise and independence of its members enable the Supervisory Board to best carry out the full range ofits responsibilities.
The Supervisory Board considers that its current composition satisfies the best that is obtainable in this segment in termsof diversity, gender (two women out of seven Supervisory Board members), age, nationality (five different nationalities),financial and business management expertise and international experience in the oil and gas industries. The SupervisoryBoard intends to submit to the AGM on 15 April 2015 the appointment of Mr S. Hepkema. The Supervisory Board intendsto complete the selection process of at least one other member prior to the date of publication of the agenda for theAGM. The candidate being considered is a woman. When appointed, the composition of the Supervisory Board will meetthe legal requirements of gender diversity.
The Supervisory Board strives to also achieve the required gender diversity at the level of the Management Board, butafter careful consideration of the candidates for the Management Board appointments opted to nominate the bestavailable candidates in terms of business experience and professional expertise.
Executive CommitteeTowards the end of 2012 the Management Board created an Executive Committee (Excom) comprised of theManagement Board, the Group Executive Managing Director, the Managing Directors of the Company’s variousExecution Centers, the MD of Brazil and a number of Group Functions Directors. The Excom meets by telepresence fora two to three hour session every month and once a quarter for a full day face-to-face meeting. In the meetings bothstrategic and operational topics are discussed. The Excom facilitates decision making without detracting from theexercise of statutory responsibilities by the members of the Management Board and the internal Company authoritymatrix.
ShareholdersShare Capital
The authorised share capital of the Company amounts EUR 200 Million and is divided into 400,000,000 ordinary shareswith a nominal value of EUR 0.25 and 400,000,000 protective preference shares with a nominal value of EUR 0.25. Thepreference shares can be issued as a protective measure, as explained below in the section on the Stichting ContinuiteitSBM Offshore. On 31 December 2014 the following investors holding ordinary shares had notified an interest of 3% ormore of the Company’s issued share capital to the Autoriteit Financiële Markten (AFM):
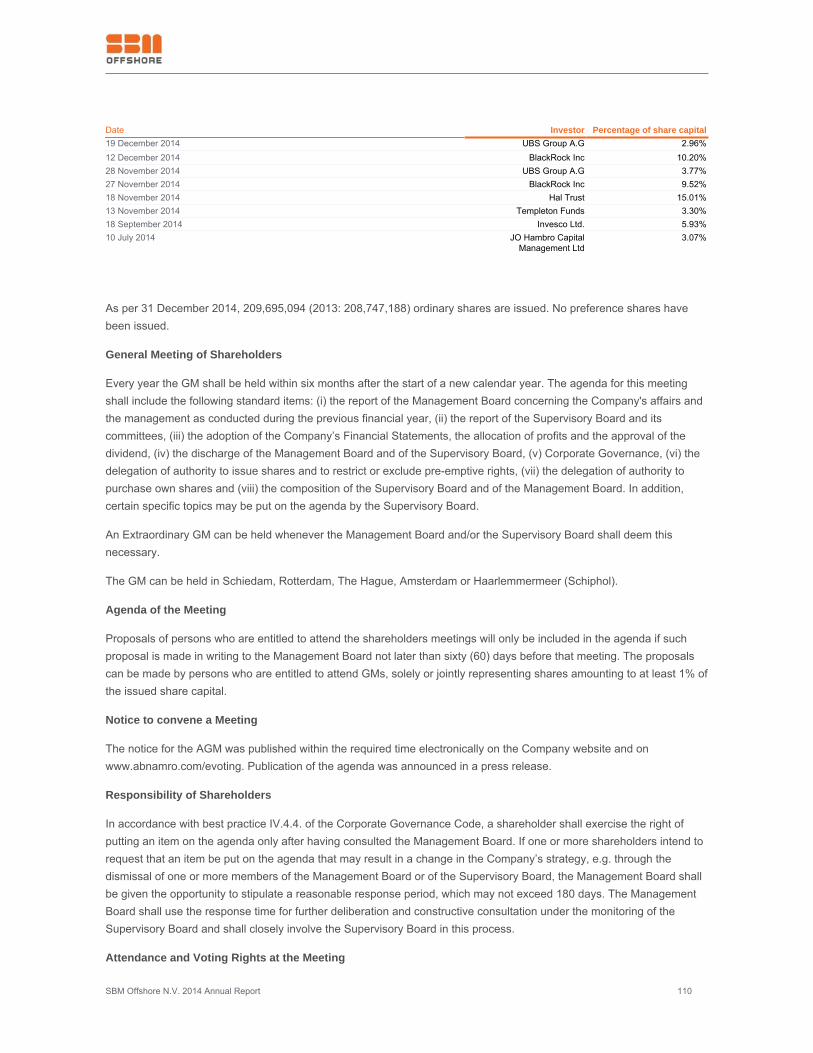
SBM Offshore N.V. 2014 Annual Report 110
Date Investor Percentage of share capital19 December 2014 UBS Group A.G 2.96%12 December 2014 BlackRock Inc 10.20%28 November 2014 UBS Group A.G 3.77%27 November 2014 BlackRock Inc 9.52%18 November 2014 Hal Trust 15.01%13 November 2014 Templeton Funds 3.30%18 September 2014 Invesco Ltd. 5.93%10 July 2014 JO Hambro Capital
Management Ltd3.07%
As per 31 December 2014, 209,695,094 (2013: 208,747,188) ordinary shares are issued. No preference shares havebeen issued.
General Meeting of Shareholders
Every year the GM shall be held within six months after the start of a new calendar year. The agenda for this meetingshall include the following standard items: (i) the report of the Management Board concerning the Company's affairs andthe management as conducted during the previous financial year, (ii) the report of the Supervisory Board and itscommittees, (iii) the adoption of the Company’s Financial Statements, the allocation of profits and the approval of thedividend, (iv) the discharge of the Management Board and of the Supervisory Board, (v) Corporate Governance, (vi) thedelegation of authority to issue shares and to restrict or exclude pre-emptive rights, (vii) the delegation of authority topurchase own shares and (viii) the composition of the Supervisory Board and of the Management Board. In addition,certain specific topics may be put on the agenda by the Supervisory Board.
An Extraordinary GM can be held whenever the Management Board and/or the Supervisory Board shall deem thisnecessary.
The GM can be held in Schiedam, Rotterdam, The Hague, Amsterdam or Haarlemmermeer (Schiphol).
Agenda of the Meeting
Proposals of persons who are entitled to attend the shareholders meetings will only be included in the agenda if suchproposal is made in writing to the Management Board not later than sixty (60) days before that meeting. The proposalscan be made by persons who are entitled to attend GMs, solely or jointly representing shares amounting to at least 1% ofthe issued share capital.
Notice to convene a Meeting
The notice for the AGM was published within the required time electronically on the Company website and onwww.abnamro.com/evoting. Publication of the agenda was announced in a press release.
Responsibility of Shareholders
In accordance with best practice IV.4.4. of the Corporate Governance Code, a shareholder shall exercise the right ofputting an item on the agenda only after having consulted the Management Board. If one or more shareholders intend torequest that an item be put on the agenda that may result in a change in the Company’s strategy, e.g. through thedismissal of one or more members of the Management Board or of the Supervisory Board, the Management Board shallbe given the opportunity to stipulate a reasonable response period, which may not exceed 180 days. The ManagementBoard shall use the response time for further deliberation and constructive consultation under the monitoring of theSupervisory Board and shall closely involve the Supervisory Board in this process.
Attendance and Voting Rights at the Meeting
SBM Offshore N.V. 2014 Annual Report 111
With reference to the articles of association, all Shareholders are entitled to attend the GM, to address the GM and tovote. At the GM each Ordinary Share with a nominal value of EUR 0.25 each shall confer the right to cast one (1) vote.Each protective preference share with a nominal value of EUR 0.25 each shall confer the right to cast one (1) vote, whenissued. None of the protective preference shares have been issued to date. Unless otherwise required by the law andarticles of association all resolutions shall be adopted by an absolute majority of votes.
The Corporate Governance Code’s principles also require that proxy voting means are made available, with the intentionof maximising shareholder participation in GMs of the Company. The proxy voting system used at the AGM is providedthrough ABN Amro and SGG Financial Services B.V. as independent third party.
At the AGM of 17 April 2014, 102,936,084 ordinary shares participated in the voting, equal to 49,31% (2013: 55.71%) ofthe then total outstanding share capital of 208,747,188 ordinary shares.
All the proposed resolutions were approved with a vast majority of the votes. The outcome of the voting was posted onthe Company’s website on the day following the AGM.
Articles of Association
Issue of SharesThe GM or the Management Board if authorised by the GM and with the approval of the Supervisory Board may resolveto issue shares; as long as the Management Board is authorised to issue shares, the GM may not pass a resolution toissue shares.
The GM or the Management Board, subject to the approval of the Supervisory Board, shall set the price and furtherconditions of issue, with due observance of the provisions contained in the articles of association. Shares shall never beissued below par, except in the case as referred to in section 80, subsection 2, Book 2, of the Dutch Civil Code.
If the Management Board has been designated as the body authorised to issue shares the number and the class ofshares must be specified in such designation. Upon such designation the duration of the designation shall be set, whichshall not exceed five years. The designation may be extended, from time to time, for periods not exceeding five years.Unless such designation provides otherwise, it may not be withdrawn. A resolution of the GM to issue shares or todesignate the Management Board as being authorised to issue shares, shall be valid only if accompanied by a prior orsimultaneous resolution of approval by each group of shareholders of the same class whose rights are prejudiced by theissue. Although the duration of the designation as provided by law may be a maximum of five years, the Companyadheres to the good practice of limiting this duration to eighteen months. At the AGM of 17 April 2014, the shareholdershave delegated to the Management Board for a period of eighteen months and subject to the approval of the SupervisoryBoard, the authority to issue ordinary shares up
to 10% of the total outstanding shares at that time. In case of Mergers or Acquisitions this percentage is increased to20%. In the same meeting, the shareholders have delegated the authority to the Managing Directors for a period ofeighteen months as from 17 April 2014 and subject to the approval of the Supervisory Board to restrict or withdrawpreferential rights of the shareholders in respect of ordinary shares when ordinary shares are being issued. At the AGMof 15 April 2015, a similar proposal to authorise the Management Board to issue shares will be submitted to shareholdersfor approval.
Repurchase of own Shares
The Management Board may, with the authorisation of the GM and the Supervisory Board and without prejudice to theprovisions of sections 98 and sections 98d, Book 2, Dutch Civil Code and the articles of association cause the Companyto acquire fully paid up shares in its own capital for valuable consideration. The Management Board may resolve, subjectto the approval of the Supervisory Board, to dispose of shares acquired by the company in its own capital. Nopre-emption right shall exist in respect of such disposal.
SBM Offshore N.V. 2014 Annual Report 112
At the AGM of 2014, the shareholders have delegated the authority to the Management Board for a period of eighteenmonths as from 17 April 2014 and subject to approval of the Supervisory Board, to acquire up to 10% of the totaloutstanding shares at that time. At the AGM of 2015, a similar proposal to authorise the Management Board torepurchase own shares will be submitted to shareholders for approval.
Amendment of the Articles of Association
The GM may adopt a resolution to amend the Articles of Association of the Company by an absolute majority of votescast, but solely upon the proposal of the Management Board subject to the approval of the Supervisory Board.
The Articles of Association are reviewed on a regular basis.
5.4.2 Appointment of the Auditor of SBM Offshore N.V.
At the AGM of 2012, KPMG Accountants N.V. was appointed as the auditor of SBM Offshore N.V. for a period expiring atthe closure of the accounting year 2013. In view of the new Dutch law on compulsory rotation of external auditors, theCompany started the selection process for a new external audit firm during the course of 2013. The outcome of theselection process was carried out under the direction of the Audit Committee to the Supervisory Board, which supportedthe recommendation of the Management Board to propose PricewaterhouseCoopers Accountants N.V. with MrW.Jansen as lead partner to the AGM in 2014 as the new external auditors of the Company for a period of four years.The Supervisory Board agreed with the recommendation and the appointment was approved by shareholders at theAGM of 2014.
5.4.3 Stichting Continuiteit SBM Offshore N.V.
A Foundation ‘Stichting Continuiteit SBM Offshore (the Foundation), has been established on 15 March 1988 with theobjective of using the voting power on any preference shares in the Company, which it may hold at any time, in the bestinterests of the Company and its stakeholders. The Foundation will perform its role, and take all actions required, at itssole discretion. In the exercise of its functions it will, however, be guided by the interests of the Company and thebusiness enterprises connected with it, and all other stakeholders, including shareholders and employees.
The Foundation is managed by a Board, the composition of which is intended to ensure that an independent judgmentmay be made as to the interests of the Company. The Board consists of a number of experienced and reputable formersenior executives of multinational companies. To be kept informed about the business and interest of the Company, theCEO and/or the CGCO is invited to attend the Foundation meetings to address this agenda item.
The Board of the Foundation consists of: Mr. R.P. Voogd, Chairman, a former notary and presently a lawyer, Mr. H.A.van Karnebeek, a former Vice-Chairman of the Management Board of Akzo, Mr. A.W. Veenman, a former CEO of theNederlandse Spoorwegen, Mr. C.J.M. van Rijn, a former CFO of Nutreco N.V. and Mr. R.H. Berkvens, CEO of DamenShipyard. Mr. B. Vree has been asked by the Foundation to join the Board effective 2015. Mr H.A. van Karnebeek willstep down at the end of 2015.
The Management Board, with the approval of the Supervisory Board at that time, has granted a call option to theFoundation to acquire a number of preference shares in the Company’s share capital, carrying voting rights, equal to onehalf of the voting rights carried by the ordinary shares outstanding immediately prior to the exercise of the option,enabling it effectively to perform its functions as it, at its sole discretion and responsibility, deems useful or desirable.
The option was granted on 30 March 1989. In accordance with the by-laws of the Company, shareholders were advisedof the reasons for granting this option in the Extraordinary GM of 28 April 1989.
In the same option agreement the Foundation granted a put option to the Company and the Company decided on 3
SBM Offshore N.V. 2014 Annual Report 113
March 2011 to definitively waive its rights under the put option. In the course of 2011, the option agreement wasamended and restated to reflect the waiver by the Company of its put option and the alignment of the nominal value ofthe protective preference shares with the nominal value of ordinary shares by reducing the nominal value of EUR 1 toEUR 0.25 and the related increase in the number of protective preference shares as per the amended articles ofassociation of the Company.
In the joint opinion of the Supervisory Board, the Management Board and the Foundation board members, theFoundation is independent as stipulated in clause 5:71 section 1 sub c Supervision Financial Market Act.
5.4.4 The European Directive on Take-Over Bids and Publication Requirements
To meet the publication requirement as mentioned in the Decree of 5 April 2006 relating to Article 10 of Directive2004/25/EC on take-over bids of 21 April 2004 of the European Parliament and the Council of the European Union, thefollowing information is provided:
The articles of association do not provide for any limitation of the transferability of the ordinary shares●
The voting right is not subject to any limitation●
The appointment, suspension and discharge of members of the Management Board and Supervisory Board are set out in this●
Corporate Governance section of this report
The procedure for alteration of the articles of association is mentioned in this Corporate Governance section of this report●
In the services agreement between the Company and each of the members of the Management Board a change of control clause is●
included. A severance payment amounting to no more than one year base salary will be paid if the employment contract would be
terminated due to a change of control by a public take-over bid unless this would be manifestly unreasonable in the case of a
termination during the first term of office in which case the amount payable could amount up to two years base salary at the most. The
Supervisory Board will have the discretionary power to settle the termination conditions
[SBM Offshore N.V. has a revolving credit facility of US$ 750 million under which the agreement of the participating banks must be●
obtained in the event of a change in control of the Company after a public take-over bid has been made]
Under exceptional circumstances, certain vessel charters contain clauses to the effect that the prior consent of the client is required in●
case of a change of control or merger or where the company resulting from such change of control or merger would have a lower
financial rating or where such change of control or merger would affect the proper execution of the contract. In addition, local bidding
rules and regulations (e.g.in Brazil for Petrobras) may require client approval for changes in control affecting the charter.
The Investor Relations Centre and the Corporate Governance section of the Company website
(www.sbmoffshore.com) provide extensive information including:
Articles of association●
Company code of conduct and Anti-Corruption and Compliance Guide●
Supervisory Board rules, including rules for the three committees of the Supervisory Board Supervisory Board profile and retirement●
schedule for its members
Management Board rules●
Rules for reporting of alleged irregularities of a general, operational or financial nature (‘Whistleblowing’ rules); these rules are●
designed to enable employees to report alleged irregularities without jeopardising their employment position and are also available on
the Company’s intranet site
Remuneration policy●
Regulations concerning inside information and the holding of and effecting transactions in shares and other financial instruments●
Agenda, minutes, resolutions and presentations given at previous GMs●
SBM Offshore N.V. 2014 Annual Report 114
6 Financial Report 20146.1 Company Overview and Financial Review
6.1.1 2014 Company Overview
Introduction
Projects under construction progressed to plan in 2014, delivering FPSOs Cidade de Ilhabela and N’Goma FPSO to theirrespective clients following systems acceptance. Sound financial results, steady Directional1 revenue growth, continuedreliable operational performance and a near record backlog point to sustained progress of the turnaround commenced in2012. The transformation continues as the Company focuses its attention to delivering three FPSO projects by mid-2016and completing the business improvement initiatives.
Notwithstanding the ongoing investigations by authorities in Brazil, a major milestone was reached when the Companyannounced a US$240 million out-of-court settlement with the Dutch Public Prosecutor’s Office.
The FPSO Turritella Operations and Maintenance contract was signed in May and Encana agreed to a settling of claimsarising from the Deep Panuke project offshore Nova Scotia. Through the corporate and project financing activitiescompleted during the course of the year, the financial position of the Company is markedly strengthened.
Consistent with the Company’s strategy to focus on its core business and to further strengthen its financial position, thesale and leaseback of the Monaco real estate portfolio was completed and the all cash sale of the Diving Support andConstruction Vessel (DSCV) SBM Installer was announced and closed. SBM Offshore was also successful in securingthree financings and signing the renewal of its Revolving Credit Facility in 2014. A US$400 million bridge loan for thefinancing of the Deep Panuke platform was secured in May. In August project financing was secured for FPSO Cidadede Maricá totalling US$1.45 billion from a consortium of international banks at a weighted average cost of debt of 5.3%.In early November, the Company refinanced the US$400 million bridge loan for the Deep Panuke Production FieldCentre when it announced the completion of US$450 million of non-recourse senior secured debt by way of a USPP. The3.5% fixed coupon bond is rated BBB- / BBB (low) by Fitch and DBRS respectively and carries a 7 year maturity. Theadditional liquidity and greater financial flexibility have further improved the Company’s risk profile for securing fundingfor future projects.
Lastly, a review of strategic alternatives regarding balance sheet optimisation announced at the Capital Markets Day inSeptember was completed in November. The Management Board, with the endorsement of the Supervisory Board,intends to pursue the development of a master limited partnership (MLP). The anticipated offering is subject to marketconditions.
HSSE
SBM Offshore deeply regretted to have to report two fatalities of yard contractor staff on construction projects inSingapore. Root cause analysis has been carried out and appropriate measures have been put into effect at thecontractor facilities.
The Company achieved a much improved safety performance in 2014 thanks to the focused drive, commitment andinvolvement of its employees. Total Recordable Injury Frequency Rate (TRIFR) improved 45% to 0.22 compared to 0.40in 2013, while the Lost Time Injury Frequency Rate (LTIFR) improved by 66% to 0.05 in 2015 from 0.15 from 2013.
Furthermore, the environmental performance of the Group has also improved compared to last year, with 13% lessGreen House Gas emissions per hydrocarbon production offshore compared to 2013, 9% less energy consumption and17% less oil discharged from produced water offshore compared to 2013.
SBM Offshore N.V. 2014 Annual Report 115
Compliance
On November 12, 2014, SBM Offshore reached a US$240 million out-of-court settlement with the Dutch PublicProsecutor’s Office over the inquiry into alleged improper payments. Furthermore, the United States Department ofJustice informed the Company that it would not prosecute and has closed its inquiry into the matter. The settlementagreement with the Openbaar Ministerie and the United States Department of Justice’s decision relate to payments tosales agents in Equatorial Guinea, Angola and Brazil in the period from 2007 through 2011. The main reason for theauthorities to agree to an out-of-court settlement is related to the comprehensive remedial actions taken by the newManagement Board since taking office in 2012.
The investigation of the Dutch Public Prosecutors Office established, through means inaccessible to SBM Offshore, thatpayments were made from the Company’s Brazilian sales agent’s offshore entities to Brazilian government officials. As aresult, SBM Offshore is a party in a number of investigations in Brazil, notably by the Federal Prosecutor, the FederalAccounts Tribunal and the Comptroller General’s Office, who recently confirmed in writing to the Company that they haveopened an investigation. The Company continues to cooperate with all requests for information and is in active dialoguewith the Brazilian Comptroller General’s Office in order to come to an agreement to close the matter in Brazil.
Management confirms that it is not aware of any authorities outside of Brazil investigating SBM Offshore.
Investing in Our Future
Costs associated with research and development focused investments and the Odyssey24 programme came to US$63million in 2014, representing a year-on-year increase of US$37 million. The programmes’ focus on step changes indesign, execution, project and supply chain management, allowing the Company to deliver its projects faster whilereducing project costs by at least 5% per project. The programmes continue into 2015 and once completed is expectedto benefit from a quick payback on new contract awards.
Divestment Update
In August the Company announced the completion of the sale and leaseback of its Monaco real estate portfolio. The lastof three buildings was sold for approximately US$62 million net of expenses, resulting in a book profit of approximatelyUS$58 million. This was in addition to the December 2013 announced sale and leaseback transactions for two of thethree buildings with sales proceeds exceeding US$100 million and resulting in a book profit of approximately US$30million. Total proceeds, net of expenses, resulting from the transactions are in excess of US$162 million with a total bookprofit of approximately US$88 million.
In early December, SBM Offshore announced the US$150 million all cash sale of the DSCV SBM Installer to OS InstallerAS. The Company confirmed in mid-December that OS Installer AS, a newly established Joint Venture between OceanYield (75%) and SBM Offshore (25%), secured bank financing and that the transaction had closed. Net of the retainedequity interest in the Joint Venture, the Company received US$140 million in proceeds.
FPSO Brasil and VLCC Alba remain held for sale.
Year-End Update
In the December 17, 2014 year-end update press release, SBM Offshore announced the reduction of the useful life ofthe Deep Panuke Production Field Centre to eight years, in line with the fixed contract period. This adjustment resulted ina non-cash impairment charge of approximately US$59 million. The eight-year firm contract revenue is not affected bythe announcement.
In addition, the Company announced a one-off impairment charge (non-cash) of US$49 million related to a financialasset following a dispute with a US-based client, as well as the decision to make an additional provision for warranties atyear end of US$40 million.
SBM Offshore N.V. 2014 Annual Report 116
Supervisory Board
Following the completion of Chairman H.C. Rothermund’s third term on the Supervisory Board, he will resign at theCompany's Annual General Meeting of Shareholders on April 15, 2015. SBM Offshore’s Supervisory Board has decidedto appoint F.J.G.M. Cremers, currently Vice Chairman, as Chairman as of that date. T.M.E. Ehret will simultaneously beappointed as Vice Chairman replacing Mr. Cremers.
Outlook and Guidance 2015
The Company is providing 2015 Directional1revenue guidance of at least US$2.2 billion, of which US$1.0 billion isexpected in the Turnkey segment and US$1.2 billion in the Lease and Operate segment. Proportional net debt guidanceis being introduced for FY2015. The Company expects to end the year with proportional net debt below US$3.5 billion.Guidance is based on Management’s conservative award assumptions in light of the current macro environment.
Dividend
The Management Board reiterates that the Company will not pay a dividend over 2014, in view of the losses incurred inrecent years and the desire to continue strengthening the balance sheet. The Management Board intends to present, atthe Annual General Meeting (AGM) in April 2015, a change of dividend policy from the existing policy of paying out 50%of IFRS net income. Under the new dividend policy, the proposed payout ratio would be between 25% and 35% ofDirectional1net income subject to the availability of sufficient free cash flow in the year of payment.
[1]Directional view is a non-IFRS disclosure, which assumes all lease contracts are classified as operating leases and all vessel joint venturesare proportionally consolidated.
6.1.2 Financial Review
IFRS 10, 11 & 12
New consolidation standards for joint ventures (JVs) have been introduced as of January 1, 2014 ending proportionalconsolidation of JVs for SBM Offshore. As disclosed in its 2013 Annual Report, the Company is now required to accountfor its fully controlled JVs on a fully consolidated basis (mostly impacting all Brazilian FPSOs) and apply equityaccounting to the Company’s jointly controlled JVs (mostly impacting all Angolan FPSOs). All 2013 income statement,statement of financial position, cash flow statement comparatives figures and key indicators presented in the financialreport were restated for the introduction of these new standards.
On balance, this implementation has a limited impact on the Company’s IFRS revenue as the additionally reportedpartner share in the fully consolidated ventures is offset by the exclusion of revenue in the equity accounted ventures andalmost nil to net income attributable to shareholders. However, the Company’s reported total asset value at year-end2013 has increased significantly (approximately US$1.6 billion) as the now fully consolidated Brazilian assets areyounger and represent a larger portion of the balance sheet. A similar effect is visible at the gross debt level, increasingfrom US$2.9 billion to US$3.6 billion.
As this change of consolidation rules under IFRS further complicates the understanding of the Company’s performance,effective January 1, 2014, Directional1reporting principles were amended and stand as follows:
Directional1reporting represents an additional non-GAAP disclosure to IFRS reporting●
Directional1reporting assumes all lease contracts are classified as operating leases●
Directional1reporting assumes all JVs related to lease contracts are consolidated on a proportional basis●
All other accounting principles remain unchanged compared to applicable IFRS standards●
SBM Offshore N.V. 2014 Annual Report 117
All 2013 Directional1income statement comparative figures presented in the financial report were restated for introductionof these new consolidation rules.
As Directional1reporting better reflects of the performance of the Company’s segments and drives key decisions taken bythe Management Board, the segmental information has been provided under Directional1reporting principles as part ofthe financial statements, and reviewed by the Company’s auditors.
Highlights
Directional1consolidated net income for 2014 came in at US$84 million versus a net loss of US$58 million in 2013. Thisresult includes divestment profits and other non-recurring items which generated a net loss of US$265 million in 2014compared to US$433 million in 2013. Excluding divestment profits, and other non-recurring items, 2014 underlyingconsolidated Directional1net income attributable to shareholders stood at US$349 million, a slight decrease from US$375million in the year-ago period.
Reported consolidated 2014 IFRS net income was US$652 million versus US$175 million in 2013. IFRS net incomeattributable to shareholders amounts to US$575 million compared to US$114 million in 2013.
Directional1earnings per share (EPS) in 2014 amounted to US$0.40 compared to a loss of US$0.28 per share in 2013.Adjusted for divestment profits and other non-recurring items, underlying Directional1EPS decreased 9% year-on-year toUS$1.67 from US$1.84 in 2013.
IFRS Net Debt at the year-end totalled US$4,775 million versus US$3,400 million in 2013. All bank covenants were metand available cash and undrawn committed credit facilities stood at US$1,987 million.
Order intake for year totalled US$3,124 million, a 77% / 23% split between the Lease and Operate and Turnkeysegments respectively. This compares to US$9,990 million achieved in 2013.
Directional1 revenue increased by 5% to US$3,545 million compared to US$3,373 million in the year-ago period. IFRSrevenue increased 20% to US$5,482 million versus US$4,584 million in 2013. This was mainly attributable higherTurnkey segment revenues.
Directional1backlog at the end of 2014 remained high at US$21.8 billion compared to US$22.2 billion at the end of 2013.This reflects the reduced level of order intake in 2014 and a Lease and Operate portfolio consisting of US$20.6 billion atyear-end.
Directional1EBITDA amounted to US$486 million, representing a 7% decrease compared to US$520 million in 2013. Thisfigure includes non-recurring items totalling US$157 million.
IFRS EBITDA amounted to US$925 million, representing a 56% increase compared to US$592 million in 2013. Thisfigure includes non-recurring items totalling US$163 million.
Directional1EBIT increased to US$201 million after divestment profits and non-recurring items of US$236 million. Thiscompares to US$63 million in 2013 which included US$437 million of non-recurring items including charges related to theYme and Deep Panuke projects.
IFRS EBIT increased to US$726 million after impairment charges, divestment profits and non-recurring items of US$227million. This compares to 2013 EBIT of US$188 million, which included US$436 million of non-recurring items includingcharges related to the Yme and Deep Panuke projects.
The year was marked by the following financial highlights:
Order intake of US$3.1 billion maintaining the Directional1backlog to a high level of US$21.8 billion●
On November 12, 2014 an out-of-court settlement was reached with the Dutch Public Prosecutor’s Office (Openbaar Ministerie) over●
SBM Offshore N.V. 2014 Annual Report 118
the investigation into potentially improper sales payments. Furthermore, the US Department of Justice informed the Company it would
not be prosecuted and closed its inquiry into the matter. This out-of-court settlement consists of a payment by the Company to the
Openbaar Ministerie of US$240 million. Payments will be in made in three instalments, the first of which US$100 million was paid at
the time of the announcement. Two further instalments of US$70 million each will be due on December 1, 2015 and 2016 respectively
A Production Handling Agreement (PHA) was signed with Noble Energy to produce the Big Bend and Dantzler fields to the Thunder●
Hawk DeepDraftTMSemi in the US Gulf of Mexico. Production fees associated with produced volumes are estimated to lead up to
projected revenue of US$400 million to be delivered over the ten year primary contract period. Based on new projected production
reserves combined with projections from existing fields, total deliverable volumes will allow the asset’s current book value to be
sustained and reverse the full US$109 million of previous years’ impairments
The Company has chosen to reduce the useful life of the Deep Panuke Production Field Centre from ten to eight years in line with the●
fixed contract period. This adjustment resulted in a non-cash impairment charge of approximately US$59 million
As a result of a contractual dispute, the Company recorded a one-off non-cash impairment charge of US$49 million related to a●
financial asset following a dispute with a US-based client
Following the remediation of some technical issues under warranty, the decision was taken to incur an additional US$40 million●
provision for warranties at year-end
With the contract for FPSO Marlim Sulset to expire at the end of June 2015, upon completion of vessel decommissioning, the●
Company has reassessed the carrying value of the FPSO. This undertaking has resulted in an impairment charge of US$15 million
Late November 2014 marked the announcement of FPSO Cidade de Ilhabela being formally on hire after achieving first oil. Following●
the announcement an upfront payment of US$145 million was received on December 31, 2014 in accordance with the contract. The
unit will operate under a twenty year charter and operate contract with Petrobras S.A., and the FPSO is owned and operated by a joint
venture formed by SBM Offshore (62.25%), QCOG, and Mitsubishi Corporation
N’Goma FPSO began oil production and went on hire in late November. Formal Production Readiness Notice was received from the●
client Eni in mid-January 2015 going into effect retroactively to late November. The unit is owned by Sonasing, a joint venture
consisting of SBM Offshore (50%), Sonangol and Angola Offshore Services Limitada (AOSL). The vessel will be operated by OPS, a
joint venture company formed by SBM Offshore (50%) and Sonangol (50%), for twelve years
The divestment of the non-core Monaco real estate portfolio was completed in August. The last of three buildings was sold for●
approximately US$62 million net of expenses, resulting in a book profit of approximately US$58 million. This was in addition to the
December 2013 announced sale and leaseback transactions for two of the three buildings with sales proceeds exceeding US$100
million and resulting in a book profit of approximately US$30 million. Total proceeds, net of expenses, resulting from the transactions
are in excess of US$162 million with a total book profit of approximately US$88 million
In early December, SBM Offshore announced the US$150 million all cash sale of the DSCV SBM Installer to OS Installer AS. The●
Company agreed to charter the vessel under a long-term bareboat charter for a fixed period of twelve years while maintaining the
option to acquire the vessel during the charter period, with the first option exercisable after five years. The Company further confirmed
in mid-December that OS Installer AS, a new established Joint Venture between Ocean Yield (75%) and SBM Offshore (25%),
secured bank financing and that the transaction had closed. Net of the retained equity interest in the Joint Venture, the Company
received US$140 million in proceeds
Capital expenditure and investments in finance leases amounted to US$2,396 million in 2014, which exceeded 2013 levels of●
US$1,792 million. The increase is primarily attributable to a full fiscal year of investments in the current projects under construction
Revolving Credit Facility (RCF) renewal was signed mid-December with maturity on January 30, 2020 securing liquidity of up to●
US$1.0 billion. The RCF’s maturity can be extended with two additional one year extension options. The facility was secured with a
select group of thirteen core relationship banks and replaced the existing facility of US$750 million that was due to expire in mid-2015
New project financing agreements totaling US$ 1.9 billion were put in place. This includes project financing for FPSO Cidade de●
Maricá totalling US$1.45 billion from a consortium of international banks, and the US$450 million of non-recourse senior secured debt
by way of a US Private Placement for the Deep Panuke Production Field Centre
Cash and undrawn committed credit facilities amounted to US$2.0 billion at the end of December 2014 compared to US$1.4 billion in●
2013.
Fiscal year 2014 segmental information regarding the two core business segments of the Company is provided in thedetailed financial analysis section of the press release. Revenue by geography is also included in the notes to theFinancial Statements.
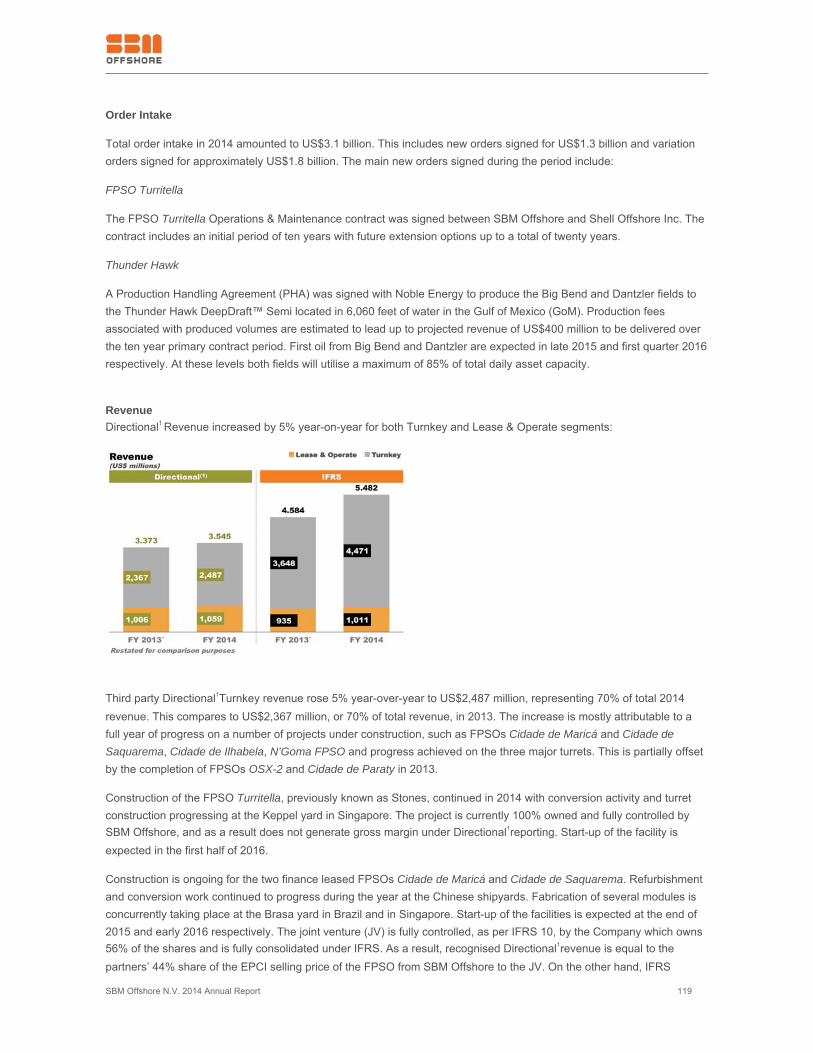
SBM Offshore N.V. 2014 Annual Report 119
Order Intake
Total order intake in 2014 amounted to US$3.1 billion. This includes new orders signed for US$1.3 billion and variationorders signed for approximately US$1.8 billion. The main new orders signed during the period include:
FPSO Turritella
The FPSO Turritella Operations & Maintenance contract was signed between SBM Offshore and Shell Offshore Inc. Thecontract includes an initial period of ten years with future extension options up to a total of twenty years.
Thunder Hawk
A Production Handling Agreement (PHA) was signed with Noble Energy to produce the Big Bend and Dantzler fields tothe Thunder Hawk DeepDraft™ Semi located in 6,060 feet of water in the Gulf of Mexico (GoM). Production feesassociated with produced volumes are estimated to lead up to projected revenue of US$400 million to be delivered overthe ten year primary contract period. First oil from Big Bend and Dantzler are expected in late 2015 and first quarter 2016respectively. At these levels both fields will utilise a maximum of 85% of total daily asset capacity.
RevenueDirectional1 Revenue increased by 5% year-on-year for both Turnkey and Lease & Operate segments:
Third party Directional1Turnkey revenue rose 5% year-over-year to US$2,487 million, representing 70% of total 2014revenue. This compares to US$2,367 million, or 70% of total revenue, in 2013. The increase is mostly attributable to afull year of progress on a number of projects under construction, such as FPSOs Cidade de Maricá and Cidade deSaquarema, Cidade de Ilhabela, N’Goma FPSO and progress achieved on the three major turrets. This is partially offsetby the completion of FPSOs OSX-2 and Cidade de Paraty in 2013.
Construction of the FPSO Turritella, previously known as Stones, continued in 2014 with conversion activity and turretconstruction progressing at the Keppel yard in Singapore. The project is currently 100% owned and fully controlled bySBM Offshore, and as a result does not generate gross margin under Directional1reporting. Start-up of the facility isexpected in the first half of 2016.
Construction is ongoing for the two finance leased FPSOs Cidade de Maricá and Cidade de Saquarema. Refurbishmentand conversion work continued to progress during the year at the Chinese shipyards. Fabrication of several modules isconcurrently taking place at the Brasa yard in Brazil and in Singapore. Start-up of the facilities is expected at the end of2015 and early 2016 respectively. The joint venture (JV) is fully controlled, as per IFRS 10, by the Company which owns56% of the shares and is fully consolidated under IFRS. As a result, recognised Directional1revenue is equal to thepartners’ 44% share of the EPCI selling price of the FPSO from SBM Offshore to the JV. On the other hand, IFRS
SBM Offshore N.V. 2014 Annual Report 120
revenue recognition is instead based 100% on the fair value of the lease and on a percentage of completion basis.
FPSO Cidade de Ilhabela has been formally on hire, after achieving first oil and completing a 72 hour continuousproduction test leading to Production Acceptance Notice (PAN), since late November 2014. The vessel operates under atwenty year charter and operate contract with Petrobras S.A. on the Sapinhoá field development in the Brazilian pre-salt.The JV is fully controlled, as per IFRS 10, by the Company which owns 62.25% of the shares and is fully consolidatedunder IFRS. As a result, recognised Directional1 revenue is equal to the partners’ 37.75% share of the EPCI selling priceof the FPSO from SBM Offshore to the JV. On the other hand, IFRS revenue recognition is instead based 100% on thefair value of the lease.
N’Goma FPSO began production and went on hire in late November 2014. Full systems acceptance by the client wasachieved in January 2015 with the issuance of the Production Readiness Notice, which is retroactive to November 28,2014. The twelve-year lease contract with Eni is also accounted for as a finance lease under IFRS. The joint ventureowning the FPSO is jointly controlled as per IFRS 10 by the Company, which owns 50% of the shares, and isconsolidated through the equity method under IFRS. Directional1revenue during construction is equal to the partners’50% share of the EPCI selling price of the FPSO to the JV. On the other hand, IFRS revenue reflects 100% of the EPCIselling price of the FPSO from the Company to the JV.
Total Directional1 Lease and Operate revenue increased by 5% to US$1,059 million. The accounted for 30% of totalrevenue contribution in 2014, a similar split to 2013. The increase in segment revenue is attributable to the start-up ofFPSOs Cidade de Ilhabela and N’Goma FPSO in November 2014 and a full year of operations for FPSO Cidade deParaty. This was partially offset by the decommissioning from the fleet of FPSOs Kuitoand Brasilin 2014.
Total IFRS revenue rose significantly in the year, up 20% to US$5,482 million due to much higher revenue recognised inthe Turnkey segment. This was mostly due to the strong contribution of the finance lease contracts under constructionsuch as FPSOs Turritella, Cidade de Maricá, Cidade de Saquarema, Cidade de Ilhabela and the sale of N’Goma FPSO.
Project Review
N’Goma FPSO (Angola)
The construction, refurbishment, and module work at Keppel Singapore was completed in early May 2014. A successfullifting campaign at the Paenal yard in Port Amboim, Angola, was completed in July and the vessel set sail to the offshoresite where mooring, hook-up operations and acceptance testing was completed. Formal Production Readiness Noticewas received in early January 2015 going into effect retroactively to late November. The vessel is producing and on-hiregenerating dayrate.
FPSO Cidade de Ilhabela (Brazil)
Following completion of refurbishment and conversion at the Chinese yard at the end of 2013, construction continued forthe finance leased vessel during the first half of 2014 in Brazil where the process modules were successfully installed atthe Brasa yard. The FPSO includes topside facilities able to process 150,000 bpd of production fluids for export,including the substantial volumes of associated gas from the pre-salt field. The vessel has officially been on-hire sinceNovember 2014.
FPSO Cidade de Maricá and Cidade de Saquarema (Brazil)
Construction is ongoing for the two finance leased vessels. Refurbishment and conversion work progressed during thefirst half of 2014 at a Chinese yard. The charter contract for both vessels includes an initial period of 20 years withextension options. The two double-hull sister vessels will be moored in approximately 2,300 meters of water depth andpossess a storage capacity of 1.6 million barrels each. The topside facilities of each FPSO weigh approximately 22,000tons, will be able to produce 150,000 bpd of well fluids and have associated gas treatment capacity of 6,000,000 Sm3/d.The water injection capacity of the FPSOs will be 200,000 bpd each.
SBM Offshore N.V. 2014 Annual Report 121
FPSO Turritella (US Gulf of Mexico)
Construction on the FPSO previously known as Stones continued for the finance leased vessel in the first half of theyear, with refurbishment and conversion work continuing at Keppel Singapore. The charter contract includes an initialperiod of 10 years with extension options up to a total of 20 additional years. In May 2014, the Operations & Maintenancecontract was signed with Shell Offshore Inc. When installed at almost 3 kilometers of water depth, the FPSO Turritellawillbe the deepest offshore production facility of any type in the world. The vessel is a typical Generation 2 design, with adisconnectable internal turret and processing facility capacity of 60,000 barrels of oil per day (bpd) and 15 mmscfd of gastreatment and export.
FPSO Marlim Sul (Brazil)
Successful end of production of the vessel was completed in December. After over ten years of operations for Petrobrasin Brazil. Decommissioning activities have commenced and are expected to be completed during the second quarter of2015.
FPSO Kikeh (Malaysia)
SBM Offshore and its joint venture partner MISC Bhd achieved a key milestone with the start-up of the Siakap NorthPetai (SNP) field through a tie-back to the Kikeh FPSO.
The SNP field, a unitised development operated by Murphy Sabah Oil Co.,Ltd (Murphy), is located offshore Malaysia inwater depth of approximately 1,300 metres. Murphy announced first oil production from the SNP field on February 27,2014.
The event is an important milestone for a project that commenced in January 2012 at SBM Offshore’s Kuala Lumpuroffice and involved the fabrication and offshore lifting of four new modules and approximately 340,000 man-hours ofoffshore construction and commissioning work done on a live FPSO.
Turret Mooring Systems
The three large, complex turrets for Prelude FLNG, Quad 204 and Ichthys are progressing, in close consultation with therespective clients, on schedule according to their respective stages of project completion. Fabrication work on PreludeFLNG is nearing completion in Dubai, while the integration of the Quad 204 Turret with the vessel continues in SouthKorea, with expected delivery in early 2015. Engineering and procurement for the Ichthys turret has been completedwhile fabrication continues to progress at the yard in Singapore, with expected delivery in the second half of 2015.
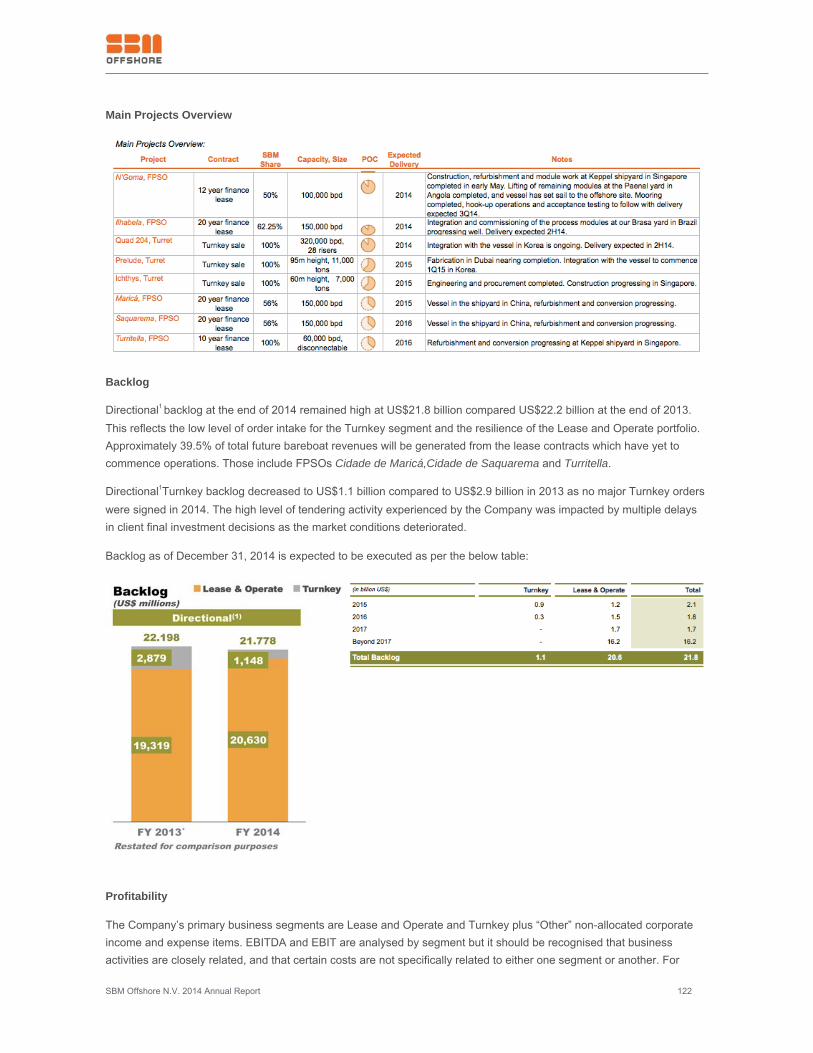
SBM Offshore N.V. 2014 Annual Report 122
Main Projects Overview
Backlog
Directional1 backlog at the end of 2014 remained high at US$21.8 billion compared US$22.2 billion at the end of 2013.This reflects the low level of order intake for the Turnkey segment and the resilience of the Lease and Operate portfolio.Approximately 39.5% of total future bareboat revenues will be generated from the lease contracts which have yet tocommence operations. Those include FPSOs Cidade de Maricá,Cidade de Saquarema and Turritella.
Directional1Turnkey backlog decreased to US$1.1 billion compared to US$2.9 billion in 2013 as no major Turnkey orderswere signed in 2014. The high level of tendering activity experienced by the Company was impacted by multiple delaysin client final investment decisions as the market conditions deteriorated.
Backlog as of December 31, 2014 is expected to be executed as per the below table:
Profitability
The Company’s primary business segments are Lease and Operate and Turnkey plus “Other” non-allocated corporateincome and expense items. EBITDA and EBIT are analysed by segment but it should be recognised that businessactivities are closely related, and that certain costs are not specifically related to either one segment or another. For
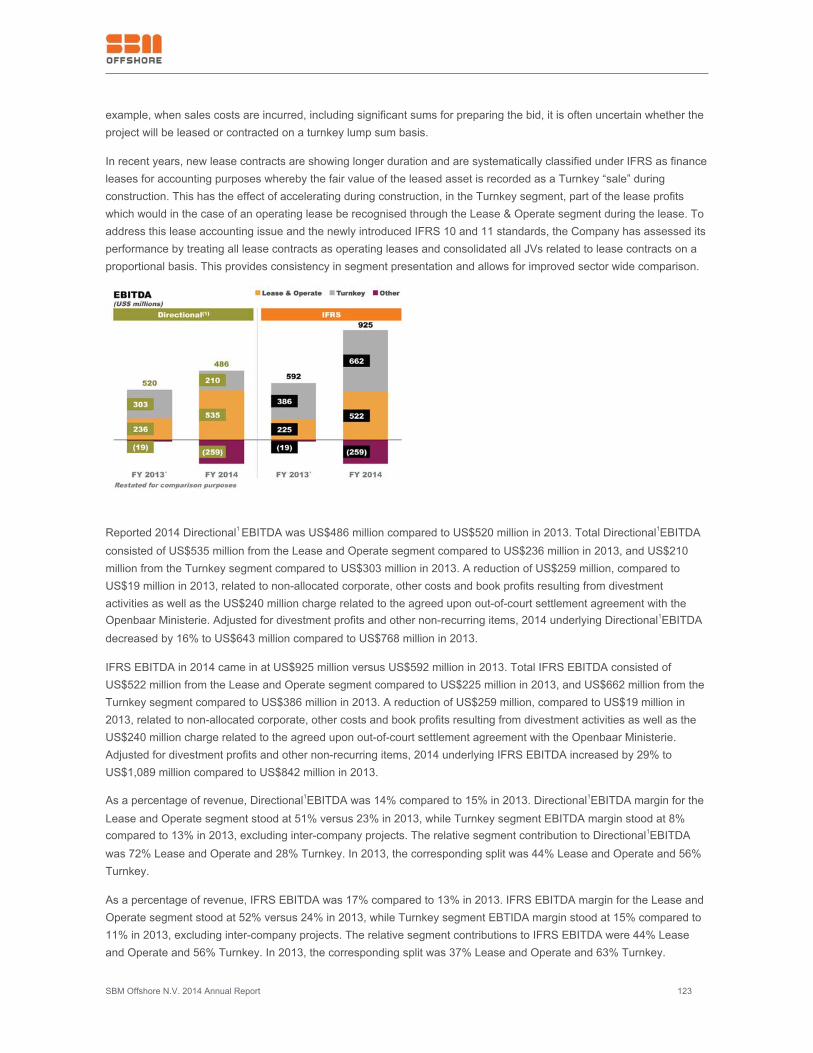
SBM Offshore N.V. 2014 Annual Report 123
example, when sales costs are incurred, including significant sums for preparing the bid, it is often uncertain whether theproject will be leased or contracted on a turnkey lump sum basis.
In recent years, new lease contracts are showing longer duration and are systematically classified under IFRS as financeleases for accounting purposes whereby the fair value of the leased asset is recorded as a Turnkey “sale” duringconstruction. This has the effect of accelerating during construction, in the Turnkey segment, part of the lease profitswhich would in the case of an operating lease be recognised through the Lease & Operate segment during the lease. Toaddress this lease accounting issue and the newly introduced IFRS 10 and 11 standards, the Company has assessed itsperformance by treating all lease contracts as operating leases and consolidated all JVs related to lease contracts on aproportional basis. This provides consistency in segment presentation and allows for improved sector wide comparison.
Reported 2014 Directional1 EBITDA was US$486 million compared to US$520 million in 2013. Total Directional1EBITDAconsisted of US$535 million from the Lease and Operate segment compared to US$236 million in 2013, and US$210million from the Turnkey segment compared to US$303 million in 2013. A reduction of US$259 million, compared toUS$19 million in 2013, related to non-allocated corporate, other costs and book profits resulting from divestmentactivities as well as the US$240 million charge related to the agreed upon out-of-court settlement agreement with theOpenbaar Ministerie. Adjusted for divestment profits and other non-recurring items, 2014 underlying Directional1EBITDAdecreased by 16% to US$643 million compared to US$768 million in 2013.
IFRS EBITDA in 2014 came in at US$925 million versus US$592 million in 2013. Total IFRS EBITDA consisted ofUS$522 million from the Lease and Operate segment compared to US$225 million in 2013, and US$662 million from theTurnkey segment compared to US$386 million in 2013. A reduction of US$259 million, compared to US$19 million in2013, related to non-allocated corporate, other costs and book profits resulting from divestment activities as well as theUS$240 million charge related to the agreed upon out-of-court settlement agreement with the Openbaar Ministerie.Adjusted for divestment profits and other non-recurring items, 2014 underlying IFRS EBITDA increased by 29% toUS$1,089 million compared to US$842 million in 2013.
As a percentage of revenue, Directional1EBITDA was 14% compared to 15% in 2013. Directional1EBITDA margin for theLease and Operate segment stood at 51% versus 23% in 2013, while Turnkey segment EBITDA margin stood at 8%compared to 13% in 2013, excluding inter-company projects. The relative segment contribution to Directional1EBITDAwas 72% Lease and Operate and 28% Turnkey. In 2013, the corresponding split was 44% Lease and Operate and 56%Turnkey.
As a percentage of revenue, IFRS EBITDA was 17% compared to 13% in 2013. IFRS EBITDA margin for the Lease andOperate segment stood at 52% versus 24% in 2013, while Turnkey segment EBTIDA margin stood at 15% compared to11% in 2013, excluding inter-company projects. The relative segment contributions to IFRS EBITDA were 44% Leaseand Operate and 56% Turnkey. In 2013, the corresponding split was 37% Lease and Operate and 63% Turnkey.
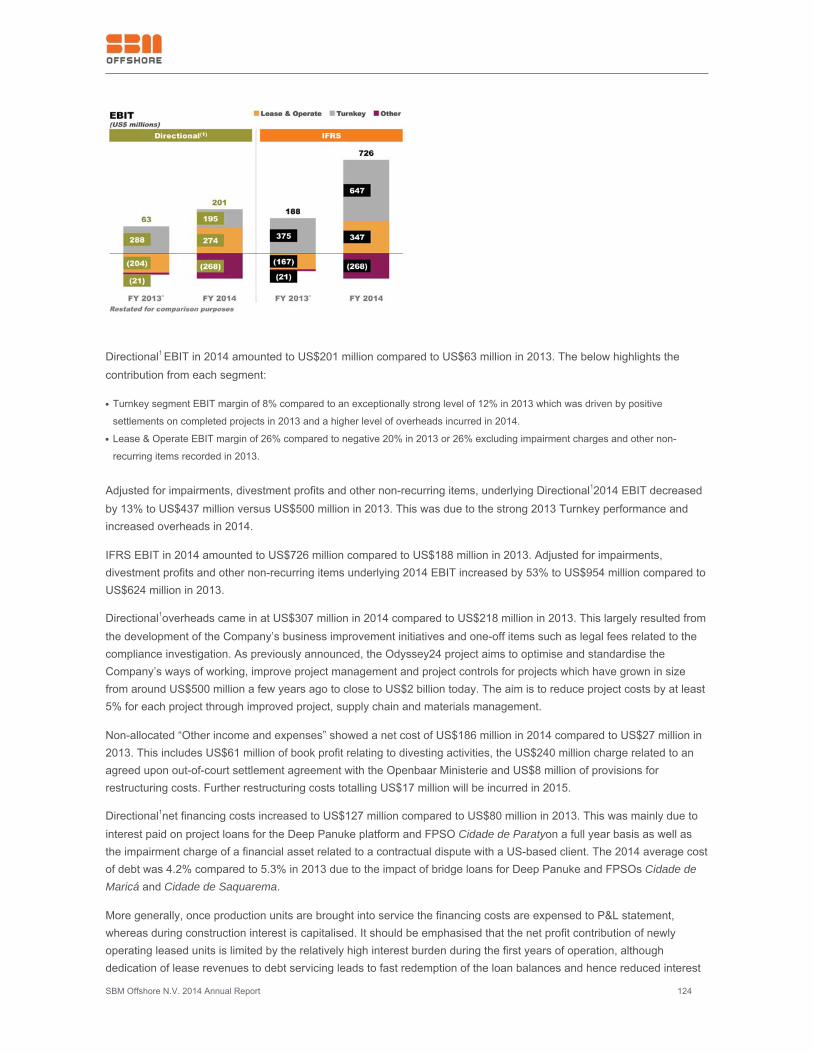
SBM Offshore N.V. 2014 Annual Report 124
Directional1 EBIT in 2014 amounted to US$201 million compared to US$63 million in 2013. The below highlights thecontribution from each segment:
Turnkey segment EBIT margin of 8% compared to an exceptionally strong level of 12% in 2013 which was driven by positive●
settlements on completed projects in 2013 and a higher level of overheads incurred in 2014.
Lease & Operate EBIT margin of 26% compared to negative 20% in 2013 or 26% excluding impairment charges and other non-●
recurring items recorded in 2013.
Adjusted for impairments, divestment profits and other non-recurring items, underlying Directional12014 EBIT decreasedby 13% to US$437 million versus US$500 million in 2013. This was due to the strong 2013 Turnkey performance andincreased overheads in 2014.
IFRS EBIT in 2014 amounted to US$726 million compared to US$188 million in 2013. Adjusted for impairments,divestment profits and other non-recurring items underlying 2014 EBIT increased by 53% to US$954 million compared toUS$624 million in 2013.
Directional1overheads came in at US$307 million in 2014 compared to US$218 million in 2013. This largely resulted fromthe development of the Company’s business improvement initiatives and one-off items such as legal fees related to thecompliance investigation. As previously announced, the Odyssey24 project aims to optimise and standardise theCompany’s ways of working, improve project management and project controls for projects which have grown in sizefrom around US$500 million a few years ago to close to US$2 billion today. The aim is to reduce project costs by at least5% for each project through improved project, supply chain and materials management.
Non-allocated “Other income and expenses” showed a net cost of US$186 million in 2014 compared to US$27 million in2013. This includes US$61 million of book profit relating to divesting activities, the US$240 million charge related to anagreed upon out-of-court settlement agreement with the Openbaar Ministerie and US$8 million of provisions forrestructuring costs. Further restructuring costs totalling US$17 million will be incurred in 2015.
Directional1net financing costs increased to US$127 million compared to US$80 million in 2013. This was mainly due tointerest paid on project loans for the Deep Panuke platform and FPSO Cidade de Paratyon a full year basis as well asthe impairment charge of a financial asset related to a contractual dispute with a US-based client. The 2014 average costof debt was 4.2% compared to 5.3% in 2013 due to the impact of bridge loans for Deep Panuke and FPSOs Cidade deMaricá and Cidade de Saquarema.
More generally, once production units are brought into service the financing costs are expensed to P&L statement,whereas during construction interest is capitalised. It should be emphasised that the net profit contribution of newlyoperating leased units is limited by the relatively high interest burden during the first years of operation, althoughdedication of lease revenues to debt servicing leads to fast redemption of the loan balances and hence reduced interest
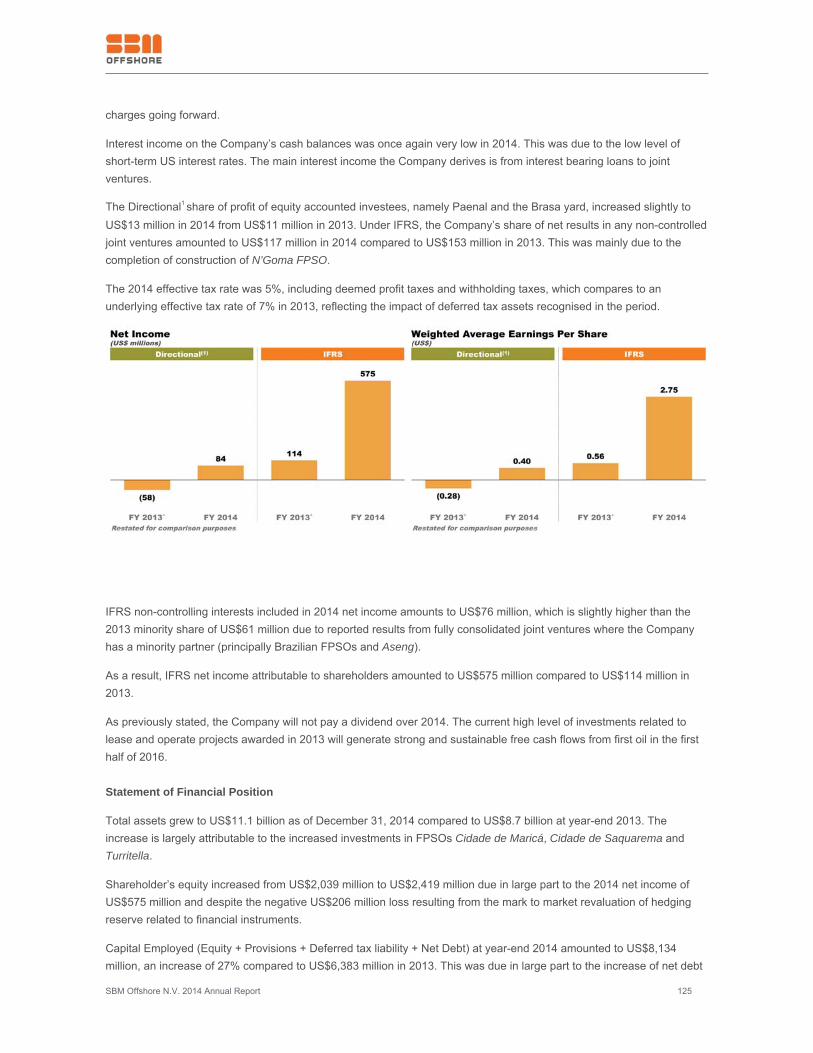
SBM Offshore N.V. 2014 Annual Report 125
charges going forward.
Interest income on the Company’s cash balances was once again very low in 2014. This was due to the low level ofshort-term US interest rates. The main interest income the Company derives is from interest bearing loans to jointventures.
The Directional1 share of profit of equity accounted investees, namely Paenal and the Brasa yard, increased slightly toUS$13 million in 2014 from US$11 million in 2013. Under IFRS, the Company’s share of net results in any non-controlledjoint ventures amounted to US$117 million in 2014 compared to US$153 million in 2013. This was mainly due to thecompletion of construction of N’Goma FPSO.
The 2014 effective tax rate was 5%, including deemed profit taxes and withholding taxes, which compares to anunderlying effective tax rate of 7% in 2013, reflecting the impact of deferred tax assets recognised in the period.
IFRS non-controlling interests included in 2014 net income amounts to US$76 million, which is slightly higher than the2013 minority share of US$61 million due to reported results from fully consolidated joint ventures where the Companyhas a minority partner (principally Brazilian FPSOs and Aseng).
As a result, IFRS net income attributable to shareholders amounted to US$575 million compared to US$114 million in2013.
As previously stated, the Company will not pay a dividend over 2014. The current high level of investments related tolease and operate projects awarded in 2013 will generate strong and sustainable free cash flows from first oil in the firsthalf of 2016.
Statement of Financial Position
Total assets grew to US$11.1 billion as of December 31, 2014 compared to US$8.7 billion at year-end 2013. Theincrease is largely attributable to the increased investments in FPSOs Cidade de Maricá, Cidade de Saquarema andTurritella.
Shareholder’s equity increased from US$2,039 million to US$2,419 million due in large part to the 2014 net income ofUS$575 million and despite the negative US$206 million loss resulting from the mark to market revaluation of hedgingreserve related to financial instruments.
Capital Employed (Equity + Provisions + Deferred tax liability + Net Debt) at year-end 2014 amounted to US$8,134million, an increase of 27% compared to US$6,383 million in 2013. This was due in large part to the increase of net debt
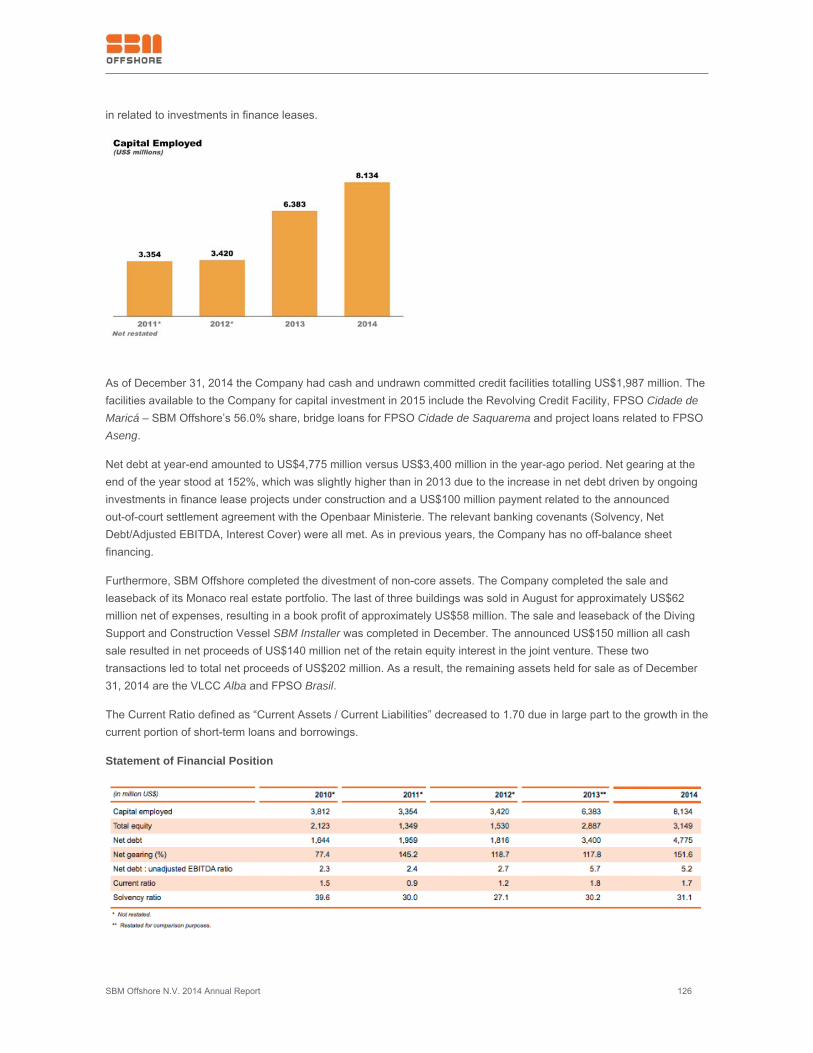
SBM Offshore N.V. 2014 Annual Report 126
in related to investments in finance leases.
As of December 31, 2014 the Company had cash and undrawn committed credit facilities totalling US$1,987 million. Thefacilities available to the Company for capital investment in 2015 include the Revolving Credit Facility, FPSO Cidade deMaricá – SBM Offshore’s 56.0% share, bridge loans for FPSO Cidade de Saquarema and project loans related to FPSOAseng.
Net debt at year-end amounted to US$4,775 million versus US$3,400 million in the year-ago period. Net gearing at theend of the year stood at 152%, which was slightly higher than in 2013 due to the increase in net debt driven by ongoinginvestments in finance lease projects under construction and a US$100 million payment related to the announcedout-of-court settlement agreement with the Openbaar Ministerie. The relevant banking covenants (Solvency, NetDebt/Adjusted EBITDA, Interest Cover) were all met. As in previous years, the Company has no off-balance sheetfinancing.
Furthermore, SBM Offshore completed the divestment of non-core assets. The Company completed the sale andleaseback of its Monaco real estate portfolio. The last of three buildings was sold in August for approximately US$62million net of expenses, resulting in a book profit of approximately US$58 million. The sale and leaseback of the DivingSupport and Construction Vessel SBM Installer was completed in December. The announced US$150 million all cashsale resulted in net proceeds of US$140 million net of the retain equity interest in the joint venture. These twotransactions led to total net proceeds of US$202 million. As a result, the remaining assets held for sale as of December31, 2014 are the VLCC Alba and FPSO Brasil.
The Current Ratio defined as “Current Assets / Current Liabilities” decreased to 1.70 due in large part to the growth in thecurrent portion of short-term loans and borrowings.
Statement of Financial Position
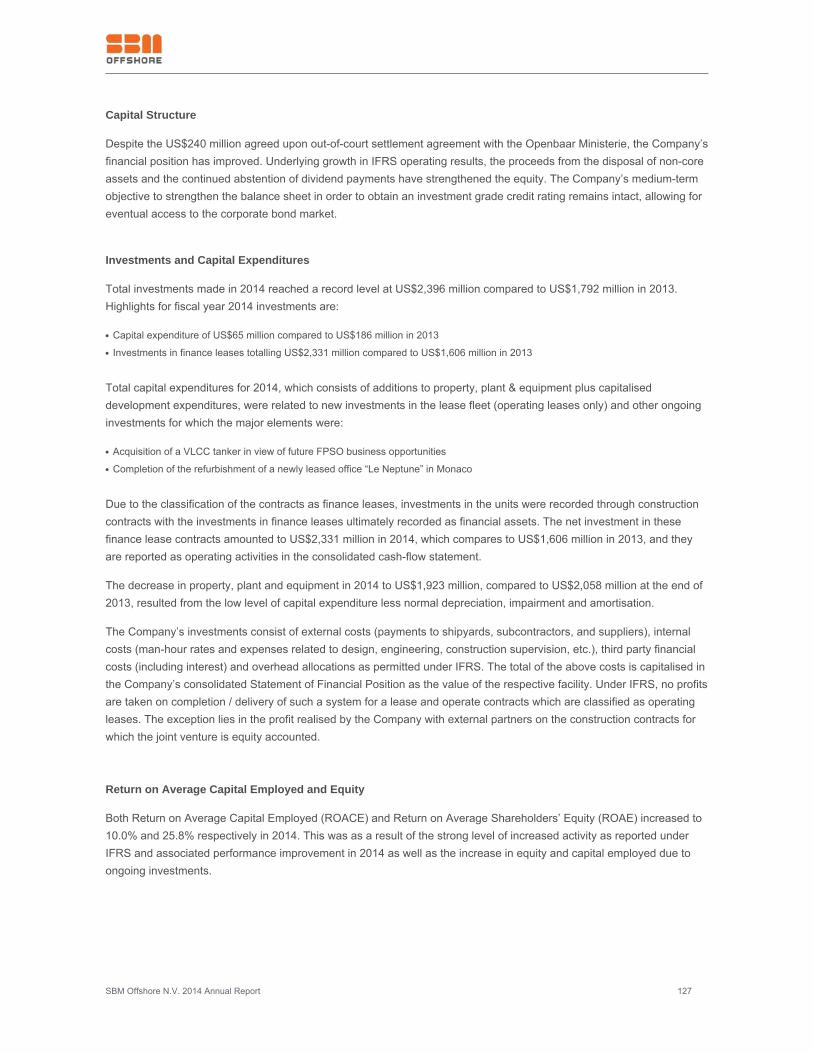
SBM Offshore N.V. 2014 Annual Report 127
Capital Structure
Despite the US$240 million agreed upon out-of-court settlement agreement with the Openbaar Ministerie, the Company’sfinancial position has improved. Underlying growth in IFRS operating results, the proceeds from the disposal of non-coreassets and the continued abstention of dividend payments have strengthened the equity. The Company’s medium-termobjective to strengthen the balance sheet in order to obtain an investment grade credit rating remains intact, allowing foreventual access to the corporate bond market.
Investments and Capital Expenditures
Total investments made in 2014 reached a record level at US$2,396 million compared to US$1,792 million in 2013.Highlights for fiscal year 2014 investments are:
Capital expenditure of US$65 million compared to US$186 million in 2013●
Investments in finance leases totalling US$2,331 million compared to US$1,606 million in 2013●
Total capital expenditures for 2014, which consists of additions to property, plant & equipment plus capitaliseddevelopment expenditures, were related to new investments in the lease fleet (operating leases only) and other ongoinginvestments for which the major elements were:
Acquisition of a VLCC tanker in view of future FPSO business opportunities●
Completion of the refurbishment of a newly leased office “Le Neptune” in Monaco●
Due to the classification of the contracts as finance leases, investments in the units were recorded through constructioncontracts with the investments in finance leases ultimately recorded as financial assets. The net investment in thesefinance lease contracts amounted to US$2,331 million in 2014, which compares to US$1,606 million in 2013, and theyare reported as operating activities in the consolidated cash-flow statement.
The decrease in property, plant and equipment in 2014 to US$1,923 million, compared to US$2,058 million at the end of2013, resulted from the low level of capital expenditure less normal depreciation, impairment and amortisation.
The Company’s investments consist of external costs (payments to shipyards, subcontractors, and suppliers), internalcosts (man-hour rates and expenses related to design, engineering, construction supervision, etc.), third party financialcosts (including interest) and overhead allocations as permitted under IFRS. The total of the above costs is capitalised inthe Company’s consolidated Statement of Financial Position as the value of the respective facility. Under IFRS, no profitsare taken on completion / delivery of such a system for a lease and operate contracts which are classified as operatingleases. The exception lies in the profit realised by the Company with external partners on the construction contracts forwhich the joint venture is equity accounted.
Return on Average Capital Employed and Equity
Both Return on Average Capital Employed (ROACE) and Return on Average Shareholders’ Equity (ROAE) increased to10.0% and 25.8% respectively in 2014. This was as a result of the strong level of increased activity as reported underIFRS and associated performance improvement in 2014 as well as the increase in equity and capital employed due toongoing investments.
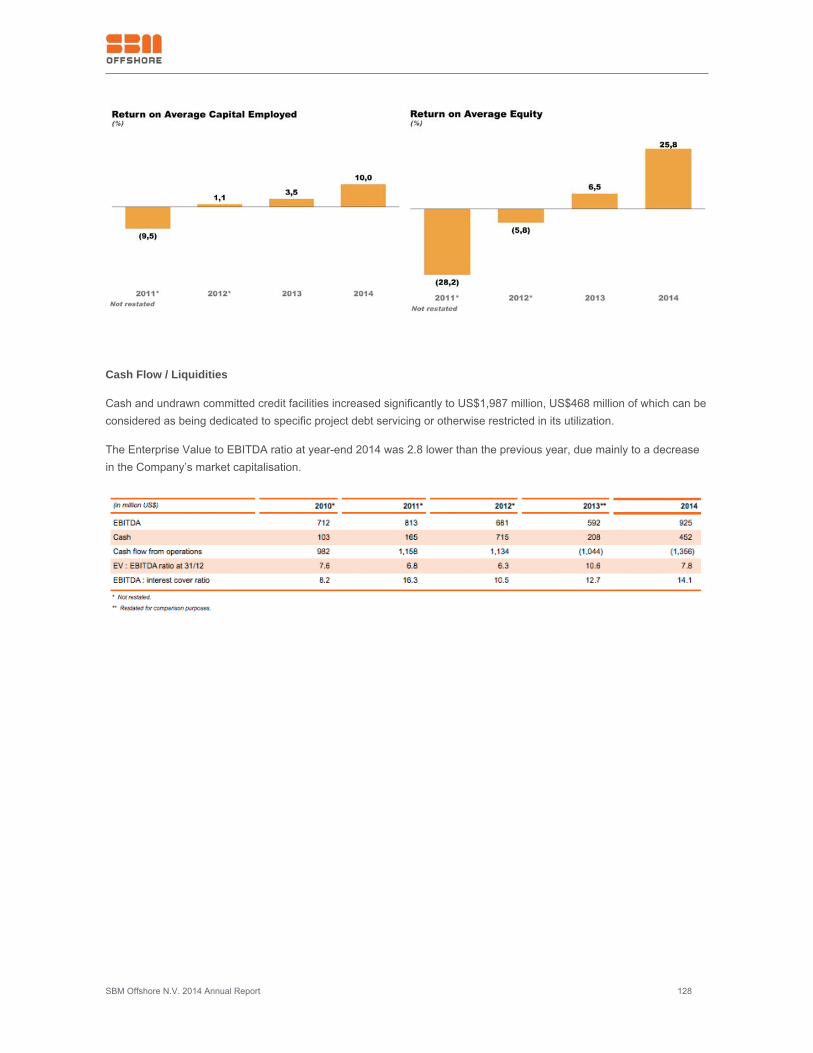
SBM Offshore N.V. 2014 Annual Report 128
Cash Flow / Liquidities
Cash and undrawn committed credit facilities increased significantly to US$1,987 million, US$468 million of which can beconsidered as being dedicated to specific project debt servicing or otherwise restricted in its utilization.
The Enterprise Value to EBITDA ratio at year-end 2014 was 2.8 lower than the previous year, due mainly to a decreasein the Company’s market capitalisation.
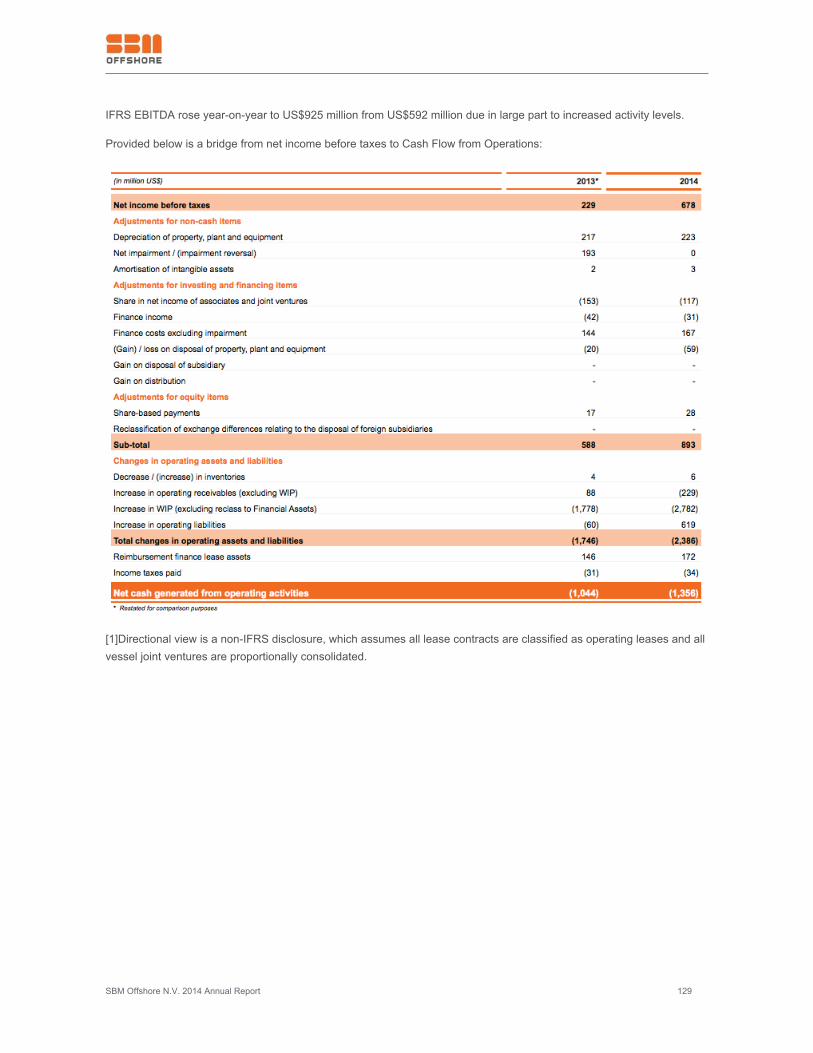
SBM Offshore N.V. 2014 Annual Report 129
IFRS EBITDA rose year-on-year to US$925 million from US$592 million due in large part to increased activity levels.
Provided below is a bridge from net income before taxes to Cash Flow from Operations:
[1]Directional view is a non-IFRS disclosure, which assumes all lease contracts are classified as operating leases and allvessel joint ventures are proportionally consolidated.
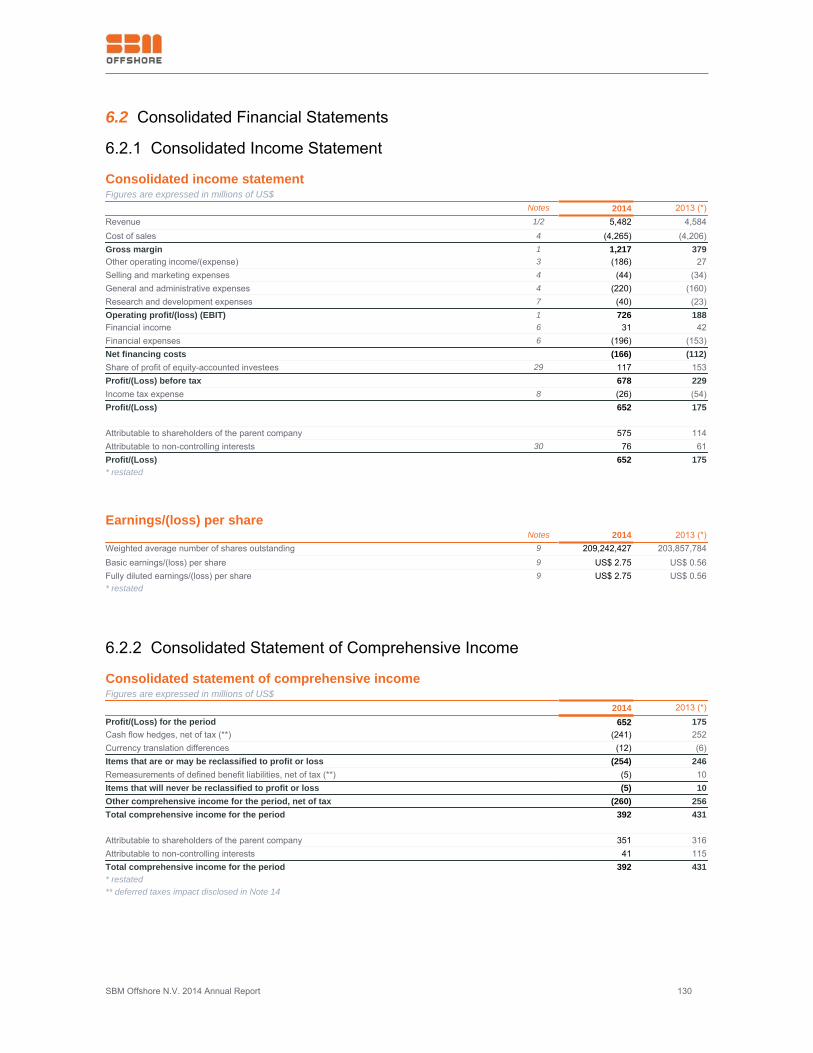
SBM Offshore N.V. 2014 Annual Report 130
6.2 Consolidated Financial Statements
6.2.1 Consolidated Income Statement
Consolidated income statementFigures are expressed in millions of US$
Notes 2014 2013 (*)Revenue 1/2 5,482 4,584Cost of sales 4 (4,265) (4,206)Gross margin 1 1,217 379Other operating income/(expense) 3 (186) 27Selling and marketing expenses 4 (44) (34)General and administrative expenses 4 (220) (160)Research and development expenses 7 (40) (23)Operating profit/(loss) (EBIT) 1 726 188Financial income 6 31 42Financial expenses 6 (196) (153)Net financing costs (166) (112)Share of profit of equity-accounted investees 29 117 153Profit/(Loss) before tax 678 229Income tax expense 8 (26) (54)Profit/(Loss) 652 175 Attributable to shareholders of the parent company 575 114Attributable to non-controlling interests 30 76 61Profit/(Loss) 652 175* restated
Earnings/(loss) per share Notes 2014 2013 (*)Weighted average number of shares outstanding 9 209,242,427 203,857,784Basic earnings/(loss) per share 9 US$ 2.75 US$ 0.56Fully diluted earnings/(loss) per share 9 US$ 2.75 US$ 0.56* restated
6.2.2 Consolidated Statement of Comprehensive Income
Consolidated statement of comprehensive incomeFigures are expressed in millions of US$
2014 2013 (*)Profit/(Loss) for the period 652 175Cash flow hedges, net of tax (**) (241) 252Currency translation differences (12) (6)Items that are or may be reclassified to profit or loss (254) 246Remeasurements of defined benefit liabilities, net of tax (**) (5) 10Items that will never be reclassified to profit or loss (5) 10Other comprehensive income for the period, net of tax (260) 256Total comprehensive income for the period 392 431 Attributable to shareholders of the parent company 351 316Attributable to non-controlling interests 41 115Total comprehensive income for the period 392 431* restated** deferred taxes impact disclosed in Note 14
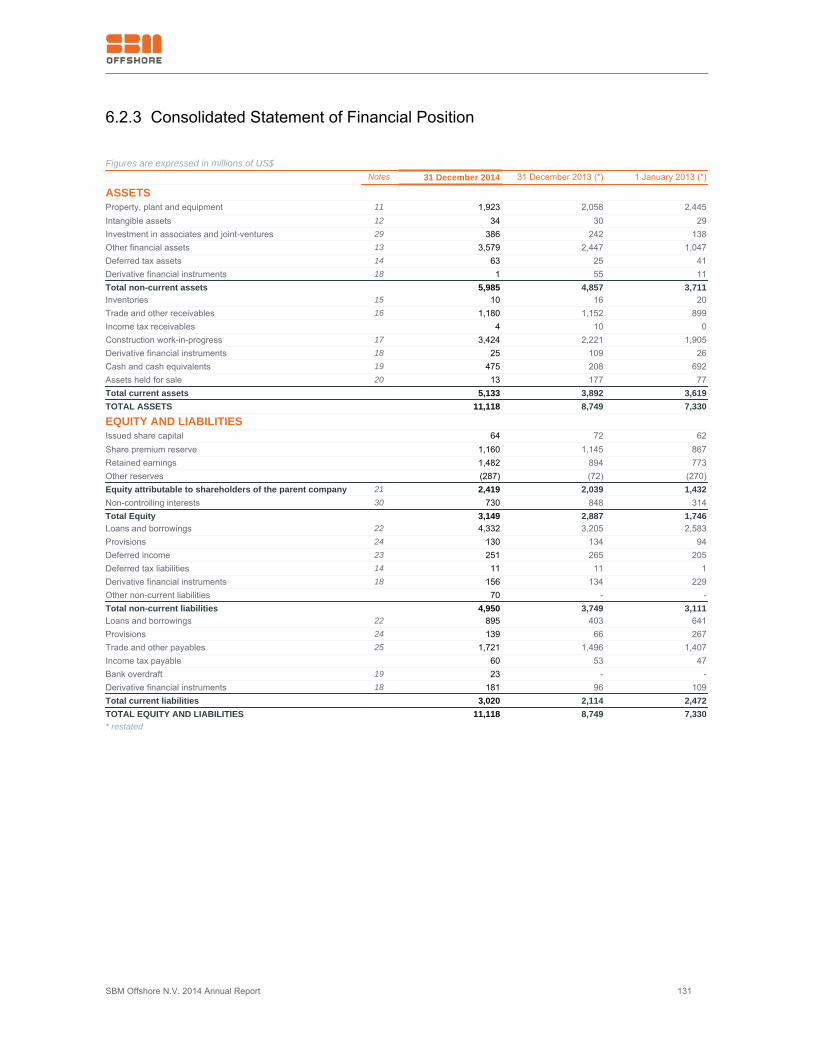
SBM Offshore N.V. 2014 Annual Report 131
6.2.3 Consolidated Statement of Financial Position
Figures are expressed in millions of US$
Notes 31 December 2014 31 December 2013 (*) 1 January 2013 (*)
ASSETSProperty, plant and equipment 11 1,923 2,058 2,445Intangible assets 12 34 30 29Investment in associates and joint-ventures 29 386 242 138Other financial assets 13 3,579 2,447 1,047Deferred tax assets 14 63 25 41Derivative financial instruments 18 1 55 11Total non-current assets 5,985 4,857 3,711Inventories 15 10 16 20Trade and other receivables 16 1,180 1,152 899Income tax receivables 4 10 0Construction work-in-progress 17 3,424 2,221 1,905Derivative financial instruments 18 25 109 26Cash and cash equivalents 19 475 208 692Assets held for sale 20 13 177 77Total current assets 5,133 3,892 3,619TOTAL ASSETS 11,118 8,749 7,330
EQUITY AND LIABILITIESIssued share capital 64 72 62Share premium reserve 1,160 1,145 867Retained earnings 1,482 894 773Other reserves (287) (72) (270)Equity attributable to shareholders of the parent company 21 2,419 2,039 1,432Non-controlling interests 30 730 848 314Total Equity 3,149 2,887 1,746Loans and borrowings 22 4,332 3,205 2,583Provisions 24 130 134 94Deferred income 23 251 265 205Deferred tax liabilities 14 11 11 1Derivative financial instruments 18 156 134 229Other non-current liabilities 70 - -Total non-current liabilities 4,950 3,749 3,111Loans and borrowings 22 895 403 641Provisions 24 139 66 267Trade and other payables 25 1,721 1,496 1,407Income tax payable 60 53 47Bank overdraft 19 23 - -Derivative financial instruments 18 181 96 109Total current liabilities 3,020 2,114 2,472TOTAL EQUITY AND LIABILITIES 11,118 8,749 7,330* restated
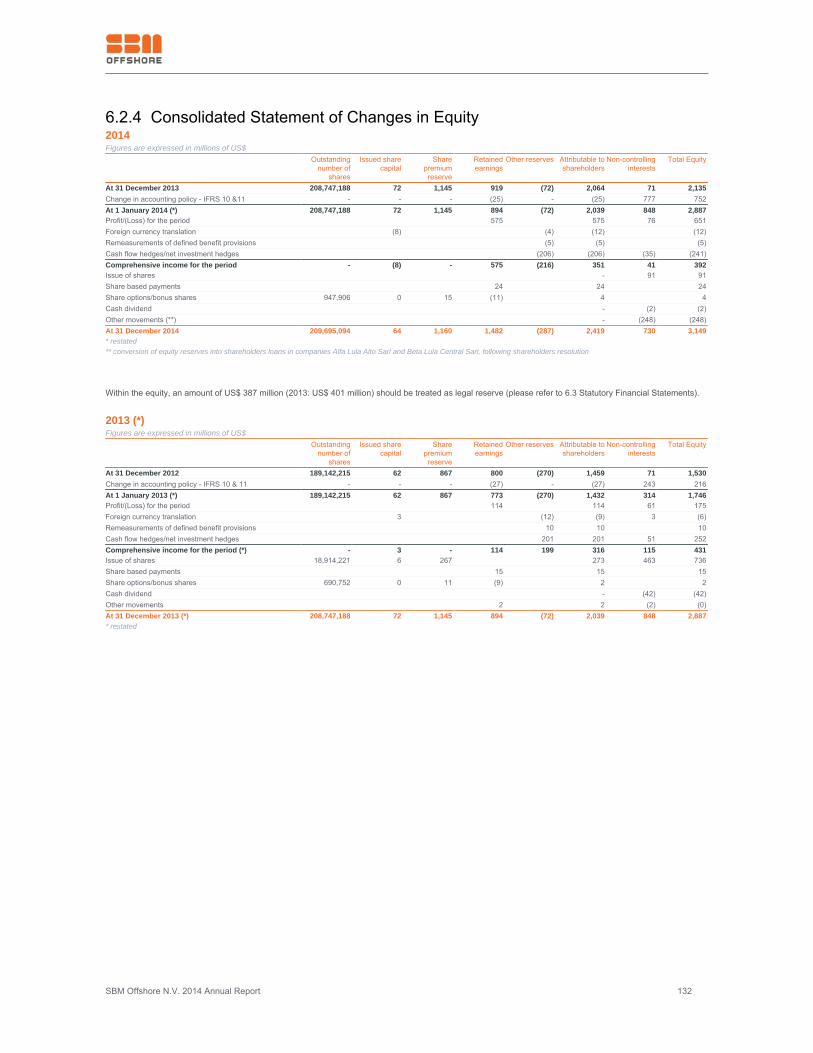
SBM Offshore N.V. 2014 Annual Report 132
6.2.4 Consolidated Statement of Changes in Equity2014Figures are expressed in millions of US$
Outstandingnumber of
shares
Issued sharecapital
Sharepremiumreserve
Retainedearnings
Other reserves Attributable toshareholders
Non-controllinginterests
Total Equity
At 31 December 2013 208,747,188 72 1,145 919 (72) 2,064 71 2,135Change in accounting policy - IFRS 10 &11 - - - (25) - (25) 777 752At 1 January 2014 (*) 208,747,188 72 1,145 894 (72) 2,039 848 2,887Profit/(Loss) for the period 575 575 76 651Foreign currency translation (8) (4) (12) (12)Remeasurements of defined benefit provisions (5) (5) (5)Cash flow hedges/net investment hedges (206) (206) (35) (241)Comprehensive income for the period - (8) - 575 (216) 351 41 392Issue of shares - 91 91Share based payments 24 24 24Share options/bonus shares 947,906 0 15 (11) 4 4Cash dividend - (2) (2)Other movements (**) - (248) (248)At 31 December 2014 209,695,094 64 1,160 1,482 (287) 2,419 730 3,149* restated** conversion of equity reserves into shareholders loans in companies Alfa Lula Alto Sarl and Beta Lula Central Sarl, following shareholders resolution
Within the equity, an amount of US$ 387 million (2013: US$ 401 million) should be treated as legal reserve (please refer to 6.3 Statutory Financial Statements).
2013 (*)Figures are expressed in millions of US$
Outstandingnumber of
shares
Issued sharecapital
Sharepremiumreserve
Retainedearnings
Other reserves Attributable toshareholders
Non-controllinginterests
Total Equity
At 31 December 2012 189,142,215 62 867 800 (270) 1,459 71 1,530Change in accounting policy - IFRS 10 & 11 - - - (27) - (27) 243 216At 1 January 2013 (*) 189,142,215 62 867 773 (270) 1,432 314 1,746Profit/(Loss) for the period 114 114 61 175Foreign currency translation 3 (12) (9) 3 (6)Remeasurements of defined benefit provisions 10 10 10Cash flow hedges/net investment hedges 201 201 51 252Comprehensive income for the period (*) - 3 - 114 199 316 115 431Issue of shares 18,914,221 6 267 273 463 736Share based payments 15 15 15Share options/bonus shares 690,752 0 11 (9) 2 2Cash dividend - (42) (42)Other movements 2 2 (2) (0)At 31 December 2013 (*) 208,747,188 72 1,145 894 (72) 2,039 848 2,887* restated
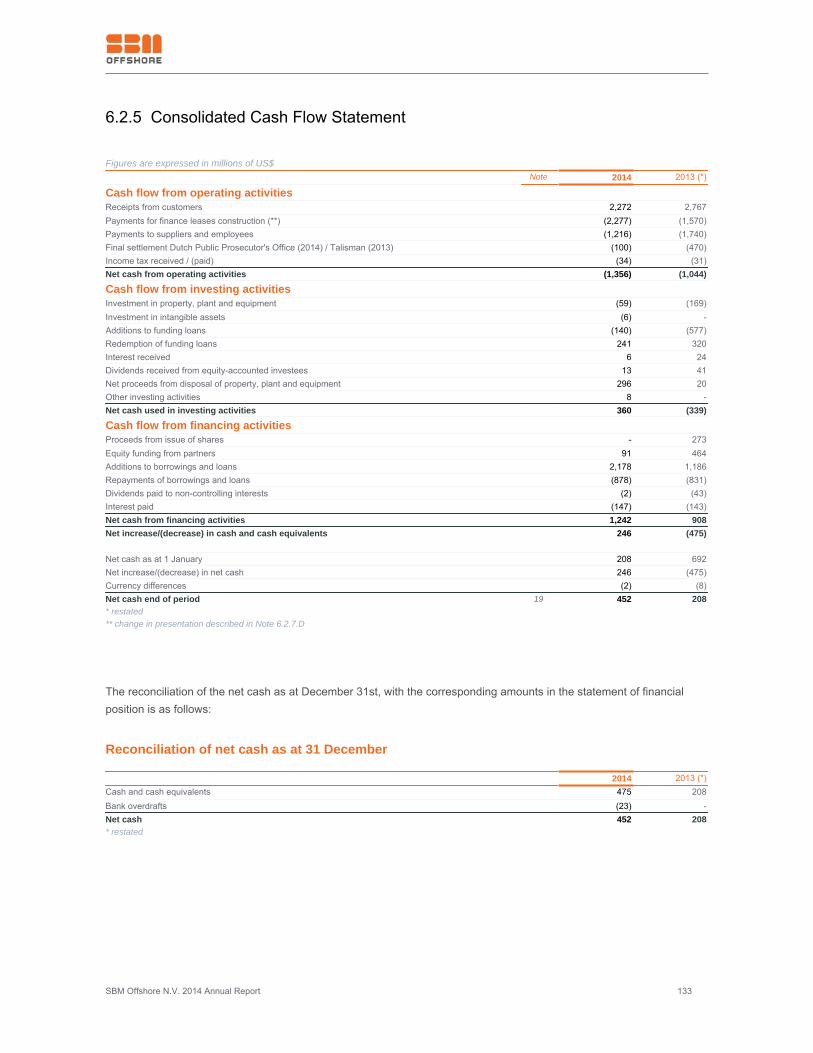
SBM Offshore N.V. 2014 Annual Report 133
6.2.5 Consolidated Cash Flow Statement
Figures are expressed in millions of US$
Note 2014 2013 (*)
Cash flow from operating activitiesReceipts from customers 2,272 2,767Payments for finance leases construction (**) (2,277) (1,570)Payments to suppliers and employees (1,216) (1,740)Final settlement Dutch Public Prosecutor's Office (2014) / Talisman (2013) (100) (470)Income tax received / (paid) (34) (31)Net cash from operating activities (1,356) (1,044)
Cash flow from investing activitiesInvestment in property, plant and equipment (59) (169)Investment in intangible assets (6) -Additions to funding loans (140) (577)Redemption of funding loans 241 320Interest received 6 24Dividends received from equity-accounted investees 13 41Net proceeds from disposal of property, plant and equipment 296 20Other investing activities 8 -Net cash used in investing activities 360 (339)
Cash flow from financing activitiesProceeds from issue of shares - 273Equity funding from partners 91 464Additions to borrowings and loans 2,178 1,186Repayments of borrowings and loans (878) (831)Dividends paid to non-controlling interests (2) (43)Interest paid (147) (143)Net cash from financing activities 1,242 908Net increase/(decrease) in cash and cash equivalents 246 (475) Net cash as at 1 January 208 692Net increase/(decrease) in net cash 246 (475)Currency differences (2) (8)Net cash end of period 19 452 208* restated** change in presentation described in Note 6.2.7.D
The reconciliation of the net cash as at December 31st, with the corresponding amounts in the statement of financialposition is as follows:
Reconciliation of net cash as at 31 December
2014 2013 (*)Cash and cash equivalents 475 208Bank overdrafts (23) -Net cash 452 208* restated
SBM Offshore N.V. 2014 Annual Report 134
6.2.6 General Information
SBM Offshore N.V. is a company domiciled in Rotterdam, the Netherlands. SBM Offshore N.V. is the holding company ofa group of international marine technology oriented companies. The Company serves globally the offshore oil and gasindustry by supplying engineered products, vessels and systems, as well as offshore oil and gas production services.
The Company is listed on the Euronext Amsterdam stock exchange.
The consolidated financial statements for the year ended December 31st, 2014 comprise the financial statements ofSBM Offshore N.V., its subsidiaries and interests in associates and joint ventures (together referred to as ‘theCompany’). They are presented in millions of US Dollars, except when otherwise indicated. Figures may not add up dueto rounding.
The consolidated financial statements were authorised for issue by the Supervisory Board on February 4th, 2015.
6.2.7 Accounting Principles
A. Accounting Framework
The consolidated financial statements of the Company have been prepared in accordance with International FinancialReporting Standards (IFRS) and interpretations adopted by the EU, where effective, for financial years beginningJanuary 1st, 2014.
The separate financial statements incuded in section 6.3 are part of the 2014 financial statements of SBM Offshore N.V.With reference to the separate income statement of SBM Offshore N.V., use has been made of the exemption pursuantto Section 402 of Book 2 of the Netherlands Civil Code.
New standards and interpretations applicable as of January 1st, 2014
The Company has adopted the following new standards with a date of initial application of January 1st, 2014:
IFRS 10 “Consolidated financial statements” which supersedes IAS 27 “Consolidated and separate financial statements”, and SIC 12●
“Consolidation: Special Purpose Entities”
IFRS 11 “Joint arrangements”, which supersedes IAS 31 “Interests in Joint-Venture”●
IFRS 12 “Disclosure of Interests in Other Entities”●
IAS 28 Amended “Interests in Associates and Joint-Ventures”●
IAS 32 Amended “Financial Instruments: Presentation” about “Offsetting Financial Assets and Financial Liabilities”●
IAS 36 Amended “Impairment of assets” about “Recoverable Amount Disclosures for Non-Financial Assets”●
IAS 39 Amended “Financial instruments – recognition and measurement” about “Novation of derivatives and continuation of hedge●
accounting”
IAS 19 Amended "Defined Benefit Plans: Employee Contributions"●
Main impacts of the application of these standards result from the application of IFRS 10, IFRS 11 and IAS 28 Amended,which are described in part B. “Change in accounting method”.
Standards and interpretations not mandatory applicable to the group as of January 1st, 2014
The following standards and interpretations were published by the IASB but have not been endorsed yet by theEuropean Commission:
Annual improvements: 2010-2012 cycle, 2011-2013 cycle and 2012-2014 cycle●
IFRS 9 “Financial Instruments”●
IFRS 7 Amended “Financial Instruments: Disclosures”●
SBM Offshore N.V. 2014 Annual Report 135
IFRS 15 “Revenue from contract with customers”●
Amendments to IAS 16 and 38 about “Clarification of acceptable methods of depreciation and amortisation”●
Amendments to IFRS 10, IFRS 11 and IAS 28●
In addition, the IFRIC 21 "Levies", endorsed by the EU, will be mandatory as of January 1st, 2015. The Company hasdecided not to early adopt it.
The Company does not apply these standards and interpretations but is analysing the impacts and practicalconsequences of their future application.
B. Change in Accounting Method: Application of IFRS 10, IFRS 11, IFRS 12 andIAS 28 Amended
The Company applies the new standards relating to IFRS 10, IFRS 11, IFRS 12 and IAS 28 amended as of January 1st,2014.
IFRS 10 introduces a new control model to determine whether an investee should be consolidated. This new modelfocuses on whether a Group has power over an investee, exposure or rights to variable returns from its involvement withthe investee and its ability to use its power to affect those returns.
IFRS 11 changes the accounting treatment for interests in joint arrangements by distinguishing two types of jointarrangements:
a company’s interest in a joint operation, which is an arrangement in which a company has rights to the assets, and obligations for the●
liabilities, will be accounted for on the basis of the Company’s interest in those assets and liabilities
a company’s interest in a joint-venture, which is an arrangement in which a company has rights only to the net assets, will be equity-●
accounted
When making this assessment, IFRS 11 requires consideration of the structure of joint arrangements, the legal form ofany separate vehicles, the contractual terms of the arrangements and other facts and circumstances. IFRS 11 does notallow the proportionate consolidation of joint-ventures.
IFRS 12 requires to disclose information that enables to evaluate the nature of its interests in entities, the risksassociated with, and their effects in the consolidated financial statements.
Consequences on the consolidation scope
In accordance with these new standards, the Company has reviewed the nature of control exercised by the Company onits jointly owned entities. As a result, and as disclosed in its 2013 annual financial statements, the Company is nowrequired:
to account for its fully controlled subsidiaries on a full consolidated basis, mostly impacting Brasilian FPSOs●
to apply equity accounting treatment to the joint-ventures, mostly impacting Angolan FPSOs.●
None of the jointly owned entities qualify for joint-operations as per IFRS 11.
In determining under IFRS 10 whether the Company has power over the investee, exposure or rights to variable returnsfrom its involvement, it was assessed that, for entities whereby all key decisions are taken on a mutual consent basis, themain deciding feature was residing in the deadlock clause existing in shareholders' agreements. In case of a deadlocksituation arises at the Board of Directors of an entity, whereby the Board is unable to force a decision, the deadlockclause of the shareholders' agreements generally stipulate whether a substantive right is granted to the Company or to
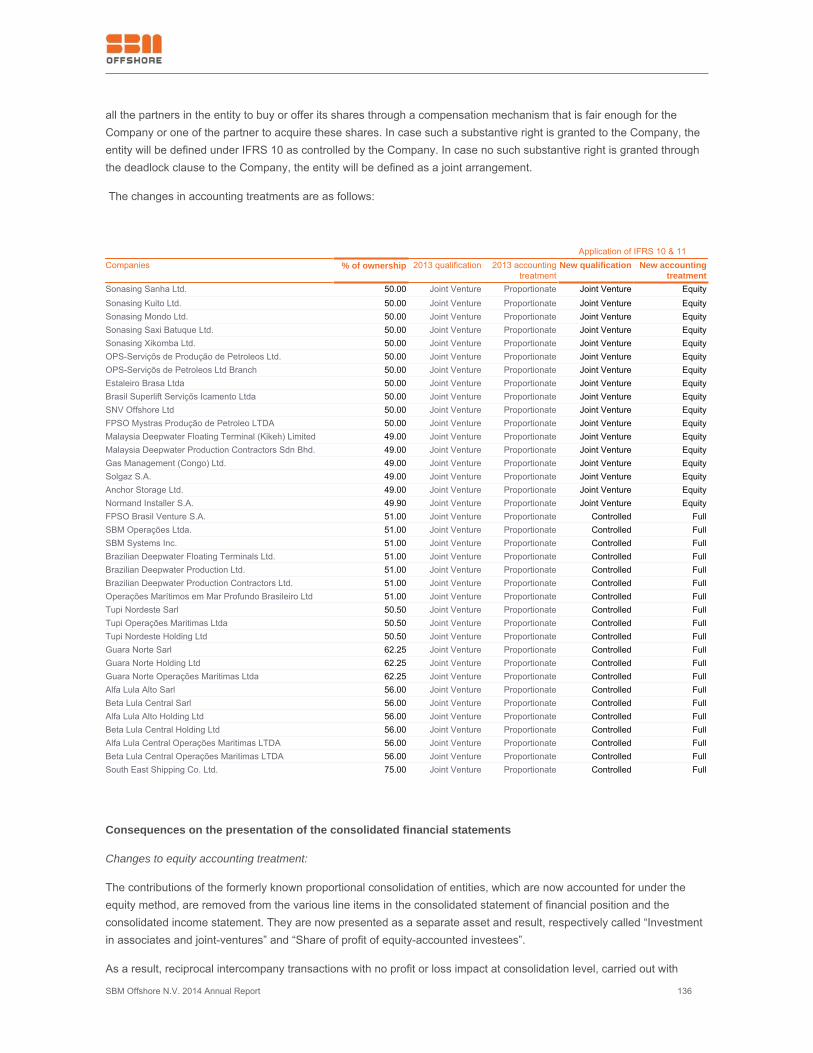
SBM Offshore N.V. 2014 Annual Report 136
all the partners in the entity to buy or offer its shares through a compensation mechanism that is fair enough for theCompany or one of the partner to acquire these shares. In case such a substantive right is granted to the Company, theentity will be defined under IFRS 10 as controlled by the Company. In case no such substantive right is granted throughthe deadlock clause to the Company, the entity will be defined as a joint arrangement.
The changes in accounting treatments are as follows:
Application of IFRS 10 & 11Companies % of ownership 2013 qualification 2013 accounting
treatmentNew qualification New accounting
treatmentSonasing Sanha Ltd. 50.00 Joint Venture Proportionate Joint Venture EquitySonasing Kuito Ltd. 50.00 Joint Venture Proportionate Joint Venture EquitySonasing Mondo Ltd. 50.00 Joint Venture Proportionate Joint Venture EquitySonasing Saxi Batuque Ltd. 50.00 Joint Venture Proportionate Joint Venture EquitySonasing Xikomba Ltd. 50.00 Joint Venture Proportionate Joint Venture EquityOPS-Serviçõs de Produção de Petroleos Ltd. 50.00 Joint Venture Proportionate Joint Venture EquityOPS-Serviçõs de Petroleos Ltd Branch 50.00 Joint Venture Proportionate Joint Venture EquityEstaleiro Brasa Ltda 50.00 Joint Venture Proportionate Joint Venture EquityBrasil Superlift Serviçõs Icamento Ltda 50.00 Joint Venture Proportionate Joint Venture EquitySNV Offshore Ltd 50.00 Joint Venture Proportionate Joint Venture EquityFPSO Mystras Produção de Petroleo LTDA 50.00 Joint Venture Proportionate Joint Venture EquityMalaysia Deepwater Floating Terminal (Kikeh) Limited 49.00 Joint Venture Proportionate Joint Venture EquityMalaysia Deepwater Production Contractors Sdn Bhd. 49.00 Joint Venture Proportionate Joint Venture EquityGas Management (Congo) Ltd. 49.00 Joint Venture Proportionate Joint Venture EquitySolgaz S.A. 49.00 Joint Venture Proportionate Joint Venture EquityAnchor Storage Ltd. 49.00 Joint Venture Proportionate Joint Venture EquityNormand Installer S.A. 49.90 Joint Venture Proportionate Joint Venture EquityFPSO Brasil Venture S.A. 51.00 Joint Venture Proportionate Controlled FullSBM Operações Ltda. 51.00 Joint Venture Proportionate Controlled FullSBM Systems Inc. 51.00 Joint Venture Proportionate Controlled FullBrazilian Deepwater Floating Terminals Ltd. 51.00 Joint Venture Proportionate Controlled FullBrazilian Deepwater Production Ltd. 51.00 Joint Venture Proportionate Controlled FullBrazilian Deepwater Production Contractors Ltd. 51.00 Joint Venture Proportionate Controlled FullOperações Marítimos em Mar Profundo Brasileiro Ltd 51.00 Joint Venture Proportionate Controlled FullTupi Nordeste Sarl 50.50 Joint Venture Proportionate Controlled FullTupi Operações Maritimas Ltda 50.50 Joint Venture Proportionate Controlled FullTupi Nordeste Holding Ltd 50.50 Joint Venture Proportionate Controlled FullGuara Norte Sarl 62.25 Joint Venture Proportionate Controlled FullGuara Norte Holding Ltd 62.25 Joint Venture Proportionate Controlled FullGuara Norte Operações Maritimas Ltda 62.25 Joint Venture Proportionate Controlled FullAlfa Lula Alto Sarl 56.00 Joint Venture Proportionate Controlled FullBeta Lula Central Sarl 56.00 Joint Venture Proportionate Controlled FullAlfa Lula Alto Holding Ltd 56.00 Joint Venture Proportionate Controlled FullBeta Lula Central Holding Ltd 56.00 Joint Venture Proportionate Controlled FullAlfa Lula Central Operações Maritimas LTDA 56.00 Joint Venture Proportionate Controlled FullBeta Lula Central Operações Maritimas LTDA 56.00 Joint Venture Proportionate Controlled FullSouth East Shipping Co. Ltd. 75.00 Joint Venture Proportionate Controlled Full
Consequences on the presentation of the consolidated financial statements
Changes to equity accounting treatment:
The contributions of the formerly known proportional consolidation of entities, which are now accounted for under theequity method, are removed from the various line items in the consolidated statement of financial position and theconsolidated income statement. They are now presented as a separate asset and result, respectively called “Investmentin associates and joint-ventures” and “Share of profit of equity-accounted investees”.
As a result, reciprocal intercompany transactions with no profit or loss impact at consolidation level, carried out with
SBM Offshore N.V. 2014 Annual Report 137
these entities, are no longer eliminated for the preparation of the consolidated financial statements. Thus, the removal ofthese entities’ contributions from the various line items in the Company’s financial statements is partially offset by thepresentation in the same line items of the amounts for the transactions carried out by the Group with these entities. Theimpact arising from reciprocal intercompany transactions does not, however, have any impact on the operating profit andnet income.
Changes to full consolidation method:
On the contrary, the formerly known proportional consolidation of entities, which are now fully consolidated, areaccounted for at one hundred percent in the consolidated statement of financial position and the income statement,disregarding the percentage of ownership of the Company in these investees.
As a result, reciprocal intercompany transactions with no profit or loss impact at consolidation level, carried out withthese entities are now fully eliminated for the preparation of the consolidated financial statements.
Finally, the implementation of new standards has a limited impact on the Company’s IFRS revenue and net incomeattributable to shareholders, but the total asset value, equity attributable to non-controlling interests and loans andborrowings have increased significantly, mainly due to the effect of the full consolidation of Brasilian investees.
Detailed impacts on the Company’s consolidated financial statements
The Group complied with the transitional measures for application of IFRS 10, IFRS 11 and IAS 28 Amended. The 2013comparative figures have been restated accordingly for comparison purposes.
The reconciliations between restated comparative data and data published as of December 31st, 2013 are presentedbelow in section 6.2.7.E.
Additional disclosures implemented by IFRS 12
Required informations by IFRS 12 which have not been developed in that part, are disclosed in the Note 29 "Interest injoint ventures and associates" and Note 30 "Information on non-controlling interests".
C. Change in Accounting Policies used in the Measurement of Operating Segments
Following the introduction of Directional Reporting in its financial reviews, and as allowed by IFRS 8 “Operatingsegments”, the Management Board decided to change the measurement of its reported operating segments in order tobetter reflect the manner in which it analyses the segments information. The Company’s operating segments are nowmeasured under Directional Reporting principles, rather than accounting principles applied in the IFRS consolidatedfinancial statements. The operating segments informations are provided in Note 1 “Operating segments” . Comparativeinformation has been restated consequently, in accordance with IAS 1 "Presentation of financial statements".
In this way, the Management believes that Directional Reporting addresses the complexity in the Group’s businessmodel, where turnkey sales are combined with construction projects for its own lease and operate portfolio. Indeed, theaccounting treatment for finance lease contracts for the manufacturer who is also a lessor, like the Company, addsfurther complexity by accelerating revenue and profit recognition into the construction phase, well before rents areinvoiced to, and paid by the client. By changing the measurement of its reported operating segment, the ManagementBoard believes it increases transparency and understanding of segment performance.
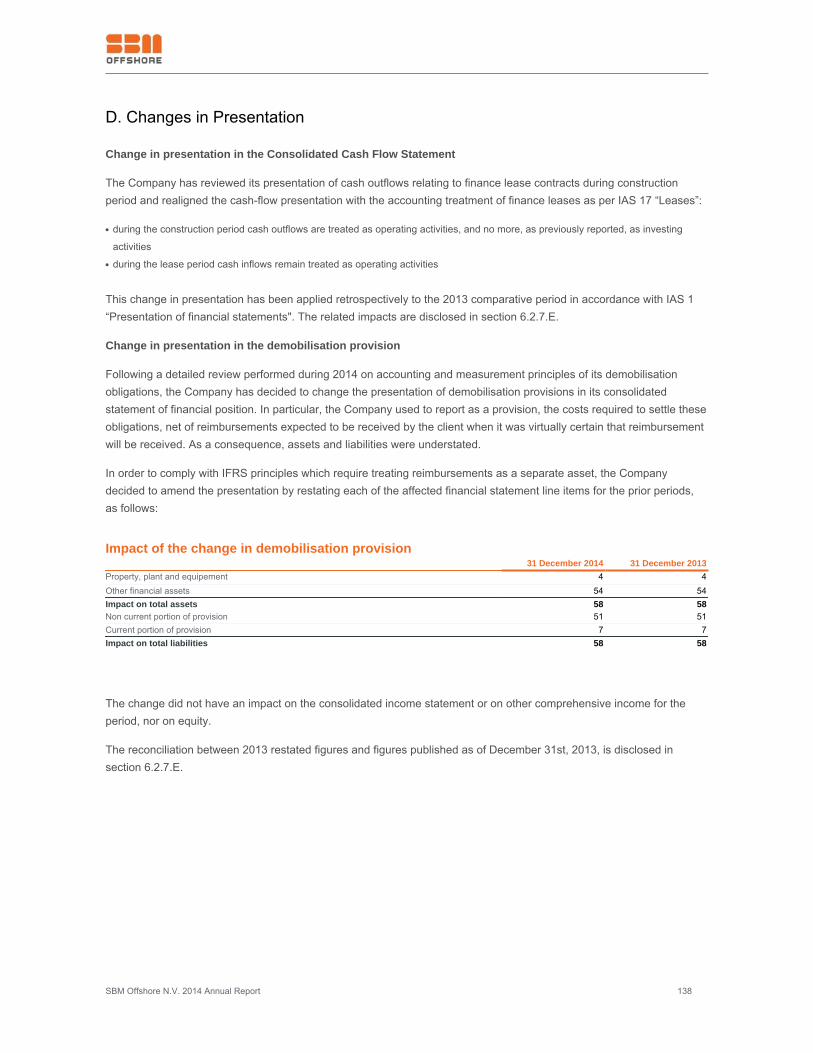
SBM Offshore N.V. 2014 Annual Report 138
D. Changes in Presentation
Change in presentation in the Consolidated Cash Flow Statement
The Company has reviewed its presentation of cash outflows relating to finance lease contracts during constructionperiod and realigned the cash-flow presentation with the accounting treatment of finance leases as per IAS 17 “Leases”:
during the construction period cash outflows are treated as operating activities, and no more, as previously reported, as investing●
activities
during the lease period cash inflows remain treated as operating activities●
This change in presentation has been applied retrospectively to the 2013 comparative period in accordance with IAS 1“Presentation of financial statements". The related impacts are disclosed in section 6.2.7.E.
Change in presentation in the demobilisation provision
Following a detailed review performed during 2014 on accounting and measurement principles of its demobilisationobligations, the Company has decided to change the presentation of demobilisation provisions in its consolidatedstatement of financial position. In particular, the Company used to report as a provision, the costs required to settle theseobligations, net of reimbursements expected to be received by the client when it was virtually certain that reimbursementwill be received. As a consequence, assets and liabilities were understated.
In order to comply with IFRS principles which require treating reimbursements as a separate asset, the Companydecided to amend the presentation by restating each of the affected financial statement line items for the prior periods,as follows:
Impact of the change in demobilisation provision 31 December 2014 31 December 2013Property, plant and equipement 4 4Other financial assets 54 54Impact on total assets 58 58Non current portion of provision 51 51Current portion of provision 7 7Impact on total liabilities 58 58
The change did not have an impact on the consolidated income statement or on other comprehensive income for theperiod, nor on equity.
The reconciliation between 2013 restated figures and figures published as of December 31st, 2013, is disclosed insection 6.2.7.E.
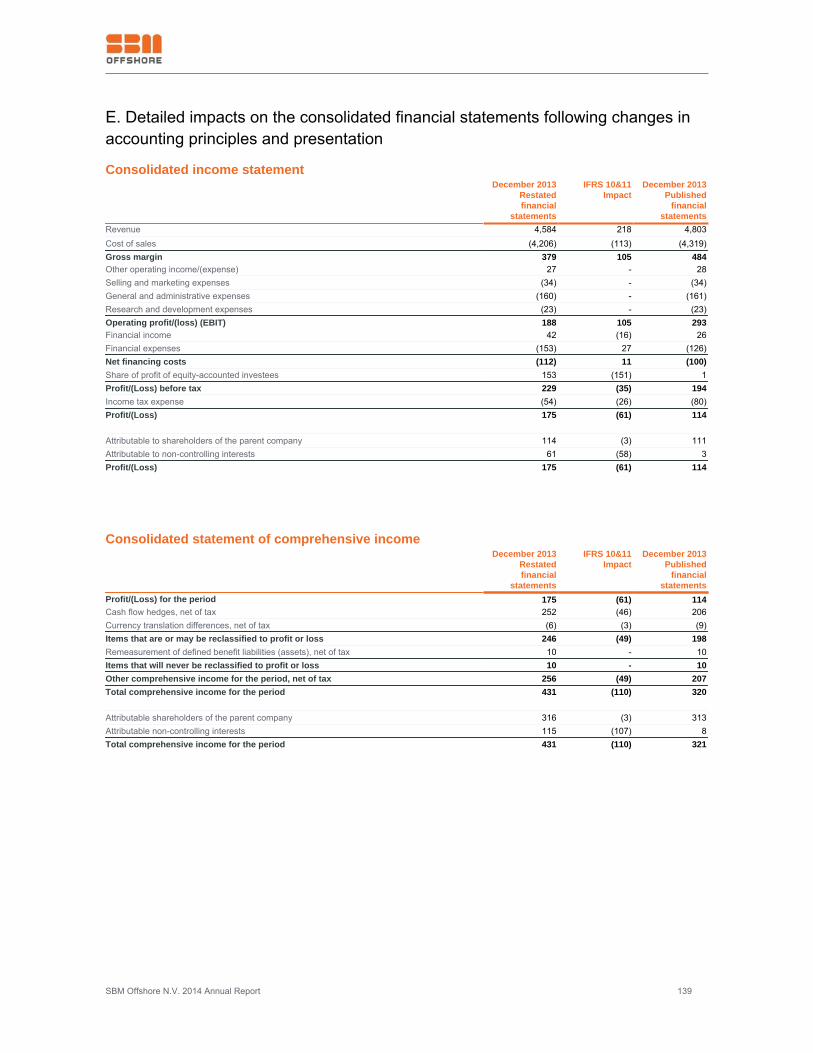
SBM Offshore N.V. 2014 Annual Report 139
E. Detailed impacts on the consolidated financial statements following changes inaccounting principles and presentation
Consolidated income statement December 2013
Restatedfinancial
statements
IFRS 10&11Impact
December 2013Published
financialstatements
Revenue 4,584 218 4,803Cost of sales (4,206) (113) (4,319)Gross margin 379 105 484Other operating income/(expense) 27 - 28Selling and marketing expenses (34) - (34)General and administrative expenses (160) - (161)Research and development expenses (23) - (23)Operating profit/(loss) (EBIT) 188 105 293Financial income 42 (16) 26Financial expenses (153) 27 (126)Net financing costs (112) 11 (100)Share of profit of equity-accounted investees 153 (151) 1Profit/(Loss) before tax 229 (35) 194Income tax expense (54) (26) (80)Profit/(Loss) 175 (61) 114 Attributable to shareholders of the parent company 114 (3) 111Attributable to non-controlling interests 61 (58) 3Profit/(Loss) 175 (61) 114
Consolidated statement of comprehensive income December 2013
Restatedfinancial
statements
IFRS 10&11Impact
December 2013Published
financialstatements
Profit/(Loss) for the period 175 (61) 114Cash flow hedges, net of tax 252 (46) 206Currency translation differences, net of tax (6) (3) (9)Items that are or may be reclassified to profit or loss 246 (49) 198Remeasurement of defined benefit liabilities (assets), net of tax 10 - 10Items that will never be reclassified to profit or loss 10 - 10Other comprehensive income for the period, net of tax 256 (49) 207Total comprehensive income for the period 431 (110) 320 Attributable shareholders of the parent company 316 (3) 313Attributable non-controlling interests 115 (107) 8Total comprehensive income for the period 431 (110) 321
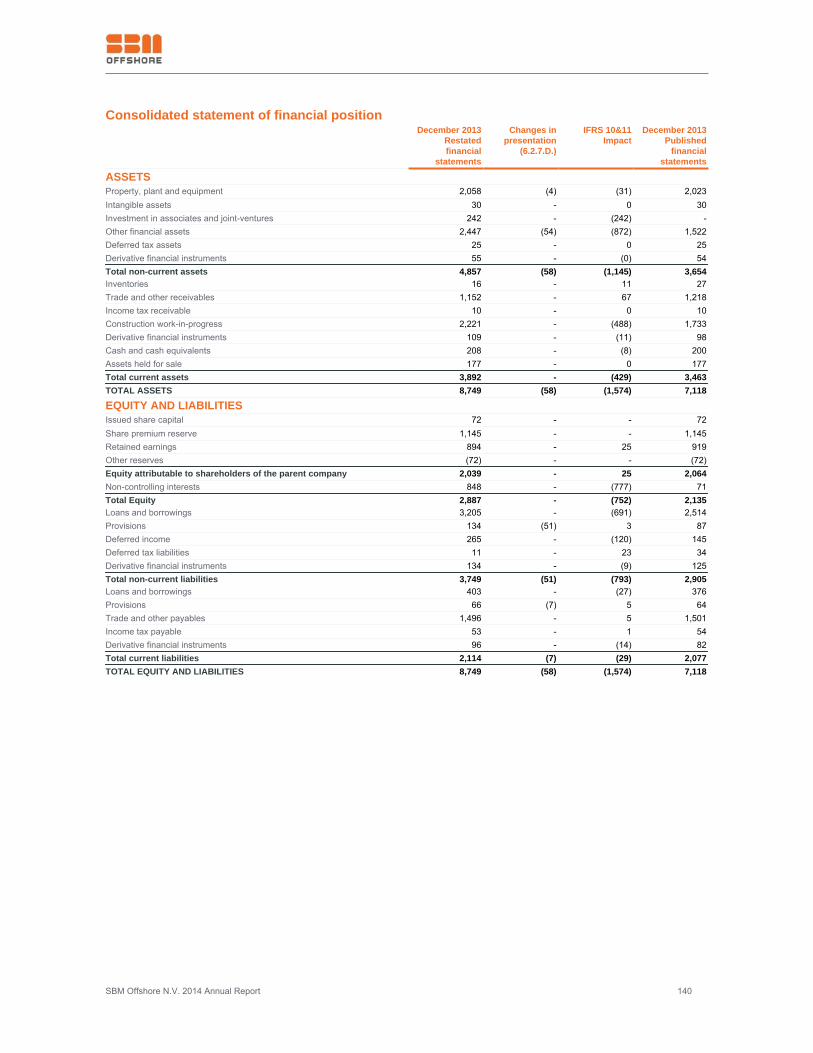
SBM Offshore N.V. 2014 Annual Report 140
Consolidated statement of financial position December 2013
Restatedfinancial
statements
Changes inpresentation
(6.2.7.D.)
IFRS 10&11Impact
December 2013Published
financialstatements
ASSETSProperty, plant and equipment 2,058 (4) (31) 2,023Intangible assets 30 - 0 30Investment in associates and joint-ventures 242 - (242) -Other financial assets 2,447 (54) (872) 1,522Deferred tax assets 25 - 0 25Derivative financial instruments 55 - (0) 54Total non-current assets 4,857 (58) (1,145) 3,654Inventories 16 - 11 27Trade and other receivables 1,152 - 67 1,218Income tax receivable 10 - 0 10Construction work-in-progress 2,221 - (488) 1,733Derivative financial instruments 109 - (11) 98Cash and cash equivalents 208 - (8) 200Assets held for sale 177 - 0 177Total current assets 3,892 - (429) 3,463TOTAL ASSETS 8,749 (58) (1,574) 7,118
EQUITY AND LIABILITIESIssued share capital 72 - - 72Share premium reserve 1,145 - - 1,145Retained earnings 894 - 25 919Other reserves (72) - - (72)Equity attributable to shareholders of the parent company 2,039 - 25 2,064Non-controlling interests 848 - (777) 71Total Equity 2,887 - (752) 2,135Loans and borrowings 3,205 - (691) 2,514Provisions 134 (51) 3 87Deferred income 265 - (120) 145Deferred tax liabilities 11 - 23 34Derivative financial instruments 134 - (9) 125Total non-current liabilities 3,749 (51) (793) 2,905Loans and borrowings 403 - (27) 376Provisions 66 (7) 5 64Trade and other payables 1,496 - 5 1,501Income tax payable 53 - 1 54Derivative financial instruments 96 - (14) 82Total current liabilities 2,114 (7) (29) 2,077TOTAL EQUITY AND LIABILITIES 8,749 (58) (1,574) 7,118
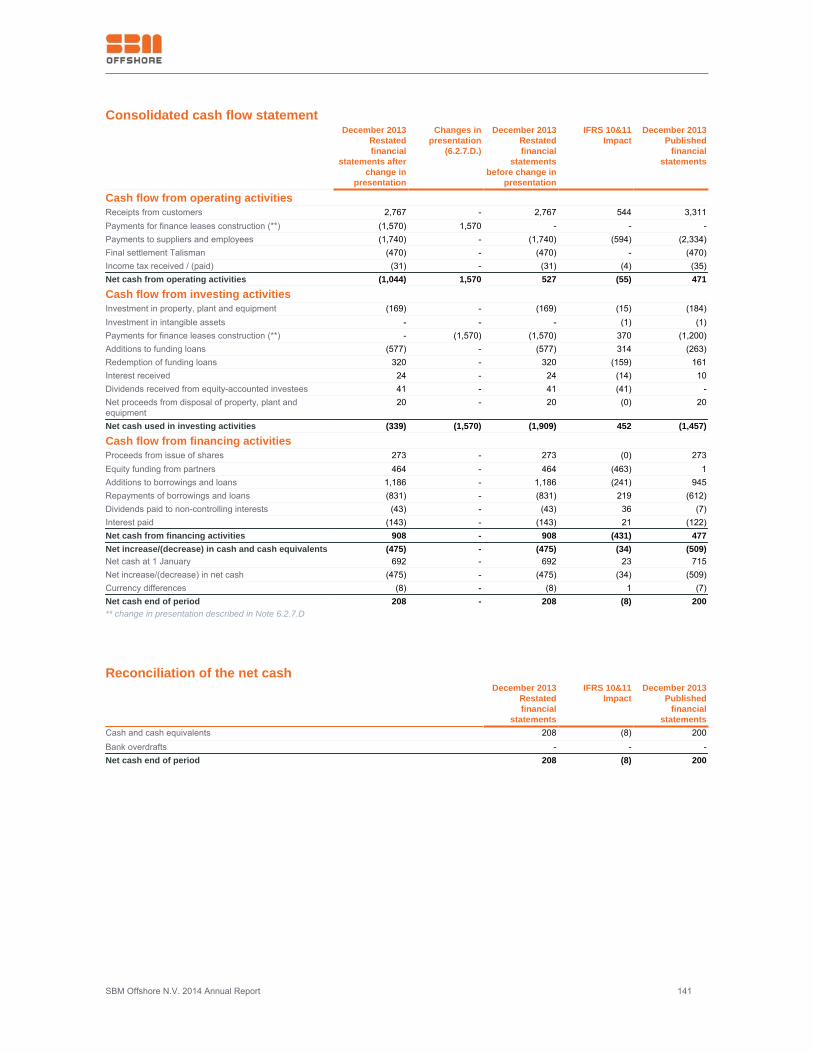
SBM Offshore N.V. 2014 Annual Report 141
Consolidated cash flow statement December 2013
Restatedfinancial
statements afterchange in
presentation
Changes inpresentation
(6.2.7.D.)
December 2013Restatedfinancial
statementsbefore change in
presentation
IFRS 10&11Impact
December 2013Published
financialstatements
Cash flow from operating activitiesReceipts from customers 2,767 - 2,767 544 3,311Payments for finance leases construction (**) (1,570) 1,570 - - -Payments to suppliers and employees (1,740) - (1,740) (594) (2,334)Final settlement Talisman (470) - (470) - (470)Income tax received / (paid) (31) - (31) (4) (35)Net cash from operating activities (1,044) 1,570 527 (55) 471
Cash flow from investing activitiesInvestment in property, plant and equipment (169) - (169) (15) (184)Investment in intangible assets - - - (1) (1)Payments for finance leases construction (**) - (1,570) (1,570) 370 (1,200)Additions to funding loans (577) - (577) 314 (263)Redemption of funding loans 320 - 320 (159) 161Interest received 24 - 24 (14) 10Dividends received from equity-accounted investees 41 - 41 (41) -Net proceeds from disposal of property, plant andequipment
20 - 20 (0) 20
Net cash used in investing activities (339) (1,570) (1,909) 452 (1,457)
Cash flow from financing activitiesProceeds from issue of shares 273 - 273 (0) 273Equity funding from partners 464 - 464 (463) 1Additions to borrowings and loans 1,186 - 1,186 (241) 945Repayments of borrowings and loans (831) - (831) 219 (612)Dividends paid to non-controlling interests (43) - (43) 36 (7)Interest paid (143) - (143) 21 (122)Net cash from financing activities 908 - 908 (431) 477Net increase/(decrease) in cash and cash equivalents (475) - (475) (34) (509)Net cash at 1 January 692 - 692 23 715Net increase/(decrease) in net cash (475) - (475) (34) (509)Currency differences (8) - (8) 1 (7)Net cash end of period 208 - 208 (8) 200** change in presentation described in Note 6.2.7.D
Reconciliation of the net cash December 2013
Restatedfinancial
statements
IFRS 10&11Impact
December 2013Published
financialstatements
Cash and cash equivalents 208 (8) 200Bank overdrafts - - -Net cash end of period 208 (8) 200
SBM Offshore N.V. 2014 Annual Report 142
F. Critical Accounting Policies
Critical accounting policies involving a high degree of judgment or complexity, or areas where assumptions andestimates are material, are disclosed in the paragraphs below.
(a) Use of estimates and judgment
When preparing the financial statements, it is necessary for the Management of the Company to make estimates andcertain assumptions that can influence the valuation of the assets and liabilities and the outcome of the incomestatement. The actual outcome may differ from these estimates and assumptions, due to changes in facts andcircumstances. Estimates and judgments are continually evaluated and are based on historical experience and otherfactors, including expectations of future events that are believed to be reasonable.
Estimates:
Significant areas of estimation and uncertainty in applying accounting policies that have the most significant impact onamounts recognised in the financial statements are:
The measurement of revenues and costs at completion, and margin recognition on construction contracts based on thestage of completion method:
Gross margin at completion and revenue at completion are reviewed periodically and regularly throughout the life of thecontract. They require to make a large number of estimates, especially of the total expected costs at completion, due tothe high complexity of the Company’s construction contracts.Judgment is also required for the recognition of variation orders, incentives and claims from clients where negotiations ordiscussions, are at a sufficiently advanced stage.The gross margin at completion reflects at each reporting period, the management’s current best estimate of theprobable future benefits and obligations associated with the contract.
The impairment of property, plant and equipment and intangible assets:
Some assumptions and estimates used in the discounted cash flow model and the adjusted present value model todetermine the value in use of assets or group of assets are subject to uncertainty. There is a possibility that changes incircumstances or in market conditions could impact the recoverable amount of the asset or group of assets.
The anticipated useful life of the leased facilities:
Management uses its experience to estimate the remaining useful life of an asset. The actual useful life of an asset maybe impacted by an unexpected event that may result in an adjustment to the carrying amount of the asset.
The Company's taxation:
The Company is subject to income taxes in numerous jurisdictions. Significant judgment is required in determining theworldwide provision for income taxes. There are many transactions and calculations for which the ultimate taxdetermination is uncertain during the ordinary course of business. The Company recognises liabilities for anticipated taxaudit issues based on estimates of whether additional taxes will be due. Where the final tax outcome of these matters isdifferent from the amounts that were initially recorded, such differences will influence the income tax and deferred taxprovisions in the period in which such determination is made.
The Company’s exposure to litigation with third parties and non-compliance:
The Company identifies and provide analysis on a regular basis, of current litigations and measures, when necessary,provisions on the basis of its best estimate of the expenditure required to settle the obligation, taking into accountinformation available and different possible outcomes at the reporting period.
SBM Offshore N.V. 2014 Annual Report 143
Judgments:
In addition to the above estimates, the Management exercises the following judgments:
Lease classification:
When the Company enters into a new lease arrangement, the terms and conditions of the contract are analysed in orderto assess whether the Company retains or not the significant risks and rewards of ownership of the asset subject of thelease contract. In applying the criteria provided by IAS 17 “Leases”, the Company can make significant judgment todetermine whether the arrangement results in a finance lease or an operating lease. This judgment can have asignificant effect on the amounts recognised in the consolidated financial statements.
The timing and estimated cost of demobilisation:
The estimated future costs of demobilisation are reviewed on a regular basis and adjusted when appropriate.Nevertheless, considering the long term expiry date of the obligation, these costs are subject to uncertainty. Indeed, costestimates can vary in response to many factors, including for example new demobilisation techniques, the ownCompany’s experience on demobilisation operations, future changes in laws and regulations, and timing ofdemobilisation operation.
Estimates and assumptions made in determining these obligations, can therefore lead to significant adjustments to thefuture financial results. Nevertheless, the cost of demobilisation obligations at the reporting date representmanagements’ best estimate of the present value of the future costs required.
(b) Leases: accounting by lessor
A lease is an agreement whereby the lessor conveys to the lessee, in return for a payment, or series of payments, theright to use an asset for an agreed period of time.
Leases in which a significant portion of the risk and rewards of ownership are retained by the lessor are classified asoperating leases. Under an operating lease, the asset is included in the statement of financial position as property, plantand equipment. Lease income is recognised over the term of the lease on a straight-line basis. This implies therecognition of deferred income when the contractual day rates are not constant during the initial term of the leasecontract.
When assets are leased under a finance lease, the present value of the lease payments is recognised as a financialasset. Under a finance lease, the difference between the gross receivable and the present value of the receivable isrecognised as revenue. Lease income is, as of the commencement date of the lease contract, recognised over the termof the lease using the net investment method, which reflects a constant periodic rate of return. During the constructionphase of the facility, the contract is treated as a construction contract, whereby the percentage of completion method isapplied.
(c) Impairment of non-financial assets
Under certain circumstances, impairment tests must be performed. Assets that have an indefinite useful life, for examplegoodwill, are tested annually for impairment and whenever events or changes in circumstances indicate that the carryingamount may not be recoverable. Other assets that are subject to amortisation or depreciation are tested for impairmentwhenever events or changes in circumstances indicate that the carrying amount may not be recoverable.
The recoverable amount is the higher of an asset’s or cash-generating-unit’s (CGU’s) fair value less costs of disposaland its value-in-use. The recoverable amount is determined for an individual asset, unless the asset does not generatecash inflows that are largely independent of those from other assets or group of assets. An impairment loss is recognisedfor the amount by which the asset’s or CGU’s carrying amount exceeds its recoverable amount.
In assessing value in use, the estimated future cash flows are discounted to their present value using a pre-tax discount
SBM Offshore N.V. 2014 Annual Report 144
rate that reflects current market assessments of the time value of money, and risks specific to the asset. The Companybases its future cash flows on detailed budgets and forecasts.
Non-financial assets, other than goodwill, that have been impaired are reviewed for possible reversal of the impairmentat each statement of financial position date.
(d) Impairment of financial assets
The Company assesses whether there is objective evidence that a financial asset or group of financial assets (togetherreferred to as “financial asset”) may be impaired at the end of each reporting date. An impairment exists if one or moreevents (a ‘loss event’) that have occurred after the initial recognition of the asset, has an impact on the estimated futurecash flows of the financial asset that can be reliably estimated. The criteria that the Company uses to determine whetherthere is objective evidence of an impairment loss include:
significant financial difficulty of the obligor●
a breach of contract, such as a default or delinquency in interest or principal payments●
the Company, for economic or legal reasons relating to the borrower’s financial difficulty, grant to the borrower a concession that the●
lender would not otherwise consider
it becomes probable that the borrower will enter bankruptcy or other financial reorganisation●
national or local economic conditions that correlate with defaults on the financial assets●
The amount of the impairment is measured as the difference between the asset’s carrying amount and the present valueof the estimated future cash flows (excluding future credit losses that have not yet been incurred) discounted at thefinancial asset’s original effective interest rate. The asset’s carrying amount is reduced by the impairment which isrecognised in the income statement. If the financial asset has a variable interest rate, the discount rate for measuring anyimpairment loss is the current effective interest rate determined under the contract.
If, in a subsequent period, the amount of the impairment loss decreases and the decrease can be related objectively toan event occurring after the impairment was recognised, the reversal of the previously recognised impairment loss isrecognised in the income statement.
Impairment on trade and other receivables is described later in Section 6.2.7.G. Significant accounting policies.
(e) Revenue
Revenue is shown net of value-added tax, returns, rebates and discounts and after eliminating sales within the group.
Construction contracts
Construction contracts are accounted for in accordance with IAS 11 "Construction contracts". Revenue and gross marginare recognised at each period based upon the advancement of the work-in-progress, using the percentage ofcompletion. The percentage of completion is calculated based on the ratio of costs incurred to date to total estimatedcosts. Margin is recognised only when the visibility of the riskiest stages of the contract is deemed sufficient and whenestimates of costs and revenues are considered to be reliable.
Complex projects that present a high risk profile due to technical novelty, complexity or pricing arrangements agreed withthe client are subject to gate reviews at advanced degrees of completion in engineering prior to recognition of margin,typically around 25% complete. Until this point, no margin is recognised, with revenue recognised to the extent of costincurred.
Due to the nature of the services performed, variation orders and claims are commonly billed to clients in the normalcourse of business. Additional contract revenue arising from variation orders is recognised when it is more than probablethat the client will approve the variation and the amount of revenue arising from the variation can be reliably measured.Revenue resulting from claims is recognised in contract revenue only when negotiations have reached an advanced
SBM Offshore N.V. 2014 Annual Report 145
stage such that it is more than probable that the client will accept the claim and that the amount can be measuredreliably.
Provisions for anticipated losses are made in full in the period in which they become known.
Lease and operate contracts
Revenue from long-term operating lease contracts is reported on a straight-line basis over the period of the contract oncethe facility has been brought into service. The difference between straight-line revenue and the contractual day-rates,which may not be constant throughout the charter, is included as deferred income. Revenue from finance lease contractsis, as of the commencement date of the lease contract, recognised over the term of the lease using the net investmentmethod, which reflects a constant periodic rate of return.
(f) Construction work in progress
Construction work in progress is stated at cost plus profit recognised to date less any provisions for foreseeable lossesand less invoiced instalments. Cost includes all expenditures related directly to specific projects and attributableoverhead. Where instalments exceed the value of the related costs, the excess is included in current liabilities. Advancesreceived from customers are also included in current liabilities.
(g) Demobilisation obligations
The demobilisation obligations of the Company are either stated in the lease contract or derive from the internationalconventions and the specific legislation applied in the countries where the company builds assets. Demobilisation costswill be incurred by the Company at the end of the operating life of the Company’s facilities.
For operating leases, the net present value of the future obligations is included in property, plant and equipment with acorresponding amount included in the provision for demobilisation. As the remaining duration of each lease reduces, andthe discounting effect on the provision unwinds, accrued interest is recognised as part of financial expenses and addedto the provision. The subsequent updates of the measurement of the demobilisation costs are recognised both impactingthe provision and the asset.
For finance leases, demobilisation obligations are analysed as a component of the sale recognised under IAS 17"Leases". Therefore, because of the fact that demobilisation operation is performed at a later stage, the related revenueis deferred until demobilisation operations occur. The subsequent updates of the measurement of the demobilisationcosts are recognised immediately through deferred revenue, for the present value of the change.
SBM Offshore N.V. 2014 Annual Report 146
G. Significant Accounting Policies
The consolidated financial statements of the Company have been prepared on the historical cost basis except for therevaluation of certain financial instruments.
(a) Distinction between current and non current assets and liabilities
The distinction between current assets and liabilities, and non-current assets and liabilities is based on their maturity.Assets and liabilities are classified as “current” if their maturity is less than twelve months or “non-current” if their maturityexceeds twelve months.
(b) Consolidation
The Company’s consolidated financial statements include the financial statements of all controlled subsidiaries.
Subsidiaries:
Subsidiaries are all entities over which the group has control. The group controls an entity when the group is exposed to,or has rights to, variable returns from its involvement with the entity and has the ability to affect those returns through itspower over the entity. Subsidiaries are consolidated using the global integration method.
All reciprocal transactions between two controlled subsidiaries, with no profit or loss impact at consolidation level, arefully eliminated for the preparation of the consolidated financial statements.
Interests in joint ventures:
The group has applied IFRS 11 “Joint arrangement” to all joint arrangements. Under IFRS 11 investment in jointarrangements are classified as either joint operations or joint ventures depending on the contractual rights andobligations of each investor. The group has assessed the nature of its joint arrangements and determined them to bejoint ventures.
Investments in associates:
Associates are all entities over which the Company has significant influence. Significant influence is the power toparticipate in the financial and operating policy decisions of the investee, but is not control over those policies.Investments in associates are accounted for under the equity method.
When losses of an equity-accounted entity are greater than the value of the Company’s net investment in that entity,these losses are not recognised unless the Company has a constructive obligation to fund the entity. The share of thenegative net equity of these is first accounted for against the loans held by the owner towards the equity-accountedcompany. Any excess is accounted for under provisions.
Reciprocal transactions carried out between a subsidiary and an equity-accounted entity, are not eliminated for thepreparation of the consolidated financial statements. Only transactions leading to an internal profit (like for dividends orinternal margin on asset sale) are eliminated applying the percentage owned in the equity-accounted entity.
The financial statements of the subsidiaries, associates and joint venture are prepared for the same reporting period asthe Group. When necessary, adjustments are made to bring the accounting policies in line with those of the Company.
(c) Non-derivatives financial assets
The Company classifies its financial assets into finance lease receivables, corporate debt securities and loans to jointventures and associates. Trade and other receivables, even when they are financial assets according to IFRS definitions,are considered separately.
SBM Offshore N.V. 2014 Annual Report 147
Finance leases are non-derivative financial assets with fixed or determined payments that are not quoted in an activemarket.
Corporate debt securities relates to fixed-rate bonds, issued by internationally known companies, quoted in liquidmarkets with fixed maturities, have bullet repayments at maturity and investment grade ratings at issuance. Theseinstruments are classified as “held-to-maturity” as the Company has the ability and intention to hold to maturity.Assuming the criteria was not met, they would be classified as available-for-sale. They are measured at fair value lesstransaction costs at initial recognition and subsequently measured at amortised cost. Any difference between theproceeds (net of transaction costs) and the redemption value, is recognised in the consolidated income statement overthe period of the borrowings, using the effective interest method.
Loans to joint ventures and associates relate primarily to interest-bearing loans to joint ventures. These financial assetsare initially measured at fair value less transaction costs (if any) and subsequently measured at amortised cost.
Corporate debt securities and loans to joint ventures and associates are recognised on settlement date being the date onwhich cash is paid or received.
A financial asset or a group of financial assets is considered to be impaired only if objective evidence indicates that oneor more events ('loss events'), happening after its initial recognition, have an effect on the estimated future cashflows ofthat asset. For loans to joint-ventures and subsidiaries, as the company has visibility over the expected cash inflows andoutflows of the counterparty (joint venture), impairment occurs as soon as there is evidence that the asset will not be dulyrepaid.
(d) Borrowings (bank and other loans)
Borrowings are recognised on settlement date being the date on which cash is paid or received. They are initiallyrecognised at fair value, net of transaction costs incurred (transaction price), subsequently measured at amortised costand classified as current liabilities unless the Company has an unconditional right to defer settlement of the liability for atleast twelve months after the statement of financial position date.
Borrowing costs are recognised as an expense in the period in which they are incurred.
(e) Operating segment information
As per IFRS 8, an operating segment is a component of an entity:
that engages in business activities from which it may earn revenues and incur expenses●
whose operating results are regularly reviewed by the entity’s chief operating decision maker●
for which distinct financial information is available●
The Management Board, as chief operating decision maker, monitors the operating results of its operating segmentsseparately for the purpose of making decisions about resource allocation and performance assessment. Segmentperformance is evaluated based on Revenue, Gross Margin and EBIT.
The Group has two reportable segments:
the Lease and Operate segment includes all earned day-rates on long-term operating lease and operate contracts. In the case of a●
finance lease, revenue is recognised during the construction and installation period within the Turnkey segment. As of the
commencement date of a finance lease contract, interest income is shown in this segment
the Turnkey segment includes Monaco, Houston, Schiedam and Kuala Lumpur execution centres that derive revenues from turnkey●
supply contracts and after-sales services, which consist mainly of large production systems, large mooring systems, deep water export
systems, fluid transfer systems, tanker loading and discharge terminals, design services and supply of special components and
proprietary designs and equipment
SBM Offshore N.V. 2014 Annual Report 148
No operating segments have been aggregated to form the above reportable operating segments.
The Company’s corporate overhead functions do not consitute an operating segment as defined by IFRS 8 "Operatingsegments" and are reported under the "Other" section in the Note 1 "Operating segments".
Operating segments are measured under Directional Reporting accounting policies, which main principles are thefollowing:
- all lease contracts are classified and accounted for as if they were operating lease contracts. Some Lease and Operatecontracts may provide for defined invoicing ("upfront payments") to the client occurring during the construction phase orat first-oil (beginning of the lease phase), to cover specific construction work and/or services performed during theconstruction phase. These "upfront payments" are recognised as revenues and the costs associated to the constructionwork and/or services are recognised as "Cost of sales" with no margin during the construction. As a consequence, thesecosts are not capitalised in the gross value of the assets under construction at joint venture level.
- all joint-ventures related to lease and operate contracts are accounted for at Company's share using the proportionateconsolidation method (where all lines of the income statement are accounted for using the Company's percentage ofownership).
- all other accounting principles remained unchanged compared to applicable IFRS standards.
The above differences to the consolidated financial statements under IFRS are pointed out in the reconciliationsprovided in Note 1 "Operating segments" on the revenue, the EBIT and other significant items, as required by IFRS 8"Operating segments".
(f) Foreign currency transactions and derivative financial instruments
Foreign currency transactions are translated into the functional currency, the US Dollar, at the exchange rate applicableon the transaction date. At the closing date, monetary assets and liabilities stated in foreign currencies are translated intothe functional currency at the exchange rate prevailing on that date. Resulting exchange gains or losses are directlyrecorded in the income statement, except exchange gains or losses on cash accounts eligible for future cash flowhedging on net foreign currency investments.
Translation of foreign currency income statements of subsidiaries into US Dollars are converted at the average exchangerate prevailing during the year. Statements of financial position are translated at the exchange rate at the closing date.Differences arising in the translation of financial statements of foreign subsidiaries are recorded in other comprehensiveincome as foreign currency translation reserve. On consolidation, exchange differences arising from the translation of thenet investment in foreign entities, and borrowings of such investments, are taken to Company equity.
Derivative financial instruments held by the Company are aimed at hedging risks associated with market risk fluctuations.A derivative instrument qualifies for hedge accounting (cash flow hedge or net investment hedge) when there is formaldesignation and documentation of the hedging relationship, and of the effectiveness of the hedge throughout the life ofthe contract. A cash flow hedge aims at reducing risks incurred by variations in the value of future cash flows that mayimpact net income. A net investment hedge aims at reducing risks incurred by variations in the value of the netinvestment in a foreign operation.
In order for a derivative to be eligible for hedge accounting treatment, the following conditions must be met:
its hedging role must be clearly defined and documented at the date of inception●
its efficiency should be proven at the date of inception and as long as it remains highly effective in offsetting exposure to changes in●
the fair value of the hedged item or cash flows attributable to the hedged risk
All derivative instruments are recorded and disclosed in the statement of financial position at fair value. Where a portion
SBM Offshore N.V. 2014 Annual Report 149
of a financial derivative is expected to be realised within twelve months of the reporting date, that portion should bepresented as current; the remainder of the financial derivative should be shown as non-current.
Changes in fair value of derivatives designated as cash flow or net investment hedge relationships are recognised asfollows:
the effective portion of the gain or loss of the hedging instrument is recorded directly in other comprehensive income, and the●
ineffective portion of the gain or loss on the hedging instrument is recorded in the income statement. The exchange gain or loss which
is deferred in equity, is reclassified to the net income in the period(s) in which the specified hedged transaction affects the income
statement
the changes in fair value of derivative financial instruments that do not qualify as hedging in accounting standards are directly recorded●
in the income statement
When measuring the fair value of a financial instrument, the Company uses market observable data as long as possible.Fair values are categorised into different levels in a fair value hierarchy based on the inputs used in the valuationtechniques. Further information about the fair value measurement of financial derivatives is included in the Note 26"Financial Instruments - Fair values and risk management".
(g) Offsetting financial instruments
Financial assets and liabilities are offset and the net amount is reported in the statement of financial position when thereis a legally enforceable right to offset the recognised amounts and there is an intention to settle on a net basis, or realisethe asset and settle the liability simultaneously.
(h) Provisions
Provisions are recognised if and only if the following criteria are simultaneously met:
the Company has an ongoing obligation (legal or constructive) as a result of a past event●
it is probable that an outflow of resources embodying economic benefits will be required to settle the obligation●
the amount of the obligation can be reliably estimated; provisions are measured according to the risk assessment or the exposed●
charge, based upon best-known elements
Demobilisation provisions relate to estimated costs for demobilisation of leased facilities at the end of the respectivelease period or operating life.
Warranties provisions relate to the Company’s obligations to replace or repair defective items that become apparentwithin an agreed period starting from final acceptance of the delivered system. Such warranties are provided tocustomers on most turnkey sales. These provisions are estimated on a statistical basis regarding the Company’s pastexperience or on an individual basis in the case of any warranty claim already identified. This provision is classified ascurrent by nature as it coincides with the production cycle of the Company.
(i) Property, plant and equipment
Property, plant and equipment are stated at cost less accumulated depreciation and accumulated impairment losses.
Historical cost includes expenditure that is directly attributable to the acquisition of such items. The capital value of afacility to be leased and operated for a client is the sum of external costs (such as shipyards, subcontractors, suppliers),internal costs (design, engineering, construction supervision, etc.), third party financial costs including interest paidduring construction and attributable overheads.
Subsequent costs are included in the assets’ carrying amount or recognised as a separate asset, as appropriate, onlywhen it is probable that future economic benefits associated with the item will flow to the Company and the cost of theitem can be measured reliably. The costs of assets include the initial estimate of costs of demobilisation of the asset net
SBM Offshore N.V. 2014 Annual Report 150
of reimbursement expected to be received by the client. All other repairs and maintenance are charged to the incomestatement during the financial period in which they are incurred.
When significant parts of an item of property, plant and equipment have different useful lives, those components areaccounted for as separate line items of property, plant and equipment. With the exception of the ThunderHawk facility,depreciation is calculated on a straight-line basis as follows:
Converted tankers 10-20 years (including in Vessels and floating equipment)●
Floating equipment 3-15 years (including in Vessels and floating equipment)●
Buildings 30-50 years●
Other assets 2-20 years●
Land is not depreciated●
The depreciation charge for the Thunder Hawk facility is calculated based on its future anticipated economic benefits.This results in a depreciation charge partly based on the units of production method and, for the other part, based on thestraight-line method.
Useful lives and methods of depreciation are reviewed at least annually, and adjusted if appropriate.
The assets’ residual values are reviewed and adjusted, if appropriate, at each statement of financial position date. Anasset’s carrying amount is written down immediately to its recoverable amount if the asset’s carrying amount is higherthan its estimated recoverable amount.
Gains and losses arising on disposals or retirement of assets are determined by comparing any sales proceeds and thecarrying amount of the asset. These are reflected in the income statement in the period that the asset is disposed of orretired.
(j) Intangible assets
Goodwill represents the excess of the cost of an acquisition over the fair value of the Company’s share of the netidentifiable assets of the acquired subsidiary at the date of the acquisition.
Goodwill is allocated to cash-generating units (CGUs) for the purpose of the annual impairment testing.
Patents are amortised on a straight-line basis over their useful life, generally over fifteen years.
Research costs are expensed when incurred. In compliance with IAS 38, development costs are capitalised if all of thefollowing criteria are met:
the projects are clearly defined●
the Company is able to reliably measure expenditures incurred by each project during its development●
the Company is able to demonstrate the technical feasibility of the project●
the Company has the financial and technical resources available to achieve the project●
the Company can demonstrate its intention to complete, to use or to commercialise products resulting from the project●
the Company is able to demonstrate the existence of a market for the output of the intangible asset, or, if it is used internally, the●
usefulness of the intangible asset
When capitalised, research costs are carried at cost less any accumulated amortisation. Amortisation begins when theproject is complete and available for use. It is amortised over the period of expected future benefit, which is generallybetween three and five years.
(k) Assets (or disposal groups) held for sale
The Company classifies assets or disposal groups as being held for sale when their carrying amount will be recovered
SBM Offshore N.V. 2014 Annual Report 151
principally through a sale transaction rather than through continuing use. This classification is performed when thefollowing criteria are met:
management has committed to a plan to sell the asset or disposal group●
the asset or disposal group is available for immediate sale in its present condition●
an active program to locate a buyer and other actions required to complete the plan to sell the asset or disposal group have been●
initiated
the sale of the asset or disposal group is highly probable●
transfer of the asset or disposal group is expected to qualify for recognition as a completed sale, within one year●
the asset or disposal group is being actively marketed for sale at a price that is reasonable in relation to its current fair value●
actions required to complete the plan indicate that it is unlikely that significant changes to the plan will be made or that the plan will be●
withdrawn
Assets or disposal groups classified as held for sale are measured at the lower of their carrying value or fair value lesscosts of disposal. Non-current assets are not depreciated once they meet the criteria to be held for sale and are shownseparately on the face of the consolidated statement of financial position.
When an asset or disposal group previously classified as assets held for sale, is sold and lease back, the lease backtransaction is analysed regarding IAS 17 “Leases”. For a sale and leaseback transaction that results in a finance lease,any excess of proceeds over the carrying amount is deferred and amortised over the lease term. If a sale and leasebacktransaction results in an operating lease, and it is clear that the transaction is established at fair value, the profit or loss isrecognised immediately.
(l) Inventories
Inventories are valued at the lower of cost or net realisable value. Cost is determined using the first-in first-out method.Net realisable value is the estimated selling price in the ordinary course of business, less the estimated cost ofcompletion and selling expenses. Inventories comprise semi-finished and finished products valued at cost includingattributable overheads and spare parts stated at the lower of purchase price or market value.
(m) Trade and other receivables
Trade receivables are recognised initially at fair value and subsequently measured at fair value less impairment. At eachbalance sheet date, the Company assesses whether any indications exist that a financial asset or group of financialassets is impaired.
In relation to trade receivables, a provision for impairment is made when there is objective evidence that the Companymay not be able to collect all of the amounts due. Impaired trade receivables are derecognised when they aredetermined to be uncollectible.
Other receivables are carried at amortised cost, using the effective interest rate method. Interest income, together withgains and losses when the receivables are derecognised or impaired, is recognised in the income statement.
(n) Cash and cash equivalents
Cash and cash equivalents consist of cash in bank and in hand fulfilling the following criteria: a maturity of usually lessthan three months, highly liquid, a fixed exchange value and an extremely low risk of loss of value.
(o) Share capital
Ordinary Shares and Protective Preference Shares are classified as equity. Incremental costs directly attributable to theissue of new shares are shown in equity as a deduction, net of tax, from the proceeds.
(p) Income tax
SBM Offshore N.V. 2014 Annual Report 152
The tax expense for the period comprises current and deferred tax. Tax is recognised in the income statement, except tothe extent that it relates to items recognised in other comprehensive income or directly in equity. In this case the tax isalso recognised in other comprehensive income or directly in equity.
Income tax expenses comprise corporate income tax due in countries of incorporation of the Company's mainsubsidiaries and levied on actual profits. Income tax expense also includes the corporate income taxes which are leviedon a deemed profit basis and revenue basis (withholding taxes). This presentation adequately reflects SBM Offshore'sglobal tax burden.
(q) Deferred income tax
Deferred income tax is recognised using the liability method, on temporary differences arising between the tax bases ofassets and liabilities and their carrying amounts in the financial statements. Deferred tax is determined using tax ratesand laws that have been enacted or substantially enacted by the statement of financial position date and are expected toapply when the related deferred tax asset is realised or the deferred tax liability is settled.
Deferred tax assets are recognised only to the extent that it is probable that future taxable profit will be available againstwhich the temporary differences can be utilised. Deferred tax is provided for on temporary differences arising oninvestments in subsidiaries and associates, except where the timing of the reversal of the temporary difference iscontrolled by the Company and it is probable that the temporary difference will not reverse in the foreseeable future.
(r) Employee benefits
Pension obligations: the Company operates various pension schemes that are generally funded through paymentsdetermined by periodic actuarial calculations to insurance companies or are defined as multi-employer plans. TheCompany has both defined benefit and defined contribution plans:
a defined benefit plan is a pension plan that defines an amount of pension benefit that an employee will receive on retirement, usually●
dependent on one or more factors such as age, years of service and compensation
a defined contribution plan is a pension plan under which the Company pays fixed contributions to public or private pension insurance●
plans on a mandatory, contractual or voluntary basis. The Company has no legal or constructive obligation to pay further contributions
if the fund does not hold sufficient assets to pay all employees the benefits relating to employee service in the current and prior
periods. The contributions to defined contribution plans and multi-employer plans are recognised as an expense in the income
statement as incurred
The liability recognised in the statement of financial position in respect of defined benefit pension plans is the presentvalue of the defined benefit obligation at the statement of financial position date less the fair value of the plan assets,together with adjustments for unrecognised actuarial gains and losses and past service costs. The defined benefitobligation is calculated periodically by independent actuaries using the projected unit credit method. The present value ofthe defined benefit obligation is determined by discounting the estimated future cash outflows using interest rates onhigh-quality corporate bonds that have maturity dates approximating the terms of the Company’s obligations.
The expense recognised under the EBIT comprises the current service cost and the effects of any change, reduction orwinding up of the plan. The accretion impact on actuarial debt and interest income on plan assets are recognised underthe net financing cost.
Cumulative actuarial gains and losses arising from experience adjustments and changes in actuarial assumptions arerecognised immediately in comprehensive income.
Share-based payments: within the Company there are three types of share based payment plans that qualify as equitysettled:
Restricted Share Unit (RSU)/ Performance Share Unit (PSU)●
SBM Offshore N.V. 2014 Annual Report 153
Performance shares●
Matching bonus shares●
The estimated total amount to be expensed over the vesting period related to share based payments is determined byreference to the fair value of the instruments determined at the grant date, excluding the impact of any non-marketvesting conditions. Non-market vesting conditions are included in assumptions about the number of shares that theemployee will ultimately receive. Main assumptions for estimates are revised at statement of financial position date. Totalcost for the period is charged or credited to the income statement, with a corresponding adjustment to equity.
When equity instruments are exercised, the Company issues new shares.
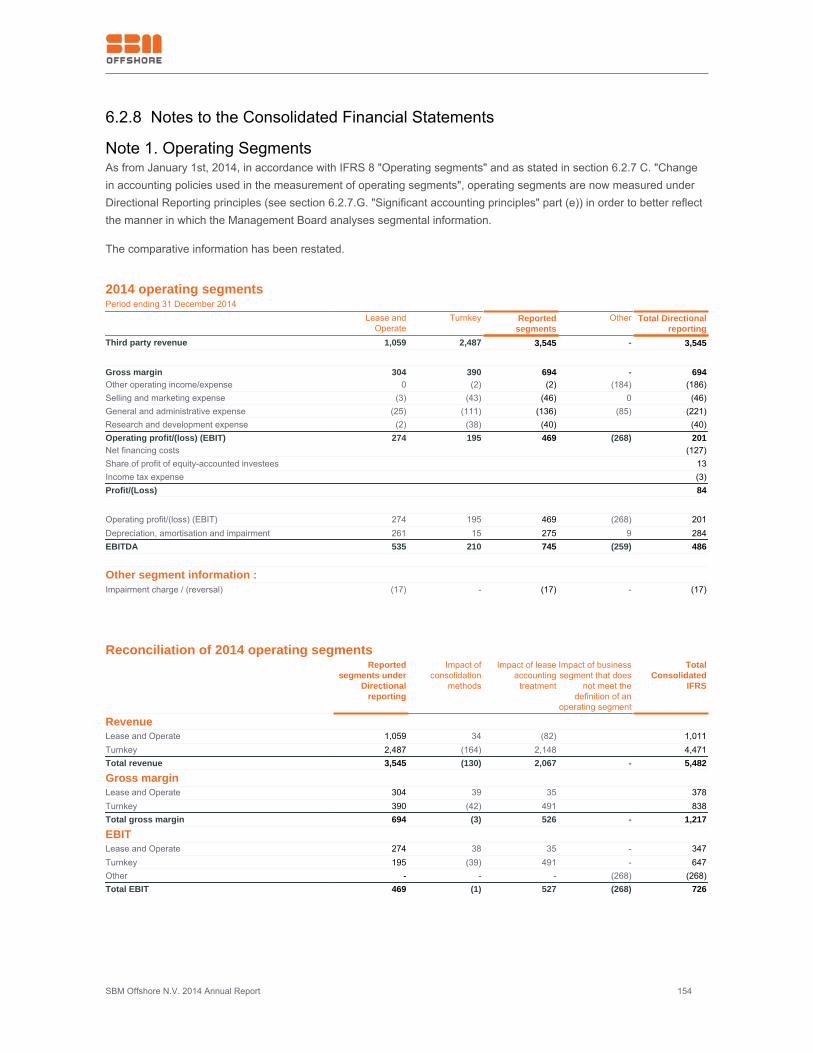
SBM Offshore N.V. 2014 Annual Report 154
6.2.8 Notes to the Consolidated Financial Statements
Note 1. Operating SegmentsAs from January 1st, 2014, in accordance with IFRS 8 "Operating segments" and as stated in section 6.2.7 C. "Changein accounting policies used in the measurement of operating segments", operating segments are now measured underDirectional Reporting principles (see section 6.2.7.G. "Significant accounting principles" part (e)) in order to better reflectthe manner in which the Management Board analyses segmental information.
The comparative information has been restated.
2014 operating segmentsPeriod ending 31 December 2014 Lease and
OperateTurnkey Reported
segmentsOther Total Directional
reportingThird party revenue 1,059 2,487 3,545 - 3,545 Gross margin 304 390 694 - 694Other operating income/expense 0 (2) (2) (184) (186)Selling and marketing expense (3) (43) (46) 0 (46)General and administrative expense (25) (111) (136) (85) (221)Research and development expense (2) (38) (40) (40)Operating profit/(loss) (EBIT) 274 195 469 (268) 201Net financing costs (127)Share of profit of equity-accounted investees 13Income tax expense (3)Profit/(Loss) 84
Operating profit/(loss) (EBIT) 274 195 469 (268) 201Depreciation, amortisation and impairment 261 15 275 9 284EBITDA 535 210 745 (259) 486
Other segment information :Impairment charge / (reversal) (17) - (17) - (17)
Reconciliation of 2014 operating segments Reported
segments underDirectional
reporting
Impact ofconsolidation
methods
Impact of leaseaccounting
treatment
Impact of businesssegment that does
not meet thedefinition of an
operating segment
TotalConsolidated
IFRS
RevenueLease and Operate 1,059 34 (82) 1,011Turnkey 2,487 (164) 2,148 4,471Total revenue 3,545 (130) 2,067 - 5,482
Gross marginLease and Operate 304 39 35 378Turnkey 390 (42) 491 838Total gross margin 694 (3) 526 - 1,217
EBITLease and Operate 274 38 35 - 347Turnkey 195 (39) 491 - 647Other - - - (268) (268)Total EBIT 469 (1) 527 (268) 726
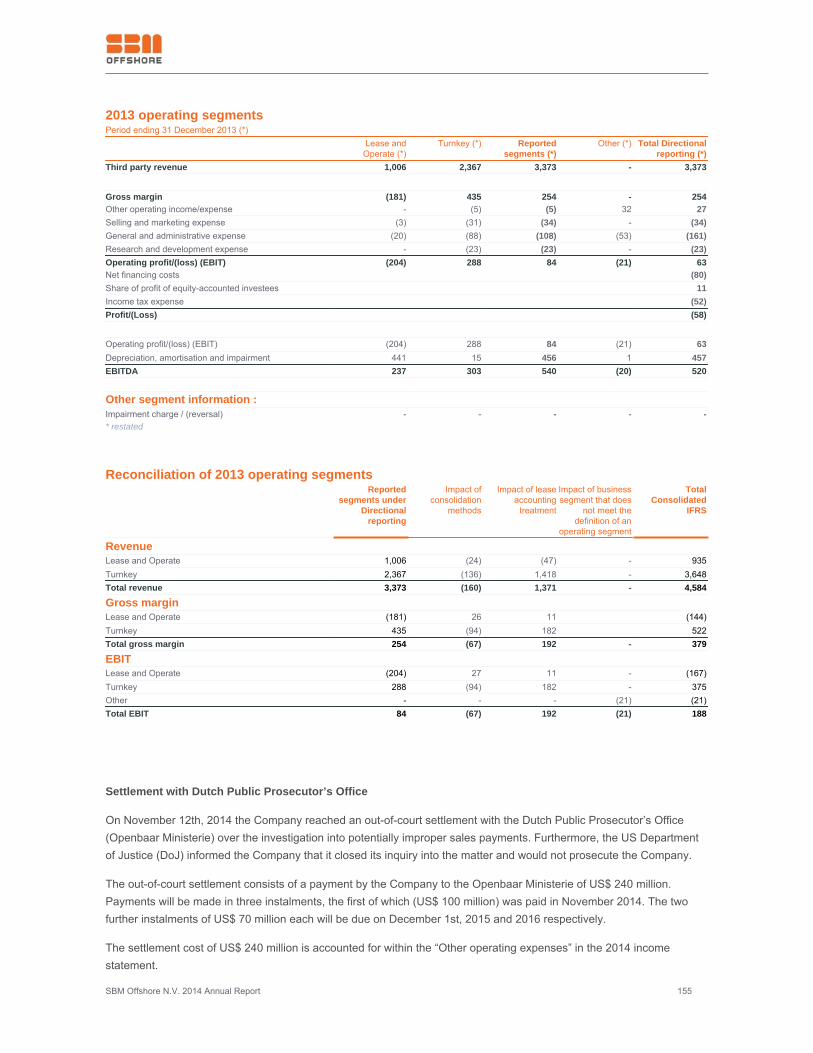
SBM Offshore N.V. 2014 Annual Report 155
2013 operating segmentsPeriod ending 31 December 2013 (*) Lease and
Operate (*)Turnkey (*) Reported
segments (*)Other (*) Total Directional
reporting (*)Third party revenue 1,006 2,367 3,373 - 3,373
Gross margin (181) 435 254 - 254Other operating income/expense - (5) (5) 32 27Selling and marketing expense (3) (31) (34) - (34)General and administrative expense (20) (88) (108) (53) (161)Research and development expense - (23) (23) - (23)Operating profit/(loss) (EBIT) (204) 288 84 (21) 63Net financing costs (80)Share of profit of equity-accounted investees 11Income tax expense (52)Profit/(Loss) (58)
Operating profit/(loss) (EBIT) (204) 288 84 (21) 63Depreciation, amortisation and impairment 441 15 456 1 457EBITDA 237 303 540 (20) 520
Other segment information :Impairment charge / (reversal) - - - - -* restated
Reconciliation of 2013 operating segments Reported
segments underDirectional
reporting
Impact ofconsolidation
methods
Impact of leaseaccounting
treatment
Impact of businesssegment that does
not meet thedefinition of an
operating segment
TotalConsolidated
IFRS
RevenueLease and Operate 1,006 (24) (47) - 935Turnkey 2,367 (136) 1,418 - 3,648Total revenue 3,373 (160) 1,371 - 4,584
Gross marginLease and Operate (181) 26 11 (144)Turnkey 435 (94) 182 522Total gross margin 254 (67) 192 - 379
EBITLease and Operate (204) 27 11 - (167)Turnkey 288 (94) 182 - 375Other - - - (21) (21)Total EBIT 84 (67) 192 (21) 188
Settlement with Dutch Public Prosecutor’s Office
On November 12th, 2014 the Company reached an out-of-court settlement with the Dutch Public Prosecutor’s Office(Openbaar Ministerie) over the investigation into potentially improper sales payments. Furthermore, the US Departmentof Justice (DoJ) informed the Company that it closed its inquiry into the matter and would not prosecute the Company.
The out-of-court settlement consists of a payment by the Company to the Openbaar Ministerie of US$ 240 million.Payments will be made in three instalments, the first of which (US$ 100 million) was paid in November 2014. The twofurther instalments of US$ 70 million each will be due on December 1st, 2015 and 2016 respectively.
The settlement cost of US$ 240 million is accounted for within the “Other operating expenses” in the 2014 incomestatement.
SBM Offshore N.V. 2014 Annual Report 156
Restructuring
On December 11th, 2014, the Company announced the process of releasing approximately 600 contractor staff and anequal number of permanent staff, totalling approximately 1,200 positions worldwide, over the period 2014 and 2015.Restucturing costs of US$ 8 million were accounted for within the "Other operating expense" regarding 2014 obligations.
Divestment program for non-core assets
On August 29th, 2014 the Company completed the sale and operating lease back of its Monaco real estate portfolio. Thelast of the three buildings was sold for approximately US$ 62 million net of expenses, resulting in a book profit ofapproximately US$ 58 million accounted for within the “Other operating income” in the 2014 income statement.
On December 1st, 2014 the Company also completed the all cash sale of the Diving Support and Construction Vessel(DSCV) SBM Installer to OS Installer AS for approximately US$ 150 million, resulting in a book profit of US$ 4 millionaccounted for within the “Other operating income” in the 2014 income statement. OS Installer AS is a new establishedjoint-venture between Ocean Yield (75%) and the Company (25%). The Company will charter the vessel under anoperating lease for a fixed period of 12 years and will have certain options to acquire the vessel during the bare boatcharter period, with the first option exercisable after five years.
Thunder Hawk
Following the signature on September 16th, 2014 of a Production Handling Agreement with Noble Energy, the Companyhas reversed the previously taken US$ 109 million impairment incurred on the semi-submersible facility in the US Gulf ofMexico. The value in use of the asset has been calculated based on estimated future cash flows including the tie back oftwo wells to the platform, and using a weighted average cost of capital of 6.9% (2013: 8.0%). The reversal is accountedfor within the "Cost of sales" of the Lease and Operate segment in the 2014 income statement.
Deep Panuke
The Company has reduced the useful life of the Deep Panuke Field Centre from ten to eight years in line with the fixedcontract period. This change of assumption decreases the recoverable amount based on the adjusted present valuemethod of the asset and results in a non-cash impairment charge of US$ 59 million recorded in the second half of 2014.The adjusted present value of the platform has been estimated based on estimated future cash flows including bareboat,operating expenditures and some winter bonus, using a weighted average cost of capital of 6.0% (2013: 8.0%) andassuming transferability to a third party of existing tax loss carried forward and Atlantic incentive tax credit. Theimpairment charge has been accounted for within the "Cost of sales" of the Lease and Operate segment in the 2014income statement.
Warranty fund
The Company has recorded a specific increase of the warranty provision at year-end of US$ 40 million, in relation to awarranty claim. The additional provision has been recorded within the "Cost of sales" of the Turnkey segment in the 2014income statement.
Financial Asset Impairment
The Company has taken a one-off impairment charge (non-cash) of assets of approximately US$ 49 million following adispute with a US-based client. This impairment is accounted for US$ 19 million within the “Cost of sales” of the TurnkeySegment and US$ 29 million within the “Net financing costs” in the 2014 income statement.
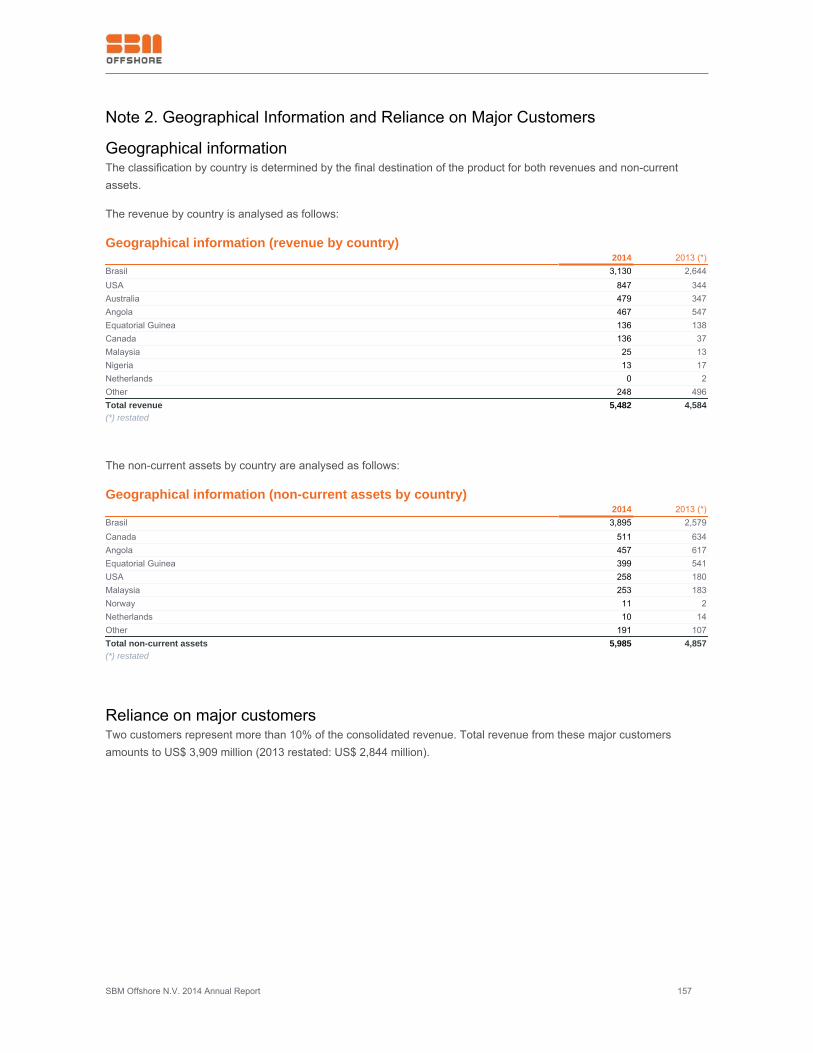
SBM Offshore N.V. 2014 Annual Report 157
Note 2. Geographical Information and Reliance on Major Customers
Geographical informationThe classification by country is determined by the final destination of the product for both revenues and non-currentassets.
The revenue by country is analysed as follows:
Geographical information (revenue by country)2014 2013 (*)
Brasil 3,130 2,644USA 847 344Australia 479 347Angola 467 547Equatorial Guinea 136 138Canada 136 37Malaysia 25 13Nigeria 13 17Netherlands 0 2Other 248 496Total revenue 5,482 4,584(*) restated
The non-current assets by country are analysed as follows:
Geographical information (non-current assets by country)2014 2013 (*)
Brasil 3,895 2,579Canada 511 634Angola 457 617Equatorial Guinea 399 541USA 258 180Malaysia 253 183Norway 11 2Netherlands 10 14Other 191 107Total non-current assets 5,985 4,857(*) restated
Reliance on major customersTwo customers represent more than 10% of the consolidated revenue. Total revenue from these major customersamounts to US$ 3,909 million (2013 restated: US$ 2,844 million).
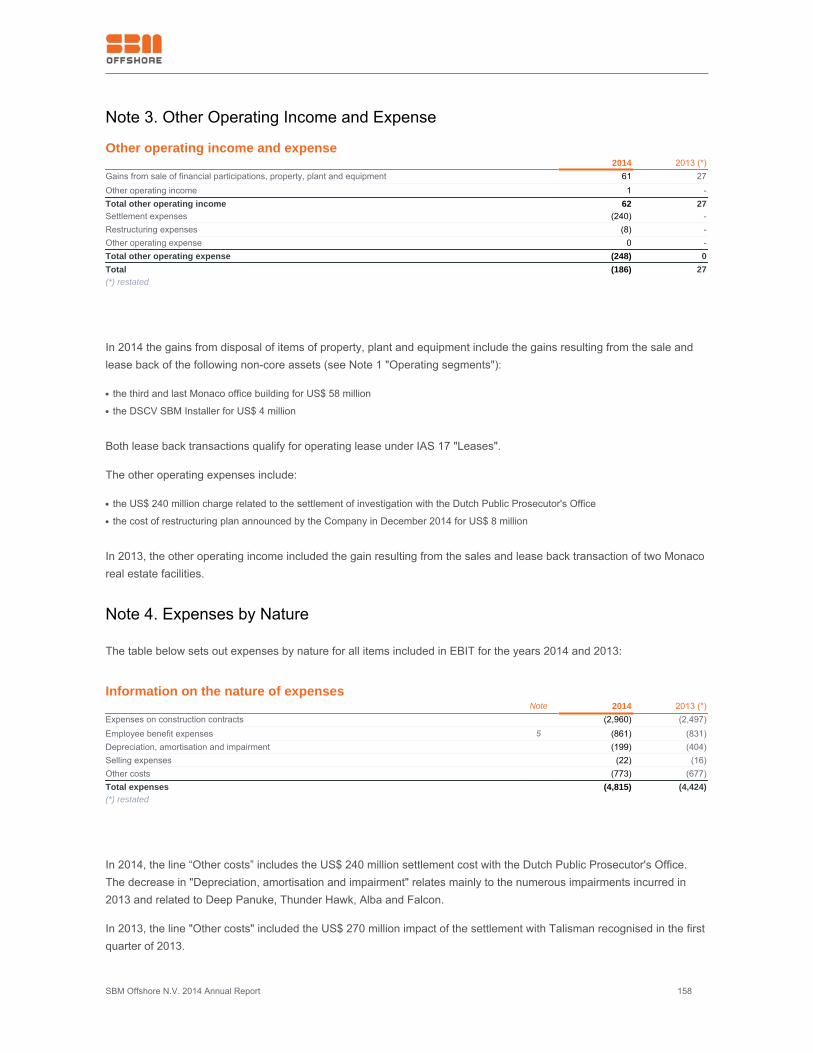
SBM Offshore N.V. 2014 Annual Report 158
Note 3. Other Operating Income and Expense
Other operating income and expense 2014 2013 (*)Gains from sale of financial participations, property, plant and equipment 61 27Other operating income 1 -Total other operating income 62 27Settlement expenses (240) -Restructuring expenses (8) -Other operating expense 0 -Total other operating expense (248) 0Total (186) 27(*) restated
In 2014 the gains from disposal of items of property, plant and equipment include the gains resulting from the sale andlease back of the following non-core assets (see Note 1 "Operating segments"):
the third and last Monaco office building for US$ 58 million●
the DSCV SBM Installer for US$ 4 million●
Both lease back transactions qualify for operating lease under IAS 17 "Leases".
The other operating expenses include:
the US$ 240 million charge related to the settlement of investigation with the Dutch Public Prosecutor's Office●
the cost of restructuring plan announced by the Company in December 2014 for US$ 8 million●
In 2013, the other operating income included the gain resulting from the sales and lease back transaction of two Monacoreal estate facilities.
Note 4. Expenses by Nature
The table below sets out expenses by nature for all items included in EBIT for the years 2014 and 2013:
Information on the nature of expenses Note 2014 2013 (*)Expenses on construction contracts (2,960) (2,497)Employee benefit expenses 5 (861) (831)Depreciation, amortisation and impairment (199) (404)Selling expenses (22) (16)Other costs (773) (677)Total expenses (4,815) (4,424)(*) restated
In 2014, the line “Other costs” includes the US$ 240 million settlement cost with the Dutch Public Prosecutor's Office.The decrease in "Depreciation, amortisation and impairment" relates mainly to the numerous impairments incurred in2013 and related to Deep Panuke, Thunder Hawk, Alba and Falcon.
In 2013, the line "Other costs" included the US$ 270 million impact of the settlement with Talisman recognised in the firstquarter of 2013.
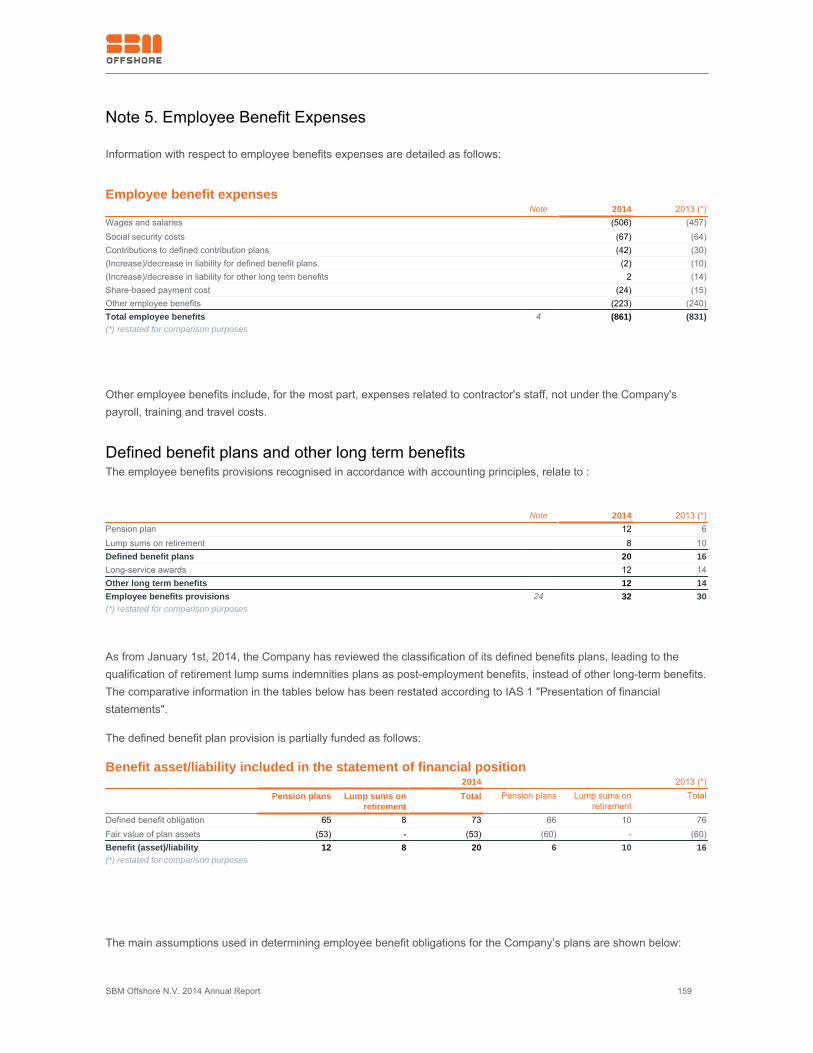
SBM Offshore N.V. 2014 Annual Report 159
Note 5. Employee Benefit Expenses
Information with respect to employee benefits expenses are detailed as follows:
Employee benefit expensesNote 2014 2013 (*)
Wages and salaries (506) (457)Social security costs (67) (64)Contributions to defined contribution plans (42) (30)(Increase)/decrease in liability for defined benefit plans (2) (10)(Increase)/decrease in liability for other long term benefits 2 (14)Share-based payment cost (24) (15)Other employee benefits (223) (240)Total employee benefits 4 (861) (831)(*) restated for comparison purposes
Other employee benefits include, for the most part, expenses related to contractor's staff, not under the Company'spayroll, training and travel costs.
Defined benefit plans and other long term benefitsThe employee benefits provisions recognised in accordance with accounting principles, relate to :
Note 2014 2013 (*)Pension plan 12 6Lump sums on retirement 8 10Defined benefit plans 20 16Long-service awards 12 14Other long term benefits 12 14Employee benefits provisions 24 32 30(*) restated for comparison purposes
As from January 1st, 2014, the Company has reviewed the classification of its defined benefits plans, leading to thequalification of retirement lump sums indemnities plans as post-employment benefits, instead of other long-term benefits.The comparative information in the tables below has been restated according to IAS 1 "Presentation of financialstatements".
The defined benefit plan provision is partially funded as follows:
Benefit asset/liability included in the statement of financial position 2014 2013 (*) Pension plans Lump sums on
retirementTotal Pension plans Lump sums on
retirementTotal
Defined benefit obligation 65 8 73 66 10 76Fair value of plan assets (53) - (53) (60) - (60)Benefit (asset)/liability 12 8 20 6 10 16(*) restated for comparison purposes
The main assumptions used in determining employee benefit obligations for the Company’s plans are shown below:
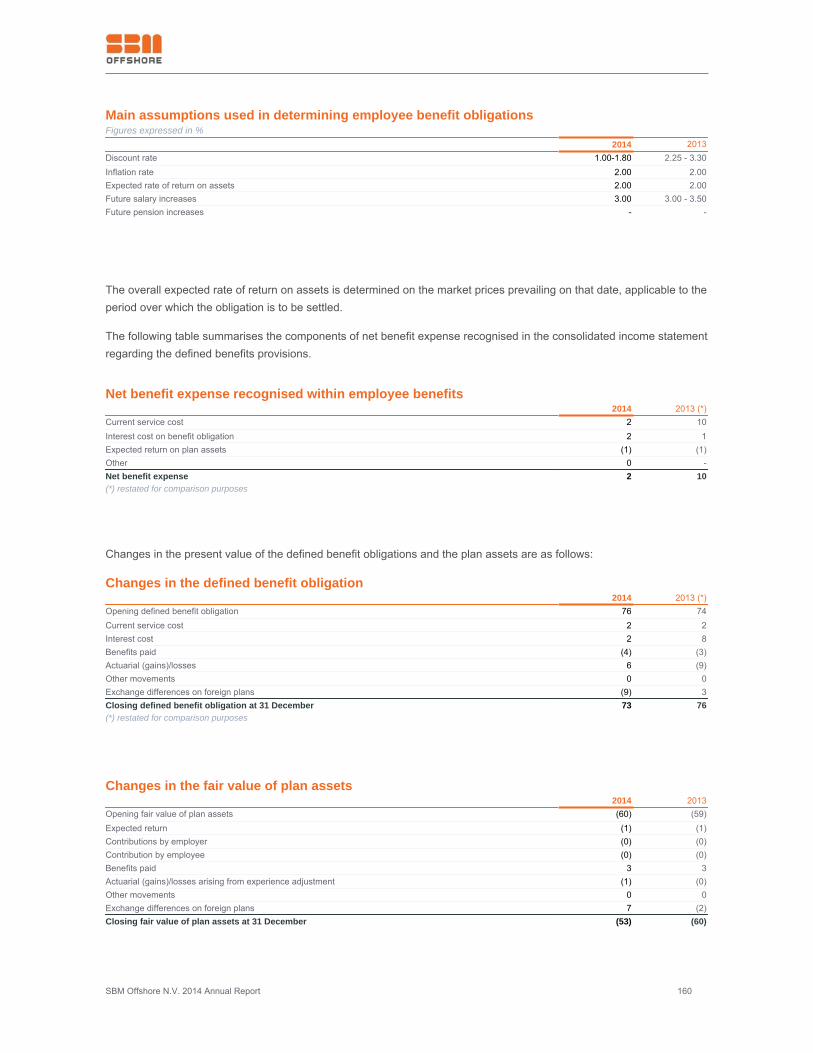
SBM Offshore N.V. 2014 Annual Report 160
Main assumptions used in determining employee benefit obligationsFigures expressed in %
2014 2013Discount rate 1.00-1.80 2.25 - 3.30Inflation rate 2.00 2.00Expected rate of return on assets 2.00 2.00Future salary increases 3.00 3.00 - 3.50Future pension increases - -
The overall expected rate of return on assets is determined on the market prices prevailing on that date, applicable to theperiod over which the obligation is to be settled.
The following table summarises the components of net benefit expense recognised in the consolidated income statementregarding the defined benefits provisions.
Net benefit expense recognised within employee benefits 2014 2013 (*)Current service cost 2 10Interest cost on benefit obligation 2 1Expected return on plan assets (1) (1)Other 0 -Net benefit expense 2 10(*) restated for comparison purposes
Changes in the present value of the defined benefit obligations and the plan assets are as follows:
Changes in the defined benefit obligation 2014 2013 (*)Opening defined benefit obligation 76 74Current service cost 2 2Interest cost 2 8Benefits paid (4) (3)Actuarial (gains)/losses 6 (9)Other movements 0 0Exchange differences on foreign plans (9) 3Closing defined benefit obligation at 31 December 73 76(*) restated for comparison purposes
Changes in the fair value of plan assets 2014 2013Opening fair value of plan assets (60) (59)Expected return (1) (1)Contributions by employer (0) (0)Contribution by employee (0) (0)Benefits paid 3 3Actuarial (gains)/losses arising from experience adjustment (1) (0)Other movements 0 0Exchange differences on foreign plans 7 (2)Closing fair value of plan assets at 31 December (53) (60)
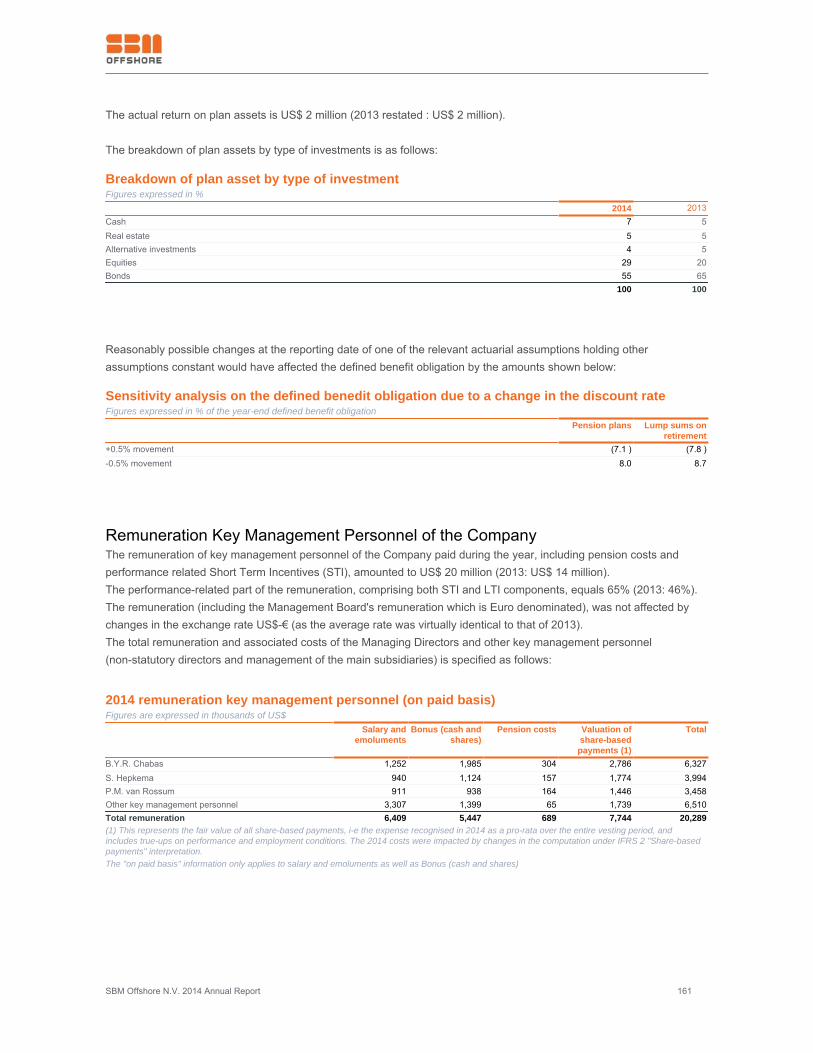
SBM Offshore N.V. 2014 Annual Report 161
The actual return on plan assets is US$ 2 million (2013 restated : US$ 2 million).
The breakdown of plan assets by type of investments is as follows:
Breakdown of plan asset by type of investmentFigures expressed in %
2014 2013Cash 7 5Real estate 5 5Alternative investments 4 5Equities 29 20Bonds 55 65 100 100
Reasonably possible changes at the reporting date of one of the relevant actuarial assumptions holding otherassumptions constant would have affected the defined benefit obligation by the amounts shown below:
Sensitivity analysis on the defined benedit obligation due to a change in the discount rateFigures expressed in % of the year-end defined benefit obligation
Pension plans Lump sums onretirement
+0.5% movement (7.1 ) (7.8 )-0.5% movement 8.0 8.7
Remuneration Key Management Personnel of the CompanyThe remuneration of key management personnel of the Company paid during the year, including pension costs andperformance related Short Term Incentives (STI), amounted to US$ 20 million (2013: US$ 14 million).The performance-related part of the remuneration, comprising both STI and LTI components, equals 65% (2013: 46%).The remuneration (including the Management Board's remuneration which is Euro denominated), was not affected bychanges in the exchange rate US$-€ (as the average rate was virtually identical to that of 2013).The total remuneration and associated costs of the Managing Directors and other key management personnel(non-statutory directors and management of the main subsidiaries) is specified as follows:
2014 remuneration key management personnel (on paid basis)Figures are expressed in thousands of US$
Salary andemoluments
Bonus (cash andshares)
Pension costs Valuation ofshare-basedpayments (1)
Total
B.Y.R. Chabas 1,252 1,985 304 2,786 6,327S. Hepkema 940 1,124 157 1,774 3,994P.M. van Rossum 911 938 164 1,446 3,458Other key management personnel 3,307 1,399 65 1,739 6,510Total remuneration 6,409 5,447 689 7,744 20,289(1) This represents the fair value of all share-based payments, i-e the expense recognised in 2014 as a pro-rata over the entire vesting period, andincludes true-ups on performance and employment conditions. The 2014 costs were impacted by changes in the computation under IFRS 2 "Share-basedpayments" interpretation.The "on paid basis" information only applies to salary and emoluments as well as Bonus (cash and shares)
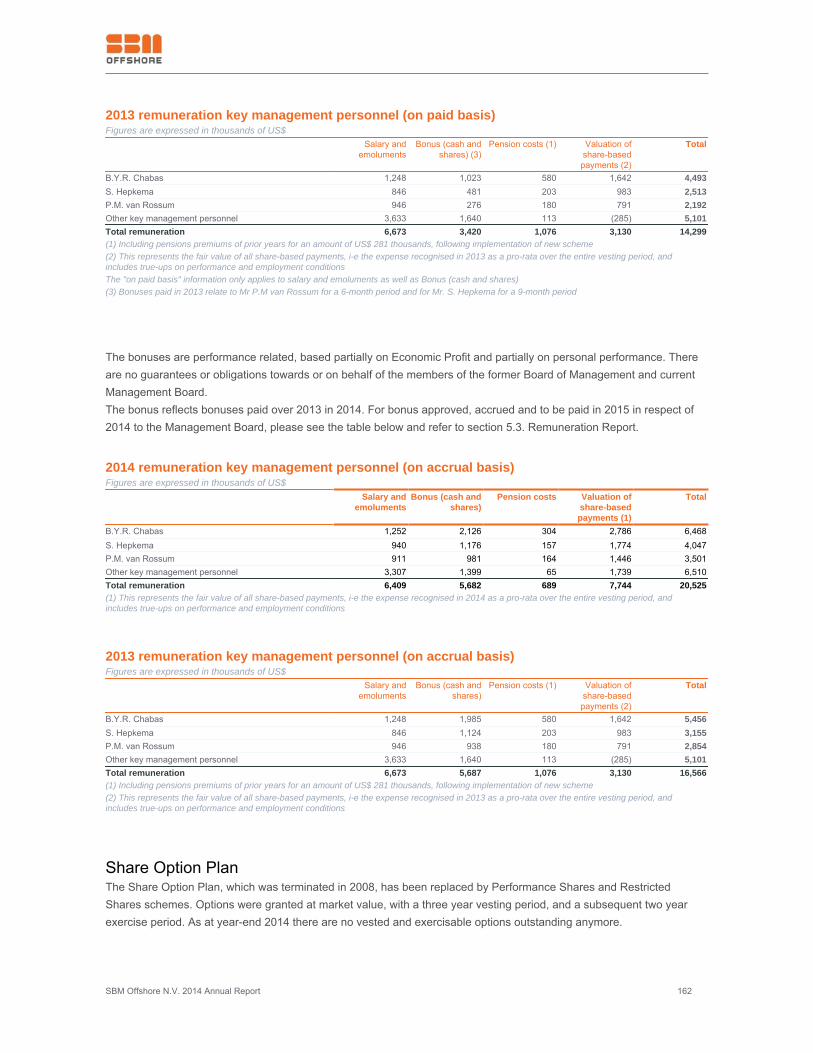
SBM Offshore N.V. 2014 Annual Report 162
2013 remuneration key management personnel (on paid basis)Figures are expressed in thousands of US$
Salary andemoluments
Bonus (cash andshares) (3)
Pension costs (1) Valuation ofshare-basedpayments (2)
Total
B.Y.R. Chabas 1,248 1,023 580 1,642 4,493S. Hepkema 846 481 203 983 2,513P.M. van Rossum 946 276 180 791 2,192Other key management personnel 3,633 1,640 113 (285) 5,101Total remuneration 6,673 3,420 1,076 3,130 14,299(1) Including pensions premiums of prior years for an amount of US$ 281 thousands, following implementation of new scheme(2) This represents the fair value of all share-based payments, i-e the expense recognised in 2013 as a pro-rata over the entire vesting period, andincludes true-ups on performance and employment conditionsThe "on paid basis" information only applies to salary and emoluments as well as Bonus (cash and shares)(3) Bonuses paid in 2013 relate to Mr P.M van Rossum for a 6-month period and for Mr. S. Hepkema for a 9-month period
The bonuses are performance related, based partially on Economic Profit and partially on personal performance. Thereare no guarantees or obligations towards or on behalf of the members of the former Board of Management and currentManagement Board.The bonus reflects bonuses paid over 2013 in 2014. For bonus approved, accrued and to be paid in 2015 in respect of2014 to the Management Board, please see the table below and refer to section 5.3. Remuneration Report.
2014 remuneration key management personnel (on accrual basis)Figures are expressed in thousands of US$
Salary andemoluments
Bonus (cash andshares)
Pension costs Valuation ofshare-basedpayments (1)
Total
B.Y.R. Chabas 1,252 2,126 304 2,786 6,468S. Hepkema 940 1,176 157 1,774 4,047P.M. van Rossum 911 981 164 1,446 3,501Other key management personnel 3,307 1,399 65 1,739 6,510Total remuneration 6,409 5,682 689 7,744 20,525(1) This represents the fair value of all share-based payments, i-e the expense recognised in 2014 as a pro-rata over the entire vesting period, andincludes true-ups on performance and employment conditions
2013 remuneration key management personnel (on accrual basis)Figures are expressed in thousands of US$
Salary andemoluments
Bonus (cash andshares)
Pension costs (1) Valuation ofshare-basedpayments (2)
Total
B.Y.R. Chabas 1,248 1,985 580 1,642 5,456S. Hepkema 846 1,124 203 983 3,155P.M. van Rossum 946 938 180 791 2,854Other key management personnel 3,633 1,640 113 (285) 5,101Total remuneration 6,673 5,687 1,076 3,130 16,566(1) Including pensions premiums of prior years for an amount of US$ 281 thousands, following implementation of new scheme(2) This represents the fair value of all share-based payments, i-e the expense recognised in 2013 as a pro-rata over the entire vesting period, andincludes true-ups on performance and employment conditions
Share Option PlanThe Share Option Plan, which was terminated in 2008, has been replaced by Performance Shares and RestrictedShares schemes. Options were granted at market value, with a three year vesting period, and a subsequent two yearexercise period. As at year-end 2014 there are no vested and exercisable options outstanding anymore.
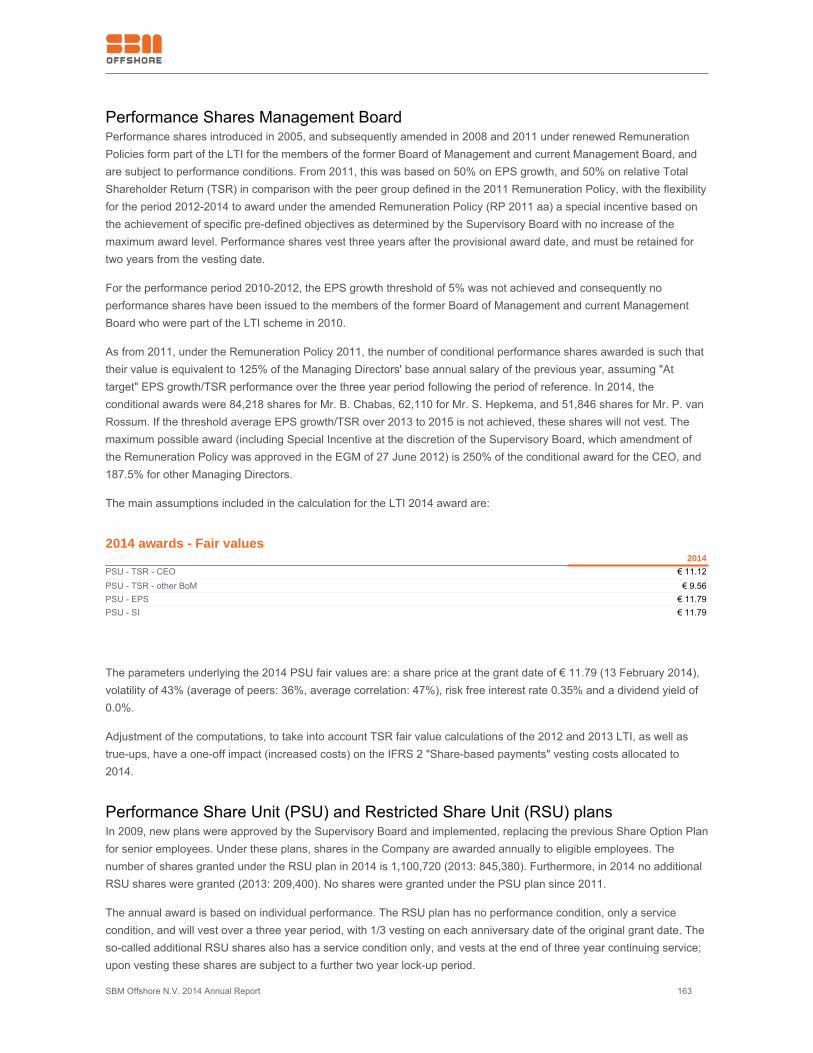
SBM Offshore N.V. 2014 Annual Report 163
Performance Shares Management BoardPerformance shares introduced in 2005, and subsequently amended in 2008 and 2011 under renewed RemunerationPolicies form part of the LTI for the members of the former Board of Management and current Management Board, andare subject to performance conditions. From 2011, this was based on 50% on EPS growth, and 50% on relative TotalShareholder Return (TSR) in comparison with the peer group defined in the 2011 Remuneration Policy, with the flexibilityfor the period 2012-2014 to award under the amended Remuneration Policy (RP 2011 aa) a special incentive based onthe achievement of specific pre-defined objectives as determined by the Supervisory Board with no increase of themaximum award level. Performance shares vest three years after the provisional award date, and must be retained fortwo years from the vesting date.
For the performance period 2010-2012, the EPS growth threshold of 5% was not achieved and consequently noperformance shares have been issued to the members of the former Board of Management and current ManagementBoard who were part of the LTI scheme in 2010.
As from 2011, under the Remuneration Policy 2011, the number of conditional performance shares awarded is such thattheir value is equivalent to 125% of the Managing Directors' base annual salary of the previous year, assuming "Attarget" EPS growth/TSR performance over the three year period following the period of reference. In 2014, theconditional awards were 84,218 shares for Mr. B. Chabas, 62,110 for Mr. S. Hepkema, and 51,846 shares for Mr. P. vanRossum. If the threshold average EPS growth/TSR over 2013 to 2015 is not achieved, these shares will not vest. Themaximum possible award (including Special Incentive at the discretion of the Supervisory Board, which amendment ofthe Remuneration Policy was approved in the EGM of 27 June 2012) is 250% of the conditional award for the CEO, and187.5% for other Managing Directors.
The main assumptions included in the calculation for the LTI 2014 award are:
2014 awards - Fair values 2014PSU - TSR - CEO € 11.12PSU - TSR - other BoM € 9.56PSU - EPS € 11.79PSU - SI € 11.79
The parameters underlying the 2014 PSU fair values are: a share price at the grant date of € 11.79 (13 February 2014),volatility of 43% (average of peers: 36%, average correlation: 47%), risk free interest rate 0.35% and a dividend yield of0.0%.
Adjustment of the computations, to take into account TSR fair value calculations of the 2012 and 2013 LTI, as well astrue-ups, have a one-off impact (increased costs) on the IFRS 2 "Share-based payments" vesting costs allocated to2014.
Performance Share Unit (PSU) and Restricted Share Unit (RSU) plansIn 2009, new plans were approved by the Supervisory Board and implemented, replacing the previous Share Option Planfor senior employees. Under these plans, shares in the Company are awarded annually to eligible employees. Thenumber of shares granted under the RSU plan in 2014 is 1,100,720 (2013: 845,380). Furthermore, in 2014 no additionalRSU shares were granted (2013: 209,400). No shares were granted under the PSU plan since 2011.
The annual award is based on individual performance. The RSU plan has no performance condition, only a servicecondition, and will vest over a three year period, with 1/3 vesting on each anniversary date of the original grant date. Theso-called additional RSU shares also has a service condition only, and vests at the end of three year continuing service;upon vesting these shares are subject to a further two year lock-up period.
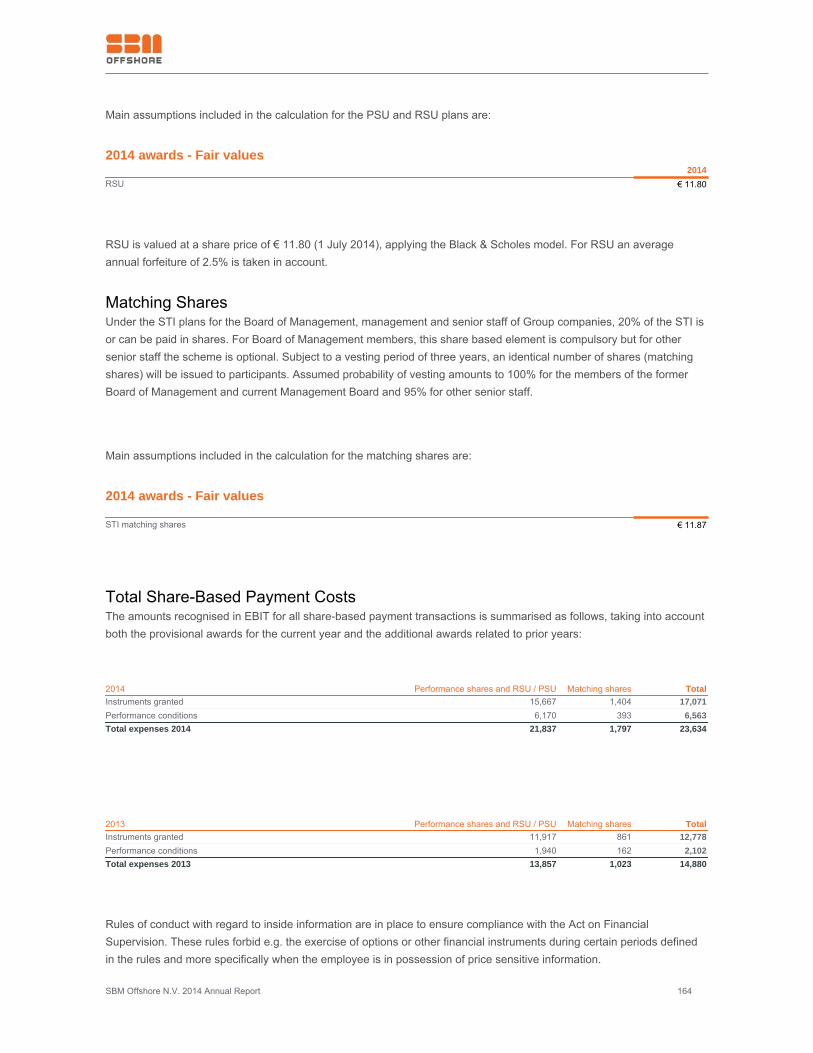
SBM Offshore N.V. 2014 Annual Report 164
Main assumptions included in the calculation for the PSU and RSU plans are:
2014 awards - Fair values 2014RSU € 11.80
RSU is valued at a share price of € 11.80 (1 July 2014), applying the Black & Scholes model. For RSU an averageannual forfeiture of 2.5% is taken in account.
Matching SharesUnder the STI plans for the Board of Management, management and senior staff of Group companies, 20% of the STI isor can be paid in shares. For Board of Management members, this share based element is compulsory but for othersenior staff the scheme is optional. Subject to a vesting period of three years, an identical number of shares (matchingshares) will be issued to participants. Assumed probability of vesting amounts to 100% for the members of the formerBoard of Management and current Management Board and 95% for other senior staff.
Main assumptions included in the calculation for the matching shares are:
2014 awards - Fair values STI matching shares € 11.87
Total Share-Based Payment CostsThe amounts recognised in EBIT for all share-based payment transactions is summarised as follows, taking into accountboth the provisional awards for the current year and the additional awards related to prior years:
2014 Performance shares and RSU / PSU Matching shares TotalInstruments granted 15,667 1,404 17,071Performance conditions 6,170 393 6,563Total expenses 2014 21,837 1,797 23,634
2013 Performance shares and RSU / PSU Matching shares TotalInstruments granted 11,917 861 12,778Performance conditions 1,940 162 2,102Total expenses 2013 13,857 1,023 14,880
Rules of conduct with regard to inside information are in place to ensure compliance with the Act on FinancialSupervision. These rules forbid e.g. the exercise of options or other financial instruments during certain periods definedin the rules and more specifically when the employee is in possession of price sensitive information.
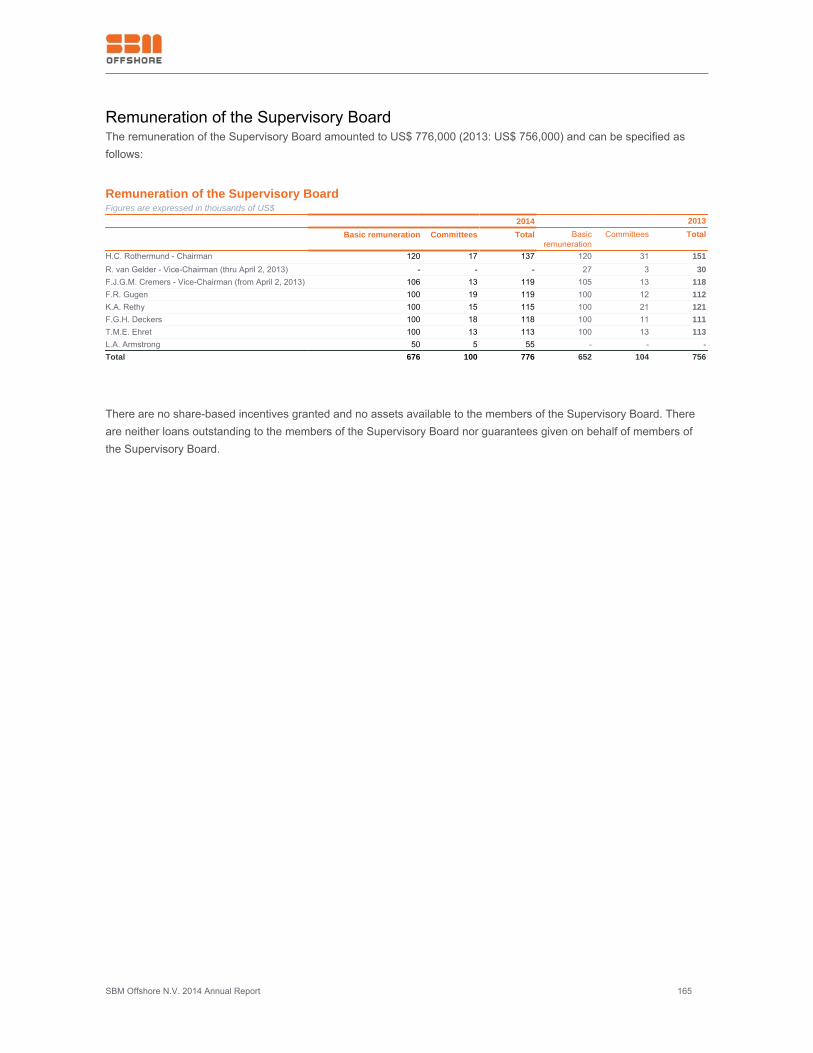
SBM Offshore N.V. 2014 Annual Report 165
Remuneration of the Supervisory BoardThe remuneration of the Supervisory Board amounted to US$ 776,000 (2013: US$ 756,000) and can be specified asfollows:
Remuneration of the Supervisory BoardFigures are expressed in thousands of US$ 2014 2013
Basic remuneration Committees Total Basicremuneration
Committees Total
H.C. Rothermund - Chairman 120 17 137 120 31 151R. van Gelder - Vice-Chairman (thru April 2, 2013) - - - 27 3 30F.J.G.M. Cremers - Vice-Chairman (from April 2, 2013) 106 13 119 105 13 118F.R. Gugen 100 19 119 100 12 112K.A. Rethy 100 15 115 100 21 121F.G.H. Deckers 100 18 118 100 11 111T.M.E. Ehret 100 13 113 100 13 113L.A. Armstrong 50 5 55 - - -Total 676 100 776 652 104 756
There are no share-based incentives granted and no assets available to the members of the Supervisory Board. Thereare neither loans outstanding to the members of the Supervisory Board nor guarantees given on behalf of members ofthe Supervisory Board.
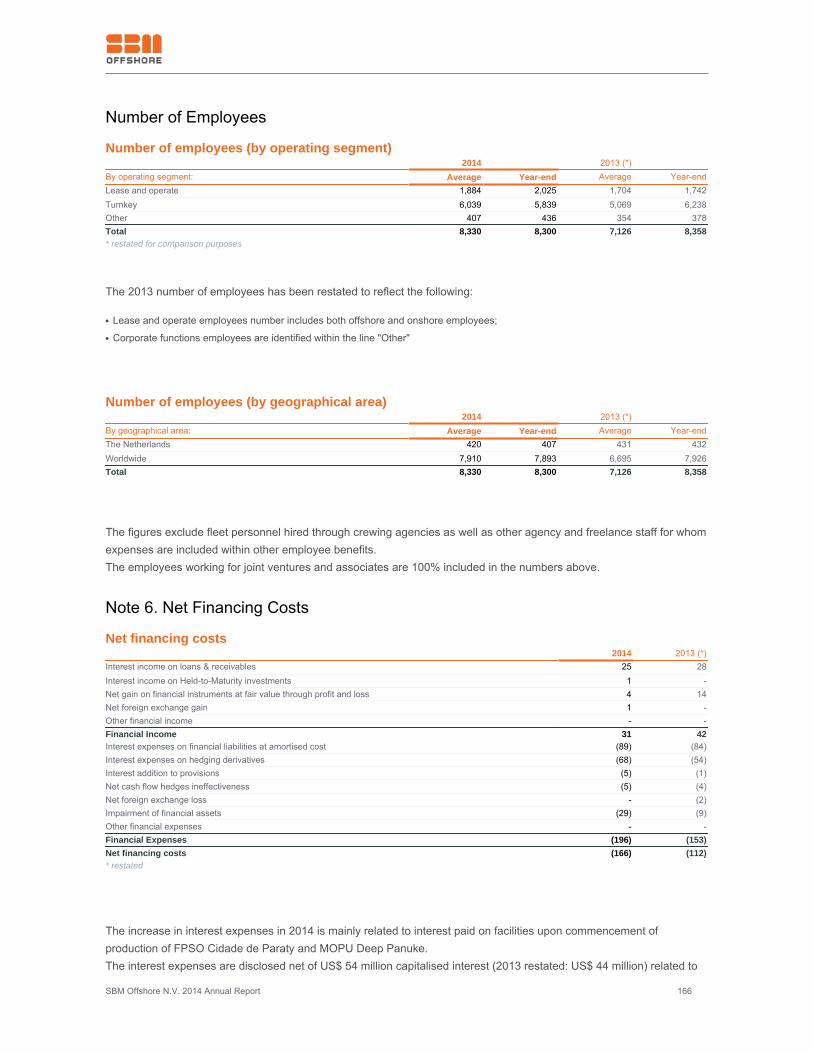
SBM Offshore N.V. 2014 Annual Report 166
Number of Employees
Number of employees (by operating segment) 2014 2013 (*) By operating segment: Average Year-end Average Year-endLease and operate 1,884 2,025 1,704 1,742Turnkey 6,039 5,839 5,069 6,238Other 407 436 354 378Total 8,330 8,300 7,126 8,358* restated for comparison purposes
The 2013 number of employees has been restated to reflect the following:
Lease and operate employees number includes both offshore and onshore employees;●
Corporate functions employees are identified within the line "Other"●
Number of employees (by geographical area) 2014 2013 (*) By geographical area: Average Year-end Average Year-endThe Netherlands 420 407 431 432Worldwide 7,910 7,893 6,695 7,926Total 8,330 8,300 7,126 8,358
The figures exclude fleet personnel hired through crewing agencies as well as other agency and freelance staff for whomexpenses are included within other employee benefits.The employees working for joint ventures and associates are 100% included in the numbers above.
Note 6. Net Financing Costs
Net financing costs 2014 2013 (*)Interest income on loans & receivables 25 28Interest income on Held-to-Maturity investments 1 -Net gain on financial instruments at fair value through profit and loss 4 14Net foreign exchange gain 1 -Other financial income - -Financial Income 31 42Interest expenses on financial liabilities at amortised cost (89) (84)Interest expenses on hedging derivatives (68) (54)Interest addition to provisions (5) (1)Net cash flow hedges ineffectiveness (5) (4)Net foreign exchange loss - (2)Impairment of financial assets (29) (9)Other financial expenses - -Financial Expenses (196) (153)Net financing costs (166) (112)* restated
The increase in interest expenses in 2014 is mainly related to interest paid on facilities upon commencement ofproduction of FPSO Cidade de Paraty and MOPU Deep Panuke.The interest expenses are disclosed net of US$ 54 million capitalised interest (2013 restated: US$ 44 million) related to
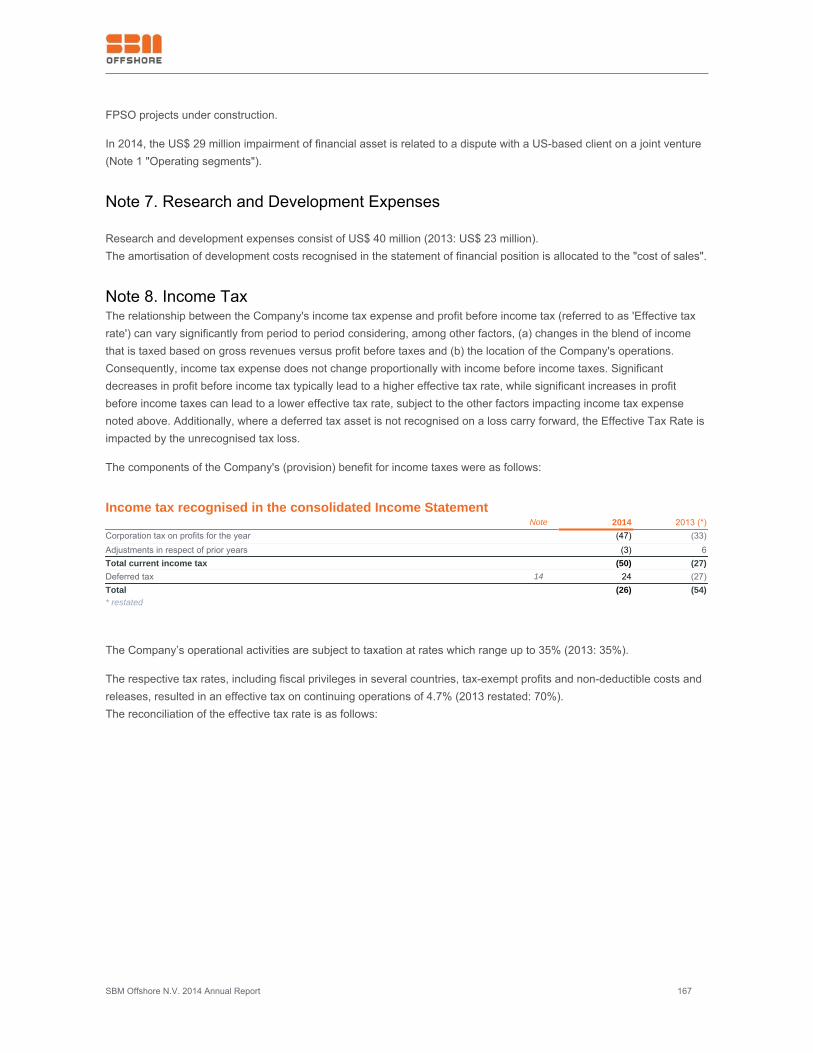
SBM Offshore N.V. 2014 Annual Report 167
FPSO projects under construction.
In 2014, the US$ 29 million impairment of financial asset is related to a dispute with a US-based client on a joint venture(Note 1 "Operating segments").
Note 7. Research and Development Expenses
Research and development expenses consist of US$ 40 million (2013: US$ 23 million).The amortisation of development costs recognised in the statement of financial position is allocated to the "cost of sales".
Note 8. Income TaxThe relationship between the Company's income tax expense and profit before income tax (referred to as 'Effective taxrate') can vary significantly from period to period considering, among other factors, (a) changes in the blend of incomethat is taxed based on gross revenues versus profit before taxes and (b) the location of the Company's operations.Consequently, income tax expense does not change proportionally with income before income taxes. Significantdecreases in profit before income tax typically lead to a higher effective tax rate, while significant increases in profitbefore income taxes can lead to a lower effective tax rate, subject to the other factors impacting income tax expensenoted above. Additionally, where a deferred tax asset is not recognised on a loss carry forward, the Effective Tax Rate isimpacted by the unrecognised tax loss.
The components of the Company's (provision) benefit for income taxes were as follows:
Income tax recognised in the consolidated Income Statement Note 2014 2013 (*)Corporation tax on profits for the year (47) (33)Adjustments in respect of prior years (3) 6Total current income tax (50) (27)Deferred tax 14 24 (27)Total (26) (54)* restated
The Company’s operational activities are subject to taxation at rates which range up to 35% (2013: 35%).
The respective tax rates, including fiscal privileges in several countries, tax-exempt profits and non-deductible costs andreleases, resulted in an effective tax on continuing operations of 4.7% (2013 restated: 70%).The reconciliation of the effective tax rate is as follows:
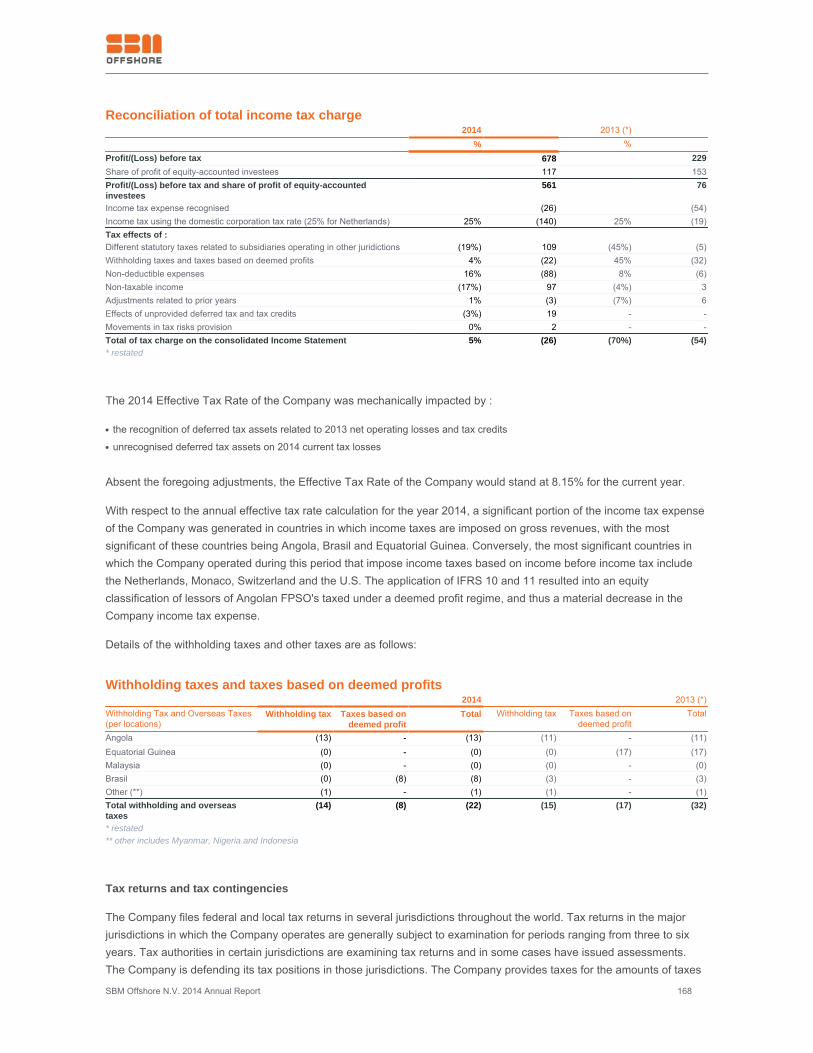
SBM Offshore N.V. 2014 Annual Report 168
Reconciliation of total income tax charge 2014 2013 (*) % % Profit/(Loss) before tax 678 229Share of profit of equity-accounted investees 117 153Profit/(Loss) before tax and share of profit of equity-accountedinvestees
561 76
Income tax expense recognised (26) (54)Income tax using the domestic corporation tax rate (25% for Netherlands) 25% (140) 25% (19)Tax effects of : Different statutory taxes related to subsidiaries operating in other juridictions (19%) 109 (45%) (5)Withholding taxes and taxes based on deemed profits 4% (22) 45% (32)Non-deductible expenses 16% (88) 8% (6)Non-taxable income (17%) 97 (4%) 3Adjustments related to prior years 1% (3) (7%) 6Effects of unprovided deferred tax and tax credits (3%) 19 - -Movements in tax risks provision 0% 2 - -Total of tax charge on the consolidated Income Statement 5% (26) (70%) (54)* restated
The 2014 Effective Tax Rate of the Company was mechanically impacted by :
the recognition of deferred tax assets related to 2013 net operating losses and tax credits●
unrecognised deferred tax assets on 2014 current tax losses●
Absent the foregoing adjustments, the Effective Tax Rate of the Company would stand at 8.15% for the current year.
With respect to the annual effective tax rate calculation for the year 2014, a significant portion of the income tax expenseof the Company was generated in countries in which income taxes are imposed on gross revenues, with the mostsignificant of these countries being Angola, Brasil and Equatorial Guinea. Conversely, the most significant countries inwhich the Company operated during this period that impose income taxes based on income before income tax includethe Netherlands, Monaco, Switzerland and the U.S. The application of IFRS 10 and 11 resulted into an equityclassification of lessors of Angolan FPSO's taxed under a deemed profit regime, and thus a material decrease in theCompany income tax expense.
Details of the withholding taxes and other taxes are as follows:
Withholding taxes and taxes based on deemed profits 2014 2013 (*)Withholding Tax and Overseas Taxes(per locations)
Withholding tax Taxes based ondeemed profit
Total Withholding tax Taxes based ondeemed profit
Total
Angola (13) - (13) (11) - (11)Equatorial Guinea (0) - (0) (0) (17) (17)Malaysia (0) - (0) (0) - (0)Brasil (0) (8) (8) (3) - (3)Other (**) (1) - (1) (1) - (1)Total withholding and overseastaxes
(14) (8) (22) (15) (17) (32)
* restated** other includes Myanmar, Nigeria and Indonesia
Tax returns and tax contingencies
The Company files federal and local tax returns in several jurisdictions throughout the world. Tax returns in the majorjurisdictions in which the Company operates are generally subject to examination for periods ranging from three to sixyears. Tax authorities in certain jurisdictions are examining tax returns and in some cases have issued assessments.The Company is defending its tax positions in those jurisdictions. The Company provides taxes for the amounts of taxes
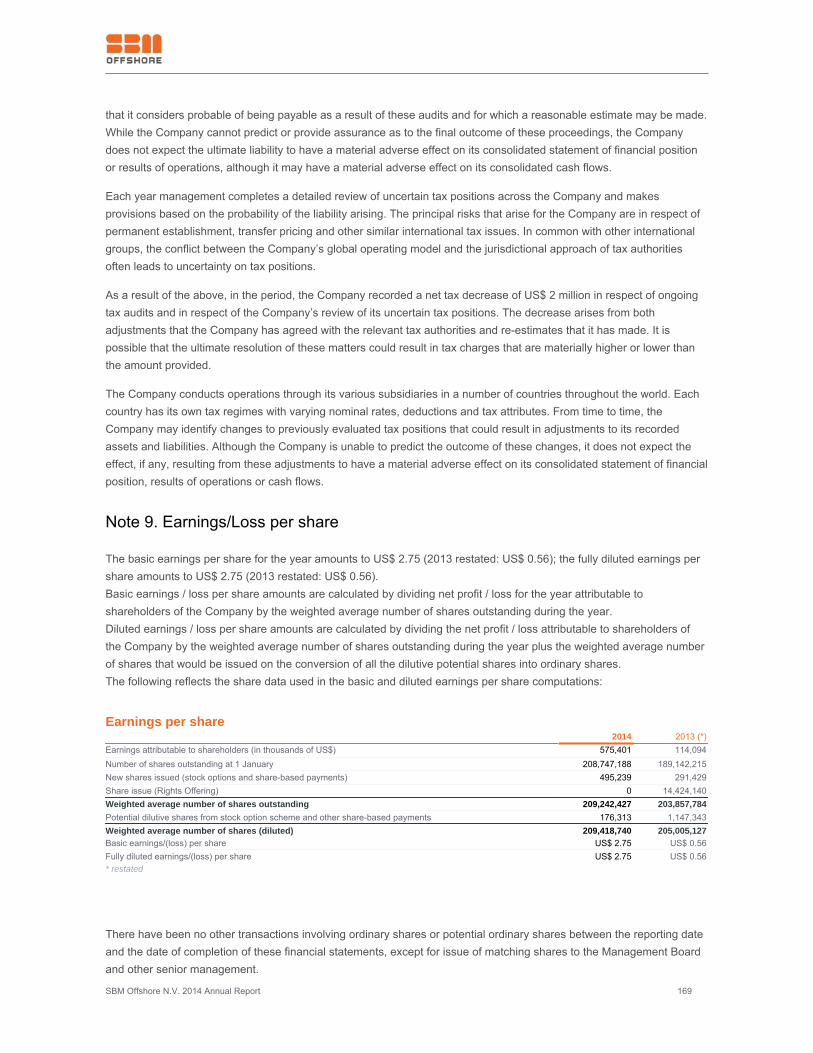
SBM Offshore N.V. 2014 Annual Report 169
that it considers probable of being payable as a result of these audits and for which a reasonable estimate may be made.While the Company cannot predict or provide assurance as to the final outcome of these proceedings, the Companydoes not expect the ultimate liability to have a material adverse effect on its consolidated statement of financial positionor results of operations, although it may have a material adverse effect on its consolidated cash flows.
Each year management completes a detailed review of uncertain tax positions across the Company and makesprovisions based on the probability of the liability arising. The principal risks that arise for the Company are in respect ofpermanent establishment, transfer pricing and other similar international tax issues. In common with other internationalgroups, the conflict between the Company’s global operating model and the jurisdictional approach of tax authoritiesoften leads to uncertainty on tax positions.
As a result of the above, in the period, the Company recorded a net tax decrease of US$ 2 million in respect of ongoingtax audits and in respect of the Company’s review of its uncertain tax positions. The decrease arises from bothadjustments that the Company has agreed with the relevant tax authorities and re-estimates that it has made. It ispossible that the ultimate resolution of these matters could result in tax charges that are materially higher or lower thanthe amount provided.
The Company conducts operations through its various subsidiaries in a number of countries throughout the world. Eachcountry has its own tax regimes with varying nominal rates, deductions and tax attributes. From time to time, theCompany may identify changes to previously evaluated tax positions that could result in adjustments to its recordedassets and liabilities. Although the Company is unable to predict the outcome of these changes, it does not expect theeffect, if any, resulting from these adjustments to have a material adverse effect on its consolidated statement of financialposition, results of operations or cash flows.
Note 9. Earnings/Loss per share
The basic earnings per share for the year amounts to US$ 2.75 (2013 restated: US$ 0.56); the fully diluted earnings pershare amounts to US$ 2.75 (2013 restated: US$ 0.56).Basic earnings / loss per share amounts are calculated by dividing net profit / loss for the year attributable toshareholders of the Company by the weighted average number of shares outstanding during the year.Diluted earnings / loss per share amounts are calculated by dividing the net profit / loss attributable to shareholders ofthe Company by the weighted average number of shares outstanding during the year plus the weighted average numberof shares that would be issued on the conversion of all the dilutive potential shares into ordinary shares.The following reflects the share data used in the basic and diluted earnings per share computations:
Earnings per share 2014 2013 (*)Earnings attributable to shareholders (in thousands of US$) 575,401 114,094Number of shares outstanding at 1 January 208,747,188 189,142,215New shares issued (stock options and share-based payments) 495,239 291,429Share issue (Rights Offering) 0 14,424,140Weighted average number of shares outstanding 209,242,427 203,857,784Potential dilutive shares from stock option scheme and other share-based payments 176,313 1,147,343Weighted average number of shares (diluted) 209,418,740 205,005,127Basic earnings/(loss) per share US$ 2.75 US$ 0.56Fully diluted earnings/(loss) per share US$ 2.75 US$ 0.56* restated
There have been no other transactions involving ordinary shares or potential ordinary shares between the reporting dateand the date of completion of these financial statements, except for issue of matching shares to the Management Boardand other senior management.
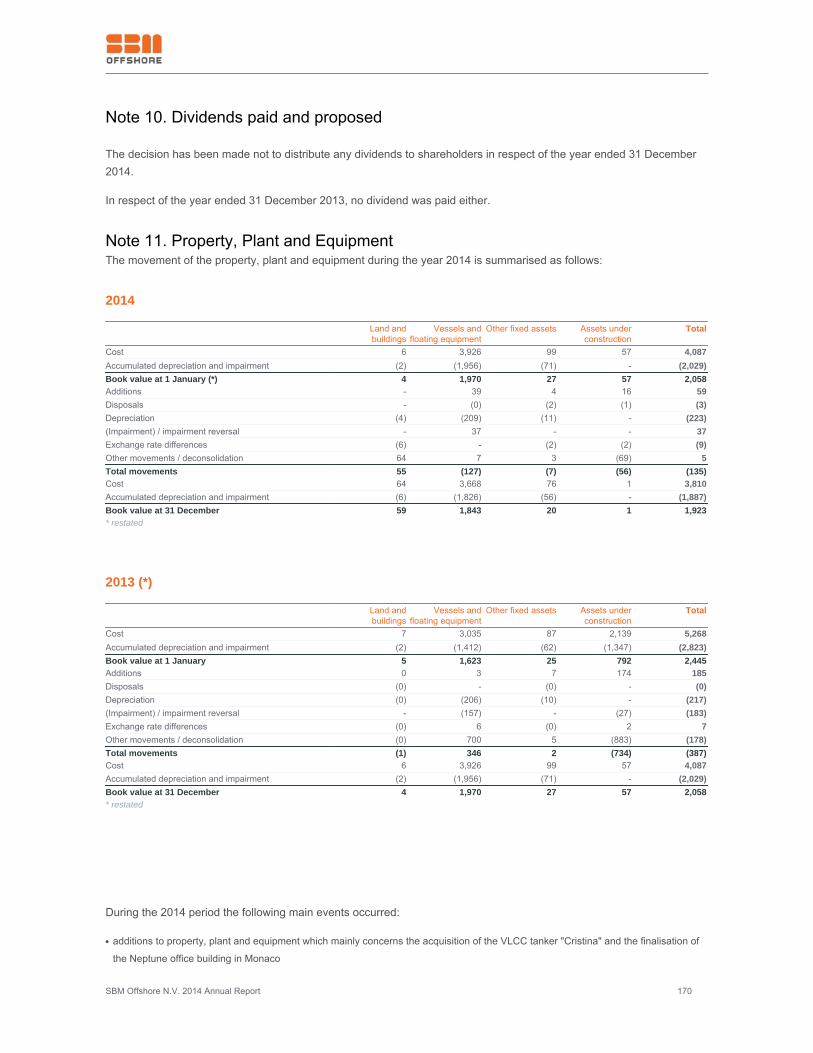
SBM Offshore N.V. 2014 Annual Report 170
Note 10. Dividends paid and proposed
The decision has been made not to distribute any dividends to shareholders in respect of the year ended 31 December2014.
In respect of the year ended 31 December 2013, no dividend was paid either.
Note 11. Property, Plant and EquipmentThe movement of the property, plant and equipment during the year 2014 is summarised as follows:
2014 Land and
buildingsVessels and
floating equipmentOther fixed assets Assets under
constructionTotal
Cost 6 3,926 99 57 4,087Accumulated depreciation and impairment (2) (1,956) (71) - (2,029)Book value at 1 January (*) 4 1,970 27 57 2,058Additions - 39 4 16 59Disposals - (0) (2) (1) (3)Depreciation (4) (209) (11) - (223)(Impairment) / impairment reversal - 37 - - 37Exchange rate differences (6) - (2) (2) (9)Other movements / deconsolidation 64 7 3 (69) 5Total movements 55 (127) (7) (56) (135)Cost 64 3,668 76 1 3,810Accumulated depreciation and impairment (6) (1,826) (56) - (1,887)Book value at 31 December 59 1,843 20 1 1,923* restated
2013 (*) Land and
buildingsVessels and
floating equipmentOther fixed assets Assets under
constructionTotal
Cost 7 3,035 87 2,139 5,268Accumulated depreciation and impairment (2) (1,412) (62) (1,347) (2,823)Book value at 1 January 5 1,623 25 792 2,445Additions 0 3 7 174 185Disposals (0) - (0) - (0)Depreciation (0) (206) (10) - (217)(Impairment) / impairment reversal - (157) - (27) (183)Exchange rate differences (0) 6 (0) 2 7Other movements / deconsolidation (0) 700 5 (883) (178)Total movements (1) 346 2 (734) (387)Cost 6 3,926 99 57 4,087Accumulated depreciation and impairment (2) (1,956) (71) - (2,029)Book value at 31 December 4 1,970 27 57 2,058* restated
During the 2014 period the following main events occurred:
additions to property, plant and equipment which mainly concerns the acquisition of the VLCC tanker "Cristina" and the finalisation of●
the Neptune office building in Monaco
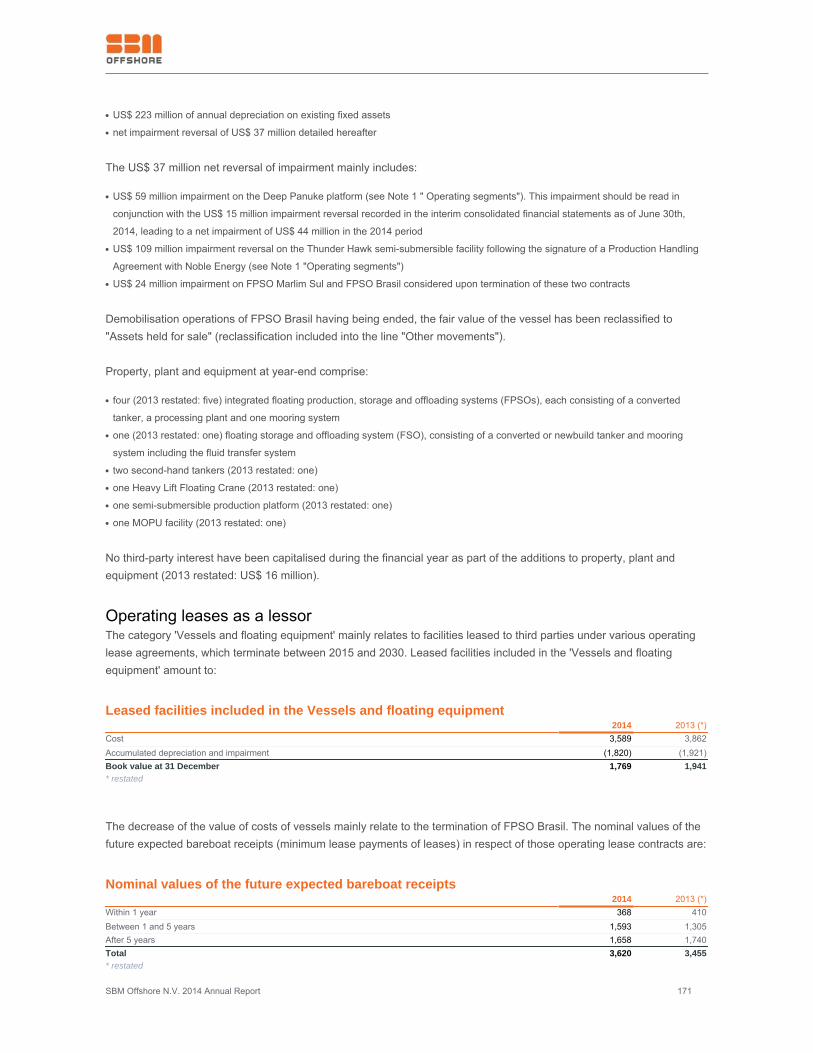
SBM Offshore N.V. 2014 Annual Report 171
US$ 223 million of annual depreciation on existing fixed assets●
net impairment reversal of US$ 37 million detailed hereafter●
The US$ 37 million net reversal of impairment mainly includes:
US$ 59 million impairment on the Deep Panuke platform (see Note 1 " Operating segments"). This impairment should be read in●
conjunction with the US$ 15 million impairment reversal recorded in the interim consolidated financial statements as of June 30th,
2014, leading to a net impairment of US$ 44 million in the 2014 period
US$ 109 million impairment reversal on the Thunder Hawk semi-submersible facility following the signature of a Production Handling●
Agreement with Noble Energy (see Note 1 "Operating segments")
US$ 24 million impairment on FPSO Marlim Sul and FPSO Brasil considered upon termination of these two contracts●
Demobilisation operations of FPSO Brasil having being ended, the fair value of the vessel has been reclassified to"Assets held for sale" (reclassification included into the line "Other movements").
Property, plant and equipment at year-end comprise:
four (2013 restated: five) integrated floating production, storage and offloading systems (FPSOs), each consisting of a converted●
tanker, a processing plant and one mooring system
one (2013 restated: one) floating storage and offloading system (FSO), consisting of a converted or newbuild tanker and mooring●
system including the fluid transfer system
two second-hand tankers (2013 restated: one)●
one Heavy Lift Floating Crane (2013 restated: one)●
one semi-submersible production platform (2013 restated: one)●
one MOPU facility (2013 restated: one)●
No third-party interest have been capitalised during the financial year as part of the additions to property, plant andequipment (2013 restated: US$ 16 million).
Operating leases as a lessorThe category 'Vessels and floating equipment' mainly relates to facilities leased to third parties under various operatinglease agreements, which terminate between 2015 and 2030. Leased facilities included in the 'Vessels and floatingequipment' amount to:
Leased facilities included in the Vessels and floating equipment 2014 2013 (*)Cost 3,589 3,862Accumulated depreciation and impairment (1,820) (1,921)Book value at 31 December 1,769 1,941* restated
The decrease of the value of costs of vessels mainly relate to the termination of FPSO Brasil. The nominal values of thefuture expected bareboat receipts (minimum lease payments of leases) in respect of those operating lease contracts are:
Nominal values of the future expected bareboat receipts 2014 2013 (*)Within 1 year 368 410Between 1 and 5 years 1,593 1,305After 5 years 1,658 1,740Total 3,620 3,455* restated
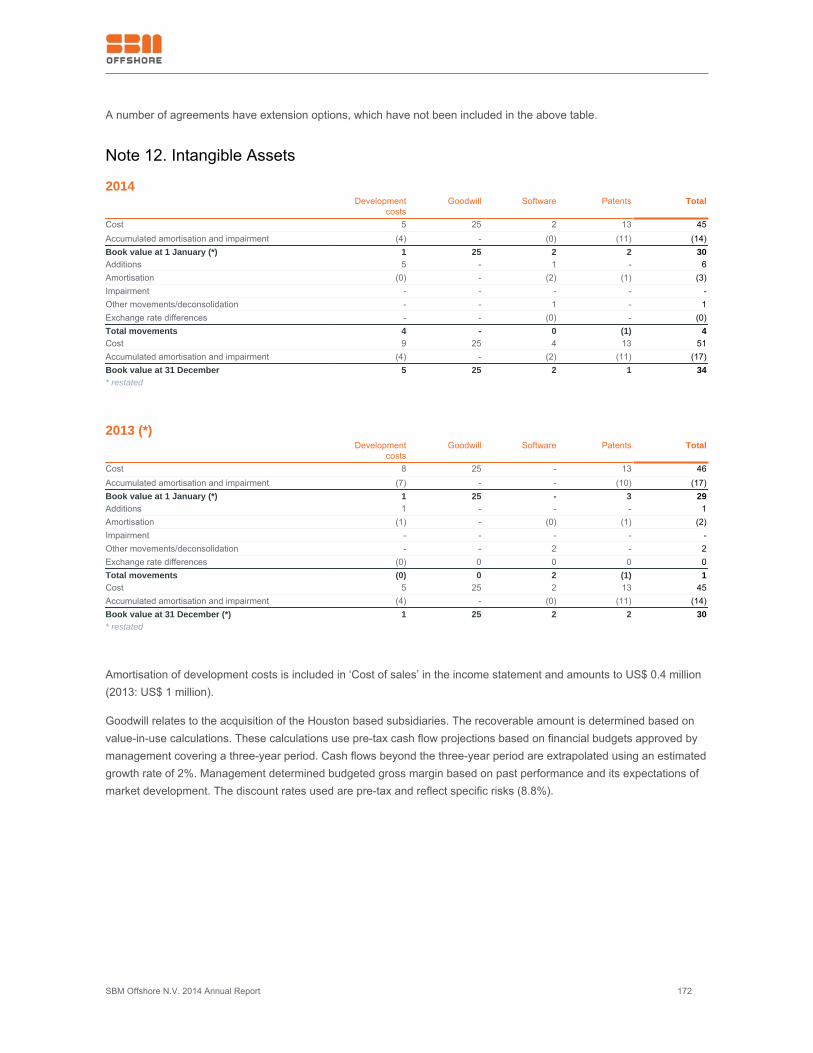
SBM Offshore N.V. 2014 Annual Report 172
A number of agreements have extension options, which have not been included in the above table.
Note 12. Intangible Assets
2014 Development
costsGoodwill Software Patents Total
Cost 5 25 2 13 45Accumulated amortisation and impairment (4) - (0) (11) (14)Book value at 1 January (*) 1 25 2 2 30Additions 5 - 1 - 6Amortisation (0) - (2) (1) (3)Impairment - - - - -Other movements/deconsolidation - - 1 - 1Exchange rate differences - - (0) - (0)Total movements 4 - 0 (1) 4Cost 9 25 4 13 51Accumulated amortisation and impairment (4) - (2) (11) (17)Book value at 31 December 5 25 2 1 34* restated
2013 (*) Development
costsGoodwill Software Patents Total
Cost 8 25 - 13 46Accumulated amortisation and impairment (7) - - (10) (17)Book value at 1 January (*) 1 25 - 3 29Additions 1 - - - 1Amortisation (1) - (0) (1) (2)Impairment - - - - -Other movements/deconsolidation - - 2 - 2Exchange rate differences (0) 0 0 0 0Total movements (0) 0 2 (1) 1Cost 5 25 2 13 45Accumulated amortisation and impairment (4) - (0) (11) (14)Book value at 31 December (*) 1 25 2 2 30* restated
Amortisation of development costs is included in ‘Cost of sales’ in the income statement and amounts to US$ 0.4 million(2013: US$ 1 million).
Goodwill relates to the acquisition of the Houston based subsidiaries. The recoverable amount is determined based onvalue-in-use calculations. These calculations use pre-tax cash flow projections based on financial budgets approved bymanagement covering a three-year period. Cash flows beyond the three-year period are extrapolated using an estimatedgrowth rate of 2%. Management determined budgeted gross margin based on past performance and its expectations ofmarket development. The discount rates used are pre-tax and reflect specific risks (8.8%).
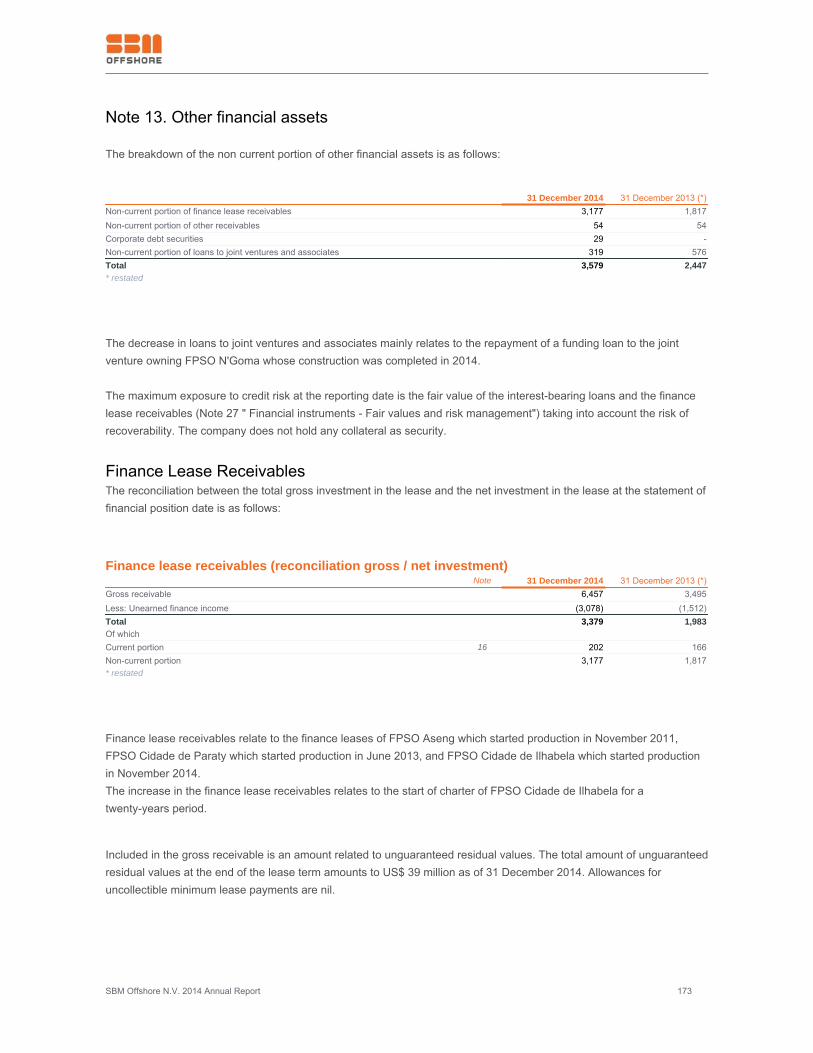
SBM Offshore N.V. 2014 Annual Report 173
Note 13. Other financial assets
The breakdown of the non current portion of other financial assets is as follows:
31 December 2014 31 December 2013 (*)Non-current portion of finance lease receivables 3,177 1,817Non-current portion of other receivables 54 54Corporate debt securities 29 -Non-current portion of loans to joint ventures and associates 319 576Total 3,579 2,447* restated
The decrease in loans to joint ventures and associates mainly relates to the repayment of a funding loan to the jointventure owning FPSO N'Goma whose construction was completed in 2014.
The maximum exposure to credit risk at the reporting date is the fair value of the interest-bearing loans and the financelease receivables (Note 27 " Financial instruments - Fair values and risk management") taking into account the risk ofrecoverability. The company does not hold any collateral as security.
Finance Lease ReceivablesThe reconciliation between the total gross investment in the lease and the net investment in the lease at the statement offinancial position date is as follows:
Finance lease receivables (reconciliation gross / net investment) Note 31 December 2014 31 December 2013 (*)Gross receivable 6,457 3,495Less: Unearned finance income (3,078) (1,512)Total 3,379 1,983Of which Current portion 16 202 166Non-current portion 3,177 1,817* restated
Finance lease receivables relate to the finance leases of FPSO Aseng which started production in November 2011,FPSO Cidade de Paraty which started production in June 2013, and FPSO Cidade de Ilhabela which started productionin November 2014. The increase in the finance lease receivables relates to the start of charter of FPSO Cidade de Ilhabela for atwenty-years period.
Included in the gross receivable is an amount related to unguaranteed residual values. The total amount of unguaranteedresidual values at the end of the lease term amounts to US$ 39 million as of 31 December 2014. Allowances foruncollectible minimum lease payments are nil.
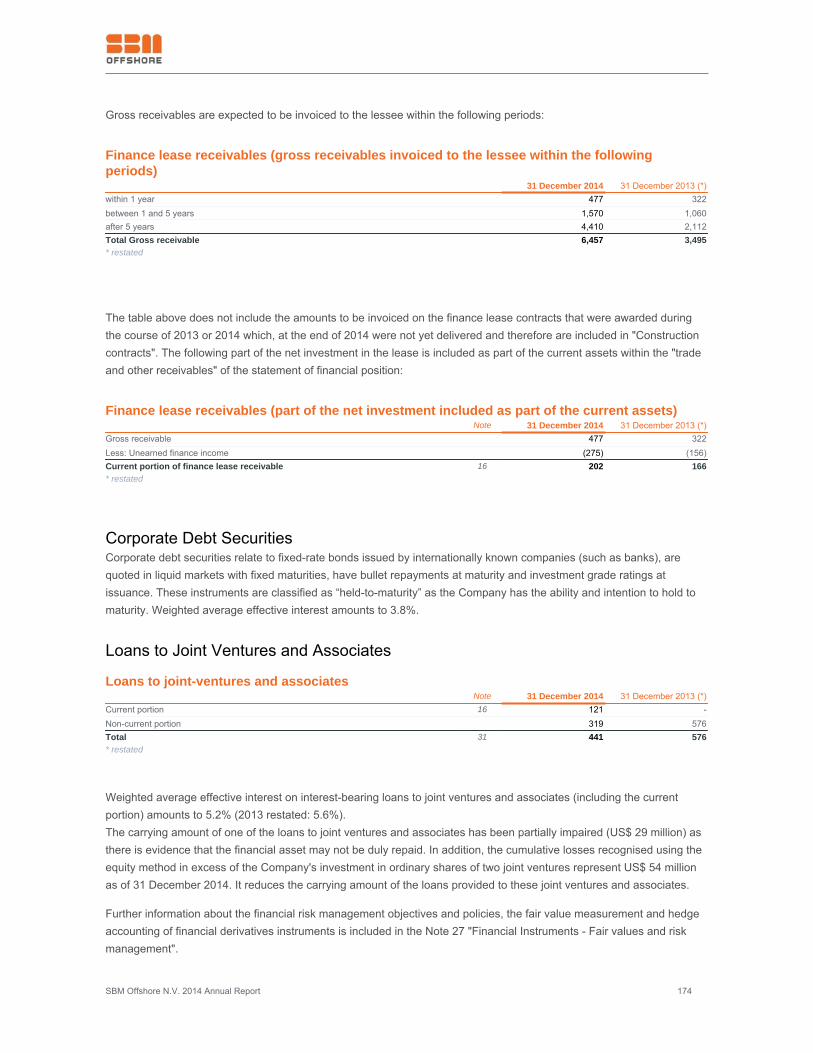
SBM Offshore N.V. 2014 Annual Report 174
Gross receivables are expected to be invoiced to the lessee within the following periods:
Finance lease receivables (gross receivables invoiced to the lessee within the followingperiods) 31 December 2014 31 December 2013 (*)within 1 year 477 322between 1 and 5 years 1,570 1,060after 5 years 4,410 2,112Total Gross receivable 6,457 3,495* restated
The table above does not include the amounts to be invoiced on the finance lease contracts that were awarded duringthe course of 2013 or 2014 which, at the end of 2014 were not yet delivered and therefore are included in "Constructioncontracts". The following part of the net investment in the lease is included as part of the current assets within the "tradeand other receivables" of the statement of financial position:
Finance lease receivables (part of the net investment included as part of the current assets) Note 31 December 2014 31 December 2013 (*)Gross receivable 477 322Less: Unearned finance income (275) (156)Current portion of finance lease receivable 16 202 166* restated
Corporate Debt SecuritiesCorporate debt securities relate to fixed-rate bonds issued by internationally known companies (such as banks), arequoted in liquid markets with fixed maturities, have bullet repayments at maturity and investment grade ratings atissuance. These instruments are classified as “held-to-maturity” as the Company has the ability and intention to hold tomaturity. Weighted average effective interest amounts to 3.8%.
Loans to Joint Ventures and Associates
Loans to joint-ventures and associates Note 31 December 2014 31 December 2013 (*)Current portion 16 121 -Non-current portion 319 576Total 31 441 576* restated
Weighted average effective interest on interest-bearing loans to joint ventures and associates (including the currentportion) amounts to 5.2% (2013 restated: 5.6%).The carrying amount of one of the loans to joint ventures and associates has been partially impaired (US$ 29 million) asthere is evidence that the financial asset may not be duly repaid. In addition, the cumulative losses recognised using theequity method in excess of the Company's investment in ordinary shares of two joint ventures represent US$ 54 millionas of 31 December 2014. It reduces the carrying amount of the loans provided to these joint ventures and associates.
Further information about the financial risk management objectives and policies, the fair value measurement and hedgeaccounting of financial derivatives instruments is included in the Note 27 "Financial Instruments - Fair values and riskmanagement".
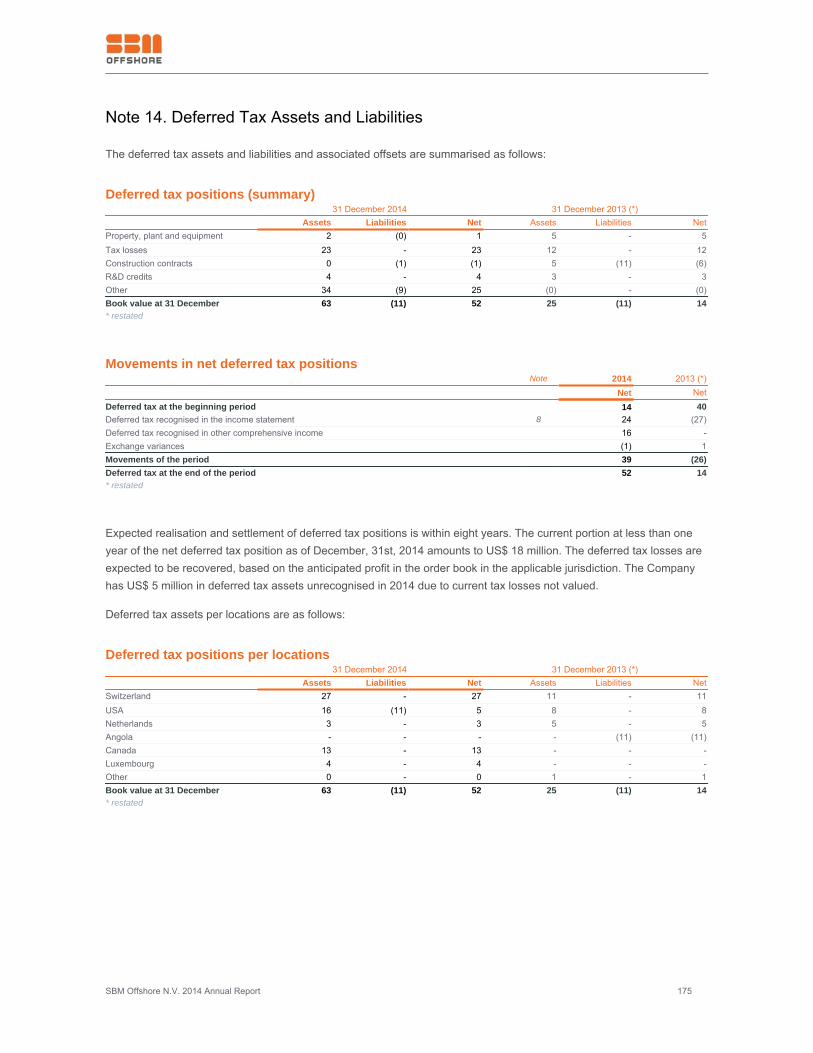
SBM Offshore N.V. 2014 Annual Report 175
Note 14. Deferred Tax Assets and Liabilities
The deferred tax assets and liabilities and associated offsets are summarised as follows:
Deferred tax positions (summary) 31 December 2014 31 December 2013 (*) Assets Liabilities Net Assets Liabilities NetProperty, plant and equipment 2 (0) 1 5 - 5Tax losses 23 - 23 12 - 12Construction contracts 0 (1) (1) 5 (11) (6)R&D credits 4 - 4 3 - 3Other 34 (9) 25 (0) - (0)Book value at 31 December 63 (11) 52 25 (11) 14* restated
Movements in net deferred tax positions Note 2014 2013 (*) Net NetDeferred tax at the beginning period 14 40Deferred tax recognised in the income statement 8 24 (27)Deferred tax recognised in other comprehensive income 16 -Exchange variances (1) 1Movements of the period 39 (26)Deferred tax at the end of the period 52 14* restated
Expected realisation and settlement of deferred tax positions is within eight years. The current portion at less than oneyear of the net deferred tax position as of December, 31st, 2014 amounts to US$ 18 million. The deferred tax losses areexpected to be recovered, based on the anticipated profit in the order book in the applicable jurisdiction. The Companyhas US$ 5 million in deferred tax assets unrecognised in 2014 due to current tax losses not valued.
Deferred tax assets per locations are as follows:
Deferred tax positions per locations 31 December 2014 31 December 2013 (*) Assets Liabilities Net Assets Liabilities NetSwitzerland 27 - 27 11 - 11USA 16 (11) 5 8 - 8Netherlands 3 - 3 5 - 5Angola - - - - (11) (11)Canada 13 - 13 - - -Luxembourg 4 - 4 - - -Other 0 - 0 1 - 1Book value at 31 December 63 (11) 52 25 (11) 14* restated
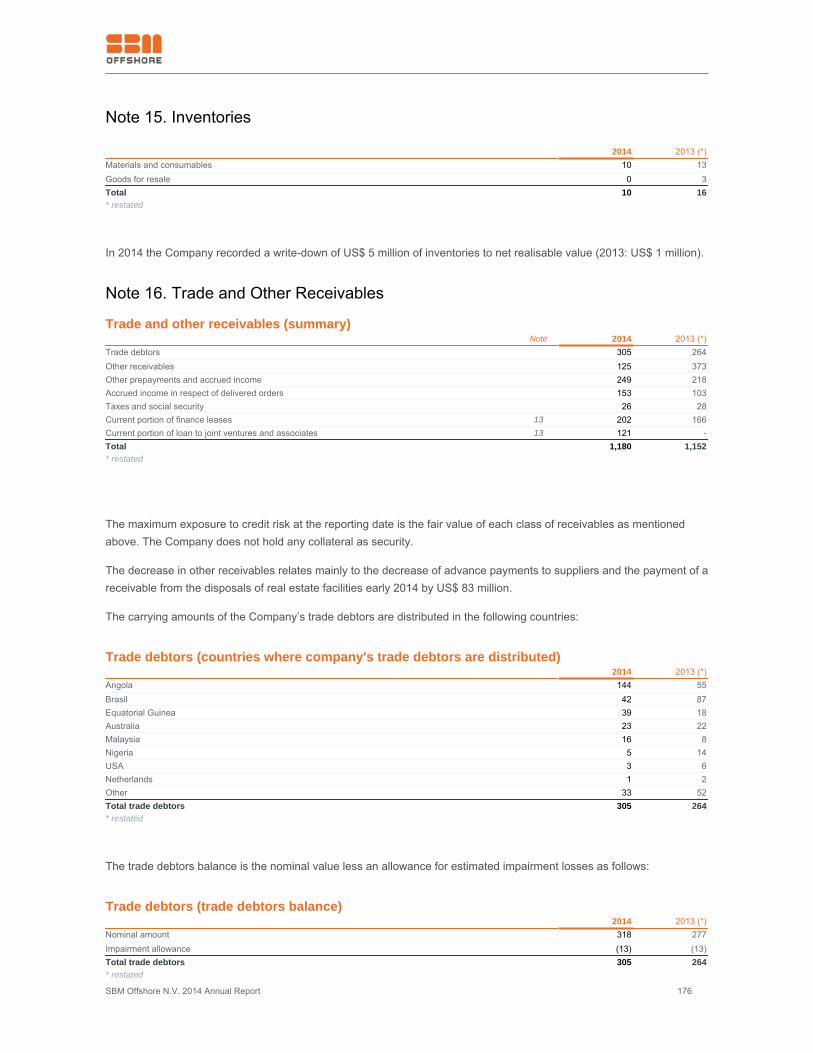
SBM Offshore N.V. 2014 Annual Report 176
Note 15. Inventories 2014 2013 (*)Materials and consumables 10 13Goods for resale 0 3Total 10 16* restated
In 2014 the Company recorded a write-down of US$ 5 million of inventories to net realisable value (2013: US$ 1 million).
Note 16. Trade and Other Receivables
Trade and other receivables (summary) Note 2014 2013 (*)Trade debtors 305 264Other receivables 125 373Other prepayments and accrued income 249 218Accrued income in respect of delivered orders 153 103Taxes and social security 26 28Current portion of finance leases 13 202 166Current portion of loan to joint ventures and associates 13 121 -Total 1,180 1,152* restated
The maximum exposure to credit risk at the reporting date is the fair value of each class of receivables as mentionedabove. The Company does not hold any collateral as security.
The decrease in other receivables relates mainly to the decrease of advance payments to suppliers and the payment of areceivable from the disposals of real estate facilities early 2014 by US$ 83 million.
The carrying amounts of the Company’s trade debtors are distributed in the following countries:
Trade debtors (countries where company's trade debtors are distributed) 2014 2013 (*)Angola 144 55Brasil 42 87Equatorial Guinea 39 18Australia 23 22Malaysia 16 8Nigeria 5 14USA 3 6Netherlands 1 2Other 33 52Total trade debtors 305 264* restated
The trade debtors balance is the nominal value less an allowance for estimated impairment losses as follows:
Trade debtors (trade debtors balance) 2014 2013 (*)Nominal amount 318 277Impairment allowance (13) (13)Total trade debtors 305 264* restated
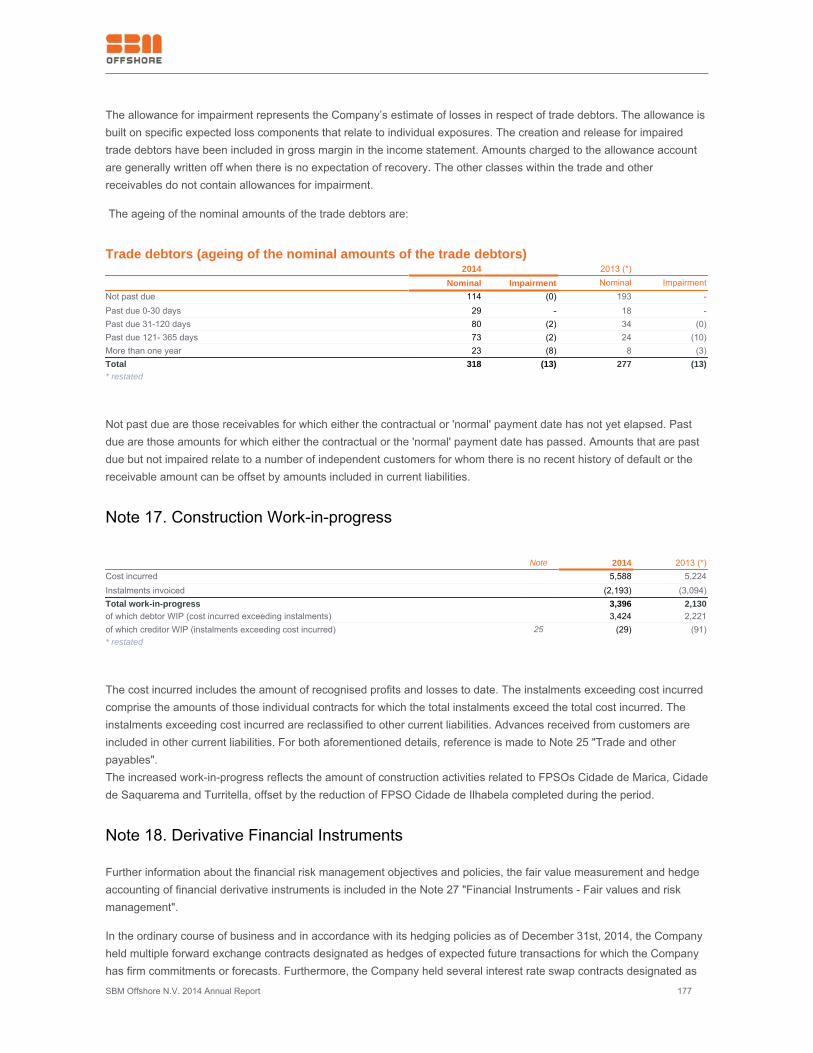
SBM Offshore N.V. 2014 Annual Report 177
The allowance for impairment represents the Company’s estimate of losses in respect of trade debtors. The allowance isbuilt on specific expected loss components that relate to individual exposures. The creation and release for impairedtrade debtors have been included in gross margin in the income statement. Amounts charged to the allowance accountare generally written off when there is no expectation of recovery. The other classes within the trade and otherreceivables do not contain allowances for impairment.
The ageing of the nominal amounts of the trade debtors are:
Trade debtors (ageing of the nominal amounts of the trade debtors) 2014 2013 (*) Nominal Impairment Nominal ImpairmentNot past due 114 (0) 193 -Past due 0-30 days 29 - 18 -Past due 31-120 days 80 (2) 34 (0)Past due 121- 365 days 73 (2) 24 (10)More than one year 23 (8) 8 (3)Total 318 (13) 277 (13)* restated
Not past due are those receivables for which either the contractual or 'normal' payment date has not yet elapsed. Pastdue are those amounts for which either the contractual or the 'normal' payment date has passed. Amounts that are pastdue but not impaired relate to a number of independent customers for whom there is no recent history of default or thereceivable amount can be offset by amounts included in current liabilities.
Note 17. Construction Work-in-progress
Note 2014 2013 (*)Cost incurred 5,588 5,224Instalments invoiced (2,193) (3,094)Total work-in-progress 3,396 2,130of which debtor WIP (cost incurred exceeding instalments) 3,424 2,221of which creditor WIP (instalments exceeding cost incurred) 25 (29) (91)* restated
The cost incurred includes the amount of recognised profits and losses to date. The instalments exceeding cost incurredcomprise the amounts of those individual contracts for which the total instalments exceed the total cost incurred. Theinstalments exceeding cost incurred are reclassified to other current liabilities. Advances received from customers areincluded in other current liabilities. For both aforementioned details, reference is made to Note 25 "Trade and otherpayables".The increased work-in-progress reflects the amount of construction activities related to FPSOs Cidade de Marica, Cidadede Saquarema and Turritella, offset by the reduction of FPSO Cidade de Ilhabela completed during the period.
Note 18. Derivative Financial Instruments
Further information about the financial risk management objectives and policies, the fair value measurement and hedgeaccounting of financial derivative instruments is included in the Note 27 "Financial Instruments - Fair values and riskmanagement".
In the ordinary course of business and in accordance with its hedging policies as of December 31st, 2014, the Companyheld multiple forward exchange contracts designated as hedges of expected future transactions for which the Companyhas firm commitments or forecasts. Furthermore, the Company held several interest rate swap contracts designated as
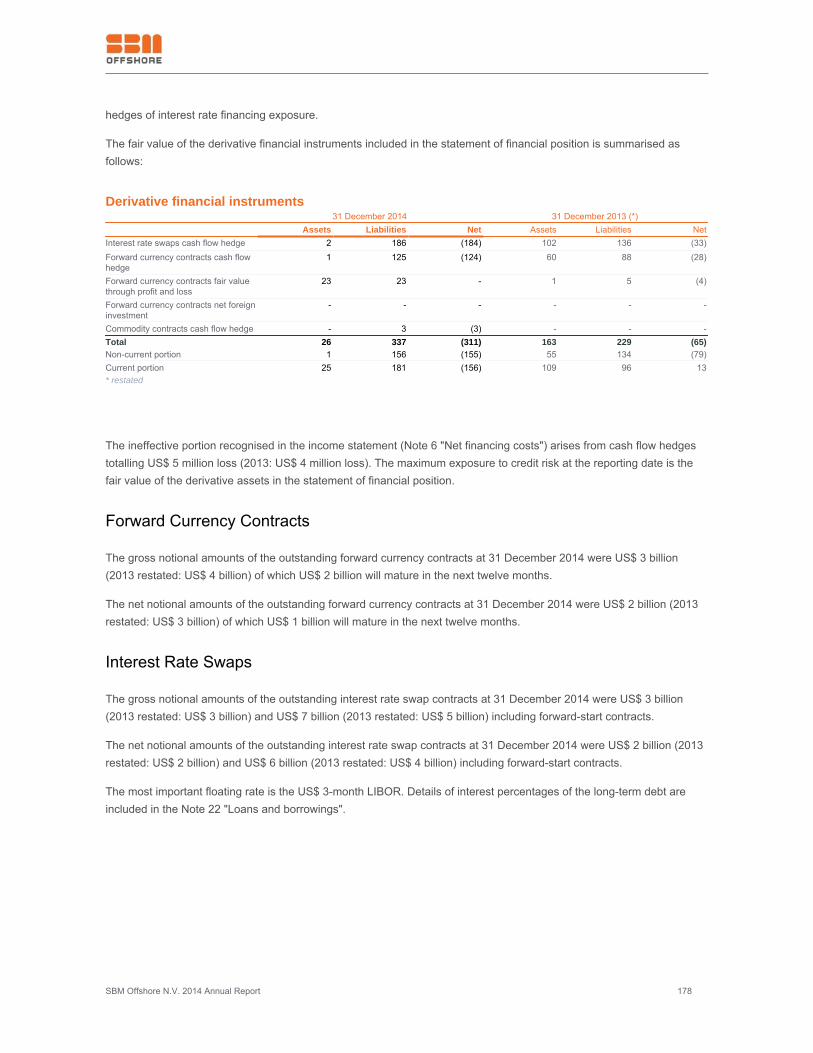
SBM Offshore N.V. 2014 Annual Report 178
hedges of interest rate financing exposure.
The fair value of the derivative financial instruments included in the statement of financial position is summarised asfollows:
Derivative financial instruments 31 December 2014 31 December 2013 (*) Assets Liabilities Net Assets Liabilities NetInterest rate swaps cash flow hedge 2 186 (184) 102 136 (33)Forward currency contracts cash flowhedge
1 125 (124) 60 88 (28)
Forward currency contracts fair valuethrough profit and loss
23 23 - 1 5 (4)
Forward currency contracts net foreigninvestment
- - - - - -
Commodity contracts cash flow hedge - 3 (3) - - -Total 26 337 (311) 163 229 (65)Non-current portion 1 156 (155) 55 134 (79)Current portion 25 181 (156) 109 96 13* restated
The ineffective portion recognised in the income statement (Note 6 "Net financing costs") arises from cash flow hedgestotalling US$ 5 million loss (2013: US$ 4 million loss). The maximum exposure to credit risk at the reporting date is thefair value of the derivative assets in the statement of financial position.
Forward Currency Contracts
The gross notional amounts of the outstanding forward currency contracts at 31 December 2014 were US$ 3 billion(2013 restated: US$ 4 billion) of which US$ 2 billion will mature in the next twelve months.
The net notional amounts of the outstanding forward currency contracts at 31 December 2014 were US$ 2 billion (2013restated: US$ 3 billion) of which US$ 1 billion will mature in the next twelve months.
Interest Rate Swaps
The gross notional amounts of the outstanding interest rate swap contracts at 31 December 2014 were US$ 3 billion(2013 restated: US$ 3 billion) and US$ 7 billion (2013 restated: US$ 5 billion) including forward-start contracts.
The net notional amounts of the outstanding interest rate swap contracts at 31 December 2014 were US$ 2 billion (2013restated: US$ 2 billion) and US$ 6 billion (2013 restated: US$ 4 billion) including forward-start contracts.
The most important floating rate is the US$ 3-month LIBOR. Details of interest percentages of the long-term debt areincluded in the Note 22 "Loans and borrowings".
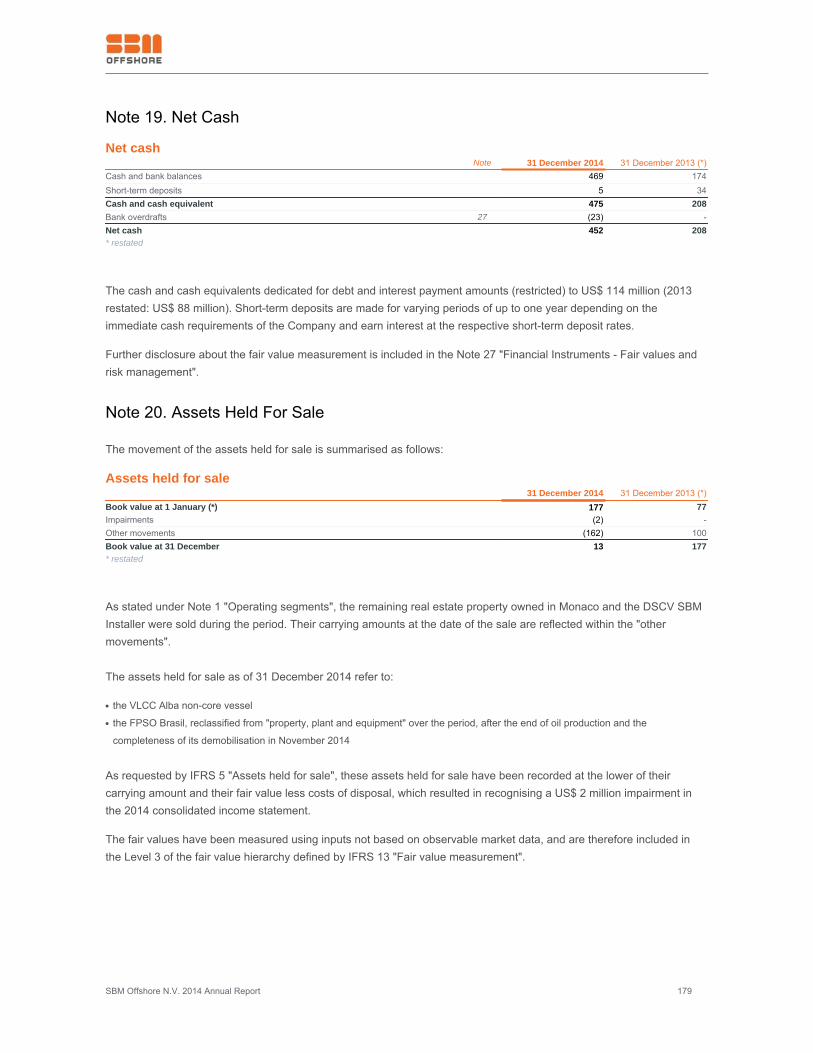
SBM Offshore N.V. 2014 Annual Report 179
Note 19. Net Cash
Net cash Note 31 December 2014 31 December 2013 (*)Cash and bank balances 469 174Short-term deposits 5 34Cash and cash equivalent 475 208Bank overdrafts 27 (23) -Net cash 452 208* restated
The cash and cash equivalents dedicated for debt and interest payment amounts (restricted) to US$ 114 million (2013restated: US$ 88 million). Short-term deposits are made for varying periods of up to one year depending on theimmediate cash requirements of the Company and earn interest at the respective short-term deposit rates.
Further disclosure about the fair value measurement is included in the Note 27 "Financial Instruments - Fair values andrisk management".
Note 20. Assets Held For Sale
The movement of the assets held for sale is summarised as follows:
Assets held for sale 31 December 2014 31 December 2013 (*)Book value at 1 January (*) 177 77Impairments (2) -Other movements (162) 100Book value at 31 December 13 177* restated
As stated under Note 1 "Operating segments", the remaining real estate property owned in Monaco and the DSCV SBMInstaller were sold during the period. Their carrying amounts at the date of the sale are reflected within the "othermovements".
The assets held for sale as of 31 December 2014 refer to:
the VLCC Alba non-core vessel●
the FPSO Brasil, reclassified from "property, plant and equipment" over the period, after the end of oil production and the●
completeness of its demobilisation in November 2014
As requested by IFRS 5 "Assets held for sale", these assets held for sale have been recorded at the lower of theircarrying amount and their fair value less costs of disposal, which resulted in recognising a US$ 2 million impairment inthe 2014 consolidated income statement.
The fair values have been measured using inputs not based on observable market data, and are therefore included inthe Level 3 of the fair value hierarchy defined by IFRS 13 "Fair value measurement".
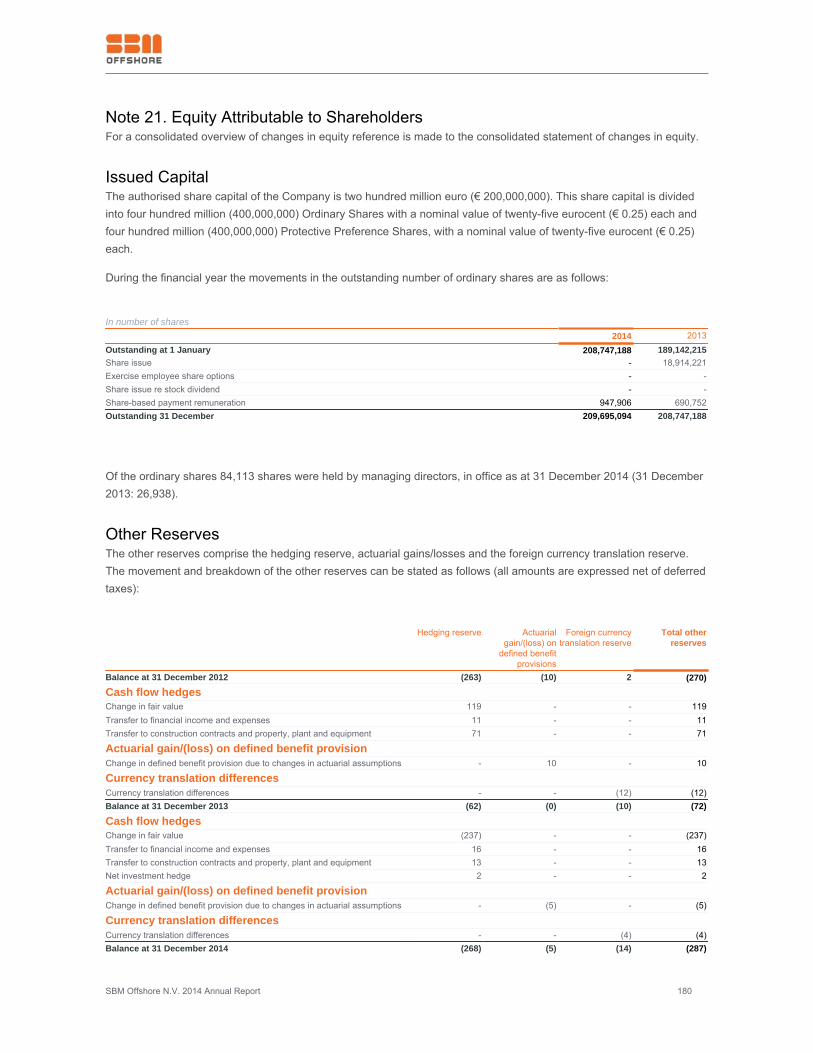
SBM Offshore N.V. 2014 Annual Report 180
Note 21. Equity Attributable to ShareholdersFor a consolidated overview of changes in equity reference is made to the consolidated statement of changes in equity.
Issued CapitalThe authorised share capital of the Company is two hundred million euro (€ 200,000,000). This share capital is dividedinto four hundred million (400,000,000) Ordinary Shares with a nominal value of twenty-five eurocent (€ 0.25) each andfour hundred million (400,000,000) Protective Preference Shares, with a nominal value of twenty-five eurocent (€ 0.25)each.
During the financial year the movements in the outstanding number of ordinary shares are as follows:
In number of shares
2014 2013Outstanding at 1 January 208,747,188 189,142,215Share issue - 18,914,221Exercise employee share options - -Share issue re stock dividend - -Share-based payment remuneration 947,906 690,752Outstanding 31 December 209,695,094 208,747,188
Of the ordinary shares 84,113 shares were held by managing directors, in office as at 31 December 2014 (31 December2013: 26,938).
Other ReservesThe other reserves comprise the hedging reserve, actuarial gains/losses and the foreign currency translation reserve.The movement and breakdown of the other reserves can be stated as follows (all amounts are expressed net of deferredtaxes):
Hedging reserve Actuarial
gain/(loss) ondefined benefit
provisions
Foreign currencytranslation reserve
Total otherreserves
Balance at 31 December 2012 (263) (10) 2 (270)Cash flow hedgesChange in fair value 119 - - 119Transfer to financial income and expenses 11 - - 11Transfer to construction contracts and property, plant and equipment 71 - - 71
Actuarial gain/(loss) on defined benefit provisionChange in defined benefit provision due to changes in actuarial assumptions - 10 - 10
Currency translation differencesCurrency translation differences - - (12) (12)Balance at 31 December 2013 (62) (0) (10) (72)
Cash flow hedgesChange in fair value (237) - - (237)Transfer to financial income and expenses 16 - - 16Transfer to construction contracts and property, plant and equipment 13 - - 13Net investment hedge 2 - - 2
Actuarial gain/(loss) on defined benefit provisionChange in defined benefit provision due to changes in actuarial assumptions - (5) - (5)
Currency translation differencesCurrency translation differences - - (4) (4)Balance at 31 December 2014 (268) (5) (14) (287)
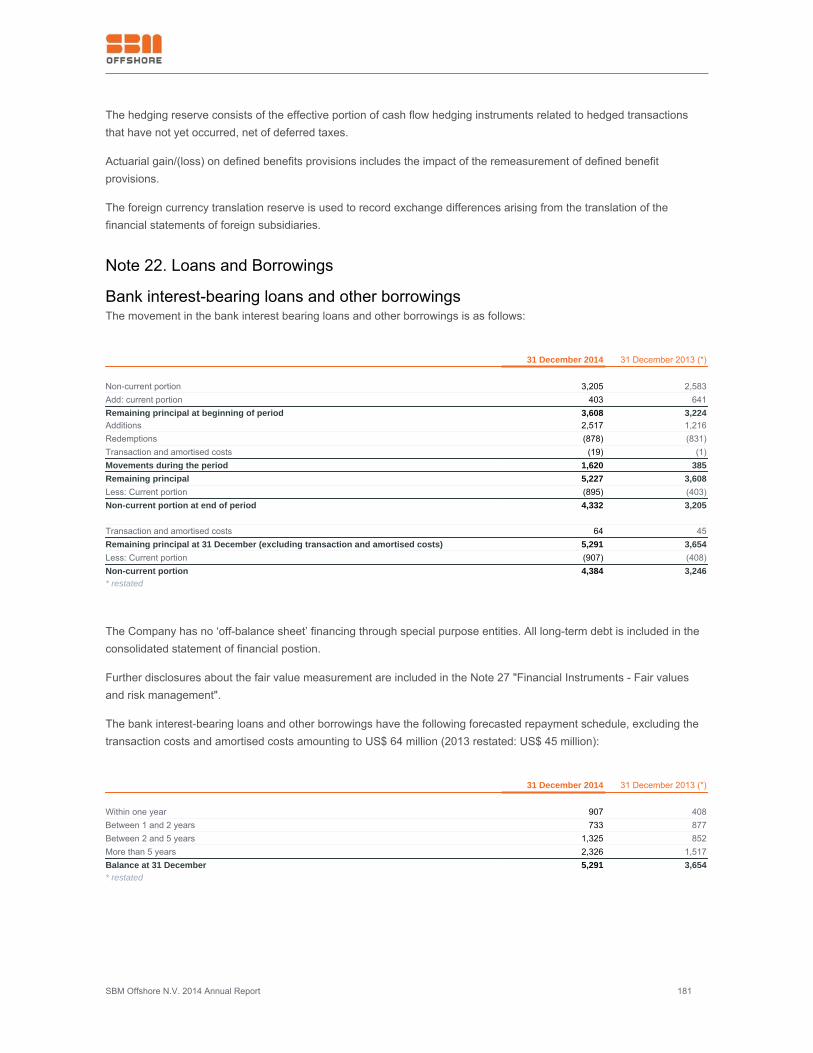
SBM Offshore N.V. 2014 Annual Report 181
The hedging reserve consists of the effective portion of cash flow hedging instruments related to hedged transactionsthat have not yet occurred, net of deferred taxes.
Actuarial gain/(loss) on defined benefits provisions includes the impact of the remeasurement of defined benefitprovisions.
The foreign currency translation reserve is used to record exchange differences arising from the translation of thefinancial statements of foreign subsidiaries.
Note 22. Loans and Borrowings
Bank interest-bearing loans and other borrowingsThe movement in the bank interest bearing loans and other borrowings is as follows:
31 December 2014 31 December 2013 (*)
Non-current portion 3,205 2,583Add: current portion 403 641Remaining principal at beginning of period 3,608 3,224Additions 2,517 1,216Redemptions (878) (831)Transaction and amortised costs (19) (1)Movements during the period 1,620 385Remaining principal 5,227 3,608Less: Current portion (895) (403)Non-current portion at end of period 4,332 3,205 Transaction and amortised costs 64 45Remaining principal at 31 December (excluding transaction and amortised costs) 5,291 3,654Less: Current portion (907) (408)Non-current portion 4,384 3,246* restated
The Company has no ‘off-balance sheet’ financing through special purpose entities. All long-term debt is included in theconsolidated statement of financial postion.
Further disclosures about the fair value measurement are included in the Note 27 "Financial Instruments - Fair valuesand risk management".
The bank interest-bearing loans and other borrowings have the following forecasted repayment schedule, excluding thetransaction costs and amortised costs amounting to US$ 64 million (2013 restated: US$ 45 million):
31 December 2014 31 December 2013 (*) Within one year 907 408Between 1 and 2 years 733 877Between 2 and 5 years 1,325 852More than 5 years 2,326 1,517Balance at 31 December 5,291 3,654* restated
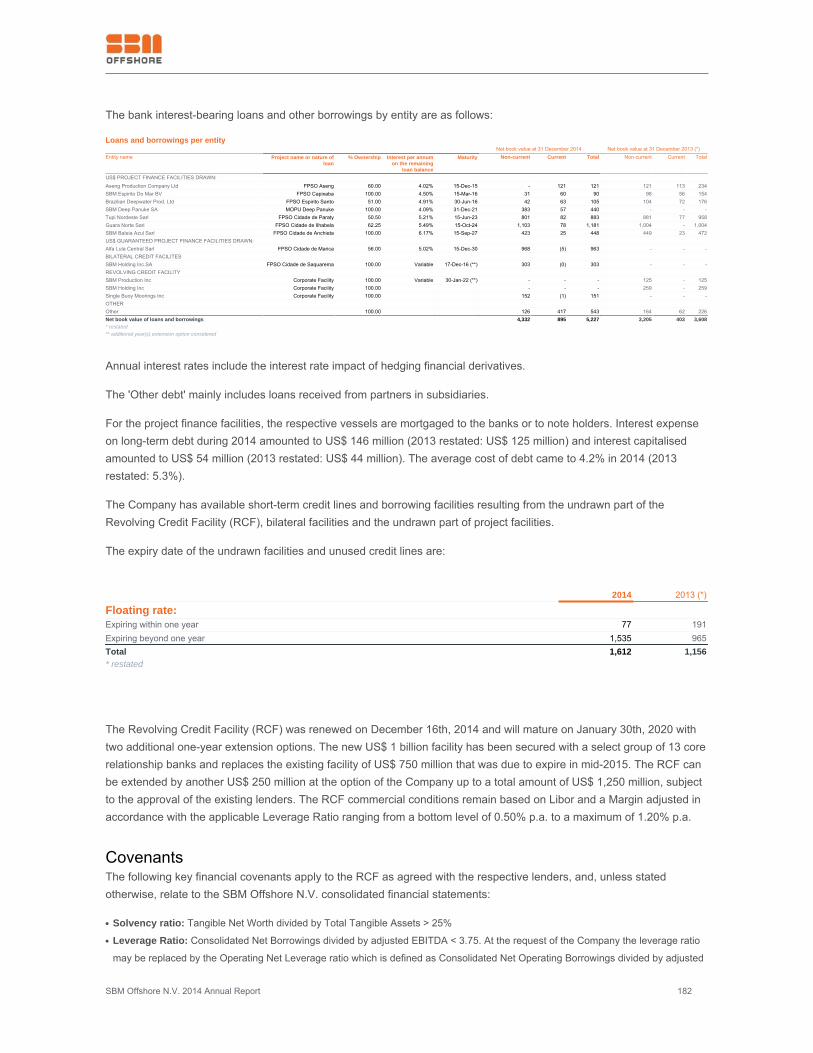
SBM Offshore N.V. 2014 Annual Report 182
The bank interest-bearing loans and other borrowings by entity are as follows:
Loans and borrowings per entity Net book value at 31 December 2014 Net book value at 31 December 2013 (*)Entity name Project name or nature of
loan% Ownership Interest per annum
on the remainingloan balance
Maturity Non-current Current Total Non-current Current Total
US$ PROJECT FINANCE FACILITIES DRAWN: Aseng Production Company Ltd FPSO Aseng 60.00 4.02% 15-Dec-15 - 121 121 121 113 234SBM Espirito Do Mar BV FPSO Capixaba 100.00 4.50% 15-Mar-16 31 60 90 98 56 154Brazilian Deepwater Prod. Ltd FPSO Espirito Santo 51.00 4.91% 30-Jun-16 42 63 105 104 72 176SBM Deep Panuke SA MOPU Deep Panuke 100.00 4.09% 31-Dec-21 383 57 440 - - -Tupi Nordeste Sarl FPSO Cidade de Paraty 50.50 5.21% 15-Jun-23 801 82 883 881 77 958Guara Norte Sarl FPSO Cidade de Ilhabela 62.25 5.49% 15-Oct-24 1,103 78 1,181 1,004 - 1,004SBM Baleia Azul Sarl FPSO Cidade de Anchieta 100.00 6.17% 15-Sep-27 423 25 448 449 23 472US$ GUARANTEED PROJECT FINANCE FACILITIES DRAWN: Alfa Lula Central Sarl FPSO Cidade de Marica 56.00 5.02% 15-Dec-30 968 (5) 963 - - -BILATERAL CREDIT FACILITES SBM Holding Inc.SA FPSO Cidade de Saquarema 100.00 Variable 17-Dec-16 (**) 303 (0) 303 - - -REVOLVING CREDIT FACILITY SBM Production Inc Corporate Facility 100.00 Variable 30-Jan-22 (**) - - - 125 - 125SBM Holding Inc Corporate Facility 100.00 - - - 259 - 259Single Buoy Moorings Inc Corporate Facility 100.00 152 (1) 151 - - -OTHER Other 100.00 126 417 543 164 62 226Net book value of loans and borrowings 4,332 895 5,227 3,205 403 3,608* restated** additional year(s) extension option considered
Annual interest rates include the interest rate impact of hedging financial derivatives.
The 'Other debt' mainly includes loans received from partners in subsidiaries.
For the project finance facilities, the respective vessels are mortgaged to the banks or to note holders. Interest expenseon long-term debt during 2014 amounted to US$ 146 million (2013 restated: US$ 125 million) and interest capitalisedamounted to US$ 54 million (2013 restated: US$ 44 million). The average cost of debt came to 4.2% in 2014 (2013restated: 5.3%).
The Company has available short-term credit lines and borrowing facilities resulting from the undrawn part of theRevolving Credit Facility (RCF), bilateral facilities and the undrawn part of project facilities.
The expiry date of the undrawn facilities and unused credit lines are:
2014 2013 (*)
Floating rate:Expiring within one year 77 191Expiring beyond one year 1,535 965Total 1,612 1,156* restated
The Revolving Credit Facility (RCF) was renewed on December 16th, 2014 and will mature on January 30th, 2020 withtwo additional one-year extension options. The new US$ 1 billion facility has been secured with a select group of 13 corerelationship banks and replaces the existing facility of US$ 750 million that was due to expire in mid-2015. The RCF canbe extended by another US$ 250 million at the option of the Company up to a total amount of US$ 1,250 million, subjectto the approval of the existing lenders. The RCF commercial conditions remain based on Libor and a Margin adjusted inaccordance with the applicable Leverage Ratio ranging from a bottom level of 0.50% p.a. to a maximum of 1.20% p.a.
CovenantsThe following key financial covenants apply to the RCF as agreed with the respective lenders, and, unless statedotherwise, relate to the SBM Offshore N.V. consolidated financial statements:
Solvency ratio: Tangible Net Worth divided by Total Tangible Assets > 25%●
Leverage Ratio: Consolidated Net Borrowings divided by adjusted EBITDA < 3.75. At the request of the Company the leverage ratio●
may be replaced by the Operating Net Leverage ratio which is defined as Consolidated Net Operating Borrowings divided by adjusted
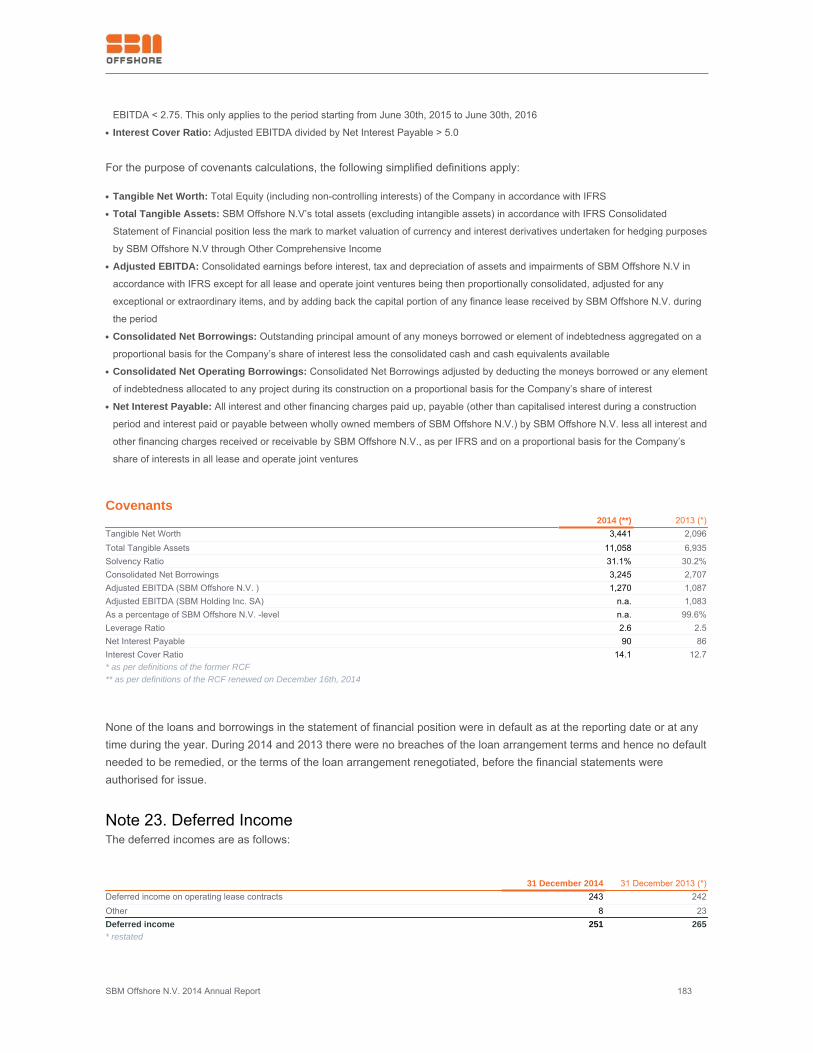
SBM Offshore N.V. 2014 Annual Report 183
EBITDA < 2.75. This only applies to the period starting from June 30th, 2015 to June 30th, 2016
Interest Cover Ratio: Adjusted EBITDA divided by Net Interest Payable > 5.0●
For the purpose of covenants calculations, the following simplified definitions apply:
Tangible Net Worth: Total Equity (including non-controlling interests) of the Company in accordance with IFRS●
Total Tangible Assets: SBM Offshore N.V’s total assets (excluding intangible assets) in accordance with IFRS Consolidated●
Statement of Financial position less the mark to market valuation of currency and interest derivatives undertaken for hedging purposes
by SBM Offshore N.V through Other Comprehensive Income
Adjusted EBITDA: Consolidated earnings before interest, tax and depreciation of assets and impairments of SBM Offshore N.V in●
accordance with IFRS except for all lease and operate joint ventures being then proportionally consolidated, adjusted for any
exceptional or extraordinary items, and by adding back the capital portion of any finance lease received by SBM Offshore N.V. during
the period
Consolidated Net Borrowings: Outstanding principal amount of any moneys borrowed or element of indebtedness aggregated on a●
proportional basis for the Company’s share of interest less the consolidated cash and cash equivalents available
Consolidated Net Operating Borrowings: Consolidated Net Borrowings adjusted by deducting the moneys borrowed or any element●
of indebtedness allocated to any project during its construction on a proportional basis for the Company’s share of interest
Net Interest Payable: All interest and other financing charges paid up, payable (other than capitalised interest during a construction●
period and interest paid or payable between wholly owned members of SBM Offshore N.V.) by SBM Offshore N.V. less all interest and
other financing charges received or receivable by SBM Offshore N.V., as per IFRS and on a proportional basis for the Company’s
share of interests in all lease and operate joint ventures
Covenants 2014 (**) 2013 (*)Tangible Net Worth 3,441 2,096Total Tangible Assets 11,058 6,935Solvency Ratio 31.1% 30.2%Consolidated Net Borrowings 3,245 2,707Adjusted EBITDA (SBM Offshore N.V. ) 1,270 1,087Adjusted EBITDA (SBM Holding Inc. SA) n.a. 1,083As a percentage of SBM Offshore N.V. -level n.a. 99.6%Leverage Ratio 2.6 2.5Net Interest Payable 90 86Interest Cover Ratio 14.1 12.7* as per definitions of the former RCF** as per definitions of the RCF renewed on December 16th, 2014
None of the loans and borrowings in the statement of financial position were in default as at the reporting date or at anytime during the year. During 2014 and 2013 there were no breaches of the loan arrangement terms and hence no defaultneeded to be remedied, or the terms of the loan arrangement renegotiated, before the financial statements wereauthorised for issue.
Note 23. Deferred IncomeThe deferred incomes are as follows:
31 December 2014 31 December 2013 (*)Deferred income on operating lease contracts 243 242Other 8 23Deferred income 251 265* restated
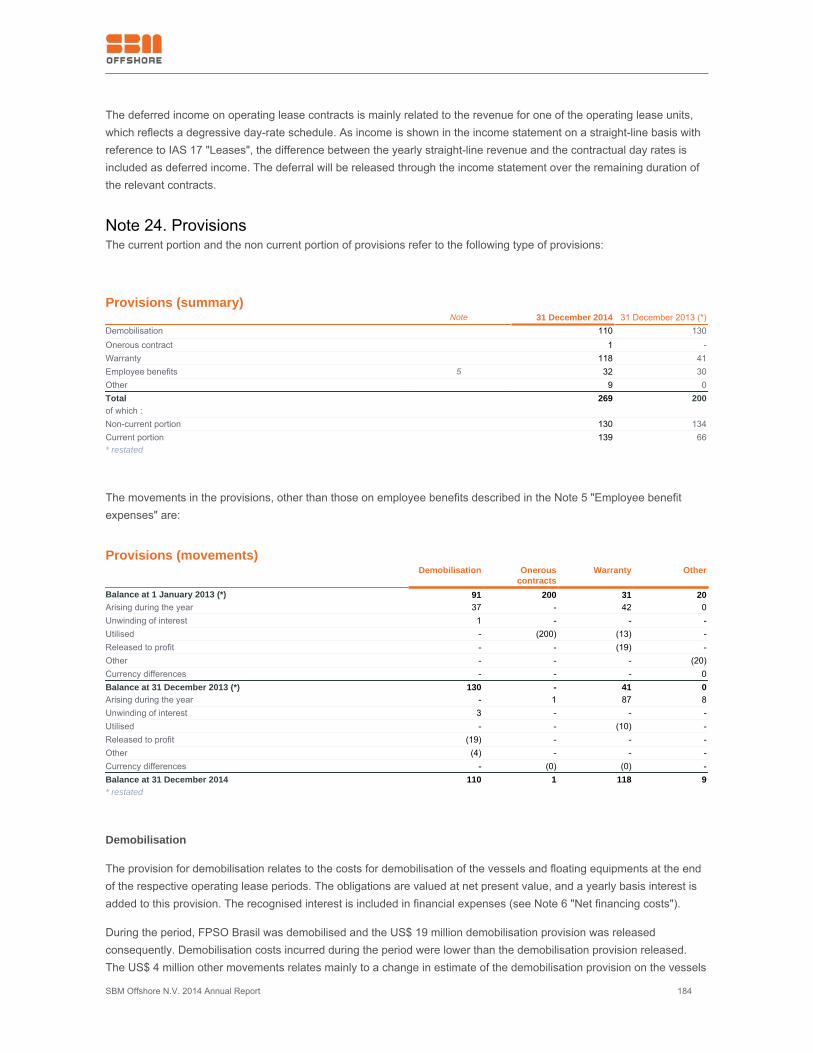
SBM Offshore N.V. 2014 Annual Report 184
The deferred income on operating lease contracts is mainly related to the revenue for one of the operating lease units,which reflects a degressive day-rate schedule. As income is shown in the income statement on a straight-line basis withreference to IAS 17 "Leases", the difference between the yearly straight-line revenue and the contractual day rates isincluded as deferred income. The deferral will be released through the income statement over the remaining duration ofthe relevant contracts.
Note 24. ProvisionsThe current portion and the non current portion of provisions refer to the following type of provisions:
Provisions (summary) Note 31 December 2014 31 December 2013 (*)Demobilisation 110 130Onerous contract 1 -Warranty 118 41Employee benefits 5 32 30Other 9 0Total 269 200of which : Non-current portion 130 134Current portion 139 66* restated
The movements in the provisions, other than those on employee benefits described in the Note 5 "Employee benefitexpenses" are:
Provisions (movements) Demobilisation Onerous
contractsWarranty Other
Balance at 1 January 2013 (*) 91 200 31 20Arising during the year 37 - 42 0Unwinding of interest 1 - - -Utilised - (200) (13) -Released to profit - - (19) -Other - - - (20)Currency differences - - - 0Balance at 31 December 2013 (*) 130 - 41 0Arising during the year - 1 87 8Unwinding of interest 3 - - -Utilised - - (10) -Released to profit (19) - - -Other (4) - - -Currency differences - (0) (0) -Balance at 31 December 2014 110 1 118 9* restated
Demobilisation
The provision for demobilisation relates to the costs for demobilisation of the vessels and floating equipments at the endof the respective operating lease periods. The obligations are valued at net present value, and a yearly basis interest isadded to this provision. The recognised interest is included in financial expenses (see Note 6 "Net financing costs").
During the period, FPSO Brasil was demobilised and the US$ 19 million demobilisation provision was releasedconsequently. Demobilisation costs incurred during the period were lower than the demobilisation provision released.The US$ 4 million other movements relates mainly to a change in estimate of the demobilisation provision on the vessels
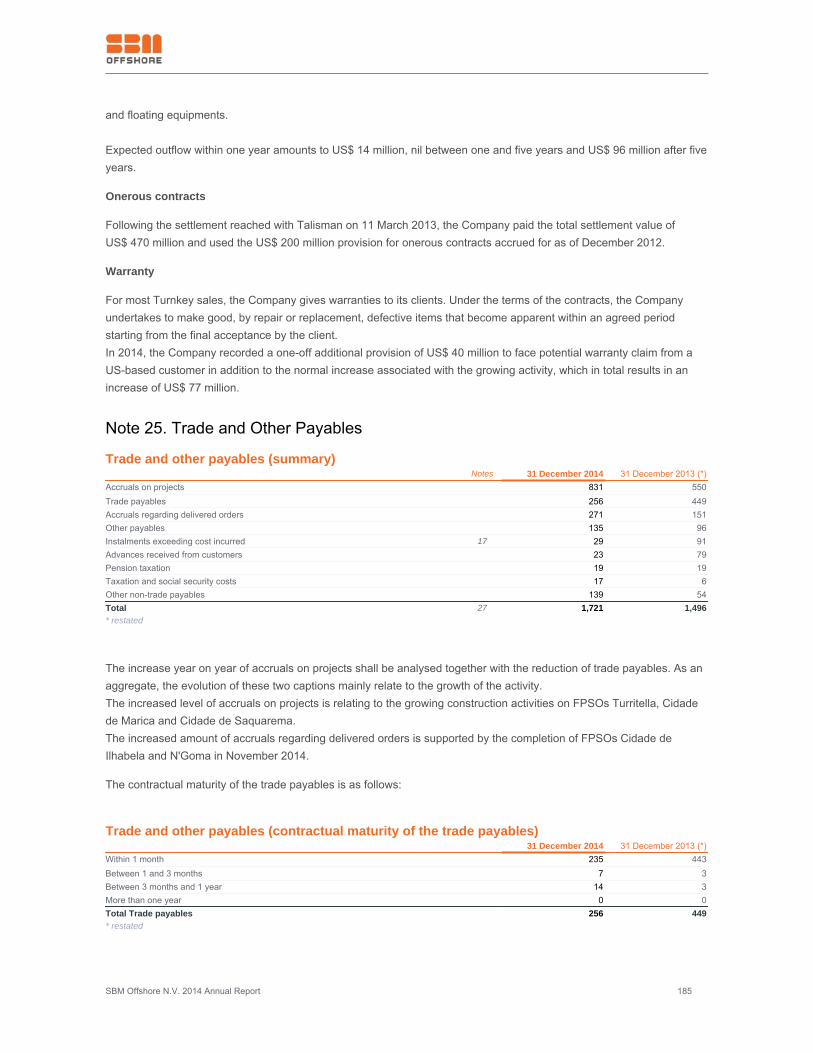
SBM Offshore N.V. 2014 Annual Report 185
and floating equipments.
Expected outflow within one year amounts to US$ 14 million, nil between one and five years and US$ 96 million after fiveyears.
Onerous contracts
Following the settlement reached with Talisman on 11 March 2013, the Company paid the total settlement value of US$ 470 million and used the US$ 200 million provision for onerous contracts accrued for as of December 2012.
Warranty
For most Turnkey sales, the Company gives warranties to its clients. Under the terms of the contracts, the Companyundertakes to make good, by repair or replacement, defective items that become apparent within an agreed periodstarting from the final acceptance by the client.In 2014, the Company recorded a one-off additional provision of US$ 40 million to face potential warranty claim from aUS-based customer in addition to the normal increase associated with the growing activity, which in total results in anincrease of US$ 77 million.
Note 25. Trade and Other Payables
Trade and other payables (summary) Notes 31 December 2014 31 December 2013 (*)Accruals on projects 831 550Trade payables 256 449Accruals regarding delivered orders 271 151Other payables 135 96Instalments exceeding cost incurred 17 29 91Advances received from customers 23 79Pension taxation 19 19Taxation and social security costs 17 6Other non-trade payables 139 54Total 27 1,721 1,496* restated
The increase year on year of accruals on projects shall be analysed together with the reduction of trade payables. As anaggregate, the evolution of these two captions mainly relate to the growth of the activity.The increased level of accruals on projects is relating to the growing construction activities on FPSOs Turritella, Cidadede Marica and Cidade de Saquarema.The increased amount of accruals regarding delivered orders is supported by the completion of FPSOs Cidade deIlhabela and N'Goma in November 2014.
The contractual maturity of the trade payables is as follows:
Trade and other payables (contractual maturity of the trade payables) 31 December 2014 31 December 2013 (*)Within 1 month 235 443Between 1 and 3 months 7 3Between 3 months and 1 year 14 3More than one year 0 0Total Trade payables 256 449* restated
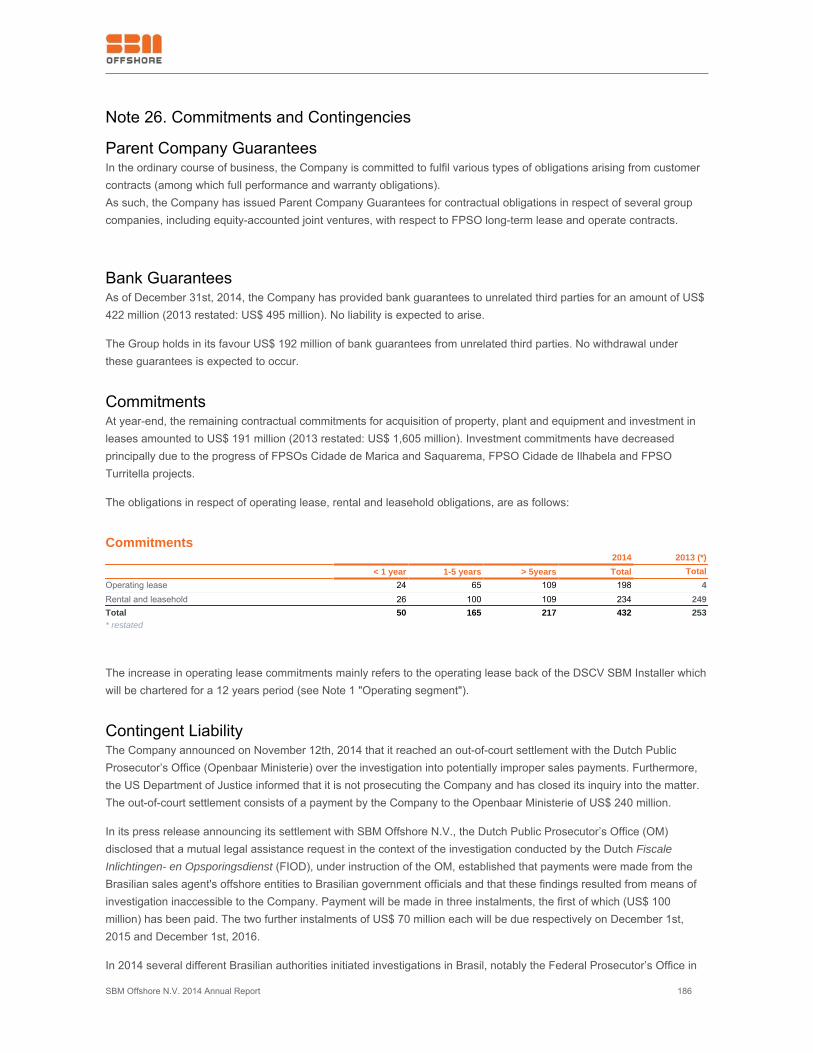
SBM Offshore N.V. 2014 Annual Report 186
Note 26. Commitments and Contingencies
Parent Company GuaranteesIn the ordinary course of business, the Company is committed to fulfil various types of obligations arising from customercontracts (among which full performance and warranty obligations).As such, the Company has issued Parent Company Guarantees for contractual obligations in respect of several groupcompanies, including equity-accounted joint ventures, with respect to FPSO long-term lease and operate contracts.
Bank GuaranteesAs of December 31st, 2014, the Company has provided bank guarantees to unrelated third parties for an amount of US$422 million (2013 restated: US$ 495 million). No liability is expected to arise.
The Group holds in its favour US$ 192 million of bank guarantees from unrelated third parties. No withdrawal underthese guarantees is expected to occur.
CommitmentsAt year-end, the remaining contractual commitments for acquisition of property, plant and equipment and investment inleases amounted to US$ 191 million (2013 restated: US$ 1,605 million). Investment commitments have decreasedprincipally due to the progress of FPSOs Cidade de Marica and Saquarema, FPSO Cidade de Ilhabela and FPSOTurritella projects.
The obligations in respect of operating lease, rental and leasehold obligations, are as follows:
Commitments 2014 2013 (*) < 1 year 1-5 years > 5years Total TotalOperating lease 24 65 109 198 4Rental and leasehold 26 100 109 234 249Total 50 165 217 432 253* restated
The increase in operating lease commitments mainly refers to the operating lease back of the DSCV SBM Installer whichwill be chartered for a 12 years period (see Note 1 "Operating segment").
Contingent LiabilityThe Company announced on November 12th, 2014 that it reached an out-of-court settlement with the Dutch PublicProsecutor’s Office (Openbaar Ministerie) over the investigation into potentially improper sales payments. Furthermore,the US Department of Justice informed that it is not prosecuting the Company and has closed its inquiry into the matter.The out-of-court settlement consists of a payment by the Company to the Openbaar Ministerie of US$ 240 million.
In its press release announcing its settlement with SBM Offshore N.V., the Dutch Public Prosecutor’s Office (OM)disclosed that a mutual legal assistance request in the context of the investigation conducted by the Dutch FiscaleInlichtingen- en Opsporingsdienst (FIOD), under instruction of the OM, established that payments were made from theBrasilian sales agent's offshore entities to Brasilian government officials and that these findings resulted from means ofinvestigation inaccessible to the Company. Payment will be made in three instalments, the first of which (US$ 100million) has been paid. The two further instalments of US$ 70 million each will be due respectively on December 1st,2015 and December 1st, 2016.
In 2014 several different Brasilian authorities initiated investigations in Brasil, notably the Federal Prosecutor’s Office in
SBM Offshore N.V. 2014 Annual Report 187
Rio de Janeiro (“MPF”), the Federal Accounts Tribunal (“TCU”) and the Controller General’s Office (“CGU”). Some ofthese investigations are directed against or involve the Company. At this stage, it is not possible to state anything on theoutcome of these investigations, financial or otherwise, but failure to comply with Brasilian anti-corruption laws, ifestablished, could result in the Company having to pay damages, fines or penalties, as well as in disgorgement, ordebarment.
The Company is currently in active dialogue with relevant authorities in Brasil with the aim of seeking closure of theseissues, especially with the Comptroller General's Office, from which the Company recently received a notice ofinvestigation.
Contingent AssetThe Company keeps on investigating the possibility to recover losses incurred in connection with the Yme developmentproject from insurers. Under the terms of the settlement agreement with Talisman, all pending and future claimrecoveries (after expenses and legal costs) relating to the Yme development project under the relevant construction allrisks insurance shall be shared 50/50 between the Company and Talisman.
Note 27. Financial Instruments - Fair Values and Risk Management
This note presents information about the Company's exposure to risk resulting from its use of financial instruments, theCompany's objectives, policies and processes for measuring and managing risk, and the Company's management ofcapital. Further qualitative disclosures are included throughout these consolidated financial statements.
Accounting classifications and fair valuesThe Company uses the following fair value hierarchy for financial instruments that are measured at fair value in thestatement of financial position, which require disclosure of fair value measurements by level:
• Quoted prices (unadjusted) in active markets for identical assets or liabilities (Level 1)
• Inputs other than quoted prices included within Level 1 that are observable for the asset or liability, either directly (thatis, as prices) or indirectly (that is, derived from prices) (Level 2)
• Inputs for the asset or liability that are not based on observable market data (that is unobservable inputs) (Level 3)
The following table shows the carrying amounts and fair values of financial assets and financial liabilities, including theirlevels in the fair value hierarchy. It does not include fair value information for financial assets and financial liabilities notmeasured at fair value if the carrying amount is a reasonable approximation of fair value.
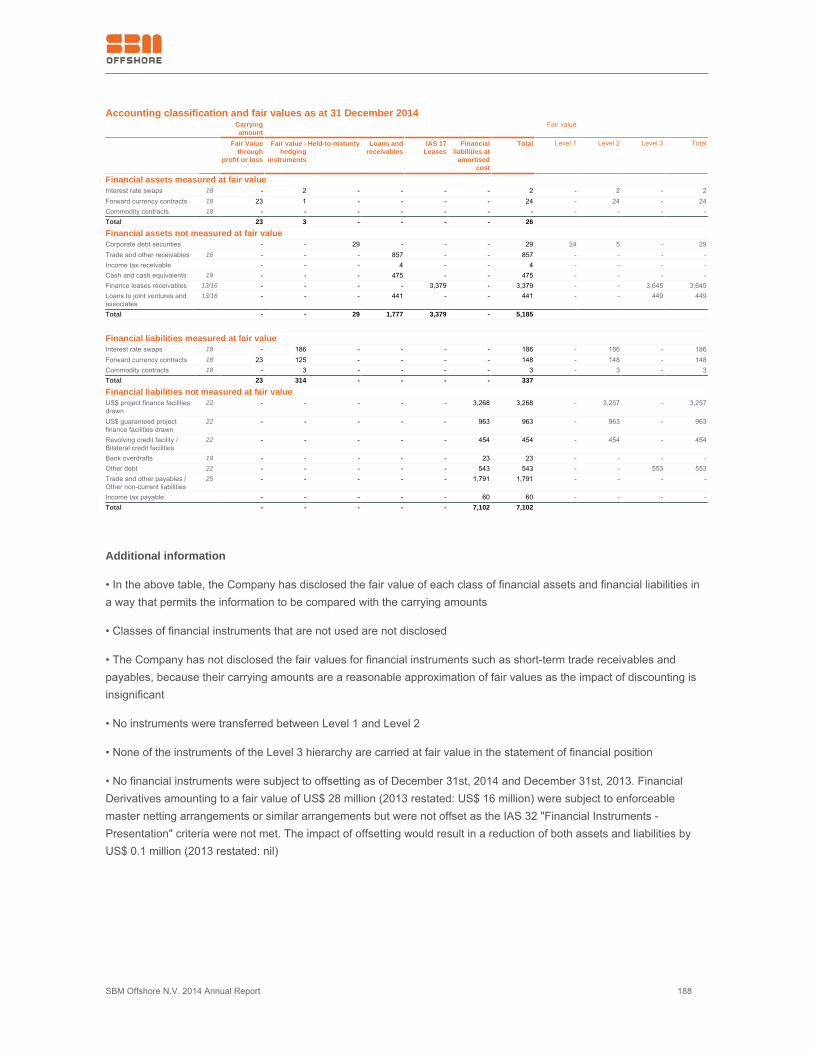
SBM Offshore N.V. 2014 Annual Report 188
Accounting classification and fair values as at 31 December 2014 Carrying
amount Fair value
Fair Valuethrough
profit or loss
Fair value -hedging
instruments
Held-to-maturity Loans andreceivables
IAS 17Leases
Financialliabilities at
amortisedcost
Total Level 1 Level 2 Level 3 Total
Financial assets measured at fair valueInterest rate swaps 18 - 2 - - - - 2 - 2 - 2Forward currency contracts 18 23 1 - - - - 24 - 24 - 24Commodity contracts 18 - - - - - - - - - - -Total 23 3 - - - - 26
Financial assets not measured at fair valueCorporate debt securities - - 29 - - - 29 24 5 - 29Trade and other receivables 16 - - - 857 - - 857 - - - -Income tax receivable - - - 4 - - 4 - - - -Cash and cash equivalents 19 - - - 475 - - 475 - - - -Finance leases receivables 13/16 - - - - 3,379 - 3,379 - - 3,645 3,645Loans to joint ventures andassociates
13/16 - - - 441 - - 441 - - 449 449
Total - - 29 1,777 3,379 - 5,185
Financial liabilities measured at fair valueInterest rate swaps 18 - 186 - - - - 186 - 186 - 186Forward currency contracts 18 23 125 - - - - 148 - 148 - 148Commodity contracts 18 - 3 - - - - 3 - 3 - 3Total 23 314 - - - - 337
Financial liabilities not measured at fair valueUS$ project finance facilitiesdrawn
22 - - - - - 3,268 3,268 - 3,257 - 3,257
US$ guaranteed projectfinance facilities drawn
22 - - - - - 963 963 - 963 - 963
Revolving credit facility /Bilateral credit facilities
22 - - - - - 454 454 - 454 - 454
Bank overdrafts 19 - - - - - 23 23 - - - -Other debt 22 - - - - - 543 543 - - 553 553Trade and other payables /Other non-current liabilities
25 - - - - - 1,791 1,791 - - - -
Income tax payable - - - - - 60 60 - - - -Total - - - - - 7,102 7,102
Additional information
• In the above table, the Company has disclosed the fair value of each class of financial assets and financial liabilities ina way that permits the information to be compared with the carrying amounts
• Classes of financial instruments that are not used are not disclosed
• The Company has not disclosed the fair values for financial instruments such as short-term trade receivables andpayables, because their carrying amounts are a reasonable approximation of fair values as the impact of discounting isinsignificant
• No instruments were transferred between Level 1 and Level 2
• None of the instruments of the Level 3 hierarchy are carried at fair value in the statement of financial position
• No financial instruments were subject to offsetting as of December 31st, 2014 and December 31st, 2013. FinancialDerivatives amounting to a fair value of US$ 28 million (2013 restated: US$ 16 million) were subject to enforceablemaster netting arrangements or similar arrangements but were not offset as the IAS 32 "Financial Instruments -Presentation" criteria were not met. The impact of offsetting would result in a reduction of both assets and liabilities byUS$ 0.1 million (2013 restated: nil)
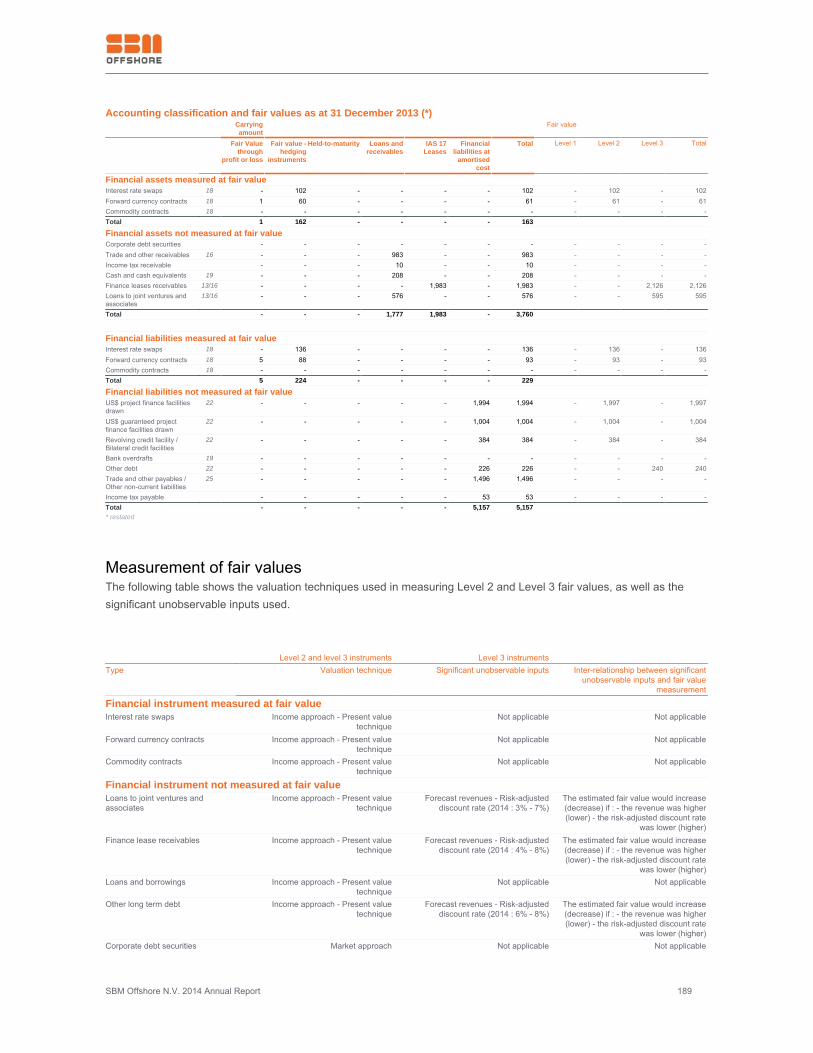
SBM Offshore N.V. 2014 Annual Report 189
Accounting classification and fair values as at 31 December 2013 (*) Carrying
amount Fair value
Fair Valuethrough
profit or loss
Fair value -hedging
instruments
Held-to-maturity Loans andreceivables
IAS 17Leases
Financialliabilities at
amortisedcost
Total Level 1 Level 2 Level 3 Total
Financial assets measured at fair valueInterest rate swaps 18 - 102 - - - - 102 - 102 - 102Forward currency contracts 18 1 60 - - - - 61 - 61 - 61Commodity contracts 18 - - - - - - - - - - -Total 1 162 - - - - 163
Financial assets not measured at fair valueCorporate debt securities - - - - - - - - - - -Trade and other receivables 16 - - - 983 - - 983 - - - -Income tax receivable - - - 10 - - 10 - - - -Cash and cash equivalents 19 - - - 208 - - 208 - - - -Finance leases receivables 13/16 - - - - 1,983 - 1,983 - - 2,126 2,126Loans to joint ventures andassociates
13/16 - - - 576 - - 576 - - 595 595
Total - - - 1,777 1,983 - 3,760
Financial liabilities measured at fair valueInterest rate swaps 18 - 136 - - - - 136 - 136 - 136Forward currency contracts 18 5 88 - - - - 93 - 93 - 93Commodity contracts 18 - - - - - - - - - - -Total 5 224 - - - - 229
Financial liabilities not measured at fair valueUS$ project finance facilitiesdrawn
22 - - - - - 1,994 1,994 - 1,997 - 1,997
US$ guaranteed projectfinance facilities drawn
22 - - - - - 1,004 1,004 - 1,004 - 1,004
Revolving credit facility /Bilateral credit facilities
22 - - - - - 384 384 - 384 - 384
Bank overdrafts 19 - - - - - - - - - - -Other debt 22 - - - - - 226 226 - - 240 240Trade and other payables /Other non-current liabilities
25 - - - - - 1,496 1,496 - - - -
Income tax payable - - - - - 53 53 - - - -Total - - - - - 5,157 5,157 * restated
Measurement of fair valuesThe following table shows the valuation techniques used in measuring Level 2 and Level 3 fair values, as well as thesignificant unobservable inputs used.
Level 2 and level 3 instruments Level 3 instruments Type Valuation technique Significant unobservable inputs Inter-relationship between significant
unobservable inputs and fair valuemeasurement
Financial instrument measured at fair valueInterest rate swaps Income approach - Present value
techniqueNot applicable Not applicable
Forward currency contracts Income approach - Present valuetechnique
Not applicable Not applicable
Commodity contracts Income approach - Present valuetechnique
Not applicable Not applicable
Financial instrument not measured at fair valueLoans to joint ventures andassociates
Income approach - Present valuetechnique
Forecast revenues - Risk-adjusteddiscount rate (2014 : 3% - 7%)
The estimated fair value would increase(decrease) if : - the revenue was higher(lower) - the risk-adjusted discount rate
was lower (higher)Finance lease receivables Income approach - Present value
techniqueForecast revenues - Risk-adjusted
discount rate (2014 : 4% - 8%)The estimated fair value would increase(decrease) if : - the revenue was higher(lower) - the risk-adjusted discount rate
was lower (higher)Loans and borrowings Income approach - Present value
techniqueNot applicable Not applicable
Other long term debt Income approach - Present valuetechnique
Forecast revenues - Risk-adjusteddiscount rate (2014 : 6% - 8%)
The estimated fair value would increase(decrease) if : - the revenue was higher(lower) - the risk-adjusted discount rate
was lower (higher)Corporate debt securities Market approach Not applicable Not applicable
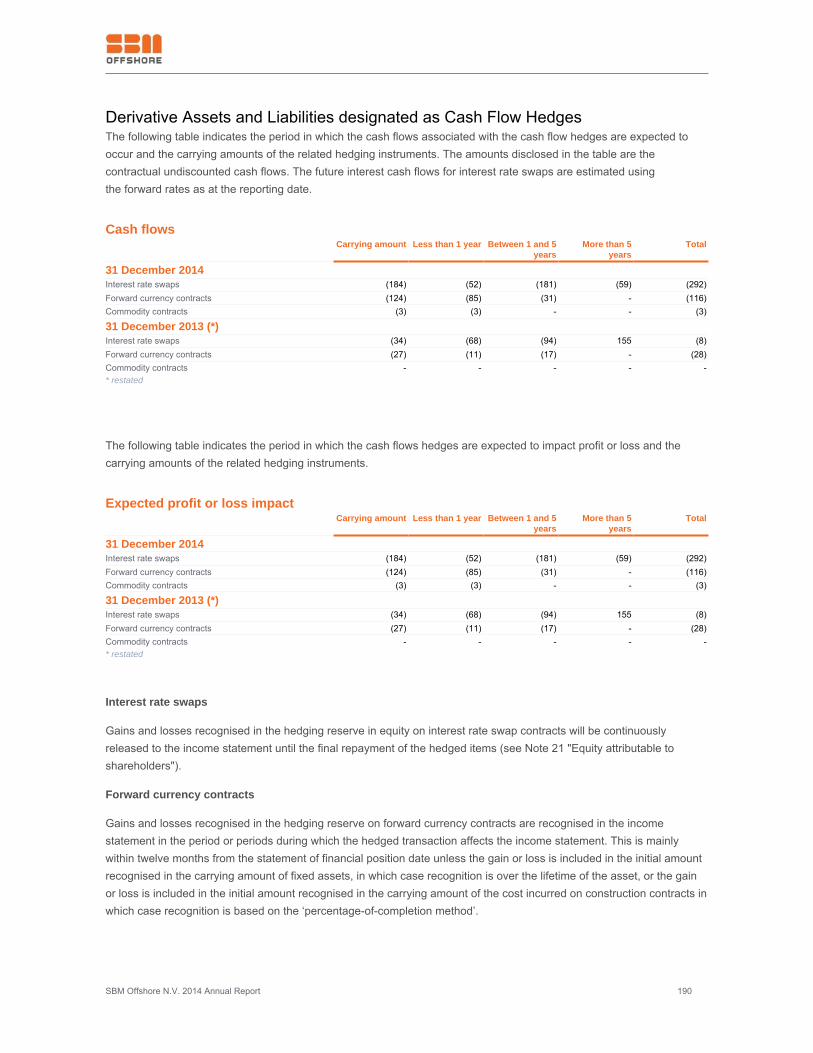
SBM Offshore N.V. 2014 Annual Report 190
Derivative Assets and Liabilities designated as Cash Flow HedgesThe following table indicates the period in which the cash flows associated with the cash flow hedges are expected tooccur and the carrying amounts of the related hedging instruments. The amounts disclosed in the table are thecontractual undiscounted cash flows. The future interest cash flows for interest rate swaps are estimated usingthe forward rates as at the reporting date.
Cash flows Carrying amount Less than 1 year Between 1 and 5
yearsMore than 5
yearsTotal
31 December 2014Interest rate swaps (184) (52) (181) (59) (292)Forward currency contracts (124) (85) (31) - (116)Commodity contracts (3) (3) - - (3)
31 December 2013 (*)Interest rate swaps (34) (68) (94) 155 (8)Forward currency contracts (27) (11) (17) - (28)Commodity contracts - - - - -* restated
The following table indicates the period in which the cash flows hedges are expected to impact profit or loss and thecarrying amounts of the related hedging instruments.
Expected profit or loss impact Carrying amount Less than 1 year Between 1 and 5
yearsMore than 5
yearsTotal
31 December 2014Interest rate swaps (184) (52) (181) (59) (292)Forward currency contracts (124) (85) (31) - (116)Commodity contracts (3) (3) - - (3)
31 December 2013 (*)Interest rate swaps (34) (68) (94) 155 (8)Forward currency contracts (27) (11) (17) - (28)Commodity contracts - - - - -* restated
Interest rate swaps
Gains and losses recognised in the hedging reserve in equity on interest rate swap contracts will be continuouslyreleased to the income statement until the final repayment of the hedged items (see Note 21 "Equity attributable toshareholders").
Forward currency contracts
Gains and losses recognised in the hedging reserve on forward currency contracts are recognised in the incomestatement in the period or periods during which the hedged transaction affects the income statement. This is mainlywithin twelve months from the statement of financial position date unless the gain or loss is included in the initial amountrecognised in the carrying amount of fixed assets, in which case recognition is over the lifetime of the asset, or the gainor loss is included in the initial amount recognised in the carrying amount of the cost incurred on construction contracts inwhich case recognition is based on the ‘percentage-of-completion method’.
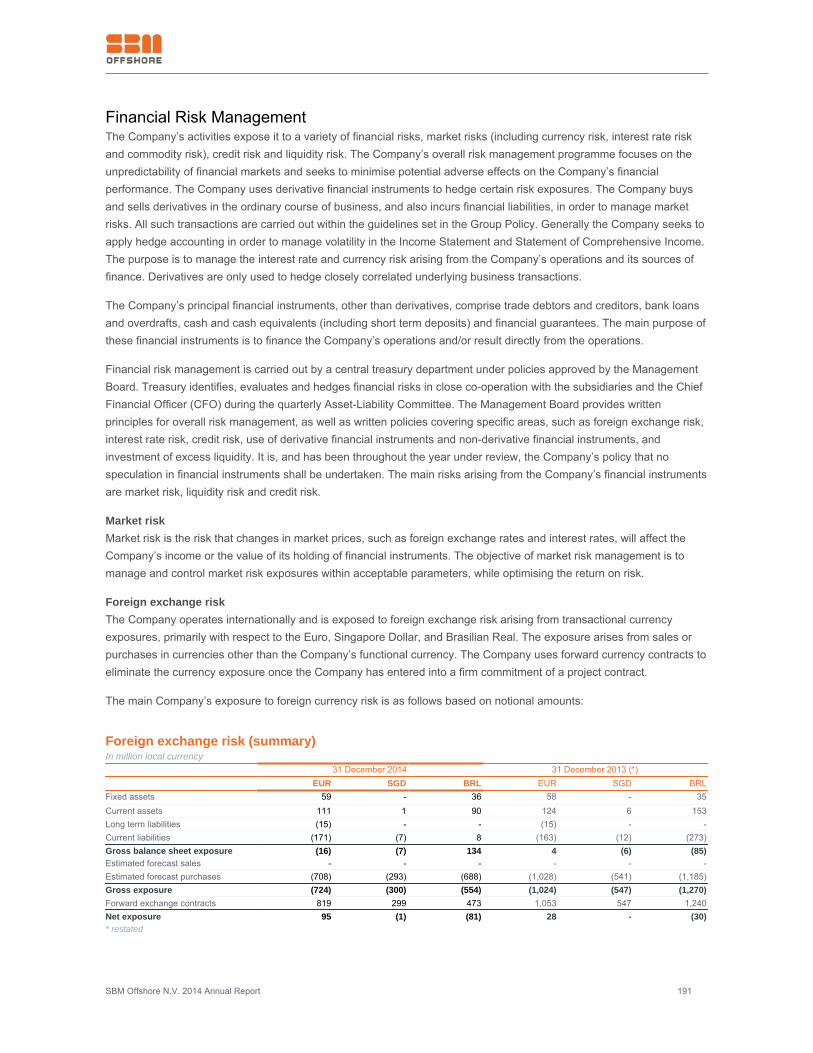
SBM Offshore N.V. 2014 Annual Report 191
Financial Risk ManagementThe Company’s activities expose it to a variety of financial risks, market risks (including currency risk, interest rate riskand commodity risk), credit risk and liquidity risk. The Company’s overall risk management programme focuses on theunpredictability of financial markets and seeks to minimise potential adverse effects on the Company’s financialperformance. The Company uses derivative financial instruments to hedge certain risk exposures. The Company buysand sells derivatives in the ordinary course of business, and also incurs financial liabilities, in order to manage marketrisks. All such transactions are carried out within the guidelines set in the Group Policy. Generally the Company seeks toapply hedge accounting in order to manage volatility in the Income Statement and Statement of Comprehensive Income.The purpose is to manage the interest rate and currency risk arising from the Company’s operations and its sources offinance. Derivatives are only used to hedge closely correlated underlying business transactions.
The Company’s principal financial instruments, other than derivatives, comprise trade debtors and creditors, bank loansand overdrafts, cash and cash equivalents (including short term deposits) and financial guarantees. The main purpose ofthese financial instruments is to finance the Company’s operations and/or result directly from the operations.
Financial risk management is carried out by a central treasury department under policies approved by the ManagementBoard. Treasury identifies, evaluates and hedges financial risks in close co-operation with the subsidiaries and the ChiefFinancial Officer (CFO) during the quarterly Asset-Liability Committee. The Management Board provides writtenprinciples for overall risk management, as well as written policies covering specific areas, such as foreign exchange risk,interest rate risk, credit risk, use of derivative financial instruments and non-derivative financial instruments, andinvestment of excess liquidity. It is, and has been throughout the year under review, the Company’s policy that nospeculation in financial instruments shall be undertaken. The main risks arising from the Company’s financial instrumentsare market risk, liquidity risk and credit risk.
Market riskMarket risk is the risk that changes in market prices, such as foreign exchange rates and interest rates, will affect theCompany’s income or the value of its holding of financial instruments. The objective of market risk management is tomanage and control market risk exposures within acceptable parameters, while optimising the return on risk.
Foreign exchange riskThe Company operates internationally and is exposed to foreign exchange risk arising from transactional currencyexposures, primarily with respect to the Euro, Singapore Dollar, and Brasilian Real. The exposure arises from sales orpurchases in currencies other than the Company’s functional currency. The Company uses forward currency contracts toeliminate the currency exposure once the Company has entered into a firm commitment of a project contract.
The main Company’s exposure to foreign currency risk is as follows based on notional amounts:
Foreign exchange risk (summary)In million local currency 31 December 2014 31 December 2013 (*)
EUR SGD BRL EUR SGD BRLFixed assets 59 - 36 58 - 35Current assets 111 1 90 124 6 153Long term liabilities (15) - - (15) - -Current liabilities (171) (7) 8 (163) (12) (273)Gross balance sheet exposure (16) (7) 134 4 (6) (85)Estimated forecast sales - - - - - -Estimated forecast purchases (708) (293) (688) (1,028) (541) (1,185)Gross exposure (724) (300) (554) (1,024) (547) (1,270)Forward exchange contracts 819 299 473 1,053 547 1,240Net exposure 95 (1) (81) 28 - (30)* restated
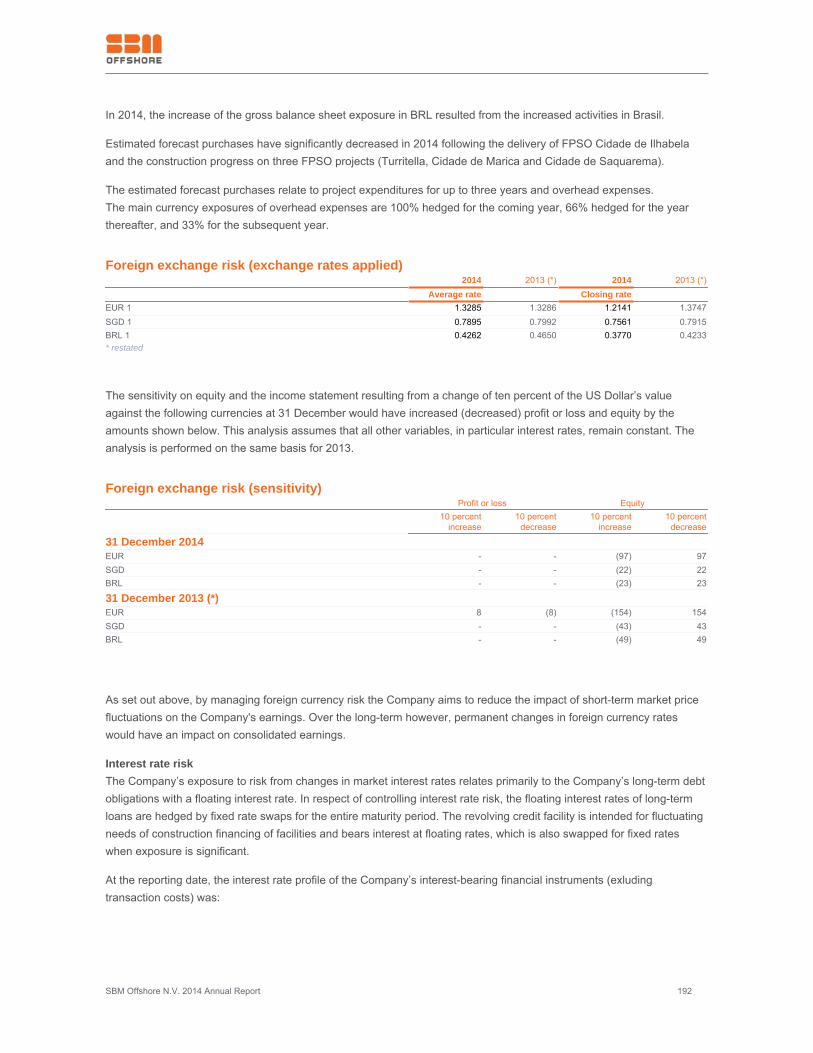
SBM Offshore N.V. 2014 Annual Report 192
In 2014, the increase of the gross balance sheet exposure in BRL resulted from the increased activities in Brasil.
Estimated forecast purchases have significantly decreased in 2014 following the delivery of FPSO Cidade de Ilhabelaand the construction progress on three FPSO projects (Turritella, Cidade de Marica and Cidade de Saquarema).
The estimated forecast purchases relate to project expenditures for up to three years and overhead expenses.The main currency exposures of overhead expenses are 100% hedged for the coming year, 66% hedged for the yearthereafter, and 33% for the subsequent year.
Foreign exchange risk (exchange rates applied) 2014 2013 (*) 2014 2013 (*) Average rate Closing rate EUR 1 1.3285 1.3286 1.2141 1.3747SGD 1 0.7895 0.7992 0.7561 0.7915BRL 1 0.4262 0.4650 0.3770 0.4233* restated
The sensitivity on equity and the income statement resulting from a change of ten percent of the US Dollar’s valueagainst the following currencies at 31 December would have increased (decreased) profit or loss and equity by theamounts shown below. This analysis assumes that all other variables, in particular interest rates, remain constant. Theanalysis is performed on the same basis for 2013.
Foreign exchange risk (sensitivity) Profit or loss Equity 10 percent
increase10 percent
decrease10 percent
increase10 percent
decrease
31 December 2014EUR - - (97) 97SGD - - (22) 22BRL - - (23) 23
31 December 2013 (*)EUR 8 (8) (154) 154SGD - - (43) 43BRL - - (49) 49
As set out above, by managing foreign currency risk the Company aims to reduce the impact of short-term market pricefluctuations on the Company's earnings. Over the long-term however, permanent changes in foreign currency rateswould have an impact on consolidated earnings.
Interest rate riskThe Company’s exposure to risk from changes in market interest rates relates primarily to the Company’s long-term debtobligations with a floating interest rate. In respect of controlling interest rate risk, the floating interest rates of long-termloans are hedged by fixed rate swaps for the entire maturity period. The revolving credit facility is intended for fluctuatingneeds of construction financing of facilities and bears interest at floating rates, which is also swapped for fixed rateswhen exposure is significant.
At the reporting date, the interest rate profile of the Company’s interest-bearing financial instruments (exludingtransaction costs) was:
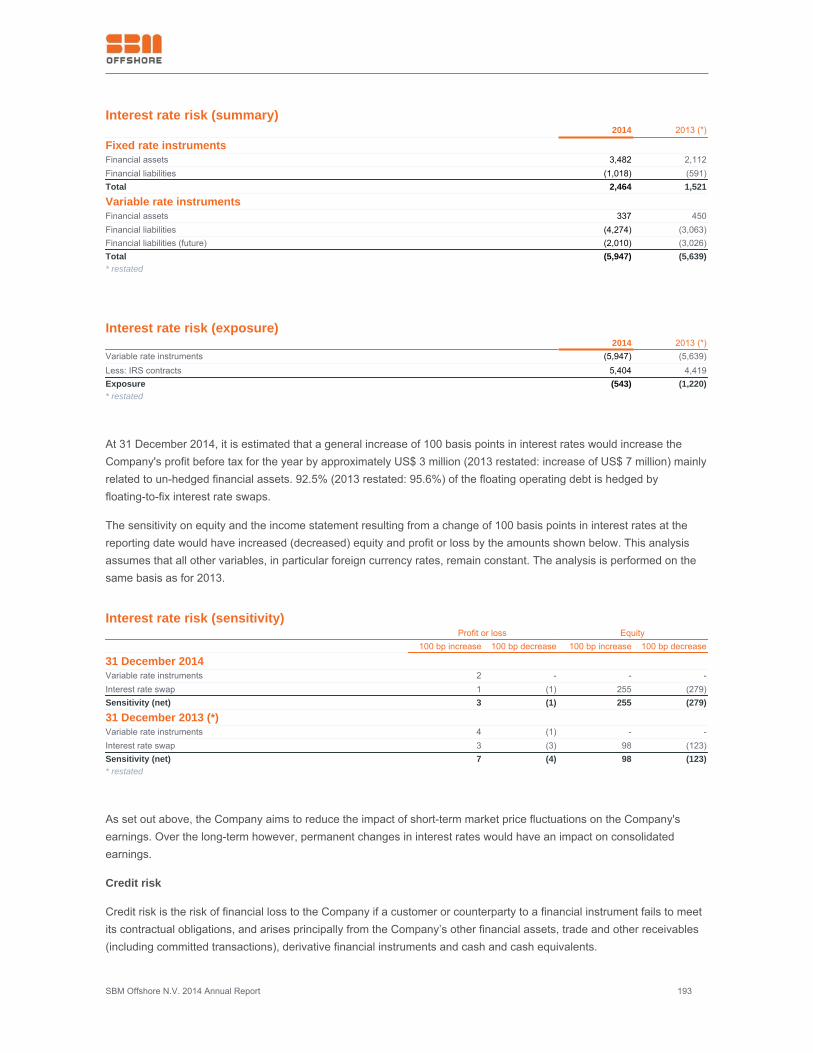
SBM Offshore N.V. 2014 Annual Report 193
Interest rate risk (summary) 2014 2013 (*)
Fixed rate instrumentsFinancial assets 3,482 2,112Financial liabilities (1,018) (591)Total 2,464 1,521
Variable rate instrumentsFinancial assets 337 450Financial liabilities (4,274) (3,063)Financial liabilities (future) (2,010) (3,026)Total (5,947) (5,639)* restated
Interest rate risk (exposure) 2014 2013 (*)Variable rate instruments (5,947) (5,639)Less: IRS contracts 5,404 4,419Exposure (543) (1,220)* restated
At 31 December 2014, it is estimated that a general increase of 100 basis points in interest rates would increase theCompany's profit before tax for the year by approximately US$ 3 million (2013 restated: increase of US$ 7 million) mainlyrelated to un-hedged financial assets. 92.5% (2013 restated: 95.6%) of the floating operating debt is hedged byfloating-to-fix interest rate swaps.
The sensitivity on equity and the income statement resulting from a change of 100 basis points in interest rates at thereporting date would have increased (decreased) equity and profit or loss by the amounts shown below. This analysisassumes that all other variables, in particular foreign currency rates, remain constant. The analysis is performed on thesame basis as for 2013.
Interest rate risk (sensitivity) Profit or loss Equity 100 bp increase 100 bp decrease 100 bp increase 100 bp decrease
31 December 2014Variable rate instruments 2 - - -Interest rate swap 1 (1) 255 (279)Sensitivity (net) 3 (1) 255 (279)
31 December 2013 (*)Variable rate instruments 4 (1) - -Interest rate swap 3 (3) 98 (123)Sensitivity (net) 7 (4) 98 (123)* restated
As set out above, the Company aims to reduce the impact of short-term market price fluctuations on the Company'searnings. Over the long-term however, permanent changes in interest rates would have an impact on consolidatedearnings.
Credit risk
Credit risk is the risk of financial loss to the Company if a customer or counterparty to a financial instrument fails to meetits contractual obligations, and arises principally from the Company’s other financial assets, trade and other receivables(including committed transactions), derivative financial instruments and cash and cash equivalents.
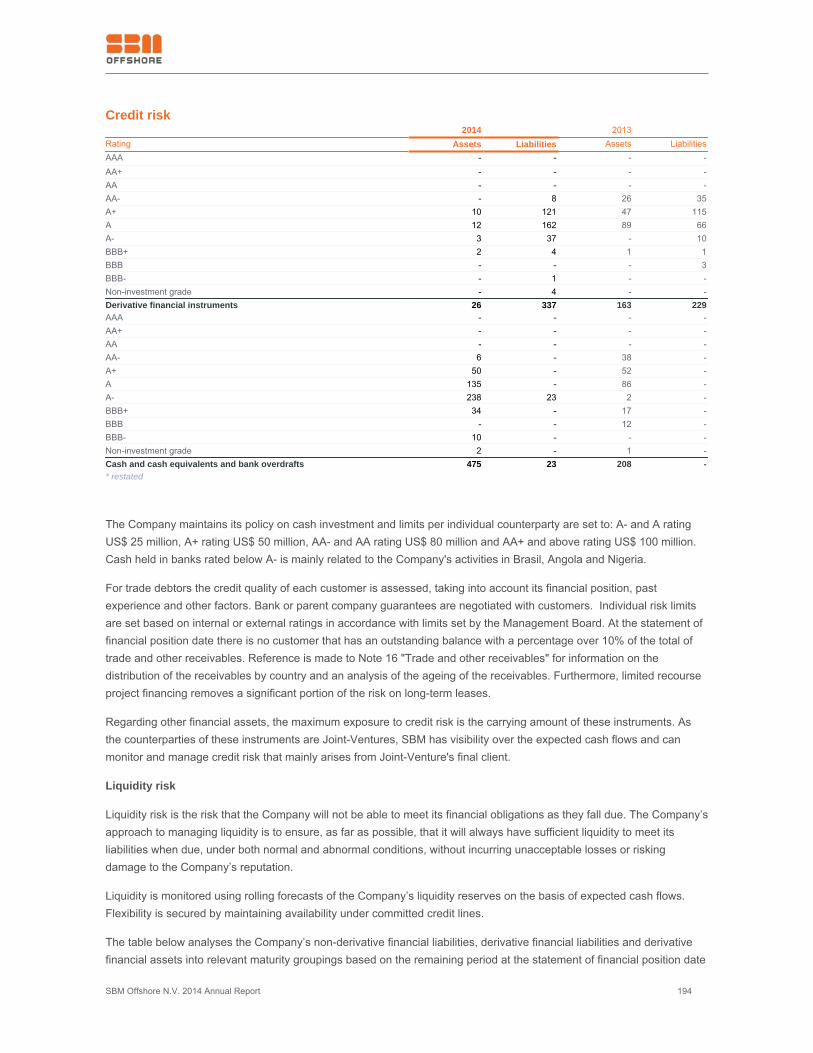
SBM Offshore N.V. 2014 Annual Report 194
Credit risk 2014 2013 Rating Assets Liabilities Assets LiabilitiesAAA - - - -AA+ - - - -AA - - - -AA- - 8 26 35A+ 10 121 47 115A 12 162 89 66A- 3 37 - 10BBB+ 2 4 1 1BBB - - - 3BBB- - 1 - -Non-investment grade - 4 - -Derivative financial instruments 26 337 163 229AAA - - - -AA+ - - - -AA - - - -AA- 6 - 38 -A+ 50 - 52 -A 135 - 86 -A- 238 23 2 -BBB+ 34 - 17 -BBB - - 12 -BBB- 10 - - -Non-investment grade 2 - 1 -Cash and cash equivalents and bank overdrafts 475 23 208 -* restated
The Company maintains its policy on cash investment and limits per individual counterparty are set to: A- and A ratingUS$ 25 million, A+ rating US$ 50 million, AA- and AA rating US$ 80 million and AA+ and above rating US$ 100 million.Cash held in banks rated below A- is mainly related to the Company's activities in Brasil, Angola and Nigeria.
For trade debtors the credit quality of each customer is assessed, taking into account its financial position, pastexperience and other factors. Bank or parent company guarantees are negotiated with customers. Individual risk limitsare set based on internal or external ratings in accordance with limits set by the Management Board. At the statement offinancial position date there is no customer that has an outstanding balance with a percentage over 10% of the total oftrade and other receivables. Reference is made to Note 16 "Trade and other receivables" for information on thedistribution of the receivables by country and an analysis of the ageing of the receivables. Furthermore, limited recourseproject financing removes a significant portion of the risk on long-term leases.
Regarding other financial assets, the maximum exposure to credit risk is the carrying amount of these instruments. Asthe counterparties of these instruments are Joint-Ventures, SBM has visibility over the expected cash flows and canmonitor and manage credit risk that mainly arises from Joint-Venture's final client.
Liquidity risk
Liquidity risk is the risk that the Company will not be able to meet its financial obligations as they fall due. The Company’sapproach to managing liquidity is to ensure, as far as possible, that it will always have sufficient liquidity to meet itsliabilities when due, under both normal and abnormal conditions, without incurring unacceptable losses or riskingdamage to the Company’s reputation.
Liquidity is monitored using rolling forecasts of the Company’s liquidity reserves on the basis of expected cash flows.Flexibility is secured by maintaining availability under committed credit lines.
The table below analyses the Company’s non-derivative financial liabilities, derivative financial liabilities and derivativefinancial assets into relevant maturity groupings based on the remaining period at the statement of financial position date
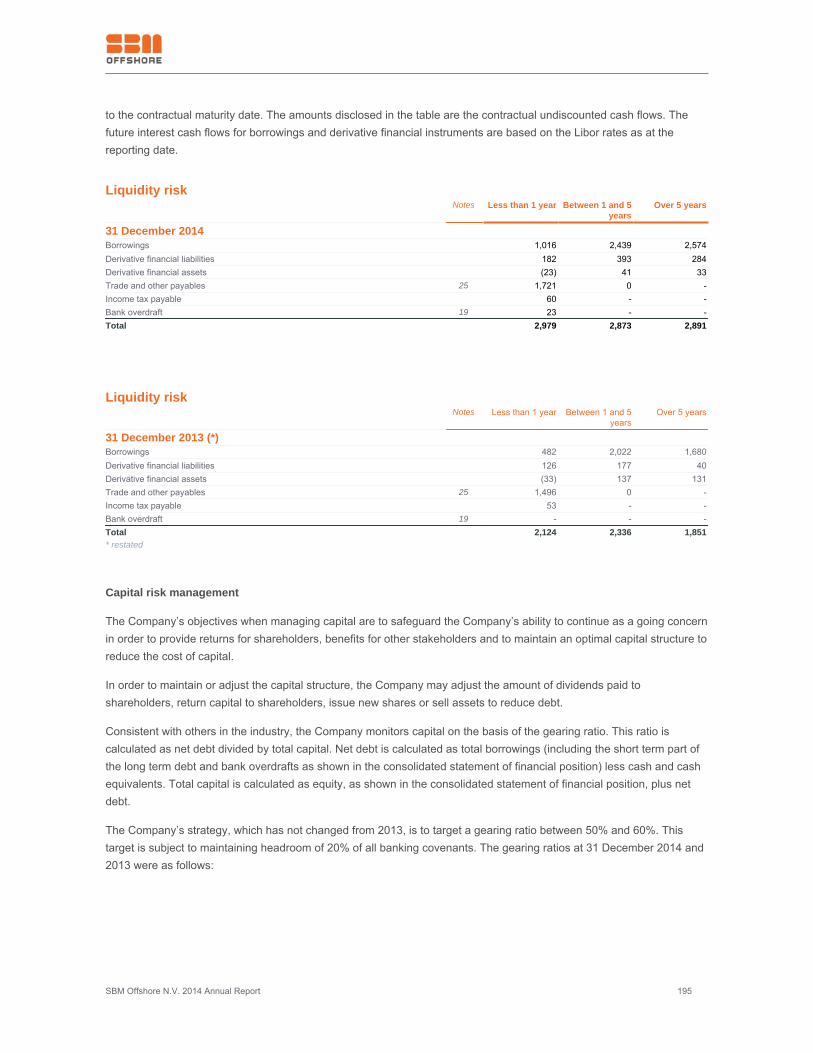
SBM Offshore N.V. 2014 Annual Report 195
to the contractual maturity date. The amounts disclosed in the table are the contractual undiscounted cash flows. Thefuture interest cash flows for borrowings and derivative financial instruments are based on the Libor rates as at thereporting date.
Liquidity risk Notes Less than 1 year Between 1 and 5
yearsOver 5 years
31 December 2014Borrowings 1,016 2,439 2,574Derivative financial liabilities 182 393 284Derivative financial assets (23) 41 33Trade and other payables 25 1,721 0 -Income tax payable 60 - -Bank overdraft 19 23 - -Total 2,979 2,873 2,891
Liquidity risk Notes Less than 1 year Between 1 and 5
yearsOver 5 years
31 December 2013 (*)Borrowings 482 2,022 1,680Derivative financial liabilities 126 177 40Derivative financial assets (33) 137 131Trade and other payables 25 1,496 0 -Income tax payable 53 - -Bank overdraft 19 - - -Total 2,124 2,336 1,851* restated
Capital risk management
The Company’s objectives when managing capital are to safeguard the Company’s ability to continue as a going concernin order to provide returns for shareholders, benefits for other stakeholders and to maintain an optimal capital structure toreduce the cost of capital.
In order to maintain or adjust the capital structure, the Company may adjust the amount of dividends paid toshareholders, return capital to shareholders, issue new shares or sell assets to reduce debt.
Consistent with others in the industry, the Company monitors capital on the basis of the gearing ratio. This ratio iscalculated as net debt divided by total capital. Net debt is calculated as total borrowings (including the short term part ofthe long term debt and bank overdrafts as shown in the consolidated statement of financial position) less cash and cashequivalents. Total capital is calculated as equity, as shown in the consolidated statement of financial position, plus netdebt.
The Company’s strategy, which has not changed from 2013, is to target a gearing ratio between 50% and 60%. Thistarget is subject to maintaining headroom of 20% of all banking covenants. The gearing ratios at 31 December 2014 and2013 were as follows:
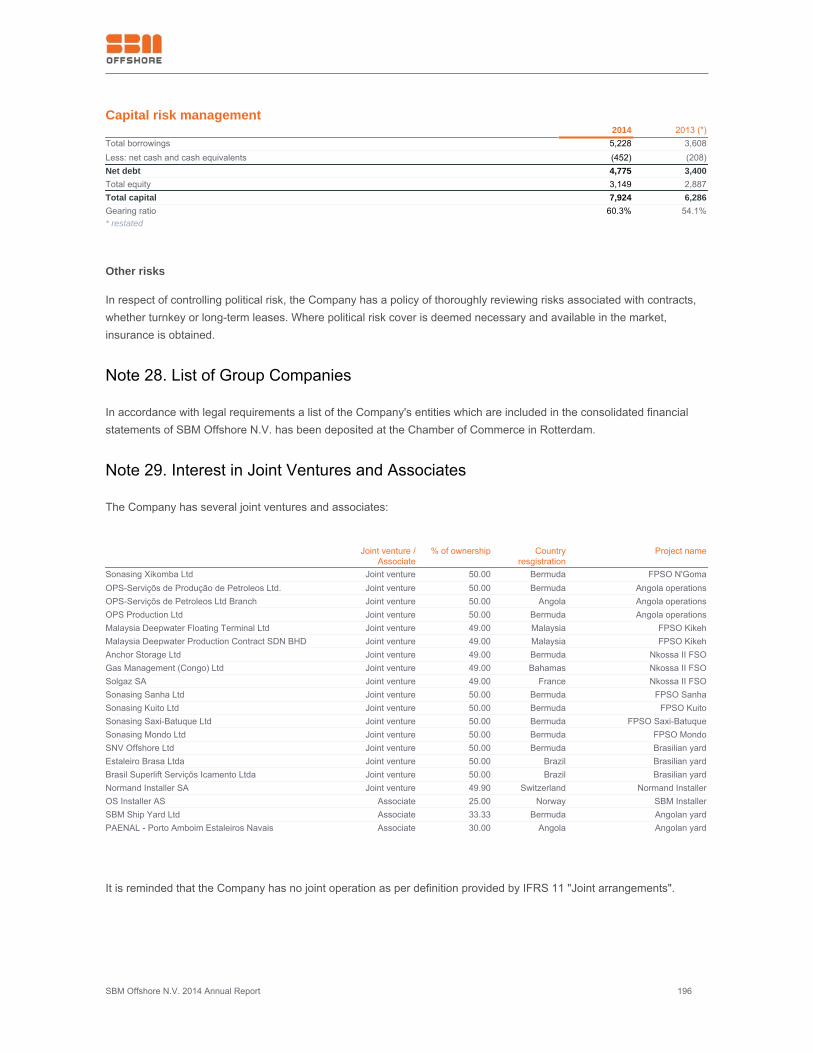
SBM Offshore N.V. 2014 Annual Report 196
Capital risk management 2014 2013 (*)Total borrowings 5,228 3,608Less: net cash and cash equivalents (452) (208)Net debt 4,775 3,400Total equity 3,149 2,887Total capital 7,924 6,286Gearing ratio 60.3% 54.1%* restated
Other risks
In respect of controlling political risk, the Company has a policy of thoroughly reviewing risks associated with contracts,whether turnkey or long-term leases. Where political risk cover is deemed necessary and available in the market,insurance is obtained.
Note 28. List of Group Companies
In accordance with legal requirements a list of the Company's entities which are included in the consolidated financialstatements of SBM Offshore N.V. has been deposited at the Chamber of Commerce in Rotterdam.
Note 29. Interest in Joint Ventures and Associates
The Company has several joint ventures and associates:
Joint venture /
Associate% of ownership Country
resgistrationProject name
Sonasing Xikomba Ltd Joint venture 50.00 Bermuda FPSO N'GomaOPS-Serviçõs de Produção de Petroleos Ltd. Joint venture 50.00 Bermuda Angola operationsOPS-Serviçõs de Petroleos Ltd Branch Joint venture 50.00 Angola Angola operationsOPS Production Ltd Joint venture 50.00 Bermuda Angola operationsMalaysia Deepwater Floating Terminal Ltd Joint venture 49.00 Malaysia FPSO KikehMalaysia Deepwater Production Contract SDN BHD Joint venture 49.00 Malaysia FPSO KikehAnchor Storage Ltd Joint venture 49.00 Bermuda Nkossa II FSOGas Management (Congo) Ltd Joint venture 49.00 Bahamas Nkossa II FSOSolgaz SA Joint venture 49.00 France Nkossa II FSOSonasing Sanha Ltd Joint venture 50.00 Bermuda FPSO SanhaSonasing Kuito Ltd Joint venture 50.00 Bermuda FPSO KuitoSonasing Saxi-Batuque Ltd Joint venture 50.00 Bermuda FPSO Saxi-BatuqueSonasing Mondo Ltd Joint venture 50.00 Bermuda FPSO MondoSNV Offshore Ltd Joint venture 50.00 Bermuda Brasilian yardEstaleiro Brasa Ltda Joint venture 50.00 Brazil Brasilian yardBrasil Superlift Serviçõs Icamento Ltda Joint venture 50.00 Brazil Brasilian yardNormand Installer SA Joint venture 49.90 Switzerland Normand InstallerOS Installer AS Associate 25.00 Norway SBM InstallerSBM Ship Yard Ltd Associate 33.33 Bermuda Angolan yardPAENAL - Porto Amboim Estaleiros Navais Associate 30.00 Angola Angolan yard
It is reminded that the Company has no joint operation as per definition provided by IFRS 11 "Joint arrangements".
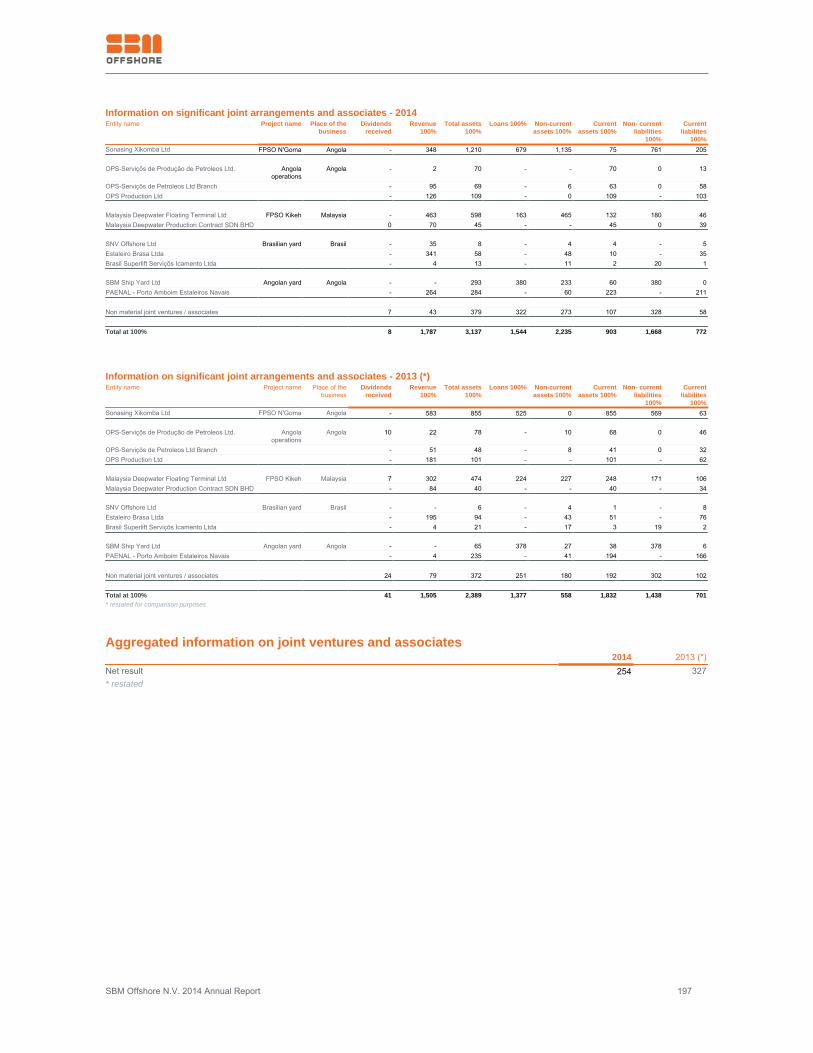
SBM Offshore N.V. 2014 Annual Report 197
Information on significant joint arrangements and associates - 2014Entity name Project name Place of the
businessDividends
receivedRevenue
100%Total assets
100%Loans 100% Non-current
assets 100%Current
assets 100%Non- current
liabilities100%
Currentliabilites
100%Sonasing Xikomba Ltd FPSO N'Goma Angola - 348 1,210 679 1,135 75 761 205 OPS-Serviçõs de Produção de Petroleos Ltd. Angola
operationsAngola - 2 70 - - 70 0 13
OPS-Serviçõs de Petroleos Ltd Branch - 95 69 - 6 63 0 58OPS Production Ltd - 126 109 - 0 109 - 103 Malaysia Deepwater Floating Terminal Ltd FPSO Kikeh Malaysia - 463 598 163 465 132 180 46Malaysia Deepwater Production Contract SDN BHD 0 70 45 - - 45 0 39 SNV Offshore Ltd Brasilian yard Brasil - 35 8 - 4 4 - 5Estaleiro Brasa Ltda - 341 58 - 48 10 - 35Brasil Superlift Serviçõs Icamento Ltda - 4 13 - 11 2 20 1 SBM Ship Yard Ltd Angolan yard Angola - - 293 380 233 60 380 0PAENAL - Porto Amboim Estaleiros Navais - 264 284 - 60 223 - 211 Non material joint ventures / associates 7 43 379 322 273 107 328 58 Total at 100% 8 1,787 3,137 1,544 2,235 903 1,668 772
Information on significant joint arrangements and associates - 2013 (*)Entity name Project name Place of the
businessDividends
receivedRevenue
100%Total assets
100%Loans 100% Non-current
assets 100%Current
assets 100%Non- current
liabilities100%
Currentliabilites
100%Sonasing Xikomba Ltd FPSO N'Goma Angola - 583 855 525 0 855 569 63 OPS-Serviçõs de Produção de Petroleos Ltd. Angola
operationsAngola 10 22 78 - 10 68 0 46
OPS-Serviçõs de Petroleos Ltd Branch - 51 48 - 8 41 0 32OPS Production Ltd - 181 101 - - 101 - 62 Malaysia Deepwater Floating Terminal Ltd FPSO Kikeh Malaysia 7 302 474 224 227 248 171 106Malaysia Deepwater Production Contract SDN BHD - 84 40 - - 40 - 34 SNV Offshore Ltd Brasilian yard Brasil - - 6 - 4 1 - 8Estaleiro Brasa Ltda - 195 94 - 43 51 - 76Brasil Superlift Serviçõs Icamento Ltda - 4 21 - 17 3 19 2 SBM Ship Yard Ltd Angolan yard Angola - - 65 378 27 38 378 6PAENAL - Porto Amboim Estaleiros Navais - 4 235 - 41 194 - 166 Non material joint ventures / associates 24 79 372 251 180 192 302 102 Total at 100% 41 1,505 2,389 1,377 558 1,832 1,438 701* restated for comparison purposes
Aggregated information on joint ventures and associates 2014 2013 (*)Net result 254 327* restated
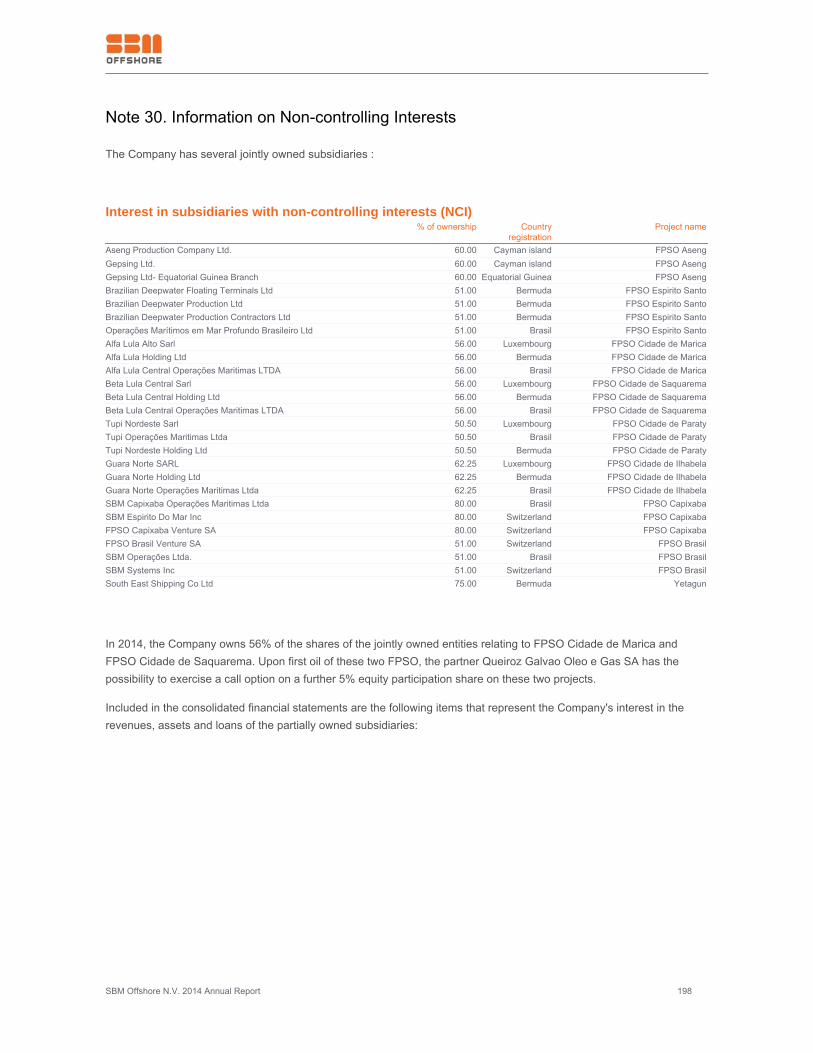
SBM Offshore N.V. 2014 Annual Report 198
Note 30. Information on Non-controlling Interests
The Company has several jointly owned subsidiaries :
Interest in subsidiaries with non-controlling interests (NCI) % of ownership Country
registrationProject name
Aseng Production Company Ltd. 60.00 Cayman island FPSO AsengGepsing Ltd. 60.00 Cayman island FPSO AsengGepsing Ltd- Equatorial Guinea Branch 60.00 Equatorial Guinea FPSO AsengBrazilian Deepwater Floating Terminals Ltd 51.00 Bermuda FPSO Espirito SantoBrazilian Deepwater Production Ltd 51.00 Bermuda FPSO Espirito SantoBrazilian Deepwater Production Contractors Ltd 51.00 Bermuda FPSO Espirito SantoOperações Marítimos em Mar Profundo Brasileiro Ltd 51.00 Brasil FPSO Espirito SantoAlfa Lula Alto Sarl 56.00 Luxembourg FPSO Cidade de MaricaAlfa Lula Holding Ltd 56.00 Bermuda FPSO Cidade de MaricaAlfa Lula Central Operações Maritimas LTDA 56.00 Brasil FPSO Cidade de MaricaBeta Lula Central Sarl 56.00 Luxembourg FPSO Cidade de SaquaremaBeta Lula Central Holding Ltd 56.00 Bermuda FPSO Cidade de SaquaremaBeta Lula Central Operações Maritimas LTDA 56.00 Brasil FPSO Cidade de SaquaremaTupi Nordeste Sarl 50.50 Luxembourg FPSO Cidade de ParatyTupi Operações Maritimas Ltda 50.50 Brasil FPSO Cidade de ParatyTupi Nordeste Holding Ltd 50.50 Bermuda FPSO Cidade de ParatyGuara Norte SARL 62.25 Luxembourg FPSO Cidade de IlhabelaGuara Norte Holding Ltd 62.25 Bermuda FPSO Cidade de IlhabelaGuara Norte Operações Maritimas Ltda 62.25 Brasil FPSO Cidade de IlhabelaSBM Capixaba Operações Maritimas Ltda 80.00 Brasil FPSO CapixabaSBM Espirito Do Mar Inc 80.00 Switzerland FPSO CapixabaFPSO Capixaba Venture SA 80.00 Switzerland FPSO CapixabaFPSO Brasil Venture SA 51.00 Switzerland FPSO BrasilSBM Operações Ltda. 51.00 Brasil FPSO BrasilSBM Systems Inc 51.00 Switzerland FPSO BrasilSouth East Shipping Co Ltd 75.00 Bermuda Yetagun
In 2014, the Company owns 56% of the shares of the jointly owned entities relating to FPSO Cidade de Marica andFPSO Cidade de Saquarema. Upon first oil of these two FPSO, the partner Queiroz Galvao Oleo e Gas SA has thepossibility to exercise a call option on a further 5% equity participation share on these two projects.
Included in the consolidated financial statements are the following items that represent the Company's interest in therevenues, assets and loans of the partially owned subsidiaries:
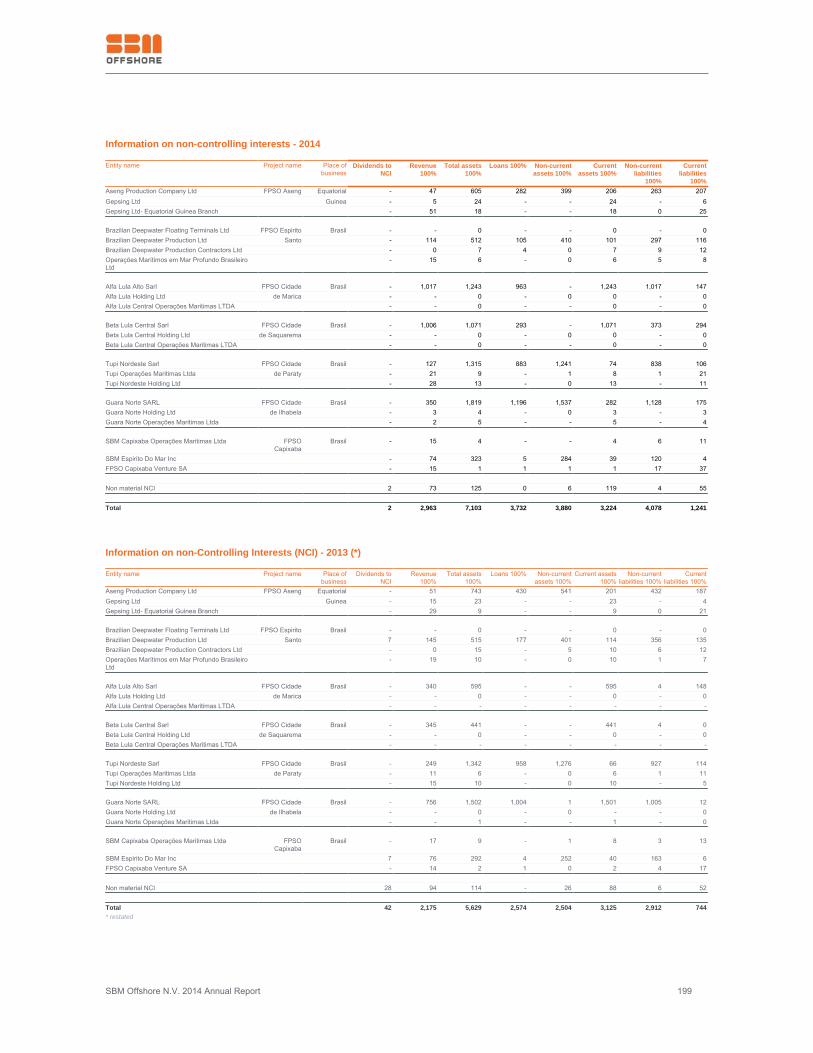
SBM Offshore N.V. 2014 Annual Report 199
Information on non-controlling interests - 2014 Entity name Project name Place of
businessDividends to
NCIRevenue
100%Total assets
100%Loans 100% Non-current
assets 100%Current
assets 100%Non-current
liabilities100%
Currentliabilities
100%Aseng Production Company Ltd FPSO Aseng Equatorial - 47 605 282 399 206 263 207Gepsing Ltd Guinea - 5 24 - - 24 - 6Gepsing Ltd- Equatorial Guinea Branch - 51 18 - - 18 0 25 Brazilian Deepwater Floating Terminals Ltd FPSO Espirito Brasil - - 0 - - 0 - 0Brazilian Deepwater Production Ltd Santo - 114 512 105 410 101 297 116Brazilian Deepwater Production Contractors Ltd - 0 7 4 0 7 9 12Operações Marítimos em Mar Profundo BrasileiroLtd
- 15 6 - 0 6 5 8
Alfa Lula Alto Sarl FPSO Cidade Brasil - 1,017 1,243 963 - 1,243 1,017 147Alfa Lula Holding Ltd de Marica - - 0 - 0 0 - 0Alfa Lula Central Operações Maritimas LTDA - - 0 - - 0 - 0 Beta Lula Central Sarl FPSO Cidade Brasil - 1,006 1,071 293 - 1,071 373 294Beta Lula Central Holding Ltd de Saquarema - - 0 - 0 0 - 0Beta Lula Central Operações Maritimas LTDA - - 0 - - 0 - 0 Tupi Nordeste Sarl FPSO Cidade Brasil - 127 1,315 883 1,241 74 838 106Tupi Operações Maritimas Ltda de Paraty - 21 9 - 1 8 1 21Tupi Nordeste Holding Ltd - 28 13 - 0 13 - 11 Guara Norte SARL FPSO Cidade Brasil - 350 1,819 1,196 1,537 282 1,128 175Guara Norte Holding Ltd de Ilhabela - 3 4 - 0 3 - 3Guara Norte Operações Maritimas Ltda - 2 5 - - 5 - 4 SBM Capixaba Operações Maritimas Ltda FPSO
CapixabaBrasil - 15 4 - - 4 6 11
SBM Espirito Do Mar Inc - 74 323 5 284 39 120 4FPSO Capixaba Venture SA - 15 1 1 1 1 17 37 Non material NCI 2 73 125 0 6 119 4 55 Total 2 2,963 7,103 3,732 3,880 3,224 4,078 1,241
Information on non-Controlling Interests (NCI) - 2013 (*) Entity name Project name Place of
businessDividends to
NCIRevenue
100%Total assets
100%Loans 100% Non-current
assets 100%Current assets
100%Non-current
liabilities 100%Current
liabilities 100%Aseng Production Company Ltd FPSO Aseng Equatorial - 51 743 430 541 201 432 187Gepsing Ltd Guinea - 15 23 - - 23 - 4Gepsing Ltd- Equatorial Guinea Branch - 29 9 - - 9 0 21 Brazilian Deepwater Floating Terminals Ltd FPSO Espirito Brasil - - 0 - - 0 - 0Brazilian Deepwater Production Ltd Santo 7 145 515 177 401 114 356 135Brazilian Deepwater Production Contractors Ltd - 0 15 - 5 10 6 12Operações Marítimos em Mar Profundo BrasileiroLtd
- 19 10 - 0 10 1 7
Alfa Lula Alto Sarl FPSO Cidade Brasil - 340 595 - - 595 4 148Alfa Lula Holding Ltd de Marica - - 0 - - 0 - 0Alfa Lula Central Operações Maritimas LTDA - - - - - - - - Beta Lula Central Sarl FPSO Cidade Brasil - 345 441 - - 441 4 0Beta Lula Central Holding Ltd de Saquarema - - 0 - - 0 - 0Beta Lula Central Operações Maritimas LTDA - - - - - - - - Tupi Nordeste Sarl FPSO Cidade Brasil - 249 1,342 958 1,276 66 927 114Tupi Operações Maritimas Ltda de Paraty - 11 6 - 0 6 1 11Tupi Nordeste Holding Ltd - 15 10 - 0 10 - 5 Guara Norte SARL FPSO Cidade Brasil - 756 1,502 1,004 1 1,501 1,005 12Guara Norte Holding Ltd de Ilhabela - - 0 - 0 - - 0Guara Norte Operações Maritimas Ltda - - 1 - - 1 - 0 SBM Capixaba Operações Maritimas Ltda FPSO
CapixabaBrasil - 17 9 - 1 8 3 13
SBM Espirito Do Mar Inc 7 76 292 4 252 40 163 6FPSO Capixaba Venture SA - 14 2 1 0 2 4 17 Non material NCI 28 94 114 - 26 88 6 52 Total 42 2,175 5,629 2,574 2,504 3,125 2,912 744* restated
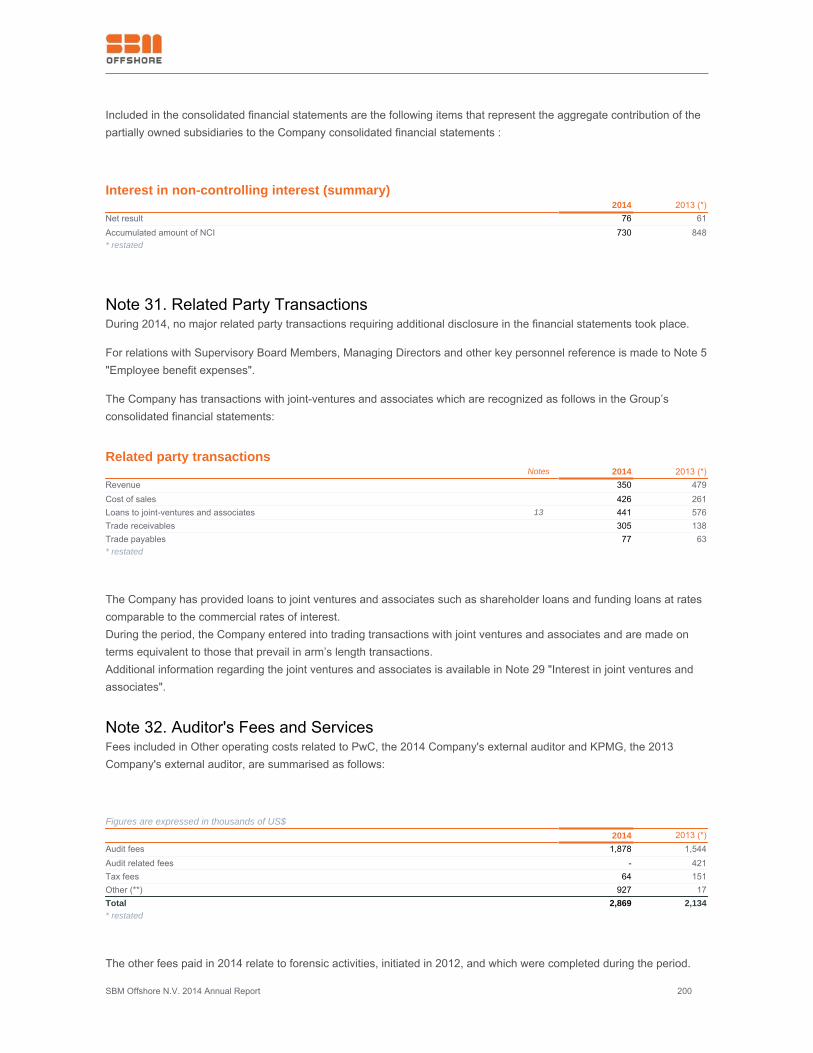
SBM Offshore N.V. 2014 Annual Report 200
Included in the consolidated financial statements are the following items that represent the aggregate contribution of thepartially owned subsidiaries to the Company consolidated financial statements :
Interest in non-controlling interest (summary) 2014 2013 (*)Net result 76 61Accumulated amount of NCI 730 848* restated
Note 31. Related Party TransactionsDuring 2014, no major related party transactions requiring additional disclosure in the financial statements took place.
For relations with Supervisory Board Members, Managing Directors and other key personnel reference is made to Note 5"Employee benefit expenses".
The Company has transactions with joint-ventures and associates which are recognized as follows in the Group’sconsolidated financial statements:
Related party transactions Notes 2014 2013 (*)Revenue 350 479Cost of sales 426 261Loans to joint-ventures and associates 13 441 576Trade receivables 305 138Trade payables 77 63* restated
The Company has provided loans to joint ventures and associates such as shareholder loans and funding loans at ratescomparable to the commercial rates of interest.During the period, the Company entered into trading transactions with joint ventures and associates and are made onterms equivalent to those that prevail in arm’s length transactions.Additional information regarding the joint ventures and associates is available in Note 29 "Interest in joint ventures andassociates".
Note 32. Auditor's Fees and ServicesFees included in Other operating costs related to PwC, the 2014 Company's external auditor and KPMG, the 2013Company's external auditor, are summarised as follows:
Figures are expressed in thousands of US$ 2014 2013 (*)
Audit fees 1,878 1,544Audit related fees - 421Tax fees 64 151Other (**) 927 17Total 2,869 2,134* restated
The other fees paid in 2014 relate to forensic activities, initiated in 2012, and which were completed during the period.

SBM Offshore N.V. 2014 Annual Report 201
Note 33. Events after the Balance Sheet DateThere are no reportable events after the balance sheet date.
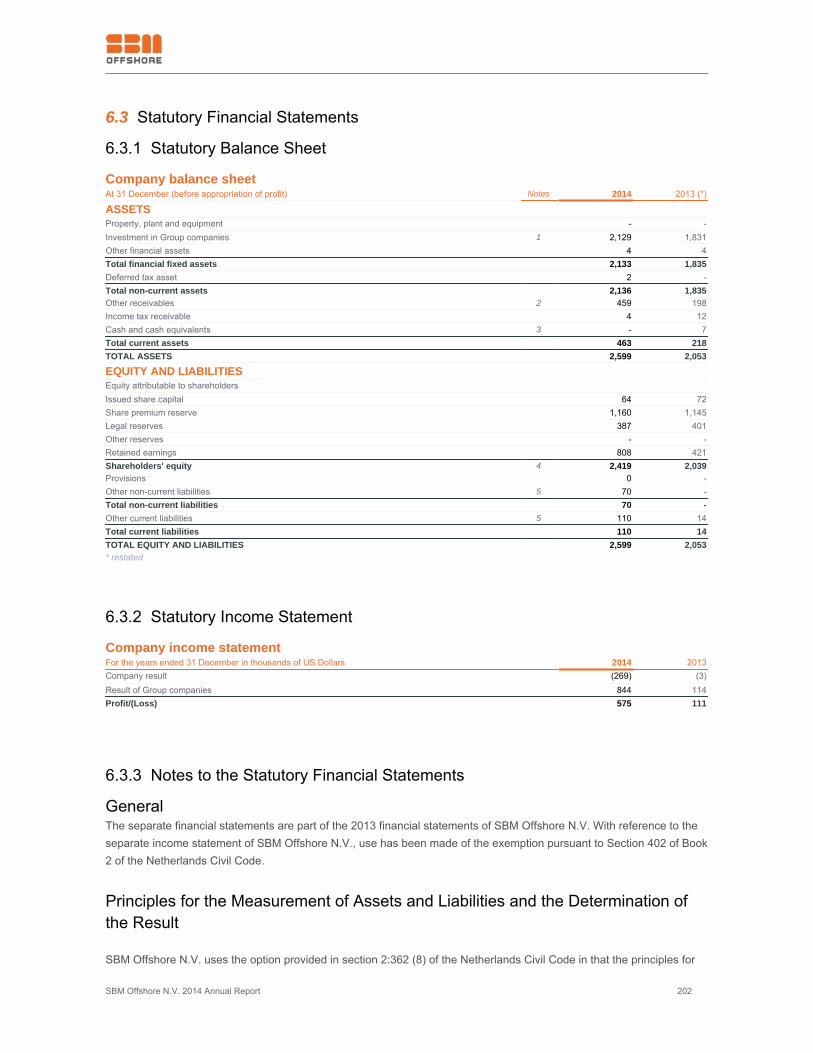
SBM Offshore N.V. 2014 Annual Report 202
6.3 Statutory Financial Statements
6.3.1 Statutory Balance Sheet
Company balance sheetAt 31 December (before appropriation of profit) Notes 2014 2013 (*)
ASSETSProperty, plant and equipment - -Investment in Group companies 1 2,129 1,831Other financial assets 4 4Total financial fixed assets 2,133 1,835Deferred tax asset 2 -Total non-current assets 2,136 1,835Other receivables 2 459 198Income tax receivable 4 12Cash and cash equivalents 3 - 7Total current assets 463 218TOTAL ASSETS 2,599 2,053
EQUITY AND LIABILITIESEquity attributable to shareholders Issued share capital 64 72Share premium reserve 1,160 1,145Legal reserves 387 401Other reserves - -Retained earnings 808 421Shareholders' equity 4 2,419 2,039Provisions 0 -Other non-current liabilities 5 70 -Total non-current liabilities 70 -Other current liabilities 5 110 14Total current liabilities 110 14TOTAL EQUITY AND LIABILITIES 2,599 2,053* restated
6.3.2 Statutory Income Statement
Company income statementFor the years ended 31 December in thousands of US Dollars 2014 2013Company result (269) (3)Result of Group companies 844 114Profit/(Loss) 575 111
6.3.3 Notes to the Statutory Financial Statements
GeneralThe separate financial statements are part of the 2013 financial statements of SBM Offshore N.V. With reference to theseparate income statement of SBM Offshore N.V., use has been made of the exemption pursuant to Section 402 of Book2 of the Netherlands Civil Code.
Principles for the Measurement of Assets and Liabilities and the Determination ofthe Result
SBM Offshore N.V. uses the option provided in section 2:362 (8) of the Netherlands Civil Code in that the principles for
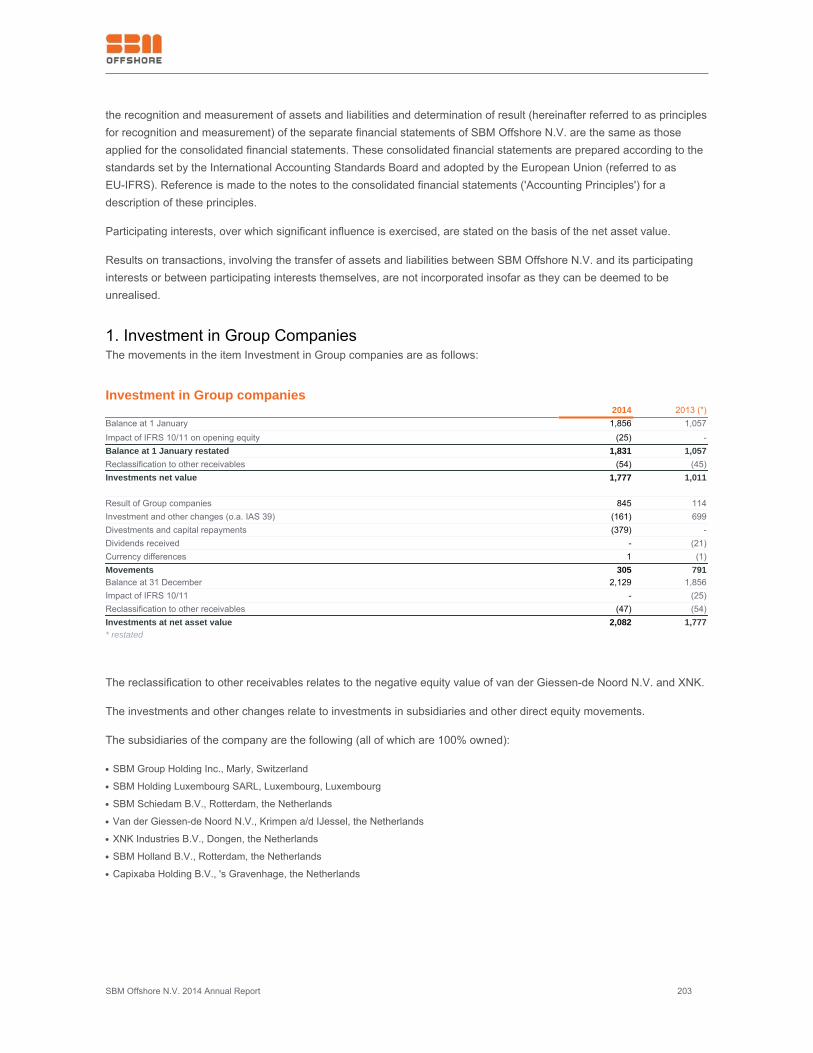
SBM Offshore N.V. 2014 Annual Report 203
the recognition and measurement of assets and liabilities and determination of result (hereinafter referred to as principlesfor recognition and measurement) of the separate financial statements of SBM Offshore N.V. are the same as thoseapplied for the consolidated financial statements. These consolidated financial statements are prepared according to thestandards set by the International Accounting Standards Board and adopted by the European Union (referred to asEU-IFRS). Reference is made to the notes to the consolidated financial statements ('Accounting Principles') for adescription of these principles.
Participating interests, over which significant influence is exercised, are stated on the basis of the net asset value.
Results on transactions, involving the transfer of assets and liabilities between SBM Offshore N.V. and its participatinginterests or between participating interests themselves, are not incorporated insofar as they can be deemed to beunrealised.
1. Investment in Group CompaniesThe movements in the item Investment in Group companies are as follows:
Investment in Group companies 2014 2013 (*)Balance at 1 January 1,856 1,057Impact of IFRS 10/11 on opening equity (25) -Balance at 1 January restated 1,831 1,057Reclassification to other receivables (54) (45)Investments net value 1,777 1,011 Result of Group companies 845 114Investment and other changes (o.a. IAS 39) (161) 699Divestments and capital repayments (379) -Dividends received - (21)Currency differences 1 (1)Movements 305 791Balance at 31 December 2,129 1,856Impact of IFRS 10/11 - (25)Reclassification to other receivables (47) (54)Investments at net asset value 2,082 1,777* restated
The reclassification to other receivables relates to the negative equity value of van der Giessen-de Noord N.V. and XNK.
The investments and other changes relate to investments in subsidiaries and other direct equity movements.
The subsidiaries of the company are the following (all of which are 100% owned):
SBM Group Holding Inc., Marly, Switzerland●
SBM Holding Luxembourg SARL, Luxembourg, Luxembourg●
SBM Schiedam B.V., Rotterdam, the Netherlands●
Van der Giessen-de Noord N.V., Krimpen a/d IJessel, the Netherlands●
XNK Industries B.V., Dongen, the Netherlands●
SBM Holland B.V., Rotterdam, the Netherlands●
Capixaba Holding B.V., 's Gravenhage, the Netherlands●
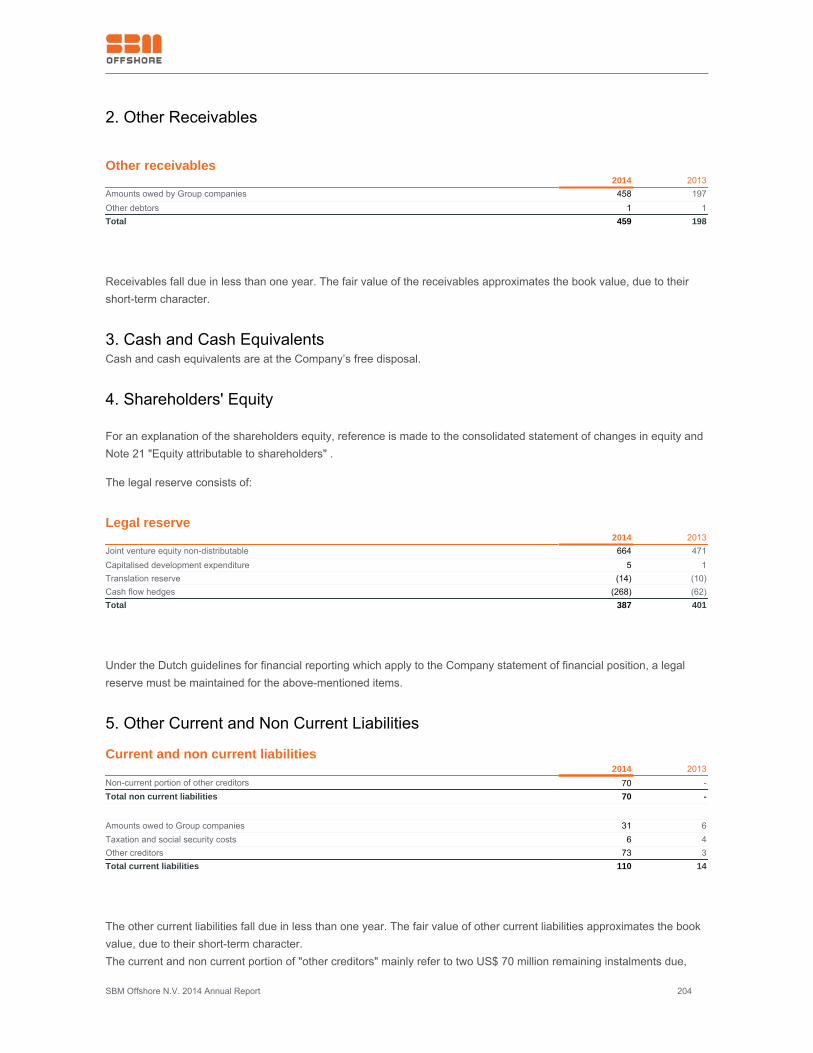
SBM Offshore N.V. 2014 Annual Report 204
2. Other Receivables
Other receivables 2014 2013Amounts owed by Group companies 458 197Other debtors 1 1Total 459 198
Receivables fall due in less than one year. The fair value of the receivables approximates the book value, due to theirshort-term character.
3. Cash and Cash EquivalentsCash and cash equivalents are at the Company’s free disposal.
4. Shareholders' Equity
For an explanation of the shareholders equity, reference is made to the consolidated statement of changes in equity andNote 21 "Equity attributable to shareholders" .
The legal reserve consists of:
Legal reserve 2014 2013Joint venture equity non-distributable 664 471Capitalised development expenditure 5 1Translation reserve (14) (10)Cash flow hedges (268) (62)Total 387 401
Under the Dutch guidelines for financial reporting which apply to the Company statement of financial position, a legalreserve must be maintained for the above-mentioned items.
5. Other Current and Non Current Liabilities
Current and non current liabilities 2014 2013Non-current portion of other creditors 70 -Total non current liabilities 70 -
Amounts owed to Group companies 31 6Taxation and social security costs 6 4Other creditors 73 3Total current liabilities 110 14
The other current liabilities fall due in less than one year. The fair value of other current liabilities approximates the bookvalue, due to their short-term character.The current and non current portion of "other creditors" mainly refer to two US$ 70 million remaining instalments due,
SBM Offshore N.V. 2014 Annual Report 205
following the settlement with the Dutch Public Prosecutor's Office over the investigation into potentially improper salespayments (see Note 1 "Operating segments" of the consolidated financial statements within section 6.2.8.)
6. Commitments and Contingencies
The Company has issued performance guarantees for contractual obligations to complete and deliver projects in respectof several Group companies, and fulfilment of obligations with respect to F(P)SO long-term lease/operate contracts.Furthermore, the Company has issued parent company guarantees in respect of several Group companies’ financingarrangements.
The Company is head of a fiscal unity in which almost all Dutch Group companies are included. This means that thesecompanies are jointly and severally liable in respect of the fiscal unity as a whole.
7. Directors' RemunerationFor further details on the Directors' remuneration, reference is made to Note 5 of the consolidated financial statements.
8. Number of EmployeesThe Company has 6 employees, excluding members of the Management Board.
9. Audit FeesFor the audit fees relating to the procedures applied to the company and its consolidated group entities by accountingfirms and external auditors, reference is made to the Note 32 "Audit fees" of the consolidation financial statements.
Schiedam, 11 February 2015
Management Board:
B.Y.R. Chabas, Chief Executive Officer
P.M. van Rossum, Chief Financial Officer
S. Hepkema, Chief Governance Compliance Officer
Supervisory Board:
H.C. Rothermund, Chairman
F.J.G.M. Cremers, Vice-Chairman
F.G.H. Deckers
T.M.E. Ehret
F.R. Gugen
K.A. Rethy
L.A. Armstrong
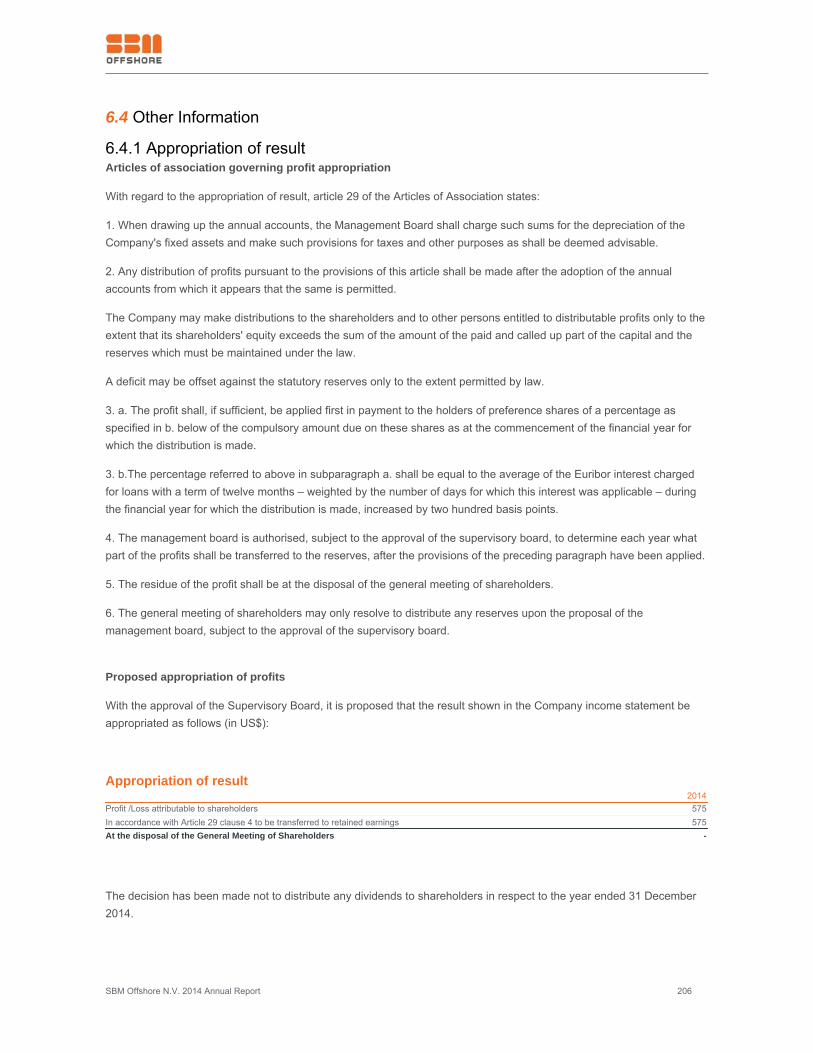
SBM Offshore N.V. 2014 Annual Report 206
6.4 Other Information
6.4.1 Appropriation of resultArticles of association governing profit appropriation
With regard to the appropriation of result, article 29 of the Articles of Association states:
1. When drawing up the annual accounts, the Management Board shall charge such sums for the depreciation of theCompany's fixed assets and make such provisions for taxes and other purposes as shall be deemed advisable.
2. Any distribution of profits pursuant to the provisions of this article shall be made after the adoption of the annualaccounts from which it appears that the same is permitted.
The Company may make distributions to the shareholders and to other persons entitled to distributable profits only to theextent that its shareholders' equity exceeds the sum of the amount of the paid and called up part of the capital and thereserves which must be maintained under the law.
A deficit may be offset against the statutory reserves only to the extent permitted by law.
3. a. The profit shall, if sufficient, be applied first in payment to the holders of preference shares of a percentage asspecified in b. below of the compulsory amount due on these shares as at the commencement of the financial year forwhich the distribution is made.
3. b.The percentage referred to above in subparagraph a. shall be equal to the average of the Euribor interest chargedfor loans with a term of twelve months – weighted by the number of days for which this interest was applicable – duringthe financial year for which the distribution is made, increased by two hundred basis points.
4. The management board is authorised, subject to the approval of the supervisory board, to determine each year whatpart of the profits shall be transferred to the reserves, after the provisions of the preceding paragraph have been applied.
5. The residue of the profit shall be at the disposal of the general meeting of shareholders.
6. The general meeting of shareholders may only resolve to distribute any reserves upon the proposal of themanagement board, subject to the approval of the supervisory board.
Proposed appropriation of profits
With the approval of the Supervisory Board, it is proposed that the result shown in the Company income statement beappropriated as follows (in US$):
Appropriation of result2014
Profit /Loss attributable to shareholders 575In accordance with Article 29 clause 4 to be transferred to retained earnings 575At the disposal of the General Meeting of Shareholders -
The decision has been made not to distribute any dividends to shareholders in respect to the year ended 31 December2014.

SBM Offshore N.V. 2014 Annual Report 207
6.4.2 Events after balance sheet dateThere are no reportable events after the balance sheet date.
6.4.3 Independent auditor's reportTo: the Annual General Meeting of Shareholders of SBM Offshore N.V.
SBM Offshore N.V. 2014 Annual Report 208
SBM Offshore N.V. 2014 Annual Report 209
SBM Offshore N.V. 2014 Annual Report 210
SBM Offshore N.V. 2014 Annual Report 211
SBM Offshore N.V. 2014 Annual Report 212
SBM Offshore N.V. 2014 Annual Report 213
SBM Offshore N.V. 2014 Annual Report 214
SBM Offshore N.V. 2014 Annual Report 215
SBM Offshore N.V. 2014 Annual Report 216
SBM Offshore N.V. 2014 Annual Report 217
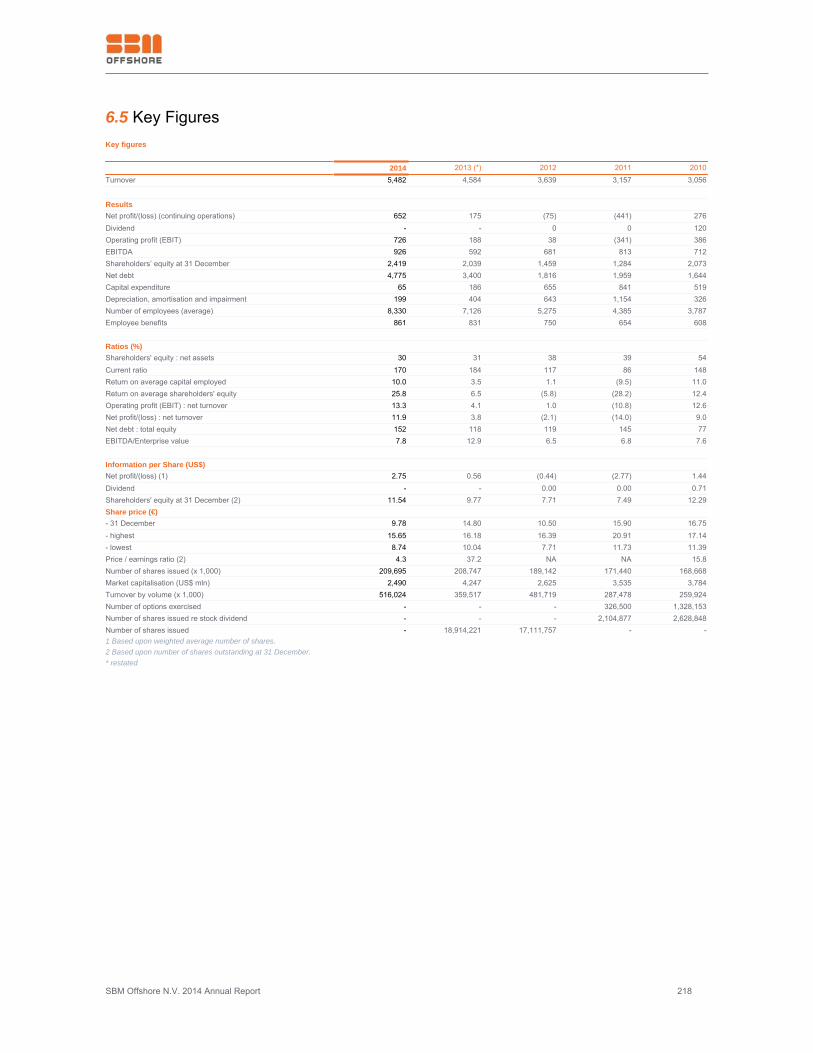
SBM Offshore N.V. 2014 Annual Report 218
6.5 Key FiguresKey figures
2014 2013 (*) 2012 2011 2010
Turnover 5,482 4,584 3,639 3,157 3,056
ResultsNet profit/(loss) (continuing operations) 652 175 (75) (441) 276Dividend - - 0 0 120Operating profit (EBIT) 726 188 38 (341) 386EBITDA 926 592 681 813 712Shareholders’ equity at 31 December 2,419 2,039 1,459 1,284 2,073Net debt 4,775 3,400 1,816 1,959 1,644Capital expenditure 65 186 655 841 519Depreciation, amortisation and impairment 199 404 643 1,154 326Number of employees (average) 8,330 7,126 5,275 4,385 3,787Employee benefits 861 831 750 654 608 Ratios (%)Shareholders' equity : net assets 30 31 38 39 54Current ratio 170 184 117 86 148Return on average capital employed 10.0 3.5 1.1 (9.5) 11.0Return on average shareholders' equity 25.8 6.5 (5.8) (28.2) 12.4Operating profit (EBIT) : net turnover 13.3 4.1 1.0 (10.8) 12.6Net profit/(loss) : net turnover 11.9 3.8 (2.1) (14.0) 9.0Net debt : total equity 152 118 119 145 77EBITDA/Enterprise value 7.8 12.9 6.5 6.8 7.6 Information per Share (US$)Net profit/(loss) (1) 2.75 0.56 (0.44) (2.77) 1.44Dividend - - 0.00 0.00 0.71Shareholders' equity at 31 December (2) 11.54 9.77 7.71 7.49 12.29Share price (€)- 31 December 9.78 14.80 10.50 15.90 16.75- highest 15.65 16.18 16.39 20.91 17.14- lowest 8.74 10.04 7.71 11.73 11.39Price / earnings ratio (2) 4.3 37.2 NA NA 15.8Number of shares issued (x 1,000) 209,695 208,747 189,142 171,440 168,668Market capitalisation (US$ mln) 2,490 4,247 2,625 3,535 3,784Turnover by volume (x 1,000) 516,024 359,517 481,719 287,478 259,924Number of options exercised - - - 326,500 1,328,153Number of shares issued re stock dividend - - - 2,104,877 2,628,848Number of shares issued - 18,914,221 17,111,757 - -1 Based upon weighted average number of shares.2 Based upon number of shares outstanding at 31 December.* restated
SBM Offshore N.V. 2014 Annual Report 219
7 Performance Indicators7.1 Scope of Sustainability Information
MaterialitySBM Offshore discloses its performance indicators for its stakeholders to inform them on SBM Offshore’s impact, inconnection to our sustainability policies, targets and performance. SBM Offshore’s stakeholders include employees,shareholders, investment community, clients, business partners, export credit agencies and suppliers.
The performance indicators disclosed for 2014 are based on topics identified as material for SBM Offshore. Generalstandard disclosure and aspects with less of a reporting priority are included in the GRI Index table which can be found inthe chapter 7.4.The Disclosures on Management Approach (DMA) for material aspects can also be found in the GRI Index table.
SBM Offshore together with its stakeholders, has performed a materiality analysis to identify the aspects that are materialto the ‘license to operate’ and the ‘license to grow’. Details about how SBM Offshore preformed the materiality analysisand the outcomes can be found in Chapter 3.3 Sustainability. The 2014 materiality determination resulted in aconfirmation of the already existing aspects on ‘license to operate’ elements of the Sustainability Framework and theCompany continues its performance reporting on these aspects. The material aspects on ‘license to grow’ are new andthe Company used those as a base for its new sustainability strategy, for which additional performance indicators will bedeveloped starting next year.
Reporting BoundariesThe performance indicators include Financial, Social, Health, Safety, Security and Environmental data, which is includedin the following pages of the report.
HSSE data is presented for the calendar years 2013 and 2014 to allow for comparison. Human Resources data ispresented for 2014. For certain key data the last five years have been published to show the Company’s long history ofdata collection and disclosure. PricewaterhouseCoopers Accountants N.V. has provided limited assurance on the safetyindicators LTIFR and TRIFR and environment data reported for the years 2010 until 2013 based on a separate report onselected key sustainability indicators prepared by SBM Offshore. The financial data has been audited as part of theannual financial reporting process.
For Health, Safety and Security information is provided in relation to SBM Offshore direct activities and also includesimpacts outside the organisation by reporting on contractors and contractor’s subcontractors.
For Environment and Human Resources information is provided in relation to impacts within the Company.
Reporting about Sustainability InformationThe sustainability information presented in this report is prepared ‘in accordance’ with the ‘core’ option of GlobalReporting Initiative (“GRI4”) G4 Guidelines of Sustainability Reporting. The Company has used the GRI G4 Guidelines todetermine material aspects for this year’s report.
SBM Offshore thinks it is important to have assurance on financial as well as non-financial information, to obtainassurance on the reliability of information presented to its stakeholders. This year the Company requested limitedassurance on the sustainability information.
SBM Offshore selected the financial auditor based on integrated reporting principles, including getting assurance on aswell financial as non-financial data.SBM Offshore has engaged PricewaterhouseCoopers Accountants N.V. (“PwC”) asits auditor.
SBM Offshore N.V. 2014 Annual Report 220
Health, Safety and Security ReportingThe Health, Safety and Security performance indicators scope takes into account:
Employees which include all permanent employees, part-time employees, locally hired agency staff (”direct contractors”) in the●
fabrication sites, offices and offshore workers, i.e. all people working for the Company.
Contractors which include any person employed by a Contractor or Contractor’s Sub-Contractor(s) who is directly involved in●
execution of prescribed work under a contract with SBM Offshore.
HSSE incident reporting is registered and managed through the Company’s Single Reporting System (SRS) database.SRS is a web-based reporting system that is used to collect data on all incidents occurring in all locations where theCompany operates.
The SRS system also records an incident such as: environmental incidents, security incidents, process safety events,equipment failure, damage only.
Incidents are reported based on the incident classifications as defined by International Association of Oil and GasProducers (IOGP). The Company also reports incident data from Contractor’s construction facilities if the incident isrelated to a SBM Offshore project.
The Company uses records of exposure hours and SRS data to calculate Health and Safety performance indicators setby SBM Offshore.
Environmental ReportingOffshore
The environmental offshore performance reporting scope is comprised of fourteen offshore units that use the followingreporting boundaries:
Units in the Company's fleet producing and/or storing hydrocarbons under lease and operate contracts during 2014●
Units in which the Company exercises full operational management control●
Units in which the Company has full ownership or participates in a Joint Venture (JV) partnership, where the Company controls 50% or●
more of the shares
The environmental performance of the Company is reported by region: Brazil, Angola and Rest of the World. Based onthe criteria stated above, SBM Offshore reports on the environmental performance for following fourteen vessels:
Brazil - FPSO Brasil, FPSO Marlim Sul, FPSO Espirito Santo, FPSO Capixaba, FPSO Cidade de Anchieta, FPSO Cidade de Party●
and FPSO Ilhabela
Angola – FPSOKuito,FPSO Mondo, FPSO Saxi Batuque and FPSO N’Goma●
Rest of World – FPSO Aseng, FSO Yetagun and PFC Deep Panuke●
The environmental offshore performance reporting methodology was chosen according to the performance indicatorsrelative to GRI and IOGP guidelines. This includes:
Greenhouse Gases, referred to as GHG which are N2O (Nitrous Oxide), CH4(Methane) and CO2(Carbon Dioxide)●
GHG emissions per hydrocarbon production from flaring and energy generation●
Non Greenhouse Gases which are CO (Carbon Monoxide), NOx (Nitrogen Oxides), SO2(Sulphur Dioxide) and VOCs (Volatile Organic●
Compounds)
Gas flared per hydrocarbon production, including gas flared on SBM account●
Energy consumption per hydrocarbon production●
Oil in Produced Water per hydrocarbon production●
SBM Offshore N.V. 2014 Annual Report 221
SBM Offshore reports some of its indicators as a weighted average, calculated pro rata the volume of hydrocarbonproduction per region. This is in line with the IOGP reporting style published in their annual Environmental PerformanceIndicators (http://www.iogp.org/pubs/2012e.pdf)
The calculation of air emissions from offshore operations units uses the method as described in the EEMS-AtmosphericEmissions Calculations (Issue 1.810a) recommended by Oil & Gas UK (OGUKA).
Emissions reported in the Company’s emissions records include:
• GHG emissions for the production of energy. Records of GHG emissions from steam boilers, gas turbines and dieselengines used by the operating units.
• GHG emissions from gas flared. Records of the volume of gas flared below the limit defined by the Client, above thelimit attributable to SBM account or at the request of the client to optimise production.
Offshore Energy Consumption
The energy used to produce oil and gas covers a range of activities, including:
• Driving pumps producing the hydrocarbons or re-injecting produced water
• Heating produced oil for separation
• Producing steam
• Powering compressors to re-inject produced gas
• Driving turbines to generate electricity needed for operational activities.
The main source of energy consumption of offshore units is Fuel Gas and Marine Gas Oil.
Oil in Produced Water Discharges
Produced water is a high volume liquid discharge generated during the production of oil and gas. After extraction,produced water is separated and treated (de-oiled) before discharge to surface water. The quality of produced water ismost widely expressed in terms of its oil content. Limits are imposed on the concentration of oil in the effluent dischargestream (generally expressed in the range of 15-30 ppm) or discharge is limited where re-injection is permitted back intothe reservoir. The overall efficiency of the oil in water treatment and as applicable reinjection can be expressed as tonnesof oil discharged per million tonnes of hydrocarbon produced.
Environmental releases to air (except certain gas leaks which are not quantifiable), water or land from the offshoreoperations units are reported using the data recorded in the Single Reporting System (SRS) database.
Onshore
The environmental onshore reporting scope includes offices in the following locations; Monaco, Rio, Schiedam, Houston,Kuala Lumpur and Marly.
For the onshore energy usage, the Company uses the World Resources Institute Greenhouse Gas Protocol (GHGProtocol) method to calculate CO2equivalents. CO2equivalency is a quantity that describes, for a given mixture andamount of greenhouse gas, the amount of CO2that would have the same global warming potential (GWP), when
measured over a specified timescale (generally, 100 years). For further information on the GHG protocol and countryspecific calculation methods, please refer to their website: http://www.ghgprotocol.org/calculation-tools. For Monacolocations, the CO2equivalency has been calculated based on the 2014 average from Electricity de France (EDF) which is
based on the Life Cycle Analysis method (http://fr.edf.com/edf-en-france-51250.html).
SBM Offshore N.V. 2014 Annual Report 222
Construction Yards environmental data, specifically emissions, energy and water usage have not been included inscope. SBM Offshore is aware that the constructions yards may have a large impact on the environment and haveidentified this as part of its licence to grow under the initiative ‘Manage Environmental Impact’.
Human Resources Reporting
The Company’s Human Resource data covers the global workforce and is broken down into parts which are; operatingunits, employment type, gender, and age. The performance indicators report the workforce status at year ending 31December 2014. It includes all staff who were assigned on permanent and fixed-term contracts, employee hires anddepartures, total number of locally-employed staff from agencies, and all crew working on board the offshore operationsunits.
Human Resources considers:
‘Permanent’ employees as a Staff member, holding a labour contract for either an unlimited or a defined period (or an offer letter for an●
unlimited period in the USA). Permanent employees are recorded on the payroll, directly paid by one of the SBM Offshore Group
‘Contractors’ as an individual performing work for or on behalf of SBM Offshore, but not recognised as an employee under national law●
or practice (not part of SBM Offshore companies payroll, they issue invoices for services rendered).
For reporting purposes certain performance indicators report on Construction Yard employees separately. ConstructionYards employees for Human Resources reporting purposes consist of employees for yards located in Brazil and Angola.Construction Yard Employees are non-traditional type of SBM Offshore workforce who work on construction yards, whichSBM Offshore owns and/or operates in Joint Venture, and are allocated to non-SBM Offshore projects. SBM Offshoreincludes the Brasa Yard in Brazil and the Paenal yard in Angola in its reporting scope based on partial ownership,operational control including human resource activities and social responsibility for the employees.
For some performance indicators the Company makes a split between Onshore and Offshore activities. Onshoreincludes all SBM Offshore employees and contractors in onshore offices, yards and SBM Operations employees basedin Monaco. Offshore includes all fleet and their respective supporting shore base. This breakdown does not includeConstruction Yard employees.
Performance Reviews / Skills Management / Training
In order to ensure people development and optimal distribution of resources within the Company, the Company conductsannual performance reviews for all employees. Globally, the Company uses the Hay Competency system to grade andevaluate all permanent staff.
As a complementary parallel to this long-established annual performance review, the Talent Management andSuccession Planning programmes, a process called “People Review” is in place to discuss the strengths, developmentneeds and potential future career paths of SBM Offshore employees, taking into account certain criteria, and identifythose who have the potential to take on greater leadership roles today and tomorrow. Employee reviews reported arethose which were completed during 2013.
Stakeholder Engagement Stakeholder Group: Shareholders and Loan Providers
What they expect
Shareholders expect SBM Offshore to be compliant with all relevant laws and regulations, concerning the full scope ofeconomic, ethical, social and environmental issues. And they are looking for stable and predictable cash flows and
SBM Offshore N.V. 2014 Annual Report 223
liquidity. They value the prevention of environmental damage and development of sustainable technology. The liabilityaspect of environmental damage is also on their agenda. Concerning social aspects they expect SBM Offshore tocontribute to local development, protection of human rights, ethical business, behaviour and culture. And they expectSBM Offshore to have highly developed technological skills and employees that feel proud to work for the Company.
How SBM Offshore engages
SBM Offshore organises a yearly Capital Markets Day for this group of stakeholders. During this two-day session theCompany Management Board shares and discusses the Company strategy, performance and future outlook. As part ofthe materiality analysis the Company performed desk research and talked with stakeholders specifically on theirexpectations regarding sustainability.
Stakeholder Group:Employees
What they expect
SBM Offshore employees expect high economic performance, with attention for Total Cost of Ownership in theCompany's products and services. Employees highly value vigilence against bribery and corruption and the Companyculture of ethical business and behaviour. Protection of the environment and development of sustainable technology areimportant aspects for employees. And attention for the search and retainment of talent, including talent development isexpected.
How SBM Offshore engages
SBM Offshore Management Board organises throughout the year several so called Town Hall sessions whereemployees can interact and learn about the objectives and strategy relevant to their Regional Centre. Also CEO BrunoChabas interacts with young SBM Offshore employees during special lunch sessions.
The Sustainability Director interacts with employees at all locations during special organised sessions where he explainsSBM Offshore’s policies. And for the materiality analysis the Company also sent out questionnaires to employees.
Stakeholder Group: Clients and Business partners
What they expect
Clients expect SBM Offshore to be compliant with all relevant laws and regulations, concerning the full scope ofeconomic, social and environmental issues. Clients expect SBM Offshore to have a high standard regarding anti-briberyand corruption and business ethics. They expect SBM Offshore to be efficient in use of energy and natural resources andto protect the environment. They expect SBM Offshore to adhere to international standards on human rights and tocontribute to local societies. Looking at the future in the oil & gas industry they expect an increase of renewables in theenergy mix.
How SBM Offshore engages
SBM Offshore interacts with its clients during regular marketing and sales activities. Apart from these, there areTechnology Days with clients to present the newest offshore solutions and developments. During these events theCompany gets insight into the client’s appetite regarding commercial issues and related sustainability issues. As part ofthe materiality analysis the Company also had some interviews with clients specifically on their views on sustainability atSBM Offshore.
Stakeholder Group: Suppliers
What they expect
Suppliers expect SBM Offshore to be compliant with all relevant laws and regulations, concerning the full scope of
SBM Offshore N.V. 2014 Annual Report 224
economic, ethical, social and environmental issues. They expect efficiency in SBM Offshore operations, and attention foran integrated sustainable supply chain. They expect efficient use of energy and natural resources and attention fordevelopment of sustainable technology. They expect SBM Offshore to adhere to human rights standards and have afocus on health & safety. And they expect a high level of technological knowledge. Looking at the future in the oil & gasindustry they expect an increase of renewables in the energy mix.
How SBM Offshore engages
SBM Offshore is in active dialogue with its suppliers during regular procurement activities. Sometimes sustainability is anexplicit topic, for example when replacement, take back and recycling of certain supplies is discussed. There are alsoexchanges between the sustainability experts of SBM Offshore and its suppliers, and one of the suppliers was invited asa guest speaker at the Company’s sustainability strategy session. As part of the materiality analysis SBM Offshore alsoperformed desk research and had interviews with suppliers on sustainability and expectations for SBM Offshore.
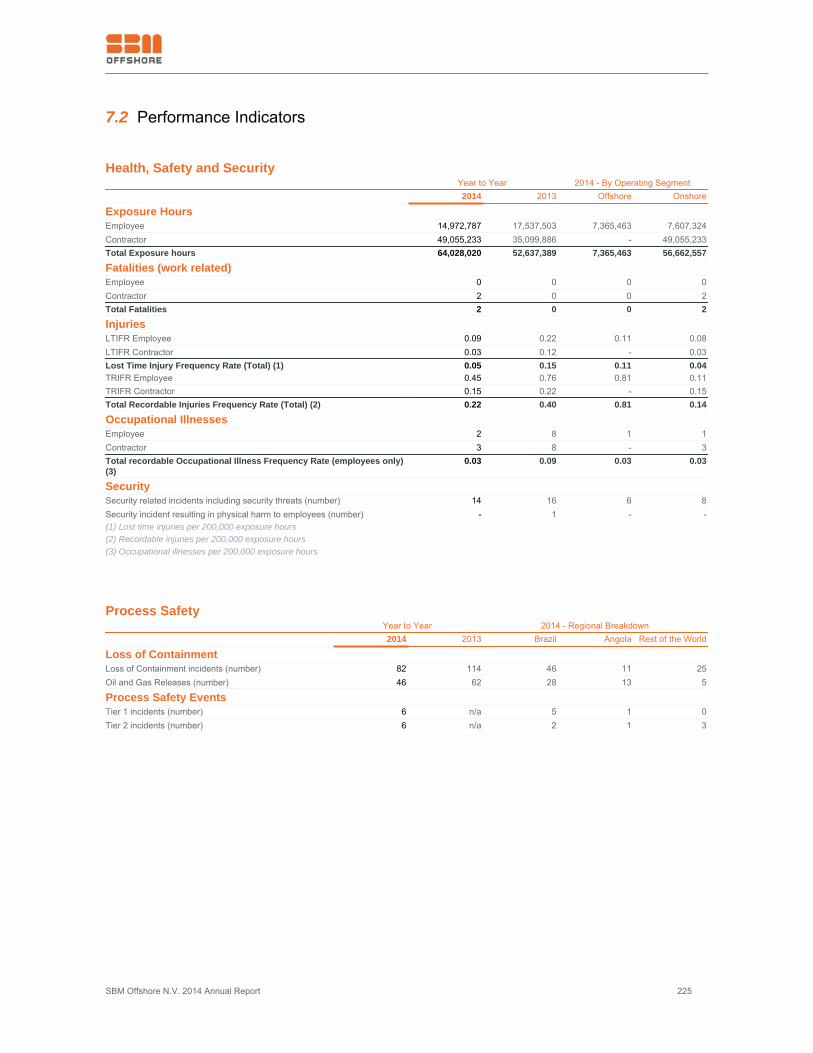
SBM Offshore N.V. 2014 Annual Report 225
7.2 Performance Indicators
Health, Safety and Security Year to Year 2014 - By Operating Segment 2014 2013 Offshore Onshore
Exposure HoursEmployee 14,972,787 17,537,503 7,365,463 7,607,324Contractor 49,055,233 35,099,886 - 49,055,233Total Exposure hours 64,028,020 52,637,389 7,365,463 56,662,557
Fatalities (work related)Employee 0 0 0 0Contractor 2 0 0 2Total Fatalities 2 0 0 2
InjuriesLTIFR Employee 0.09 0.22 0.11 0.08LTIFR Contractor 0.03 0.12 - 0.03Lost Time Injury Frequency Rate (Total) (1) 0.05 0.15 0.11 0.04TRIFR Employee 0.45 0.76 0.81 0.11TRIFR Contractor 0.15 0.22 - 0.15Total Recordable Injuries Frequency Rate (Total) (2) 0.22 0.40 0.81 0.14
Occupational IllnessesEmployee 2 8 1 1Contractor 3 8 - 3Total recordable Occupational Illness Frequency Rate (employees only)(3)
0.03 0.09 0.03 0.03
SecuritySecurity related incidents including security threats (number) 14 16 6 8Security incident resulting in physical harm to employees (number) - 1 - -(1) Lost time injuries per 200,000 exposure hours(2) Recordable injuries per 200,000 exposure hours(3) Occupational illnesses per 200,000 exposure hours
Process Safety Year to Year 2014 - Regional Breakdown 2014 2013 Brazil Angola Rest of the World
Loss of ContainmentLoss of Containment incidents (number) 82 114 46 11 25Oil and Gas Releases (number) 46 62 28 13 5
Process Safety EventsTier 1 incidents (number) 6 n/a 5 1 0Tier 2 incidents (number) 6 n/a 2 1 3
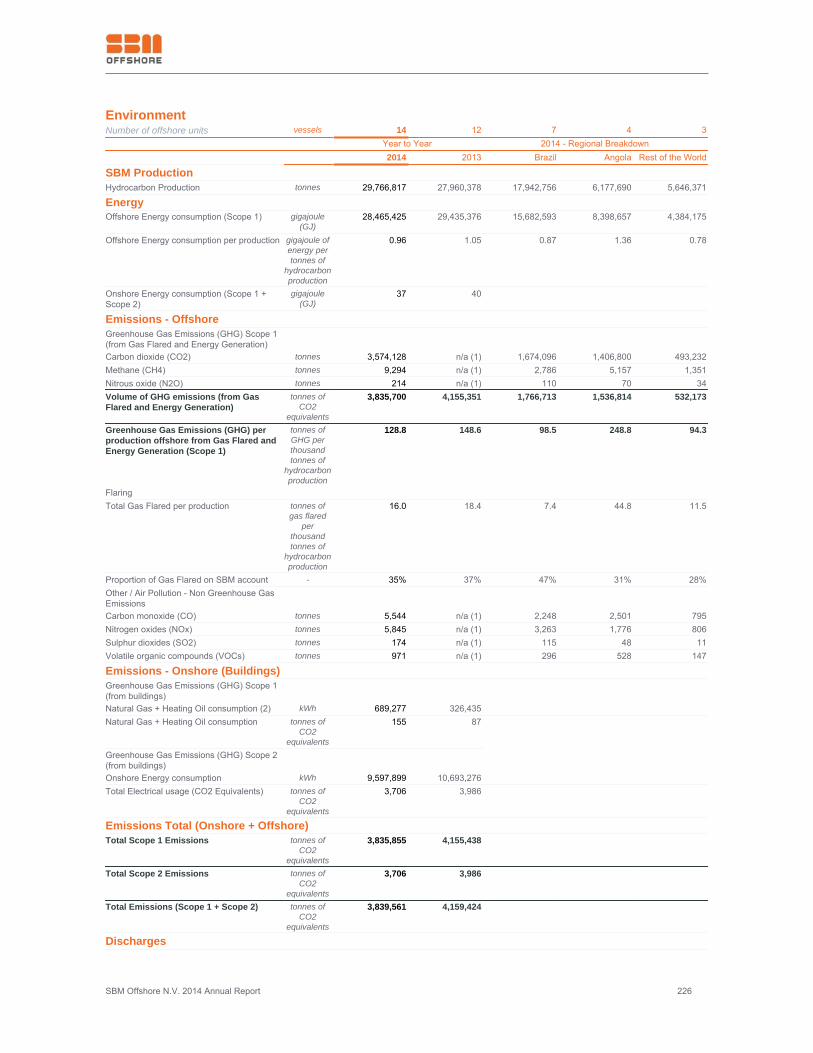
SBM Offshore N.V. 2014 Annual Report 226
EnvironmentNumber of offshore units vessels 14 12 7 4 3 Year to Year 2014 - Regional Breakdown
2014 2013 Brazil Angola Rest of the World
SBM ProductionHydrocarbon Production tonnes 29,766,817 27,960,378 17,942,756 6,177,690 5,646,371
EnergyOffshore Energy consumption (Scope 1) gigajoule
(GJ)28,465,425 29,435,376 15,682,593 8,398,657 4,384,175
Offshore Energy consumption per production gigajoule ofenergy pertonnes of
hydrocarbonproduction
0.96 1.05 0.87 1.36 0.78
Onshore Energy consumption (Scope 1 +Scope 2)
gigajoule(GJ)
37 40
Emissions - OffshoreGreenhouse Gas Emissions (GHG) Scope 1(from Gas Flared and Energy Generation)Carbon dioxide (CO2) tonnes 3,574,128 n/a (1) 1,674,096 1,406,800 493,232Methane (CH4) tonnes 9,294 n/a (1) 2,786 5,157 1,351Nitrous oxide (N2O) tonnes 214 n/a (1) 110 70 34Volume of GHG emissions (from GasFlared and Energy Generation)
tonnes ofCO2
equivalents
3,835,700 4,155,351 1,766,713 1,536,814 532,173
Greenhouse Gas Emissions (GHG) perproduction offshore from Gas Flared andEnergy Generation (Scope 1)
tonnes ofGHG perthousandtonnes of
hydrocarbonproduction
128.8 148.6 98.5 248.8 94.3
Flaring Total Gas Flared per production tonnes of
gas flaredper
thousandtonnes of
hydrocarbonproduction
16.0 18.4 7.4 44.8 11.5
Proportion of Gas Flared on SBM account - 35% 37% 47% 31% 28%Other / Air Pollution - Non Greenhouse GasEmissions
Carbon monoxide (CO) tonnes 5,544 n/a (1) 2,248 2,501 795Nitrogen oxides (NOx) tonnes 5,845 n/a (1) 3,263 1,776 806Sulphur dioxides (SO2) tonnes 174 n/a (1) 115 48 11Volatile organic compounds (VOCs) tonnes 971 n/a (1) 296 528 147
Emissions - Onshore (Buildings)Greenhouse Gas Emissions (GHG) Scope 1(from buildings)Natural Gas + Heating Oil consumption (2) kWh 689,277 326,435 Natural Gas + Heating Oil consumption tonnes of
CO2equivalents
155 87
Greenhouse Gas Emissions (GHG) Scope 2(from buildings)
Onshore Energy consumption kWh 9,597,899 10,693,276 Total Electrical usage (CO2 Equivalents) tonnes of
CO2equivalents
3,706 3,986
Emissions Total (Onshore + Offshore)Total Scope 1 Emissions tonnes of
CO2equivalents
3,835,855 4,155,438
Total Scope 2 Emissions tonnes ofCO2
equivalents
3,706 3,986
Total Emissions (Scope 1 + Scope 2) tonnes ofCO2
equivalents
3,839,561 4,159,424
Discharges
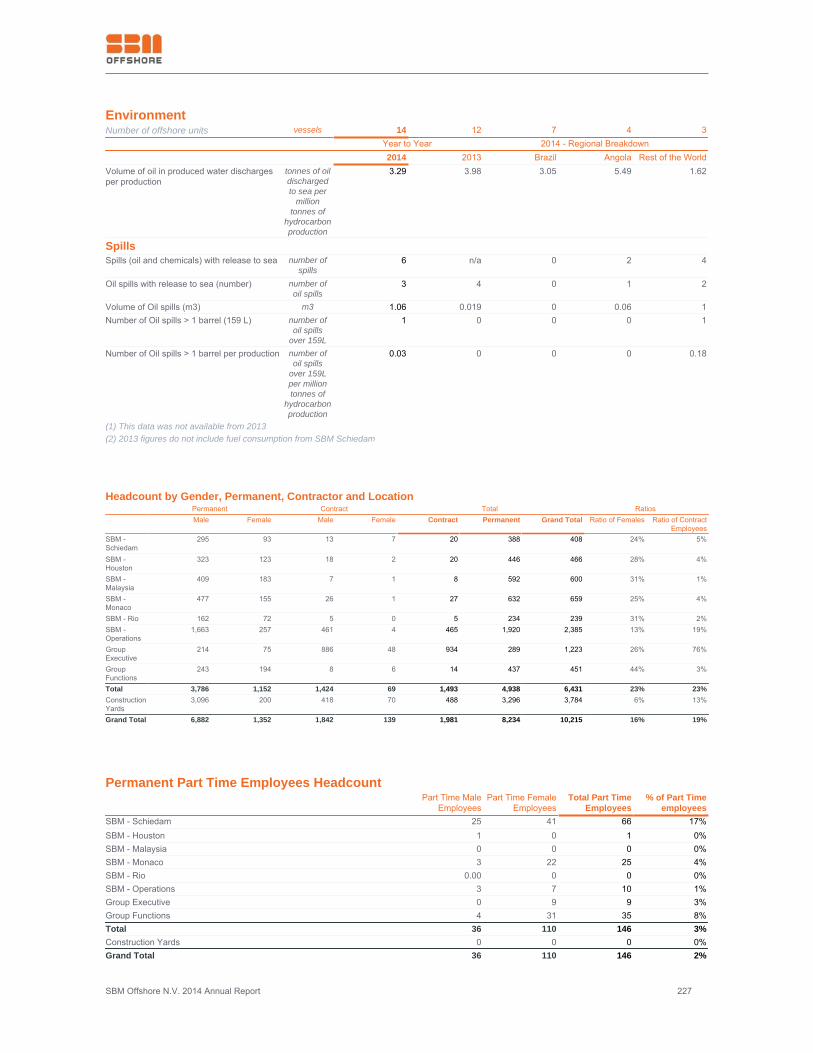
SBM Offshore N.V. 2014 Annual Report 227
EnvironmentNumber of offshore units vessels 14 12 7 4 3 Year to Year 2014 - Regional Breakdown
2014 2013 Brazil Angola Rest of the WorldVolume of oil in produced water dischargesper production
tonnes of oildischargedto sea per
milliontonnes of
hydrocarbonproduction
3.29 3.98 3.05 5.49 1.62
SpillsSpills (oil and chemicals) with release to sea number of
spills6 n/a 0 2 4
Oil spills with release to sea (number) number ofoil spills
3 4 0 1 2
Volume of Oil spills (m3) m3 1.06 0.019 0 0.06 1Number of Oil spills > 1 barrel (159 L) number of
oil spillsover 159L
1 0 0 0 1
Number of Oil spills > 1 barrel per production number ofoil spills
over 159Lper milliontonnes of
hydrocarbonproduction
0.03 0 0 0 0.18
(1) This data was not available from 2013(2) 2013 figures do not include fuel consumption from SBM Schiedam
Headcount by Gender, Permanent, Contractor and Location Permanent Contract Total Ratios Male Female Male Female Contract Permanent Grand Total Ratio of Females Ratio of Contract
EmployeesSBM -Schiedam
295 93 13 7 20 388 408 24% 5%
SBM -Houston
323 123 18 2 20 446 466 28% 4%
SBM -Malaysia
409 183 7 1 8 592 600 31% 1%
SBM -Monaco
477 155 26 1 27 632 659 25% 4%
SBM - Rio 162 72 5 0 5 234 239 31% 2%SBM -Operations
1,663 257 461 4 465 1,920 2,385 13% 19%
GroupExecutive
214 75 886 48 934 289 1,223 26% 76%
GroupFunctions
243 194 8 6 14 437 451 44% 3%
Total 3,786 1,152 1,424 69 1,493 4,938 6,431 23% 23%ConstructionYards
3,096 200 418 70 488 3,296 3,784 6% 13%
Grand Total 6,882 1,352 1,842 139 1,981 8,234 10,215 16% 19%
Permanent Part Time Employees Headcount Part Time Male
EmployeesPart Time Female
EmployeesTotal Part Time
Employees% of Part Time
employeesSBM - Schiedam 25 41 66 17%SBM - Houston 1 0 1 0%SBM - Malaysia 0 0 0 0%SBM - Monaco 3 22 25 4%SBM - Rio 0.00 0 0 0%SBM - Operations 3 7 10 1%Group Executive 0 9 9 3%Group Functions 4 31 35 8%Total 36 110 146 3%Construction Yards 0 0 0 0%Grand Total 36 110 146 2%
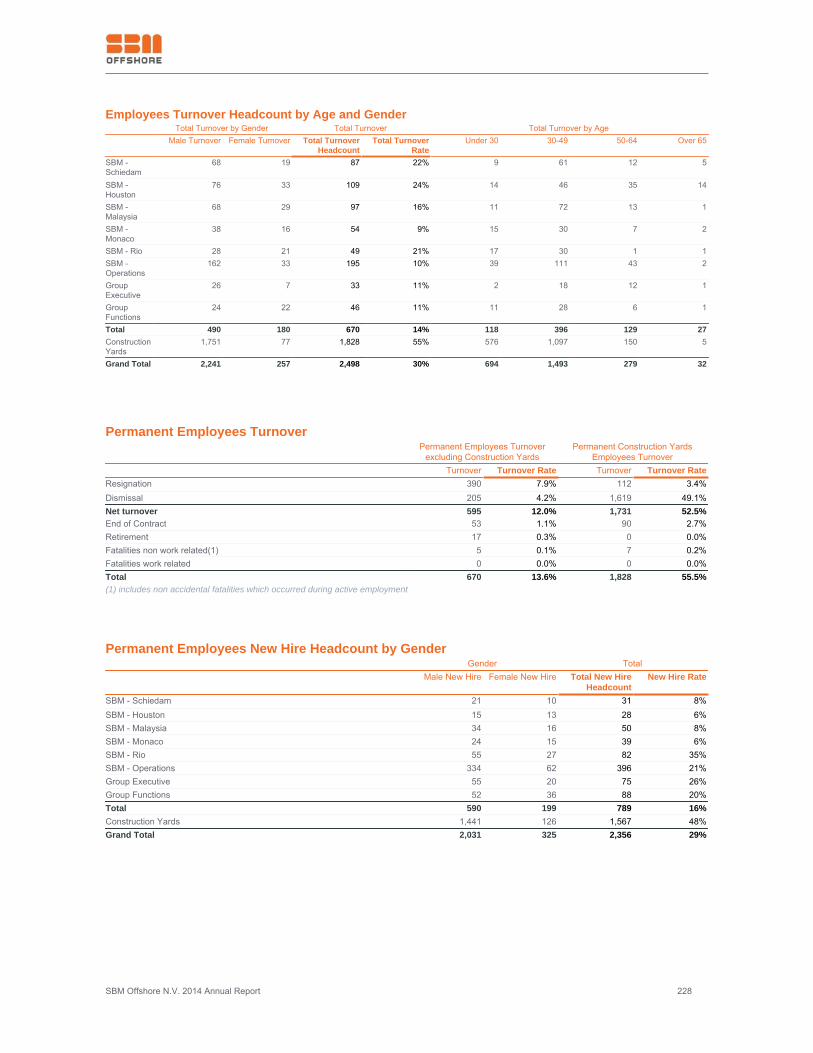
SBM Offshore N.V. 2014 Annual Report 228
Employees Turnover Headcount by Age and Gender Total Turnover by Gender Total Turnover Total Turnover by Age Male Turnover Female Turnover Total Turnover
HeadcountTotal Turnover
RateUnder 30 30-49 50-64 Over 65
SBM -Schiedam
68 19 87 22% 9 61 12 5
SBM -Houston
76 33 109 24% 14 46 35 14
SBM -Malaysia
68 29 97 16% 11 72 13 1
SBM -Monaco
38 16 54 9% 15 30 7 2
SBM - Rio 28 21 49 21% 17 30 1 1SBM -Operations
162 33 195 10% 39 111 43 2
GroupExecutive
26 7 33 11% 2 18 12 1
GroupFunctions
24 22 46 11% 11 28 6 1
Total 490 180 670 14% 118 396 129 27ConstructionYards
1,751 77 1,828 55% 576 1,097 150 5
Grand Total 2,241 257 2,498 30% 694 1,493 279 32
Permanent Employees Turnover Permanent Employees Turnover
excluding Construction YardsPermanent Construction Yards
Employees Turnover Turnover Turnover Rate Turnover Turnover RateResignation 390 7.9% 112 3.4%Dismissal 205 4.2% 1,619 49.1%Net turnover 595 12.0% 1,731 52.5%End of Contract 53 1.1% 90 2.7%Retirement 17 0.3% 0 0.0%Fatalities non work related(1) 5 0.1% 7 0.2%Fatalities work related 0 0.0% 0 0.0%Total 670 13.6% 1,828 55.5%(1) includes non accidental fatalities which occurred during active employment
Permanent Employees New Hire Headcount by Gender Gender Total Male New Hire Female New Hire Total New Hire
HeadcountNew Hire Rate
SBM - Schiedam 21 10 31 8%SBM - Houston 15 13 28 6%SBM - Malaysia 34 16 50 8%SBM - Monaco 24 15 39 6%SBM - Rio 55 27 82 35%SBM - Operations 334 62 396 21%Group Executive 55 20 75 26%Group Functions 52 36 88 20%Total 590 199 789 16%Construction Yards 1,441 126 1,567 48%Grand Total 2,031 325 2,356 29%
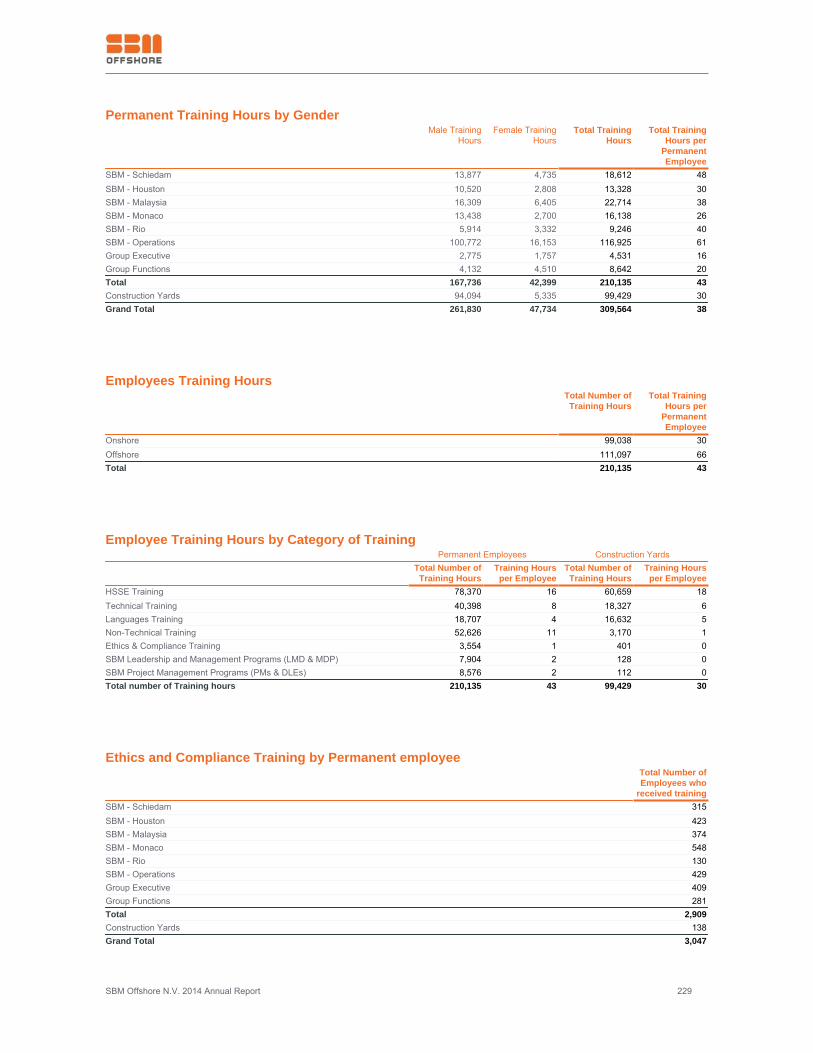
SBM Offshore N.V. 2014 Annual Report 229
Permanent Training Hours by Gender Male Training
HoursFemale Training
HoursTotal Training
HoursTotal Training
Hours perPermanentEmployee
SBM - Schiedam 13,877 4,735 18,612 48SBM - Houston 10,520 2,808 13,328 30SBM - Malaysia 16,309 6,405 22,714 38SBM - Monaco 13,438 2,700 16,138 26SBM - Rio 5,914 3,332 9,246 40SBM - Operations 100,772 16,153 116,925 61Group Executive 2,775 1,757 4,531 16Group Functions 4,132 4,510 8,642 20Total 167,736 42,399 210,135 43Construction Yards 94,094 5,335 99,429 30Grand Total 261,830 47,734 309,564 38
Employees Training Hours Total Number of
Training HoursTotal Training
Hours perPermanentEmployee
Onshore 99,038 30Offshore 111,097 66Total 210,135 43
Employee Training Hours by Category of Training Permanent Employees Construction Yards Total Number of
Training HoursTraining Hoursper Employee
Total Number ofTraining Hours
Training Hoursper Employee
HSSE Training 78,370 16 60,659 18Technical Training 40,398 8 18,327 6Languages Training 18,707 4 16,632 5Non-Technical Training 52,626 11 3,170 1Ethics & Compliance Training 3,554 1 401 0SBM Leadership and Management Programs (LMD & MDP) 7,904 2 128 0SBM Project Management Programs (PMs & DLEs) 8,576 2 112 0Total number of Training hours 210,135 43 99,429 30
Ethics and Compliance Training by Permanent employee Total Number of
Employees whoreceived training
SBM - Schiedam 315SBM - Houston 423SBM - Malaysia 374SBM - Monaco 548SBM - Rio 130SBM - Operations 429Group Executive 409Group Functions 281Total 2,909Construction Yards 138Grand Total 3,047
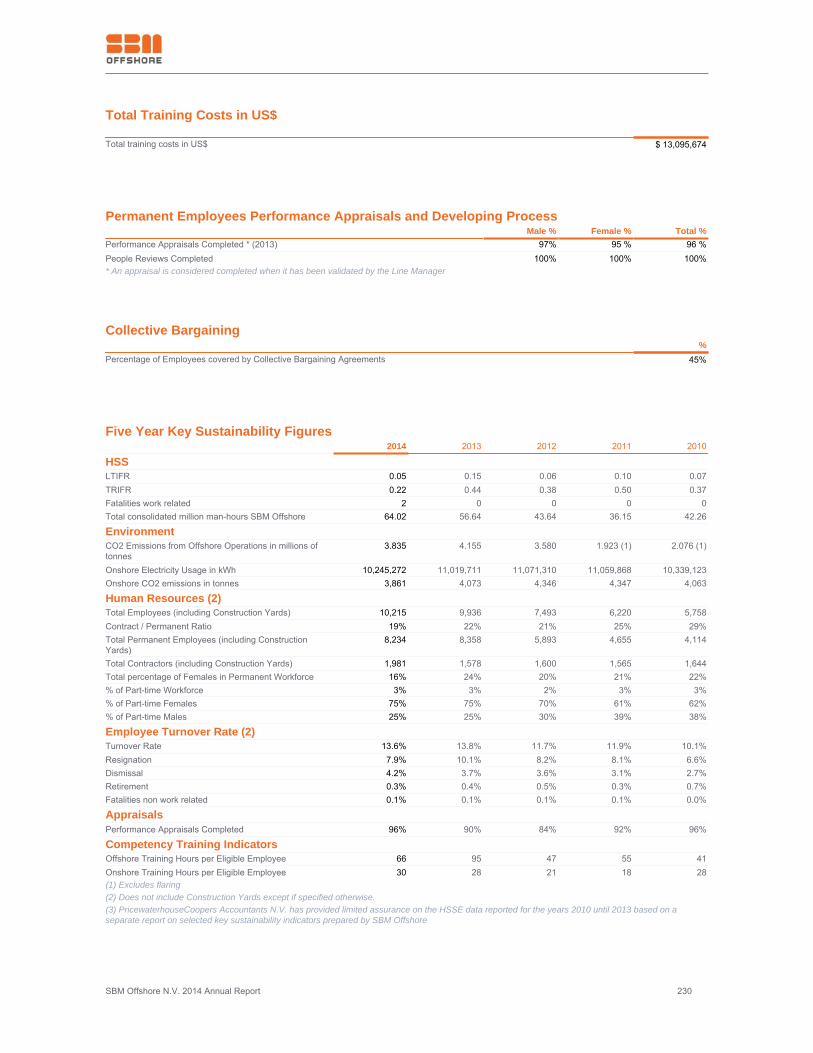
SBM Offshore N.V. 2014 Annual Report 230
Total Training Costs in US$ Total training costs in US$ $ 13,095,674
Permanent Employees Performance Appraisals and Developing Process Male % Female % Total %Performance Appraisals Completed * (2013) 97% 95 % 96 %People Reviews Completed 100% 100% 100%* An appraisal is considered completed when it has been validated by the Line Manager
Collective Bargaining %Percentage of Employees covered by Collective Bargaining Agreements 45%
Five Year Key Sustainability Figures 2014 2013 2012 2011 2010
HSSLTIFR 0.05 0.15 0.06 0.10 0.07TRIFR 0.22 0.44 0.38 0.50 0.37Fatalities work related 2 0 0 0 0Total consolidated million man-hours SBM Offshore 64.02 56.64 43.64 36.15 42.26
EnvironmentCO2 Emissions from Offshore Operations in millions oftonnes
3.835 4.155 3.580 1.923 (1) 2.076 (1)
Onshore Electricity Usage in kWh 10,245,272 11,019,711 11,071,310 11,059,868 10,339,123Onshore CO2 emissions in tonnes 3,861 4,073 4,346 4,347 4,063
Human Resources (2)Total Employees (including Construction Yards) 10,215 9,936 7,493 6,220 5,758Contract / Permanent Ratio 19% 22% 21% 25% 29%Total Permanent Employees (including ConstructionYards)
8,234 8,358 5,893 4,655 4,114
Total Contractors (including Construction Yards) 1,981 1,578 1,600 1,565 1,644Total percentage of Females in Permanent Workforce 16% 24% 20% 21% 22%% of Part-time Workforce 3% 3% 2% 3% 3%% of Part-time Females 75% 75% 70% 61% 62%% of Part-time Males 25% 25% 30% 39% 38%
Employee Turnover Rate (2)Turnover Rate 13.6% 13.8% 11.7% 11.9% 10.1%Resignation 7.9% 10.1% 8.2% 8.1% 6.6%Dismissal 4.2% 3.7% 3.6% 3.1% 2.7%Retirement 0.3% 0.4% 0.5% 0.3% 0.7%Fatalities non work related 0.1% 0.1% 0.1% 0.1% 0.0%
AppraisalsPerformance Appraisals Completed 96% 90% 84% 92% 96%
Competency Training IndicatorsOffshore Training Hours per Eligible Employee 66 95 47 55 41Onshore Training Hours per Eligible Employee 30 28 21 18 28(1) Excludes flaring(2) Does not include Construction Yards except if specified otherwise.(3) PricewaterhouseCoopers Accountants N.V. has provided limited assurance on the HSSE data reported for the years 2010 until 2013 based on aseparate report on selected key sustainability indicators prepared by SBM Offshore
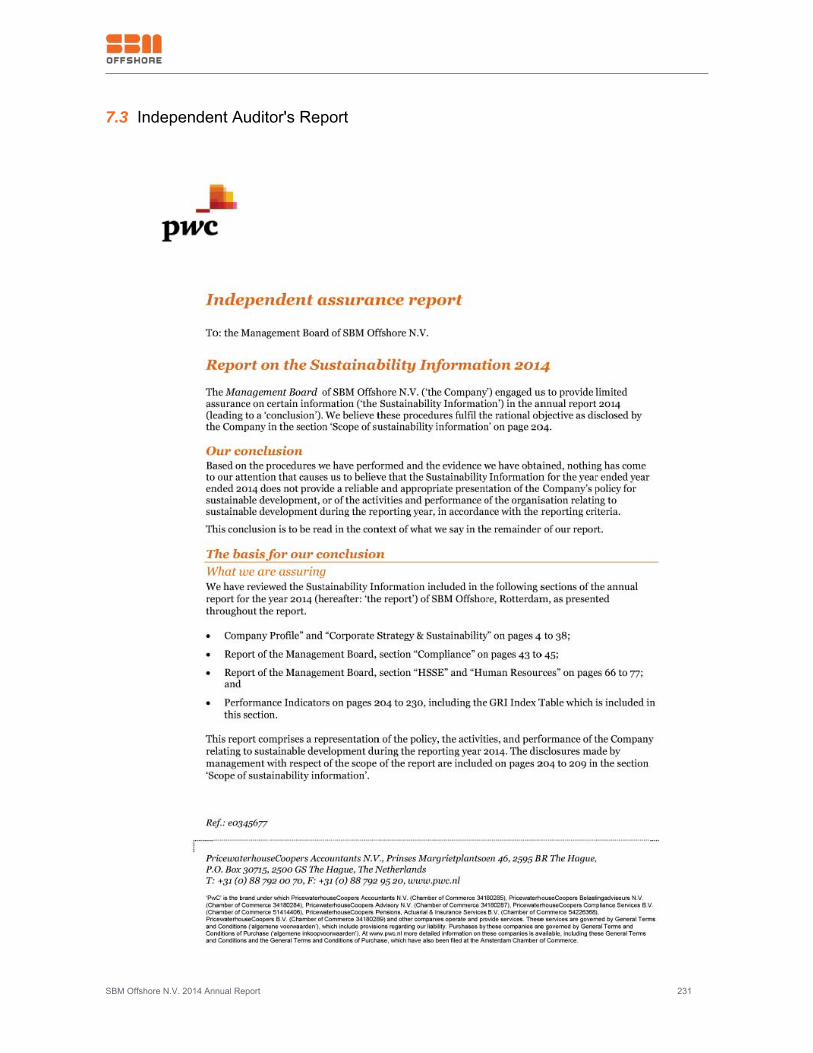
SBM Offshore N.V. 2014 Annual Report 231
7.3 Independent Auditor's Report
SBM Offshore N.V. 2014 Annual Report 232
SBM Offshore N.V. 2014 Annual Report 233
SBM Offshore N.V. 2014 Annual Report 234
SBM Offshore N.V. 2014 Annual Report 235
SBM Offshore N.V. 2014 Annual Report 236
7.4 Notes & GRI Table
Note 1
FAT: Fatality
RWC: Restricted Work Case
MTC: Medical Treatment Case
LTI: Lost Time Injury
LTIFR: Lost Time Incident Frequency Rate
TRI: Total Recordable Injuries
TRIFR: Total Recordable Injury Frequency Rate
TROIFR: Total Recordable Occupational Illness Frequency Rate
Note 2
LTI = the number of Lost Time Injuries
LTIFR = ((FAT + LTI) x 200,000)/ EH
Where:
200,000 = base for 100 equivalent full-time workers
(Working 40 hours per week, �50 weeks per year)
EH = Exposure Hours, total hours worked by all employees and contractors
TRI = FAT+LTI+RWC+MTC
TRIFR = (TRI x 200,000)/ EH
Where:
TRI = Total Recordable Injury
200,000 = base for 100 equivalent full-time workers
(Working 40 hours per week, 50 weeks per year)
EH = Exposure Hours, total hours worked�by all employees and contractors
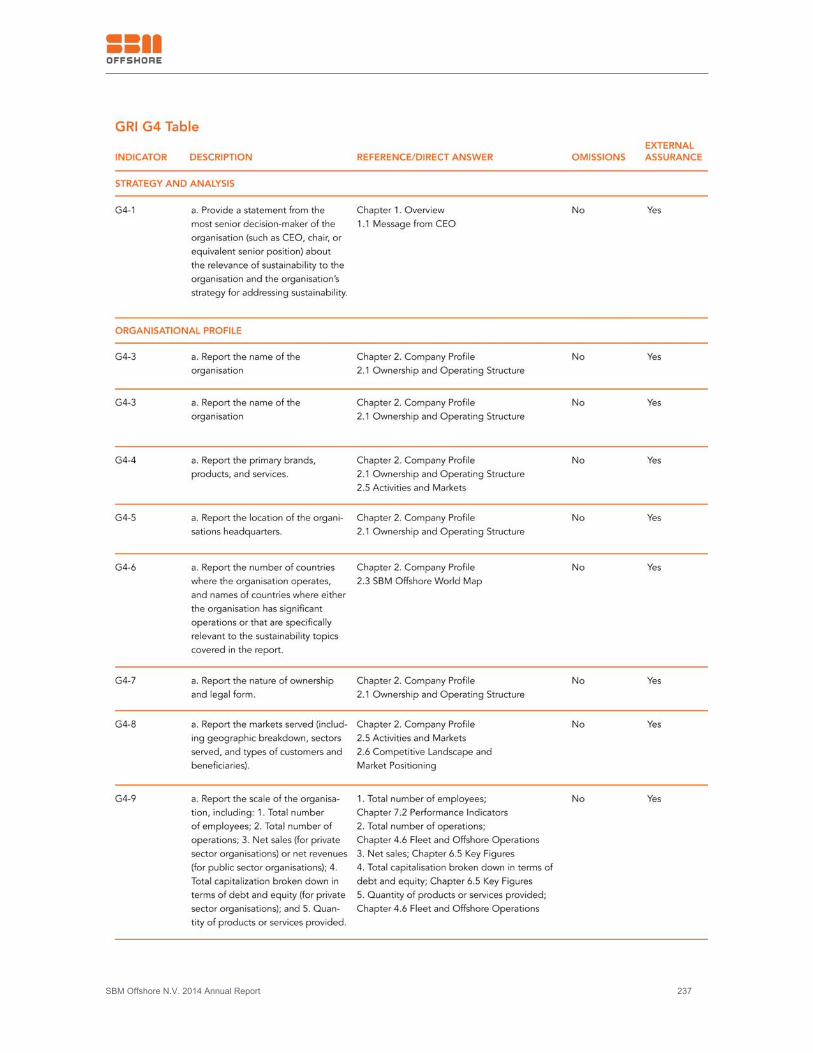
SBM Offshore N.V. 2014 Annual Report 237
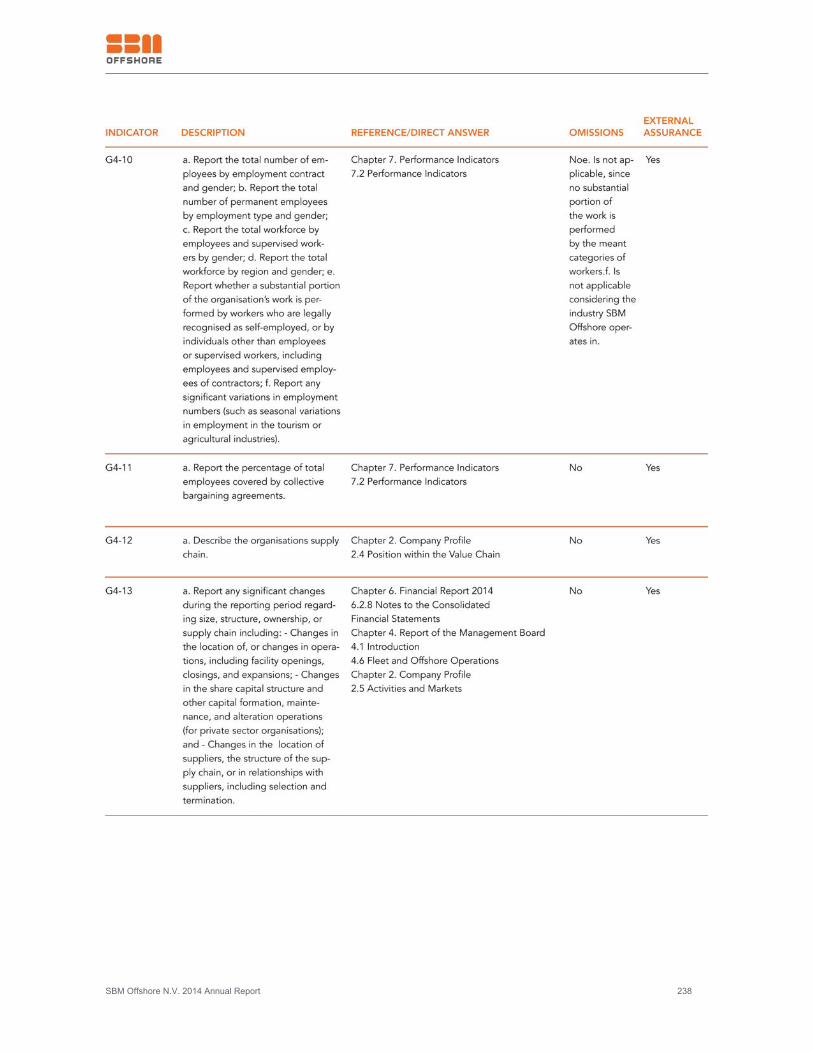
SBM Offshore N.V. 2014 Annual Report 238
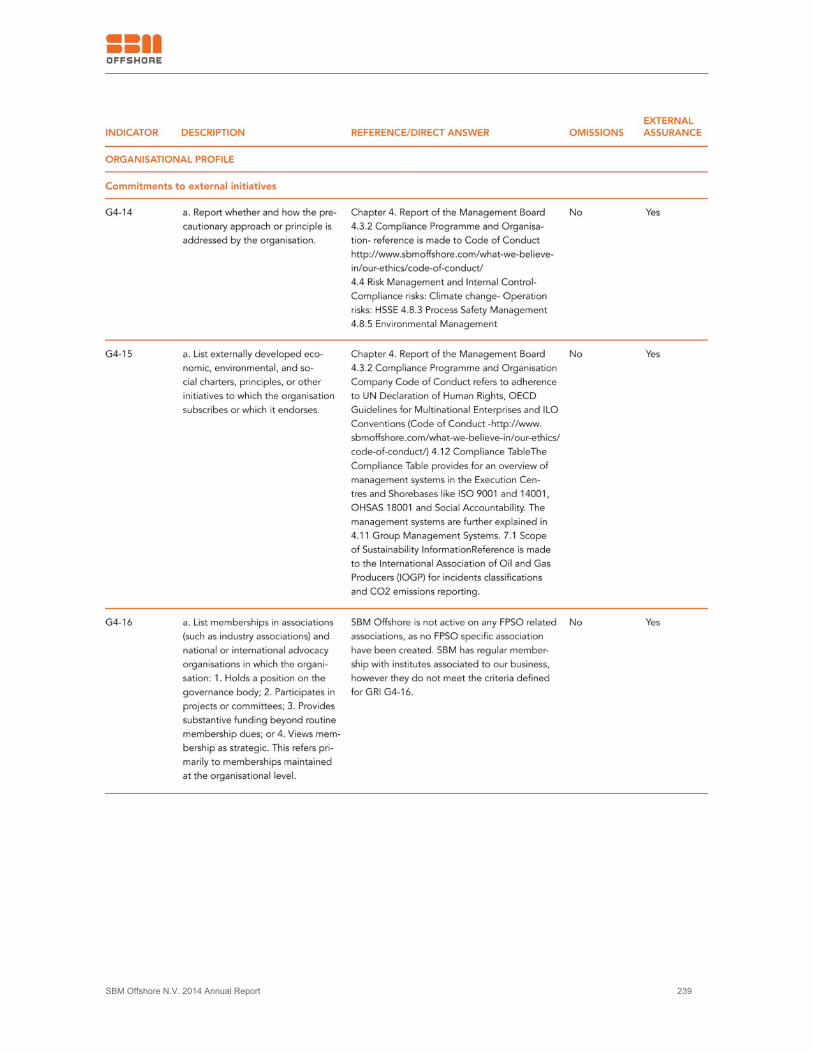
SBM Offshore N.V. 2014 Annual Report 239
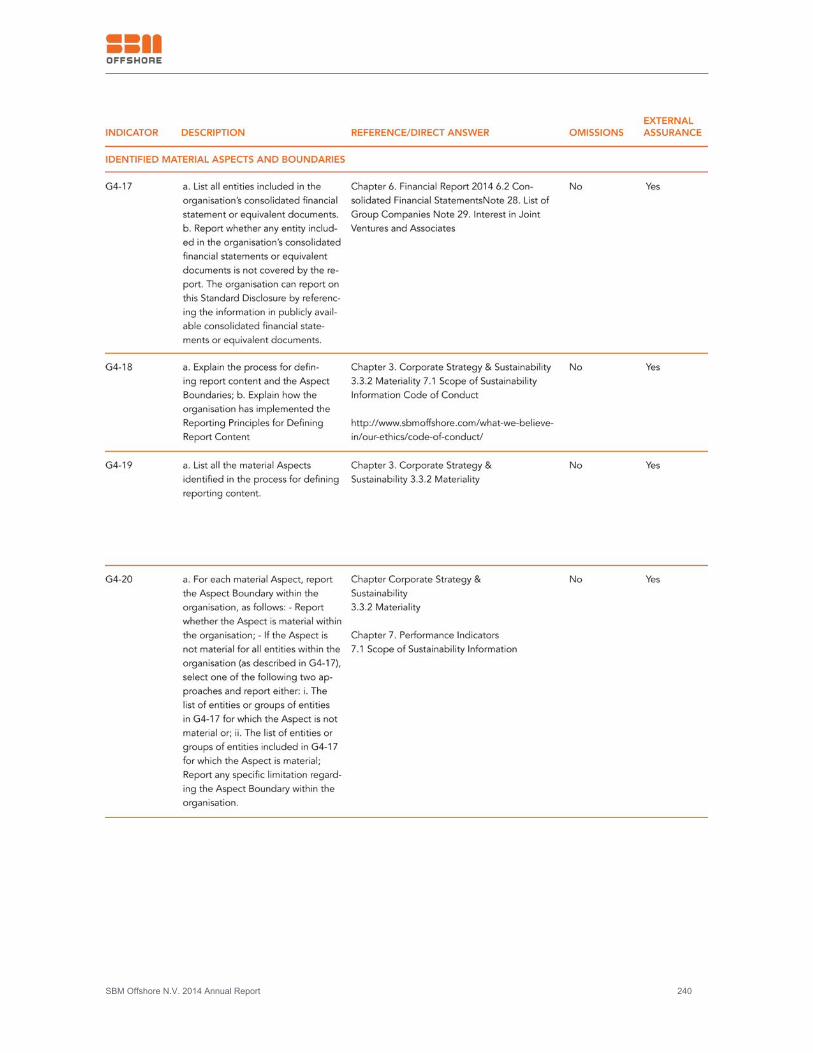
SBM Offshore N.V. 2014 Annual Report 240
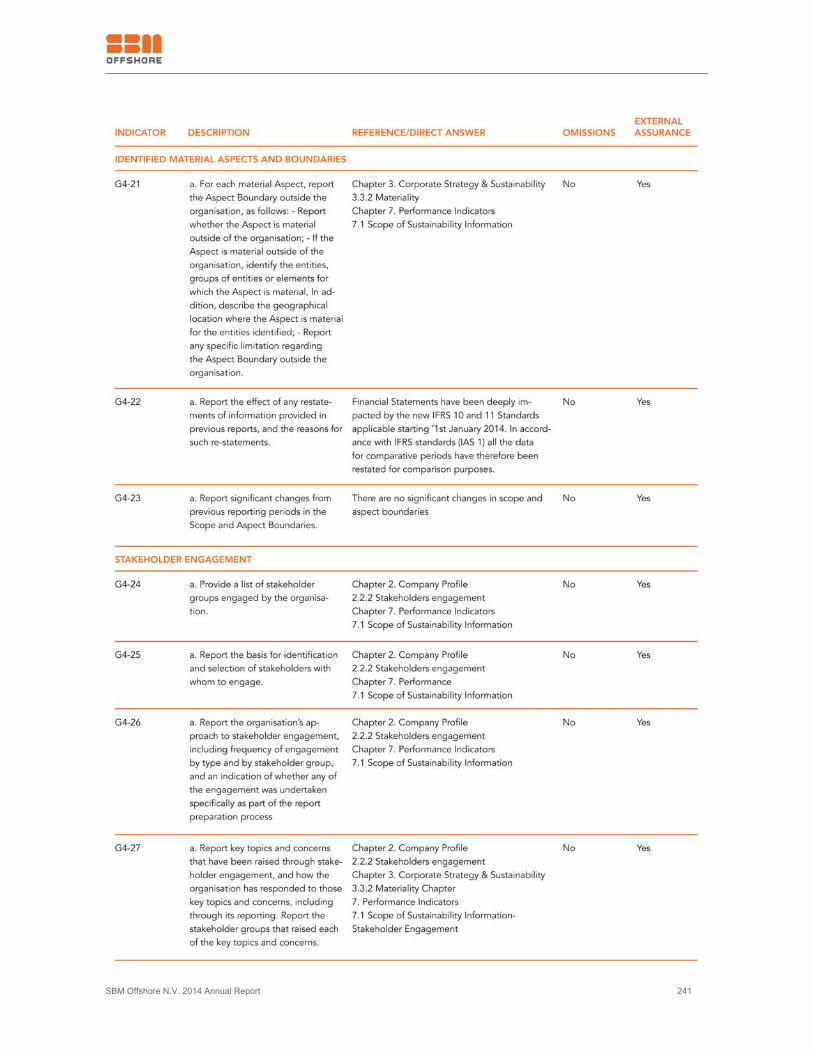
SBM Offshore N.V. 2014 Annual Report 241
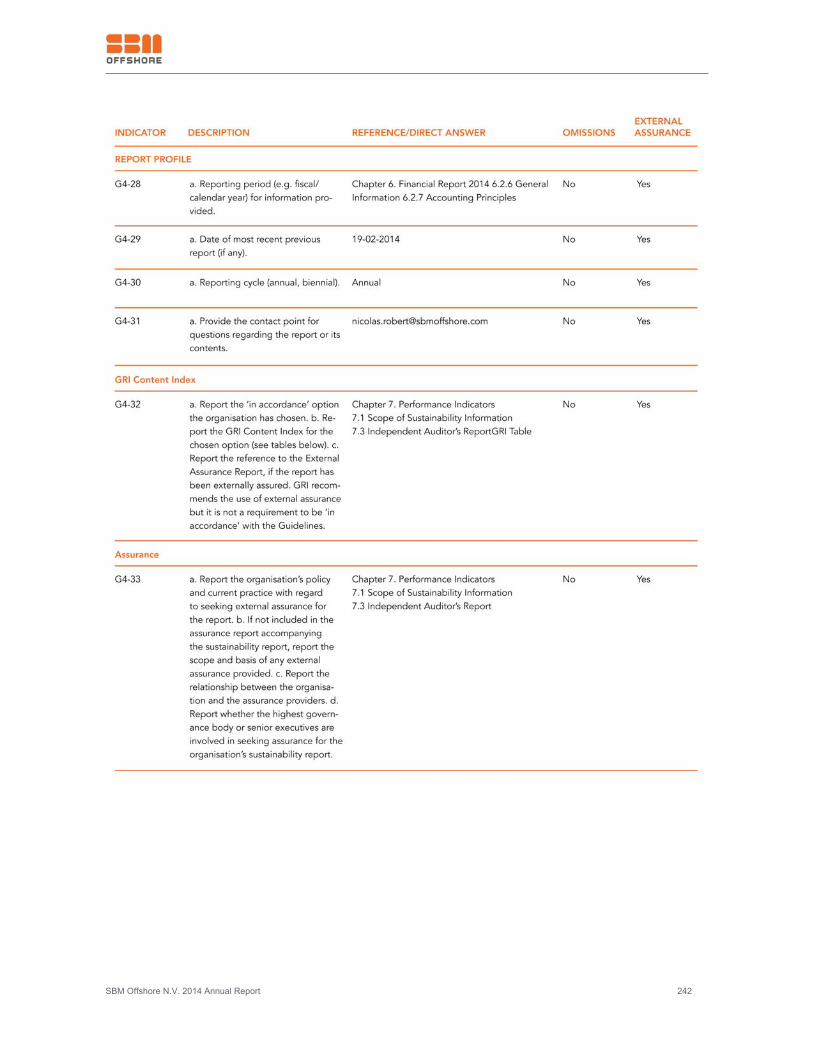
SBM Offshore N.V. 2014 Annual Report 242
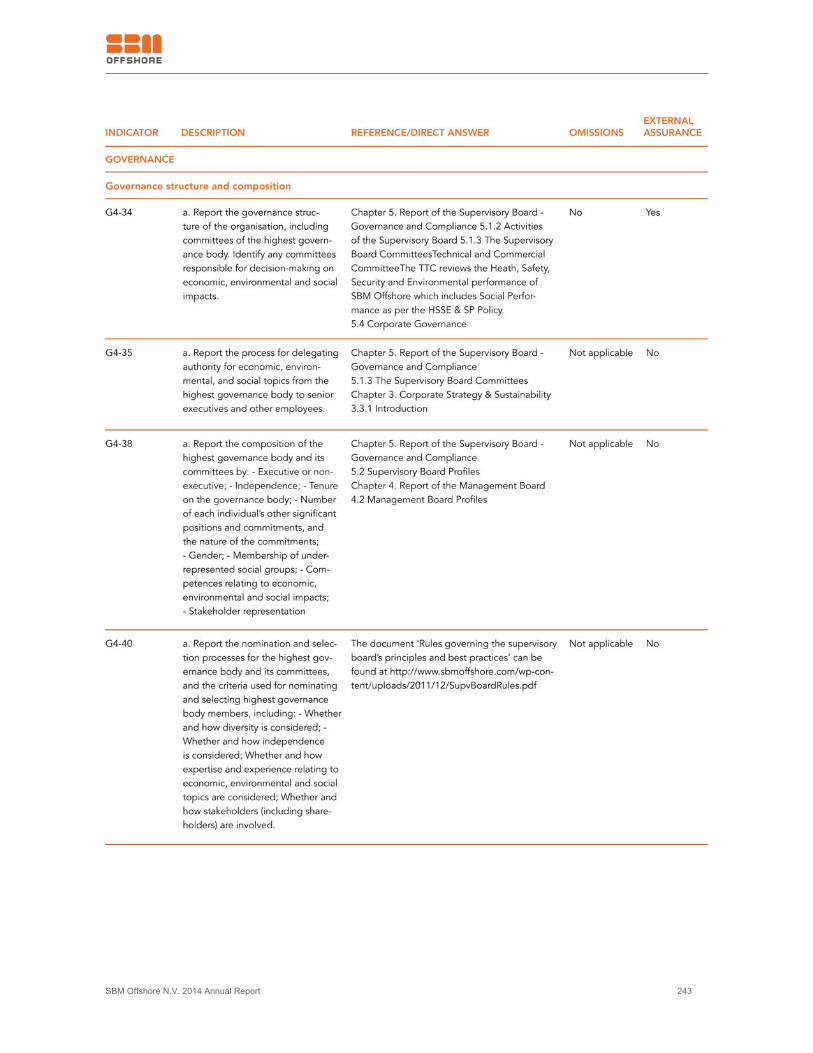
SBM Offshore N.V. 2014 Annual Report 243
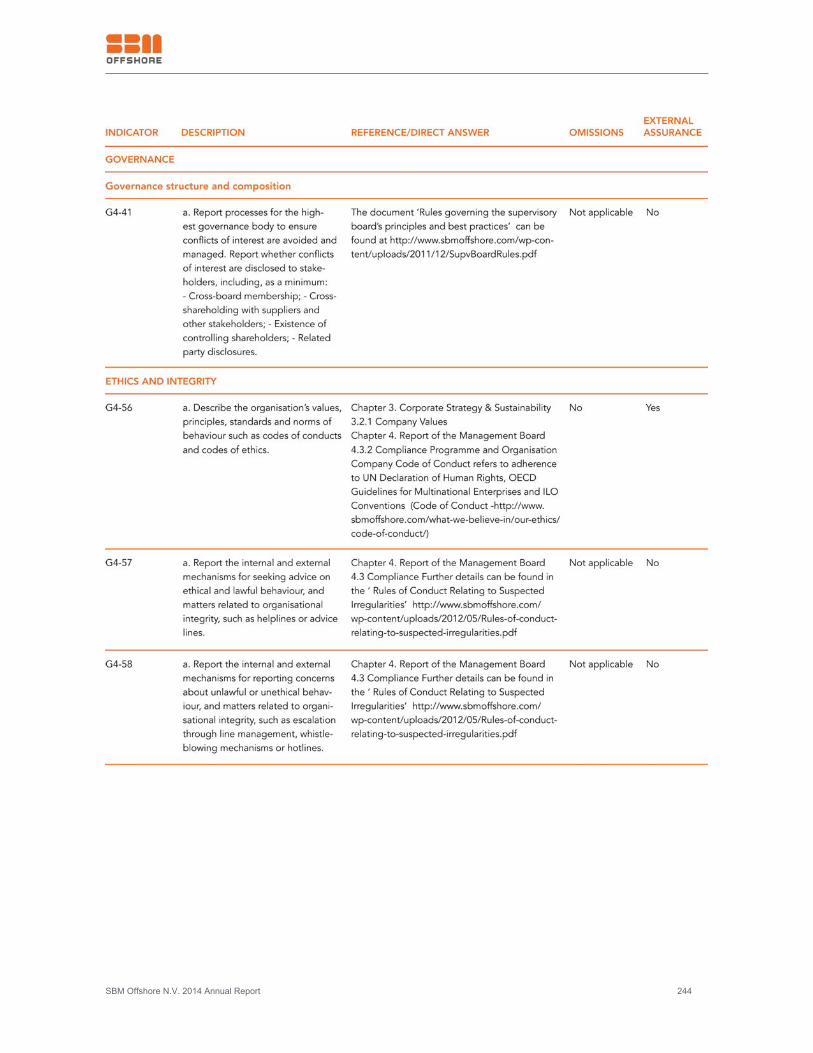
SBM Offshore N.V. 2014 Annual Report 244
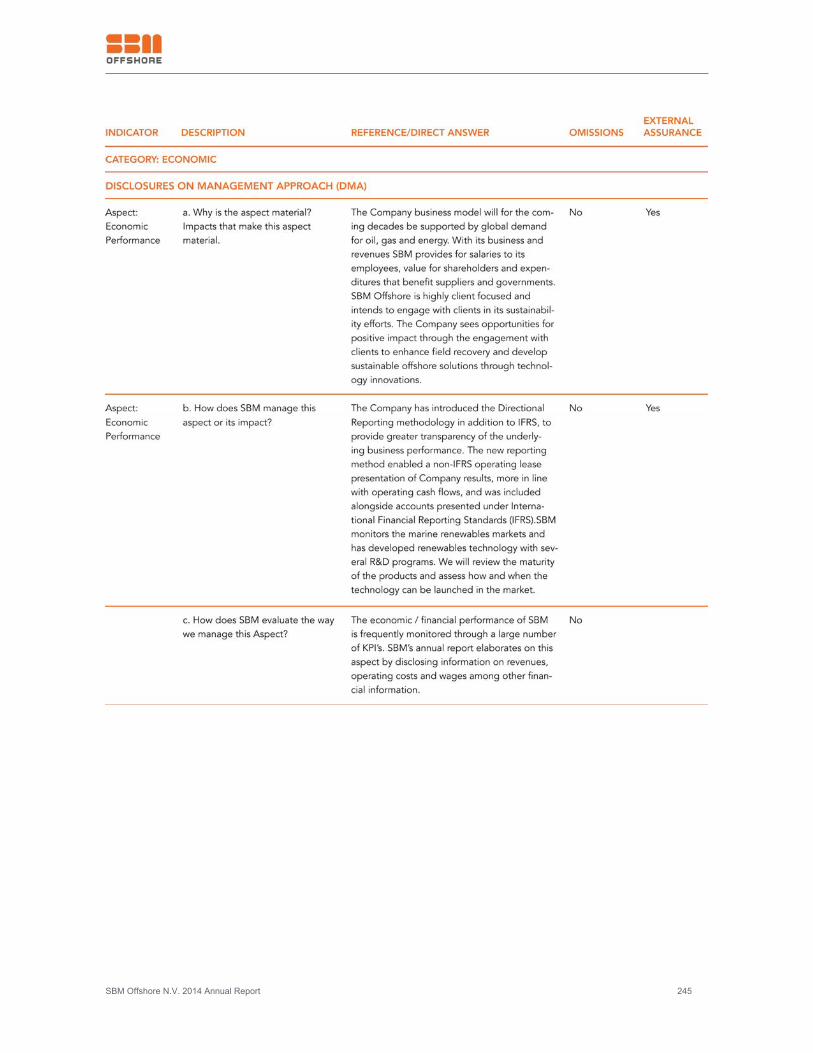
SBM Offshore N.V. 2014 Annual Report 245
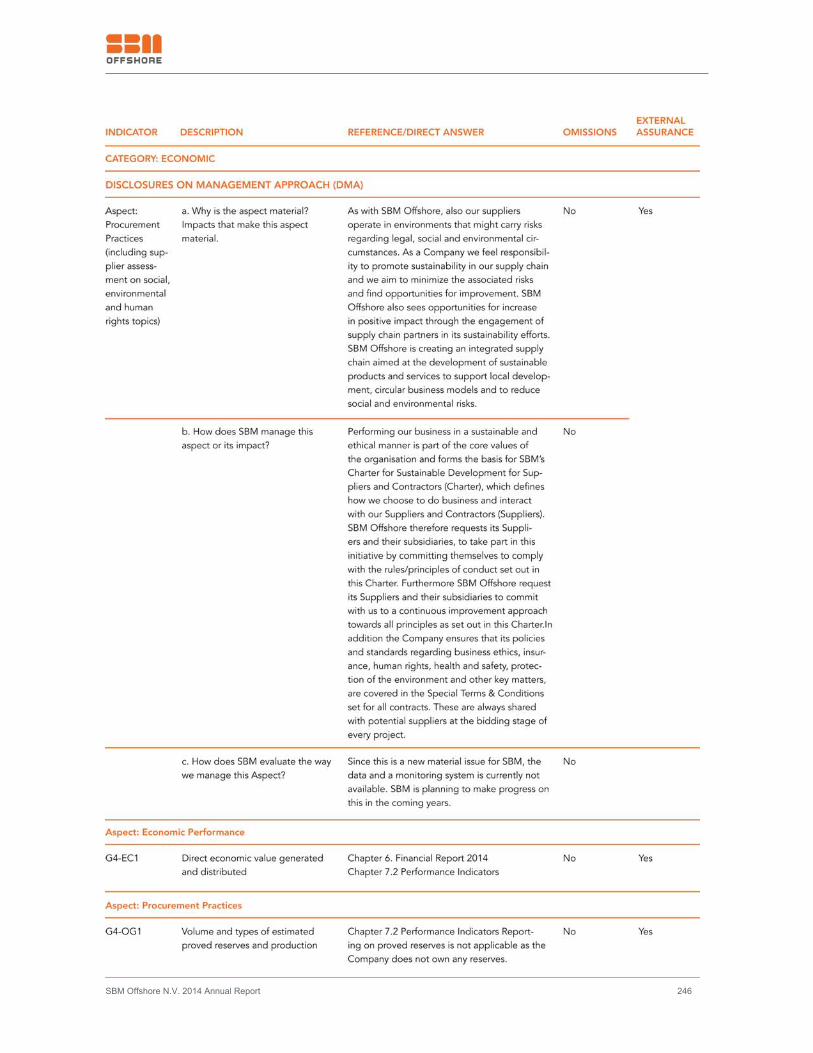
SBM Offshore N.V. 2014 Annual Report 246
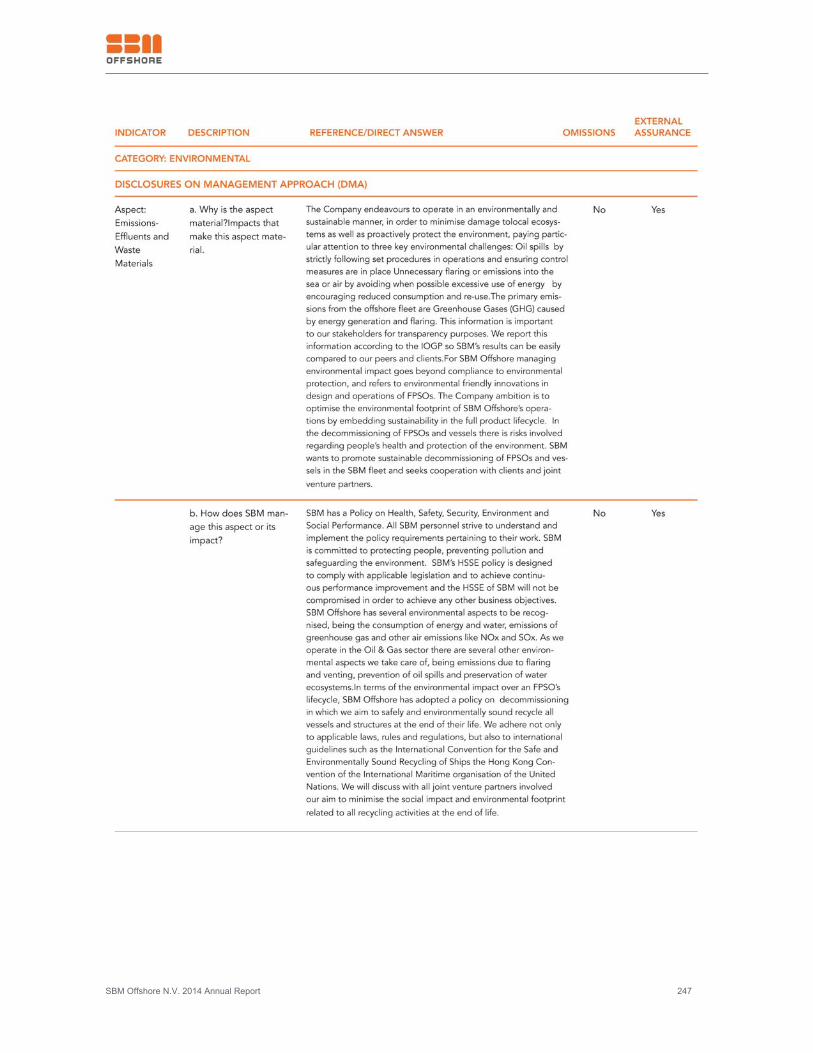
SBM Offshore N.V. 2014 Annual Report 247
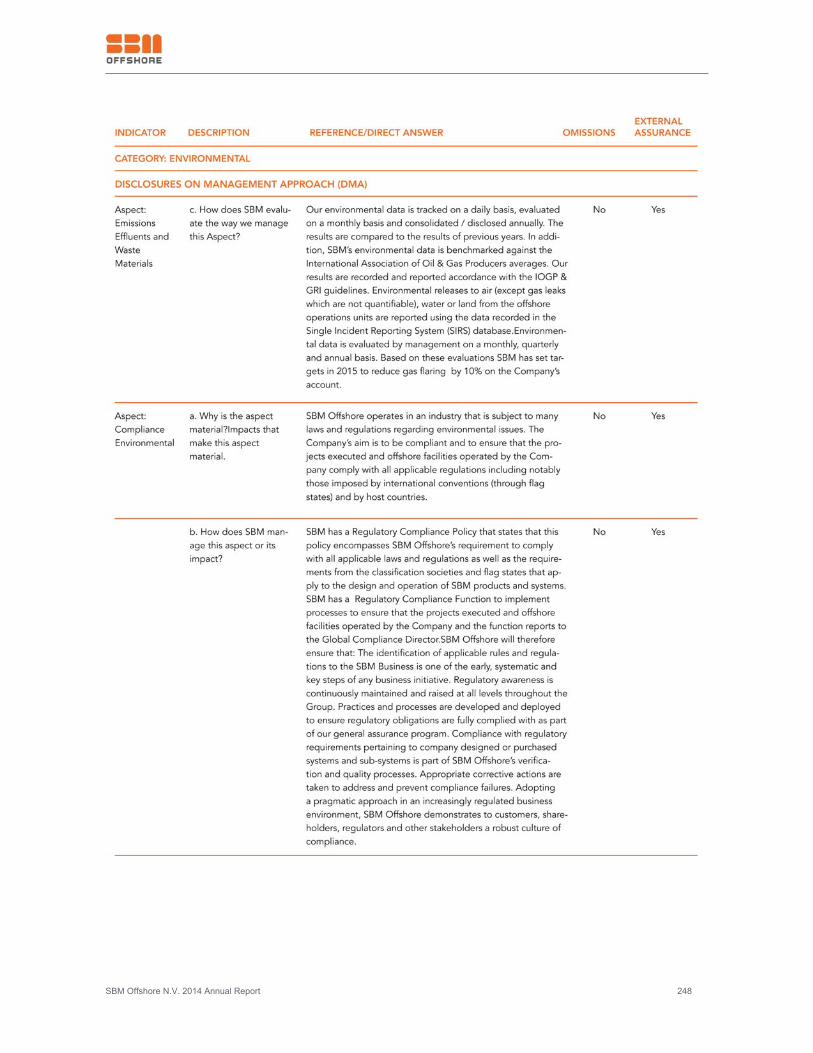
SBM Offshore N.V. 2014 Annual Report 248
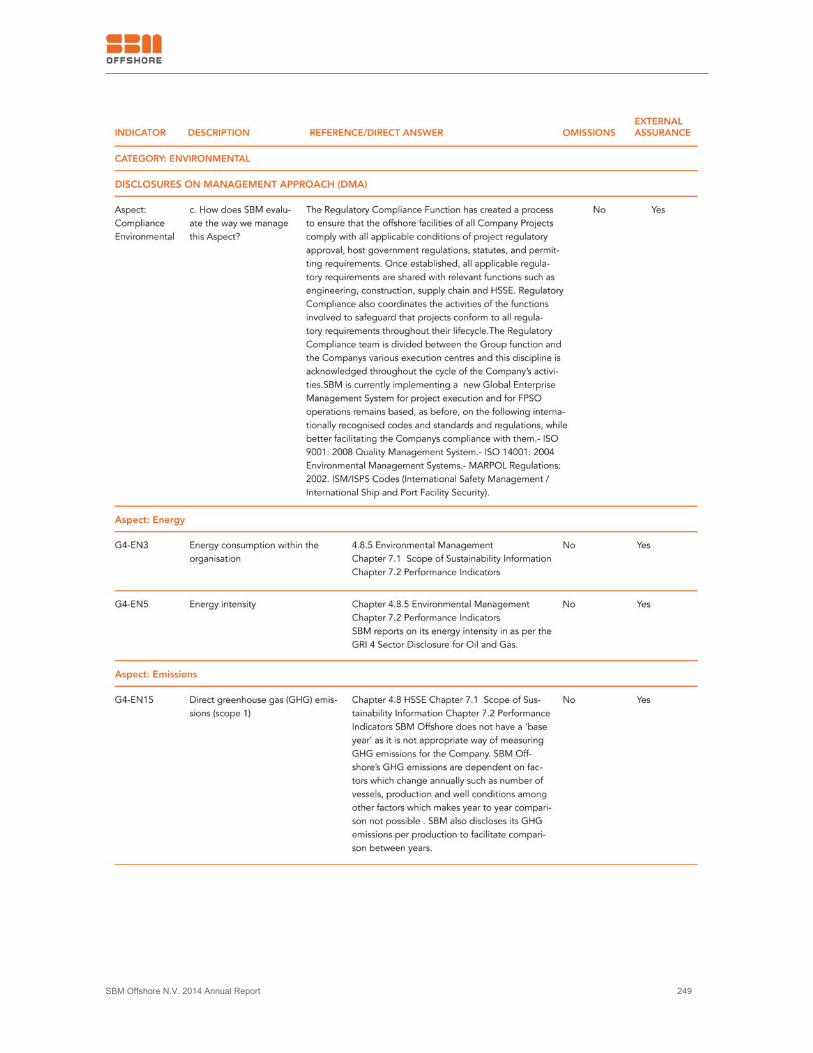
SBM Offshore N.V. 2014 Annual Report 249
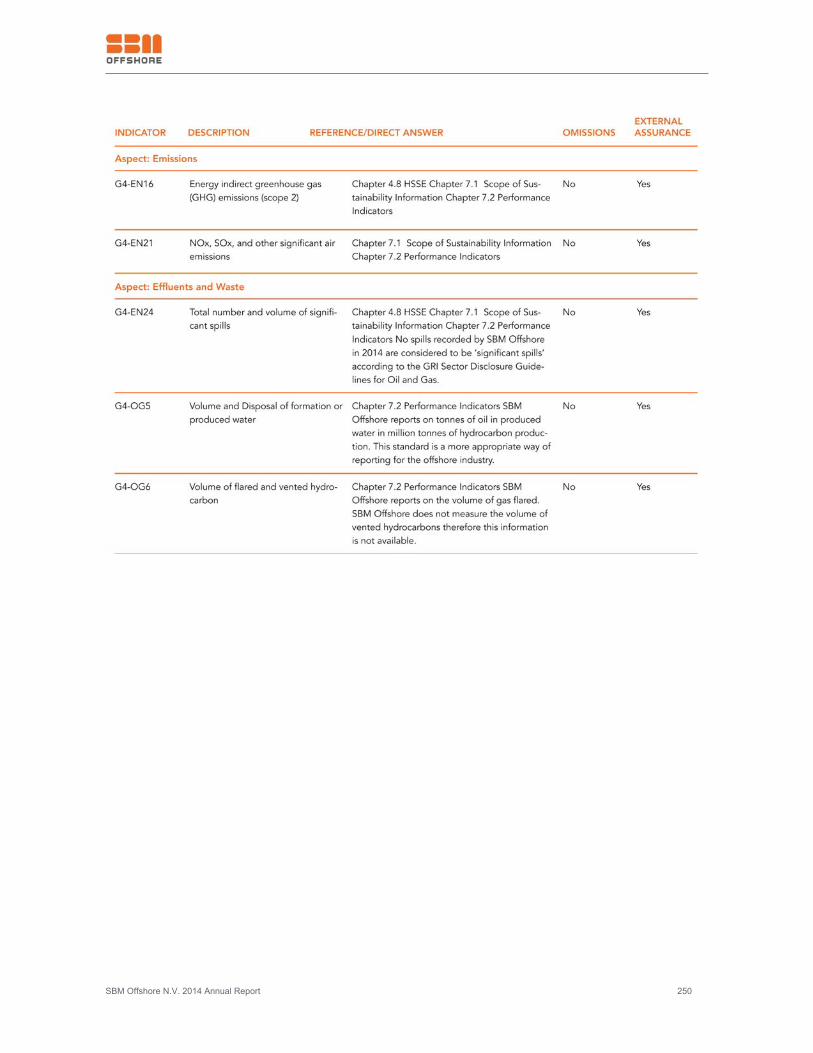
SBM Offshore N.V. 2014 Annual Report 250
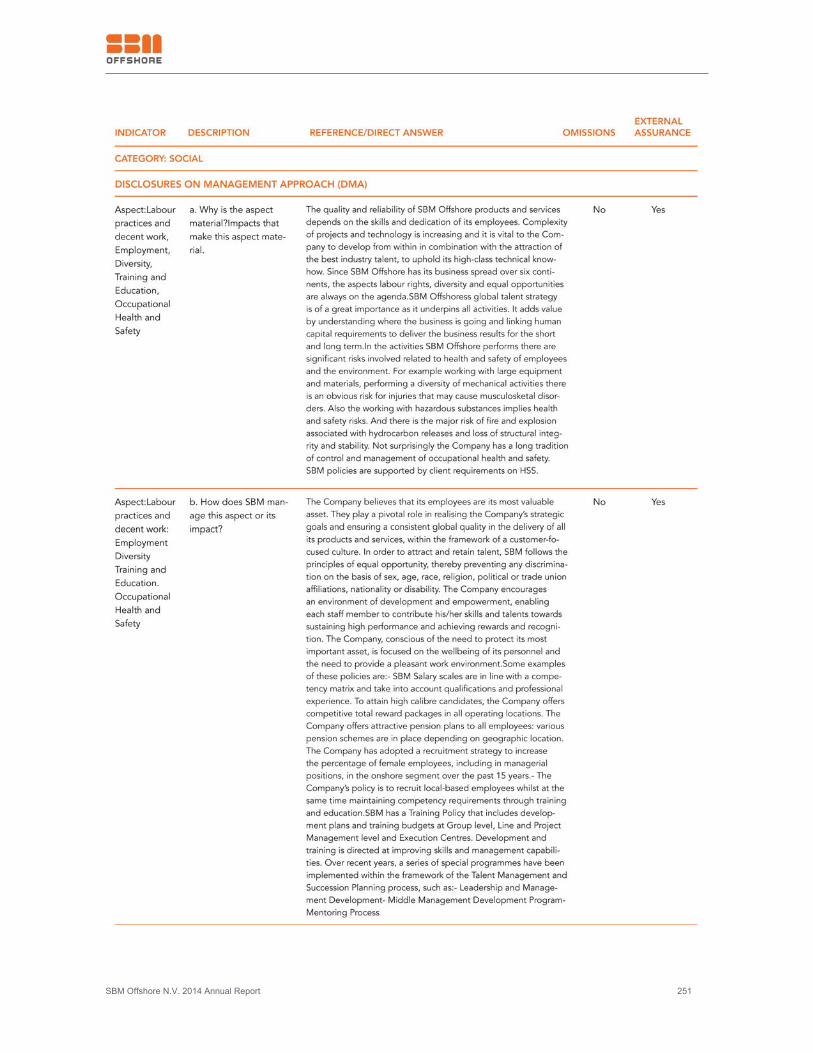
SBM Offshore N.V. 2014 Annual Report 251
SBM Offshore N.V. 2014 Annual Report 252
SBM Offshore N.V. 2014 Annual Report 253
SBM Offshore N.V. 2014 Annual Report 254
SBM Offshore N.V. 2014 Annual Report 255
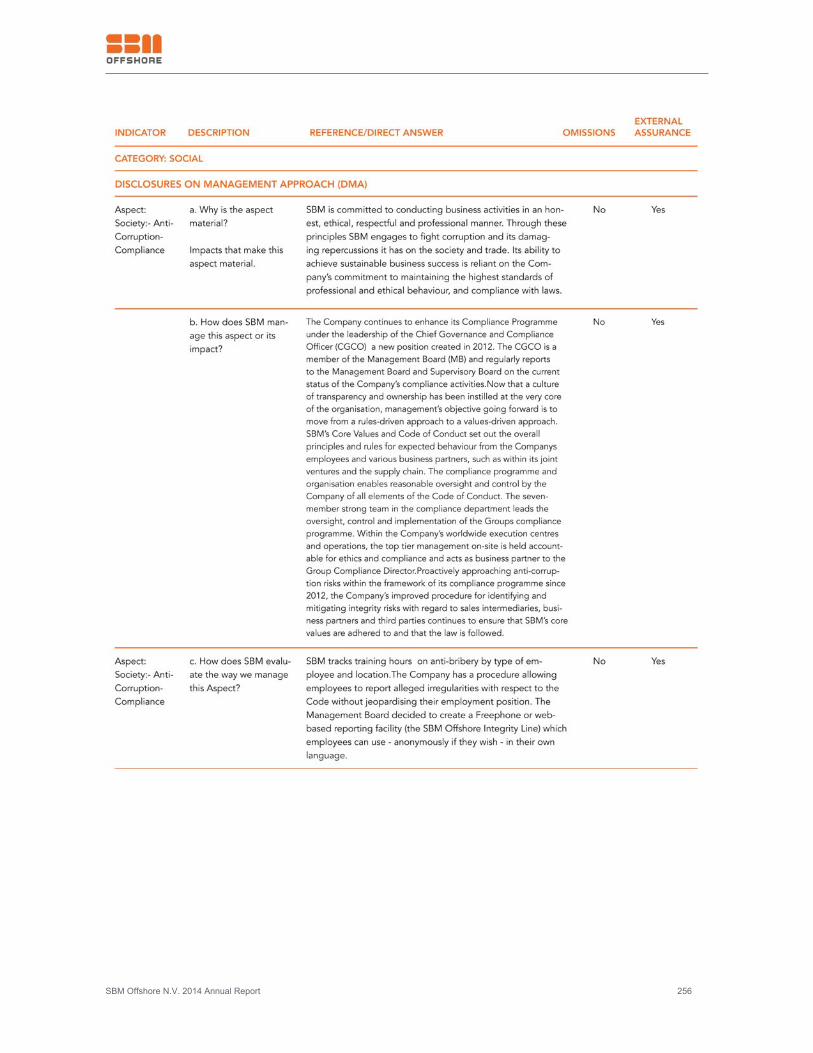
SBM Offshore N.V. 2014 Annual Report 256
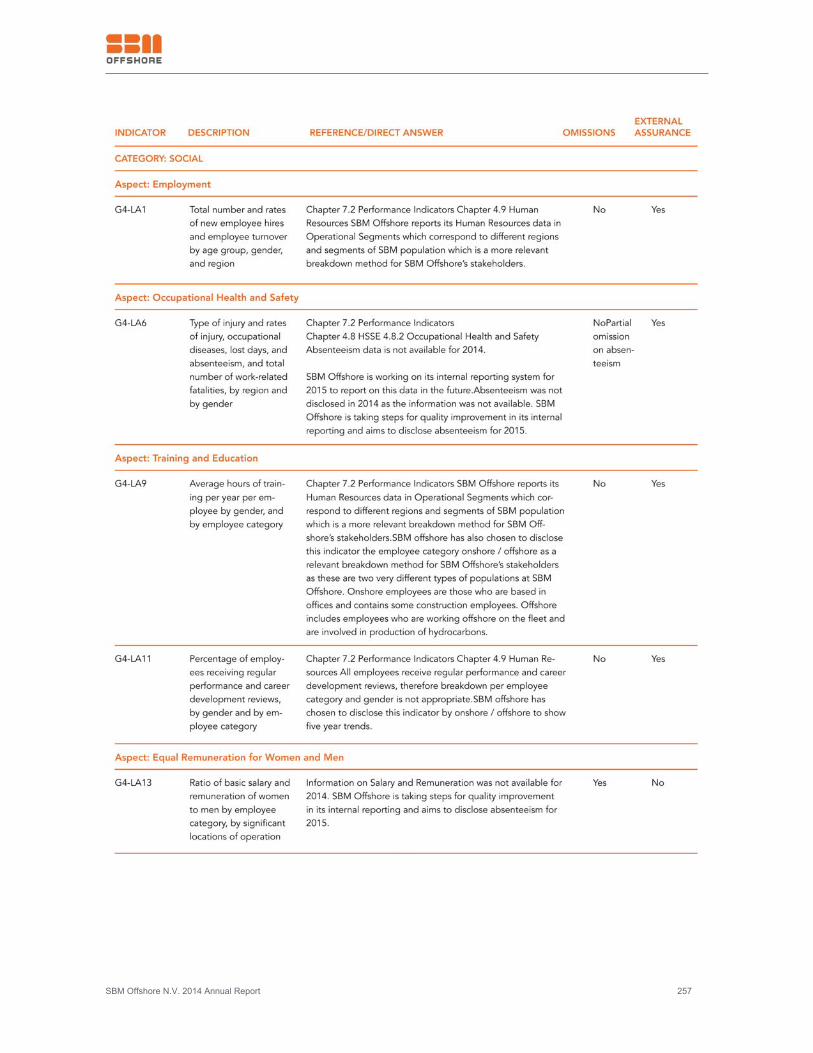
SBM Offshore N.V. 2014 Annual Report 257
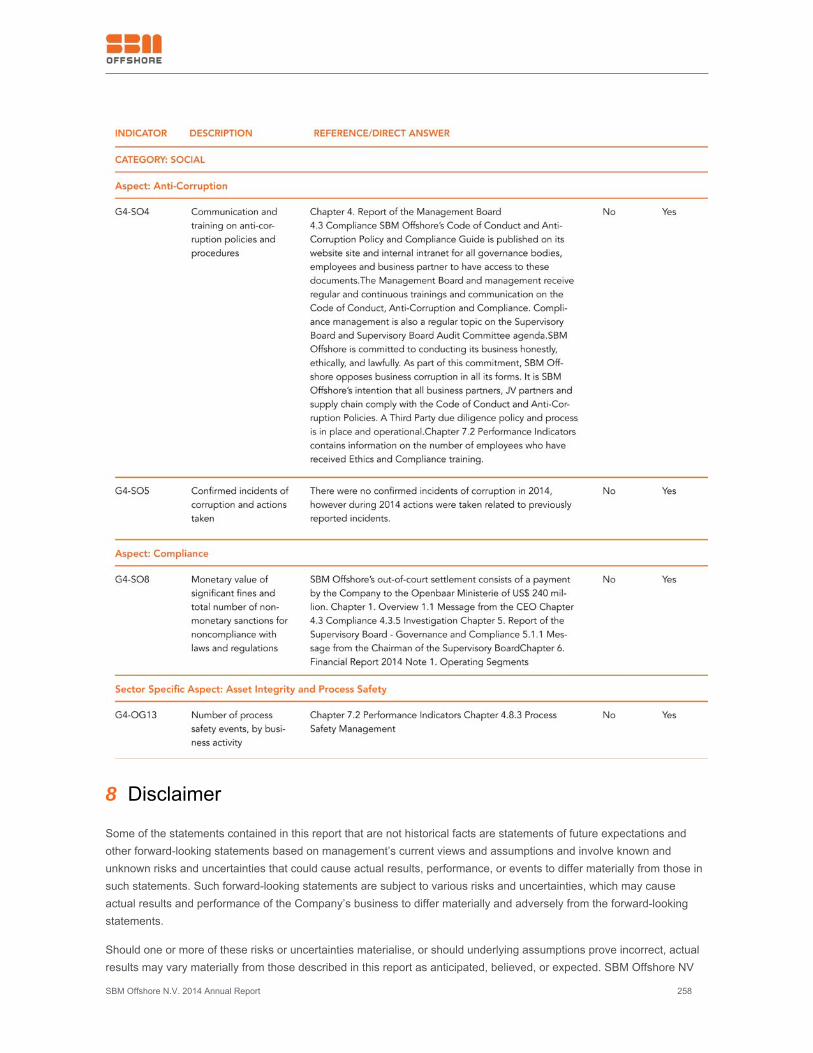
SBM Offshore N.V. 2014 Annual Report 258
8 Disclaimer
Some of the statements contained in this report that are not historical facts are statements of future expectations andother forward-looking statements based on management’s current views and assumptions and involve known andunknown risks and uncertainties that could cause actual results, performance, or events to differ materially from those insuch statements. Such forward-looking statements are subject to various risks and uncertainties, which may causeactual results and performance of the Company’s business to differ materially and adversely from the forward-lookingstatements.
Should one or more of these risks or uncertainties materialise, or should underlying assumptions prove incorrect, actualresults may vary materially from those described in this report as anticipated, believed, or expected. SBM Offshore NV

SBM Offshore N.V. 2014 Annual Report 259
does not intend, and does not assume any obligation, to update any industry information or forward-looking statementsset forth in this report to reflect subsequent events or circumstances.
Related Documents