Welcome message from author
This document is posted to help you gain knowledge. Please leave a comment to let me know what you think about it! Share it to your friends and learn new things together.
Transcript
i
TABLE OF CONTENTS LIST OF FIGURES ................................................................................................................ i
LIST OF TABLES .................................................................................................................. i
COUNTRY FACT SHEET ...................................................................................................... i
LIST OF ACRONYMS .......................................................................................................... ii
EXECUTIVE SUMMARY ....................................................................................................... i
1. INTRODUCTION AND BACKGROUND ........................................................................ 1
1.1 Introduction ............................................................................................................................ 1
1.2 Background ........................................................................................................................... 2
2. OVERVIEW OF ZAMBIA ............................................................................................... 4
3. ECONOMIC OUTLOOK ................................................................................................ 7
3.1 Economy ..................................................................................................................................... 7
3.2 Economic Structure ................................................................................................................... 9
3.3 Credit Rating............................................................................................................................. 11
3.4 Monetary Policy ....................................................................................................................... 12
3.5 Trade Environment .................................................................................................................. 14
3.5.1 Major Destinations for Exports ....................................................................................... 15
3.5.2 Major Destinations for Imports ....................................................................................... 17
3.5.3 Zambia’s Trade with SADC ............................................................................................ 19
3.5.4 Zambia’s Trade with COMESA ...................................................................................... 19
3.5.5 Document requirements for importation and exportation ........................................... 21
3.6 Business Environment ............................................................................................................ 22
3.6.1 Global Competitiveness .................................................................................................. 22
3.6.2 The Legatum Prosperity Index ....................................................................................... 23
3.6.3 Ease of Doing Business .................................................................................................. 24
3.7 Regional Integration index ..................................................................................................... 30
4. ROAD TRANSPORT ENVIRONMENT ........................................................................ 35
4.1 Overview ................................................................................................................................... 35
4.2 Road Traffic Legislation .......................................................................................................... 39
4.2.1 Speed Limits ..................................................................................................................... 39
4.2.2 Traffic Fines ....................................................................................................................... 39
4.2.3 Toll Plazas ......................................................................................................................... 40
4.2.4 Border posts ...................................................................................................................... 41
4.2.5. Zambia – Main Trade Routes ..................................................................................... 44
ii
5. PASSENGER ROAD TRANSPORT ............................................................................ 46
5.1 Passenger traffic Volumes ..................................................................................................... 46
5.2 Tourists ...................................................................................................................................... 46
5.3 Zambia Tourism Sector .......................................................................................................... 47
5.4 Zambia Tourists Attractions ................................................................................................... 48
5.4.1 National Parks ................................................................................................................... 48
5.4.2 Waterfalls ........................................................................................................................... 49
5.4.3 Museums ........................................................................................................................... 49
5.4.4 Cultural Ceremonies ........................................................................................................ 49
5.5 Cross border road transport permits ..................................................................................... 50
6. OPPORTUNITIES ........................................................................................................ 51
6.1 Mining sector ............................................................................................................................ 52
6.2 Infrastructure sector ................................................................................................................ 53
6.2.1 Transport Infrastructure ................................................................................................... 53
6.2.2 Housing and Estate Infrastructure ................................................................................. 57
6.2.3 Energy Infrastructure ....................................................................................................... 58
6.3 Agriculture sector ..................................................................................................................... 58
6.4 Tourism sector ......................................................................................................................... 59
6.5 Manufacturing sector ............................................................................................................... 60
7. CONCLUSION ............................................................................................................. 63
8. CONTACT DETAILS OF RELEVANT AUTHORITIES ................................................ 64
9. REFERENCE ............................................................................................................... 65

i
LIST OF FIGURES
Figure 1: Map of Zambia .................................................................................................................... 4
Figure 2: Districts of Zambia ............................................................................................................. 5
Figure 3: Zambia GDP per capita ..................................................................................................... 6
Figure 4: GDP Growth Rate .............................................................................................................. 8
Figure 5: GDP by sector ..................................................................................................................... 9
Figure 6: Sector contributions to GDP ........................................................................................... 10
Figure 7: Zambia Inflation Rate ....................................................................................................... 13
Figure 8: Major Export destinations (USD millions) ..................................................................... 15
Figure 9: Top Source Countries for Imports (USD millions) ....................................................... 18
Figure 10: Global Competitiveness Index Framework ................................................................ 22
Figure 11: Zambia’s Competitive Ranking .................................................................................... 23
Figure 12: Zambia vs. South Africa Rankings ............................................................................... 25
Figure 13: Comparative Ranking .................................................................................................... 27
Figure 14: Trading Across Borders South Africa vs. Zambia ...................................................... 29
Figure 15: Regional Integration Index ............................................................................................ 31
Figure 16: Overall scores on regional integration by REC ......................................................... 32
Figure 17: SADC vs. COMESA scores .......................................................................................... 32
Figure 18: Total Road Network (Percentage) ............................................................................... 37
Figure 19: Reasons to invest in Zambia ........................................................................................ 51
Figure 20: Zambia’s main routes and mineral occurrences ....................................................... 53
Figure 21: Railway opportunities .................................................................................................... 56
LIST OF TABLES
Table 1: Sovereign Risk Ratings .................................................................................................... 11
Table 2: Top Zambia Exports 2017 ................................................................................................ 16
Table 3: Zambia’s Trade with selected SADC countries............................................................. 19
Table 4: Zambia’s Trade with COMESA ........................................................................................ 20
Table 5: Procedures required in registering a firm in Zambia ..................................................... 27
Table 6: Zambia vs. South Africa on Trading across borders .................................................... 29
Table 7: Road indicators of Zambia and middle income countries ............................................. 35
Table 8: Periodic Maintenance ....................................................................................................... 38
Table 9: Traffic Fines ......................................................................................................................... 39
Table 10: Road toll tariff structure .................................................................................................. 40
Table 11: Operational Toll Collection Sites ................................................................................... 41
Table 12: Zambia Border Posts and operating times .................................................................. 42
Table 13: Travel Statistics ............................................................................................................... 46
Table 14: Top Ten Leading SADC Countries ............................................................................... 47
Table 15: Operator permits issued in the period .......................................................................... 50
Table 16: Contact Details .................................................................................................................. 64

i
COUNTRY FACT SHEET
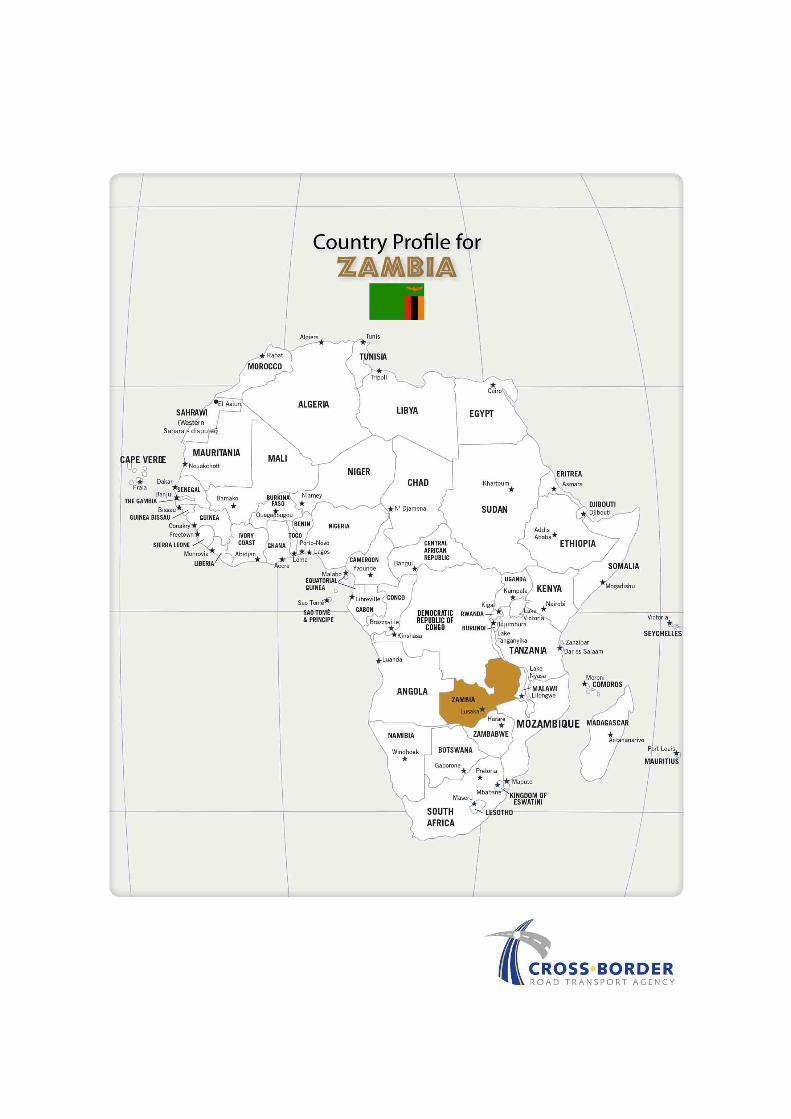
COUNTRY ZAMBIA
Capital Lusaka
Language English, Bemba, Kaonda, Lozi, Lunda Luval, Nyanja, Tonga
Location Neighbouring the Democratic Republic of the Congo to the north, Tanzania to the north-east, Malawi to the east, Mozambique to the southeast, Zimbabwe and Botswana to the south, Namibia to the southwest and Angola to the west.
Area 752 618 km2
Currency Kwacha
Population 17,466,732 (as of 2017)
President Edgar Chagwa Lungu
Districts Central, Copperbelt, Eastern, Luapula, Lusaka, Northern, Muchinga, North-Western, Southern and Western
Real GDP growth rate 3.3 (2016)
GDP per capita 1 178,39 USD (2016)
GDP 19,55 billion USD (2016)
Inflation 6.6% (2017)
Government Bond Ratings Moody’s = B3 Negative S & P = B Stable Fitch = B Negative
Main Exports Copper and articles thereof; inorganic chemicals; cereals; other base metals, cements and articles thereof; and works of art
Main export partners Switzerland, China, Congo DR, South Africa, Singapore, and the United Arab Emirates
Main Imports Mineral fuels, oils and products of their distillation, ores, slag and ash; inorganic chemicals, nuclear reactors and boilers; and fertilisers
Main Imports partners South Africa, Congo DR, China, United Arab Emirates and Mauritius
Ease of Doing Business 85
Global competitiveness 118
Road network 67,671km
Speed Limit 120km/h and 60km/h
ii
LIST OF ACRONYMS
AEC African Economic Community
AfDB African Development Bank
AGOA African Growth and Opportunity Act
C-BRTA Cross-Border Road Transport Agency
COMESA Common Market for Eastern and Southern Africa
CRN Core Road Network
EAC East African Community
FDI Foreign Direct Investment
FTA Free Trade Agreement
GCI Global Competitiveness Index
GCR Global Competitive Report
GDP Gross Domestic Product
GRZ Government of the Republic of Zambia
IMF International Monetary Fund
MFEZ Multi Facility Economic Zones
NRFA National Road Fund Agency
NTBs Non- Tariff Barriers
OSBP One Stop Border Post
PFR Primary Feeder Roads
PTA Preferential Trade Agreement
PTCM Protocol on Transport, Communications and Meteorology
RDA Road Development Agency
RSZ Railway Systems of Zambia
SADC Southern African Development Community
S & P Standard and Poor’s
SSA Sub Saharan Africa
STATSSA Statistics South Africa

iii
TAZARA Tanzania Zambia Railway Authority
TMD Trunk, Main and District roads
WTO World Trade Organisation
ZDA Zambia Development Agency
i
EXECUTIVE SUMMARY
This Country Profile Report provides information on Zambia that is relevant to cross-border
road transport operators, regulatory authorities and other stakeholders with an interest in
cross-border business between Zambia and South Africa. The Report further provides an
update of recent developments in Zambia with regard to the performance of the economy,
the road transport environment including traffic legislation and policies that affect cross-
border operations. It also covers the business environment in Zambia and identifies business
opportunities.
The aim of the Cross-Border Road Transport Agency (C-BRTA) is to profile all the Southern
African Development Community (SADC) member states with which South Africa has multi-
lateral and bilateral cross-border road transport agreements or memorandums of
understanding (MoUs). The long-term objective is to broaden the scope and profile all the
SADC member states with a view to provide cross-border road transport operators with
information that is both informative and useful for decision making in the course of doing
business. The information is also useful to aspirant cross-border operators, the trading
community and regulatory authorities.
Zambia is a landlocked country in Southern Africa, neighbouring the Democratic Republic of
the Congo to the north, Tanzania to the north-east, Malawi to the east, Mozambique to the
southeast, Zimbabwe and Botswana to the south, Namibia to the southwest and Angola to
the west. The country has an area of 752,618 km², with a population of 17,466,732 people.
The economic structure consists of 5.45% of the primary sector which comprises of crop
farming, livestock rearing and fisheries. The agricultural sector is the backbone of the
Zambian economy as it contributes to the growth of the economy and also to exports, even
though it contributes the least to Gross Domestic Product (GDP). Mining, construction and
manufacturing together make up the majority of the secondary sector at 35.5% and the
tertiary sector is at 59%.
As a landlocked country, Zambia relies on its neighbours for imports and exports to access
seaports. The top six destinations for Zambia’s exports are Switzerland, China, Congo DR,
South Africa, Singapore and the United Arab Emirates and the top five export commodities
were copper and articles thereof; inorganic chemicals; cereals; other base metals, cements,
and articles thereof; and works of art. The top five source countries for imports are South
Africa, DRC, China, UAE and Mauritius and the top five import commodities were: mineral

ii
fuels, oils and products of their distillation; ores, slag and ash; inorganic chemicals; nuclear
reactors and boilers; and fertilisers.
Road transport is the major mode of surface travel in Zambia followed by rail. Zambia uses
tolls to broaden revenue base and for road maintenance. The country aims to construct forty
toll stations by the end of 2018. There are 3 One Stop Border Posts (OSBP) between
Zambia/DRC, Zambia/Tanzania and Zambia/Zimbabwe.
Zambia has achieved impressive economic performance over the past decade due to stable
political system and thriving private sector. This therefore resulted in creation of vast
opportunities for investment in the mining sector for extraction and processing of minerals,
infrastructure sector with various opportunities in the transport, housing and energy sectors.
Other opportunities are in the agriculture, tourism and manufacturing sector.
The following are the opportunities that exist in Zambia for cross-border transport operators
and the trading community:
Transport and Logistics: Opportunities exist with respect to transportation of minerals from
mines to various export destinations especial major ports in the region. This also creates
opportunities for both new and existing companies in the refight logistics industry.
Passenger Transport: Opportunities exist with respect to provision of bus operations as the
volume of passengers travelling by road exceed those carried by other modes. This was also
demonstrated by increase in permits issued. Passenger transport operators also have
opportunities with respect to tourism.
Mining sector: Opportunities exist with respect to extraction and processing of minerals ,
establishment of copper and other mining related industrial parks, copper mining and
beneficiation, especially in setting up copper smelting and refinery facilities, providing mining
support services (in particular, machinery) for the mining sector and joint-ventures with
existing small-scale operators or in green fields investments in gemstone mining and
processing (emeralds, amethyst, aquamarine, tourmaline, garnets and beryl).
Infrastructure sector: Opportunities exist with respect to transport Infrastructure, airports and
related support infrastructure, road transport infrastructure, railways transport infrastructure
and housing and estates infrastructure amongst others.

iii
Energy Infrastructure: Opportunities exist with respect to electricity generation and
transmission, refineries, storage facilities and pipelines for petroleum and gas and renewable
energy facilities.
Agriculture sector: Opportunities exist with respect to livestock production, development of
textile production facilities, livestock breeding, agro processing and fisheries.
Tourism sector: Opportunities exist with respect to redevelopment of the existing
infrastructure facilities and international tourism services. Zambia is well connected with the
rest of the regional countries.
Manufacturing sector: Opportunities exist with respect to minerals processing, chemical
products, engineering and metal works, packaging materials, food processing and the
textiles.
1
1. INTRODUCTION AND BACKGROUND
1.1 Introduction The aim of this Country Profile Report (Report) is to provide a consolidated platform for the
dissemination of information that is useful to key stakeholders in the cross-border
environment, particularly cross-border road transport operators, regulatory authorities and
trading parties. The information articulated in this Report can be used to support informed
decision making and identification of opportunities by operators and traders in respect of the
Zambian segment of the cross border industry.
The Report also provides up to date information about Zambia focusing on the road
transport environment, requirements for undertaking cross-border road transportation,
corridor developments, road transport projects currently taking place in Zambia and the
business environment specifically focusing on the ease of doing business. The objectives of
the Report are to:
Provide relevant information that can be used by cross-border road transport
operators in conducting their business;
Help transport operators to understand better the countries that they do business in;
Assist relevant stakeholders to know and understand the requirements of doing
business in Zambia; and
Provide information with respect to possible opportunities for South African cross-
border road transport operators and prospective investors.
A qualitative approach was adopted through secondary research that relied on relevant
publications, internet based resources and references. Planned semi-structured interviews
and engagements with relevant departments in Zambia could not materialise due to
International Relations not securing the meetings.
The Report is structured as follows:
Chapter 1: Introduction and background;
Chapter 2: The overview of Zambia;
Chapter 3: The economic outlook looking at recent economic developments -
summarises the data of imports and exports between South Africa and Zambia,
documents required for trade and an assessment of the ease and cost of doing
business;
Chapter 4: The road transport environment;

2
Chapter 5: Passenger transport; and
Chapter 6: Opportunities in Zambia
1.2 Background The C-BRTA is a regulatory authority founded in terms of the Cross-Border Road Transport
Act No 4 of 1998 (C-BRT Act), as amended, for the purpose of facilitating unimpeded
movement of persons and goods between South Africa and neighbouring countries in the
region. The core mandate of the Agency is to:
Improve the unimpeded flow of freight and passengers in the region;
Introduce regulated competition in respect of cross-border passenger road transport;
Reduce operational constraints for the cross-border road transport industry as a
whole;
Liberalise market access progressively in respect of cross-border freight road
transport;
Enhance and strengthen the capacity of the public sector in support of its strategic
planning, enabling and monitoring functions; and
Empower the cross-border road transport industry to maximise business
opportunities and to incrementally regulate themselves to improve safety, security,
reliability, quality and efficiency of services.
The four core functions of the C-BRTA are: regulatory, facilitation, advisory and law
enforcement. The Agency has therefore compiled this Report in pursuit of its mandate to
provide advice and up to date information to the Minister of Transport, road transport
industry and relevant stakeholders in the cross-border value chain.
Additionally, there are other instruments that also provide the broader context of the
mandate and functions of the Agency and these include the:
SADC Protocol on Transport, Communications and Meteorology (PTCM);
Memorandum of Understanding on Road Transportation in the Common Customs
Area pursuant to the Customs Union Agreement between the Governments of
Botswana, Lesotho, South Africa and Swaziland (SACU MoU);
Memorandum of Understanding on the development and management of the Trans-
Kalahari Corridor; and
Bilateral Road Transport Agreements between South Africa and Malawi,
Mozambique, Zambia and Zimbabwe.
3
The development of this Country Profile Report is therefore aligned to the mandate of the
Agency and the overall goals of enhancing opportunities for cross-border road transport
operators and ensuring that cross-border road transportation between Zambia and South
Africa is conducted in a seamless way through providing relevant information.
4
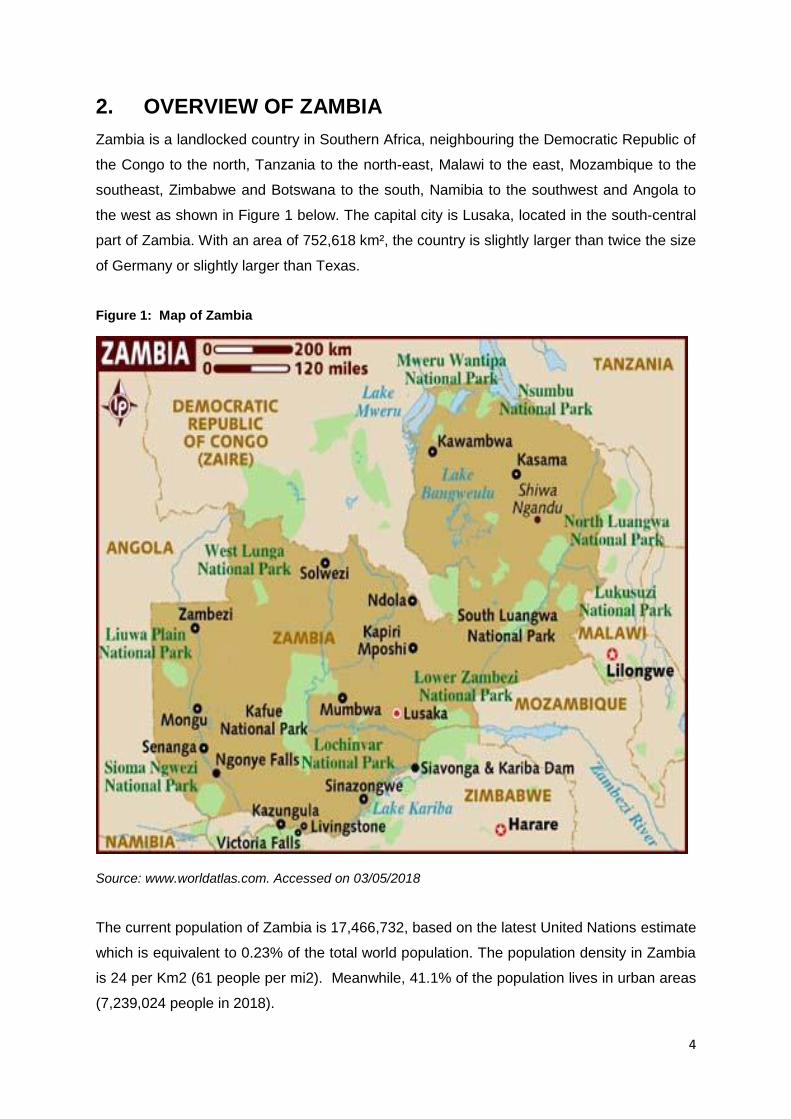
2. OVERVIEW OF ZAMBIA
Zambia is a landlocked country in Southern Africa, neighbouring the Democratic Republic of
the Congo to the north, Tanzania to the north-east, Malawi to the east, Mozambique to the
southeast, Zimbabwe and Botswana to the south, Namibia to the southwest and Angola to
the west as shown in Figure 1 below. The capital city is Lusaka, located in the south-central
part of Zambia. With an area of 752,618 km², the country is slightly larger than twice the size
of Germany or slightly larger than Texas.
Figure 1: Map of Zambia
Source: www.worldatlas.com. Accessed on 03/05/2018
The current population of Zambia is 17,466,732, based on the latest United Nations estimate
which is equivalent to 0.23% of the total world population. The population density in Zambia
is 24 per Km2 (61 people per mi2). Meanwhile, 41.1% of the population lives in urban areas
(7,239,024 people in 2018).
5
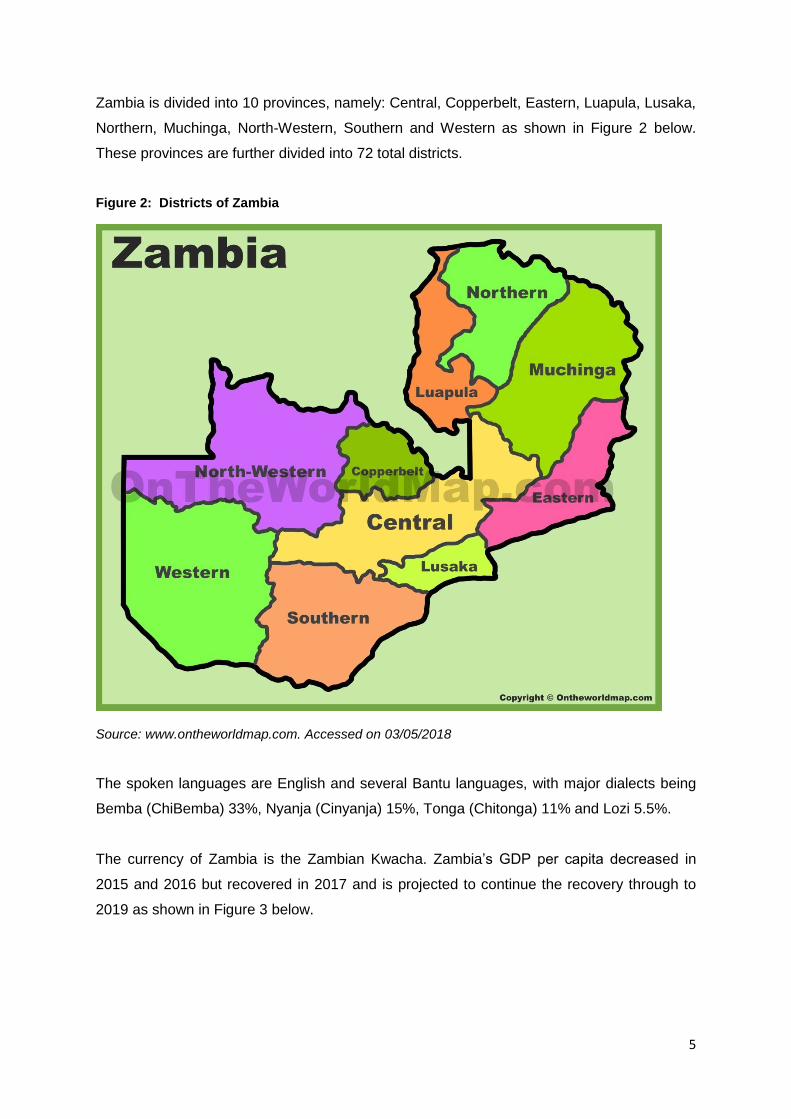
Zambia is divided into 10 provinces, namely: Central, Copperbelt, Eastern, Luapula, Lusaka,
Northern, Muchinga, North-Western, Southern and Western as shown in Figure 2 below.
These provinces are further divided into 72 total districts.
Figure 2: Districts of Zambia
Source: www.ontheworldmap.com. Accessed on 03/05/2018
The spoken languages are English and several Bantu languages, with major dialects being
Bemba (ChiBemba) 33%, Nyanja (Cinyanja) 15%, Tonga (Chitonga) 11% and Lozi 5.5%.
The currency of Zambia is the Zambian Kwacha. Zambia’s GDP per capita decreased in
2015 and 2016 but recovered in 2017 and is projected to continue the recovery through to
2019 as shown in Figure 3 below.

6
Figure 3: Zambia GDP per capita
Source:https://www.statista.com/statistics/457693/gross-domestic-product-gdp-per-capita-in-zambia;
Accessed on 03/05/2018
* projected
Zambia is a low middle-income country which experienced robust economic growth during
the commodity boom averaging 7.4% (2004-2014) but the economy came under strain and
growth slowed to less than 3% in 2015. The economy stabilised in 2017 with an increase of
18% in GDP per capita compared to 2016, the positive trend is forecasted to continue
through to 2019.
17251840
1727
13101257
14841538 1542
0
200
400
600
800
1000
1200
1400
1600
1800
2000
2012 2013 2014 2015 2016 2017 2018* 2019*
GDP PER CAPITA (US$)

7
3. ECONOMIC OUTLOOK
3.1 Economy
For more than a decade (2000-2014), the country attained macroeconomic stability and
achieved impressive real growth averaging 6.7% per annum and lifting Zambia above the
threshold of lower middle income countries. However, growth slowed during the period 2015
to 2017, due to falling copper prices, reduced power generation, and depreciation of the
Kwacha. Zambia’s lack of economic diversification and dependency on copper as its sole
major export makes it vulnerable to fluctuations in the world commodities market. This is
exemplified by the downward turn in prices for commodities in 2015 due to declining demand
from China which culminated in Zambia being overtaken by the Democratic Republic of
Congo as Africa’s largest copper producer.
Zambia weathered two years of below-average rainfall in the agriculture seasons of 2015
and 2016. The two dry periods affected the regeneration of key hydropower reservoirs,
which lost about 50% of their generation capacity, leading to significant load shedding.
Combined with low copper prices, economic activity declined to its lowest in more than a
decade, reaching 2.9% GDP growth in 2015 but rebounded to 3.4% in 2016. Good rains in
2017 increased agricultural production and ended load shedding. Growth is projected to
exceed 4% in the medium term, aided by rising global demand for copper that boosted
prices by more than 16% this year.
Figure 4 below shows the performance of Zambia’s economy between 2012 through to the
projected rates of 2018 and 2019.

8
Figure 4: GDP Growth Rate
Source: AfDB, Statistics Department AEO. Accessed on 04/05/2018
Despite recent strong economic growth and its status as a lower middle-income country,
widespread and extreme rural poverty and high unemployment levels remain significant
problems, made worse by a high birth rate, a relatively high HIV/AIDS burden, and by
market-distorting agricultural and energy policies. Zambia has raised $7 billion from
international investors by issuing separate sovereign bonds in 2012, 2014, and 2015,
significantly increasing the country’s public debt burden to 56% of GDP.
Zambia's economy continued to recover in 2017 but, despite a bumper harvest, improved
electricity generation and an easing of monetary policy, growth remained subdued at 3.8%
due to weak performances by the services, mining, and construction sectors. Growth is,
however, forecast to strengthen to 4.5% in 2018 and 4.7% in 2019. Hard hit by lower copper
prices and domestic pressures, including a poor harvest after an El-Nino induced drought in
2015, a power crisis, and political uncertainty in the lead-up to 2016 elections, in 2015 the
economy had tumbled to its lowest since 1998, with growth registering just 2.9%.
In 2018, GDP is projected to remain positive, mainly on account of the anticipated expansion
in mining and manufacturing output. The recovery in electricity generation is also expected
to support increased production. However, despite being positive, growth is projected to
remain below its potential. Preliminary data indicate that growth in 2018 may be lower than
the projected 5% in the 2018 Budget, largely reflecting the impact of adverse weather
7.3%
5.1%4.7%
2.9%3.4%
4.0%4.5% 4.7%
0.0%
1.0%
2.0%
3.0%
4.0%
5.0%
6.0%
7.0%
8.0%
2012 2013 2014 2015 2016 2017 2018* 2019*
GDP Growth Rate
9
conditions on the agriculture sector output. Accelerated economic growth will therefore
require concerted efforts from both monetary and fiscal policies. On the fiscal side, there is
need for additional measures to boost growth, particularly in key sectors such as agriculture,
tourism and manufacturing. With inflation within the 6-8% target band, the easing of
monetary policy is expected to support credit growth and aggregate demand.
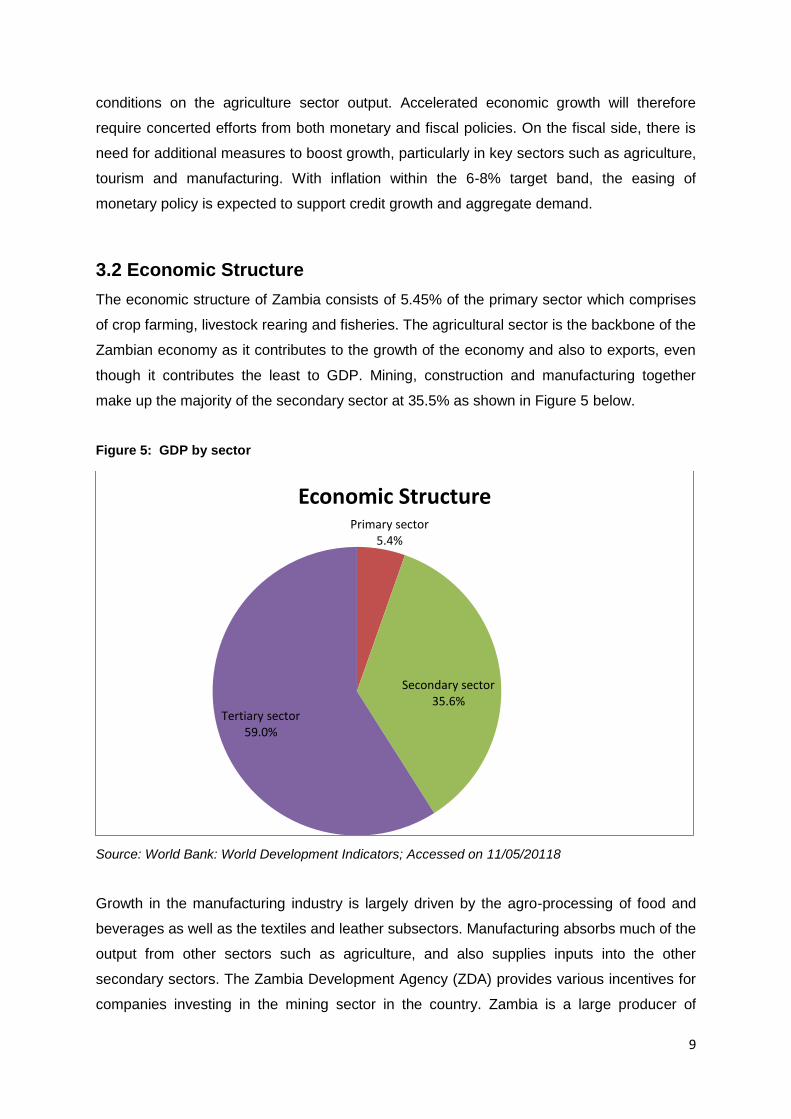
3.2 Economic Structure
The economic structure of Zambia consists of 5.45% of the primary sector which comprises
of crop farming, livestock rearing and fisheries. The agricultural sector is the backbone of the
Zambian economy as it contributes to the growth of the economy and also to exports, even
though it contributes the least to GDP. Mining, construction and manufacturing together
make up the majority of the secondary sector at 35.5% as shown in Figure 5 below.
Figure 5: GDP by sector
Source: World Bank: World Development Indicators; Accessed on 11/05/20118
Growth in the manufacturing industry is largely driven by the agro-processing of food and
beverages as well as the textiles and leather subsectors. Manufacturing absorbs much of the
output from other sectors such as agriculture, and also supplies inputs into the other
secondary sectors. The Zambia Development Agency (ZDA) provides various incentives for
companies investing in the mining sector in the country. Zambia is a large producer of
Primary sector5.4%
Secondary sector35.6%
Tertiary sector59.0%
Economic Structure
10
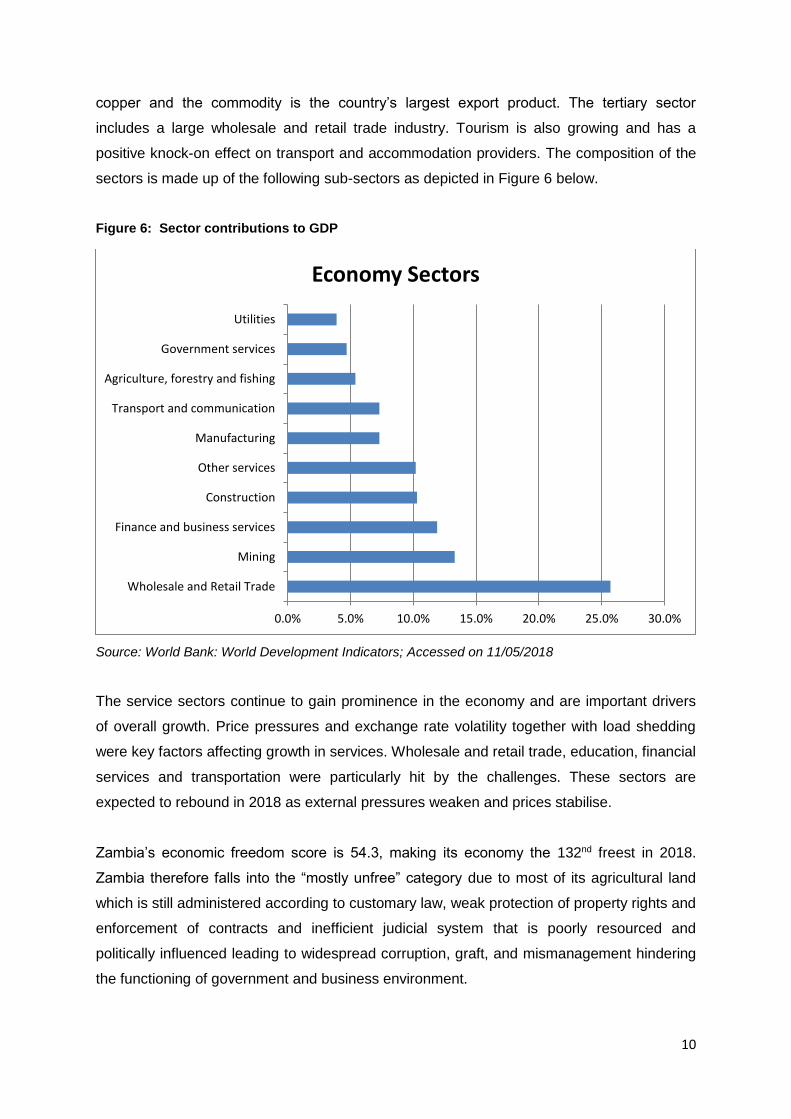
copper and the commodity is the country’s largest export product. The tertiary sector
includes a large wholesale and retail trade industry. Tourism is also growing and has a
positive knock-on effect on transport and accommodation providers. The composition of the
sectors is made up of the following sub-sectors as depicted in Figure 6 below.
Figure 6: Sector contributions to GDP
Source: World Bank: World Development Indicators; Accessed on 11/05/2018
The service sectors continue to gain prominence in the economy and are important drivers
of overall growth. Price pressures and exchange rate volatility together with load shedding
were key factors affecting growth in services. Wholesale and retail trade, education, financial
services and transportation were particularly hit by the challenges. These sectors are
expected to rebound in 2018 as external pressures weaken and prices stabilise.
Zambia’s economic freedom score is 54.3, making its economy the 132nd freest in 2018.
Zambia therefore falls into the “mostly unfree” category due to most of its agricultural land
which is still administered according to customary law, weak protection of property rights and
enforcement of contracts and inefficient judicial system that is poorly resourced and
politically influenced leading to widespread corruption, graft, and mismanagement hindering
the functioning of government and business environment.
0.0% 5.0% 10.0% 15.0% 20.0% 25.0% 30.0%
Wholesale and Retail Trade
Mining
Finance and business services
Construction
Other services
Manufacturing
Transport and communication
Agriculture, forestry and fishing
Government services
Utilities
Economy Sectors
11
Its overall score has decreased by 1.5 points, with a small improvement in business freedom
outweighed by lower scores for the labour freedom, fiscal health, and monetary freedom
indicators.
Although Zambia had one of the world’s fastest growing economies until 2014, slower
growth thereafter has highlighted the need for diversification. To attract investment, the
government plans to use public finances to incentivise the private sector to stimulate value-
added industrialisation by improving power and transport infrastructure. However, the
achievement of this goal might be hampered by lingering institutional shortcomings that
include inefficient legal and regulatory frameworks, weak protection of property rights, and
corruption, all of which continue to undercut prospects for long-term development
3.3 Credit Rating Standard & Poor’s Financial Services (S&P) Global Ratings affirmed Zambia’s long-term
foreign sovereign credit ratings at “B” in August 2017, and changed the outlook on this rating
from negative to stable. The revised outlook is based on an improving macroeconomic
climate which will be supportive of reducing fiscal deficits and the stock of debt. The agency
expects higher copper prices and production to support the local economy. Macroeconomic
stability is also a key downside risk factor for the country’s ratings. Some of the factors that
could individually or collectively result in a deterioration of the rating include weaker copper
prices and lower agricultural production due to drought.
Moody's Investors Services rated Zambia with a “B3” government bond rating with a
negative outlook in May 2017 as shown in Table 1 below. A month later, the agency
commented that the suspension of 48 opposition members of parliament for 30 days “point
to a gradual institutional weakening”. Moody’s warned that the suspensions “raise the risk of
domestic political turmoil” that will discourage foreign financiers from supporting a wide
range of on-going development projects in the country. This is concerning considering that,
historically, Zambia has been recognised “as a beacon of democracy in Sub-Saharan
Africa”, and that the country’s “previous overall political stability was a relative credit
strength” in Moody’s credit assessment.
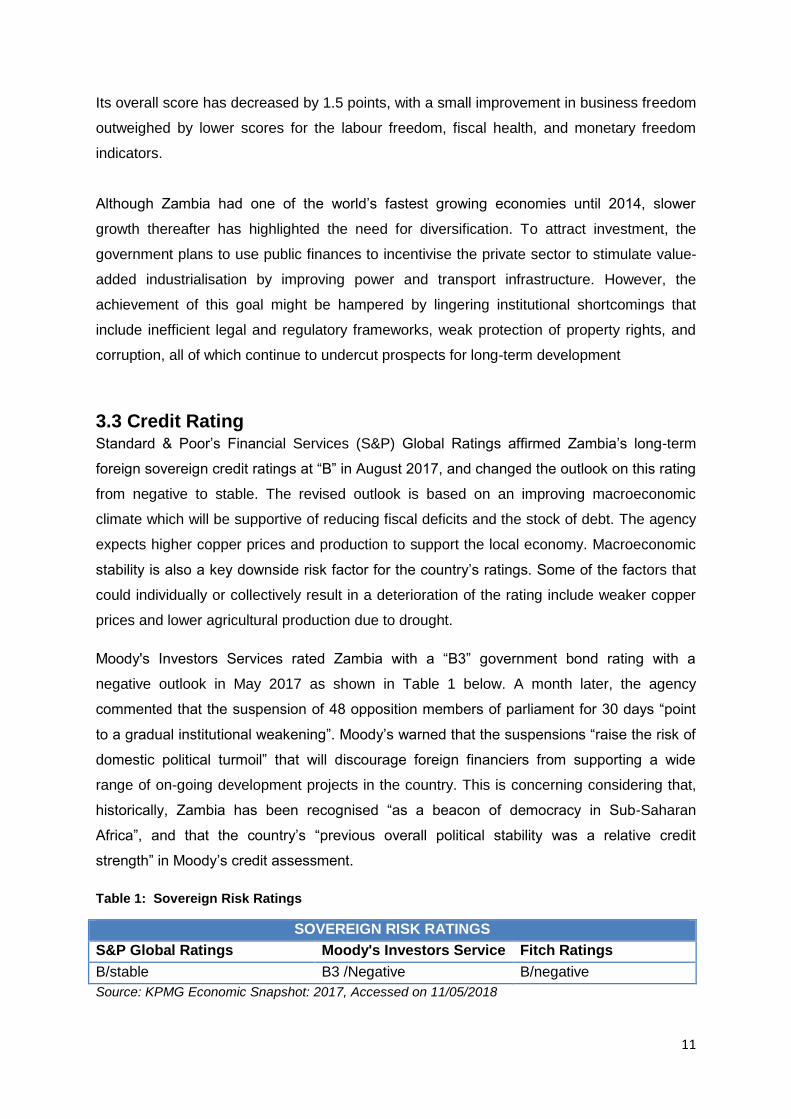
Table 1: Sovereign Risk Ratings
SOVEREIGN RISK RATINGS
S&P Global Ratings Moody's Investors Service Fitch Ratings
B/stable B3 /Negative B/negative
Source: KPMG Economic Snapshot: 2017, Accessed on 11/05/2018

12
Fitch Ratings affirmed Zambia’s long-term foreign Issuer Default Ratings (IDR) at “B” with a
negative outlook in February 2017. The agency affixed the negative outlook a year earlier
due to a combination of falling copper revenue and slowing economic growth leading to
persistent and large fiscal deficits as well as a doubling of government debt since 2012. In
February 2017, Fitch commented that the doubling in the government debt ratio over the
past five years was a product of this fiscal situation. It also noted an improved outlook for
fiscal and debt dynamics if the country was able to agree with the IMF on a support
programme.
Lusaka had been in discussions with the multilateral organisation since early 2016 and Fitch
expected an agreement during the first half of 2017. However, progress has been slow. In
July, the rating agency commented that and IMF programme is key to underpinning the
current rating.
3.4 Monetary Policy Loose fiscal policy since 2013 led to a gradual tightening of monetary policy in order to
maintain inflation at single digit levels, while limiting excessive exchange rate volatility.
Monetary policy was thus substantially tightened in 2015 to limit rising inflation which
exceeded 22% in February 2016. This was largely due to pass-through price effects from the
sharp depreciation of the kwacha. At its lowest in November 2015, the exchange rate
averaged 12.2 kwacha to the US dollar, up from 6.4 in November 2014. As of April 2016 the
exchange rate stabilised around 10 Kwacha to the US dollar. This helped stabilise monthly
inflation between 0.1 and 0.3% from the second quarter of 2016. The current low monthly
inflation of 0.4% is consistent with single digit annual inflation in the medium term.
The main instruments applied by the Bank of Zambia in 2016 in order to reduce liquidity in
the market and limit speculative exchange rate behaviour were to: increase the monetary
policy rate from 12.5% to 15.5%; increase the commercial bank reserve requirements from
14 to 18%, and increase the overnight lending facility rate by 10% to 25.5%. Further, to
stabilise the exchange rate, the central bank used its foreign reserves to stabilise the
exchange rate reducing reserves to USD 2.2 billion in October 2016 from USD 3.9 billion in
July 2015.
Although the policies implemented by the central bank have been effective, these have
come at a cost to domestic credit expansion and higher interest rates on lending. At the
13
same time the governments need for budget funding have crowded out domestic private
borrowing for investment.
Credit contracted by 6% between September 2016 and September 2015, compared to
expansion of 35% between September 2015 and September 2014, while average lending
rates reached 28.9% in September 2016 from 20.8% a year earlier. At the same time
treasury bills and bonds in December 2016 yielded between 20% and 25% depending on
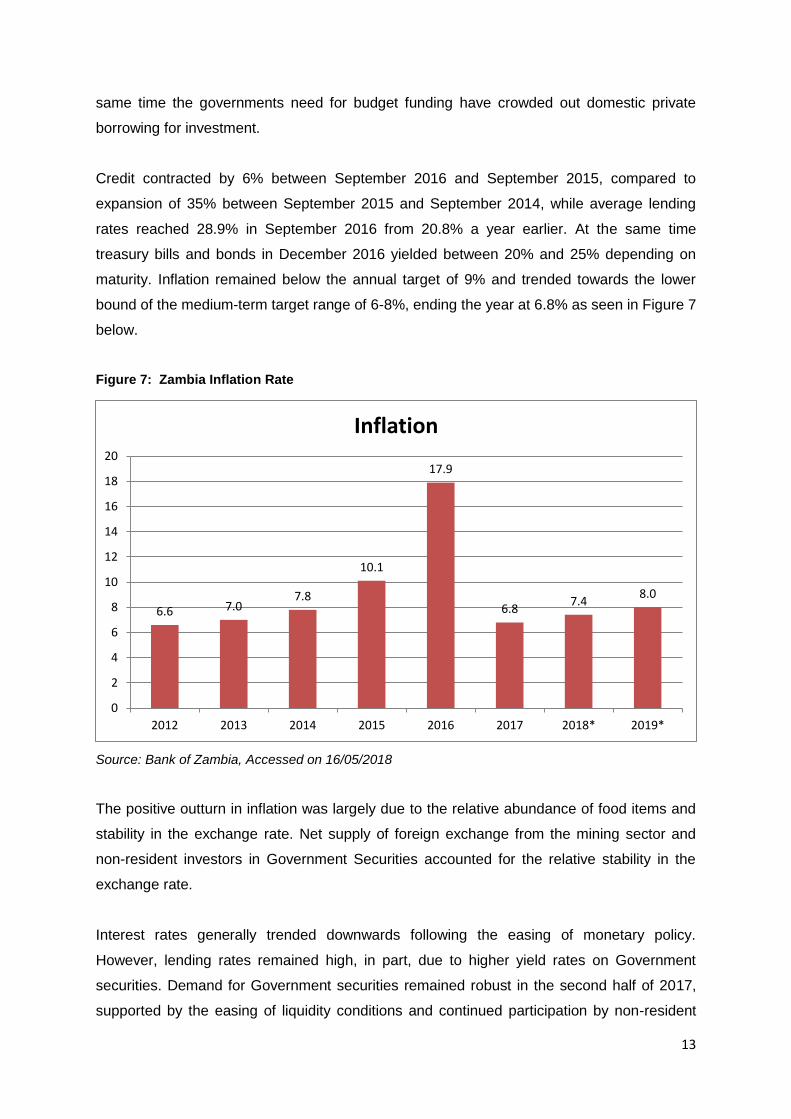
maturity. Inflation remained below the annual target of 9% and trended towards the lower
bound of the medium-term target range of 6-8%, ending the year at 6.8% as seen in Figure 7
below.
Figure 7: Zambia Inflation Rate
Source: Bank of Zambia, Accessed on 16/05/2018
The positive outturn in inflation was largely due to the relative abundance of food items and
stability in the exchange rate. Net supply of foreign exchange from the mining sector and
non-resident investors in Government Securities accounted for the relative stability in the
exchange rate.
Interest rates generally trended downwards following the easing of monetary policy.
However, lending rates remained high, in part, due to higher yield rates on Government
securities. Demand for Government securities remained robust in the second half of 2017,
supported by the easing of liquidity conditions and continued participation by non-resident
6.6 7.07.8
10.1
17.9
6.87.4
8.0
0
2
4
6
8
10
12
14
16
18
20
2012 2013 2014 2015 2016 2017 2018* 2019*
Inflation
14
investors, relatively high yields, and stability in inflation. Domestic credit growth was positive
but remained below historical averages. On the other hand, credit to the private sector
picked up as economic activity continued to recover and lending rates declined.
In the first half of 2018, inflation in Zambia is projected to average 6.4%, well within the
target range of 6-8%. Underlying this low inflation projection is mainly the relative stability in
the exchange rate of the Kwacha against the US dollar, supported by higher copper prices.
In addition, the steady supply of food items and the constraint in Government spending, in
line with the 2018 Budget, underlie the favourable inflation outlook. However, upside risks to
the inflation outlook include projected higher crude oil prices and potentially lower
agricultural output due to poor distribution of rainfall in the southern part of the country.
Notwithstanding these upside risks, inflation is projected to remain well anchored.
3.5 Trade Environment
Zambia is a landlocked country and therefore depends on its neighbours for seaborne trade
(exports and imports to access seaports). This requires a high level of co-operation and co-
ordination to ensure that movement of goods and services across borders is as efficient as
possible.
In 2016 Zambia exported $10.5 billion worth of goods/ commodities, making it the 107th
largest exporter in the world. During the last five years the exports of Zambia have increased
at an annualized rate of 16.6%, from $12.9 billion in 2011 to $10.5 billion in 2016. The most
recent exports are led by raw copper which represent 25.7% of the total exports of Zambia,
followed by refined copper, which account for 14%.
In 2016 Zambia imported $8.09 billion worth of goods/ commodities, making it the 143rd
largest importer in the world. During the last five years the imports of Zambia have increased
at an annualized rate of 16.6%, from $7.27 billion in 2011 to $8.09 billion in 2016. The most
recent imports are led by refined petroleum which represents 2.05% of the total imports of
Zambia, followed by Other Cast Iron Products, which account for 1.92%.
In the fourth quarter of 2017, Zambia’s total trade (exports and imports) increased to
US$4.84 billion from US$3.98 billion in the corresponding period in 2016. The improvement
in trade was on account of an increase in both export and import performance. Exports
rebounded due to higher copper exports and non-traditional exports such as:
Inorganic chemicals;
15
Cereals;
Other base metals,
Cements, and articles thereof; and
Works of art.
Imports also recovered largely on account of higher imports of mineral fuels, oils and
products of their distillation; ores, slag and ash; inorganic chemicals; nuclear reactors and
boilers; and fertilisers. Switzerland remained the top major destination for Zambia’s exports
and South Africa is the top major source for Zambia’s imports.
3.5.1 Major Destinations for Exports
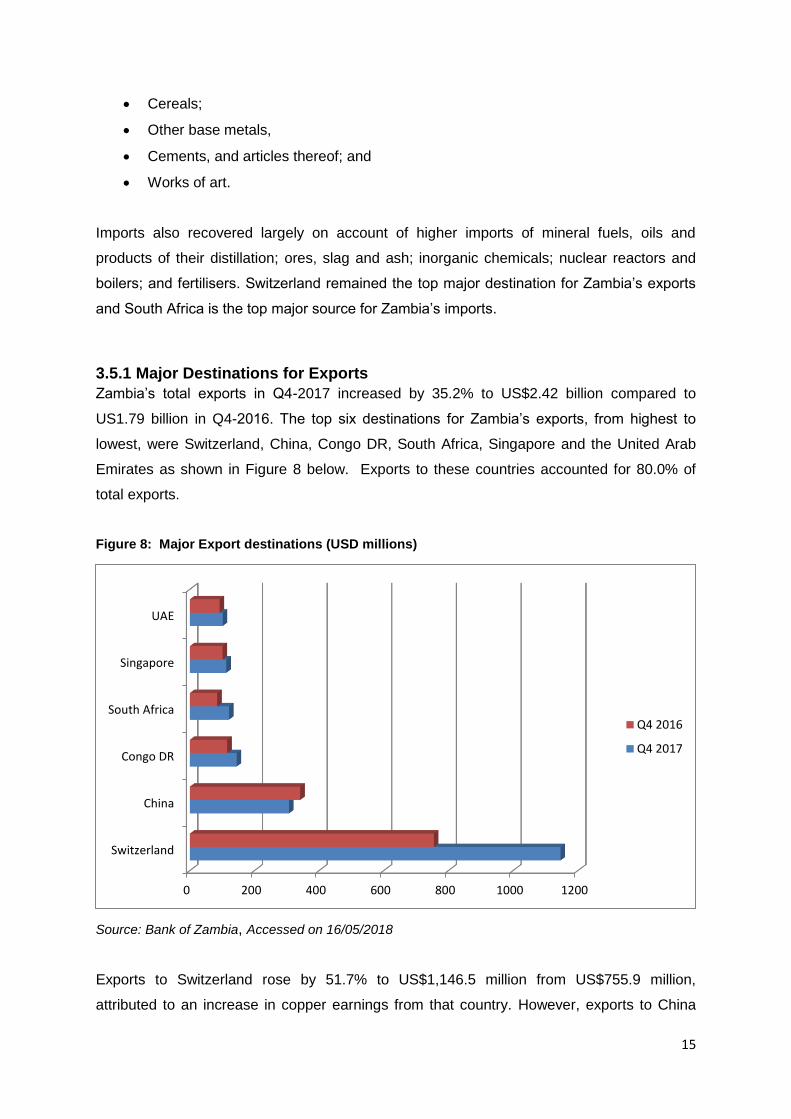
Zambia’s total exports in Q4-2017 increased by 35.2% to US$2.42 billion compared to
US1.79 billion in Q4-2016. The top six destinations for Zambia’s exports, from highest to
lowest, were Switzerland, China, Congo DR, South Africa, Singapore and the United Arab
Emirates as shown in Figure 8 below. Exports to these countries accounted for 80.0% of
total exports.
Figure 8: Major Export destinations (USD millions)
Source: Bank of Zambia, Accessed on 16/05/2018
Exports to Switzerland rose by 51.7% to US$1,146.5 million from US$755.9 million,
attributed to an increase in copper earnings from that country. However, exports to China
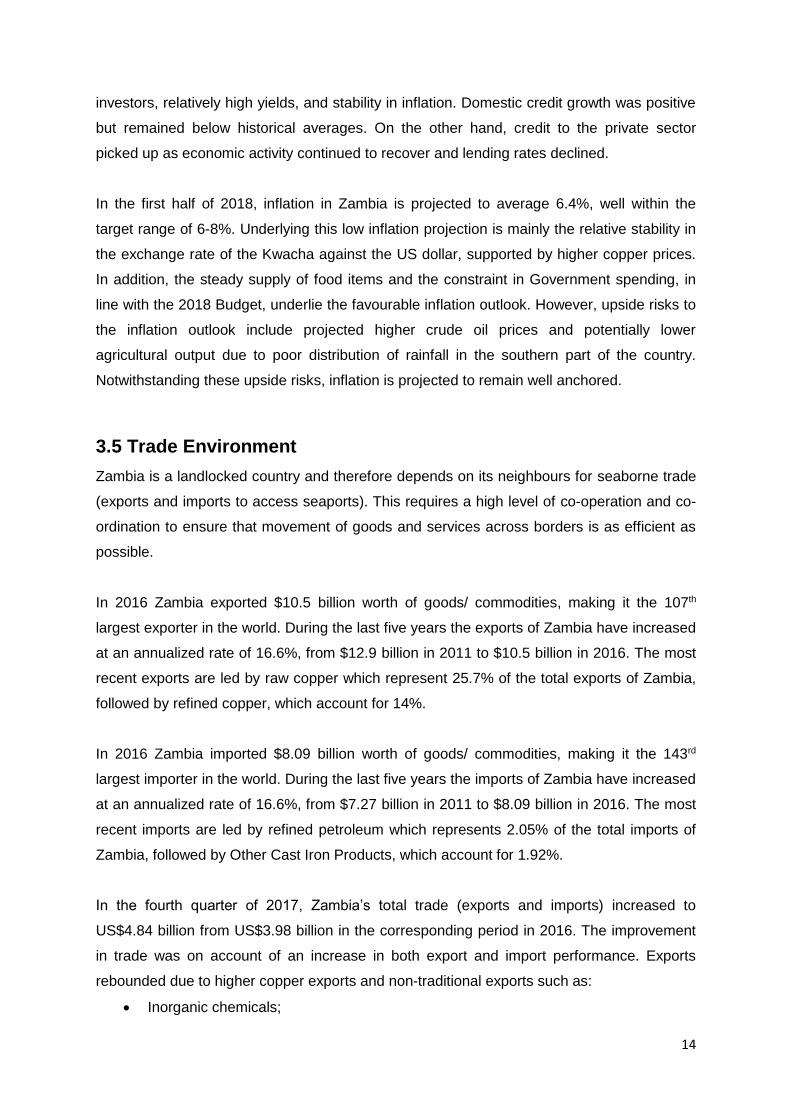
0 200 400 600 800 1000 1200
Switzerland
China
Congo DR
South Africa
Singapore
UAE
Q4 2016
Q4 2017
16
reduced by 10.2% to US$306.9 million from US$341.6 million mainly on account of a
reduction in exports of copper and articles thereof. Further, exports to South Africa rose by
43.1% to US$121.1 million from US$84.6 million on account of an increase in exports of
inorganic chemicals; pearls, precious stones and metals; nuclear reactors and residues and
waste from the food industry.
Exports to Congo (DR) recorded a 25.8% increase to US$145.0 million from US$115.3
million on account of a rise in exports of inorganic chemicals; sugars and sugar
confectionery and small incremental increases in various NTE commodities such as soap,
beverages, explosives, organic chemicals and cereals and cereal products. Exports to
Singapore rose by 11.4% to US$112.6 million from US$101.0 million on account of an
increase in exports of articles of art. In addition, exports to the United Arab Emirates
increased by 10.6% to US$101.6 million from US$91.9 million mainly on account of a rise in
exports of copper and articles thereof.
The top five export commodities were copper and articles thereof; inorganic chemicals;
cereals; other base metals, cements, and articles thereof; and works of art. The country
earned US$1.37 billion from copper exports compared to US$1.04 billion in the
corresponding quarter in 2016.
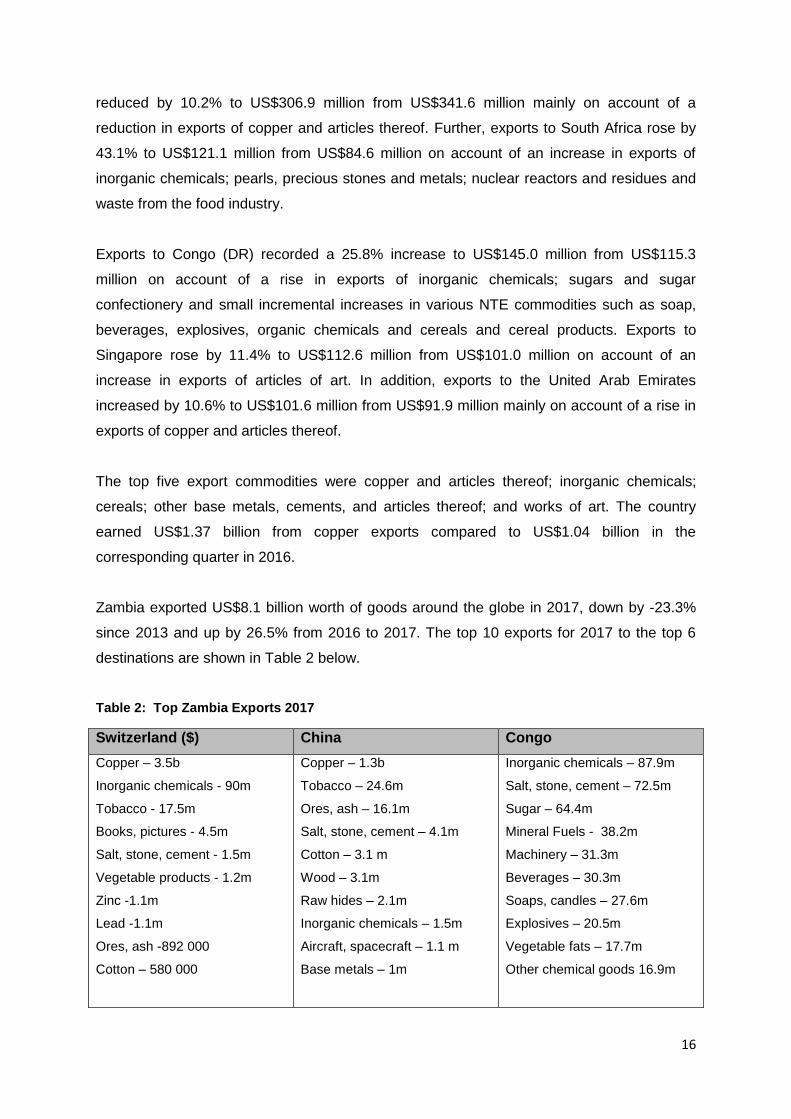
Zambia exported US$8.1 billion worth of goods around the globe in 2017, down by -23.3%
since 2013 and up by 26.5% from 2016 to 2017. The top 10 exports for 2017 to the top 6
destinations are shown in Table 2 below.
Table 2: Top Zambia Exports 2017
Switzerland ($) China Congo
Copper – 3.5b
Inorganic chemicals - 90m
Tobacco - 17.5m
Books, pictures - 4.5m
Salt, stone, cement - 1.5m
Vegetable products - 1.2m
Zinc -1.1m
Lead -1.1m
Ores, ash -892 000
Cotton – 580 000
Copper – 1.3b
Tobacco – 24.6m
Ores, ash – 16.1m
Salt, stone, cement – 4.1m
Cotton – 3.1 m
Wood – 3.1m
Raw hides – 2.1m
Inorganic chemicals – 1.5m
Aircraft, spacecraft – 1.1 m
Base metals – 1m
Inorganic chemicals – 87.9m
Salt, stone, cement – 72.5m
Sugar – 64.4m
Mineral Fuels - 38.2m
Machinery – 31.3m
Beverages – 30.3m
Soaps, candles – 27.6m
Explosives – 20.5m
Vegetable fats – 17.7m
Other chemical goods 16.9m
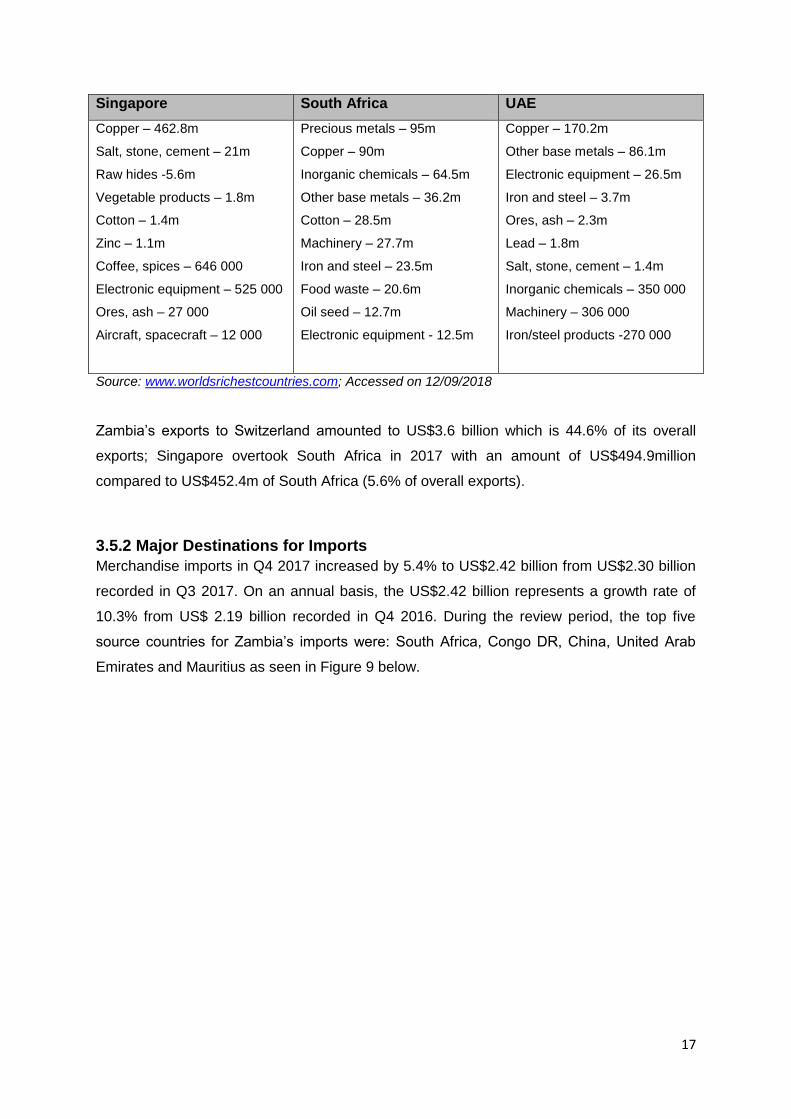
17
Singapore South Africa UAE
Copper – 462.8m
Salt, stone, cement – 21m
Raw hides -5.6m
Vegetable products – 1.8m
Cotton – 1.4m
Zinc – 1.1m
Coffee, spices – 646 000
Electronic equipment – 525 000
Ores, ash – 27 000
Aircraft, spacecraft – 12 000
Precious metals – 95m
Copper – 90m
Inorganic chemicals – 64.5m
Other base metals – 36.2m
Cotton – 28.5m
Machinery – 27.7m
Iron and steel – 23.5m
Food waste – 20.6m
Oil seed – 12.7m
Electronic equipment - 12.5m
Copper – 170.2m
Other base metals – 86.1m
Electronic equipment – 26.5m
Iron and steel – 3.7m
Ores, ash – 2.3m
Lead – 1.8m
Salt, stone, cement – 1.4m
Inorganic chemicals – 350 000
Machinery – 306 000
Iron/steel products -270 000
Source: www.worldsrichestcountries.com; Accessed on 12/09/2018
Zambia’s exports to Switzerland amounted to US$3.6 billion which is 44.6% of its overall
exports; Singapore overtook South Africa in 2017 with an amount of US$494.9million
compared to US$452.4m of South Africa (5.6% of overall exports).
3.5.2 Major Destinations for Imports
Merchandise imports in Q4 2017 increased by 5.4% to US$2.42 billion from US$2.30 billion
recorded in Q3 2017. On an annual basis, the US$2.42 billion represents a growth rate of
10.3% from US$ 2.19 billion recorded in Q4 2016. During the review period, the top five
source countries for Zambia’s imports were: South Africa, Congo DR, China, United Arab
Emirates and Mauritius as seen in Figure 9 below.

18
Figure 9: Top Source Countries for Imports (USD millions)
Source: Bank of Zambia, Accessed on 16/05/2018
Imports from South Africa reduced by 12.0% to US$641.4 million from US$728.7 million
mainly on account of a decrease in imports of mineral fuels, oils and products of their
distillation; vehicles; fertilisers; electrical machinery and parts thereof; and salt, Sulphur,
plastering material, lime and cement.
An increase of 69.7% in imports from Congo DR was recorded to US$592.5 million from
US$349.1 million mainly on account of an increase in imports of inorganic chemicals; ores,
slag and ash; and copper and articles thereof. Imports from China also rose by 53.2% to
US$242.4 million from US$158.2 million on account of a rise in imports of articles of iron and
steel; electrical machinery and parts thereof; and vehicles, parts and accessories thereof.
Imports from the United Arab Emirates increased by 20.3% to US$127.8 million from
US$106.3 million due to a rise in mineral fuels, oils and products of their distillation;
inorganic chemicals; and fertilisers.
Imports from Mauritius also increased by 89.2% to US$101.7 million from US$53.8 million
mainly attributed to a rise in imports of mineral fuels, oils and products of their distillation;
and fertilisers from that country. The rise in the importation of mineral fuels is consistent with
the general uptick in economic activity as they are used as a raw material in a number of
industries. The rise in fertilisers is due to seasonal factors.
0 100 200 300 400 500 600 700 800
South Africa
Congo DR
China
UAE
Mauritius
India
Q4 2016
Q4 2017
19
Zambia’s top five import commodities were: mineral fuels, oils and products of their
distillation (US$318.1 million); ores, slag and ash (US$316.3 million); inorganic chemicals
(US$293.2 million); nuclear reactors and boilers (US$266.5 million); and fertilisers
(US$172.5 million).
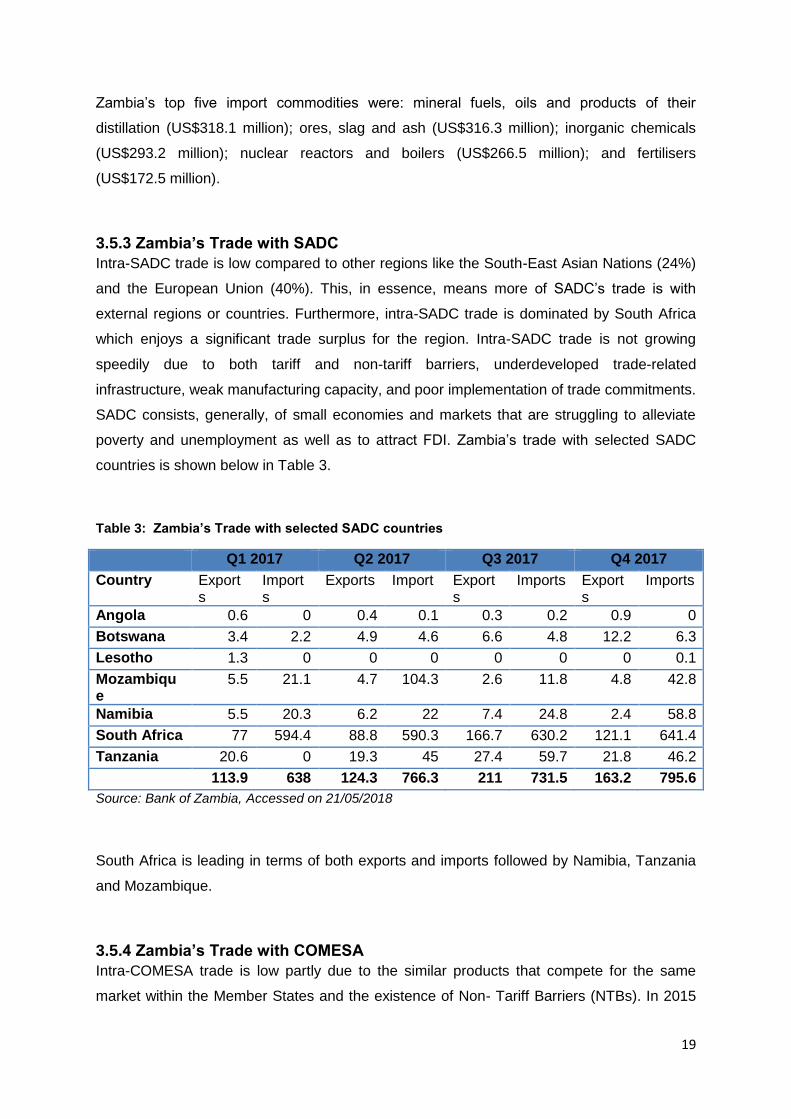
3.5.3 Zambia’s Trade with SADC
Intra-SADC trade is low compared to other regions like the South-East Asian Nations (24%)
and the European Union (40%). This, in essence, means more of SADC’s trade is with
external regions or countries. Furthermore, intra-SADC trade is dominated by South Africa
which enjoys a significant trade surplus for the region. Intra-SADC trade is not growing
speedily due to both tariff and non-tariff barriers, underdeveloped trade-related
infrastructure, weak manufacturing capacity, and poor implementation of trade commitments.
SADC consists, generally, of small economies and markets that are struggling to alleviate
poverty and unemployment as well as to attract FDI. Zambia’s trade with selected SADC
countries is shown below in Table 3.
Table 3: Zambia’s Trade with selected SADC countries
Q1 2017 Q2 2017 Q3 2017 Q4 2017
Country Exports
Imports
Exports Import Exports
Imports Exports
Imports
Angola 0.6 0 0.4 0.1 0.3 0.2 0.9 0
Botswana 3.4 2.2 4.9 4.6 6.6 4.8 12.2 6.3
Lesotho 1.3 0 0 0 0 0 0 0.1
Mozambique
5.5 21.1 4.7 104.3 2.6 11.8 4.8 42.8
Namibia 5.5 20.3 6.2 22 7.4 24.8 2.4 58.8
South Africa 77 594.4 88.8 590.3 166.7 630.2 121.1 641.4
Tanzania 20.6 0 19.3 45 27.4 59.7 21.8 46.2
113.9 638 124.3 766.3 211 731.5 163.2 795.6
Source: Bank of Zambia, Accessed on 21/05/2018
South Africa is leading in terms of both exports and imports followed by Namibia, Tanzania
and Mozambique.
3.5.4 Zambia’s Trade with COMESA
Intra-COMESA trade is low partly due to the similar products that compete for the same
market within the Member States and the existence of Non- Tariff Barriers (NTBs). In 2015

20
the top five countries in the COMESA trading bloc that registered the biggest share of intra
export market were Egypt, Kenya, Zambia, DR Congo and Uganda. Egypt and Kenya
registered the biggest share of Intra-COMESA export market with 22 and 17 percent share
respectively. Zambia, DR Congo and Uganda followed with 13 percent, 12 percent and 11
percent respectively.
With regard intra-COMESA import market share, Zambia registered the biggest share
followed by DR Congo, Sudan, Uganda, Libya, Kenya and Egypt. Zambia’s intra-COMESA
imports were mainly copper ores and concentrates and Cobalt oxides and hydroxides from
Congo DR. Copper ores and concentrates were the most exported products in value terms
in the region from 2011 to 2015 followed by black tea. Cobalt oxides and hydroxides
products minerals also performed relatively well in 2015 taking the third slot from the 71
position in 2014. Zambia’s total trade with COMESA for 2017 is shown below in Table 3.
Table 4: Zambia’s Trade with COMESA
Q1 2017 Q2 2017 Q3 2017 Q4 2017
Country Exports Imports Exports Import Exports Imports Exports Imports
Burundi 4.5 0 6.5 0 6.4 0 7 0
Comoros 0 0.1 0 0 0 0 0 0
Djibouti 0 0 0 0 0 0 0 0
Egypt 0 3.4 0 2.6 0 3.3 0 4.4
Eritrea 0 0 0 0 0 0 0 0
Ethiopia 0 0.1 0 0 0 0 1.7 0
Kenya 8.1 7.1 24.5 8 17.4 9.6 22.5 10.8
Libya 10.4 0.7 0 0 0 0 0 0
Rwanda 7.1 0 8.2 0 8.9 0 9.5 0
Sudan 0 0 0 0 0 0 0.6 0
Uganda 0.8 0 1.4 0.2 1.6 0.5 1.2 2.6
30.9 11.4 40.6 10.8 34.3 13.4 42.5 17.8
Source: Bank of Zambia, Accessed on 21/05/2018

21
3.5.5 Document requirements for importation and exportation
3.5.5.1 Importation
In order to clear goods through Customs, an importer must present the usual commercial
documents such as bill of lading, airway bill and commercial invoice. The Import Declaration
Form is used for statistical purposes, and no fee is required. For goods to be cleared at the
border, the importer fills the Zambia Revenue Authority (ZRA) Form CE 20, the standard
form for entry and exit. Zambia is using the Automated System for Customs Data and
Management (ASYCUDA). Customs clearance can be accomplished within hours, but
incomplete forms and other difficulties, (e.g. lack of supporting documents) can result in
substantial delays.
Zambia applies tariffs on the Cost, Insurance and Freight (C.I.F.) basis. Customs tariffs are
calculated on the basis of the dutiable value, based on the WTO Agreement on Customs
Valuation. Most tariffs are ad valorem (method for charging a duty, fee, or tax according to
the value of goods and services, instead of by a fixed rate, or by weight or quantity) but a
few specific tariffs remain. Zambia uses the international harmonised system. Zambia’s tariff
schedule is structured around four tiers: 0%, 5%, 15% and 25% rates of duty. Virtually all
raw materials and most industrial or productive machinery fall within the 0 and 5 percent
tariff categories, while most imported intermediate goods are subject to 15 percent, and
imported final products are rated at 25 percent. Zambia’s simple average import tariff is
about 14 percent.
3.5.5.2 Exportation
Exporters must complete an export declaration form (standard customs authority form ZRA
CE 20, mainly for statistical purposes. An original commercial invoice and a packaging list
for shipment should accompany the form CE20. An airway bill or bill of lading for
transportation of exports should be obtained either from the freight forwarder or the
transporter being used. Zambia has no export taxes, charges and levies.
If there are preferences that are being claimed in the exporting market (e.g., reduced tariffs),
then an appropriate stamped certificate of origin, from the ZRA is required. COMESA,
SADC, EU and AGOA textiles have different certificates of origin.
A very limited number of goods require a special export permit. Gemstone exports require a
permit from the Ministry of Mines, Energy and Water Development; timber requires a timber
verification certificate from the Forestry Department.
22
3.6 Business Environment
Zambia’s business environment is based on the Global Competitiveness Index (GCI) of the
World Economic Forum, the Legatum Prosperity index and the Ease of Doing Business
Report by the World Bank.
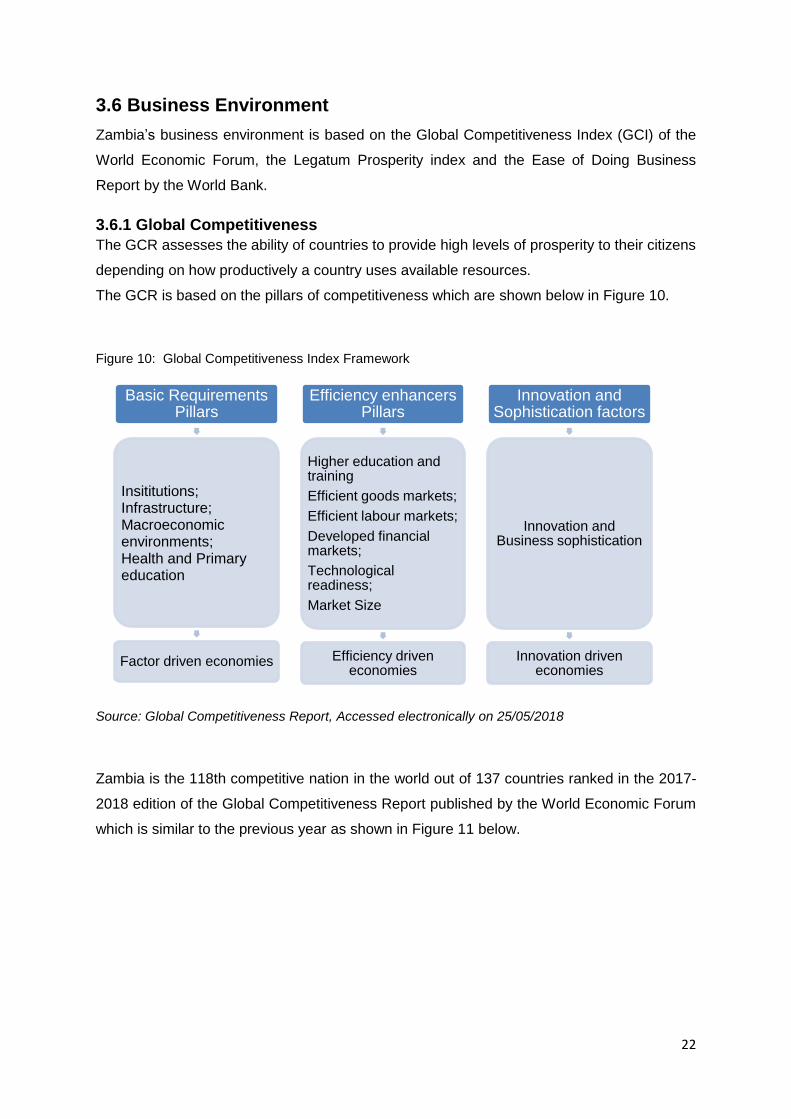
3.6.1 Global Competitiveness
The GCR assesses the ability of countries to provide high levels of prosperity to their citizens
depending on how productively a country uses available resources.
The GCR is based on the pillars of competitiveness which are shown below in Figure 10.
Figure 10: Global Competitiveness Index Framework
Source: Global Competitiveness Report, Accessed electronically on 25/05/2018
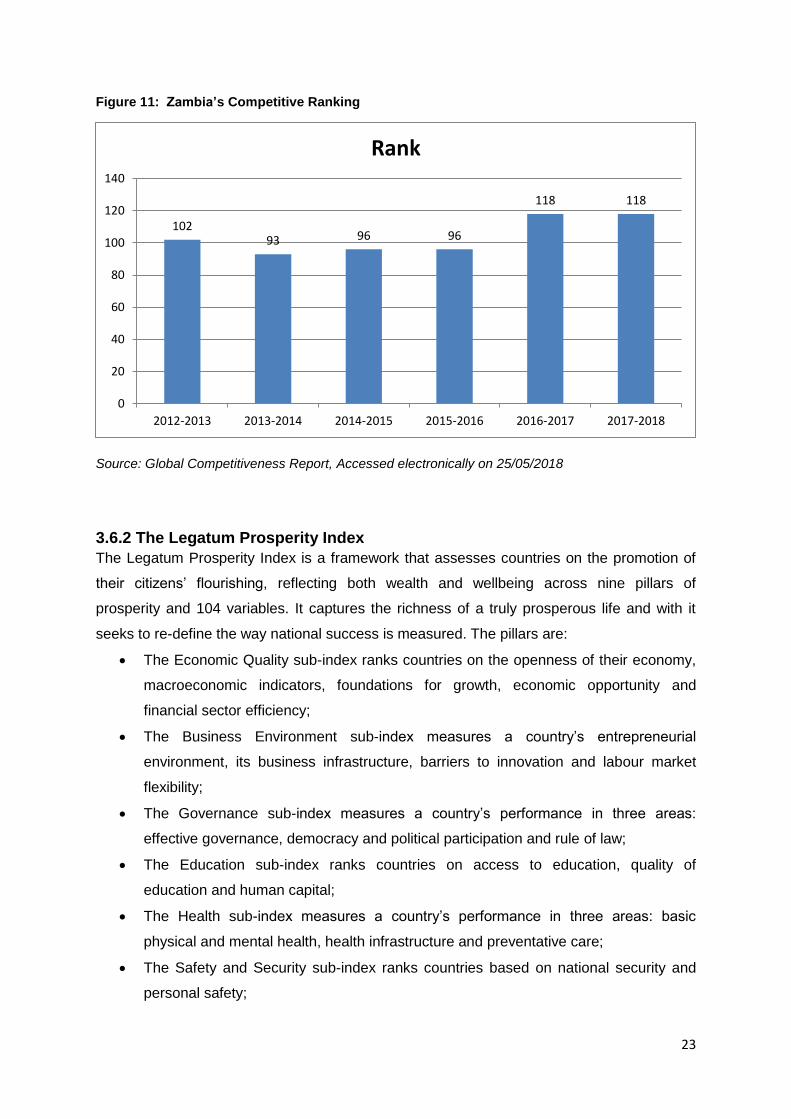
Zambia is the 118th competitive nation in the world out of 137 countries ranked in the 2017-
2018 edition of the Global Competitiveness Report published by the World Economic Forum
which is similar to the previous year as shown in Figure 11 below.
Basic Requirements Pillars
Insititutions; Infrastructure; Macroeconomic environments; Health and Primary education
Factor driven economies
Efficiency enhancers Pillars
Higher education and training
Efficient goods markets;
Efficient labour markets;
Developed financial markets;
Technological readiness;
Market Size
Efficiency driven economies
Innovation and Sophistication factors
Innovation and Business sophistication
Innovation driven economies
23
Figure 11: Zambia’s Competitive Ranking
Source: Global Competitiveness Report, Accessed electronically on 25/05/2018
3.6.2 The Legatum Prosperity Index
The Legatum Prosperity Index is a framework that assesses countries on the promotion of
their citizens’ flourishing, reflecting both wealth and wellbeing across nine pillars of
prosperity and 104 variables. It captures the richness of a truly prosperous life and with it
seeks to re-define the way national success is measured. The pillars are:
The Economic Quality sub-index ranks countries on the openness of their economy,
macroeconomic indicators, foundations for growth, economic opportunity and
financial sector efficiency;
The Business Environment sub-index measures a country’s entrepreneurial
environment, its business infrastructure, barriers to innovation and labour market
flexibility;
The Governance sub-index measures a country’s performance in three areas:
effective governance, democracy and political participation and rule of law;
The Education sub-index ranks countries on access to education, quality of
education and human capital;
The Health sub-index measures a country’s performance in three areas: basic
physical and mental health, health infrastructure and preventative care;
The Safety and Security sub-index ranks countries based on national security and
personal safety;
10293 96 96
118 118
0
20
40
60
80
100
120
140
2012-2013 2013-2014 2014-2015 2015-2016 2016-2017 2017-2018
Rank

24
The Personal Freedom sub-index measures national progress towards basic legal
rights, individual freedoms and social tolerance;
The Social Capital sub-index measures the strength of personal relationships, social
network support, social norms and civic participation in a country; and
The Natural Environment sub-index measures a country’s performance in three
areas: the quality of the natural environment, environmental pressures and
preservation efforts
Africa’s prosperity is growing yet still below world average and the gap between best and
worst performing countries remains significant. Commodity-dependent economies struggle
to convert wealth into prosperity. The majority of Sub-Saharan Africa has seen economic
growth, though at a slower rate than in the past decade. However, many of the region’s
richest economies underperform significantly when prosperity delivery is measured against
their wealth. Oil-rich Gabon and Angola, posting some of the largest prosperity deficits
globally, are examples of such underperformance.
Similarly, Nigeria and the Republic of Congo struggle to deliver prosperity in spite of sizeable
commodity endowments and are, in addition, afflicted by unstable political and security
environments. Overall, economies across the continent remain in need of more
diversification, in terms of quality of exports and revenue sources. Africa trails last in the field
of health and education where the overall score of both sub-indices remains far below the
average of other developing regions, crippling countries’ chances of building a prosperous
society.
In the overall Prosperity Index rankings, Zambia has climbed by 5 positions from 108 to 103
when compared to last year. Since the Prosperity Index began in 2006, Zambia has moved
up the rankings table by 9 places. Zambia performed best on Social Capital and Business
Environment and scores lowest on the Economic Quality pillar.
3.6.3 Ease of Doing Business
According to the World Bank, Zambia is ranked at 85th in 2018 which is an improvement
from the 2017 ranking for the ease of doing business out of a total of 190 economies. The
ease of doing business covers 10 themes and the ranking between Zambia and South Africa
is depicted in Figure 12 below.

25
Figure 12: Zambia vs. South Africa Rankings
Source: World Bank, Doing Business 2018, Accessed electronically on 25/05/2018
When comparing Zambia with South Africa using the 10 themes, it shows that Zambia is
performing better than South Africa in four areas namely starting a business, dealing with
construction permits, getting credit and paying taxes. Four countries in Sub-Saharan Africa
rank in the top 10 in Getting Credit (with an average rank of 115). Zambia ranks 2, just after
New Zealand. A record number of 83 reforms, making it easier to do business, were
implemented in 36 of 48 economies in Sub-Saharan Africa in the past year. This is the
largest number of reforms ever recorded by the Doing Business report in any region, and
represents 31 percent of all reforms implemented globally in the past year.
With Malawi, Nigeria and Zambia, Sub-Saharan Africa is the most represented region
among the global top 10 improvers in the Doing Business 2018 report; and
Multiple economies in the region implemented three or more reforms in the past year,
including Kenya (6 reforms), Mauritania, Nigeria, Rwanda, and Senegal (5 reforms
each), Malawi, Mauritius and Niger (4 reforms each), and Angola, Benin, Cape Verde
and Zambia (3 reforms each).
Starting a business, paying taxes, and obtaining credit are all within 25% of the best
performing countries globally. The Patents and Companies Registration Authority has made
it much easier to register a company as most registration forms are now available online.
0
50
100
150
200Starting a Business
Dealing withConstruction Permits
Getting Electricity
Registering Property
Getting Credit
Protecting MinorityInvestors
Paying Taxes
Trading Across Borders
Enforcing Contracts
Resolving Insolvency
SouthAfrica
Zambia
26
Access to credit was improved by the introduction of a new Movable Property Act and by
setting up a new collateral registry. The tax authority, with the introduction of an online
platform and implementation of ASCUDA World, has supported easier import and export of
goods and services. However, some key areas continue to perform dismally. These areas
are resolving insolvency; registering property; trading across borders; and enforcing
contracts which need to improve by more than 50 percentage points to reach the level of the
best performing countries.
Despite this relatively good performance, the regulatory environment remains a challenge for
entrepreneurs and investors. Licensing and labour code requirements are often excessive,
discouraging formalisation and requiring significant knowledge to remain compliant,
especially for small businesses.
This report only focuses on two themes namely starting a business and trading across
borders.
Starting a Business
This indicator looks at the ease of starting a business taking into considerations procedures
officially required by an entrepreneur and the time and cost required to complete these
procedures. It assumes that all information is readily available to the entrepreneur and that
there has been no prior contact with officials and that the entrepreneur will pay no bribes.
Zambia’s ranking on starting a business is 101 which is better than South Africa. The ranking
is made up of the number of procedures, time in days and cost to start a business. The time
it takes to start a business for Zambia ensured that the country’s ranking is better. Figure 13
below shows the comparative ranking of starting a business with South Africa.

27
Figure 13: Comparative Ranking
Source: World Bank, Doing Business 2018, Accessed electronically on 25/05/2018
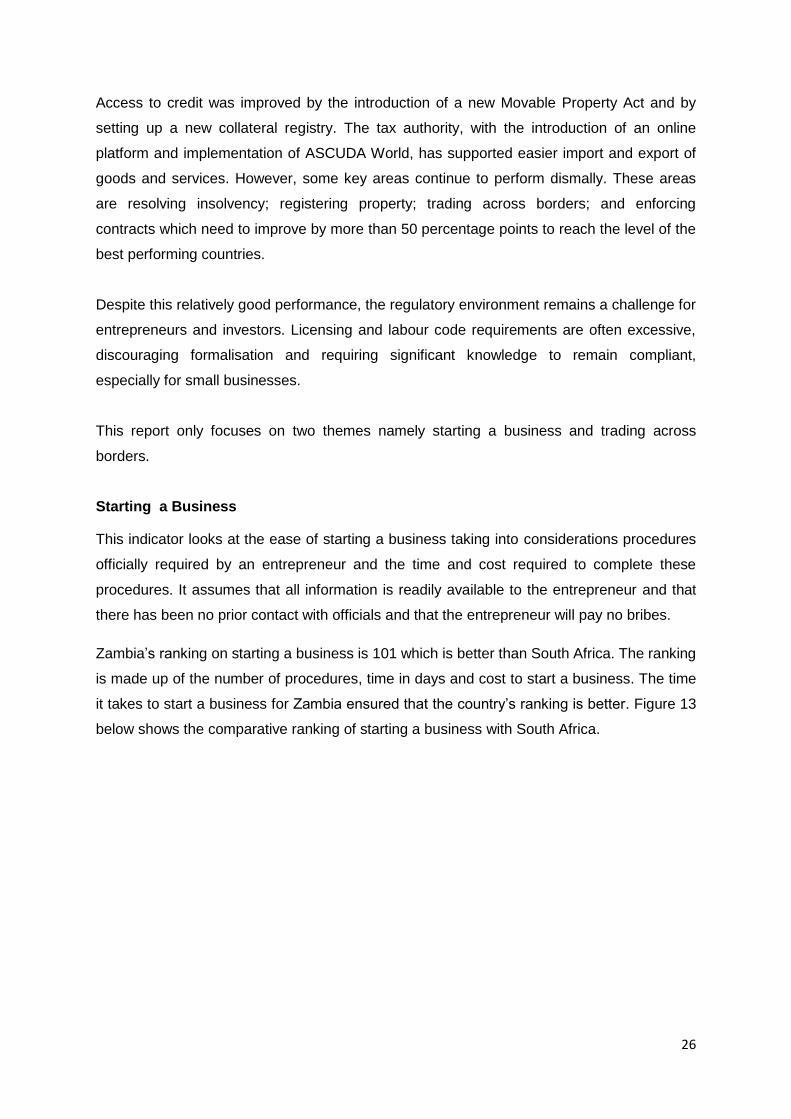
Zambia has 7 procedures that an entrepreneur must complete to incorporate and register a
new company as outlined in Table 5 below.
Table 5: Procedures required in registering a firm in Zambia
0
5
10
15
20
25
30
35
40
45
Procedures (Number) Time(days) Cost
78.5
34.2
7
45
0.2
ZAMBIA
SOUTH AFRICA
Procedure Time to
complete
Associated Costs
1 Check the company name for uniqueness
Agency: Patent And Companies Registration
Agency (PACRA).
Less than 1 day
(online)
-ZMK 83 for name
search and clearance
- ZMK 166 for
name reservation
2 Have a Commissioner of Oaths sign Companies Form 11
(Declaration of Compliance)
Agency: Commissioner of Oaths
1 day ZMK 50 on average
The cost varies based
on the Commissioner. A
Commissioner for Oath
who has an office next
to PACRA head office
charges ZMK 20 others
typically between ZMK
30 - ZMK 80
28
Source: World Bank, Doing Business 2018, Accessed electronically on 25/05/2018
3 Register the company
Applicant submits the following forms:
- Form 2 :Application for Incorporation,
- Form 5: Declaration of Consent to act as a Director or
Secretary, and
- Form 11: Declaration of compliance.
The applicant receives a case number to track the
application status and pays the fees at the cashier. At the
end of the process, the applicant obtains the certificate of
incorporation and the certificate of share capital.
Agency: PACRA
3 days The fees payable to
PACRA are as follows:
- Registration Fee: 2.5%
of nominal capital (with
a minimum fee of ZMK
250)
-Certificate of
incorporation: ZMK 83
-Certificate of share
capital: ZMK 83
-Companies Form 5:
ZMK 83
-Companies Form 11:
ZMK 83
4 Obtain a tax payer's tax number
Agency: Zambia Revenue Authority
1 day No charge
5 Register for Social Security
In order to register with the National Pension Scheme
Authority, the applicant must file an Employer
Registration form and attach a copy of the company's
Certificate of Incorporation. The employees must
complete a membership registration form and attach
copies of their National Registration Cards
Agency: National Pensions Scheme Authority
1 day No charge
6 Pay business levy
All businesses are required to pay a business levy to
commence business activities.
Agency: Lusaka City Council
1 day ZMK 450
7 Register for VAT
The VAT registration annual turnover threshold is ZMK
800,000 per the VAT Act Cap 331 and Regulations.
Agency: Zambia Revenue Authority
1 day No charge
29
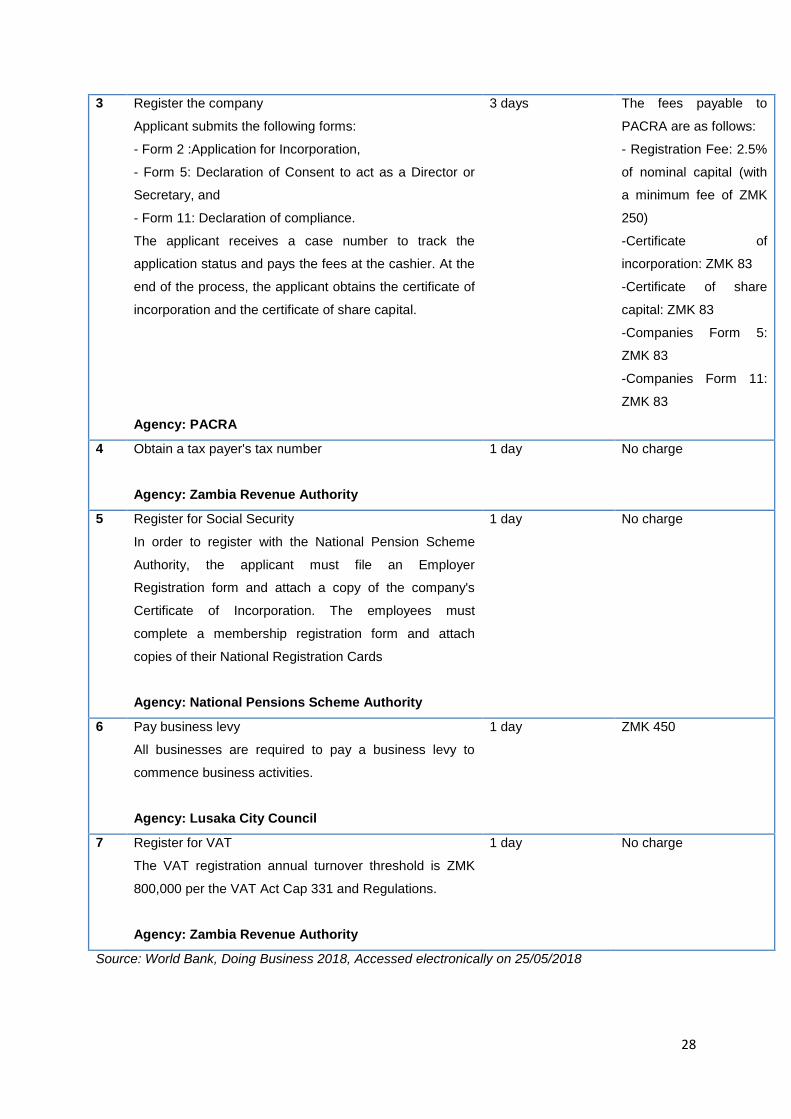
a) Trading across borders
Making trade between economies easier is increasingly important for business in today’s
globalised world. Excessive document requirements, burdensome customs procedures,
inefficient port operations and inadequate infrastructure all lead to extra costs and delays for
exporters and importers, stifling trade potential. Figure 14 below shows a ranking
comparative between the South Africa and Zambia.
Figure 14: Trading Across Borders South Africa vs. Zambia
Source: World Bank, Doing Business 2018, Accessed electronically on 13/06/2018
Zambia has improved its ranking on the trading across borders theme and South Africa’s
ranking has dropped 8 places. The trading across borders rating is based on a set of specific
predefined procedures. It is based on the time and cost to import and export focusing on
both border and documentary compliance (excluding tariffs and the time and cost for sea
transport) as shown in Table 6 below.
Table 6: Zambia vs. South Africa on Trading across borders
Indicator Zambia South Africa
Time to export: Border compliance (hours) 120 100
Cost to export: Border compliance (USD) 370 428
Time to export: Documentary compliance (hours) 96 68
Cost to export: Documentary compliance (USD) 200 170
Time to import: Border compliance (hours) 120 144
125
130
135
140
145
150
155
160
165
Zambia South Africa
161
139
150
147
2017
2018

30
Cost to import: Border compliance (USD) 380 657
Time to import: Documentary compliance (hours) 72 36
Cost to import: Documentary compliance (USD) 175 213
*24 hours = 1 day therefore 100 hours = 4 days
Source: World Bank, Doing Business 2018, Accessed electronically on 13/06/2018
Although the overall ranking for Zambia is worse than South Africa, it is performing far much
better in the cost to export and import: border compliance, cost to import: documentary
compliance and time to import: border compliance.
In 2016 Zambia launched two critical systems to facilitate expedient customs clearing and
enhance trade. The Zambia National Electronic Single Window which enabled parties
involved in international trade to submit regulatory import and export related documentation
required by various agencies through a single platform.
The other system supported from the COMESA, allowed electronic cargo tracking. The
system is used to monitor the movement of consignments along transport corridors while
using a single regional window to connect national customs offices, thereby facilitating the
documentation process. This system helped improve logistics in transit trade and reduce
administrative costs. Furthermore, Zambia provided for advance ruling on rules of origin for
goods originating from countries with which it has signed trade agreements; and established
trade centres at borders of major non-traditional export markets.
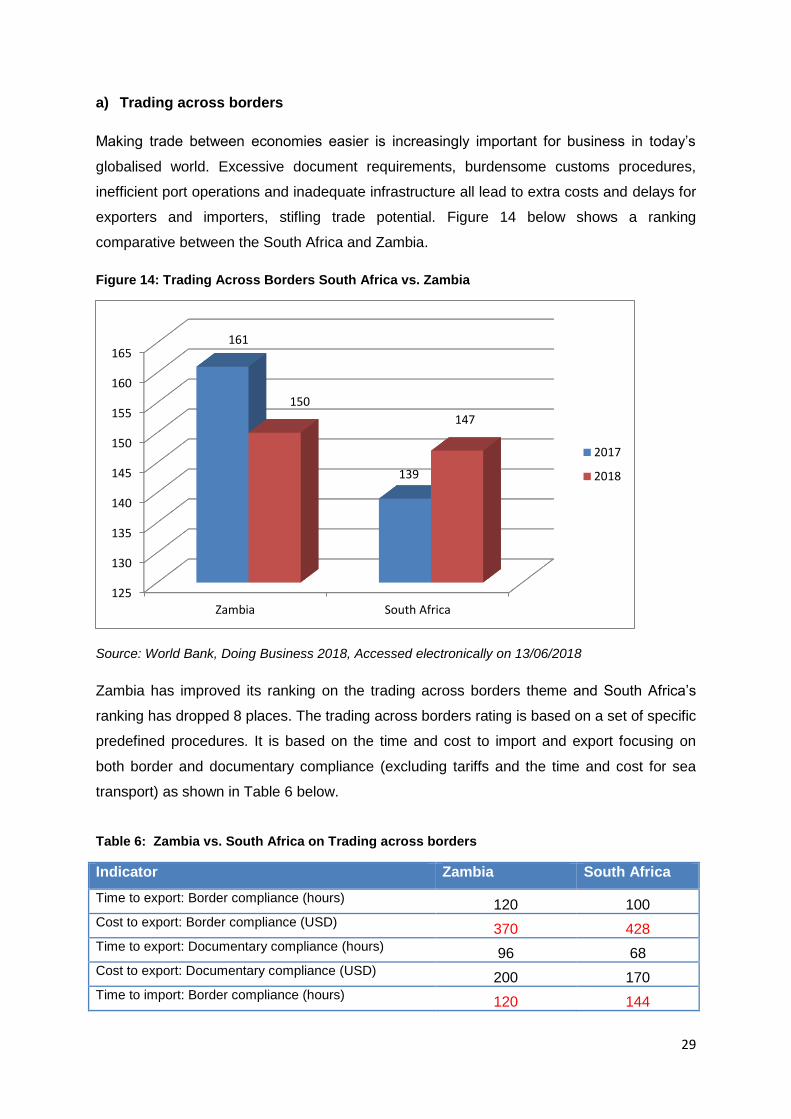
3.7 Regional Integration index
The Africa regional integration index is designed to measure the extent to which each
country in Africa is meeting its commitments under the various pan-African integration
frameworks, such as Agenda 2063 and the Abuja Treaty. The Index is made up of five
Dimensions, which are the key socio-economic categories that are fundamental to Africa’s
integration. The index uses sixteen indicators which cut across the five dimensions which
are based on the Abuja Treaty and its operational framework as set out in Figure 15 below.
31
Figure 15: Regional Integration Index
Source: Africa Regional Integration Index Report; Accessed electronically on 13/06/2018
EAC is the top performing REC on regional integration with higher than average scores in all
dimensions except for financial and macroeconomic integration. It is followed by SADC and
ECOWAS as shown in Figure 16 below. UMA is one of the least integrated of the African
communities and due to the distance between the member countries; COMESA has a low
score in the 2016 African Regional Integration Index.

32
Figure 16: Overall scores on regional integration by REC
Source: Africa Regional Integration Index Report; Accessed electronically on 14/06/2018
Overall, Zambia performed strongly in all dimensions of the regional integration index.
However, its performance in infrastructural integration, financial integration and
macroeconomic policy convergence could be improved. Zambia is second in COMESA with
the score of 0.565 and fourth in SADC with the score of 0.523. Figure 17 below shows the
scores of all dimensions in both SADC and COMESA.
Figure 17: SADC vs. COMESA scores
Source: Africa Regional Integration Index Report; Accessed electronically on 14/06/2018
0 0.1 0.2 0.3 0.4 0.5 0.6
CEN-SAD
COMESA
ECCAS
IGAD
UMA
ECOWAS
SADC
EAC
0.395
0.415
0.454
0.457
0.459
0.509
0.531
0.540
CEN-SAD COMESA ECCAS IGAD UMA ECOWAS SADC EAC
0 0.2 0.4 0.6 0.8 1
Overall
Trade integration
Regional infrastructure
Productive integration
Free movement of people
Financial and Macroeconomic
0.565
1
0.437
0.61
0.442
0.337
0.523
0.628
0.444
0.533
0.693
0.32
SADC
COMESA
33
Free movement of persons: African countries are scored based on two indicators in this
dimension of the Africa Regional Integration Index: the proportion of REC-level protocols on
free movement of persons ratified (out of those RECs of which the country is a member) and
the number of other African countries whose nationals are allowed to enter visa-free or with
a visa on arrival. Zambia scores strongly in this dimension relative to other members of
COMESA and SADC. It allows nationals of twenty-four other African countries to enter visa-
free or with a visa on arrival. Zambia has ratified articles 14, 17 and 18 of the SADC treaty
which concern free movement of persons, rights of establishment and free movement of
workers but has not ratified the COMESA protocol on free movement of persons (ECA, AfDB
and AUC, 2012; ECA, AUC and AfDB, 2013; ECA and AUC, 2015).
Trade integration: The Index includes a number of indicators of trade integration, including
average applied tariffs on intra-REC imports and intra-REC goods imports and goods
exports. Trade in services is not included due to a lack of data on intra-African trade in
services. Overall, Zambia performs strongly in the dimension of trade integration relative to
other members of COMESA and SADC. Zambia has an average applied tariff of just 0.1 per
cent on imports from SADC, with an average applied tariff of just 0.003 per cent on imports
from COMESA. This means that it has the seventh-lowest average applied tariff among
SADC member states (behind Lesotho, Mauritius, Swaziland, Botswana, Namibia and South
Africa) and the third lowest average applied tariff on imports from COMESA, based on the
latest available data (UNSD, 2015; ITC, 2015).
Zambia’s trade with the rest of the RECs of which it is a member is also high as a share of
its GDP. In 2016, the country’s imports from SADC amounted to 42.4% of its GDP, meaning
that it ranked ninth within the bloc on this measure. It has the highest share of imports from
COMESA in GDP (28 per cent) of any COMESA member. Furthermore, Zambia’s exports
(excluding re-exports) to SADC amounted to 35.2% of GDP, meaning that it ranked seventh
on this measure among SADC members. The country has the highest share of exports to
COMESA of any COMESA member, at 12 percent.
Productive integration: As with trade integration, Zambia falls within the group of top-ranking
countries in SADC and COMESA in terms of its integration into regional value chains.
Zambia scores moderately (nineteenth out of all countries in Africa) in UNCTAD’s
Merchandise Trade Complementarity Index, which measures the extent to which a country’s
trade is complementary with that of its partners. This suggests that some level of
specialisation through trade between Zambia and other countries in the region may have
34
taken place. The Index also measures productive integration looking at intra-regional trade in
intermediate goods. The proportion of intermediate goods in Zambia’s (already high) trade
with SADC is also high. Zambia’s share of intermediates in total imports within the region
averaged 53 per cent in 2014 (i.e. the average of the shares for SADC and COMESA), while
in the same year, its share of intermediates in its exports to the RECs of which it is a
member was also high at 76 percent.
Infrastructure: Zambia’s infrastructural integration with the rest of the region is moderate
relative to other members of the same RECs’. Based on the latest available data Zambia’s
internet bandwidth per capita of around 0.7 megabits per second per person is the 22nd-
highest on the continent. Internet bandwidth is important for international communication,
both within Africa and beyond, including supporting trade in services.

35
4. ROAD TRANSPORT ENVIRONMENT
4.1 Overview Zambia made major progress with its main trunk road network. Despite relatively low road
densities, Zambia’s primary and secondary networks provide basic regional and national
connectivity, linking the provincial capitals to Lusaka, and Lusaka to the main international
border crossings. More than 80 percent of Zambia’s paved road networks are in good or fair
condition, on par with its middle-income neighbours and well ahead of the typical
performance of resource-rich countries in Africa as depicted in Table 7 below.
Table 7: Road indicators of Zambia and middle income countries
Unit Resource-
rich
Zambia Middle-income
countries
Paved road
density
Km/1000km2 of arable land 97.6 56.3 146.8
Unpaved road
density
Km/1000km2 of arable land 128.2 95.0 257.8
GIS rural
accessibility
% of rural population within
2km from all season road
19.7 16.8 22.9
Paved road traffic Average annual daily traffic 1408.2 736.6 2558.3
Unpaved road
traffic
Average annual daily traffic 54.2 45.2 14.9
Paved network
condition
% in food or fair condition 67.9 83.0 82.0
Unpaved network
condition
% in food or fair condition 61.4 25.0 57.6
Source: Zambia’s Infrastructure: A continental perspective, Accessed on 03/07/2018
The establishment of a second-generation road fund in the country resulted in a stable
allocation of resources to the sector. Zambia is one of the few countries in the region with a
road sector budget in excess of what is needed to maintain the main road network, and
adequate to address the rehabilitation backlog.
There is evidence of overinvestment in Zambia’s main road network. About three-quarters of
the primary and secondary road network is paved, one of the highest ratios among Africa’s
low-income countries. Traffic density on Zambia’s paved roads is comparatively low at 736
vehicles per day it is about half of the average for resource-rich countries.
36
Zambia’s rural road accessibility is poor compared to its peers. While 70 percent of
Zambians depend on agriculture for their livelihood, only 17 percent of this population lives
within 2 km of an all-season road i.e. about half the African average. The condition of the
existing rural networks is exceptionally poor, with only 21 percent in good or fair condition,
compared with around 60 percent in the relevant peer groups.
Zambia’s rail sector is critical to its mineral-based economy. Rail transport continues to be
the most competitive for large bulk, time-insensitive commodities, such as Zambia’s copper
production. The country’s rail network has two operators:
Railway Systems of Zambia (RSZ) serves the north-south corridor and connects
with the Zimbabwean rail operator for onward service to the Port of Durban; and
Tanzania and Zambia Railway Authority (TAZARA) operates an eastward route
from the copper belt into Tanzania and on to Dar es Salaam.
Zambian railways’ low traffic densities are well below the viability threshold of at least 2
million tons per kilometre for railways of this kind, making it difficult to capture the revenues
needed to maintain assets. Low traffic volumes complicate the financial viability of any
concession arrangement. In the case of the RSZ, the lack of a clear regulatory framework or
administrative capacity to supervise the contract has made it difficult for the government to
provide clear oversight. For example, the RSZ practices discriminatory pricing against transit
traffic from the DRC to Dar es Salaam, charging $2.00 per tonne-km versus the normal tariff
of around $0.05 per tonne-km.
The tariffs reflect an abuse of monopoly power aimed at diverting trade flows from the DRC
away from Dar es Salaam and toward Durban, with the same concessionaire operating the
Zambian rail network and the Beit Bridge border crossing from Zimbabwe into South Africa.
The high level of these tariffs has a distortionary effect on traffic flows and investment
decisions along the entire corridor. For example, copper exports from the DRC are currently
going by road in order to avoid these charges, even though they are more suited to rail
transportation. Resolving this situation is not simple, and would probably require a major
renegotiation of the rail concession contract, combined with careful tariff regulation
thereafter.
The lack of reciprocal access rights delays rail transit through Zambia and along the entire
north south corridor. A rail freight journey of 3,000 km from Kolwezi on the DRC border to
the port of Durban takes 38 days to complete i.e.9 days of travel time and 29 days
associated with customs clearance and loading and interchange. Freight moves no more

37
than 4 km per hour on average, and the aggregate costs of delays along the corridor have
been estimated at $120 million per year. The Zambian rail network contributes to these
delays.
Access from one rail system to another is restricted for technical reasons or connecting rail
operators simply do not have the necessary traction capacity to service existing traffic. Poor
traffic planning causes undue delays, and operators are not incentivized to provide reliable
interconnection services. Reducing these delays requires revision of the contractual
relationships and access rights linking these railways to ensure transparency and fairness in
reciprocal track access rights.
Zambia has a total classified network of 67,671km of public roads comprising Trunk, Main,
District, Primary, Secondary and Tertiary Feeder, Urban and Park Roads. The Core Road
Network (CRN) of 40,454 km is broken down as shown in Figure 18 below.
Figure 18: Total Road Network (Percentage)
Source: RDA; Accessed electronically on 03/07/2018
The Road Development Agency (RDA) delegated some responsibility to Local Road
Authorities in line with Section 20 and Section 73 of the Public Roads Act No. 12 of 2002. On
the paved Trunk, Main and District (TMD) network, 87% were assessed in good condition,
Trunk, 3116
Main, 3701
District, 13707
Urban, 5597
Primary Feeder, 14333
Core Road Network
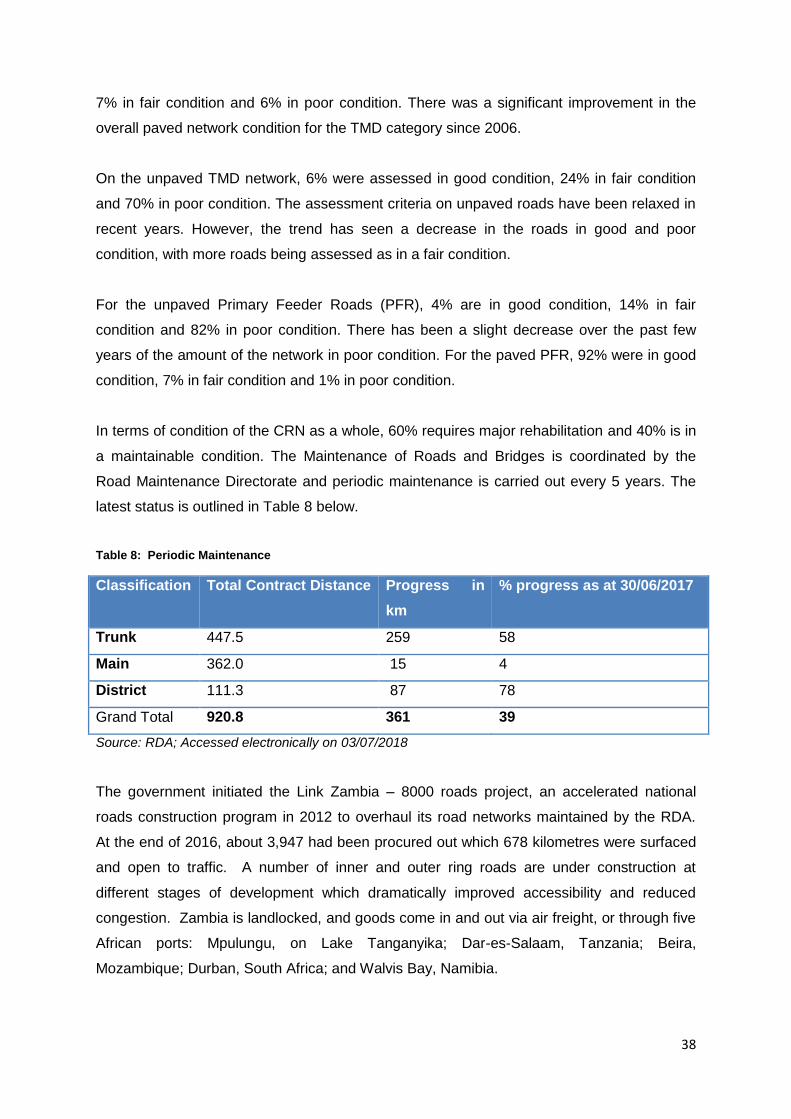
38
7% in fair condition and 6% in poor condition. There was a significant improvement in the
overall paved network condition for the TMD category since 2006.
On the unpaved TMD network, 6% were assessed in good condition, 24% in fair condition
and 70% in poor condition. The assessment criteria on unpaved roads have been relaxed in
recent years. However, the trend has seen a decrease in the roads in good and poor
condition, with more roads being assessed as in a fair condition.
For the unpaved Primary Feeder Roads (PFR), 4% are in good condition, 14% in fair
condition and 82% in poor condition. There has been a slight decrease over the past few
years of the amount of the network in poor condition. For the paved PFR, 92% were in good
condition, 7% in fair condition and 1% in poor condition.
In terms of condition of the CRN as a whole, 60% requires major rehabilitation and 40% is in
a maintainable condition. The Maintenance of Roads and Bridges is coordinated by the
Road Maintenance Directorate and periodic maintenance is carried out every 5 years. The
latest status is outlined in Table 8 below.
Table 8: Periodic Maintenance
Classification Total Contract Distance Progress in
km
% progress as at 30/06/2017
Trunk 447.5 259 58
Main 362.0 15 4
District 111.3 87 78
Grand Total 920.8 361 39
Source: RDA; Accessed electronically on 03/07/2018
The government initiated the Link Zambia – 8000 roads project, an accelerated national
roads construction program in 2012 to overhaul its road networks maintained by the RDA.
At the end of 2016, about 3,947 had been procured out which 678 kilometres were surfaced
and open to traffic. A number of inner and outer ring roads are under construction at
different stages of development which dramatically improved accessibility and reduced
congestion. Zambia is landlocked, and goods come in and out via air freight, or through five
African ports: Mpulungu, on Lake Tanganyika; Dar-es-Salaam, Tanzania; Beira,
Mozambique; Durban, South Africa; and Walvis Bay, Namibia.

39
4.2 Road Traffic Legislation
Relevant stakeholders are working together to enforce the traffic laws of Zambia, facilitating
the free and orderly flow of traffic, and assisting in education of road users.
4.2.1 Speed Limits
The general speed limit on national highways is 100km/h, secondary roads 100km/h and in
urban built up areas 65 km/h unless otherwise indicated.
4.2.2 Traffic Fines
Zambia’s traffic flows on the left side on the road and the minimum driving age is 18 years.
The minimum age for renting a car is between 23 and 25 and it is accompanied by a
payment for a young driver premium if below 25. It is mandatory to use seat belts at all times
while driving. Using cell phones while driving is prohibited; the exception is cell phones with
hands-free systems.
The offenses and official road traffic fines for Zambia are outlined in Table 9 below.
Table 9: Traffic Fines
TRAFFIC VIOLATION AMOUNT (KWACHA)
Driving under the influence
Refusing to give blood/breath sample
Limit 80mg per 100ml of blood;
K6000 or 5 years imprisonment
K 600 or 6 months imprisonment
Exceeding speed limit
K300 up to K10 000
Defects in the car (hooter, tyre, worn out brakes)
K300
Failure to obey traffic signs and signals
1st offence K300, 2nd offence
K900
Obstructing other road users/roadway 1st offence K300, 2nd offence
K900
Driving without license
Reckless driving
Using a cell-phone
1st offence K450, 2nd offence
K900
K4500 OR 5 years imprisonment
K450
Unauthorised goods K300
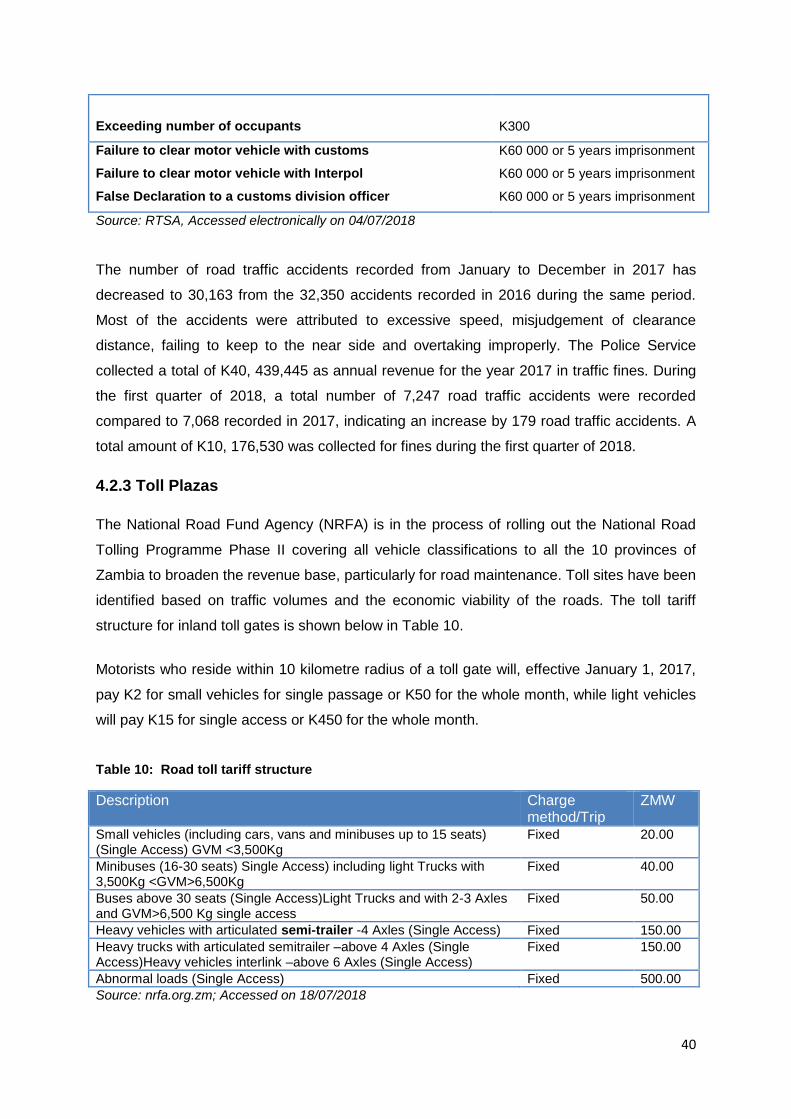
40
Exceeding number of occupants
K300
Failure to clear motor vehicle with customs
Failure to clear motor vehicle with Interpol
False Declaration to a customs division officer
K60 000 or 5 years imprisonment
K60 000 or 5 years imprisonment
K60 000 or 5 years imprisonment
Source: RTSA, Accessed electronically on 04/07/2018
The number of road traffic accidents recorded from January to December in 2017 has
decreased to 30,163 from the 32,350 accidents recorded in 2016 during the same period.
Most of the accidents were attributed to excessive speed, misjudgement of clearance
distance, failing to keep to the near side and overtaking improperly. The Police Service
collected a total of K40, 439,445 as annual revenue for the year 2017 in traffic fines. During
the first quarter of 2018, a total number of 7,247 road traffic accidents were recorded
compared to 7,068 recorded in 2017, indicating an increase by 179 road traffic accidents. A
total amount of K10, 176,530 was collected for fines during the first quarter of 2018.
4.2.3 Toll Plazas
The National Road Fund Agency (NRFA) is in the process of rolling out the National Road
Tolling Programme Phase II covering all vehicle classifications to all the 10 provinces of
Zambia to broaden the revenue base, particularly for road maintenance. Toll sites have been
identified based on traffic volumes and the economic viability of the roads. The toll tariff
structure for inland toll gates is shown below in Table 10.
Motorists who reside within 10 kilometre radius of a toll gate will, effective January 1, 2017,
pay K2 for small vehicles for single passage or K50 for the whole month, while light vehicles
will pay K15 for single access or K450 for the whole month.
Table 10: Road toll tariff structure
Description Charge method/Trip
ZMW
Small vehicles (including cars, vans and minibuses up to 15 seats) (Single Access) GVM <3,500Kg
Fixed 20.00
Minibuses (16-30 seats) Single Access) including light Trucks with 3,500Kg <GVM>6,500Kg
Fixed 40.00
Buses above 30 seats (Single Access)Light Trucks and with 2-3 Axles and GVM>6,500 Kg single access
Fixed 50.00
Heavy vehicles with articulated semi-trailer -4 Axles (Single Access) Fixed 150.00
Heavy trucks with articulated semitrailer –above 4 Axles (Single Access)Heavy vehicles interlink –above 6 Axles (Single Access)
Fixed 150.00
Abnormal loads (Single Access) Fixed 500.00
Source: nrfa.org.zm; Accessed on 18/07/2018

41
Phase I of the NRTP was launched on November 1, 2013 with inland tolling operations
targeting Heavy Goods Vehicles (HGV) with Gross Vehicle Mass (GVM) of 6.5 tonnes and
above which are required by law to pass through gazetted weighbridges.
During this phase, collection of tolls was restricted to ten (10) ports of entry or border toll
stations and eight (8) gazetted weighbridges across the country. Currently there are 20
collection sites as shown in Table 11 below.
Table 11: Operational Toll Collection Sites
Toll Station Name Port of Entry
Shimabala Chirundu
Katuba Kariba
Mumbwa Livingstone Falls Way
Manyumbi Kazungula
Kafulafuta Katima Mulilo
Kafue/Turnpike Kasumbalesa
Kazungula Weighbridge Nakonde
Kapiri Mposhi Weighbridge Mwami
Mwami Weighbridge Chanida
Livingstone Weighbridge
Mpika Weighbridge Source: nrfa.org.zm, Accessed on 19/07/2018
The Agency intends to construct additional twenty toll plazas for Phase II to bring the total
number to forty toll stations by the end of 2018 to ensure equity in the collection and
disbursement of Toll collections across Zambia’s core road network.
4.2.4 Border posts
Zambia shares borders with eight countries, so there’s a huge number of crossing points.
Most are open daily from 6am to 6pm as shown in Table 12 below.
4.2.4.1 Angola
There are two border posts between Angola and Zambia. The Chavuma/ Caripande border
post is one of the remotest border posts in Zambia. The Jimbe border is exceptionally small
with no electricity; it uses solar panels to power the ZRA computer. There is no truck
movement possible due to road conditions on the Angolan side of the border.
4.2.4.2 Botswana
Botswana and Zambia share the world’s shortest border crossing just 750 metres in the
Zambezi River. It is in this spot where the corners of four countries meet – Namibia,
Botswana, Zambia and Zimbabwe. The pontoon ferry (ZMW2 for foot passengers and
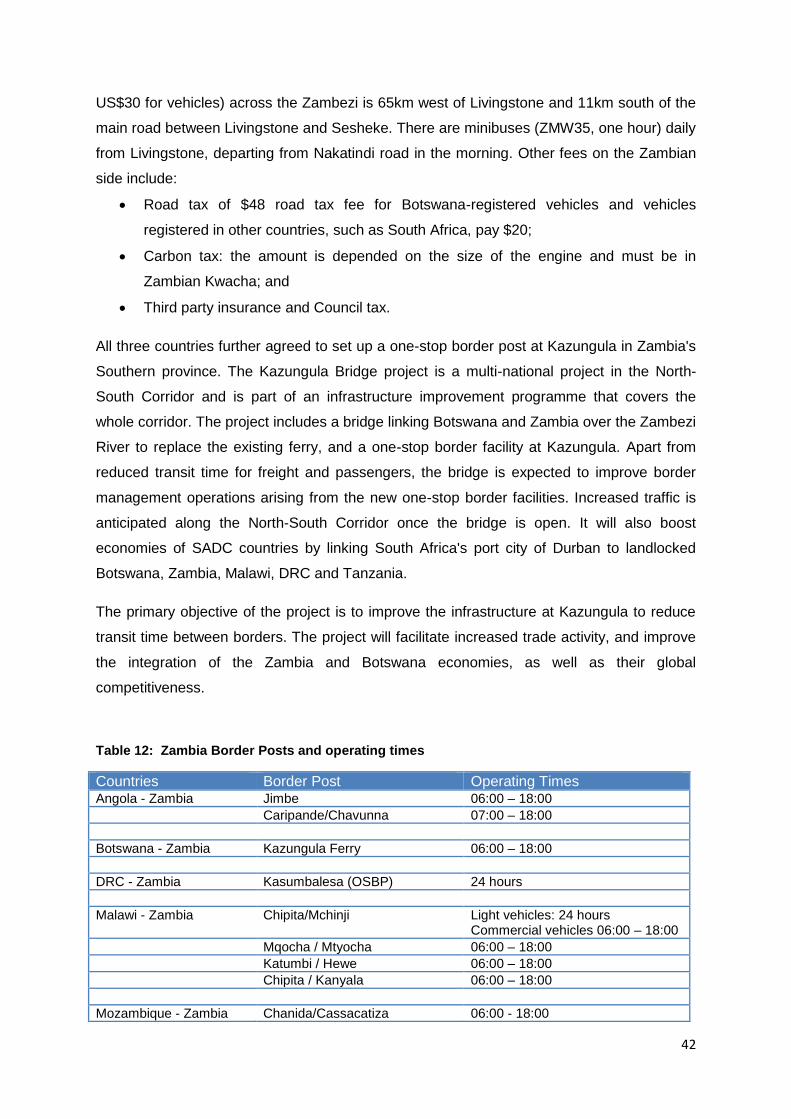
42
US$30 for vehicles) across the Zambezi is 65km west of Livingstone and 11km south of the
main road between Livingstone and Sesheke. There are minibuses (ZMW35, one hour) daily
from Livingstone, departing from Nakatindi road in the morning. Other fees on the Zambian
side include:
Road tax of $48 road tax fee for Botswana-registered vehicles and vehicles
registered in other countries, such as South Africa, pay $20;
Carbon tax: the amount is depended on the size of the engine and must be in
Zambian Kwacha; and
Third party insurance and Council tax.
All three countries further agreed to set up a one-stop border post at Kazungula in Zambia's
Southern province. The Kazungula Bridge project is a multi-national project in the North-
South Corridor and is part of an infrastructure improvement programme that covers the
whole corridor. The project includes a bridge linking Botswana and Zambia over the Zambezi
River to replace the existing ferry, and a one-stop border facility at Kazungula. Apart from
reduced transit time for freight and passengers, the bridge is expected to improve border
management operations arising from the new one-stop border facilities. Increased traffic is
anticipated along the North-South Corridor once the bridge is open. It will also boost
economies of SADC countries by linking South Africa's port city of Durban to landlocked
Botswana, Zambia, Malawi, DRC and Tanzania.
The primary objective of the project is to improve the infrastructure at Kazungula to reduce
transit time between borders. The project will facilitate increased trade activity, and improve
the integration of the Zambia and Botswana economies, as well as their global
competitiveness.
Table 12: Zambia Border Posts and operating times
Countries Border Post Operating Times Angola - Zambia Jimbe 06:00 – 18:00
Caripande/Chavunna 07:00 – 18:00
Botswana - Zambia Kazungula Ferry 06:00 – 18:00
DRC - Zambia Kasumbalesa (OSBP) 24 hours
Malawi - Zambia Chipita/Mchinji Light vehicles: 24 hours Commercial vehicles 06:00 – 18:00
Mqocha / Mtyocha 06:00 – 18:00
Katumbi / Hewe 06:00 – 18:00
Chipita / Kanyala 06:00 – 18:00
Mozambique - Zambia Chanida/Cassacatiza 06:00 - 18:00

43
Luangwa/Zumbo 06:00 – 18:00
Chimefusa 07:00 - 17:00
Namibia - Zambia Wenela 06:00 – 18:00
Tanzania - Zambia Mbala 06:00 – 18:00
Tunduma/Nakonde (OSBP) 06:00 – 18:00
Zimbabwe - Zambia Chirundu (OSBP) 06:00 – 22:00
Siavonga/Kariba 06:00 – 18:00
Kazungula Ferry 06:00 – 18:00
Kazangula Road 06:00 – 18:00
Livingstone/Victoria Falls 06:00 – 18:00
4.2.4.3 Democratic Republic of the Congo
There are three border posts with DRC, one connects Chingale in the Copperbelt with
Lubumbashi in Katanga Province, via the border towns of Chililabombwe (Zambia) and
Kasumbalesa (DRC) the other two are the Mokambo Border Post near Mufulira and Sakania
Border Gate near Ndola.
4.2.4.4 Malawi
Malawi has 4 border posts with Zambia although most foreigners use the border at Mchinji,
30km southeast of Chipata, because it’s along the road between Lusaka and Lilongwe.
Further north is another border crossing at Nakonde.
4.2.4.5. Mozambique
There are three border posts but the main border is between Mlolo (Zambia) and fairly
remote Cassacatiza (Mozambique), but most travellers choose to reach Mozambique
through Malawi. There is no public transport between the two countries.
4.2.4.6 Namibia
The only border is at Sesheke (Zambia), on the northern and southern bank of the Zambezi,
while the Namibian border is at Wenela near Katima Mulilo. There are bus services to
Sesheke from Lusaka and Livingstone respectively.
4.2.4.7 Tanzania
The main border by road, and the only crossing by train, is between Nakonde (Zambia) and
Tunduma (Tanzania) which is an OSBP. Bus services run from Lusaka to Nakonde and on
to Mbeya. There is also a crossing at Kasesya, between Mbala and Sumbawanga
(Tanzania).
4.2.4.8 Zimbabwe
There are five crossings: at Chirundu, along the road between Lusaka and Harare; between
Siavonga (Zambia) and Kariba (Zimbabwe), about 50km upstream from Chirundu; and the
easiest and most common of all, between Livingstone (Zambia) and Victoria Falls town

44
(Zimbabwe). The third one is Namafulo Border Post found between Zimbabwe and Zambia
on Lake Kariba in Sinazongwe. The last two are the Kazungula road and ferry.
4.2.5. Zambia – Main Trade Routes
Compared to most developing landlocked countries in Africa, Zambia is particularly well
serviced in terms of road and rail infrastructure. There are several alternative road and rail
connections from Zambia’s main economic centres to regional ports and they include:
4.2.5.1 Dar es Salaam Corridor
This is Zambia’s import and export port and transport corridor. The corridor is served by road
and rail, with the infrastructure on both services being in generally good order and operating
at well below capacity, with the exception of the Nakonde border post, which is often
congested.
4.2.5.2 North South – Chirundu, Beit Bridge, Gauteng, Durban
This is the most heavily trafficked corridor for regional trade, which connects South Africa
with Zimbabwe, Zambia, central and northern Mozambique, the DRC, Malawi, Tanzania and
the great lakes region.
Road infrastructure is in good condition but the border post-upgrades were delayed. Delays
and congestion occur at the Beitbridge and Chirundu border posts, particularly at peak
periods. Delays at Beitbridge can be up to 3 days due to processing capacity limitations. At
Chirundu, processing normally takes up to 1 day. Some of the traffic has been switched to
the Kazungula crossing, but delays appear to be even higher.
Despite significant longer distance from Zambia, Durban remains an attractive alternative to
Dar es Salaam, because the flow of goods exported out of South Africa allows the trucking
companies to offer a discount for the back haul, to offset the additional cost of the longer
distance.
Another important attraction for Durban as an import and export port for Zambia is the fact
that Durban serves as a regional hub port with a high vessel calling frequency, and therefore
favoured by many customers. This position is gradually also being attained by Dar es
Salaam and Walvis Bay, but not yet by Beira and Maputo. Chirundu border post has a
steady volume of traffic. There is very little parking space available for trucks except along
the roadside outside the gates. Approximately 440 trucks per day cross both ways and 16
buses enter and exit the border per day. The maximum capacity is about 500 trucks per
day. Waiting time is between 24 to 48 hours depending on documentation completeness.
45
Pre-clearance and registration as well as forwarders with e-payment capability are essential
to facilitating cargo movement
The fees at Chirundi include 3rd party Insurance between ZMW400 -ZMW500 depending on
the type of vehicle, Road Access USD30 valid for a year, Council Levy USD20 per car paid
on entry and exit and Carbon tax pollution about ZMW200 per vehicle.
4.2.5.3 North South – Kazungula / Victoria Falls
This is the ‘alternative’ North – South route between South Africa, Botswana, Zambia and
the DRC, which bypasses Zimbabwe. The road conditions on the Kazungula route are good,
except for a stretch of about 80 km north on Livingstone in Zambia, which requires
upgrading. This route is served by two old river ferries at Kazungula, operated by the
Zambian ministry of transport. This route has become increasingly popular, partly because of
increasing congestion at Chirundu, but also because it bypasses Zimbabwe, which
frequently suffers from fuel shortages. Congestion may occur mainly because Zambia’s
customs office at Kazungula is not able to cope with the increased traffic demands.
4.2.5.4 Beira Corridor
From the Zambian and DRC Copperbelt, Beira offers the shortest route by road to any
regional seaport. Despite the very significant distance advantage by road, Beira has not
been able to attract significant levels of traffic to and from Zambia. This is mainly due to the
fact that Beira port has an 8 metres draft and has very few direct calls. The port serves
mainly as a feeder port to Durban and road transport directly between Durban and Zambia is
therefore most often quicker and cheaper.
4.2.5.5 Walvis Bay Corridor
Walvis Bay is currently being marketed as the western gateway to the SADC region, for
trade to and from the West. Walvis Bay is an efficient port and has invested in additional
capacity well ahead of demand. The road distance from Walvis Bay to Ndola is about 2 300
km, which is about 15% longer than to Dar es Salaam, but considerably shorter than to
Durban. The road conditions along the route are good, with the exception of the 80km
section north of Livingston. The route crosses the Zambezi via the new bridge at Katimo
Mulilo and has the advantage of no congestion at either the port or at the border post.
The main marketing advantage of this route is the savings in time, possibly 7 to 10 days, for
Zambian trade to and from the west. Walvis Bay has not yet been successful in capturing
significant volumes of Zambian traffic, possible because the port has mainly acted as feeder
port for the South Africa ports – Cape Town Port Elizabeth and Durban –but this is changing.
46
5. PASSENGER ROAD TRANSPORT
The commercial conveyance of passengers by road between South Africa and Zambia is
carried out by buses and organised party operators. All commercial passenger operators,
both in South Africa and Zambia need to have valid cross-border road transport permit in
order to transport passengers across the South African and Zambian borders.
The statistics used to analyse passenger volumes and trends obtained from data collected
by the Department of Home Affairs’ (DHA) immigration officers at the ports of entry into
South Africa shows that a total of 3 582 842 travellers (arrivals, departures and transits)
passed through South African ports of entry in April 2018. The data used for analysis is
comprised of mode of transport used, purpose of entry and point of entry and exit.
5.1 Passenger traffic Volumes
Road transport was the most common mode of travel used by 2 525 737 (70, 5%) of the 3
582 842 travellers as depicted in Table 13 below. The total number of travellers who used air
transport was 1 022 843 (28,5%). Information on arrivals of South African residents shows
that 194 693 (36,8%) came by air and 326 337 (61,6%) came by road. For departures, 204
156 (41%) used air and 284 614 (57,2%) used road. All travellers in transit, 865 (100%) used
air transport.
Table 13: Travel Statistics
Mode of Transport
Air 1 022 843
Road 2 525 737
Source: Statistics South Africa Tourism, Accessed 13/07/2018
Foreign travellers accounted for 263 344 (20,3%) arrived by air and 1 027 380 (79,1%) came
by road. When departing South Africa, 301 830 (25,2%) foreign travellers left by air and 887
406 (74,0%) left by road. All travellers in transit 57 955 (100%) used air transport.
5.2 Tourists
The ten leading SADC countries in terms of the number of tourists visiting South Africa in
April 2018 were: Zimbabwe, 199 567 (30,4%); Lesotho, 163 989 (25,0%); Mozambique, 109
483 (16,7%); Swaziland, 74 359 (11,3%); Botswana, 50 536 (7,7%); Namibia, 17 214
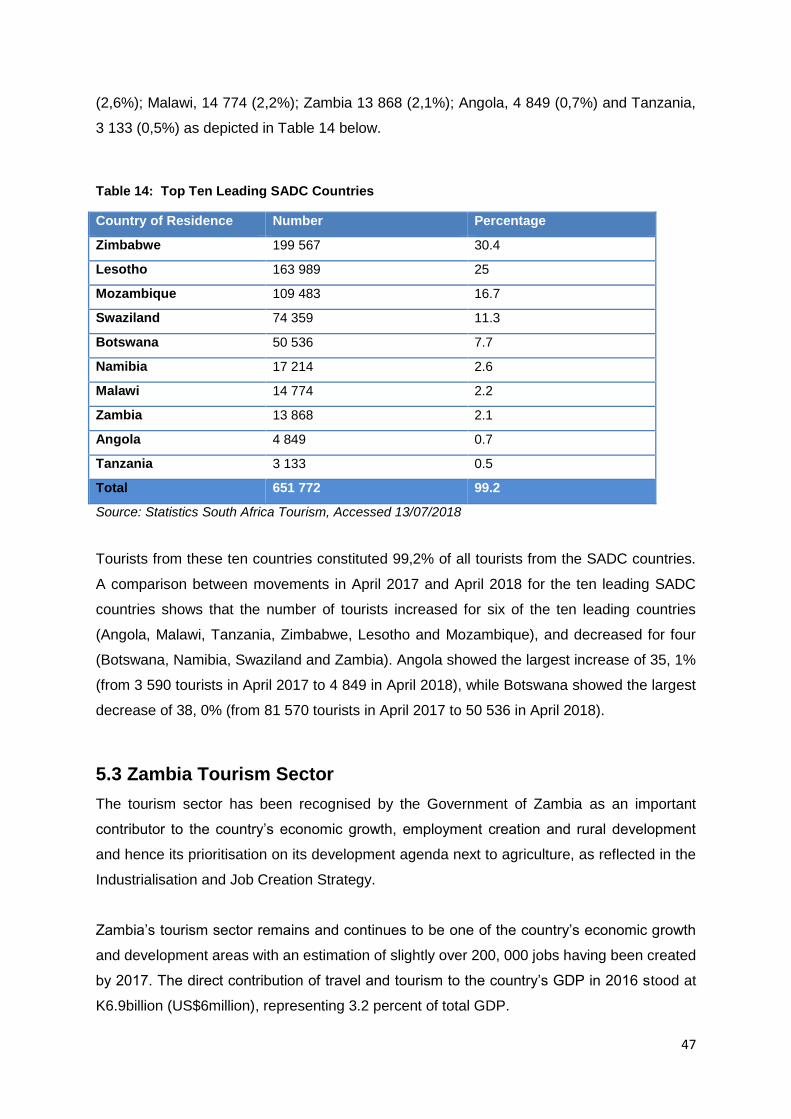
47
(2,6%); Malawi, 14 774 (2,2%); Zambia 13 868 (2,1%); Angola, 4 849 (0,7%) and Tanzania,
3 133 (0,5%) as depicted in Table 14 below.
Table 14: Top Ten Leading SADC Countries
Country of Residence Number Percentage
Zimbabwe 199 567 30.4
Lesotho 163 989 25
Mozambique 109 483 16.7
Swaziland 74 359 11.3
Botswana 50 536 7.7
Namibia 17 214 2.6
Malawi 14 774 2.2
Zambia 13 868 2.1
Angola 4 849 0.7
Tanzania 3 133 0.5
Total 651 772 99.2
Source: Statistics South Africa Tourism, Accessed 13/07/2018
Tourists from these ten countries constituted 99,2% of all tourists from the SADC countries.
A comparison between movements in April 2017 and April 2018 for the ten leading SADC
countries shows that the number of tourists increased for six of the ten leading countries
(Angola, Malawi, Tanzania, Zimbabwe, Lesotho and Mozambique), and decreased for four
(Botswana, Namibia, Swaziland and Zambia). Angola showed the largest increase of 35, 1%
(from 3 590 tourists in April 2017 to 4 849 in April 2018), while Botswana showed the largest
decrease of 38, 0% (from 81 570 tourists in April 2017 to 50 536 in April 2018).
5.3 Zambia Tourism Sector
The tourism sector has been recognised by the Government of Zambia as an important
contributor to the country’s economic growth, employment creation and rural development
and hence its prioritisation on its development agenda next to agriculture, as reflected in the
Industrialisation and Job Creation Strategy.
Zambia’s tourism sector remains and continues to be one of the country’s economic growth
and development areas with an estimation of slightly over 200, 000 jobs having been created
by 2017. The direct contribution of travel and tourism to the country’s GDP in 2016 stood at
K6.9billion (US$6million), representing 3.2 percent of total GDP.
48
Zambia’s tourism potential draws from its natural environment, from which abound a variety
of tourism attractions ranging from waterfalls, the wealth of wildlife spread out in the
country’s 20 national parks and 34 game management reserves with a total surface area of
65,000 square kilometres. Furthermore, the country boasts of vast lakes and rivers, one of
the largest concentrations of bird species in the world, a rich cultural heritage and several
monuments dotted around the country.
Zambia recorded a total of 956,332 international tourist arrivals in 2016 compared to
931,782 in 2015 – a marginal increase of 2.6 percent. The majority of the tourists who visited
Zambia used road as their mode of transport, accounting for 652,952 tourists while rail was
the least recording 2,871 tourist arrivals. About 53 percent of the tourists travelled for
business purposes while 26 percent came for leisure or holiday, visiting friends and relatives
accounted for six percent while conferences and study accounted for three and two percent
respectively.
According to the figures, most of the tourists who visited Zambia came from Africa,
accounting for 77.9 percent (744,543 tourists) of the total international arrivals followed by
Europe, with 9.2 percent (88,333 tourists) of arrivals, Asia contributed 7 percent, while
Americas accounted for 5 percent and Australia contributed 0.9 percent to the total arrivals.
The total number of tourist visits to the five major national parks was 107,464, recording an
increase of 5.4 per cent compared to 2015 which recorded 101,972 visitors. South Luangwa
National Park had the highest number of tourists at 46,510 while Kafue National Park
recorded the least tourists at 11,347. The Victoria Falls, one of the Seven Wonders of the
World and Zambia’s flagship tourism products, recorded 167,710 tourist visits in 2016
compared to 141,929 visitors in 2015, representing an increase of 18.2 percent. International
tourists increased from 29,575 in 2015 to 51,450 in 2016 resulting in an increase of 74
percent while domestic tourists increased from 112,354 in 2015 to 116,260 in 2016
representing an increase of 3.5 percent.
5.4 Zambia Tourists Attractions
5.4.1 National Parks
About 30% of Zambia’s 752,614 square kilometres is reserved for wildlife. There are 20
national parks and 34 game management areas in the country. South Luangwa, Kafue and

49
Lower Zambezi rank among the finest game parks in the world. The major national parks
are:
Kafue National Park: largest park;
Lower Zambezi National Park: Has a large population of elephants, buffaloes,
waterbucks and zebra;
Mosi-oa-Tunya National Park; and
South Luangwa National Park: Has one of the largest concentrations of wildlife in the
world.
5.4.2 Waterfalls
Zambia is one of the most water-rich countries in Africa and boasts 5 major rivers, 4 major
lakes, and over 20 magnificent waterfalls, including the Victoria Falls, one of the Seven
Natural Wonders of the World. It is a World Heritage Site with unique geological and
geomorphologic significance. The second most significant waterfall is the Kalambo Falls
which are nearly twice as high as the Victoria Falls. Other waterfalls include Lumangwe
Falls, Ngonye Falls, Chipembe Falls, Chisimba Falls and Ntumbachushi Falls.
5.4.3 Museums
Zambia has four national museums which play a significant role in interpreting the country’s
heritage through research, collections and exhibitions. There are:
Moto-Moto Museum: located in Mbala near Lake Tanganyika and Kalambo Falls
Lusaka National Museum: started as a national political museum and is now a
cultural history institution specialising in ethnography, art, archaeology and history;
Livingstone Museum: Oldest and largest museum. Its collection include the original
David Livingstone memorabilia (including signed letters), tribal artefacts (from bark
cloth to witchcraft exhibits), a life-sized model of an African village, taxidermy
displays and coverage of modern-day Zambian history; and
Copperbelt Museum is a living museum located in Ndola, Zambia.
5.4.4 Cultural Ceremonies
Zambia has a diverse population with a total of 73 languages. Each is distinguished from the
other by unique and colourful traditional customs and lifestyles. The most significant cultural
festivals are:

50
Kulamba: Held after harvest in late August, as a way of bringing together different
Chewa chiefs from the three countries (Zambia, Malawi and Mozambique) to present
their reports of grievances to paramount chief Kalonga Gawa Undi;
Kuomboka: Held in March or April to mark the migration of the people from the
flooded plains to higher grounds;
Umutomboko: Held every last Saturday of July at Chief Kazembe’s Palace;
Likumbi Lya Mize: Held in July or August on the last Saturday of the month at the
Mize palaceof the Senior Chief Ngundu in Zambezi;
Shimunenga: Is celebrated on the weekend of the full moon in September or October
in memory of mourning of Shimunenga. The Shimunenga cattle drive lasts for three
days; and
Ukusefya pa Ng’wena: Held around August/September and is to celebrate the
formation of the Bemba people and nation, and their subsequent achievements.
5.5 Cross border road transport permits
The number of permits issued by the C-BRTA from South Africa to Zambia for freight in
2017/18 is 12 616 which is a 3.3% decrease from 13 044 that was issued in 2016/17.
Passenger permits that were issued are 83 and 34 during the same review respectively,
which resulted in 144.1% increase and bus permits showed a higher increase of 150% from
22 in 2016/17 to 55 in 2017/18. Table 15 below shows the number of permits issued to
South African operators to operate between South Africa and Zambia.
Table 15: Operator permits issued in the period
FINANCIAL YEAR FREIGHT PERMITS BUS PERMITS PASSENGER PERMITS
2016/2017 13 044 22 34
2017/2018 12 616 55 83
Source: the CBRTA, Accessed on 16/07/2018
A total of 91,629 permits were issued for the year ending 31 March 2018, which is 13,629
permits more than the annual target of 78 000 for all the modes.
Currently there are no taxi passengers’ movement between the two countries due to the
distance, rugged terrain, comfort and productivity cost of the operation. There are three bus
companies namely Autopax, Go-liner and Inter-Cape operating the cross-border from South
Africa to Zambia.
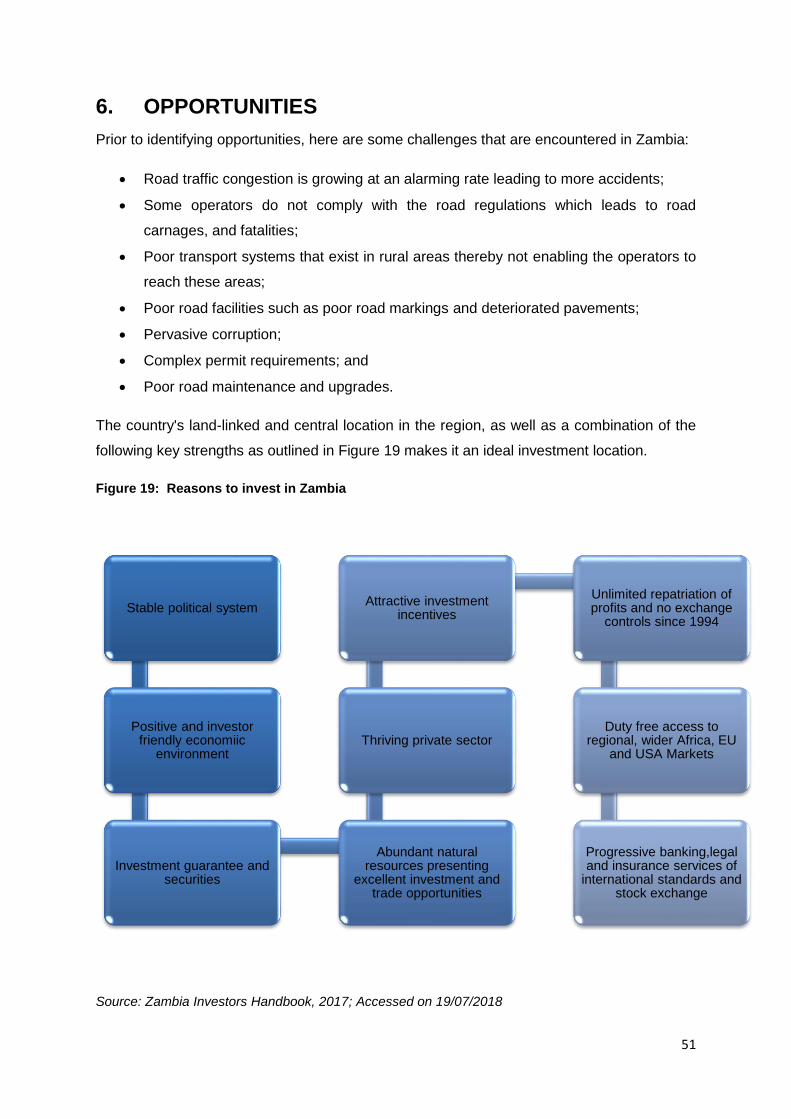
51
6. OPPORTUNITIES
Prior to identifying opportunities, here are some challenges that are encountered in Zambia:
Road traffic congestion is growing at an alarming rate leading to more accidents;
Some operators do not comply with the road regulations which leads to road
carnages, and fatalities;
Poor transport systems that exist in rural areas thereby not enabling the operators to
reach these areas;
Poor road facilities such as poor road markings and deteriorated pavements;
Pervasive corruption;
Complex permit requirements; and
Poor road maintenance and upgrades.
The country's land-linked and central location in the region, as well as a combination of the
following key strengths as outlined in Figure 19 makes it an ideal investment location.
Figure 19: Reasons to invest in Zambia
Source: Zambia Investors Handbook, 2017; Accessed on 19/07/2018
Stable political system
Positive and investor friendly economiic
environment
Investment guarantee and securities
Abundant natural resources presenting
excellent investment and trade opportunities
Thriving private sector
Attractive investment incentives
Unlimited repatriation of profits and no exchange
controls since 1994
Duty free access to regional, wider Africa, EU
and USA Markets
Progressive banking,legal and insurance services of
international standards and stock exchange
52
For those conducting or intending to conduct business in Zambia, the opportunities for
investment are in the following sectors:
6.1 Mining sector
Zambia is the world’s eighth largest producer of copper and holds six percent of the world’s
known copper reserves. Copper and cobalt, as the country's traditional exports account for
well over 70 percent of export earnings. Other minerals include gold and gemstones (eg
emeralds, aquamarine, topaz, opal, agate and amethysts). Zambia produces over 20% of
the world’s emeralds. This extensive range of mineral resources, including a variety of
industrial minerals, and energy resources including uranium, coal and hydrocarbons,
presents excellent investment opportunities in the extraction and processing of these
minerals in the country.
Opportunities in this sector include:
Extraction and processing of minerals;
Establishment of copper and other mining related industrial park;
Copper mining and beneficiation, especially in setting up copper smelting and
refinery facilities;
Iron mining and beneficiation to supply for the iron demands of burgeoning domestic
and regional markets;
Manganese mining and processing for exports. Exports markets include South Africa,
Switzerland, Belgium, and the DRC;
Providing mining support services (in particular, machinery) for the mining sector;
and
Joint-ventures with existing small-scale operators or in green fields investments in
gemstone mining and processing (emeralds, amethyst, aquamarine, tourmaline,
garnets and beryl).
Figure 20 below shows the main routes of the minerals in Zambia.
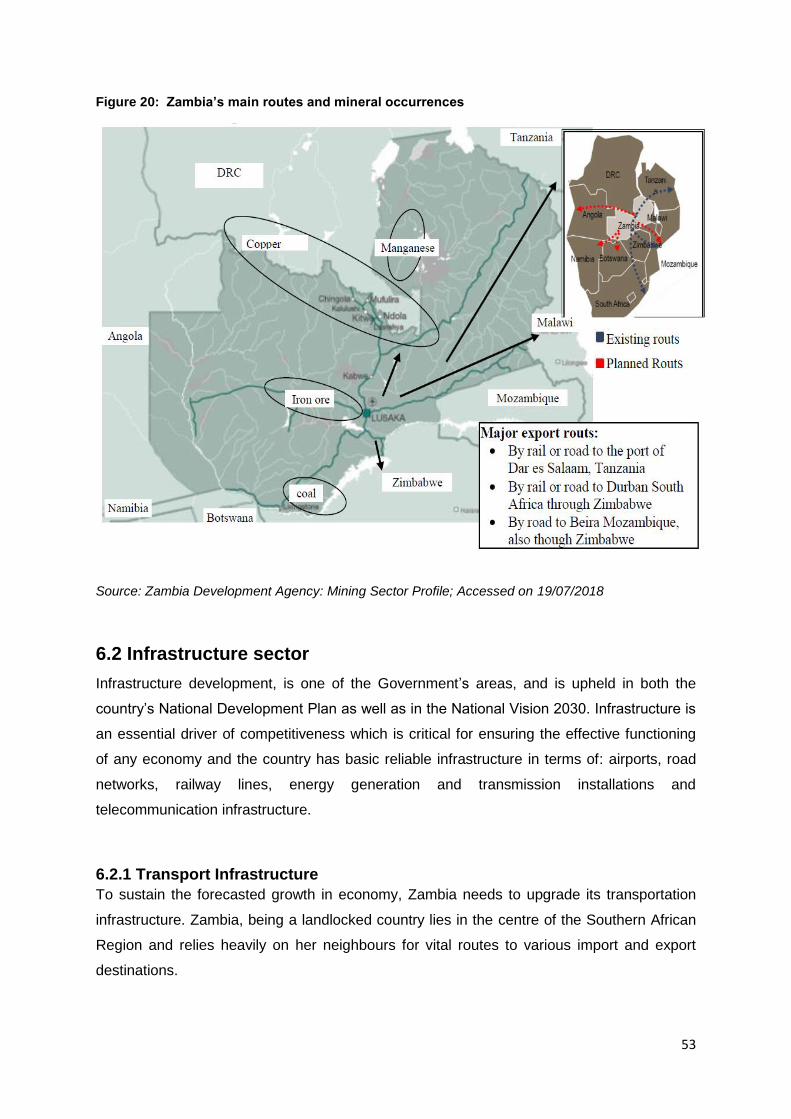
53
Figure 20: Zambia’s main routes and mineral occurrences
Source: Zambia Development Agency: Mining Sector Profile; Accessed on 19/07/2018
6.2 Infrastructure sector
Infrastructure development, is one of the Government’s areas, and is upheld in both the
country’s National Development Plan as well as in the National Vision 2030. Infrastructure is
an essential driver of competitiveness which is critical for ensuring the effective functioning
of any economy and the country has basic reliable infrastructure in terms of: airports, road
networks, railway lines, energy generation and transmission installations and
telecommunication infrastructure.
6.2.1 Transport Infrastructure
To sustain the forecasted growth in economy, Zambia needs to upgrade its transportation
infrastructure. Zambia, being a landlocked country lies in the centre of the Southern African
Region and relies heavily on her neighbours for vital routes to various import and export
destinations.

54
Transport infrastructure covers: roads and bridges, railways, airports and aerodromes and
maritime and inland waterways. The state of transport infrastructure remains inadequate to
sustain and match the desired levels of growth due to weak structural and management
capacity resulting in over commitments, high cost of construction and low investment.
Government seeks to strongly address these challenges and is focusing on construction,
rehabilitation and maintenance of physical infrastructure.
6.2.1.1. Airports
There are four international airports; five secondary airfields and five airstrips serving the
international and domestic flights. The Kenneth Kaunda International Airport is Zambia’s
main airport connecting the country with the rest of the world. This is complimented by three
smaller airports at Ndola, Livingstone and Mfuwe, as well as secondary airfields at Chipata,
Kitwe, Kasama, Mongu, Solwezi and Mansa. Zambia has no national airline but is served by
a number of airlines that connect to international routes via Johannesburg, Durban, Cape
Town, Addis Ababa, Nairobi, and Dubai.
Pro-flight Zambia is a privately run airline with proposed regional flights to Johannesburg and
Congo DRC and local flights to various destinations within the country. The country recently
adapted an “open sky policy” and is currently promoting the establishment of an air cargo
hub for the Southern African region.
Government has embarked on a program to improve the infrastructure at all the international
airports. This is being done in collaboration with private sector participation. The
developments include the runways, terminals and auxiliary facilities in and around the
airports such as hotels, shopping malls, and conference facilities. Other opportunities include
the development of the Mansa airport into an international airport and the construction and
upgrading of district and provincial aerodromes and erection of toll gates.
6.2.1.2. Roads
The Government of Zambia embarked on the Link Zambia 8,000 project (Accelerated
National Roads Construction Programme) aimed at rehabilitating and constructing the road
network. The aim is to construct an efficient road network and international highways linking
Zambia to South Africa, Zimbabwe, Mozambique, Malawi, Tanzania, the Democratic
Republic of Congo and Namibia. This project also aims at contributing to the reduction of
road user costs and transit times across Zambia.
Opportunities in the road sub sector are:
Upgrading of the following roads to bitumen and erection of toll gates

55
Solwezi-Kipushi road: upgrading and erection of toll gates;
Mwinilunga-Jimbe: upgrading and erection of toll gates;
Katunda-Lukulu- Watopa;
Kalabo-Kalanola-Sitoti-Matebele;
Luwingu-Chilubi;
Mpongwe-Machiya: upgrading and erection of toll gates;
Lufwanyama-Kankolonkolo: upgrading and erection of toll gates;
Kazungula-Livingstone;
Chirundu-Chilanga; and
Chingola-Solwezi-Mutanda.
6.2.1.3. Railways
The Government intends to expand its railway network in the country to develop the surface
transport sector. The development of rail routes linking important exit points is not only vital
for facilitating smooth access to the outside world but also for the overall boosting of trade in
the sub-region and making Zambia a competitive country for doing business.
The Zambian railways generally operate well below their original design capacity, yet they
cannot increase their volumes because of poor track condition, lack of locomotive and
wagon availability and low operating capital.
Government is seeking private sector participation in the development and rehabilitation of
the railway infrastructure. Some of the opportunities as indicated in Figure 21 below include
the links between Zambia with Tanzania. The recent opening of the Chipata-Mchinji railway
link provides connectivity into the Malawi railway network and further connects Zambia to the
northern Mozambique railway network and opens up new and exciting opportunities for the
private sector in Zambia, Malawi, and Mozambique.
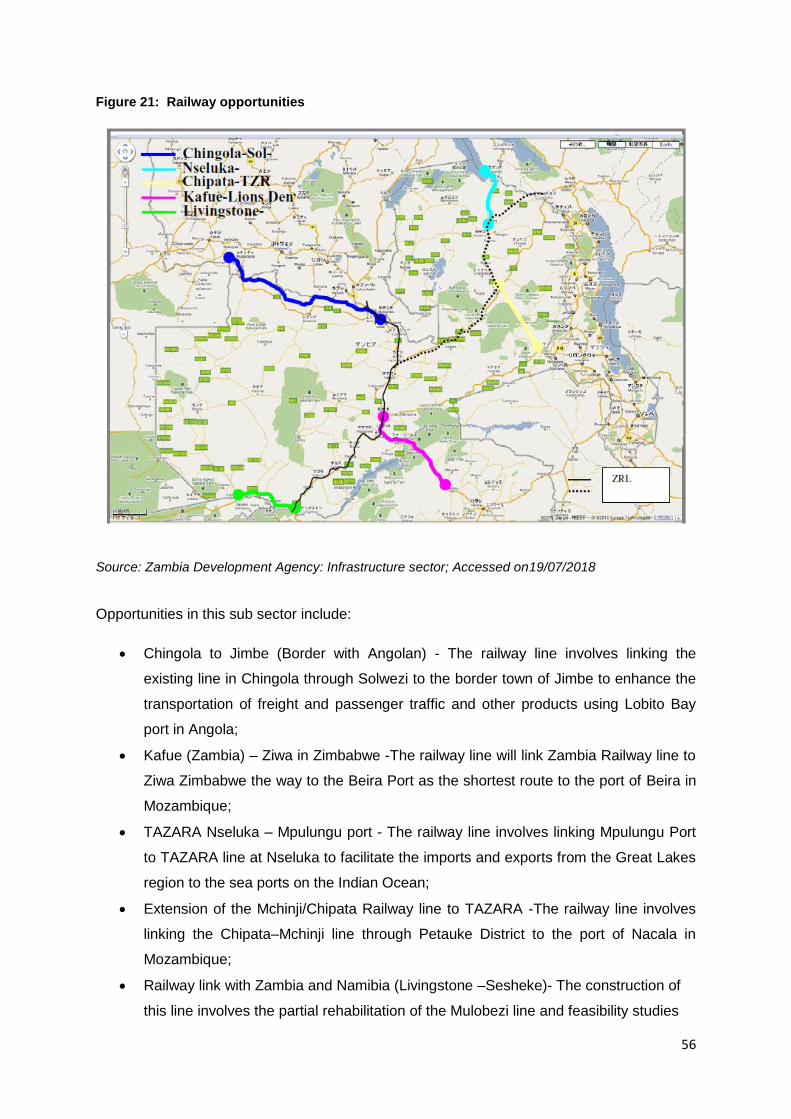
56
Figure 21: Railway opportunities
Source: Zambia Development Agency: Infrastructure sector; Accessed on19/07/2018
Opportunities in this sub sector include:
Chingola to Jimbe (Border with Angolan) - The railway line involves linking the
existing line in Chingola through Solwezi to the border town of Jimbe to enhance the
transportation of freight and passenger traffic and other products using Lobito Bay
port in Angola;
Kafue (Zambia) – Ziwa in Zimbabwe -The railway line will link Zambia Railway line to
Ziwa Zimbabwe the way to the Beira Port as the shortest route to the port of Beira in
Mozambique;
TAZARA Nseluka – Mpulungu port - The railway line involves linking Mpulungu Port
to TAZARA line at Nseluka to facilitate the imports and exports from the Great Lakes
region to the sea ports on the Indian Ocean;
Extension of the Mchinji/Chipata Railway line to TAZARA -The railway line involves
linking the Chipata–Mchinji line through Petauke District to the port of Nacala in
Mozambique;
Railway link with Zambia and Namibia (Livingstone –Sesheke)- The construction of
this line involves the partial rehabilitation of the Mulobezi line and feasibility studies

57
for construction of a spur between Livingstone and KatimaMulilo via Kazungula and
connect to the Nambian Railway System at (Border) as part of the Walvis Bay –
Livingstone – Lusaka – Ndola – Lubumbashi Corridor; and
Development of a modern urban metro mass transit railway line to cater for the
growing population in Lusaka, a line linking Kafue to Ziwa (Zimbabwe), extension of
the TAZARA line and a line from Livingstone to Sesheke district.
6.2.2 Housing and Estate Infrastructure
Zambia has been facing a very critical shortage of housing since independence. There is a
definite shortage of housing supply in many urban centres and in rapidly growing towns and
districts. The Copperbelt and North Western province where mining activities have resurged
are also experiencing serious housing shortages. The creation of new Provinces and
districts also increased the housing demand in these areas to meet the standards at district
and provincial level, especially for civil servants.
There is an enormous need for modern cluster style homes, commercial and social facilities.
Demands for commercial properties include business parks, shopping malls and office
blocks. Demands for social infrastructure include construction and development of schools,
health facilities and other public infrastructure services.
Further developments with demand for infrastructure facilities include the development of
Multi-Facility Economic Zones and industrial parks. The government also recently embarked
on the establishment of Multi Facility Economic Zones (MFEZ) and Industrial Parks to boost
manufacturing activities in the country. These will be industrial areas for both export
orientated and domestic orientated industries, with the necessary infrastructure provided. So
far four (4) zones – the Chambeshi MFEZ in Kitwe district, the Lumwana MFEZ in Solwezi
district, the Lusaka East MFEZ and the Lusaka South MFEZ, and 2 industrial parks – the
Roma Industrial Park and the Ndola Gemstone Exchange Park, have been declared by the
government and are being developed. Opportunities in the housing and estate development
sector include
Redevelopment of the Zambia International Trade Fair:
In the provincial city of Ndola on the Copperbelt, there is a 60 hectare ground which
accommodates the Zambia International Trade Fair and a 52 room hotel. This is the
home of Zambia’s premier international trade fair. Only 30 hectares has been developed
in the grounds. Government through the Ministry of Commerce, Trade and Industry is
seeking development partners to joint finance, re-design and redevelop the trade fair
58
grounds into a modern exhibition, entertainment and business centre which can be used
as Zambia’s main business exhibition and trade centre;
Development of a multi-storey building for office accommodation to house the 5 statutory
bodies under the Ministry of commerce, Trade and Industry;
Development of a 2100 hectare multi-facility economic zone in Lusaka;
Development of student hostels and staff housing at the University of Zambia (UNZA);
Construction of 45 houses in Nakonde District; and
Development of mixed real estate complexes comprising of commercial and business
hubs with residential units and quality tourism and leisure facilities.
6.2.3 Energy Infrastructure
Zambia is endowed with a wide range of energy resources, particularly woodlands and
forests, hydropower, coal and renewable sources of energy. Petroleum is the only energy
source that is currently wholly imported. Hydro power is the most important energy source in
the country after wood fuel, contributing about 10 percent to the national energy supply and
is generated by three major hydroelectric power stations. Other energy sources are
petroleum, coal and wood. There is massive potential for private sector investment in
hydroelectricity and thermal power generation, transmission and distribution, and supply of
petroleum products, including bio-fuels.
Opportunities in the power sector include:
Electricity Generation and transmission;
Refineries, storage facilities and pipelines for petroleum and gas;
Renewable energy facilities;
Transport facilities for coal distribution and exports; and
Construction of the Kapamba and Mumburuma hydro power stations;
Development of solar power plants; and
The construction of a fuel storage depot.
6.3 Agriculture sector
Zambia is endowed with a large land resource base of 42 million hectares of which only 1.5
million hectares is cultivated every year. There are abundant water resources for irrigation
and the country has 40 percent of the water in Central and Southern Africa.
59
The agricultural sector continues to be the backbone of the Zambian economy as it
contributes to the growth of the economy and also to exports. Primary agriculture contribute
about 35 percent to the country’s total non-traditional exports (all the country’s exports other
than copper and cobalt) and about 10 percent of the total export earnings for the country.
The following opportunities are available:
Development of 12 000 Ha of land as a joint venture with more than 350 small and
medium farms for out grower scheme development;
Development of farm block for cotton production in Lundazi;
Establishment of livestock breeding and artificial insemination centres
Agro processing opportunities include:
o Peanut butter production;
o Cashew nut processing;
o Cassava Processing (food and other industrial products);
o Grain Milling (Rice, Maize, Wheat);
o Edible oil Production;
o Fruit Canning and Juice Extraction;
o Meat, dairy, leather and leather products;
o Fish canning and fish meal production;
o Bio-diesel production and ethanol production; and
o Honey processing
Investment Opportunities in the Fisheries Sector
o Cold storage and fish Haulage;
o Aqua-culture; and
o Fish Ornaments.
6.4 Tourism sector
Zambia’s tourism sector is currently one of the country’s growth potential areas. It has been
given the non-traditional export status and is receiving a lot of support from the Government
by way of infrastructure development, promotion of increased private sector participation, as
well as attractive tax incentives for all investments in the sector.
Zambia’s tourism potential draws from its natural environment, from which abound a variety
of tourism attractions. The main tourism attractions in the country include; the Victoria Falls
(which is one of the most renowned beautiful transcendental Seven Natural Wonders of the
60
World), and the wealth of wildlife spread out in the country’s 19 national parks and 34 game
management areas with a total area of 65,000 km2. Furthermore the country boasts of vast
water falls, lakes and rivers, one of the largest concentrations of bird species in the world, a
rich cultural heritage and several monuments spread across the country.
Opportunities are to redevelop the existing Mulungushi International Conference Centre into
an ultra-modern international conferencing facility. This involves refurbishing the existing
infrastructure, developing a 5000 capacity auditorium, exhibition centre, Business Park and
office block and a 5 and 3 star hotels.
6.5 Manufacturing sector
The manufacturing sector in Zambia accounts for about 11 percent of the country’s GDP and
has been growing at an average annual growth rate of 3 percent in the last five years.
Growth in the sector is largely driven by the agro processing (food and beverages), textiles
and leather subsectors.
Secondary processing of metals is another main activity in the sector, including the smelting
and refining of copper, and this has led to the manufacturing of metal products. Fertilizers,
chemicals, explosives and construction materials such as cement are also produced in the
sector. Other activities include wood products and paper products. However, the sector
needs to produce a wide range of high quality value added intermediate and final products
for the export markets.
The manufacturing activities in the country are undertaken by the private sector with
government playing a proactive role. The sector is of vital importance in relation to the
country’ macroeconomic strategy for encouraging broad based economic growth. In this
regard, the Government has put in place measures to support manufacturing activities, such
as the establishment of Multi-Facility Economic Zones (MFEZs) and Industrial Parks (these
are industrial areas for both export orientated and domestic orientated industries, with the
necessary support infrastructure installed), and provision of sector-specific investment
incentives. Government also promotes small and medium enterprises in rural and urban
areas so as to enhance labour intensive light manufacturing activities in these areas.
The growth is largely driven by agro-processing, textiles and leather subsectors. Investment
opportunities are in:
Food processing: growing and processing of oil seeds, downstream processing of
livestock products, fish processing activities and processing of grocery products;
61
Textiles and clothing: Textile, garment and apparel manufacturing have a very high
potential in Zambia;
Mineral processing: manufacturing of copper wire and other copper products and the
cutting and polishing of gemstones;
Chemical products: The processing of minerals for the agro industry is another area
in which demand is fast growing in Zambia. Zambia contains many agricultural
minerals. Peat and limestone deposits are available for the manufacturing of soil
conditioners while phosphates are also available for the production of fertilizers.
Opportunities exist in the production of fertilizers due to the presence of feasible
sources of fertilizers in the following areas:
the Chilembwe deposits near Petauke district estimated at 1.6 million tonnes;
Mumbwa deposits at 500,000 tonnes;
Nkombwe (near Isoka district) at 500 million tonnes; and
Kaluwe (near Luangwa) estimated at 207 million tonnes.
Establishment of rural based plants in any of the above areas would contribute to the
realisation of food security, increase agricultural productivity and improve the quality
of life of the people. The country is also endowed with mineral deposits for the
production of other chemical products such as cement, adhesives and explosives, as
well as; glass, batteries, argon gas, sulphuric acid, paints, cosmetics, soaps and
detergents.
Engineering and metal works: Zambia has a variety of minerals which are exported
as raw materials. At present there is very little value addition being made to these
mineral exports. Hence there are massive investment opportunities in processing
copper, iron ore and steel, cobalt and other minerals into intermediate and finished
engineering products. Engineering products have a ready local market from the
mines (for the supply of mining equipment), construction companies, and other
industries. The manufacture of engineering products includes metal items such as
window frames, doors and roofing materials, as nuts and bolts, as well as light
engineering products such as cable carbon brushes, switch gears, pipes and rail
sleepers. Furthermore, Zambia imports all major spare parts required for machinery
and therefore investment opportunities also exist in the local manufacture of spare
parts for various industrial machines.
62
Electrical Appliances: Enormous potential exists in the manufacture of electrical
appliances such as Refrigerators, Air Conditioners, Computers, Transformers,
Television sets, Stoves, Fans and other goods. Most of these products are currently
imported from within the Southern African region, the Far East and Europe.
Pharmaceutical products: Zambia and her surrounding neighbours have relatively
high burdens of diseases that require high consumption of pharmaceutical products.
Malaria, HIV/AIDS and other ailments have constantly triggered demand on these
products, which are mostly sourced outside Africa. There are a limited number of
manufacturing companies and pharmaceutical trading companies in the country.
Most of these manufacturing companies are engaged in the manufacturing of basic
pharmaceutical formulations (medicines). The majority of essential health drugs are
still being imported. Therefore there is scope for new investments in the manufacture
of pharmaceutical products such as moringa and atemisia for the production of
coatem.
Packaging materials : Investment opportunities exist in packaging materials to supply
other industries such as the food processing industry (for packaging material of grain
milling, products, sugar, opaque beer, dairy products, cold meats and canned foods)
and the chemical products industry (for packaging of soaps, detergents, cement and
fertilizers). Other industries that require packaging materials are; leather products,
electrical appliances and pharmaceuticals.

63
7. CONCLUSION
Zambia is a landlocked country in Southern Africa, neighbouring the Democratic Republic of
the Congo to the north, Tanzania to the north-east, Malawi to the east, Mozambique to the
southeast, Zimbabwe and Botswana to the south, Namibia to the southwest and Angola to
the west. At an area of 752,618 km², the country is slightly larger than twice the size of
Germany or slightly larger than Texas. The current population is 17,466,732 which is
equivalent to 0.23% of the total world population.
Zambia is a low middle-income country which experienced robust economic growth during
the commodity boom averaging 7.4% (2004-2014) but the economy came under strain and
growth slowed to less than 3% in 2015. Growth slowed during the period 2015 to 2017 due
to falling copper prices, reduced power generation, and depreciation of the kwacha.
Zambia’s lack of economic diversification and dependency on copper as its sole major
export makes it vulnerable to fluctuations in the world commodities market.
As a landlocked country, Zambia depends on its neighbours for exports and imports to
access seaports. This requires a high level of co-operation and co-ordination to ensure that
movement of goods and services across borders is as efficient as possible. In 2016 Zambia
exported $10.5billion, making it the 107th largest exporter in the world. In the fourth quarter
of 2017, Zambia’s total trade (exports and imports) increased to US$4.84 billion from
US$3.98 billion in the corresponding period in 2016.
The road network is the backbone of the Zambian transport system, reaching the remote
areas of the country. Zambia has a total classified network of 67,671km of public roads.
Trade Corridors are vital to sustaining Zambia’s economic activity. The following are the
corridors: The Southern Corridor links Zambia to the Durban Port in South Africa; The Walvis
Bay Corridor connects Zambia to the Port of Walvis Bay in Namibia; Zambia is linked to
Mozambique through three corridors: The Maputo Corridor to the Port of Maputo; the Beira
Corridor to Beira and the Nacala Corridor to Nacala. Finally, the Tazara Corridor connects
Zambia to Dar es Salaam, Tanzania.
Zambia has vast opportunities in various sectors which includes extraction and processing of
minerals in the mining sector; upgrading of roads and erection of toll gates in the transport
sector; agro processing in the manufacturing sector and construction of hydro power stations
in the energy sector.
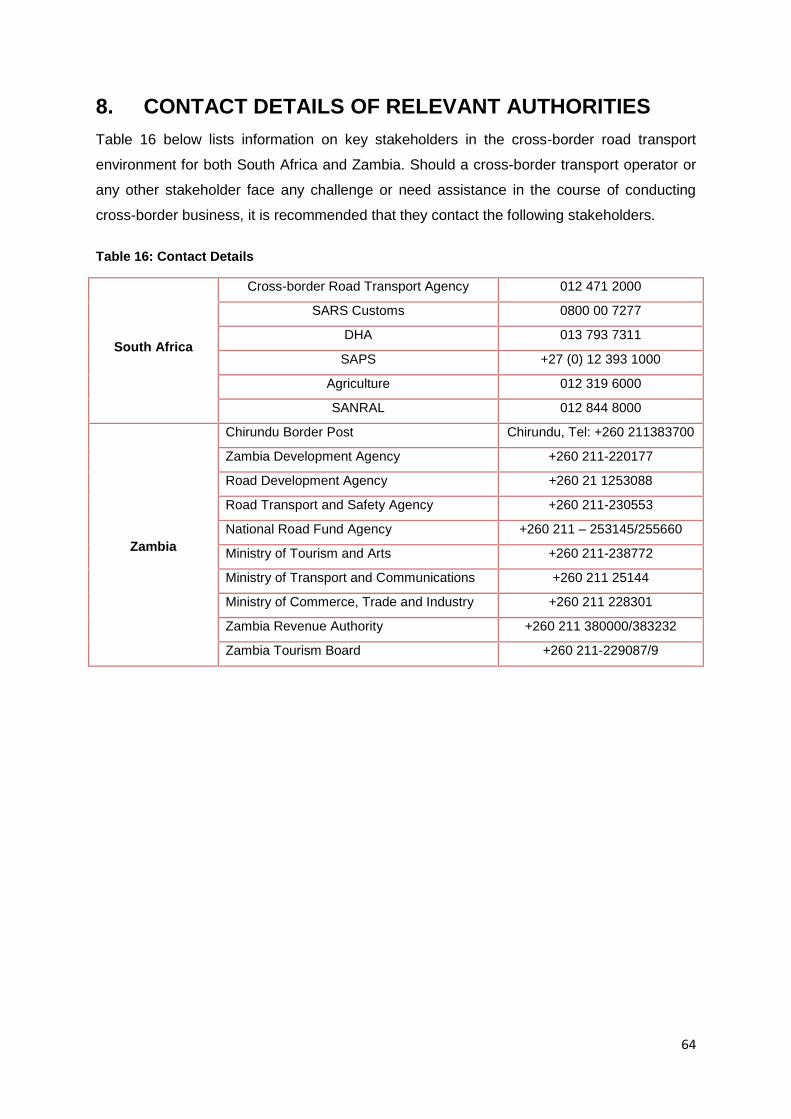
64
8. CONTACT DETAILS OF RELEVANT AUTHORITIES
Table 16 below lists information on key stakeholders in the cross-border road transport
environment for both South Africa and Zambia. Should a cross-border transport operator or
any other stakeholder face any challenge or need assistance in the course of conducting
cross-border business, it is recommended that they contact the following stakeholders.
Table 16: Contact Details
South Africa
Cross-border Road Transport Agency 012 471 2000
SARS Customs 0800 00 7277
DHA 013 793 7311
SAPS +27 (0) 12 393 1000
Agriculture 012 319 6000
SANRAL 012 844 8000
Zambia
Chirundu Border Post Chirundu, Tel: +260 211383700
Zambia Development Agency +260 211-220177
Road Development Agency +260 21 1253088
Road Transport and Safety Agency +260 211-230553
National Road Fund Agency +260 211 – 253145/255660
Ministry of Tourism and Arts +260 211-238772
Ministry of Transport and Communications +260 211 25144
Ministry of Commerce, Trade and Industry +260 211 228301
Zambia Revenue Authority +260 211 380000/383232
Zambia Tourism Board +260 211-229087/9
65
9. REFERENCE
Africa, U. N. (2017). Africa Regional Integration Index .
Agency, Z. D. (2017). Tourism Sector Profile. Lusaka, Zambia.
Arts, M. o. (2015). 2015 Tourism Statistical Digest. Lusaka: Republic of Zambia.
Bank of Zambia. (2015). Annual Report. Lusaka.
Bank of Zambia. (2017). Zambia Direction of Trade Report. Lusaka, Zambia.
Foster, V. &. (2011). Zambia's Infrastructure: A continental Perspective. Washington DC:
World Bank.
KPMG. (2017). Zambia Economic Snapshot H2.
Woolfrey, S. (2016, January). The political economy of regional integration in Africa:
COMESA Report. Lusaka, Zambia.
World Bank. (2018). Doing Business 2018: Economy Profile 2018 Zambia. Washington: The
World Bank.
World Economic Forum. (2017). Global Competitiveness Report 2017-2018. Geneva: World
Economic Forum.
Zamba, C., Chirwa, E., & Rasmussen, P. (2017). African Economic Outlook: Zambia 2017.

66
Related Documents