Annals of the „Constantin Brâncuş i” University of Târgu Jiu, Economy Series, Issue 3/2016 „ACADEMICA BRÂNCUŞI” PUBLISHER, ISSN 2344 – 3685/ISSN-L 1844 - 7007 Table of Contens 1. GENERATION Z ATTITUDES TOWARD GREEN MARKETING: A CROSS COUNTRY AND GENDER ANALYSIS BARAN TAMER, POPESCU CĂTĂLIN 6 2. TRENDS IN USING THE LABOUR FORCE SUBSEQUENT TO THE CRISIS GHIZDEANU ION, RĂBONŢU IRINA-CECILIA 10 3. ORGANIZATIONAL COMMUNICATION FROM THE TOP DOWN TO S.C. ARTEGO S.A. DORU CÎRNU, GABRIELA BUȘAN, IRINA ELENA CHIRTOC 22 4. TAX EVASION THROUGH FICTITIOUS ECONOMIC OPERATIONS, OBSTACLE TO SUSTAINABLE DEVELOPMENT SERGIU-BOGDAN CONSTANTIN 26 5. URBAN GREEN AREAS – ISSUES AND ANSWERS FOR SUISTAINABLE DEVELOPMENT (CASE STUDY IN ROMANIA) LIVIU NEAMŢU, ADINA CLAUDIA NEAMŢU 30 6. GRADUATES’ WILLINGNESS TO BUILD A CAREER IN TOURISM. A VIEW POINT OF THE STUDENTS IN THE TOURISM PROFILE ACADEMIC PROGRAMMES FROM THE TRANSILVANIA UNIVERSITY OF BRAŞOV CODRUȚA ADINA BĂLTESCU 36 7. APPROACHES ON MEASURING SUSTAINABLE DEVELOPMENT IN CONTEMPORARY WORLD – BEYOND CLASSICAL INDICATORS ALECU ALEXANDRA, DUŞMĂNESCU DOREL 40 8. SEMIOTICS- INTEGRAL PART OF THE ECONOMIC HERMENEUTICS ANDA- LAURA LUNGU 49 9. PROPOSAL REGARDING THE REFORMATION OF THE ROMANIAN PUBLIC PENSION SYSTEM NICOLAE ECOBICI 57 10. METHODS FOR IMPROVING THE LEVEL OF MANAGEMENT INOVAȚIONAL COMPANIES ROMANESCU MARCEL LAURENȚIU 61 11. NGO 'S ROLE IN SOCIAL ECONOMY MARIANA CLAUDIA MUNGIU-PUPĂZAN 65 12. A SYSTHEMATIC METHOD FOR DETERMINING THE FACTORS INFLUENCING THE AMOUNT OF PENSIONS CARINA-ELENA STEGĂROIU 69 13. HOW TO MAKE A DESTINATION MORE COMPETITIVE IN TOURISM GABRIEL SANDA 74 14. ELECTRONIC COMMERCE, PART OF THE INFORMATION SOCIETY TEODORESCU ANA-MARIA 78 15. EVALUATION OF THE INVESTMENT DECISIONS IN AGRICULTURE VASILE BURJA, SORINA SIMONA BUMBESCU 82 16. IMPLEMENTING CLEANER PRODUCTION IN ROMANIAN INDUSTRIAL ENTERPRISES IN TERMS OF SUSTAINABLE DEVELOPMENT PAUL BOGDAN ZAMFIR 88 17. KISCH / UL AND DURABLE DEVELOPMENT OF THE REGIONS THAT HAVE A LARGE NUMBER OF RELIGIOUS SETTLEMENTS ENEA CONSTANTA, ENEA CONSTANTIN 93 18. IMPROVING PERFORMANCES BY USING COST CONTROLLING IN THE MINING INDUSTRY ENTITIES SORINEL CĂPUŞNEANU, DAN IOAN TOPOR, ILEANA – SORINA RAKOS, CORINA DUCU, ANAMARIA TEPEŞ-BOBESCU 98 19. MIGRATION WITHIN THE EU AND ITS IMPACT ON UNEMPLOYMENT RATE HARALAMBIE GEORGE ALIN 109 20. STAGES AND EVOLUTIONS IN STRATEGIC MANAGEMENT ACCOUNTING CĂRUNTU GENU ALEXANDRU 114 21. UNCONDITIONAL BASIC INCOME – IMPACT ON THE ECONOMY OANA-VALENTINA CERCELARU 118 3

Welcome message from author
This document is posted to help you gain knowledge. Please leave a comment to let me know what you think about it! Share it to your friends and learn new things together.
Transcript

Annals of the „Constantin Brâncuşi” University of Târgu Jiu, Economy Series, Issue 3/2016
„ACADEMICA BRÂNCUŞI” PUBLISHER, ISSN 2344 – 3685/ISSN-L 1844 - 7007
Table of Contens
1. GENERATION Z ATTITUDES TOWARD GREEN MARKETING: A CROSS COUNTRY AND GENDER ANALYSIS BARAN TAMER, POPESCU CĂTĂLIN
6
2. TRENDS IN USING THE LABOUR FORCE SUBSEQUENT TO THE CRISIS GHIZDEANU ION, RĂBONŢU IRINA-CECILIA
10
3. ORGANIZATIONAL COMMUNICATION FROM THE TOP DOWN TO S.C. ARTEGO S.A. DORU CÎRNU, GABRIELA BUȘAN, IRINA ELENA CHIRTOC
22
4. TAX EVASION THROUGH FICTITIOUS ECONOMIC OPERATIONS, OBSTACLE TO SUSTAINABLE DEVELOPMENT SERGIU-BOGDAN CONSTANTIN
26
5. URBAN GREEN AREAS – ISSUES AND ANSWERS FOR SUISTAINABLE DEVELOPMENT (CASE STUDY IN ROMANIA) LIVIU NEAMŢU, ADINA CLAUDIA NEAMŢU
30
6. GRADUATES’ WILLINGNESS TO BUILD A CAREER IN TOURISM. A VIEW POINT OF THE STUDENTS IN THE TOURISM PROFILE ACADEMIC PROGRAMMES FROM THE TRANSILVANIA UNIVERSITY OF BRAŞOV CODRUȚA ADINA BĂLTESCU
36
7. APPROACHES ON MEASURING SUSTAINABLE DEVELOPMENT IN CONTEMPORARY WORLD – BEYOND CLASSICAL INDICATORS ALECU ALEXANDRA, DUŞMĂNESCU DOREL
40
8. SEMIOTICS- INTEGRAL PART OF THE ECONOMIC HERMENEUTICS ANDA- LAURA LUNGU
49
9. PROPOSAL REGARDING THE REFORMATION OF THE ROMANIAN PUBLIC PENSION SYSTEM NICOLAE ECOBICI
57
10. METHODS FOR IMPROVING THE LEVEL OF MANAGEMENT INOVAȚIONAL COMPANIES ROMANESCU MARCEL LAURENȚIU
61
11. NGO 'S ROLE IN SOCIAL ECONOMY MARIANA CLAUDIA MUNGIU-PUPĂZAN
65
12. A SYSTHEMATIC METHOD FOR DETERMINING THE FACTORS INFLUENCING THE AMOUNT OF PENSIONS CARINA-ELENA STEGĂROIU
69
13. HOW TO MAKE A DESTINATION MORE COMPETITIVE IN TOURISM GABRIEL SANDA
74
14. ELECTRONIC COMMERCE, PART OF THE INFORMATION SOCIETY TEODORESCU ANA-MARIA
78
15. EVALUATION OF THE INVESTMENT DECISIONS IN AGRICULTURE VASILE BURJA, SORINA SIMONA BUMBESCU
82
16. IMPLEMENTING CLEANER PRODUCTION IN ROMANIAN INDUSTRIAL ENTERPRISES IN TERMS OF SUSTAINABLE DEVELOPMENT PAUL BOGDAN ZAMFIR
88
17. KISCH / UL AND DURABLE DEVELOPMENT OF THE REGIONS THAT HAVE A LARGE NUMBER OF RELIGIOUS SETTLEMENTS ENEA CONSTANTA, ENEA CONSTANTIN
93
18. IMPROVING PERFORMANCES BY USING COST CONTROLLING IN THE MINING INDUSTRY ENTITIES SORINEL CĂPUŞNEANU, DAN IOAN TOPOR, ILEANA – SORINA RAKOS, CORINA DUCU, ANAMARIA TEPEŞ-BOBESCU
98
19. MIGRATION WITHIN THE EU AND ITS IMPACT ON UNEMPLOYMENT RATE HARALAMBIE GEORGE ALIN
109
20. STAGES AND EVOLUTIONS IN STRATEGIC MANAGEMENT ACCOUNTING CĂRUNTU GENU ALEXANDRU
114
21. UNCONDITIONAL BASIC INCOME – IMPACT ON THE ECONOMY OANA-VALENTINA CERCELARU
118
3

Annals of the „Constantin Brâncuşi” University of Târgu Jiu, Economy Series, Issue 3/2016
„ACADEMICA BRÂNCUŞI” PUBLISHER, ISSN 2344 – 3685/ISSN-L 1844 - 7007
22. RISK AND THE FOREIGN DIRECT INVESTMENT - SYNTHETIC APPROACH LĂPĂDUŞI MIHAELA LOREDANA, CIURLĂU LOREDANA
123
23. THE SEPARATION BETWEEN ACCOUNTING PROFESSION AND TAX PROFESSION IN THE CONTEXT OF SUSTAINABLE DEVELOPMENT IN ROMANIA MIHAELA-NICOLETA BĂCANU
129
24. GREEN DEVELOPMENT FOR THE CITIES-INTEGRATED MANAGEMENT LIVIU NEAMŢU, ADINA CLAUDIA NEAMŢU
134
25. THE MANAGEMENT OF THE SUSTAINABLE DEVELOPMENT OF CAREER – GRAND SCULPTOR CONSTANTIN BRÂNCUȘI CORINA ANA BORCOȘI
139
26. INFORMATION SOCIETY AND FINANCIAL SUSTAINABILITY OF THE ROMANIAN HEALTH SYSTEM TATIANA BOGDAN
145
27. A SHORT ANALYSE OF THE DIALOGUE SOCIAL SYSTEMS AND THEIR ROLE IN THE ECONOMIC DEVELOPMENT CEAUSESCU IONUT
150
28. ARE LEISURE AND WORK PRODUCTIVITY CORRELATED? A MACROECONOMIC INVESTIGATION ANA-MARIA SAVA
155
29. REDUCING GREENHOUSE GAS EMISSIONS AND THE INFLUENCES ON ECONOMIC DEVELOPMENT ANGHELUȚĂ PETRICĂ SORIN
160
30. THE IMPACT OF CULTURE ON THE ECONOMIC CRISIS CARINA-ELENA STEGĂROIU
166
31. FINANCIAL PERFORMANCES MEASUREMENT TOOLS BÎRCĂ ALIONA
169
32. IMPORTANCE OF SMES IN EUROPEAN COUNTRIES ECONOMY ROMANESCU MARCEL LAURENȚIU
174
33. STUDY ON INCREASING THE SHARE CAPITAL BY NEW CONTRIBUTIONS IN CASH AND IN KIND CARUNTU GENU ALEXANDRU, HOLT GHEORGHE
178
34. USING PARAMETRIC METHODS FOR OPTIMIZIMG PRODUCTION COSTS IN ECONOMIC ENTITIES WOOD PROCESSING INDUSTRY GHEORGHE(DAMIAN) AURELIA, DAMIAN DORIAN FLORIN
182
35. TOURISM IN THE GORJ COUNTY-THE LAST 10 YEARS OF DEVELOPMENT GABRIEL SANDA
185
36. THE IMPACT OF ICT SECTOR ON THE SOCIAL PILLAR OF SUSTAINABLE DEVELOPMENT TEODORESCU ANA-MARIA
189
37. ANALYSIS OF THE DURATION OF UNEMPLOYMENT IN ROMANIA ROMANESCU GEORGE OCTAVIAN
193
38. RECENT ASPECTS ON TERRITORIAL DISPARITIES IN FINANCIAL BEHAVIOUR OF HOUSEHOLDS IN ROMANIA BABUCEA ANA-GABRIELA
198
39. THE NEW CLASSICAL ECONOMY AND COUNTER-REVOLUTION OF THE MONETARISM KRUME NIKOLOSKI
206
40. REVIEW OF ECONOMIC DEVELOPMENT IN THE REPUBLIC OF SERBIA IN TRANSITION CONDITIONS JELENA TOSKOVIC, SLOBODAN POPOVIC, JOVANA ADZIC
212
41. ROLE OF FINANCIAL SUBSIDIES ALLOCATED BY THE CAP AND OUT EMIGRATION IN ROMANIAN RURAL AREAS NICOLA GALLUZZO
218
42. TOTAL REVENUE - TOTAL EXPENDITURE INTERDEPENDENCE FOR A HOUSEHOLD IN ROMANIA SAVU MIHAELA, VOICU OANA-LUMINIȚA
225
43. THE TAX POLICY WITHIN THE EUROPEAN UNION: CONCEPTS, INSTITUTIONS, TRENDS AND CHALLENGES CRISTINA COJOCARU (BOROVINA), RALUCA ELENA MOISESCU (DUICAN)
230
44. THE OPTIMIZATION OF THE ENTERPRISE FINANCIAL ANALYSIS TROUGH THE FINANCIAL SYSTEM OF CONTROL DU PONT GÂDOIU MIHAELA
236
45. CLUSTERS’ ROLE IN REGIONAL DEVELOPMENT 241
4

Annals of the „Constantin Brâncuşi” University of Târgu Jiu, Economy Series, Issue 3/2016
„ACADEMICA BRÂNCUŞI” PUBLISHER, ISSN 2344 – 3685/ISSN-L 1844 - 7007
BORDEI CONSTANTIN 46. VIRTUAL CURRENCY "BITCOIN" – CHALLENGES AND CONTROVERSIES
ȘOAVĂ GEORGETA, MEHEDINȚU ANCA, SITNIKOV CĂTĂLINA 248
47. ACCOUNTING TREATMENT OF THE FINANCIAL INCOMES AND EXPENSES HOLT GHEORGHE
260
48. THE ANALYSIS OF RESOURCES, MARKET AND THE INDICATORS OF THE ACCOMODATION STRUCTURES FOR THE TOURISTIC PRODUCT BOCSA AREA GHERGHINA LILIANA
265
49. REFLECTIONS ON THE IMPLEMENTATION OF INFORMATION SOCIETY IN ROMANIA PAUL BOGDAN ZAMFIR
272
50. THE IMPORTANCE OF COLLECTING ECONOMIC AND OTHER GENERAL FACTORS’ INFLUENCE ON THE VALUE OF PUBLIC COMPANIES IN SERBIA SLOBODAN POPOVIĆ, DRAGAN ĐURANOVIĆ, JELENA TOŠKOVIĆ, MENSUR CEMALOVIC, RANKO MIJIĆ
277
51. ARTIFICIAL CONDITIONS AND THE ABSORPTION OF EUROPEAN FUNDS IN THE FIELD OF AGRICULTURE IN ROMANIA DEACONU SORIN-CONSTANTIN
284
52. RESPONSABILITY AND TRANSPARENCY ON NON-FINANCIAL REPORTING GĂDĂU LIANA
291
53. PLACE AND ROLE OF THE STRUCTURAL FUNDS IN THE LOCAL BUDGET REVENUES CRISTINEL ICHIM
294
54. USES OF THE BALANCED SCORECARD SYSTEM IN THE STRATEGIC PLANNING AND THE IMPROVEMENT OF THE JUDICIARY FUNCTIONING HULPUŞ IOANA ALEXANDRA, MIRICESCU DAN
300
55. FINANCIAL RESOURCES MANAGEMENT AND THE IMPACT ON THE FINANCIAL POSITION OF THE ENTITIES IN THE ROMANIAN ENERGY SECTOR MIRON VASILE CRISTIAN IOACHIM, FOCȘAN ELEONORA IONELA, BOTA CRISTIAN FLORIN
306
56. ROMANIAN YOUNG LEADERS CAPABILITIES: AN EMPIRICAL SURVEY ANGELA-OLIMPIA LOBONEA OLTEAN
312
5

Annals of the „Constantin Brâncuşi” University of Târgu Jiu, Economy Series, Issue 3/2016
„ACADEMICA BRÂNCUŞI” PUBLISHER, ISSN 2344 – 3685/ISSN-L 1844 - 7007
GENERATION Z ATTITUDES TOWARD GREEN MARKETING:
A CROSS COUNTRY AND GENDER ANALYSIS
BARAN TAMER LECTURER, PAMUKKALE UNIVERSITY, KALE VOCATIONAL SCHOOL, DENIZLI, TURKEY
POPESCU CĂTĂLIN PROFESSOR, PETROLEUM-GAS UNIVERSITY, BUSINESS ADMINISTRATION DPT.,
PLOIESTI, ROMANIA [email protected]
Abstract
In social marketing definition, green marketing is the improvement and marketing of products layout to as far as possible minimize adverse effect level on the physical environment. As for environmental marketing definition, green marketing is defined for organizations endeavour to produce, promote, package and reclaim products in a manner that susceptible or responsive to environmental concerns. In this context we define green marketing performing marketing activities which include product improvement, pricing, promote and placing so as to minimize harm to the environment regardless of sector. Related to this approach it will be made a survey in order to analyse the attitude of young generation toward green marketing. It will be created a questionnaire that could offer a perspective about the behaviour of young people concern the environmental issues and future challenges. Keywords: Green Marketing, Generation Z, Green Consumer, Green Consumption JEL Classification: M31, C18, C12 1. WHAT IS THE GREEN MARKETING? WHAT ISN’T?
In the marketing literature it’s possible to find many green marketing definitions. For example, Saha and Darnton (2005: 121-122) defined green marketing as the special product regarding improvement, pricing, promotion and placing that don’t harm the environment. From this definition, it can be clearly understood that green marketing is not only associated with promotion or products with environmental features, but also includes all of the marketing elements. On the other hand, Polonsky (1994: 2), in his study, stated that green marketing is composed of whole activities made up for satisfying human expectation, needs and desires, with minimum effect harm on the environment. One of the earliest definitions of green marketing stated by Henion and Kinnear (1976) defined green marketing as the work of positive and negative orientation of marketing activity on environmental pollution, energy and non-energy resources consuming. One of the most important points of this definition declared that green marketing is consisting of a subset of the overall marketing activities (Polonsky, 1994: 2). Further AMA (2015) develops green marketing definitions in terms of retailing, social marketing and environmental marketing. In this approach, in retailing, green marketing can be defined as marketing of products that are assumed to be environmentally secure. On the other hand in social marketing definition, green marketing represents the improvement and marketing of products’ layout to as possible to minimize adverse effect level on the physical environment. As regarding environmental marketing definition, green marketing is defined for organizations endeavour to produce, promote, package and reclaim products in a manner that is susceptible or responsive to environmental concerns (AMA, 2015).
According to green marketing definitions given above it can be pointed out that green marketing don’t harm the environment but not in the same way such as activities like tree planting, greening etc. In this context we define green marketing performing marketing activities which include product improvement, pricing, promote and placing in order to minimize the impact to the environment.
Green marketing is important for both, companies and people. By green marketing strategies, companies can take some advantages such as be more socially responsible (Davies, 1992; Freeman and Liedtka, 1991; Keller, 1987), overcoming to governmental pressure (Saha and Darnton, 2005: 131), competitive advantages from competitors (Saha and Darnton, 2005: 131) etc. On the other hand, consumers are interested not only in purchasing and consuming but also in production process and in environmental problems and, also, they are considering themselves as green consumers (Zinkhan and Carlson, 1995: 2).
6

Annals of the „Constantin Brâncuşi” University of Târgu Jiu, Economy Series, Issue 3/2016
„ACADEMICA BRÂNCUŞI” PUBLISHER, ISSN 2344 – 3685/ISSN-L 1844 - 7007
Another critical issue is that there are so many studies about consumers’ environmental conscience. In this respect these studies have different findings that were revealed by authors. For example, based on Simmons Market Research Bureau’s (SMRB) or research of Kalafatis et. al. (1999: 442) is stated that consumers are not enthusiastic about purchasing environmental friendly products. On the contrary, Ottman (1993: 43) found that more than half of the 16 countries’ (included in his study) consumers are sensitive to environment pollution in his research. Similarly Fisher (1990), Cross (1990) and Donaton and Fitzgerald (1992) mentioned that consumers declared themselves as environmentalist (informed by Ay and Ecevit, 2005: 241). Similar findings were found by Turkish academicians. Aracıoğlu and Tatlıdil (2009: 459) found that Turkish consumers adopt an environmental protectionist attitude and when they have to make a selection, they choose the less harmful products to the environment option. Çoban and Sönmez (2014: 74) found that Turkish consumers have positive attitude towards green marketing. In this study, results showed that consumers are sensitive especially to the green products, green pricing and green promotion. According to Ay and Ecevit’s study (2005: 250) Turkish university students try to have environmentally-conscious behaviour. Aslan and Çınar (2015: 183) stated that Turkish students are consciousness about purchasing and using environmentally harmful products. Also according to the results of this study, students believe that there is a relation between the nature of consuming products and contribution to environmental protection, they are aware about the importance of packaging type in product buying decision and they understand not to disturb natural balance, they are trying to reduse or eliminate different types of wastes and keep the environment clean, they are willing to get information about pre-purchasing period related to the products features and what happen during the purchasing period, taking in account environmentalist products.
The meaning of these paragraphs is to establish the context of the paper. In this light the present paper is developed by bringing the specific literature first (quotations) and then is synthesized the current meaning of the investigated matter. In the following chapters are formulated the paper’ goal under the form of hypotheses, questions or matters treated and are explained the method approach and, in brief, necessary arguments. Based on a survey conducted in Turkey and Romania, were studied some features related to the Turkish and Romanian consumers.
2. GENERATION Z ATTITUDES TOWARDS GREEN MARKETING AND HYPOTHESIS DEVELOPMENT 2.1. Methodology
Sampling, Data Collection and Scaling The sampling was determined for the study by using convenience and judgement sampling methods. The data
gathered with a face-to-face questionnaire method were delivered from 135 respondents. Questionnaire was built up according to Roberts and Bacon’s (1997) ecologically conscious consumer scale and appropriately adopted for the study. Frequency analysis and Mann Whitney U Test were used for achieve the aims of the study through SPSS 20 statistical programme.
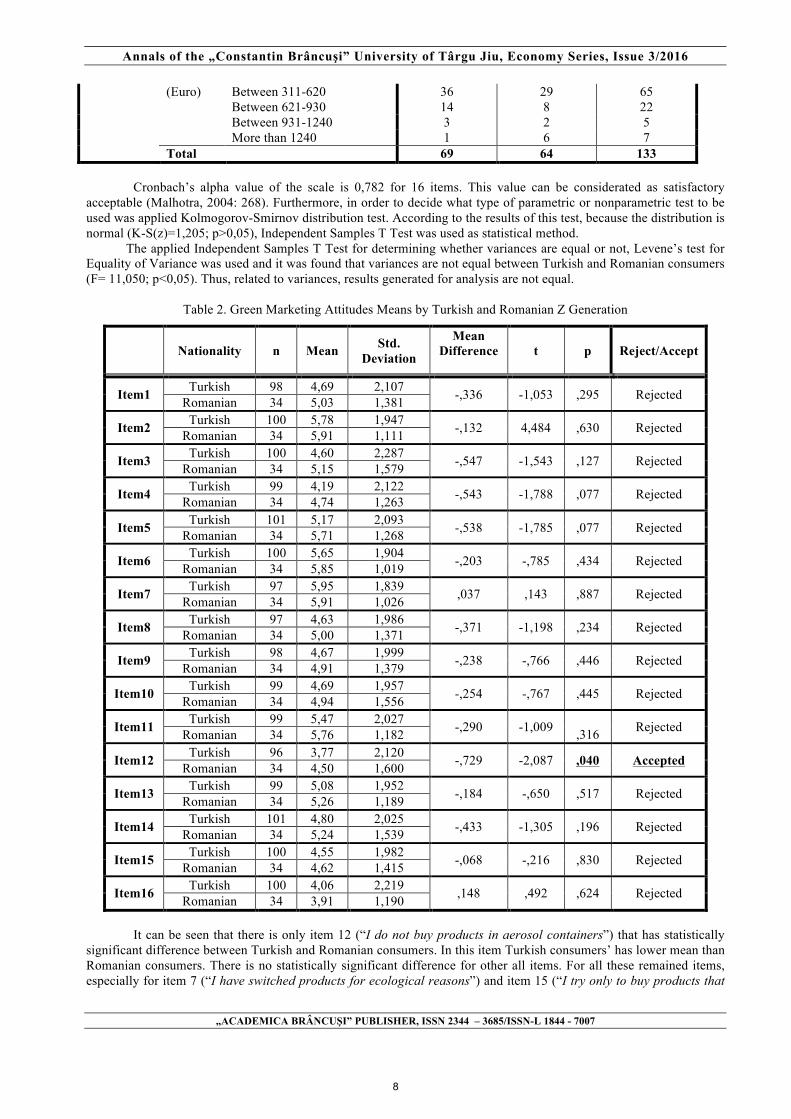
Findings Respondents’ demographics were given in detail in Table 1. As can be seen in this table almost 75% of the
respondents are Turkish consumers. More than half of total respondents are female. Moreover, major part of the respondents is having low income.
Table 1. Country*Gender*Income Cross Tabulation
Country Gender Total F M
Turkish Income (Euro)
Less than 310 5 15 20 Between 311-620 30 24 54 Between 621-930 12 5 17 Between 931-1240 2 1 3 More than 1240 1 4 5
Total 50 49 99 Romanian Income Less than 310 10 4 14 (Euro) Between 311-620 6 5 11 Between 621-930 2 3 5 Between 931-1240 1 1 2 More than 1240 0 2 2 Total 19 15 34 Total Income Less than 310 15 19 34
7
Annals of the „Constantin Brâncuşi” University of Târgu Jiu, Economy Series, Issue 3/2016
„ACADEMICA BRÂNCUŞI” PUBLISHER, ISSN 2344 – 3685/ISSN-L 1844 - 7007
(Euro) Between 311-620 36 29 65 Between 621-930 14 8 22 Between 931-1240 3 2 5 More than 1240 1 6 7 Total 69 64 133
Cronbach’s alpha value of the scale is 0,782 for 16 items. This value can be considerated as satisfactory
acceptable (Malhotra, 2004: 268). Furthermore, in order to decide what type of parametric or nonparametric test to be used was applied Kolmogorov-Smirnov distribution test. According to the results of this test, because the distribution is normal (K-S(z)=1,205; p>0,05), Independent Samples T Test was used as statistical method.
The applied Independent Samples T Test for determining whether variances are equal or not, Levene’s test for Equality of Variance was used and it was found that variances are not equal between Turkish and Romanian consumers (F= 11,050; p<0,05). Thus, related to variances, results generated for analysis are not equal.
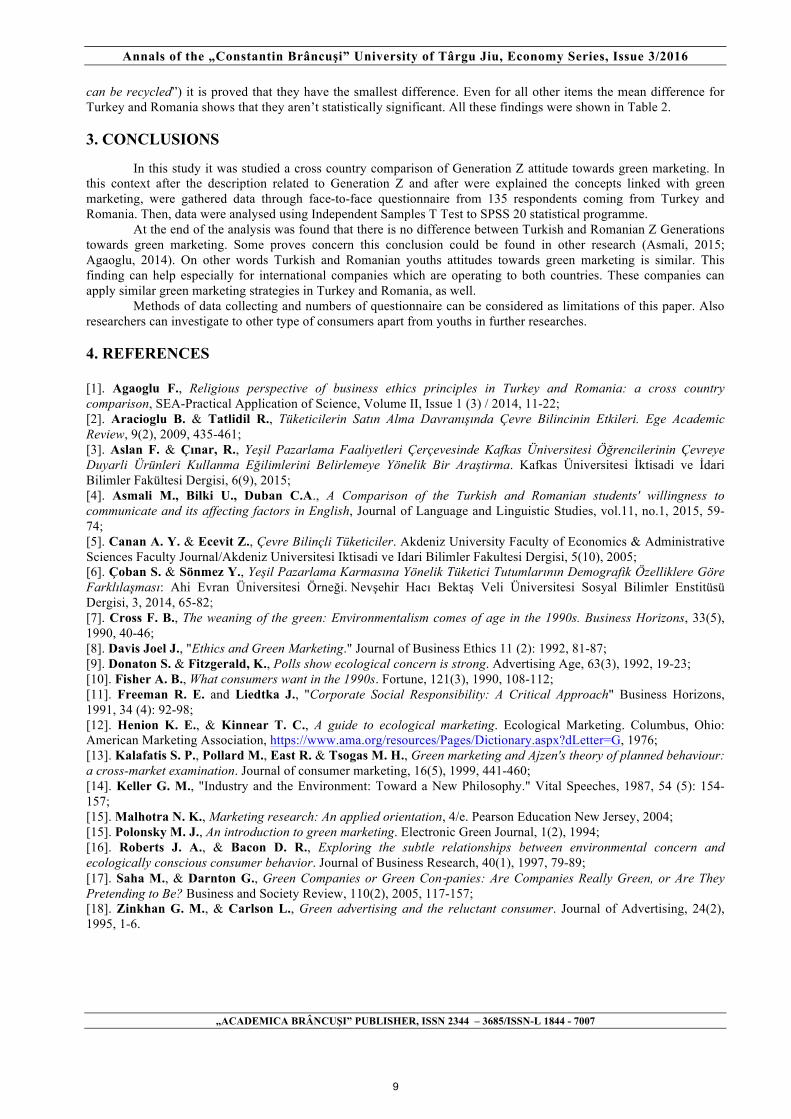
Table 2. Green Marketing Attitudes Means by Turkish and Romanian Z Generation
Nationality n Mean Std. Deviation
Mean Difference
t p Reject/Accept
Item1 Turkish 98 4,69 2,107 -,336 -1,053 ,295 Rejected Romanian 34 5,03 1,381
Item2 Turkish 100 5,78 1,947 -,132 4,484 ,630 Rejected Romanian 34 5,91 1,111
Item3 Turkish 100 4,60 2,287 -,547 -1,543 ,127 Rejected Romanian 34 5,15 1,579
Item4 Turkish 99 4,19 2,122 -,543 -1,788 ,077 Rejected Romanian 34 4,74 1,263
Item5 Turkish 101 5,17 2,093 -,538 -1,785 ,077 Rejected Romanian 34 5,71 1,268
Item6 Turkish 100 5,65 1,904 -,203 -,785 ,434 Rejected Romanian 34 5,85 1,019
Item7 Turkish 97 5,95 1,839 ,037 ,143 ,887 Rejected Romanian 34 5,91 1,026
Item8 Turkish 97 4,63 1,986 -,371 -1,198 ,234 Rejected Romanian 34 5,00 1,371
Item9 Turkish 98 4,67 1,999 -,238 -,766 ,446 Rejected Romanian 34 4,91 1,379
Item10 Turkish 99 4,69 1,957 -,254 -,767 ,445 Rejected Romanian 34 4,94 1,556
Item11 Turkish 99 5,47 2,027 -,290 -1,009 ,316 Rejected Romanian 34 5,76 1,182
Item12 Turkish 96 3,77 2,120 -,729 -2,087 ,040 Accepted Romanian 34 4,50 1,600
Item13 Turkish 99 5,08 1,952 -,184 -,650 ,517 Rejected Romanian 34 5,26 1,189
Item14 Turkish 101 4,80 2,025 -,433 -1,305 ,196 Rejected Romanian 34 5,24 1,539
Item15 Turkish 100 4,55 1,982 -,068 -,216 ,830 Rejected Romanian 34 4,62 1,415
Item16 Turkish 100 4,06 2,219 ,148 ,492 ,624 Rejected Romanian 34 3,91 1,190
It can be seen that there is only item 12 (“I do not buy products in aerosol containers”) that has statistically significant difference between Turkish and Romanian consumers. In this item Turkish consumers’ has lower mean than Romanian consumers. There is no statistically significant difference for other all items. For all these remained items, especially for item 7 (“I have switched products for ecological reasons”) and item 15 (“I try only to buy products that
8
Annals of the „Constantin Brâncuşi” University of Târgu Jiu, Economy Series, Issue 3/2016
„ACADEMICA BRÂNCUŞI” PUBLISHER, ISSN 2344 – 3685/ISSN-L 1844 - 7007
can be recycled”) it is proved that they have the smallest difference. Even for all other items the mean difference for Turkey and Romania shows that they aren’t statistically significant. All these findings were shown in Table 2.
3. CONCLUSIONS
In this study it was studied a cross country comparison of Generation Z attitude towards green marketing. In this context after the description related to Generation Z and after were explained the concepts linked with green marketing, were gathered data through face-to-face questionnaire from 135 respondents coming from Turkey and Romania. Then, data were analysed using Independent Samples T Test to SPSS 20 statistical programme.
At the end of the analysis was found that there is no difference between Turkish and Romanian Z Generations towards green marketing. Some proves concern this conclusion could be found in other research (Asmali, 2015; Agaoglu, 2014). On other words Turkish and Romanian youths attitudes towards green marketing is similar. This finding can help especially for international companies which are operating to both countries. These companies can apply similar green marketing strategies in Turkey and Romania, as well.
Methods of data collecting and numbers of questionnaire can be considered as limitations of this paper. Also researchers can investigate to other type of consumers apart from youths in further researches.
4. REFERENCES [1]. Agaoglu F., Religious perspective of business ethics principles in Turkey and Romania: a cross country comparison, SEA-Practical Application of Science, Volume II, Issue 1 (3) / 2014, 11-22; [2]. Aracioglu B. & Tatlidil R., Tüketicilerin Satın Alma Davranışında Çevre Bilincinin Etkileri. Ege Academic Review, 9(2), 2009, 435-461; [3]. Aslan F. & Çınar, R., Yeşil Pazarlama Faaliyetleri Çerçevesinde Kafkas Üniversitesi Öğrencilerinin Çevreye Duyarli Ürünleri Kullanma Eğilimlerini Belirlemeye Yönelik Bir Araştirma. Kafkas Üniversitesi İktisadi ve İdari Bilimler Fakültesi Dergisi, 6(9), 2015; [4]. Asmali M., Bilki U., Duban C.A., A Comparison of the Turkish and Romanian students' willingness to communicate and its affecting factors in English, Journal of Language and Linguistic Studies, vol.11, no.1, 2015, 59-74; [5]. Canan A. Y. & Ecevit Z., Çevre Bilinçli Tüketiciler. Akdeniz University Faculty of Economics & Administrative Sciences Faculty Journal/Akdeniz Universitesi Iktisadi ve Idari Bilimler Fakultesi Dergisi, 5(10), 2005; [6]. Çoban S. & Sönmez Y., Yeşil Pazarlama Karmasına Yönelik Tüketici Tutumlarının Demografik Özelliklere Göre Farklılaşması: Ahi Evran Üniversitesi Örneği. Nevşehir Hacı Bektaş Veli Üniversitesi Sosyal Bilimler Enstitüsü Dergisi, 3, 2014, 65-82; [7]. Cross F. B., The weaning of the green: Environmentalism comes of age in the 1990s. Business Horizons, 33(5), 1990, 40-46; [8]. Davis Joel J., "Ethics and Green Marketing." Journal of Business Ethics 11 (2): 1992, 81-87; [9]. Donaton S. & Fitzgerald, K., Polls show ecological concern is strong. Advertising Age, 63(3), 1992, 19-23; [10]. Fisher A. B., What consumers want in the 1990s. Fortune, 121(3), 1990, 108-112; [11]. Freeman R. E. and Liedtka J., "Corporate Social Responsibility: A Critical Approach" Business Horizons, 1991, 34 (4): 92-98; [12]. Henion K. E., & Kinnear T. C., A guide to ecological marketing. Ecological Marketing. Columbus, Ohio: American Marketing Association, https://www.ama.org/resources/Pages/Dictionary.aspx?dLetter=G, 1976; [13]. Kalafatis S. P., Pollard M., East R. & Tsogas M. H., Green marketing and Ajzen's theory of planned behaviour: a cross-market examination. Journal of consumer marketing, 16(5), 1999, 441-460; [14]. Keller G. M., "Industry and the Environment: Toward a New Philosophy." Vital Speeches, 1987, 54 (5): 154-157; [15]. Malhotra N. K., Marketing research: An applied orientation, 4/e. Pearson Education New Jersey, 2004; [15]. Polonsky M. J., An introduction to green marketing. Electronic Green Journal, 1(2), 1994; [16]. Roberts J. A., & Bacon D. R., Exploring the subtle relationships between environmental concern and ecologically conscious consumer behavior. Journal of Business Research, 40(1), 1997, 79-89; [17]. Saha M., & Darnton G., Green Companies or Green Con-‐panies: Are Companies Really Green, or Are They Pretending to Be? Business and Society Review, 110(2), 2005, 117-157; [18]. Zinkhan G. M., & Carlson L., Green advertising and the reluctant consumer. Journal of Advertising, 24(2), 1995, 1-6.
9
Annals of the „Constantin Brâncuşi” University of Târgu Jiu, Economy Series, Issue 3/2016
„ACADEMICA BRÂNCUŞI” PUBLISHER, ISSN 2344 – 3685/ISSN-L 1844 - 7007
TRENDS IN USING THE LABOUR FORCE SUBSEQUENT TO THE CRISIS
GHIZDEANU ION PRESIDENT OF THE NATIONAL COMMISSION OF PROGNOSIS, SENIOR RESEARCHER ROMANIAN ACADEMY, PROFESSOR PHD, CONSTANTIN BRANCUSI UNIVERSITY OF
TARGU JIU [email protected]
RĂBONŢU IRINA-CECILIA
PROFESSOR PH.D., CONSTANTIN BRANCUSI UNIVERSITY OF TARGU-JIU [email protected]
Abstract
The use of labour force acquires new aspects in the stages subsequent to the economic and financial crisis in Romania and we would like to present them in this paper. The imbalances caused by the Romanian economy restructuring were visible in the labour market evolution, offering a new dimension to the issue of adapting the labour force to the market requirements, within the regions and their counties. Through this paper, we want to offer an overview of the Romanian labour market, integrating it in the realities of the international labour market. We will thus seek to observe if the labour market responds, and to what extend if so, to the current requirements given by the realities emerged as a consequence of the crisis’ effects. In order to analyse what we had set to, we used the most recent statistical data on the official labour market but, in order to get an even clearer image of the field, we also appealed to data offered by the National Prognosis Commission, indicating the source. Analysing the practical features when taking into consideration the emigration possibility presents a major interest for completing this study, as lately we are witnesses to massive migration, especially of the qualified youth, which leads to a decrease in labour force quality in the country. Also, an analysis of the sectors with significant imbalances between the number of job vacancies and the number of employees may contribute to identifying the current labour market trends. Key word: labour market, crisis, trend, domestic and national employment, statistical indicators, economy, Romania 1. Introduction
Were we to try to define the labour market, we can state that it describes the relations series established between the capital holders, as buyers and the labour force holders, as sellers, through the labour market (salary), the free competition and other specific mechanisms which adjust the labour supply and demand. In the published literature, we either find the labour market1 designation, or the labour force market2 one.
Regardless of the name, the economic content of the ”labour market” concept (or “labour force market”, expresses the same objective reality and that is that the factor of production, the labour- is provided through the market in a market economy. Generally, the labour market works according to the market’s basic principles: demand, supply, price, competition, etc., but all these manifest in accordance with the work force, which establishes certain particularities to the labour market3, through its philosophical, psychological, social and moral particularities. The most important are:
a) on the labour market, not all the nation’s labour potential is negotiated, but only that which is required by the capital factor of production and is offered by the ones ready to use their work capacity.
b) Compared to the other markets, the labour market is more organised, more complex, the economic operators are not only sellers and buyers.
c) The contemporaneous labour market is a contractual and participative one, where negotiation and employment contract play an important role in determining the labour demand and supply. On this market the ratio between the labour demand and supply is specifically manifested in that the supply is
permanently higher than the demand, which determines the existence of unemployment. According the data from the National Statistics Institute, the resident population of Romania is 19, 94 million persons.
The study of the labour market begins and ends with the analysis of the labour demand and supply. On the labour demand side we have the firms, whose decisions regarding the labour force employment are influenced by the conditions on the three markets. On the labour supply side we have the employees and potential employees whose decisions on the workplace and whether to work are linked to their options regarding the spending of the time they 1 Marin Băbeanu, Marius Băbeanu, Piaţa şi sistemul pieţei, Fundaţia „Scrisul Românesc”, Craiova, AustRom IMPEX SRL Publishing House, 1998, p 149; 2 Gh. Creţoiu and colab., Economie politică, „Şansa” S.R.L. Publishing House, Bucharest, 1995, p. 395; I.D 3 Gheorghe MECU – Contents and Particularities of the Labor market http://www.revistadestatistica.ro/suplimente/2012/2/srrs2_2012a44.pdf
10
Annals of the „Constantin Brâncuşi” University of Târgu Jiu, Economy Series, Issue 3/2016
„ACADEMICA BRÂNCUŞI” PUBLISHER, ISSN 2344 – 3685/ISSN-L 1844 - 7007
have. The main elements of the labour market are determined by the remuneration means and the working conditions; - the level of employment. These elements are the result of the action and functioning of the labour market. For their generation, both supply and demand are needed.
According to the data offered by the Labour Force Balance on January 1, 2015, the civil economically active population was 8910.0 thousand persons, representing 44,9% of the total population. From the gender division point of view, the situation of the active persons is: 53, 4% are male and 46, 6% are female. The civil employment was of 8431, 7 thousand persons, 4900, 7 thousand of which were employees. Most of the employees worked in the services sector (3014, 5 thousand persons), while 1772,4 thousand persons were working in industry and constructions. In agriculture, forestry and fishing, 113, 8 thousand persons were working. In the 3rd trimester of 2015, the employment rate of the working age population (15- 64 years old) was 63, 2%, with higher values for men (71,6% compared to 54,6% for women). 94.9% of the active female persons were employed and 5.1% were unemployed. In the active civil population, the employed population held a share of 94, 3%. 2. The statistical indicators system and expression
The complexity of the labour market does not only stem from the general features of the daily people flows between sub-sectors or the labour market inputs and outputs, but also from the Romanian economy particularities of structural and behavioural nature.
The labour market broadly includes issues linked to employment, unemployment and labour quality, productivity, gains and labour costs.4 The complexity and importance of the labour market is also reflected in the role designated within the Europe 2020 Strategy, that has the employment rate as main indicator and the creation of more and better jobs in the EU as general objective. Moreover, The European Union has detailed the future preoccupations and action directions for increasing employment within the European Employment Strategy and for assessing the evolutions in the labour market sector, a comprehensive analytical and statistical sector based on structural approach.
In order to capture as well as possible the complex diversity of employment in Romanian statistics, European indicators and statistics are used, as well as national indicators and surveys. To these, we add databases and wide administrative statistics for separate use, especially those from the National Agency for Fiscal Administration and labour inspections.
From this point of view, the labour statistics is the most comprehensive sectoral statistical system, surpassing in number of indicators and diversity of information all the other sectoral statistics (industrial, foreign trade statistics etc.).
Another argument in this direction is the fact that the same phenomenon, for example unemployment or employment, is analysed and statistically highlighted from different perspectives: that of the employee and that of the employer, of the one who considers he/she is unemployed, searching for a workplace or that of the one who actually addressed the competent public institution regarding employment. Moreover, the labour market is characterized not only by the employment indicators, but also by indicators highlighting the jobs. Under these circumstances, there is often the risk of using a statistical indicator concerning the labour market without explaining its expression or conferring it another expression.
The statistical researches of the National Statistical Institute are the following:5 o The statistical research on labour force in households, for data regarding employment and unemployment
(according to Regulation no. 577/ 1998 of the Counsel regarding the organization of a survey inquiry on the labour force in the community, with the ulterior HLFS modifications);
o The statistical research regarding the labour force cost in the economic and social units, for data regarding the number of employees (according to the Regulation no. 530/ 1999 of the European Parliament and of the Council regarding the statistics of the employees earnings and the labour force cost);
o The quarterly statistical research on job vacancies, for data regarding the vacancies rate (according to Regulation no. 453/ 2008 of the European Parliament and of the Council on the statistics regarding the job vacancies);
o The labour force balance for the data regarding the civil employment by activities of the national economy, ownership and by county. The statistical research resulting from the EU Regulations, compulsory for all member states, ensures the
comparativeness of the data series regarding the labour market published by Eurostat and offers thus adequate informational sources to the macroeconomic analyses and prognoses and subsequently for the establishment of public European and national policies.
From the statistical research, the following indicators detailing employment arise: 1. The number of employees (LFB);
4 Albu, L., L., Caraiani, P., Iordan, M. – The perspectives of the labour market in Romania in the context of the Europe 2020 strategy, study developed within the “Improving the institutional, assessment and macroeconomic policy formulation capacity in the field of economic convergence of the National Prognosis Commission with the European Union, code SMIS 27153” project, Ed. Economică, Bucharest, 2012 5 Details on the research are found in the Romanian Statistical Yearbook, NSI, 2015, as well as in the periodicals published by NSI, which present the results of the HLFS and LFB surveys.
11
Annals of the „Constantin Brâncuşi” University of Târgu Jiu, Economy Series, Issue 3/2016
„ACADEMICA BRÂNCUŞI” PUBLISHER, ISSN 2344 – 3685/ISSN-L 1844 - 7007
2. The number of employees (HLFS); 3. The average number of employees (LFB and the survey regarding the labour force cost).
A first important conceptual difference between the indicators comes from the statistical research subject and is referring to the one giving information on the paid employment.
HLFS takes place in households, the interviewed person stating whether he/she is employed or not. Therefore, the number of employees6 is defined as being the number of the persons working based on a written or verbal consent (agreement, employment contract, employment relationship etc.) with the employer, in exchange for remuneration as salary, wage or in nature.
The survey regarding the LFB labour force cost is developed by the institutional employers, the commercial societies. As a consequence, the number of employees and the average number of employees represent the number of the persons holding a written employment contract and declared by the employers. That is why it is said that the two indicators show employment in the official sector, as they represent the number of employees officially declared by the economic operators.
As we can see, the main difference lies in the scope. In the first case, we are talking about all employees – regardless of the fact that they work either in an economic unit, for a particular person or within a household- while in the second case, we are talking about contract-based employees officially working in enterprises.
A second major difference is the temporal vision. The number of employees 7 illustrates the number of employees on the last day of the reference period, while the average number of employees8, although resulting from the same statistical research, refers to the average of the employees working and receiving a salary during the reference period.
Differences also emerge in relation with the employees’ statute: paid or non-paid employees, employees that are having or not having the main position at the reporting unit, employees detached abroad or not. Still, such differences are smaller and they do not modify significantly the ratios between the three indicators measuring employment.
In summary, it could be said that the whole employment is illustrated by the number of employees in the HLFS survey, the average number of employees being only the expression of the civil9 and official employment, of the fiscalised work, respectively (because this comes with a labour force cost and implicitly the taxation of the additional expenditures).
We want to highlight again that, given the particularities of each inquiry, the comparativeness, as well as the conclusions in the indicators’ analysis or the differences between them are not very exact. For example, the HLFS survey is a quarterly survey, the reference period for the statistical research being the middle month of a quarter.
By convention, the number of employees resulted from this survey is supposed to represent an average value, the annual data being obtained as an arithmetic mean of the 4 quarterly results. Unlike this indicator, the average number of employees in LFB is calculated by each economic operator based on the daily number of employees, as NSI only aggregates and conciliates the average number of employees transmitted by the economic operators.10
Still, the delimitations are not so categorical. There are employees working for self-employed persons that pay their contributions and taxes, but these add to other fiscal obligations. Yet, these employees are not included in the average number of employees due to this survey’s exclusive concern for the institutional employers. Also, the day labour is not included in the average number of employees, although it takes place in enterprises, because there is no employment contract involved.
In order to understand this compulsory difference, we highlight the case of the “day labourers”, who, despite working in enterprises, do not have employment contracts.
The daily workers law (Law no. 52/ 201111, modified and completed by Law no. 277/2013) establishes that the duration of the occasional activity that can be exerted under this law is of one day minimum, corresponding to 8
6 The number of employees includes the persons with a working contract in an economic or social unit- regardless of its ownership type- or the persons working for particular employers, in exchange for remuneration as salary, wage or in nature, as commission etc. 7 The number of employees at the end of the period is the number of employees employed with individual labour contract with definite or non-definite duration, full or part-time (including those with suspended labour contract/ agreement) existent in the enterprise records at the end of the year. The employees detached abroad and those who hold more than one position and are not having the main position at the reporting unit are not included. 8 The average number of employees represents a simple arithmetic mean resulted from the sum of daily employees number, including from the weekly rest days, legal holidays and other non-working days divided to the total calendar days of the year (365 days). In the daily number of employees taken into calculation for average number, there are not included: employees under unpaid leave, on strike, detached to work abroad. In weekends, legal holidays, other days off, the number of employees from the previous day is taken into calculation, less that or those whose labour contract ceased the same day. Employees who were not full-time employed are included in the average number of employees proportionally with the working time from the labour contract. 9 The average number of employees does not consider the employees in the defence sector and the staff treated as such in SRI, Ministry of Internal Affairs, etc., thus, the non-civil employees. 10 NSI- Statistical Research S1- The survey on salaries, where there is a chapter and a designated position for “the average number of employees”
12

Annals of the „Constantin Brâncuşi” University of Târgu Jiu, Economy Series, Issue 3/2016
„ACADEMICA BRÂNCUŞI” PUBLISHER, ISSN 2344 – 3685/ISSN-L 1844 - 7007
hours of work. The daily duration for a daily labourer’s activity cannot exceed 12 hours. The daily labourers work without an employment contract, based on mutual agreement. The activity is registered in an evidence register.
Table no 1. Number of day labourers registered up to December 31
Activity field No. of registrations (in the evidence register of the daily labourers) 2011 2012 2013 2014
Total no. of registrations 2.342.010 6.406.375 10.874.942 19.891.662 of which: - agriculture 891.967 1.840.391 : 4.615.555 - hunting and fishing 4.942 24.445 : 60.191 - forestry 305.681 836.671 : 2.654.123 - fishery and aquaculture 8.776 18.377 : 40.182 - fruit and wine growing 473.225 1.109.793 : 2.641.624 - beekeeping 4.574 5.367 : 11.623 - livestock 59.515 164.504 : 319.272 Not indicated 269.558 1.438.779 : 7.238.601
Source: Labour Inspection – MMFPSPV (for 2013 the structure of the registrations has not been published) The beneficiary must pay the daily labourer the agreed remuneration at the end of each work day and provide
the labourer with the work and protection equipment. There is only one tax (16%) calculated for the gross remuneration and that is the beneficiary’s obligation. Day labourers cannot work for the same beneficiary for a period longer than 90 days during a calendar year. The labourer can work all year long for different beneficiaries, as the law does not prohibit that.
A specific significance is held by the number of employees, which reflects the filled in jobs, regardless of whether associated with an income or not.12 This indicator, associated with the job vacancies resulting from a statistical survey on this subject, provides the extent of the employment in economy. If we do not consider the reference period it could be said that the number of employees, expressed as difference between the number of employees and the average number of employees, designates the jobs filled in by persons who do not work in the specified period, being detached, in leave without pay, study leave etc. or who work part time. The expressiveness of the number of employees is also illustrated by the vacancies rate, which is an important indicator for the analysis of the balance between the demand and supply of labour force. The vacancies rate is the ratio between the number of job vacancies and the total number of jobs, expressed as:
100*100*LVLO
LVLtotaleLvacanteRLV
+==
where: LO – number of employees;
Lvacante, LV – job vacancies. If we refer to the latest data published by NIS in Q4 2015, when the average number of employees increased
by over 3%, the vacancies rate was 1.21%, increasing as compared to the previous quarter, highlighting the structural difficulties in meeting the labour demand with the labour supply, even if there is an improvement in the employment. As compared to the corresponding quarter in 2014 the vacancies rate increased by 0.3 percentage points.
3. The structure and evolution of the remunerated labour
The problematic of a proper use of the employment indicators is as important as the temptation of using some indicators having in mind a desired conclusion to be highlighted is higher, thus neglecting their expressivity. Even in economic research some „errors” may occur, which unfortunately are distorting the research. For example, in the Romanian development strategy, soon published by the Romanian Academy it is stated that: “The average number of employees strongly decreased during transition period: from 8.1 million in 1990 to 4.9 million in 2014 (NIS, 2015)”13. It is compared the number of employees in 1990 when there was no informal labour and no contract labour with the average number of employees, namely those within the institutional sector. The number of employees did not decrease dramatically, it has another structure, according to the market economy specificities.
In 2014 Romania had 5850.3 thou employees out of which 4.5 million in civil institutional sector, namely in economic units.
What is mentioned in the Strategy published by the Romanian Academy is an example for another error, namely the use of jobs (number of employees) at the end of the year as compared to the number of employees during the full year period. In 2014 the average number of employees in the civil and official sector was 4.5 million persons, with a number of employees at the end of the year (31 December) of 4.9 million.
11 Law no. 52/ 15.04.2011 regarding the development of seasonal activities by day labourers, republished (Official Monitor no. 947/22.12.2015) 12 NSI – Methodological specifications, Press release no 46/ February 2016 13 Romanian Academy – Romania’s development strategy in the next 20 years, vol. II, Romanian Academy Publishing House, 2016,
p. 298
13
Annals of the „Constantin Brâncuşi” University of Târgu Jiu, Economy Series, Issue 3/2016
„ACADEMICA BRÂNCUŞI” PUBLISHER, ISSN 2344 – 3685/ISSN-L 1844 - 7007
Salariatii AMIGO si BFM
4.000
4.500
5.000
5.500
6.000
6.500
2000 2001 2002 2003 2004 2005 2006 2007 2008 2009 2010 2011 2012 2013 2014
mii persoane
Numar salariati (AMIGO) Numar salariati (BFM)
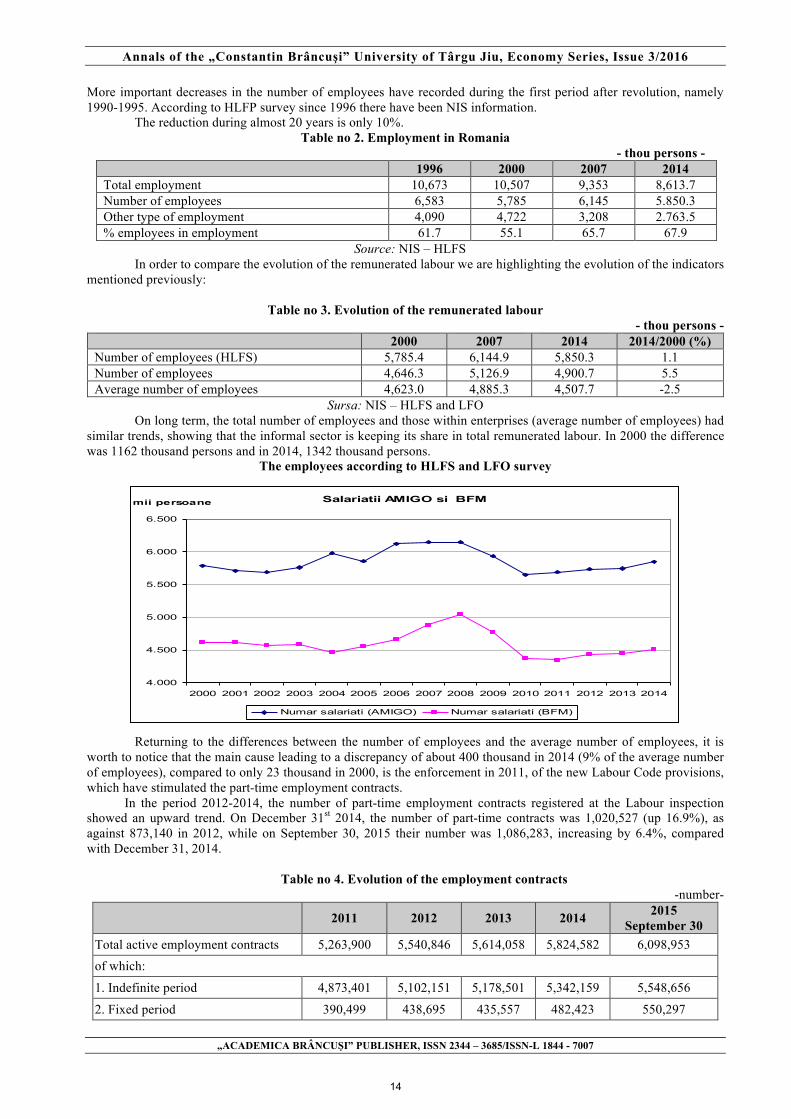
More important decreases in the number of employees have recorded during the first period after revolution, namely 1990-1995. According to HLFP survey since 1996 there have been NIS information.
The reduction during almost 20 years is only 10%. Table no 2. Employment in Romania
- thou persons - 1996 2000 2007 2014
Total employment 10,673 10,507 9,353 8,613.7 Number of employees 6,583 5,785 6,145 5.850.3 Other type of employment 4,090 4,722 3,208 2.763.5 % employees in employment 61.7 55.1 65.7 67.9
Source: NIS – HLFS In order to compare the evolution of the remunerated labour we are highlighting the evolution of the indicators
mentioned previously:
Table no 3. Evolution of the remunerated labour - thou persons -
2000 2007 2014 2014/2000 (%) Number of employees (HLFS) 5,785.4 6,144.9 5,850.3 1.1 Number of employees 4,646.3 5,126.9 4,900.7 5.5 Average number of employees 4,623.0 4,885.3 4,507.7 -2.5
Sursa: NIS – HLFS and LFO On long term, the total number of employees and those within enterprises (average number of employees) had
similar trends, showing that the informal sector is keeping its share in total remunerated labour. In 2000 the difference was 1162 thousand persons and in 2014, 1342 thousand persons.
The employees according to HLFS and LFO survey
Returning to the differences between the number of employees and the average number of employees, it is worth to notice that the main cause leading to a discrepancy of about 400 thousand in 2014 (9% of the average number of employees), compared to only 23 thousand in 2000, is the enforcement in 2011, of the new Labour Code provisions, which have stimulated the part-time employment contracts.
In the period 2012-2014, the number of part-time employment contracts registered at the Labour inspection showed an upward trend. On December 31st 2014, the number of part-time contracts was 1,020,527 (up 16.9%), as against 873,140 in 2012, while on September 30, 2015 their number was 1,086,283, increasing by 6.4%, compared with December 31, 2014.
Table no 4. Evolution of the employment contracts
-number-
2011 2012 2013 2014 2015 September 30
Total active employment contracts 5,263,900 5,540,846 5,614,058 5,824,582 6,098,953 of which:
1. Indefinite period 4,873,401 5,102,151 5,178,501 5,342,159 5,548,656
2. Fixed period 390,499 438,695 435,557 482,423 550,297
14
Annals of the „Constantin Brâncuşi” University of Târgu Jiu, Economy Series, Issue 3/2016
„ACADEMICA BRÂNCUŞI” PUBLISHER, ISSN 2344 – 3685/ISSN-L 1844 - 7007
of which:
1. Full time - 4,667,706 4,671,761 4,804,055 5,012,670
2. Part time - 873,140 942,297 1,020,527 1,086,283 Source: http://www.inspectiamuncii.ro/documents/66402/187655/Raport+anual+2014.pdf/
As a result, the share of the part-time contracts in total active employment has increased from 15.8% in 2012,
to 17.8% in September 2015. The extension of the part-time contracts is favored by the fact that there are no restrictions regarding the
part-time jobs. Moreover, the Labour Code provides the opportunity of both part time and full time jobs for the same business, but does not introduce any criterion to justify the need for a part-time job.
For example, what happens if similar activities include mostly part-time employment contracts, which in fact, is a way to reduce the tax burden of the employer? If they represented only a requirement for efficiency and full utilization of the workforce, it would have been sufficient to replace those contracts with a single full-time employment contract. In fact, the employees with part-time jobs usually exceed the norm established in the contract.
Analyzing the data on part-time wage employment (on the basis of the annual average equivalent), according to HLFS survey, one can notice that the impact on the number of employees is still low. The number of part time employees is still insignificant, accounting for less than 1% of total employees. Consequently, in 2014, from a total of 5.850,3 thousand employees, only 41.107 people were part time employed, of which, 75% were active in the field of services. Regarding the part time employed population, the share is similar, reaching about 1%, being influenced by over 700 thousand people working part time in agriculture (underemployment in this sector is also the main cause of low productivity). In 2014, the proportions were as follows: 0.7% for employees and 1% for the total employed population.
4. Domestic and national employment
The previously analyzed indicators have in view the resident population and therefore, the number of employees across the country, with Romanian citizenship. As can be seen, the criterion of territoriality is important, but this principle is not applied by the surveys described above.
Structuring employees according to the workplace is important, especially for the correlation with the economic growth process14.
First, the methodology of quantification considers the space where the economic agents operate, as being essential, without any restrictions, respectively: a country, a region or an economic area. A second criterion is the nationality of the economic operators.
The "domestic" category delimitates the contribution of the business agents operating on the economic territory, regardless their nationality; as long as the production is achieved within the country. From this point of view, the statistical units are grouped by “resident” and “non-resident”.
The "national" category delimitates the output of the national business agents; thus, the contribution of all national production factors is taken into account. Accordingly, from this point of view, the macroeconomic indicators measure the results of the national economy, no matter if the economic agent operates within or outside the country.
This criterion translates in the field of employment, by measuring the number of employees and the employed population participating at the achievement of the national accounts, the gross domestic product, respectively. The number of employees15 includes both residents and non-residents, working in resident production units (the "domestic employment" concept).
In the context of national accounts, the employed population16 is that who works for the resident production units in Romania and creates actually, the Romanian gross domestic product (“domestic employment” concept). The estimation of employment from the national accounts may differ, as compared to other statistics and surveys, in particular the Labour Force Survey (LFS - in Romania, AMIGO). Even though, employment is defined according to the criteria of the International Labour Organization (ILO). The differences are conceptual and depend on the sources which have been used.
Thus, in the context of the national accounts, the employment integrates information from multiple sources, such as surveys on employment, population censuses, surveys on business, labour cost surveys etc., seeking to combine information to get a complete and consistent estimate, related to other variables, such as GDP, output, remuneration, etc.
The distinction between the domestic and the national concept is important in terms of employment in Romania, because our country is facing a particular situation. Much of the resident population able to work, has performed seasonal work abroad, leaving the country temporarily. In order to improve statistics on population and
14 Ghizdeanu I. - Applied Macroeconomics, Ed.Bren, Bucharest, 2007, ISBN 978-973-648-677-7, p. 24 15 The number of employees represents all the full title working people, on the basis of a formal or informal contract, for a resident institutional unit, a salary or an equivalent remuneration (National Institute of Statistics - National Accounts, Bucharest, 2015). 16 The persons (employees and self-employed) that perform a productive activity within the European System of Accounts (ESA) corresponding production, concerning residents and non-residents working in resident production units.
15
Annals of the „Constantin Brâncuşi” University of Târgu Jiu, Economy Series, Issue 3/2016
„ACADEMICA BRÂNCUŞI” PUBLISHER, ISSN 2344 – 3685/ISSN-L 1844 - 7007
economy, all people living and working within the national territory must be taken into account. Due to the fact that the employed persons are important in terms of national accounts, they are considered according to the domestic concept. The persons included in the employed population must have a job within the national territory. The unemployed and those people not included in the labour force should have Romanian residence, in order to be included in the total population.
According to the domestic concept, within the employed population of Romania, the following groups of population may be statistically included: Romanians living in Romania, foreigners with Romanian residence, foreigners with annual residence permits, seasonal workers, border workers living abroad and working in Romania, holders of short-term permits, asylum seekers, the Romanian staff working abroad in embassies, consulates and on cargo vessels. The staff of foreign embassies, consulates and international organizations located in Romania, the persons living in Romania and working abroad and the Romanians who live and work abroad are not included in this category.
More significant differences have been noticed by activities, due to the same principle used for the gross domestic product, i.e. the concept of homogeneous branches17. The homogeneous branch includes both main and secondary activities of the same kind, specific to different economic units, meaning that a branch refers actually, only to comparable goods and services obtained through a specific technology. The difficulty consists of separating the secondary activities, using on this purpose, information from multiple statistical and administrative sources and conventions for weighting the importance of the secondary activities of a homogeneous branch. As a result, LFS survey data regarding the employees reconciliates with the information included in the Annual Structural Survey of Enterprises (ASA), but also with the data submitted by the business agents within the balance sheets.
According to the national accounts, data have revealed that the employment went up by 0.8% in 2014, compared to 2013, accordingly to LFS survey18.
In case of employees, the two dynamics are as follows: 1.7%, according to the national accounts and 1.9%, in line with the LFS survey.
The insufficiency of the data sources concerning the foreign labour flows did not produce significant differences, compared to the results of the LFS survey.
Overall, the number of employees within the national accounts is lower than the result of LFS surveys, showing partly, that the number of Romanian employees officially working abroad is higher than the number of specialists and foreign workers in Romania.
Table no 5. Evolution of employment and net migration
- thou persons - 2012 2013 2014
Employment - national concept (Eurostat) 8,814.5 8,723.6 8,779.2 Employment - domestic concept (Eurostat and NIS) 8,645.3 8,569.4 8,637.8 - Difference 169.2 154.2 141.4 Employees - national concept (Eurostat) 6,028.4 6,009.4 6,097.7 Employees - domestic concept (Eurostat and NIS) 5,906.7 5,897.4 5,998.2 - Difference 121.7 112.0 99.5 Other categories of employment - national concept (Eurostat) 2,786.2 2,714.2 2,681.5 Other categories of employment - domestic concept (Eurostat and NIS) 2,738.6 2,672.0 2,639.6 - Difference 47.6 42.2 41.9
Source: EUROSTAT and NIS
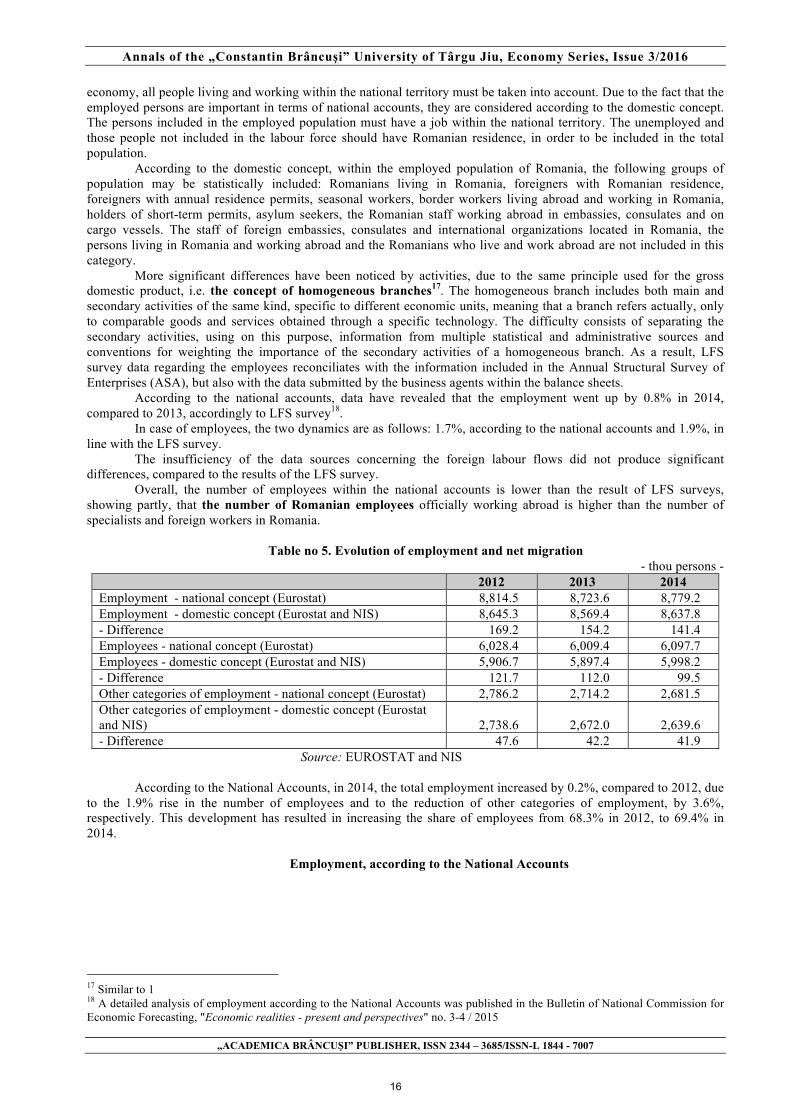
According to the National Accounts, in 2014, the total employment increased by 0.2%, compared to 2012, due to the 1.9% rise in the number of employees and to the reduction of other categories of employment, by 3.6%, respectively. This development has resulted in increasing the share of employees from 68.3% in 2012, to 69.4% in 2014.
Employment, according to the National Accounts
17 Similar to 1 18 A detailed analysis of employment according to the National Accounts was published in the Bulletin of National Commission for Economic Forecasting, "Economic realities - present and perspectives" no. 3-4 / 2015
16

Annals of the „Constantin Brâncuşi” University of Târgu Jiu, Economy Series, Issue 3/2016
„ACADEMICA BRÂNCUŞI” PUBLISHER, ISSN 2344 – 3685/ISSN-L 1844 - 7007
5906,7 5897,4 5998,2
2738,6 2672,0 2639,6
0,0
2500,0
5000,0
7500,0
10000,0
2012 2013 2014
- mii p
ersoa
ne -
Salariati Alte categorii de populatie ocupata
8645,3 8569,4 8637,8
On long term, the trend described by the article regarding the relative stability in the number of employees, together with the reduction of employment due to the decline of non-wage employment activities, appears even more striking within the National Accounts. Evolution of employment is very suggestive for highlighting the productivity gains, because the National Accounts ensure the consistency between the gross domestic product and the employment who contributes to its achievement.
In 2016, the total employment was 20% lower than in 2000, due to a 46% decrease of the non-wage employment.
Table no 6.Employment in Romania -thou persons-
2000 2007 2014 Total employment 10,771.6 9,364.8 8,637.8 Number of employees 5,881.8 6,436.5 5,998.2 Other categories of employment 4,889.8 2,928.3 2,639.6 % of employees within employment 54.6 68.7 69.4
Source: NIS – National Accounts Relating to the reduction of non-wage employment, it is significant that, until the accession, this category has
diminished by almost 2 million persons, respectively by 40%. After the accession, the decrease was only by 288 thousand persons (almost 10%). The data are consistent with the intensity of the labour movement, from Romania to EU countries, before and after accession.
Within the concept of national accounts, the statistics regarding employment is important not only for international comparability – which is possible through the LFS survey - but especially for the derivative analysis, regarding for instance, productivity and competitiveness, where the equivalence between employees, remuneration and gross domestic product are necessary.
5. The unit labour costs
At the present times, after the economic and financial crisis particularly, competitiveness is a key parameter of the ability of an economy to cope with the competitive pressures within the European single market. Competitiveness is mainly analyzed by the correlation between wages and labour productivity and the productivity gains should not be cancelled by the wage policy of firms or governments.
In this perspective, competitiveness is analyzed by the unit labour costs in nominal and real terms. The unit labour costs has become, in fact, one of the most important indicators for assessing progress towards the Lisbon objectives and at the same time, one of the indicators forecasted by the European Commission (DG ECFIN) for all the Member States. The indicator is part of the dashboard, which monitors the macroeconomic imbalances in the EU.
The dashboard includes 11 significant indicators regarding the deficits and competitiveness19. Nominal unit labour costs are included within the dashboard (U.L.C.), which is calculated as an average of the percentage changes registered in the last 3 years, with an alert threshold for macroeconomic imbalances of plus 12, for the Member States outside the euro area20.
Especially in the view of economic forecasting, once a year, the national accounts system enables an accurate evaluation of labour costs for the whole economy, taking into account all labour costs. Such an approach is all the more necessary, as economies become increasingly economies for services. 19 Regulation (EU) no. 1176/2011 of the European Parliament and European Council from 16th of November 2011, regarding the prevention and correction of macroeconomic imbalances (OJ L 306 / 23.11.2011) 20 European Commission - Scoreboard for the surveillance of macroeconomic imbalances, February 2012
17

Annals of the „Constantin Brâncuşi” University of Târgu Jiu, Economy Series, Issue 3/2016
„ACADEMICA BRÂNCUŞI” PUBLISHER, ISSN 2344 – 3685/ISSN-L 1844 - 7007
Basically, the unit labour costs compare the increase of total labour expenses, with labour productivity growth. The standard indicator – which is also included within the system of structural indicators - is calculated as the ratio between the unit growth of the employee remuneration and the increase of labour productivity21.
PQSRs
CUM =
Where: Rs -Remuneration of employees; S -Number of employees; Q -Gross domestic product; P - Employment.
In order to ensure data comparability between countries, concerning total employment and the number of employees, the same concepts and definitions (ESA 95) are being applied for all countries, consistent with the definitions of the International Labour Office (ILO). Problems of comparability between countries may occur, due to different structures and structural changes in their systems (e.g. the social security systems) and also as a result of different structures of employment (i.e. part-time employment and work opportunities).
The employee remuneration, as macroeconomic aggregate - generation of income account (D1 within the classification of the distribution transactions) is evaluated only in nominal values, within the Table of Integrated Economic Accounts. The assessment of this aggregate in real terms, induces approximations and in lack of a statistically determined price index for this aggregate, another deflator is used, by convention. Therefore, in terms of methodology, the Commission decided to use the second term of the report, in nominal and real terms, respectively the Gross Domestic Product.
According to the assessment of labour productivity - based on the nominal value of GDP and its real growth - there are two indicators, explaining the unit labour cost:
Ø The nominal unit labour costs - compensation per employee divided by the actual value of GDP per person employed;
Ø The real unit labour costs - compensation per employee divided by the nominal value of GDP per person employed.
Taking into consideration that prices can distort the accurate picture of the labour costs evolution - especially for countries like Romania, with higher inflation, but also with important differences between certain categories of prices - the real value is more expressive and it is more often used for analysis.
An increase in the real unit labour cost, due to higher employee remuneration as against productivity, may indicate both the difficulties in maintaining competitiveness and the demand-side pressures on inflation. There are, as well, approaches that emphasize negative values of dynamics for this indicator, due to differences in terms of employee remuneration. The comparison between the long-term evolution of real remuneration of labour with the percentage increase of the EU gross domestic product shows that the overall trend is improving the competitiveness.
During the period 1974-1985, the real remuneration in EU increased by 0.75 percentage points, corresponding to 1 per cent GDP growth, while in the period 1986-1990, the rate was 0.55/122. In recent times, after the economic and financial crisis of 2007-2008, a 0.5 percentage points increase of the real remuneration have corresponded to one per cent of economic growth.
Table no 7 The real unit labour costs
-annual percentage change- 2009 2010 2011 2012 2013 2014
France 3.4 -0.1 0.1 1.1 0.1 0.9 Germany 4.4 -2.0 -0.4 1.8 0.1 0.2 Italy 2.5 -0.3 -0.8 0.0 -0.4 -0.2 Poland -2.7 1.0 -2.2 -0.3 -0.1 -0.4 Czech Republic 0.0 1.5 0.8 1.7 -0.8 -2.3 Hungary -0.9 -3.5 -0.8 0.5 -2.1 -1.2
21 Remuneration of employees (part of gross value added) comprises the total payment, in cash (gross wages) or payment in kind, which an employer pays to an employee in return for a work carried out over a period of time, including the employer's contribution to Social Security. The employees (staff employed) are persons that work for a resident institutional unit and receive a salary, by agreement. Labour productivity is given by the ratio between the gross domestic product and employment, which includes both employees and private entrepreneurs. The number of people employed is calculated corresponding to the concepts of National Accounts (ESA 95), being different from the concepts of national statistics regarding employment. The accuracy of the data is monitored within the working group of Eurostat regarding the National Accounts. 22 Ciutacu C. - Labour Market, Ed. Expert, Bucharest, 2001, ISBN 973-8177-30-8, p. 226-227
18

Annals of the „Constantin Brâncuşi” University of Târgu Jiu, Economy Series, Issue 3/2016
„ACADEMICA BRÂNCUŞI” PUBLISHER, ISSN 2344 – 3685/ISSN-L 1844 - 7007
Euro Zone 3.5 -1.4 -0.5 0.7 -0.1 0.2 EU28 3.2 -1.4 -0.9 0.5 -0.4 -0.3 Romania -1.5 -2.8 -10.0 -1.1 -3.9 1.4
Source: Eurostat Following the crisis, the real unit labour costs in EU, has recorded negative dynamics, showing a continuous
reduction in amplitude, which makes the concerns regarding competitiveness still valid, especially because Germany and France have recorded positive dynamics23 of the real unit labour costs, in the period 2012-2014 .
Romania was one of the few European countries with a high gain in competitiveness, after the economic and financial crisis. Besides the positive developments in the private sector, the dynamics presented in the table above were also encouraged by measures of adjusting personnel expenses in the public sector. In the period 2009-2013, the real unit labour costs in Romania were reduced by 18%, compared to 2008. Since 2014, a reverse trend of the real unit labour cost growth has occurred, which represent a concern for the stability and competitiveness. The 1.4% growth in 2014 is one of the highest in the European Union.
The positive development subsequent to the crisis was emphasized in the Country Report Romania 201624, which states: "Between 2009 and 2016, both productivity of the tradable sector and the nontradable sector rose by 6%, while employee remuneration increased by 2% and by 3%, respectively, during the same period".
In the same report, even if the evaluation refers to the total employment and not to the wage employment, the assessment of the positive trends actually regards the employees. As a result, we believe that two assessments of the European Commission are relevant, in comparison with the conclusions presented in the article. The document stresses that "labour market situation in Romania is generally better than in previous years" and "employment is particularly concentrated in sectors with high added value."
6. The unemployment after the economic crisis In statistical terms, the unemployment is measured - in two ways: total unemployment - as defined by the
International Labour Office (ILO - which focuses on availability and personal effort to find a job; evaluation is made quarterly, based on the " Labour Force Survey (AMIGO) "and the registered unemployment at the end of each month by the National Agency for Employment (NAE), only to the unemployed who have decided to seek a job through this agency.
In general, the developments of the two categories of unemployment are divergent, depending on the economic situation.
In 2010, after a 7.0% increase of the ILO and registered unemployment rate, in 2011 the ILO unemployment rate reached the highest value (7.2%), while the registered unemployment rate was 5.2%.
In 2012, the positive economic developments, led to a slight increase in employment and a reduction in the ILO unemployment rate (6.8%), the registered unemployment recording 5.4%.
In 2013, the impact on employment growth has been moderate and the unemployment rate was 7.1%. Among the economic factors that have influenced the evolution of unemployment one can mention: the large
share of the rural population, the existence of a state economic sector, the high percentage of the hidden economy, the existence of illegal work or “day labourers". As an argument, it is to notice that in 2013, the number of non-wage employed has increased by 2.3%, while the number of employees picked up by 0.2%.
During the periods of unemployment rate decreases (unpaid unemployed who have not renewed requests from NAE), the ILO the monthly unemployment rate seasonally adjusted has increased.
In 2015, the unemployment rate decreased from 5.54% in January to 4.9% in December, while the monthly rate of ILO unemployment in 2015 was identical to that in 2014, 6.8% respectively. In this period, the number of non-wage employees decreased by 1.5% in 2014 and 10.5% in 2015, while the number of employees increased by 1.9% in 2014 and 3.6% in 2015.
2010 2011 2012 2013 2014 2015
Total number of unemployed (ILO), thou persons 651.7 659.4 627.2 653.0 628.7 623.9
Unemployment rate (ILO), % 7.0 7.2 6.8 7.1 6.8 6.8 Number of unemployed registered at the end of the year, thou persons 627.0 461.0 493.8 512.3 478.3 436.2
Unemployment rate registered, % 7.0 5.2 5.4 5.7 5.4 4.9
23 "The forecast of the unit labour cost" from the Bulletin of National Commission for Economic Forecasting, "Economic realities - present and perspectives" no. 3/2006 24 European Commission, the Commission staff working paper "Country Report Romania 2016", the Romanian version, Brussels, 02.26.2016, SWD (2016) 91 final, p. 27
19
Annals of the „Constantin Brâncuşi” University of Târgu Jiu, Economy Series, Issue 3/2016
„ACADEMICA BRÂNCUŞI” PUBLISHER, ISSN 2344 – 3685/ISSN-L 1844 - 7007
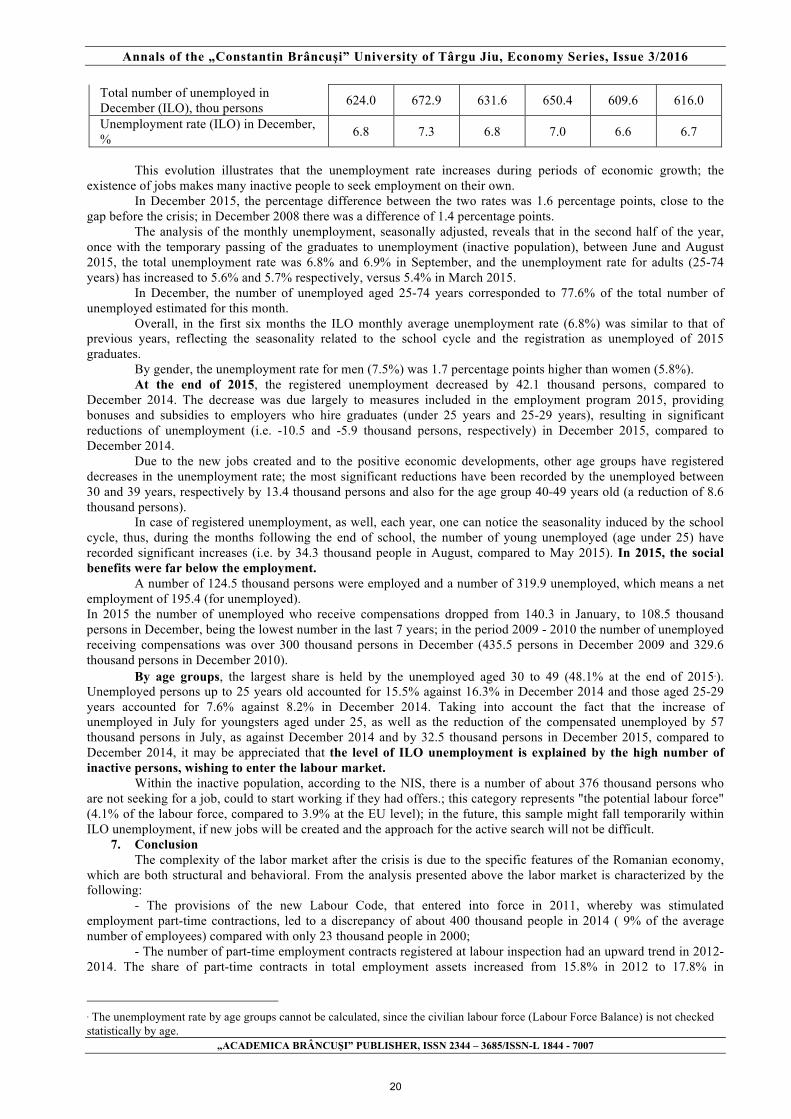
Total number of unemployed in December (ILO), thou persons 624.0 672.9 631.6 650.4 609.6 616.0
Unemployment rate (ILO) in December, % 6.8 7.3 6.8 7.0 6.6 6.7
This evolution illustrates that the unemployment rate increases during periods of economic growth; the
existence of jobs makes many inactive people to seek employment on their own. In December 2015, the percentage difference between the two rates was 1.6 percentage points, close to the
gap before the crisis; in December 2008 there was a difference of 1.4 percentage points. The analysis of the monthly unemployment, seasonally adjusted, reveals that in the second half of the year,
once with the temporary passing of the graduates to unemployment (inactive population), between June and August 2015, the total unemployment rate was 6.8% and 6.9% in September, and the unemployment rate for adults (25-74 years) has increased to 5.6% and 5.7% respectively, versus 5.4% in March 2015.
In December, the number of unemployed aged 25-74 years corresponded to 77.6% of the total number of unemployed estimated for this month.
Overall, in the first six months the ILO monthly average unemployment rate (6.8%) was similar to that of previous years, reflecting the seasonality related to the school cycle and the registration as unemployed of 2015 graduates.
By gender, the unemployment rate for men (7.5%) was 1.7 percentage points higher than women (5.8%). At the end of 2015, the registered unemployment decreased by 42.1 thousand persons, compared to
December 2014. The decrease was due largely to measures included in the employment program 2015, providing bonuses and subsidies to employers who hire graduates (under 25 years and 25-29 years), resulting in significant reductions of unemployment (i.e. -10.5 and -5.9 thousand persons, respectively) in December 2015, compared to December 2014.
Due to the new jobs created and to the positive economic developments, other age groups have registered decreases in the unemployment rate; the most significant reductions have been recorded by the unemployed between 30 and 39 years, respectively by 13.4 thousand persons and also for the age group 40-49 years old (a reduction of 8.6 thousand persons).
In case of registered unemployment, as well, each year, one can notice the seasonality induced by the school cycle, thus, during the months following the end of school, the number of young unemployed (age under 25) have recorded significant increases (i.e. by 34.3 thousand people in August, compared to May 2015). In 2015, the social benefits were far below the employment.
A number of 124.5 thousand persons were employed and a number of 319.9 unemployed, which means a net employment of 195.4 (for unemployed). In 2015 the number of unemployed who receive compensations dropped from 140.3 in January, to 108.5 thousand persons in December, being the lowest number in the last 7 years; in the period 2009 - 2010 the number of unemployed receiving compensations was over 300 thousand persons in December (435.5 persons in December 2009 and 329.6 thousand persons in December 2010).
By age groups, the largest share is held by the unemployed aged 30 to 49 (48.1% at the end of 2015∗). Unemployed persons up to 25 years old accounted for 15.5% against 16.3% in December 2014 and those aged 25-29 years accounted for 7.6% against 8.2% in December 2014. Taking into account the fact that the increase of unemployed in July for youngsters aged under 25, as well as the reduction of the compensated unemployed by 57 thousand persons in July, as against December 2014 and by 32.5 thousand persons in December 2015, compared to December 2014, it may be appreciated that the level of ILO unemployment is explained by the high number of inactive persons, wishing to enter the labour market.
Within the inactive population, according to the NIS, there is a number of about 376 thousand persons who are not seeking for a job, could to start working if they had offers.; this category represents "the potential labour force" (4.1% of the labour force, compared to 3.9% at the EU level); in the future, this sample might fall temporarily within ILO unemployment, if new jobs will be created and the approach for the active search will not be difficult.
7. Conclusion The complexity of the labor market after the crisis is due to the specific features of the Romanian economy,
which are both structural and behavioral. From the analysis presented above the labor market is characterized by the following:
- The provisions of the new Labour Code, that entered into force in 2011, whereby was stimulated employment part-time contractions, led to a discrepancy of about 400 thousand people in 2014 ( 9% of the average number of employees) compared with only 23 thousand people in 2000;
- The number of part-time employment contracts registered at labour inspection had an upward trend in 2012-2014. The share of part-time contracts in total employment assets increased from 15.8% in 2012 to 17.8% in
∗ The unemployment rate by age groups cannot be calculated, since the civilian labour force (Labour Force Balance) is not checked statistically by age.
20

Annals of the „Constantin Brâncuşi” University of Târgu Jiu, Economy Series, Issue 3/2016
„ACADEMICA BRÂNCUŞI” PUBLISHER, ISSN 2344 – 3685/ISSN-L 1844 - 7007
September 2015. The number of employees working part time is still very low, representing less than 1 % of total employees.
- The total employed population from National Accounts in 2014 was 0.2% higher compared to 2012, due to the increase of the number of employees by 1.9% and due to reducing other categories of employed people by 3.6%. This development has resulted in increasing the share of employees from 68.3% in 2012 to 69.4% in 2014.
- Romania was one of the few European countries with a high gain of competitiveness after economic and financial crisis. Besides the positive developments in the private sector, the dynamics presented in the table above have also contributed the adjustment measures of the personnel expenses in the public sector. In the period 2009-2013, real unit labour costs in Romania was reduced by 18% compared to 2008. Since 2014 it is developing the backward trend of the real unit labour cost growth, which is worrying for stability and competitiveness. The increase of 1.4% in 2014 is one of the highest in the European Union.
- The slight increase in employment and the reduction in the ILO unemployment rate (6.8%) and the registered unemployment to 5.4% in 2012, are due to positive economic developments. In 2013 the impact on employment growth was moderate, the ILO unemployment rate being just 7.1%. In 2015 the unemployment rate was reduced from 5.54% in January to 4.9% in December.
- In 2013 the number of unemployed population was reduced by 2.3%, while the number of employees was increased by 0.2%. Bibliography
1. Albu, L., L., Caraiani, P., Iordan, M. – The perspectives of the labour market in Romania in the context of the
Europe 2020 strategy, study developed within the “Improving the institutional, assessment and macroeconomic policy formulation capacity in the field of economic convergence of the National Prognosis Commission with the European Union, code SMIS 27153” project, Ed. Economică, Bucharest, 2012
2. Bocean Claudiu George, Balances and imbalances on the labour market in Romania, Universitaria Publishing House, Craiova, 2007.
3. Chipea, F. (2011), Labour market exclusion risks in Romania for 15-24 age group, Romanian Sociology, 9(4), 45.
4. Ciucur Dumitru, Gavrilă, Ilie, Popescu, Constantin, Economics, IInd edition, Economica Publishing house, Bucharest, 2001.
5. Ciutacu C. - Labour Market, Ed. Expert, Bucharest, 2001, ISBN 973-8177-30-8, p. 226-227 6. European Commission, the Commission staff working paper "Country Report Romania 2016", the Romanian
version, Brussels, 02.26.2016, SWD (2016) 91 final, p. 27 7. Gh. Creţoiu and colab., Economie politică, „Şansa” S.R.L. Publishing House, Bucharest, 1995, p. 395; I.D 8. Gheorghe MECU – Contents and Particularities of the Labor market
http://www.revistadestatistica.ro/suplimente/2012/2/srrs2_2012a44.pdf 9. Ghizdeanu I. - Applied Macroeconomics, Ed.Bren, Bucharest, 2007, ISBN 978-973-648-677-7, p. 24 10. Marin Băbeanu, Marius Băbeanu, Piaţa şi sistemul pieţei, Fundaţia „Scrisul Românesc”, Craiova, AustRom
IMPEX SRL Publishing House, 1998, 11. Motoi, Gabriela Labour market in Europe in the world crisis context and the impact on youth,
Source: Political Sciences Paper, 2010, Issue 28, p76-80. 5p. 12. NSI – Methodological specifications, Press release no 46/ February 2016 13. NSI- Statistical Research S1- The survey on salaries, where there is a chapter and a designated position for
“the average number of employees” 14. Romanian Academy – Romania’s development strategy in the next 20 years, vol. II, Romanian Academy
Publishing House, 2016, p. 298 15. The forecast of the unit labour cost" from the Bulletin of National Commission for Economic Forecasting,
"Economic realities - present and perspectives" no. 3/2006 16. http://media.hotnews.ro/media_server1/document-2014-10-13-18295270-0-balanta-fortei-munca-1-ianuarie-
2014.pdf 17. http://www.cnp.ro/user/repository/ancheta_de_conjunctura_trim_I_2016.pdf 18. http://www.cnp.ro/user/repository/ancheta_de_conjunctura_trim_IV_2015.pdf 19. https://ec.europa.eu/eures/userSatisfaction.do?method=vote&satisfaction=1
21
Annals of the „Constantin Brâncuşi” University of Târgu Jiu, Economy Series, Issue 3/2016
„ACADEMICA BRÂNCUŞI” PUBLISHER, ISSN 2344 – 3685/ISSN-L 1844 - 7007
ORGANIZATIONAL COMMUNICATION FROM
THE TOP DOWN TO S.C. ARTEGO S.A.
DORU CÎRNU PROFESSOR PH.D. „CONSTANTIN BRANCUSI” UNIVERSITY OF TARGU JIU
e-mail:[email protected]
GABRIELA BUȘAN LECTURER PH.D, C CONSTANTIN BRANCUSI UNIVERSITY OF TARGU-JIU
IRINA ELENA CHIRTOC ASSISTANT PH.D, CONSTANTIN BRANCUSI UNIVERSITY OF TARGU-JIU
[email protected] Abstract
Vertical communication within the organization is twofold: top down and bottom up. The communication from the top down starts from the top management and continuous vertical hierarchy downward until the execution personnel from the base.
This type of organizational communication aims to inform, advise, to guide, to train and evaluate subordinates, and to provide all necessary information on the objectives and organizational policies. Often, managers are overly optimistic about the clarity and complete vertical communication. In fact, they are usually managers who frequently recorded failures in the communication of important information or adequate training of subordinates. Starting from previous research more laboriou, among which we mention the GLOBE Study of American Professor Robert House or one conducted in our country (the study Comoros ) team coordinated by Professor Constantin Rosca, we did a study of smaller scale (at company level) the vertical communication and efficiency of communication modalities of this type of managerial act.
In this regard, a research performed at S. C. ARTEGO S.A. watched and how communication is done from top to bottom line information and training of personnel. The research, based on a questionnaire, which preserves the anonymity of respondents had interesting results, we stood to attention and present them in what follows. It was surprising to find that certain legal limits for working climat, especially causes of stress are almost unknown, even if some subjects gave positive answers to questions of this nature. Keywords: organizational comunication, hierarchy manager, subordinate sample Clasificare JEL: J50, M12, M54 1. The importance and context of the study The idea that started this study is based on previous research conducted by renowned specialists, but by the extent of the coverage area led to their failure to complete in all respects, to this day. We turn first to the GLOBE study started many years ago by an international team led by the famous American professor Robert House. Among the main objectives was found researching the impact and effectiveness of leadership on specific behaviors and attitudes on the subordinates global leader effectiveness. A similar study, but limited on a national scale, it has made our country a team of researchers from SSMAR under the direction of another great specialist in human resources, Professor Constantin Rosca. The results, which began to appear, are particularly interesting, but even begun five years ago, the study not finished. If specific versus universal proved to be too laborious to avoid a similar situation, we set similar goals for a specific studio, limited level of organization. We do also mention that all this research are based on the cultural dimensions of Hofstede identified during the 80`s. [3] Vertical communication within the organization is twofold: top down and bottom up. The communication from the top down starts from the top management and continuous vertical hierarchy downward until the execution personnel from the base. This type of organizational communication aims to inform, advise, to guide, to train and evaluate subordinates, and to provide all necessary information on the objectives and organizational policies. [4]
22
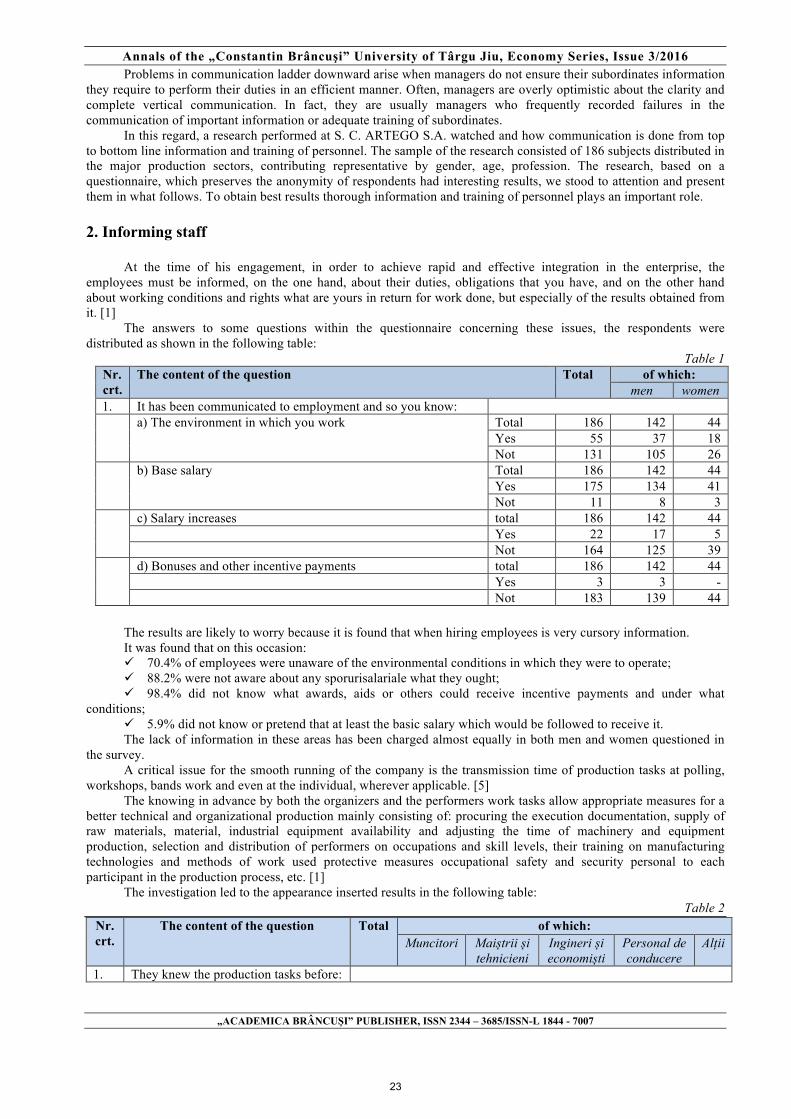
Annals of the „Constantin Brâncuşi” University of Târgu Jiu, Economy Series, Issue 3/2016
„ACADEMICA BRÂNCUŞI” PUBLISHER, ISSN 2344 – 3685/ISSN-L 1844 - 7007
Problems in communication ladder downward arise when managers do not ensure their subordinates information they require to perform their duties in an efficient manner. Often, managers are overly optimistic about the clarity and complete vertical communication. In fact, they are usually managers who frequently recorded failures in the communication of important information or adequate training of subordinates.
In this regard, a research performed at S. C. ARTEGO S.A. watched and how communication is done from top to bottom line information and training of personnel. The sample of the research consisted of 186 subjects distributed in the major production sectors, contributing representative by gender, age, profession. The research, based on a questionnaire, which preserves the anonymity of respondents had interesting results, we stood to attention and present them in what follows. To obtain best results thorough information and training of personnel plays an important role. 2. Informing staff
At the time of his engagement, in order to achieve rapid and effective integration in the enterprise, the employees must be informed, on the one hand, about their duties, obligations that you have, and on the other hand about working conditions and rights what are yours in return for work done, but especially of the results obtained from it. [1]
The answers to some questions within the questionnaire concerning these issues, the respondents were distributed as shown in the following table:
Table 1 Nr. crt.
The content of the question Total of which: men women
1. It has been communicated to employment and so you know: a) The environment in which you work Total 186 142 44
Yes 55 37 18 Not 131 105 26
b) Base salary Total 186 142 44 Yes 175 134 41 Not 11 8 3
c) Salary increases total 186 142 44 Yes 22 17 5 Not 164 125 39 d) Bonuses and other incentive payments total 186 142 44 Yes 3 3 - Not 183 139 44
The results are likely to worry because it is found that when hiring employees is very cursory information.
It was found that on this occasion: ü 70.4% of employees were unaware of the environmental conditions in which they were to operate; ü 88.2% were not aware about any sporurisalariale what they ought; ü 98.4% did not know what awards, aids or others could receive incentive payments and under what
conditions; ü 5.9% did not know or pretend that at least the basic salary which would be followed to receive it.
The lack of information in these areas has been charged almost equally in both men and women questioned in the survey.
A critical issue for the smooth running of the company is the transmission time of production tasks at polling, workshops, bands work and even at the individual, wherever applicable. [5]
The knowing in advance by both the organizers and the performers work tasks allow appropriate measures for a better technical and organizational production mainly consisting of: procuring the execution documentation, supply of raw materials, material, industrial equipment availability and adjusting the time of machinery and equipment production, selection and distribution of performers on occupations and skill levels, their training on manufacturing technologies and methods of work used protective measures occupational safety and security personal to each participant in the production process, etc. [1]
The investigation led to the appearance inserted results in the following table: Table 2
Nr. crt.
The content of the question Total
of which: Muncitori
Maiștrii și tehnicieni
Ingineri și economiști
Personal de conducere
Alții
1. They knew the production tasks before:
23

Annals of the „Constantin Brâncuşi” University of Târgu Jiu, Economy Series, Issue 3/2016
„ACADEMICA BRÂNCUŞI” PUBLISHER, ISSN 2344 – 3685/ISSN-L 1844 - 7007
Nr. crt.
The content of the question Total
of which: Muncitori
Maiștrii și tehnicieni
Ingineri și economiști
Personal de conducere
Alții
a) with more than one day 29 28 - - - 1 b) with 1-2 days 100 98 2 - - - c) with 3-5 days 42 37 4 1 - - d) less than 5 days 15 6 3 3 3 - Total 186 169 9 4 3 1
The data presented may be noted that in the view of those who answered this question transmission mechanism
production tasks is quite well developed, for which functioning properly to ensure the organization early tasks for work.
Thus, depending on the specific production processes, and the level of execution that lies personnel (workers, foremen, technicians, engineers, management personnel), responses are distributed as follows:
ü 8% of staff said that production tasks are known by more than 5 days before the start of the execution itself. Such a response has been given full management staff participating in the survey (department heads, heads of workshops), 75% of engineers and economists, 33% of masters and technicians and even 3.5% of workers;
ü 22.6% say that these tasks are known ănainte 3-5 days. On this response personnel was distributed as follows: 25% of engineers and economists, 44.4% of masters and technicians, 21.9% of workers;
ü 55.8% think that in general, the production volumes are known by those to whom they are addressed by about 1-2 days earlier. Most of those who gave this response are workers (58% of total) and foremen or technicians (22.2% of subjects who fall into this category);
ü 15.6% of those surveyed estimated that production tasks are transmitted no later than one day before or even the day to carry them out. Such a response was given exclusively by workers, especially the unskilled.
3. Staff training
In the communication process from top to bottom, as thorough training of staff plays an important role, both for
compliance and manufacturing technologies for the security and safety of personnel. [2] Answers some questions concerning these aspects of managerial capacity were distributed as follows (Table 3):
Table 3 Nr. crt.
The content of the questions Total of which: men women
1. Employment have known the rules of labor protection? Total 186 142 44 Yes 168 130 38 Not 18 12 6
2. Do you know what are the legal limits of ambient factors admitted work for:
a) temperature Total 186 142 44 Yes 79 74 5 Not 107 68 39
b) toxic gases (NOx) Total 186 142 44 Yes 35 32 3 Not 151 109 42
c) lighting total 186 142 44 Yes 12 12 - Not 174 130 44 d) noise total 186 142 44 Yes 114 95 19 Not 72 47 25 e) industrial dust total 186 142 44 Yes 8 8 - Not 178 134 44
3. Do you know that is manufacturing technology and method of work? total 186 142 44 Yes 170 129 41 Not 16 13 3
24

Annals of the „Constantin Brâncuşi” University of Târgu Jiu, Economy Series, Issue 3/2016
„ACADEMICA BRÂNCUŞI” PUBLISHER, ISSN 2344 – 3685/ISSN-L 1844 - 7007
4. Conclusions
If we analyze the data obtained from S.C. Artego S.A., from the questionnaires filled by the subjects in the sample were drawn important conclusions. Whereas internal regulations do not permit the employment of any person to not sign the Individual form of General Instruction for Workplace Safety and Special Training in the Workplace sheet, we can appreciate that negative responses can be attributed to the "memory" of those persons or on behalf of a formal training, which may have the most serious of pursues.
Legal limits for permissible work environment factors are almost unknown, even if some subjects gave positive answers to questions of this nature. We affirm this because such knowledge is not transmitted neither on briefings, neither at regular workplace protection trainings, recorded in individual sheets, nor at the various training and /or retraining as reflected in consultation with a significant part of the programs of such courses.
Based on these findings derived from statistical processing of the responses to the questions in the questionnaire that formed the basis of the research, we believe that the management team, otherwise a powerful enough one, might have in vie certain measures for:
ü a better organization of staff informing, at hiring as well as in the work process regarding the conditions of physical and mental work environment and salary system elements, bonuses, prizes and certain compensation;
ü regulating the way and transmission deadlines of production tasks in hierarchical levels: from technical production manager, head of department, head of workshop, foreman to simple performers;
ü improving the content of training activities on labor protection rules, physical environment ambient conditions, the conditions of employment of each employee, manufacturing technologies, as well as ones regarding working methods that are applied. We believe that consideration and application of several measures proposed by the management team of SC ARTEGO S.A. with valuable collective there will lead to change attitudes and mentalities likely to positively influence mood and hence results. Bibliography [1] Albu, N., Albu, C., Instrumente de management al performanţei, Editura Economică, Bucureşti, 2011. [2] AMCOR, Manualul consultantului în management, Editura Inter-Media. Bucureşti, 2012. [3] Hofstede G., . Hofstede G.J. –Cultures and Organizations, EADM 826.3-Executive Book,1991 [4] Newton, R., Managementul schimbării pas cu pas, Editura ALL, Bucureşti, 2009. [5] Prodan, A., Managementul resurselor umane. Ghid de practică, Editura Economică, București, 2011. [6] Tofler, A., Corporaţia adaptabilă, Editura ANTET, Bucureşti, 1996. [7] Zorlentan, T., Burdus, E., Caprarescu ,G., Managementul organizaţiei, Editura Holding Reporter,
Bucureşti, 2005.
25
Annals of the „Constantin Brâncuşi” University of Târgu Jiu, Economy Series, Issue 3/2016
„ACADEMICA BRÂNCUŞI” PUBLISHER, ISSN 2344 – 3685/ISSN-L 1844 - 7007
TAX EVASION THROUGH FICTITIOUS ECONOMIC OPERATIONS, OBSTACLE TO
SUSTAINABLE DEVELOPMENT
SERGIU-BOGDAN CONSTANTIN UNIVERSITY LECTURER PHD, BUCHAREST UNIVERSITY OF ECONOMIC STUDIES,
e-mail: [email protected] Abstract
Tax evasion means the avoidance of declaring and paying taxes. The purpose of the research is to identify ways and mechanisms of tax evasion through fictitious economic operations and how this kind o tax evasion can influence sustainable development. The principal methods are researching tax evasion cases investigated by the Romanian authorities responsible for combating this phenomenon, court trials on tax evasion and using the bibliographic references in the field. The data used are obtained through open sources of the authorities specialized in combating tax evasion for the cases made public, the media and also from specialised literature. The principal results are that this type of tax evasion is manifested through transactions with “ghost companies”, with offshore companies and transactions between associated enterprises. The main causes of this problem are: high taxation, corruption, inefficient government and tax authorities, no fiscal education and very hard tax legislation. The consequences are that the state budget is affected, the companies that do business legally are affected and also the final consumers, so Romania will not have economic growth and the quality of life will not improve. The main conclusion is that in order to have sustainable development, tax evasion in general and this kind of tax evasion in particular must be eradicated. The measures that have to be taken are to prevent tax evasion and to tighten controls but without violating taxpayers rights and without making abuses. Keywords: tax evasion, fictitious economic operations, ghost companies, offshore companies, associated enterprises, sustainable development Clasificare JEL: H26, O11 1. Introduction
Taxation is critical for fiscal policy; it lies at the heart of the society and constitutes a powerful instrument for sustainable development. Incomes are taxed to generate revenues for the state to provide essential services for the citizenry [4]. Through taxation the state gets revenues for health care, social care, environment protection, education, research, infrastructure, investments all these necessary for development. Economically some sectors of the economy are developed with tax revenue from more developed sectors.
Taxation can be also an innoportunity for the Romanian taxpayer, however honest they prove to be. Moreover, it becomes a burden and the cause of public discontent when the state does not administer money properly, pushing the taxpayer not to pay taxes [1].
Tax evasion means the avoidance by any means, whether fully or partially, of declaring and paying taxes to the state budget. Tax evasion is committed by infringing the tax law, taking advantage of the specific way in which taxation is applied, and it is one of the social and economic phenomena of greatest importance [2]. The main causes of the phenomenon are: high taxation, corruption, inefficient government, inefficient tax authorities, no fiscal education and very hard tax legislation.
The most common form of tax evasion is through fictitious economic operations. Law 241/2005 for the prevention and fight against tax evasion defines the fictitious economic operations as being the dissimulation of the economic reality by creating the apparent existence of an operation which, in fact, does not exist. The accounting of documents of acquisitions that are not real, or the accounting of any fictitious operations, their essential purpose being to manipulate the accounting and fiscal information, therefore, to distort reality in order to avoid taxation or to obtain fiscal advantages that, otherwise could not be granted [5].
The specialty literature describes the tax evasion phenomenon both on national and international level, the Romanian authors performing researches and surveys in the field [1] – [8]. The problematic of the fictitious economic operations is also presented but without thorough dedicated research.
The purpose of the research is to identify ways and mechanisms of tax evasion through fictitious economic operations and how can they influence sustainable development.
There were studied tax evasion cases investigated by the Romanian authorities responsible for combating the phenomenon, court trials on tax evasion [9] – [13] and using the specific literature [1] – [8]. The information and data
26

Annals of the „Constantin Brâncuşi” University of Târgu Jiu, Economy Series, Issue 3/2016
„ACADEMICA BRÂNCUŞI” PUBLISHER, ISSN 2344 – 3685/ISSN-L 1844 - 7007
used were obtained through open sources from the authorities for the cases made public, the media and also from specialized literature. First were identified the ways of making tax evasion through fictitious economic operations and then the consequences that affect sustainable development, were determined.
The most frequent fictitious economic operations are through “ghost companies”, offshore companies and associated enterprises. 2. Economic operations of the ghost companies
The analysis of the tax evasion phenomenon indicates a continuous tendency of fictive entities extension, practically of some obscure business groups, whose non dissimulated purpose is to achieve huge profits through tax evasion. This fact is facilitated by certain legislative deficiencies and is based on operational maneuvers cleverly exploited. All these entities are known as “ghost companies”.
Practice has proved the existence of two main categories of ghost companies, some that are registered with the Trade Register and others that are not registered at all.
The non registered ghost companies in fact do not exist, not being registered with the Trade Register. These companies have articles of association and forgery made stamps; they use accounting and fiscal documents that are false, counterfeit or illegally procured. Usually, the company name is close to the one of an existing one, just for creating confusion among the eventual “business partners” and give a note of apparent legality of the economic operations they carry out. Obviously, they do not submit tax statements, do not lead and do not organize accounting evidence.
The registered ones have an apparent legal aspect, meaning that their associates exist as natural persons and effectively take part in the firm’s foundation and registration with the Trade Register, lease a premise, open bank accounts, issue invoices, obtain the necessary authorizations for being able to function (obviously where the fiscal legislation provided this obligation) [5].
Some of these “ghost type” companies cannot be controlled, as they do not function at the declared premises, being used sometimes only for collecting the reimbursable VAT from the state budget. Most times, these companies act, in a first stage, in the transparent area of the economy and only subsequently prove a “ghost type” behavior, as they accumulate debts at the state budget; they frequently use the bank accounts to collect money from clients and to make the payments towards the suppliers just for creating a note of apparent legality over the activity they carry out. The said companies are used both for defrauding the state budget (usually functioning by organizing and leading double accounting activities that are based on a whole technique regarding documents forgery), and the commercial partners (initially, these companies attentively build an image of respectable and correct company for winning the business partners’ trust, and subsequently, will issue checks with no cover for the purchased goods, simultaneously with the disappearance from the registered office and from the declared working points).
The ghost companies are frequently used by the owners and/or administrators of some companies in order not to pay to the state budget the profit tax, the VAT, the tax on dividends and the salary contributions. After they deduct profit tax and VAT then they withdraw vast amounts of money – thus obtaining “black money”. The said acquisitions decrease the accounting profit of the company, and the dividends which would have been taxed on payment. Further on “under table” salaries are paid.
Ghost companies are also used in the contracts for public works of infrastructure - roads, bridges, water sewerage, and blocks’ rehabilitation. The contracts in cause are carried out with the state institutions after the Tenders are counterfeit. The owners of the companies that concluded such contracts with the state institutions use the ghost companies for having the necessary money to bribe the civil servants. In this case, fiscal evasion is joined to corruption.
The most visible consequence of the “ghost companies” activity is represented by the avoidance of taxation of some important incomes and VAT unreal deductions, deeds that generate significant fiscal prejudices and deprives the state budget of important financial resources. This is how a pressure over the national currency is created, information and statistics are distorted, and the operations carried out through these companies lead to the vitiation of the competitive business environment, with unfavorable effects over the companies that correctly fulfill their fiscal obligations. We should not lose sight of the fact that these illicit commercial practices encourage the introduction on the market of some expired or qualitatively inadequate products, with severe effects, on long term, over the population health status. Hence, the activity of these companies impairs the national economy, slows down the economic development and life’s quality decreases.
3. Economic operations through offshore companies
This is a method of international tax evasion that consists in the transfer of profits to states with reduced
taxation by taking revenues out of the country. The companies are paying services provided by offshore companies registered in tax havens but these services are not real [2]. Tax havens are tax free jurisdictions which have a legal status of state entities. These states entities offer an escape from tax but do not have anything illegal because everything is provided in the local law. They also provide secrecy, escape from financial regulation and are indifferent to the laws
27

Annals of the „Constantin Brâncuşi” University of Târgu Jiu, Economy Series, Issue 3/2016
„ACADEMICA BRÂNCUŞI” PUBLISHER, ISSN 2344 – 3685/ISSN-L 1844 - 7007
of other jurisdictions. A tax haven is a place that attracts business by offering facilities to help tax payers escape the laws of their countries.
The services provided by offshore companies registered in tax havens are of consultancy, management, marketing, and they cannot be quantified because they are fictitious services. Such services are not concretely or practically provided, and only a circuit of documents is created, but such documents do not reflect real economic operations. These services, although not real and not based on actual economic operations, are regulated based on commercial contracts concluded between parties, which contain a series of advantages in order to favour the transfer of profits to a country with much more favourable tax regulations. Many of these contracts stipulate the confidential character of the business precisely because it is desired to hide fictitious economic operations without a real base. In order for the services to look more real, written reports and estimates of works are made also. The fictitious services are used as instrument of transfer of an important part of the taxable profit to more favourable tax conditions, practically making a transfer of the right of taxation from Romania to countries with lighter taxation [2]. By accounting these services as deductable expenses, less profit tax is declared and paid to the Romanian state budget. More expenses mean less dividends and less dividend tax to pay.
The offshore companies are also used in the field of goods export. The indigenous goods are exported at modest prices to an offshore company, which carries a price adjustment. The price is raised up to the real value of the export, and, subsequently, the said products reach the final destination. The taxable profit is visibly diminished with the hidden price of the goods that are to be “exported” to other offshore companies from tax havens, and the effect is represented by the diminishing of the profit tax due in Romania. Goods may be also exported to offshore companies and then imported back in Romania, illegally requiring the VAT reimbursement in the Customs.
Thus offshore economic operations are a device to avoid taxes. Because of the offshore companies, vast amounts financial resources are kept offshore and go untaxed.
Romania cannot afford to lose these tax revenues. The more is done to eradicate tax evasion, the more resources Romania will have to finance growth-enhancing public investment, restore the health of public finances, and put the euro area economy back on a sustained and long-term recovery.
4. Transactions between associated enterprises
Commercial and financial transactions between associated enterprises must be made as if they were independent enterprises and that is according to the principle of free market price [7]. The transfer pricing principles must be considered when determining the profits of the associated enterprises and the revenues or expenses should be adjusted in order to reflect the market price for the goods or services provided.
Transfer pricing abuse refers to various acts of manipulating transactions in associated enterprises with the view to reducing the amount of profit tax and/or value added tax (VAT) these companies should pay. When referred to transfer pricing abuse it can also be referred to making false profits or losses, false company performance [3].
Transfer pricing abuse makes access to real information impossible. Manipulating financial information makes financial statements difficult to access and assess. Such companies are irresponsible because they undermine the important contributions that government, banks, shareholders, trade unions, and stock exchange make to their success.
When some companies have to recover the VAT or have fiscal loss, they issue invoices for sales or for fictive services supply to friends companies or to associated enterprises. The companies making such acquisitions diminish the VAT or the profit tax to pay. Friends companies are third parties companies which have common interests and are in the same sphere of influence. They are clients companies from the “group” with the main goal of avoiding transfer prices rules. Each company among the ones mentioned above may act both as supplier, and as client towards the others, meaning that each company may be both supplier, and client for all others, exchanging invoices among each other. All these companies don't use real prices of the goods and services within the transactions. The profits of these companies are not real and do not observe the principles regarding the transfer prices. The total annual expenditures are artificially kept at certain percentages from the total annual revenues every year. The transactions among these companies do not have an economic purpose, do not have a real economic content, but have the role of achieving the fiscal optimization, of avoiding taxation, hence, of paying as less as possible at the state budget, the said transactions being artificial and fictive. The main purpose of the transactions among these companies is to diminish their taxes by fictively increasing the expenditures, decreasing incomes and the illegal deduction of VAT. They consider this a fiscal optimization, but, actually, this is tax evasion, prejudicing thus the state budget by this shuttle system.
Some of the associated enterprises that do business are offshore companies incorporated in tax havens. So, some enterprises do business with associated enterprises from tax havens. Because of the secrecy policy in the tax havens nobody realy knows what companies that do business are associated enterprises. Even thou the business is real is very hard for the tax aurhorities to determine if the transfer pricing rules are respected.
As associated enterprises continue to report false financial statements, the business environment will not show its real potential and the potential investors will judge it wrong. Such investors will leave and relocate when they’ll learn that they were cheated, resulting in a loss in employment and national income.
28

Annals of the „Constantin Brâncuşi” University of Târgu Jiu, Economy Series, Issue 3/2016
„ACADEMICA BRÂNCUŞI” PUBLISHER, ISSN 2344 – 3685/ISSN-L 1844 - 7007
5. Conclusions
“Ghost companies”, offshore companies and transfer pricing abuses are the main forms of tax evasion that
threaten sustainable development. Because of these, vast amounts of financial resources go to the shadow economy, go untaxed and a pressure is put to the national currency, so the state doesn’t have the money to fulfil its role in society. Potential investors may consider the business environment as hostile and take their business to other countries.
These forms of tax evasion lead to the destruction of competition as those that pay all taxes and fees are obliged to practice smaller prices, to cover their costs. Or, each entrepreneur is free and independent to set up the price of its products based on its own production costs and the amount adherent to the estimated profit.
The evasion practices block the development efforts for those who want to function legally, as the others function in the underground economy. The manufacturers and traders that work under the table from the fiscal point of view, do this from other points of view too.
The applicability of the research is in the accounting and fiscal practice for understanding which are the most common forms of tax evasion through fictitious economic operations, but also their inferring over the sustainable development. This work could be used both by the taxpayers that work legally in order to protect themselves, to correct and direct them, and by the fiscal authorities for better understanding these practices and for finding them out easily. Starting from the results of the research, the fiscal authorities may take measures for informing the entrepreneurs about the risks and the negative implications inferred by the ghost companies, offshore companies and the transactions between associated enterprises.
In order to avoid tax evasion running out of control during the evolution of our society and to try to eradicate the phenomenon, further actions are required seeking for preventive measures as well as the improvement of the control system of economic subjects concerning the compliance with tax legislation. The evasion practices are an impediment for the sustainable development and, hence, the eradication or, at least, the diminishing of the tax evasion should be compulsory.
Sustainable development must remain a fundamental objective for Romania and it will not be brought about by eradicating tax evasion only. It must be taken up by society, as well as the big political and economic decisions that have to be taken. This requires profound changes in thinking, in economic and social structures and in consumption and production patterns.
The research directions that will follow will be about other forms tax evasion may manifest in Romania. Tax evasion is to be analyzed on each type of tax and fee regulated by the Tax Code, also considering the way tax evasion is presented in Law 241/2005 for tax evasion prevention and control.
6. Bibliography [1] Constantin S.B., “A study on tax evasion in Romania”, International Scientific Conference, ECOTREND 2014, CONSTANTIN BRANCUSI” UNIVERSITY OF TÂRGU JIU, FACULTY OF ECONOMICS AND BUSINESS ADMINISTRATION, Conference Proceedings, Academica Brâncuşi House Publisher, Târgu Jiu, 2014; [2] Constantin S.B., “International Tax Evasion in the Current Geopolitical Context“, OVIDIUS” UNIVERSITY OF CONSTANŢA FACULTY OF ECONOMIC SCIENCES; “OVIDIUS” UNIVERSITY ANNALS, Economic Sciences Series, Volume XIV, Issue 2, Constanţa, 2014; [3] Costea I.M., Optimizarea fiscală, Editura C.H. Beck, Bucureşti, 2011; [4] Elena I., Julean M., Capotă M., Bizon M., Ursu I., Cearbă R., Manualul specialistului în fiscalitate, Editura Irecson, Bucureşti, 2005; [5] Florescu D.A. P., Mrejeru T., Bucur D., Pantea M., Vasile M., Martinescu A., Evaziunea fiscală, Editura Universul Juridic, Bucureşti, 2013; [6] Horaţiu S., Dragoş P., Florin C., Practici de sustragere de la înregistrarea şi plata impozitelor: la limita fraudei şi dincolo de ea, Editura C.H. Beck, Bucureşti, 2009; [7] Pătroi D., Biriş G., Controverse actuale în fiscalitate, Editura C.H. Beck, Bucureşti, 2011; [8] Vîrjan B., Infracţiunilea de evaziune fiscală, Teză de doctorat, Facultatea de Drept, Universitatea din Bucureşti, 2011; [9] http://www.antifrauda.ro/ [10] http://www.dgipi.ro/ [11] http://www.pna.ro/ [12] https://b.politiaromana.ro/ [13] http://portal.just.ro/
29
Annals of the „Constantin Brâncuşi” University of Târgu Jiu, Economy Series, Issue 3/2016
„ACADEMICA BRÂNCUŞI” PUBLISHER, ISSN 2344 – 3685/ISSN-L 1844 - 7007
URBAN GREEN AREAS – ISSUES AND ANSWERS FOR SUISTAINABLE
DEVELOPMENT (CASE STUDY IN ROMANIA)
LIVIU NEAMŢU ASSOC.PROF.PHD, CONSTANTIN BRANCUSI UNIVERSITY FROM TARGU JIU
ADINA CLAUDIA NEAMŢU
PROF.PHD, CONSTANTIN BRANCUSI UNIVERSITY FROM TARGU JIU e-mail: [email protected]
Abstract The current situation of urban areas from Romania shows a natural environment with increased risk for health
of residents due to the low level of green growth resulted from lack of integrated management of green spaces in relation to the other components of sustainable development.
Urban evolution in the last 40 years has been characterized by an extensive industrial development and intensive residential development paving the way for an unstructured extension and poor urban landscaping. On this poorly planned urban development was felt a progressive green space crisis and landscaped recreational areas.
Regarding the management of the green areas in this general context, the urban areas will have to suggest for the future a series of ample projects in order to increase the surfaces, but also the quality of the green spaces, having an effect on the environmental quality but also projects of accomplishing certain areas of pleasure and leisure in frame of certain efficient environment strategies, all of these having a positive role on the health status of the population.
Keywords: green areas, development, green cities, urban.
JEL Classification: Q2, Q5, R5, M1, O2
1. Introduction
The current situation of urban areas from Romania shows a natural environment with increased risk for health of
residents due to the low level of green growth resulted from lack of integrated management of green spaces in relation to the other components of sustainable development.
The fields of sustainable development in urban areas we consider them: urban planning, management of green spaces and air quality, waste reduction and management, water quality, energy efficiency, clean and efficient transportation.
Within the strategic management of green areas and spaces aiming an improving air quality a priority role is occupied by methodology and the system to obtain the necessary informations for decision-making. In this context, monitoring of existing green areas is the cornerstone, which should provide the necessary informations. Correlated with this monitoring it is necessary to achieve data operational system for air quality monitoring that consists of fixed monitoring points in automatic and real-time mode for the main pollutants in the air. Air quality management will be closely connected with the management of green areas under the coordination of a specialized department within municipalities.
It is known that the society or social system represents a dependent part of the mother-nature (ecosystem) with a minor impact upon the human existence and conscience. (mazilu, 2009)
The information owned by the Ministry of the Environment about the green surface of the towns in Romania shows that, in the last 25 years, their trend followed a descendent line. From almost 22.000 hectares, as they were in 1990, the green surface decreased with about 2.000 hectares. The most important decrease passed in the big cities where during the last 25 years the green spaces were reduced with about 30%. For example, Bucharest was the most affected, registering a decrease with about 50%, from 34 million square metres of space, as they were in 1990, to only 17 million square metres (ionascu, 2003).
The average towns, having a population of maximum 100.000 inhabitants and having a pronounced industrial role, have also problems regarding the surface of the green spaces. This is due to the forced development during 1960-1990 when the evolution of the constructed space increased with an average of about 60%. Here there are towns like Targu-Jiu, Alexandria, Turnu Măgurele Piatra Neamţ, Petroşani, Călăraşi that did not care about the green spaces.
In exchange, the small towns in the hill and field areas are localities where people enjoy a lot of green, according to the data of the Ministry of Environment. In their top, there is Vişeul de Sus (county of Maramureş), Gătaia (county of Timiş) and Bragadiru (county of Ilfov), where every inhabitant has some hundreds of square metres of green
30

Annals of the „Constantin Brâncuşi” University of Târgu Jiu, Economy Series, Issue 3/2016
„ACADEMICA BRÂNCUŞI” PUBLISHER, ISSN 2344 – 3685/ISSN-L 1844 - 7007
space: Vişeul de Sus, Maramureş - 443 sqm/inhabitant; Gătaia, Timiş - 359,13 sqm/inhabitant; Bragadiru, Ilfov - 226 sqm/inhabitant; Baia de Aramă, Mehedinţi - 197,53 sqm/inhabitant; Ocna Sibiului, Sibiu - 181 sqm/inhabitant.
The surface stipulated by the World Health Organization (WHO) for any planet inhabitant is of 50 square metres per inhabitant (between 40 and 60 sqm/ inhabitant). Romania accessed this norm only on paper, more specifically in the Report on the Environmental State in Romania, the real average actually reaching only 18 sqm/inhabitant. The small surface is not the only problem of the green spaces in Romania. The other big problem is the inadequate state of many of the parks and public gardens in the country. In cities such as Târgu-Mureş, Constanţa, Cluj-Napoca, Iaşi or Bucureşti, most of the green spaces were transformed in commercial areas.
Neither the European localities achieve the WHO exigencies, the continental average being of about 25 sqm/inhabitant1. In the European top, there is Austria with sqm/inhabitant, followed by Netherlands and Belgium, having equal points - 65 sqm/inhabitant. The average in Hungary is of 30 sqm/inhabitant, and Malta and Cyprus have 35mp/inhabitant (baycan-levent and nijkamp, 2009).
In European Union countries the authorities require that the minimum surface accepted is of 16 square meters of green space per capita. The norms in force on Romania talk about a necessary of minimum 26 square meters of greenery per person, which will be achieved by 2013. However, there are still restrictions on the allocation of land for future parks or green areas in the neighborhoods.
The lifestyle based on consumption is generating the urban expansion. The urban expansions are caused by the change of lifestyles and consumption, as well as by the tolerant strategies, but not necessarily by the population growth. (beaujeu-garnier, 1987)
We need an action plan to address the two causes of intensive urban development expansion model: the consumption more than the standard needs of living and the tolerant policies of the design and spatial planning (urban planning) .
In this context, many authors argue for improving legislation and taxation on the urban environment. The urban policy will have to play an important role in the promotion and prevention of the aggressive urban sprawl and maintaining a balanced intensive development complemented by extensive development of certain areas. (ionascu, 2003) 2. Issues of urban green spaces
Issues concerning urban green spaces are of two kinds, those related to the quantity and also the quality of
improuvements related to these green areas. The current situation of urban land it shows an almost absolute preponderance of construction land amid a
massive market demand for such type of land. Land market is in large development and will achieve in the next 10 years a degree of maturity, which will cause serious damages to the lands with a green areas potential.
In order to prevent the damage of the environment and of the life quality, in the general list of the urban fields we will have to identify especially these green fields in order to be put under a local protection.
The main categories of green areas from the construction perimeter can be: Green spaces with unlimited access; Public green spaces and of specialized usage; Recreation areas; Sports complexes; Green spaces with limited access from the interior of some institutions; Areas planted in private yards - individuals should be advised to plant species characteristic of our area in arranging the gardens.
Many authors in the field of urban planning (campbell, 1996; morancho, 2003; kongjian, 2007) consider that the existent situation on these types of green land with development potential for recreation and leisure uses is unsatisfactory from the following points of view:
§ Deficit of green space. § Uneven distribution of green spaces. There are neighborhoods with a lack of green spaces. It is necessary
that we keep the existent green areas but also that we create new green areas and recreation parks. § Numerous areas with green spaces or that have a green potential development have been transformed in
constructed areas. It is compulsory a strict settlement of the constructions from the green spaces, from the areas that have a potential of being arranged as green areas or as recreation and leisure spaces.
§ In the autumn –winter period there is no sufficient perennial vegetation having as result desolate landscapes during these seasons. So it appears necessary the development of the spaces full with evergreen vegetation (southern or Nordic origin), especially trees on the sidewalks, green curtains that separate the streets from the sidewalks.
§ Green areas are not perfectly integrated in the natural circuits and in the ecosystems specific to the areas. It requires the protection and extension of biodiversity in poultry and small animals that may inhabit the green zone (e.g.: for small birds by setting up nests, feeders, notices);
§ There is no coherent long term plan and an official policy on green spaces and biodiversity protection. An operating plan is required to include active measures to preserve existing green areas correlated with active measures
1 According to the information from the Ministry of Environment
31
Annals of the „Constantin Brâncuşi” University of Târgu Jiu, Economy Series, Issue 3/2016
„ACADEMICA BRÂNCUŞI” PUBLISHER, ISSN 2344 – 3685/ISSN-L 1844 - 7007
pro biodiversity, but also encourages the creation, necessarily, of new green areas and parks to meet anti-pollution and recreational roles with an emphasis on ecological criteria in relation with the aesthetic.
§ There is little awareness campaigns and programs regarding the critical situation of the localities and their future development in the absence of adequate green spaces as number, surface and quality of the arrangement. The environmental education and information should be directed to owners of land which have a tendency to obsessive exploitation of constructed space.
The future of Cities, through the present realities, can be imagined as a way to one of the following urban development variants:
1) The Gray City - with neutral architecture and industry-specific characteristic of western European cities in areas with energy profile;
2) The Red City - with residential development through individual dwellings and an occupancy rate of the land very high functioning as zonal polarization center;
3) Blue City – with commercial and financial development as a regional center having many buildings with glass surface and with associated shade color;
4) Green Town – with integrated residential development also many green spaces and orientation towards commercial activities and service facilities and vocation of multiregional urban center.
3. Answers for the sustainable development of urban green areas
Regarding the management of the green areas in this general context, the urban areas will have to suggest for the
future a series of ample projects in order to increase the surfaces, but also the quality of the green spaces, having an effect on the environmental quality but also projects of accomplishing certain areas of pleasure and leisure in frame of certain efficient environment strategies, all of these having a positive role on the health status of the population.
A vision of integrated development of urban areas thus becomes a development model with a pronounced degree of balance between residential areas, industrial areas, commercial and service areas and landscaped green areas, balance that ensure the medium and long-term development.
Urban evolution in the last 40 years has been characterized by an extensive industrial development and intensive residential development paving the way for an unstructured extension and poor urban landscaping. On this poorly planned urban development was felt a progressive green space crisis and landscaped recreational areas like parks and gardens. Urban redevelopment will have to start from a well-defined strategy regarding the development of green spaces and recreational and leisure areas in the city, within each their development area. This strategy will be subordinated to the overall vision of urban balanced development on medium and long term.
By means of a sustainable strategy it can set the priorities for achieving the main goal of urban sustainable that of creating green cities using what might be called green zone management (caspersen and others, 2006). Based on the issues that we have identified in most cities in Romania these priorities could be set as follows:
a. Developing an integrated network of parks and public gardens Inside the urban areas urgent actions should be taken to increase green spaces as large landscaped parks and
gardens in addition to managing smaller green spaces like square type sites, in order to speak of modernization and rehabilitation of natural heritage for the benefit of the public. At the present moment the vast majority of cities have only one public garden. Most of these public gardens have already very long existence they occurring in a period in which urban space anthropization was not excessive one.
The natural environment within cities and gradually narrowed so that in the future are few prospects of finding sufficiently extensive areas of land for such facilities like parks or public gardens. However, in urban areas we have identified five types of spaces with the potential for conversion into green areas like parks and gardens:
1. Compact areas of land owned by municipalities in new residential areas, areas from which are made the current concessions for residential contructions;
2. Areas in the meadows, swamps and lakes along the rivers that are outside the buil-up areas; 3. Industrial or commercial type areas resulting from the decommissioning of existing economic objectives in
urban areas; 4. Privately owned surfaces in all areas of urban development that can be donated to the public domain or
includen in public-private partnership; 5. Outside the city areas that have potentially fitting as green areas and recreational and leisure activities and it
can be arranged before the start of residential and economic development of the area. In this way it can improve environmental indicators, such as number and surface of areas landscaped as parks
and public gardens; the number of people benefiting from direct recreation facilities and leisure through these parks and gardens; economic and residential land compared to the parks surfaces.
Also the effects of urban life quality will be numerous by increasing the number of parks by balancing the use of residential, industrial commercial with green areas; creating new poles of intra-urban concentration; increasing the comfort of living in new districts; creating the image of postindustrial cities or long term planned development of the city.
32
Annals of the „Constantin Brâncuşi” University of Târgu Jiu, Economy Series, Issue 3/2016
„ACADEMICA BRÂNCUŞI” PUBLISHER, ISSN 2344 – 3685/ISSN-L 1844 - 7007
b. Maintaining and developing existing green areas as recreational areas Without having a certain thematic arrangement in most urban areas, the green areas types and forms are not
highly diversified in terms of lanscaping. Natural urban environment is subject to constant degradation as a result of some influence factors. The causes of degradation are of two types: expansion of residential areas in the green areas and degradation of green spaces.
25 years in Romania has been extensively characterized by the degradation of green spaces, the maintenance and landscaping investments began to be more consistent after 2004. Maintaining green space is still quite expensive action, requiring diversified measures to support this, including:
§ Management contracts with private partners;; § Increasing income by renting facilities for commercial activities in these green spaces; § Increasing income by renting facilities for commercial activities in these green spaces;
Lanscaping of green areas is deficient in terms of ensuring their role as recreation and leisure areas. Considering that the arrangement would be directed to these facilities, the volume of city administration revenues from the management of parks would be much higher and would allow future funding arrangements. Maintain a groomed natural environment raises the comfort a life standards of the population and has a positive impact on public health. The cities will have to become not only green cities but also through this to provide additional value to the lives of residents by increasing recreational and leisure role of these spaces.
Another issue of landscaped green areas currently represents the opportunities for expand it in the immediate vicinity spaces. Opportunities for expansion are generally low and should be long term followed. Being placed in areas with relatively high land demand these lands remains very high price. In this situation, the only way a municipality to acquire new land for expansion is by donation or joint venture participation, between City Hall and individuals for development projects.
Active policy of maintenance and development of green areas and their transformation including as recreational areas will allow: the emergence of new green areas in urban ecological system, increasing the number of private partners involved in the rehabilitation of green spaces; increasing the value of green spaces rehabilitation projects; generating benefits from the exploitation of green areas for tourism and leisure.
c. Landscaping wetland and existing degraded lands Because the cities have followed an extensive development, the urban territory began to include numerous river
meadow and marsh land, most of them remaining public property. These lands with lakes and swamps are usually in an advanced state of decay being totally undeveloped. This damaging situation must be stopped and meadow type public land must be rehabilitated for the residents and potential tourist visitors. The advantage is that these lands have no residential or industrial potential, without real estate market demand for them. In these circumstances they can be transformed into new spaces like parks and gardens and may benefit from the presence of lakes, water reservoirs or wells. The potential of these areas must be individually assessed and subsequently included in General Urbanism Plan. This action will generate increasing diversity of green area structure in urban space, as well as the parks development and aquatic and meadows spaces revitalization. If they are in marginal areas of the city there will be possible to create recreational areas with lakes, forests or meadows specific landscape or it can create new parks.
A second area of work for the future development of green areas and recreational and leisure urban areas is to introduce degraded and undeveloped lands into the "green" city circuit. Being located somewhat outside of the intensive development of the city, the potential of these areas lies in large landscaping possibilities for recreation or leisure. he actions must target investments to protect the land to landslides and restoring vegetation in areas where it has been destroyed by cutting. Also the measures must cover construction restrictions in and around the area and the prohibition of industrial development but encouraging the development of non-polluting entrepreneurship like commerce and leisure services. Developing new public gardens in this type of area depends on two elements:
- The purchase of land in public ownership or development of a public-private partnership; - Land improvements to eliminate the danger of landslides. Outside these areas can be also identified other smaller lands that can be arranged as green squares or mini-
parks inside the residential areas. Marshland and degraded land conversion into the green areas brings many advantages: integration by
landscaping of degraded areas; inclusion of land sloping into the urban green system; stopping the phenomenon of stealing land from natural circuits; and green city image.
d. Vegetation curtains development on street alignments Cities have a highly fragmented structure highlighted by the length of streets.As such, asphalt coated surfaces
are very large in total urbanized area causing negative repercussions at the level of health of the population. This reality is often complemented by curtains lack of forest vegetation along the road network, both along
major circulation axes on urban area and at the level of access roads in residential areas. On one hand, even in the presence of trees along the sidewalks, they are not the type of perennial vegetation, and green vegetation is only in spring and summer seasons. The rest of the time their role is not met, even taking into account only the reduction of chemical pollution and noise. On the other hand the avenues and streets aesthetic could be affected, with pretty bleak landscapes.
33

Annals of the „Constantin Brâncuşi” University of Târgu Jiu, Economy Series, Issue 3/2016
„ACADEMICA BRÂNCUŞI” PUBLISHER, ISSN 2344 – 3685/ISSN-L 1844 - 7007
The quick solution to solve the problem is given by planting vegetation type conifers along the street network that have continuous vegetative period with high growth rate, and at the same time these can be already planted in their maturity.This solution can be achieved starting from the main boulevards, continuing with the main streets and in the third stage on neighborhood streets and parking areas.
Vegetation development measures in the area of street network will result in: reducing chemical and noise pollution; aesthetic improuving on main boulevards; developing balanced arboreal vegetation in residential neighborhoods; and civic involvement in arranging the street of residence.
e. Urban natural heritage protection The vast majority of cities do not at all exploit for leisure activities the rivers on which they are located, despite
the fact they can be arranged to form a complex of green spaces and water areas that can be used for people recreation. Instead of these urban recreational green areas the rivers are most often considered areas without public and scenic interest and at the same time they have a high level of pollution.The establishment of a green axis along the rivers may be possible by establishing a rehabilitation and landscaping plan with river embankments along their entire length from the entry to the exit from urban space. All economic activities that can be found along riverbeds will need to be ecologically rehabilitated and renovated or moved to other industrial areas.
Forests outside the cities, quite stretched around many cities, they may be of long term interest in connection with urban development.Even if the city is one with limited green areas and there is no great prospects for expansion of such surfaces in theirs central areas, in the suburbs greening level can be very high and some green spaces may be of forestry. Arranging these forest areas will allow balanced territorial development with urban forest strips around the city.They must be managed effectively for tourism and leisure, without admission of pollution or degradation.
By integrating riverbeds usually central, and woodland generally peripheral, it can create a central green areas on rivers and a balanced forest system in the suburbs along with suburbs opening to leisure and recreation.
4. Conclusions
The urban redevelopment will have to start from a well defined strategy in the development of green spaces and
recreational and leisure areas from the territory of cities, at the level of each developed area. This strategy will have to be subordinated to the general vision of the short and long term urban balanced development.
In order to do this will have to be developed a service, even specialized department to manage these activities and to become directly involved in various partnerships with the private sector.
Based on the development of an effective organizational system we will be able to develop and approve the action plan for green areas and even establish a Revaluation program of green areas for recreation and leisure facilities.
Based on this formalization there will be developed and implemented pilot projects for the development and operation of green areas. It is important to select a database of potential investors in projects to develop green areas. Investors will be encouraged to participate in these projects through opportunities offered for partnership exploitation of these areas.
In addition, municipalities in partnership with NGOs and various institutions, donors, businesses, can organize various activities and information and civic education campaigns for the population to become more aware and responsive to problems of urban spatial planning.
It is necessary even to create Consultative Councils, locally, regarding problems of 'green' development, council which will monitor and evaluate the quality of actions taken by municipal authorities in the field.
Also the community involvement is needed in the management of green spaces in order not to develop their practice of withdrawing from public property.
5. Bibliography [1] Baycan-Levent, T., Nijkamp, P., Planning and management of urban green spaces in Europe: Comparative
analysis, Journal of Urban Planning and Development , 135.1 (2009): 1-12. [2] Beaujeu-Garnier, J., Regions, Villes et Amenagement, Societe de Geographie, Paris, France, 1987. [3] Campbell, S., Green cities, growing cities, just cities?: Urban planning and the contradictions of sustainable
development., Journal of the American Planning Association 62.3 (1996): 296-312. [4] Caspersen, O.H., Konijnendijk, C.C., Olafsson, , A.S., Green space planning and land use: An assessment of
urban regional and green structure planning in Greater Copenhagen, Geografisk Tidsskrift-Danish Journal of Geography, 106 (2) 2006: 7-20.
[5] Ionaşcu G., Development and Rehabilitation of Human Settlements in Romania, Tempus, Bucharest, Romania, 2003.
[6] Kongjian, Y., Principles and Practices of Affordable Urban Green Space, Journal Landscape Architecture, (1) 2007: 55-64.
34

Annals of the „Constantin Brâncuşi” University of Târgu Jiu, Economy Series, Issue 3/2016
„ACADEMICA BRÂNCUŞI” PUBLISHER, ISSN 2344 – 3685/ISSN-L 1844 - 7007
[7] Mazilu, M., The ecological component of the lasting development, Journal of Environmental Protection and Ecology, 10 (1), 131 (2009).
[8] Morancho, A.B., A hedonic valuation of urban green areas, Landscape and urban planning 66.1 (2003): 35-41.
[9] Muntean, I. O. , Cuglesan N., Implementation of environmental protection laws and the new tasks of local authorities. J. of Environmental Protection and Ecology, 10 (1), 201 (2009).
[10] Neamțu, L., Neamțu, A.C., Strategic Management, Brancusi Academics, Targu-Jiu, Romania, 2010. [11] Paraschou, P., Nikolaou, K., Management, conservation and revelation of suburban forests. The case of
the suburban forest of the hill ‘Ag. Panteleimonas’ of Florina. J. of Environmental Protection and Ecology, 11 (2), 693 (2010).
[12] Todea, N., Popa, M., Deaconu, S. C., Environmental taxes in Romania, Journal of Environmental Protection and Ecology, 11 (4), 1465 (2010).
35
Annals of the „Constantin Brâncuşi” University of Târgu Jiu, Economy Series, Issue 3/2016
„ACADEMICA BRÂNCUŞI” PUBLISHER, ISSN 2344 – 3685/ISSN-L 1844 - 7007
GRADUATES’ WILLINGNESS TO BUILD A CAREER IN TOURISM. A VIEW POINT
OF THE STUDENTS IN THE TOURISM PROFILE ACADEMIC PROGRAMMES FROM THE TRANSILVANIA UNIVERSITY OF BRAŞOV
CODRUȚA ADINA BĂLTESCU
ASSOCIATE PROFESSOR PH.D., FACULTY OF ECONOMIC SCIENCES AND BUSINESS ADMINISTRATION, TRANSILVANIA UNIVERSITY OF BRAȘOV
e-mail: [email protected] Abstract
The sustainable development of the society is based on a solid and efficient educational system. At the same time, the sustainable development of the tourism sector can be achieved only with competent and responsible employees. Such goals represent the foundation in designing academic programs in all universities. But it cannot be ignored the fact that many university graduates do not follow a professional career in the same profile for which they have been prepared. In this context, it was conducted a quantitative marketing research among students in their final years from the Bachelor’s and Master’s academic programmes in the tourism profile at the Transilvania University of Brasov. The research aimed to reveal the level of students’ satisfaction regarding their knowledge and skills acquired during the academic studies. The results which have been obtained highlighted the fact that the majority intends to have a career in the tourism field but, at the same time, the students consider necessary to continue their studies in universities from Romania and other countries. This is a prerequisite in order to improve their knowledge and to increase their chances to be employed in a suitable job. The results are also relevant for improving the education curriculum, to optimize the didactic process, and especially for reshaping the training practice content. Keywords: Education, undergraduate students, career, tourism and hospitality industries. Clasificare JEL: A22, I250, M31. 1. Introduction
Education is an essential pillar for the development of a sustainable society. Equally, sustainable tourism
development is based on competence, skills and commitment of both employees and managers. More people working in tourism, in whatever capacity, raises the significance of the sector in political, economic and social terms at a local and national level [3]. Estimates of the scale of tourism employment vary but suggest that, globally, it is rising in the order of 2 % per annum and will constitute approximately 3.6 % of direct employment and 9.5 % of total employment by 2015 [20]. Kreisel (2011) identifies that one of the principle challenges for educators is how to contribute to sustainable development in our educational offering. If successful, we will be equipping graduates with the research and conceptual skills necessary for them to become the leaders of tomorrow not just in an important economic sector, but in fostering a more sustainable world [17]. The main objective of this paper was to identify the intentions of the students enrolled in the tourism study programmes from the Transilvania University of Brasov about consolidating a career in this field.
2. Literature review
A career is broadly defined as a lifelong process of work-related activities [9], and its development is an
ongoing series of stages characterized by unique concerns, themes and tasks [8]. What emerges in the career behavior of young professionals is what might be labeled a “bricolage,” a mixed bag of available short-term work and volunteer activities that when supported by strong professional identity can give rise to adaptability and sense of well-being [18]. As Wan et al. (2014) highlighted that career choice is a complex and multifaceted phenomenon, and multiple factors come into play that shape students’ career prospects and commitment to the tourism and hospitality industries. The match between what a person sees as important aspects of a career and the extent to which they believe a particular career offers these factors will play a crucial role in that person’s decision-making process [14].
The tourism and hospitality industries worldwide have been confronted with the problem of attracting and retaining quality employees, which has led to a shortage of skilled employees to staff the ever-growing number of hospitality businesses [3, 15]. There are many factors contributing to the problem, and negative disposition toward the industries is one of them. The industries have a poor reputation due mainly to the low financial compensation,
36
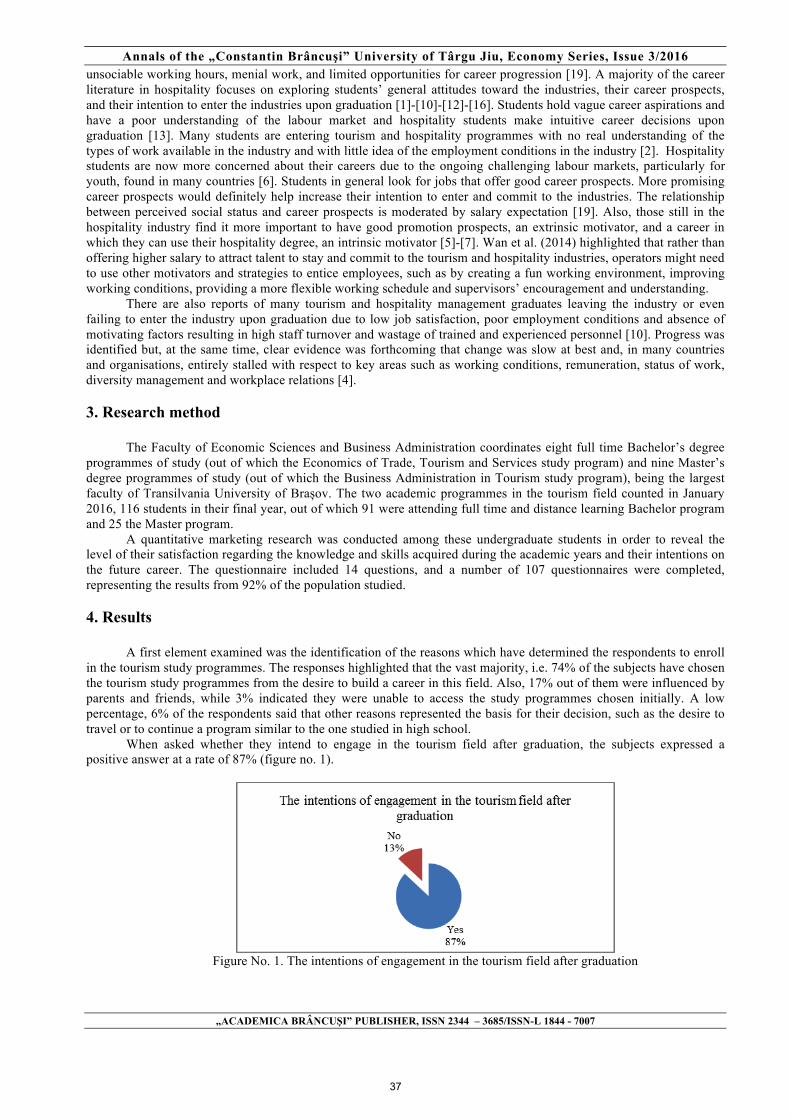
Annals of the „Constantin Brâncuşi” University of Târgu Jiu, Economy Series, Issue 3/2016
„ACADEMICA BRÂNCUŞI” PUBLISHER, ISSN 2344 – 3685/ISSN-L 1844 - 7007
unsociable working hours, menial work, and limited opportunities for career progression [19]. A majority of the career literature in hospitality focuses on exploring students’ general attitudes toward the industries, their career prospects, and their intention to enter the industries upon graduation [1]-[10]-[12]-[16]. Students hold vague career aspirations and have a poor understanding of the labour market and hospitality students make intuitive career decisions upon graduation [13]. Many students are entering tourism and hospitality programmes with no real understanding of the types of work available in the industry and with little idea of the employment conditions in the industry [2]. Hospitality students are now more concerned about their careers due to the ongoing challenging labour markets, particularly for youth, found in many countries [6]. Students in general look for jobs that offer good career prospects. More promising career prospects would definitely help increase their intention to enter and commit to the industries. The relationship between perceived social status and career prospects is moderated by salary expectation [19]. Also, those still in the hospitality industry find it more important to have good promotion prospects, an extrinsic motivator, and a career in which they can use their hospitality degree, an intrinsic motivator [5]-[7]. Wan et al. (2014) highlighted that rather than offering higher salary to attract talent to stay and commit to the tourism and hospitality industries, operators might need to use other motivators and strategies to entice employees, such as by creating a fun working environment, improving working conditions, providing a more flexible working schedule and supervisors’ encouragement and understanding.
There are also reports of many tourism and hospitality management graduates leaving the industry or even failing to enter the industry upon graduation due to low job satisfaction, poor employment conditions and absence of motivating factors resulting in high staff turnover and wastage of trained and experienced personnel [10]. Progress was identified but, at the same time, clear evidence was forthcoming that change was slow at best and, in many countries and organisations, entirely stalled with respect to key areas such as working conditions, remuneration, status of work, diversity management and workplace relations [4].
3. Research method
The Faculty of Economic Sciences and Business Administration coordinates eight full time Bachelor’s degree programmes of study (out of which the Economics of Trade, Tourism and Services study program) and nine Master’s degree programmes of study (out of which the Business Administration in Tourism study program), being the largest faculty of Transilvania University of Brașov. The two academic programmes in the tourism field counted in January 2016, 116 students in their final year, out of which 91 were attending full time and distance learning Bachelor program and 25 the Master program.
A quantitative marketing research was conducted among these undergraduate students in order to reveal the level of their satisfaction regarding the knowledge and skills acquired during the academic years and their intentions on the future career. The questionnaire included 14 questions, and a number of 107 questionnaires were completed, representing the results from 92% of the population studied.
4. Results
A first element examined was the identification of the reasons which have determined the respondents to enroll in the tourism study programmes. The responses highlighted that the vast majority, i.e. 74% of the subjects have chosen the tourism study programmes from the desire to build a career in this field. Also, 17% out of them were influenced by parents and friends, while 3% indicated they were unable to access the study programmes chosen initially. A low percentage, 6% of the respondents said that other reasons represented the basis for their decision, such as the desire to travel or to continue a program similar to the one studied in high school.
When asked whether they intend to engage in the tourism field after graduation, the subjects expressed a positive answer at a rate of 87% (figure no. 1).
Figure No. 1. The intentions of engagement in the tourism field after graduation
37
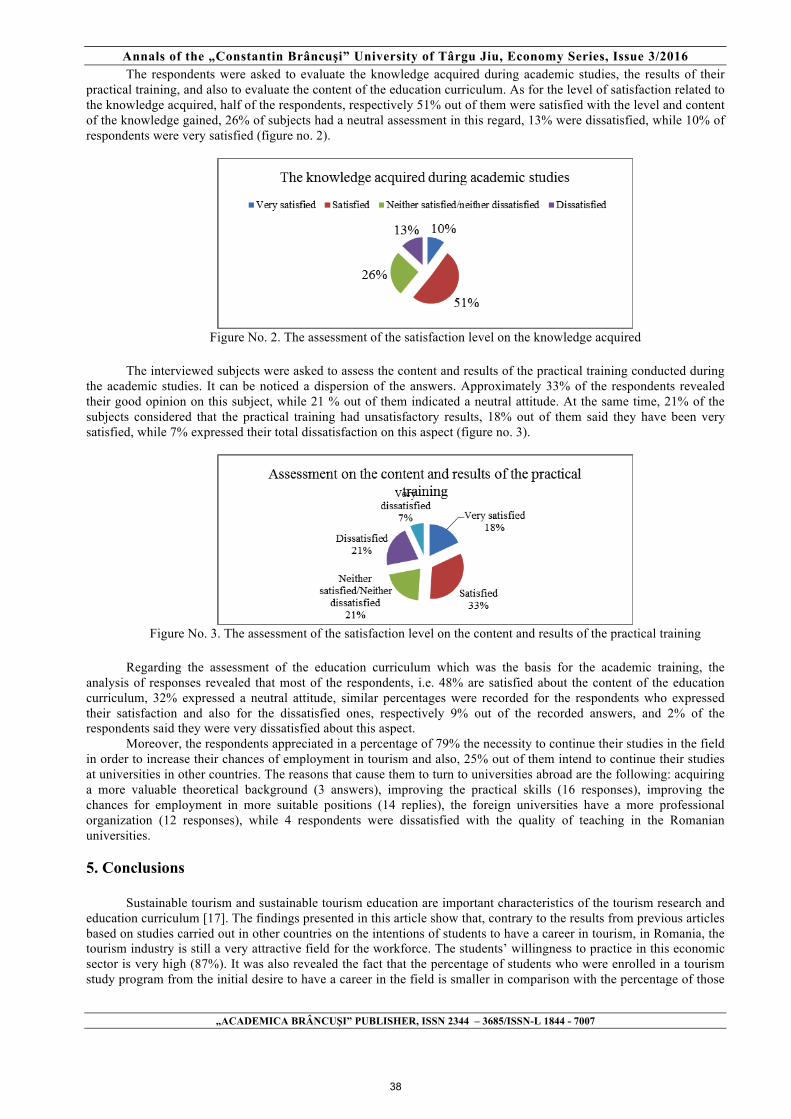
Annals of the „Constantin Brâncuşi” University of Târgu Jiu, Economy Series, Issue 3/2016
„ACADEMICA BRÂNCUŞI” PUBLISHER, ISSN 2344 – 3685/ISSN-L 1844 - 7007
The respondents were asked to evaluate the knowledge acquired during academic studies, the results of their practical training, and also to evaluate the content of the education curriculum. As for the level of satisfaction related to the knowledge acquired, half of the respondents, respectively 51% out of them were satisfied with the level and content of the knowledge gained, 26% of subjects had a neutral assessment in this regard, 13% were dissatisfied, while 10% of respondents were very satisfied (figure no. 2).
Figure No. 2. The assessment of the satisfaction level on the knowledge acquired
The interviewed subjects were asked to assess the content and results of the practical training conducted during
the academic studies. It can be noticed a dispersion of the answers. Approximately 33% of the respondents revealed their good opinion on this subject, while 21 % out of them indicated a neutral attitude. At the same time, 21% of the subjects considered that the practical training had unsatisfactory results, 18% out of them said they have been very satisfied, while 7% expressed their total dissatisfaction on this aspect (figure no. 3).
Figure No. 3. The assessment of the satisfaction level on the content and results of the practical training
Regarding the assessment of the education curriculum which was the basis for the academic training, the
analysis of responses revealed that most of the respondents, i.e. 48% are satisfied about the content of the education curriculum, 32% expressed a neutral attitude, similar percentages were recorded for the respondents who expressed their satisfaction and also for the dissatisfied ones, respectively 9% out of the recorded answers, and 2% of the respondents said they were very dissatisfied about this aspect.
Moreover, the respondents appreciated in a percentage of 79% the necessity to continue their studies in the field in order to increase their chances of employment in tourism and also, 25% out of them intend to continue their studies at universities in other countries. The reasons that cause them to turn to universities abroad are the following: acquiring a more valuable theoretical background (3 answers), improving the practical skills (16 responses), improving the chances for employment in more suitable positions (14 replies), the foreign universities have a more professional organization (12 responses), while 4 respondents were dissatisfied with the quality of teaching in the Romanian universities.
5. Conclusions
Sustainable tourism and sustainable tourism education are important characteristics of the tourism research and education curriculum [17]. The findings presented in this article show that, contrary to the results from previous articles based on studies carried out in other countries on the intentions of students to have a career in tourism, in Romania, the tourism industry is still a very attractive field for the workforce. The students’ willingness to practice in this economic sector is very high (87%). It was also revealed the fact that the percentage of students who were enrolled in a tourism study program from the initial desire to have a career in the field is smaller in comparison with the percentage of those
38

Annals of the „Constantin Brâncuşi” University of Târgu Jiu, Economy Series, Issue 3/2016
„ACADEMICA BRÂNCUŞI” PUBLISHER, ISSN 2344 – 3685/ISSN-L 1844 - 7007
who expressed the willingness to practice in this sector after graduation, being thus satisfied with the content of education curriculum and knowledge gained. However, there cannot be overlooked the negative findings reported, especially those related to the training practice content and results. In this context, it is important to mention that at a very large extent (75% out of them), the students consider necessary to continue their academic training in universities from Romania or abroad in order to achieve their goals.
For a sustainable education system in tourism and hospitality the role of the key stakeholders (policymakers, educators and employers) is to ensure that students have a more accurate understanding of the industry and the nature of the changing graduate labour market [13]-[14]-[15]. The education, training, skills and motivation of staff play a key role in an organization gaining a competitive advantage, while their commitment to the industry or firm will determine if the company can sustain this competitive edge [12]. To encourage more graduates to commit to the field, industry partners and hospitality educators have to join hands in order to attract competent employees with a positive attitude towards their work.
6. Bibliography [1] Aksu, A. A. and Köksal, C. D., Perceptions and attitudes of tourism students in Turkey. International Journal of Contemporary Hospitality Management, 12(5), 2005, pp. 436-447; [2] Barron, P. and Maxwell, G., Hospitality management student’s views of the hospitality industry. International Journal of Contemporary Hospitality Management, 5(5), 1993, pp. V–V10; [3] Baum, T., Human resource management for tourism, hospitality and leisure: An international perspective. London: Thomson Learning, 2006; [4] Baum, T., Human resources in tourism: Still waiting for change? - A 2015 reprise. Tourism Management, 50, 2015, pp. 204-212; [5] Brown, E.A., Arendt, S.W. and Bosselman, R.H., Hospitality management graduates’ perceptions of career factor importance and career factor experience. International Journal of Hospitality Management, 37, 2014, pp. 58-67; [6] Choi,Y., Kwon, J. and Kim, W., Effects of attitudes vs experience of workplace fun on employee behaviors: Focused on Generation Y in the hospitality industry. International Journal of Contemporary Hospitality Management, 25(3), 2013, pp. 410–427; [7] Chuang, N. K., Yin, D. and Dellmann-Jenkins, M., Intrinsic and extrinsic factors impacting casino hotel chef’s job satisfaction. International Journal of Contemporary Hospitality Management, 21(3), 2009, pp. 323-340; [8] Greenhaus, J. H., Callanan, G. A. and Godschalk, V. M., Career management in Simosi, M., Rousseau, D.M. and Daskalaki, M. When career paths cease to exist: A qualitative study of career behavior in a crisis economy. Journal of Vocational Behavior, 91, 2015, pp. 134-146; [9] Hall, D. T., Careers in and out of organizations. Thousand Oaks, CA: Sage Publications, 2002; [10] Jenkins, A. K., Making a career of it? Hospitality students’ future perspective: an Anglo-Dutch study. International Journal of Contemporary Hospitality Management, 13(1), 2001, pp. 13-20; [11] Kreisel, W. Some thoughts on the future of research on leisure and tourism geography. Current Issues in Tourism, 2011. Retrieved from http://www.tandfonline.com. ezproxy.lib.uts.edu.au/doi/full/10.1080/13683500.2011.615914; [12] Kusluvan, S. and Kusluvan, Z., Perceptions and attitudes of undergraduate tourism students towards working in the tourism industry in Turkey. Tourism Management, 21(3), 2000, pp. 251-269; [13] Nachmias, S. and Walmsley, A., Making career decisions in a changing graduate labour market: A Hospitality perspective. Journal of Hospitality, Leisure, Sport & Tourism Education, 17, 2015, pp. 50–58. [14] Richardson, S., Undergraduates’ perceptions of tourism and hospitality as a career choice. International Journal of Hospitality Management, 28, 2009, pp. 382-388; [15] Richardson, S., Generation Y’s perceptions and attitudes towards a career in tourism and hospitality. Journal of Human Resources in Hospitality & Tourism, 9(2), 2010, pp. 179-199; [16] Roney, S. A. and Öztin, P., Career perceptions of undergraduate tourism students: a case study in Turkey. Journal of Hospitality, Leisure, Sport & Tourism Education, 6(1), 2007, pp. 4-18; [17] Schweinsberg, S., Wearing, S.L. and McManus, P., Exploring sustainable tourism education in business schools: The honours program. Journal of Hospitality and Tourism Management, 20, 2013, pp. 53-60; [18] Simosi, M., Rousseau, D.M. and Daskalaki, M., When career paths cease to exist: A qualitative study of career behavior in a crisis economy. Journal of Vocational Behavior, 91, 2015, pp. 134-146; [19] Wan, Y.K.P., Wong, IK, A. and Kong, W.H., Student career prospect and industry commitment: The roles of industry attitude, perceived social status, and salary expectations. Tourism Management, 40, 2014, pp. 1-14; [20] WTTC., Travel & Tourism Economic Impact 2015 - World. Retrieved from https://www.wttc.org/- /media/files/reports/economic%20impact%20research/regional%202015/world2015.pdf
39
Annals of the „Constantin Brâncuşi” University of Târgu Jiu, Economy Series, Issue 3/2016
„ACADEMICA BRÂNCUŞI” PUBLISHER, ISSN 2344 – 3685/ISSN-L 1844 - 7007
APPROACHES ON MEASURING SUSTAINABLE DEVELOPMENT IN CONTEMPORARY WORLD – BEYOND CLASSICAL INDICATORS
ALECU ALEXANDRA
MA STUDENT, PETROLEUM-GAS UNIVERSITY OF PLOIESTI, FACULTY OF ECONOMIC SCIENCES, B-DUL BUCURESTI NO.39, 100680, PLOIESTI, PRAHOVA, ROMANIA
e-mail: [email protected]
DUŞMĂNESCU DOREL ASSOCIATE PROFESSOR, PETROLEUM-GAS UNIVERSITY OF PLOIESTI, FACULTY OF
ECONOMIC SCIENCES, B-DUL BUCURESTI NO.39, 100680, PLOIESTI, PRAHOVA, ROMANIA
e-mail: [email protected] Abstract
Measurement of sustainable development in the contemporary world represents a topic of wide approach in the context of transformations which global economic environment has experienced over the last half-century. The necessity of identification of new indicators that provide a more faithful image of economic life has imposed the construction of new indicators for measuring. In this context, the central objective of the paper is to achieve a synthesis of some of these indicators, analysing their evolution in the context of existing economic realities but also highlighting further correlations, limitations and disputes to which they are subjected to lately.
Thus in this paper are presented and analyzed, considering the arguments above, a series of indicators such as the ecological footprint, biocapacity, happy planet index or other segnificant indicators. Another objective of the paper is also the identification of possible solutions for the application of these indicators in the foundation for sustainable economic policies in the context of global economic transformations. Key words: sustainable development, well-being, Ecological Footprint, Biocapacity, Happy Planet Index. JEL Classification: E00, O1, H5. 1. Introduction and context of the study
Sustainable economic growth is one of the main goals of the contemporary economy. Achieving sustainable
economic growth, according to the exigencies of providing a superior valorisation of the resources available in a company involves an extensive process of mobilization and redistribution in contemporary societies. Ensuring sustainable economic growth is the main goal of policy makers in the modern states. Trying to achieve a resilient and competitive European economy, in terms of efficient allocation and use of available resources and socially inclusive require an integrative approach and the existence of a system of indicators that would enable monitoring the process. Such mostly quantitative measurement of objectives and economic performance is not grounded and of a qualitative assessment. Functionality and intelligence of a socioeconomic system cannot be assessed solely on quantitative data, which usually do not provide information about related phenomena, without defining and correlations.
In societies contemporary the classic indicator used by countries in measuring progress and economic performance is the Gross Domestic Product (GDP), which has already proven its limits and requires an extensive process of reconsideration, as outlined in the Commission's report Stiglitz-Sen-Fitoussi, where it says that "doubts on the ability of GDP to correctly measure well-being and even market activity exists for a long time".1
Issues raised by measuring the sustainable economic development were highlighted in numerous studies. Chancel et al., 2014 performed a review of six initiatives on GDP and beyond. Also, Stiglitz et al. (2009) highlights the need to replace and complement GDP with other indicators. Layard (2005) contributes to the identification of
1 Stiglitz Joseph, Sen Amartya și Fittousi Jean Paul, Issues Paper, Commission on the Measurement of the Economic Perfomance and Social Progress, 25.7.2008.
40
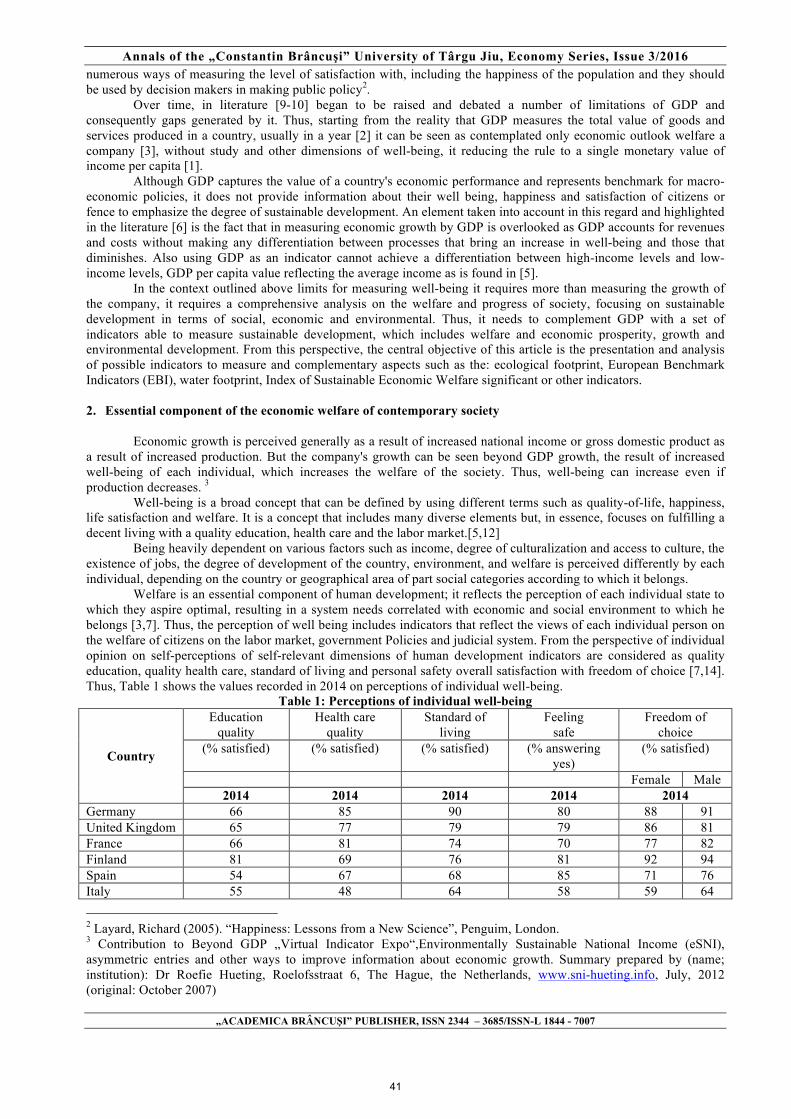
Annals of the „Constantin Brâncuşi” University of Târgu Jiu, Economy Series, Issue 3/2016
„ACADEMICA BRÂNCUŞI” PUBLISHER, ISSN 2344 – 3685/ISSN-L 1844 - 7007
numerous ways of measuring the level of satisfaction with, including the happiness of the population and they should be used by decision makers in making public policy2.
Over time, in literature [9-10] began to be raised and debated a number of limitations of GDP and consequently gaps generated by it. Thus, starting from the reality that GDP measures the total value of goods and services produced in a country, usually in a year [2] it can be seen as contemplated only economic outlook welfare a company [3], without study and other dimensions of well-being, it reducing the rule to a single monetary value of income per capita [1].
Although GDP captures the value of a country's economic performance and represents benchmark for macro-economic policies, it does not provide information about their well being, happiness and satisfaction of citizens or fence to emphasize the degree of sustainable development. An element taken into account in this regard and highlighted in the literature [6] is the fact that in measuring economic growth by GDP is overlooked as GDP accounts for revenues and costs without making any differentiation between processes that bring an increase in well-being and those that diminishes. Also using GDP as an indicator cannot achieve a differentiation between high-income levels and low-income levels, GDP per capita value reflecting the average income as is found in [5].
In the context outlined above limits for measuring well-being it requires more than measuring the growth of the company, it requires a comprehensive analysis on the welfare and progress of society, focusing on sustainable development in terms of social, economic and environmental. Thus, it needs to complement GDP with a set of indicators able to measure sustainable development, which includes welfare and economic prosperity, growth and environmental development. From this perspective, the central objective of this article is the presentation and analysis of possible indicators to measure and complementary aspects such as the: ecological footprint, European Benchmark Indicators (EBI), water footprint, Index of Sustainable Economic Welfare significant or other indicators. 2. Essential component of the economic welfare of contemporary society
Economic growth is perceived generally as a result of increased national income or gross domestic product as
a result of increased production. But the company's growth can be seen beyond GDP growth, the result of increased well-being of each individual, which increases the welfare of the society. Thus, well-being can increase even if production decreases. 3
Well-being is a broad concept that can be defined by using different terms such as quality-of-life, happiness, life satisfaction and welfare. It is a concept that includes many diverse elements but, in essence, focuses on fulfilling a decent living with a quality education, health care and the labor market.[5,12]
Being heavily dependent on various factors such as income, degree of culturalization and access to culture, the existence of jobs, the degree of development of the country, environment, and welfare is perceived differently by each individual, depending on the country or geographical area of part social categories according to which it belongs.
Welfare is an essential component of human development; it reflects the perception of each individual state to which they aspire optimal, resulting in a system needs correlated with economic and social environment to which he belongs [3,7]. Thus, the perception of well being includes indicators that reflect the views of each individual person on the welfare of citizens on the labor market, government Policies and judicial system. From the perspective of individual opinion on self-perceptions of self-relevant dimensions of human development indicators are considered as quality education, quality health care, standard of living and personal safety overall satisfaction with freedom of choice [7,14]. Thus, Table 1 shows the values recorded in 2014 on perceptions of individual well-being.
Table 1: Perceptions of individual well-being
Country
Education quality
Health care quality
Standard of living
Feeling safe
Freedom of choice
(% satisfied) (% satisfied) (% satisfied) (% answering yes)
(% satisfied)
Female Male 2014 2014 2014 2014 2014
Germany 66 85 90 80 88 91 United Kingdom 65 77 79 79 86 81 France 66 81 74 70 77 82 Finland 81 69 76 81 92 94 Spain 54 67 68 85 71 76 Italy 55 48 64 58 59 64
2 Layard, Richard (2005). “Happiness: Lessons from a New Science”, Penguim, London. 3 Contribution to Beyond GDP „Virtual Indicator Expo“,Environmentally Sustainable National Income (eSNI), asymmetric entries and other ways to improve information about economic growth. Summary prepared by (name; institution): Dr Roefie Hueting, Roelofsstraat 6, The Hague, the Netherlands, www.sni-hueting.info, July, 2012 (original: October 2007)
41

Annals of the „Constantin Brâncuşi” University of Târgu Jiu, Economy Series, Issue 3/2016
„ACADEMICA BRÂNCUŞI” PUBLISHER, ISSN 2344 – 3685/ISSN-L 1844 - 7007
Estonia 52 51 46 65 73 73 Lithuania 54 52 34 47 46 43 Portugal 66 62 44 72 82 86 Hungary 53 56 48 47 48 46 Latvia 55 48 49 57 60 62 Romania 55 55 48 55 67 72 Bulgaria 42 38 37 54 53 53
Source: authors based on [24]
In the countries analysed in the table above, thosewith very high human development, according to HDI data, have a higher degree of individual welfare than countries with only high human development (Romania and Bulgaria).
In terms of education quality it can be seen that Finland is placed on the highest level, with 81% of population satistied by education level, followed by Germany, France, Portugal (66% satisfied) and the United Kindom (65% satisfied). In terms of health care quality and standard of living, Germany has the highest degree of satisfaction of needs of the population, with 85%, i.e. 90% degree of satisfaction.
Finland occupy first place in to maintain security of the population, with 81% of residents feeling safe, and in terms of freedom of choice, more than 90% of population, female (92%), as well as male (94%) are satisfied with the level of the society and the policies adopted in this respect.On the other hand, less-developed countries, such as Romania and Bulgaria, have a much lower level of welfare society compared with the desired level. Romania presents in 2015 only 55% degree of satisfaction of the needs of education quality, quality of health care and personal safety.
Fig. 1: Overall life satisfaction index in 2014 Source: author based on [24]
From Fig.1, it is noticed that the overall life satisfaction index in 2014, Finland records the highest degree
of satisfaction of needs of the population, recording the value of 7.4 out of 10. It is followed by Germany with 7 out of 10 and the United Kindom 6.8 out of 10. In terms of countries that satisfy less the needs of citizens, Bulgaria receives 2.7 out of 10, and Romania and Latvia recorded a level of 3.5 out of 10.
Society's well-being depends not only on social factors, but also on environmental factors such as natural resources or pollution. In this sense, the Adjusted net saving (ANS) is the indicator which helps to measure the welfare of society taking into account environmental factors By definition, ANS measures the true rate of saving in an economy after taking into account investments in human capital, depletion of natural resources and damages caused by pollution.4
4 Contribution to Beyond GDP, “Virtual Indicator Expo”, http://www.beyond-gdp.eu, Name of the indicator/method: Adjusted Net Saving (ANS) as percentage of GNI, Summary prepared by: Environment Department, The World Bank, Updated: June 29, 2012
42
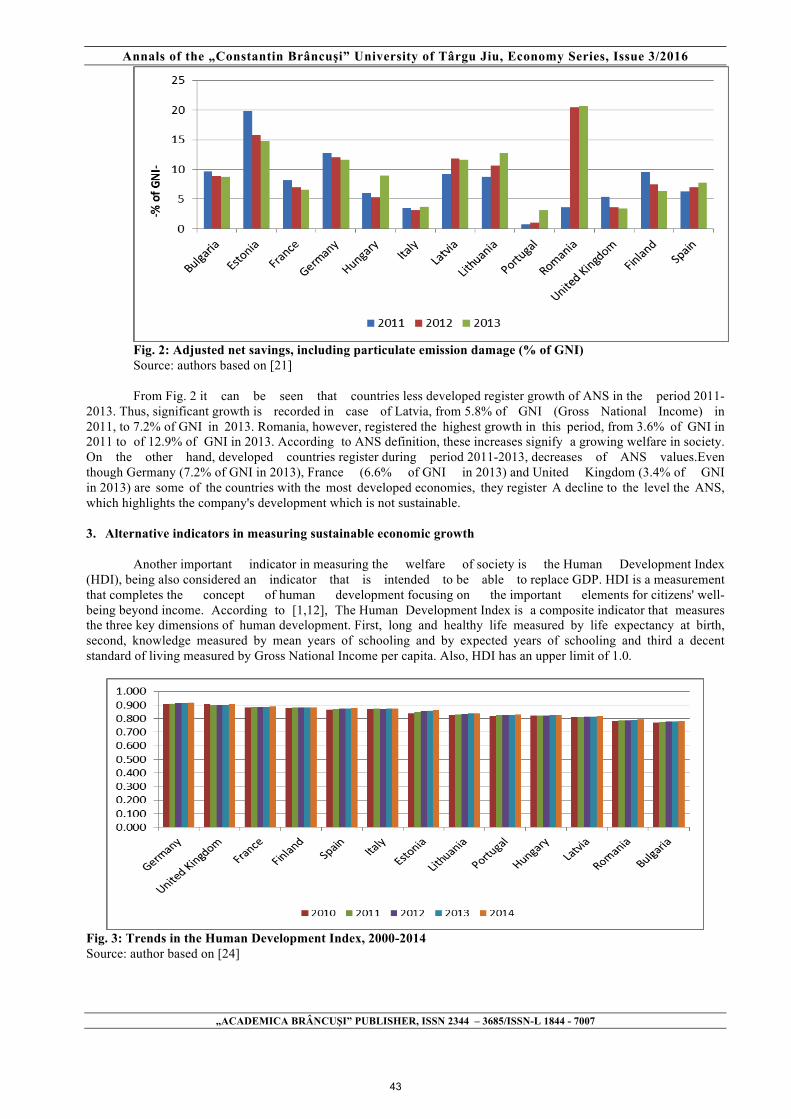
Annals of the „Constantin Brâncuşi” University of Târgu Jiu, Economy Series, Issue 3/2016
„ACADEMICA BRÂNCUŞI” PUBLISHER, ISSN 2344 – 3685/ISSN-L 1844 - 7007
Fig. 2: Adjusted net savings, including particulate emission damage (% of GNI) Source: authors based on [21]
From Fig. 2 it can be seen that countries less developed register growth of ANS in the period 2011-
2013. Thus, significant growth is recorded in case of Latvia, from 5.8% of GNI (Gross National Income) in 2011, to 7.2% of GNI in 2013. Romania, however, registered the highest growth in this period, from 3.6% of GNI in 2011 to of 12.9% of GNI in 2013. According to ANS definition, these increases signify a growing welfare in society. On the other hand, developed countries register during period 2011-2013, decreases of ANS values.Even though Germany (7.2% of GNI in 2013), France (6.6% of GNI in 2013) and United Kingdom (3.4% of GNI in 2013) are some of the countries with the most developed economies, they register A decline to the level the ANS, which highlights the company's development which is not sustainable.
3. Alternative indicators in measuring sustainable economic growth
Another important indicator in measuring the welfare of society is the Human Development Index
(HDI), being also considered an indicator that is intended to be able to replace GDP. HDI is a measurement that completes the concept of human development focusing on the important elements for citizens' well-being beyond income. According to [1,12], The Human Development Index is a composite indicator that measures the three key dimensions of human development. First, long and healthy life measured by life expectancy at birth, second, knowledge measured by mean years of schooling and by expected years of schooling and third a decent standard of living measured by Gross National Income per capita. Also, HDI has an upper limit of 1.0.
Fig. 3: Trends in the Human Development Index, 2000-2014 Source: author based on [24]
43
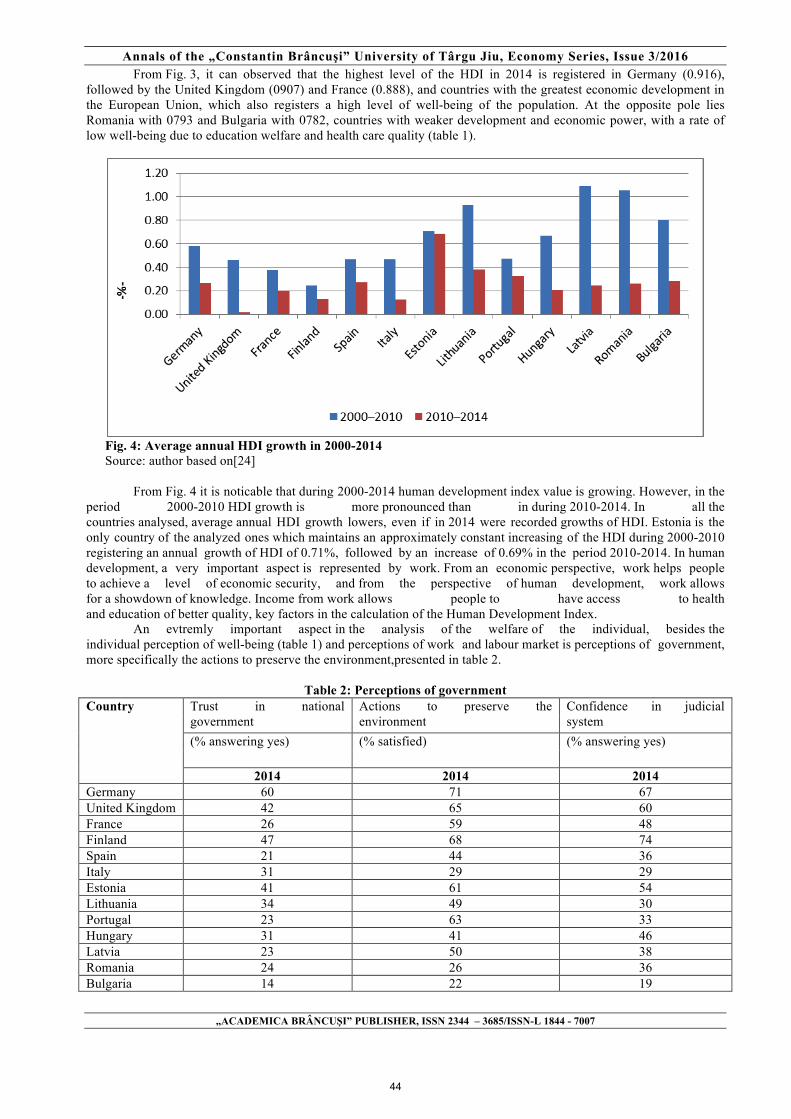
Annals of the „Constantin Brâncuşi” University of Târgu Jiu, Economy Series, Issue 3/2016
„ACADEMICA BRÂNCUŞI” PUBLISHER, ISSN 2344 – 3685/ISSN-L 1844 - 7007
From Fig. 3, it can observed that the highest level of the HDI in 2014 is registered in Germany (0.916), followed by the United Kingdom (0907) and France (0.888), and countries with the greatest economic development in the European Union, which also registers a high level of well-being of the population. At the opposite pole lies Romania with 0793 and Bulgaria with 0782, countries with weaker development and economic power, with a rate of low well-being due to education welfare and health care quality (table 1).
Fig. 4: Average annual HDI growth in 2000-2014 Source: author based on[24]
From Fig. 4 it is noticable that during 2000-2014 human development index value is growing. However, in the
period 2000-2010 HDI growth is more pronounced than in during 2010-2014. In all the countries analysed, average annual HDI growth lowers, even if in 2014 were recorded growths of HDI. Estonia is the only country of the analyzed ones which maintains an approximately constant increasing of the HDI during 2000-2010 registering an annual growth of HDI of 0.71%, followed by an increase of 0.69% in the period 2010-2014. In human development, a very important aspect is represented by work. From an economic perspective, work helps people to achieve a level of economic security, and from the perspective of human development, work allows for a showdown of knowledge. Income from work allows people to have access to health and education of better quality, key factors in the calculation of the Human Development Index.
An evtremly important aspect in the analysis of the welfare of the individual, besides the individual perception of well-being (table 1) and perceptions of work and labour market is perceptions of government, more specifically the actions to preserve the environment,presented in table 2.
Table 2: Perceptions of government
Country Trust in national government
Actions to preserve the environment
Confidence in judicial system
(% answering yes) (% satisfied) (% answering yes)
2014 2014 2014 Germany 60 71 67 United Kingdom 42 65 60 France 26 59 48 Finland 47 68 74 Spain 21 44 36 Italy 31 29 29 Estonia 41 61 54 Lithuania 34 49 30 Portugal 23 63 33 Hungary 31 41 46 Latvia 23 50 38 Romania 24 26 36 Bulgaria 14 22 19
44
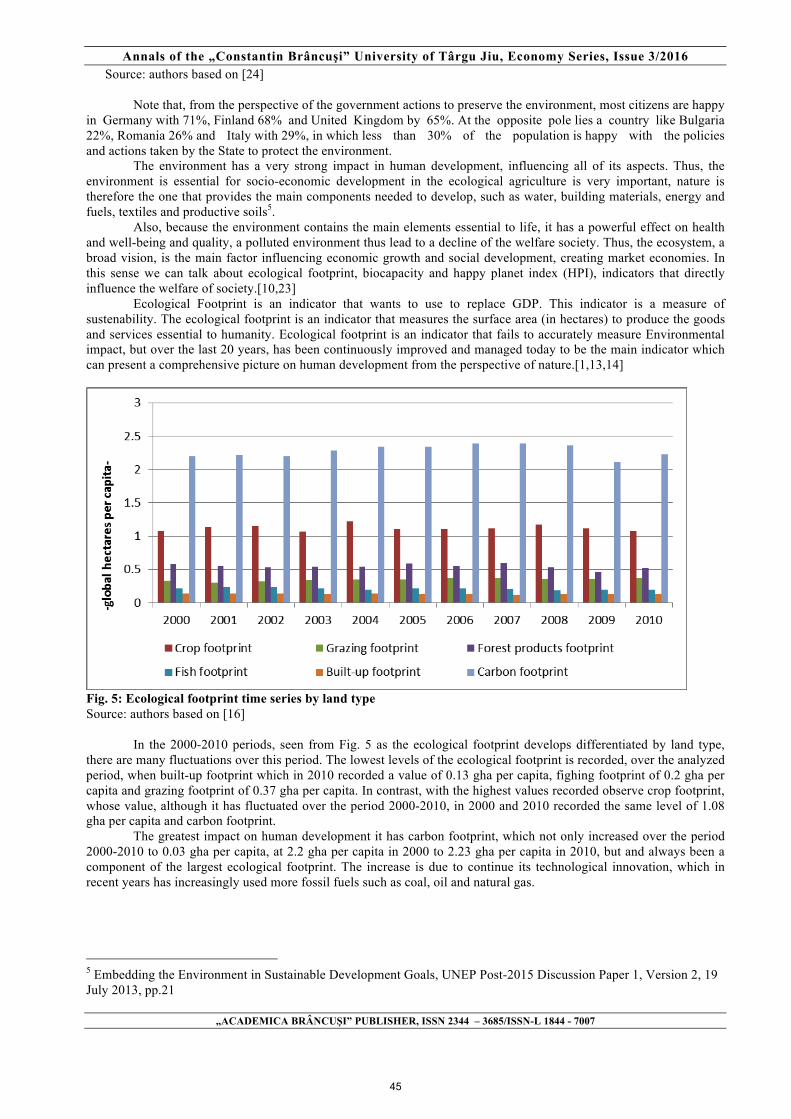
Annals of the „Constantin Brâncuşi” University of Târgu Jiu, Economy Series, Issue 3/2016
„ACADEMICA BRÂNCUŞI” PUBLISHER, ISSN 2344 – 3685/ISSN-L 1844 - 7007
Source: authors based on [24]
Note that, from the perspective of the government actions to preserve the environment, most citizens are happy in Germany with 71%, Finland 68% and United Kingdom by 65%. At the opposite pole lies a country like Bulgaria 22%, Romania 26% and Italy with 29%, in which less than 30% of the population is happy with the policies and actions taken by the State to protect the environment.
The environment has a very strong impact in human development, influencing all of its aspects. Thus, the environment is essential for socio-economic development in the ecological agriculture is very important, nature is therefore the one that provides the main components needed to develop, such as water, building materials, energy and fuels, textiles and productive soils5.
Also, because the environment contains the main elements essential to life, it has a powerful effect on health and well-being and quality, a polluted environment thus lead to a decline of the welfare society. Thus, the ecosystem, a broad vision, is the main factor influencing economic growth and social development, creating market economies. In this sense we can talk about ecological footprint, biocapacity and happy planet index (HPI), indicators that directly influence the welfare of society.[10,23]
Ecological Footprint is an indicator that wants to use to replace GDP. This indicator is a measure of sustenability. The ecological footprint is an indicator that measures the surface area (in hectares) to produce the goods and services essential to humanity. Ecological footprint is an indicator that fails to accurately measure Environmental impact, but over the last 20 years, has been continuously improved and managed today to be the main indicator which can present a comprehensive picture on human development from the perspective of nature.[1,13,14]
Fig. 5: Ecological footprint time series by land type Source: authors based on [16]
In the 2000-2010 periods, seen from Fig. 5 as the ecological footprint develops differentiated by land type,
there are many fluctuations over this period. The lowest levels of the ecological footprint is recorded, over the analyzed period, when built-up footprint which in 2010 recorded a value of 0.13 gha per capita, fighing footprint of 0.2 gha per capita and grazing footprint of 0.37 gha per capita. In contrast, with the highest values recorded observe crop footprint, whose value, although it has fluctuated over the period 2000-2010, in 2000 and 2010 recorded the same level of 1.08 gha per capita and carbon footprint.
The greatest impact on human development it has carbon footprint, which not only increased over the period 2000-2010 to 0.03 gha per capita, at 2.2 gha per capita in 2000 to 2.23 gha per capita in 2010, but and always been a component of the largest ecological footprint. The increase is due to continue its technological innovation, which in recent years has increasingly used more fossil fuels such as coal, oil and natural gas.
5 Embedding the Environment in Sustainable Development Goals, UNEP Post-2015 Discussion Paper 1, Version 2, 19 July 2013, pp.21
45
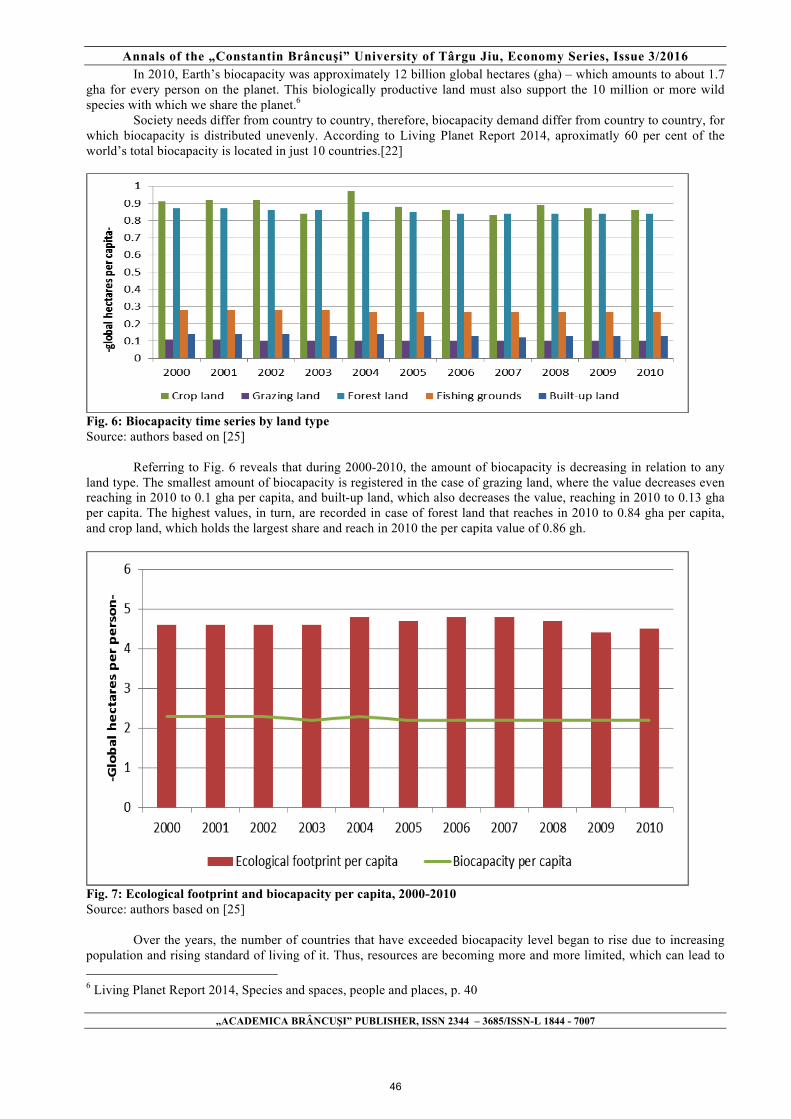
Annals of the „Constantin Brâncuşi” University of Târgu Jiu, Economy Series, Issue 3/2016
„ACADEMICA BRÂNCUŞI” PUBLISHER, ISSN 2344 – 3685/ISSN-L 1844 - 7007
In 2010, Earth’s biocapacity was approximately 12 billion global hectares (gha) – which amounts to about 1.7 gha for every person on the planet. This biologically productive land must also support the 10 million or more wild species with which we share the planet.6
Society needs differ from country to country, therefore, biocapacity demand differ from country to country, for which biocapacity is distributed unevenly. According to Living Planet Report 2014, aproximatly 60 per cent of the world’s total biocapacity is located in just 10 countries.[22]
Fig. 6: Biocapacity time series by land type Source: authors based on [25]
Referring to Fig. 6 reveals that during 2000-2010, the amount of biocapacity is decreasing in relation to any
land type. The smallest amount of biocapacity is registered in the case of grazing land, where the value decreases even reaching in 2010 to 0.1 gha per capita, and built-up land, which also decreases the value, reaching in 2010 to 0.13 gha per capita. The highest values, in turn, are recorded in case of forest land that reaches in 2010 to 0.84 gha per capita, and crop land, which holds the largest share and reach in 2010 the per capita value of 0.86 gh.
Fig. 7: Ecological footprint and biocapacity per capita, 2000-2010 Source: authors based on [25]
Over the years, the number of countries that have exceeded biocapacity level began to rise due to increasing
population and rising standard of living of it. Thus, resources are becoming more and more limited, which can lead to 6 Living Planet Report 2014, Species and spaces, people and places, p. 40
46
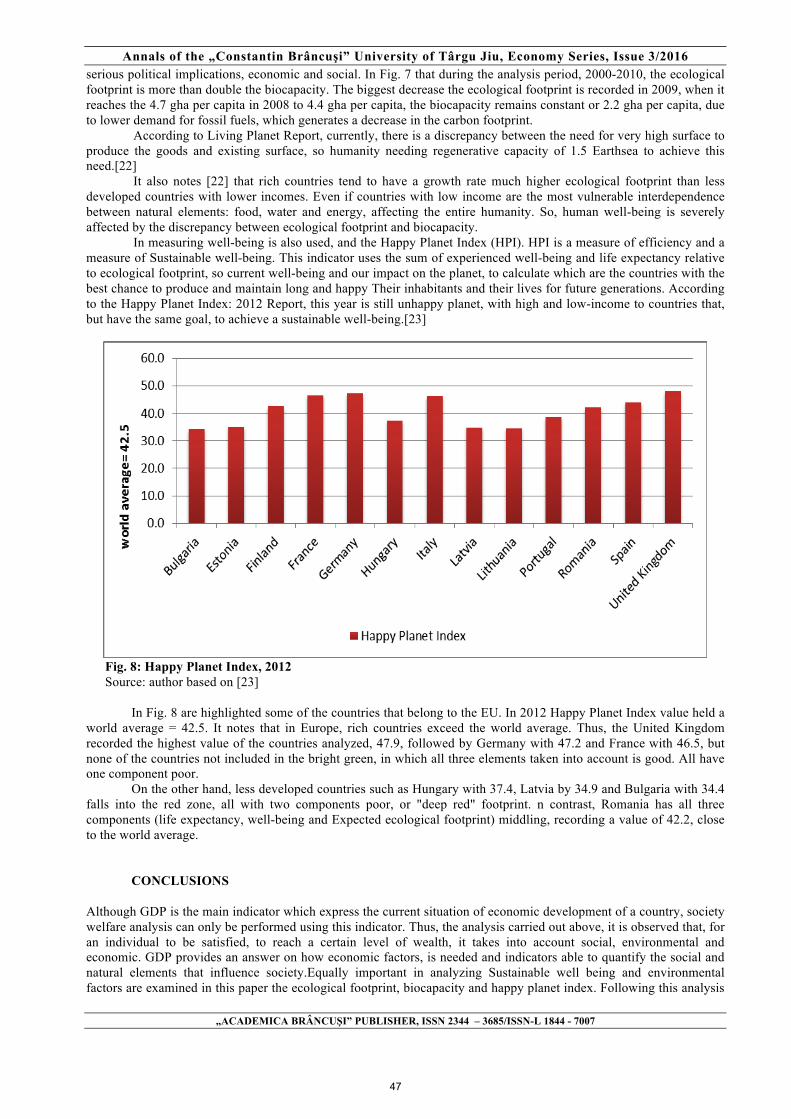
Annals of the „Constantin Brâncuşi” University of Târgu Jiu, Economy Series, Issue 3/2016
„ACADEMICA BRÂNCUŞI” PUBLISHER, ISSN 2344 – 3685/ISSN-L 1844 - 7007
serious political implications, economic and social. In Fig. 7 that during the analysis period, 2000-2010, the ecological footprint is more than double the biocapacity. The biggest decrease the ecological footprint is recorded in 2009, when it reaches the 4.7 gha per capita in 2008 to 4.4 gha per capita, the biocapacity remains constant or 2.2 gha per capita, due to lower demand for fossil fuels, which generates a decrease in the carbon footprint.
According to Living Planet Report, currently, there is a discrepancy between the need for very high surface to produce the goods and existing surface, so humanity needing regenerative capacity of 1.5 Earthsea to achieve this need.[22]
It also notes [22] that rich countries tend to have a growth rate much higher ecological footprint than less developed countries with lower incomes. Even if countries with low income are the most vulnerable interdependence between natural elements: food, water and energy, affecting the entire humanity. So, human well-being is severely affected by the discrepancy between ecological footprint and biocapacity.
In measuring well-being is also used, and the Happy Planet Index (HPI). HPI is a measure of efficiency and a measure of Sustainable well-being. This indicator uses the sum of experienced well-being and life expectancy relative to ecological footprint, so current well-being and our impact on the planet, to calculate which are the countries with the best chance to produce and maintain long and happy Their inhabitants and their lives for future generations. According to the Happy Planet Index: 2012 Report, this year is still unhappy planet, with high and low-income to countries that, but have the same goal, to achieve a sustainable well-being.[23]
Fig. 8: Happy Planet Index, 2012 Source: author based on [23]
In Fig. 8 are highlighted some of the countries that belong to the EU. In 2012 Happy Planet Index value held a
world average = 42.5. It notes that in Europe, rich countries exceed the world average. Thus, the United Kingdom recorded the highest value of the countries analyzed, 47.9, followed by Germany with 47.2 and France with 46.5, but none of the countries not included in the bright green, in which all three elements taken into account is good. All have one component poor.
On the other hand, less developed countries such as Hungary with 37.4, Latvia by 34.9 and Bulgaria with 34.4 falls into the red zone, all with two components poor, or "deep red" footprint. n contrast, Romania has all three components (life expectancy, well-being and Expected ecological footprint) middling, recording a value of 42.2, close to the world average.
CONCLUSIONS
Although GDP is the main indicator which express the current situation of economic development of a country, society welfare analysis can only be performed using this indicator. Thus, the analysis carried out above, it is observed that, for an individual to be satisfied, to reach a certain level of wealth, it takes into account social, environmental and economic. GDP provides an answer on how economic factors, is needed and indicators able to quantify the social and natural elements that influence society.Equally important in analyzing Sustainable well being and environmental factors are examined in this paper the ecological footprint, biocapacity and happy planet index. Following this analysis
47

Annals of the „Constantin Brâncuşi” University of Târgu Jiu, Economy Series, Issue 3/2016
„ACADEMICA BRÂNCUŞI” PUBLISHER, ISSN 2344 – 3685/ISSN-L 1844 - 7007
finds that our planet is still not a happy one.Large discrepancy between ecological footprint and biocapacity highlights overall well-being decrease. In fact it is found that in rich countries economically, are not necessarily the happiest or have a high level of well-being. However, these indicators are still under development and improvement. For a more accurate analysis is needed on welfare and accurate data constantly renewed. Aknowledgement The authors thank to all discussants for their precious remarks regarding the ideas express in the paper presented during the ISSD 2016 conference. The paper includes all the recommendations and suggestions expressed during the event. Bibliography [1]. Alkire, S. Dimensions of human development. World Development 30, no. 2: 181-205, 2002. [2]. Anghelache, C., Capanu, I. Statistică macroeconomică, Editura Economică, Bucuresti. 2004. [3]. Cassiers, I. (ed.). Redefining Prosperity. Routledge: London. 2014. [4]. Chancel L., Thiry G., Demailly D. Beyond-GDP indicators: to what end?, Study No.04/14, IDDRI, Paris, France,
2014. [5]. Decancq, K., Decoster, A., Schokkaert, E. The evolution of world inequality in well-being. World Development
37, no. 1: 11-25. 2009. [6]. Feleagă N., Malciu L. Reformă după reformă: Contabilitatea din România în fata unei noi provocări, vol. I Eseuri
si analiza standardelor IAS – IFRS, Editura Economică, Bucuresti. 2005. [7]. Giesselmann, M., Himer, R., Siegel, N.A., Wagner, G. Measuring Well-being: W3 Indicators to Complement
GDP, DIW Economic Bulletin, May 2013. [8]. van Greuring, H. Standarde Intenaţionale de Raportare Financiară, Ghid practic, Ed.Irecson, Bucureşti. 2005. [9]. Lachaize, P., Morel, J. Les usages du PIB, Vol. 1, Shift Project report, 52p. 2013. [10]. Layard, R. Happiness: Lessons from a New Science, Penguim, London. 2005. [11]. Matei M., Stancu A., Enescu G., Geambaşu C.Burse de mărfuri şi valori, Editura Universităţii Petrol-Gaze din
Ploieşti. 2008. [12]. Michaelson, J. The Use of Sustainable Development Indicators in the Welsh Government, BRAINPOoL Case
Study. available at: http://www.brainpoolproject.eu/wp-content/ uploads/2014/01/WP3-case-study-Wales.pdf . 2013.
[13]. Oulton, N. “Hooray for GDP!”, mimeo. Stiglitz, Joseph, Amartya Sen, and Jean-Paul Fitoussi (2009). Report by the Commission on the Measurement of Economic Performance and social Progress”, available at http://www.stiglitzsen-fitoussi.fr/en/index.htm., 2012.
[14]. Wallace, J., Schmuecker, K.. Shifting the Dial: From wellbeing measures to policy practices, Carnegie Trust Report. 2013.
[15]. Zaman, G., Vasile, V., Matei, M., Croitoru, C., & Enescu, G. Aspecte ale impactului ISD din România asupra exporturilor şi dezvoltării durabile.Romanian Journal of Economics, 1-60. 2010.
[16]. ***Ecological Footprint and Biocapacity, available at: http://www.eea.europa.eu/data-and-maps/indicators/ecological-footprint-of-european-countries/ecological-footprint-of-european-countries-2
[17]. ***Happy Planet Index Report, available at: http://www.happyplanetindex.org/assets/happy-planet-index-report.pdf
[18]. ***Living Planet Report 2014 available at: http://awsassets.panda.org/downloads/wwf_lpr2014_low_res_full_report.pdf
[19]. ***OECD. “How’s life? Measuring Well-Being”, available at http://www.oecdilibrary.org/economics/how-s-life_9789264121164-en. 2011
[20]. ***UNECE/OECD/Eurostat. “Report on measuring sustainable development: statistics for sustainable development, commonalities between current practice an theory”, Working Paper ECE/CES/2008/29. 2008.
[21]. ***World DataBank, available at: http://data.worldbank.org/indicator/NY.ADJ.SVNG.GN.ZS/countries?display=graph
[22]. ***Living Planet Report, available at: http://cdn1.footprintnetwork.org/Living_Planet_Report_2014.pdf [23]. ***Happy Planet Index, available at: http://www.happyplanetindex.org [24]. ***United Nations Development Programme, The 2015 Human Development Report, available at:
hdr.undp.org/sites/default/files/2015_human_development_report.pdf [25]. ***The European Environment Agency Ecological footprint of European countries, available at:
http://www.eea.europa.eu/data-and-maps/indicators/ecological-footprint-of-european-countries/ecological-footprint-of-european-countries-2
48
Annals of the „Constantin Brâncuşi” University of Târgu Jiu, Economy Series, Issue 3/2016
„ACADEMICA BRÂNCUŞI” PUBLISHER, ISSN 2344 – 3685/ISSN-L 1844 - 7007
SEMIOTICS- INTEGRAL PART OF THE ECONOMIC HERMENEUTICS
ANDA- LAURA LUNGU PHD. ASSOCIATE PROFESSOR, WEST UNIVERSITY OF TIMIȘOARA, FACULTY OF
ECONOMICS AND BUSINESS ADMINISTRATION, [email protected]
Abstract
Although a social science, economy makes use of the tools of numbers and precise data. Should we not include semiotics in the theory of economic interpretation, the axiomatization of the economic science would be impossible and furthermore the capitalization of the advantages of artificial intelligence that eliminates the inconveniences of equivocal meanings and inflation of words would be useless.
Interpretation is an endeavor that implies decoding the hidden meaning of the manifestation of economic processes and phenomena. Semantics and pragmatics – by abstracting and axiomatization – help us overcome the intuition limitations’ in the process of interpretation. Our hypothesis is the human existence develops in an universe of signals and signs whom knowledge, interpretation and use conditions the action of society, groups and single human beings. Our main objective is to prove that in order to grasp the meanings of evolution one needs to understand the meaning of signs.
We conclude by suggesting a semiotic symbology that includes all its subcategory: the relations between signs, studied by syntax; the relation between signs and object, the field of semantics; the relation between signs and the subjects (interpreters) that use them, meaning pragmatics. The finality is to strengthen the concept of hermeneutic economics by including semiotics in its action field.
Keywords: economic interpretation, semiotics, syntax, semantics, pragmatics. Clasificare JEL : B59, O30 1. Introduction and context of the study
The natural language is specific to the social sciences among which we find economics too. But the latter leaves
space for interpretation which can alter the reasoning of a science which would like to consider itself precise and where the equivocal and the multiple interpretations slow down or even stop the drawing of precise and rational fundamented conclusions. In order to avoid such mistakes, the exact sciences appeal to professional languages which they build, moving forward to the symbolic language (e.g. in mathematics the sign “∃” stands for an existential quantifier). When looking closer to the economic field, we discover that such a language is not enough. We explain ourselves: the producer has his own notions about the products he produces and commercializes, raw material, finite products, while the dealers or the profiteers see them as transactional value. “The linguistic turn”* underlines the need to narrow the multitude of possible interpretations which are given to the “animal spirits” [1], connecting the behavior of the economic agent to the social environment where he develops.
Ever since 1925 there have been voices advocating for the necessity of economic semiotics [2] [3] [4], however without theoretically fundamenting this new field.
A more complex study of economic semiotics is offered by proffesor Gheorghe Băileșteanu [5] in a pioneering thesis where he implements the basic principles of Peirce [6] and Saussure’s semiotics, that he filters through P. Botezatu’ s logics [7] and launches the invitation of contribute to this toiling endeavor to edificate an economic semiotics. The present thesis would like to be a continuation of his work.
In a symbiosis with the three dimensions of the signs, semiotics, as the general theory of signs, comprises three large fields: syntax, the theory of the relation between the signs; semantics, studies the relations of the signs with the objects they refer to and pragmatics, which presents the connection between the signs and the subjects who use the language. 2. Rules of building the sign-symbol in economy
The sign determines a subjective image in the mind of the receiver regarding the reality which it represents
according to the receiver. For example, for an educated economist, the lack of liquidities is a sure sign that the
49
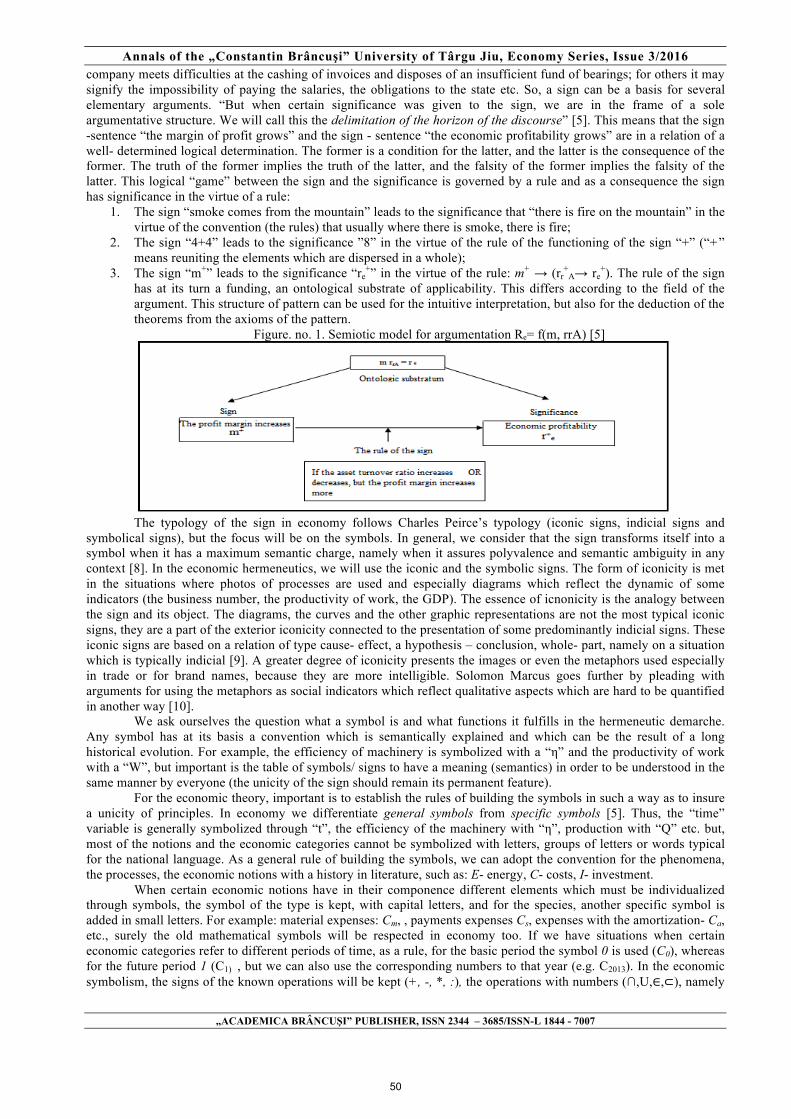
Annals of the „Constantin Brâncuşi” University of Târgu Jiu, Economy Series, Issue 3/2016
„ACADEMICA BRÂNCUŞI” PUBLISHER, ISSN 2344 – 3685/ISSN-L 1844 - 7007
company meets difficulties at the cashing of invoices and disposes of an insufficient fund of bearings; for others it may signify the impossibility of paying the salaries, the obligations to the state etc. So, a sign can be a basis for several elementary arguments. “But when certain significance was given to the sign, we are in the frame of a sole argumentative structure. We will call this the delimitation of the horizon of the discourse” [5]. This means that the sign -sentence “the margin of profit grows” and the sign - sentence “the economic profitability grows” are in a relation of a well- determined logical determination. The former is a condition for the latter, and the latter is the consequence of the former. The truth of the former implies the truth of the latter, and the falsity of the former implies the falsity of the latter. This logical “game” between the sign and the significance is governed by a rule and as a consequence the sign has significance in the virtue of a rule:
1. The sign “smoke comes from the mountain” leads to the significance that “there is fire on the mountain” in the virtue of the convention (the rules) that usually where there is smoke, there is fire;
2. The sign “4+4” leads to the significance ”8” in the virtue of the rule of the functioning of the sign “+” (“+” means reuniting the elements which are dispersed in a whole);
3. The sign “m+” leads to the significance “re+” in the virtue of the rule: m+ → (rr
+A→ re
+). The rule of the sign has at its turn a funding, an ontological substrate of applicability. This differs according to the field of the argument. This structure of pattern can be used for the intuitive interpretation, but also for the deduction of the theorems from the axioms of the pattern.
Figure. no. 1. Semiotic model for argumentation Rₑ= f(m, rrA) [5]
The typology of the sign in economy follows Charles Peirce’s typology (iconic signs, indicial signs and
symbolical signs), but the focus will be on the symbols. In general, we consider that the sign transforms itself into a symbol when it has a maximum semantic charge, namely when it assures polyvalence and semantic ambiguity in any context [8]. In the economic hermeneutics, we will use the iconic and the symbolic signs. The form of iconicity is met in the situations where photos of processes are used and especially diagrams which reflect the dynamic of some indicators (the business number, the productivity of work, the GDP). The essence of icnonicity is the analogy between the sign and its object. The diagrams, the curves and the other graphic representations are not the most typical iconic signs, they are a part of the exterior iconicity connected to the presentation of some predominantly indicial signs. These iconic signs are based on a relation of type cause- effect, a hypothesis – conclusion, whole- part, namely on a situation which is typically indicial [9]. A greater degree of iconicity presents the images or even the metaphors used especially in trade or for brand names, because they are more intelligible. Solomon Marcus goes further by pleading with arguments for using the metaphors as social indicators which reflect qualitative aspects which are hard to be quantified in another way [10].
We ask ourselves the question what a symbol is and what functions it fulfills in the hermeneutic demarche. Any symbol has at its basis a convention which is semantically explained and which can be the result of a long historical evolution. For example, the efficiency of machinery is symbolized with a “η” and the productivity of work with a “W”, but important is the table of symbols/ signs to have a meaning (semantics) in order to be understood in the same manner by everyone (the unicity of the sign should remain its permanent feature).
For the economic theory, important is to establish the rules of building the symbols in such a way as to insure a unicity of principles. In economy we differentiate general symbols from specific symbols [5]. Thus, the “time” variable is generally symbolized through “t”, the efficiency of the machinery with “η”, production with “Q” etc. but, most of the notions and the economic categories cannot be symbolized with letters, groups of letters or words typical for the national language. As a general rule of building the symbols, we can adopt the convention for the phenomena, the processes, the economic notions with a history in literature, such as: E- energy, C- costs, I- investment.
When certain economic notions have in their componence different elements which must be individualized through symbols, the symbol of the type is kept, with capital letters, and for the species, another specific symbol is added in small letters. For example: material expenses: Cm, , payments expenses Cs, expenses with the amortization- Ca, etc., surely the old mathematical symbols will be respected in economy too. If we have situations when certain economic categories refer to different periods of time, as a rule, for the basic period the symbol 0 is used (C0), whereas for the future period 1 (C1) , but we can also use the corresponding numbers to that year (e.g. C2013). In the economic symbolism, the signs of the known operations will be kept (+, -, *, :), the operations with numbers (∩,U,∈,⊂), namely
50
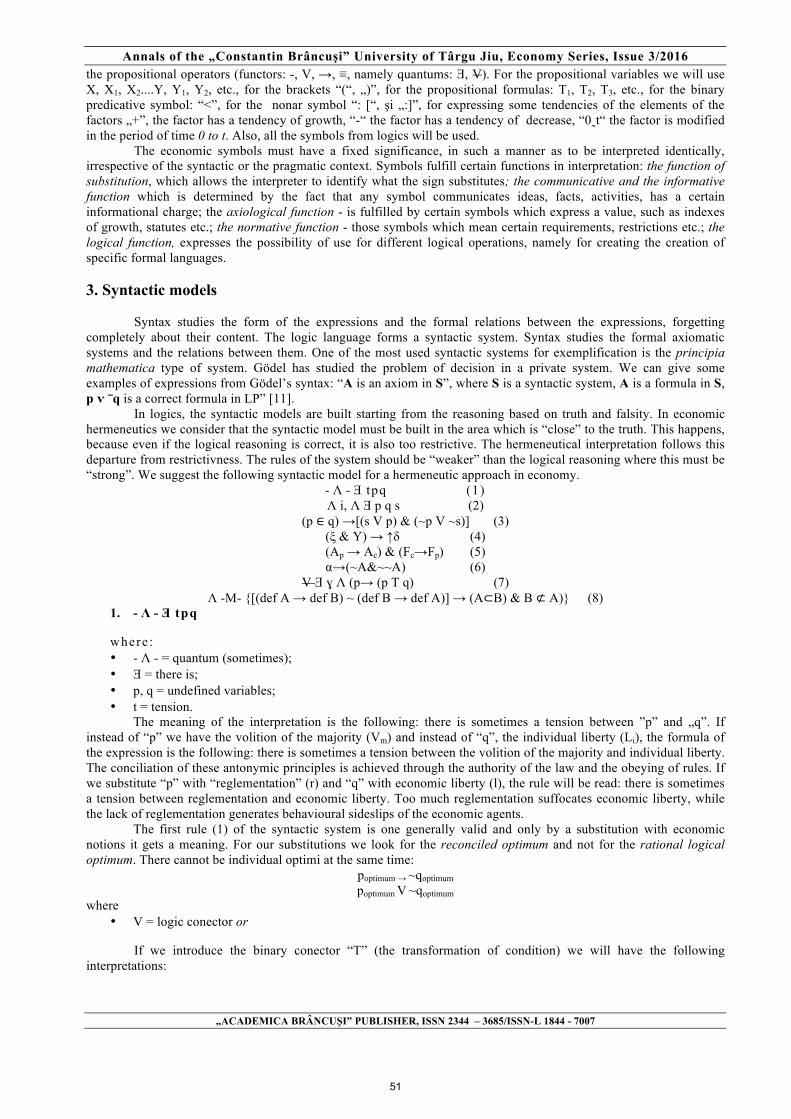
Annals of the „Constantin Brâncuşi” University of Târgu Jiu, Economy Series, Issue 3/2016
„ACADEMICA BRÂNCUŞI” PUBLISHER, ISSN 2344 – 3685/ISSN-L 1844 - 7007
the propositional operators (functors: -, V, →, ≡, namely quantums: Ǝ, V). For the propositional variables we will use X, X1, X2....Y, Y1, Y2, etc., for the brackets “(“, „)”, for the propositional formulas: T1, T2, T3, etc., for the binary predicative symbol: “<”, for the nonar symbol “: [“, şi „:]”, for expressing some tendencies of the elements of the factors „+”, the factor has a tendency of growth, “-“ the factor has a tendency of decrease, “0˷t“ the factor is modified in the period of time 0 to t. Also, all the symbols from logics will be used.
The economic symbols must have a fixed significance, in such a manner as to be interpreted identically, irrespective of the syntactic or the pragmatic context. Symbols fulfill certain functions in interpretation: the function of substitution, which allows the interpreter to identify what the sign substitutes; the communicative and the informative function which is determined by the fact that any symbol communicates ideas, facts, activities, has a certain informational charge; the axiological function - is fulfilled by certain symbols which express a value, such as indexes of growth, statutes etc.; the normative function - those symbols which mean certain requirements, restrictions etc.; the logical function, expresses the possibility of use for different logical operations, namely for creating the creation of specific formal languages.
3. Syntactic models
Syntax studies the form of the expressions and the formal relations between the expressions, forgetting completely about their content. The logic language forms a syntactic system. Syntax studies the formal axiomatic systems and the relations between them. One of the most used syntactic systems for exemplification is the principia mathematica type of system. Gödel has studied the problem of decision in a private system. We can give some examples of expressions from Gödel’s syntax: “A is an axiom in S”, where S is a syntactic system, A is a formula in S, p ѵ ‾q is a correct formula in LP” [11].
In logics, the syntactic models are built starting from the reasoning based on truth and falsity. In economic hermeneutics we consider that the syntactic model must be built in the area which is “close” to the truth. This happens, because even if the logical reasoning is correct, it is also too restrictive. The hermeneutical interpretation follows this departure from restrictivness. The rules of the system should be “weaker” than the logical reasoning where this must be “strong”. We suggest the following syntactic model for a hermeneutic approach in economy.
- Ʌ - Ǝ tpq (1) Ʌ i, Ʌ Ǝ p q s (2)
(p ∈ q) →[(s V p) & (~p V ~s)] (3) (ξ & Y) → ↑δ (4) (Ap → Ac) & (Fc→Fp) (5) α→(~A&~~A) (6)
V Ǝ ɣ Ʌ (p→ (p T q) (7) Ʌ -M- {[(def A → def B) ~ (def B → def A)] → (A⊂B) & B ⊄ A)} (8)
1. - Ʌ - Ǝ tpq
where : • - Ʌ - = quantum (sometimes); • Ǝ = there is; • p, q = undefined variables; • t = tension.
The meaning of the interpretation is the following: there is sometimes a tension between ”p” and „q”. If instead of “p” we have the volition of the majority (Vm) and instead of “q”, the individual liberty (Li), the formula of the expression is the following: there is sometimes a tension between the volition of the majority and individual liberty. The conciliation of these antonymic principles is achieved through the authority of the law and the obeying of rules. If we substitute “p” with “reglementation” (r) and “q” with economic liberty (l), the rule will be read: there is sometimes a tension between reglementation and economic liberty. Too much reglementation suffocates economic liberty, while the lack of reglementation generates behavioural sideslips of the economic agents.
The first rule (1) of the syntactic system is one generally valid and only by a substitution with economic notions it gets a meaning. For our substitutions we look for the reconciled optimum and not for the rational logical optimum. There cannot be individual optimi at the same time:
poptimum → ~qoptimum poptimum V ~qoptimum
where • V = logic conector or
If we introduce the binary conector “T” (the transformation of condition) we will have the following interpretations:
51

Annals of the „Constantin Brâncuşi” University of Târgu Jiu, Economy Series, Issue 3/2016
„ACADEMICA BRÂNCUŞI” PUBLISHER, ISSN 2344 – 3685/ISSN-L 1844 - 7007
p T q - the conservation of characteristics. For example, the action of the management has not changed at all the structure of the personnel and of the assets;
pT ~ q - the characteristics; ~pm T ~ qm - the conservation or the preservation of the absence of characteristics. ~L i T ~ Li
When we deal with the hermeneutics of the crises, we will operate with these transformations. For example, the “social visible hand” does not involve the change of the system of judicial norms (pTp), while the interventionist hand of the state implies changes of the system of norms (pT ~p).
2. Ʌ i Ʌ Ǝ p q s
where Ʌ = cuantor (always)
a) When there is incomplete information, the predictability of the system depends on the available information and on the capacity of the individual to interpret the agent:
b) We assume that people react rationally. This means that their behaviour is predictibale; c) The rational action requires sufficient information. As a result, the level of reasoning depends on the level of
knowledge (information). Because in economy the information is always insufficient, it means that in an objective way the predictability of the behaviour of the economic agents is possible, but probable;
d) The existent information is processed by each agent according to their capacity of interpretation. What is rational for an agent in reality could be irrational for others. In the economic interpretations, we must take into account that there is, objectively speaking, a conflict between the available information and the capacity of each agent to interpret.
3. (p ∈ q) →[(s V p) & (~p V ~s)] If “p” is included in “q”, then “s” or “p” and “non p” or “non s” (logical interpretation).
The hermeneutic interpretation is other: what is true for everybody (p), is also valid for some and for each one (q). What is not valid for anyone, is not valid for some or for each one (the principle of subsumption).
4. (ξ & Y) → ↑δ The more a relation is repeated in several cases, (ξ) and varied too (Y), the more the probability grows that this
represents a law (the principle of summing). 5. (Ap → Ac) & (Fc→Fp) The principle of sending the values: the descendent sending of the truth (the truth is sent from premise (Ap) to conclusion (Ac), and the ascendent sending of the fake (the fake is sent from conclusion (Fc) to premise(Fp), at least at one of them. The former serves to the demonstrations, and the latter is used mainly in counter-argument.
6. α→(~A&~~A) The paradox (α) is a statement which is contrary to the usual convictions, or one which seems contradictory,
unbelievable, absurd (~A), but it can be true in reality (A). If an economic concept is paradoxical, then it almost gets close to integrity and it becomes close to the truth. When an economic concept is not at least paradoxical (in the hermeneutic interpretation), one can suspect that it does not integrate certain aspects of the whole.
7. V Ǝ ɣ Ʌ (p→ (p T q) Wherever there is a direct relation of causality, when “p” takes place, “q” is produced (example: in the
companies where the management is not renumerated according to performance criteria (p), the activity goes on poorly (q)).
8. Ʌ -M- {[(def A → def B) ~ (def B → def A)] → (A⊂B) & B ⊄ A)} It is always obligatory (-M-) that what defines or is about A (def A), defines or is not about B (def B), but what
defines or is not about B does not define or is not about A, if between A and B is a relation of subordination (A⊂B) & (B⊄A). In the classic economic interpretation this rule is presented in the following way:
Figure no. 2. Venn’s diagram [12]
Conclusions:
52

Annals of the „Constantin Brâncuşi” University of Târgu Jiu, Economy Series, Issue 3/2016
„ACADEMICA BRÂNCUŞI” PUBLISHER, ISSN 2344 – 3685/ISSN-L 1844 - 7007
• All the elements which change the efficiency of the fixed assets, also change the efficiency of the total assets, the economic profit and the financial profit. The elements which change the financial profit do not necessarily change the efficiency of the fixed assets.
• All the elements which change the efficiency of the assets, also change the economic profit and the financial profit. The elements which change the financial profit do not necessarily change the efficiency of the assets.
• All the elements which change the economic profit, also change the financial profit. The elements which change the financial profit do not necessarily change the economic profit.
Logical relations (a) η±
Af→(Mc→r±f): If the efficiency of the fixed assets modifies (increases or decreases), the
financial profit changes if the multitude of the other influential elements remains constant;
(b) r±f→~ η±
Af: The change of the financial profit does not necessarily imply the change of the efficiency of the fixed assets;
(c) η±A→(Mc→ r±
e): If the efficiency of the total assets modifies, the economic profit changes, if the multitude of the other influential elements remains constant;
(d) r±e →~η±
A The change of the economic profit does not necessarily imply the change of the profit of the total assets;
(e) r±e→(Mc→ r±
f): If the economic profit changes, the finacial profit changes too, if the multitude of the other factors remains constant;
(f) r±f→~ r±
e: The change of the financial profit does not necessaily imply the change of the economic profit.
4. Pragmatics
Essentially pragmatics aims at studying the relations between sign/symbol and the interpreter including both objective elements that belong to the logic of truth, to interpretation and subjective, psychological, that refer to the attitude towards the symbol, the reception mode, the way people report to sign and the represented object.
Building pragmatics in economy would imply on the one hand the attempt to elaborate a language that analyzes the pragmatic, utilitarian dimension of the spoken words and on the other hand to apply this language to concrete language. R. Carnap sees pragmatics as the science that “studies concepts like opinion, assertion, enunciation” [11]. Consequently the pragmatic endeavor helps us distinguish between: truth/satisfiability, opinion/ assertion/ enunciation, calculable/ decidable/ measurable, palpable/useful/efficient etc.
From our point of view, if we refer for example to the cathegory of efficiency, pragmatics includes all man’s behavioral issues regarding the perception, interpretation and manifestation of efficiency signs/ symbols, implying a theoretical and a practical dimension. The theoretical dimension includes ideas and constructs derived from the essence of economic efficiency combined with syntax and semantic elements. A pragmatic language should ease man’s hermeneutic endeavor. Pragmatics’ practical dimension associated to the cathegory of efficiency regards human action in specific situations where resources are consumed and economic outcome is obtained [5].
If we refer to efficiency, a pragmatic approach would be: • the dynamic of the effects generated by economic systems must outrun the dynamic of the resources
consumed by these; • the dynamic of the consumed resources must be higher than that of the advanced and employed ones, while
the effects associated to profit and savings must increase more rapidly than those of production; • dynamically, the efficiency indicators must increase as a sign of time saving under the influence of the
scientific revolution; • over time the direction of development of efficiency indicators (e.g. productivity, savings) is ascending (but
not strictly), while consummated resources must decrease (but not strictly) ; • always and invariably, the values of efficiency indicators must outrun standardized figures (minimum
efficiency requirements); • every action, decision influences the economic efficiency level and dynamic, in other words efficiency is
sensitive to the variation of its components; • even if in many cases human actions may be compensatory (some negative consequences may be compensated
by positive ones), they always act upon the implicated resources and the effects they generate; • every waste of time occurred within the system is experienced at the level and dynamic of economic efficiency
because time, even if unlimited, is not reversible. On a macroeconomic scale the following truths may be enunciated:
• capitalism can provide us with the best possible world, but it will do so only if governments set rules and watch over their compliance;
53

Annals of the „Constantin Brâncuşi” University of Târgu Jiu, Economy Series, Issue 3/2016
„ACADEMICA BRÂNCUŞI” PUBLISHER, ISSN 2344 – 3685/ISSN-L 1844 - 7007
• the basic function of markets must be augmented and improved by political actions, however the state must “govern”, not “paddle”;
• it is not enough that people be protected by the government, they must also perceive the necessity of responsibility; social justice must not be assimilated to public expenses and social benefits must not inhibit initiative;
• the state and government lay at the bottom of all problems as well as the market; • markets respond to the economic desires of consumers, but may affect ethical standards; • without private equity there cannot be social investment; • democracy shall be assimilated to a “law manifestation”, not to human power.
5. Semantics
Semantics studies the sign relations with the objects they refer to. Semantics evolves from three stages: „1. The semantics of „logical thought” in natural language, 2. The semantics of special logical language and of some applied logical systems, 3. The theory of interpretation” [11].
In economy, semantic interpretation differs for each specific category: micro/macroeconomics, concepts etc. We explain ourselves by means of some general postulates:
• profitability is the signal that market economies use to signalize to companies how useful their activities are to society;
• companies that have a certain routine, own the necessary resources for applying it on a larger scale – for development;
• wrong economic decisions are unavoidable in a world of uncertainties, errors are inherent because of the enormous information volume and the nature of this information (subjective, silent, scattered), the dynamic character of the entrepreneurial process and the flaws of scientific observation, leaving the economic environment to detect, limit and correct these failures;
• a crisis is always preceded by a series of signs such as: imbalances between the financial dimension and real economy; the increase of the loan level for short term instruments in comparison to the long term ones; the embrittlement of financial instruments – the increase of assets and liabilities compared to the own capital; very small risk premiums generating a higher appetite for taking chances; the increase of the manifestation of speculative capital; the increase of the current account’s deficit etc.;
• there are important economic rules that cannot be empirically proved. Empirical studies may provide at their best certain information about the inquired topic. The future provides us with relevant indicators for appreciating sustainable development, migrating to non-economic criteria such as: “the genuine progress” indicator, Happy planet indicator, wealth index, human development index, carbon footprint, GINI, indicators for gender equality, ecological footprint;
• the signals of economic growth shall be completed with new signs: food bubble, failed states etc. Microeconomy can provide us with lots of examples of semantic interpretation. If we consider semantic
interpretation on behalf of models, we must decide to which extent models reflect reality and how abstract these must be. The Italian mathematician Beltrami introduced models for the first time in 1868. The modern evolution of sciences clearly requires the achievement of ideal models that facilitate the system study, especially of abstract ones. The semantic model is the result of the correlation of a formal system with a model. It carries three meanings: (1) the entities’ lot which we functionally report the lot of objects and sequences of objects of the syntactic system; (2) an intuitive theory associated to a syntactic system following certain corresponding rules; (3) system of entities that transform the formal system into a true theory [13].
Petre Botezatu advances following “methodological antinomies” to be considered: • the antinomy of power; • the antinomy of purity; • the antinomy of preciseness; • the antinomy of abstraction; • the antinomy of interpretation.
It is obvious that a self-sufficient syntactic system is not realizable and in order to become useful it must use a minimax theory - minimizing the possible loss for a worst case scenario. The dual representation theory may fulfill both the exigency of formal rigorously and the easiness of hermeneutic interpretation.
The economic interpretation makes also use of modal semantics. Considering as starting point G. H. von Wright’s paper, An Essay in Modal Logic [14], logicians pointed out some analogies in the behavior of several terms. Wright advocates for the following table of modalities:
Table no. 1. The table of modalities [14] Alethic Existential Epistemic Deontic
necessary universal verified binding
54

Annals of the „Constantin Brâncuşi” University of Târgu Jiu, Economy Series, Issue 3/2016
„ACADEMICA BRÂNCUŞI” PUBLISHER, ISSN 2344 – 3685/ISSN-L 1844 - 7007
posibible contingent impossible
existential partial inanity
unadulterated undecided
counterfeited
permited indifferent forbidden
The openings for interpretation in economy are given by Boetius’ square. Figure no. 3. Boethius’ square in economy
Modal operators are introduced by defining one of them. If we introduce satisfiability (◊p), the other three will
result according to the relations [15]: Necessary Impossible Contingent Possible
□p νp Lp □~p ≡ ~◊ηp Up ~□p γp Zp ◊p = ~□~p µp Mp
From the perspective of our hermeneutic interpretation endeavor we underline: • the necessary involves satisfiability, but satisfiability does not imply the necessary:
□p → [◊p & (◊p ≠ □ p)] • satisfiability implies possible and possible involves probable:
□p → ◊p & (◊p → ~ □ p) • the necessary of the possible is possible:
□ ◊ p ≡ □p • the possible of the necessary is necessary:
◊ □ p ≡ □p • the contingent of the impossible is possible:
~□□~p ≡ ◊ p • the impossible of the contingent is necessary:
□~~□p ≡ □ p • the necessary of the impossible is possible:
□□p ≡ □~p • the contingent of the possible is impossible:
~□◊p ≡□~p • the possible of the impossible is impossible:
□~◊p ≡ □ ~p It is important that the economic interpretation theory adopts the semantic of modal logics: how true can this be?; where or how much can it be true?; how sufficient is this statement in the given context? All these questions may be answered by interpreting the rules of combinations’ reduction among modal operators. 7. Conclusions
The directions to be be followed for the construction of a language of the economic systems targets at extending the use of signs in the economic theory and practice and at widening the present sign system along with the computerization and the operationalization of all systems, including the economic one. The axiomatization of the economic science by means of a sign system may result in remarkable implications upon its building, argumentation and interpretation horizon that is its hermeneutic horizon including implicitly the expansion of its prospective prerogatives. Without an economic semantics, the hermeneutic process would be vague and worthless. This study is to be considered as a starting point for future research directions in the field of symbolic language that facilitate a hermeneutic interpretation in economy.
* The term is borrowed from psychology and refers to the contemporary development of the language of social sciences and their relation to psychology.
8. Bibliography
55
Annals of the „Constantin Brâncuşi” University of Târgu Jiu, Economy Series, Issue 3/2016
„ACADEMICA BRÂNCUŞI” PUBLISHER, ISSN 2344 – 3685/ISSN-L 1844 - 7007
[1] Akerlof, G. A., Schiller, R.J., Spirite animale. Despre felul în care psihologia umană influențează economia și ce înseamnă asta pentru capitalismul global, traducere de Monica Sibinescu, Editura Publica, București, 2010; [2] Mortara, G., La semiotica economica nell'opera di Maffeo Pantaleoni. Giornale Degli Economisti E Rivista Di Statistica, 66 (Anno 40)(4), pp. 215–223, 1925, available at: http://www.jstor.org/stable/23226245)., [Accessed 20 February 2016]; [3] Schinckus, C., Semiotics of Financial Marketplace, The Journal of Interdisciplinary Economics, Vol. 22, pp. 317–333, A B Academic Publishers, 2010; [4] Jessop, B., Critical Semiotic Analysis and Cultural Political Economy, available at: http://eprints.lancs.ac.uk/183/2/E-2004b_CDS-CPE.pdf, [Accessed 21 February 2016]; [5] Băileșteanu, G., Semiotică economică, Editura Mirton, Timișoara, 2005; [6] Peirce, Ch. S., Semnificaţie şi acţiune, trad. rom., Editura Humanitas, Bucureşti, 1990. [7] Jessop, B., Critical Semiotic Analysis and Cultural Political Economy, available at: http://eprints.lancs.ac.uk/183/ 2/E-2004b_CDS-CPE.pdf, [Accessed 21 February 2016]; [8] Evseev, I., Cuvând – simbol- mit, Editura Facla, Timișoara, 1983; [9] Mileas, I., Social Indicators for Human Development, Frances Printer Publishers London, Londra, 1985; [10] Marcus, S., Provocarea științei, Editura Politica, București, 1988; [11] Enescu, G., Dictionar de logică, Editura Tehnică, Bucureşti, 2003; [12] Băileșteanu, G., Teorie economică. Limite și perspective, Editura Mirton, Timișoara, 2010; [13] Bârliba, D. M., Petru, I., Știrbăț, T., Logică, adevăr formal și relevanță interpretativă, Editura Științifică și Enciclopedică, București, 1988; [14] Wright, G. H. Von, An Essay in Modal Logic, Amsterdam 1951, available at: http://philpapers.org/rec/VONAEI-2, [Accessed 12 December 2015]; [15] Malița, M., Malița, M., Bazele inteligenței artificiale, Editura Tehnică, București, 1987.
56

Annals of the „Constantin Brâncuşi” University of Târgu Jiu, Economy Series, Issue 3/2016
„ACADEMICA BRÂNCUŞI” PUBLISHER, ISSN 2344 – 3685/ISSN-L 1844 - 7007
PROPOSAL REGARDING THE REFORMATION OF THE ROMANIAN PUBLIC
PENSION SYSTEM
NICOLAE ECOBICI ASSOC. PROF. PHD, CONSTANTIN BRANCUSI UNIVERSITY FROM TARGU JIU,
e-mail: [email protected] Abstract
The social insurance system from Romania, reformed continuously since the 90`s, is undergoing a period of serious crisis, with huge and growing deficits, while being far from the principle of social reasonability. Similar situations are found also internationally. The paper aims to answer the following question: how could we implement the principle "equality between present and future generations"? Taking into account the data provided by the National Institute of Statistics from Romania, Eurostat, the World Bank and EU regarding: developments in the birth rate, the number of contributors, life expectancy, the forecasts made in Romania, but also internationally, on sustainability and reasonability of public pension systems, are pessimistic. This paper proposes a solution as simple as it is effective. Why could it not exist in Romania a decent unique minimum pension linked to a decent minimum wage through the mandatory pension contribution rates? Why the welfare of pensioners in 2065 must depend on the existing number of employees in 2065, particularly given the pessimistic demographic forecasts that indicate a population decrease of 20% since 2060? The current PAYG pension system it will not be sustainable in future. Therefore it has to be changed. Keywords: pensions, reformation, public pension system, social insurance Clasificare JEL : E60, H55, I38 1. Introduction
Retirement is an important event for everyone, as good as marriage, divorce, raising a family, or even death,
and therefore it is not something to be neglect. Psychologists and mass media frequently debate about the crisis before retirement.
Being an important event and simultaneously having an important economic and social impact in worldwide, the retirement has different rules and provisions of pensions in every country.
There are some questions whose answers are very important, such as: which is the decent retirement age?, which is the decent amount of pension?, what system is better for a country amongst public or private?, which is the ideal minimum stage of contribution for public system?
There are huge and growing deficits of the pension systems caused mainly by ageing, population reduction and financial crisis. This is the case in almost all EU and other countries worldwide.
Therefore the main problem of any public pension system is the long term risks of unsustainability. In order to try being sustainable a pension system has to rely on entirely private system or on pillar system of pension schemes, during a long properly period of time. The pensioner's major problem is the inequity of the pension size or amount after a long period of contribution.
Countries from all over the world are trying to continuously extend the age of pensioning, accordingly with the increasing of the average lifetime. For example, in Australia the retirement age will be increased to 70 years old after 2035. Moreover, the countries are trying to avoid collapse by deep reform. For example, Romania has introduced in 2007 the three pillar system of pension schemes, upon a tested and recommended model of the World Bank [1] – [8]. 2. Representative pension types
Briefly we will present some types of pension system from three representative countries with high living
standards: UK, US and Denmark. In UK there are many types of pension system, such as: state pension („the basic state pension”), additional
state pension or „the new state pension” (after 6 April 2016), early retirement, pension credit (to complete the revenue till the minimum income), occupational pension, over 80 pension, stakeholder pension [9].
The minimum income in UK for all people above 60 years old is approximately 600 £ per month (137.35 £ per week) and for the pensioners who live with a partner is 209.70 £ per week (approximately 900 £ per month).
The pension age after 2020 is 65 and it will be gradually increased to 68 since 2024 till 2046. The working life is 49 years starting with 2020. All the information about state pension age, pension credit calculator, the new state
57

Annals of the „Constantin Brâncuşi” University of Târgu Jiu, Economy Series, Issue 3/2016
„ACADEMICA BRÂNCUŞI” PUBLISHER, ISSN 2344 – 3685/ISSN-L 1844 - 7007
pension and others can be obtained online [9]. The basic state pension in UK is now maximum £115.95 per week [9], and yearly it will slowly increase. In US, the land of all possibilities, there are a lot of types of retirement plans, such as: Individual Retirement
Arrangements (IRAs), Roth IRAs, 401(k) Plans, 403(b) Plans, SIMPLE IRA Plans (Savings Incentive Match Plans for Employees), SEP Plans (Simplified Employee Pension), SARSEP Plans (Salary Reduction Simplified Employee Pension), Payroll Deduction IRAs, Profit-Sharing Plans, Defined Benefit Plans, Money Purchase Plans, Employee Stock Ownership Plans (ESOPs), Governmental Plans, 457 Plans, 409A Nonqualified Deferred Compensation Plans [10]. Actually, the motto in this country is “start saving, keep saving and stick to your goals”.
In Denmark the pension system is very well-established, over 95% of Danish are paying into private pension schemes. There are different types of pension schemes in Denmark, such as: state pension scheme, statutory pension schemes (ATP contribution and SP contribution), collective pensions, company pensions or private pension schemes [11].
As a conclusion, the pension size is determined by the period of contribution and the private systems ensure an important supplement for state pension. 3. Romanian Pension System
In Romania the pension system has been gradually reformed and since 2007 it include a public system with two
pillar of pension schemes and a private system (the third pillar), upon a tested and recommended model of the World Bank [1]-[8]. Currently, the Romanian public pension system is a „pay as you go” system and it is based on solidarity between generations [12].
The lifetime expectation in Romania is increasing, and the evolution in long term of the number of pensioners, monthly average pension, the dependency rate of the public system and the replacement rate of earnings through pension are very risky for the sustainability of the pension system [13].
Yearly evolution of total average number of all social insurance pensioners between 2003-2015 is showed in fig. no. 1, (social insurance include: state social insurance, social insurance from former farmers system, social insurance from Ministry of Culture, social insurance from Insurance House of Lawyers, social benefits– pension type and war, invalids, orphans and widows pensioners) [15].
Fig. no. 1: Yearly evolution of average number of pensioners between 2003-2015 (Source: National Institute of
Statistics – Average number of pensioners and monthly average pension, year 2015 - http://www.insse.ro/cms/sites/default/files/field/publicatii/numarul_de_pensionari_si_pensia_medie_lunara_in_anul_2015_0.pdf, pag. 33-34)
We see that the average number of pensioners is descreasing yearly, from 6.3 million to 5.3 million, with 1 million pensioners less than twelve years ago.
58
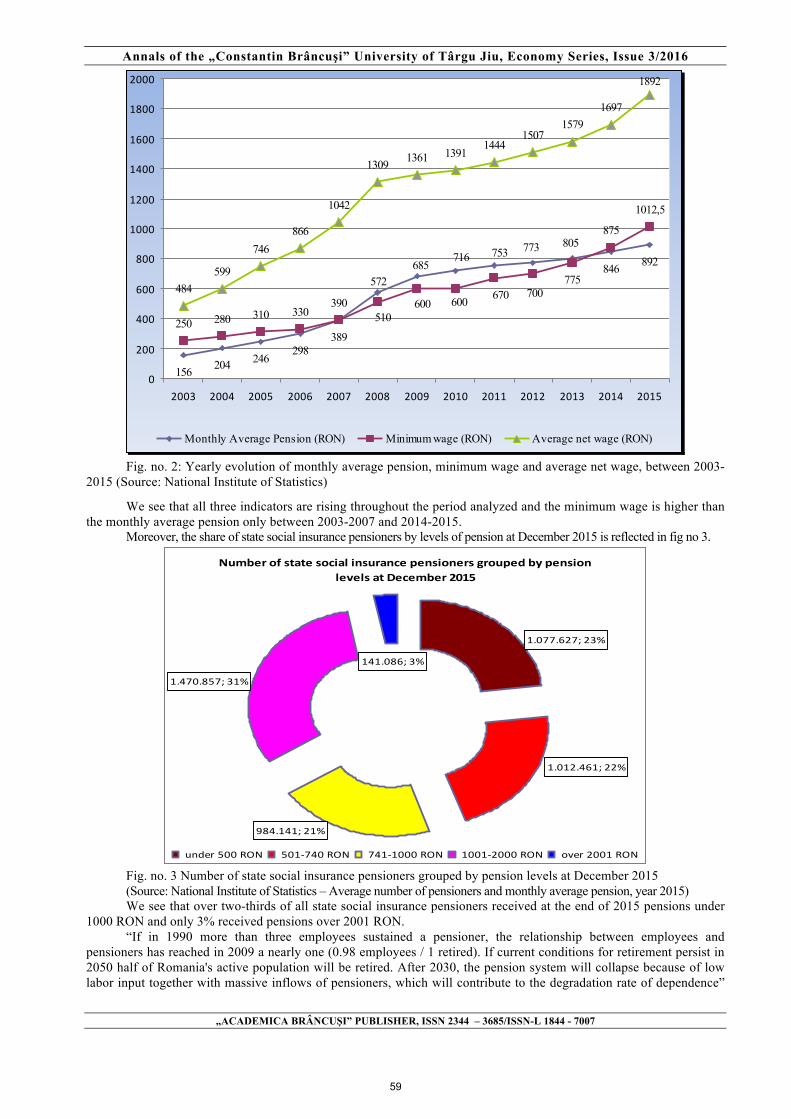
Annals of the „Constantin Brâncuşi” University of Târgu Jiu, Economy Series, Issue 3/2016
„ACADEMICA BRÂNCUŞI” PUBLISHER, ISSN 2344 – 3685/ISSN-L 1844 - 7007
156 204 246298
389
846 892
250 280 310 330390
875
1012,5
484599
746866
1042
1309 1361 13911444
15071579
1697
1892
805
572685
716 753 773
775
510600 600 670 700
0
200
400
600
800
1000
1200
1400
1600
1800
2000
2003 2004 2005 2006 2007 2008 2009 2010 2011 2012 2013 2014 2015
Monthly Average Pension (RON) Minimum wage (RON) Average net wage (RON)
Fig. no. 2: Yearly evolution of monthly average pension, minimum wage and average net wage, between 2003-2015 (Source: National Institute of Statistics)
We see that all three indicators are rising throughout the period analyzed and the minimum wage is higher than the monthly average pension only between 2003-2007 and 2014-2015.
Moreover, the share of state social insurance pensioners by levels of pension at December 2015 is reflected in fig no 3.
Number of state social insurance pensioners grouped by pension levels at December 2015
1.470.857; 31%
1.077.627; 23%
141.086; 3%
1.012.461; 22%
984.141; 21%
under 500 RON 501-‐740 RON 741-‐1000 RON 1001-‐2000 RON over 2001 RON
Fig. no. 3 Number of state social insurance pensioners grouped by pension levels at December 2015 (Source: National Institute of Statistics – Average number of pensioners and monthly average pension, year 2015) We see that over two-thirds of all state social insurance pensioners received at the end of 2015 pensions under
1000 RON and only 3% received pensions over 2001 RON. “If in 1990 more than three employees sustained a pensioner, the relationship between employees and
pensioners has reached in 2009 a nearly one (0.98 employees / 1 retired). If current conditions for retirement persist in 2050 half of Romania's active population will be retired. After 2030, the pension system will collapse because of low labor input together with massive inflows of pensioners, which will contribute to the degradation rate of dependence”
59
Annals of the „Constantin Brâncuşi” University of Târgu Jiu, Economy Series, Issue 3/2016
„ACADEMICA BRÂNCUŞI” PUBLISHER, ISSN 2344 – 3685/ISSN-L 1844 - 7007
[12]. In 2015, in Romania the ratio between average number of state social insurance pensioners and average number of employees was 10 to 10, and between average number of all pensioners and average number of employees was 11,33 to 10 (0,88 employees / 1 retired) [15].
According to The World Bank estimations, the public pension system deficits are to evolve [14, pag. 13-15]. For Romania the next reform is to change the third pillar (private optional pension system) from DC (defined
contributions) to DB (defined benefits) [13].
4. Proposal regarding the reformation of the Romanian public pension system Public systems of all states have been more affected by crisis than private schemes [12]. So, Romania should
also stimulate private savings (third pillar) and there is needed some legal improvements and an increasing contributions for the second pillar [13, pag. 9].
Every state should focus on stimulating and well advertising the private pension systems. Romania needs to focus more on moving the responsibility of supporting the pensions to private area. The state
will no longer be able to bear all that pressure in the future. Considering all the above, we believe that the following proposal is as simple as it is effective, while being
assured the implementation of "equality of rights between present and future generations": after application of mandatory contributions for pension to the minimum wage for minimum 40 years, a pensioner will receive a decent pension (homologous with minimum wage). Simply put as: decent minimum wage – decent minimum state pension. Of course, further calculations are required to establish a decent wage, with gradual changes over time, thus ensuring a correlation with decent minimum pension.
Therefore, legal contribution quotas supported by employees could be applied only to individual income level equal to decent minimum wage and the legal contribution quotas supported by employers to gross wage. In this way, the employers would bear the same pressure, instead employees with higher incomes than minimum wage could use even the remaining difference, obtained by applying legal contribution quota only to the minimum wage, to contribute more for private pensions. In that way, Romanian pensioners would receive an equal minimum pension from state.
On the other hand, Romania must efficiently stimulate, like US, individual contributions for private pensions, accompanied by a good advertising amongst population regarding this modern form of provision. Everybody should know their retirement needs and take charge of their future and plan ahead. Romania has to move the responsibility towards each individual person in matter of retirement. 5. Bibliography [1] Public pension schemes (www.cnpas.org) [2] European Federation of Pension Funds (EFRP): Global Economic Crisis - no reason to give back from the way of private pensions (May 2009) [3] EFRP: Directions for the European pensions reform and a report on the 11 private pension systems in Central and Eastern Europe (October 2009) [4] EU report: Public Pension system in Romania, threatened by demographic change (March 2009) [5] EU: Romania, among the countries with the largest long-term risks of the public pension systems (October 2009) [6] OECD: Economic crisis makes private pensions more necessary than ever (April 2009) [7] OECD: Securing yields of private pension funds should be avoided (June 2009) [8] OECD: What guarantees and restrictions are there in world of private pensions (July 2009) [9] https://www.gov.uk (https://www.gov.uk/state-pension/what-youll-get, https://www.gov.uk/pension-credit-calculator, https://www.gov.uk/state-pension-age [10] https://www.irs.gov/Retirement-Plans [11] https://www.justlanded.com/english/Denmark/Denmark-Guide/Jobs/Pensions [12] Gheorghe Matei, Daniela Pîrvu – Financial crisis and the pension system, published in Annals of the University of Craiova. Economic Sciences Series, 2010, http://feaa.ucv.ro/annals/v2_2010/0038v2-019.pdf [13] Mihai Şeitan, Mihaela Arteni, Adriana Nedu - Evoluţia demografică pe termen lung şi sustenabilitatea sistemului de pensii, http://www.cnp.ro/inovatie/docs/conferinta-finalizare-studii-28-05-2012/Rezumat%20studiu%20Sistem%20de%20pensii.pdf [14] The World Bank report "Pension Crisis" (Pensions in Crisis: Europe and Central Asia Regional Policy Note), December 2009 [15] National Institute of Statistics - Number of pensioners and monthly average pension in 2015. Available at http://www.insse.ro/cms/sites/default/files/field/publicatii/numarul_de_pensionari_si_pensia_medie_lunara_in_anul_2015_0.pdf, published on June 4th 2016
60

Annals of the „Constantin Brâncuşi” University of Târgu Jiu, Economy Series, Issue 3/2016
„ACADEMICA BRÂNCUŞI” PUBLISHER, ISSN 2344 – 3685/ISSN-L 1844 - 7007
METHODS FOR IMPROVING THE LEVEL OF MANAGEMENT INOVAȚIONAL COMPANIES
ROMANESCU MARCEL LAURENȚIU
CONF. UNIV. DR. OF THE ”CONSTANTIN BRÂNCUȘI”UNIVERSITY OF TÂRGU-JIU, e-mail:[email protected]
Abstract The importance of this material requires the formulation of appropriate methods to improve innovation management in companies and defining the main policies to be applied by policy makers in order to improve the condition of novelty, innovation Romanian companies. Firms learn is the most important structural element participating in the accumulation of capital for scientific and technological progress, the development of social policies, and the development of innovations that strengthen national competitiveness in the international market. In conclusion, when strengthen relations on the national and international strategy is elaborated and innovation management at company level. Innovation management firms based on the premise that mission to be identified subsequently as might improve it based on innovative ideas or innovations. Keywords: management, innovation, firm, techniques Clasification JEL : : M10, O 30, 034 1.Introduction
Management innovation is "a modern management system, which is based on the attitude of managers receptive to innovations, focusing on the establishment and consistent application of innovative strategies" [6, p. 103]. Both innovative management and the change are directly related to the collaborative organizations. Innovative ideas, in turn, crossing lifecycles, starting at events threatening or destructive to the environment in general or for specific organizations, in particular (especially those who do not want to change) and to obsolescence ideas that build great social and organizational transformations. Specialists consider that there is interference between innovation and interorganizational collaboration: the more innovation is required in an organization, the more it feels the need of collaboration to better cope with change. Also, as an organization open to collaboration with other organizations, the more it will have to manage this process innovations are required. In collaborative management, innovation is made in the organizational structure, which gets a new entity created network (Partnership), but also in content activities of the new organizational entity. 2. Content analysis inter-organizational innovation Most innovative forms - collaborative, which can be found in Romania, has characteristics of "organizational empowerment". This means that the organization that allocates funds (usually public funds) and initiating partnership of the State has the tendency to control other organizations, or at least to require an isomorphism in the setting of "management provisional" period and the progress of the association which subsidizes them (total or majority). Private companies prefer to coordinate their forms partnership, especially if you and starts to have more control over their management easy. Such 'organizations "mother" that creates, then "mandate" antreprenoriatele to act in one direction or another management (according to the needs for which they have helped to set up voluntarily) must take account analysis innovative potential, located at the heart of the mandate and the action that the primary issue in November entrepreneurial. Innovation is a function of the manager. So managers are expected to lead in a way that everyone involved (employees, customers, shareholders) to be satisfied with their work. To achieve this, they turn to the following [1, p. 56]: • devolution of decision at lower levels; • the need to act quickly; • rapid adaptation; • functional and qualification of workers removing barriers to create a market for goods and services with high added value.
61

Annals of the „Constantin Brâncuşi” University of Târgu Jiu, Economy Series, Issue 3/2016
„ACADEMICA BRÂNCUŞI” PUBLISHER, ISSN 2344 – 3685/ISSN-L 1844 - 7007
The intensity of innovation within the company in order to increase "finished production" of technologies, products, organizational solutions for new or upgraded involves multiple improvements. The competitive advantage stems primarily from improvements, innovations and changes. Some companies obtain a competitive advantage over competitors as they devise a new way to compete effectively or find new and better ways to compete in existing modes. Innovation achieved in these firms include not only new technologies, but also new methods and ways sometimes seem rather insignificant. 3. Making innovation process at enterprise Innovation process has a broad coverage. Basically, it manifests itself in all the activities taking place in enterprises, nerezumându to the products and technologies. He also covers information systems, economic methods, organizational structures, decision processes, etc [7, p. 68]. It is necessary to make this clarification since there is often a tendency to limit creativity and innovation to the production, although lately the world there is a definite trend to promote other categories of inventions and innovations. In literature there are many opinions, views and algorithms on how to make innovation process in the enterprise. Often they are very different and they differ essentially. The fact is that this topic is not particularly well structured literature. At the same time, the diversity of views among specialists lies in the high complexity of the matter - the innovation process. In the following a few precautions to visions of management researchers, both Westerners and Romanian, the essence, content and manner of the innovation process in the enterprise. It highlights the following fundamental activities of a company where managers expect to achieve, on a proper leadership, a radical change from the current situation: marketing; internationalization; production; sale; customer serving; innovation; staff; organization; lead; and management information systems; management control and financial management. It believes that passion is the change that will ensure business prosperity. The following principles of innovation management is a prerequisite for success of a business [2, p. 191]: - A firm answer customer needs and expectations; - Development of a continuous process of innovation in all fields of the company; - Creating a spirit of partnership; - Existence at all levels of passion for change management and capacity training of the staff of the company to achieve a good idea or proposal; - Use of management tools simple but capable of ensuring an efficient activity. The requirements on continuous innovation provide encouraging the launch of new projects in all company functions, from all employees so as not to delay changes to the evolution of high-speed current circumstances. Requirements concerning senior management - suggests the application of processes which promote change (shortening the minimum production cycles, higher quality, customer satisfaction, involving all employees) and the continuous reduction of hierarchy within the firm (elimination of hierarchical levels intermediate control and decision). Innovative organization comes up with an idea that might be product or service, and it is sometimes possible to sell in significant quantities, provide income and sometimes even profits. What is missing is the "business" this viable, organized, operating and people know where they are going, what you should do, what results are or should be. If not properly managed would not survive, no matter how good the idea, how much money it would invest as good as products and how great the demand. In the innovative organization it is likely that the most important step toward innovative leadership is a leadership team composition. For founding this step it is very important, because they must lead to future success. As the company grows, roles and relationships change. If the founders refuse to accept this situation, the business may stop altogether. They can and must change with the undertaking. Many did not understand at that time and have destroyed business and they destroyed them. Innovative strategies are important, distinct and special. Their goal is to introduce innovations; itself is an innovation strategy. The product or service to which it relates to exist for a long time, but to be transformed, to change the utility, value and economic characteristics. Innovative strategies are as important as innovations for a particular purpose or as innovative leadership. All tend to maintain flexibility and continuous renewal in society, economy, industry, services or business. We need a society where innovation and innovative system are normal, firm and permanent - as part of the economic activity in organizations and in our society. This assumes that all leaderships to make innovation and the innovative standard practice - and continues daily - of their own work and the work of their organization. 4. Innovative approaches patterns Innovation and process innovation are the themes studied in the literature in the late seventeenth and deeper in the last 30 years. During this period, each author has succeeded in developing a definition of innovation and the
62

Annals of the „Constantin Brâncuşi” University of Târgu Jiu, Economy Series, Issue 3/2016
„ACADEMICA BRÂNCUŞI” PUBLISHER, ISSN 2344 – 3685/ISSN-L 1844 - 7007
innovation process particular situation analyzed in research conducted thus founding a multitude of concepts and their dimensions [5, p. 156]. Management innovation should not be confused with innovation management, which involves the introduction and implementation of an invention-related practices, techniques, ideas or management structures and plans to develop or change the organization's objectives. Innovation, as defined above, is an all-encompassing process resulting in significant renewal or improvement of a product, service or method, and innovation management is actively organizing and monitoring the performance of activities that determines innovations. To justify the need to propel innovation process and develop management models for innovation, researchers are still studying the impact of innovation on economic development and the results ie the subject stimulates other scientists to look further factors and strategies which will subsequently increase the volume innovation and economic productivity respectively. New theory of growth and development believes that innovative activity is the main mechanism of economic progress. It was included innovation type endogenous, in addition to technological progress, highlighting the contribution of innovation in development when the economy achieve steady. Considering the importance of innovation for growth, researchers found it necessary to study its causes, including factors intrinsic and extrinsic increases volume innovation, and persistence in commercial enterprises, producing a series of models and systems as explained innovation process, as it suggests strategies for implementing and maintaining its innovations are almost never easy to predict, therefore, most often analyzes and models built retrospective examines the success or failure innovative projects. There are few studies that really addressed the problem in terms of procedural or longitudinal pursue certain companies without their influence, their innovative path. Thus, in most cases, created models of the innovation process, the determinants of which are extrapolated from the results already achieved [7, p. 71]. Largely, however, the innovation field researchers agree with the steps that transform the invention into an innovation and therefore managing them. The Ordinary follows the model of the innovation process start-up enterprise, which is characterized by four main stages - pure entrepreneurship, strategic focus, systems development, corporate management. The same steps are representative at the level of innovation in companies already established on the market, the major difference is that corporate management is present in all stages, from start up to launch innovation and key actors and their roles ultimate goals differ substantially. The stage-gate barriers in every stage enabling continuous analysis of market and innovation. This decomposition stages and innovation activities is important because moving authors and consultants base their suggestions for structuring managerial namely the consecutive steps of transformation invention or idea into an innovation. An innovative model built for developing countries, however, identifies three stages: acquisition of new technologies and the uptake of new processes, improve them. Models of innovation in less developed countries are called stage-skipping, which means that models of innovation are not necessarily linear, they can skip certain stages, or even return to them through cycles feedbac. Most comprehensive and the first model of innovation the process is that of Abernathy and Utterback that places innovation process and product in the same group. They argue that product and process innovations occur depending on the level of development of the company. Originally product innovations are dominant, did not emerge until a product model mainly, then focus on innovation transfer process. Innovative service models are more difficult to study because the main characteristics of business enterprises that offer, although the European and US market share exceeds 70% of GDP. Firstly, services are defined as the processes by which certain abilities as a skills / talents and knowledge are used to benefit another person or entity. Such services are very dynamic and fluid, changing constantly to meet customer needs. This means that compared with goods or products that pass through generations editions and scaled incremental innovations, service innovations are continuous and almost indistinguishable changes in customer requirements. One of the most interesting models of innovation that combines all the above in a rather sophisticated and intelligent is even called games of innovation or innovative games. The rules and purpose of these games: employees and managers who actually are participants or organizational actors compete and cooperate at the same time to create enterprise value, which value can be created with a specific combination of factors. Depending on game innovation, every business should create innovative organizational principles, embedded in the practice of management. CONCLUSIONS Management innovation remains one of the most studied and important current topics. This is not only demonstrated by the number unimaginably theses, articles and books written on this subject, and demand persistent and
63

Annals of the „Constantin Brâncuşi” University of Târgu Jiu, Economy Series, Issue 3/2016
„ACADEMICA BRÂNCUŞI” PUBLISHER, ISSN 2344 – 3685/ISSN-L 1844 - 7007
voluminous from managers and directors of companies who understand very well that the future of business and economic growth depend on the largely innovative spirit. Organization introducing innovative management strategies and practices can become a big business. Predictability and discipline, along with responsibility, accompanying the organization to success. For innovative entrepreneur and advice it is important to have independent, objective, outside. Someone who is not involved in the issue should ask questions, review decisions and impose permanent needs of long-term survival of the enterprise by focusing on market by providing financial projections by creating a functional leadership teams. BIBILIOGRAPHY
1. Băloiu Liviu, Managementul inovațional, Editura ASE, București, 2008. 2. Boboc, I., Comportamente şi strategii manageriale în organizaţiile non-guvernamentale, „Calitatea Vieţii”,
Bucureşti, Editura Academiei Române, 2006, pp. 191–204. 3. Boboc, I., Management strategic. Teorie şi practici pentru formele asociative de tip public, privat şi ONG din
agricultură, Bucureşti, Editura Pro Universitaria, 2009. 4. Burduș Eugen, Reproiectarea managementului organizației, Editura Pro Universitară, București, 2016. 5. Dalotă Marius, Managementul schimbarii si inovarii. Elemente fundamentale, Editura Universitară, București,
2012. 6. Munteanu V., Management, Editura Universității de Vest, Timișoara, 2008. 7. Visan Sanda, Inovare, cercetare științifică, progres tehnic. Editia a II-a, revizuită, Editura ASE, București,
2012.
64

Annals of the „Constantin Brâncuşi” University of Târgu Jiu, Economy Series, Issue 3/2016
„ACADEMICA BRÂNCUŞI” PUBLISHER, ISSN 2344 – 3685/ISSN-L 1844 - 7007
NGO 'S ROLE IN SOCIAL ECONOMY
MARIANA CLAUDIA MUNGIU-PUPĂZAN
LECTURER PHD AND CONSTANTIN BRÂNCUŞI UNIVERSITY OF TÂRGU JIU, e-mail:[email protected]
Abstract
This paper aims to be a company - NGO relationship analysis and points out that a company can find its strategic stakeholders among non - profit organizations. In world practice social responsibility is spoken frequently about the collaboration between the business sector and non - profit. At the international level, NGOs are one of the most important dialogue partners of the business sector. In Romania, NGOs are often seen as something always require organizations that sponsor or if you want to do exercises image. On the one hand NGOs are wondering what to do to see their sponsored projects, although according to modern definitions, sponsorship does not really have much in common with corporate social. On the other hand companies are trying to answer the question "who are strategic stakeholders". Their proactive involvement of the stakeholders helps to cultivate relationships that can provide a competitive advantage especially in times of crisis. Like any business, stakeholder engagement has a number of constraints: requires time, financial and human resources dedicated to rely on a continuous process of monitoring and may require. Moreover, if not properly planned and implemented, could damage relations between the company and stakeholders. Keywords: stakeholder, non - profit organizations, strategy, competitive advantage Clasificare JEL : M1, M2 1. Introduction
When we think of civil society discussion essentially so vast concept to individual and social welfare and all
items included in the democratic culture of tolerance (various behaviors and attitudes of everyday life). Also, civil society structures lies on the border between the private economy, entrepreneurship and formal institutions of political society, which inevitably is filled without substitutable. So, it is emerging as a developed concept, which includes all aspects of the public sphere, working outside the states, private parties and business.
In this way , the quality and depth of a democratic and participatory process are insured, its main features being diversified and active participation of citizens and various ways in which choices and decisions configures power, attracting people from socially responsible and with a high degree of individual independence. Every citizen feels he can be independent in a wider context over the past few years and this ensures more power to participate.
If we add this involvement a personalized element of social responsibility, the individual can take initiatives and can know others with similar characteristics and interests. In this participatory approach, an independent and responsible socially to meet other people more widely, creating the opportunity for personal responsibility to contribute to and implementation of a collective vision. So what matters is what you do citizen in relation to the state, not what it does state on the citizen. Civil society is a space above state and private enterprises are developed collective actions of different entities and citizens, scrolling down a wide range of actions and practices of informal communication horizontally. The goal is to operationalize a new concept of collective public interest for the benefit of the general public. As noted, the factors that determine or determine civil society is structured and vary depending on the level of legitimacy conferred by their autonomy and capacity of expression. In addition, the definition of civil society is not absolute and unambiguous no. According to Georgiadou (Georgiadou, 1996), civil society has a long history, as it involves a balance of forces between the economy and society: control , criticize and oppose incoherent policies manifests itself as an active component in the state. In this way it influences the political system in modern democracies.
Currently, NGOs are an integral part of civil society and their action depends directly on the needs of society and their ability to perceive them faster and authentic, due to the nature of social responsibility individually or collectively (that new needs society and how can they be covered). NGOs - as characteristic space expression for civil society - appeared initially as requirements expression and collective action as a new vector public action outside the party convention, and turned in substantial media entities between citizens and states, but targeting the interests of citizens. NGOs and requirements for co complicity in the traditional centers of power is a positive development in strengthening new forms of governance at local, national, supranational. NGO definition covers all governmental and non-profit groups.
65
Annals of the „Constantin Brâncuşi” University of Târgu Jiu, Economy Series, Issue 3/2016
„ACADEMICA BRÂNCUŞI” PUBLISHER, ISSN 2344 – 3685/ISSN-L 1844 - 7007
2. Principles NGOs It is considered that the fundamental principle of non-governmental organization refers to defining the purpose of the service provided to society as a whole. Thus, each NGO in civil society's mission is to mobilize adequate support, to influence governments, organizations and international corporations , to collect funds to educate the public, to allocate resources and to represent its members, beneficiaries, donors and key actors in the community. Through this expanded role, a non-governmental organization will achieve public goals or contribute to the social capital of the community, while promoting a cause which ensures continuity in its actions. The fundamental responsibility of NGOs is to coordinate their actions in a non-confrontational manner not to affect people, communities and the natural resources used.
For a non-governmental organization remain attached to tasks and services should be open and transparent to: mission and objectives; values and principles; own administration; own activities; the means to achieve goals. Other principles derived Independence A nongovernmental organization transparently presents all legal ties, organizational and financial corporations, governments and other structures that may affect intentions, activities and impact. Representation In relation to governments, corporations, international organizations, non-governmental organization will always be transparent and honest in to represent its members, donors, beneficiaries and other structures whose interests they represent. An NGO must bear in mind that its services offered will be subject to public comment and review, which recommended to engage in discourse justified the mission, objectives, values and principles of governance and legal means at its disposal to achieve its objectives. Additionally, an NGO will provide honest and clear information about the cause that promotes the interests they represent. Participation An NGO will communicate regularly with the parties they represent and provide them sufficient opportunity to respond to their objectives, activities and submissions made. Respect for law In all its operations, a non-governmental organization will demonstrate respect for the law and will consider all aspects and the relevant legal obligations in decision making. The provision When planning or implementing its policies and actions, an NGO will demonstrate sufficient attention and care on their own heads against whom action. For damage caused to a government, international organizations, corporations or other parties, will become responsible for their actions. Integrity The management and staff of nongovernmental organizations will use their positions not for personal advantage or financial gain. In particular, an entity of the social economy is considered a nongovernmental organization if it meets the following conditions: if an organization independent of the government (NGO ) - this means that the state can not interfere in its operations; if nonprofit - do not aim for profit used for personal purposes; if established , organized or operated by a private initiative in order to compensate the lack of political interest; if voluntary - everyone should have the right to participate as a volunteer; if operating under a record which clearly defines its operations and administrative structure; whether they provide, maintain and promote democratic values; whether they provide , maintain and promote the autonomy to choose their operations and financing. These analytical characteristics must be present throughout the entire existence of the entity wishing to be classified as a non-governmental organization . 3. Corporate social responsibility Corporate social responsibility is a relative concept again appeared in the second half of the twentieth century in the US, as societal responsibility of the company. Keith Davis and Robert Blomstrom define the concept of Such corporate social responsibility: "Responsibility Social makers are obliged to act in order protecting and improving the wellbeing of society as a whole, along with the need to protect their own interests." To operationalize the concept of responsibility Corporate social (short CSR / CSR = Corporate Social Responsibility ), we need four main elements namely: - economic responsibility is the foundation of all other types of responsibilities and relate primarily to economic responsibility of the company to be profitable ; - legal liability concerns, of course, responsibility company to comply with laws and perform contractual obligations; - ethical responsibility refers to the observance of a code of and good business relations with the external environment Internal company;
66

Annals of the „Constantin Brâncuşi” University of Târgu Jiu, Economy Series, Issue 3/2016
„ACADEMICA BRÂNCUŞI” PUBLISHER, ISSN 2344 – 3685/ISSN-L 1844 - 7007
- philanthropic responsibility covers issues the company's involvement in community development in operating at the company's contribution linked to increased quality of life in the community. In Europe , the concept and practice of social responsibility corporate came relatively late ; a formalized form of this Green Card concept we find in social responsibility Corporate (2001 ), developed at the Summit Lisbon. This document have two clear goals: - A multinational launch the debate on the subject - Identify ways of establishing a European partnership to promote the concept and values of corporate social responsibility CSR is defined as voluntary manner by which companies integrate social issues and those related to environmental protection in their actions and in their interaction with interest groups inside and outside the corporation. Such a vision to overcome business interests and rigors legal framework, managing to combine operational needs and interests of those who play an important role in the life of the company. Interest groups from outside the corporation can be identified civil society representatives. Reasons for business is willing to develop successful relationship with NGOs can be the following:
1. The relationship with the community. Companies argue most or community development projects and development services to the community in which they live their employees. These operations provide visibility by local consumers, but wins sympathy and suţinerea employees.
2. Marketing. Companies are willing and sometimes very willing to sponsor events organized by NGOs, as long as their logos can be very visible featured prominently in those events.
3. Relationship marketing case. Companies donates a portion the gain from the sale of own product / service a cause supported by an NGO. Resort to this as this ensures its sales growth.
4. Corporate foundations. Some companies make their own foundations, which have a strategy and programs lasting support community development. With the advent of these corporate foundations, can speak and the emergence of a new type of corporate culture and the development of the concept of "corporate citizenship".
5. Discretionary grant programs. Some companies (most often banks) have a budget allocated donations. This budget does not have a strategy so that sponsorships they are made when the company considers it appropriate. By with these donations, companies establish a better connection with the community, but it also involves. Active in her life.
6. Corporate Membership. Some NGOs provide some Facilities companies ( ex .: allowed free access to some events, often cultural, organized by them) in a fee for membership. Thus, companies can reward employees and even customers, but wins prestige in the community and NGOs wins support to achieve their own financial objectives and for programs.
In Romania, the concept of social responsibility is in phase early, but it is " pushed back " to awareness social problems and the pressure it exerts companies multinational this. With market liberalization and influx of foreign capital, there was the need to identify some appropriate ways to enhance corporate image, and their reputation. This led to the construction strategies more sophisticated and complex, it is obliged to otherwise, and the consumer who was educated and taught to do informed choices. Even if they made remarkable efforts to change Romanians' perception of the concept of responsibility corporate social is still long before this concept it will not be understood and treated as an act of charity or a type donation. Unfortunately, only multinationals have significant budgets, supported by development strategies they include social responsibility. To be consistent with the directives and international standards, Companies in Romania will need to make point strategies that meet the needs in their community operates. Also, public sector and civil society will have to popularize long-term projects. A very important role for information and promotion of the concept of fair CSR plays and the media. 4. NGOs - strategic stakeholder
The term "stakeholder" was first used in the 80s, at which many believed it was wrong transcription of the word "Stockholder". The concept of "stakeholder" refers to individuals or groups who: are affected directly or indirectly by the activity of a company, are interested in the functioning of an organization, have the legal right to be treated in a certain way, can positively affect or negative results of a company.
Romanian specialized literature, the concept has been translated either as' partner of interest "or by the" group jointly interested ", but because none capture the full meaning of the term stakeholder, was preferred to use the English version.
Once inside the practitioners use the term stakeholder has proved to be extremely useful and generator of confusion because it is increasingly difficult to identify key stakeholders and strategic. As the segmentation methodology becomes more developed, the number of stakeholders are in constant growth. Also, after the term stakeholder was imposed in the vocabulary of social responsibility, a number of theorists felt that CSR is a relational concept, which rather means Stakeholder Corporate Responsibility.
67
Annals of the „Constantin Brâncuşi” University of Târgu Jiu, Economy Series, Issue 3/2016
„ACADEMICA BRÂNCUŞI” PUBLISHER, ISSN 2344 – 3685/ISSN-L 1844 - 7007
It must therefore question, "have in common stakeholders and NGOs?" Apparently, not much. At the limit, NGOs are considered external stakeholders, forms of organization non-profit entities that advocate for causes the most diverse and sometimes can implement one project sponsored by a company. But that stakeholders concerns social groups and individuals, not abstract bodies, complicates practice.
The groups may overlap in terms of interest and identity while individuals may have different social roles and may belong to multiple groups. Key stakeholder groups of traditional companies: shareholders, employees, distributors and consumers themselves can include subgroups. Thus, some of the employees may belong to minority groups or can be segmented by gender. Consumers can include activist groups, while shareholders may be members of various civic groups. And all these groups and community activists, minority groups of shareholders or, in many cases, self-organizing as NGOs.
Therefore, more and more companies consider NGOs as strategic stakeholder groups, ie groups essential to the survival of the organization, groups that contribute to reducing risks and maximizing existing opportunities within a specific time. Obviously, strategic stakeholder status is directly influenced by the relationship between cause and values supported by NGOs or corporate objectives. On the other hand, the vehemence of a stakeholder group is not a guarantee of the importance of the case although there are plenty of cases of multinational various projects initiated by the desire to avoid an open confrontation with militant NGOs. 5. Conclusions International, non-governmental organizations - NGOs - are recognized as key actors of the third sector in terms of the areas of development, human rights, humanitarian, environment and many other areas of public action. NGOs run mainly different types of activity, but most often interrelated, as a mix of following guidelines: services, public companies, organization of pleadings / advocacy. NGOs have the main function providing services in various fields. Most arrogates based organizations and militant ( or advocacy ) in the dominant activity . NGOs are active presence in public space by drawing attention important issues, but ignored by authorities. It is often the " mouthpiece " of minority groups or specific problems that can generate social effects (rights of disadvantaged people, tolerance for orientation sexual rights expropriated etc. ). NGOs, through their actions the organization functional communities, economic development and of the community, forming networks and community initiate policies and social action plays an important role in community development, participating fully in the creation of capital social. By enrolling in the voluntary nature of the activity of an organization NGOs, facilitates skills development and social skills, enabling their transfer areas economic or political activities. Social entrepreneurs operate in the same market as imperfect and commercial entrepreneurs, however, this market raises many other obstacles in attracting financial and material resources necessary. This affects the ability to create economic value, which is reflected default on the ability to create social value. For this reason, NGOs are constrained to appeal and forms of aid such as: acts of volunteering, donations, membership fees which are increasingly difficult to obtain. The results of these are dependent on a number of factors such as access to resources and support in this regard, the purpose of employment, its reputation, how they can assess the social value achieved by the company. 6. Bibliography [1] Clark, Gerard (1998), „Non-‐Governmental Organizations (NGOs) and Politics in the Developing World”, Political Studies, 46, p. 36-‐52 [2] Lambru, M., Relația între sectorul de afaceri şi sectorul nonguvernamental între sponsorizare şi construcția de relații parteneriale, Fundația Concept [3] Lewis, D. (2005), Actors, ideas and networks: trajectories of the nongovernmental. [4] ***Economia socială şi grupurile vulnerabile (2011), Raport final, Editura Expert, Bucureşti. [5] *** www.catalogong.net [6] *** www.responsabilitatesocială.ro [7] *** Commission of the European Communities – Communication from the Commission concerning Corporate Social Responsibility: A Business Contribution to Sustainable Development, www.europa.eu.int. [8] *** http://ec.europa.eu/enterprise/csr/index_en.htm) [9] *** http://www.ngo.org/ngoinfo/define.html.
68

Annals of the „Constantin Brâncuşi” University of Târgu Jiu, Economy Series, Issue 3/2016
„ACADEMICA BRÂNCUŞI” PUBLISHER, ISSN 2344 – 3685/ISSN-L 1844 - 7007
A SYSTHEMATIC METHOD FOR DETERMINING THE FACTORS INFLUENCING
THE AMOUNT OF PENSIONS
CARINA-ELENA STEGĂROIU LECTURER PHD, „CONSTANTIN BRÂNCUŞI” UNIVERSITY, TARGU JIU, ROMANIA
Abstract
The paper proposes a comprehensive and systematic treatment of human welfare, while highlighting the main factors and connections that deal with the quality of social life.
Based on this analysis of unemployment and the consequences of immigration or labor migration to and from Romania, which has direct implications for quality of life we have found and demonstrated that it is influenced by various factors: social, economic, ambient, educational, cultural , scientific, recreational, technology, quality of employment is input into the system, the quality of social system outputs; occupation policy of labor, economic, social, educational, environmental, technical and scientific development constitutes reverse connection of occupation labor policy, economic and social policies of the country. Keywords: individual well-being, natural unemployment, social security, labor Classification JEL: E19, E69, K34 1. Introduction and context of the study
A comprehensive treatment of human welfare, the main factors are highlighted, and reverse connections can be
achieved through a social quality systemic treatment. Based on this analysis of unemployment naturally under immigration or labor migration to and from Romania,
which has direct implications for quality of life we have found and demonstrated that it is influenced by various factors: social, economic, ambient, educational, cultural, scientific, recreational, technology, quality of employment is input into the system, the quality of social system outputs; occupation policy of labor, economic, social, educational, environmental, technical and scientific development constitutes reverse connection of occupation labor policy, economic and social policies of the country.
2. Treatment of systemic unemployment
Social security and unemployment is a special form of protection latest coming in support of those who for one
reason or another, have lost their jobs as a result of restructuring or abolition [4]; [5] and for which compensation is granted, referred unemployment benefits for a limited time.
It is known that the function of gross domestic product (GDP), ( )Y , satisfying the conditions:
0;0 2
2
<∂∂
>∂∂
LY
LY , (1)
where: L - labor.
So between the marginal increase in GDP and employment, involved in economic dependence is reversed. In
other words, each additional unit of labor involved in economic activity is better than the next unit. The company increased its number of employees until the condition is satisfied: Marginal Cost Marginal
Revenue equals. In mathematical language: gross ( )=pf Revenue WLPY ⋅−⋅ .
69

Annals of the „Constantin Brâncuşi” University of Târgu Jiu, Economy Series, Issue 3/2016
„ACADEMICA BRÂNCUŞI” PUBLISHER, ISSN 2344 – 3685/ISSN-L 1844 - 7007
Pf it will be maximized when ( ) ( ) 0=∂∂
−∂∂
=∂∂ WL
LPY
LLPf
(2)
or 0=−⋅∂∂
=∂∂ WP
LY
LPf
(3)
where from: WPLY
=⋅∂∂
Marginal Revenue will be maximized when PW
LY=
∂∂
.
Conditions 02
2
<∂∂LY
and pW
LY=
∂∂
can be interpreted graphically (Figure 1):
Figure 1. Determine the natural unemployment L * which can not be reduced If the available country workforce coincides with L*, then the total occupation of economically justified (zero
unemployment); otherwise unemployed in the country occur if L* < L2 or shortage of labor, if L1 < L* or schematic (Figure 2):
Figure 2. Change in unemployment naturally
Marginal Revenue
Marginal Cost jobs
Marginal Revenue
Marginal Cost jobs
LY∂∂
PW
0L1 L2L*
Laborshortage
Unemplo-ymentnaturally
LY∂∂
PW
0L1 L2L*
Laborshortage
Unemplo-ymentnaturally
The country needs labor, immigrants
Naturally there isunemployment in the
country which can not be reduced
Expendituresto support
unemployedL > L* ?NOT YES
The country needs labor, immigrants
Naturally there isunemployment in the
country which can not be reduced
Expendituresto support
unemployedL > L* ?NOT YES
70
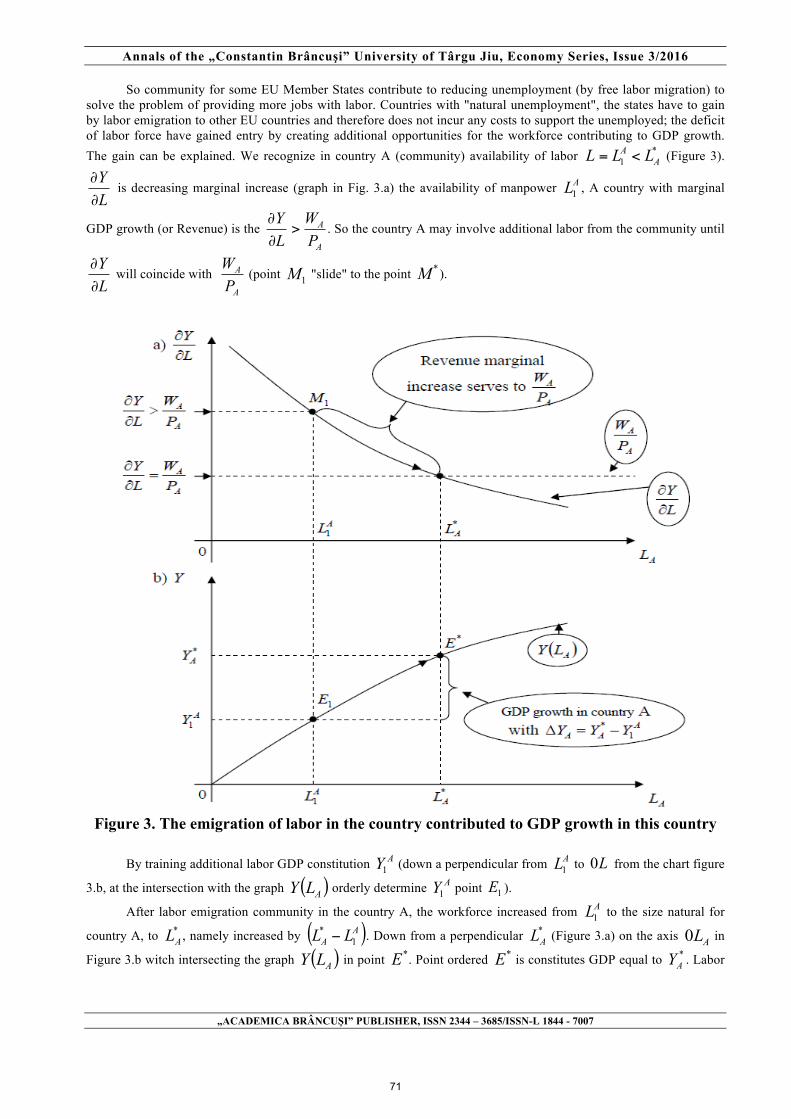
Annals of the „Constantin Brâncuşi” University of Târgu Jiu, Economy Series, Issue 3/2016
„ACADEMICA BRÂNCUŞI” PUBLISHER, ISSN 2344 – 3685/ISSN-L 1844 - 7007
So community for some EU Member States contribute to reducing unemployment (by free labor migration) to
solve the problem of providing more jobs with labor. Countries with "natural unemployment", the states have to gain by labor emigration to other EU countries and therefore does not incur any costs to support the unemployed; the deficit of labor force have gained entry by creating additional opportunities for the workforce contributing to GDP growth. The gain can be explained. We recognize in country A (community) availability of labor *
1 AA LLL <= (Figure 3).
LY∂∂
is decreasing marginal increase (graph in Fig. 3.a) the availability of manpower AL1 , A country with marginal
GDP growth (or Revenue) is the A
A
PW
LY>
∂∂
. So the country A may involve additional labor from the community until
LY∂∂
will coincide with A
A
PW
(point 1M "slide" to the point *M ).
Figure 3. The emigration of labor in the country contributed to GDP growth in this country
By training additional labor GDP constitution AY1 (down a perpendicular from AL1 to L0 from the chart figure
3.b, at the intersection with the graph ( )ALY orderly determine AY1 point 1E ).
After labor emigration community in the country A, the workforce increased from AL1 to the size natural for
country A, to *AL , namely increased by ( )AA LL 1
* − . Down from a perpendicular *AL (Figure 3.a) on the axis AL0 in
Figure 3.b witch intersecting the graph ( )ALY in point *E . Point ordered *E is constitutes GDP equal to *AY . Labor
71

Annals of the „Constantin Brâncuşi” University of Târgu Jiu, Economy Series, Issue 3/2016
„ACADEMICA BRÂNCUŞI” PUBLISHER, ISSN 2344 – 3685/ISSN-L 1844 - 7007
migration has contributed to GDP growth in country A with AAA YYY 1* −=Δ ; cut back unemployment in countries of
origin for immigrant labor. Each country has created its own social protection system on the unemployed [1].
3. Unemployment influence on the growth of social insurance Rising unemployment (block 3) contributes to increasing social security (block 4) and further additional costs
on the national state (block 8). In our view, efforts, economic mechanisms should aim at regaining the reclassification of persons unemployed for use in further labor savings related to increased social security resources. Financial, economic efforts must be channeled block 5 (Figure 4). At retraining redundant by certain levies, it is necessary participation of all EU countries (block 7 in Figure 4).
Figure 4. Block diagram of maintaining the quality of personal economic asset
In some EU countries unemployment may be naturally [2] and so it can not be reduced, the country will pay for
the national social insurance for the unemployed; in other countries, the availability of labor is below demand, marginal
GDP growth ⎟⎠
⎞⎜⎝
⎛∂∂LY
is less than one unit of labor input, additionally driven ⎟⎠
⎞⎜⎝
⎛ <∂∂ PLY
. In this case the country needs
additional manpower that can enhance the final product unit ⎟⎠
⎞⎜⎝
⎛∂∂
−LYP units, the company that collects Revenue
additional part can be transferred as subscriptions in the EU economy, part will be the firm's profit (see blocks 8, 9, 10, 11, 12 in Figure 4). Analysis start with a block 1, examine two alternatives: (3 - 4 - 8) and (5-6). Burden Social security in this case, a national state support. Because labor is demanded by other EU Member States, the redundant staff can be retrained. Expenses for retraining have to bear those countries that can increase GDP after already retrained workforce involvement (blocks 8-9 - 10-11 - 12-7 - 5 in Figure 4)[3].
4. Conclusions
Social security are some economic support to the national economy serve as an "injection" that can contribute or
not to develop the national economy as a whole. The problem of social insurance is made up of several issues: the issue of reducing imports, increasing labor productivity, coverage of money coming from abroad from Romanian compatriots; the problem of increasing labor's share in final products, restricting the amount of the over done by some companies; systematic treatment of social insurance problem, exclusion gap by quantifying them with a single standard, making basic education experience to the position, importance and contribution of the relevant subjects for society; Social Security matching problem in Romania with the EU member states. 5. Bibliography
[1] Alber, J., Fahey, T., Perception of living condition în an enlarged Europe, European Commission, 2004, pp. 29-37
72

Annals of the „Constantin Brâncuşi” University of Târgu Jiu, Economy Series, Issue 3/2016
„ACADEMICA BRÂNCUŞI” PUBLISHER, ISSN 2344 – 3685/ISSN-L 1844 - 7007
[2] Ozaki, M., Negotiating flexibility. The Role of social partners and the State. - Geneva: ILO, 1999, pp. 100-101 [3] Stegaroiu, V., Social Insurance in Romania in the Context of Integrating EU, LAP LAMBERT Academic Publishing GmbH&Co. KG, Saabrucken, 2010. [4] *** Legea nr. 76 din 16 ianuarie 2002 privind sistemul asigurărilor pentru şomaj şi stimularea ocupării forţei de muncă, publicată în M.O. al României, Partea I, nr. 103 din 6 februarie 2002.. [5] *** Legea nr. 53 din 24 ianuarie 2003 – Codul muncii, publicată în M.O. al României, Partea I, nr. 72 din 5 februarie 2003
73

Annals of the „Constantin Brâncuşi” University of Târgu Jiu, Economy Series, Issue 3/2016
„ACADEMICA BRÂNCUŞI” PUBLISHER, ISSN 2344 – 3685/ISSN-L 1844 - 7007
HOW TO MAKE A DESTINATION MORE COMPETITIVE IN TOURISM
GABRIEL SANDA,
ASSOCIATE PROFESSOR, FACULTY OF ECONOMICS AND BUSINESS ADMINISTRATION,"CONSTANTIN BRÂNCUŞI" UNIVERSITY
e-mail:[email protected] Abstract The aim of the article is to make an overview on the concept of destination competitiveness, starting with the importance of tourism in the economy and ending with what actually means the concept, taking into consideration also the importance of developing quality tourism products.Powerful destinations manage to attract millions of tourists annually. The key of establishing proper strategies for tourism destinations is to determine the competitiveness of a tourism destination. This subject has been researched by many important researchers from the tourism area and the findings obtained can help marketers. It must also be taken into discussion the fact that competitiveness may not only relate to factors of related to the destination. Keywords: tourism, destination, destination competitiveness, tourism product. Classification JEL: Z00,Z3 1. INTRODUCTION The fact that the world economies are dominated by services rather than goods has brought a special attention to tourism. Each destination has unique features and since each tourist has special needs there must exist a connection between the two. And that is why "destination competitiveness" receives a special attention from the marketing researchers. Professors Geoffrey I. Crouch and J.R. Brent Ritchie used the theory available in this field of interest and come up with one of the most important models for understanding destination competitiveness. The aim of the article is to present readers why it is so important for destinations to take into consideration the "destination competitiveness" model in case they want to gain competitive advantages in the competition with other destinations. But the first we must introduce the reader to what means a destination for a marketer. "From the demand perspective, destinations are places that attract visitors for a temporary stay, and range from continents to countries, to states, to provinces, to cities to villages, to purpose-built resort areas, an inhabited islands"[3](Pike,2012). People come and go from different destinations according to the aim of their visit. Some take business travels and can stay from one day to several weeks, some go on vacation and in the same way they can stay only a few days or more days. If people find something that appeals to their interest they can decide to stay more than a simple city break."Tourism happens only when a tourist has to leave his (or her) residence for a certain destination by means of transport for various purposes, for example to enjoy the beautiful landscapes or the different culture of the destination the tourist is visiting"[4](Wang and Pizam,2011). 1.2. THE COMPLEXITY OF TOURISM DESTINATIONS Tourists buy tourism products when they choose a destination for a holiday. " The tourism product at the destination level is a combination of goods and services that are produced by independent enterprises, each one acting autonomously according to its own needs and interests, and with little consideration for the needs and activities of other enterprises."[4](Wang and Pizam,2011). Companies have as main aim the maximization of their profit and not all of them understand that in order to have profit you must have satisfied customers and satisfied customers must receive quality products. And that is why " tourists do not perceive the situation in this manner. From a tourist perspective, the tourism destination is a unified product regardless of its numerous components. When a tourist has an unpleasant experience with a local tourism provider, this experience may result in a halo effect that causes a negative carry-over judgment to other tourism providers and to the destination as a whole"[4](Wang and Pizam,2011). This makes it clearly how important is for companies from a certain destination to make a tourism product that will satisfy tourists.
74

Annals of the „Constantin Brâncuşi” University of Târgu Jiu, Economy Series, Issue 3/2016
„ACADEMICA BRÂNCUŞI” PUBLISHER, ISSN 2344 – 3685/ISSN-L 1844 - 7007
Figure 1. Concept and scope of destination marketing and management
Source: Youcheng Wang, Abraham Pizam,Destination marketing and management: theories and application, CABI, 2011.
As we can notice in figure number 1 the concept of destination is a complex one and its scope has to be well
understood in order for marketers to create and apply destination strategies. The figure highlights the fact that if something goes wrong with one of the elements than the image of the destination will not be the same anymore. A destination does not need only an image positioning communication, a destination product development, a destination product distribution, a stakeholder management, a safety and crisis management, a structure policy planning or consumer decision making it also needs destination competitiveness and sustainability.
Figure 2. The multidimensional strengths of a tourism destination Source:J.R., Brent Ritchie,Crouch,Geoffrey, The competitive destination: a sustainable tourism perspective, Cabi
Publishing,Cambridge,2003
As we can notice from the second figure all the components of the environment affect a destination. Here we can mention not only the economic, political and social environment but also the environmental, technological, cultural ones."In summary, what makes a tourism destination truly competitive is its ability to increase tourism expenditure, to increasingly attract visitors while providing them with satisfying, memorable experiences, and to do so in a profitable
75
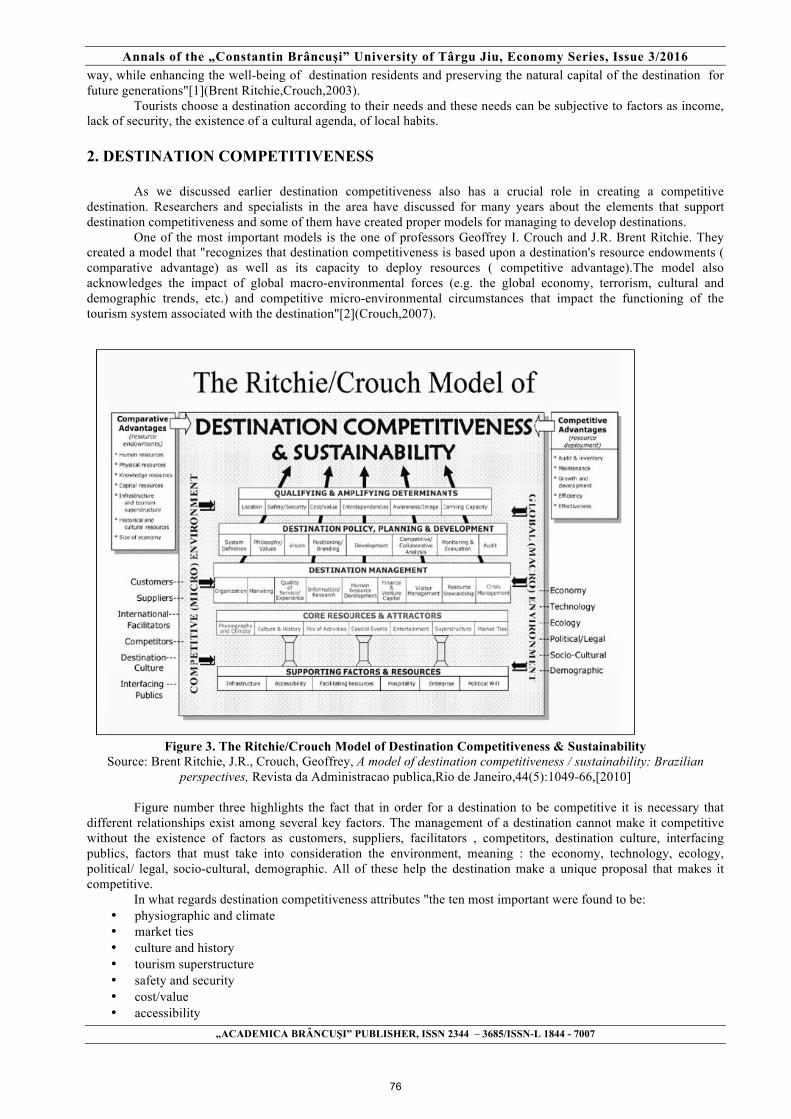
Annals of the „Constantin Brâncuşi” University of Târgu Jiu, Economy Series, Issue 3/2016
„ACADEMICA BRÂNCUŞI” PUBLISHER, ISSN 2344 – 3685/ISSN-L 1844 - 7007
way, while enhancing the well-being of destination residents and preserving the natural capital of the destination for future generations"[1](Brent Ritchie,Crouch,2003). Tourists choose a destination according to their needs and these needs can be subjective to factors as income, lack of security, the existence of a cultural agenda, of local habits. 2. DESTINATION COMPETITIVENESS As we discussed earlier destination competitiveness also has a crucial role in creating a competitive destination. Researchers and specialists in the area have discussed for many years about the elements that support destination competitiveness and some of them have created proper models for managing to develop destinations. One of the most important models is the one of professors Geoffrey I. Crouch and J.R. Brent Ritchie. They created a model that "recognizes that destination competitiveness is based upon a destination's resource endowments ( comparative advantage) as well as its capacity to deploy resources ( competitive advantage).The model also acknowledges the impact of global macro-environmental forces (e.g. the global economy, terrorism, cultural and demographic trends, etc.) and competitive micro-environmental circumstances that impact the functioning of the tourism system associated with the destination"[2](Crouch,2007).
Figure 3. The Ritchie/Crouch Model of Destination Competitiveness & Sustainability
Source: Brent Ritchie, J.R., Crouch, Geoffrey, A model of destination competitiveness / sustainability: Brazilian perspectives, Revista da Administracao publica,Rio de Janeiro,44(5):1049-66,[2010]
Figure number three highlights the fact that in order for a destination to be competitive it is necessary that different relationships exist among several key factors. The management of a destination cannot make it competitive without the existence of factors as customers, suppliers, facilitators , competitors, destination culture, interfacing publics, factors that must take into consideration the environment, meaning : the economy, technology, ecology, political/ legal, socio-cultural, demographic. All of these help the destination make a unique proposal that makes it competitive. In what regards destination competitiveness attributes "the ten most important were found to be:
• physiographic and climate • market ties • culture and history • tourism superstructure • safety and security • cost/value • accessibility
76
Annals of the „Constantin Brâncuşi” University of Târgu Jiu, Economy Series, Issue 3/2016
„ACADEMICA BRÂNCUŞI” PUBLISHER, ISSN 2344 – 3685/ISSN-L 1844 - 7007
• awareness/image • location • infrastructure"[2](Crouch,2007).
Tourists take into consideration some of these attributes when they decide where to go for a holiday. According to their needs and wishes they rank the attributes and after that they choose a destination.
CONCLUSIONS The development of a destination cannot exist without fulfilling certain requirements. One of this requirements regards the competitiveness of the destination. The most important attributes of competitiveness show us that not only climate, culture and history count, but also tourism infrastructure, safety and security, cost/value and infrastructure. This article tries to introduce the reader to the importance of paying attention to the competitiveness of a destination and tries to make marketers come up with new strategies of developing destinations. BIBLIOGRAPHY
[1] Crouch, Geoffrey., Modeling destination competitiveness. A survey and analysis of the impact of competitiveness attributes, CRC for sustainable tourism, Australia, 2007; [2] J.R., Brent Ritchie, Crouch, Geoffrey, The competitive destination: a sustainable tourism persective,Cabi Publishing, Cambridge , 2003; [3] Pike, Steven, Destination Marketing. Essentials, Routledge , NY, 2015; [4] Youcheng Wang, Abraham Pizam, Destination marketing and management: theories and application, CABI, 2011.
77

Annals of the „Constantin Brâncuşi” University of Târgu Jiu, Economy Series, Issue 3/2016
„ACADEMICA BRÂNCUŞI” PUBLISHER, ISSN 2344 – 3685/ISSN-L 1844 - 7007
ELECTRONIC COMMERCE, PART OF THE INFORMATION SOCIETY
TEODORESCU ANA-MARIA ASSISTENT PHD., FACULTY OF ECONOMIC SCIENCES, PETROLEUM-GAS UNIVERSITY,
PLOIESTI, ROMANIA e-mail: [email protected]
Abstract
This article shows the role of electronic commerce in the digital economy, where information is the main resource. Internet, information society technology vector, made possible transition to a knowledge society at the beginning of XXI century. New economy involves transition from a traditional economy based on resources, to a knowledge-based economy.
The development of information technology leads to major changes in the economic and social fields. In a world of globalization, e-commerce, part of the information society, manages to eliminate geographical barriers between participants at economic transactions.
I presented e-commerce history, definitions. I pointed out the importance of this sector at european level by quantification of indicators. I used a theoretical research and qualitative analysis of the data. I presented values indicators at the european level, the lowest and highest value, and recorded values for Romania.
Keywords: e-commerce, information society, information technology, internet, knowledge-based economy
Classification JEL: D83, Q01, O1
1. Introduction
Current society is based on the need for communication and information. The information society is the premise of economic and social development that we witness since the ‘80s. Identified in 1990 as the fifth wave of technology, ICT has revolutionized business models, method of communication.
At european level, since 1994, the attention was focussed on the importance of the information society in economic and social development. In 1994 Council of Europe foundated Council Information Society. Since 2006, at european level annual report on the information society is achieved.
Based on the concept "computer networks", the term "Internet" was spelled out in 1974 as a network of connected computers that operate due to assembly standardized data transfer.protocols
Essentially, the information society is the society based on the Internet that produced and produces new consequences for society by facilitating the process of globalization [3]. We are in a world where progress is paramount to each domain. Starting with the third millennium we can say that we belong to an era of the Internet. Worldwide, every day, thousands of users take advantage of the evolution of information technology, both for personal and professional. Worldwide, a percentage of 40.4% of the population uses the Internet.
2. E-commerce: history, definitions
Trade replaced barter, as exchange of goods, with the advent of money and merchants. Currently, traditional retail is replaced by the electronic somehow, which had a remarkable evolution.
Global e-commerce sales has gradually increased. In 2014, e-commerce sales increased by 21% compared to previous year. It is expected that global e-commerce sales increased over 10% for every year and reached to $1,506 billion in 2018 [2].
Electronic commerce is field in which information technology mirrors its best potential. The oldest form of commerce was held in 50'60 years in the airline using database management service for
reservations. In the next 10 years, specifically in the '70s, electronic information exchange system was implemented. in 1977 the first stock trading system was used. The concept of electronic exchange emerged in the 80s (for visible through financial markets, precious metals, oil). E-commerce concept was fully recognized in the 90’s. In 2000, ecommerce has grown particular, due to lower cost of Internet services. Electronic commerce is the modern form of the purchase of goods and services by removing geographic boundaries at any time via the Internet.
Over time, there have been set various definitions of the term, which reflect the peculiarities of electronic commerce. Thus, Internet Computing Magazine, emphasizes the role of this trade to "create interest buyers before the sale and ensure consumers after sales support”.
78

Annals of the „Constantin Brâncuşi” University of Târgu Jiu, Economy Series, Issue 3/2016
„ACADEMICA BRÂNCUŞI” PUBLISHER, ISSN 2344 – 3685/ISSN-L 1844 - 7007
In 1977, the Organisation for Economic Co-operation and Development issued e-commerce definition that refers to all forms of transactions with related commercial activities, carried out at the company, or buyers.
In 1977, the European Information Technology Observatory mentioned that this form of trade is "achieving commercial activities involving stock exchanges via telecommunications networks".
The definition given by the Centre for Resources Electronic Commerce unites participants in this trade: "the purpose of electronic commerce is to merge its extensive network of small firms, government agencies, large corporations and independent distributors in a single community, providing the ability to intercommunicate seamlessly through any computing platform".
"Electronic commerce is any form of use of electronic technologies in every aspect of commercial activity" is the definition given by the Centre for Electronic Commerce Resources (USA) which punctuate the connection between information technology and commerce.
Electronic commerce is the process of sale, transfer and exchange of products, services and / or information via computer networks [4].
E-commerce transactions can be occurred between businesses, households, individuals, governments and public or private establishments. (OECD, 2011).
Electronic commerce can be defined as the process of presentation, sale and purchase of goods and services regardless of time and space, within the seller and buyer meet via the Internet.
It is the process by which information technology makes possible connection between buyer and seller by the sphere of products offered or desired.
Electronic commerce is a reflection of the evolution of the benefits of economic development and communications technology in general and the Internet in particular. Regardless of actors for electronic commerce (companies, individual buyers) and thus the type of electronic commerce (business-to-business B2B, B2C business -to- consumer, consumer-to-consumerC2C, government-to-business G2B government- to-consumer G2C), the Internet enables the exchange of information between participants in the process of sale. However, it should be specified that electronic commerce besides buying and selling process also means negotiations between companies, hiring, planning, transfer of documents.
Developing countries should embrace e-commerce wholeheartedly as it will enhance their economic and social development, lead to gains in commercial productivity, lower the operating costs of businesses, and enhance the level of domestic integration with international markets [1].
3. E-commerce indicators
Information society and electronic commerce contribute to meeting the objectives set at european level on transforming the economy into one sustainable. Thus they were created indicators to quantify their evolution.
Ecommerce by enterprises Across the 28 European Union member states, the average of enterprises that have received orders online in
2015 was 86%, up 1 percent from the level of 2013. The same result they had inpreprinderile and small (10-49 employees) and 87% of medium businesses (located between 50 and 249 staff) have received orders online. In 2015, 17% of enterprises used e-commerce, up 3 percent from 2013.
Internet purchases by individuals According to the results at european level indicators, 43% of europeans have purchased products using the
Internet in 2015, up 5 percent from 2013. As shown in table. 1, residents of Denmark were most confident europeans about electronic commerce. 67% of them have purchased online. Romanians stood in last place ranking on Internet purchases, with a rate of only 8%.
Table No 1 – Internet purchases by individuals 2013 2014 2015 UE 28 average 38% 41% 43% The highest value 65% (Denmark) 66% 67% The lowest value (Romania) 5% (Romania) 6% 8%
Source: http://ec.europa.eu/eurostat
I analyzed the europeans age who accept this trade (table 2). Therefore, 56% of europeans aged between 20 and 24 years showed interest in purchasing products online. In this age group, 16% of romanians have confidence in this trade, up 10 percent from 2013.
Table No 2 – Internet purchases by individuals (% population aged 20-24) 2013 2014 2015 UE 28 average 49 51 56%
79

Annals of the „Constantin Brâncuşi” University of Târgu Jiu, Economy Series, Issue 3/2016
„ACADEMICA BRÂNCUŞI” PUBLISHER, ISSN 2344 – 3685/ISSN-L 1844 - 7007
The highest value 82 (United Kingdom) 79 (Malta) 83(United Kingdom) The lowest value (Romania) 6 10 16
Source: http://ec.europa.eu/eurostat
One cause of the low level of the practice of online commerce in Romania, as in other states, is the small number of Internet users and low Internet skills. In 2013 only 75% of europeans had knowledge of Internet navigation and in Romania only 50% possessed such abilities. At european level, 28% achieved these skills through various forms of schooling (school, college, university). Different courses were organized in educational centers designed to provide IT skills for 13% of Europeans who had the initiative, while 14% benefited from courses offered by the employer. 21% of Europeans showed their characteristic self-taught in IT for 2011. For 2015, 27% of the europeans had competent digital basic level, while 28% have advanced competent. The results of these indicators for the romanians had reached 17% and 9% respectively. In Romania, persons aged between 25-34 have made purchases on the Internet at the highest level, followed by those aged 35-44.
Table no3 Using Internet Purchases in Romania (% population) 2013 2014 2015
25-34 9 11 13 25-54 6 7 9 25-64 5 6 8 35-44 5 7 10 45-54 3 4 5 55-64 2 1 2 55-74 1 1 2
Source: http://insse.ro These results are due to the increased rates on the romanians Internet skills. In the period 2006-2013, the population of Romania who owned a low internet skills increased from 14% to 29; the intermediate level from 7-23, and those with high levels of 2 to 5. Enterprises purchasing via the Internet and / or networks other than Internet At european level, the percentage of enterprises that purchase over the Internet dropped in 2007-2009 from 30% to 27%. During this period, this indicator has fallen 5 percent for small enterprises. The same indicator for small enterprises also declined, from 33% to 29%. Among small and medium enterprises, only 24% have purchased online in 2009 compared to 28 percent of them for 2007. Enterprises selling via the internet and / or networks other than Internet Only 14% of european business category 1 (Sale, maintenance and repair of motor vehicles and motorcycles; retail sale of automotive fuel, Hotels and other short-stay Provision of accommodation, transport and storage, Post and telecommunications, computer and related activities) sold online in 2009. Of these, in 2009, only 11% were small enterprises, 18% were medium enterprises. The benchmark of declines from the previous year. Values of the indicator "Percentage of e-commerce enterprises receving orders", fell as well, from 90% for 2009 to 91% compared to 2008 (table no 4)
Table No 4 – Companies (category 1) selling Internet (%) 2007 2008 2009 UE 28 average 16 17 14% The highest value 28 (Ireland) 28 (Ireland) 26 (Croatia) The lowest value 3 (Italy) 3(Bulgaria) 3(Bulgaria) Romania value 4 4 -
Source: http://ec.europa.eu/eurostat As for the activity of the enterprises of category 2 (Food and beverage service activities, Travel agency, tour operator reservation service and related activities, Information and communication, Construction, Transport) in 2015 sold online 17%, up 3 percent from 2013 (table no 5). 18% of these companies practiced e-commerce in their own country for 2015 and 8% in other countries within the EU. In Romania, only 2% of companies were sold online in other Member States and 6% in our country. As obstacles that stand in the way businesses sell online are "goods and services has not suitable", "problems related to logistics", “problems related to payments",“problems related to ICT security","problems related to legal framework ". The first problem was greeted by 3% of enterprises in the EU 28 in 2013, of which Norway and Iceland
80

Annals of the „Constantin Brâncuşi” University of Târgu Jiu, Economy Series, Issue 3/2016
„ACADEMICA BRÂNCUŞI” PUBLISHER, ISSN 2344 – 3685/ISSN-L 1844 - 7007
recorded the highest percentage, 8%. Logistics issues, payment issues have prevented 2% of European businesses to sell online. Only 1% of European enterprises have encountered difficulties because the last two categories reported.
Table No 5 – Companies (category 2) selling Internet (%) 2013 2014 2015 UE 28 average 14 15 17% The highest value 27% (Denmark) 27%(Czech Republic) 26% (Norway) The lowest value 5 (Italy) 5 (Italy) 7 (Italy) Romania value 9 7 8
Source: http://ec.europa.eu/eurostat
Value of purchases and sales by internet and / or networks other than Internet The turnover of enterprises in e-commerce is another very important indicator to quantify the european
economy. Thus, for companies with activities in category 2 of economic activity, in 2015 the indicator value was 17, compared to category 1, where the value reached 14. 4. Conclusions
This article begins with a brief history of electronic commerce. I tried to fit this new way of trading in the new society, the information society. Electronic commerce can be defined as the process of presentation, sale and purchase of goods and services regardless of time and space, within the seller and buyer meet via the Internet. Electronic commerce is the process by which information technology enables the connection between buyer and seller by the scope of products offered or desired. It is a method by which the european goal of owning a digital economy can be achieved. Electronic commerce is the field in which information technology mirrors its best potential. Indicators regarding online orders registered at the enterprise level increased in 2013-2015. Also, 43% of europeans have purchased products using the Internet in 2015, up 5 percent from 2013. Romania occupied the last place in the rankings, although indicators have increased in 2013-2015. One cause of the low level of the practice of online commerce in Romania, as in other countries, is given by the small number of Internet users and Internet navigation skills.
The indicators regarding "Companies who purchase Internet" have declined in 2007-2009. Small enterprises have registered the biggest declines of the results indicators. Only 14% of companies from category 1 ( Sale, maintenance and repair of motor vehicles and motorcycles; retail sale of automotive fuel, Hotels and other provision of short-stay accommodation, Transport and storage, Post and telecommunications, Computer and related activities) sold online, down from 16% in 2007. Another situation occurred in companies from category 2 (Food and beverage service activities, Travel agency; tour operator reservation service and related activities, Information and communication, Construction, Transport), where increases have been recorded in 2013-2015. Similarly, the turnover of companies from category 2 increased in 2015 due to e-commerce. 5. Bibliografy
[1] Adel A.Alyoubi, E-commerce in Developing Countries and How to Develop Them During the Introduction of Modern Systems, Procedia Computer Science 65 (2015), pp.479 – 483 [2] Burcu Kuzucu Yapar, Seda Bayrakdar, Mustafa Yapar, The Role of Taxation Problems on the Development of Ecommerce, Procedia - Social and Behavioral Sciences 195 (2015), pp.642 – 648 [3] Drăgănescu M, Din istoria telecomunicaţiilor în România, comunicare, Academia Romană, 15 aprilie 2003, publicată în vol. Coord. Mihai Draganescu, Telecomunicaţiile în Romania. Pagini de istorie, Editura Academiei Române, Bucureşti, 2003, pp. 7–33 [4] Turban E., Electronic commerce a managerial perspective, 2006, Ed. Pearson Prentice Hall, p. 4 [5]***http://ec.europa.eu/eurostat [6]***http://insse.ro
81
Annals of the „Constantin Brâncuşi” University of Târgu Jiu, Economy Series, Issue 3/2016
„ACADEMICA BRÂNCUŞI” PUBLISHER, ISSN 2344 – 3685/ISSN-L 1844 - 7007
EVALUATION OF THE INVESTMENT DECISIONS IN AGRICULTURE
Vasile BURJA PHD PROFESSOR, 1 DECEMBRIE 1918 UNIVERSITY OF ALBA IULIA
e-mail:[email protected]
Sorina Simona BUMBESCU PHD STUDENT, 1 DECEMBRIE 1918 UNIVERSITY OF ALBA IULIA
e-mail:[email protected] Abstract
Romania has a significant agricultural potential but underutilized and not adapted to the current requirements of the market economy. The role of the investmen process in agricultural development is obvious. This involves the use of a significant amount of resources that has to be directed towards objectives with maximum efficiency. The decision process is complex given the multiple criteria on which are based the investments. The article presents the particularities of the investment process in agriculture and proposes a model for the evaluation and ranking of investments under multi-criteria conditions based on ELECTRE method. The result shows the method opportunity that can lead to the investment efficiency increasing in agriculture.
Key words: agriculture, investments, decision, ELECTRE method. JEL Code: M21, Q01
1. Introduction Romania has a significant agricultural potential, holding 13.3 million hectares utilized agricultural area, which
place Romania on the 6th place in EU. Romania represents 6% of the total European Union area and 4% of its population.
There are significant disparities between Romania and EU, so a farmer endowment for Romania compared to EU 15 farmers endowment is about 25-26 times smaller: 9000-9200 € tangible assets in EU; 350€ in Romania [10].
In this context, and taking into account the contribution of agriculture to the national economy, we consider that the mechanization of agriculture in Romania is a fundamental necessity. On the other hand mechanization requires significant fundings; an opportunity in this respect is the Common Agricultural Policy (CAP) through the two pillars of development.
Romania's EU integration and implementation of the CAP has opened new horizons of development based on competitiveness, market orientation, increases of productivity, food security, etc
It is important to note that in 2007-2013, Romania had significant funds through the CAP, 13.524 million euro (representing 3.6% of the CAP budget of the EU27 member states), of which 5.502 millions euro for pillar 1 and 8.022 million euros pillar 2 [13]
Regarding the EU's 2014-2020 financial year, Romania has 8.026 million euro (representing 8% of the CAP budget of the EU 28 Member States and occupies 6th place in the EU 28 in terms of amounts distributed by CAP) for rural development and market measures, pillar 1 and pillar 2 [15].
In the period 2014-2020, the European programs for agriculture have in their center the sustainable rural development which implies a strong rural economy, a modern rural infrastructure, an adequate technical equipment of the rural area, using of local natural resources, environmental protection.
Farm structure in Romania is not adapted to the EU developed countries, so that the farms for Romania are characterized by a high degree of fragmentation. Romania has the largest number of farms in the EU, of which the majority (about 90%) are subsistence farms, and some of them very large. Excessive division of agricultural land and establishment of a large number of farms has led to decreased agricultural productivity, expanding rural poverty, abandonment of cultivation of agricultural land, inefficient use of inputs, lack of capital accumulation in agriculture.
In the current economic context, the main way of ensuring economic growth and revitalization is the rational use of resources and increased business efficiency. Due to the resources of Romania, agriculture is considered to be one of the most important factors of economic growth and development.
The objectives considered in the research can be summarized as follows: Ø Highlighting the particular of decisions and decision-making proces in agriculture;
82
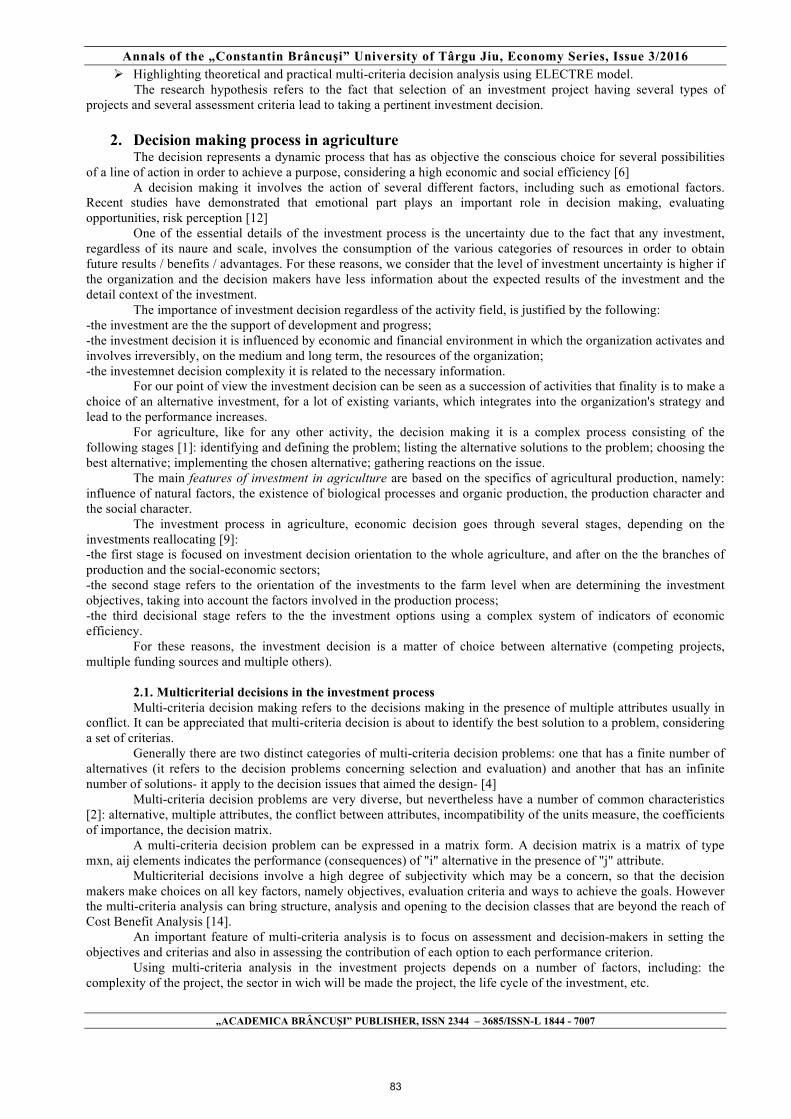
Annals of the „Constantin Brâncuşi” University of Târgu Jiu, Economy Series, Issue 3/2016
„ACADEMICA BRÂNCUŞI” PUBLISHER, ISSN 2344 – 3685/ISSN-L 1844 - 7007
Ø Highlighting theoretical and practical multi-criteria decision analysis using ELECTRE model. The research hypothesis refers to the fact that selection of an investment project having several types of
projects and several assessment criteria lead to taking a pertinent investment decision.
2. Decision making process in agriculture The decision represents a dynamic process that has as objective the conscious choice for several possibilities
of a line of action in order to achieve a purpose, considering a high economic and social efficiency [6] A decision making it involves the action of several different factors, including such as emotional factors.
Recent studies have demonstrated that emotional part plays an important role in decision making, evaluating opportunities, risk perception [12]
One of the essential details of the investment process is the uncertainty due to the fact that any investment, regardless of its naure and scale, involves the consumption of the various categories of resources in order to obtain future results / benefits / advantages. For these reasons, we consider that the level of investment uncertainty is higher if the organization and the decision makers have less information about the expected results of the investment and the detail context of the investment.
The importance of investment decision regardless of the activity field, is justified by the following: -the investment are the the support of development and progress; -the investment decision it is influenced by economic and financial environment in which the organization activates and involves irreversibly, on the medium and long term, the resources of the organization; -the investemnet decision complexity it is related to the necessary information.
For our point of view the investment decision can be seen as a succession of activities that finality is to make a choice of an alternative investment, for a lot of existing variants, which integrates into the organization's strategy and lead to the performance increases.
For agriculture, like for any other activity, the decision making it is a complex process consisting of the following stages [1]: identifying and defining the problem; listing the alternative solutions to the problem; choosing the best alternative; implementing the chosen alternative; gathering reactions on the issue.
The main features of investment in agriculture are based on the specifics of agricultural production, namely: influence of natural factors, the existence of biological processes and organic production, the production character and the social character.
The investment process in agriculture, economic decision goes through several stages, depending on the investments reallocating [9]: -the first stage is focused on investment decision orientation to the whole agriculture, and after on the the branches of production and the social-economic sectors; -the second stage refers to the orientation of the investments to the farm level when are determining the investment objectives, taking into account the factors involved in the production process; -the third decisional stage refers to the the investment options using a complex system of indicators of economic efficiency.
For these reasons, the investment decision is a matter of choice between alternative (competing projects, multiple funding sources and multiple others).
2.1. Multicriterial decisions in the investment process Multi-criteria decision making refers to the decisions making in the presence of multiple attributes usually in
conflict. It can be appreciated that multi-criteria decision is about to identify the best solution to a problem, considering a set of criterias.
Generally there are two distinct categories of multi-criteria decision problems: one that has a finite number of alternatives (it refers to the decision problems concerning selection and evaluation) and another that has an infinite number of solutions- it apply to the decision issues that aimed the design- [4]
Multi-criteria decision problems are very diverse, but nevertheless have a number of common characteristics [2]: alternative, multiple attributes, the conflict between attributes, incompatibility of the units measure, the coefficients of importance, the decision matrix.
A multi-criteria decision problem can be expressed in a matrix form. A decision matrix is a matrix of type mxn, aij elements indicates the performance (consequences) of "i" alternative in the presence of "j" attribute.
Multicriterial decisions involve a high degree of subjectivity which may be a concern, so that the decision makers make choices on all key factors, namely objectives, evaluation criteria and ways to achieve the goals. However the multi-criteria analysis can bring structure, analysis and opening to the decision classes that are beyond the reach of Cost Benefit Analysis [14].
An important feature of multi-criteria analysis is to focus on assessment and decision-makers in setting the objectives and criterias and also in assessing the contribution of each option to each performance criterion.
Using multi-criteria analysis in the investment projects depends on a number of factors, including: the complexity of the project, the sector in wich will be made the project, the life cycle of the investment, etc.
83

Annals of the „Constantin Brâncuşi” University of Târgu Jiu, Economy Series, Issue 3/2016
„ACADEMICA BRÂNCUŞI” PUBLISHER, ISSN 2344 – 3685/ISSN-L 1844 - 7007
In the investment projects financed from European funds, the multi-criteria analysis is used in several stages [8]: during the programming phase of the Structural Instruments, in the preparation of European projects, in project selection and to interim and ex-post programs evaluation.
In conclusion, we can say that to make a good decision on the projects financed from European funds, public and even private funds it is recommended to use both cost benefit analysis and multi-criteria analysis because both provide useful and varied information to the decision-maker.
2.2. ELECTRE decision model- characteristic elements ELECTRE methods is one of the most used methods to solve multi-criteria decision problems [5]. The model
consists in finding in a decision situation with more alternatives and criteria, the best alternative using as much as possible information for the decision matrix, using safe decision rules.
ELECTRE decision model can help to ensure that the decision is properly framed for the group of decision makers or negotiators [7]: -ELECTRE model requires a minimum number of alternatives to be viable. If there are considered only a few alternatives, the decision maker is likely to omit a valuable alternative for the study. The studies have shown that the most appropriate number of alternatives are 10 - ELECTRE model makes the decision maker to select all of the options that allow comparative evaluation of the relevand options for the the decision problem. Only those characteristics whose performance can be evaluated on a measurable scale, can qualify as evaluation criteria.
ELECTRE model depends on the types of criteria involved that can be classified into two categories: (a) criteria of truth (b) pseudo-criteria. The criteria of truth fit into the "traditional" structure of the preference, which has no levels involved. The differences between the performance and criterion are used to determine which alternative is preferred [11].
2.3. Case study regarding ELECTRE decision model The case study is conducted in a rural livestock farms who intend to diversify and improve the activity, having
four alternative / investment projects (P1-P4): Ø A1: Acquisition of agriculture machinary Ø A2: Acquisition of equipment for milk processing Ø A3: Purchase of equipment for meat processing Ø A4: The establishment of a blueberry plantation.
For the projects listed above are taken into account four analysis criteria: C1-price, C2- co finance value, C3- yield of use, C4- degree of yield of the production achieved.
The funding sources for the four investment projects are the EU funding (through the National Rural Development Programme 2014-2020). We note that depending on the each project, the farm must provide own contribution in cash that is proportional to the project value (eg 50% of agricultural equipment value).
Selecting an alternative / investment project of the four mentioned above it is the subject of this multi-criteria analysis.
In order to select an investment project, based on four criterias, the first step consists in making decision matrix situation.
Table no. 1: Matrix decision situation
Criteria Alternative
C1: Price C2: Co finance value
C3: Yield of use
C4: Degree of yield of the production achieved
A1: Acquisition of agriculture machinary 1,500,000 750,000 80% 85%
A2: Acquisition of equipment for milk processing
1,800,000 900,000 90% 98%
A3: Purchase of equipment for meat processing
1,950,000 975,000 85% 95%
A4: Establishment of a blueberry plantation 2,600,000 780,000 95% 100% Kj- Importance coefficient 0.15 0.30 0.20 0.35
Source: author’s view
The information for the table. no.1 are used to calculate the matrix utilities, using as a determination method of utilities the linear interpolation method between 0 and 1.
The calculation formula of the utilities is [3]:
84

Annals of the „Constantin Brâncuşi” University of Târgu Jiu, Economy Series, Issue 3/2016
„ACADEMICA BRÂNCUŞI” PUBLISHER, ISSN 2344 – 3685/ISSN-L 1844 - 7007
01
0
jj
jijij aa
aau
−
−= (1)
uij- utility consequence of i altertanive after j criteria aj
0- the worst consequence aj
1- the best consequence aij- consequence of i alternative after j criteria
Tabel no. 2: Matrix utilities
Criteria
Alternative C1 C2 C3 C4
A1 1 1 0 0 A2 0.73 0.33 0.67 0.87 A3 0.59 0.00 0.33 0.67 A4 0 1 1 1 Kj 0.15 0.30 0.20 0.35
Source: author’s view
In order to determine the ranking of the project alternative or the upgrademay relationships between them, it is necessary to calculate two indicators [3]: -concordance indicators shows how a strategy Pg is better then another strategy Ph, considering all criteria, and are calculated according to the below formulas:
( ) ∑=
=+++++
=n
jj
njhg njK
KKKKPPc
121
,1(......
1 (2)
Kj for those j where hjgj uu ≥
So: ( ) 10 << hgPPc
-discordance indicators highlights the opposite of the concordance indicators, namely how a Pg strategy is weaker than a Ph strategy. The calculation formula is as follows:
( ) ( )⎪⎩
⎪⎨⎧
−Δ
≤=
gjhj
ghhj
hg uuu
uuPPd
max1,0
, (3)
The two indicators presented above provides the ability to use a upgrademay rule [2]: Pg upgrademay Ph, so Ph P Pg if: ( ) pPPc hg ≥
( ) qPPd hg ≤
p and q are two threshold values between 0 and 1, q is required to be as close as possible to 0 and p closer to 1. So an alternative P0 can surpass all others if:
( ) ( )mipPPc i ,1,0 =≥
( ) qPPd i ≤0
85
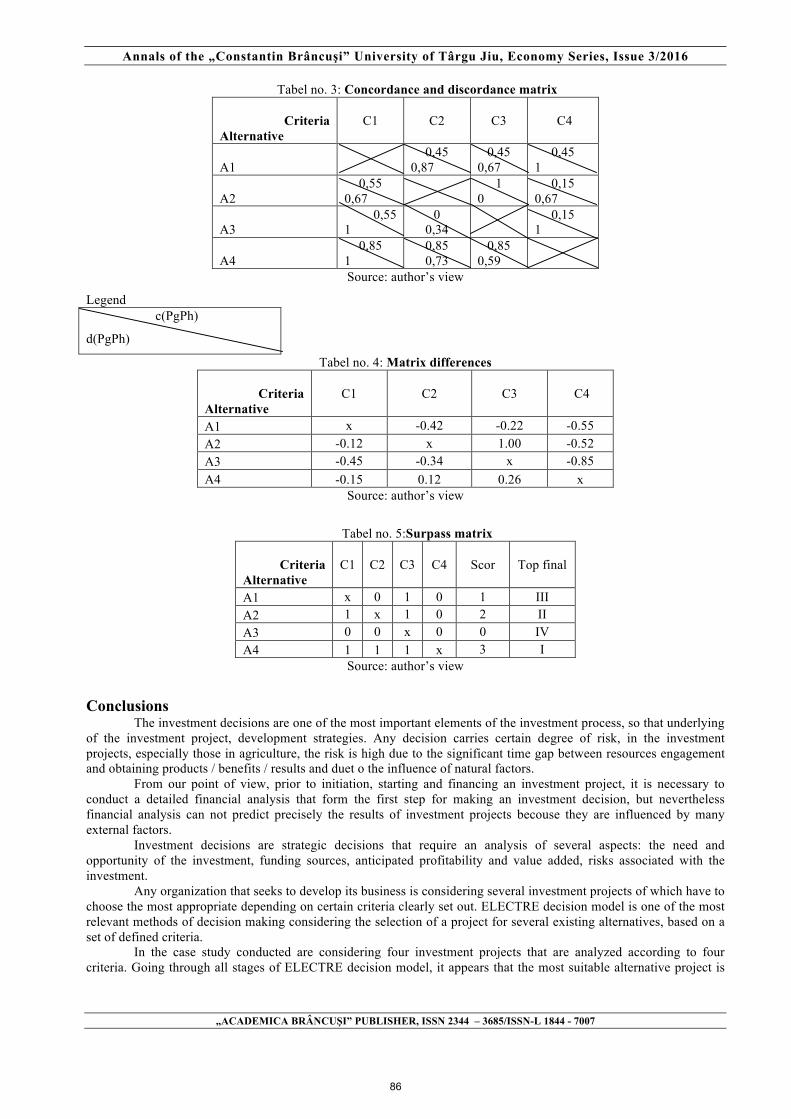
Annals of the „Constantin Brâncuşi” University of Târgu Jiu, Economy Series, Issue 3/2016
„ACADEMICA BRÂNCUŞI” PUBLISHER, ISSN 2344 – 3685/ISSN-L 1844 - 7007
Tabel no. 3: Concordance and discordance matrix
Criteria
Alternative C1 C2 C3 C4
A1
0,45
0,87 0,45
0,67 0,45
1
A2 0,55
0,67
1 0
0,15 0,67
A3 0,55
1 0
0,34 0,15
1
A4 0,85
1 0,85 0,73
0,85 0,59
Source: author’s view
Legend c(PgPh)
d(PgPh)
Tabel no. 4: Matrix differences
Criteria Alternative
C1 C2 C3 C4
A1 x -0.42 -0.22 -0.55 A2 -0.12 x 1.00 -0.52 A3 -0.45 -0.34 x -0.85 A4 -0.15 0.12 0.26 x
Source: author’s view
Tabel no. 5:Surpass matrix
Criteria
Alternative C1 C2 C3 C4 Scor Top final
A1 x 0 1 0 1 III A2 1 x 1 0 2 II A3 0 0 x 0 0 IV A4 1 1 1 x 3 I
Source: author’s view
Conclusions
The investment decisions are one of the most important elements of the investment process, so that underlying of the investment project, development strategies. Any decision carries certain degree of risk, in the investment projects, especially those in agriculture, the risk is high due to the significant time gap between resources engagement and obtaining products / benefits / results and duet o the influence of natural factors.
From our point of view, prior to initiation, starting and financing an investment project, it is necessary to conduct a detailed financial analysis that form the first step for making an investment decision, but nevertheless financial analysis can not predict precisely the results of investment projects becouse they are influenced by many external factors.
Investment decisions are strategic decisions that require an analysis of several aspects: the need and opportunity of the investment, funding sources, anticipated profitability and value added, risks associated with the investment.
Any organization that seeks to develop its business is considering several investment projects of which have to choose the most appropriate depending on certain criteria clearly set out. ELECTRE decision model is one of the most relevant methods of decision making considering the selection of a project for several existing alternatives, based on a set of defined criteria.
In the case study conducted are considering four investment projects that are analyzed according to four criteria. Going through all stages of ELECTRE decision model, it appears that the most suitable alternative project is
86

Annals of the „Constantin Brâncuşi” University of Târgu Jiu, Economy Series, Issue 3/2016
„ACADEMICA BRÂNCUŞI” PUBLISHER, ISSN 2344 – 3685/ISSN-L 1844 - 7007
alternative 4, which is the establishment a blueberry plantations, followed by alternative no. 2 (purchase of equipment for processing of milk).
The research hypothesis was verified. Any organization that has as objective the development and growth of the business is considering the implementation of several investment projects but due to various restrictions (particularly financial) requires a prioritization of investment projects. So having several investment projects analyzed by certain criteria and using an appropriate model leads to making an good investment decision. The existence of a single project alternatives can lead to failure, primarily because there is no basis for comparison with the benefits generated by other projects.
In terms of future directions of research, we intend to extend the research by analyzing the relationship between efficiency and size farms both in Romania and at EU level. References [1] Certo S., Management modern, Editura Teora, București, 2002; [2] Ionescu Gh.Gh., Cazan E., Negrușa A. L., Bazele managementului, Editura Concordia, 2003; [3] Ionescu Gh. Gh., Lile R., Management general, Arad, Editura Concordia, 2004 ; [4] Ling Xu, Jian-Bo Yang, Introduction to Multi-Criteria Decision Making and the Evidential Reasoning Approach, University of Manchester Institute of Science and Technology, Working Paper No. 0106, 2001, https://phps.portals.mbs.ac.uk/Portals/49/docs/jyang/XuYang_MSM_WorkingPaperFinal.pdf ; [5] Pang Jihong, Zhang Genbao, Chen Guohua, ELECTRE I Decision Model of Reliability Design Scheme for Computer Numerical Control Machine, Journal of Software, vol. 6, no. 5, 2011; [6] Radu E., Management, Editura ASE, Bucuresti, 2003; [7] Rogers Martin Gerard , Bruen Michael, Maystre Lucien-Yves, Electre and Decision Support: Methods and Applications in Engineering and Infrastructure Investment, Springer Science & Business Media, 2013; [8] Roman M., Analiza multi-criterială, 2012, p.29-31 http://old.fonduri-ue.ro/res/filepicker_users/cd25a597fd-62/Documente_Suport/Studii/0_Studii_Instrumente_Structurale/Pag.3_ACB/19_Analiza_Multicriteriala.pdf accessed on 02.03.2016 ; [9] Subic V. Jonel, Fundamentarea deciziei privind proiectele de investiții în agricultură, Revista Economia, nr. 2/2013,; [10] Steriu V., Otiman P. I., Cadrul National Startegic pentru dezvoltarea durabilă a sectorului agroalimentar si a spatiului rural în perioada 2014-2020-2030, Editura Academiei Romane, Bucuresti, 2013; [11]Tam C.M., Tong Thomas K.L., Lau C.T., ELECTRE III in evaluating performance of construction plants: case study on concrete vibrators, Construction Innovation, 2002, Vol. 3 Iss 1 pp. 45 – 61; [12] Welpe, I., Sporrle, M., Grichnik, D., Michl, T. and Audretsch, D.B, Emotions and opportunities: the interplay of opportunity evaluation, fear, joy, and anger as antecedent of entrepreneurial exploitation, Entrepreneurship Theory and Practice, Vol. 36 No. 1, 2012, pp. 69-96; [13] Zahiu L., Toma E., Dachin A., Alexandri C., Agricultura în economia României, Editura Ceres, București, 2010; [14] Department for Communities and Local Government, Multi-criteria analysis: a manual, London, 2009, http://eprints.lse.ac.uk/12761/1/Multi-criteria_Analysis.pdf, accessed on 04.03.2016 ; [15] European Commission, Agriculture and Rural Development, Multiannual Financial Framework 2014-2020 and the financing of the CAP, p. 2-3; http://ec.europa.eu/agriculture/cap-funding/budget/mff-2014-2020/mff-figures-and-cap_en.pdf, accessed on 04.03.2016 .
87

Annals of the „Constantin Brâncuşi” University of Târgu Jiu, Economy Series, Issue 3/2016
„ACADEMICA BRÂNCUŞI” PUBLISHER, ISSN 2344 – 3685/ISSN-L 1844 - 7007
IMPLEMENTING CLEANER PRODUCTION IN ROMANIAN INDUSTRIAL
ENTERPRISES IN TERMS OF SUSTAINABLE DEVELOPMENT
PAUL BOGDAN ZAMFIR LECTURER PH. D. CONSTANTIN BRÂNCUŞI UNIVERSITY OF TÂRGU-JIU, ROMANIA
e-mail:[email protected]
Abstract: In this paper I propose to emphasize the necessity of implementation cleaner production in industrial enterprises from our country in the contemporary context of sustainable development through extensive use of renewable resources. On this backgroung it is important to note that in accordance with recent scientific studies and research in the field of analyzed phenomenon it is suggested the idea that obtaining a cleaner production by industrial enterprises becomes a sine qua non condition in the achievement process of sustainable development objectives. Moreover, it is obvious that the integration of Romanian industrial enterprises into the paradigm of sustainable development is essentially possible in obtaining a clean production through evacuation into the natural environment of minimum quantity of waste and pollutants. In this paper the scientific argumentation is achieved by using the specific methods of research elaborated in the area of analysis theme such as: methods of quantitative measurement and qualitative analysis. Also in the strucure of this paper are inserted some current statistical data that show the adaptation level of Romanian industry to sustainable development objectives. Finally it is important to emphansize that all results of economic research and major conclusions which are presented in this article are based on a series of specialized studies and official documents among that are highlighted in the content of this scientific approach such as : Europe 2020 Strategy, National Sustainable Development Strategy Romania 2013–2020–2030, National Strategy of Waste Management 2014-2020. Keywords: sustainable development, industrial enterprises, renewable resources, cleaner production, natural environment Classification JEL: Q01; Q2; Q51; Q53; Q55 1. Introduction
The complexity of the concept of sustainable development has generated over the years a number of definitions, both from scientists and also by the most prestigious international institutions. For example, Brundtland Report of the World Commission on Environment and Development (1987) defines the term "sustainable development" as "the ability of humanity to guarantee satisfaction of current needs without compromising the ability of future generations to meet their own needs."
After analyzing the economic doctrine it is evident that sustainable development is defined and treated (Cerin, 2006; Dernbach J.C., 2003; Stoddart, 2011) from the perspective of achievement a possible equality between present and future generations.
The issue of harmonizing the activity of Romanian industrial enterprises with the objectives of sustainable development must be analyzed in accordance with the strategic vision of EU in this field, which propose to stimulate investments in a smart, sustainable and inclusive growth and promote a development model based essentially on three pillars: economic, social and environmental.
Against this background, the general objective of the paper is to identify the directions and means of increasing the competitiveness of industrial activity in Romania, respecting the principles of sustainable development. Thus by elaborating of this scientific paper the author has not proposed an exhaustive approach of the analyzed theme, but it sought to clarify certain aspects related to the necessity of harmonizing the industrial activity from our country with values, principles and objectives of sustainable development.
At the same time, the message of the paper is that the industrial activity in Romania can and must become more competitive, without sacrificing the development opportunities of future generations and modernization offered by European integration. [1] Moreover it is important to note that for the Romanian industrial enterprises in the current economic context, identifying new tools and mechanisms for sustainable development must become a constant concern in increasing the competitiveness at European and global level.
88
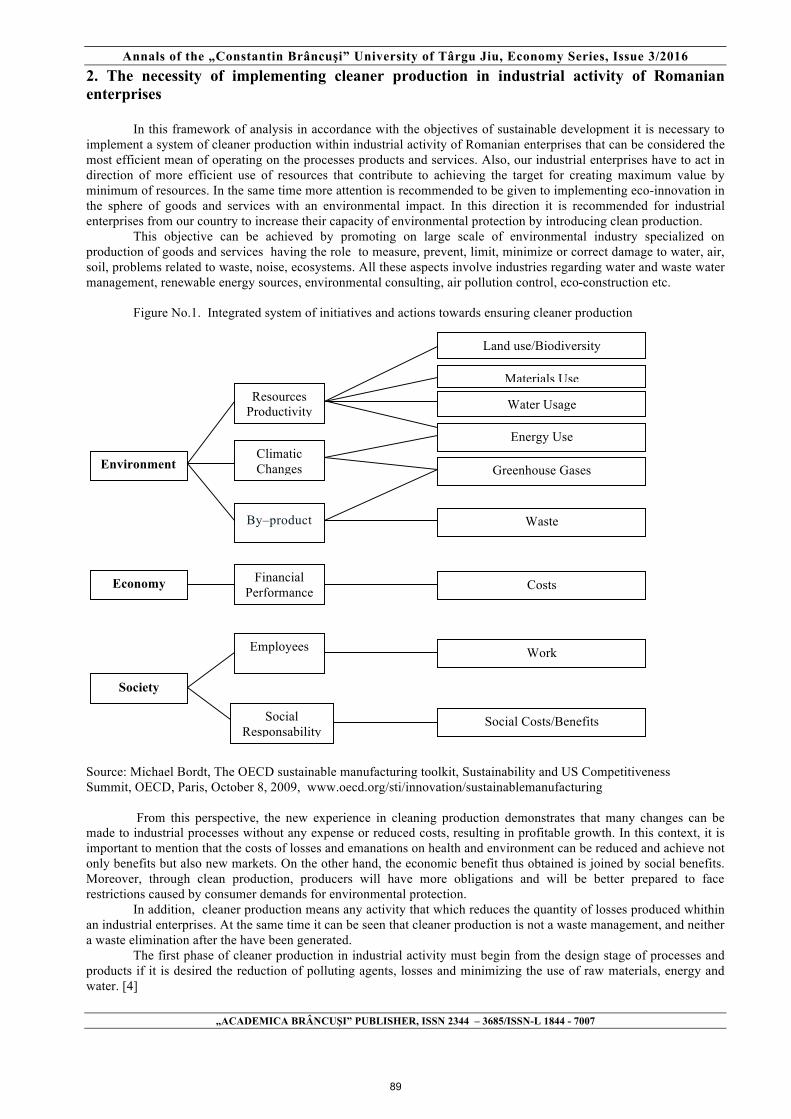
Annals of the „Constantin Brâncuşi” University of Târgu Jiu, Economy Series, Issue 3/2016
„ACADEMICA BRÂNCUŞI” PUBLISHER, ISSN 2344 – 3685/ISSN-L 1844 - 7007
2. The necessity of implementing cleaner production in industrial activity of Romanian enterprises
In this framework of analysis in accordance with the objectives of sustainable development it is necessary to implement a system of cleaner production within industrial activity of Romanian enterprises that can be considered the most efficient mean of operating on the processes products and services. Also, our industrial enterprises have to act in direction of more efficient use of resources that contribute to achieving the target for creating maximum value by minimum of resources. In the same time more attention is recommended to be given to implementing eco-innovation in the sphere of goods and services with an environmental impact. In this direction it is recommended for industrial enterprises from our country to increase their capacity of environmental protection by introducing clean production.
This objective can be achieved by promoting on large scale of environmental industry specialized on production of goods and services having the role to measure, prevent, limit, minimize or correct damage to water, air, soil, problems related to waste, noise, ecosystems. All these aspects involve industries regarding water and waste water management, renewable energy sources, environmental consulting, air pollution control, eco-construction etc.
Figure No.1. Integrated system of initiatives and actions towards ensuring cleaner production
Source: Michael Bordt, The OECD sustainable manufacturing toolkit, Sustainability and US Competitiveness Summit, OECD, Paris, October 8, 2009, www.oecd.org/sti/innovation/sustainablemanufacturing
From this perspective, the new experience in cleaning production demonstrates that many changes can be
made to industrial processes without any expense or reduced costs, resulting in profitable growth. In this context, it is important to mention that the costs of losses and emanations on health and environment can be reduced and achieve not only benefits but also new markets. On the other hand, the economic benefit thus obtained is joined by social benefits. Moreover, through clean production, producers will have more obligations and will be better prepared to face restrictions caused by consumer demands for environmental protection.
In addition, cleaner production means any activity that which reduces the quantity of losses produced whithin an industrial enterprises. At the same time it can be seen that cleaner production is not a waste management, and neither a waste elimination after the have been generated.
The first phase of cleaner production in industrial activity must begin from the design stage of processes and products if it is desired the reduction of polluting agents, losses and minimizing the use of raw materials, energy and water. [4]
Environment
Resources Productivity productivity
Climatic Changes
By–product
Economy Financial Performance
e
Society
Employees
Social Responsability
y
Land use/Biodiversity
Materials Use materials
Water Usage
Energy Use
Greenhouse Gases
Waste
Costs
Work
Social Costs/Benefits
89
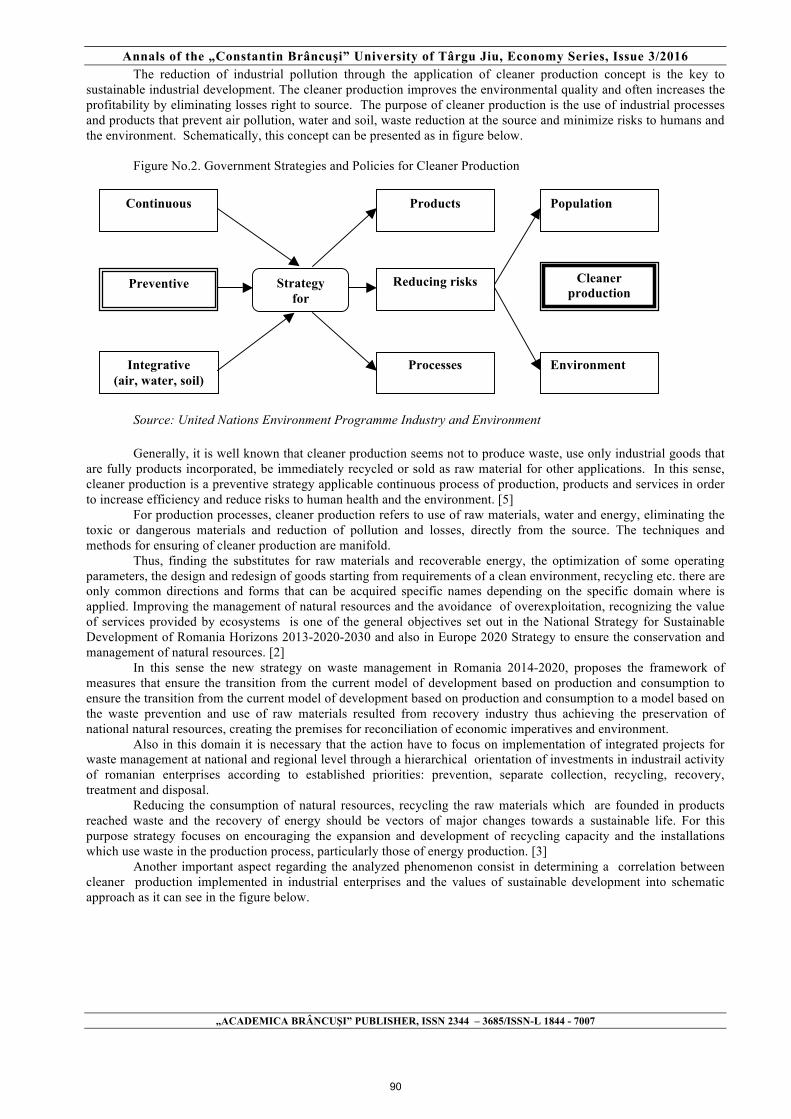
Annals of the „Constantin Brâncuşi” University of Târgu Jiu, Economy Series, Issue 3/2016
„ACADEMICA BRÂNCUŞI” PUBLISHER, ISSN 2344 – 3685/ISSN-L 1844 - 7007
The reduction of industrial pollution through the application of cleaner production concept is the key to sustainable industrial development. The cleaner production improves the environmental quality and often increases the profitability by eliminating losses right to source. The purpose of cleaner production is the use of industrial processes and products that prevent air pollution, water and soil, waste reduction at the source and minimize risks to humans and the environment. Schematically, this concept can be presented as in figure below.
Figure No.2. Government Strategies and Policies for Cleaner Production
Source: United Nations Environment Programme Industry and Environment Generally, it is well known that cleaner production seems not to produce waste, use only industrial goods that
are fully products incorporated, be immediately recycled or sold as raw material for other applications. In this sense, cleaner production is a preventive strategy applicable continuous process of production, products and services in order to increase efficiency and reduce risks to human health and the environment. [5]
For production processes, cleaner production refers to use of raw materials, water and energy, eliminating the toxic or dangerous materials and reduction of pollution and losses, directly from the source. The techniques and methods for ensuring of cleaner production are manifold.
Thus, finding the substitutes for raw materials and recoverable energy, the optimization of some operating parameters, the design and redesign of goods starting from requirements of a clean environment, recycling etc. there are only common directions and forms that can be acquired specific names depending on the specific domain where is applied. Improving the management of natural resources and the avoidance of overexploitation, recognizing the value of services provided by ecosystems is one of the general objectives set out in the National Strategy for Sustainable Development of Romania Horizons 2013-2020-2030 and also in Europe 2020 Strategy to ensure the conservation and management of natural resources. [2]
In this sense the new strategy on waste management in Romania 2014-2020, proposes the framework of measures that ensure the transition from the current model of development based on production and consumption to ensure the transition from the current model of development based on production and consumption to a model based on the waste prevention and use of raw materials resulted from recovery industry thus achieving the preservation of national natural resources, creating the premises for reconciliation of economic imperatives and environment.
Also in this domain it is necessary that the action have to focus on implementation of integrated projects for waste management at national and regional level through a hierarchical orientation of investments in industrail activity of romanian enterprises according to established priorities: prevention, separate collection, recycling, recovery, treatment and disposal.
Reducing the consumption of natural resources, recycling the raw materials which are founded in products reached waste and the recovery of energy should be vectors of major changes towards a sustainable life. For this purpose strategy focuses on encouraging the expansion and development of recycling capacity and the installations which use waste in the production process, particularly those of energy production. [3]
Another important aspect regarding the analyzed phenomenon consist in determining a correlation between cleaner production implemented in industrial enterprises and the values of sustainable development into schematic approach as it can see in the figure below.
Continuous
Preventive
Integrative (air, water, soil)
Population
Cleaner production
Environment
Products
Reducing risks
Processes
Strategy for
90

Annals of the „Constantin Brâncuşi” University of Târgu Jiu, Economy Series, Issue 3/2016
„ACADEMICA BRÂNCUŞI” PUBLISHER, ISSN 2344 – 3685/ISSN-L 1844 - 7007
Figure No. 3. Correlation between cleaner production and sutainable development
Environmental Performances
Time Source: http://cleanprod.ecosv.ro The generation and waste disposal may be translated into a loss of valuable resources, and hence the pressure
that is put on the ability of the environment to resist to increased demand. In this analytical framework should be taken into consideration and the additional impact generated by extraction and processing of new materials and production / distribution of new goods.
3. Conclusions In the current context of integration of Romanian industrial activity into paradigm of sustainable development
is distinguished for enterprises the "win-win"principle, according to which simultaneously with minimizing the impact on environment can be achieved the use of resources efficiency so implicitly of business. Thus, the efficiently use of resources has always been fundamental to maintaining the business competitiveness in a dynamic market by reducing costs throughout the supply chain.
Also, significant savings can be realized through measures of cost reduction but frequently the environmental improvements require new technology, and this process involves a greater financial effort. On the other hand, the process of increasing productivity having a minimal imput value is actually an optimization mechanism. Taking into account current trends and requirements from environmental protection romanian industrial companies can conclude very well that a more comprehensive approach to environmental costs in the investment planning and decision-making can prove beneficial in terms of sustainable development. In this sense it is important to mention that through impplementing cleaner production in industrial enterprises from our country can be obtained a wide range of remarkable benefits, such as: products and packages safe and friendly with environment throughout their life cycle; minimizing, reducing or recycling waste and by-products ecological incompatible; eliminating chemicals or physical agents dangerous for environment and human health; conservation of energy and materials used in production processes; continuous improvement regarding the economic viability of enterprises. 4. Bibliography
[1] European Commission, EUROPE 2020. A strategy for smart, sustainable and inclusive growth [2] Government of Romania, National Strategy for Sustainable Development of Romania Horizons 2013-
2020-2030 [3] Government of Romania, National strategy on waste management in Romania 2014-2020 [4] Khuriyati, N, Kumalasari W. D., Cleaner Production Strategy for Improving Environmental Performance
of Small Scale Cracker Industry, Agriculture and Agricultural Science Procedia 3/2015 p. 102 –107
Dispersionnnn
Control Pollution
Recycling
Pollution Prevention
Cleaner Production
Eco- efficiency
Industrial ecology
Sustainable Development
91

Annals of the „Constantin Brâncuşi” University of Târgu Jiu, Economy Series, Issue 3/2016
„ACADEMICA BRÂNCUŞI” PUBLISHER, ISSN 2344 – 3685/ISSN-L 1844 - 7007
[5] Zorpas, A., Environmental Management Systems as Sustainable Tools in The Way of Life for The SMEs and VSMEs. Bioresource Technology 101/2010, p. 1544-1577.
[6] ∗∗∗ www.oecd.org/sti/innovation/sustainablemanufacturing, 2009 [7] ∗∗∗ http://cleanprod.ecosv.ro
92

Annals of the „Constantin Brâncuşi” University of Târgu Jiu, Economy Series, Issue 3/2016
„ACADEMICA BRÂNCUŞI” PUBLISHER, ISSN 2344 – 3685/ISSN-L 1844 - 7007
KISCH / UL AND DURABLE DEVELOPMENT OF THE REGIONS THAT HAVE A
LARGE NUMBER OF RELIGIOUS SETTLEMENTS
ENEA CONSTANTA, ASSOCIATE PROFESSOR, UNIVERSITY OF CONSTANTIN BRANCUSI TARGU JIU, ROMANIA,
ENEA CONSTANTIN, ASSOCIATE PROFESSOR, UNIVERSITY OF CONSTANTIN BRANCUSI TARGU JIU, ROMANIA,
[email protected] Abstract
We live in a world of contemporary kitsch, a world that merges authentic and false, good taste and meets often with bad taste. This phenomenon is găseseşte everywhere: in art, in literature cheap in media productions, shows, dialogues streets, in homes, in politics, in other words, in everyday life. Ksch site came directly in tourism, being identified in all forms of tourism worldwide, but especially religious tourism, pilgrimage with unexpected success in recent years.
This paper makes an analysis of progressive evolution tourist traffic religion on the ability of the destination of religious tourism to remain competitive against all the problems, to attract visitors for their loyalty, to remain unique in terms of cultural and be a permanent balance with the environment, taking into account the environment religious phenomenon invaded Kisch, it disgraceful mixing dangerously with authentic spirituality. How trade, and rather Kisch's commercial components affect the environment, reflected in terms of religious tourism offer representatives highlighted based on a survey of major monastic ensembles in North Oltenia.
Research objectives achieved in work followed, on the one hand the contributions and effects of the high number of visitors on the regions that hold religious sites, and on the other hand weighting and effects of commercial activity carried out in or near monastic establishments, be it genuine or kisck the respective regions. The study conducted took into account the northern region of Oltenia, and where demand for tourism is predominantly oriented exclusively practicing religious tourism.
Keywords: sustainable development, religious tourism, Kisch, commercial activities Clasificare JEL : M21, Q01 1. Introduction
Globalization has resulted in a very competitive economic environment that develops very quickly, leading to
a multitude of challenges. All people, whether individuals, companies or institutions, seeking to find solutions for various sustainable competitive advantages through collaboration in various fields. In an attempt to be prepared for the present and future needs, sustainable development seeks to establish a balance between making a profit in the short and long term projections that put the spotlight environmental protection [1].
Sustainable tourism aims at achieving a balance between protection environmental, maintaining cultural integrity and promoting economic benefits [2]. With the transformation of religious tourism in an industry and extend it globally, it can become a starting point for the sustainable development of religious tourism destinations. Linked to trade, particularly represented by the sale of religious items and other souvenirs, many monastic buildings used this practice by building many souvenir shops adjacent religious objectives. The desire to earn more, many churches no longer keep religious objects sobriety and offers visitors eager for such souvenirs, anything, anytime and from any sources. Add to this the vendors that trick visitors ignorant of all sorts of objects occult counterfeit very disgraceful that “obscures” the beauty of holy places.
The economic impact is very high due to the fact that pilgrims and other passengers religious or less religious (more curiously) are avid buyers of religious souvenirs. Early humans traveled to the holy places considetare to meet with divinity. Those travelers who were motivated by religion (considered as the first form of tourism) were held without anyone to measure their economic or social [1].
In Romania motivated by religious tourism has gained momentum especially after 1990, and more significant after 2010 - 2011.
The economic contribution of this form of tourism still remains questionable. The paper identifies the role that have commercial activities were rampant in addition to religious settlements
or in their immediate vicinity, which do not preserve traditions but are transformed into Kisch sites disgraceful in
93
Annals of the „Constantin Brâncuşi” University of Târgu Jiu, Economy Series, Issue 3/2016
„ACADEMICA BRÂNCUŞI” PUBLISHER, ISSN 2344 – 3685/ISSN-L 1844 - 7007
watching of obtaining maximum revenue, both from churches, representatives monasteries and itinerant traders who take advantage of ignorance or illiteracy visitors. 2. Pilgrimages between religion, curiosity and commerce
In its authentic pilgrimage was a journey of initiatory type or revealing. Physical movement was the expression of a spiritual movement. Need to motivate inner light outer body
movements, so it became a pilgrimage complete an existential event, a profound experience of man returning transfigured.
Today, the pilgrimage tends to disappear, being replaced by religious tourism. Religious tourism is more willing to take a selfie with divinity than to be in communion with it.
The situation becomes even cloudier when “pilgrim” has no idea who visit, blocking the possibility of using spiritual ignorance. Contemporary man but not contemplate visiting, but not through an inner and outer beauty a trip through not receiving answers revealing that there has questions. În addition, as the objectives of pilgrimage multiply tends to secularize religious tourism. Some monks complain that waves of tourists alter monastic silence, while others strive to make the place more attractive, kistch the religious disgraceful mixing dangerously with authentic spirituality.
The concept of kitsch is applicable mainly phenomena aesthetic (the term comes, apparently, from the German word kitschen - doing something sloppy), but, by extension, it can be used to describe phenomena not specific, but involving mismatch, falsehood degradation [3]. The attitude of kitsch aesthetic level is comparable and has the same effects as snobbery and hypocrisy manifested morale. In direct translation “You know that morally you are vulnerable, but you like to amaze how hypocritical in the name of good”. The concept of kitsch is applicable mainly phenomena aesthetic (the term comes, apparently, from the German word kitschen - doing something sloppy), but, by extension, it can be used to describe phenomena not specific, but involving mismatch, falsehood degradation.
The attitude of kitsch aesthetic level is comparable and has the same effects as snobbery and hypocrisy manifested morale. In direct translation “You know that morally you are vulnerable, but you like to amaze how hypocritical in the name of good”. Where does the malignant potential of religious kitsch? Kitsch is generated and the desire for communication or grab as many believers [4].
Kitsch massive orthodoxy that broke the gates wide open to the world and secularization postindustrializarea canceled short-circuit if you like, just this subtle process of communication between man and divinity. “Community of Love”, already strained, is threatened [5]. Under the effect of modern art, multiplying industrial processes, lack of religious culture and traditional society death kitsch art arises. “The split between the sacred immanent transcendent divine and human religiosity is so great that no one can switch from one plan to another” [9].
How and who authorizes atrocious mutilation monasteries cheap plastic windows, trade fair called “windows” to mask the misery of a material that will age 10-15 years ugly, big teeth Smoking? How can brake invasion “lamps” red plastic, bought parish priests greedy of gain per kilogram in supermarkets, foreign objects orthodoxy in some places and threatening to remove the classic candle wax? Why encourage trade with CDs of religious music “orthodox”, which is echoed bass kept artificially unnatural of electronic organs? How is it that the overwhelming majority of churches almost no longer sell what we icons, just pieces of colored plastic or gaudy kitsch Greek gender ignition key keychain car? Accepting passion for simple believers inconsistent forms of popular religious culture and drift pietist, we wonder though: there is not even that minimal religious authority that curb the uncontrollable expansion of kitsch items sold in our churches? Would not thought none of priests and bishops responsible how to use his shepherd the faithful that those “objects” in the exercise of their spiritual and not just in mechanical performance of rituals?
Keeping traditional values protected from invasion kitsch demands modesty and humility. Religious kitsch palette is quite wide, but simplifying things, this can be reduced to four aspects: the object of kitsch, kitsch situation, act and kitsch. In all these cases, the promoters of falsehood are both representatives of clergy and believers. Kitsch object consists either of poor quality artistic achievements, lack of talent (some souvenir craft or industrial, which can be found by monasteries around icons pyrography, candles carried by fretwork, “Cristi” Gypsum, brochures popularity or prayers) or from objects arrive profane - but their subordinates forced religious symbols diverted from their goals initial (trinkets in the form of a cross, music videos having the leit motive cross, or crucifixion, postcards “Christ” making eye, etc.). Here we include a plethora of books with religious content, claiming popularization of faith, but that brings more disadvantages authentic theological culture. Observe today an overabundance of this literature (after decades of prohibition) that on behalf idea of accessibility of Christianity, slip into disuse, platitude and falsehood dogmatic inducing is a religious culture questionable (based on the presence of elements dogmatic apocryphal resorted to a stagnant tradition).
There are also situations kitsch, ie dissonant groupings of objects - valuable in itself - but do not bind to each other. Relationships are forced proximity, altered, as they are joined contrasting artistic styles or genres or incompatible value (Byzantine - style carpets "Persian" - wrought iron chandeliers or deer horns, etc.). Kitsch is generated and overuse or auten¬tice clutter objects. Measuring balance must manage the location and distribution of sacramental objects in space. Here we include uninspired architecture, or agglutination conglomeration of decorative styles distances, forbidding modernist developments of religious canons.
94

Annals of the „Constantin Brâncuşi” University of Târgu Jiu, Economy Series, Issue 3/2016
„ACADEMICA BRÂNCUŞI” PUBLISHER, ISSN 2344 – 3685/ISSN-L 1844 - 7007
We can talk and acts kitsch religious, consisting in producing and updating the reception of sacred ceremonies when (or where) is not applicable, satisfying the demands of the illicit ordination, justification symbolic of enterprise morally questionable (sanctification of supermarket, a casino, etc.). Sometimes, we can identify exploitation of servants Church (actually sacramental authority) by politicians, for very specific interests (see election campaigns, when invoking religious symbols or call suddenly to become quite suspicious of priests) [6].
At the limit, we can identify the man kitsch, the pretentious religiosity, feelings or behaviors that mimic high spiritual. Hypocrite is the man who does not believe, but the challenge diligently - sometimes aggressively - actually his condition. This type of man is more problematic than honest infidel. We also have taken into account the challenger island, in search of sophisticated forms of spirituality, true religion which substitutes with aberrant spiritual landmarks, curious, dangerous. This person can be seen most often among believers still not installed in a religious tradition, but there are cases of clergy right, very rare - giving proof of wandering, excesses visionary eccentricity. Another present aggressive kitsch appears in the space of pilgrimage, where tourism and commerce in the bathroom sink godliness, but without sacrificing commercial habits. In such conditions, t-tulle souvenir, forgetfulness antidote, specifically tourism, makes an appearance here as religious souvenir. Unfortunately, its form of manifestation differs substantially from that of its fellow tourist. Preferred are small objects that can be worn all the time in order feririi of evil forces. About forms of manifestation of “religious tourism” imagination seems to have barriers being extremely inventive in the “equip” the saints faces various objects [8].
In this regard was made even a list of products kitsch - by City Council Oberammergau town invaded souvenirs and handicraft products religious - list, which featured, among other things [5]:
1) the achievements of poor quality, devoid of talent and careful execution of any material that has nothing to do with authentic works of folk art, from painting and sculpture;
2) transposition of religious sentiment into an object arrive profane, like toys Holy Cross roller, handkerchiefs and neckties decorated with the image of the Virgin and other religious symbols diverted from their goals, which are eye Cristi etc.
West himself was compelled to admit that the existence of many valuable paintings and sculptures consecrated to Christ prevented the appearance in the last century, an art of worst quality. As such, “an ordinary commodity religious commercial character spawned these representations gang of Christ, offered so often that art. The religious sentiment did that, unfortunately, many people and even clergymen do not disprove this humiliation of art” [7].
Which did not resolve the situation, what you and some commercial side. Neither in the Orthodox world things are not better. Between pilgrimage and tourism road seems to be extremely short. The need pilgrimage of every man was noticed by those who removed money from everybody, hijacking a “fast by tourism, so Fatima or in Jerusalem, for example, the sacred is sold and bought shamelessly. Country St. can rent a cross and a crown of thorns and you can picture wearing them, or you can buy a postcard in which Jesus winks, without any tourists to outrage! There's even salami with the image of the Savior on the label after how to buy and bottles with tears Virgin or pieces generous wood of the Cross! You need a lot of fortitude to remain pilgrim in the Holy Land without makes you a tourist or something else. West sell and buy anything, while Christian East seems to keep still the spirit of genuine holiness certain places, pockets or persons. in monasteries and hermitages Romanian, for instance, monasticism there is still real, even if sometimes the monks are suspicious of unfamiliar in theology, but more skilled as babele in different pseudocanoane and pseudorugaciuni constructed formulas known only by them” [4].
It is known as one of the “diseases” of kitsch phenomenon lie. Achieving that is a true substitute product, a fake is manifested in various forms. One is the surrogate, which always defines as “product, developed on an industrial scale, meant to replace on the market, a commodity sought, without possessing however quality. When the genuine product is missing or rarely, you it offers - and sometimes you have to accept consciously failing which interest you – surrogate” [5].
The emergence surrogacy was favored industrial development, allowing nuances reproduction procedures in the table so that centuries of the nineteenth century, but especially the twentieth century, blooming especially “two types of surrogate aesthetic: copy or reproduce, from small, of a sculpture or a painting known, for instance, and the product which “brings the work of art” in general” [6]. Trade with frills products of folk art, especially “souvenirs” is customary, more integrated, especially in the tourism industry [6]. Regarding children or reproductions should be noted that, as long as they do not overcome the status of "replacement" of the real object, not treated as works of original art, “does not qualify as surrogates, but remain authentic accessories of Information cultural needed every educated man”. [7].
In this context, a problem is reproductions of famous icons, by technical means becoming more efficient, the results of which wants to imitate as closely icon that - if you can, and obsolescence occurred over time. Personally, I do not consider reproductions on paper as kitsch - Although Russian theologians declare against them - and I think that is preferably a photocopy or any other copy of an authentic icon of paintings defy any iconographic and aesthetic canons. Generally, when something is hard to get or extremely expensive, making it inaccessible to many, the question naturally the problem of finding a replacement, “prosecutor easier possessing similar qualities, at least at first” [4.
95
Annals of the „Constantin Brâncuşi” University of Târgu Jiu, Economy Series, Issue 3/2016
„ACADEMICA BRÂNCUŞI” PUBLISHER, ISSN 2344 – 3685/ISSN-L 1844 - 7007
On a superficial reading would seem that the painter would kitsch iconography lawyer phenomenon, but in fact he defends the phenomenon of industrialization, and now manifested in the iconography. It is not the happiest solution, nor recommended but, for many, is a way to have a face painted face even in orthodox traditional manner.
Architecture, painting and sculpture looking, each by means of expression specific to materialize in a formula category aesthetic ideal of beauty. A universe of beauty, meant to participate in the prayer that rises in that place. The church is not only meant to house shell construction jobs, but the entire composed her part - or should do - to divine worship that takes place there. This is the goal of ecclesiastical art, but that is often misconstrued. Kitsch “embellishing” reality, “poetizeaza”, “apparently prose of life and actually” prozaized “her poetry authentic” [3]. Kitsch scuffing conflicts suppresses way to remove them “relieve” pain without them discover the cause, covering ashamed wounds what ought healed. And it is even worse to do however as the “benevolence” and “tenderness”. "Pseudo-beauty” [4]. Etal has no way to allay thirst after the beautiful authentic. Remain always alive and insatiable desire to see, partly after each power, the beauty of the eighth day.
Between the beautiful artistic aspiration, specific human nature and longing for the beauty of the former, there is an interplay more enduring than it might seem at first glance. In fact, it can not operate a separation between the spiritual and artistic beauty. The road to the kingdom of heaven always pass only through the church, the living icon of the unseen beauty. There is only one path to another, and it never occurred to the “realm of kitsch”. Imperceptibly, religious kitsch turns into an "aesthetic system of communication" mass, as Abraham Moles said. The crowd begins to speak a new language, the language of kitsch. It is very evident in this presentation that makes the great pilgrimage media in Romania (Nicula Monastery, Iasi, Bucharest, Prislop). Communication pilgrimage is mainly based on emotion rough handling. Or religious emotion glass does not pass, the depth of the human soul should not be disturbed. But perfectly suited to handling large assemblies excitement surrounds collective human kind. From transmitter religious message, the media became producer of message.
The result on the ground among pilgrims, is catastrophic. Many of them dress kitsch, kitsch worship, religious kitsch speak a language just because “I saw it on TV”. What is the price in the end? Kitsch “Christian” (with quotation marks required!) Is the best indication of a colossal loss of fundamental theological substance created and settled over time and can no longer be so easily replaced once destroyed [6]. “Icons” representing Christa crowned with thorns, Weeping on the embroidery sheet, and Madonna pathetic and voluptuous wringing his desperate hands on to heaven, totally alien to the spirit of Orthodoxy, not for long now "salt of the earth" in the eyes of those few who wish to he knows what's really happening. To be sure: we do not want to mix theology with the aesthetic exercise, easy moralizing! In fact, any attempt to write about kitsch requires this necessary clarification. On the one hand, atheists or those who simply have very little information about theology (and the great mass of Orthodox believers not excel in the field due to lack of minimum catechesis) can not notice what this loss of theological substance. Nor enormous distance that exists between genuine religious art and sacred place of installation scorched sustainable kitsch. On the other hand, a significant part of the faithful and priests living in a cheerful ignorance of kitsch, not to say that it encourages directly. They stood, paradoxically, precisely against those who dispute bath kitsch which they have become accustomed. At one point, kitsch becomes a form of power, its various forms of expression malignant goes to interconnect with each other. Trapped in this terrible fabric, any appeal against the order of religious art kitsch interpreted by “administrators in the sacred” as a personal offense, sad famous “pride in cassock” react promptly in such cases [4]. I invite you to experience: enter an Orthodox church where there are “icons” made in China (will not be hard to find, unfortunately) and claim altar servant canonical inadequacy of the object. Do not be afraid response and how it will be provided. You will be regarded as a “heretic” (with quotation marks needed), a provocative, an “enemy of the faith”, as qualified by these lines some time ago by the parish priest of the parish of Transylvania. It studded inside one of the oldest churches in Romania with icons spotted by a deadly tasteless. My remark about the inadequacy of abode outside and inside it was really ticked. Again, just having protest will exercise better understand the seriousness of the facts [4].
Religious memory has a distinctive feature: it preserves the past, but it reconstructs based on religious objects, rituals, traditions, etc., and using “data”. Recent psychological and social, are obliged constantly to “compose this”. A frame memory and weakened by the assault impregnated religious kitsch will send in turn, diminished memory, the permanence and the need to preserve itself unaltered the original message are put to the test. What transmit to our descendants in November? Kitsch massive orthodoxy that broke the gates wide open to the world and secularization postindustrializarea canceled short-circuit if you like, just this subtle process of communication between man and divinity. “Community of Love”, already strained, is threatened. Under the effect of modern art, multiplying industrial processes, lack of religious culture and traditional society death kitsch art arises. “The split between the sacred immanent transcendent divine and human religiosity is so great that no one can switch from one plan to another” [9].
We did not want any time to do inventory forms of kitsch blooming in contemporary Romanian Orthodoxy; It would be too easy and is not the purpose of these lines. But we can not afford not to raise certain questions. How and who authorizes atrocious mutilation monasteries cheap plastic windows, trade fair called “windows” to mask the misery of a material that will age 10-15 years ugly, big teeth Smoking? How can brake invasion “lamps” red plastic, bought parish priests greedy of gain per kilogram in supermarkets, foreign objects orthodoxy in some places and threatening to remove the classic candle wax? Why encourage trade with CDs of religious music “orthodox”, which is
96

Annals of the „Constantin Brâncuşi” University of Târgu Jiu, Economy Series, Issue 3/2016
„ACADEMICA BRÂNCUŞI” PUBLISHER, ISSN 2344 – 3685/ISSN-L 1844 - 7007
echoed bass kept artificially unnatural of electronic organs? How is it that the overwhelming majority of churches almost no longer sell what we icon, just pieces of colored plastic or gaudy kitsch Greek gender ignition key keychain car? Accepting passion for simple believery inconsistent forms of popular religious culture and drift pietist, we wonder though: there is not even that minimal religious authority that curb the uncontrollable expansion of kitsch items sold in our churches? Would not thought none of priests and bishops responsible how to use his shepherd the faithful that those “objects” in the exercise of their spiritual and not just in mechanical performance of rituals? Keeping traditional values protected from invasion kitsch demands modesty and humility.
We can fight against religious kitsch? In daily life needs to be rediscovered authenticity of religious experience, and in the religious rediscovery of the essentials of life. The crisis is double aesthetic and religious, must answer these two directions oriented (Ch. Yannaras). Coming out of the ivory tower of religious essays, recipes but no anti-kitsch. Object “battle” (the word is imperfect) anti-kitsch it should not form its forms of expression, which anyway have multiplied to infinity, escaping any attempt to control, but the conditions of its production.
3. Conclusions
In 2005, the World Tourism Organization together with the UN Environment Programme published a guide called "Making Tourism more Sustainable" that can be applied globally and focuses around 12 principles that should respect sustainable tourism: economic viability, local prosperity, quality of employment, social equity, visitor satisfaction, local control, community welfare, cultural richness, physical integrity, biodiversity, resource efficiency and environmental purity.
This paper makes an analysis of progressive evolution tourist traffic religion on the ability of the destination of religious tourism to remain competitive against all the problems, to attract visitors for their loyalty, to remain unique in terms of cultural and be a permanent balance with the environment, taking into account the environment religious phenomenon invaded Kisch, it disgraceful mixing dangerously with authentic spirituality. Assessing the number of visitors benefit religious establishments predicted that economic aid through donations or sponsorships are the main source of revenue caused by these visitors, followed by supporting the spiritual mission of the monastery.
The views of the monasteries on the commercial side benefits are based on a combination side happy between economic and spiritual side of monasteries.
In conclusion, respecting religious significance of the place, avoiding excessive commercialization of religious objects, care for the environment and the host community can achieve a balance between the needs and expectations of the parties involved in religious tourism, tourism offer specific is ready and willing to be an integral part of sustainable development.
4. Bibliography
[1] Bressers, H.T., Implementing sustainable development: know to know what work, where, when and kow, in W.M. Laffery (ed) Governance for Sustainable Dewvelopment: the Challenge of Adapting Form to Funtion, EdwRD Elgar> Northampton, pp.284-318, 2004 [2] Carroll, B, Sustainable development: an elective view, CIWEM International Directory, Cameron Publishing, London, 2003. [3] Stanciulescu, G, The implications of the monastic commercial activity as a way to support sustainable development in religious tourism in Romania. Magazine contribution to the sustainable development of commercial activity, vol XII, no. 27, pp.130-146, 2010 [4] Dale, A, At the Edge: Sustainable Development in the 21st Century, University of British Columbia Press, Vancouver, 2001. [5] Jackowski, A & Smith, V.L, Polish pilgrim – tourists, Annals of Tourism Research, vol.19(1), pp.92-106, 1992 [6] Jayawardena, C, Patterson, D.J. Choi, C. & Brian, R, Sustainable tourism development in Niagara, International Journal of Contemporary Hospitality Management, vol.20(3), pp.258/277, 2008 [7] Mowforth, A.S. & Munt, I, Tourism & Sustainability: New Tourism in the Third World, Routlege, London, 1998; [8] Rinschede, G, Form of religious, Annals of Tourism Research, vol 19(1), pp.51-67,1992 [9] Evdochinov, P, Iubirea nebuna a lui Dumnezeu, Ed. Sophia, pp. 121-126, 2013, [10] ∗∗∗ WTO, UNEP, Making Tourism More Sustainable, A Guide for Policy Markets, Paris, Madrid, pp.209, 2005
97

Annals of the „Constantin Brâncuşi” University of Târgu Jiu, Economy Series, Issue 3/2016
„ACADEMICA BRÂNCUŞI” PUBLISHER, ISSN 2344 – 3685/ISSN-L 1844 - 7007
IMPROVING PERFORMANCES BY USING COST CONTROLLING IN THE MINING INDUSTRY ENTITIES
SORINEL CĂPUŞNEANU
SENIOR LECTURER, PHD, “DIMITRIE CANTEMIR” CHRISTIAN UNIVERSITY, BUCHAREST, ROMANIA,
E-mail: [email protected]
DAN IOAN TOPOR LECTURER, PHD, HYPERION UNIVERSITY, BUCHAREST, ROMANIA,
E-mail: [email protected]
ILEANA – SORINA RAKOS ASISSTANT PROFESSOR, PHD, UNIVERSITY OF PETROŞANI, PETROŞANI, ROMANIA,
E-mail: [email protected]
CORINA DUCU LECTURER, PHD, CONSTANTIN BRANCOVEANU UNIVERSITY, PITESTI, ROMANIA,
E-mail: [email protected]
ANAMARIA TEPEŞ-BOBESCU 1 DECEMBRIE 1918 UNIVERSITY, ALBA-IULIA, ROMANIA,
E-mail: [email protected]
Abstract The aim of this article is to highlight the improving performances of entities from mining industry entities by using cost controlling as an important tool of management accounting, applying the target costing method. The survey is based on questions that led investigation made in the Romanian entities from mining industry and based on data a thorough analysis was done for fulfillment of authors’ purpose. The results obtained by applying the target costing method has allowed a very strict cost control, which ultimately led to increased performances of economic entities from mining industry in Romania. The secondary purpose of this article is to try adjusting the target costing method to the specific of entities in the mining industry. According to studies of specialists this method based on target costing calculation is rather unusual in this sector of mining industry and it relies heavily on the activity-based costing method. The article ends with the authors' conclusions on improving the performances of entities from mining industry based on cost controlling and use of mix information obtained through the applied methods. Keywords: Controlling, target costing, performance, mining industry, sustainable development Classification JEL: M41 1. Introduction and context of the study
As result of globalization, the economic entities in the extractive industry in Romania are subjected today, more
than ever, under pressure due to the economic downturn and increasing sustainability requirements. Thus, the economic entities began to change the manufacturing systems through the wider use of modern manufacturing technologies. Under a successful competitive economic climate, information on costs and their management have become essential for the management of economic entities, as well as the entire national economy. Wishing continuous improvement of performance entities, managers try alongside accountants’ specialists or controllers to find those methods that guarantee achieving performance in the short or long term. Established at the request of top management, the analysis committee of an economic entity will consider those proposals carefully checked and documented by accountants specialists and controllers, and on this basis will prepare a synthesized analysis report indicating the most effective solutions identified. In conducting this article were taken into account two lines of research that forms its purpose, namely: (1) an attempt to adapt the target costing calculation method to the specific of entities in the mining industry in Romania and (2) highlighting performance improvement of economic entities from mining industry through controlling using as instrument target costing method.
98
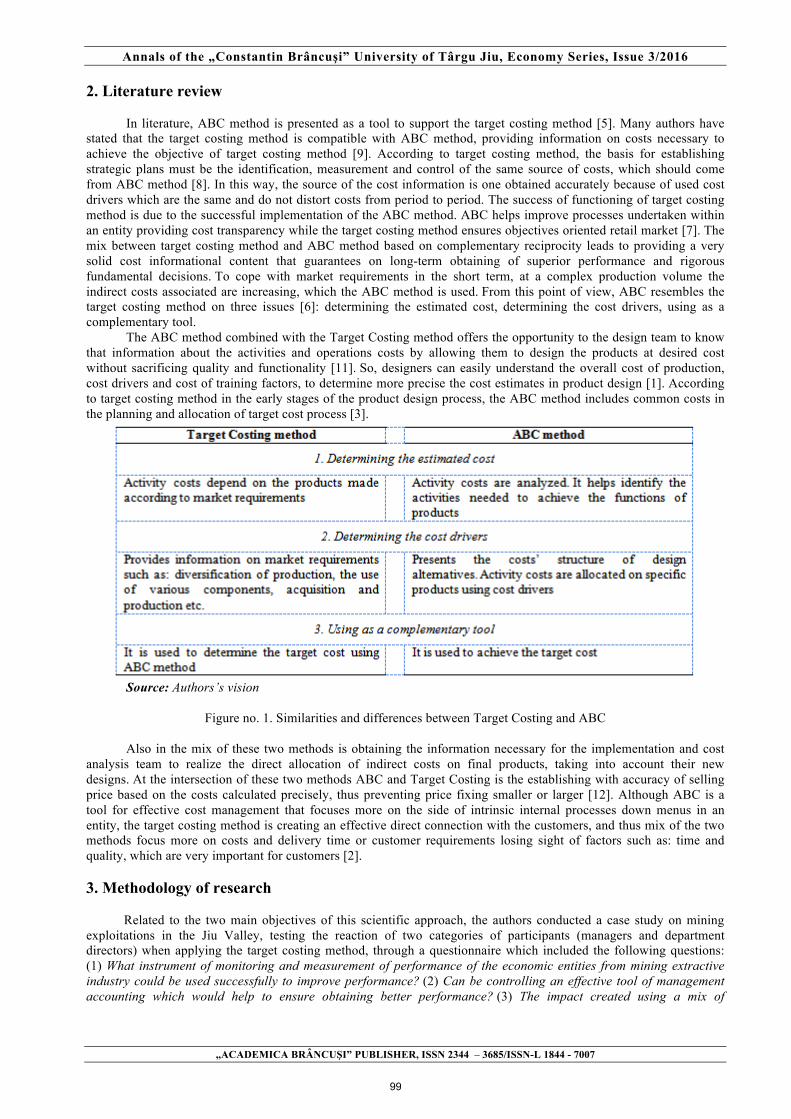
Annals of the „Constantin Brâncuşi” University of Târgu Jiu, Economy Series, Issue 3/2016
„ACADEMICA BRÂNCUŞI” PUBLISHER, ISSN 2344 – 3685/ISSN-L 1844 - 7007
2. Literature review
In literature, ABC method is presented as a tool to support the target costing method [5]. Many authors have stated that the target costing method is compatible with ABC method, providing information on costs necessary to achieve the objective of target costing method [9]. According to target costing method, the basis for establishing strategic plans must be the identification, measurement and control of the same source of costs, which should come from ABC method [8]. In this way, the source of the cost information is one obtained accurately because of used cost drivers which are the same and do not distort costs from period to period. The success of functioning of target costing method is due to the successful implementation of the ABC method. ABC helps improve processes undertaken within an entity providing cost transparency while the target costing method ensures objectives oriented retail market [7]. The mix between target costing method and ABC method based on complementary reciprocity leads to providing a very solid cost informational content that guarantees on long-term obtaining of superior performance and rigorous fundamental decisions. To cope with market requirements in the short term, at a complex production volume the indirect costs associated are increasing, which the ABC method is used. From this point of view, ABC resembles the target costing method on three issues [6]: determining the estimated cost, determining the cost drivers, using as a complementary tool.
The ABC method combined with the Target Costing method offers the opportunity to the design team to know that information about the activities and operations costs by allowing them to design the products at desired cost without sacrificing quality and functionality [11]. So, designers can easily understand the overall cost of production, cost drivers and cost of training factors, to determine more precise the cost estimates in product design [1]. According to target costing method in the early stages of the product design process, the ABC method includes common costs in the planning and allocation of target cost process [3].
Source: Authors’s vision
Figure no. 1. Similarities and differences between Target Costing and ABC
Also in the mix of these two methods is obtaining the information necessary for the implementation and cost
analysis team to realize the direct allocation of indirect costs on final products, taking into account their new designs. At the intersection of these two methods ABC and Target Costing is the establishing with accuracy of selling price based on the costs calculated precisely, thus preventing price fixing smaller or larger [12]. Although ABC is a tool for effective cost management that focuses more on the side of intrinsic internal processes down menus in an entity, the target costing method is creating an effective direct connection with the customers, and thus mix of the two methods focus more on costs and delivery time or customer requirements losing sight of factors such as: time and quality, which are very important for customers [2]. 3. Methodology of research
Related to the two main objectives of this scientific approach, the authors conducted a case study on mining
exploitations in the Jiu Valley, testing the reaction of two categories of participants (managers and department directors) when applying the target costing method, through a questionnaire which included the following questions: (1) What instrument of monitoring and measurement of performance of the economic entities from mining extractive industry could be used successfully to improve performance? (2) Can be controlling an effective tool of management accounting which would help to ensure obtaining better performance? (3) The impact created using a mix of
99

Annals of the „Constantin Brâncuşi” University of Târgu Jiu, Economy Series, Issue 3/2016
„ACADEMICA BRÂNCUŞI” PUBLISHER, ISSN 2344 – 3685/ISSN-L 1844 - 7007
management accounting methods has effect on the growth on informational content of costs and default on economic entities on the growth performance of mining extractive industry?
In the study were taken into account and other techniques and research procedures such as: reviewing the literature, the use of diverse information sources (discussion, observation, interview), data collection and data processing, synthesizing of theoretical aspects and research results.
Table no. 1. Categories of respondents and their answers
Source: Developed by authors
Having analyzed the questionnaires, the analysis team concluded that the simplest, most viable and most
efficient cost calculation method able to help the company under these market conditions would be the target costs method, as it relies on low costs and time, while the price-profit-cost analysis and the sustainable development indicators are tools guaranteeing the obtaining of performances by these entities. At the same time, the ABC-Target-costing method mix contributes to an increase of the informational contribution of the costs necessary to the mining industry companies' leadership for making efficient decisions. This contribution is due to the fact that they practice a very efficient administration control, which guarantees the increase of their performances.
4. SWOT analysis
Based on the data provided by the economic entities of Jiului Valley, a SWOT analysis has been elaborated, which is presented in Table no. 2 and has been at the basis of the use of the ABC-TC method mix for the increase of their performances.
Table no. 2. SWOT analysis
SWOT analysis Strenghts Weaknesses
- situation in the only zone of pit coal exploitation of Romania; - concentration of the mining activity in a relatively limited area; - geological reserves for more than 20 years; - situation near the two main pit coal beneficiaries, namely the power plants of Mintia and Paroşeni; - the mining activity takes place only in the underground; - modern and high-performance technologies applied in a production sector.
- lean coal and high content of dust and sulphur of the coal extracted; - little experience of activity in an environment based on competition; - low productivity, at a level not accepted by the international standards; - quite precarious technical endowment, with a high degree of physical and moral wear; - relatively high number of employees compared to the quantity of products achieved and the quality of the products obtained; - conserving the production capacity means very high costs, hard to bear under the present financial conditions of the National Pit Coal Company (CNH).
Opportunities Threats
100

Annals of the „Constantin Brâncuşi” University of Târgu Jiu, Economy Series, Issue 3/2016
„ACADEMICA BRÂNCUŞI” PUBLISHER, ISSN 2344 – 3685/ISSN-L 1844 - 7007
- increased productivity and reduction of costs by the concentration of the activity in consistent faults; - the increase of the electrical power price makes it possible to increase the Gcal price paid to the coal providers; - continuation of the investment programme for introducing new technologies and modernization; - investigating the possibilities of catching / profitably using the pit gas emissions from the deposits under exploitation; - continuation of the process of concentration of the production capacity in strata with coal biogas in considerable coal faults; - the present world economic situation generated by the power crisis makes it possible to develop the electrical power production based on coal and implicitly develop the pit coal production; - the growth of the production volume, corroborated to the reduction of the number of personnel, is leading to lower costs per ton of pit coal and implicitly to an increased production efficiency.
- the probability that the most important pit coal consumer of Romania – the power plant of Mintia – might replace the pit coal of Jiului Valley by imported pit coal or turn to the use of natural gas as fuel; - repeated delays in the updating of the coal price according to the inflation, which has led to a very low sale price for pit coal; - the social impact, on the level of the local community, of the high number of layoffs; - high risk of occurence of major mining accidents, with impact on the production capacity and the functioning of the exploitation; - great sensitivity to the outbreak of work conflicts with concentration of large masses of workers, in a short while.
Source: elaborated by the authors 5. The use of the ABC-TC mix
Based on the general functioning scheme of the two methods in their combined variant (Figure no. 2) by which we identified the complementary role of these methods for each other, we moved on to the concentration of the data for the case study.
Source: The authors’ design for the variant of the ABC-TC mix
Figure no. 2. Use of the ABC-TC mix
To take into account the market price, namely 285 lei/ton of coal, the economic entity has set itself the target profit margin of 9.377% of the price of a ton of coal:
9.377% x 285 lei/ton of coal = 26.725 lei target profit margin/ton of coal
The target cost is determined by external market factors, the SWOT analysis offering a good understanding and determination of the cost inductors for an economic entity of the mining industry. Treated as an approach of the management of the mining entity, the target cost relies on the rule according to which the market, not the costs of the economic entity dictates the sale price. Consequently, the formula according to which we calculate the target cost is:
285 lei sale price – 26.725 lei target profit margin = 258.275 lei target cost
101

Annals of the „Constantin Brâncuşi” University of Târgu Jiu, Economy Series, Issue 3/2016
„ACADEMICA BRÂNCUŞI” PUBLISHER, ISSN 2344 – 3685/ISSN-L 1844 - 7007
Consequently, the team analyzing the costs moved on to the identification of the processes and activities generating costs, to be able to remain within the limits of the target cost established. The economic entity under analysis is made up of three main production sectors and 4 secondary production sectors and the direct and indirect costs (on activities) identified are presented in Tables no. 3, 4 and 5.
Table no. 3. Direct expenses statement
Explanations Production Sector 2 (lei)
Production Sector 3 (lei)
Production Sector 4 (lei)
Costs on activities (lei)
Expenses on direct materials Explosives 21162 19033 24254 64449.00 Armatures, clamps 14712 4237 14021 32970.00 Basketry 36145 32508 153111 221764.00 Wood 16714 15033 19877,3 51624.30 Prefabricated blocks 699.67 900 1700 3299.67 Ballast sand 120 213 229,96 562.96 Various materials 73061 65760 226153 364974.00 Fuel 3023 2719.07 6055 11797.07 Spare parts 20962 33336 45412 99710.00 Consumables 3007 1803 5317 10127.00 Total expenses on direct materials 189605.67 175542.07 496130.26 861278.00
Direct salary expenses Expenses on salaries 595324 604926 1090058 2290308.00
Other direct expenses Electricity 20779 18687 71260 110726.00 Water 522 570 1547.57 2639.57 Amortization 145193 130583 457224 733000.00 Inventory objects 828 744 2606.45 4178.45 GFR 106210.95 95523.74 334465.31 53620000 Packaging 46 54 153.01 253.01 Transport of materials 7636.29 6873.19 23638.34 38147.82 Total direct expenses 1358525.91 1330600.00 3012442.94 5701568.85 Source: processing of the data collected from E.M.Lupeni
Table no. 4. Indirect expenses statement (on activities)
Explanations
Sector 5: ground
transport
Sector 6: ground electromechanic
Sector 7: ground airing
Sector 5: underground
transport
Sector 6 underground
electromechanic
Sector 7 underground
airing
Costs on activities
lei Various materials 0.00 0.00 0.00 2043.00 1831.00 0.00 3874.00 Fuel 2987.00 478.00 0.00 0.00 0.00 0.00 3465.00 Spare parts 0.00 19584.26 0.00 0.00 0.00 0.00 19584.26 Electricity 465297.85 278322.00 0.00 561.00 191259.00 0.00 935439.85 Thermal energy 7788.00 21272.00 0.00 0.00 0.00 0.00 29060.00 Amortization 0.00 3904.00 0.00 26707.00 17770.24 3252.00 51633.24 Transport 0.00 0.00 0.00 237.00 16800 0.00 405.00 Equipment repairs 0.00 0.00 0.00 29491.76 0.00 0.00 29491.76 Services to third parties 0.00 0.00 0.00 25580.14 525609.74 0.00 551189.88 Antidote liquids 0.00 0.00 0.00 175.38 0.00 0.00 175.38 Salaries 242500.00 310000.00 25000.00 264000.00 600000.00 369000.00 1810500.00 Accessories to salaries 67980.00 86902.00 7.008.00 298896.00 183821.00 131514.00 776121.00 Total Indirect expenses (lei) 786552.85 720462.26 32008.00 647691.28 1520458.98 503766.00 4210939.37
Source: processing of the data collected from E.M.Lupeni
Table no. 5. Collection of administrative and supplies expenses (on activities)
Administrative activities Total (lei) - Remuneration 480765.00 - Management of immobilizations 155252.52 - Material stocks management 7251.50 - Drafting of cost calculations 63.00 - Inventory of patrimony 136600.00 - Calculation of result 1208.78 - Checking up costs 34521.00
102
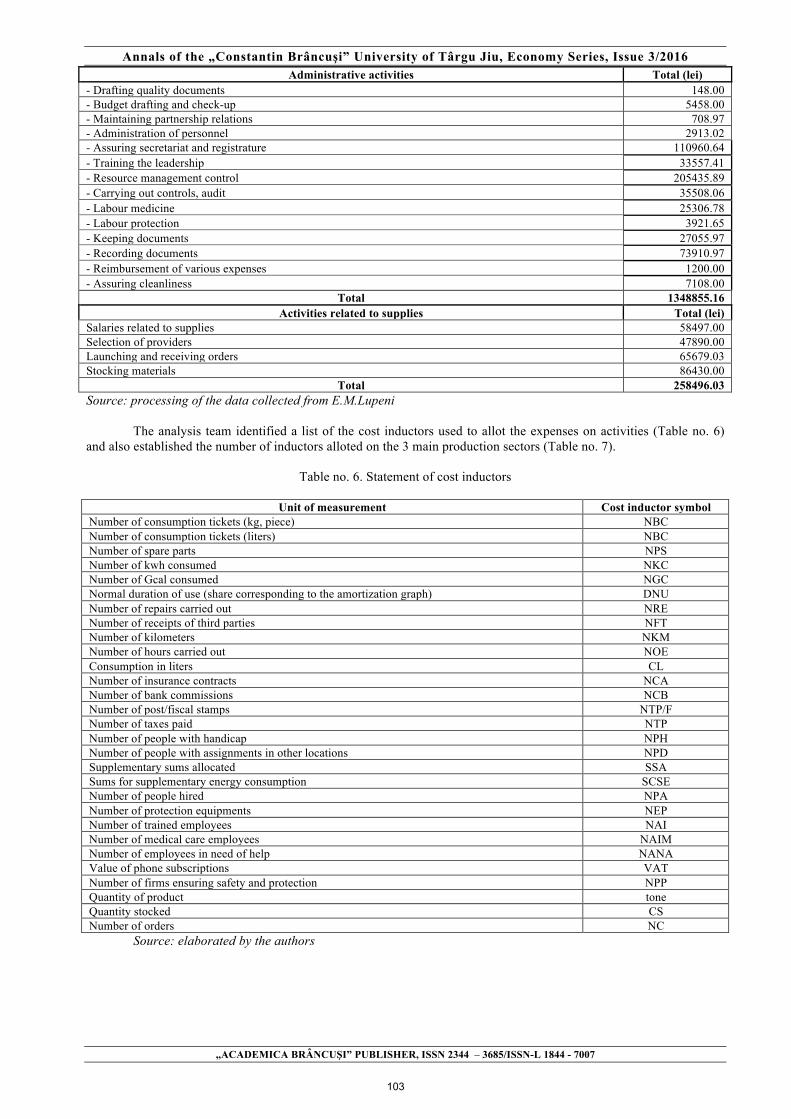
Annals of the „Constantin Brâncuşi” University of Târgu Jiu, Economy Series, Issue 3/2016
„ACADEMICA BRÂNCUŞI” PUBLISHER, ISSN 2344 – 3685/ISSN-L 1844 - 7007
Administrative activities Total (lei) - Drafting quality documents 148.00 - Budget drafting and check-up 5458.00 - Maintaining partnership relations 708.97 - Administration of personnel 2913.02 - Assuring secretariat and registrature 110960.64 - Training the leadership 33557.41 - Resource management control 205435.89 - Carrying out controls, audit 35508.06 - Labour medicine 25306.78 - Labour protection 3921.65 - Keeping documents 27055.97 - Recording documents 73910.97 - Reimbursement of various expenses 1200.00 - Assuring cleanliness 7108.00
Total 1348855.16 Activities related to supplies Total (lei)
Salaries related to supplies 58497.00 Selection of providers 47890.00 Launching and receiving orders 65679.03 Stocking materials 86430.00
Total 258496.03 Source: processing of the data collected from E.M.Lupeni
The analysis team identified a list of the cost inductors used to allot the expenses on activities (Table no. 6) and also established the number of inductors alloted on the 3 main production sectors (Table no. 7).
Table no. 6. Statement of cost inductors
Unit of measurement Cost inductor symbol
Number of consumption tickets (kg, piece) NBC Number of consumption tickets (liters) NBC Number of spare parts NPS Number of kwh consumed NKC Number of Gcal consumed NGC Normal duration of use (share corresponding to the amortization graph) DNU Number of repairs carried out NRE Number of receipts of third parties NFT Number of kilometers NKM Number of hours carried out NOE Consumption in liters CL Number of insurance contracts NCA Number of bank commissions NCB Number of post/fiscal stamps NTP/F Number of taxes paid NTP Number of people with handicap NPH Number of people with assignments in other locations NPD Supplementary sums allocated SSA Sums for supplementary energy consumption SCSE Number of people hired NPA Number of protection equipments NEP Number of trained employees NAI Number of medical care employees NAIM Number of employees in need of help NANA Value of phone subscriptions VAT Number of firms ensuring safety and protection NPP Quantity of product tone Quantity stocked CS Number of orders NC
Source: elaborated by the authors
103
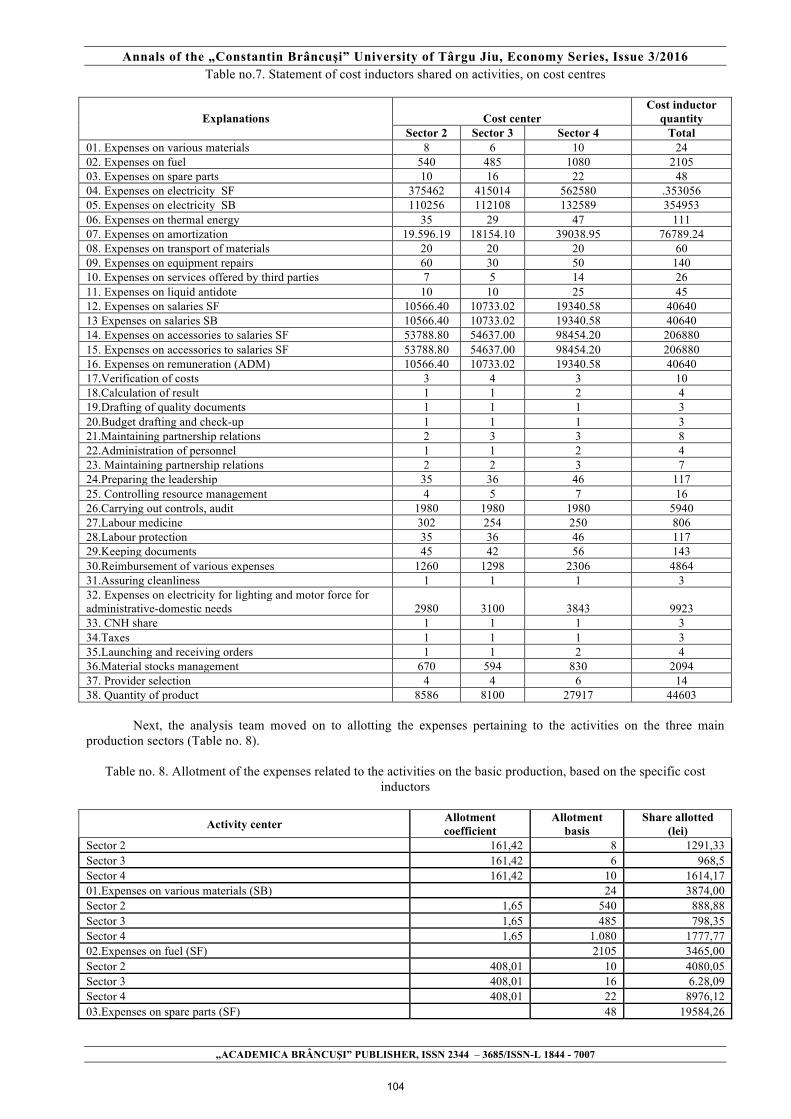
Annals of the „Constantin Brâncuşi” University of Târgu Jiu, Economy Series, Issue 3/2016
„ACADEMICA BRÂNCUŞI” PUBLISHER, ISSN 2344 – 3685/ISSN-L 1844 - 7007
Table no.7. Statement of cost inductors shared on activities, on cost centres
Explanations
Cost center
Cost inductor quantity
Sector 2 Sector 3 Sector 4 Total 01. Expenses on various materials 8 6 10 24 02. Expenses on fuel 540 485 1080 2105 03. Expenses on spare parts 10 16 22 48 04. Expenses on electricity SF 375462 415014 562580 .353056 05. Expenses on electricity SB 110256 112108 132589 354953 06. Expenses on thermal energy 35 29 47 111 07. Expenses on amortization 19.596.19 18154.10 39038.95 76789.24 08. Expenses on transport of materials 20 20 20 60 09. Expenses on equipment repairs 60 30 50 140 10. Expenses on services offered by third parties 7 5 14 26 11. Expenses on liquid antidote 10 10 25 45 12. Expenses on salaries SF 10566.40 10733.02 19340.58 40640 13 Expenses on salaries SB 10566.40 10733.02 19340.58 40640 14. Expenses on accessories to salaries SF 53788.80 54637.00 98454.20 206880 15. Expenses on accessories to salaries SF 53788.80 54637.00 98454.20 206880 16. Expenses on remuneration (ADM) 10566.40 10733.02 19340.58 40640 17.Verification of costs 3 4 3 10 18.Calculation of result 1 1 2 4 19.Drafting of quality documents 1 1 1 3 20.Budget drafting and check-up 1 1 1 3 21.Maintaining partnership relations 2 3 3 8 22.Administration of personnel 1 1 2 4 23. Maintaining partnership relations 2 2 3 7 24.Preparing the leadership 35 36 46 117 25. Controlling resource management 4 5 7 16 26.Carrying out controls, audit 1980 1980 1980 5940 27.Labour medicine 302 254 250 806 28.Labour protection 35 36 46 117 29.Keeping documents 45 42 56 143 30.Reimbursement of various expenses 1260 1298 2306 4864 31.Assuring cleanliness 1 1 1 3 32. Expenses on electricity for lighting and motor force for administrative-domestic needs
2980
3100
3843
9923
33. CNH share 1 1 1 3 34.Taxes 1 1 1 3 35.Launching and receiving orders 1 1 2 4 36.Material stocks management 670 594 830 2094 37. Provider selection 4 4 6 14 38. Quantity of product 8586 8100 27917 44603
Next, the analysis team moved on to allotting the expenses pertaining to the activities on the three main production sectors (Table no. 8).
Table no. 8. Allotment of the expenses related to the activities on the basic production, based on the specific cost
inductors
Activity center Allotment coefficient
Allotment basis
Share allotted (lei)
Sector 2 161,42 8 1291,33 Sector 3 161,42 6 968,5 Sector 4 161,42 10 1614,17 01.Expenses on various materials (SB) 24 3874,00 Sector 2 1,65 540 888,88 Sector 3 1,65 485 798,35 Sector 4 1,65 1.080 1777,77 02.Expenses on fuel (SF) 2105 3465,00 Sector 2 408,01 10 4080,05 Sector 3 408,01 16 6.28,09 Sector 4 408,01 22 8976,12 03.Expenses on spare parts (SF) 48 19584,26
104

Annals of the „Constantin Brâncuşi” University of Târgu Jiu, Economy Series, Issue 3/2016
„ACADEMICA BRÂNCUŞI” PUBLISHER, ISSN 2344 – 3685/ISSN-L 1844 - 7007
Sector 2 0,55 375462 206.48,44 Sector 3 0,55 415014 228085,64 Sector 4 0,55 562580 309185,77 04.Expenses on electricity (SF) 1.353.056 743619,85 Sector 2 0,54 110.256 59583,40 Sector 3 0,54 112.108 60584,24 Sector 4 0,54 132.589 71652,37 05.Expenses on electricity (SB) 354.953 191820,00 Sector 2 261,80 35 9163,06 Sector 3 261,80 29 7592,25 Sector 4 261,80 47 12304,68 06.Expenses on thermal power 111 29060,00 Sector 2 0,67 19.596,19 13176,52 Sector 3 0,67 18.154,10 12206,85 Sector 4 0,67 39.038,95 26249,87 07. Expenses on amortization related to auxiliary and main sections
76.789,24 51633,24
Sector 2 6,75 20 135 Sector 3 6,75 20 135 Sector 4 6,75 20 135 08. Expenses on transport of materials 60 405 Sector 2 210,66 60 12639,33 Sector 3 210,66 30 6319,66 Sector 4 210,66 50 10532,77 09.Expenses on equipment repairs SB 140 29491,76 Sector 2 21.199,61 7 148397,28 Sector 3 21.199,61 5 105998,05 Sector 4 21.199,61 14 296794,55 10. Expenses on services offered by third parties (SB) 26 551189,88 Sector 2 3,9 10 38,97 Sector 3 3,9 10 38,97 Sector 4 3,9 25 97,43 11. Expenses on antidote liquids of the auxiliary section (SB) 45 175,38 Sector 2 14,21 10.566 150150,00 Sector 3 14,21 10.733 152517,75 Sector 4 14,21 19.341 274832,25 12.Expenses on salaries (SF) 40.640 577500,00 Sector 2 30,34 10.566 320580,00 Sector 3 30,34 10.733 325635,25 Sector 4 30,34 19.341 586784,75 13.Expenses on salaries (SB) 40.640 1233000,00 Sector 2 0,78 53.789 42091,40 Sector 3 0,78 54.637 42755,14 Sector 4 0,78 98.454 77043,46 14.Expenses on accessories to salaries (SF) 206.880 161890,00 Sector 2 2,97 53.789 159700,06 Sector 3 2,97 54.637 162218,38 Sector 4 2,97 98.454 292312,56 15.Expenses on accessories to salaries (SB) 206.880 614231,00 Sector 2 11,83 10.566,40 124998,90 Sector 3 11,83 10.733,02 126969,99 Sector 4 11,83 19.340,58 228796,11 16.Expenses on remuneration (ADM) 40.640 480765,00 Sector 2 38813,13 1 38813,13 Sector 3 38813,13 1 38813,13 Sector 4 38813,13 2 77626,26 17 Management of immobilizations 4 155252,52 Sector 2 1208,58 1 1208,58 Sector 3 1208,58 2 2417,17 Sector 4 1208,58 3 3625,75 18 Management of stocks of materials 6 7251,50 Sector 2 15,75 1 15,75 Sector 3 15,75 1 15,75
105

Annals of the „Constantin Brâncuşi” University of Târgu Jiu, Economy Series, Issue 3/2016
„ACADEMICA BRÂNCUŞI” PUBLISHER, ISSN 2344 – 3685/ISSN-L 1844 - 7007
Sector 4 15,75 2 31,50 19. Drafting of cost calculation 4 63,00 Sector 2 15177,8 3 45.533,33 Sector 3 15177,8 3 45.533,33 Sector 4 15177,8 3 45.533,33 20. Inventory of patrimony 9 136.600,00 Sector 2 302,2 1 483,51 Sector 3 302,2 1 241,76 Sector 4 302,2 2 483,51 21.Calculation of result 4 1208,78 Sector 2 3.452,10 3 10.356,30 Sector 3 3.452,10 4 13808,40 Sector 4 3.452,10 3 10356,30 22.Verification of costs 10 34521,00 Sector 2 49,33 1 49,33 Sector 3 49,33 1 49,33 Sector 4 49,33 1 49,33 23.Drafting of quality documents 3 148,00 Sector 2 1819,33 1 1819,33 Sector 3 1819,33 1 1819,33 Sector 4 1819,33 1 1819,33 24.Budget drafting and check-up 3 5458,00 Sector 2 88,62 2 177,24 Sector 3 88,62 3 265,86 Sector 4 88,62 3 265,86 25.Maintaining partnership relations 8 708.97 Sector 2 728.26 1 728.26 Sector 3 728.26 1 728.26 Sector 4 728.26 2 1456.51 26.Personnel administration 4 2913.02 Sector 2 15.851.52 2 31703.04 Sector 3 15.851.52 2 31703.04 Sector 4 15.851.52 3 47554.56 27.Assuring secretariat and registrature 7 110960.64 Sector 2 286.82 35 10038.54 Sector 3 286.82 36 10325.36 Sector 4 286.82 46 13193.51 28.Preparing the leadership 117 33557.41 Sector 2 12839.74 4 51358.97 Sector 3 12839.74 5 64198.72 Sector 4 12839.74 7 89878.20 29. Resource management control 16 205435.89 Sector 2 5.98 1980 11836.02 Sector 3 5.98 1980 11836.02 Sector 4 5.98 1980 11836.02 30.Carrying out controls, audit 5940 35508.06 Sector 2 31.4 302 9482.19 Sector 3 31.4 254 7975.09 Sector 4 31.4 250 7849.50 31.Labour medicine 806 25306.78 Sector 2 33.52 35 1173.14 Sector 3 33.52 36 1206.66 Sector 4 33.52 46 1541.85 32.Labour protection 117 3921.65 Sector 2 189.2 45 8514.12 Sector 3 189.2 42 7946.51 Sector 4 189.2 56 10595.34 33.Keeping documents 143 27055.97 Sector 2 10558.71 2 2111742 Sector 3 10558.71 2 21117.42 Sector 4 10558.71 2 21117.42 34.Recording documents 6 63352.26 Sector 2 0,25 1260 310.86
106
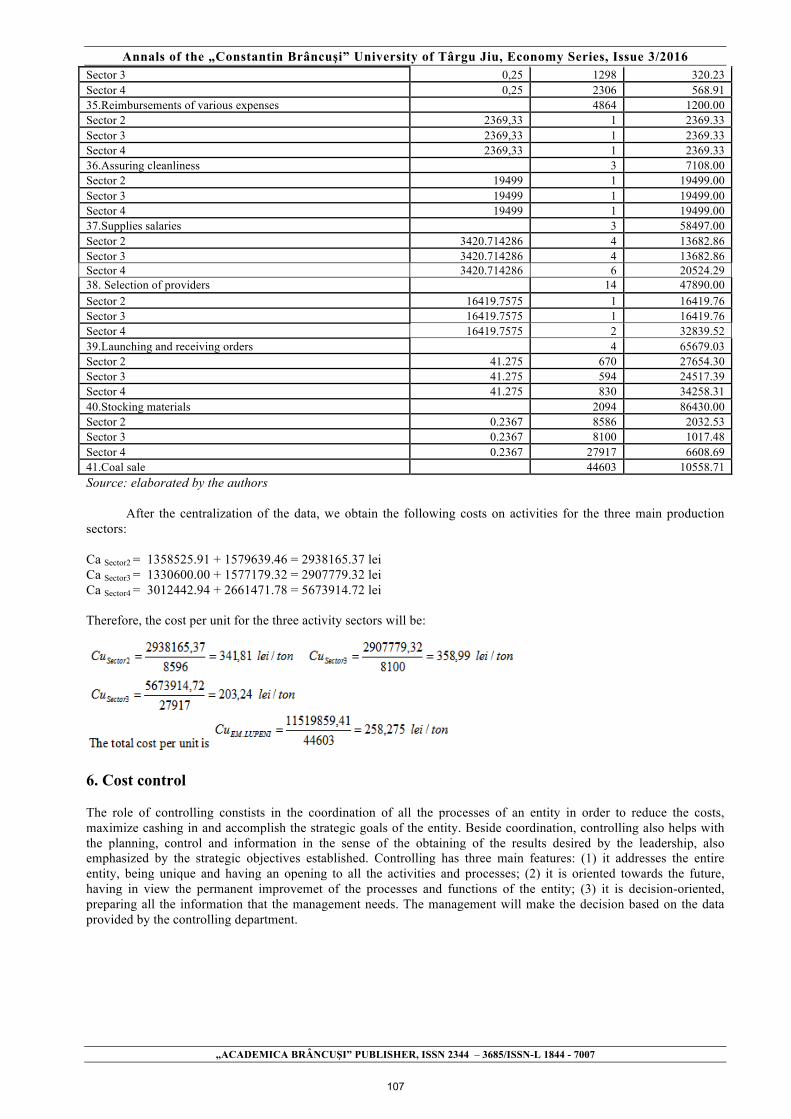
Annals of the „Constantin Brâncuşi” University of Târgu Jiu, Economy Series, Issue 3/2016
„ACADEMICA BRÂNCUŞI” PUBLISHER, ISSN 2344 – 3685/ISSN-L 1844 - 7007
Sector 3 0,25 1298 320.23 Sector 4 0,25 2306 568.91 35.Reimbursements of various expenses 4864 1200.00 Sector 2 2369,33 1 2369.33 Sector 3 2369,33 1 2369.33 Sector 4 2369,33 1 2369.33 36.Assuring cleanliness 3 7108.00 Sector 2 19499 1 19499.00 Sector 3 19499 1 19499.00 Sector 4 19499 1 19499.00 37.Supplies salaries 3 58497.00 Sector 2 3420.714286 4 13682.86 Sector 3 3420.714286 4 13682.86 Sector 4 3420.714286 6 20524.29 38. Selection of providers 14 47890.00 Sector 2 16419.7575 1 16419.76 Sector 3 16419.7575 1 16419.76 Sector 4 16419.7575 2 32839.52 39.Launching and receiving orders 4 65679.03 Sector 2 41.275 670 27654.30 Sector 3 41.275 594 24517.39 Sector 4 41.275 830 34258.31 40.Stocking materials 2094 86430.00 Sector 2 0.2367 8586 2032.53 Sector 3 0.2367 8100 1017.48 Sector 4 0.2367 27917 6608.69 41.Coal sale 44603 10558.71 Source: elaborated by the authors
After the centralization of the data, we obtain the following costs on activities for the three main production
sectors: Ca Sector2 = 1358525.91 + 1579639.46 = 2938165.37 lei Ca Sector3 = 1330600.00 + 1577179.32 = 2907779.32 lei Ca Sector4 = 3012442.94 + 2661471.78 = 5673914.72 lei Therefore, the cost per unit for the three activity sectors will be:
6. Cost control The role of controlling constists in the coordination of all the processes of an entity in order to reduce the costs, maximize cashing in and accomplish the strategic goals of the entity. Beside coordination, controlling also helps with the planning, control and information in the sense of the obtaining of the results desired by the leadership, also emphasized by the strategic objectives established. Controlling has three main features: (1) it addresses the entire entity, being unique and having an opening to all the activities and processes; (2) it is oriented towards the future, having in view the permanent improvemet of the processes and functions of the entity; (3) it is decision-oriented, preparing all the information that the management needs. The management will make the decision based on the data provided by the controlling department.
107
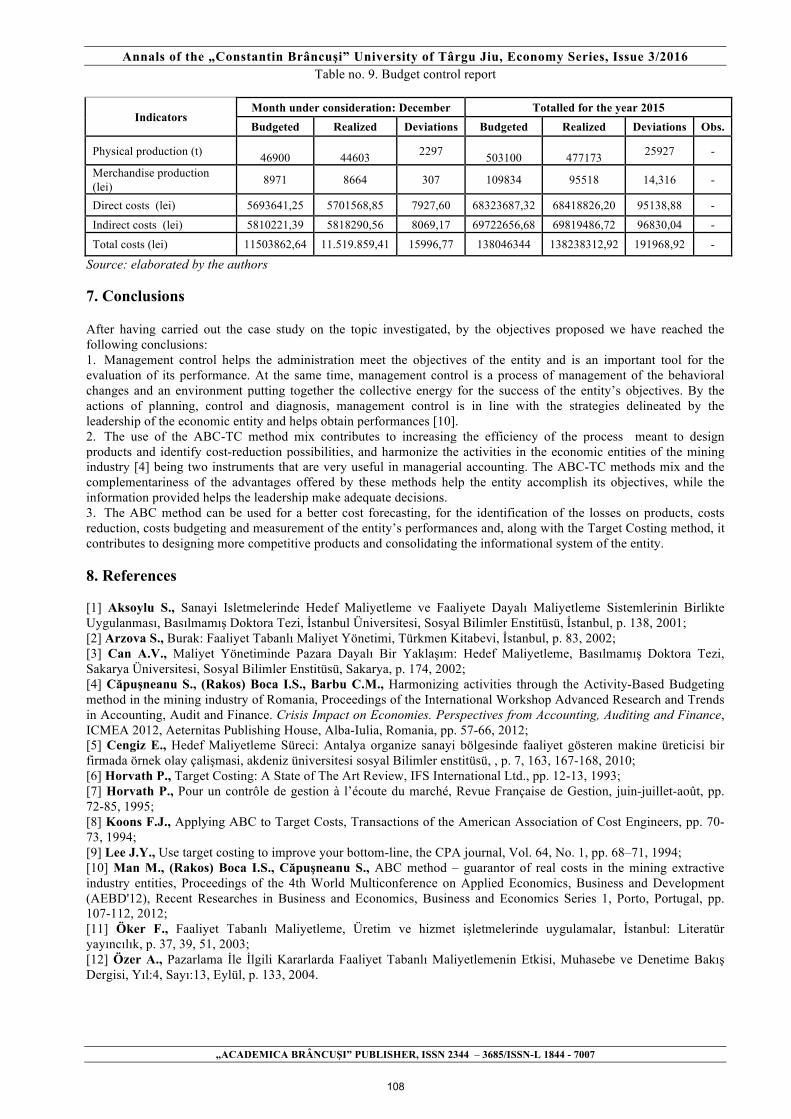
Annals of the „Constantin Brâncuşi” University of Târgu Jiu, Economy Series, Issue 3/2016
„ACADEMICA BRÂNCUŞI” PUBLISHER, ISSN 2344 – 3685/ISSN-L 1844 - 7007
Table no. 9. Budget control report
Indicators Month under consideration: December Totalled for the year 2015 Budgeted Realized Deviations Budgeted Realized Deviations Obs.
Physical production (t) 46900
44603 2297
503100
477173 25927 -
Merchandise production (lei) 8971 8664 307 109834 95518 14,316 -
Direct costs (lei) 5693641,25 5701568,85 7927,60 68323687,32 68418826,20 95138,88 -
Indirect costs (lei) 5810221,39 5818290,56 8069,17 69722656,68 69819486,72 96830,04 -
Total costs (lei) 11503862,64 11.519.859,41 15996,77 138046344 138238312,92 191968,92 -
Source: elaborated by the authors 7. Conclusions
After having carried out the case study on the topic investigated, by the objectives proposed we have reached the following conclusions: 1. Management control helps the administration meet the objectives of the entity and is an important tool for the evaluation of its performance. At the same time, management control is a process of management of the behavioral changes and an environment putting together the collective energy for the success of the entity’s objectives. By the actions of planning, control and diagnosis, management control is in line with the strategies delineated by the leadership of the economic entity and helps obtain performances [10]. 2. The use of the ABC-TC method mix contributes to increasing the efficiency of the process meant to design products and identify cost-reduction possibilities, and harmonize the activities in the economic entities of the mining industry [4] being two instruments that are very useful in managerial accounting. The ABC-TC methods mix and the complementariness of the advantages offered by these methods help the entity accomplish its objectives, while the information provided helps the leadership make adequate decisions. 3. The ABC method can be used for a better cost forecasting, for the identification of the losses on products, costs reduction, costs budgeting and measurement of the entity’s performances and, along with the Target Costing method, it contributes to designing more competitive products and consolidating the informational system of the entity. 8. References
[1] Aksoylu S., Sanayi Isletmelerinde Hedef Maliyetleme ve Faaliyete Dayalı Maliyetleme Sistemlerinin Birlikte Uygulanması, Basılmamış Doktora Tezi, İstanbul Üniversitesi, Sosyal Bilimler Enstitüsü, İstanbul, p. 138, 2001; [2] Arzova S., Burak: Faaliyet Tabanlı Maliyet Yönetimi, Türkmen Kitabevi, İstanbul, p. 83, 2002; [3] Can A.V., Maliyet Yönetiminde Pazara Dayalı Bir Yaklaşım: Hedef Maliyetleme, Basılmamış Doktora Tezi, Sakarya Üniversitesi, Sosyal Bilimler Enstitüsü, Sakarya, p. 174, 2002; [4] Căpuşneanu S., (Rakos) Boca I.S., Barbu C.M., Harmonizing activities through the Activity-Based Budgeting method in the mining industry of Romania, Proceedings of the International Workshop Advanced Research and Trends in Accounting, Audit and Finance. Crisis Impact on Economies. Perspectives from Accounting, Auditing and Finance, ICMEA 2012, Aeternitas Publishing House, Alba-Iulia, Romania, pp. 57-66, 2012; [5] Cengiz E., Hedef Maliyetleme Süreci: Antalya organize sanayi bölgesinde faaliyet gösteren makine üreticisi bir firmada örnek olay çalişmasi, akdeniz üniversitesi sosyal Bilimler enstitüsü, , p. 7, 163, 167-168, 2010; [6] Horvath P., Target Costing: A State of The Art Review, IFS International Ltd., pp. 12-13, 1993; [7] Horvath P., Pour un contrôle de gestion à l’écoute du marché, Revue Française de Gestion, juin-juillet-août, pp. 72-85, 1995; [8] Koons F.J., Applying ABC to Target Costs, Transactions of the American Association of Cost Engineers, pp. 70-73, 1994; [9] Lee J.Y., Use target costing to improve your bottom-line, the CPA journal, Vol. 64, No. 1, pp. 68–71, 1994; [10] Man M., (Rakos) Boca I.S., Căpuşneanu S., ABC method – guarantor of real costs in the mining extractive industry entities, Proceedings of the 4th World Multiconference on Applied Economics, Business and Development (AEBD'12), Recent Researches in Business and Economics, Business and Economics Series 1, Porto, Portugal, pp. 107-112, 2012; [11] Öker F., Faaliyet Tabanlı Maliyetleme, Üretim ve hizmet işletmelerinde uygulamalar, İstanbul: Literatür yayıncılık, p. 37, 39, 51, 2003; [12] Özer A., Pazarlama İle İlgili Kararlarda Faaliyet Tabanlı Maliyetlemenin Etkisi, Muhasebe ve Denetime Bakış Dergisi, Yıl:4, Sayı:13, Eylül, p. 133, 2004.
108
Annals of the „Constantin Brâncuşi” University of Târgu Jiu, Economy Series, Issue 3/2016
„ACADEMICA BRÂNCUŞI” PUBLISHER, ISSN 2344 – 3685/ISSN-L 1844 - 7007
MIGRATION WITHIN THE EU AND ITS IMPACT ON UNEMPLOYMENT RATE
HARALAMBIE GEORGE ALIN, ASSOCIATE PROFESSOR, FACULTY OF ECONOMICS, PETROLEUM AND GAS UNIVERSITY,
PLOIESTI, ROMANIA e-mail: [email protected]
Abstract
Migration, recurrent phenomenon in the XXI century knows an unprecedented scale with unpredictable consequences economically, politically and socially.
A meaningful analysis of the impact of migratory flows, in terms of employment, on the economy of the countries involved, show both positive and negative effects on the countries of origin and those of destination, which imposed the adoption of public policy at regional and international level aimed at providing the necessary workforce amid demographic change, facilitate transfers of knowledge and technology, but also the increase of competitiveness on the labor market.
The fear of host countries regarding migration is linked to fewer jobs available for their citizens. Labour migration also contributes to alleviating labor market imbalances cause by lack of qualified personnel in
certain areas, but also by lower interest of the domestic workers for some low-paid sectors. A natural consequence of the increased number of employees is increasing consumption on medium and long term
with implications for the creation of new jobs, with impact livelihoods. The aim of this article is to analyze the effects of migration on unemployment rate, using data provided by
Eurostat, interpreted using regression and correlation analysis. The results suggest that the unemployment rate was not influenced by migration.
Keywords : migration, labour market, unemployment rate, globalization. Classification JEL: E24,F22 1. Introduction
The migration phenomenon is not recent, It meets throughout the history of human society, knowing a new form of expression in the late twentieth and early twenty-first century, amid globalization and mutations in socio-economic and political.
Migration issue has been addressed in numerous studies that focused on specific areas of interest such as: business cycle, geographical area, professional training level, wage levels in the host country, age of the migrants, and its impact on short, medium and long term.
The dynamics of a country's economy changes over time, cyclicality is the fundamental characteristic of economic life.
The economic crisis has only served to deepen this perception on the impact of migration on the labor market in terms of cost and benefits, given that during recessions migration flows tend to increase.
Specialized studies show that the impact of immigration on unemployment depends on the skills of migrants, of workers' skills and characteristics of the host economy [11].
The same idea is reiterated by George Borjas in the Labour Economics, work that insists on professional skills of migrants in terms of demand for labor in the receiving country, highlighting the extent to which they replace or complement the needs of labor [1]. In the first case there is an increase competitiveness in the labor market with repercussions on wage levels and the employability of citizens of the receiving country, since they are not willing to accept a reduction in salary, migrant accepting to work on lower wages.
This was demonstrated using model Hecksher-Olin-Samuelson (HOS) which indicates that wages will be higher in countries where labor is relatively rare.
The existence of complementary labor market leads to increased productivity.
109

Annals of the „Constantin Brâncuşi” University of Târgu Jiu, Economy Series, Issue 3/2016
„ACADEMICA BRÂNCUŞI” PUBLISHER, ISSN 2344 – 3685/ISSN-L 1844 - 7007
The influence of migration on wage was also analyzed by Pischke and Vellinge, Zorlu and Hartog, Venturini and Villosio. They concluded that there is a weak correlation between the level of remuneration in the host country and the number of migrants.
An analysis of migration also aims its impact on the labor market in the short, medium and long term. Thus, on short and medium term migration has great influence on the employment of labor, while long-term effects are insignificant, due to the market correction mechanisms.
2. The effects of migration on the labor market in the European Union
In the context of enlargement the EU borders in recent decades and increasing flows of migrants from new member states to other states, fear appeared among citizens on the decrease in the number of jobs available to them for migrants, who are willing to accept lower wages.
European integration is based on free movement of persons, goods, services and capital in the European Union, and an open policy on migration of persons in the Community, who can look for a job corresponding to their training in another member country, by ensuring fair treatment, in terms of employment and remuneration as a result of the exercise of a profession.
However, many countries do not agree the migratory flows from the countries of southeastern Europe under population pressure.
This common labor market offers advantages to both employers in terms of reducing the cost of labor, and migrants by obtaining earnings above those of the country of origin.
However, in the medium and long term we are witnessing increased demand for goods and services due to increasing consumption and thus the investment to cover the needs of population. Increased investment leads to the creation of new jobs, with positive implications on salaries, budget revenues from income tax and social security contributions.
Migration and unemployment rate are influenced by economic, political and social factors both from the migrant's country of origin and the country of its destination.
As demonstrated by the recent crisis, unemployment has been influenced to a greater degree by economic and financial conditions and not by the number of migrants, fact illustrated by the dynamics unemployment in the countries of the European Union.
Table No. 1. The dynamics of unemployment rate in the countries of the European Union in the period 2008-2015 EU countries 2008 2009 2010 2011 2012 2013 2014 2015 Austria 4.1 5.3 4.8 4.6 4.9 5.4 5.6 5.7 Belgium 7.0 7.9 8.3 7.2 7.6 8.4 8.5 8.5 Bulgaria 5.6 6.8 10.3 11.3 12.3 13.0 11.4 9.2 Croatia 8.6 9.2 11.7 13.7 16.0 17.3 17.3 16.3 Cyprus 3.7 5.4 6.3 7.9 11.9 15.9 16.1 15.1 Czech Republic 4.4 6.7 7.3 6.7 7.0 7.0 6.1 5.1 Denmark 3.4 6.0 7.5 7.6 7.5 7.0 6.6 6.2 Estonia 5.5 13.5 16.7 12.3 10.0 8.6 7.4 6.2 Finland 6.4 8.2 8.4 7.8 7.7 8.2 8.7 9.4 France 7.4 9.1 9.3 9.2 9.8 10.3 10.3 10.4 Germany 7.4 7.6 7.0 5.8 5.4 5.2 5.0 4.6 Greece 7.8 9.6 12.7 17.9 24.5 27.5 26.5 24.9 Hungary 7.8 10.0 11.2 11.0 11.0 10.2 7.7 6.8 Ireland 6.4 12.0 13.9 14.7 14.7 13.1 11.3 9.4 Italy 6.7 7.7 8.4 8.4 10.7 12.1 12.7 11.9 Latvia 7.7 17.5 19.5 16.2 15.0 11.9 10.8 9.9 Lithuania 5.8 13.8 17.8 15.4 13.4 11.8 10.7 9.1 Luxembourg 4.9 5.1 4.6 4.8 5.1 5.9 6.0 6.4 Malta 6.0 6.9 6.9 6.4 6.3 6.4 5.8 5.4 Netherlands 3.7 4.4 5.0 5.0 5.8 7.3 7.4 6.9 Poland 7.1 8.1 9.7 9.7 10.1 10.3 9.0 7.5 Portugal 8.8 10.7 12.0 12.9 15.8 16.4 14.1 12.6 Romania 5.6 6.5 7.0 7.2 6.8 7.1 6.8 6.8 Slovak Republic 9.6 12.1 14.5 13.7 14.0 14.2 13.2 11.5 Slovenia 4.4 5.9 7.3 8.2 8.9 10.1 9.7 9.0
110

Annals of the „Constantin Brâncuşi” University of Târgu Jiu, Economy Series, Issue 3/2016
„ACADEMICA BRÂNCUŞI” PUBLISHER, ISSN 2344 – 3685/ISSN-L 1844 - 7007
Spain 11.3 17.9 19.9 21.4 24.8 26.1 24.5 22.1 Sweden 6.2 8.3 8.6 7.8 8.0 8.0 7.9 7.4 United Kingdom 5.6 7.6 7.8 8.1 7.9 7.6 6.1 5.3
Source: Developed by the author based on statistics of the European Union [10] Migrants prefer countries with strong economic growth and increased demand in the labor market, migration
flows resulting in dynamic economic life, with no pressure on the labor market. Destination countries are involved in the migration process in order to avoid an excessive flow of workers. Combating discrimination against workers in some member states and removing bottlenecks in the labor market in
the European Union are the main objectives of the "EU Directive 54/2014 on measures to facilitating the exercise of rights conferred on workers in the context of freedom of movement for workers ", given the major challenges they face regarding access to employment, working conditions and remuneration. At the same time it aims to facilitate labor mobility.
From an EU perspective, labor migration helps reduce labor shortages in certain sectors, low-paid or requiring a high level of qualification, at acquiring new knowledge in the workplace, to the rejuvenation of supply in the labor market given that migrants are people aged 18-40 years, without taking into account the impact on the unemployment rate, wage distortions, illegal employment, mass emigration of qualified labor ( "brain drain") capable of creating added value.
There is a correlation between the number of migrants and the unemployment rate, both in the countries of destination and countries of origin.
Studies of migration shows that migration flows were directed towards industrialized countries (Germany, Spain, Italy, United Kingdom, France) with a rate of over 77% of all migrants within the EU.
More than 40% of them are citizens of the new Member States such as Romania, Poland and Bulgaria. The dynamics of unemployment in the European Union seems to be influenced by migration, as shown in the
figure below.
Figure No.1. The dynamics of unemployment and net migration at EU level in the period 2007-2014 Source: Developed by the author based on statistics of the European Union [10]
Thus, during the peak of the financial crisis, the unemployment rate in the European Union reached the threshold of 10.9%, while net migration rate was 3.3 / 1000 population, a level higher than in the previous year when was 1.7 / 1,000 inhabitants.
3. Modelling the impact of migration on unemployment rate in EU
The method applied to explain the impact of migration on unemployment rate in EU is regression, data used in the analysis were provided by Eurostat, for the period 2007-2014.
The considered dependent variable is unemployment rate, and explanatory variable was rate of net migration. Table No.2 Estimated fixed panel data model for unemployment rate in EU
Explanatory Variable Coefficient P-value
2007 2008
2009 2010 2011 2012 2013 2014
0 5
10 15
2007 2008 2009 2010 2011 2012 2013 2014
111

Annals of the „Constantin Brâncuşi” University of Târgu Jiu, Economy Series, Issue 3/2016
„ACADEMICA BRÂNCUŞI” PUBLISHER, ISSN 2344 – 3685/ISSN-L 1844 - 7007
Rate of net migration 3,938797 0,000375
R Square 0,853156
The value of R Square shows that 85.31% of the variation in unemployment rate in EU is due to the variation of the abovementioned explanatory variable.
For materiality level α = 0.05 we can reject the null hypothesis of the coefficient α1 (0.000375 is smaller than 0.05).
The variable Rate of net migration has a positive estimated coefficient. More specifically, increasing rate of net migration will lead to higher unemployment.
Regarding the correlation coefficient that measures the direction and degree of association between two variables, without implying a causal relationship, its value which is -0.24027 shows a weak correlation between the unemployment rate and net migration rate.
Table No.3 The coefficient of correlation between the unemployment rate and net migration rate
Unemployment rate
Rate of net migration
Unemployment rate 1 Rate of net migration -0,24027 1
Poor correlation between the unemployment rate and net migration rate is illustrated by the point cloud distribution in
figure number 2.
Figure No.2. Bivariate distribution graph
4. Conclusions
Increased migration within the European Union should lead to a rethinking of policies for the reception of migrants and a common approach to migration management issues.
The EU should develop an efficient migration policy, based on solidarity and responsibility in line with the needs of the member countries and the migrants, by helping them to return to their countries of origin, by providing funds to enable their integration into the labor market.
Addressing migration from the perspective of member countries must be channeled to their economic and financial interests, rather than earning political capital by policymakers in response to the opinions of citizens who perceive this as being negative.
Experience shows that economic crises, technological progress, international trade, level of education and low birth rates have a much bigger impact on the labor market than migration. Competition in the labor market it is in favor of workers in the host country, because most jobs involve language and communication skills that many migrants do not have. In addition, immigrants with similar education levels to natives receive a much lower salary. Migrants accept jobs that
0
0.5
1
1.5
2
2.5
3
3.5
0 2 4 6 8 10 12
Une
mpl
oym
ent r
ate
Rate of net migration
112

Annals of the „Constantin Brâncuşi” University of Târgu Jiu, Economy Series, Issue 3/2016
„ACADEMICA BRÂNCUŞI” PUBLISHER, ISSN 2344 – 3685/ISSN-L 1844 - 7007
natives refuse them. That means politicians can not ignore the role that migrants have on the labor market. An effective integration policy can help improve public confidence in the immigration system.
Reality has shown that in countries of destination of migrants, their contribution to GDP growth was significant, which is due to increase productivity in certain fields such as agriculture, construction, retail, manufacturing where most migrants find a job .
5. Bibliography [1] Blanchflower D.G., Shadforth C., Fear, Unemployment and Migration, The Economic Journal, volume 119, 2009; [2] Borjas G., Labour Economics, 7 th Edition, Irwin/McGrawHill, 2015; [3] Donnely M., Competition and solidarity: union members and immigration in Europe, West European Politics, volume 51, 2015; [4] Fleischmann F., Dronkers J., Unemployment among immigrants in European labour markets: an analysis of origin and destination effects. Work, Employment and Society., volume 24, 2010; [5] Okkerse L., How to measure labour market effects of immigration: a review. Journal of Economic Surveys , volume 22, 2008; [6] Pischke J., Velling J., Employment effects of immigration to Germany: an empirical analysis based on local labor markets, Review of Economic and Statistics, volume 22, 2008; [7] Venturini A., Villosio C., Labour Market Effects of Immigration into Italy: An Empirical Analysis, International Labour Review, volume 145, 2006; [8] Zorlu A., Hartog J., The efect of immigration on native earnings, Tinbergen Institute, Discussion Paper, 2000; [9] European Parliament & European Council, Directive 2014/54/EC of the European Parliament and of the Council of 16 April 2014 on measures to facilitating the exercise of rights conferred on workers in the context of freedom of movement for workers; [10] ∗∗∗ec.europa.eu/eurostat; [11]∗∗∗ http://www.migrationobservatory.ox.ac.uk/briefings/labour-market-effects-immigration;
113
Annals of the „Constantin Brâncuşi” University of Târgu Jiu, Economy Series, Issue 3/2016
„ACADEMICA BRÂNCUŞI” PUBLISHER, ISSN 2344 – 3685/ISSN-L 1844 - 7007
STAGES AND EVOLUTIONS IN STRATEGIC MANAGEMENT ACCOUNTING
CĂRUNTU GENU ALEXANDRU,
ASSOCIATE PROFESSOR, FACULTY OF ECONOMICS AND BUSINESS ADMINISTRATION,"CONSTANTIN BRÂNCUŞI" UNIVERSITY
[email protected] Abstract
Strategic management accounting includes inside, outside the company and future oriented tools, which have as role monitoring the strategy, its communication and helping develop new strategies. A special category in strategic management accounting is the performance management systems, covering a sum of indicators from diverse sources which support the pursuit of creating value for partners. Keywords: research,strategy,performed,company, developed, Clasificare JEL : M40, M41 1. Introduction and context of the study
Managerial accounting is a new field of Accounting Science, always in the shadow of Financial Accounting,
where many reforms have attracted the attention of research, teaching and practice. The real problems of research in this area focused on the following areas: description of strategic management
accounting in terms of functions, tools and its link with evolutions in the strategy field; identifying a contingency model for control systems and organizational performance; presentation of strategic management accounting tools as concepts and evolution and their analysis through contingency factors.
1.1. The stages of managerial accounting evolution
To understand the characteristics of management tools, it is necessary placing them on a historical axis, comprising the following steps:
The first step is to determine cost and financial control, which lasts from early managerial accounting until 1950. At this stage, managerial accounting is regarded as a technical activity necessary to achieve the objectives of the organization, geared towards determining the cost of production. Managerial accounting arises from the need for managers to run their businesses. During this period large firms start applying budgeting activities on fields, analysis of deviations regarded costs, applying flexible budgets.
The second step refers to information for planning and control (1950-1965 period). The turning point is to define and place the control as function of management and, in particular, to formalize the relationship between control and strategy.
In this regard, the control must contribute to achieving organized objectives and to ensure behaviors coordination and motivation. During this period, it is shaping the classic organizational control system, consistent system with stable environment, suitable for using experiences captured in this phase.
At first, managerial accounting was a managerial activity, more oriented to internal management rather than to the environment and the strategy.
The third step refers to reducing resource waste (1985 – 1995 period). It is believed that environmental changes impose new managerial techniques: flexible manufacturing systems, production systems timely, supply chain management, total quality management or planning systems inventories.
These, in turn, involves developments in managerial accounting, referred to cost - target, value engineering, strategic costs accounting, costs on activities or indicators non - financial, etc.These, in turn, involves developments in managerial accounting or cost - target, value engineering, cost accounting policy, costs on activities or non - financial indicators etc.
The last step is creating value by using resources efficiently and effectively (after 1995 to present), which involves the analysis of value inducers for customers or for business partners. During this time, planning, controlling and reducing wastage acquires strategic dimension because it is focused on creating value by identifying, measuring and managing customer value, innovation and customer relationship management. In this context, there are developing value management tools such as balance scores.
114
Annals of the „Constantin Brâncuşi” University of Târgu Jiu, Economy Series, Issue 3/2016
„ACADEMICA BRÂNCUŞI” PUBLISHER, ISSN 2344 – 3685/ISSN-L 1844 - 7007
The value-based management was built and bounded on past practice and include, in particular, performance measurement models, seen as models of the company as a system that reflects the organizational knowledge of relations along the value chain.
The main difference between the last two stages and the first is the change of the mindset accounting, i.e. the transition from providing information to resources management. In the foreground the information become a source among others, imposing their management and value creation.
Finally, managerial accounting becomes an important part of the management process, evolving from purely financial orientation towards strategic approaches[1, p. 28.].
1.2. Strategy evolution - analysis framework for management accounting
The traditional role of management accounting is to function as a rational system, to provide information for
decision-making and promoting businesses experience. In recent decades, the evolutions from the economic and management background led to an enrichment of management accounting role, which serves the strategic goals, being analyzed and considered as a social product. In this context, managerial accounting tools fulfill two complementary roles, namely: exercise control in order to ensure targets achievement, and providing support to seek opportunities and solve problems; the way how managerial accounting system performs balancing these roles which represents an important area for future research. These roles involve analyzing managerial accounting in organizational context, especially in relation to strategy and organizational learning. In fact, attracting and using control instruments depend on the strategy, and these in turn influence the enterprise through organizational learning and vigilence - orientation managers. It is possible to identify a link between managerial accounting, strategy and learning as controller can stimulate learning both individually and collectively, to increase the level of operational company's strategic options and to manipulate the productive systems evolution. The all experiences that guide the action in enterprises represents a part of organizational learning, and the management accounting system requires formalization routines, influencing behaviors. Managerial accounting definitions include implicit or explicit references to the nature and the substance of the strategic process. [2, p. 49.].
It is necessary to define the concept of strategy and the phased transition of strategic schools and their characteristics, in order to put on this pedestal the evolution of management accounting tools. It should be shown that the strategy is anchored in a specific economic and history context, each era generating its practices, concepts and tools.
On long periods strategy has oscillated between internal and external analysis, but the evolution of concepts and instruments was performed by enriching more than replacing them. Staging strategic concepts will underpin the analysis of management tools, limiting a classical and a modern period.
In outlining the link between strategy and management tools, for an analysis of causality links it can be establish three distinct phases:
The first period - business portfolio approach It is the period between 2001-2005, when it was considered that the basic principles of this period are
competitive positioning and suitability, which involve two fundamental attitudes to ensure sustainability, the company must adapt to the environment to succeed, it must acquire competitive advantages and keep them. In order to adapt to the environment, it is necessary to analyze it and to analyze the proportion to the size of the enterprise, being represented by a model as concisely as SWOT analysis (Strengths - Weaknesses - Opportunities - Threats), which analyse the enterprise activity, starting with environmental threats and opportunities, in order to position then the company in terms of strengths - weaknesses. The most important principles of management of this period, which will directly influence management tools, are:[3, p. 117.].
- strategic planning, where the strategy is seen as a sum of goals and plans. Adequacy involves the prevalence of environment, of external analysis, that will guide corporate decisions. The strategy resulting from a controlled, conscious and formal planning process based on an extensive collection of information, it is believed that it can be implemented through specific objectives, budgets and programs;
- performance is explained by factors of manufacturing industry structure and by enterprise link with it, where overall performance is the sum of industrial performances;
- the reduced costs are achieved by the effect of experience and market positioning, using investments in physical assets, as the way to bring future savings, referring here to economies scale.
The second period - competence portfolio (the importance of internal resources) Towards the end of the millennium, the environment is transformed by economic recession and by
accelerating the competitive intensity and product life cycles, when the environment can not be easily predicted and can be changed continuously.
At this stage, the cost savings obtained by the effect of experience have been exhausted, and competitive advantage is no longer a target difficult to reach, and strategic segments become objectionable due to price fragment, environment complexity and redefining the boundaries between different types of industries (producing and processing
115

Annals of the „Constantin Brâncuşi” University of Târgu Jiu, Economy Series, Issue 3/2016
„ACADEMICA BRÂNCUŞI” PUBLISHER, ISSN 2344 – 3685/ISSN-L 1844 - 7007
of raw materials). The starting point and determining the strategy is to multiply assets, technologies, skills, business analysis that gives concise strategic advantage against competitors.
The basic principles of this period, which will influence management tools are: - the analysis of internal resources and skills, development, their creation and utilization in order to respond to
customer requirements. By relating primarily to customers and competitors, it is established a marketing orientation. To this end, environmental relating is not achieved in order to adapt and identify actions expected, but to maximize the use of existing skills;
- establishing long-term strategic intent, which will include current actions; - the overall performance is not the sum of local performance because it creates links using basic skills. The third period - portfolio of relationships. At the beginning of the current millennium, the current environment is characterized by extremely high
competition, requiring transformation and speed. In this context there are long-term performant the companies that continue to reinvent capacity by managing new sources of value creation without creating inventory overstocks[4, p. 128.].
But competition can attach the cost – quality proportion, time, entry barriers and financing capacity. In a sharply competitive environment, the best performing company is that which conjugates the best competitive advantages and makes them evolve faster, or seizure new commercial spaces by creating disturbances in the existential environment.
During this period, it is developing the concept of strategic configuration, which involves customer focus and not on resources acquired, and customer needs must determine the value chain and skills, and not the opposite. Strategic configuration will generate the most value for shareholders, who hold majority control of the company capital.
In these circumstances, the organization's strategy is no longer purely internal, and it is turning to the environment, not for searching predictability, but to identify partners and establish relationships with foreign partners.
The company's objectives are mainly managing continuous change of the relationship between products, services, markets, skills, competition, knowledge of internal and external partners of the firm.
The basic principles of this period, which will influence management tools are: - performance resulting from cooperation and change, learning change also from inter-organizational
synergies; - the value chain is continuosly developing, according to environmental requirements, and besides resources
and costs must be managed accumulated knowledge and relationships.
1.3. Strategic management accounting
Although not excluded, the strategy and managerial accounting were considered as different parts of the management process. We distinguish that the strategy is future-oriented decision-making medium and long term and it is a qualitative support, while accounting is historical, developed over a relatively long time, being oriented on the quantitative side of managerial support. As stages of managerial process, the strategy design firm in its entirety and follows synergies during time, the managerial accounting divide firm into controllable parts easily pursued by various managerial levers.
The chain of managerial and strategic accounting requires strategic principles integration, namely: - future – orientation and pursuing long-term business; - outside firm – orientation to value chain; - providing qualitative information (nonfinancial). In the second period of consecration, strategic management accounting develops masively, and some strategic
principles such as the value, resources, skills and strategic intent are significant. Skills are part of the activities that add value to the product, approach that falls in line with the value chain
proposed by some economists, but is an extension of it. Strategic intent presume a long term vision and a portfolio of core competencies, and skills must be used under conditions of optimum efficiency, namely: cost, quality, time and diversity[1, p. 68.].
Ultimately, some authors divide the techniques in strategic management accounting in three categories: - inside the company - oriented, highlighting the collection and reporting of relevant information to achieve
efficiency as a source of competitive advantage and which relate to accounting techniques associated with the development of new production strategies (information as: cost, quality, time, etc.) filtered by ABC (activity cost method) and ABM (activity based management).
Even if ABC method is similar to traditional instruments by focusing inward and historical information, it becomes a strategic tool through quality information they provide and the information base for decision making; it can be considered that all the traditional techniques may be used for strategic purposes, e.g. cost analysis can play a strategic role if deviations are analyzed according to the causative factors and then are linked to different strategic consequences.
116
Annals of the „Constantin Brâncuşi” University of Târgu Jiu, Economy Series, Issue 3/2016
„ACADEMICA BRÂNCUŞI” PUBLISHER, ISSN 2344 – 3685/ISSN-L 1844 - 7007
- outside company – oriented; it is considered that the instruments focused inward limit the ability of the company to compete effectively. Strategic Managerial Accounting (SMA) must realize comparison with the competitors' cost structure, into a strategy cost and comparison the proportion of product quality, market requirements, in a strategy of diversification.
- future-oriented, primarily used in investment decisions, which tend to focus on the long term, especially since the field has been criticized for removal strategy.
To Strategic Managerial Accounting (SMA) level, the roles are developing and identifing: [3, p. 135.]. - monitoring strategy - role achieved through tools such as performance measurement systems by competitors
– oriented accounting, given that competitive advantage can be created only by comparison with competitors; - strategy development - where the information is used to develop superior strategies to obtain sustainable
competitive advantages, and as tools: investment planning and marketing programs; - the formulation of new strategies - SMA has an important role in the strategic changes, not only because of
actual instruments, but especially through available information and knowledge. Performance measurement tools included with SMA (strategic management accounting), given that their
role is a strategic, performance resulting from the successful implementation of the strategy. Managerial Accounting aim is to improve the performance measurement as an effective performance
measurement enable description and strategy implementation guide employee behavior and provide their base pay. The measurement system and performance management opens a new path in managerial accounting,
strategic system focusing on a balanced performance measurement. The measurement and performance management system opens a new path in managerial accounting focusing
on a balanced performance measurement strategic system.
Conclusion The performance measurement tools are included in SMA (strategic management accounting) category, given
that their role is strategic, resulting the performance from the successful implementation of the strategy. Managerial accounting aim is to improve the performance measurement because an effective performance
measurement system enables strategy description and implementation, guides employee behavior and provides their base pay.
Bibliography 1. Albu, N., Albu, C., Performance management tools, Economica Publisher, Bucharest, 2010 2. Caraiani, C., Dumitrana., M., Accounting and Management Control, InfoMega Publisher, Bucharest, 2004 3. Epuran, M., Babo, V., Grosu, C., Accounting and Management Control, Economica Puclisher, Bucharest,
2009 4. Florinel, M., Sgârdea, Management Control, Academy of Economic Sciences Puclisher, Bucharest, 2009
117
Annals of the „Constantin Brâncuşi” University of Târgu Jiu, Economy Series, Issue 3/2016
„ACADEMICA BRÂNCUŞI” PUBLISHER, ISSN 2344 – 3685/ISSN-L 1844 - 7007
UNCONDITIONAL BASIC INCOME – IMPACT ON THE ECONOMY
OANA-VALENTINA CERCELARU
PHD STUDENT AT ROMANIAN ACADEMY – NATIONAL INSTITUTE OF ECONOMIC RESEARCH
e-mail: [email protected] Abstract
The introduction of a basic income has a significant impact, both on the economy and on social life and personal development. This topic has been widely discussed in recent years. In June 2016, Switzerland will hold a referendum to vote on whether to introduce this new social insurance system. This new form of organization has important advantages and disadvantages and it is still debatable which way the balance tilts. In the market economy, the impact levels are very high and difficult to quantify, triggering a chain reaction. This benefit is granted under certain criteria, heading towards a well-established line of decision makers. Keywords: unconditional basic income, development, trends Clasificare JEL : G 28, H19, H20, H30 1. Introduction
The minimum wage was introduced and established by law at the end of the nineteenth century, in Australia and New Zealand. Since then, the minimum wage was introduced gradually in many countries and has now become an important indicator of the economy. The minimum wage was introduced as a form of social protection, as defined in the Universal Declaration of Human Rights: ”Everyone who works has the right to just and favourable remuneration ensuring for himself and his family an existence worthy of human dignity”. However, the reality of this definition differs from country to country, the minimum wage failing to cover all human needs in some cases.
The need to settle an income that provides stability and a certain living standard has been debated for a long time.
Regardless of the name used e.g. basic income, minimum income, basic income guarantee, universal basic income - the principles are based on the same idea presented by Montesquieu in 1778: “the State owes all its citizens a secure subsistence, suitable food and clothing, and a manner of life that is not contrary to good health.”
Two hundred years later, Niels I. Meyer, Kristen Helveg Petersen and Villy Sørensen propose the term of unconditional basic income (UBI), regulating this idea as “citizen’s income”. So far it has not been possible to establish a clear strategy to enable the implementation of this idea, leaving all projects to pilot stage. This topic raises many issues, with implications both on economic and social level.
Origins - introducing the minimum wage
According to Eurostat, in 2015, in the European Union, 22 member states out of 28 had national minimum wages. However, countries, such as Sweden, Finland, Denmark, Norway, Iceland, Switzerland, Austria, Cyprus and Italy, did not have minimum wage laws.
Minimum wage rates vary greatly across many different jurisdictions. To perform a relevant comparison we used the PPP indicator (purchasing power parity) and the value in euro. The PPP indicator shows how many units are needed to buy a certain amount of goods and services. Thus, the price differences created due to exchange rate fluctuations are eliminated and certain expenses in national currency are converted into a common, artificial currency.
As shown in Figures 1 and 2, there is a significant difference between the wage in euro and the wage in PPP. There are differences in the hierarchy of countries when the minimum wage is expressed in euro and when it is expressed in PPP, so countries with relatively low minimum wages in euro show a lower price level, resulting in a higher minimum wage when measured against purchasing power.
There is also a significant difference between the minimum wage recorded at the lowest value and the minimum wage recorded at the highest value in euro compared to the value expressed in PPP. Therefore, when referring to euro, there is a difference of 1766.05 (Bulgaria has the lowest minimum wage – 189,18 and Luxembourg has the highest minimum wage - 1922.96), and when we refer to PPP, there is a difference of 1268.07 (has the lowest minimum wage - 328.58 and Luxembourg has the highest minimum wage - 1596.65).
118

Annals of the „Constantin Brâncuşi” University of Târgu Jiu, Economy Series, Issue 3/2016
„ACADEMICA BRÂNCUŞI” PUBLISHER, ISSN 2344 – 3685/ISSN-L 1844 - 7007
Fig.1 National minimum wage expressed in Euro, in 2015
Data source: http://appsso.eurostat.ec.europa.eu/nui/submitViewTableAction.do accesat la data de 27.02.2016
Fig.2 National minimum wage expressed in PPP, in 2015
Data source: http://appsso.eurostat.ec.europa.eu/nui/show.do, accesat la data de 27.02.2016
The minimum wage was introduced as a safeguard so that workers would not be paid below this level. The
state thereby ensures that all employees have a guaranteed minimum standard of living. However, the introduction of an unconditional basic income is currently being debated, as minimum wage failed to ensure the desired level of social protection.
2. Unconditional basic income The Universal Declaration of Human Rights states that “everyone has the right to life, liberty and security of person” and “the right to a standard of living adequate for the health and well-being of himself and of his family”. As a response to this statement, the term basic income was introduced. This should represent a basic income guarantee that would be granted unconditionally to all people in all countries.
119
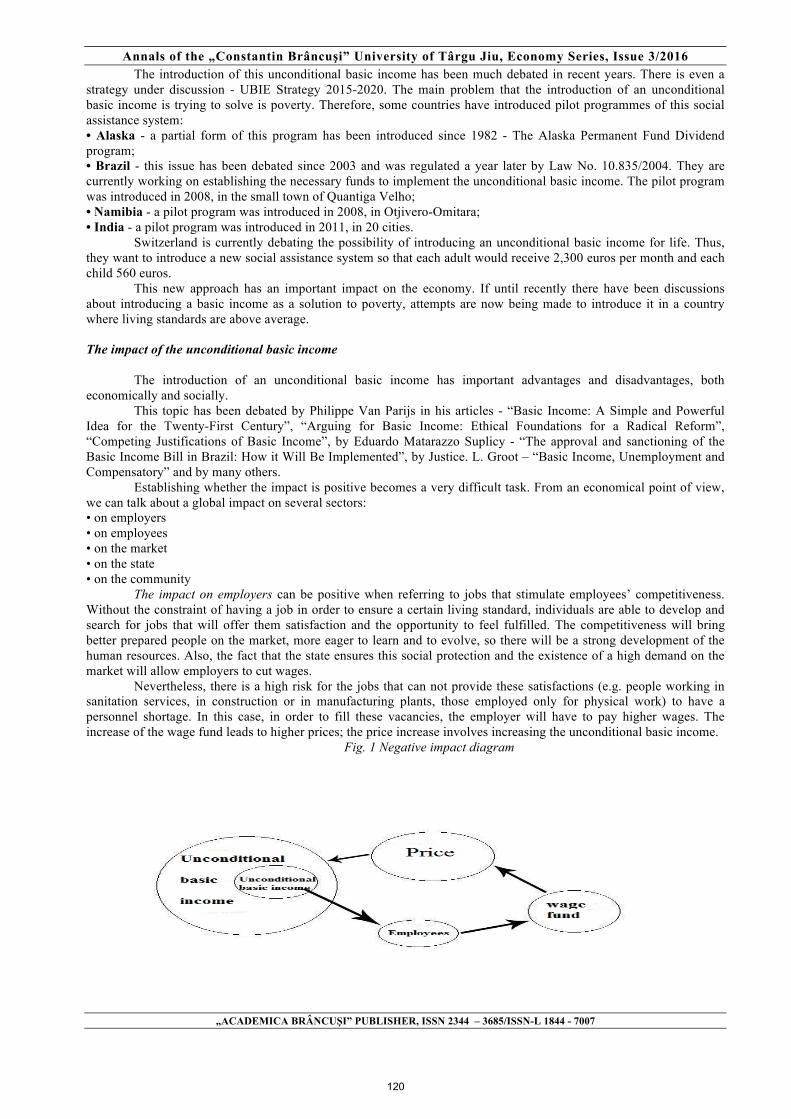
Annals of the „Constantin Brâncuşi” University of Târgu Jiu, Economy Series, Issue 3/2016
„ACADEMICA BRÂNCUŞI” PUBLISHER, ISSN 2344 – 3685/ISSN-L 1844 - 7007
The introduction of this unconditional basic income has been much debated in recent years. There is even a strategy under discussion - UBIE Strategy 2015-2020. The main problem that the introduction of an unconditional basic income is trying to solve is poverty. Therefore, some countries have introduced pilot programmes of this social assistance system: • Alaska - a partial form of this program has been introduced since 1982 - The Alaska Permanent Fund Dividend program; • Brazil - this issue has been debated since 2003 and was regulated a year later by Law No. 10.835/2004. They are currently working on establishing the necessary funds to implement the unconditional basic income. The pilot program was introduced in 2008, in the small town of Quantiga Velho; • Namibia - a pilot program was introduced in 2008, in Otjivero-Omitara; • India - a pilot program was introduced in 2011, in 20 cities. Switzerland is currently debating the possibility of introducing an unconditional basic income for life. Thus, they want to introduce a new social assistance system so that each adult would receive 2,300 euros per month and each child 560 euros. This new approach has an important impact on the economy. If until recently there have been discussions about introducing a basic income as a solution to poverty, attempts are now being made to introduce it in a country where living standards are above average. The impact of the unconditional basic income The introduction of an unconditional basic income has important advantages and disadvantages, both economically and socially. This topic has been debated by Philippe Van Parijs in his articles - “Basic Income: A Simple and Powerful Idea for the Twenty-First Century”, “Arguing for Basic Income: Ethical Foundations for a Radical Reform”, “Competing Justifications of Basic Income”, by Eduardo Matarazzo Suplicy - “The approval and sanctioning of the Basic Income Bill in Brazil: How it Will Be Implemented”, by Justice. L. Groot – “Basic Income, Unemployment and Compensatory” and by many others. Establishing whether the impact is positive becomes a very difficult task. From an economical point of view, we can talk about a global impact on several sectors: • on employers • on employees • on the market • on the state • on the community
The impact on employers can be positive when referring to jobs that stimulate employees’ competitiveness. Without the constraint of having a job in order to ensure a certain living standard, individuals are able to develop and search for jobs that will offer them satisfaction and the opportunity to feel fulfilled. The competitiveness will bring better prepared people on the market, more eager to learn and to evolve, so there will be a strong development of the human resources. Also, the fact that the state ensures this social protection and the existence of a high demand on the market will allow employers to cut wages.
Nevertheless, there is a high risk for the jobs that can not provide these satisfactions (e.g. people working in sanitation services, in construction or in manufacturing plants, those employed only for physical work) to have a personnel shortage. In this case, in order to fill these vacancies, the employer will have to pay higher wages. The increase of the wage fund leads to higher prices; the price increase involves increasing the unconditional basic income.
Fig. 1 Negative impact diagram
120

Annals of the „Constantin Brâncuşi” University of Târgu Jiu, Economy Series, Issue 3/2016
„ACADEMICA BRÂNCUŞI” PUBLISHER, ISSN 2344 – 3685/ISSN-L 1844 - 7007
In this situation, the question is how should the state regulate the unconditional basic income in order to reduce the negative impact on the economy, to avoid creating a vicious circle between the employer - employee - pricing/economy?
The impact on employees is positive. They are in the position to choose continuous development by getting involved in programmes that can help them get the desired positions, being able to invest a part of the basic income in education without affecting the family budget/daily consumer basket.
It is not possible to establish a global impact on the market, as some fields will suffer, while others will experience a rapid development.
If currently in the fields of construction / sanitation / manufacturing most employees have secondary education and receive a relatively low wage, and in IT / economic / medical fields employees have higher education and receive a relatively high wage, the balance is expected to change with the introduction of the unconditional basic income. Wages will rise significantly in the first fields, while on the other side of the scales wages will decrease and workers will become increasingly overqualified.
There is also the risk that many people will be satisfied with the basic income and they will stop working, at least for a while.
Stuart White identified another problem in The Civic Minimum: On the Rights and Obligations of Economic Citizenship: “the providential arrangement”. In the words of Stuart White, “it seems sometimes to be regarded as quite a providential arrangement that some should be born without the necessity of working for their own living so that they have leisure to impose this fundamental duty on others.”
In this situation, the matter of state power arises. The citizens’ behaviour must be carefully observed in order to assess their condition and, if necessary, to intervene through programmes and counselling.
Philippe Van Parijs regulated this situation by saying: “Where these rights secure a citizen a sufficiently generous share of the social product, and sufficiently good opportunities for productive contribution, citizens have definite and potentially enforceable obligations to make a productive contribution to the community in return.”
State’s involvement in this policy (granting the unconditional basic income) should be very strong, becoming the pillar that supports both the economy and the social life. It could be said that we go back to the time when economic and social life were heavily regulated and controlled by the state.
Placing an amount of money on the market will increase the daily basket of goods which can lead to an imbalance in the economy. A normal protective barrier adopted in this situation is to encourage the consumption of national products, thus stimulating domestic production. This action would be a subsidy granted by the state budget to local firms. The subsidy is not given directly, but through the most important factor – the people. The impact of this action is double, helping social life, increasing life quality and stimulating the development of firms/companies.
There will be an important impact on the community, making it grow and become more powerful. A society no longer stressed by deprivation and protected by the state will have an above average quality of life. A higher living standard should result in better prepared, more competitive, stronger people who are more eager to grow.
Nevertheless, there’s an important element that sould not be neglected. The budget will be subject to an expense that will need funding. The question is: “What are the sources of funding in order to provide an unconditional basic income for life?” The introduction of taxes and fees could give an answer. Higher taxes on above average incomes and profits represent another possibility, returning to progressive taxation policy.
At the moment, progressive taxation seems to be the most accessible source of funding for this social policy that wants to provide a basic standard of living.
The fiscal policy of an economy that involves an unconditional basic income has certain particularities. In such case, there’s an assumption that some expenses will no longer exist: for unemployment, pensions, social assistance – leaving only the funds for people with disabilities.
Furthermore, state budget expenditures will be reduced by reducing the wage bill, since the number of people working in the public system will decrease.
However, it can’t be said that this will balance the budget. Balancing the budget can be achieved both by taxing wages and by a tax on consumption (VAT / excise duties). The increase of these taxes or the introduction of a new tax can represent a source of financing.
Eliminating unemployment contributions and social security contributions, however, can not represent a decrease of the fiscal pressure on the economy. This change must happen gradually to avoid any turbulence in the economy.
Philippe Van Parijs discussed this issue in the article “Basic Income: A Simple and Powerful Idea for the Twenty-First Century”: “The basic income may, but need not, be funded in a specific, earmarked way. If it is not, it is simply funded along with all other government expenditures, out of a common pool of revenues from a variety of sources. Among those who advocated earmarked funding, most are thinking of a specific tax. Some want it funded out of a land tax or a tax on natural resources (from Thomas Paine (1796) to Raymond Crotty (1987), Marc Davidson (1995) or James Robertson (1999) for example). Others prefer a specific levy on a very broadly defined income base (for example, Pelzer 1998, 1999) or a massively expanded value-added tax (for example, Duchatelet 1992, 1998). And some of those who are thinking of a worldwide basic income stress the potential of new tax instruments such as “Tobin
121

Annals of the „Constantin Brâncuşi” University of Târgu Jiu, Economy Series, Issue 3/2016
„ACADEMICA BRÂNCUŞI” PUBLISHER, ISSN 2344 – 3685/ISSN-L 1844 - 7007
taxes” on speculative capital movements (see Bresson 1999) or “bit taxes” on transfers of information (see Soete & Kamp 1996).”
Unconditional basic income funding problem is the most difficult part in implementing this new social policy. However, the impact on the community is considered to be very powerful, since the community suffers the
biggest changes. An unconditional basic income for life will help increase life quality, consumption and education significantly. Since the man is the link that underpins the existence of the market, the changes in his behaviour are strongly reflected in the economy. The fact that in this situation the state is the chain linking the two components (the man and the economy) must not be overlooked, making it difficult to establish to what extent people have the capacity to be independent. 3. Conclusions The introduction of an unconditional basic income would produce a major impact on all levels. There would be significant changes, leading to a different type of economy. People’s vulnerability shows the importance and the necessity of this new social security system. Although a few years ago people were fighting for democracy and freedom, now studies show that we need a new approach; people need more help and protection. Granting an unconditional basic income for life will impact both the economy and the social life. Accurately identifying and quantifying this impact is difficult. The influence on employers and employees can be positive when referring to jobs that stimulate employees’ competitiveness. Without the constraint of having a job in order to ensure a certain living standard, individuals are able to develop and search for jobs that will offer them satisfaction and the opportunity to feel fulfilled. Competitiveness will bring better prepared people on the market, having a strong impact on the economy. Also, the introduction of the unconditional basic income implies changing the fiscal policy on remuneration and profit, thus representing a new stage in the tax system. BIBLIOGRAPHY [1] Birnbaum, Simon, 2012, Basic Income Reconsidered: Social Justice, Liberalism and the Demands of Equality [2] J. Cunliffe, and G., 2004, Erreygers, The Origins of Universal Grants: An Anthology of Historical Writings on Basic Capital and Basic Income [3] Clive Lord, 2003 A Citizens' Income: A Foundation for a Sustainable World [4] Leonard M. Greene, 1998, The National Tax Rebate: A New America with Less Government [5] Guy Standing, Michael Samson, 2003, A Basic Income Grant for South Africa [6] Leok Groot, 2004, Basic Income, Unemployment and Compensatory Justice [7] N. Marcu, M. Siminică, 2009, The organization process in the bureacratic type of public administration [8] N. Marcu, M. Siminică, D. Giurascu, 2009, Management of change in public organizations, 2009 [9] Michael L. Murray,1997, "...And Economic Justice for All" Welfare Reform for the 21st Century [10] Philippe Van Parijs, Basic Income: A simple and powerful idea for the twenty-first century [11] Philippe Van Parijs 1995, Real Freedom for All: What (if anything) can justify capitalism? [12] Theobald Robert, 1961, The Challenge of Abundance [13] Allan Sheahen, 1983, Guaranteed Income: The Right to Economic Security Allan Sheahen [14] Robert Theobald, 1967, The Guaranteed Income: Next Step in Socioeconomic Evolution? [15] Walter Van Trier, 1988, Antwerp, Basic Income European Network: Proceedings of the second international conferences on Basic Income [16] Yannick Vanderborght, 2004, Do Trade Unions Form an Obstacle to the Introduction of a Basic Income? [17] Tony Walter, 1989, Basic Income. Freedom from Poverty, Freedom to Work, 1989 [18] Stuart White, 2003, The Civic Minimum: On the Rights and Obligations of Economic Citizenship [19] J. Philip Wogaman, 1968, Guaranteed annual income; the moral issues
122

Annals of the „Constantin Brâncuşi” University of Târgu Jiu, Economy Series, Issue 3/2016
„ACADEMICA BRÂNCUŞI” PUBLISHER, ISSN 2344 – 3685/ISSN-L 1844 - 7007
RISK AND THE FOREIGN DIRECT INVESTMENT - SYNTHETIC APPROACH
LĂPĂDUŞI MIHAELA LOREDANA, LECTURER PHD, “CONSTANTIN BRÂNCUŞI” UNIVERSITY OF TG-JIU,
FACULTY OF ECONOMICS E-mail: [email protected]
CIURLĂU LOREDANA,
LECTURER PHD, “CONSTANTIN BRÂNCUŞI” UNIVERSITY OF TG-JIU, FACULTY OF ECONOMICS E-mail: [email protected]
Abstract:
As part of the international economics flows, FDI always puts a mark on the economic development of a country. The internationalization of a company by investments involves a great many risks, from the lowest to the highest level of involvement. On the basis of these considerations one can assess that the country risk is one of the most important pillars that support the process of internationalization of a company by means of foreign direct investments.
Broadly sepaking, country risk is an important component of the overall risk of trading on international levels. In other terms it can be seen as the likelihood of losses resulting from a series of macroeconomic (GDP decline on the long run, inflation increase, economic crises, etc.), social (conflicts between social classes, civil wars, riots, etc.) and political events (wars, territorial claims, conflicts of interest, etc.).
In order to identify the main country risk factors that influence the decision of corporations to invest abroad, AT Kearney (2004) performed an extensive survery among multinational corporations. Those risk factors that were most frequently mentioned included government regulations (64%), country financial risk (60%), currency or interest rate volatility (51%) and political and social disturbance (46%).[11]
The purpose of this article is to highlight a number of important factors that may affect the realization of a foreign direct investment, in other terms to influence "go-no-go" decisions, that is to invest or not to invest. Also, through the analysis of the influence of country risk over FDI one aims at evaluating the relationship between risk and potential gain resulting from conducting the respective business. The purpose of this article is an attempt to identify and develop aspects that outline a number of risk factors of influence over FDI. Keywords: country risk, FDI, risk factors, economic relation. Clasificare JEL: P33 International Trade, Finance, Investment, Relations and Aid 1. Introduction
A.M. Best* defines country risk as the risk that country-specific factors could adversely affect an insurer's ability to meet its financial obligations. Country risk is evaluated and factored into all A.M. Best ratings. As part of evaluating country risk, A.M. Best identifies the various factors within a country that may directly or indirectly affect an insurance company. Countries are placed into one of five tiers, ranging from Country Risk Tier 1 (CRT-1), denoting a stable environment with the least amount of risk, to Country Risk Tier 5 (CRT-5) for countries that pose the most risk and, therefore, the greatest challenge to an insurer's financial stability, strength and performance - (Annex no.1).[12]
The assignment of CRTs to score ranges is based on A.M. Best’s assertion that the risk in countries can be categorized loosely to provide a basis of comparison, provided that country-by-country differences are acknowledged. Therefore, CRTs can be classified, in a typical scenario, by the following: [13]
* A.M. Best was founded in 1899 by Alfred M. Best with the mission to report on the financial stability of insurers and the insurance industry. It is the oldest and most widely recognized provider of ratings, financial data and news with an exclusive insurance industry focus. A.M. Best has offices in the U.S., London, Hong Kong, Dubai, Mexico City and Singapore. View the company's history to learn more about its role in the global insurance industry.
123
Annals of the „Constantin Brâncuşi” University of Târgu Jiu, Economy Series, Issue 3/2016
„ACADEMICA BRÂNCUŞI” PUBLISHER, ISSN 2344 – 3685/ISSN-L 1844 - 7007
CRT-1: Predictable and transparent political environment, legal system and business infrastructure; sophisticated financial system regulation with deep capital markets; mature insurance industry framework.
CRT-2: Predictable and transparent political environment, legal system and business infrastructure; sufficient financial system regulation; mature insurance industry framework.
CRT-3: Developing political environment, legal system and business infrastructure with developing capital markets; developing insurance regulatory structure.
CRT-4: Relatively unpredictable and nontransparent political, legal and business environment with underdeveloped capital markets; partially to fully inadequate regulatory structure.
CRT-5: Unpredictable and opaque political, legal and business environment with limited or nonexistent capital markets; low human development and social instability; nascent insurance industry.
The country risk is an essential component of the overall risk that characterizes any business party, transaction, investment, etc. This is the result of interaction of the multitude economic, social, policies and financial factors whiche characterize the socio-political and financial-economic environment of the host country. Since the rise and the materialisation of the country risk depends on the complex of events in that country, the person who conducts a business, transaction or investment may not have any control on those events. In conclusion, all he can do is to to forecast events that may influence the actions undertaken and take appropriate measures to protect those actions.
The challenges of direct foreign investments will always be a quite interesting subject for specialists in the field, publications stand proof, having aspects of this field as research themes. By putting in the foreground the analysis of direct foreign investments in the light of the occurrence and manifestation of the country risk, all we do not is to emphasize the importance and the topicality of the study of such themes. I am going to present to you some publications which are based on the two important aspects mentioned above: the country risk and foreign direct investments which have constituted the basis of this study:
1.Kazunobu Hayakawa, Fukunari Kimura, Hyun-Hoon Lee, How does country risk matter for foreign direct investment, Institute of Developing Economies, February 2011;
2. Evica Petrović, Jelena Stanković, Country risk and effects of foreign Direct investment, FACTA UNIVERSITATIS, Series: Economics and Organization Vol. 6, No 1, 2009, pp. 9 - 22, UDC 339.22 (497.11);
3. Duncan H. Meldrum, Country Risk and Foreign Direct Investment, Business economics, the journal of the National Association for business Economists, Basingstoke : Palgrave Macmillan, ISSN 0007-666X, ZDB-ID 9632682. - Vol. 35.2000, 1, p. 33-40;
4.Coplin, William D. and & O’Leary, Michael K., editors, The Handbook of Country and Political Risk Analysis, East Syracuse, New York: Political Risk Services, International Business Communications, 1994;
And the list may continue, the influence of the country risk on foreign direct investment being a theme of great interest for many participants in economic and financial activities on internal and international level.
The purpose of this study consists in outlining an approach to the completion of foreign direct investments in the light of the influence of the country risk assessment.
By this study I am trying to make an introduction to a series of theoretical aspects that emphasize the importance of the influence of the risk by country on foreign direct investment. I also hope that this study to be of help to the future studies on this topic which certainly will never end. 2. Foreign direct investment globally
One of the most important elements that underlie globalization is free movement of capital worldwide, thus in this process particularly complex foreign direct investiţile is one of the most important aspects in the economic development of a country. In both states, which initiates and investment of the receiving states regard the investment as a means of maximising their influence on the effectiveness and cost-efficiency.
Global foreign direct investment (FDI) inflows fell by 16 per cent in 2014 to $1.23 trillion, down from $1.47 trillion in 2013. The decline in FDI flows was influenced mainly by the fragility of the global economy, policy uncertainty for investors and elevated geopolitical risks. New investments were also offset by some large divestments. The decline in FDI flows was in contrast to growth in GDP, trade, gross fixed capital formation and employment (table no. 2). [14]
124

Annals of the „Constantin Brâncuşi” University of Târgu Jiu, Economy Series, Issue 3/2016
„ACADEMICA BRÂNCUŞI” PUBLISHER, ISSN 2344 – 3685/ISSN-L 1844 - 7007
Table no. 2 Growth rates of global GDP, GFCF, trade, employment and FDI, 2008–2016 (Per cent)
Source: UNCTAD, FDI/MNE database for FDI in 2008–2014; United Nations (2015) for GDP; IMF (2015) for
GFCF and trade; ILO for employment; and UNCTAD estimates for FDI in 2015–2016. *Projections. Note: FDI excludes Caribbean offshore financial centres. GFCF = gross fixed capital formation. UNCTAD forecasts an upturn in FDI flows to $1.4 trillion in 2015 and beyond ($1.5 trillion in 2016 and $1.7
trillion in 2017) due to growth prospects in the United States, the demand-stimulating effects of lower oil prices and accommodating monetary policy, and continued investment liberalization and promotion measures. Forecasts for macroeconomic fundamentals and continued high levels of profitability and cash reserves among multinational enterprises (MNEs) support the expectation of higher FDI flows. However, a number of economic and political risks, including ongoing uncertainties in the Eurozone, potential spillovers from geopolitical tensions, and persistent vulnerabilities in emerging economies, may disrupt the projected recovery. [14]
The global FDI decline masks regional variations. While developed countries and economies in transition saw a significant decrease, inflows to developing economies remained at historically high levels.
Synthetic, the evolution of foreign direct investment by region is presented as follows:
Figure no. 1 FDI inows, by region, 2012–2014 (Billions of dollars) Source: UNCTAD, FDI/MNE database (www.unctad.org/fdistatistics).
3. A synthetic approach regarding the connection between country risk and foreign direct investment
Foreign Direct Investments may be defined according to various authors as follows: a)„ Foreign Direct investments consist in the transfer of an industrial package which comprises capital,
technologies, methods of Industrial Organization, managing expertise, marketing expertise, etc. which allow the investor to exercise the right of control over the investment”; [3]
b)” Foreign Direct investments represent the expenditure incurred for the purchase or the creation of economic units, the modernization and expansion of the present and future income, with the purposemof obtaining future income from foreign investors”; [2]
c) The definition of direct foreign investments offerd by the International Monetary Fund is to be found in the Book about balance of payments and in its Supplement. [1] According to that definition, the foreign direct investments
125

Annals of the „Constantin Brâncuşi” University of Târgu Jiu, Economy Series, Issue 3/2016
„ACADEMICA BRÂNCUŞI” PUBLISHER, ISSN 2344 – 3685/ISSN-L 1844 - 7007
is a category of international investments that reflects the purpose of a business entity residing in a country (direct investor) to obtain a long-term collaboration in a company residing in a foreign country (direct investment). [6]
On the basis of the definitions above, we can extract the following aspects: - the risk factors that influence the foreign direct investments are born in the business environment
characterising the host country; - the events which lead to the rise of country risk are controlled by the Government of the country in which the
investment is carried out; - decisions concerning the achievement of a foreign direct investment in a host country should be taken
exclusively on the basis of a solid documentation on the financial and economic and political environment; - the implementation of investments is made only if they provide a safe profit with a minimum of risks; - avoiding the losses in the case of the contracting the investment shoul be a constant concern for investing
companies and these losses may be: loss of opportunities generated by locking the profits made from the investment made, losses resulting from additional costs arising from the adoption of various actions in order to avoid and reduce the risk of loss arising from the capital invested that once lost can no longer be recovered in the host country.
Unlike an investment in general, representing the costs are for obtaining capital goods, foreign investment foreign elements incorporate a (foreign currency, the location of the place where the goods are sold in a foreign country, mediums, different countries, from contractors etc.). Thus, foreign investments representing capital transfers from one country to another in various forms (direct investments, portfolio investments, etc.). [1]
Country Risk can influence the foreign direct investments by means of the following levers: - limitation or restriction of the capital - political, economic or social events (strikes, military conflicts, elections) - loss of profit caused by economic crisis - corruption, legislative instability From the aspect of a domestic company, FDI is one of the instruments for production stimulus, import of know-
how, employment growth, infrastructure development, poverty reduction etc. From the aspect of a foreign company, the above mentioned investments can be defined as any form of capital investment in a foreign company, which enables achieving the ownership control. The operating mechanism of FDI considers establishing a subsidiary of parent firm in a foreign country, which can be investor's full ownership or partial foreign ownership. [15]
Table no. 3 Spread of FDI potential effects
Source: http://facta.junis.ni.ac.rs/eao/eao200901/eao200901-02.pdf
As for the economic component of country risk, the analyst must be able to understand the basic components of
the economy of the host country, its vulnerabilities; in other words, he must anticipate those factors able to affect the general economic environment. Domestic factors of an economic nature can be chategorized in six main groups generically entitled: A. The condition of national economy; B. Sectorial Factors; C. The size of domestic market; D. The domestic financial situation; E. Geographical factors.
External factors concern the economic relations of the host country with foreign investors They may provide a clear image upon the dependence of the country of the situation in the global economy, on the obligations which the country has assumed to foreign investors, the degree of indebtedness, the level of diversification and the processing of exports, the vulnerability to fluctuations in prices on the world market, the rigidity of the imports, etc. External factors
126

Annals of the „Constantin Brâncuşi” University of Târgu Jiu, Economy Series, Issue 3/2016
„ACADEMICA BRÂNCUŞI” PUBLISHER, ISSN 2344 – 3685/ISSN-L 1844 - 7007
can be chategorized in: F. External trade; G. External degree of indebtedness; H. Foreign investments; I. The balance of payments and the exchange rate. [7] 4. Conclusions
Even though the topic presents only some issues regarding the link between foreign direct investment and the risk of the country, it does not highlight the fact that the issue of direct investments in relation to the risk of the country is simple and easy to understand.
On the contrary, the approach of direct foreign investments is carried out both at national and international level, especially that the volume and structure of foreign direct investment influences the level of development of a country.
Located in attention of researchers for several decades, foreign direct investment still remains a broad research topic, which has not lost its importance, but more in the context of the economic and social realities constantly changing, I consider a perpetual FDI analysis necessary, both in terms of the expected benefits but also of the determinants. [16]
The analysis and evaluation of country risk for FDI involve solving major issues such as: [4] a) complete and accurate information on current political and economic situation in the host country; b) detailed analysis of risk factors, and structuring a system of specific indicators; c) building the country matrix through mathematical modelling of the system of indicators; d) evaluating and determining the dynamics of country risk or country risk index; e) formulation, based on the ratings and the country risk index, of strategic alternatives that should also include
elements of risk management, etc. Analysis of country risk (or Country Risk Analysis – CRA) identifies the likelihood of this risk, and specialized
agencies duly rate its components. A deep kowledge of the degree and complexity of the country risk is the premise for the implementation and
development of foreign investments. Investors will decide whether it is cost-effective or not and whether they will allow it to enter the new markets.
The degree of involvement in a specific market increases in direct proportion to the level of risk of the latter. In these terms, the country risk analysis is important not only in deciding to move business abroad but also in elaborating strategies for the installation, the choice of operation type that is to be carried out on a given market, in the strategic planning process of the company or in establishing the conditions for creditation (granting grace periods and reducting interest). [7]
In conclusion, the decision to invest in a particular country is based on an analysis of the factors characterizing the local market of the host country, as well as the opportunities offered by this market in order to obtain profitability.
Among the factors to be considered we can mention: the economic and political stability, the seriousness of governmental institutions, the safety and fairness of the legal system, the accessibility to the information system and the development of the infrastructure of the host country, etc.
5. Bibliography [1] Anghel Ion, Investiţii străine directe în România, Ed. Expert, Bucureşti, 2002; [2]Balance of Payments Manual, Fifth Edition, International Monetary Fund, Washington, D.C., 1993; [3] Băbeanu Marin, Macroeconomie, manual universitar, Ed. Universitaria, Craiova, 2006; [4] Negriţoiu Mişu, Salt înainte: dezvoltarea şi investiţiile străine directe, Ed. Expert 1996; [5] Popa Suzana, The influence of the country risk rating on the foreign direct investment inflows in Romania, International Journal of Economic Sciences, Vol. I (No. 2), The International Institute of Social and Economic Sciences ISSN 1804-9796, 2012; [6] Săvoiu Gheorghe , Popa Suzana, Investiţile străine directe (ISD) în România, Revista Română de Statistică nr. 1 / 2012, Universitatea din Piteşti; [7]***http://www.editurauniversitara.ro/media/pdf/4f50cf451d68aInvestitiile_straine_inainte_si_dupa_criza_..._p._1-12.pdf [8]***http://www.finint.ase.ro/Cursuri%20masterat/Master%20ASE_Management%20si%20marketing%20international/Studiile%20de%20caz/Analiza%20gradului%20de%20expunere%20la%20risc.pdf [9]***http://www.fiscalitatea.ro/perspective-asupra-investitiilor-straine-directe-in-romania-363/ [10] ***http://www.iises.net/download/Soubory/soubory-puvodni/pp093116_ijoes_2012V1N2 .pdf [11] ***http://www.fdi-cri.org/country-risk-and-fdi-inflows.html [12] ***http://www3.ambest.com/ratings/cr/crisk.aspx [13] ***http://www3.ambest.com/ambv/ratingmethodology/OpenPDF.aspx?rc=197697 [14] ***http://unctad.org/en/PublicationsLibrary/wir2015_en.pdf [15] *** http://facta.junis.ni.ac.rs/eao/eao200901/eao200901-02.pdf [16]***http://phdthesis.uaic.ro/PhDThesis/Amarandei,%20Cristina,%20Mihaela,%20The%20impact%20of%20country%20risk%20on%20foreign%20direct%20investment%20flows%20in%20Central%20and%20Eastern%20Europea
127

Annals of the „Constantin Brâncuşi” University of Târgu Jiu, Economy Series, Issue 3/2016
„ACADEMICA BRÂNCUŞI” PUBLISHER, ISSN 2344 – 3685/ISSN-L 1844 - 7007
ANNEX NO.1
Country List - All CRTs
Source: http://www3.ambest.com/ratings/cr/crisk.aspx
128
Annals of the „Constantin Brâncuşi” University of Târgu Jiu, Economy Series, Issue 3/2016
„ACADEMICA BRÂNCUŞI” PUBLISHER, ISSN 2344 – 3685/ISSN-L 1844 - 7007
THE SEPARATION BETWEEN ACCOUNTING PROFESSION AND TAX PROFESSION
IN THE CONTEXT OF SUSTAINABLE DEVELOPMENT IN ROMANIA
MIHAELA-NICOLETA BĂCANU PHD STUDENT, THE BUCHAREST UNIVERSITY OF ECONOMIC STUDIES,
e-mail: [email protected] Abstract
The relation between accounting and taxation is a complex issue. The development of this relation is still in progress in Romania. The purpose of this paper is to analyze the evolution of the accounting and tax profession in Romania for the last twenty-five years and to establish the moment of the separation between the two professions and the impact of this separation on the application of the accounting and taxation treatments, in the context of the sustainable development. This evolution is important to the three dimensions of sustainable development. In this paper it will be taken into consideration a theoretical and qualitative research using as methodology the analysis of the social documents: the regulations regarding the profession of chartered accountant and the profession of tax advisory. The starting point in this research is the fall of the communism when Romania is in research of a new identity. There can be identified three major stages of evolution: between 1990-2000 when the accountant was really important for accounting and fiscal issues, between 2001-2006 when the accountant professionals and tax professionals had different activities and after 2007 when there appeared the Chamber of Tax Consultants and the two professions have been separated through two professional bodies. Keywords: accounting, taxation, professionals, relation, evolution Clasificare JEL: H20, M41, Q01 1. Introduction
Living in a world in continuous change in which the differences between individuals and countries exist by
culture, the medium in which an individual grow up, the profession, the religion, the size, geographical position, the natural wealth of each country, economical possibilities, and the needs of people become increasingly more, there was a need to develop various processes such as the globalization and sustainable development, in order to diminish these differences and to manage the necessary resources for satisfying the needs.
The three components of the sustainable development: environmental, social and economic performance can be maximized using efficiently the limited resources. Accounting and taxation are two important domains for the management of the world’s limited resources therefore the relation between them is important too.
The professionals could be factors that influence significantly the environmental, social and economic performance by the way in which the duties are fulfilled, or by the way in which the legal provisions are applied. The accountant is important because he must chronologically and systematically record all the transactions of an entity, processing the information related to the activity performed and presenting the financial position of an entity taking into consideration the fact that this must offer a true and fair view of the financial position. The tax consultant is also important because he provides services in the field of taxation, performing assistance for tax issues.
The purpose of this paper is to establish the moment of separation of the two professions and to determine the impact of this separation on the application of the accounting and taxation treatments, in the context of the sustainable development. Also, the aim of the paper is to determine the impact of these issues on the three dimensions of the sustainable development.
2. Literature review
We will start the paper by defining the process of sustainable development through the most used definition:
Sustainable development is development that meets the needs of the present without compromising the ability of future generations to meet their own needs. It contains within it two key concepts: the concept of 'needs', in particular the essential needs of the world's poor, to which overriding priority should be given; and the idea of limitations imposed by the state of technology and social organization on the environment's ability to meet present and future needs. [11]
The environmental dimension is generally well understood, even if the measurement of external impacts gives rise to debate. Reporting rarely extends to biodiversity issues. Social performance is normally linked with ethical issues and includes labor practices, human rights policy, product responsibility and the enterprise’s relationship with society.
129

Annals of the „Constantin Brâncuşi” University of Târgu Jiu, Economy Series, Issue 3/2016
„ACADEMICA BRÂNCUŞI” PUBLISHER, ISSN 2344 – 3685/ISSN-L 1844 - 7007
Typical economic indicators in a sustainability report would cover job creation, productivity, outsourcing expenditure, employment diversity and training as a contribution to the wider economy. Economic performance is not the same as the creation of shareholder value. [10]
Albu N. (2013) has analyzed the evolution of accounting profession and stated that international bodies, such as ACCA and ICAEW, have a visible implication in wider accounting issues such as corporate governance and sustainability and these developments extend the role and competencies of accountants. [1]
According to Băcanu (2015) the accounting and taxation have different objectives. So, there was a need to separate the profession of chartered accountant of the profession of tax advisory. [2]
IFAC strongly believes that professional accountants can influence the way organizations integrate sustainability into their mission, goals and objectives, strategies, management and operations, definitions of success, and stakeholder communications. By having a clear and sustainable vision professional accountants can significantly change the way organizations operate. [3]
Strengthening domestic resource mobilisation is not just a question of raising revenue: it is also about designing a tax system that promotes inclusiveness, encourages good governance, responds to society’s concerns over income and wealth inequalities, and promotes social justice. More fundamentally, the centrality of taxation in the exercise of state power means that more efficient, transparent and fairer tax systems, and less corrupt tax administrations, can spearhead improvement on wider governance issues. [6]
3. Research Methodology
This paper is based on a theoretical and qualitative research, using as methodology the analysis of the social documents.
The main research directions are: establishing the role of the accounting and taxation in the context of sustainable development, analyzing the regulations regarding the profession of chartered accountant and the profession of tax advisory, establishing the moment of the separation between the two professions.
It will be pointed out the impact the two professions have on the elements of the sustainable development.
4. Accounting and taxation in the context of sustainable development Accounting is an important tool in determining the performance of an entity, in providing the information
related to the performance of an entity and in establishing the indicators by which the resources can be efficiently managed for meeting the needs. Alongside with accounting, taxation is also an important tool in establishing and determining the fees and taxes owed by taxpayers, the final objective being the collection of the amounts of money by the state for financing the public expenses.
As it can be seen even if the two domains aim the performances of an entity, they have different objectives: accounting is a tool useful for entities themselves for determining its performance and establishing the strong and weak points of their business for improving the prosperity of the entity, but also for all the users of financial information in making their own decisions and taxation is a tool useful for the state for gathering the amounts of money owed by the taxpayers.
Both accounting and taxation target a common point namely the management of the resources, but these resources and the purpose of using these are different. By accounting the resources are managed to be used for the company’s purposes and by taxation resources are managed to be used for public expenses.
Analyzing the accounting and taxation in the context of sustainable development it can be seen that the objectives themselves are identified in the context of the three dimensions. Thus, the objective of accounting, to present an accurate view of the financial performance of a company, can be linked by social performance because the information presented by a company is used by a wide range of users. If the information presented is true and fair, the relation of the company with the society will be improved as the users are the investors, the suppliers, the clients, the creditors, the employees, the state institutions and the audience. It can be linked also by the environment performance because analyzing the information from the Financial Statements the management of a company can measure the position of the company with the others companies similar to it, can make previsions and reorganize efficiently the resources of the environment used and can prevent the waste of the resources. Also, the decisions made by the users, participants in the economic circuit, are influencing the environment performance. Accounting is an important tool for determining factors such as: employment, job creation, productivity, wealth, debts or investments. Analyzing the accounting objective in the context of the economic performance, we can say that the financial information presented by a company is very important for the quality of the activity performed. All the factors presented above are directly influenced by the quality of the activity of the companies.
On the other hand, the objective of taxation, to collect the amounts of money owed by the taxpayers as fiscal revenues, gathers all the three dimensions of the sustainable development. There can be identified a circle process: the economic performance is linked by the factors mentioned above which influence the business environment. The quality of the business environment can be improved by providing practices and policies which help to enhance the methods of
130
Annals of the „Constantin Brâncuşi” University of Târgu Jiu, Economy Series, Issue 3/2016
„ACADEMICA BRÂNCUŞI” PUBLISHER, ISSN 2344 – 3685/ISSN-L 1844 - 7007
collecting the taxes. By collecting the taxes the state procures the fiscal revenues which are further managed for improving the living standards and the environment in which the society is living.
To accomplish these goals in good conditions the professionals dealing with the compliance and enforcement of the provisions of the law have an important role. Also, the relation between the accountant professionals and the tax professionals is important.
Further it will be analyzed the evolution of the relation between the two professions.
5. History of the relation between the accounting profession and tax profession in Romania
In the communist period, Romania applied a centralized economy in which the Body of Chartered Certified Accountants and Authorized Accountants was not accepted, thus in 1951 this body was disbanded. The accounting became an instrument of gathering information for the state, so the accountant had to fulfill financial and accounting responsibilities taking into consideration the practices applied at that moment by organizing the preparation of the financial planning works. According to the Decree No. 79/1971 applied in that period, the accounting expertise and the technical expertise were means of evidence used to clarify certain facts or circumstances of a case in which the knowledge of an expert were required. Thus the chartered accountants were nominated only for performing judicial accounting expertise.
After the fall of the communism, the centralized economy had been replaced by the market economy in which the state does not plan the economic activities. Thus, the economic agents could negotiate the prices and the enterprises were no longer dependent on the state planning. The accountant had to update his responsibilities to the requests of the new economy applied.
This is why in 1992 the Body of Chartered Certified Accountants and Authorized Accountants of Romania was reestablished. The organization of the accounting expertise and that of the activities of the authorized accountants was established by the Government Ordinance no. 65/1994.
So, starting with1994, the accounting profession unfolds according to the provisions of a law. During that period, according to the article 2 line 3 from the Ordinance no. 65/1994 [7] “Chartered accountant
can also organize and lead the accounting of companies, can analyze by specific accounting procedures, the economic, financial and fiscal situations of the companies”. At the same time, according to the article 6, letter e) from the same Ordinance, the chartered accountant “performs other work with a financial and accounting character, tax character, work of administrative organization and informatics”. As we can see from the all presented above the chartered accountant could also perform works of fiscal type. Analyzing the responsibilities described in the law applied in the post-communist period and taking into consideration the classification of the relation between accounting and taxation determined by Lamb, Nobes si Roberts (1998), the relation between accounting profession and tax profession can be characterized by identity, because both the accounting profession and tax profession were in fact the same. Moreover all the fiscal issues were fulfilled by the accountant according to the law.
Over time the Ordinance no. 65/1994 was modified and improved by various ordinances: Government Ordinance no. 50/1997, Government Ordinance no. 89/1998 and Government Emergency Ordinance no. 75/1999, but the most representative change for the relation between accounting and taxation was the Government Ordinance no. 71/2001 on the rules of functioning for the tax consulting activity.
This is the moment when the tax profession appears in Romania. The new Ordinance delimited the tax consulting responsibilities: “Activity of tax advisory consists in providing expert assistance in the preparation of the taxes statements, other tax matters and budgetary duties, such as fines, penalties and compliance with legal provisions and representation before the tax bodies” [8].
Once published, this Ordinance repealed the provisions from the Ordinance no. 65/1994 regarding the exercising of fiscal works by the accountant. So, starting to this moment the accounting profession and the tax profession have separated.
The application of the Ordinance no. 71/2001 have been suspended for a short period of time by the Ordinance no. 94/2004 starting to the 3rd of September 2004 until 30th of March 2005, when the Ordinance no. 24/2005 entered in force.
In 2007 is founded the Chamber of Tax Consultants in Romania. Now the exams for obtaining the qualification of tax consultant are organized by the Chamber of Tax Consultants and not by the Ministry of Finance as they were until 2007.
The two professions are now separated by the organization of two separated bodies. The chartered and authorized accountants are members of the Body of Chartered Certified Accountants and Authorized Accountants and the tax consultants are members of the Chamber of Tax Consultants.
The Government Emergency Ordinance no. 53/2007 for the amendment of the Government Ordinance no. 71/2001 on the rules of functioning for the tax consulting activity establishes more tax consulting responsibilities such as “provision of professional services in the field of taxation; provision of services and specialized assistance for the preparation of declarations of taxes; support and services on procedural tax issues; assistance with the preparation of documentation for legal remedies against debt securities and other administrative acts; assistance for the claims on
131

Annals of the „Constantin Brâncuşi” University of Târgu Jiu, Economy Series, Issue 3/2016
„ACADEMICA BRÂNCUŞI” PUBLISHER, ISSN 2344 – 3685/ISSN-L 1844 - 7007
general consolidated budget, with the fulfilling of legal provisions in force; assistance and representation before tax authorities, including specialized assistance during the course of the tax audit; implementation of tax expertise at the request of the Judiciary bodies, criminal investigation bodies, tax authorities and other responsible bodies; tax assistance in proceedings before a judicial authority”.[9]
Thus, starting with 2007 the responsibilities of the tax consultant and those of the chartered accountant have been clearly defined. The tax consultant can perform activities of fiscal character and the chartered accountant can perform activities of financial and accounting character.
In order to establish clearer the separation between the two professions, in 2013 entered into force the Law no. 149/2013 which specifies that the tax advisories can practice the profession of chartered accountant only if they register as members in the organizations that coordinate these professions and the persons who have the quality of chartered accountant could exercise the tax advisory profession, after they register as members in the organizations that coordinate these professions. [4]
Starting with the 1st of February 2014, the date of entering into force of the Law no. 187/2012 - for the implementation of Law no. 286/2009 on the Criminal Code, “exercising tax consultancy activities by individuals who do not acquired the qualification of tax consultancy, or who have not become active members of the Chamber and by legal entities that were not authorized by the Chamber or which have not been registered in the Register of tax consultants and tax consulting companies constitutes a crime and it will be punished according to the law. Also, exercising any activity specific to the qualification of the chartered accountant and the authorized accountant by unauthorized individuals constitutes a crime and it will be punished according to the law”. [5]
As we can see, in the last years, the separation of the two professions became obvious by adding explicit provisions in the law regarding the exercise of the two professions.
6. The impact of the separation of the two professions
The separation of the two professions had a positive impact over the economic circuit in the context of the
sustainable development process. To present a true and fair view of a company, the professional accountant must fulfill the practices and the
policies established for this domain. There were also established the ethical policies the professionals must fulfill in applying the practices. This has a positive impact over the social performance, because if the accountant remains honest and objective with respect to the application of his profession in the business environment, the financial information prepared by him for a company is transparent and real. The users of the financial information are not negatively influenced if the information published is true and fair and the decisions made are improving the quality of the environment. Also, the shareholders can make previsions and enhancements for their activity based on the information from the Financial Statements prepared by the accountant. The resources used for their activity can be efficiently used. This can improve also the economic environment, there can be created new jobs, the productivity can be improved, the unemployment rate can be reduced etc.
On the other hand, the tax professionals have different attributions: tax consultant must provide professional services in the field of taxation. He has also an ethical code to respect so there is a positive impact over the social performance in this case, too.
We can observe that there are different attributions for each of the two professions and the two domains have different objectives, thus the separation of them is a positive aspect. The companies want bigger profits, but small taxes and the state wants bigger taxes for obtaining bigger fiscal revenues. The targets of the companies are opposites from those of the state, so the professionals’ role intervenes there. The accountant must assure that the Financial Statements of the company are transparent and present a true and fair view, and the tax professional must assure that the taxes are correctly computed, declared and paid. The fulfillment of this principle help to a better development of the three dimensions of the sustainable development.
7. Conclusions
Accounting and taxation are two tools with an important role in the sustainable development process. Starting from the objectives of the two domains, we can observe that both of them influence the three
dimensions of this process. Through accounting a company must present the true and fair view of its financial position and through taxation the state collects the fiscal obligations as fiscal revenues. Both of the objectives can be linked by social performance, economic performance or environment performance. These can be reached if the professionals fulfill their obligations.
There can be identified three stages of evolution of the relation between accounting profession and taxation profession: between 1990-2000 when the accountant has to fulfill both accounting and fiscal issues, between 2001-2006 when the tax profession appears in Romania and the accounting professionals and tax professionals had different activities established by different laws and after 2007 when the two professions have been separated through two professional bodies.
132

Annals of the „Constantin Brâncuşi” University of Târgu Jiu, Economy Series, Issue 3/2016
„ACADEMICA BRÂNCUŞI” PUBLISHER, ISSN 2344 – 3685/ISSN-L 1844 - 7007
For the first period, between 1990 and 2000, the accountant was the main subject for accounting and for fiscal issues, and he had to fulfill the regulation existent in that moment for both of them. The accounting legislation applied in that moment was influenced by the French system, which is characterized by an intense connection between accounting and taxation. So, the legislation had also a large influence on the profession.
Between 2001 and 2006, the period when the accounting legislation and tax legislation were separated through the appearance of the Fiscal Code, the profession had to be separated too, thus the tax profession appeared. This is the period in which an important step for the separation of the two domains was made.
After 2007, the two professions have been completely separated. This is the year when the Chamber of Tax Consultants was founded in Romania. So, the accounting professionals must respect the obligations and the attributions according to their professional body, which is the Body of Chartered Certified Accountants and Authorized Accountants of Romania and the tax professionals must fulfill the attributions and obligations according to the Chamber of Tax Consultants in Romania.
The chartered accountant must present a true and fair view of the transactions performed by a company, and the tax consultant must provide professional services in the field of taxation. This clear separation of the attributions has a positive impact on the economic performance, but also for the environment performance, because if the Financial Statements are not influenced by the tax issues and the companies present transparent and real information, the taxes will be computed at their real value.
8. Bibliografy
[1] Albu N., Exploring The Recent Evolution Of The Accounting Profession In Romania – An Institutional Approach, Accounting and Management Information Systems, Vol. 12, No. 4, pp. 537–552, 2013; [2] Băcanu M.-N., Romania from Connection to Disconnection between Taxation and Accounting - a Comparative Analysis of the Two Areas, Analele Universitatii Ovidius – Constanta, 2015; [3] IFAC, Sustainability Framework 2.0 Professional Accountants as Integrators, Professional Accountants in Business Committee International Federation of Accountants, New York, USA, 2011; [4] Law no. 149/30.04.2013 - regarding the approval of Government Ordinance no. 23/2012 amending and supplementing Government Emergency Ordinance no. 90/2008 on statutory audits of annual accounts and the consolidated annual financial statements and Government Ordinance no. 65/1994 regarding the organization of accounting expertise and authorized accountants and amending other laws; [5] Law no. 187/2012 - for the implementation of Law no. 286/2009 on the Criminal Code; [6] ***http://dx.doi.org/10.1787/dcr-2014-11-en, OECD, Tax revenues as a motor for sustainable development, in Development Co-operation Report 2014: Mobilising Resources for Sustainable Development, OECD Publishing, Paris, 2014; [7] ***http://www.cdep.ro/pls/legis/legis_pck.htp_act_text?idt=14498; [8] ***http://www.clr.ro/rep_htm/OG71_2001.htm; [9] ***http://www.clr.ro/rep_htm/OUG53_2007.htm; [10] ***www.icaew.com/sustainablebusiness, ICAEW, Sustainability: The Role Of Accountants Sustainable Business Initiative, 2004; [11] ***www.un-documents.net/ocf-cf.htm, Our Common Future: Report of the World Commission on Environment and Development, United Nations, July 1987;
133
Annals of the „Constantin Brâncuşi” University of Târgu Jiu, Economy Series, Issue 3/2016
„ACADEMICA BRÂNCUŞI” PUBLISHER, ISSN 2344 – 3685/ISSN-L 1844 - 7007
GREEN DEVELOPMENT FOR THE CITIES-INTEGRATED MANAGEMENT
LIVIU NEAMŢU
ASSOC.PROF.PHD, CONSTANTIN BRANCUSI UNIVERSITY FROM TARGU JIU ADINA CLAUDIA NEAMŢU
PROF.PHD, CONSTANTIN BRANCUSI UNIVERSITY FROM TARGU JIU e-mail: [email protected]
Abstract This paper aims to provide a policy model to improve green spaces in urban areas. Current management
structures leave much to be desired and, unfortunately, they do not seek to manage the green spaces on types of activities and these activities are not integrated into a unit structure to ensure coordination of operations for maintenance and expansion of these spaces.
Given the necessity of an integrated management for urban space, the model proposes solutions to eliminate functional overlaps by creating a set of action, together with arrangements for its effective support. Developing effective solutions to managing green spaces for recreation and leisure becomes an obligation for the next period under conditions of increasing green areas arranged as parks and other types of green spaces and hence an increase for the cost of their administration.
On the other hand, the paper addresses the issue of integrated management for both, green areas and recreational and leisure facilities existing within the urban areas, by giving more importance and impact for these spaces within communities.
Keywords: urban, policy, green areas, managerial structures, smart growt.
JEL Classification: Q2, Q5, R5, M1, O2
1. Introduction
The qualitative appreciations concerning the identity of the green areas, of the quality of their arrangement and
of the coherence of the system of urban green areas does not create a unitary system in terms of the space and are completely isolated from the extra territory (cameron and others, 2012; campbell, 1996).
Those surfaces included in the green area of a green city are not only compact areas, clearly defined and arranged as parks. Inventories for improvements and extensions of green areas must take into account the greenery portions and trees among blocks, and also landscaped green space within households or peripheral green areas of the city.
Cities are facing an acute shortage of green spaces.It is a common problem, regardless of the season. One by one, green areas have left the place in the city for parking place or diverse building: from supermarkets to firms, residential construction and even churches. The grass was quickly replaced by asphalt. Also, the local species of trees and shrubs that create identity of the region for a particular city were cut, and in their place were planted other trees which do not integrate into the landscape site specific zone of the urban center.
Most affected by the lack of these green areas are residents living in downtown or city center so they have often only 3-4 square meters of greenery per capita. One thing not by chance if we think that in these areas is the highest density of population related to the surface expressed in square meters, in most cases more than half the city's population living here.
For example, green spaces decreased continuously in several cities in Romania regardless of their demographic size or geographical positioning. In terms of population size, the most affected were large and medium cities who felt negative influences of rising real estate market that had sometimes aggressive tendencies. Also, in terms of geographical location, the most disadvantaged cities were those in the hilly areas which due to misconceptions that are located in areas with more green space outside the city, did not favor them green areas inside their urban territory. The phenomena were felt at the level of exaggerated urban land concession from public domain.
Gren cities have to be urban areas where green space is wanted, appreciated and maintained by every inhabitant. This is why the cities have to promote the establishment of an efficient urban management system of green areas and civic awareness. In order to achieve this, we have to develop a specialized service or even department able to manage these activities and able to directly be involved in various partnerships from the private field.
134

Annals of the „Constantin Brâncuşi” University of Târgu Jiu, Economy Series, Issue 3/2016
„ACADEMICA BRÂNCUŞI” PUBLISHER, ISSN 2344 – 3685/ISSN-L 1844 - 7007
This is how the cities will be able to develop and implement pilot projects for arranging and using green areas. It is important to select of base of potential investors in projects of green areas arrangement. Investors will be encouraged to take part in these projects through the possibilities given by the use of these areas in partnership.
In addition, local institutions in partnership with NGOs and various institutions, donors, economic agents will be able to organize information and civil information actions and campaigns, in order to make the population aware and receptive towards urban space arrangement problems. It is even necessary to create some Advisory Councils for problems of “green” arrangement of urban areas, councils that will observe and assess the quality of actions developed by the authorities in the field. These Councils will periodically publish assessment and observation reports.
It is necessary to involve the community in the management of green spaces, in order not to develop practices for withdrawing them from the public patrimony. Citizens’ opinion has to become decisive in the matter of green spaces arrangement for children’s amusement as well as for adults and elderly amusement.
The main objective should propose a city to become a green city is to hold a minimum of 40 square meters of green space per capita according to the World Health Organization (caspersen and others, 2006).This objective is almost impossible without a coherent strategy and policy together with an action plan and appropriate organizational formulas. 2. Future urban development. Urban smart growth and green cities
The lifestyle based on consumption is the way to generate urban sprawl. Urban expansions are caused by
changing lifestyles and consumption and not necessarily by population growth, but also are caused by tolerant strategies regarding urban environment.
However, many more people migrate from rural to urban areas because on the cities there are more jobs, and agriculture does not provide sufficient income.Therefore, the cities are expanding continuously, so natural spaces are fewer and fewer. If in 1900 the people living in the cities amounted less then15% of the population, in 2014 more than half the population was domiciled in cities with at least 100,000 residents. Trends for the future is obvious that.Worldwide, the cities grow in a faster pace than the number of population so the quality of life decrease in urban areas and many problems related to the environment occur.
It requires an action plan to address the two cases of extending the model of urban development intensive: consumption over the needs of the standard living space (approx. 25 sqm/inhabitant) and tolerant policies of construction and spatial planning (urban planning).
Urban policy will be one that the principles of action will have an important role in preventing aggressive urban sprawl and promoting and maintaining a balanced intensive-development complemented by extensive development only to certain areas. Besides reviewing the strategies underlying urban plans, there are needed a green taxes reform, one which goes gradually toward pollution taxation and for inefficient use of land, materials and energy.
Current estimate of the urban population growth rate is over 5%, which means a doubling of urban population in about 20 years, and many areas of land will be transformed into an urban area.
Today more than ever, the cities tend to consume land resources they have for future decades of development because their agressive urbanization. The main risk that come out inside the cities is the built area consumption over the standard needs of a human being. This phenomenon translates into an aggressive real estate development.
High demand for new housing, but also for business centers and commercial areas has led to an accelerated pace of construction in urban areas. Chaotic development of cities affects the life quality of residents, and the entire business environment, resulting in considerable losses.
Aggressive and free from strategy real estate development can have serious consequences: the destruction of green belt areas of cities, land with immediate development potential as green areas occupancy and real estate penetration in existing green areas. Currently, cities face these problems generating considerable decrease of life quality.
The number of people suffering from lung disease in Romania (bronchitis, asthma, etc. angina) or heart (myocardial infarction or ischemic heart disease) has dramatically increased. For example, according to Ministry of Healt in Romania, where in 1995, 700 inhabitants in 100,000 suffering from ischemic heart disease, in 2014 was their number reached 1500 in 100,000 inhabitants.
Cities administration and land owners together with estate developers should consider implementing concepts such as "smart growth"or "urban renewal" to prevent critical problems, as happened in western cities of Europe 50 years ago (sanesi and chiarello, 2006).
However some cities have managed to find balanced solutions between urbanization and the preservation of the natural environment, particularly through green areas.
In cities such as Graz and Vienna (Austria) and Helsinki (Finland) there are at least 110 square meters of green space per capita. In cities like Brussels (Belgium), Copenhagen (Denmark), Liverpool (UK) and Hamburg (Germany), each inhabitant has between 30 and 35 square meters of greenery. At the same time some large European capitals such as Stockholm and London, currently owns 83 and 64 square meters per capita (baycan-levent and Nijkamp, 2009).
135
Annals of the „Constantin Brâncuşi” University of Târgu Jiu, Economy Series, Issue 3/2016
„ACADEMICA BRÂNCUŞI” PUBLISHER, ISSN 2344 – 3685/ISSN-L 1844 - 7007
Vienna for a long time holds one of the first places in the world in terms of quality of life. Vienna is a model in respect of landscaping green areas. But what are the reasons why it is considered a model and what are the differences from the model applied in Romania?
The project European Urban Audit of Eurostat assessed the quality of life in 258 cities in the EU and found that Vienna ranks first in most areas related to quality of life, the use of public transportation and availability of green areas, which demonstrates why Vienna is considered a model in the field of balanced development.
But what are the reasons regarding Viena as a model and what are the principles relating to environmental protection applied in Vienna? A very important role in ensuring high quality of life it is represented by the green areas already mentioned. Almost half of Viena surface is covered by greenery which determines very good air quality.
Regarding organizing system and management of green areas, there are specific departments that manage these areas. It is those departments of City Hall of Vienna whose activities have a direct link with nature and green spaces, such as MA 22 (Environment Protection) and the MA 49 (Forest Service) with about 100 employees - experts in environmental legislation, noise protection, or nature protection, etc. The main aim of experts of the city is keeping qualityof the current green spaces, so city of Vienna to offer after 50 or 100 years the same better condition of life and environement.
In Vienna there are 18 protected areas that occupy about 15,000 ha, comprising a national park, a protected biotope as well as more than 400 natural monuments.The oldest natural monument in Vienna is an ancient yew tree with a thousand years (Taxus baccata) remaining - according to tradition take - from a yew forests of the Roman Empire. Approximate 30.66% of the surface of Vienna represents protected areas.Lainz Zoo has a surface almost equal to that of the only national park in Vienna, Donau (Danube Valley),and along this it is the largest environment protected surface, each occupying about 5.5% from total protected area in Vienna.The most popular green area protected in Vienna - which in the meantime has been included in the route of the annually marathon held by the city, highly appreciated at internationally level - is Prater Park.
In addition, Forest Service of Vienna's City Hall manages Rax and Schneeberg areas as well as the Hochschwab massif, a surface of about 32,000 ha of forest, grassland and meadows, which allows activities such as forest management, tourism, hunting and fishing being coordinated that way to ensure water sources protection.
3. Development policies of green areas in an urban smart growth process
Local authorities from urban environments have to take notice of the existing deficit of green spaces and based
on a development strategy of the green space they have to develop a coherent support policy of this strategy. The integrated arrangement policy of the urban territory will have to comprise the action principles within the
plans developed within the strategy on at least 6 main directions. This study are proposing a policy model regarding the green spaces from the urban environment that shows
some ways to joint the efforts in order to provide a better environment and living quality, because noise, polluted air, hard traffic, green environment neglecting in favour of built space, the lack of environmental and green areas management and the lack of a strategic planning can result into health problems and a lower quality of living standards.
Based on the legislation in the field, we will have to fund a developing policy of the green environment specific to the town and adapted to the concrete conditions. The main measures should focus on:
1. The sustainable protection and management of green spaces as public interest objectives of the urban environment so that these areas could be efficiently managed by means of general town planning. Thus, the town should take the measures necessary in order to avoid the damage of the green spaces in the developing areas and, implicitly, of the life quality of the inhabitants, measures leading to the maintenance and the increase of these surfaces.
2. Improving the urban environment by correlating the increase of the surfaces with green spaces arranged in report to the built surface, suggesting thus a limit of the occupying percentage of the field under 50%, a limit that should have to be imposed by the local legislation for each landlord. Based on this policy, there will be their sustainable protection and management, and also the increase of the inhabitants’ living standards. The green spaces of the strongly urbanized localities have a powerful influence on the inhabitants’ life quality.
3. The efficient management of the green spaces, based on evaluating indicators for every green space, park, planted alignment and square, becoming thus different and attractive places in frame of the developing areas of the town. One of the main directions of an efficient policy in the fields is the one of keeping and developing the biodiversity of the green spaces in the town. By arranging them, the inhabitants may have the possibility to have contact with species of the wild flora so that this interaction could lead to the increase of the awareness regarding the environmental problems. Regarding the impact on the environment, this will be positive and the green spaces register as one of the most important tools for improving the quality of the air, of the water and of the soil.
4. Project-based development represents the approaching solution of the developing policy of green spaces. The simple development of the supporting strategy of green spaces development cannot be efficient without the existence of concrete project in frame of a plan developed on the following years. Accessing funds of different environmental programmes and regional development should be a priority for the following period, considering the fact that the necessary funds cannot be covered by the town’s budget and the participation of the private environment.
136

Annals of the „Constantin Brâncuşi” University of Târgu Jiu, Economy Series, Issue 3/2016
„ACADEMICA BRÂNCUŞI” PUBLISHER, ISSN 2344 – 3685/ISSN-L 1844 - 7007
Also, the increase of green spaces surfaces and the closeness of their size, per inhabitant, to the European standards will be able to be accomplished only by means of governmental support. The projects will be oriented towards: the development and modernization of the green spaces and the settlement of new parks, squares and planted alignments.
For that, the local authorities should lay down projects that should be selected in order to be financed. 5. Forbidding constructions on green areas based on the demand on the real estate market should become the
basis of the developing policy of the green area, considering several aspects: the damage of the green spaces on the territory of the localities caused by their destruction as a consequence of the development of the economical and social activity; the necessity to improve the environmental factors and life quality by increasing the green spaces surfaces in localities, sustainably protecting and managing them; the impossibility of a corresponding environmental management in the localities, in lack of an immediate regulation and of a strategical planning in this field. Thus, the regulations should be also transposed in decisions of the Local Councils, so that the change of destination of the fields arranged like green spaces and/or regarded as such in the urbanism documentations, the reduction of their surfaces or their migration are totally forbidden, no matter the juridical system of those fields. Also, the administrative or juridical documents emitted or contracted by disrespecting the previously mentioned stipulations should be hit by an absolute nullity.
6. Establishing fines for disrespecting the regulations referring to the green spaces will have to become a priority of the local policy.
It is necessary to keep an evidence of the occupying degree of the field for different developing areas and to establish some acting priorities also reflected by the building authorizations granted in frame of these areas. Disrespecting these regulations and the building authorizations constitute a contravention and may be sanctioned with fine, for natural persons and judicial entities.
4. Conclusions
The process of a community economic development must be accompanied by the identification of the impact on
the natural environment and by establishing mechanisms to control and limit harm. Also, the local economic development should be responsible for the support of the approach of the existing
environmental problems. The key issue for sustainable development of urban green spaces is the reconciliation between two human aspirations: the need for further economic and social development and environmental protection and improvement.
To prevent adverse functional developments cities will have to achieve a functional zoning strictly on functions and densities, indicating the percentage of occupancy (CAN), coefficient of land use (CLU) and multiplication indicator of development land (as UNCHS Habitat: media between the average price of land with public utilities in urban area and the land outside without public utilities) that will be essential in making decisions about urban development in the area for both private and public investors.
To coordinate the management of functional city areas and also of the green areas is necessary to conduct a management plan of public and private real estate properties to meet future demand for land without causing damage to the balanced development of the city and the environment surrounding areas following some directions: § ensuring the control of the supply of urban land available for construction by coordinating urban development
planning, management of urban land and land taxes; § influencing behavior of the owner/user of land by local regulations for the General Urban Plan; § improve the performance of City Hall in the public domain management, by landscaping the green spaces and
recreational and leisure areas in order to generate income and reduce maintenance costs of the land. At administrative level, changes will be necessary in order to create the organization structures necessary for
applying the support strategy and politics of green space development. Organization reform measures at institutional level in local public services refer to:
1. Creating specific organization structures able to manage the integrated development of green spaces. 2. Providing this structure capacity to fulfil the development objectives of green areas. 3. Increasing the capacity to fulfil its duties at the level of urban arrangement. In order to achieve this it is
necessary to pass the objectives and measures through the sustainability strategy for “green development” on the list of priorities.
Beyond the strengthening of the specialized operationalization structure capacity, this organization will allow to create the premises for: § increasing the flexibility towards change; § establishing a specialized professional and neutral service; § simplifying administrative procedures; § increasing the transparency level; § decentralization decision etc.
137

Annals of the „Constantin Brâncuşi” University of Târgu Jiu, Economy Series, Issue 3/2016
„ACADEMICA BRÂNCUŞI” PUBLISHER, ISSN 2344 – 3685/ISSN-L 1844 - 7007
5. Bibliography
[1] Baycan-Levent, T., Nijkamp, P., Planning and management of urban green spaces in Europe: Comparative
analysis, Journal of Urban Planning and Development , 135.1 (2009): 1-12. [2] Cameron, R. W., Blanuša, T., Taylor, J. E., Salisbury, A., Halstead, A. J., Henricot, B., & Thompson, K.,
The domestic garden–Its contribution to urban green infrastructure, Urban Forestry & Urban Greening, 11(2) 2012: 129-137.
[3] Campbell, S., Green cities, growing cities, just cities?: Urban planning and the contradictions of sustainable development., Journal of the American Planning Association 62.3 (1996): 296-312.
[4] Caspersen, O.H., Konijnendijk, C.C., Olafsson, , A.S., Green space planning and land use: An assessment of urban regional and green structure planning in Greater Copenhagen, Geografisk Tidsskrift-Danish Journal of Geography, 106 (2) 2006: 7-20.
[5] Kongjian, Y., Principles and Practices of Affordable Urban Green Space, Journal Landscape Architecture, (1) 2007: 55-64.
[6] Lo, A.Y., Jim, C. Y., Willingness of residents to pay and motives for conservation of urban green spaces in the compact city of Hong Kong, Urban Forestry & Urban Greening 9.2 (2010): 113-120.
[7] Neamțu, L., Neamțu, A.C., Strategic Management, Brancusi Academics, Targu-Jiu, Romania, 2010. [8] Rosol, M., Public Participation in Post-‐Fordist Urban Green Space Governance: The Case of Community
Gardens in Berlin, International Journal of Urban and Regional Research, 34.3 (2010): 548-563. [9] Sanesi, G., Chiarello, F., Residents and urban green spaces: the case of Bari." Urban Forestry & Urban
Greening, 4.3 (2006): 125-134. [10] Selitsaniotis, I., Nikolaou, K., Planning for the upgrading and increasing of urban green in the city of
Larissa, Greece, Journal of Environmental Protection and Ecology, 10 (2), 394 (2009).
138
Annals of the „Constantin Brâncuşi” University of Târgu Jiu, Economy Series, Issue 3/2016
„ACADEMICA BRÂNCUŞI” PUBLISHER, ISSN 2344 – 3685/ISSN-L 1844 - 7007
THE MANAGEMENT OF THE SUSTAINABLE DEVELOPMENT OF CAREER – GRAND SCULPTOR CONSTANTIN BRÂNCUȘI
CORINA ANA BORCOȘI
SCIENTIFIC RESEARCHER II, “CONSTANTIN BRÂNCUȘI” UNIVERSITY, e-mail: [email protected]
Abstract
The specialization in a single domain of activity throughout the entire working life is no longer active mode to work now and less so in the future. The management of the sustainable development of his career contribute to find those activities that will bring the individual rewarding and not only. Working made with pleasure ensures the independence of the individual, freedom, fulfillment emotional. The sustainable development of the career offers the possibility to people to be a grant support and for the others. Keywords: management, sustainable development, career Clasificare JEL: M40, M41
1. Introduction The management of career aims to help find those activities which, taken to the individual satisfactions
and not only. The work done with pleasure ensure individual independence, liberty, emotional fulfillment, it is stimulating, enabling people to provide support and others [1].
Discovering those activities appropriate to each person, brings confidence and motivation to always return with fresh forces wherever needed, whenever life demands it.
Dissatisfaction at work causes exhaustion is very hard to work all day on projects that, to you personally, do not mean anything [2]. Negative feelings about the service that you do not like are present in your spare time; when you theoretically should rejoice that you are really free to do what you like.
Our continue evolution is natural, we are always eager to learn new things, and when we are bored at work means that it requires a change.
Specialization in one field of activity throughout life is no longer active mode to work now and much less in the future.
We are influenced in our career, especially in the labor market requirements and choices in their private lives [2]. To make the best decision on:
- work in which we want to operate; - the chosen specialization; - time chosen to make a change, means to ensure fulfillment at work, our personal happiness. 2. The management of career The management of career is the art to satisfy your own aspirations, to combine harmoniously the
individual needs with of the organization needs [6]. The steps of implementation career management as follows. A. Study of current professional situation Are considered professional situations that are challenging to undertake more in life and career following
[2]: a. Every individual seek meaning in the work they undertake in life that he lives. People feel that
life no longer rewarding, do not feel rewarded for their efforts. b. Individuals can not do the same work only the desire to earn money. People will not be able to
change career immediately. But those who make their courage and make a plan by which to act will surely succeed.
c. Those who are injured and are reluctant to seek work that suits them are those who have been made redundant or who have been victims of discrimination. They no longer have the courage to take a new start, although they are aware of the need to continue working.
139

Annals of the „Constantin Brâncuşi” University of Târgu Jiu, Economy Series, Issue 3/2016
„ACADEMICA BRÂNCUŞI” PUBLISHER, ISSN 2344 – 3685/ISSN-L 1844 - 7007
d. Individuals bored cap that have worked hard for a long time, although they are aware that they need to change, no longer have the energy, the determination to do it.
e. There are people who want to be on your own, feel they can have their own business. There are those who can no longer handle growing stress at work. Work on their own individual can satisfy needs that were neglected in the workplace where the individual was just hired.
f. When the individual is close to retirement and wants to withdraw all or part of the workplace where they work. There are people that working in the same job but reduce their work schedule. And individuals who are completely changing careers or retire permanently from working life, cultivating passions that have not had time until then: travel, sport, retire to the country etc.
Once established the professional situation in which is the individual, he must establish the position it wants to reach. For this he must get to know himself very well. Only by understanding each who he is, what value does have, type of personality is, he may find what kind of job activity and what will make him happy. There is no only one course of action for each individual but certainly only one is most advantageous.
B. Self-assessment Self-assessment it makes every individual in this stage crossroads of his professional life, and not only has
to be as realistic as possible. It allows the individual to think clearly the items to their own needs, experiences acquired, the personality traits he has.
Self-assessment process includes several stages [2]. The first stage is the setting for one person that matters. Values represent a set of principles, quality standards etc. that have importance for an individual. We have our own values. They give meaning to our life. May or may not be linked to our work. As a representative set of values can include the following [2]:successful fulfillment of tasks; advancement; autonomy; creativity; teamwork; financial stability; beneficence; inner peace, harmony; sense of satisfaction, joy, happiness; enthusiasm; friendship; fun; family happiness; respect.
The next steps are to identify the most important values and selection of these ten most important values needed for future employment. The last step is to compare personal values with those required for the new job you want. So, new personal values are set to be appropriated to access a new job that we want in the future.
In election of the new job is always recommended to raport to personal list of values to not forget for a moment what we really want: a job on our own values measure [4].
C. Attitudes There are different attitudes, in which life tests us (whether life lived to work, whether it be our personal
lives), to be analyzed and known, when we want to choose a new job. Still remember some attitudes that characterize us, maybe many of us [2]:
§ I have confidence in myself and in my abilities; § not boast, considering that, for the good works they do will be noticed by the right people; § know pretty well what field are good, they can perform; § they are able to invest more time and energy into my work; § because relationships are important, develop and maintain relationships with people inside and
outside the company where I work; § I set short term goals, they always realised.
Although most people do not like change because it can be difficult, uncomfortable, it can take when necessary (when the individual is ready to change) a satisfactory job. Doing change we give up away at what familiar, known, is venturing into the unknown with fear, with some uncertainty, having only hope that the way we have chosen is the most favorable. Before making the step towards change, each individual must self-assess their resistance to change, its degree of flexibility in the face of new challenges.
There are several attitudes of individuals in the face of change [2]: § are always people looking for change; § are often taken aback by the change at work; § encourage colleagues to always experiment; § looking forward to change always work or career.
When work becomes unsatisfactory for an individual is necessary, in order to find job satisfaction, accept and initiate change.
D. Personality traits To know us better we must know what personality traits we each as individuals. The essence of who we
are can not be changed, but we can change behavior. We have found that concordance between personality traits of the individual and the work that they can the best. Among the most important personality traits that an individual must have in order to have a successful career include [2]: likes planning; collect all the information prior to realise anything; prefer to lead rather than be led; gets bored quickly; often thinks about what could
140

Annals of the „Constantin Brâncuşi” University of Târgu Jiu, Economy Series, Issue 3/2016
„ACADEMICA BRÂNCUŞI” PUBLISHER, ISSN 2344 – 3685/ISSN-L 1844 - 7007
happen, not to what it is happened in reality; not rigorously follow the instructions. By comparing personality traits of individual with the necessary working environment currently, if there
are any irregularities multiple, we can conclude that we have a reason to be dissatisfied with their current job and are therefore entitled to seek a new job.
All items above helps us to implement the next stage of career management namely action in the desired direction.
E. Action Directions and mode of action depends on the concrete situation in which are the individual. Whether it's
an injured person and hesitant, an employee bored and capped who wants to work on their own, whether in retirement or simply unwilling to do the same work although need to earn money, he is aware that it can not continue.
Where, for an individual's daily routine at work has become unbearable, knowing, however, that should earn a living by working, it would like a change of job, although reached professional and financial levels where it is difficult to quit [2].
It has a successful career and still does not feel motivated to continue working in the same job. If willing to discover their real interests and begin to plan the next stage of his career, then he will be able to find a new job that unconsciously wants it.
Once set that really wants another job, follows several steps: improves self-confidence; own self-evaluation; paying more attention to interpersonal relationships; do not forget what caused him to seek change; improves professional knowledge on the current, or if they want a career in a new field, acquire new knowledge in the chosen field; actions must move steadily towards the stated goal; analyze bottlenecks and opportunities arising in actions.
The action plan itself, which develop and implement an individual, whose life work was installed routine, shown below [2]. This includes:
a. establish professional divisions of major interest; b. to take action to get more information about the new job; c. determining the period when it is considered most appropriate to be changed; d. availability for any opportunity that arises; e. scheduling business meetings or personal gain new information and meeting people; f. effective specialization for new employment target; g. work on the new job, to begin with, even part-time work.
And so, the person's daily routine discontent deeply, managed to open the way to a new job, that and wanted and to which were directed all his actions from the time that he wanted a change in his professional life.
Ten items are considered to be the key to success in the life of any individual. These are [2]: a. curiosity sprang from a desire to know, to learn new things; b. determination; c. always perseverance in obtaining results; d. empathy; e. the flexibility to be able to make the necessary changes at the right time; f. the continuity of operations; g. humor; h. intelligence, that leading to realise a efficient work, of quality; i. optimism - total confidence that everything was planned will achieve; j. respect for self and others.
Some of these items can be acquired native and others are obtained through education and self-education throughout life.
All these elements, which are the key to success in life, accompanied him throughout his artistic life successful Romanian sculptor Constantin Brancusi. Relevant aspects of the great sculptor career are listed below.
3. Aspects of the great artist career - Constantin Brâncuși A. Great sculptor Constantin Brâncuși – aspects of his life and career in Romania The great sculptor Constantin Brancusi was born on 19 February 1876 in the village in Gorj county
Hobiţa. He learned for two years at a primary school in Peştişani, then going down another two years at the school
in Bradiceni [3]. His desire for independence manifested at a young so that at age 11 ran for the first time at home, he left
141
Annals of the „Constantin Brâncuşi” University of Târgu Jiu, Economy Series, Issue 3/2016
„ACADEMICA BRÂNCUŞI” PUBLISHER, ISSN 2344 – 3685/ISSN-L 1844 - 7007
school to work in Targu - Jiu. The second time she left home in Slatina, where he entered as a "servant at an inn" [3], where he stayed
until he managed to raise the money needed to go by train to Craiova (1889). In Craiova "came in a little shop in the pub and shop in Station Square Spirtaru brothers" [3] and after
almost four years left to work at "grocery of Ion Zamfirescu" [3]. She worked hard in Craiova, from the early age of thirteen.
Working for Ion Zamfirescu he was noted for his skill to carve wood and he was commissioned to build a violin. The great sculptor worked on the violin an entire winter without hurry, "combining a resin rare" [3]. The fiddler who played in the pub where Constantin Brancusi work, tried the violin, has charmed listeners with its sonority. After this event, the life of the great artist change unexpectedly because among auditors sounds violin charmed include "county counselor Grecescu and Badea - minister of prefectural" [3] which facilitates Constantin Brancusi's admission to the School of Arts and Crafts Craiova (September 1, 1894).
At school he was a good student, eager to learn, acquiring a solid technical here that will be helpful in the future. He learned the art of carving, modeling technique, through polling carpentry, turning shop and mechanical. He realized that everything started to be brought "to an end" [3].
He graduated from the School of Arts and Crafts in Craiova after four years and not five (as it was during normal school) in 1898, the good results and qualities "exceptional". During his studies he received a scholarship granted even Madona Dudu Church.
In the summer of 1897 he took a trip to Vienna, where he worked in the furniture factory "Tonetti" noncommercial there, among other things, the art of bending wood.
In 1897 he participated in his first public sculpture presented at the exhibition opened in Craiova Bibescu Park with a bust of Gheorghe Chitu, who was a former member of the Romanian Academy and founder of the School of Arts and Crafts in Craiova.
Fill in 1898, the same year of graduation at the School of Arts and Crafts in Craiova, School of Belle Arts in Bucharest [3] (he was 22 years old). Bucharest came to a scholarship of 200 lei per year, which, in the school year 1900-1901, Madona Dudu Church trustees and a double, but even so it means very little for his needs for food, rent and education.
The official doctrine of the school School of Belle Arts in Bucharest was to evoke victories of great princes and create sculptures commemorative (by creating monuments dedicated to the greatest figures of national history) leaving no place for creating works authentic, original. So, while studying at the School of Belle Arts in Bucharest, Constantin Brancusi won bronze medals and honorable mentions, which were at an average level. Among the works created during this period include: Ecorşeul and Portrait of Ion Georgescu-Gorjan. The great sculptor obtains authorization to do dissections on corpses, Faculty of Medicine, to reflect accurately the human body in his works. Ecorşeul success is even a work that shows how seriously study "the anatomy of the human body and outstanding technical mastery" [2]. It is the first success is his first work exhibited in Bucharest.
Dimitrie Gerota, doctor (who claims his life along the great sculptor), his attorney Constantin Brancusi order to execute the bust of General doctor Carol Davila, who was to be installed in a military hospital courtyard.
Constantin Brancusi, in 1902 graduated from the School of Belle Arts in Bucharest and decided to continue their studies abroad.
In 1907, hired to carve the tomb of a wealthy landowner in Romania, Brancusi carved a statue representing a young woman kneels called Prayer, which is the first stage of its evolution by simplified forms [7]. With all that created in Targu Jiu: Gate kiss, Endless Column and The Table of Silence, Constantin Brancusi changes the concept of monument, which is no longer required by its features formal autonomous, but through the relationship that the sculptures maintain with each other and with their environment [8]. B. Great sculptor Constantin Brâncuși – aspects of his life and career outside of his country
In 1903 he goes to Munich, via Vienna and Salzburg, where he stopped for a while. Munich city was considered at that time, the "New Athens of the North" [3], due to its museums, summer schools and artistic life. Because he did not know German, Constantin Brancusi was done pretty hard to Munich. He visited museums, admired paintings of Renaissance masters, but decided to go further in Paris. The trip to Paris last long because he do not have the money for the trip. He arrived in Paris in autumn 1904. He visited the city, museums and parks. The beginning of his life spent in Paris was the hardest part of life, because she had to work to support them. "Sometimes I kept the walls do not fall. Hunger and sickness. I hung over the bed banners reading tips that I gave myself only in moments of doubt "[3], told the great artist. Of these tips include:
§ "Remember that you are an artist!" § "Do not lose courage; do not be afraid of anything!" § "You'll get through it! Create like a god, command like a king, work like a slave! [3]"
142

Annals of the „Constantin Brâncuşi” University of Târgu Jiu, Economy Series, Issue 3/2016
„ACADEMICA BRÂNCUŞI” PUBLISHER, ISSN 2344 – 3685/ISSN-L 1844 - 7007
These tips would guide them throughout life. In 1905 was admitted to the Ecole Nationale des Beaux-Arts, to the studio of sculptor Antonin Merca,
where he stayed only one year. In 1906 he puts at the lottery sculpture "Child," which won a student Victor N. Popp, one of the first
collectors of his work. Also in that year, at the urging of Constantine Gănescu, older sculptor, he participates with a sculpture at the XVI Salon of the National Society of Belle Arts in Paris, where the jury chairman Rodin – the man who influenced his work (search for truth beyond conventional beauty).
At lounge of National Society of Arts in 1907 he participate with four sculptures [3]: - Bust in plaster; - Bust in bronze; - Child head and - The ordeal. In 1907, the great sculptor receives a command of performance a monument in the cemetery of Petre
Stanescu from Buzau. This command, which brought an income of 7,000 francs along with renting workshop of Street Montparnasse, no. 54, changed his life radically. It was one of the many miracles that have guided his life. Moving in the Montparnasse district brought him closer to the heart of Paris. It met here with outstanding representatives of the young generation of artists and writers (Picasso, Matisse, Modigliani, etc.) that have revolutionized the art before the First World War.
Moving the great sculptor in Montparnasse street got rid of loneliness, poverty. He linked many friends, making he known through his work in avant-garde circles. He worked for three sculptures started [3]:
a. Prayer; b. The kiss, that will be developed for 30 years until the Gate of the Kiss, the Ensemble of Targu Jiu; c. Wisdom of the Earth. Through these three sculptures, the Brancusi's work takes on a form of its own, stemming from his
Romanian soul. His works thus acquires authenticity, generating new insights into the evolution of modern art. The creation in 1910 of the Miraculous Bird with Bird in the air represents a turning point in the work
of Constantin Brancusi. Theme flight will cause a renewal of artistic language and the modern conception of art [3].
Modigliani came regularly since 1909 in the workshop of the great sculptor Constantin Brancusi to catch sculpture craft.
In 1910 he executed the first outdoor funeral sculpture, installed in public space, Tania Raşevskaia tomb in Montparnasse Cemetery.
From 1910 to 1933 he performed the cycle of Birds, the Sleeping Muse and Mademoiselle Pogany (which will carry 17 variants). During this period the great sculptor had the feeling of rediscovering self-confidence in his destiny. Are set out below some of its wise "words" [3].
- "We do not realize what miracle is life." - "Art should be only joy." - "The practice of art is a natural need, a necessity of life. You work as breathing. " - "Every man should find far. And art is the measure of a man. " In Montparnasse studio, Street nr. 54, the great sculptor had neighbor workshop on American painter
Walter Pach, who organize group exhibitions, thus facilitating contacts between artists [3]. In 1913 he organized an exhibition in New York, who revolutionized American artistic life. At this exhibition American: Armory Show, Constantin Brancusi participated with five sculptures:
- Miss Pogany; - The Kiss; - Muse; - Sleeping Muse; - Tors. The exhibition was a success, being presented in Chicago and Boston, attracting over 300,000 visitors, a
record at the time. In 1913 the great artist sculptures were exhibited in seven cities of the world: Paris, Bucharest, London,
Munich, New York, Chicago and Boston. In 1916, Constantin Brancusi moves into a new neighborhood of Paris, most spacious this time, the
Impasse Ronsin, no. 8. Between the two world wars it was the most fruitful of his life [3]. In 1926 he will have two solo exhibitions in New York, which will exhibit 32 works. In America he will
meet on the art dealer Joseph Brummer, whom he met in Paris, and he proposes Brancusi to make an exhibition at his gallery, taking all costs.
The exhibition continues at Chicago in 1927 and has an undeniable success, both materially and morally. His sculptures began to sell at high prices, making known the great contribution of sculptor to the
143

Annals of the „Constantin Brâncuşi” University of Târgu Jiu, Economy Series, Issue 3/2016
„ACADEMICA BRÂNCUŞI” PUBLISHER, ISSN 2344 – 3685/ISSN-L 1844 - 7007
promotion of modern art. Many favorable articles appeared in the press, highlighting the exceptional value of Constantin Brancusi's sculptures.
Conclusions Applying as a master, principles of career management, unknown but felt, great Romanian sculptor Constantin Brancusi built a sustainable career. The results of this sustainable career will last for centuries: his sculptures. The secrets to success in career reveal to us Constantin Brancusi [5]:
§ "Work as if breathing, working like work for you." § "All my life I searched essence flight. Flight! What a wonder! " § "Seeing something in the distance, but getting there is something else." § "You have to climb very high to see far." § "Maning not words but work accomplished".
Bibliography
[1] Ceaușu, E. – Compendiu managerial, Editura Academică de Management,București, 2004 [2] Jansen, J. – Managementul carierei, Editura POLIROM, București, 2007 [3] Jianu, I. - Constantin Brâncuși – Viața și opera, Editura științifică și enciclopedică, București, 1983 [4] Nicolescu O., Nicolescu C. – Cum să fim performanți în viață și în afaceri, Editura Economică, București, 2006 [5] Paleolog T. – De vorbă cu Brâncuși, Editura Sport-Turism, București, 1976 [6] Parkinson, M. – Ghidul carierei, Editura All Beck, București, 2002 [7]https://istoriiregasite.wordpress.com/2014/01/05/constantin-brancusi-viata-si-opera/ [8]https://www.roportal.ro/articole/despre/complexul_monumental_constantin_brancusi_de_la_targu_jiu_2479/
144
Annals of the „Constantin Brâncuşi” University of Târgu Jiu, Economy Series, Issue 3/2016
„ACADEMICA BRÂNCUŞI” PUBLISHER, ISSN 2344 – 3685/ISSN-L 1844 - 7007
INFORMATION SOCIETY AND FINANCIAL SUSTAINABILITY OF THE
ROMANIAN HEALTH SYSTEM
TATIANA BOGDAN PHD STUDENT AT “LUCIAN BLAGA” UNIVERSITY, SIBIU, ROMANIA,
e-mail: [email protected] Abstract
The financial sustainability of the health systems often reveals the ability of policy makers to finance healthcare in the face of growing cost pressures, with populations ageing, new technologies and increased patient expectations for healthcare coverage and quality. Thus, the healthcare systems need to reinvent themselves by using innovative financing mechanisms coupled with electronic information and communication systems, while offering greater transparency, flexibility and choice and increasing access to the services available. The paper analyses the healthcare financing models: the national health system, the social insurance or the private insurance model so that the Romanian health care reform should preserve the best elements of its existing system while selectively adapt techniques and processes that seemed to have been successful in other countries.
Moreover, the application of information and communication technologies – eHealth offers new possibilities for improving almost every aspect of healthcare, from making medical systems more powerful and responsive to providing better health information to all. Keywords: financing, health policy, sustainability, efficiency, health system reform, universal health coverage, health information system.
Classification JEL: I15 Health and Economic Development; G28 Government Policy and Regulation 1. Introduction
Romania is affected by a crisis in health financing, and the health care system has continued to struggle with insufficient and inequitably distributed resources. This is worsened by the governments ineffective spending, limited capacity for domestic resource generation as well as lack of institutional capacity to convert external resources into meaningful health inputs. As argued in Preker and Carrin (2004), the health care financing mechanisms have profound effect on the population’s access to health care, and on the health status of each individual. Therefore it is imperative that Romania evaluates all mechanisms which make up the system of financing.
Given the generally poor health performance and limited healthcare financing in Romania, this study will critically evaluate the current health financing mechanisms in Romania, including social security contributions, direct government funding, external funding, or out-of-pocket payments and also will identify alternative ways of working (electronic information and communication systems) that could complement the existing financing mechanisms.
This is a descriptive study involving health financing datas from different sources including, journals, reports, published articles and studies. More over data collection was done through electronic searches of specific databases, namely: Science Direct, World Bank, WHO, the Ministry of Health, Google Scholar using key words – health financing, health system.
The health policy is considered to be of high importance for the society. The implementation of this policy has been achieved with funding mechanisms that gathered and allocated resources, and payed the health services. A robust financing mechanism will determine health policy makers to achieve maximum benefits with minimum effort and expense. The financial mechanism has a complex structure that includes: the financial system, the financial levers used to influence the economic activity, the administrative methods of management used in finance, the institutional framework composed of institutions and bodies with attributes in finance, the legal framework consisting of laws and other financial legislative measures.[13]
The literature distinguishes three fundamental financing sub-functions: Ø Revenue rising; Ø Risk pooling; Ø Resource allocation and service provision. Revenue rising for healthcare indicates how financial resources are collected for payment of medical services.
Thus, there are many sources: compulsory health contributions paid by the employees and the employers, direct taxes (income tax, corporate income tax) and indirect (VAT, excise duties), private health insurance premiums and direct payments of health services by consumers.
Risk pooling involves that health funding should be done in order to ensure the entire population’s access to health services they needed without causing financial suffering.
Resource allocation and service provision refers to the allocation of funds to health sectors (primary, secondary and tertiary level and to healthcare services providers: hospitals, polyclinics, private health clinics). Health funds are
145
Annals of the „Constantin Brâncuşi” University of Târgu Jiu, Economy Series, Issue 3/2016
„ACADEMICA BRÂNCUŞI” PUBLISHER, ISSN 2344 – 3685/ISSN-L 1844 - 7007
allocated through various mechanisms to the health services providers, an important part being used for staff remuneration. The funding mechanisms of the European health systems are very complex and differ from country to country, requiring detailed research and careful attention from specialists. The main funding mechanisms include budgetary funding through general taxes, social health insurance and private insurance and direct payments. Modern health systems use these mechanisms in various combinations, depending on the specific objectives pursued and the economic, political and social constraints set out in those countries. 2. Literature review Fiscal sustainability is an important issue for health systems today and in the future, because of the rapid growth of health spending. The OECD defines fiscal sustainability as the ability of a government to maintain public finances at a credible and serviceable position over the long term (OECD, 2013). Fiscal sustainability implies governments are able to maintain policies and expenditure into the future, without major adjustments and excessive debt burdens for future generations. Policy makers have three broad ways to ensure fiscal sustainability of health systems: raise more money for health, improve the efficiency of government health spending, and reassess the boundaries between public and private spending. Simpler blanket spending cuts can also evidently address fiscal constraints, but are more likely to have adverse effects. [10]
The 2013 Annual Growth Survey recognized that „ in the context of the demographic challenges and the pressure on age-related expenditure, reforms of healthcare systems should be undertaken to ensure cost-effectiveness and sustainability, assessing the performance of these systems against the twin aim of a more efficient use of public resources and access to high quality healthcare”.
“Creating and implementing the strategy for financing health involves continuous adaptation and not a linear increase because the conditions in the countries are in constant transformation, the characteristics of diseases is changing, resources decrease and fluctuate, institutions develop or go through periods of decline” [19].
Financing and organization of health systems in the Member States of the European Union follows institutional, political and socio-economic traditions. This focuses on a series of social objectives in terms of funding and delivery of effective health care services at a price approachable. [8] 3.The EU’s health financing systems
This parts of the paper analysis the different mechanisms of financing health systems in the Member States of the European Union to conclude the advantages and disadvantages of each system. The mechanisms of financing the health systems are very different from one another, depending on cultural and historic backgrounds proper to each European nation.
EU countries use a combined system between social security contributions and direct government funding of the healthcare system. The private insurances represent a supplement rather than a substitute for the primary health system.
The EU member states have the following typology of health systems based on their funding mechanisms: Ø The Health Insurance System – the Bismark model, including countries that finance their health sector mainly
through social security contributions: Austria, Belgium, Czech Republic, Estonia, France, Germany, Hungary, Lithuania, Luxembourg, Netherlands, Poland, Romania, Slovakia and Slovenia. This system of health financing involves payments from employers and employees to finance these sickness funds and participation is compulsory. The advantages of this system include: funding is independent of changing political priorities; health financing system is linked to income level; greater transparency of contributions and benefits of the healthcare system for citizens; funds paid are relatively stable in the system; efficient and appropriate services are provided; supports the rights of insured patients. The disadvantages of the health insurance system may be summarized as follows: the administrative costs are higher compared to a system based on general taxation, especially at the beginnings, when the infrastructure is achieved; a reduction of the contributions during the recession; funding is dependent on employment or unemployment of the labor force; higher costs for small agents by including the amounts paid by employers to ensure employees in the production costs; can become financially vulnerable if it lacks grants.
Ø The National Health System - Beveridge model, including countries that finance their health care system through general taxation and are managed by the state: Denmark, Finland, Ireland, Italy, Malta, Portugal, Spain, Sweden, UK etc. Citizens have access to healthcare services binding on income taxes, thus ensuring a high degree of social equity. Payment of physicians in this system is based on either salary or capitation. The advantages of this system are equity in funding, ensuring universal coverage of health services for the population; the lower administration cost of the system; and the possibility of controlling the healthcare expenditures. The major disadvantage of this type of system is the short-term political decisions that can affect health financing system, which competes with other public sectors. Other drawbacks are the lack of transparency in the financing of additional healthcare services; low efficiency in the management of funds; long waiting lists (predominantly for performing surgical services); the medical staff lack of motivation to increase the activity or quality.
Ø Private health insurance system. Private insurance does not play an important role in the European Union countries, as does in the USA, Australia and Swiss. In EU States voluntary health insurance provides additional
146

Annals of the „Constantin Brâncuşi” University of Târgu Jiu, Economy Series, Issue 3/2016
„ACADEMICA BRÂNCUŞI” PUBLISHER, ISSN 2344 – 3685/ISSN-L 1844 - 7007
coverage for services that are partially or entirely not covered by the social once. In a private insurance system the individuals voluntarily opt to pay an insurance based on the potential individual or group risks. The private insurance system advantages are: direct funding makes the consumer be aware of the cost of health care; the choice of selecting the service provider and the service range; transparency in costs and in the system benefits; financing does not depend on the short term political objectives. The disadvantages of private insurance system are: lack of equity in health system financing; poor population coverage with health services; high costs involved by the insurance companies and high medical fees.
In conclusion, the ideal financing solution could be a health care system with three levels [7]: ü For goods and public health services with major impact on the health status, namely financing through general
taxation; ü For necessary health services derived from the individual sickness risks, through public funding, special
taxation or social insurance health; ü For reduced service needs (with unproven efficiency, luxury, at the patients request etc.) based on private
health funding or direct payment. 4. The information society and health financing mechanism in Romania The Romanian healthcare system is continuously facing poor achievement of system function, lack of comprehensive long-term care strategy, low levels of public investment in health, inefficient use of resources, improper health infrastructure. Therefore, Romania must develop its health strategy based on values and principles such as: universal protection against financial risk, equitable provision and use of services relative to need, improved transparency and accountability of the system to the public, quality and efficiency in service delivery, while ensuring the financial sustainability of the health system.
The Romanian health system is a mixed model of joining sources obtained from premiums paid by the citizens and the funds of Government collected through taxes into a single public fund for health insurance.
Financial resources for the compulsory health insurance will be payed to the Unique National Social Health Insurance Fund (UNSHIF). This includes all founding sources: health insurance premiums for all citizens and residents of Romania; budget transfers from government institutions to cover mandatory health insurance for special groups (pensioners, unemployed, persons with disabilities, persons under social assistance); local budgets; own incomes; external credits; external subsidies; donations and sponsorships; the claw-back tax which represents a tax obligation owed by all manufacturers of drugs on the Romanian market through marketing authorization holders of medicines in Romania or their legal representatives, to finance the necessary health services for the entire community; the vice tax, payable by legal entities that produce or import tobacco products, entities that produce or import alcoholic beverages other than beer, wine, fermented beverages and by entities who derive revenues from advertising activities on tobacco products and alcoholic beverages.
Another important resource of the health sector is represented by the private expenditure of the population achieved through private health insurances or direct payments (i.e., co-payment and service fees). The private health insurances are insignificant as a percentage of the total private spending and so the proportion of people who pay directly out of pocket for the health services is increasing. The consequence is a reduced access to the necessary health services, especially for the low-income population.
The Romanian health financing mechanisms should contribute to more efficient and sustainable vision for better healthcare. Several levers may hold the key to transformation: pay for value, not for volume; encourage awareness and independence among consumers; focus efforts on prevention; implement modern management and focus on performance; promote technology innovations that optimises for both quality and cost; investigate the feasibility of alternative financing models for cure and care; reshape the healthcare landscape .[18]
Thus, the healthcare system need to reinvent itself by using innovative financing mechanisms coupled with electronic information and communication systems, while offering greater transparency, flexibility and choice and increasing access to the services available.
Compared to other sectors, information technology is used much less in health. ICT has never been used to its full potential. So far, only certain areas of the health sector have used ICTs. The reasons are understandable: difficulties in agreeing on specific requirements for interoperability for e-Health solutions, the need for communication was not so big in the past, and also the high costs of IT solutions. It requires sustained efforts to improve the use of ICT in health. Modern ICT technologies make possible things that previously seemed impossible: organization, coordination and delivery of healthcare, clinical research in ways unimaginable in the past and at reasonable costs.
Electronic health care services, generally known as e-Health, represent the result of the information and communication technology across the range of functions related to the health sector.
A thorough analysis is performed aiming to identify the main internal and external driving forces and obstacles for the Romanian “e-Health” strategy. The SWOT analyses categorize the findings in the literature review based on four criteria: Strengths, Weaknesses, Threats and Opportunities[11].
Strengths of e-Health in Romania Ø Interest for eHealth strategies; Ø Equipped family doctors with computers; Ø Hospitals and other healthcare service providers gradually increase the use of ICT;
147

Annals of the „Constantin Brâncuşi” University of Târgu Jiu, Economy Series, Issue 3/2016
„ACADEMICA BRÂNCUŞI” PUBLISHER, ISSN 2344 – 3685/ISSN-L 1844 - 7007
Ø Long tradition in collecting statistical data and activity data at the health service providers level; Ø Using international coding standards for reporting of hospital services (ICD-10, ICD-10-AM (ICHI)); Weaknesses of eHealth in Romania Ø A relatively small portion of the eGovernment budget is allocated to eHealth; Ø Insufficient level with computers in hospitals; Ø Low durability of previous projects results in the eHealth field; Ø Low level of interoperability in healthcare applications (information systems in hospitals, laboratories
information systems, applications for family doctors), administrative information systems (accounting, human resources) and national eHealth systems (statistics, CNAS,DSP);
Ø Insufficient information support for customers - citizens and patients. Opportunities for eHealth in Romania Ø Continuous drop in the price of ICT; Ø Increasing the quality and availability of ICT (power, capacity, range, etc.); Ø Savings by automating processes using ICT (productivity, efficiency, quality and safety); Ø Ability to use the experience of other EU Member States and WHO; Ø International cooperation on eHealth standards and initiatives. Risks of eHealth in Romania: Ø Insufficient support from central and local authorities; Ø Lack of financial resources; Ø Low level of preparedness of users of e-Health. In order to ensure the sustainability of the health care system through the application of information and
communication technologies, the EU report „ Redesigning health in Europe for 2020” identifies some recommendations:
Ø The policymakers must create a legal framework to manage the explosion of health data, establishing strong safeguards and providing a stable market environment to encourage innovation.
Ø Public authorities (national or regional) that have advanced eHealth activities should provide leadership and inspiration for other EU countries and third countries, thus ensuring rapid progress.
Ø Increase public understanding about the opportunities of eHealth to monitor measure and manage their wellbeing. Raise awareness of what data is collected, the different ways that it can be used and the benefits for the individual and the health system.
Ø Use the power of data while creating a culture of transparency in health or benchmarking and monitoring performance of the health system.
Ø Re-orient EU funding and policies by requiring transparency from institutions in health systems through procurement and funding criteria. 5. Conclusions
Results show that the Romania’s health financing system carries out its functions primarily through the Ministry of Health. Revenue collection mainly occurs domestically via social security contributions and direct government founding of the healthcare system. The financing system has contributed to an improvement in the health status of the population by prioritizing the main health problems and granting universal access to public health services, however, pooling strategies seem to have led to demand side misuse that highlight and perpetuated supply side constraints.
The main aim of any health financing mechanisms is to sustainably generate adequate resources for the health system, while at the same time setting the financial incentives for health care providers as well as insuring that all individuals have access to health care in a more equitable, efficient and effective way. Most importantly, the way in which any health system is financed has profound effects on its stewardship, service provision, resource mobilization and attainment of national health goals, as well as faire financial contributions so that individuals are not exposed to financial risk of impoverishment. In other words, countries should design and implement health financing mechanisms that are able to collect revenues, pool financial risks and allocate resources through purchasing of services. [20]
Financial sustainability is an important issue for health systems. The paper explores how the health financing mechanisms can be used to improve the value of the health systems and, thereby ensure their financial sustainability. Although the financial efforts of the Romanian state to support the health system have increased, the quality of healthcare services is very often not assessed to be at the desired level. The health system financial sustainability demands strong governance of the health system that includes political decisions about how and how much to invest in health and how resources should be allocated. There are several policy levers and tools which ensure financial sustainability of health systems without compromising important achievements in access and quality of health care: raise more money for health, improve the efficiency of government health spending, and reassess the boundaries between public and private spending.
148

Annals of the „Constantin Brâncuşi” University of Târgu Jiu, Economy Series, Issue 3/2016
„ACADEMICA BRÂNCUŞI” PUBLISHER, ISSN 2344 – 3685/ISSN-L 1844 - 7007
The strategy regarding health information system aims to foster a smarter and more sustainable healthcare system. Greatest challenges in relation to designing and implementing health information system in Romania are tied to physical infrastructure for its implementation and qualified personnel to use it. Regarding the required physical infrastructure for health information system implementation, provision of computers and internet connection for all health institutions is needed. On the other hand, the staffs that will use the infrastructure need to be adequately trained. Another challenge is the capacity to maintain and further develop the health information system. In conclusion, the Romanian health information system has great potential to help improve quality of health care, assure patient safety and increase efficiency in health care delivery.
6. Bibliography
[1] COCIR Report (2013), Fostering financial sustainability of healthcare systems in Europe. [2] Efor-Mind Research & Rating Report (2012), Revenues and expenditures of the Romanian health system. [3] eHealth Task Force Report (2012) – Redesigning Health in Europe for 2020. [4] European Commission - Information Society and Health: Linking European Polices. [5] Kutzin J, Cashin C, Jakab M (2010) – Implementing Health Financing Reform: Lessons from Countries in Transitions, WHO Regional Office for Europe and The European Observatory on Health Systems and Policies, Copenhagen. [6] Law Nr. 95/2006, Financing Health Expenditure in Romania. [7] “Modalităţi de finanţare pentru sitemul public de sănătate – prezent �i perspective” (2011), Raport al Consiliului naţional al persoanelor vȃrstnice. [8] Niţă L (2004) – Politica socială în Uniunea Europeană, Editura Universitaria, Craiova. [9] Nistor I (2008) – Sisteme de sănătate – studiu comparativ, Vol “Reforma sistemului asigurărilor sociale din Romȃnia în vederea aderării la Uniunea Europeană”, Casa Cărţii de Stiinţă, Cluj Napoca. [10] OECD (2015), Fiscal sustainability of health systems: Bridging health and finance perspectives, OECD Publishing, Paris. [11] Strategia de e-Sănătate a Ministerului Sănătăţii. [12] The National Health Strategy 2014-2020, November 2014 [13] Văcărel I. (2006) – Finanţe publice, Ediţia a V-a, Editura Didactică şi Pedagogică, Bucureşti. [14] Văcărel I. (2007) – Finanţe publice, Ediţia a 6-a, Editura Didactică şi Pedagogică, Bucureşti. [15] Viorela Ligia Văidean (2010) – Sistemul romȃnesc al asigurărilor de sănătate în context European, Editura Risoprint, Cluj Napoca. [16] Vlădescu C. et al (2008) – A healthcare system centered on citizen’ need. The Report of Presidency Commotion for Public Health Policy Analysis and Elaboration in Romania. Bucharest. [17] World Economic Forum (2012): The Financial Sustainability of Health Systems – A case for change. [18] World Economic Forum (2013): A vision for the Dutch health care system in 2040 – towards a sustainable, high-quality health care system. [19] World Health Organization(2010): The World Health Report: Health System Financing – The Path to Universal Coverage. [20] Joseph Chibuye - Assessing the Impact of Health Financing Mechanism in Zambia; TropEd Master of Science in International Health; 17th August 2009 – 3rd September 2010.
149

Annals of the „Constantin Brâncuşi” University of Târgu Jiu, Economy Series, Issue 3/2016
„ACADEMICA BRÂNCUŞI” PUBLISHER, ISSN 2344 – 3685/ISSN-L 1844 - 7007
A SHORT ANALYSE OF THE DIALOGUE SOCIAL SYSTEMS AND THEIR ROLE IN
THE ECONOMIC DEVELOPMENT
CEAUSESCU IONUT ASSIST. PH.D., CONSTANTIN BRANCUSI UNIVERSITY OF TARGU-JIU
Abstract
The trade unions are considered under the law of association, constitutionally guaranteed principle of all democratic regimes in the world. Moreover, freedom of expression and association is one of the fundamental principles underlying the activities of the International Labour principles set out both in the Treaty of Versailles (June 1919) [1] and the Declaration of Philadelphia (May 1944 ) regarding the goals and objectives of the ILO. Any of the 175 member states of this organization are obliged to provide the necessary legal framework establishment and operation of structures representing the interests of employees and employers (where employers' organizations). In turn, I.L.O. It adopted the Convention on Freedom of Association and Protection of the Right to Organise (June 1948) that workers and employers have the right to constitute organizations or to join them. Organizations have the right to draw up statutes and administrative regulations, to organize their administration and activities, to freely choose their representatives to formulate the action program, the condition is to respect the law. In turn, public authorities in each member country must refrain from any interference which would restrict this right or impede the lawful exercise them.
Therefore, organizations representing and defending the rights of employees there and exercise their role for which they were created, changing a lesser or greater extent characteristics of different segments of the labor market in a country or another. Moreover, amid the internationalization of the labor market specific features, such as international migration of labor, multinational and transnational companies entering the domestic markets of the various countries, legislating the right to free movement of labor in different geographic areas - economic, etc. , the issue of the influence of trade unions can not be circumvented.
In essence, this study develops the issue of social dialogue seen as a prerequisite for economic and social development of Romania, existing tripartite and bipartite institutions and their role in the proper functioning of the social mechanism and a critical analysis of the participation of trade union organizations at work performed by them. The study pitting practices and outcomes of social dialogue in different countries in the European and not only with those implemented and produced in our country, accompanied by recommendations for a more effective engagement of the three stakeholders - employers' organizations, trade unions and the state. Key words: social responsibility, the trade unions, public organization, social dialogue, social partners JEL classification: J50, J51 1. Introduction
The dialogue between all social partners - trade unions and employers, between them and governmental factors are a reality of the contemporary world, a necessity that can not be challenged, as was proven repeatedly manner most convenient, more efficient harmonization of the interests of employees with the employers of solving conflict situations, from unit level up to the national economy.
Tripartite Mechanism (administration, trade unions, employers) to make decisions regarding labor relations (and others) is recognized and adopted as a principle in international scale by itself the organization and functioning of the International Labour Organisation (ILO). Tripartite structure of this institution is unique in the UN system, and this is because appreciated, since the foundation of the ILO, in 1919, that social justice can not be promoted only by involving trade unions and employers in formulating and implementing social policies and economic concerning labor relations.
On several occasions, representatives of the International Labour Organization have stated that dialogue between the social partners has three essential roles: acting to prevent conflicts, causing the parties with divergent interests to reach an agreement and post-conflict rebuilding social peace. This collaboration, whether it takes the form of consultation or cooperation, should not affect the freedom of association, nor the rights of employers' organizations, but must pursue a common analysis of issues of mutual interest to achieve as much as possible at acceptable solution all parties involved [2]. It is true that, by tradition, or rather, a habit formed from the collective mentality, trade unions and employers are perceived as organizations objectives are in complete disagreement, which puts them mandatory, in position absolutely opposite state being somewhere above you in the position of arbitrator, while in the "gendarme".
150

Annals of the „Constantin Brâncuşi” University of Târgu Jiu, Economy Series, Issue 3/2016
„ACADEMICA BRÂNCUŞI” PUBLISHER, ISSN 2344 – 3685/ISSN-L 1844 - 7007
On the other hand, all social practice shows that the place held by social dialogue, whether it takes the form of bipartite negotiations or consultations tripartite depends on a number of constraints, sensitivities, traditions that differ from country to country and from one period to another. In some cases, organizations and trade unions nationally representative expects to be consulted by the institutions of authority over certain issues they consider of mutual interest. If this happens, tripartite cooperation will expand at the expense of bipartite. If, on the contrary, the state sets a relatively strict delineation of spheres of competence, will restrict forms of tripartism. This latter attitude, combined with a widening field of action of market forces, will normally, in effect, giving preference over others bipartite relations. Perhaps the best example in this moment, appropriate industrial relations in Belgium. There may be situations where, in a period of structural economic changes or major difficulties, organizations and trade unions can not solve a problem without the help of the state, expanding the tripartite dialogue. Appropriate countries in central and eastern Europe, which have gone from a centralized economy to a market one. Against this background it becomes increasingly clear that social dialogue is more easily established and maintained amid a favorable economic situation; as it deteriorates, the negotiations become more difficult, because it is difficult to cooperate on the condition that only require sacrifices. Paradoxically, however, when economic and social situation tends to enter a critical phase, dialogue (tripartite mostly) begins to be seen as a solution, as a last means of avoiding a total blockage that could lead to social disorder . This time, what is no longer negotiate mutual exchange of benefits but a fair distribution of the sacrifices required to exit the crisis. It is therefore difficult to argue whether bipartite social dialogue forms are more effective or less effective compared to the tripartite. The effectiveness varies from case to case and only an analysis of each situation can be shown that the solution of two ways when and given juncture. But one thing is certain: for social dialogue to work, the parties must be prepared for cooperation and also strong enough to perform these duties and commitments. When the collaboration between the social partners is perceived as a loss of autonomy of decision and a subordination of the interests and objectives of each organization, it deteriorates and becomes a source of suspicion and dissatisfaction for any of those involved. 2. Bipartite system or tripartite system of social dialogue? A characterization of forms of social dialogue as issuing opinions concerning the effectiveness of their work on market developments should take into account a number of economic, social and political influence. Of these the most relevant are:
Ø Globalization of the economy, the rapid movement of goods, capital and labor, intensification of international competition have forced many countries to adopt restructuring programs with financial aid from international organizations [3]. Often, their support was accompanied by a series of economic and social conditions, requiring expansion of cooperation between social partners, in particular the widening of the tripartite dialogue.. In other news, the same process of economic globalization has facilitated the penetration of multinationals in the economies of many countries, which printed an opening practices bipartite dialogue, including the implementation of forms of participation of representatives of employees in the decision making across the enterprise .
Ø The political changes in Central, Eastern Europe and former Soviet Union countries, the transition from model economy to the market, led to an extensive process of transition from the form of property prevailing state at a plurality of forms of property, fundamental becoming the private. In all these countries, social dialogue dressed mainly ternary form, evolution is natural considering the role of multi-play state: on the one hand, the creator of the regulatory framework governing the social dialogue, on the other patron for much of those employed in the areas of the budget, RAs and other economic entities in which the state is a majority shareholder.
Ø Increasing diversification of the labor market also translates into new forms of labor relations and work temporarily carrying out activities outside the classic work (eg teleworking or outsourcing certain activities) or service type "part- time ". Increased heterogeneity targets different groups of employees tripartite dialogue difficult, especially at the central level, that is becoming increasingly difficult for the social partners to dialogue on issues of "common interest". This makes it necessary to decentralize the negotiation process, the center of gravity transferring to the bipartite dialogue at the level of economic unit.
Ø The traditional way of organizing production - taking classic in which a large number of workers produce a large amount of items standardized in a well defined and with the qualification standard and a range of working conditions tends to make room for another way more supple. The new structure is able to adapt quickly to a request for a high diversity, flexibility to qualified employees during their labor, receive a high technology. Therefore, changes including forms of participation and cooperation between employees and employers, belittling classic negotiation process between the employer and the union.
Ø Traditionally, in some developed countries show an increased reluctance to social dialogue type tripartite especially against some forms of it, considering them a form of interference of public authorities in matters that should be subject to exclusive negotiations between employers and employees - applicable United States and, to a lesser extent, Germany and England.
151

Annals of the „Constantin Brâncuşi” University of Târgu Jiu, Economy Series, Issue 3/2016
„ACADEMICA BRÂNCUŞI” PUBLISHER, ISSN 2344 – 3685/ISSN-L 1844 - 7007
The main difficulties are related tripartite dialogue type or complexity of the objectives of the government, or how they actually work tripartite institutions. In the first case, the government wishes to obtain the consent of the other two sides on some very important issues especially related to jobs, social protection and wage increases. After several rounds of negotiation, organizations and trade unions (especially the latter) consider arguments Parthians insufficient or less credible government to accept its demands and trying to reach a common view fails. Regarding the functioning of tripartite institutions in some countries it was found that they go through a series of cumbersome procedures or negotiations to adopt a common point stretch over long periods of time (see Netherlands, where the number of cases where social partners not grant unanimous opinions is growing from year to year), which sometimes led governments to take decisions without prior consultation of the social partners, or have found solutions to get their consent informally. Gradually, the role of tripartite consultation institution decreases, it continues formally to exist, but in reality no longer perform the role for which it was established.
For completeness analysis, we must mention the fact that social dialogue can take institutionalized forms, as can also work in an informal setting, some issues subject to such contacts between public authorities, trade unions and employers' and finding and solving in this way.
At European level, there are both institutions of the social partners, where they can present their views on issues related to social and economic policies and practices of consultation between the European Commission and the social partners. A good example is the Val Duchesse social dialogue [4], consists of two elements: organization of regular consultations between the European Commission and UNICE, CEEP and ETUC, before the adoption of legislative proposals relating to the social field; financial and logistic support from the Commission of the European social partners to create joint working groups. The Maastricht agreement on social policy practiced by the Commission turns consultations voluntary (according Val Duchesse dialogue) in its obligations.
3. The role of Economic and Social Councils (ESCs) for social dialogue
At European level, the oldest institution of social partnership is the Economic and Social Committee of the
European Community (EC CES), an advisory body, according to art. 4 of the Treaty of Rome, gives union representatives, employers and other groups representing socioeconomic interests, the opportunity to express their views on matters of interest of the European Union. CES-CE is composed of 222 members representing employers, employees and other occupational categories - self-employed, farmers, farmers, family associations etc[5].
The European Commission must consult CES-EC before taking decisions on matters of social or economic nature; draft proposals are submitted to advisory committees of CES - CE, structures that are composed of representatives of national governments, employees and employers. Among the advisory committees of CES-CE, the most important are: the European Social Fund; Advisory Committee on Social Security for migrant workers; Advisory Committee on freedom of movement of workers; Advisory Committee on training; Advisory Committee on safety, hygiene and safety at work; Advisory Committee on Equal Opportunities for Women and Men. Since 1992, the Committee initiates on these topics.
Economic and Social Council in Romania (CES) Economic and Social Council of Romania was created as a tripartite institution, autonomous social dialogue,
an advisory besides the legislative and executive authority of the state. The mission, tasks and principles of organization and functioning of the CES were regulated by Law no. 109/1997 on the organization and functioning of the Economic and Social Council, as amended and supplemented. According to it, the institution of public interest has been created to achieve social dialogue between unions and employers and the Government to achieve and maintain the climate of social peace. Thus, the Economic and Social Council has an advisory role in policy formulation and economic and social policies in settlement of conflict at branch or national level occurred between the social partners and achieving, promoting and developing social dialogue and social solidarity.
At CES, the social partners have the opportunity to discuss, consult and negotiate on the draft legislation and draft programs and strategies (embodied in draft laws) which refers to the restructuring and development of national economy, privatization economic, labor relations, wage policy, social protection and health care, education, research etc. [6].
To act as advisory C.E.S. It has the following main tasks: a) analyze and approve draft resolutions and ordinances of the Government and bills to be presented to the Parliament;; b) analyze and approve draft programs and strategies embodied in draft laws before their adoption; c) signals to Government or Parliament the emergence of economic and social phenomena that call for new laws; d) analyzing the causes of conflict arising at national or branch and make proposals for solving them in the national interest; e) shall, at the request of the Government, Parliament or on its own initiative, analyzes and studies on the economic and social realities; f) develop and support the implementation of strategies, programs, methodologies and standards in social dialogue;
152
Annals of the „Constantin Brâncuşi” University of Târgu Jiu, Economy Series, Issue 3/2016
„ACADEMICA BRÂNCUŞI” PUBLISHER, ISSN 2344 – 3685/ISSN-L 1844 - 7007
g) aims to meet the obligations arising from the Convention no.144 / 1976 ILO tripartite consultations to promote the implementation of international labor standards, adopted on 2 June 1976 in Geneva, ratified by Romania by Law no. 58/2003, art. 6. Another role of the CES is to mediate at the request of social partners, the conflicts occurred between them at branch or national level and in sectors where it is forbidden to strike. CES has an obligation to invite the parties to the dispute and institutions that can play a role in settling claims (Law 109/1997, art. 9, para 2), to mediate a possible solution. If within 30 days of the date on which addressed CES, those involved do not reach any agreement, the mediation powers of the Council ceases not involved before communicating his view on the situation. During mediation, the partners are obliged to refrain from carrying out specific forms to support the claims. 4. Conclusions
The trade unions represent the "actors" of the labor market which can be appreciated as a balancing factor, or conversely, an element of disruption of the normal evolution of the labor market, but in any case they should not be ignored.
A "rule" of European industrial relations is that the social partners, ie employers and trade unions are not just lobbying organizations or pressure groups are doing everything possible to achieve specific objectives of representation. Their mission includes, in addition to traditional aims, responsibility for public welfare, playing an important role in structuring and functioning of the labor market, as in the social security system. In some countries (see Denmark), the state went so far left exclusively in the hands of two stakeholders for regulation of the labor market and the mechanism of social security, from the "presumption on a balance of power between the two parties, the role active trade union organizations leading to a better functioning of the labor market [7] and an income distribution that is both fair and reasonable economically. " In this way it creates the conditions for an optimal allocation of resources in the labor market, maintaining a low level of unemployment and reduce the negative effects of conflicts between employees and employers.
Given the powers conferred by law, we believe that, in essence, the role of trade unions in the labor market may be analyzed highlighted: the correct coordinates, the pressure and the consultative and partnership. Corrective role is performed mainly by the quality of trade unions to negotiate collective agreements, from the national to the unit.
In other news, the influence of trade unions on labor market not only achieved directly by negotiating collective employment contract may, but by using levers that have ultimately affect the level of remuneration and employment levels.
One of these levers can increase productivity. The union can be involved in the preliminary consultation company management decisions on this subject; union may engage in measures to increase the quality of work; They may be stipulated in the collective forms of continuous training of employees; these are all measures that can increase labor productivity, which may result in an increased demand for labor, to the extent that productivity growth is higher than the marginal product price drop.
Indirectly, unions can influence by their actions, increased demand for certain categories of products and services: they can press for adoption of a program of purchases of government to increase spending on public health, the state education, infrastructure etc..
The pressures of unions can be directed at other directions that may influence indirectly certain parts of the labor market - pushing for programs to stimulate investment and to prevent the extinction of economic unit, for providing incentives to those who invest in certain areas, forcing measures obliging firms as significant share of the production of goods for the domestic market to be achieved in the country etc.
Social dialogue between unions, employers and government is a social exercise not easy, given the multitude and complexity of each party interests they represent. To be functional, it must be based on equality, robustness and openness for cooperation of the partners, or remain a formality, a "mimed ritual" without real effect on the socio-economic plan. As long as social partners in Romania will not perceive this as the role they have in the different institutions of social dialogue, consensus and constructive climate of social peace are simply illusions.
5. References
[1] Dispozitiile Partii a XIII-a din Tratatul de la Versailles sunt reproduse integral în Tratatul de la Saint- Germain din 10 septembrie 1919 (art. 332-372), [2] Pauzuoliene, J., Mauriciene, I., Implementation of Social Responsibility in Public Institutions, Social Research, 4, p. 141-151, 2013; [3] Lipsey R., Christal A., Principiile economiei, Bucuresti, Editura Economica, 2012, pag. 706; [4] Inaugurat la summit-ul de la Val Duchesse (Bruxelles), convocat de presedintele Comisiei Europene, JackDelors, în 1985;
153

Annals of the „Constantin Brâncuşi” University of Târgu Jiu, Economy Series, Issue 3/2016
„ACADEMICA BRÂNCUŞI” PUBLISHER, ISSN 2344 – 3685/ISSN-L 1844 - 7007
[5]. Zamfir, C., (coord.) Politici sociale în România, Bucuresti, Editura Expert, 1999; [6] Neagu C., Udrescu M., Managementul Organizației, București, Editura Triton 2008, pag. 132; [7]. Sitnikov, C.S.; Bocean C.G., Relationships among social and environmental responsibility and business, Amfiteatru Economic Journal, Vol. 15(7), p. 759-768, 2013;
154

Annals of the „Constantin Brâncuşi” University of Târgu Jiu, Economy Series, Issue 3/2016
„ACADEMICA BRÂNCUŞI” PUBLISHER, ISSN 2344 – 3685/ISSN-L 1844 - 7007
ARE LEISURE AND WORK PRODUCTIVITY CORRELATED? A MACROECONOMIC
INVESTIGATION
ANA-MARIA SAVA PH.D. CANDIDATE AT THE BUCHAREST UNIVERSITY OF ECONOMIC STUDIES,
e-mail: [email protected] Abstract
It is common sense to state that working without being mentally fatigued leads to increased labor productivity. Extensive overtime and putting in long hours on a regular basis without using proper de-stressing methods inhibit work productivity. Recently, several countries have manifested an interest towards reducing the daily work quantum (in 2015 Sweden started the shift to a 6 hours workday, France regulated in 2000 the 35 hours workweek) with the aim of improving the quality of life as well as increasing companies’ economic performance. But does disposing of more free time automatically lead to having a better life or superior business returns? Of course not – spare time also needs to be used effectively in order to achieve these goals. Every person is unique and therefore each individual will opt for different pass time activities to attain mental tension relief. But, there is evidence which sustains that allocating more time to leisure is directly correlated with increased work productivity, as will be shown in the present paper. Moreover, the investigation shows that not all ways of spending leisure time are effective in achieving the desired objective, some displaying an inversely proportional relation with labor productivity. Keywords: Spare time; leisure; labor productivity; macroeconomic analysis; correlation. JEL Classification : L83, O11, O49, O50 1. Introduction
Peoples’ need for recreation has been acknowledged for a long time now, this fact being also formally
recognized over a century ago, Greenwood (1905) claiming that education’s greatest benefit would be teaching people how to spend their leisure time in a more gainful way. A recent study on Romanians’ perception of quality of life (Constantinescu, 2012) shows that recreation and leisure are classified among the five dimensions of quality of life, after health, material wealth, education and employment.
The fact is, the use of free time for recreational purposes directly brings benefits to individuals, which may indirectly create benefits for organizations and by extension to the whole economy.
By recreation, population gains in several areas of life leading ultimately to improving the overall quality of life. Sports help maintaining a healthy body, arts and culture have a substantial contribution on education, while entertainment activities lead to relaxation and reducing daily stress.
All these elements have the cumulative effect of increasing efficiency in the workplace, having an indirect influence on the welfare of organizations. This empirical inference is confirmed by an analysis on the correlation between time spent for leisure purposes and labor productivity.
2. Research methodology
To test this hypothesis were used two series of macroeconomic data provided by OECD for 26 countries:
• time spent for leisure activities (measured as ratio of the duration of one day) (OECD, n.d. a); • labor productivity (measured as GDP per hour of work) (OECD, n.d. b).
In a first step, there has been checked whether a significant difference between the observed and expected frequencies exists for the two data series (by using the Chi-square test of association/independence χ2). Subsequently, the strength and direction of the association between them was calculated (through the Pearson correlation coefficient, R) along with the extent in which first variable explains the variation of the second one (through the coefficient of determination, R2). Last, the results were tested for statistical significance (by computing the p-value).
The fact that OECD divides leisure time in several subgroups of recreational activities, enabled not only testing whether leisure time and labor productivity are correlated, but also zooming in on these activities in order to see their individual impact on work productivity.
155

Annals of the „Constantin Brâncuşi” University of Târgu Jiu, Economy Series, Issue 3/2016
„ACADEMICA BRÂNCUŞI” PUBLISHER, ISSN 2344 – 3685/ISSN-L 1844 - 7007
The subcategories of leisure included in the OECD report are: • sports and physical exercise; • attending events; • spending time with friends; • watching TV or listening to radio; • other recreational activities.
The above described steps were carried out for each of the subcategories and also for some clustered activities (e.g.: all leisure activities excluding watching TV or listening to radio). 3. Research findings
The first analysis conducted tested whether there is a correlation between leisure time (all subgroups considered) and labor productivity. Chi-square test confirms the validity of using the two data series as basis for studying the phenomenon. Pearson correlation coefficient shows that the two data sets are linked by a strong positive relationship, the value obtained (R = 0.54) being indicative of a strong, substantial association according to De Vaus (2004). The coefficient of determination indicates that the time devoted to recreation explains 29% of the labor productivity evolution. Moreover, the results prove to be statistically significant as p-value is lower than 0.005. (p = 0.004). Figure 1 presents the graphical representation of the regression line fitted for the two data series.
Source: Author
Figure 1. Regression line fitted between work productivity and leisure time
For analysis robustness data used for the regression was collected from a single source, so that the analysis shall not be influenced by the lack of data homogeneity. However, in this choice also reside the main limitations of the research – the results can be influenced by the similarity of sample components, as well as running the analysis on a rather small sample. Moreover, since Romania is not a member state of the OECD, its coordinates were not used to running the regression analysis presented in Figure 1.
A study conducted in 2013 indicates that Romanians spend an average of 2 hours and a half every day for
recreation – equivalent to 10% of the day (Sava, 2014). Data from the National Institute of Statistics Romania (INS, n.d.) shows that hourly labor productivity in Romania for the year 2013 it was 36.3 RON. Transforming this value at the average RON-USD exchange rate (Efin, 2016), it can be concluded that the hourly labor productivity in Romania in 2013 was 10.9 USD. This indicates an excellent fit of Romania with the regression equation, as shown in Figure 2. Additionally, this further validates the hypothesis advanced – that leisure time and work productivity are correlated.
156
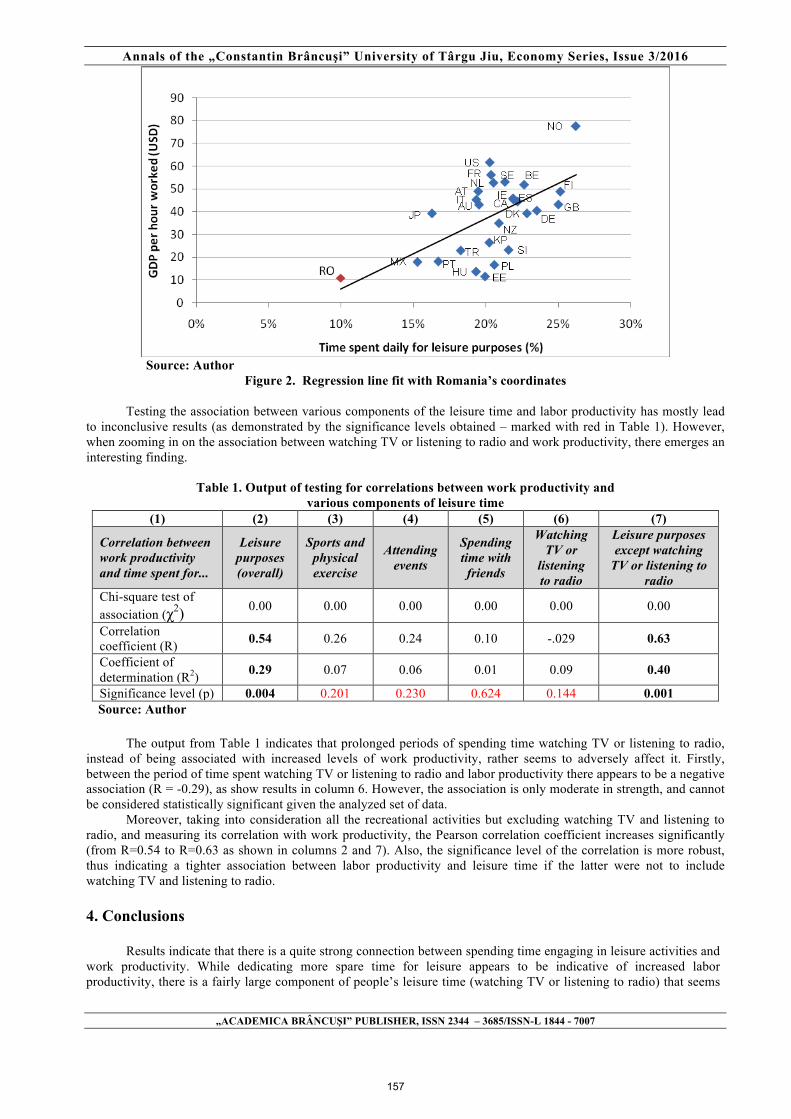
Annals of the „Constantin Brâncuşi” University of Târgu Jiu, Economy Series, Issue 3/2016
„ACADEMICA BRÂNCUŞI” PUBLISHER, ISSN 2344 – 3685/ISSN-L 1844 - 7007
Source: Author
Figure 2. Regression line fit with Romania’s coordinates Testing the association between various components of the leisure time and labor productivity has mostly lead
to inconclusive results (as demonstrated by the significance levels obtained – marked with red in Table 1). However, when zooming in on the association between watching TV or listening to radio and work productivity, there emerges an interesting finding.
Table 1. Output of testing for correlations between work productivity and
various components of leisure time (1) (2) (3) (4) (5) (6) (7)
Correlation between work productivity and time spent for...
Leisure purposes (overall)
Sports and physical exercise
Attending events
Spending time with friends
Watching TV or
listening to radio
Leisure purposes except watching
TV or listening to radio
Chi-square test of association (χ2)
0.00 0.00 0.00 0.00 0.00 0.00 Correlation coefficient (R) 0.54 0.26 0.24 0.10 -.029 0.63
Coefficient of determination (R2) 0.29 0.07 0.06 0.01 0.09 0.40
Significance level (p) 0.004 0.201 0.230 0.624 0.144 0.001 Source: Author
The output from Table 1 indicates that prolonged periods of spending time watching TV or listening to radio,
instead of being associated with increased levels of work productivity, rather seems to adversely affect it. Firstly, between the period of time spent watching TV or listening to radio and labor productivity there appears to be a negative association (R = -0.29), as show results in column 6. However, the association is only moderate in strength, and cannot be considered statistically significant given the analyzed set of data.
Moreover, taking into consideration all the recreational activities but excluding watching TV and listening to radio, and measuring its correlation with work productivity, the Pearson correlation coefficient increases significantly (from R=0.54 to R=0.63 as shown in columns 2 and 7). Also, the significance level of the correlation is more robust, thus indicating a tighter association between labor productivity and leisure time if the latter were not to include watching TV and listening to radio. 4. Conclusions
Results indicate that there is a quite strong connection between spending time engaging in leisure activities and work productivity. While dedicating more spare time for leisure appears to be indicative of increased labor productivity, there is a fairly large component of people’s leisure time (watching TV or listening to radio) that seems
157
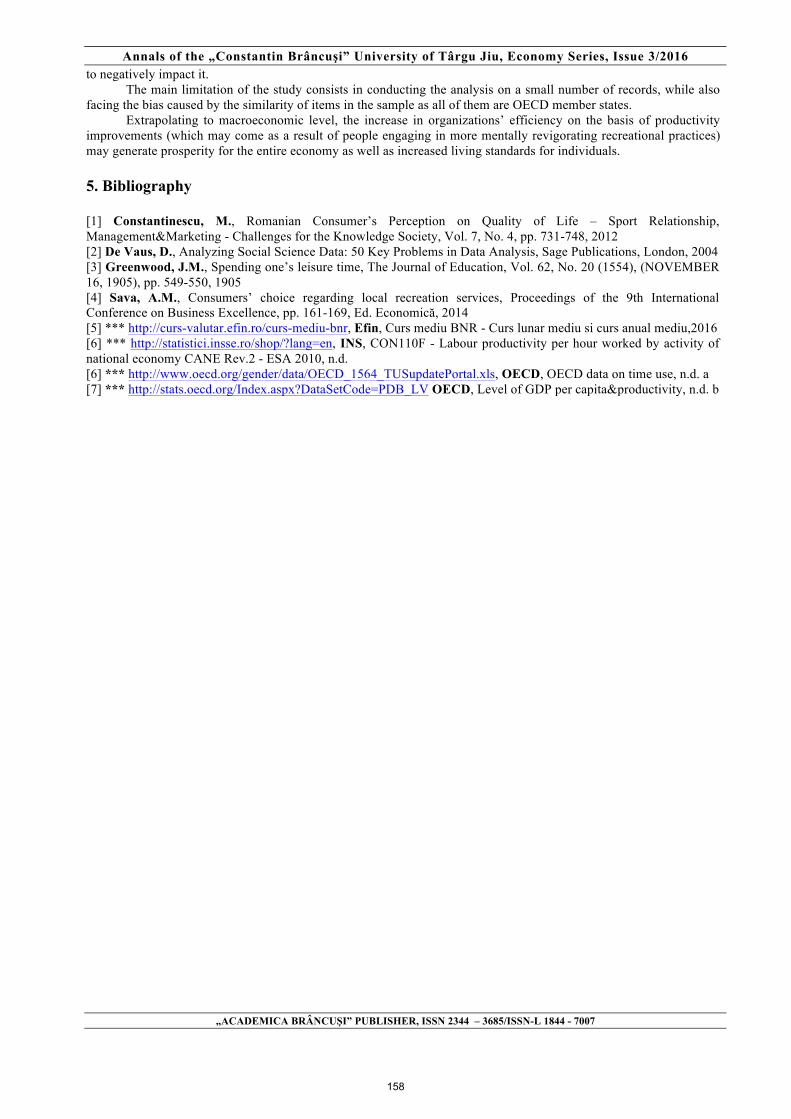
Annals of the „Constantin Brâncuşi” University of Târgu Jiu, Economy Series, Issue 3/2016
„ACADEMICA BRÂNCUŞI” PUBLISHER, ISSN 2344 – 3685/ISSN-L 1844 - 7007
to negatively impact it. The main limitation of the study consists in conducting the analysis on a small number of records, while also
facing the bias caused by the similarity of items in the sample as all of them are OECD member states. Extrapolating to macroeconomic level, the increase in organizations’ efficiency on the basis of productivity
improvements (which may come as a result of people engaging in more mentally revigorating recreational practices) may generate prosperity for the entire economy as well as increased living standards for individuals.
5. Bibliography
[1] Constantinescu, M., Romanian Consumer’s Perception on Quality of Life – Sport Relationship, Management&Marketing - Challenges for the Knowledge Society, Vol. 7, No. 4, pp. 731-748, 2012 [2] De Vaus, D., Analyzing Social Science Data: 50 Key Problems in Data Analysis, Sage Publications, London, 2004 [3] Greenwood, J.M., Spending one’s leisure time, The Journal of Education, Vol. 62, No. 20 (1554), (NOVEMBER 16, 1905), pp. 549-550, 1905 [4] Sava, A.M., Consumers’ choice regarding local recreation services, Proceedings of the 9th International Conference on Business Excellence, pp. 161-169, Ed. Economică, 2014 [5] *** http://curs-valutar.efin.ro/curs-mediu-bnr, Efin, Curs mediu BNR - Curs lunar mediu si curs anual mediu,2016 [6] *** http://statistici.insse.ro/shop/?lang=en, INS, CON110F - Labour productivity per hour worked by activity of national economy CANE Rev.2 - ESA 2010, n.d. [6] *** http://www.oecd.org/gender/data/OECD_1564_TUSupdatePortal.xls, OECD, OECD data on time use, n.d. a [7] *** http://stats.oecd.org/Index.aspx?DataSetCode=PDB_LV OECD, Level of GDP per capita&productivity, n.d. b
158

Annals of the „Constantin Brâncuşi” University of Târgu Jiu, Economy Series, Issue 3/2016
„ACADEMICA BRÂNCUŞI” PUBLISHER, ISSN 2344 – 3685/ISSN-L 1844 - 7007
Annexes
Annex 1. Time spent for recreational purposes and hourly labor productivity in OECD member states
Country Abr Year
% of day spent for recreational purposes
Hourly labor productivity
(USD/person) Leisure
purposes (overall)
Sports and
physical exercise
Attending events
Spending time with
friends
Watching TV or
listening to radio
Leisure purposes
except watching TV or listening to
radio Australia AU 2006 20% 1% 0% 1% 10% 10% 43
Austria AT 2008-09 19% 2% 1% 5% 8% 12% 49
Belgium BE 2005 23% 2% 1% 4% 9% 13% 52
Canada CA 2010 22% 2% 1% 5% 8% 14% 46
Denmark DK 2001 23% 2% 1% 6% 9% 14% 39
Estonia EE 1999-2000 20% 2% 0% 2% 10% 10% 12
Finland FI 2009-10 25% 2% 0% 3% 9% 16% 49
France FR 2009 20% 2% 0% 4% 8% 13% 56
Germany DE 2001-02 24% 2% 1% 5% 8% 16% 41
Hungary HU 1999-2000 19% 1% 0% 4% 12% 8% 14
Ireland IE 2005 22% 1% 3% 3% 6% 16% 46
Italy IT 2008-9 19% 2% 0% 5% 7% 12% 45
Japan JP 2011 16% 1% 1% 1% 9% 8% 39
Korea KP 2009 20% 2% 0% 3% 9% 12% 27
Mexico MX 2009 15% 1% 0% 6% 5% 10% 18
Netherlands NL 2005-06 21% 1% 2% 6% 6% 14% 53 New
Zeeland NZ 2009-10 21% 1% 0% 5% 9% 12% 35
Norway NO 2010 26% 1% 0% 5% 6% 20% 78
Poland PL 2003-04 21% 2% 0% 4% 10% 11% 17
Portugal PT 1999 17% 1% 1% 3% 8% 9% 18
Slovenia SI 2000-01 22% 2% 0% 4% 8% 13% 23
Spain ES 2009-10 22% 3% 1% 4% 9% 13% 45
Sweden SE 2010 21% 1% 0% 2% 6% 15% 53
Turkey TR 2006 18% 0% 0% 5% 8% 10% 23 United
Kingdom GB 2005 25% 1% 2% 6% 10% 15% 43
United States US 2010 20% 1% 0% 3% 10% 10% 62
Source: OECD (n.d. a), OECD (n.d. b)
159

Annals of the „Constantin Brâncuşi” University of Târgu Jiu, Economy Series, Issue 3/2016
„ACADEMICA BRÂNCUŞI” PUBLISHER, ISSN 2344 – 3685/ISSN-L 1844 - 7007
REDUCING GREENHOUSE GAS EMISSIONS AND THE INFLUENCES ON
ECONOMIC DEVELOPMENT
ANGHELUȚĂ PETRICĂ SORIN, PH.D. STUDENT, FACULTY OF AGRI-FOOD AND ENVIRONMENTAL ECONOMICS, THE
BUCHAREST UNIVERSITY OF ECONOMIC STUDIES, e-mail: [email protected]
Abstract
In the recent years, there has been observed a degradation of the environment. This has negative effects on human activities. Besides the influence of the environment on people, also the economic crisis had a negative contribution. The imbalances manifested in the environment influence the economic systems. This article presents an analysis of the greenhouse gas emissions. Also, there is a link between the greenhouse gas emissions and the economic development. In the situation in which the environmental pollution is increasingly affecting humanity, the transition to an economy with reduced greenhouse gas emissions appears to be a viable solution. This transition provides a number of opportunities, as well. Therefore, one of these opportunities is the one related to the employment. In this regard, retraining people working in polluting industries is very important. Keywords: emissions of greenhouse gases, economic activities, renewable sources, enterprise, Clasificare JEL: Q52, O14, P42 1. Introduction
The transition to an economy based on low emissions of greenhouse offers a number of opportunities. One of
the most important issues relating to economy with low emissions of greenhouse lies in economic opportunities. Other opportunities are the social and environmental. I believe that the most important opportunity to transition to low carbon economy Greenhouse gas is the one that envisages employment.
One of the causes of the greenhouse gas emissions of greenhouse is the climate change. Thus, developing approaches on climate change and future communities must take into account the role of local and regional authorities. Supporting and encouraging local and regional authorities can be achieved through the use of development and financing schemes that address issues of climate and energy. In this respect, it is desired that climate change should not affect average temperatures rise by more than two degrees compared to pre-industrial levels.
One of the EU's objectives is to reduce emissions of greenhouse gases by 2030. Thus, it is desirable that in 2030 the percentage of gas emissions greenhouse represent about 50% of the level registered in 1990. However, it should be as energy markets evolve in such a way as to facilitate a transition to a low carbon economy greenhouse gas emissions.
At the same time, solutions can be applied to increase the absorption natural gas emissions greenhouse. The decrease in the perimeter area led to felling forests in order to use wood or expansion of agricultural land [1]. For example, when referring to carbon emissions, can be considered the promotion of forestry and farming effective ways that can be used. 2. Greenhouse gas emissions
Reducing emissions of greenhouse gases can be achieved by adopting appropriate behavior by residents and businesses. At EU level have been proposed emission reduction targets by 2020. At the same time, Member States have adopted new policies regarding energy. Thus, energy consumption decreased and there is a shift towards the use of energy from renewable sources. However, given the negative aspects related to the economic crisis manifested in the first decade of the second millennium, but also due to structural changes in the industry, reducing consumption and emissions have acted to the detriment of employment. In these circumstances, measures are needed to increase public confidence in the reduction of gas emissions greenhouse. Some of these measures may also address energy efficiency and use of energy from renewable sources. Implementation of the measures may differ depending on the economy of each Member State, the dominant structure emission of measures already taken, and specific environmental conditions. Every EU member state there are different conditions for the use of renewable energy sources. These specific conditions into consideration existing factors, such as raw materials, natural environment, production systems and power transmission.
160
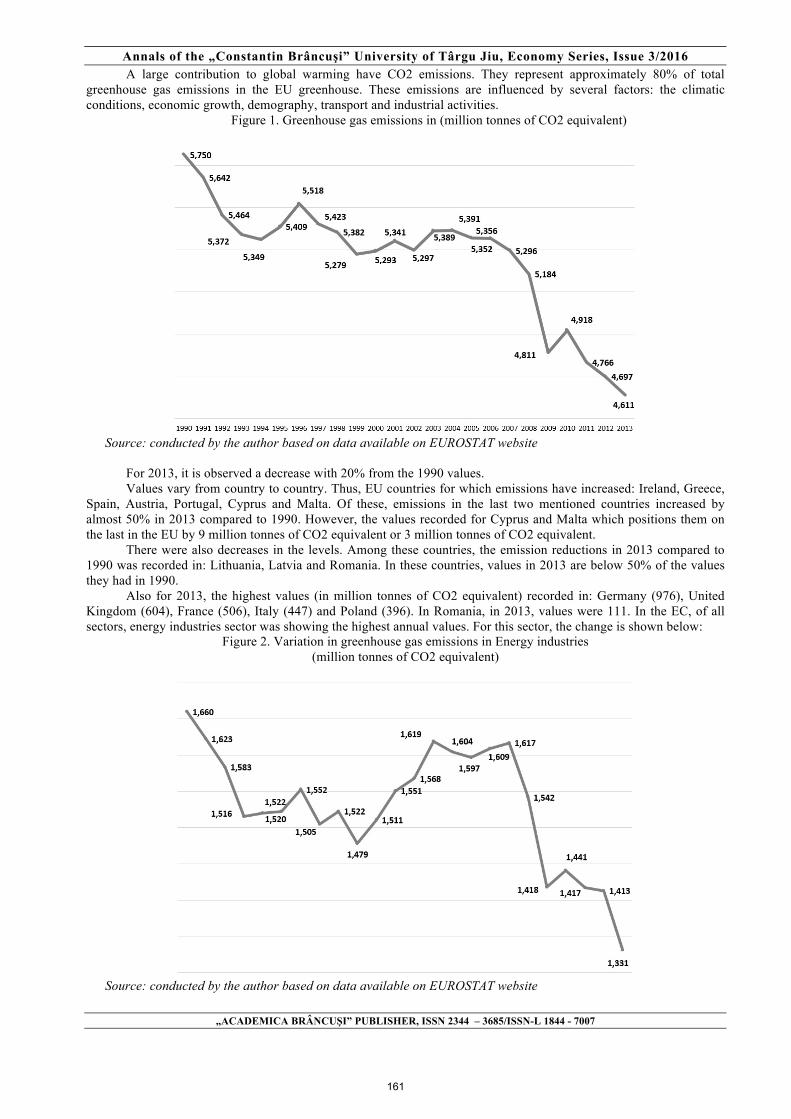
Annals of the „Constantin Brâncuşi” University of Târgu Jiu, Economy Series, Issue 3/2016
„ACADEMICA BRÂNCUŞI” PUBLISHER, ISSN 2344 – 3685/ISSN-L 1844 - 7007
A large contribution to global warming have CO2 emissions. They represent approximately 80% of total greenhouse gas emissions in the EU greenhouse. These emissions are influenced by several factors: the climatic conditions, economic growth, demography, transport and industrial activities.
Figure 1. Greenhouse gas emissions in (million tonnes of CO2 equivalent)
Source: conducted by the author based on data available on EUROSTAT website
For 2013, it is observed a decrease with 20% from the 1990 values. Values vary from country to country. Thus, EU countries for which emissions have increased: Ireland, Greece,
Spain, Austria, Portugal, Cyprus and Malta. Of these, emissions in the last two mentioned countries increased by almost 50% in 2013 compared to 1990. However, the values recorded for Cyprus and Malta which positions them on the last in the EU by 9 million tonnes of CO2 equivalent or 3 million tonnes of CO2 equivalent.
There were also decreases in the levels. Among these countries, the emission reductions in 2013 compared to 1990 was recorded in: Lithuania, Latvia and Romania. In these countries, values in 2013 are below 50% of the values they had in 1990.
Also for 2013, the highest values (in million tonnes of CO2 equivalent) recorded in: Germany (976), United Kingdom (604), France (506), Italy (447) and Poland (396). In Romania, in 2013, values were 111. In the EC, of all sectors, energy industries sector was showing the highest annual values. For this sector, the change is shown below:
Figure 2. Variation in greenhouse gas emissions in Energy industries (million tonnes of CO2 equivalent)
Source: conducted by the author based on data available on EUROSTAT website
161

Annals of the „Constantin Brâncuşi” University of Târgu Jiu, Economy Series, Issue 3/2016
„ACADEMICA BRÂNCUŞI” PUBLISHER, ISSN 2344 – 3685/ISSN-L 1844 - 7007
Values gas emissions for sectors, in comparison for 1990 and 2013, are presented below:
Figure 3. Greenhouse gas emissions by sector in 1990 and 2013
Source: conducted by the author based on data available on EUROSTAT website
There is a decrease in emissions for most sectors. The only sector which in 2013 compared to 1990, recorded
increases in emissions is the transport sector. Also, the biggest decreases were recorded for manufacturing industries and waste management, for which values were recorded nearly 60% of those in 1990.
It is expected that Member States should exploit the opportunities of the transition to a low-carbon economy can offer for the innovation and modernisation of European industry and boosting employment [2].
For Romania, the comparative situation, for the period 1990-2013, is as follows: Figure 4. Greenhouse Gas Emissions comparative situation, for the period 1990-2013
Source: conducted by the author based on data available on EUROSTAT website
162
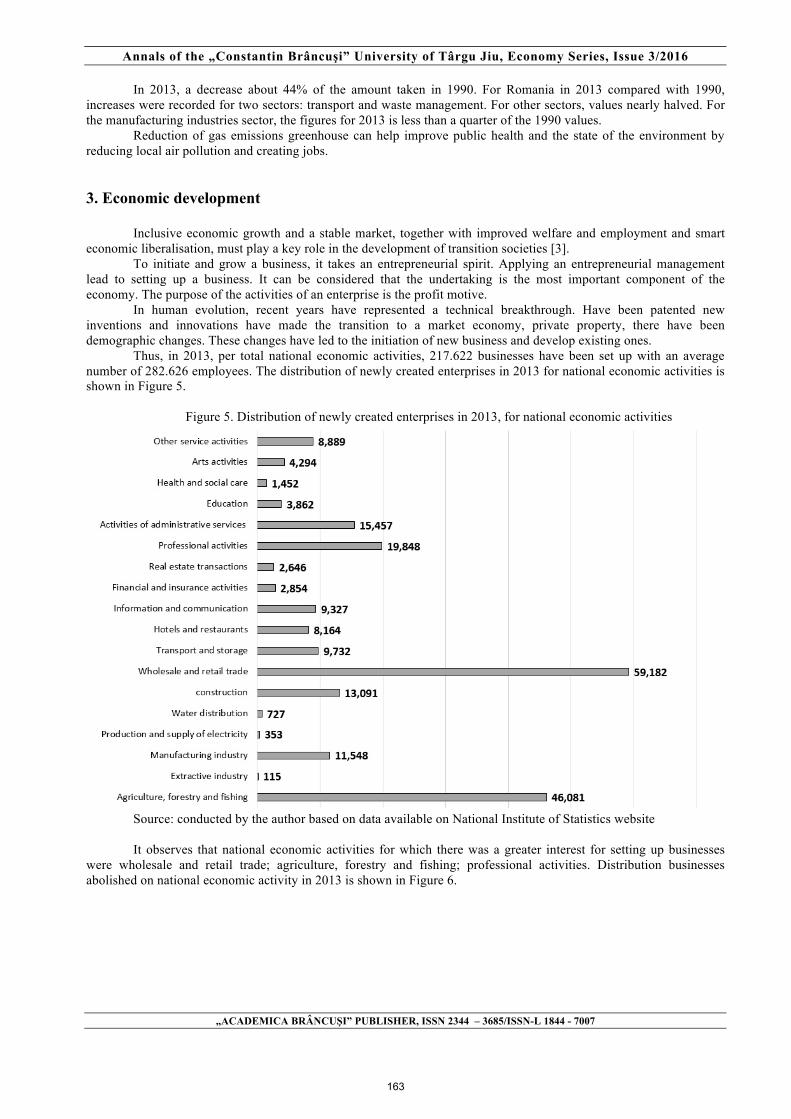
Annals of the „Constantin Brâncuşi” University of Târgu Jiu, Economy Series, Issue 3/2016
„ACADEMICA BRÂNCUŞI” PUBLISHER, ISSN 2344 – 3685/ISSN-L 1844 - 7007
In 2013, a decrease about 44% of the amount taken in 1990. For Romania in 2013 compared with 1990,
increases were recorded for two sectors: transport and waste management. For other sectors, values nearly halved. For the manufacturing industries sector, the figures for 2013 is less than a quarter of the 1990 values.
Reduction of gas emissions greenhouse can help improve public health and the state of the environment by reducing local air pollution and creating jobs.
3. Economic development
Inclusive economic growth and a stable market, together with improved welfare and employment and smart economic liberalisation, must play a key role in the development of transition societies [3].
To initiate and grow a business, it takes an entrepreneurial spirit. Applying an entrepreneurial management lead to setting up a business. It can be considered that the undertaking is the most important component of the economy. The purpose of the activities of an enterprise is the profit motive.
In human evolution, recent years have represented a technical breakthrough. Have been patented new inventions and innovations have made the transition to a market economy, private property, there have been demographic changes. These changes have led to the initiation of new business and develop existing ones.
Thus, in 2013, per total national economic activities, 217.622 businesses have been set up with an average number of 282.626 employees. The distribution of newly created enterprises in 2013 for national economic activities is shown in Figure 5.
Figure 5. Distribution of newly created enterprises in 2013, for national economic activities
Source: conducted by the author based on data available on National Institute of Statistics website It observes that national economic activities for which there was a greater interest for setting up businesses
were wholesale and retail trade; agriculture, forestry and fishing; professional activities. Distribution businesses abolished on national economic activity in 2013 is shown in Figure 6.
163
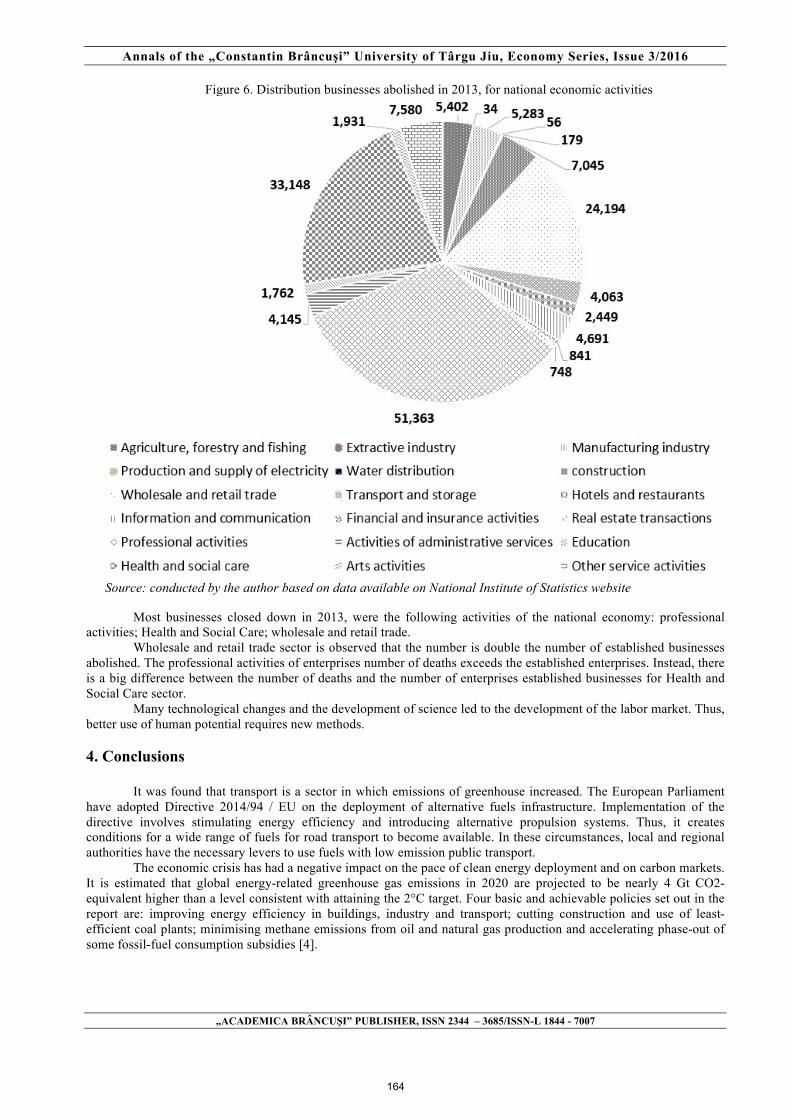
Annals of the „Constantin Brâncuşi” University of Târgu Jiu, Economy Series, Issue 3/2016
„ACADEMICA BRÂNCUŞI” PUBLISHER, ISSN 2344 – 3685/ISSN-L 1844 - 7007
Figure 6. Distribution businesses abolished in 2013, for national economic activities
Source: conducted by the author based on data available on National Institute of Statistics website
Most businesses closed down in 2013, were the following activities of the national economy: professional
activities; Health and Social Care; wholesale and retail trade. Wholesale and retail trade sector is observed that the number is double the number of established businesses
abolished. The professional activities of enterprises number of deaths exceeds the established enterprises. Instead, there is a big difference between the number of deaths and the number of enterprises established businesses for Health and Social Care sector.
Many technological changes and the development of science led to the development of the labor market. Thus, better use of human potential requires new methods.
4. Conclusions
It was found that transport is a sector in which emissions of greenhouse increased. The European Parliament have adopted Directive 2014/94 / EU on the deployment of alternative fuels infrastructure. Implementation of the directive involves stimulating energy efficiency and introducing alternative propulsion systems. Thus, it creates conditions for a wide range of fuels for road transport to become available. In these circumstances, local and regional authorities have the necessary levers to use fuels with low emission public transport.
The economic crisis has had a negative impact on the pace of clean energy deployment and on carbon markets. It is estimated that global energy-related greenhouse gas emissions in 2020 are projected to be nearly 4 Gt CO2-equivalent higher than a level consistent with attaining the 2°C target. Four basic and achievable policies set out in the report are: improving energy efficiency in buildings, industry and transport; cutting construction and use of least-efficient coal plants; minimising methane emissions from oil and natural gas production and accelerating phase-out of some fossil-fuel consumption subsidies [4].
164

Annals of the „Constantin Brâncuşi” University of Târgu Jiu, Economy Series, Issue 3/2016
„ACADEMICA BRÂNCUŞI” PUBLISHER, ISSN 2344 – 3685/ISSN-L 1844 - 7007
Another important consideration is given to sustainable regional planning. Quality of life is very important community members. Thus, measures relating to urbanization territories can contribute to the revaluation of the use of public transport through the use of low-emission fuels or alternative propulsion systems.
Given the mobility of labor and based on changes related to emissions of greenhouse, new tools are needed transparency and recognition of competences and qualifications. Thus, people with multiple skills have the ability to handle the job safer and better paid. For them, the emergence of new technologies, skills upgrading is done much easier. In this way, employees update their skills or acquire new skills facilitate business development organization in which they work. Also, they are able to develop their own businesses. In this way, they go from being a worker in a position to organize their own business alone.
6. Bibliography
[1] Ildiko, I., Bran, F., Rădulescu, C.V., Dimensiunea managerială a conservării naturii, Editura Universitară, București, 2009; [2] Opinion of the Section for Agriculture, Rural Development and the Environment on the Market-based instruments towards a resource efficient and low carbon economy in the EU (2014); [3] Opinion of the European Economic and Social Committee on Sustainable change in transition societies (2014); [4] Opinion of the European Economic and Social Committee on the Communication from the Commission to the European Parliament, the Council, the European Economic and Social Committee and the Committee of the Regions on the 2015 International Climate Change Agreement: Shaping international climate policy beyond 2020 (2014)
165
Annals of the „Constantin Brâncuşi” University of Târgu Jiu, Economy Series, Issue 3/2016
„ACADEMICA BRÂNCUŞI” PUBLISHER, ISSN 2344 – 3685/ISSN-L 1844 - 7007
THE IMPACT OF CULTURE ON THE ECONOMIC CRISIS
CARINA-ELENA STEGĂROIU
LECTURER PHD, „CONSTANTIN BRÂNCUŞI” UNIVERSITY, TARGU JIU, ROMANIA [email protected]
Abstract
This premise of this paper is based on the concept of hedonistic culture, which contributes to financial fragility, damages assessment of future capacity (generating investment myopia and short-termism) and enhances current opportunism. The paper aims to analyze economic culture as a factor of influence on the global economic crisis, considering the culture of modern capitalism that should be defined as a hedonistic culture, and this culture can contribute to global economic crises.
According to the hypothesis of this article, the economic culture and not the individuals underlie economic decisions. Accordingly, the decisions that are taken in the economy, influenced by the dominant culture can have both a positive impact on the economy or a destructive one by generating or maintaining economic crises. The current economic culture authorizes extensive use of loans, including those for consumption, thus generating financial fragility and consequently economic crisis. Hedonistic culture leads operators to focus almost entirely on short-term consequences of his actions to the detriment of long-term outcomes. It is this connection plays an important role in explaining current global crisis resistance. Opportunism emphasized as part of the hedonistic culture also affects the generation and maintenance of the global crisis and unethical behavior by refusing to invest in strategic areas for the economy.
This is particularly the widespread use of credit, including the consumer, in preference to short-term investments at the expense of long-term, low appreciation of the future and also a high and growing opportunism. The global crisis is the result of interdependence agents, burdened by debt, especially short-term constantly growing which is a high financial fragility, directed almost exclusively at short-term gains and tend to cheat in their mutual relations.
Keywords: economic culture, economic crisis, economic culture ascetic, economic hedonistic culture
Classification JEL: B40, B41, B49 1. Introduction and context of the study
Analysis of the impact of culture on economic crisis represents new aspect of economic analysis, simply
because economic culture itself has not been confirmed in economics. This relates to the fact that the current economic mainstream preconditions based on methodological individualism and economic environment almost totally ignores the role of culture as a factor leading to economic crises or, conversely, help to overcome them[1].
This paper aims to treat the idea of economic culture and its impact on the economy, describing the economic channels of the hedonistic culture and how they make their sizeable contribution in developing a global crisis.
2. What is the role of culture in economy and economic activity
The country's economic culture is formed under the influence of geographical position (climate, soil, space),
dominant religion or some other ideology and economic and social history. Namely these factors together with the economic system and economic development underlie the values and norms of a society that make up the economic culture. Economic culture is the main factor that determines the style of economic activity of society. It is the traders that perceive economic information, as they are pragmatic decision makers and they give preference to a set system of values, norms and stereotypes that determine their behavior[2].
The economic culture directly refers to informal institutions as well, which in turn form the basis of any economic system. Accordingly, economic culture in the society tends to determine the path towards a certain economic system.
166
Annals of the „Constantin Brâncuşi” University of Târgu Jiu, Economy Series, Issue 3/2016
„ACADEMICA BRÂNCUŞI” PUBLISHER, ISSN 2344 – 3685/ISSN-L 1844 - 7007
3. Which economic cultures of modern capitalism is considered hedonistic After we have postulated that economic culture plays a very important role in the economy in general, logic
would ask which types of economic culture highligh this factor (economic culture) for its impact to be studied in more depth.
Based on studying the experience of the last century, which is characterized by a full period of economic crisis - the most important criterion for classifying economic culture can influence one or another style of consumption. The explanation lies in the fact that countries that have gone through the economic crisis are distinguished by two characteristics related to the style of consumption[3]. One is to limit current consumption and the other is to stimulate consumption permanently, hence we can say that in general economic culture can be:
- an ascetic economic culture; - a hedonistic economic culture. Ascetic economic culture as it appears in the economic culture of a the society refers to the cases in which
human behavior is subject to certain moral norms requiring asceticism (sacrifice) and for some reason, the renunciation of the largest parts of current consumption. In other words, as M. Weber said, it is a culture that requires worldly asceticism[4].
Economic history shows that successful economic development undermines ascetic economic culture. Increased production sooner or later creates incentives to increase the volume consumption.
Economic culture of modern capitalism should be called hedonistic. This culture corresponds to modern mass consumer society, both in Western countries and in post-Soviet space. Economic and hedonistic culture was considered an ordinary human behavior, characterized by its tendency to maximize current consumption.
Hedonistic economic culture to a certain extent can be considered a positive thing because it stimulates the growth rate of aggregate demand, namely through the development of consumer credit and external financing of investment.
On the other hand, this has its negative and reverse. By researching the negative aspect of this culture we can obtain a picture of how the hedonistic culture contributes to global crises.
4. Hedonistic culture channels as factors of the global economic crisis Ever since1970-1980 H. F. Minsky has made financial fragility hypothesis (also called financial instability
hypothesis) that economic growth is determined by how firms finance their own investment capital[5]. But this awareness is gradually forgotten because, particularly national income created by investment in secure
gradual increase funding regime. There is a risk diminishing the value of both the debtor and the creditor. As he wrote J.M. Keynes: "In the period of economic growth both assessing the level of risk the creditor and the debtor is surprisingly low and unfounded"[6].
The theory described can be summed up as follows: first theorem of the financial instability hypothesis is that there is in the economy mode of funding by contributing to financial stability and funding regime that is unstable economy. A second theory of financial instability hypothesis is that in periods of economic growth changing from financial relationships that contribute to the stability of the system to financial relations that contribute to system instability[7].
5. How damaged appreciation of the future contribute to economic crisis
It is assumed that the level of opportunism is determined by institutional factors, both formal and informal. The
dominant economic culture is one of the key factors influencing the level of opportunism. The hypothesis of this article is that the long existence of hedonistic culture, or rather, rooting in people's behavior and their value system generates a high or / and growing opportunism[8]. The men are required as a supreme value maximizing personal consumption, more so in the eyes of each of them will devalue the interests and welfare of any other man. Correspondingly, the more will be opportunistic behavior of each individual.
6. Conclusions
So, one of the institutional causes of the current global crisis is entrenched in the thinking and behavior of
economic agents hedonistic culture. This is particularly the widespread use of credit, including the consumer, in preference to short-term investments at the expense of long-term, low appreciation of the future and also a high and growing opportunism. The global crisis is the result of interdependence agents, burdened by debt, especially short-term constantly growing which is a high financial fragility, directed almost exclusively at short-term gains and tend to cheat in their mutual relations.
167

Annals of the „Constantin Brâncuşi” University of Târgu Jiu, Economy Series, Issue 3/2016
„ACADEMICA BRÂNCUŞI” PUBLISHER, ISSN 2344 – 3685/ISSN-L 1844 - 7007
6. Bibliography [1] Rozmainski I. V., Hedonistic culture and the global crisis, Terra economicus, T. 3, no. 1, 2014, pp. 29-40. [2] Rozmainski I. V., Culture and economy as a barrier to economic growth, Journal of Institutional Research, t. 4, no. 4, 2012, pp. 22-32. [3] Ţireli S. V., Market economy and consumption patterns, Economic Journal, t. 2, no. 1, 2004, pp. 45-58. [4] Weber M., Selected Works. M .: Progress, 1990 [5] Minsky H. P., The Financial instability Hypothesis // The Levy Economics Institute, May 1992. [6] Keynes J. M., The General Theory of Employment, Interest and Money, Post Publishing, 2009. [7] Palley T., Financialization: What It Is and Why It Matters // The Levy Economics Institute of Bard College, Working Paper № 525, December 2007. [8] Williamson O., Economic institutions of capitalism. Companies, markets, relational contracting, The Free Press. A Division of Macmillan Inc. New York, 1985.
168
Annals of the „Constantin Brâncuşi” University of Târgu Jiu, Economy Series, Issue 3/2016
„ACADEMICA BRÂNCUŞI” PUBLISHER, ISSN 2344 – 3685/ISSN-L 1844 - 7007
FINANCIAL PERFORMANCES MEASUREMENT TOOLS
BÎRCĂ ALIONA PhD. CANDIDATE DOCTORAL SCHOOL OF ECONOMICS
AND BUSINESS ADMINISTRATION,ALEXANDRU IOAN CUZA UNIVERSITY OF IASI, ROMANIA
e-mail:[email protected] Abstract
At the moment, the concept of performance enjoys great popularity in many areas. The typology of performance indicators is very complex, but our research has focused on performance indicators that measure results achieved by the top management. The research contains a number of quantitative indicators, most frequently used by the board of directors through the audit committee, by internal and external audit to measure the achievement of objectives in line with the strategic policies of the entity. Measuring the financial performance without considering the strategic, tactical and operational objectives does not provide a real situation. Therefore we initiated the study by planning the activity of entities, subsequently identified through a series of qualitative factors. In order to ensure objectivity, we proposed both indicators calculated based on revenue and expenditure, and indicators determined on the basis of the cash flow of the entity. Keywords: Financial performance, non-financial performance, strategic performance, primary strategic objectives, strategic operational objectives. Classification JEL: G23, L21, M48,O16, O21 1. Introduction and context of the study
Talking about corporate performance, we focus to successes or notable achievements of an entity. A large part of
researchers regard corporate performances as elements of management performances with reference to financial and non-financial performances. Strategic performance is another approach to corporate performance, being considered as a sequence of steps with the role of ensuring implementation of strategic, tactical and operational plans in line with the objectives to achieve.
The performance of an entity depends on the attitude of those charged with governance towards events that occur both inside and outside of it. International standards recognize that tone provided by senior managers is an important factor in establishing a positive control environment, contributing to the implementation of an effective internal control system. If those charged with governance do not comply with legislation regulating their actions, their subordinate employees’ compliance is unlikely. Conversely, an administration which sets clear objectives, pay attention to risk prevention activities, and shows personal interest in monitoring and developing effective internal control systems will promote a culture where it is more likely that the control works properly.
The purpose of this article focuses seeking the answer to the following question: How should one verify compliance of long, short and medium-term planning, objectives to be achieved and performances? We will find the answer to this question through the following objectives:
- identification of the starting point in measuring managerial performance; - establishment of qualitative factors in evaluating financial performance - identification of conceptual foundations of financial performance;
- investigation of financial performance indicators in profit entities; - specifying the calculation method for each financial indicator. Comparing the strategic performances with internal audit activity specifies intersection and common points of
these concepts. In conclusion we can assert that internal audit helps the entity in achieving its objectives, and Performance Standards for the professional practice of internal auditing regulates these processes. Control is one of the instruments of internal audit in ensuring implementation of strategic objectives, reliability of financial and operational information, safeguarding of assets and compliance with laws and regulations in force and policies to follow. Finally, internal audit must support those charged with governance in the process of implementing strategies, measured through strategic and managerial performances [10].
169

Annals of the „Constantin Brâncuşi” University of Târgu Jiu, Economy Series, Issue 3/2016
„ACADEMICA BRÂNCUŞI” PUBLISHER, ISSN 2344 – 3685/ISSN-L 1844 - 7007
2. Planning and control
Long-term strategic plans are broken down into short and medium term plans and objectives. Budget is financial plan of economic operations for a given future period, set based on objectives. In fact, the budget is a long, medium or short-term plan aiming to support those charged with governance in achieving the objectives. It is visible that targets are set in order to help entities in the process of control. The targets range from general objectives of the entity at the highest level to the goals of everyone in various departments of the entity (Fig. 1).
Figure no. 1. The hierarchy of goals [1] The chain of planning and control system starts with setting goals which, in turn, are developed through the
planning system and budgets. In the same context, internal control checks the execution of objectives through budgets. The primary objectives within profit seeking organizations:
- Maximizing shareholder wealth; - Survival and development; - Profits and shareholder value.
The financial performances have as priority the interests of shareholders, because they are the legal owners of a company. In the long term, the theoretical value of the shares is measured by the present value of future cash flows. Addressing short-term shareholder value focuses around profit. In general, shareholders are concerned about the following:
- current income; - future revenue; - dividend policy; - investment risks.
Usually, the goal of maximizing shareholder wealth is divided into three main objectives: - business continuity (survival); - maintaining growth and development; - making profit [2].
Long-term survival of a business is the financial success of a business and thus the achievement of other objectives. Growth and development is also a symbol of success, provided that the activity is profitable and leads to improved financial performance.
Companies are focusing more on long-term business value than on profit. This is due to the following factors: - Research has shown a direct correlation between shareholder value and profits; - Investors are increasingly turning towards long-term value; - The reported income is not comparable between companies.
The actions taken by the entity to be able to fulfill its purpose should be implemented through: - plans and strategic objectives; - plans and tactical objectives; - plans and operational objectives [1].
Each level must be consistent with the above one. This process involves the transition from general to particular and especially from the overall purpose and objectives to detailed objectives.
3. Management performance
The evaluation process of future management performance starts with examining the overall objective, namely
whether the planned activities seek to maximize wealth of the business owner. Satisfying the needs of stakeholders refers to the secondary objectives of the entity and these are the following: business continuity; ensuring customer satisfaction by providing quality products and / or services; environment, safety and occupational health policies; management and employee rewards.
170

Annals of the „Constantin Brâncuşi” University of Târgu Jiu, Economy Series, Issue 3/2016
„ACADEMICA BRÂNCUŞI” PUBLISHER, ISSN 2344 – 3685/ISSN-L 1844 - 7007
Figure no. 2. Typology of management performance
Financial performance indicators are designed to analyze and interpret a company's accounts by evaluating performance and specifying financial position compared with other entities in the same industry, establishing performance in the medium, long and latent-term as well as mentioning government deficiencies. Profitability, rates of return, liquidity, financial risk, and business risk outline the conceptual support of financial performance indicators, which does not imply ignoring non-financial performance indicators.
Return on capital employed (ROCE) is the key indicator of profitability and is calculated as the product of the net marginal profit and asset turnover. The stock management Just-in-Time (JIT) and the concept total quality management (TQM) are recommended measures for improving liquidity indicators. Non-financial performance indicators contain the information provided by the departments of human resources, marketing, production and have the role of monitoring and controlling the entity's activities without involving accounting principles. Reports of non-financial performance can be provided rapidly to managers, are easy to calculate and easy to understand by managers.
The most traditional method of managing financial and non-financial performance applied by managers is the dashboard (Balanced Scorecard). The Scoreboard focuses on four different perspectives (financial, customer, business, innovative) and aims to establish objectives for each dimension, together with measures that could be used to evaluate whether these objectives have been achieved.
4. Financial performance in the private sector
Any performance measurement system requires substantiation and recognition of the indicators that can be identified as past, current or future results, and documenting durability of the organization and may be qualitative and / or quantitative. As a general rule, these measures are meaningful only when compared to: other time periods, other performance measures, other companies, other industries, other budgets.
The analysis of ROCE involves comparing the indicators: - From one period to another; - Between different companies; - With the current market lending interest rate, plus a risk premium.
Capital employed is usually calculated as the difference between total assets and current liabilities, and may be based on: gross book value, net book value, replacement cost. Analysis of the ROCE is considered as a part of a range of profitability indicators (Table 1) [1].
EPS (earnings per share) = Profit less dividends attributable to preference shares / weighted average number of ordinary shares. This indicator symbolizes that part of the profit attributable to each ordinary share, and, in order to be really meaningful, it should be determined in the following context:
- if EPS is increasing or decreasing compared with the normal limits; - if meaningful after mitigation of EPS; - if calculated consistently [1].
EBITDA represents earnings or profit before making changes according to different interests: interest, taxes, depreciation and amortization. It is like a presentation of the core or center of a company's performance by omitting:
- interest - which essentially relates to the costs; - taxes - levies in the state budget are not relevant in assessing the performance of business; - Depreciation and amortization - these are the costs for the use of tangible and intangible assets. In fact they
signify some aggregate metrics in a certain number of years and therefore could be excluded when assessing financial performance in a year [1].
Net present value (NPV) is a measure of performance based on discounted cash flow analysis. The technique of discounted cash-flow (DCF) is used to determine and compare the income generated by an investment project by discounting future cash-flows of it in order to obtain the present value of these flows. The method focuses on inflows
Financial performance indicators
Non-financial performance
Balanced scorecard
Management performance
- profitability ratios - efficiency ratios - liquidity and gearing ratios - structural ratios
171

Annals of the „Constantin Brâncuşi” University of Târgu Jiu, Economy Series, Issue 3/2016
„ACADEMICA BRÂNCUŞI” PUBLISHER, ISSN 2344 – 3685/ISSN-L 1844 - 7007
and outflows of cash and less on net revenue. The rate obtained by this method is the real annual rate of return on capital immobilized in the investment[4] [6].
Internal rate of return (IRR) is the discount rate at which the net present value of a (future) stream of income or expense equals zero (NPV = 0). When there is uncertainty related to the cost of capital, some managers prefer to assess projects based on IRR, and the project is accepted if the IRR is greater than the firm's cost of capital. In order to accept a project, the IRR must be larger than or equal to the hurdle rate. The project with the highest IRR is the one to be selected, if the company is analyzing two projects. The IRR value is quite difficult to calculate without the help of a financial calculator. So, a financial calculator is highly advised to determine a project's IRR. Otherwise trial and error must be used (Table 1) [4].
Liquidity ratios and the leverage (gearing). Liquidity is the amount of money that a company can quickly obtain in order to honor debts. There is often a tradeoff between liquidity and profitability. Companies can be extremely profitable, but may have problems when they need large amounts of cash, that is why in assessing the financial position of a company is required to determine the profitability and liquidity together. Financial gearing is the use of debt to raise the return on equity using borrowed funds, such that the return resulted is greater than the cost of the debt. If the return on borrowed funds is less than the cost of the debt, the impact is to decrease the return on equity (Table 1).
Table no. 1. Summary of financial performance indicators in the private sector Representation
of indicators Interpretation of
indicators Calculation methods
ROCE
Return on capital employed
- Brut Margin = (Brut profit / Sales) × 100% - Net Margin = (Net profit / Sales) × 100% - Asset Turnover Ratio = Sales / Total Assets - Dividend cover = Profit after tax / Dividend paid to the shareholders over the year - Dividend yield = (Dividend per share/ Price per share) × 100% - Earnings yield= (EPS/ Price per share) x 100%
EPS Earnings per share EPS = Profit after taxes after paying preferred dividends / number of shares in circulation;
Liquidity ratios The company's ability to meet its short-term obligations
-Current ratio = Current assets / Current liabilities; -Quick ratio or acid test = (Current assets - inventories) / Current liabilities -Raw material period = (Average value of raw materials/Purchases) × 365 -Days Sales of Inventory = (Average Inventory value /cost of goods sold) × 365 days -Finished goods period = (Average value of finished goods/Cost of sales) × 365 -Receivables period = (Average receivables/Sales)×365 -Payables period = (Average payables/Purchases)×365
Gearing ratios Financial Indebtedness
- Gearing = (Long term debt/Shareholder funds) × 100% - Gearing = (Long term debt/(Long term debt + Shareholders funds)) × 100% - Interest cover = Profit before interest and taxes/Interest charges
5. Conclusions Finally, we wish to affirm that the financial and nonfinancial performances are key elements in evaluating the activity of an enterprise. Numerical and qualitative performance is the target towards which we focus; however the major strategies and objectives of the entity are the milestones for orientation during this evaluation demarche. Positive aspects of assessment procedures of the financial health of a company on short and medium term are:
- The financial indicators are easy to calculate, the information is available and easily understood by shareholders; - EPS indicators calculation is developed in IFRS 22 (IAS 33), which allows comparability between companies; - Interest eliminated in determining EBITDA indicators are external in nature and shall not affect business success. The fact that the assessment is based on cash flow generates a data safety precaution, because the revenue and expenditure accounts can be more easily distorted than cash accounts; - NPV indicators can be used to compare projects, because they operate with absolute values.
172
Annals of the „Constantin Brâncuşi” University of Târgu Jiu, Economy Series, Issue 3/2016
„ACADEMICA BRÂNCUŞI” PUBLISHER, ISSN 2344 – 3685/ISSN-L 1844 - 7007
Although presented indicators are also frequently used in financial and economic diagnosis of the entity together with a number of other indicators, we believe that their basic purpose is related to internal control, having the role of assessing the effectiveness of control processes of top management. 6. Bibliography
1. Association of Chartered Certified Accountants and the Chartered Institute of Management Accountants, P5 Advanced performance management, Published by: Kaplan Publishing UK Unit 2 The Business Centre Molly Millars Lane Wokingham Berkshire RG41 2QZ, 2008;
2. Association of Chartered Certified Accountants and the Chartered Institute of Management Accountants, F5 Performance management. Course notes, Published by: Learning Media, 2007.
3. Boisselier P., Chalenҫon L., Doriol D., Jardin P., Mard Y., Mayrhofer U., Contrôle de gestion, Magnard-Vuibert-Août, 2013;
4. Brigham E., Houston J., Fundamentals of Financial Management, 12th edition, © 2009 South-Western Cengage Learning,USA.
5. Gral B., How Financial Slack Affects Corporate Performance. An Examination in an Uncertain and Resource Scarce Environment, Springer Fachmedien Wiesbaden 2014;
6. Ivan I., Modalităţi privind depistarea practicilor de contabilitate creativă prin studierea fluxurilor de trezorerie, Audit financiar, XIII, Nr. 8(128)/2015, 32-40 p.
7. Lim S.,The information content of disaggregated accounting profitability: operating activities versus financing activities, Review of Quantitative Finance and Accounting, Springer Science, Business Media New York 2013, 75–96 p.;
8. Manzoni A., Islam, S., Performance Measurement in Corporate Governance, DEA Modelling and Implications for Organisational Behaviour and Supply Chain Management,,, Springer Dordrecht Heidelberg London New York, © Physica-Verlag Heidelberg 2009;
9. Oladipupo S., Satirenjit K., Mohd Y., Holistic Approach to Corporate Governance: A Conceptual Framework,Global Business and Management Research: An International Journal Vol. 6, No. 3 , 2014, 251–255 p.;
10. Precop C., Mironiuc M., Influnța raportării capitalului intengibil asupra performanței companiilor românești, Audit financiar, XIV, Nr. 1(133)/2016, 40-51 p.
11. Tabără N., Briciu S., Actualități și perspective în contabilitate și control de gestiune, Iași: Editura Tipo Moldova, 2012 ;
12. ***www.investopedia.com.
173

Annals of the „Constantin Brâncuşi” University of Târgu Jiu, Economy Series, Issue 3/2016
„ACADEMICA BRÂNCUŞI” PUBLISHER, ISSN 2344 – 3685/ISSN-L 1844 - 7007
IMPORTANCE OF SMES IN EUROPEAN COUNTRIES ECONOMY
ROMANESCU MARCEL LAURENȚIU
CONF. UNIV. DR. OF THE ”CONSTANTIN BRÂNCUȘI”UNIVERSITY OF TÂRGU-JIU, e-mail:[email protected]
Abstract Fundamentally this Article bases and develop a conceptual approach to improve the management of the SME sector in European countries into a new stage of market economy. Approach that fostered implementation priorities and mechanisms that have led to solving the most important problems, and improving management-oriented development of SMEs with limited resources according to the development strategy of small and medium enterprises for 2012-2020. In conclusion theoretical significance and practical value of research involves analyzing specific characteristics of SMEs and state policy, economic policy support to countries, arguing conceptual approach proposed for the main directions and mechanisms to improve the management of the SME sector, which forms the basis for an increase in the contribution to economic and social development of the country. Specific research activities for SMEs, recently captured the attention of scientists, public servants involved in the regulatory and business support, and representatives of the business community. SMEs contribute to the development of competition, provide mostly jobs, including in times of crisis, enables self-realization of citizens, creates prerequisites for the formation of the middle class which provides stability in society Keywords: SME, sector, economy, development, entrepreneur Clasification JEL : E01, M16, M50, 1.Introduction We tried to bring into focus the main foundations scientific results and practical: a well founded and developed the conceptual approach for îmbunătăţrea management of the SME sector in developed market economy, supported the priorities and mechanisms for its implementation that determines solving applied ; aimed at improving the management of development of the SME sector based on limited resources both in the short and medium term in line with the development strategy of small and medium enterprises for 2012-2020 years. Theoretical and practical value of research: analyzing the specifics of SME and characteristics of state policy support to countries that make market economy, arguing conceptual approach proposed priority directions and mechanisms to improve the management of SME sector in low resource that provides the basis for growth its contribution to economic and social development of the country. 2. Key features and types of SMEs object management Research in small and medium enterprises (SMEs) in recent decades has attracted the attention not only of scientists but also of civil servants involved in the regulation and business support, as well as representatives of the business community [1, p. 65]. The importance of SMEs is due, above all, the importance of the tasks they capable of solving economic and other aspects of public activity. In particular, SMEs: - boosting competition; - Has flexibility to respond to rapidly changing demand; - Provide mostly employment, including in times of crisis; - Enables self-realization of citizens; - Creates conditions for the formation of the middle class that provides stability in society. SMEs contribute to the establishment of private property, the development and implementation of innovations and participate in exports and attracting investment. This determines the practical importance of development of the sector, its impact on socio-economic development of individual countries and regions. The most quoted European SMEs are enterprises which employ a significant proportion of workers. For example, in the European Union SME sector is more than 99% of all category of businesses, with almost two thirds of people employed in the economy.
174

Annals of the „Constantin Brâncuşi” University of Târgu Jiu, Economy Series, Issue 3/2016
„ACADEMICA BRÂNCUŞI” PUBLISHER, ISSN 2344 – 3685/ISSN-L 1844 - 7007
The successful developments of SMEs rely on support from the state. In most European countries, both economic development and rise of the market, supported by the application of laws and institutions targeted by government programs newly established specifically designed to support the SME sector. EU operational program was adopted "Small Business Act" for Europe, designed to support this group of enterprises. Over the years, developed and implemented mechanisms aimed State support for SMEs, such as: - the adoption of laws regulating the establishment and operation; - Implementing strategies and programs to support SMEs; - Establishing the institutional framework required minimum, etc. The SME sector is often seen as a homogeneous group of diverse businesses in isolation without being specific groups of SMEs, making it difficult to develop adequate public support. Developing modern economy is based on the activity of enterprises of different sizes - large, medium and small, whose role has been radically changed in recent decades. Small businesses tend to use their own savings and funds from the inner circle: relatives, neighbors, friends. A disadvantage of all resources for development involves coercion. SMEs flexibility has many manifestations: - are responsive to any changes in market demand, because they are willing to drastically change its activities by combining the available resources; - Relatively easy to update and activity profile. - Can change the location of the business to make a profit, merge or acquire another company [3, p. 55.]. In the EU, all developed countries, it is recommended to support SMEs in using a single criterion of quality. The main criteria for quality of SMEs are: judicial independence SMEs, which excludes the possibility of influence over the management of company management; lack of influence on a market. 3. The basic directions and current trends in European policy to support SMEs In theory, one of the most important issues related to regulation of SMEs is their justification by the need eyebrows at first glance, contrary to the requirement of market economy and creating a level playing field for all operators. Since it was found that small and large businesses are not fair competition, namely the business environment is less favorable SME sector. It is understood that by strengthening the capacity of business providers have a positive impact on the performance of SMEs. Analysis of management approaches of SMEs in different countries revealed three major factors that determine business support system: a) governance model - liberal or conservative; b) national cultural characteristics of the population, manifested in certain regions; c) the development of market relations (including the availability and quality of institutions, methods of doing business and others.) that differs from the cost in developed countries and developing countries with economies in transition. This allowed a more compelling trends in SME management in Europe for two decades and has led the development of a long-term direction and support mechanisms for this sector. The role of SMEs in the economic development of the EU has been repeatedly recognized at the highest political level. EU 2020 Strategy, one of the priorities is to conduct industrial policy, which aims - increasing business competitiveness by improving the business environment, especially for SMEs. The main methods directly development and support of SMEs in the EU, they are law and EU operational programs. In 2008 the European Commission drafted a document to strengthen and steady growth of small and medium enterprises, which was named European Act - "First think of the children". Act stated that SMEs need to get started by EU policy and that they should consider the needs of SMEs. European Act is based on 10 principles that reflect current trends in EU Member States in the field of SMEs: - Create an environment in which entrepreneurs and family businesses can thrive and entrepreneurship is rewarded; - To provide an opportunity an honest businessman who faces the threat of bankruptcy, so he can quickly benefit from a second chance; - Develop rules (required for the development of legislation and simplification of environmental regulations), in view of the "Think Small First"; - Make sure susceptibility government supports the needs of small and medium enterprises; - Facilitate SME participation in public procurement and enhanced, support the use of state aid; - Facilitating SMEs' access to finance to improve the legal and business environment, conducive to achieving commercial contracts timely payments; - Aid provided SMEs to extract more profit from the opportunities offered by the single European market;
175

Annals of the „Constantin Brâncuşi” University of Târgu Jiu, Economy Series, Issue 3/2016
„ACADEMICA BRÂNCUŞI” PUBLISHER, ISSN 2344 – 3685/ISSN-L 1844 - 7007
- To promote staff development in SMEs and develop all forms of innovation; - To help SMEs to have capapcitatea to overcome environmental challenges; - Encourage and support SMEs to obtain profits in emerging markets [2, p. 77]. The support system for SMEs has been refocused on using indirect methods - above all, the creation of institutions to support and improve the general business environment. 4. Peculiarities of intellectual property rights management in small and medium enterprises sector In many states, regardless of their level of economic development has significantly increased the SME sector role in solving economic and social problems of society. Today, SMEs not only provide employment, create new jobs, consumer market saturation and the formation of the middle class. Increasingly, SMEs involved in the creation and implementation of innovations. In countries with a market economy, the small and medium enterprises was posted long positions safe, with predominance in the total number of businesses and diversifying the structure of the branch of the economy, new jobs, including for socially vulnerable layers of the population, while ensuring an important part of export and actively participating in research and development in the field of technical and scientific - thus influencing positively the country's competitiveness. SMEs have the ability to rapidly adapt to cyclical and structural changes in the global economy. An SME sector can thus well developed to support macro-economic stability and growth. SMEs are an important part of Europe's economic and professional activity. In practice, they represent 99% of EU businesses and occupies 2/3 of private sector employees. Small businesses, in fact, are considered true giants of the European economy. The indicator SME share in GDP or gross value added varies significantly in different countries. EU SME sector generates 58.4% of gross value added in the US - 43.4% In this context, intellectual property is a valuable asset that companies can use it in a strategic manner according to its needs. Obtaining IP protection is the first crucial step, but effective management of intellectual property means more than protection of intellectual property rights of an enterprise [5, p. 78.]. It should be stressed that for the enterprise, intellectual property is more than a simple protection, it is an instrument of conquest and communication. In a context of international competition, intellectual property is for undertaking a strategic means of competition since it allows a legally compel competitors, limiting their freedom of maneuvering, so placing them in a situation of dependence or excluding them from the market. That is why countries or the most aggressive leader in marketing are so concerned and active intellectual property chapter. In the face of fierce competition, intellectual property is a strategic tool that businesses can use it, allowing it to capitalize on innovations, but also to fight against counterfeiting. So using intellectual property company can draw benefits both in terms of profits and in terms of image. Under current conditions, intellectual property allows entrepreneurs to solve some of the most complex problems of their busines, such as: - Entering new markets (research and development by consulting patent databases, thus informing themselves about the latest technological); - Implement a franchise system based on company brand and other intellectual property rights; - Defense markets, preventing competitors to copy or counterfeit products or services of one undertaking. Intellectual property presents a mechanism whereby SMEs can strengthen their market position. An efficient management of intellectual property rights allows businesses and companies to increase their competitiveness and on this basis to achieve strategic advantage in the market. Strategic use on an enterprise, especially small and medium enterprise, it will make intellectual property rights, will strongly depend on the overall strategy. An efficient management of intellectual property rights can open up new business opportunities for companies that have the expertise, capacity for innovation and resources to use different options offered by the intellectual property system. Intellectual property rights - especially patents and utility models - not just a challenge to innovate, but in addition they play a basic role in disseminating new information technology because patents are published in most countries 18 months after filing of the application. Patents to be disclosed function facilitates the movement of new knowledge and technology is likely to reduce the resources devoted to research and development, thus avoiding a double thing. Since the 90s, most national IP offices of the OECD and the European Patent Office have implemented their databases on patents for the public to consult them without charge. The provision of these databases make them a potential source of invaluable technical information that is accessible to researchers and businesses, especially small and medium enterprises. In the last two decades, public action aimed to encourage innovation in small and medium-sized regularly, given that the development of a dynamic sector enterprises requires a permanent innovation to be able to adapt to a business environment that is evolving rapidly and fierce competition in the market. We note that the ability and the ability of businesses to innovate and develop new products, processes and services vary greatly depending on their sector, size, their resources, the environment in which they practice their professional activities[6, p. 44].
176

Annals of the „Constantin Brâncuşi” University of Târgu Jiu, Economy Series, Issue 3/2016
„ACADEMICA BRÂNCUŞI” PUBLISHER, ISSN 2344 – 3685/ISSN-L 1844 - 7007
The transition to a "knowledge economy" means that a basic condition in the creation of welfare by generating innovation, exploitation and dissemination of knowledge. In this context, creation, intellectual property protection, and its management is gaining importance increasingly higher. Various studies show that SMEs have difficulties in using the intellectual property system. Often this is due to limited knowledge of the intellectual property system, businesses knowing with certainty whether it is adapted to their level of economic strategy and competitiveness and considering this system too complicated and expensive to use In the knowledge economy, intellectual property is a key element in making daily decisions. Almost daily, new products appear on the market, Trade Marks and Designs is the result of the continuous human innovation and creativity. SMEs are often the driving force behind these innovations. However, their creative capacity is not always fully exploited, given that many SMEs are not fully aware of the importance of the intellectual property system. Many intellectual property offices do not have statistics on the work of registration of intellectual property objects commercialization of SMEs. CONCLUSION In emerging countries, the SME sector has a vast potential that favor formation of the middle class population, developing the spirit of private initiative and ensure economic and social stability. A developed sector of small and medium business influence on the country's competitiveness on an international scale. The current economy characterized by rapid evolution of information and communication technologies, it is becoming increasingly based on knowledge and innovation. Nowadays, when everything moves fast tempos, when competition is becoming increasingly fierce, to survive in the market, you need to apply it quickly elaborăril intellectual cutting edge. New technology creates economic opportunities, cultural and social ideas are implemented in an innovative way to increase productivity and create jobs, etc. Economically developed countries have understood long ago that for an intellectual product of economic benefit to it should be protected legally by obtaining the protection. The fact that intellectual property should be protected well play an important role in fostering the creation of knowledge, dissemination of artistic expression and technological progress - essential for economies focused on knowledge. BIBLIOGRAPHY
1. Aculai E., Vinogradova N., Percinschi N., Novac A., Clipa V. Dezvoltarea întreprinderilor mici şi mijlocii: contribuţie, provocări şi direcţii de perspectivă. Chişinău: IEFS, 2012.
2. Borza A., Bordean, O., Mitra, C., Supuran, R., Mureşan, A., Antreprenoriat. Managementul firmelor mici şi mijlocii. Concepte şi studii de caz, Ed. Risoprint, Cluj-Napoca, 2009.
3. Burduș Eugen. Întreprinzătorul, Editura Pro Universitaria, București, 2010. 4. Dalotă, M., D., Managementul întreprinderilor mici si mijlocii: fundamente teoretice, studiu de caz, teste
grilă, București, Pro Universitaria, 2008. 5. Grigore Ana Maria, Antreprenoriat si management pentru afaceri mici si mijlocii, Editura V. H. beh,
București, 2012 6. Nicolescu Ovidiu, Intreprenoriatul și managementul intreprinderilor mici si mijlocii, Editura Economică,
bcuurești, 2008.
177

Annals of the „Constantin Brâncuşi” University of Târgu Jiu, Economy Series, Issue 3/2016
„ACADEMICA BRÂNCUŞI” PUBLISHER, ISSN 2344 – 3685/ISSN-L 1844 - 7007
STUDY ON INCREASING THE SHARE CAPITAL BY NEW CONTRIBUTIONS IN
CASH AND IN KIND
CARUNTU GENU ALEXANDRU ASSOC.PROF.PHD, CONSTANTIN BRANCUSI UNIVERSITY FROM TARGU JIU
HOLT GHEORGHE PROF.PHD, CONSTANTIN BRANCUSI UNIVERSITY FROM TARGU JIU
Abstract
Selecting the means, techniques and financing tools is the correct expression of a financial policy placement. Essentially, the financial policy consists in determining the weight that equity and borrowed capitals have and must have into the company resources, taking into account their actual cost. It is envisaged the high share of capital in total equity, which represents long term resources in company’s activity and which knows more ways to move over time.
The share capital is equal to the nominal value of inscriptions or shares, respectively the value of the contribution in kind or in cash mentioned in the memorandum. Over the life of the company's existence, the share capital may increase by new contributions, by incorporation of reserves and by debt conversion of the company, respectively of the claims that creditors have on it. Keywords: financing instruments, Increase of capital, dividents, share premium account, Clasificare JEL : M40, M41 1. Introduction and context of the study
The increase of share capital by new contributions in cash and in kind must realise according to provisions of current normative acts including, in the foreground, the advertising. Publication of the share capital increase is required by the necessity of knowing this operation by all shareholders or members to be able to exercise preferential subscription rights, and by other natural or legal persons concerned.
The share capital increase by new cash contributions, constitute a mean of financing and building equity. This decision has as first effect the increasing of the nominal value or the number of shares of the company.
The issuance of new shares can be achieved by: - the private placement, destined to the shareholders of the company; - the public offer in order to attract existing market economies.
The decision to issue new shares requires the establishment of: the issue price (Pe) and the share premium (pe).
• The issue price (Pe) In the case of companies whose shares are not traded on the stock market (at the Bucharest Stock Exchange or
OTC markets), the issue price (Pe) is equal to the nominal value (Vn) of shares already issued. In the case of companies whose shares are quoted on one of the stock markets, the issue price (Pe) is selected in
a limited range, by the nominal value (Vn) of shares already issued and by their price (course) on the market (Cv). Therefore, the issue price can not be lower than the nominal value, nor higher than the price (course) of the market for the shares already issued by the company.
• The share premium (pe) is the deviation between the issue price of the new shares and the nominal value of the company shares. The value of the share influence the issue price, the number of shares issued to obtain capital approved (by the Extraordinary General Meeting) and dividends that will be paid in the future for each share.
The share premium (pe) represents the price paid by shareholders to constitute the reserves of the company. The total amount of share premiums is added to the company reserves accounted for the company extra financial resources in relation to capital. These resources are not benefits (profit) and are not the subject to division. In the situations in which the company has accumulated reserves, the issue price may be equal to the nominal value of shares. So the share premium is zero. This will result in increasing the number of shares issued and the amount of dividends payable in the future, reflected in cash flows. In the case of capital increase by a cash contribution, the old shareholders can benefit, according to legal provisions, a right of refusal. The Extraordinary General Meeting may decide to grant or its suppression (for example, in case of recurrence to existing market economies).
178

Annals of the „Constantin Brâncuşi” University of Târgu Jiu, Economy Series, Issue 3/2016
„ACADEMICA BRÂNCUŞI” PUBLISHER, ISSN 2344 – 3685/ISSN-L 1844 - 7007
The right to pre-emption requires the establishment of preferential subscription rights, which is a right of priority given to old shareholders. Based on this, the old shareholders can: - subscribe a number of new shares in proportion to the number of shares they hold up to the issue date; - acquire new shares at the issue price which is lower than the price (of course) on the market for the shares already issued. By granting of preferential subscription rights shall be avoided following effects:
- diluting the power of decision; - diluting the benefit (profit) per share; - diluting the old shareholder wealth. The theoretical value of preferential subscription rights is calculated based on: - the issue price of new shares: Pe - the number of new shares: Nn - the number of old shares: Nv - the price (course) of old shares: Cv
Knowing that: - before the share capital increase, the number of shares already issued (old) is Nv, and the price (value) of
each stock market is Cv; - the decision to increase the capital on the cash contributions generates the issuance of new actions Nn, to an
issue price Pi, then, after the issue, we will record: - the total number of shares in the company is Nv + Nn; - the theoretical value of all shares is Nv x Cv + Nn x Pe;
- the theoretical value Ct of a share is:
Nv x Cv + Nn x PeCt=
Nv + Nn
The theoretical value of preferential subscription rights (Vs) is the difference between the price (course) of the
company shares before and after the issuance:
Vs = Co - Ct or:
( )Nv x Cv + Nn x Pe NnVs=Cv - = Cv-PeNv + Nn Nv + Nn
As each old share gives right to a dividend, then the price (course) on the market of the old shares include the
value of the dividend. The new shares, at the time of issuance, still do not give the right to a dividend. Consequently, the theoretical value of preferential subscription rights, '
sV , becomes:
( )'s
NnV = Cv - D - PeNv + Nn
The old shareholders can use or sell the preferential subscription rights during the subscription period while
the subscription lasts. The price (course) on the market depends on the fluctuation of supply and demand. After the issuance, the real value of the shares and preferential subscription rights depends on market reaction.
All shareholders of the company benefit of: - the right to vote; - the right to receive dividends;
- the right to receive part of the net asset value at company liquidation. These rights are proportional to the number of shares of the total issued by the company, in the case of
ordinary shares. Companies can issue, under the conditions provided by law and by statute, actions that differentiate right to vote and the right to receive part of the distributed profits. Thus, the priority or privileged shares for a nominal value equal to ordinary shares give different rights to holders. These financial titles (or securities) entitle to:
- a plural vote (more than one vote); - a statutory dividend (provided by statute) or a second higher dividend; - a right of priority for payment of dividends.
In return, the priority dividend shares without voting rights, entitle holders to a priority dividend whose minimum level is established legal and by status in exchange for giving up their right to vote.
179
Annals of the „Constantin Brâncuşi” University of Târgu Jiu, Economy Series, Issue 3/2016
„ACADEMICA BRÂNCUŞI” PUBLISHER, ISSN 2344 – 3685/ISSN-L 1844 - 7007
The rights that shareholders benefit generate effects on decision-making, on flows from the treasury and on how to reward the capital invested.
The financial impacts of increasing capital on cash contributions are: - increasing the potential funding because monetary availability of the company grow; - strengthening the equity capital due to the growth of the company;
- improving the financial balance as working capital due to the increase of permanent capital while assets remain unchanged. The effect is temporary. Investing resources obtained in inmaterial assets has as result the reduction of working capital. Because the positive effect on the financial balance is not disturbed, it should be integrated in the investment plan and financing growth capital on contributions. Large capital firms have access to existing shareholders on the international financial market. The issuance of Eurobonds generates the effects presented above and in addition contributes to introducing various markets. This financing option is a financial expression of growth strategies heritage and internationalization of business through which the globalization of economies completes.
The expenses generated from the capital increase include: - legal expenses, resulting from the change of the company status; - administrative costs;
- commissions paid to financial intermediaries for the services offered (financial advisory, placement of shares, subscribed amounts centralization, guarantee issue).
The increase of share capital by contributions in kind (usually tangible) is a mean of financing through which the increasing of equity is produced.
Contributions in kind intervene in various situations: - when setting up the company, when must respect their maximum share value provided by law, in the total of
share capital; - throughout the life of the company. This operation affects the productive potential. Consequently, the evaluation of contributions in kind presents significance. An overvaluation generate partly fictitious growth of the share capital that does not ensure the increasing of productive potential, influence the negative impact on equality between shareholders and on distributed dividends and the creditors' rights are in danger.
On the account of contributions in kind grow, simultaneously, assets and equity. Instead, the working capital remains unchanged. To ensure exploitation of new assets, companies may be forced to seek new financing in order to increase its cash money. - In the case of merger, when the acquiring company receives as input all assets held by the company being acquired. When includes part of the company's asset contribution, it does not disappear, as it is a partial absorption operation. After this operation, the rewarding form of shares may remain in its portfolio or may be distributed to shareholders (company contribution).
In financial terms, merger and partial absorption operations can assimilate foreign investment, whose funding is provided through the issuance of shares.
- for division operations, contributions which come from the company that is dismantling can be designed for two or more beneficiary companies. The capital increases by shares issuing appear to companies that take contributions.
The decision to increase the share capital on account of contribution in kind has the effect of increasing the number of issued shares, the ratio of the total amount of contributions in kind and the nominal value of the shares, advanced or not with the share premium (contribution).
The capital increasing is an operation that involves a number of expenses, namely: - the costs of contributions in kind evaluation; - the administrative costs;
- legal expenses, generated by a company's status modification. The subscription right (pre-emption right) may be exercised by existing shareholders of a company given that
there is an increase of its share capital by cash contribution. Thus, the subscription right is a mean to protect the interests of the company’s old shareholders being that its exercise assure of avoidance to reduce benefits received by them as a result of the increased number of shares. Also, by exercising the pre-emption right, the old shareholders retain their share of capital invested in the company and as a result, the power to control its activity.
Given that the minority shareholders have limited decision-making power regarding the control of the company’s activities, they are in a position to submit to the decisions taken by AGA. Thus, supposing the decision to increase capital, the only way they can protect their invested capital is to exercise the pre-emption right (subscription). In this way, the minority shareholders retain the share capital held and the size of the gains realized from the capital investment in the company's activity.
In this regard, the legal regulations state that the capital increase operation without granting the existing shareholders pre-emptive rights is null and void. However, the same regulations states that the General Assembly may raises, for good reasons, the shareholders' subscription right to new shares totally or partial. For making this decision requires the presence of three-quarters of the share capital holders and the voting share of a number of shareholders
180
Annals of the „Constantin Brâncuşi” University of Târgu Jiu, Economy Series, Issue 3/2016
„ACADEMICA BRÂNCUŞI” PUBLISHER, ISSN 2344 – 3685/ISSN-L 1844 - 7007
representing at least half of the share capital. Unfortunately, such protection is not insured in case of capital increases by contribution in kind, when the pre-emption right ceases.
The proceeding to protect, in this case proposed by the Capital Market Law, no. 297/2004, is the condition imposed on the reference value of the shares issued in exchange for the contribution in kind made to the company's capital. Thus, the number of shares that follows the contribution in kind is determined as the ratio between input value, determined by independent experts, and the highest value between the market price of a share, the value per share calculated based on the accounting net asset or the nominal value of the share (art. 240, par. 3 and 4). Under these conditions, the minority shareholder is protected against losses in its earnings per unit of capital invested in the company, in exchange its participation quota on share capital decreases.
2. Conclusions
In conclusion, the pre-emption right provides protection of minority shareholders in circumstances in which it
may be exercised. The amount of capital held by these shareholders also depends on the performance of the activity conducted by the company. Thus, in making the decision to exercise the pre-emption right (subscription) should take into account the opportunities of building upon the existing capital market.
3. Bibliography
1. Albu, N., Albu, C., Performance management tools, Economica Publisher, Bucharest, 2010 2. Caraiani, C., Dumitrana., M., Accounting and Management Control, InfoMega Publisher, Bucharest, 2004 3. Epuran, M., Babo, V., Grosu, C., Accounting and Management Control, Economica Puclisher, Bucharest,
2009 4. Florinel, M., Sgârdea, Management Control, Academy of Economic Sciences Puclisher, Bucharest, 2009
181
Annals of the „Constantin Brâncuşi” University of Târgu Jiu, Economy Series, Issue 3/2016
„ACADEMICA BRÂNCUŞI” PUBLISHER, ISSN 2344 – 3685/ISSN-L 1844 - 7007
USING PARAMETRIC METHODS FOR OPTIMIZIMG PRODUCTION COSTS IN
ECONOMIC ENTITIES WOOD PROCESSING INDUSTRY
GHEORGHE(DAMIAN) AURELIA, PHD, "VALAHIA" UNIVERSITY FROM TARGOVISTE,
e-mail: [email protected]
DAMIAN DORIAN FLORIN PHD, "VALAHIA" UNIVERSITY FROM TARGOVISTE,
Abstract
The ability to control production costs, taking into account the qualitative performance of products, is a central objective of an enterprise located in a strong competitive environment.
In order to optimize production costs, parametric methods specifically adapted wood processing industry with mass production are applied.
Starting from a theoretical approach of parametric methods, it then proceeds to determine the actual costs and results achieved.
For a wider perspective, the costs of a product already in production versus costs of a new product the same range are analyzed.
The results obtained following the application of parametric methods emphasize the possibility of developing technological manufacturing process, leading indicators of optimizing of production costs. Keywords: cost optimization, parametric methods Clasificare JEL : M40, M41 1. Introduction and context of the study
The main objective of this paper is to clearly establish the optimal production cost for a new article introduced in fabrication, so that its value does not exceed the significance threshold given by the cost of production of another article (finished product) already in course of production. The finished product in question has generated for a considerable period of time substantial income in an economic entity of the wood industry of mass production. 2. Description of research theme
The approach in this paper is made from a practical perspective, with appreciation of the impact between theoretical model and real data. Moreover it is also one broad spectrum, taking into account as many cost elements that make up the finished product cost structure. Elements (expenses) included in cost of production are: raw material expenses, consumables expenses, auxiliary materials expenses, energy and water expenses, expenses resulting from machine operation, expenses on maintenance of machines, expenses on technological loses, technological test, expenses of staff salaries directly involved, expenses of administrative staff salaries, expenses packaging the finished product, expenses on waste (unrecoverable) achieved and their management, finished product storage expenses, finished product disposal expenses, advertising expenses, transportation expenses. 3. Research methodology
The methods of analysis used are mathematical methods borrowed from econometrics and statistics. More specifically, to calculate optimal production cost, we chose parametric methods of analysis based on the following considerations: the problem of optimizing production costs could be interpreted in terms of mathematical; economic observations may be attached to a number of variables or parameters called Scale. 4. Using parametric methods for optimizing production costs 4.1 Stages of solving optimization problems
182

Annals of the „Constantin Brâncuşi” University of Târgu Jiu, Economy Series, Issue 3/2016
„ACADEMICA BRÂNCUŞI” PUBLISHER, ISSN 2344 – 3685/ISSN-L 1844 - 7007
Stages of solving optimization problems are: a) Establishing the information for analysis. These can be significant influence on the cost of production or
minor influence. From the multitude of information at disposal, they were taken into account when designing a parametric model, only those with significant influence. In general, the elected in composition of information parametric model are many, the model that is considered to be more loyal and more complex on one hand but on the other hand, as the complexity increases, it becomes more cumbersome and difficult to implement. Of the 15 items (expenses) at disposal, we have capitalized on six of them as meaningful information.
b) Choosing the adequate parametric method (mathematical) - There were completed the following steps: - Framing information in the dependent variables and independent variables. All 6 information (expenses) are
considered to be dependent. They are variables that influence the cost of production. The independent variables of this parametric model are the two finished products: variable called "table style, royal-range solid wood" short "MLM" and the second variable named "style meal, regal- range of solid wood boards" at a glance "MPM".
- Selecting measuring scale for dependent variables. Measuring scale is 1/1000 lei. - Application of parametric model and establish the results. The results are reflected in the determination of
appropriate materiality breakpoints, reporting production costs of the new article (final product) to the ones of article (finished product) already existing.
Going through the three steps led to the choice of a parametric model - "Test T Student".
4.2. Application of parametric method "Test T Student"
No. Dependent variables (type of expenses) The independent
variable (MLM)
The independent
variable (MPM)
MLM-
ma(MLM)
MPM-
ma(MPM)
1 Expenses of raw materials, consumables,
auxiliary materials
3.16 3.50 1.69 2.18
2 Energy expenses, operation and maintenance of
equipment expenses
1.88 2.21 0.41 0.89
3 Expenses for technological losses, samples, tests,
non-recoverable waste, waste management
0.22 0.07 -1.25 -1.25
4 Expenses for staff salaries and salaries of
administrative staff directly involved
2.16 1.03 0.69 -0.29
5 Expenses for product packaging and storage 0.60 0.44 -0.87 -0.88
6 Expenses for marketing and transportation 0.78 0.68 -0.69 -0.64
Total 8.80 7.93 Σ(MLM-
maMLM)2=
6.31
Σ(MPM-
maMPM)2=
8.36
ma = average production costs
n = total production costs (dependent variables) s = the standard deviation of the production cost MLM and MPM
sMLM=√[Σ(MLM-maMLM)2/(nMLM-1)] = 1.12 sMPM=√[Σ(MPM-maMPM)2/(nMPM-1)] = 1.29
t = ma(MLM)-ma(MPM)/√[(s2MLM+s2
MPM)/n] = 0.21
ma(MLM) = (3.16 + 1.18 + 0.22 + 2.16 + 0.60 + 0.78)/2 = 8.8/2 = 1.47 [MLM - ma(MLM)]n1 = 3.16 – 1.47 = 1.69 [MLM – ma(MLM)n2 = 1.18 – 1.47 = 0.41 [MLM – ma(MLM)n3 = 0.22 – 1.47 = -1.25 [MLM – ma(MLM)n4 = 2.16 – 1.47 = 0.69 [MLM – ma(MLM)n5 = 0.60 – 1.47 = -0.87 [MLM – ma(MLM)n6 = 0.78 – 1.47 = -0.69
[MLM – ma(MLM)]2n1= (1.69)2 = 2.86
[MLM – ma(MLM)]2n2= (0.41)2 = 0.17
183

Annals of the „Constantin Brâncuşi” University of Târgu Jiu, Economy Series, Issue 3/2016
„ACADEMICA BRÂNCUŞI” PUBLISHER, ISSN 2344 – 3685/ISSN-L 1844 - 7007
[MLM – ma(MLM)]2n3= (-1.25)2 = 1.56
[MLM – ma(MLM)]2n4= (0.69)2 = 0.48
[MLM – ma(MLM)]2n5= (-0.87)2 = 0.76
[MLM – ma(MLM)]2n6= (-0.69)2 = 0.48
Σ(MLM – ma(MLM)2 = 2.86 +0.17 = 1.56 + 0.48 + 0.76 + 0.48 = 6.31 sMLM = √[Σ(MLM-maMLM)2/(nMLM-1)] = √(6.31/5) = √1.262 = 1.12
ma(MPM) = (3.50 + 2.21 + 0.07 + 1.03 + 0.44 + 0.68)/2 = 7.93/2 = 1.32
[MPM - ma(MPM)]n1 = 3.5 – 1.32 = 2.18 [MPM - ma(MPM)]n2 = 2.21 – 1.32 = 0.89 [MPM - ma(MPM)]n3 = 0.07 – 1.32 = -1.25 [MPM - ma(MPM)]n4 = 1.03 – 1.32 = -0.29 [MPM - ma(MPM)]n5 = 0.44 – 1.32 = -0.88 [MPM - ma(MPM)]n6 = 0.68 – 1.32 = -0.64
[MPM – ma(MPM)]2n1= (2.18)2 = 4.75
[MPM – ma(MPM)]2n2= (0.89)2 = 0.79
[MPM – ma(MPM)]2n3= (-1.25)2 = 1.56
[MPM – ma(MPM)]2n4= (-0.29)2 = 0.08
[MPM – ma(MPM)]2n5= (-0.88)2 = 0.77
[MPM – ma(MPM)]2n6= (-0.64)2 = 0.41
Σ(MPM – ma(MPM)2 = 4.75 + 0.79 + 1.56 + 0.08 + 0.77 + 0.41 = 8.36 sMPM = √[Σ(MPM-maMPM)2/(nMPM-1)] = √(8.36/5) = √1.672 = 1.29
t = ma(MLM)-ma(MPM)/√[(s2MLM+s2
MPM)/n] = (1.47 – 1.32)/ √[(1.262+1.672)/5] = 0.15/0.7 = 0.21
-‐3,18 -‐2,45 -‐1,96 0 1,96 2,45 3,18
n=3
n=6
n>31
Critical Values of “t”
t = {-2,45, 2,45} – region of acceptance of the hypothesis 5. Conclusions and contributions
The result fits in the region of acceptance of the hypothesis implementing manufacturing of the finished product "table style, royal-range solid wood". The value determined by "t" is out of his critical parts "t" and within the region of acceptance of the hypothesis.
Own contribution consists in transposing the cost within the business accounting forms of mathematical precision to determine the most optimal cost of production. By applying these calculations was reached a minimum threshold error <0.05, and also a very high degree of probability> 95%. 6. Bibliography [1] M.Popa, Decizie cu privire la ipoteza de nul. Testele T (SPSS), 2014; [2] Gheorghe Coman, Statistică şi Econometrie (Aplicaţii), Editura PIM, Iaşi, 2008; [3] Michel Gervais, La Comptabilité de Gestion par les Méthodes d’Équivalence, Ed. Economica, Paris, 2010; [4] Eduard Antonie, Cristian Velicu, Evaluarea investiţiilor, Editura Experţilor Tehnici, Iaşi, 2006; [5]www.andrei.clubcisco.ro/cursuri, Ioan Dan Filipoiu, Constantin Rânea, Managementul proiectelor în dezvoltarea de produs; [6] www.casacodex.ro/lemn_masiv.php, Despre panoul din lemn masiv; [7] www.formulas.tutorvista.com/math/t-test-formula.html, T Test Formula
184

Annals of the „Constantin Brâncuşi” University of Târgu Jiu, Economy Series, Issue 3/2016
„ACADEMICA BRÂNCUŞI” PUBLISHER, ISSN 2344 – 3685/ISSN-L 1844 - 7007
TOURISM IN THE GORJ COUNTY-THE LAST 10 YEARS OF DEVELOPMENT
GABRIEL SANDA
ASSOCIATE PROFESSOR, FACULTY OF ECONOMICS AND BUSINESS ADMINISTRATION,"CONSTANTIN BRÂNCUŞI" UNIVERSITY
e-mail:[email protected] Abstract The main objective is to become an important tourist destination not only for Romanian tourists, but also for foreigners. The only way to do that is to create long term strategies which determine competitive advantages for the destination. The aim of the article is to make an overview of the tourism development in the county.Throughout the last century the evolution of tourism in the economies of all countries has represented a serious point of reference in the development of tourism strategies. The Gorj county is a representative county in the Romanian tourism due to its remarkable geographical position, to the unique elements of natural attraction that attract each year thousands of tourists. Here we find mountains, caves, areas of mountain climbing, but the most important attraction are the works of Constantin Brâncuşi, the Endless Column, the Gate of the Kiss and the Table of Silence. Having such a valuable offer can only be an advantage for marketers in creating a tourism product that can lead to the development of tourism in the Gorj county. Keywords: tourism, development, destination, tourism strategies. Classification JEL: Z00,Z3 1. INTRODUCTION
After years of researches in the tourism field it has been unanimously agreed that the development of a
destination cannot be realized without establishing the proper strategies for creating a sustainable tourism. The Gorj county is located in the South - West part of Romania, in the Oltenia Region. The county has the incredible chance to benefit from an amazing relief, proper weather for tourism activities, tourists who visit the county can practice different types of tourism here.
As we mentioned earlier, the key to the development of the tourism in the Gorj county is to create a sustainable tourism that will attract each year tourists in the area. According to the World Tourism Organization the " tourism that takes full account of its current and future economic, social and environmental impacts, addressing the needs of visitors, the industry, the environment and host communities" is the sustainable tourism.[3] Also," any tourism development policy should take into account the varying needs and perceptions of potential tourists but, in particular, should arguably give primacy to the perceptions, knowledge and developmental needs of local communities”[2](Sharpley,2009). As it can be noticed in order to develop sustainable strategies it is necessary not only to know what tourists want but also to find out the needs of local communities. The aim of the article is to try to make a summary of the accommodation structures existent in the Gorj county by starting to discuss about the tourist that come to Romania. The following two tables present comparisons between the years 2013,2014 and 2015 in what regards Romanian and foreign tourists. Table 1.Tourists arrivals and overnights in 2013 and 2014
185
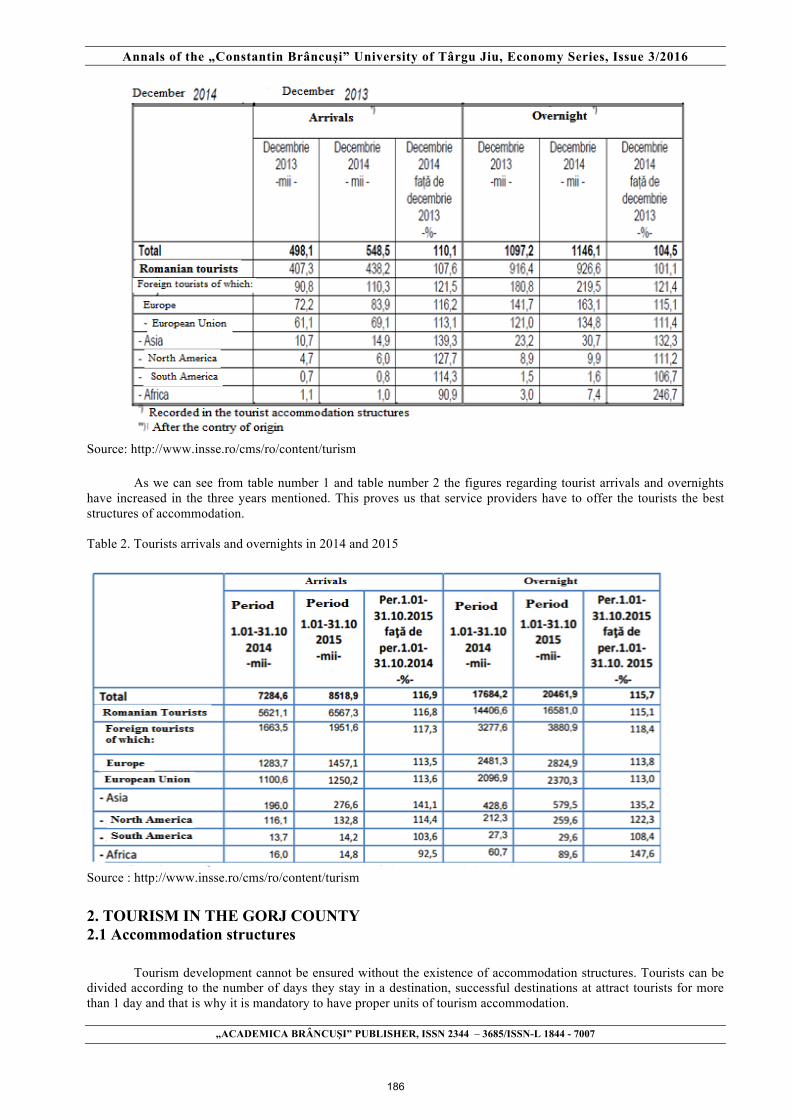
Annals of the „Constantin Brâncuşi” University of Târgu Jiu, Economy Series, Issue 3/2016
„ACADEMICA BRÂNCUŞI” PUBLISHER, ISSN 2344 – 3685/ISSN-L 1844 - 7007
Source: http://www.insse.ro/cms/ro/content/turism As we can see from table number 1 and table number 2 the figures regarding tourist arrivals and overnights have increased in the three years mentioned. This proves us that service providers have to offer the tourists the best structures of accommodation. Table 2. Tourists arrivals and overnights in 2014 and 2015
Source : http://www.insse.ro/cms/ro/content/turism 2. TOURISM IN THE GORJ COUNTY 2.1 Accommodation structures Tourism development cannot be ensured without the existence of accommodation structures. Tourists can be divided according to the number of days they stay in a destination, successful destinations at attract tourists for more than 1 day and that is why it is mandatory to have proper units of tourism accommodation.
186

Annals of the „Constantin Brâncuşi” University of Târgu Jiu, Economy Series, Issue 3/2016
„ACADEMICA BRÂNCUŞI” PUBLISHER, ISSN 2344 – 3685/ISSN-L 1844 - 7007
Table 3.Tourism accommodation structures with accommodation functions at 31 of July
Gorj County 2005 2006 2007 2008 2009 2010 2011 2012 2013
Total 36 41 40 40 61 61 69 79 79
Hotels and motels
10 14 3 12 16 15 21 22 22
Tourist INN - - - - - - - - -
Chalets 2 1 1 1 5 6 7 7 7
Camping and units of cottage type
- - - - - - - - -
Tourist Vilas 1 1 - 1 1 1 1 2 2
Pension 3 3 3 3 4 14 18 18 18
Vacation village
- - - - - - - - -
Agrotouristic pensions
18 20 21 21 33 19 17 25 25
Youth hotels - - - - - - - - -
Hostel 1 1 1 1 1 5 4 4 4
Tourism Halt
1 1 1 1 1 1 1 1 1
Source: http://www.gorj.insse.ro/main.php?id=446 According to the Romanian laws the tourist accommodation capacity it is divided as we can see in table number 1. The figures in table represent the period 2005-2013 and the data used are from the National Institute of Statistic. As we can see from the table starting with the year 2005 there has been an upward trend in the accommodation structures. The table highlights the fact that the unit of accommodation which is best represented in cities is the "hotel and motels" which shows the fact that investors prefer to put their money in units of accommodation that offer quality services to tourists. The agrotouristic pensions show also an upward trend due to the preference of tourists for clean air and healthy activities. 2.2. Tourism accommodation capacity In what regards the tourism accommodation capacity and activity we must state that there has been a continuous evolution since the year 1990. From the figures offered by the National Institute of Statistics we can notice that in the year 1990 the net use of the capacity had been of 54%, from the existent places of accommodation, meaning 4426 places but only 662,6 were in function. The situation in the year 2013 is different, the places existent were 2521, the ones in function 766,9 and the net use of the capacity in function of 22,3 as we can see from table number 2.
187

Annals of the „Constantin Brâncuşi” University of Târgu Jiu, Economy Series, Issue 3/2016
„ACADEMICA BRÂNCUŞI” PUBLISHER, ISSN 2344 – 3685/ISSN-L 1844 - 7007
Table 4. Tourist accommodation capacity in the Gorj County
SOURCE: HTTP://WWW.GORJ.INSSE.RO/MAIN.PHP?ID=446
The fact that in 2013 the capacity in function was only of 766 places shows a small increase in percentage highlights the fact that there have not been made any serious investments in this area. CONCLUSIONS Taking all of these into consideration we can conclude that although the Gorj county benefits from several types of resources that could make it one of the most beautiful destinations from Romania there have not been made any serious investments in the tourism area that could increase the number of tourists. The key to success would be to develop a relationship between the local authorities and the investors. As it has been seen at the beginning of the article, the number of tourists visiting Romania increases each year. Here we include not only foreign tourists but also Romanian tourists. The need to travel is becoming more and more important. The service providers must understand that satisfied tourists need quality accommodation structures. The Gorj county is famous for its beautiful landscape and cultural monuments but it also has to become famous for the quality of the services provided by the tourist providers. BIBLIOGRAPHY [1] Sharpley, Richard, Tourism development and the Environment: Beyond Sustainability, Earthscan , London, 2009; [2] *** www.gorj.insse.ro/main.php?id=446-Institutul National de Statistica; [3] *** http://sdt.unwto.org/content/about-us-5-World Tourism Organization.
188

Annals of the „Constantin Brâncuşi” University of Târgu Jiu, Economy Series, Issue 3/2016
„ACADEMICA BRÂNCUŞI” PUBLISHER, ISSN 2344 – 3685/ISSN-L 1844 - 7007
THE IMPACT OF ICT SECTOR ON THE SOCIAL PILLAR OF SUSTAINABLE
DEVELOPMENT
TEODORESCU ANA-MARIA ASSISTENT PHD., FACULTY OF ECONOMIC SCIENCES, PETROLEUM-GAS UNIVERSITY,
PLOIESTI, ROMANIA e-mail:[email protected]
Abstract The human being is the main axis in setting sustainable development goals. Sustainable development, through
its components - economic and environmental, has only one beneficiary - the human factor who benefits of income, education, good quality environmental factors, and enjoy inter and intra-generational equity.
Information technology and communications contributes to fulffiling the goals of sustainable development through access to information society services (e-health, e-government, e-learning), access to education.
This article presents the sustainable development objectives and the impact of ICT sector on the social pillar of sustainable development. I used a theoretical research and qualitative analysis of the data. I presented values indicators at the european level, the lowest and highest value, and recorded values for Romania.
Keywords: ICT, sustainable development, information society Classification JEL: I00, Q01, D60, D83, O1 1. Introduction
The social pillar is the principle axis of sustainable development. The main objective of sustainable
development is sustainable economic development achievement, to improve the living conditions of human communities and to contribute to social and ecological balance. Healthy and educated human resource contributes to economic development of a country.
The dynamism and complexity of the new type of society, which leads to a continuous increase in the volume and diversity of information processed and widely used information and communication technologies (ICT) have led to the concept of Information Society [9].
ICT contributes to achieving sustainable development. The impact of information society on social pillar is felt through access to its services: e-health, e-government, e-learning.
Being a multidimensional concept, the importance attached to a pillar over another is directed depending on the specific area: for economics prevails profit, for ecology care for natural resources ranks first, improving living conditions is paramount for social.
The challenge of sustainable development is combining all the economic, environmental and social objectives benefic for the present and future generation.
2. Impact of ICT
Information society requires changes in all fields: administration (e-government), business (e-commerce and
e-business), in education (distance education), culture (multimedia centers and virtual libraries) and the way to work (telework and virtual commute) [5].
The transition to the information society is essential in achieving maximum benefit through the use of digital technologies and the Internet in order to achieve sustainable development [4].
Information and communication technology presents the following positive aspects of the social pillar [6]: ü transforming the way we communicate, both socially as well as the business. Thousands of
Internet users have access to information, financial transactions occur. In the era of globalization and information transfer, virtual communication is paramount.
ü transformation the modality of access to information. With access to databases, libraries online, anyone can get the desired information. Information can be referenced and processed, can be incorporated in many ways, can be added value can be analyzed by instruments existing software and can be transformed into knowledge.
189
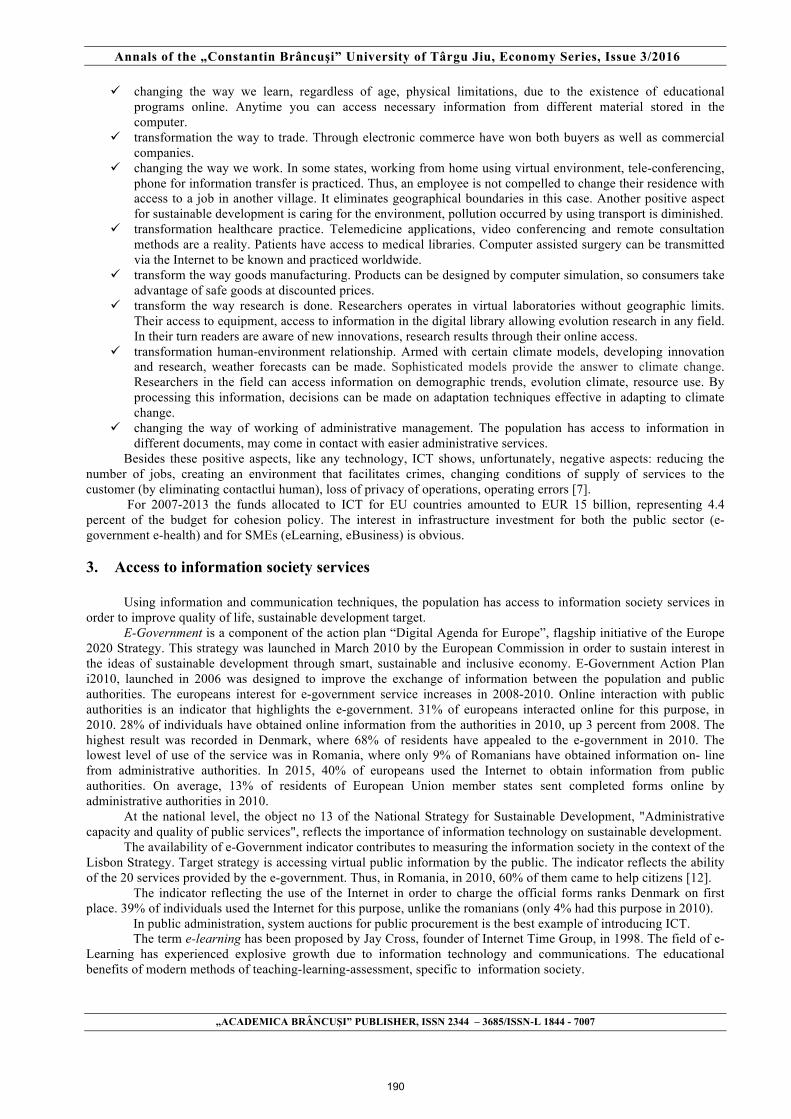
Annals of the „Constantin Brâncuşi” University of Târgu Jiu, Economy Series, Issue 3/2016
„ACADEMICA BRÂNCUŞI” PUBLISHER, ISSN 2344 – 3685/ISSN-L 1844 - 7007
ü changing the way we learn, regardless of age, physical limitations, due to the existence of educational programs online. Anytime you can access necessary information from different material stored in the computer.
ü transformation the way to trade. Through electronic commerce have won both buyers as well as commercial companies.
ü changing the way we work. In some states, working from home using virtual environment, tele-conferencing, phone for information transfer is practiced. Thus, an employee is not compelled to change their residence with access to a job in another village. It eliminates geographical boundaries in this case. Another positive aspect for sustainable development is caring for the environment, pollution occurred by using transport is diminished.
ü transformation healthcare practice. Telemedicine applications, video conferencing and remote consultation methods are a reality. Patients have access to medical libraries. Computer assisted surgery can be transmitted via the Internet to be known and practiced worldwide.
ü transform the way goods manufacturing. Products can be designed by computer simulation, so consumers take advantage of safe goods at discounted prices.
ü transform the way research is done. Researchers operates in virtual laboratories without geographic limits. Their access to equipment, access to information in the digital library allowing evolution research in any field. In their turn readers are aware of new innovations, research results through their online access.
ü transformation human-environment relationship. Armed with certain climate models, developing innovation and research, weather forecasts can be made. Sophisticated models provide the answer to climate change. Researchers in the field can access information on demographic trends, evolution climate, resource use. By processing this information, decisions can be made on adaptation techniques effective in adapting to climate change.
ü changing the way of working of administrative management. The population has access to information in different documents, may come in contact with easier administrative services.
Besides these positive aspects, like any technology, ICT shows, unfortunately, negative aspects: reducing the number of jobs, creating an environment that facilitates crimes, changing conditions of supply of services to the customer (by eliminating contactlui human), loss of privacy of operations, operating errors [7].
For 2007-2013 the funds allocated to ICT for EU countries amounted to EUR 15 billion, representing 4.4 percent of the budget for cohesion policy. The interest in infrastructure investment for both the public sector (e-government e-health) and for SMEs (eLearning, eBusiness) is obvious.
3. Access to information society services
Using information and communication techniques, the population has access to information society services in
order to improve quality of life, sustainable development target. E-Government is a component of the action plan “Digital Agenda for Europe”, flagship initiative of the Europe
2020 Strategy. This strategy was launched in March 2010 by the European Commission in order to sustain interest in the ideas of sustainable development through smart, sustainable and inclusive economy. E-Government Action Plan i2010, launched in 2006 was designed to improve the exchange of information between the population and public authorities. The europeans interest for e-government service increases in 2008-2010. Online interaction with public authorities is an indicator that highlights the e-government. 31% of europeans interacted online for this purpose, in 2010. 28% of individuals have obtained online information from the authorities in 2010, up 3 percent from 2008. The highest result was recorded in Denmark, where 68% of residents have appealed to the e-government in 2010. The lowest level of use of the service was in Romania, where only 9% of Romanians have obtained information on- line from administrative authorities. In 2015, 40% of europeans used the Internet to obtain information from public authorities. On average, 13% of residents of European Union member states sent completed forms online by administrative authorities in 2010.
At the national level, the object no 13 of the National Strategy for Sustainable Development, "Administrative capacity and quality of public services", reflects the importance of information technology on sustainable development.
The availability of e-Government indicator contributes to measuring the information society in the context of the Lisbon Strategy. Target strategy is accessing virtual public information by the public. The indicator reflects the ability of the 20 services provided by the e-government. Thus, in Romania, in 2010, 60% of them came to help citizens [12].
The indicator reflecting the use of the Internet in order to charge the official forms ranks Denmark on first place. 39% of individuals used the Internet for this purpose, unlike the romanians (only 4% had this purpose in 2010).
In public administration, system auctions for public procurement is the best example of introducing ICT. The term e-learning has been proposed by Jay Cross, founder of Internet Time Group, in 1998. The field of e-
Learning has experienced explosive growth due to information technology and communications. The educational benefits of modern methods of teaching-learning-assessment, specific to information society.
190
Annals of the „Constantin Brâncuşi” University of Târgu Jiu, Economy Series, Issue 3/2016
„ACADEMICA BRÂNCUŞI” PUBLISHER, ISSN 2344 – 3685/ISSN-L 1844 - 7007
"Computer Training (IAC) is a teaching method that capitalize the principles of modeling and analysis of cyber training activity in the context of the use of information technologies and communications, characteristic of contemporary society [1].
E-learning is the interaction between the teaching / learning and information technologies, covering a wide spectrum of activities, from eLearning up to the education provided entirely online [2].
E-learning process includes the hardware and software for transmitting knowledge, training materials in electronic format, the system administrator, instructor and trained people. To participate in this modern method of training, trained people must have basic knowledge of computer operation. Other requirements are technical endowment with equipment of educational institutions, existing companies specializing in organizing training courses.
The "digital literacy level" reveals that, in 2015, 23% of europeans have low digital skills, 27% of europeans have medium digital skills, 28% of europeans have advanced digital skills. In 2015, Luxembourg, state with one of the most developed educational systems, had the highest percentage of residents who owned an advanced level PC, 56%. The lowest result of this indicator was registered in Romania, 9% of people owned advanced digital competence.
Digital literacy gap existing between European Union member states was a topic debated by the European Commission in March 2015 in Riga at the conference "eSkills for jobs from 2015 to 2016". It is imperative to find solutions to improve digital literacy in order to achieve the goal of owning a knowledge economy by 2020. In 2014, 81% of households in the EU had access to the Internet, the highest result was recorded in Luxembourg (96%).
Another positive impact of ICT in education is the development of online systems on the situation at school where parents can access. Also, video systems installed in schools and kindergartens allow parents watching activities performed. The educational system has different internal applications in schools and universities that are a real support for communication between students and teachers [8].
The first plan at european level on e-health service was intended for prescriptions and medical cards for 2004-2011. The second plan of action in this area (2012-2020) aims to support research, innovation, development, promotion of international cooperation.
According to the report eEurope +, in December 2003, 16% of the general practitioners had Internet access in the medical office, and 5% used the Internet to swap the medical records of patients. Also, share of physicians who use electronic records of patients was 49.2% in Romania, compared to 59% in the new Member States.
According to e-health study, 92% of hospitals in Europe have access to broadband Internet, and 80% have implemented electronic patient record, in 2011. The weakness in this area is the small percentage (4%) of hospitals that provide patient access to electronic files.
Regarding health programs, it is important to identify the percentage of the population aged 16 and over using the Internet to search for information related to health. The result was 2% in Romania, compared to 4% in the countries of Central and Eastern (December 2003).
In 2015, 46% of EU inhabitants used the Internet for providing medical information, up 2 percent from 2013. Denmark is in first place with 66% of people accessing the Internet for health purposes. Romania is ranked last in the ranking, with 27% of romanians who sought health information online.
Worldwide, e-health applications showed a solid increase. In 2011 these applications market was around $ 11 billion, and the forecast for 2016 is 27 billion dollars.
An important component for market dynamisation is the mobile applications associated to health monitoring. New businesses can be developed around the use of wireless technology associated with medical devices leading to social and economic benefits (http://politicidesanatate.ro/impactul-economic-al-ehealth-pentru-romania). In the medical system impact of ICT is projected on the possibility of patients to schedule online to get references about different medical settings.
4. Conclusions
The objectives of sustainable development are geared towards the welfare of the human being. The human
being must enjoy a good state of health, education, good conditions of the environment, income. ICT contributes to achieving sustainable development. The impact of information society on social pillar is
felt through access to its services: e-health, e-government, e-learning. The article presents a picture of the impact of ICT on the social pillar in theory. I presented the indicators that reveal the impact of ICT on information society. In 2015, 40% of europeans used the Internet to obtain information from public authorities. The biggest indicator result of online interaction with public authorities was recorded in Denmark, where 68% of residents have appealed to the e-government in 2010. The lowest level of use this service was in Romania, where only 9% of people have obtained information online from administrative authorities. Denmark was ranked on first place regarding downloading official forms. The romanians have used the Internet for this purpose in 4%. To participate in the modern method of training, e-learning, “trained people” must have basic knowledge of computer operation. The "digital literacy level" reveals that, in 2015, 23% of europeans have low digital skills, 27% of europeans have medium digital skills, 28% of europeans have advanced digital skills. Luxembourg, state with one of
191
Annals of the „Constantin Brâncuşi” University of Târgu Jiu, Economy Series, Issue 3/2016
„ACADEMICA BRÂNCUŞI” PUBLISHER, ISSN 2344 – 3685/ISSN-L 1844 - 7007
the most developed educational system, had the highest percentage of residents who owned an advanced level PC, 56% for 2015. The lowest result of this indicator was registered in Romania, 9% of inhabitans owned advanced digital competence. By 2015, 46% of europeans used the Internet for the provision of medical information. Denmark was ranked on first place with 66% of people accessing the Internet for health purposes. Again, Romania is ranked last in the ranking, with 27% of romanians who searched health information online.
Looking at these results, it is imperative for Europeaan Union Member States ranked last places to have strategies to remove the existing disparities.
5. Bibliografy [1] Adăscăliţei, A., Instruire asistată de calculator: didactică informatică, Editura Polirom, Iasi, 2007, p.49 [2] Brut, M., Instrumente pentru e-learning: ghidul informatic al profesorului modern, Editura Polirom, Iasi, 2006, p.57 [3] Drăgănescu M., De la societatea informaţională la societatea cunoaşterii, Editura Tehnica, 2003, p.51 [4] Ghidiu Bîta I. M., Dănescu T., Societatea informaţională – premisă a dezvoltării durabile într-o economie competitivă, Studia universitatis Petru Maior, series oeconomica, fasciculus 1, anul iv, 2010, p.24 [5] Ghilic-Micu B., Guvernarea electronica. Revista Informatică Economică, nr. 1 (21)/2002, p.18 [6] Iancu S., Societatea informaţională- Un nou mod de a munci şi de a trăi”, Tribuna Economică 8-52 / 1997, p.59 [7] Iancu S., Unele probleme sociale, economice, juridice ş i etice ale utilizării Tehnologiei informaţiei ş i comunicaţiilor, Bucureşti, 2001, p.70 [8] Stoica M., Premise ale trecerii la societatea informationala, Revista Informatica Economica, nr 4/(16), 2000, pp. p.42-46 [9] OECD, Sustainable Development: Critical Issues, OECD, 2001 [10]***http://ec.europa.eu/eurostat/web/information-society/data/database [11]***http://ehealthromania.com/ [12]***http://www.insse.ro/cms/files/Web_IDD_BD_ro/index.htm [13]***http://ec.europa.eu/eurostat/
192

Annals of the „Constantin Brâncuşi” University of Târgu Jiu, Economy Series, Issue 3/2016
„ACADEMICA BRÂNCUŞI” PUBLISHER, ISSN 2344 – 3685/ISSN-L 1844 - 7007
ANALYSIS OF THE DURATION OF UNEMPLOYMENT IN ROMANIA
ROMANESCU GEORGE OCTAVIAN
ECONOMIST DR.-INSPECTOR ȘEF/ INSPECTORATUL TERITORIAL DE MUNCĂ GORJ [email protected] Abstract In the context of industrialization and expansion of wage labor is the difference between work and employment. The rigidity of the labor supply and its persistent surplus is explained by the very high compensation or unemployment benefits, through trade union action or error preset number of employees, which leads to greater gap between supply and demand for labor. Adjustment policies of employment in the future will be increasingly less state policy, of general application, and increasingly more political will and enterprise branch, the subject of an active social dialogue between employers and trade unions, dialogue resulted in agreements of limited duration and subject to revision depending on the economic and social situation. The duration of work and organizational modalities they will depend on this social dialogue. Keywords: forța de muncă, ocupare, șomaj, Clasification JEL : O10, O15, O 40 1.Introduction The concept of employment work can be seen in two aspects: the general aspect and narrow aspect. In broad aspect, this includes actions of central government and local entities that have direct impact on the process of creating new quality jobs. This includes both the macroeconomic policy of the state in employment work, as well as sectoral policies of education, organization of social protection, the development of production infrastructure and social, stimulating young people into work. The narrow issue, researched the concept reflects the specific actions that occur in the labor market caused by permanent changes in the relationship between supply and demand of labor. These changes have intensified in the twentieth century to the extent that. 2. The evolution of unemployment in Romania and its causes In our country, unemployment is determined by three main channels [3, p. 144]: • the first channel is the demographic - refers to young people reached working age without holding any previous training and people seeking work for the first once, for example housewives; • the second is the channel of the education system - according to identify graduates of educational institutions of all levels who hold professional qualifications; • channel is the last issue of labor employed in the economy due to the pursuit of the transformation process in the stage of transition to market economy. All three channels are based on several sources that contribute to the increase in unemployment due to: ■ make available a part of the workforce employed by the disappearance of jobs in the labor market phenomenon that relies mainly on Romanian industry restructuring; ■ lack of correlation between the structure of training-oriented employment with the school system determines not to always ensure proper training of new graduates training to enable them to adapt faster to the new requirements of the labor market. Lack of that relationship at present, leading to worsening labor market imbalances now because while the tertiary sector is found, the need for specialists in the field of vocational education exceeds supply continuously; ■ slow growth in the number of jobs offered increases the number of unemployed people, especially the vulnerable population (young people, women); ■ strengthening near-monopoly position of economic agents, and the resulting hardening of the labor market; ■ deepening trends of specialization and segmentation, forming groups and non-competing socio-professional categories, by the increasing specialization and differentiation emerged between employees in terms of experience, skills, adaptability. Unemployment may be multiple causes, causes that lie at the macroeconomic and microeconomic level. Often, in an analysis to identify the causes that led to unemployment, are taken into account various attributes granted unemployment treated as 'types' of unemployment: frictional, voluntary, involuntary, structural, technological, natural, partly, totally , chronic, seasonal, temporary, transient, cyclical, regional, disguised etc, attributes that actually covers quite extensive explanatory range of phenomena in the use of full employment in the economy. Voluntary
193
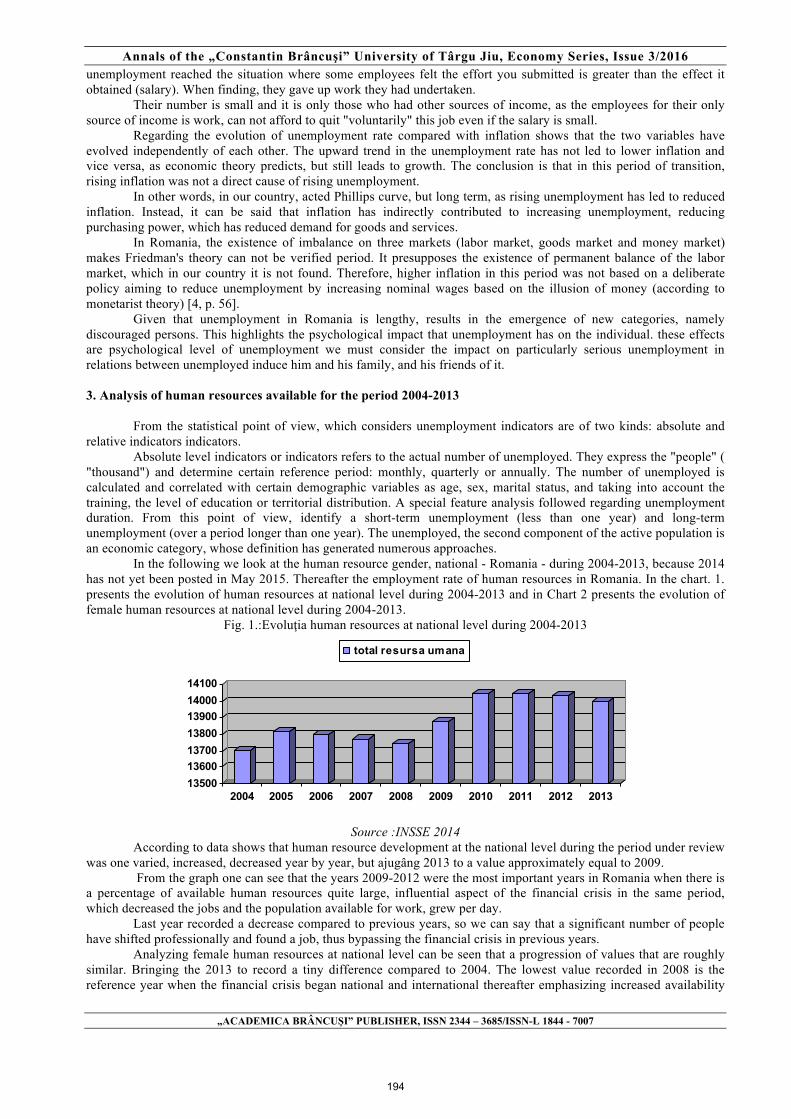
Annals of the „Constantin Brâncuşi” University of Târgu Jiu, Economy Series, Issue 3/2016
„ACADEMICA BRÂNCUŞI” PUBLISHER, ISSN 2344 – 3685/ISSN-L 1844 - 7007
unemployment reached the situation where some employees felt the effort you submitted is greater than the effect it obtained (salary). When finding, they gave up work they had undertaken. Their number is small and it is only those who had other sources of income, as the employees for their only source of income is work, can not afford to quit "voluntarily" this job even if the salary is small. Regarding the evolution of unemployment rate compared with inflation shows that the two variables have evolved independently of each other. The upward trend in the unemployment rate has not led to lower inflation and vice versa, as economic theory predicts, but still leads to growth. The conclusion is that in this period of transition, rising inflation was not a direct cause of rising unemployment. In other words, in our country, acted Phillips curve, but long term, as rising unemployment has led to reduced inflation. Instead, it can be said that inflation has indirectly contributed to increasing unemployment, reducing purchasing power, which has reduced demand for goods and services. In Romania, the existence of imbalance on three markets (labor market, goods market and money market) makes Friedman's theory can not be verified period. It presupposes the existence of permanent balance of the labor market, which in our country it is not found. Therefore, higher inflation in this period was not based on a deliberate policy aiming to reduce unemployment by increasing nominal wages based on the illusion of money (according to monetarist theory) [4, p. 56]. Given that unemployment in Romania is lengthy, results in the emergence of new categories, namely discouraged persons. This highlights the psychological impact that unemployment has on the individual. these effects are psychological level of unemployment we must consider the impact on particularly serious unemployment in relations between unemployed induce him and his family, and his friends of it. 3. Analysis of human resources available for the period 2004-2013 From the statistical point of view, which considers unemployment indicators are of two kinds: absolute and relative indicators indicators. Absolute level indicators or indicators refers to the actual number of unemployed. They express the "people" ( "thousand") and determine certain reference period: monthly, quarterly or annually. The number of unemployed is calculated and correlated with certain demographic variables as age, sex, marital status, and taking into account the training, the level of education or territorial distribution. A special feature analysis followed regarding unemployment duration. From this point of view, identify a short-term unemployment (less than one year) and long-term unemployment (over a period longer than one year). The unemployed, the second component of the active population is an economic category, whose definition has generated numerous approaches. In the following we look at the human resource gender, national - Romania - during 2004-2013, because 2014 has not yet been posted in May 2015. Thereafter the employment rate of human resources in Romania. In the chart. 1. presents the evolution of human resources at national level during 2004-2013 and in Chart 2 presents the evolution of female human resources at national level during 2004-2013.
Fig. 1.:Evoluţia human resources at national level during 2004-2013
13500136001370013800139001400014100
2004 2005 2006 2007 2008 2009 2010 2011 2012 2013
total resursa umana
Source :INSSE 2014
According to data shows that human resource development at the national level during the period under review was one varied, increased, decreased year by year, but ajugâng 2013 to a value approximately equal to 2009. From the graph one can see that the years 2009-2012 were the most important years in Romania when there is a percentage of available human resources quite large, influential aspect of the financial crisis in the same period, which decreased the jobs and the population available for work, grew per day. Last year recorded a decrease compared to previous years, so we can say that a significant number of people have shifted professionally and found a job, thus bypassing the financial crisis in previous years. Analyzing female human resources at national level can be seen that a progression of values that are roughly similar. Bringing the 2013 to record a tiny difference compared to 2004. The lowest value recorded in 2008 is the reference year when the financial crisis began national and international thereafter emphasizing increased availability
194

Annals of the „Constantin Brâncuşi” University of Târgu Jiu, Economy Series, Issue 3/2016
„ACADEMICA BRÂNCUŞI” PUBLISHER, ISSN 2344 – 3685/ISSN-L 1844 - 7007
of human resources for sex women, during the crisis, 2009-2012. These values have gradually decreased, and figures show that will continue to decline in coming years.
Fig. 2 .: The Evolution-female human resources at national level during 2004-
2013
6550660066506700675068006850
2004 2005 2006 2007 2008 2009 2010 2011 2012 2013
total feminin
[11]
Chart 3 presents the employment rate of human resources at national level in Graph 4 the employment rate of females.
Fig. 4 .: Evolution national employment rate during 2004-2013
5758596061626364
2004 2005 2006 2007 2008 2009 2010 2011 2012 2013
total rata ocupare
[11]
Given the data provided, it can be observed that the employment rate of human resources at the national level had fluctuated, first it rose considerably later during the financial crisis it dropped noticeably, which reinforces the idea that human resource was not spared from the influence of negative factors specific crisis.
Fig. 4 The evolution of the employment rate of female human resources at national level during 2004-2013
56575859606162
2004 2005 2006 2007 2008 2009 2010 2011 2012 2013
rata de ocupare feminina
[11]
Thus the employment rate of human resources at national level recorded in 2013 a similar amount in 2005, yet up from the financial crisis, namely 2010-2011 when the crisis was felt in many countries internationally. The greatest value of the employment rate was recorded in 2008, the year that marked the crisis in Romania. Noting the information shown there is a trend of female human resources similar as that of the total human resources. The percentages shown are based on total human resources, the lowest value was recorded in 2004 and the highest value in 2007, one can see equal value in 2013 and 2015.
4 OUTLOOK FOR EMPLOYMENT EMPLOYMENT YOUNG
195

Annals of the „Constantin Brâncuşi” University of Târgu Jiu, Economy Series, Issue 3/2016
„ACADEMICA BRÂNCUŞI” PUBLISHER, ISSN 2344 – 3685/ISSN-L 1844 - 7007
Rural youth face a number of problems that negatively impact the process of stimulating labor activity and employment. Among such problems can be mentioned: insufficient development of small business and the lack of attractive jobs for rural youth; insufficient technical equipment of the branches of production and processing of agricultural products; low level of infrastructure development and the social production; emigration of young people from rural areas, which has a negative impact on economic development and demographic processes; relatively high unemployment rate among rural youth; insufficient institutional policies in attracting and stimulating rural youth employed. Between the rate of growth and employment dynamics there is a direct relationship dependnţă, but disproportionate. In this connection, a few decades ago, former German Chancellor Helmuth Schmidt pointed out: "Economic growth today are tomorrow's investments and jobs after tomorrow". In other words, it is not possible employment without economic growth and investment [2, p. 5]. It should be noted that the only guidance system profitable growth -Investment - Employment is providing jobs simultaneously satisfying the economic requirements, social-educational, technical and organizational, which, through the effects they generate, maintain motivation for work and performance, continuous development and eliminate the negative effects of old systems of organization, analysis and design jobs. Only in this way employment under current conditions, sustainable employment makes sense. This should not be confused with job stability, which is seen as an occupation of a job throughout working life[8]. Employment sustainable development is a dynamic process of continuous learning, adapting to new requirements of the labor market, the approximation of market education and training of the work, performance increasing, motivation and satisfaction, fair remuneration, prevention and correction imperfections of labor market functioning. CONCLUSION
In order to increase the employment of people in rural areas or in urban areas suffering from social
reintegration as a result of economic restructuring, the National Agency for Employment included in the program of employment opportunities for 2015 the following special little program:
- 50 program, especially for the 50 towns; - 160 program, especially for 150 rural settlements. The criteria were the basis for establishing settlements were: - high share of unemployed in the total active population; - The low level of economic development. To combat and reduce long-term unemployment requires concrete actions, such as: - keeping employment as many people as possible, including adapting working time continued with training,
action supported by public funds, including the ESF; - Encouraging entrepreneurship and creating new jobs by lowering non-wage costs and stimulate flexicurity; - Improving the efficiency of national employment services and activities may intensive counseling, training,
job search, especially in the early weeks of unemployment; - Increase in the number of apprenticeships and training. Measures of labor mediation, information and counseling, as basic measures of the public employment
service, have a significant share in total employment measures leading to
BIBLIOGRAFIE 1. Albu L.L., Determinanți ai creşterii economice, ocupării şi competitivotății. Metode şi tehnici de măsurare.
Analize comparative, Editura Academiei Române, Bucureşti 2008 2. Alecxandrina Deaconu, Viorel lefter, Aurel Manolescu, Cristian Marinas, Ramona Puia, Irinel Marin,
Dezvoltarea resurselor umane, Editura ASE, București, 2012 3. Băbeanu Marin, Microeconomie, Editura Universitaria, Craiova, 2004. 4. Cace, S., Preoteasa A.M, Tomescu C. (coord.), legal şi egal pe piaţa muncii pentru comunităţile de romi:
Diagnoza factorilor care influenţează nivelul de ocupare la populaţia de romi din România”, Fundaţia Soros România, 2010.
5. Comşa, Mircea, Moșteanu Olimpia, Sprijin pentru dezvoltarea economiei sociale în comunităţi multietnice din regiunile de dezvoltare Nord-Vest si Centru din România, Centrul de Resurse pentru Diversitate Etnoculturală, Cluj-Napoca, 2011.
6. Crețu Alina Ștefania, Flexibilitatea pieții muncii, Editura ASE, București, 2010 7. Gârbo Viorica Irina, Studiul ocupațiilor și al posturilor de muncă, Suport de curs, Universitatea Babeș-Bolyai,
Cluj-Napoca, 2011
196

Annals of the „Constantin Brâncuşi” University of Târgu Jiu, Economy Series, Issue 3/2016
„ACADEMICA BRÂNCUŞI” PUBLISHER, ISSN 2344 – 3685/ISSN-L 1844 - 7007
8. Cristina lincaru, dr. Vasilica Ciucă, Priorităţi şi acţiuni cheie pe piaţa muncii în contextul crizei economice –provocări strategice, al III-lea Simpozion Naţional de Economia Muncii, octombrie 2009. .
9. Niță D., Aceanu M.I., Ocuparea resurselor de muncă în România, Editura Economică,Bucureşti, 2007 10. Stănescu, Simona, Sorin CACE, Alexandrescu FIlip (coord)., Oferta de economie socială – răspunsuri şi rezultate,
Expert, Bucureşti, 2011. 11. www. insse.ro 12. www.europa.ro
197

Annals of the „Constantin Brâncuşi” University of Târgu Jiu, Economy Series, Issue 3/2016
„ACADEMICA BRÂNCUŞI” PUBLISHER, ISSN 2344 – 3685/ISSN-L 1844 - 7007
RECENT ASPECTS ON TERRITORIAL DISPARITIES IN FINANCIAL BEHAVIOUR OF HOUSEHOLDS IN ROMANIA
BABUCEA ANA-GABRIELA,
PROF. PHD., “CONSTANTIN BRÂNCUŞI” UNIVERSITY OF TÂRGU JIU, ROMANIA e-mail: [email protected]
Abstract
In the recent past, the Romanian population has experienced major effect of psychological factors on the behavior of its financial, particularly with regard to accessing bank loans for consumer and real estate loans offered by commercial banks sometimes very easy, just "identity card". The financial crisis has compounded the effects of high-risk lending, leading in turn to many Romanian dramatic situations if we consider the impossibility of return of bank debt and the need to adopt legal regulations for restanţierii real estate loans.
The major risk of the bankruptcy of the pension system questioned especially amid massive emigration of labor in EU countries, together with a demographic trend downward as he mostly adult population to turn to savings instruments, even if according to studies BNR, they remain mostly in the sphere of bank deposits even if they offer extremely low interest rates. Appealing to methods frequently used to substantiate regional development strategies, the paper aims at analyzing the degree of concentration among the 8 regions, namely overcrowding overall levels of spatial distributions on loans and deposits of households in lei and foreign currency around a typical values of these variables. Key Words: household deposits, household credits, Struck coefficient, Romanian development regions, Classification JEL: E210, C100, O160 1. INTRODUCTION
The unbalanced development of regions nationally effect manifests including on financial behavior of the population. Inter-regional differences reflect in fact that administrative arrangements are deficient, each development region having one county that plays the role of locomotive for the others, and that, the national economic development is especially polarized in the country capital and in the regions West and North-West while the eastern and southern regions are always lagging behind.
Savings behavior of the population was recently revived throughout the country, especially under the impact of the negative effects of the period prior the financial crisis, period characterized by a facile lending but which has made from the population a banking client more cautious in terms of credits and more conscientious with his savings, in even if still preferring the deposits to other savings instruments.
Although various factors affect the population decisions of saving, the indicators of the income category and the job security remain determinants, the level of standard of living and its perspective beeing correlated and causing discrepancies at inter and intra-regional regarding the level and the ratio of credits and deposits of the population.
For a first assessment, in territorial profile, of the behavior of population regarding credits and saving, were considered centralized data at the level of the development regions on the size of loans to households in domestic and foreign currency and time deposits and deposits redeemable at notice, in national and foreign currency on the late of December 2015, the data publicly available on the website of the National Bank of Romania (NBR) to the monetary and financial statistics, data presented in table 1.
Can note a very large share of the national total of the region Bucharest - Ilfov, for both indicators considered credits and savings and for both forms, deposits in national and foreign currency. Bucharest-Ilfov Region is followed, far away, from North-West Region, while there are other two regions but with very reserved financial behavior in all situations, the South-West Oltenia and Center Region. The comparative graphics from figure 1 highlight another feature national, ie preference of Romanians to keep savings in deposits in lei while for credits they preferred foreign currency. This preference can be attributed to offers charged by banks.
198

Annals of the „Constantin Brâncuşi” University of Târgu Jiu, Economy Series, Issue 3/2016
„ACADEMICA BRÂNCUŞI” PUBLISHER, ISSN 2344 – 3685/ISSN-L 1844 - 7007
Table no. 1 – The distribution of credits and deposits of households in lei and foreign currency at the level of development regions, in late December 2015
Development region/Country
Credits in Lei Creditsiîn foreign currency Deposits în Lei Deposits in foreign currency Mil. lei % Mil. lei % Mil. lei % Mil. lei %
ROMANIA, Total 52592.80 100.00 55495.00 100.00 66044.40 100.00 41445.70 100.00
NORD WEST 5894.30 11.21 6839.10 12.32 8345.10 12.64 4795.70 11.57 NORD EAST 5416.00 10.30 5261.10 9.48 7207.90 10.91 4235.10 10.22 WEST 5455.00 10.37 4961.10 8.94 5353.00 8.11 3781.60 9.12 CENTER 4569.90 8.69 4793.80 8.64 6429.90 9.74 3580.90 8.64 SOUTH WEST OLTENIA 4118.90 7.83 3057.60 5.51 4943.90 7.49 1858.00 4.48 SOUTH MUNTENIA 5656.30 10.75 3647.90 6.57 7384.30 11.18 2802.60 6.76 SOUTH EAST 5652.90 10.75 5162.10 9.30 7400.20 11.20 3766.30 9.09 BUCHAREST+ILFOV 15829.60 30.10 21772.10 39.23 18980.10 28.74 16625.40 40.11 Source: Data processing by the author from http://www.bnr.ro/Credite-si-depozite-in-profil-teritorial-3171.aspx#peloc, December 2015
Fig. 1 - The territorial distribution at the level of the development regions of credits and depostis of
households, in national and foreign currency, in late December 2015 If we consider the actual saving as the difference between credits and deposits, we notice, analyzing the data in
Table. 2, that at the end of 2015, South Region, followed by North Region, are on the first places in ranking in terms of savings, the level of deposits in lei, or cumulated with deposits in the foreign currency, were exceeded with 882.70 million lei, namely 765.93 million lei overall level of credit, and this while the savings of the Bucharest-Ilfov Region population have amounts with 1996.18 million lei lower than those contracted credits, region followed by the West Region with a deficit between savings and debt by 1281.44 million lei.
Can note that the Region South-West Oltenia has a higher level of total credits compared with total deposits, too, but from the last position in the national ranking in terms of their volume. The Region North-West is on first place, if we referred to the largest credits simultaneously with deposits, excepting Bucharest-Ilfov Region. But, the most cautious with its money seems to be the population of South-Muntenia Region.
199

Annals of the „Constantin Brâncuşi” University of Târgu Jiu, Economy Series, Issue 3/2016
„ACADEMICA BRÂNCUŞI” PUBLISHER, ISSN 2344 – 3685/ISSN-L 1844 - 7007
A first feature that should be considered is the credits / deposits ratio, which, at the end of December 2015, has a national record value of 101%, the savings placed by the population beeing almost equal with the volume of the credits. Comparing the economic boom and the explosion of lending, of the year 2008, when ratio of population credits/deposits climbed and over 200%, changing of the financial behavior of the population it is obvious. Table no. 2 - The volume and the ratio of household credits/deposits of households in national and foreign currency at the development regions level, in late December 2015
Development region Total Credits Mil.lei
Total deposits Mil.lei
Saving (deposits-credits)
Mil.lei
Credits/deposits ratio
NORD-WEST 12733.40 13140.86 407.46 0.97 NORD-EAST 10677.10 11443.03 765.93 0.93 WEST 10416.10 9134.66 -1281.44 1.14 CENTER 9363.80 10010.72 646.92 0.94 SOUTH-WEST OLTENIA 7176.50 6801.90 -374.60 1.06 SOUTH MUNTENIA 9304.20 10186.90 882.70 0.91 SOUTH EAST 10815.00 11166.50 351.50 0.97 BUCHAREST+ILFOV 37601.70 35605.52 -1996.18 1.06
Total 108087.70 107490.05 -597.65 1.01
Fig. 2 - The volume of household saving (a) and the ratio of households deposits / deposits, national and foreign (b) at the level of development regions, in late December 2015
Considering data published by the Romanian National Prognosis Commission (NCP) presented in the table
below, regarding GDP / capita at the regional level for 2015, an important indicator that indicates living standards, we can explain the top place for two of three regions, West Region and respective Bucharest-Ilfov regarding level of credits comparing to the deposits. The explanation is their high level of GDP / capita well above the national average. In these regions is concentrate much of the national economy that gives to the people confidence to invest rather than saving, avoiding the loss given by the interest rates which registered the minimum level since 1989. As for the Region South-West Oltenia, it has the lowest levels of the both indicators. The subunitary level of its ratio of credits / deposits stemmed probably from historical loans outstanding or refinanced.
Table no. 3 – GPD/capita at the level of development regions of Romania, in the year 2015
Development regions (Counties) PIB/Cap de locuitor (Euro)
NORTH WEST (Bihor, Bistriţa-Năsăud, Cluj, Maramureş, Satu Mare, Sălaj) 6944 NORTH EAST (Bacău, Botoşani, Iaşi, Neamţ, Suceava, Vaslui) 4938 WEST (Arad, Caraș Severin, Hunedoara, Timiș) 8757 CENTER (Alba, Brașov, Covasna, Harghita, Mureș, Sibiu) 7551 SOUTH WEST OLTENIA (Mehedinși, Gorj, Dolj, Olt, Vâlcea) 6040 SOUTH MUNTENIA (Argeș, Călăraș, Dâmbovița, Giurgiu, Ialomița, Prahova, Teleorman) 6024 SOUTH EAST (Brăila, Buzău, Constanța, Galași, Tulcea, Vrancea) 6657 BUCHAREST – ILFOV 19063 Source: Romanian National Prognosis Commission (NPC)
200

Annals of the „Constantin Brâncuşi” University of Târgu Jiu, Economy Series, Issue 3/2016
„ACADEMICA BRÂNCUŞI” PUBLISHER, ISSN 2344 – 3685/ISSN-L 1844 - 7007
For all other five regions, the loan / deposit ratio is less, subunitary even with insignificant values, indicates that there is potential for lending for further and can note, that for various reasons the population started to saving and not for getting earnings from bank interest which are extremely low. Although inflation is negative, in more cases, because the commissions of banks (account management, cash withdrawal, account food etc.) the depositors lose money especially at deposit withdrawals more especially if they choose the deposits with the short term.
2. METHODOLOGY AND RESULTS
Given the complexity of the Romanian administrative-territorial units, regions that comprise different number of counties with large variation relative to population, to describe the spatial variation in the volume of household savings in term deposits or credits earned was used territorial indicators with relative calculation for which was used as the basis for reporting, the maximum level of variables considered in analysis, corresponding to Bucharest-Ilfov Region, in late December 2015.
In the tables below are present the algorithm for calculating territorial indeces and rates of gap for Romanian development regions.
Table no. 4 - The algorithm for calculating territorial indices and rates of gap by the Bucharest-Ilfov Region for household deposits, in late December 2015
Development regions
Deposits in lei Deposits în foreign currancy Total deposits
Territorial indeces
Rates of gap %
Territorial indeces
Rates of gap %
Territorial indeces
Rates of gap %
NORD-WEST 8.345,10 0,44 -56 4.795,70 0,29 -71 13.140,86 0,37 -63 NORD-EAST 7.207,90 0,38 -62 4.235,10 0,25 -75 11.443,03 0,32 -68 WEST 5.353,00 0,28 -72 3.781,60 0,23 -77 9.134,66 0,26 -74 CENTER 6.429,90 0,34 -66 3.580,90 0,22 -78 10.010,72 0,28 -72 SOUTH-WEST OLTENIA 4.943,90 0,26 -74 1.858,00 0,11 -89 6.801,90 0,19 -81
SOUTH MUNTENIA 7.384,30 0,39 -61 2.802,60 0,17 -83 10.186,90 0,29 -71 SOUTH EAST 7.400,20 0,39 -61 3.766,30 0,23 -77 11.166,50 0,31 -69 BUCHAREST+ILFOV 18.980,10 1 0 16.625,40 1 0 35.605,52 1 0
Levels of household deposits registered at regional level are placed at a very low level of only 26-44% of the population deposits in Bucharest-Ilfov region, and only 11-29% of levels for foreign currency deposits, which what determine rates of gap close to 90% when referring to foreign currency deposits in the South-West Oltenia, the polarization of the potential saving to population in the country capital is evident. We can note the gap between Bucharest-Ilfov and Region North-West which is a gap somewhat lower than Bucharest-Ilfov recorded with the other regions. Table no. 5 - The algorithm for calculating territorial indices and rates of gap of the Bucharest-Ilfov Region, in late December 2015
Development regions
Credits in lei Credits în foreign currancy Total deposits
Mil.Lei
Territorial indeces
Rates of gap %
Mil.Lei
Territorial indeces
Rates of gap %
Mil.Lei
Territorial indeces
Rates of gap %
NORD-WEST 5.894,30 0,37 -63 6.839,10 0,31 -69 12.733,40 0,34 -66 NORD-EAST 5.416,00 0,34 -66 5.261,10 0,24 -76 10.677,10 0,28 -72 WEST 5.455,00 0,34 -66 4.961,10 0,23 -77 10.416,10 0,28 -72 CENTER 4.569,90 0,29 -71 4.793,80 0,22 -78 9.363,80 0,25 -75 SOUTH-WEST OLTENIA 4.118,90 0,26 -74 3.057,60 0,14 -86 7.176,50 0,19 -81 SOUTH MUNTENIA 5.656,30 0,36 -64 3.647,90 0,17 -83 9.304,20 0,25 -75 SOUTH-EAST 5.652,90 0,36 -64 5.162,10 0,24 -76 10.815,00 0,29 -71
BUCHAREST+ILFOV 15.829,6
0 1 0 21.772,10 1 0 37.601,70 1 0
201

Annals of the „Constantin Brâncuşi” University of Târgu Jiu, Economy Series, Issue 3/2016
„ACADEMICA BRÂNCUŞI” PUBLISHER, ISSN 2344 – 3685/ISSN-L 1844 - 7007
Supremacy of Bucharest-Ilfov region is evident in the case of population credits, maintaining the similar gaps, a sign that the concentrated growth in the Bucharest-Ilfov determines the population either to consume or to invest much more than the population of the rest of the country whatever the region. A gap somewhat lower than that recorded by the Bucharest-Ilfov Region relative to other regions is recorded by the North-West Region.
To quantify the degree of uniformity of distributions in space, statistical methodology holds specific indicators. In this study, we used the spatial distribution coefficient which is named, too the concentration coefficient in space, one of the most relevant statistical indicators that can characterize this point of view for territorial series consisting of absolute values.
The variability of the inferior limit of the Gini coefficient, as compared with the n products analysed, determines a relative dificulty in using it in temporal comparisons. To eliminate that disadvantage, a number of correction procedures were propose in order to deal with the Gini coeffi cient. Such a procedure was proposed by R. Struck1:
Characterization the intensity of variables considered was accomplished by calling the concentration
coefficient Struck (Cs) whose value is between 0 - corresponding to spatial Series perfectly uniform and 1 - for major concentration, in other words, disparities, coefficient which is actually a corrected form of Gini coefficient.
Concentration coefficients for each variable considered is calculated and presented in the table below:
Table no. 6 - Algorithm for calculating the coefficient of concentration among Romanian development regions, in late December 2015
Development regions Credits in lei Credits in foreign
currency Deposits in lei Deposits in foreign currency
NORD-WEST 0,110 0,120 0,130 0,120 0,012 0,014 0,017 0,014
NORD-EAST 0,100 0,090 0,110 0,100 0,010 0,008 0,012 0,010
WEST 0,100 0,090 0,080 0,090 0,010 0,008 0,006 0,008
CENTER 0,090 0,090 0,100 0,090 0,008 0,008 0,010 0,008
SOUTH-WEST OLTENIA 0,080 0,060 0,070 0,040 0,006 0,004 0,005 0,002
SOUTH MUNTENIA 0,110 0,070 0,110 0,070 0,012 0,005 0,012 0,005
SOUTH-EAST 0,110 0,090 0,110 0,090 0,012 0,008 0,012 0,008
BUCHAREST+ILFOV 0,300 0,390 0,290 0,400 0,090 0,152 0,084 0,160
0,1608 0,2074 0,1586 0,2152
1 Săvoiu, G., Crăciuneanu, V., Ţaicu, M., A New Method of Statistical Analysis of Markets’ Concentration or Diversification, Romanian Statistical Review nr. 2 / 2010, p. 15-21.
202

Annals of the „Constantin Brâncuşi” University of Târgu Jiu, Economy Series, Issue 3/2016
„ACADEMICA BRÂNCUŞI” PUBLISHER, ISSN 2344 – 3685/ISSN-L 1844 - 7007
The values obtained from the calculation for concentration coefficients of regional distribution shows a
relatively uniform, for the volume of deposits in lei, the coefficient of Struck being quite close to 0 (CS = 0.098). As for loans in lei (CS = 0.20) and foreign currency loans (CS = 0.26) we can speak of some regional focus, while, relative to the volume of deposits in foreign currency (FC = 0.32) there a relative concentration and can thus speak about interregional disparities.
If we consider the definition of geographical regions which comprises several counties, can discuss amid variation disparities between counties. To test this hypothesis we considered data from Table. 7 data on the behavior of the population credits and deposits on the county level.
Table no. 7 – Romanian regional structure of household credits and deposits in lei and foreign currency, in late of December 2015
Millions lei
Development Region County Credits in
lei Credits in foreign
currancy Total
Credits Deposits în
lei
Deposits in foreign
currancy
Total deposits
NORTH-WEST
Bihor 1.253,0 1.481,2 2.734,3 1.650,8 899,1 2.549,87 Bistriţa-Năsăud 439,4 470,9 910,2 743,5 371,4 1.114,87 Cluj 2.560,6 3.135,8 5.696,5 3.449,1 2.069,5 5.518,64 Maramureş 749,8 742,7 1.492,6 1.123,2 740,6 1.863,83 Satu Mare 537,1 587,9 1.125,0 786,5 518,5 1.304,98 Sălaj 354,3 420,5 774,8 591,9 196,7 788,66 Total 5.894,3 6.839,1 12.733,4 8.345,1 4.795,7 13.140,86
NORTH-EAST
Bacău 948,7 783,3 1.732,0 1.508,7 912,5 2.421,19 Botoşani 490,2 438,7 928,9 585,4 254,1 839,54 Iaşi 2.047,7 2.302,2 4.350,0 1.839,6 1.039,9 2.879,51 Neamţ 633,0 573,7 1.206,7 1.228,9 818,4 2.047,31 Suceava 779,1 769,7 1.548,8 1.376,4 909,7 2.286,06 Vaslui 517,2 393,5 910,7 668,9 300,5 969,42 Total 5.416,0 5.261,1 10.677,1 7.207,9 4.235,1 11.443,03
WEST
Arad 968,1 800,5 1.768,6 982,3 748,2 1.730,56 Caraş-Severin 443,2 263,6 706,7 389,2 325,2 714,38 Hunedoara 963,1 483,0 1.446,2 1.174,2 449,6 1.623,85 Timiş 2.417,6 2.776,7 5.194,3 1.807,7 1.846,6 3.654,34
CENTER
Alba 663,0 637,4 1.300,3 999,6 411,9 1.411,52 Total 5.455,0 4.961,1 10.416,1 5.353,0 3.781,6 9.134,66 Braşov 1.737,5 1.998,9 3.736,3 2.023,5 1.402,5 3.426,01 Covasna 325,3 197,4 522,7 482,1 182,5 664,59 Harghita 338,6 216,6 555,2 878,8 230,7 1.109,49 Mureş 976,0 995,5 1.971,5 1.661,3 770,7 2.432,02 Sibiu 1.192,5 1.385,5 2.578,1 1.384,2 994,5 2.378,61 Total 4.569,9 4.793,8 9.363,8 6.429,9 3.580,9 10.010,72
SOUTH-WEST OLTENIA
Dolj 1.567,8 1.405,3 2.973,1 1.898,6 778,2 2.676,83 Gorj 755,2 312,9 1.068,1 805,0 198,8 1.003,82 Mehedinţi 471,3 410,1 881,5 462,6 210,7 673,31 Olt 632,1 393,0 1.025,1 784,5 239,6 1.024,13 Vâlcea 692,4 536,3 1.228,7 993,2 430,7 1.423,82 Total 4.118,9 3.057,6 7.176,5 4.943,9 1.858,0 6.801,9
SOUTH MUNTENIA
Argeş 1.582,1 1.277,7 2.859,8 2.157,9 707,0 2.864,85 Călăraşi 387,9 207,0 594,9 512,2 127,7 639,92 Dâmboviţa 699,5 346,5 1.046,0 923,6 399,1 1.322,69 Giurgiu 322,6 206,0 528,6 312,2 98,0 410,23 Ialomiţa 448,5 244,3 692,8 539,4 127,1 666,53 Prahova 1.750,1 1.137,7 2.887,8 2.362,0 1.172,9 3.534,87 Teleorman 465,5 228,8 694,3 577,0 170,8 747,76 Total 5.656,3 3.647,9 9.304,2 7.384,3 2.802,6 10.186,9
SOUTH-EAST Brăila 619,6 452,4 1.072,1 909,3 242,5 1.151,75 Buzău 796,4 504,1 1.300,5 1.148,0 338,0 1.486,03
203

Annals of the „Constantin Brâncuşi” University of Târgu Jiu, Economy Series, Issue 3/2016
„ACADEMICA BRÂNCUŞI” PUBLISHER, ISSN 2344 – 3685/ISSN-L 1844 - 7007
Constanţa 2.199,7 2.585,0 4.784,7 2.435,7 1.899,0 4.334,74 Galaţi 1.034,8 873,7 1.908,4 1.557,9 659,1 2.217,07 Tulcea 496,2 312,2 808,4 506,1 218,3 724,35 Vrancea 506,1 434,8 940,9 843,2 409,4 1.252,58 Total 5.652,9 5.162,1 10.815,0 7.400,2 3.766,3 11.166,5
BUCHAREST Bucureşti + Ilfov 15.829,6 21.772,1 37.601,7 18.980,1 16.625,4 35.605,52 ROMANIA Total 52.592,8 55.495,0 108.087,7 66.044,4 41.445,7 107.490,05
Source: Data from http://www.bnr.ro/Credite-si-depozite-in-profil-teritorial-3171.aspx#peloc, proceeding by the author.
The main indicators for analysis of the degree of variation between Roamnian counties were calculated and presented in Table below:
Table no. 8 - Indicators of regional variation analysis of household credits and deposits in lei and foreign currency,
in late of December 2015
N Range Minimum Maximum Sum Mean Std. Deviation Variance
Credits in lei 41 15.507,00 322,60 15.829,60 52.592,40 1.282,74 2.404,5 5.781.622 Credits in foreign currency 41 21.574,70 197,40 21.772,10 55.495,10 1.353,54 3.352,556 11.239.632 Total credits 41 37.079,00 522,70 37.601,70 108.087,80 2.636,29 5.753,609 33.104.016 Deposits in lei 41 18.667,90 312,20 18.980,10 66.044,30 1.610,84 2.860,364 8.181.680 Deposits in foreign currency 41 16.527,40 98,00 16.625,40 41.445,60 1.010,87 2.548,09 6.492.764 Total deposits 41 35.195,29 410,23 35.605,52 107.490,05 2.621,71 5.400,698 29.167.535
Source Proceedings by the author with MS Excel
As for population credits, if we compare the levels calculated for dispersions can note a variation much larger between counties like between the development regions for variables named Credits in lei or foreign currency compared to the variation of the variable named Total Credits, that is because Ilfov county is associated to Bucharest. Regarding the household savings, high variation is found in the variable Total deposits compared to the variation for variables Deposits in foreign currency or Deposits in lei.
3. CONCLUSION
After the analysis at the level of the eight development regions is observed that there are not significant
disparities, in other words: - The coefficients of Struck followed a uniform distribution of deposits in lei which denotes a relative certain
habit for savings in national currency, - There is small concentration, insignificant even, on behavior financial credit in lei and foreign currency, - There is a relative concentration of the savings in foreign currency deposits for the Bucharest-Ilfov, this
being the most developed region of Romania, both economically and socially, and default results in an increase in the concentration of certain areas, resulting in some discrepancies.
As regarding disparities between counties, there are obvious economic disparities in standards of living and considerable between them, which obviously determines the financial behavior of the population. Can note, however, levels of credits/ deposits ratio below the national value for most Romanian development regions, which although can be interpreted as signs of the population maturity and their orientation to saving, hide in fact a caution, and a limitation of consumption and investments, especially since modest supra unitary levels can note only in regions with a very high standard of life, compared to the other regions.
Bibliography:
1. Antonescu D. - Analiza disparitatilor regionale în România cu coeficientii de concentrare Gini/Struck, Romanian Journal of Economics, Institute of National Economy, no.12 / 2012, pp.160-183.
2. Băcescu-Cărbunaru A., Condruz-Băcescu, M., Statistică teoretică şi practică: seriile teritoriale/de spaţiu - sistem de indicatori şi indici, reprezentări grafice sugestive, Revista Română de Statistică nr. 12 / 2012, pp.3-14;
3. Gogonea, R.M., Statistică: baza teoretico-aplicativă pentru comerţ-servicii-turism, Editura Universitară, 2009; 4. Minică M., Consumption and Saving: Between Theory and Romanian Reality, Annals of Eftimie Murgu
University Resita, Fascicle II, Economic Studies. 2012, p75-83; 5. Oprea C., Zaharia M., Elemente de analiza datelor şi modelare utilizând Excel, - Editura Universitară, 2011;
204

Annals of the „Constantin Brâncuşi” University of Târgu Jiu, Economy Series, Issue 3/2016
„ACADEMICA BRÂNCUŞI” PUBLISHER, ISSN 2344 – 3685/ISSN-L 1844 - 7007
6. Niculescu-Aron I.G., An Analysis of The Saving Behavior In Romania. Comparative Study For 2012 And 2011 Based On The “Financial Situation Of The Romanian Households” Enquiries, Research Journal of Economics, Business and ICT, Vol 6 2012, pp.20-25;
7. Ruxanda G., Analiza datelor, Editura ASE, Bucureşti, 2001; 8. Săvoiu, G., Crăciuneanu, V., Ţaicu, M., A New Method of Statistical Analysis of Markets’ Concentration or
Diversification, Romanian Statistical Review nr. 2 / 2010, p. 15-21 9. Zaharia M., Babucea A.G., Bălăcescu A., Dynamics and their determinants in household deposits in lei. Case
of Romania after the financial crisis of 2008, Annals of 'Constantin Brancusi' University of Targu-Jiu, 2015, Special, p237-240;
10. www.bnr.ro - Official site of Romanian National Bank 11. www.cnp.ro - -Official site of Romanian National Prognosis Commission 12. www.insse.ro - Official site of Romanian National Institute of Statistics
205
Annals of the „Constantin Brâncuşi” University of Târgu Jiu, Economy Series, Issue 3/2016
„ACADEMICA BRÂNCUŞI” PUBLISHER, ISSN 2344 – 3685/ISSN-L 1844 - 7007
THE NEW CLASSICAL ECONOMY AND COUNTER-REVOLUTION OF THE
MONETARISM
PROF. KRUME NIKOLOSKI PHD GOCE DELCHEV UNIVERSITY - STIP, REPUBLIC OF MACEDONIA
E-mail: [email protected]
Abstract
The new classical economy as a school of economic thinking is developed on the basis of monetarism during 70’s and 80’s of the last century. At that time, monetarism as an extreme monetarist formulation had its golden era when it was necessary to maintain the money supply fairly stable, and that will increase slowly each year , mainly to allow natural growth of the economy. Monetarism spread in favor of economists, and the relationship between different measures of the money supply and inflation proved to be less clear than many monetary theories suggest. In this paper will be analyzed characteristics of monetary position, neglected role of money in Keynesian’s models, Phillips agreement for inflation / unemployment and the role of expectations.
Keywords: monetarism, money, counter-revolution, non-neutral money, inflation, unemployment Classification JEL: B0, B3, B22, E. 1. Introduction
The centre of the monetarism is the University of Chicago, acquired its name for the first time in the 30’s of the 20-th century. Its intellectual leaders in the 50s were F. Knight, in the field of theory and methodology and H. Simmons in the field of economic policy. In the next generation the most dominant role had M. Friedman, J. Stigler and D. Becker. Many economists who weren’t educated in Chicago, joined the "Chicago positions," though many professors at the University of Chicago denied "Chicago doctrine." The best works of the Chicago School are Simons’ Economic Policy for a Free Society and Friedman's book Capitalism and Freedom.
The interventionist monetary and fiscal policies that the orthodox post-war economics recommended came under attack in particular by a group of theorists working at the University of Chicago, which came to be known as the Chicago School. This more conservative strand of thought reasserted a "libertarian" view of market activity, that people are best left to themselves, free to choose how to conduct their own affairs. More academics who have worked at the University of Chicago have been awarded the Nobel Prize in Economics than those from any other university.
In the recent years, however, monetarism has spread in favor of economists, and the relationship between different measures of the money supply and inflation proved to be less clear than most monetary theories suggest. It is closely associated with Milton Friedman, who argued that, based on the quantity theory of money, the state should keep the money supply fairly stable, increasing it slowly each year, mainly to allow natural growth of the economy. Today, many central banks have stopped setting monetary targets, and instead of it, they accepted the stringent targets for inflation.
Authentic monetarist position is characterized by the premises: for short-term non-neutrality and long-term neutrality of money [1]. That can be realized by the means of:
• the institutions that will reduce uncertainty and • encouraging the state to follow the rules instead of discretion rights.
The first works on the relations of money and the price level are characterized by:
(1) the relation does not depend on time and space; and (2) there is an inverse relationship between the amount of money and the value of the currency.
This later developed into an attitude that money is non-neutral in the short-term (has real effects on output
during the adjustment and transition from an equilibrium to another) but money is neutral in the long term, because the effects gradually disappear.
The leading neoclassicist (Jevons, Marshall, Fisher, Wicksell) were supporters of the gold standard and fixed rates because of preserving the transparency of money and obstruction of sudden fluctuations. Keynesian revolution, as
206
Annals of the „Constantin Brâncuşi” University of Târgu Jiu, Economy Series, Issue 3/2016
„ACADEMICA BRÂNCUŞI” PUBLISHER, ISSN 2344 – 3685/ISSN-L 1844 - 7007
a result of the concerns of different variations, moves the emphasis toward institutional arrangements that will allow the government and the central bank action which should cause or prevent any developments in the future.
Neoclassicist view the cycles as deviations from equilibrium for various reasons, so these cycles were considered as the natural flow of things. Keynesian’s believed in "liquidity trap" interest rates reach their historical lows because of pessimism and mistrust and that any increase in the money supply can not topple them, and besides that the wages and rigid. This meant that monetary policy is ineffective (money-income link is weak, the changes are effected in the long run) and a different route than demand is needed, which should revive with fiscal stimulus. On top of Keynesian’s fluctuations in economic activity are accepted only as a product of changes in the investment, the offer passively comply with the demand, and interest money and prices almost had no role in contemporary models. 2. Counter-revolution of monetarism
Monetarism is used as an important element of the theoretical basis for the conduct of economic policy in the US and some other developed countries. Monetarists point out that the "invisible hand" is more effective than state intervention, the private sector is inherently stable, the state should control the money supply, economic policy should rely on strict rules and, above all, on monetary policy. Monetarism advocates free market activity, increased role of the private sector in carrying out economic activity and limit the role and importance of the state of an economy. Supporters and representatives of monetarism paid particular attention to the study of issues related to monetary theory and monetary policy.
As so often happens, just about the time that Keynes’s ideas were being triumphant in practice, they were losing their hold on the minds of scholars in the academies. A number of factors contributed to a change of attitude towards the Keynesian doctrine. One was the experience immediately after World War II. On the basis of the Keynesian analysis, economists and others expected the war to be followed by another great depression. With our present experience of over two decades of inflation behind us it is hard to recognize that this was the sentiment of the times.
But alike in the United States, in Great Britain and in many other countries, the dominant view was that, once World War II ended, once the pump-priming and government spending for military purposes ended, there would be an enormous economic collapse because of the scarcity of investment opportunities that had been given the blame for the Great Depression. Massive unemployment and massive deflation were the bugaboos of the time. As you all know, that did not happen. The problem after the war turned out to be inflation rather than deflation.
A second post-war experience that was important was the failure of cheap money policies. In Britain, Chancellor Dalton tried to follow the Keynesian policy of keeping interest rates very low. As you all know, he was unable to do so and had to give up. The same thing happened in the United States. The Federal Reserve System followed a policy of pegging bond prices, trying to keep interest rates down. It finally gave up in 1953 after the Treasury- Federal Reserve Accord of 1951 laid the ground-work for setting interest rates free. In country after country, wherever the cheap money policy was tried, it led to inflation and had to be abandoned. In no country was inflation contained until orthodox monetary policy was employed. Germany was one example in 1948; Italy shortly after; Britain and the United States later yet [2].
Monetarism is neoclassical “counter-revolution” against:
• Institutionalism in economic methodology • Keynesian macroeconomics and intervention action
In the history of monetarism there are three phases: the first is focused on the neglected role of money in
Keynesian models; the second on Phillips agreement inflation / unemployment and the third on the role of expectations. In the first phase, K. Warburton first pointed out that the real cycles are associated with minority interest of
money, that mistaken offer of money is the most important cause of vibration, that there is short-term non-neutrality of money on production and long-term neutrality. M. Friedman joined to his work in the mid-50s with labor Studies for the quantitative theory of money, Monetary History of the United States from 1867 to 1960, in which various ways he neglected Keynesian view on the role of money: money is a substitute for real and nominal assets, not just for bonds, so the potential of money is expressed in a broad portfolio of property; changes in money are closely related, naturally precede or late the change of actual units, and the Great Depression is not the result of demand deficit but the wrong adjusted monetary policy, rather than lower interest rates, turned to the gold standard. Followed by the works of leading monetarists who found that the demand for real balances is a function of interest and continuous income. Until 70's the hard core of monetarism is set out : the money grow or fall pro-cyclical; acceleration or deceleration of the money delay is followed by cyclical expansion or contraction of the real product; stable monetary growth that is relative to outcome is a sufficient condition for inflation; the growth of circulation is pro-cyclical [3].
In the sphere of politics the first phase highlighted the following: the economy can achieve greater stability if operational procedures are set up in a way that will remove the pro-cyclical money; the relation of money and production is a result of operating procedures, and it can be removed.
207

Annals of the „Constantin Brâncuşi” University of Târgu Jiu, Economy Series, Issue 3/2016
„ACADEMICA BRÂNCUŞI” PUBLISHER, ISSN 2344 – 3685/ISSN-L 1844 - 7007
This was a monetary cause for the Great Depression, not as Keynes argued, the product of the inherent instability of the market economy and a lack of aggregate demand. Friedman and Schwartz's Monetary History of the United States argued that crises of 1920-21, 1929-33 and 1937-38 are caused by the collapse of the monetary amount (reduced real money supply at higher prices), a K. Brunner and Melder identified it with mechanical identification of the "low" interest with monetary "tightening" (eg the interest marked downward trend, the Federal Reserve of the USA allowed decline in the monetary base, producing an insufficient supply of money). There wasn’t a distinction between pulses and amplifiers:
(1) monetary pulses have dominant, but not the unique role in initiating the recession; (2) distribution of shock is not permanent (sometimes real or monetary ones are dominant; (3) the relative importance of the shock depends on the nature of the monetary regime (in the gold standard
everything depends on gold; (4) a combination of real and monetary shocks, despite dominating the real ones, the choice of monetary regime
double acts on stability: first, reducing the size and frequency of monetary shock and secondly, removing monetary response to real shock. Bruner writes about it: "Firstly, monetary impulses are the main factor of variations in production, employment and prices. Second, changes in the quantity of money is the surest measure of the nature of the monetary impulse. Third, the conduct of monetary authorities affect the movement of the quantity of money in the cycle [4]. The argument that that monetary policy is weak and ineffective has been replaced by arguments that the effects of money is uneven.
The second phase began in the mid 60’s and has been focused on three issues: first, fiscal action of the
country has small and insignificant effects on overall economic activity; second, stable proportion inflation – unemployment is elaborated in the spirit of the Phillips curve, as inability of trading with these aggregates on long terms, and finally the international aspects of inflation are explored.
The third phase brings joining the hypothesis of rational expectations and the natural rate of unemployment. The foundation of the "new classical macroeconomics" are rational expectations or attitude that individuals effectively use all the information and learn from past experience. They no longer look to the past, nor do extrapolate past behavior, but look to the future and considering that politics is guided by precisely defined rules, they are able in time to anticipate and hinder any adverse consequences. The biggest disadvantage, according to Brunner and Meltzer, is that "uncertainty, incomplete knowledge of the subjects in the economy and the cost of procurement of information and reducing uncertainty are all neglected ."
The approach of the new classical macroeconomics is based on asymmetric information handling: costs are zero or insignificant, and gains are significant. Instead, classical monetary view is that it is the uncertainty that initiated such institutions, such as money as a medium of exchange. Also, expensive information disable instant adjustment of prices and it is possible a short-term rigidity. Furthermore, economic processes are not deterministic and not so predictable and it takes a long time to discern them. Therefore, they conclude: Monetary, Keynesian and New classical approach to money-production ratio(relation).
Table No. 1. Monetary, Keynesian and New Classical approach
Problem Monetarists Keynesians New-Classical Monetary changes affect real income Yes Yes No
Activist discretionary policy reduces fluctuations
No Yes No
Monetarist and most of the Keynesian accept that money influence economic activity and prices. "The radical Keynesians" and "new classical macroeconomics" deny any kind of money influence on production. According radical Keynesians money is a residual economic size, there are just as "credit money" as a passive variable determined by the volume of activity and changes in the volume of money and circulation are mutually canceled. The new classical macroeconomics clarifies the passiveness of money with the actual causes of the cycles of technological progress. First rigidity of prices translates it into an imbalance, and the second abundance of free information translates them into balance. Monetarism has made a number of important and lasting contributions to modern macroeconomics. As a result of the monetarist counter-revolution it is now widely (but not universally) accepted that [6]:
• In the long run there is no trade-off between inflation and unemployment, and that the long-run Phillips curve is vertical at the natural rate of unemployment.
• Sustained inflation is a monetary phenomenon-a majority of economists and policy makers now emphasise the rate of growth of the money supply when explaining and combating inflation over the long run.
208

Annals of the „Constantin Brâncuşi” University of Târgu Jiu, Economy Series, Issue 3/2016
„ACADEMICA BRÂNCUŞI” PUBLISHER, ISSN 2344 – 3685/ISSN-L 1844 - 7007
• The primary goal of monetary policy should be the pursuit of a low and stable rate of inflation. Interestingly, since the 1990s, inflation targeting has been adopted in a number of countries (see, for example, Mishkin, 2002 and Snowdon and Vane, 2005, Chapter 7). What has not survived the monetarist counter-revolution is the 'hard core' proposal put forward by some monetarists that the authorities should pursue a fixed rate of monetary growth. As mentioned earlier the case for such a rule was seriously undermined by the collapse of the stable demand for money function and the sharp decline in trend velocity in the 1980s in the US and elsewhere.
• The potential of activist discretionary fiscal and monetary policy is much -more limited than was once held to be the case in the 1950s and 1960s by orthodox Keynesians. However, in 1965-1975 a "monetarist" economist was somebody who believed [7]:
(1) That’s inflation expectations could not be kept far below actual inflation for long, and that proper
microeconomic policy sought not to exploit any Phillips-Curve tradeoff but rather to focus on stable money-supply growth, stable nominal GDP growth, and an unemployment rate at its natural rate.
(2) Monetary policy was a more powerful and effective macroeconomic stabilization policy tool than fiscal policy.
3. Key propositions of monetarism according to M. Friedman Milton Friedman (1912–2006) stands as one of the most influential economists of the late twentieth century.
He won the Nobel Prize in Economics in 1976, among other things, for A Monetary History of the United States (1963). Friedman argued that the Great Depression had been caused by the Federal Reserve's policies through the 1920s, and worsened in the 1930s. Friedman argues laissez-faire government policy is more desirable than government intervention in the economy. Governments should aim for a neutral monetary policy oriented toward long-run economic growth, by gradual expansion of the money supply. He advocates the quantity theory of money, that general prices are determined by money. Therefore active monetary (e.g. easy credit) or fiscal (e.g. tax and spend) policy can have unintended negative effects. In Capitalism and Freedom (1967) Friedman wrote:
There is likely to be a lag between the need for action and government recognition of the need; a further lag between recognition of the need for action and the taking of action; and a still further lag between the action and its effects.
(1) There is a consistent though not precise relation between the rate of growth of the quantity of money and the
rate of growth of nominal income. (By nominal income, I mean income measured in pounds sterling or in dollars or in francs, not real income, income measured in real goods.) That is, whether the amount of money in existence is growing by 3 per cent a year, 5 per cent a year or 10 per cent a year will have a significant effect on how fast nominal income grows. If the quantity of money grows rapidly, so will nominal income; and conversely.
(2) This relation is not obvious to the naked eye largely because it takes time for changes in monetary growth to
affect income and how long it takes is itself variable. The rate of monetary growth today is not very closely related to the rate of income growth today. Today’s income growth depends on what has been happening to money in the past. What happens to money today affects what is going to happen to income in the future.
(3) On the average, a change in the rate of monetary growth produces a change in the rate of growth of nominal
income about six to nine months later. This is an average that does not hold in every individual case. Sometimes the delay is longer, sometimes shorter.
(4) The changed rate of growth of nominal income typically shows up first in output and hardly at all in prices. If
the rate of monetary growth is reduced then about six to nine months later, the rate of growth of nominal income and also of physical output will decline. However, the rate of price rise will be affected very little. There will be downward pressure on prices only as a gap emerges between actual and potential output.
(5) On the average, the effect on prices comes about six to nine months after the effect on income and output, so
the total delay between a change in monetary growth and a change in the rate of inflation averages something like 12–18 months. That is why it is a long road to hoe to stop an inflation that has been allowed to start. It cannot be stopped overnight.
209

Annals of the „Constantin Brâncuşi” University of Târgu Jiu, Economy Series, Issue 3/2016
„ACADEMICA BRÂNCUŞI” PUBLISHER, ISSN 2344 – 3685/ISSN-L 1844 - 7007
(6) Even after allowance for the delay in the effect of monetary growth, the relation is far from perfect. There’s many a slip ‘twixt the monetary change and the income change.
(7) In the short run, which may be as much as five or ten years, monetary changes affect primarily output. Over
decades, on the other hand, the rate of monetary growth affects primarily prices. What happens to output depends on real factors: the enterprise, ingenuity and industry of the people; the extent of thrift; the structure of industry and government; the relations among nations, and so on.
(8) It follows from the propositions I have so far stated that inflation is always and everywhere a monetary
phenomenon in the sense that it is and can be produced only by a more rapid increase in the quantity of money than in output. However, there are many different possible reasons for monetary growth, including gold discoveries, financing of government spending, and financing of private spending.
(9) Government spending may or may not be inflationary. It clearly will be inflationary if it is financed by
creating money, that is, by printing currency or creating bank deposits. If it is financed by taxes or by borrowing from the public, the main effect is that the government spends the funds instead of the taxpayer or instead of the lender or instead of the person who would otherwise have borrowed the funds. Fiscal policy is extremely important in determining what fraction of total national income is spent by government and who bears the burden of that expenditure. By itself, it is not important for inflation.
(10) One of the most difficult things to explain in simple fashion is the way in which a change in the quantity of
money affects income. Generally, the initial effect is not on income at all, but on the prices of existing assets, bonds, equities, houses, and other physical capital. This effect, the liquidity effect stressed by Keynes, is an effect on the balance-sheet, not on the income account. An increased rate of monetary growth, whether produced through open-market operations or in other ways, raises the amount of cash that people and businesses have relative to other assets. The holders of the now excess cash will try to adjust their portfolios by buying other assets. But one man’s spending is another man’s receipts. All the people together cannot change the amount of cash all hold—only the monetary authorities can do that. However, as people attempt to change their cash balances, the effect spreads from one asset to another. This tends to raise the prices of assets and to reduce interest rates, which encourages spending to produce new assets and also encourages spending on current services rather than on purchasing existing assets. That is how the initial effect on balance-sheets gets translated into an effect on income and spending. The difference in this area between the monetarists and the Keynesians is not on the nature of the process, but on the range of assets considered. The Keynesians tend to concentrate on a narrow range of marketable assets and recorded interest rates. The monetarists insist that a far wider range of assets and of interest rates must be taken into account. They give importance to such assets as durable and even semi-durable consumer goods, structures and other real property. As a result, they regard the market interest rates stressed by the Keynesians as only a small part of the total spectrum of rates that are relevant.
(11) One important feature of this mechanism is that a change in monetary growth affects interest rates in one
direction at first but in the opposite direction later on. More rapid monetary growth at first tends to lower interest rates. But later on, as it raises spending and stimulates price inflation, it also produces a rise in the demand for loans which will tend to raise interest rates. In addition, rising prices introduce a discrepancy between real and nominal interest rates. That is why world-wide interest rates are highest in the countries that have had the most rapid rise in the quantity of money and also in prices—countries like Brazil, Chile or Korea. In the opposite direction, a slower rate of monetary growth at first raises interest rates but later on, as it reduces spending and price inflation, lowers interest rates. That is why world-wide interest rates are lowest in countries that have had the slowest rate of growth in the quantity of money—countries like Switzerland and Germany. This two-edged relation between money and interest rates explains why monetarists insist that interest rates are a highly misleading guide to monetary policy [8].
4. Conclusions
As Keynesian economics began to supersede the classical theory, which later proved not to be able to explain the events from 1930, Keynesian economics was caused, which again proved not to match to the economy in the 1970s. The model of Keynes argued that unstable aggregate demand causes instability of market economies, excessive aggregate demand and inflation cause expansions, and insufficient aggregate demand and unemployment cause recessions. The solution was to correct fluctuations in the private market with an opposing government policy or by slowing aggregate demand during the expansion, and increasing aggregate demand during a recession.
In 1970, in the United States followed a period of simultaneously rising of inflation and unemployment, but it was not in accordance with Keynesian model. Changes in aggregate demand caused inflation and unemployment to
210
Annals of the „Constantin Brâncuşi” University of Târgu Jiu, Economy Series, Issue 3/2016
„ACADEMICA BRÂNCUŞI” PUBLISHER, ISSN 2344 – 3685/ISSN-L 1844 - 7007
move in the opposite direction, but not together. Keynesian policy had no proposals for current economic problems. Some used expansionary policies to fight unemployment even at a cost of worsening inflation, while others used restrictive policy to fight inflation at the cost of worsening unemployment.
Since Keynesians had no immediate explanation or solution, people began to explore other alternative solutions. A small group of macroeconomists, led by Milton Friedman, caused the Keynesian economic thought, but because later it was proved not to function so well, they were not able to affect significantly the economic theory and government policy.
Friedman was also known for his work on the consumption function, the permanent income hypothesis (1957), which Friedman himself referred to as his best scientific work. This work contended that rational consumers would spend a proportional amount of what they perceived to be their permanent income. Windfall gains would mostly be saved. Tax reductions likewise, as rational consumers would predict that taxes would have to rise later to balance public finances. Other important contributions include his critique of the Phillips curve and the concept of the natural rate of unemployment (1968). This critique associated his name with the insight that a government that brings about higher inflation cannot permanently reduce unemployment by doing so. Unemployment may be temporarily lower, if the inflation is a surprise, but in the long run unemployment will be determined by the frictions and imperfections in the labour market.
In the end, the monetarist theory, as Friedman’s reworking of the traditional quantity theory of money was to be called, progressed at the same time as the neoclassical synthesis and grew, apparently, in conflict with it, as it presented itself as a criticism of Keynes’s economics, while the neoclassical economists of MIT were proclaiming themselves as ‘neo-Keynesian’. The monetarist counter-revolution began in 1956, when Friedman published ‘The Quantity Theory of Money: A Restatement’. This famous article was followed by other important works, later collected in The Optimum Quantity of Money (1969), which contains the foundations of monetarist theory. 5. Bibliography [1] Todor Todorov., (2002), “Economic theories and economic thought“, Faculty of Economics - Prilep, p. 606; [2] Milton Friedman., “The Counter-Revolution in Monetary Theory” IEA Occasional Paper, no. 33, First published by the Institute of Economic Affairs, London, 1970, p.5; [3] К. Brunner., A.Melzer., “Predicting velocity: Implications for Theory and Policy”, Journal of finance, 1963; [3] D. Laidler., “The Rate Interest: the Evidence from the Time Series”, Journal of Political Economy, 1963; [4] К. Brunner., The Role of Money and Monetary Policy”Federal Reserve Bank of St. Louis Rewiev, 1968; [5] F.Kydiand., E.Prescott, ‘Time to Build an Aggregate Fluctuations”, Econometrica, 1982; [6] Howard R. Vane., The Legacy of the Monetarist Counter-Revolution: An Academic and Personal Appraisal, 2005; [7]∗∗∗www: http://delong.typepad.com/sdj/2013/12/the-keynesian-revolution-the-monetarist-counterrevolution-the-new classical-purge-the-neo-keynesian-restoration-saturday-focu.html [8] Milton Friedman., “The Counter-Revolution in Monetary Theory” IEA Occasional Paper, no. 33, First published by the Institute of Economic Affairs, London, 1970; [9] Milton Friedman., “Capitalism and Freedom” (1961); Also available: http://www.pdf-archive.com/2011/12/28/friedman-milton-capitalism-and-freedom/friedman-milton-capitalism-and-freedom.pdf [10] Canterbery Ray., The Literate Economist: A Brief History of Economics, HarperCollins, 1995; [11] Skousen Mark., The Making of Modern Economics, ME Sharpe, 2001; [12] Ernesto Screpanti., Stefano Zamagni., An Outline of the History of Economic Thought, Second Edition, Oxford University Press, 2005; [13] E. K. Hunt., History of Economic Thought: A Critical Perspective, Armonk, New York: M. E. Sharpe, 2002; [14] E.K. Hunt., Mark Lautzenheiser., History of Economic Thought; A Critical Perspective New York: M.E. Sharpe, 2011; [15]Nikoloski Krume., Aleksoski Ognen., Petrusheva Borka ., (2015) Economic thought through the prism of new keynesian economics. Annals of the „Constantin Brâncuşi” University of Târgu Jiu, 1 (1). pp. 17-21. ISSN 2344 3685 [16] Blaug Mark., Great Economists Before Keynes and Great Economists Since Keynes, Cambridge University Press, 1985; [17] Blaug Mark., Economic Theory in Retrospect (2006), Cambridge University Press; [18] Metodija Stojkov., Development of Economic Thought, Faculty of Economics - Skopje, 2008;
211

Annals of the „Constantin Brâncuşi” University of Târgu Jiu, Economy Series, Issue 3/2016
„ACADEMICA BRÂNCUŞI” PUBLISHER, ISSN 2344 – 3685/ISSN-L 1844 - 7007
REVIEW OF ECONOMIC DEVELOPMENT IN THE REPUBLIC OF
SERBIA IN TRANSITION CONDITIONS
JELENA TOSKOVIC PhD. ERP SPECIALIST, OFFICE ADRESS, MI FINANCE D.O.O, ŠABAC, KRSMANOVACA BB,
15000 SABAC, SERBIA [email protected] SLOBODAN POPOVIC
ASSISTANT PROFESSOR, INTERNAL AUDITOR, JKP GRADSKO ZELENILO, SUTJESKA 2, 2100 NOVI SAD, SERBIA
[email protected] JOVANA ADZIC
ASSISTANT, EDUCONS UNIVERSITY, VOJVODE PUTNIKA 87, 21208 SREMSKA KAMENICA, SERBIA
[email protected] Abstract
The transition, or the process of transition from centrally-planned to a market economy in Serbia, started in the nineties of the twentieth century. Based on the concept of neoliberal economy, the system reform for the Republic of Serbia was extremely long and difficult. The decline in economic activity, rising unemployment, an increase in foreign trade deficit and balance of payment turbulence, among others, were the consequences of the implementation of neoliberal economic policy. The task of this paper is to show that Serbia, as one of the most developed countries of the Western Balkans must create and implement national economic and development policies in order to foster socio-economic development.
In line with this objective of this paper is to analyze the macroeconomic performances in Serbia in transition period or the last ten years, between 2004-2014.godine. The paper analyzes the basic macroeconomic performance as economic growth, unemployment, industrial production, import, export, and Balance of Payments. The paper consists of five parts, where in addition to the introduction analyzes the trend of economic growth, unemployment and industrial production, then analyzes the implementation of import and export policies, as well as the trend in the balance of payments. At the end, there were concluding observations and literature.
Keywords: transition, economic development, macroeconomic performances, Serbia
Clasificare JEL: E10
1. Introduction Nineteens started the transition reforms that involved the transition to a market way of functioning of the
economy. Building a market economy and quickly initiate a transition program that would open the process of market reforms, was supported by a political decision to abandon socialism and the transition to capitalism in transition countries (Filipovic, Raspopovic, Toskovic). It is further meant that the implementation of market reforms under democratic scenario was impossible without significant costs, policy of price liberalization and financial stabilization, as well as the reduction of social contributions and other forms of income redistribution (Blanchard & Kremer, 1997; Roland, 2000).
However, the transition process did not lead to economic growth and development, but also resulted in a fall in economic activity, an increase in unemployment, an increase in foreign trade deficit and balance of payment turbulence. Pursuant to the reality that the rough individualism and market fundamentalism destroyed all sense of community and led to reckless exploitation of unprotected individuals (Stiglitz, 2013), the question arises whether it is justified to continue with the creation of the economic system and economic policy on the principles of neoliberalism (Lekovic, 2015). It is essential that the methods of state influence on the behavior of economic agents are diverse and that they comply with the principles of the market economy and private enterprise (Kolodko, 1998), where the necessary active regulatory and corrective role of the state.
It was confirmed that the theoretical as well as empirical research, successful industrialization is a prerequisite for solving the four major economic problems of each country, which is a priority for underdeveloped countries - increasing added value, increase employment, earnings growth, and reducing the current account deficit (Reinert, 2006). Navigate the traditional activities of agriculture and other activities of the primary sector to modern industry is a
212
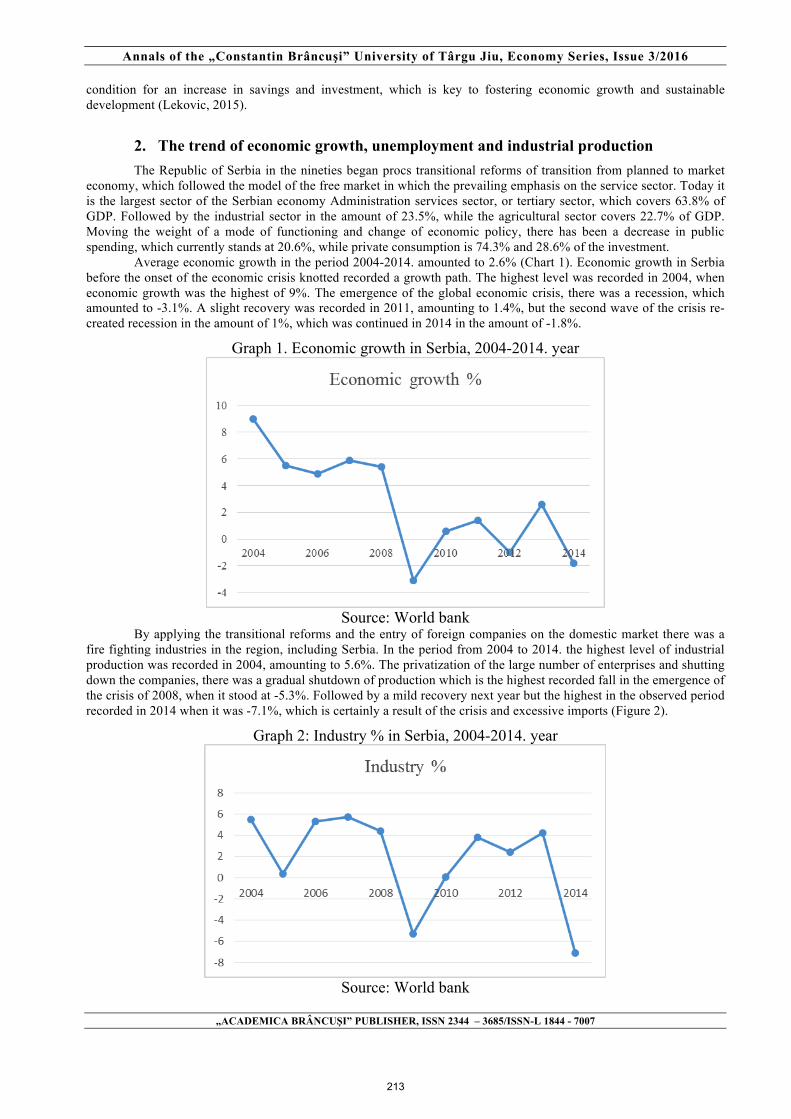
Annals of the „Constantin Brâncuşi” University of Târgu Jiu, Economy Series, Issue 3/2016
„ACADEMICA BRÂNCUŞI” PUBLISHER, ISSN 2344 – 3685/ISSN-L 1844 - 7007
condition for an increase in savings and investment, which is key to fostering economic growth and sustainable development (Lekovic, 2015).
2. The trend of economic growth, unemployment and industrial production The Republic of Serbia in the nineties began procs transitional reforms of transition from planned to market
economy, which followed the model of the free market in which the prevailing emphasis on the service sector. Today it is the largest sector of the Serbian economy Administration services sector, or tertiary sector, which covers 63.8% of GDP. Followed by the industrial sector in the amount of 23.5%, while the agricultural sector covers 22.7% of GDP. Moving the weight of a mode of functioning and change of economic policy, there has been a decrease in public spending, which currently stands at 20.6%, while private consumption is 74.3% and 28.6% of the investment.
Average economic growth in the period 2004-2014. amounted to 2.6% (Chart 1). Economic growth in Serbia before the onset of the economic crisis knotted recorded a growth path. The highest level was recorded in 2004, when economic growth was the highest of 9%. The emergence of the global economic crisis, there was a recession, which amounted to -3.1%. A slight recovery was recorded in 2011, amounting to 1.4%, but the second wave of the crisis re-created recession in the amount of 1%, which was continued in 2014 in the amount of -1.8%.
Graph 1. Economic growth in Serbia, 2004-2014. year
Source: World bank
By applying the transitional reforms and the entry of foreign companies on the domestic market there was a fire fighting industries in the region, including Serbia. In the period from 2004 to 2014. the highest level of industrial production was recorded in 2004, amounting to 5.6%. The privatization of the large number of enterprises and shutting down the companies, there was a gradual shutdown of production which is the highest recorded fall in the emergence of the crisis of 2008, when it stood at -5.3%. Followed by a mild recovery next year but the highest in the observed period recorded in 2014 when it was -7.1%, which is certainly a result of the crisis and excessive imports (Figure 2).
Graph 2: Industry % in Serbia, 2004-2014. year
Source: World bank
213

Annals of the „Constantin Brâncuşi” University of Târgu Jiu, Economy Series, Issue 3/2016
„ACADEMICA BRÂNCUŞI” PUBLISHER, ISSN 2344 – 3685/ISSN-L 1844 - 7007
Industrial policy, which would initiate the process of re-industrialization of the country, is greatly important
because the development industry create real opportunities for job creation, improvement and application of knowledge as a factor of innovation, which is an essential condition for the growth of productivity and competitiveness, and consequently, more dynamic economic growth and development (Lekovic, Micic, 2013). Unemployment is one of the main objectives of macroeconomic policy which aims to achieve full employment. How was offered a job in Serbia is extremely poor, lack of employment opportunities makes young people to leave the region and thus seek a job elsewhere. In this way, emigration exacerbates the situation on the labor market, which initiates the conduct-oriented policies in order to ensure job creation. Serbia in the last twenty years, faced with a constant outflow of young and educated people, who have left their country and find a job abroad, which is unfortunately led to the expiration of unskilled labor (Toskovic, 2016).
By analyzing the trend of the indicators of unemployment at the beginning of 2004, unemployment in Serbia amounted to 18.5%. Until the emergence of the economic crisis, the highest unemployment rate recorded in the period 2005-2006. when it was 20.8%. The lowest level was in the year of stagnation crisis amounting 13.6%. However, the escalation of the second wave of the crisis in 2012 have had the largest unemployment levels of up to 23.9% (Chart 3). It is also the highest level in the last ten years. A must-see is worth noting that in 2015, unemployment exceeded one million people, which is a record for the last fifteen years.
Graph 3: Unepmployement in Serbia, 2000-2014. year
Source: World bank
3. Analysis of the implementation of the import and export policy The liberalization of foreign trade, imposed by international financial institutions (IMF and WB), with the help
of the recommendations of the Washington Consensus, initiated primarily the liberalization of imports, where foreign investors have entered the domestic market, the use of domestic raw materials, and qualified for their goods. In this way, the liberalization of imports suppressed domestic production, which was not competitive enough to compete with the offer of foreign companies, which was suppressed domestic exports (Tošković, 2016). Certainly the result was a rise in imports of foreign goods and exports of domestic goods (Charts 4 and 5), which further led to growing foreign trade deficit.
Thus, the entry of foreign companies on the domestic market there was an increase in imports, which at the beginning of 2004 amounted to 50.6% of GDP. The uptrend continued until the beginning of the crisis, where in 2008 imports amounted to 54.1%. The escalation of the crisis there has been a slight decline, which continued in 2012, while the highest level was reached in 2014 in the amount of 54.3% of GDP.
214

Annals of the „Constantin Brâncuşi” University of Târgu Jiu, Economy Series, Issue 3/2016
„ACADEMICA BRÂNCUŞI” PUBLISHER, ISSN 2344 – 3685/ISSN-L 1844 - 7007
Graph 4: Import % GDP in Serbia, 2004-2014. Year
Source: World bank
Next, the export policy over time began to wane due to shutdowns of production capacity. This directly influenced the increase in the trade deficit, which is the growth of imports grew bigger. In 2004, exports accounted for 24.2% of GDP. At the break of the crisis there was a decrease in exports of 2.3%, but already in 2010 followed by a recovery, which continued until 2014. Thus, the increase in exports has been a reduction in the trade deficit.
Graph 5: Export % GDP in Serbia, 2004-2014. Year
Source: World bank
Today, Serbia is a signatory to the agreement on free trade with the European Union, which is the most important foreign trade partner of Serbia, which Serbian producers can export their products to the area of the EU without customs duties and fees. For products (beef, sugar, wine) is determined by the allowed amount (quota) imports annually (SIEPA, 2016). In addition, Serbia's CEFTA1, enabling it to export to the countries of the region without customs duties, which
1 CEFTA (Central European Free Trade Agreement) - trade agreement between Albania, Bosnia and Herzegovina, Macedonia, Moldova, Serbia (Kosovo) and Montenegro ..
215

Annals of the „Constantin Brâncuşi” University of Târgu Jiu, Economy Series, Issue 3/2016
„ACADEMICA BRÂNCUŞI” PUBLISHER, ISSN 2344 – 3685/ISSN-L 1844 - 7007
every year realized foreign trade surplus. Also, agreements were signed with the countries of EFTA2 and the Commonwealth of Independent States3, which has a unique position without customs access to major European markets.
4. Balance of Payments trend in Serbia Balance of payments represents a collection of all economic transactions of a country over a period of one year, which presents a picture of the performance of the economy. In fact, it is the balance of receipts and payments arising on the basis of total economic transactions with foreign countries in the period of one calendar year. Serbia and the other countries in the region faced with the problem of the deficit of the current racine, who usked lack of FDI grew bigger. In the period before the crisis, Serbia has had a current account deficit of 5.474 billion euros, which was in 2008 due to the crisis increased to 7.126 billion. Reducing the current account deficit recorded in 2009, but the onslaught of the second wave of crisis once again stopped the inflow of foreign investment deepening deficit. The total current account deficit in the period 2007-2012. in Serbia amounted to 23.996 billion euros, as a result of trade deficit, which amounted to 36.692 billion. In the same period, direct investment amounted to 12.288 billion, portfolio investments 3.882 billion, while other investments were 7.460 billion euros. The inflow in the financial account, net, which amounted to 24,313 billion, influenced the growth of foreign exchange reserves, which reached 1.155 billion euros (Table 1).
Table 1: Balance of Payments of Serbia (million Eur), 2007-2014.year ITEM 2007 2008 2009 2010 2011 2012 2013 2014 1 Current account -5,474 -7,126 -2,032 -2,037 -3,656 -3,671 -2,098 -1,985 1.A Goods and services -7,358 -8,684 -5,056 -4,729 -5,341 -5,523 -3,845 -3,645
1.A.a Goods -7,113 -8,488 -5,066 -4,719 -5,496 -5,634 -4,159 -4,111
1.A.b Service -245 -196 9 -10 154 111 313 465
1.B Primary income -982 -983 -479 -658 -1,368 -1,097 -1,419 -1,343
1.C Secondary income 2,866 2,541 3,504 3,351 3,054 2,949 3,166 3,003 2 Capital account -312 6 0 0 -3 -8 15 7
The balance of the current account and the capital account -5,786 -7,120 -2,032 -2,037 -3,659 -3,680 -2,083 -1,978
3 Financial expense, net -5,349 -6,598 -2,280 -1,553 -3,340 -3,351 -1,630 -1,705
The balance of the financial account -5,349 -6,598 -2,280 -1,553 -3,340 -3,351 -1,630 -1,705
3.1 Direct investments, net -2,528 -2,486 -2,068 -1,133 -3,320 -753 -1,298 -1,236
3.2 Portfolio investments, net -678 91 49 -67 -1,600 -1,676 -1,883 -369
3.4 Other investments, net -2,884 -2,516 -2,626 549 -197 214 855 1,703
3.5 Foreign exchange reserves 742 -1,687 2,363 -929 1,801 -1,137 697 -1,797
4. Net errors and omissions 437 522 -249 485 318 329 453 273
Source: NBS (National bank in Serbia) In conditions of deep social and economic crisis in which Serbia is expressed budgetary and balance of payments imbalances, high external debt, there is no doubt that the limited economic power and narrow maneuvering space for active and efficient functioning of the state in terms of economic growth moving (Lekovic, 2015) .To achieve economic growth and achieve sustainability of economic development is essential institutional convergence and synergy of all economic institutions (Lekovic, 2016). For the successful functioning of the economy in the Republic of Serbia, to achieve a more dynamic economic growth and sustainable development, it is necessary to leave the neo-liberal model and with full appreciation of the theoretical and empirical context, the creation of the economic system and economic policies that will satisfactorily enable the realization of the priority objectives, such as the reindustrialization of the country, encouraging faster employment, of economic growth and sustainable development.
2 EFTA (European Free Trade Association) - now has four members: the Republic of Iceland, the Principality of Liechtenstein, the Kingdom of Norway and the Swiss Confederation, which have concluded 18 free trade agreements (eg. Albania, Canada, Chile, Croatia, Egypt, Israel, Lebanon, Macedonia, Mexico, Singapore, Serbia ...), and is negotiating with another 6 countries and customs territories. 3 Commonwealth of Independent States (CIS) -podrazumeva international alliance of nine former Soviet republics (Azerbejan, Belarus, Armenia, Kazakhstan, Kyrgyzstan, Moldova, Russia, Tajikistan, Uzbekistan).
216
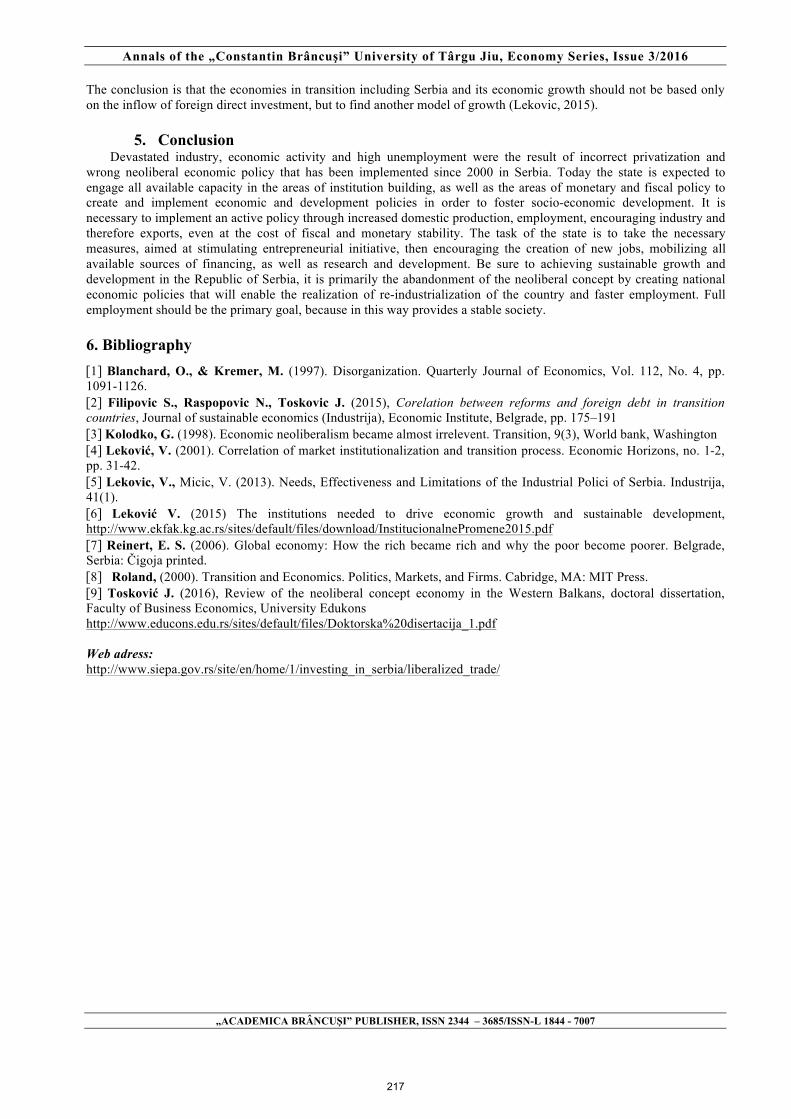
Annals of the „Constantin Brâncuşi” University of Târgu Jiu, Economy Series, Issue 3/2016
„ACADEMICA BRÂNCUŞI” PUBLISHER, ISSN 2344 – 3685/ISSN-L 1844 - 7007
The conclusion is that the economies in transition including Serbia and its economic growth should not be based only on the inflow of foreign direct investment, but to find another model of growth (Lekovic, 2015).
5. Conclusion Devastated industry, economic activity and high unemployment were the result of incorrect privatization and
wrong neoliberal economic policy that has been implemented since 2000 in Serbia. Today the state is expected to engage all available capacity in the areas of institution building, as well as the areas of monetary and fiscal policy to create and implement economic and development policies in order to foster socio-economic development. It is necessary to implement an active policy through increased domestic production, employment, encouraging industry and therefore exports, even at the cost of fiscal and monetary stability. The task of the state is to take the necessary measures, aimed at stimulating entrepreneurial initiative, then encouraging the creation of new jobs, mobilizing all available sources of financing, as well as research and development. Be sure to achieving sustainable growth and development in the Republic of Serbia, it is primarily the abandonment of the neoliberal concept by creating national economic policies that will enable the realization of re-industrialization of the country and faster employment. Full employment should be the primary goal, because in this way provides a stable society. 6. Bibliography [1] Blanchard, O., & Kremer, M. (1997). Disorganization. Quarterly Journal of Economics, Vol. 112, No. 4, pp. 1091-1126. [2] Filipovic S., Raspopovic N., Toskovic J. (2015), Corelation between reforms and foreign debt in transition countries, Journal of sustainable economics (Industrija), Economic Institute, Belgrade, pp. 175–191 [3] Kolodko, G. (1998). Economic neoliberalism became almost irrelevent. Transition, 9(3), World bank, Washington [4] Leković, V. (2001). Correlation of market institutionalization and transition process. Economic Horizons, no. 1-2, pp. 31-42. [5] Lekovic, V., Micic, V. (2013). Needs, Effectiveness and Limitations of the Industrial Polici of Serbia. Industrija, 41(1). [6] Leković V. (2015) The institutions needed to drive economic growth and sustainable development, http://www.ekfak.kg.ac.rs/sites/default/files/download/InstitucionalnePromene2015.pdf [7] Reinert, E. S. (2006). Global economy: How the rich became rich and why the poor become poorer. Belgrade, Serbia: Čigoja printed. [8] Roland, (2000). Transition and Economics. Politics, Markets, and Firms. Cabridge, MA: MIT Press. [9] Tosković J. (2016), Review of the neoliberal concept economy in the Western Balkans, doctoral dissertation, Faculty of Business Economics, University Edukons http://www.educons.edu.rs/sites/default/files/Doktorska%20disertacija_1.pdf Web adress: http://www.siepa.gov.rs/site/en/home/1/investing_in_serbia/liberalized_trade/
217

Annals of the „Constantin Brâncuşi” University of Târgu Jiu, Economy Series, Issue 3/2016
„ACADEMICA BRÂNCUŞI” PUBLISHER, ISSN 2344 – 3685/ISSN-L 1844 - 7007
ROLE OF FINANCIAL SUBSIDIES ALLOCATED BY THE CAP AND OUT
EMIGRATION IN ROMANIAN RURAL AREAS
NICOLA GALLUZZO PHD FOOD SCIENCE ASSOCIAZIONE STUDI GEOGRAFICO-ECONOMICI DELLE AREE
RURALI, e-mail:[email protected]
Abstract
In all European countries there has been a significant emigration from the countryside and this has been particularly intense in some nations after the collapse of Communist regimes. On average every year more than 15.000 Romanian people emigrate to other countries. The purpose of this paper was to investigate by a quantitative approach over the time 2007-2013 the main correlation between the emigration in all Romanian counties and financial supports allocated by the Common Agricultural Policy. The methodology has used a multiple regression model comparing Fixed Effect (FE) panel data to pooled Ordinary Least Square (OLS). Hausman’s test has pointed out as the FE approach has been the best in estimating the parameters of the multiple correlation. Findings have highlighted out a positive correlation between rural emigration and financial payments allocated by the first pillar of the CAP. The impact of financial supports allocated by the second pillar of the CAP has not implied any effects in reducing emigration from Romanian countryside. In general, less favoured rural areas, characterised by a low level of assets and investments have had the highest level of permanent emigration. Summing up, the Rural Development Plan should implement the financial allocation towards rural areas which recently are involved in an intense process of counter-urbanization from urban space. Keywords: permanent emigration, multiple regression model, panel data, Rural Development Plan, counter-urbanization. Clasificare JEL : Q18, R10 1. Introduction
Since the end of the Second World War in all European countries there has been an intense emigration from the
countryside towards the urban space able to offer newly employment opportunities with the consequence to make worse living conditions of population in rural areas [17]. This author has argued as from the 1970s in many states there has been a counter urbanisation with the consequence to generate a new productive model in the countryside correlated to a new idea and a new approach by urban citizens in favour of rural areas; hence, the rural space is being enriched by different significance and intrinsic values. In fact, farmer is able to produce different positive codified and not codified services towards the urban space as a consequence of the transition from a productivist model to a post productivist one [16]-[23]. Recent studies have argued about this latter concept emphasizing by contrast a territorial element or rather a diversification in the agrarian fabric linked to kaleidoscopic and heterogenic rural contexts able to reinforce the multifunctionality in the countryside [26]-[27].
Countries located in a framework of planned economies have not been influenced by rural out emigration phenomenon even if aftermath the collapse of Communist regimes the exodus from the countryside has arisen significantly. In theoretical terms, it is extremely harsh to define a specific role that the Common Agricultural Policy (CAP) has had in contrasting the social-economic dichotomy between rural versus urban spaces [12] and some scholars, by a quantitative approach, have tried to estimate whether there is a nexus between rural emigration and subsidies allocated by the CAP [22]. These authors have highlighted the fundamental role of quantitative methods in order to investigate the strategic function of medium term political choices in reducing rural emigration with different effects in some investigated European countries.
Before the enlargement of the EU the European Commission has financed lots of initiatives by the Sapard, Ispa and Phare programmes aimed at making less traumatic the transition from a planned economy to an open economy in a perspective of the enlargement and the entry in the European Union able in the same time in implementing agrarian enterprises and productive fabric [9].
Over the time 2007-2013 the National Rural Development Plan has been able to support financially throughout specific measures a significant generational turnover in Romanian farms where it is possible to find a new innovative and high skill generation of entrepreneurs at the head of small farms which by the diversification of activities have
218

Annals of the „Constantin Brâncuşi” University of Târgu Jiu, Economy Series, Issue 3/2016
„ACADEMICA BRÂNCUŞI” PUBLISHER, ISSN 2344 – 3685/ISSN-L 1844 - 7007
efficiently stopped out the haemorrhage from the rural areas [10]. In other European countries findings have strengthened the counter-urbanization phenomenon [19]. In particular, in Spanish rural areas some scholars have highlighted as a consequence of counter-urbanization there has been a growth of rural activities in some areas where significant has been the presence of people coming from the urban space [19] looking for a rural idyllic atmosphere in the countryside [4]-[5]-[20]-[21].
According to the estimation published by the European Commission in 2007, almost 2 million of Romanian and Bulgarian people may emigrate leaving definitely poor less favored rural areas even if focusing the attention on the phenomenon of rural out emigration from Romanian countryside is obvious as this latter aspect is sometimes a temporary remover of labour force [17]. The negative consequence of the emigration is to impoverish rural areas reducing lots of opportunities in tourism services and healthcare in order to modernize the primary sector. Kasimis and Papadopoulos in 2005 have highlighted as one of the main effect in transformation in the European countryside by the CAP has been to foster an exodus from the countryside to urban areas with negative impact on the restructuring process in rural areas [18]. 2. Aim of the research
The purpose of this research was to assess main correlations between the variable emigration from Romanian rural areas, using the time series of data published by the Romanian Statistical National Institute (INSEE) since 2007 to 2013, and the financial subsides allocated by the Common Agricultural Policy (first and second pillar) and other economic variables investigated by the Farm Accountancy Data Network.
The European Union in 1965 by the Council Regulation number 79 established an annual analysis on a sample of farmers through a specific in depth investigation called Farm Accountancy Data Network (FADN); the aim of this analysis is to evaluate the impact of Common Agricultural Policy decisions towards European farmers. FADN is an annual survey which covers approximately 80,000 European farms and a population of about 5,000,000 farmers located in all European countries able to represent more than 90% of utilized agricultural area [8]. In this quantitative analysis we have used the data published by the European Union in the Farm Accountancy Data Network (FADN) since 2007 to 2013.
A literature review has pointed out as previous studies have argued as before the MacSharry reform of the CAP, there has been a greater impact of direct payments paid by the first pillar on the income distribution towards European farmers [19]. As a consequence of the enlargement of the EU and due to the respect of WTO rules, there has been a significant shrinking of direct payments to ag-commodities and to farmers as well. By contrast many scholars have argued that direct payments have been more efficient than other typologies of financial aids provided by the CAP even if the amount of supports has had an unequal distribution among countries because of the small size of agrarian surface of farms [25]. This latter aspect assumes a pivotal role in poorest rural areas in new comers member states of the European Union[6]. Focusing our attention on the Romanian rural spaces more than 70% of agricultural enterprises are classified as subsistence and semi-subsistence farms, due to poor agricultural areas, and towards them the fundamental are the financial subsidies allocated by the second pillar of the CAP able to support their role of public goods in producing positive externalities and in reducing socio-economic marginalization of rural areas [10]-[11]-[15]. 3. Methodology
Using a quantitative approach and different source of data from 2007 to 2013 such as FADN dataset and annual results of demographic statistics in order to evaluate the permanent emigration from rural areas published by the INSSE in TEMPO on line lime series, the paper has estimated by a multiple regression model the main relationships among financial supports allocated by the first and second pillar of the CAP and rural out emigration.
The multiple regression has estimated the parameters using a panel data approach which is a good tool to reduce and to explain the heterogeneity in units of observation over the time [13]. This latter methods is pivotal to analyse the most significant changes during the time of study in all Romanian counties, estimating effects inside and outside different set or clusters of administrative units using the main information within and between groups and reducing consequently the statistical error term [2] [3].
Roughly speaking, a linear model of regression can be written as [2]-[13]:
yit = xitβ + ci + zi + eit (1) i=1...N in terms of units, t=1...T in terms of time of investigation
In the above mentioned formula β is a vector k×1 dimension made by β1, β2…βk parameters and xit is a vector
1×k dimension of explanatory independent variables refer to the time of observation. The term ci is a not observed component or rather an unobserved heterogeneity, specially whether i is an individual it takes the name of individual effect or individual heterogeneity. The term ci in the equation is able to generate a correlation between yit and yis even
219
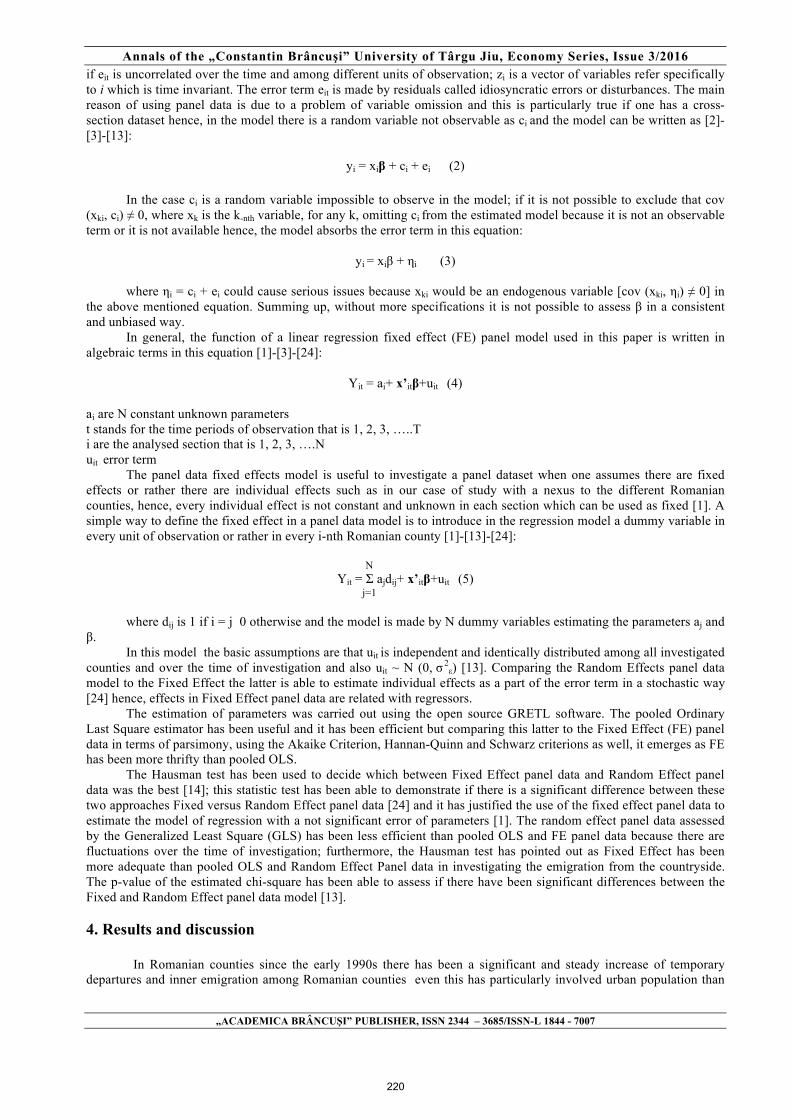
Annals of the „Constantin Brâncuşi” University of Târgu Jiu, Economy Series, Issue 3/2016
„ACADEMICA BRÂNCUŞI” PUBLISHER, ISSN 2344 – 3685/ISSN-L 1844 - 7007
if eit is uncorrelated over the time and among different units of observation; zi is a vector of variables refer specifically to i which is time invariant. The error term eit is made by residuals called idiosyncratic errors or disturbances. The main reason of using panel data is due to a problem of variable omission and this is particularly true if one has a cross-section dataset hence, in the model there is a random variable not observable as ci and the model can be written as [2]-[3]-[13]:
yi = xiβ + ci + ei (2)
In the case ci is a random variable impossible to observe in the model; if it is not possible to exclude that cov
(xki, ci) ≠ 0, where xk is the k-nth variable, for any k, omitting ci from the estimated model because it is not an observable term or it is not available hence, the model absorbs the error term in this equation:
yi = xiβ + ηi (3)
where ηi = ci + ei could cause serious issues because xki would be an endogenous variable [cov (xki, ηi) ≠ 0] in
the above mentioned equation. Summing up, without more specifications it is not possible to assess β in a consistent and unbiased way.
In general, the function of a linear regression fixed effect (FE) panel model used in this paper is written in algebraic terms in this equation [1]-[3]-[24]:
Yit = ai+ x’itβ+uit (4)
ai are N constant unknown parameters t stands for the time periods of observation that is 1, 2, 3, …..T i are the analysed section that is 1, 2, 3, ….N uit error term
The panel data fixed effects model is useful to investigate a panel dataset when one assumes there are fixed effects or rather there are individual effects such as in our case of study with a nexus to the different Romanian counties, hence, every individual effect is not constant and unknown in each section which can be used as fixed [1]. A simple way to define the fixed effect in a panel data model is to introduce in the regression model a dummy variable in every unit of observation or rather in every i-nth Romanian county [1]-[13]-[24]:
N
Yit = Σ ajdij+ x’itβ+uit (5) j=1 where dij is 1 if i = j 0 otherwise and the model is made by N dummy variables estimating the parameters aj and
β. In this model the basic assumptions are that uit is independent and identically distributed among all investigated
counties and over the time of investigation and also uit ~ N (0, σ 2ε) [13]. Comparing the Random Effects panel data
model to the Fixed Effect the latter is able to estimate individual effects as a part of the error term in a stochastic way [24] hence, effects in Fixed Effect panel data are related with regressors.
The estimation of parameters was carried out using the open source GRETL software. The pooled Ordinary Last Square estimator has been useful and it has been efficient but comparing this latter to the Fixed Effect (FE) panel data in terms of parsimony, using the Akaike Criterion, Hannan-Quinn and Schwarz criterions as well, it emerges as FE has been more thrifty than pooled OLS.
The Hausman test has been used to decide which between Fixed Effect panel data and Random Effect panel data was the best [14]; this statistic test has been able to demonstrate if there is a significant difference between these two approaches Fixed versus Random Effect panel data [24] and it has justified the use of the fixed effect panel data to estimate the model of regression with a not significant error of parameters [1]. The random effect panel data assessed by the Generalized Least Square (GLS) has been less efficient than pooled OLS and FE panel data because there are fluctuations over the time of investigation; furthermore, the Hausman test has pointed out as Fixed Effect has been more adequate than pooled OLS and Random Effect Panel data in investigating the emigration from the countryside. The p-value of the estimated chi-square has been able to assess if there have been significant differences between the Fixed and Random Effect panel data model [13]. 4. Results and discussion
In Romanian counties since the early 1990s there has been a significant and steady increase of temporary departures and inner emigration among Romanian counties even this has particularly involved urban population than
220
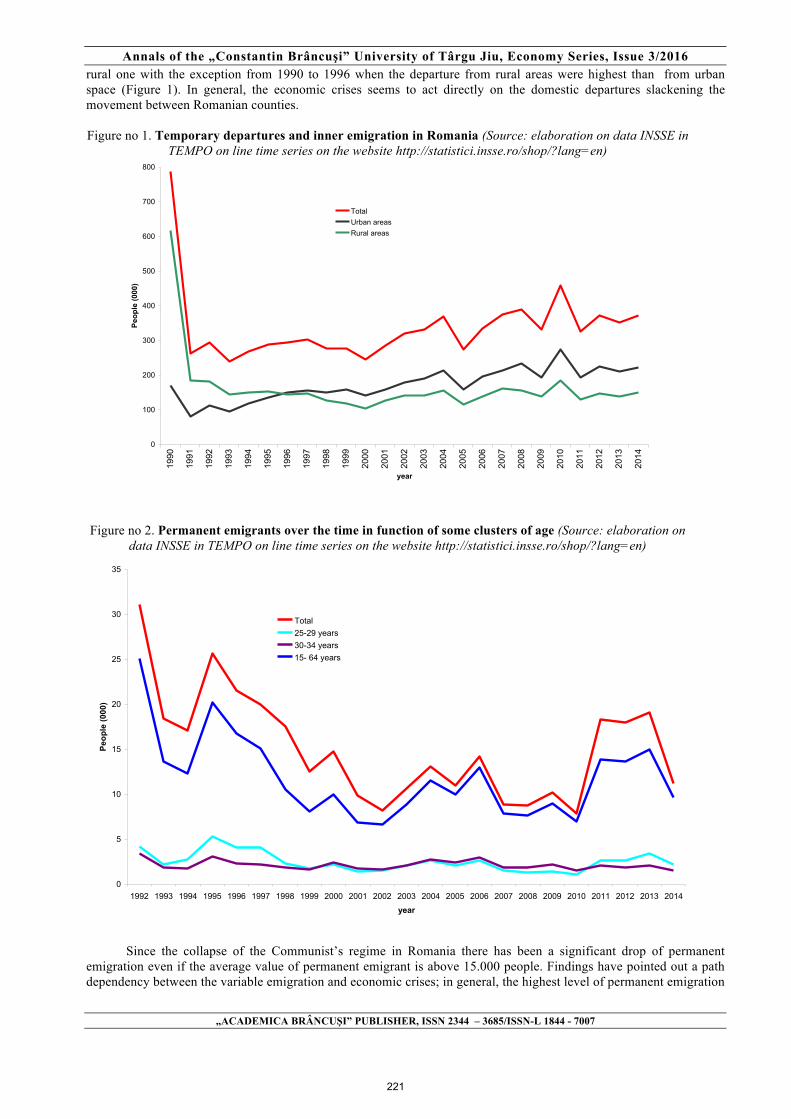
Annals of the „Constantin Brâncuşi” University of Târgu Jiu, Economy Series, Issue 3/2016
„ACADEMICA BRÂNCUŞI” PUBLISHER, ISSN 2344 – 3685/ISSN-L 1844 - 7007
rural one with the exception from 1990 to 1996 when the departure from rural areas were highest than from urban space (Figure 1). In general, the economic crises seems to act directly on the domestic departures slackening the movement between Romanian counties. Figure no 1. Temporary departures and inner emigration in Romania (Source: elaboration on data INSSE in
TEMPO on line time series on the website http://statistici.insse.ro/shop/?lang=en)
0
100
200
300
400
500
600
700
80019
90
1991
1992
1993
1994
1995
1996
1997
1998
1999
2000
2001
2002
2003
2004
2005
2006
2007
2008
2009
2010
2011
2012
2013
2014
year
Peop
le (0
00)
TotalUrban areasRural areas
Figure no 2. Permanent emigrants over the time in function of some clusters of age (Source: elaboration on
data INSSE in TEMPO on line time series on the website http://statistici.insse.ro/shop/?lang=en)
0
5
10
15
20
25
30
35
1992 1993 1994 1995 1996 1997 1998 1999 2000 2001 2002 2003 2004 2005 2006 2007 2008 2009 2010 2011 2012 2013 2014
year
Peop
le (0
00)
Total25-29 years30-34 years15- 64 years
Since the collapse of the Communist’s regime in Romania there has been a significant drop of permanent emigration even if the average value of permanent emigrant is above 15.000 people. Findings have pointed out a path dependency between the variable emigration and economic crises; in general, the highest level of permanent emigration
221

Annals of the „Constantin Brâncuşi” University of Târgu Jiu, Economy Series, Issue 3/2016
„ACADEMICA BRÂNCUŞI” PUBLISHER, ISSN 2344 – 3685/ISSN-L 1844 - 7007
have involved predominately active Romanian population in the range of age 15-64 year (Figure 2). By contrast, an uneven swing has been assessed in two clusters of people in the class of age 25-29 and 30-34 years with the first group of people predominating since 1992 to 1999 and from 2010 to 2014 in the permanent emigration phenomenon than in the cluster 30-34 year.
Analysing in depth the evolution of emigration in all Romanian counties calculating the increment ratio between emigration in 1990 as base value and emigration in 2014, Arad and Botosani have pointed out the highest value of emigration in a range which runs from 36% to 39% (Figure 3); by contrast, the lowest value of inner emigration growth among countries has been assessed in 5 Romanian counties such as Bihor, Salaj, Sautu Mare, Maramures and Dolj.
Figure no 3. Evolution of temporary inner emigration in Romanian counties comparing 2014 over 1990 (Source: elaboration on data INSSE in TEMPO on line time series on the website
http://statistici.insse.ro/shop/?lang=en elaboration by GeoDa 1.6.7)
Table no 1. Main correlations in some economic variables (Source: elaboration on data INSSE in TEMPO on line time series on the website http://statistici.insse.ro/shop/?lang=en and FADN dataset on the website
http://ec.europa.eu/agriculture/rica/database/database_en.cfm) Emigration Workforce Farms UAA FNI Assets Investments I pillar II pillar Emigration 1.00 Workforce 0.3943* 1.00 Farms -0.4192* -0.2150 1.00 UAA 0.2298 0.0678 -0.4911* 1.00 FNI 0.3886* 0.1934 -0.5556* 0.4059* 1.00 Assets 0.4995* 0.5500* -0.6308* 0.4462* 0.4494* 1.00 Investments -0.0357 0.0759 -0.2796* 0.3024* 0.1325 0.4257* 1.00 I pillar 0.3585* 0.1285 -0.5527* 0.6649* 0.5170* 0.5553* 0.4112* 1.00 II pillar 0.3042* 0.3729* -0.5150* 0.6032* 0.5258* 0.3579* 0.2235 0.6699* 1.00 * significant at 5%
Using the FADN dataset, the correlation among different variables (Table 1), estimated using the Spearman correlation with a significant level at 5%, such as emigration, workforce in the primary sector, farms, utilized agricultural area (UAA), farm net income (FNI), total asset (Assets), net investments (Investments), financial subsidies allocated by the first pillar of the Cap (I pillar) and financial subsidies allocated for the rural development by the II pillar of the CAP (II pillar), has pointed out as the emigration correlates directly with the agricultural areas, level of assets, workforce employed in the primary sector and with the financial subsidies allocated both by the first pillar and also by the second pillar of the CAP. By contrast, poorer are the level of investments and farm higher is the permanent
222

Annals of the „Constantin Brâncuşi” University of Târgu Jiu, Economy Series, Issue 3/2016
„ACADEMICA BRÂNCUŞI” PUBLISHER, ISSN 2344 – 3685/ISSN-L 1844 - 7007
emigration from Romanian counties. Focusing the analysis on the payments allocated by the CAP in its first and second pillar, results have highlighted a direct nexus of these subsidies to the agrarian capital, in terms of agricultural surface, level of investments and farm net income. Summing up, small farms with a poor endowment in machinery and circulating capital tend to receive an inadequate level of financial aids.
Findings in multiple regression model estimated by pooled OLS have pointed out as financial subsidies allocated by the II pillar of the CAP have not a nexus to dependent variable emigration whereas the all financial subsidies allocated by the first and second pillar of the Common Agricultural Policy have correlated positively to the emigration (Table 2). By contrast, net investments and total farming costs correlate indirectly to the dependent variable emigration hence, a low level of costs or, ceteris paribus, poor investments in Romanian farms have acted on an higher level of out emigration from the countryside. This has corroborated the theoretical framework, according to which, emigration is a downside of less favored areas characterised by low levels on investments and a poor technical-economic efficiency. The variable Farm Net Income has not had any relationships on the emigration instead assets correlates directly to the emigration. The values of R2 and adjusted R2 have been lower than these pointed out in the Fixed Effect panel data which has implied as the panel data model fits well to our analysis. Furthermore, other specification tests have highlighted as the errors are distributed normally and heteroscedasticity does not exist both in pooled OLS and also in Fixed Effect panel data. The Fixed Effect panel data has pointed out and corroborated findings assessed in the pooled OLS even if the independent variable farm net income correlates directly with the variable emigration (Table 2); hence, a low level of income in Romanian farms has implied a poor level of emigration due to a consolidated and stable process of emigration in previous years which does not supply new emigration flows. Table no 2. Main results in multiple regression model over the time 2007-2013 (Source: elaboration on data INSSE in TEMPO on line time series on the website http://statistici.insse.ro/shop/?lang=en and FADN dataset on the website
http://ec.europa.eu/agriculture/rica/database/database_en.cfm) Pooled OLS Fixed Effects
Variable Coefficient Standard error Significance Coefficient Standard
error Significance
Constant 1094,24 377.53 *** 563,85 384,714 n.s. Total farming costs -0,679 0,024 *** -0,627 0,096 ***
Farm Net Income 0,035 0,029 n.s. 0,073 0,0326 ** Total assets 0,012 0,0003 *** 0,014 0,0011 *** Net Investments -0,229 0,061 *** -0,218 0,0851 ** CAP total subsidies 0,523 0,088 *** 0,506 0,131 ***
CAP II pillar 0,014 0,152 n.s. 0,123 0,204 n.s. R2 0,80 0,90 Adj. R2 0,78 0,87 n.s. not significance; *** <1%; ** 5% 5. Conclusions
Over the time of investigation all Romanian counties have pointed out a sharply emigration even if lots of people move predominately from disadvantaged and less favoured rural areas to urban territories in order to find more convenient job opportunities. Many farms scattered in Romanian rural areas are managed by female entrepreneurs; all this linked to the aging issues of farmers, not only in Romania but in many European rural territories as well, is a negative aspect that strengthens emigration from the countryside. The European Union by the allocation of specific funds such as less favored subsidies, which in Romanian countryside has not produced completely the expected effects, and in particular by the Single Area Payments, which is considered one of the most important financial tool in supporting Romanian farmers, has tried to lessen the out emigration from the countryside.
For the future it is important to allocate more financial resources towards farmers, in particular to young entrepreneurs, in order to stimulate a generation turnover and an implementation of agrarian capital, in terms of usable agricultural areas, able to implement the technical and economic efficiency in Romanian farms. A good endowment of public services and health care are two pivotal priorities in reducing the emigration from the countryside but in this context of economic downturn and budget constraints in the European public finance, few public authorities have addressed their attention and invested in a process of countryside protection. For these reasons next actions and financial initiatives in the rural development programming should be based on a tightly collaboration between public authorities and farmers aimed at planning an holistic rural development plan able to protect the rural space stimulating a counter-urbanization able to bring back urban people who are looking for a place close to urban areas but characterised by specific amenities and public services. The bottleneck of counter-urbanization should be set up by an
223

Annals of the „Constantin Brâncuşi” University of Târgu Jiu, Economy Series, Issue 3/2016
„ACADEMICA BRÂNCUŞI” PUBLISHER, ISSN 2344 – 3685/ISSN-L 1844 - 7007
intense process of return that could produce more negative impacts in terms of an excessive exploitation of environment resources and positive externalities in the countryside; then, the process of rural space planning has to involve rural stakeholders in a bottom-up approach that seems only a theoretical concept instead of a real pillar in the process of an integrated and holistic path of rural development in many European rural areas 6. Bibliography [1] Asteriou D., Hall S.G. (2011). Applied Econometrics. New York: Palgrave Macmillian. [2] Baltagi B.H. (2009). A companion to Econometric analysis of panel data. Chichester: Willey. [3] Baltagi B.H. (2011). Econometrics. Berlin, Heidelberg: Springer-Verlag. [4] Bell D. (2006). Variations on the rural idyll. In: Handbook of rural studies (Eds: Cloke P., Marsden T., and Mooney P. Thousand Oaks: SAGE publishing, 149-160. [5] Bijker R.A., and Haartsen T. (2012). More than counter-urbanisation: Migration to popular and less-popular rural areas in the Netherlands. Population, Space and Place, 18(5), 643-657. [6] Davidova S., Fredriksson L. and Bailey A. (2009). Subsistence and semi-subsistence farming in selected EU new member states, Agricultural Economics, 40(1), 733-744. [7] European Commission (2007). Agriculture in the European Union- Statistical and economic. Available at http://europa.eu/index_it.htm [8] European Commission Agriculture and Rural Development (2014). Concept of FADN, available at http://www.ec.europa.eu/agriculture/rica/concept_en.cfm., accessed 2016 May 1. [9] Galluzzo N. (2011). I fondi di pre-adesione nei Paesi Europei Centro Orientali: una breve analisi. Ariccia: Ermes servizi editoriali integrati. [10] Galluzzo N. (2016). Analysis of subsidies allocated by the common agricultural policy and cropping specialization in Romanian farms using FADN dataset, Scientific Papers Series Management, Economic Engineering in Agriculture and Rural Development, 16(1), 157-164. [11] Giurca D. (2008). Semi-subsistence farming–prospects for the small Romanian farmer to choose between a “way of living” or efficiency, Agricultural Economics and Rural Development, 5(3-4), 215-230. [12] Gray J. (2000). The Common Agricultural Policy and the re-invention of the rural in the European Community, Sociologia ruralis, 40(1), 30-52. [13] Gujarati D. (2011). Econometrics by example. New York: Palgrave Macmillan. [14] Hausman J. (1978). Specification Tests in Econometrics, Econometrica, 46, 1251-1271. [15] Hubbard C., Mishev P., Ivanova N. and Luca L. (2014). Semi-subsistence Farming in Romania and Bulgaria: a Survival Strategy?, EuroChoices, 13, 46–51. [16] Ilbery B. W. (ed.) (1998). The Geography of Rural Change. Essex: Pearson Prentice Hall. [17] Kasimis C. (2010). Demographic Trends in rural Europe and international migration to rural areas, Agriregionieuropa, 21(6), 1-6. [18] Kasimis C. and Papadopoulos A.G. (2005). The multifunctional role of migrants in the Greek countryside: implications for the rural economy and society, Journal of Ethnic and Migration Studies, 31(1), 99-127. [19] Keeney M. (2000). The Distributional Impact of Direct Payments on Irish Farm Incomes, Journal of Agricultural Economics, 51, 252-265. [20] Paniagua A. (2002). Urban-rural migration, tourism entrepreneurs and rural restructuring in Spain, Tourism geographies, 4(4), 349-371. [21] Shor, B. (2006). Idyllic ruralities. In: Handbook of rural studies (Eds: Cloke P., Marsden T., and Mooney P. Thousand Oaks: SAGE publishing, 133-148. [22] Tocco B., Davidova S. and Bailey A. (2014). The Impact of CAP Payments on the Exodus of Labour from Agriculture in Selected EU Member States. In 142nd EAAE Seminar, May 29-30, 2014, Budapest, Hungary. [23] Van der Ploeg J. D., A. Long and J. Banks (2002). Living Countrysides; Rural Development Processes in Europe: the State of the Art. Doetinchem: Elsevier EBI. [24] Verbeek M. (2006). Econometria. Bologna: Zanichelli. [25] Von Witzke H., Noleppa S. (2006). Distributive effects of direct payments in German agriculture under the new Common Agricultural Policy of the European Union. German Marshall Found. Paper Series available at the website www.gmfus.org/publications/index.cfm. [26] Wilson G.A. (2001). From productivism to post-productivism … and back again? Exploring the (un)changed natural and mental landscapes of European agriculture, Transactions of the Institute of British Geographers, 26, 77-102. [27] Wilson G.A. (2008). From ‘weak’to ‘strong’multifunctionality: conceptualising farm-level multifunctional transitional pathways, Journal of rural studies, 24(3), 367-383.
224

Annals of the „Constantin Brâncuşi” University of Târgu Jiu, Economy Series, Issue 3/2016
„ACADEMICA BRÂNCUŞI” PUBLISHER, ISSN 2344 – 3685/ISSN-L 1844 - 7007
TOTAL REVENUE - TOTAL EXPENDITURE INTERDEPENDENCE
FOR A HOUSEHOLD IN ROMANIA
SAVU MIHAELA
PHD READER
VOICU OANA-LUMINIȚA PHD READER
CONSTANTIN BRÂNCOVEANU UNIVERSITY, PITEŞTI, ROMANIA [email protected]
Abstract:
The consumers’ various and constantly dynamic needs are met by the consumers through the consumption of goods and services. Achieving prosperity and continuously raising the living standards are obvious desires of people in today’s society. The possibility to quantify the standard of living is achieved through consumption or rather through the total expenditure made in a household. So, naturally, in this paper we wish to highlight the relationship between the total revenue and the total expenditure specific to a household in Romania. For the period 2010 – 2014 in our country the total expenditure recorded a growth rate faster than the total revenue. Between the two indicators there is a very strong relation and its meaning is positive, thus the total revenue obviously influences the total expenditure. Keywords: total revenues, total expenditure, consumer, chronological series J.E.L. Code: D00, E00 1. Introduction
Consumption is the final act of people’s action, the act which allows them to satisfy their needs, which are in constant development, by using various goods or services offered by the producers.
The diversity of the offer meets the consumers’ needs, needs that are varied and in continuous development. The current period is characterised by encouraging overconsumption by all possible means, so that the consumer is facing some paradoxical messages: on the one hand, he/she is driven to consume more and more under the pressure of advertising, and on the other hand, he/she is constrained by the standards of fashion to remain slim (Popescu, Voinea and Negrea, 2015). This causes the consumer to think, to choose what he/she wants, not necessarily what is good or healthy to consume. This way a great deal of the revenue is directed towards consumption by the expenses made.
The relationship between income and consumption has been analysed by a number of economists, the most representative being J. M. Keynes, who set a psychological law, called the law of Keynes. It states that an increase or a reduction in the income causes an increase or a reduction in consumption, but to a lesser extent (Ciucur D., Scurtu M. et al, 2010). Checking this law becomes interesting under the current conditions of the Romanian economy.
In the context of the conditions specific to our country, the social – human purpose of the economic functioning is a necessary requirement (Ciucur D., 2016) for improving life quality. Any consumer wants to improve the quality of his/her life through the goods and services consumed.
This paper aims to analyse the evolution of the total revenue and total expenditure specific to a Romanian household, as well as the link between the two indicators. To this end, we have identified the following objectives:
• O1 – Identifying the total revenues and total expenses. • O2 – Presenting the evolution of the total revenue and total expenditure for a 5-year period. • O3 – Analysis of the correlation between total revenue and total expenditure.
The hypotheses we start from in our research are: • I1 – The total revenues grow faster than the total expenditure. • I2 – There is a positive correlation between the total revenue and the total expenditure. • I3 –The intensity of the relationship between the total revenue and the total expenditure is strong.
Identifying the total revenues and the total expenditure is made at the level of a household in our country. The values recorded by the two indicators are the official values shown in the publication: Romania in figures 2015, published by the National Statistics Institute.
225
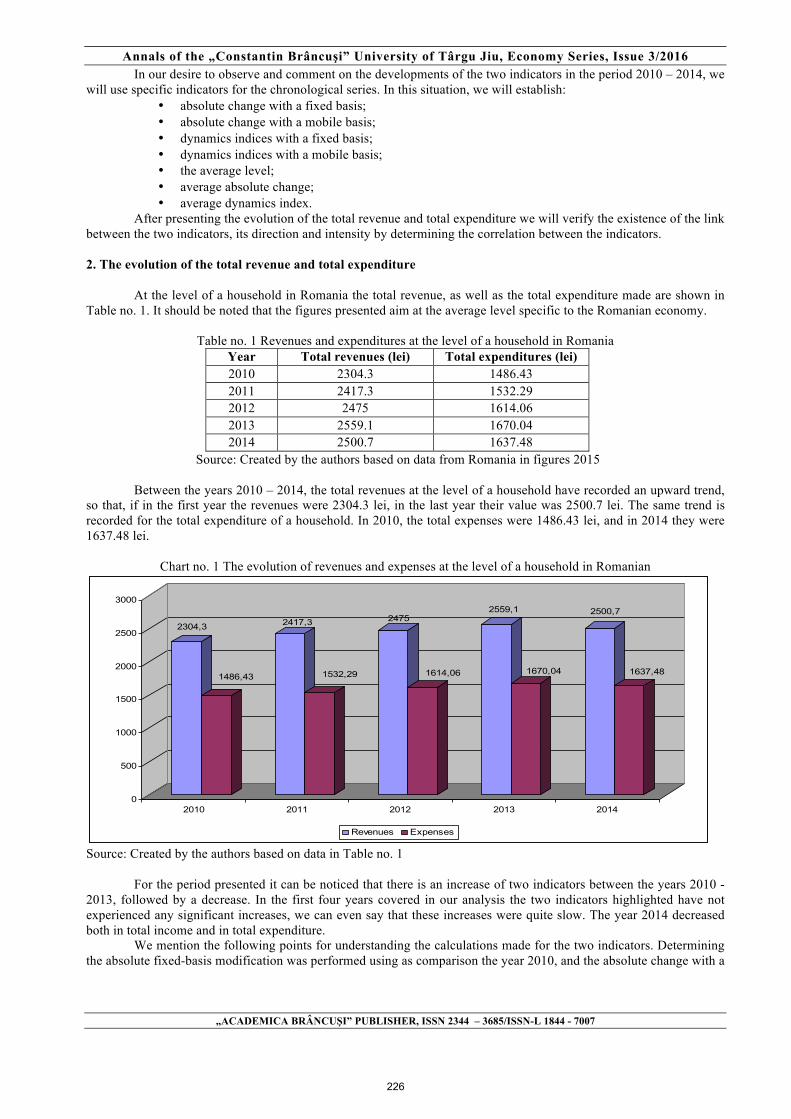
Annals of the „Constantin Brâncuşi” University of Târgu Jiu, Economy Series, Issue 3/2016
„ACADEMICA BRÂNCUŞI” PUBLISHER, ISSN 2344 – 3685/ISSN-L 1844 - 7007
In our desire to observe and comment on the developments of the two indicators in the period 2010 – 2014, we will use specific indicators for the chronological series. In this situation, we will establish:
• absolute change with a fixed basis; • absolute change with a mobile basis; • dynamics indices with a fixed basis; • dynamics indices with a mobile basis; • the average level; • average absolute change; • average dynamics index.
After presenting the evolution of the total revenue and total expenditure we will verify the existence of the link between the two indicators, its direction and intensity by determining the correlation between the indicators. 2. The evolution of the total revenue and total expenditure
At the level of a household in Romania the total revenue, as well as the total expenditure made are shown in Table no. 1. It should be noted that the figures presented aim at the average level specific to the Romanian economy.
Table no. 1 Revenues and expenditures at the level of a household in Romania
Year Total revenues (lei) Total expenditures (lei) 2010 2304.3 1486.43 2011 2417.3 1532.29 2012 2475 1614.06 2013 2559.1 1670.04 2014 2500.7 1637.48
Source: Created by the authors based on data from Romania in figures 2015
Between the years 2010 – 2014, the total revenues at the level of a household have recorded an upward trend, so that, if in the first year the revenues were 2304.3 lei, in the last year their value was 2500.7 lei. The same trend is recorded for the total expenditure of a household. In 2010, the total expenses were 1486.43 lei, and in 2014 they were 1637.48 lei.
Chart no. 1 The evolution of revenues and expenses at the level of a household in Romanian
2304,3
1486,43
2417,3
1532,29
2475
1614,06
2559,1
1670,04
2500,7
1637,48
0
500
1000
1500
2000
2500
3000
2010 2011 2012 2013 2014
Revenues Expenses
Source: Created by the authors based on data in Table no. 1
For the period presented it can be noticed that there is an increase of two indicators between the years 2010 - 2013, followed by a decrease. In the first four years covered in our analysis the two indicators highlighted have not experienced any significant increases, we can even say that these increases were quite slow. The year 2014 decreased both in total income and in total expenditure.
We mention the following points for understanding the calculations made for the two indicators. Determining the absolute fixed-basis modification was performed using as comparison the year 2010, and the absolute change with a
226

Annals of the „Constantin Brâncuşi” University of Târgu Jiu, Economy Series, Issue 3/2016
„ACADEMICA BRÂNCUŞI” PUBLISHER, ISSN 2344 – 3685/ISSN-L 1844 - 7007
mobile basis presents the evolution of the analysed indicator from year to year. Likewise the dynamic indices with fixed basis and mobile basis were calculated.
Table no. 2 The dynamics of total revenues in Romania
Year Total
revenues
Absolute change with fixed basis
Absolute change with mobile basis
Dynamics index with fixed-basis
Dynamics index with mobile basis
2010 2304.3 0 - 1.00 - 2011 2417.3 113 113 1.05 1.05 2012 2475 170.7 57.7 1.07 1.02 2013 2559.1 254.8 84.1 1.11 1.03 2014 2500.7 196.4 -58.4 1.09 0.98
Source: Created by the authors based on data in Table no. 1
From Table no. 2 we can see that the total revenues increased in 2011 as compared to 2010 with 113 lei. Compared to the first year, they increased by 170.7 lei in 2012. The year 2013 recorded the highest increase in the total revenues reaching 254.8. In 2014, the growth was only of 196.4 lei. The absolute changes with mobile basis recorded values that were different in each of the four years, so the biggest increase was of 113 lei in 2011, and the last year yielded a decrease of 58.4 lei.
The dynamic fixed-basis indices show the slow growth that characterised the total income of a household in Romania. The total revenues increased by 1.11 times as compared to 2010 in 2013. The next increase was the one achieved in the last year, when the indicator was 1.09 times higher than that considered a basis for comparison. The dynamic mobile-basis indices have values significantly lower than those with fixed basis. Thus, the total revenues were 1.05 times higher in 2011 as compared to 2010. In 2012 the total revenues were 1.02 higher than the previous year; in 2013 they were 1.03 higher as compared to 2012. In 2014, the index calculated showed the decrease recorded, the result being of 0.98. If we look at the results in percentages, we can say that in 2014 the total revenues decreased by 2% as compared to 2013.
The calculations made for the total revenue were repeated for the total expenditure, so that we see whether there are differences between the developments in the two indicators.
Table no. 3 Dynamics of total expenditure in Romania
Year Total revenues
Absolute change with fixed basis
Absolute change with mobile basis
Dynamics index with fixed-basis
Dynamics index with mobile basis
2010 1486.43 0 - 1 - 2011 1532.29 45.86 45.86 1.03 1.03 2012 1614.06 127.63 81.77 1.09 1.05 2013 1670.04 183.61 55.98 1.12 1.03 2014 1637.48 151.05 -32.56 1.10 0.98
Source: Created by the authors based on data in Table no. 1
The total expenditure increased by 45.86 lei in 2011 as compared to the previous year. In 2012 it rose by 127.63 lei as compared to 2010. The largest increase was recorded in the year 2013 as compared to the year considered basis for comparison, being of 183.61 lei. In 2014 the total expenses increased by 151.05 lei as compared to 2010. The absolute change with mobile basis, shows us that just as in the case of the total revenues, the total expenditures decreased in the last year. This decrease was of 32.56 lei as compared to the previous year. The largest increase was of 81.77 lei, recorded in 2012 (as compared with 2011).
The dynamic fixed-basis indices showed the highest growth of 1.12 times in the year 2013. The smallest increase was recorded in 2011, being of 1.03 times. The mobile basis indices showed similar values, the highest growth was of 5% in 2012 as compared with 2011. In 2014, the indicator decreased by 2%, as in the case of the reduction calculated for the total revenue.
Along with the previously calculated absolute and relative indicators, the average indicators specific to the chronological series will be established because they give a clearer picture for commenting on the developments of the total revenues and total expenses.
On average, for the period under review, the value of the total income obtained in Romania was of 2451.28 lei. The average absolute change was of 49.10 lei showing that in the five years analysed there was an increase in absolute
227

Annals of the „Constantin Brâncuşi” University of Târgu Jiu, Economy Series, Issue 3/2016
„ACADEMICA BRÂNCUŞI” PUBLISHER, ISSN 2344 – 3685/ISSN-L 1844 - 7007
value. The dynamic average index was of 1.0206 which shows that the average amount of the total revenues increased from one year to another by 1.0206 times.
Table no. 4 The average indicators specific to the chronological series Indicator Average level (lei) Absolute average
change (lei) Dynamic average
index Total revenues 2451.28 49.10 1.0206
Total expenditure 1588.06 37.76 1.0244 Source: Created by the authors based on data in Table no. 1
The average value of the total expenditure obtained in Romania was of 1588.06 lei. The average absolute change was of 37.76 lei, showing that in the five years analysed there was an increase in absolute value of the indicator. The dynamic average index was 1.0244, which shows that the average value of the total expenditure increased from one year to another by 1.0244 times.
For the period under review the total revenue increased on average by 2.06%, while the total expenses increased on average by 2.44%. One can notice that there is a higher increase in the overall expenses as compared to the total revenue.
Hypothesis 1 – The total revenues grow faster than the total expenditure – it is not true at the level of a household in Romania. For the period analysed, 2010 – 2014, the total expenditure increased, on average, more than the total revenue. For the Romanian economy, Keynes’s law does not apply to the period analysed.
Observing the relationship between the total revenue and the total expenditure in the Romanian economy involves, in the first phase, establishing a connection between the two indicators and then establishing the intensity and direction of the relationship. In establishing the existence of the relationship between the total revenue and the total expenditure we use the spreadsheet programme Excel, the Data Analysis module. The result of using this programme is highlighted in table no. 5.
Table no. 5 Results Table – the statistical correlation method
Source: Created by the authors based on data in Table no. 1
The values shown in Table no. 1 demonstrate that between the two variables there is a positive correlation, because the result is positive. Thus, between the total revenue and the total expenditure there is a link, it only remains to establish its intensity.
Hypothesis 2 - There is a positive correlation between the total revenue and the total expenditure – it is true for the Romanian economy for the period under review.
The value of 0.9738 allows us to see that between the two variables there is a strong intensity link. This shows that the income level influences very strongly (relatively deterministic) the level of expenses made in a household in Romania. The very strong link identified between the total revenue and the total expenditure was also established (Haiduc, Anghelina, 2009) for the period 1996-2005.
Hypothesis 3 – The intensity of the relationship between the total revenue and the total expenditure is very strong was confirmed by the calculations performed.
3. Conclusions
Welfare appears as an optimum state to which people aspire, through their own personal and rational manner to produce, save and consume (Ciucur D., 2016) and which provides the basis for the physical and intellectual development. The consumption of goods and services is an essential condition of human existence and at the same time it involves the making of expenditure for purchasing the goods desired.
For the Romanian economy, in the period 2010 - 2014, both the total revenue and the total expenditure recorded an upward trend. Despite this, the growth of the total expenditures was higher than that of the total revenues, so that by making reference to the period we have analysed the statement of Keynes’s psychological the law is not respected.
However, between the two indicators there is a very strong and positive relationship, which means that the total revenues significantly influence the total expenditure. The existence of such a strong relationship is explained by the fact that the total revenues are the source for making the expenditure.
Total revenue Total expenditure Total revenue 1 Total expenditure 0.973888162 1
228
Annals of the „Constantin Brâncuşi” University of Târgu Jiu, Economy Series, Issue 3/2016
„ACADEMICA BRÂNCUŞI” PUBLISHER, ISSN 2344 – 3685/ISSN-L 1844 - 7007
In a household in Romania the growth rate of the total expenditure is higher than the growth rate of the total revenues, which means a lower tendency towards saving for Romanians in the period under review, caused by the fact that the average income level is not a high one. The strong influence of the total expenditures on the total revenues shows that an increase in the expenditure should be preceded by an increase in the revenue if we desire to maintain the consumption level for a certain period of time, without resorting to loans or savings. In this case, the Romanians’ intention to increase consumption must be supported by actions that aim to increase revenues.
4. References [1] Ciucur D., 2016, Funcționarea economică adecvată [Proper Economic Functioning], Editura ASE, București, pp. 103, 108 [2] Ciucur D., Scurtu M. (coord.), 2010, Macroeconomie [Macroeconomics], Editura Independența Economică, Pitești, p. 52 [3] Haiduc C., Anghelina A., 2009, Corelația venituri – consum în cadrul economiei românești [The Income - Consumption Correlation in the Romanian Economy], Studia Universitatis “Vasile Goldiș”, Seria Științe Economice [Economics Series], Partea a II-a [2nd part], Arad, p.66 [4] Keynes J.M., 2009, Teoria generală a ocupării forţei de muncă, a dobânzii şi a banilor [General Theory of Employment, Interest and Money], Editura Publica, Bucureşti [5] Popescu, D.V., Voinea, L. and Negrea, M.T., 2015, Nutritional imbalance – dominant consumption behaviour of young people from Romania. Amfiteatru Economic, 17 (Special No. 9), pp. 872-886 [6] România în cifre 2015 [Romania in figures 2015], http://www.insse.ro/cms/files/publicatii/Romania_in_cifre_2015final.pdf
229

Annals of the „Constantin Brâncuşi” University of Târgu Jiu, Economy Series, Issue 3/2016
„ACADEMICA BRÂNCUŞI” PUBLISHER, ISSN 2344 – 3685/ISSN-L 1844 - 7007
THE TAX POLICY WITHIN THE EUROPEAN UNION: CONCEPTS, INSTITUTIONS,
TRENDS AND CHALLENGES
CRISTINA COJOCARU (BOROVINA) PH. D STUDENT
UNIVERSITY OF ECONOMIC STUDIES, BUCHAREST FACULTY OF THEORETICAL AND APPLIED ECONOMICS BUCHAREST, ROMANIA
RALUCA ELENA MOISESCU (DUICAN) PH. D STUDENT UNIVERSITY OF ECONOMIC STUDIES, BUCHAREST
FACULTY OF THEORETICAL AND APPLIED ECONOMICS BUCHAREST, ROMANIA [email protected] Abstract
At the basis of conceiving the tax policy of an European Union member state, one must consider, on the one hand, fulfilling the government's own requirements, and on the other hand, achieving the objectives set by the EC Treaty. At present, the European Union has a quite harmonized and coordinated tax policy in the indirect taxes field, and partially in the direct taxes field, based on the free movement principle of goods, services, capital and labour; thus, although the member states have the freedom to set operation rules of their own national tax systems, this freedom is conditioned by the compliance with the priority objectives of the founding treaties of the European Union. The member states should avoid adopting discriminating tax measures (which could lead to a disadvantageous treatment for the persons, goods and services or capitals coming from other member states). Sometimes, the restrictions regarding free movement on the internal market are generated by the differences between the national tax systems, so that a certain degree of tax harmonization at the European Union level is necessary. The tax harmonization can be achieved either spontaneously (by means of the forces of the market), by means of active actions at the level of the European Union (the implementation of common policies, the coordination of the policies, the harmonization of the legislation, etc.) or by means of the passive actions of the European Court of Justice (the interdiction of certain types of conduct of the member states that do not comply with the norms of the European Union). In the absence of the tax harmonization, negative effects can occur, such as: the erosion of the national tax bases, provision of public services and goods at a sub-optimal level, unwanted changes in the structure of the taxes which are levied in the member states, and distortions in assigning resources at the level of the single market. Key words: tax policy, harmonization, tax competition, public institutions JEL classification: H30, G18, H71
1. Introduction The tax policy is one of the few instruments which can still be used by the governments of the states which are
part of the European Union in order to influence the national economies. By means of the Stability and Growth Pact , which has been adopted within the European Council of Dublin in 1996, the use of this instrument has somewhat been constrained, because by means of this agreement, the member states oblige themselves to provide the increase of coherence between the objectives of the tax policy and the issue of providing the long-term sustainability of the public finances, in order to limit the excessive budgetary deficits. The concept of European tax policy has been discussed for the first time within the Treaty of Rome regarding the establishment of the European Economic Community (EEC). Although there is no single pattern, certain features of this tax coordination are encountered in all national administrations of the states, which are part of the EU in the process of conceiving, adopting and implementing the community policies (Jinga I., 2005).
According to Moldovan, I si Popa, R.A. (2012) the severity of the crisis from 2007 induced strong feelings of panic in the financial markets and to reduce the negative effects on the real economy, governments of many countries resorted to massive intervention and without precedent, in order to support markets. Following interventions to reduce the impact of the crisis, budget deficits in many countries increased considerably. Basically, the global financial crisis
230

Annals of the „Constantin Brâncuşi” University of Târgu Jiu, Economy Series, Issue 3/2016
„ACADEMICA BRÂNCUŞI” PUBLISHER, ISSN 2344 – 3685/ISSN-L 1844 - 7007
was converted in 2010 - 2011, in a sovereign debt crisis in various economies, especially those in the euro area, affecting their capacity to recover. Monetary policy became more important in managing the budget deficit.
Building the tax policy of a state is an ample endeavour, which must take into account several aspects, depending on the target aimed at: the consolidation of the public finances, achieving and maintaining the macroeconomic balance, supporting the economic development, etc. Taxes and other tax take-offs can change the phases of the social reproduction process, according to the objectives that the public authorities aim at. The policy in the tax field is an important part of the economic policy, as all tax decisions taken by the governments of the European Union member states can cause effects both at national and community level. Building a coherent and functional network of multilateral tax agreements with the purpose of mitigating the existing differences between the tax systems of the European Union states, can elude the risk of distortions in achieving intra-community commercial flows; however, in the case of removing the barriers standing in the way of the capital flows, this form of tax coordination cannot provide a correct and effective allocation of the resources at the level of the entire European Union.
2. The tax competition in the European Union
The tax policy at the European Union level can be studied from two points of view, depending on the way it is considered - as a federation or as a confederation.
If it is considered that EU is a federation, and the tax policy is considered to be that of a federal state, performed by three types of administrative bodies (federal, state and local), then we can define the EU tax policy in a similar way to the national one: the EU fiscal policy is the entirety of the regulations regarding the setting and levying taxes, charges and other tax resources of the European Community. It is obvious that the European Union does not have the responsibility of creating taxes, as this responsibility belongs to the member states, but its role is to follow the selection and procurement of the financial resources which are at the disposal of the Community, i.e. the customs charges on the external EU products, agricultural taxes, excises, a certain percentage of the VAT, calculated on harmonized bases.
Considering that the European Union is structured as a confederation, i.e. a union of independent states, we note that the tax policy at the EU level shall no longer follow the same objectives as the tax policy of a nation. In this state, we define the community tax policy as an entirety of national tax policies, performed in a coordinated manner within a well-defined area, in order to achieve the reconciliation of the taxes pertaining to the member states, and provide a smooth operation of the common market.
In order to build an integration and a full economic union, the European institutions have built a set of juridical norms completing and mediating the materialization of the provisions of the European Union Treaty, forming into what we call the community tax law. By community tax law we thus understand the coherent entirety of juridical norms elaborated by the EU institution with the purpose of achieving the community control regarding the national taxation of the member states (and of the acceding countries), achieving the tax harmonization policy at the level of all the member states, and implementing the legal mechanisms regarding these aspects (The Treaty of Rome). The compliance with the discipline rules prepared in the tax and budgetary field contributes to the general improvement of the public finances quality, and helps the member states release the budgetary resources which can be used for financing the actions in the socio-cultural field and for supporting innovation and investments. Considering the above-mentioned issues, it is obvious that the taxation issue is currently the topic of heated discussions both among theoreticians, and politicians.
We have shown that the European Union does not have the responsibility of creating or levying taxes and charges. Thus, the tax policy power lies with the member states that, depending on the constitutional or administrative structure of the government, can transfer it from the central level to the regional or local level. According to article 269 of the EC Treaty, the EC budget must be financed and completely made up of own funds, which are greatly dependent on the capacity of the member states to contribute with resources. (European Commission, 2001). Thus, we can state that the EU role regarding taxes, charges and other contributions is only a subsidiary one, as the subsidiarity principle is, as matter of fact, one of the main EU principles. The juridical basis in the taxation field is article 3 of the EC Treaty, which provides the removal, among the member states, of the excises and other measures with equivalent effects, and the provision of an undistorted competition on the common market (European Parliament Fact Sheets, 2014). On the European Union internal market, the taxes and charges must not affect the free circulation of the goods and services, and also must not distort competition. If on a single market the mobility of the factors increases, the manufacturers and residents tend to turn to the regions where taxation is reduced. Only a single European taxation could avoid the occurrence of distortions and rivalries among the national tax regimes (Gruescu, Nanu, 2001). In order to meet this purpose, they needed to perform the tax harmonisation process among all EU member states, a process whose development is quite slow because of the variety and complexity of the problems in the tax field.
The mobility of production factors allows the use of taxes as levers in attracting the mobile tax bases. Thus, the public authorities to be found in different regions or countries are motivated to reduce the taxation level for a series of mobile production factors, as they are engaged in a "tax competition". If there is a market providing the movement freedom of the goods, services, capitals and workforce, the tax competition can occur in the case of taxes on goods and services, taxes on the incomes of the companies, and taxes on the incomes of the natural persons. In order to reduce and
231

Annals of the „Constantin Brâncuşi” University of Târgu Jiu, Economy Series, Issue 3/2016
„ACADEMICA BRÂNCUŞI” PUBLISHER, ISSN 2344 – 3685/ISSN-L 1844 - 7007
remove the distortions which could be caused by the taxation of goods and services on the competition at the single market level, as early as the beginning of the 70s, the members states have set a series of measures in order to harmonize the respective taxes. At present, the progress achieved in harmonising the indirect taxes is significant, but for the other categories of taxes, they are significantly diversified. The manifestation of the tax competition phenomenon (especially regarding the taxation of the capital and incomes of the juridical persons) was the nodal point of the discussions on the harmonization of incomes.
Depending on the objectives aimed at, the tax competition is manifested depending on the optics of the governments of the countries enforcing it, and it especially refers to:
- attracting direct foreign investments which have a major importance in creating jobs in the European Union countries;
- attracting the portfolio investments, useful for financing the economic activities, in order to consolidate the financial markets and achieve comparative advantages in providing financial services;
- attracting the financial within-the-firm financial flows, which can be directed towards one's own tax jurisdiction by attracting those corporate functions which are useful for the international transfer of profits;
- attracting higher skilled labour; - attracting the buyers (indirect taxpayers) to be found in the cross-border areas and not only, especially those
interested in the products that include VAT or excises, if there are significant differences between them. The tax competition at the EU level can be considered as a competition between the tax jurisdictions of the
member states, in which each of them wants to become more attractive tax-wise for all the categories of direct or indirect taxpayers. In order to obtain such an appreciation from the investors, one must aim at several qualitative and quantitative parameters: the acceptability of the taxation levels by choosing lower levels as compared to those used in other tax jurisdictions; granting facilities under several forms (exonerations, discounts or deductions) when the taxation bases are set; the flexibility and transparency of the regulations and tax calculation methods; adequate infrastructure and smooth operation of the tax management and administration both locally and centrally; granting facilitations regarding the environmental conditions or regarding the provision of the optimal infrastructure for building or developing businesses.
Such instruments promoted by the local and central administrations can positively influence the increase of the capital and labour, as each taxpayer is interested in benefiting from the most profitable opportunities in order to achieve the highest performance of the incomes before or after taxation. In their search for such opportunities, taxpayers leave their national states of residence, thus penalising those tax systems with high taxation marginal rates and/or bushy regulations, which translates into an increase of the taxation base and implicitly of the total collections in the host countries.
In the last years and especially during the time before the crisis, at the EU level, the instances of transferring the fiscal tasks within EU have increased by means of more and more diversified manners, like form and nature. Such trends have also been favoured by the amplification of the international capital flows, financial innovations, regulation of the financial markets, and the new opportunities created for tax evasion, resulting in the reduced capacity of achieving the public financial resources, and reporting tax deficits for certain member states (Chilarez D., Ene G.-S.).
3. The institutions of the European Union with responsibilities in the taxation field. Aligning the national fiscal legislations within the EU
In order to achieve the community objectives in terms of tax policy, EU has created, by means of its treaties,
institutions exerting their competences under completely different conditions than those under which the regular institutions of international law operate. It has been intended that the community institutions be completely independent of the national authorities of the member states. Considering the above, O. states that the institutional structure of EC has the following features (Manolache O., 2006):
- combined functions - which are held by at least three of the community institutions: the Community, the Council and the Parliament, which are of several types, as they could not clearly be reconciled with the traditional distinction among the legislative, executive, legal and consultative powers (in this respect, the Commission can be distinguished, which is known as the community executive);
- the polycentric structure - the main centre around which the institutions gravitate is in Brussels, but other centres can also be found in Luxembourg, Strasbourg or Frankfurt;
- divided loyalty - because the ideal possibility of forming and conceiving the community institutions, so that their loyalty would be directed towards one single cause - the community interest - has proved to be impracticable for reasons related to principle and pragmatism; in this direction, the situation of the institutions is different: The Commission is only subject to the community interest, the Council represents the interests of the states, and the Court of Justice is asked to assess, with a total and absolute objectivity, all the litigations submitted to it for settlement;
232
Annals of the „Constantin Brâncuşi” University of Târgu Jiu, Economy Series, Issue 3/2016
„ACADEMICA BRÂNCUŞI” PUBLISHER, ISSN 2344 – 3685/ISSN-L 1844 - 7007
- separation of powers - principles which are applied to the community institutions, as they are completely independent, although they have mixed functions.
Article 7 of the CE Treaty mentions the institutions which perform the missions entrusted to the Community",
so with responsibilities also in the taxation field, i.e.: a European Parliament, a Council, a Commission, a Court of Justice, and a Court of Accounts.
In the taxation field, the European Parliament has the following responsibilities (Manolache O., 2006): - decisional legislative responsibilities: resulting from the principle laid down by article 192 align. (1), i.e. to
participate in the process leading to adopting community acts. - inquiry and ombudsman responsibilities: according to article 193 of the EC Treaty, the European Parliament
can form a temporary inquiry commission "so that it would examine accusations regarding offences or the defective administration in enforcing the community law".
- supervision and control responsibilities: the supervision and control function is exerted by the Parliament especially regarding the Commission, and it is provided by articles 197 align. (2) and (3), 200 and 201 of the EC Treaty.
- consultative responsibilities: these are not expressly provided by the Treaty, but one can interpret that article 189 also refers to the exertion of consultative, supervision and control responsibilities.
The European Council is the community institution to which numerous responsibilities have been granted by
means of the EC treaty. These also refer to achieving the objectives regarding the fiscal policy in the European Union. Thus, article 202 provides the following: The Council provides the coordination of the general economic policies of the member states; it holds the decision power; by means of the acts it adopts, it grants the Commission the responsibilities of enforcing the norms set by the Council. The Council can subject the practice of these responsibilities to certain forms.
In certain specific cases, it can also reserve its rights to directly exert execution responsibilities. The mentioned forms must answer to the principles and norms previously imposed by the Council, unanimously taking decisions, at the proposal of the Commission and with the prior approval of the European Parliament.
The European Commission is the community executive body with important tax responsibilities. The EC Treaty stipulates in article 210 the main responsibilities by means of which the Commission "provides the operation and development of the common market", i.e.:
- watches over the enforcement of the dispositions of the Community treaty and action taken by institutions in virtue thereof;
- makes recommendations or permits in the matters which are the subject of the EC treaty if these are expressly provided, or if the Commission considers them to be necessary;
- holds its own decision power and participates in the process of preparing the documents of the Council and European Parliament;
- exerts the responsibilities granted by the Council for enforcing the norms established by it. The task of guaranteeing that the law is enforced on the entire territory of the Community according to the
treaties lies with the European Court of Justice, headquartered in Luxembourg. The sentences of the Court state that "they have contributed to the consolidation of the Community, providing the protection granted by the community law, and at the same time, the compliance therewith both by the citizens and by the national governments" (Leonard D., 2001).
So, the competence of the Court of Justice, in relation to the taxation in the EU area, is to guarantee that, in interpreting and enforcing the community treaties, the law is complied with. This competence of the Court is restricted to only acting within the powers which have been granted to it by the Treaty of Nice, so that neither the competence to settle proceedings brought in court by natural or legal persons, nor the competence to solve the proceedings for cancelling the exclusively national decisions are covered by these powers. I share the opinion according to which the unusual role of the Court of Justice, as compared to the several international bodies, resides in the fact that it acts in a very different environment than the one in which the respective traditional bodies are found.
The tax policy extensively influences the saving, consumption, investments, labour and implicitly the operation manner of the markets of goods, services, capital and labour. The reforms launched by the European Council have had the role to make sure that the differences between the tax systems of the member states, which have become even more visible since the introduction of the Euro currency, do not disturb and do not fragment the single market, and do not prevent the effective allocation of resources. The national taxes and charges, the social security contributions specific to each state now also have other purposes than simply operating on the national market, and must be assessed in light of the different criteria, variable as importance from one EU member state to another.
Only by means of a close coordination of the national tax policies can one achieve a balance between different tax systems and the unencumbered right of free movement and stability in the European Union.
233
Annals of the „Constantin Brâncuşi” University of Târgu Jiu, Economy Series, Issue 3/2016
„ACADEMICA BRÂNCUŞI” PUBLISHER, ISSN 2344 – 3685/ISSN-L 1844 - 7007
In our opinion, these are a few of the most significant problems that EU is facing in adopting the tax policy action:
- problems generated by the economic globalization and technological development phenomenon: - the need to increase the effectiveness of the tax administration in the member states; - the extension of the community area by the accession of the new states; - the demographical references characterising the community area; - the global economic crisis during 2008-2011. During the latest centuries, major progress has been made in aligning the national tax legislation in the VAT
and excises field, so that both the norms of establishing the taxation base, and the procedures for the collection and administration of the respective taxes have greatly been harmonized. Also, by means of directive 92/77/CEE regarding the harmonization of the legislations of the member states regarding the turnover taxes, the minimum standard level of the value added tax has been set, and by means of directive 92/79/CEE regarding the closeness of the cigarette duties, the directive 92/82/CEE regarding the minimum levels of the excises for mineral oils, and directive 92/84/CEE regarding the closeness of the excises level for alcohol and alcoholic drinks, the minimum levels of the harmonized excises have been set;
In the field of the direct taxes, the main harmonization measures have been adopted with the purpose of facilitating the activity of the multinational companies in the European Union. Thus, by means of directive 90/434/CEE regarding the common tax regime applied to mergers, splits, transfer of assets and exchanges of shares among the companies from different member states, they have tried to remove the tax-related difficulties caused by the restructuring and reorganization processes of the multinational companies. By means of directive 90/435/CEE regarding the common tax regime which is applied to the parent-companies and their branches from different member states, they have intended to remove the situations in which the cooperation between the commercial companies from different member states was disadvantaged (by means of the aspects regarding the distributed profit), in relation to the cooperation between the commercial companies from the same member state. The obstacles to be found in the case of a transnational operation of interest or royalty payments, inside a group of commercial companies located in different member states, have been removed by means of directive 2003/49/CE. The arbitration convention 90/436/CEE mentions the procedures for settling the litigations resulting from the enforcement of the transfer prices and from the transfers of profits among commercial companies which are members of the groups.
We assess that the view according to which achieving a total harmonization is not necessarily required, under the conditions of maintaining certain manifestation conditions for the tax competition, is correct. Thus, a full harmonization can cause a vulnerability of the national tax policies, which are thus in the impossibility of defending themselves from the oscillations of the economic climate, and especially from the effects of the economic and financial crisis. Because of the difficulties that the global economy is facing, a topic under discussion is the one of the active implication of the state into the economic and social life, in order to mitigate the effects of existing or potential imbalances, especially by using the tax policy as a lever by means of which macroeconomic stabilization would be achieved. During the latest crisis, ”many states have considered it necessary to increase the maximum taxation levels per income, adopting one of the following approaches: either the enforcement of new taxation levels for the very high incomes, or the levy of temporary taxes for urgent budgetary deficit situations” (KPMG, 2012).
4. Conclusions
Due to the current economic and financial circumstance available globally, the competition among states has increased, in order to attract foreign investments with an economic potential by using the tax policy as an instrument of bringing them into their tax jurisdictions and by enforcing lower taxation levels. Within the European Union, for those states which are less developed or have recently become EU members, the preservation of a certain level of independence in the tax policy might be a good choice in the medium term, so that it would be enough time to achieve a tax consolidation, especially at present, when the tax sustainability of the public finances has become a major priority. Thus, the tax harmonization process mainly implies the selection of common taxation levels, which must be set at a level considered to be “reasonable” for all member states. Obviously, this level would become smaller than the high levels available in the developed states and higher as compared to those currently used by the less developed states. Thus, reactions are caused in both categories of states. The developed states would find themselves in the position to resize their public expenses, i.e. decrease them, while the less developed ones would give up the advantages of the lower taxation rates, as they would no longer be equally attractive for the foreign investments, and becoming at the same time very burdening for their own taxpayers. Thus, the countries with large marginal taxation rates are no supporters of the tax competition, and the less developed states are constantly developing a competition in creating and using taxation levels as attractive as possible for foreign investments.
Under the circumstances of a tax competition within national limits, by decreasing the taxation rates, the
234

Annals of the „Constantin Brâncuşi” University of Târgu Jiu, Economy Series, Issue 3/2016
„ACADEMICA BRÂNCUŞI” PUBLISHER, ISSN 2344 – 3685/ISSN-L 1844 - 7007
tax policy could cause the increase of competitiveness, and could have beneficial effects for the business development, because taxpayers would retain a more consistent part of the earned incomes, which can allow an increase of the taxation base and also of the collected charges in the future. The reversed situation is however not valid, as the sustainability limit of the tax pressure according to the theory presented by means of Laffer Curve is well-know. This can be a development factor for the European economies, by increasing the mobility degree of the production factors, because investors would seek to benefit from the advantages of the tax system with lower levels, while staying on the EU territory.
The tax competition can contribute to the limitation of the trend regarding excessive taxation and ineffective spending of the public financial resources, stimulating the increase of the budgetary effectiveness by means of using fewer resources and implicitly by decreasing the vulnerability of the taxpayers towards the pressure exerted on them by the state. At the same time, the possibility of the taxpayers to freely transfer their capitals allows them to better protect themselves from governmental abuses or corruption.
The reason for creating the “four freedoms’’ within the single European market must not be used in the sense of removing the tax competition, in favour of a complete harmonization of the national tax systems. We cannot compare tax competition to market competition in an actual sense. If the supply and demand law dominates in terms of market competition, the tax competition is only one of the aspects of the competition among countries, as a result of both certain budgetary constraints, and political, economic and social interests. We consider that the total harmonization would be beneficial up to certain limits, as the unification reduces the regional but also global tax competition, which would be a disadvantage for the European tax system.
5. References
[1] Chilarez D., Ene G-S., Harmonization and fiscal competitiveness in European Union, http://www.strategiimanageriale.ro/images/images_site/articole/article_3a5744edeef192e0d12f8e9a8446293c.pdf [2] Gruescu R., Nanu R., Economic and Monetary Union, Craiova University Reprography, 2001 [3] Jinga I., Internal Coordination in European Union, in RRDC nr. 2/2005 [4] Leonard D., European Union Guide, Editura Teora, Bucureşti, 2001 [5] Manolache O., Community Law Tractate, Edition 5, Editura All Beck, Bucureşti, 2006 [6] Moldovan, I and Popa, R.A., Challenges of the economic science against the economic crisis, Theoretic and Applied Economics ECTAP, Volume XIX (2012), No. 4(569), pp. 131-140, http://store.ectap.ro/articole/716_ro.pdf [7] European Commission, Tax policy in the European Union, Priorities for the years ahead, Brussel, 2001, Tax policy in the European Union [8] European Parliament, European Parliament Fact Sheets, 2014, Fiscal policy and taxation UE [9] KPMG-Global, http://www.kpmg.com/Global/en/services/Tax/Pages/default.aspx [10] *** The Treaty of Rome (EEC Treaty), 25 March 1957, enforced on 1 January 1958
235

Annals of the „Constantin Brâncuşi” University of Târgu Jiu, Economy Series, Issue 3/2016
„ACADEMICA BRÂNCUŞI” PUBLISHER, ISSN 2344 – 3685/ISSN-L 1844 - 7007
THE OPTIMIZATION OF THE ENTERPRISE FINANCIAL ANALYSIS TROUGH THE FINANCIAL SYSTEM OF CONTROL DU PONT
GÂDOIU MIHAELA PHD, LECTURER, UNIVERSITY OF PITESTI
Abstract: The return on assets and the return on equity are essential indicators for the assessment of the company performance. They have a rich financial content, but there are many cases where the figure sometimes shows a “prettier” reality. In such cases it is necessary to treat and interpret financial rates with caution, taking into account, at the same time, other methods used in the financial analysis. The objective of this paper is to present a popular financial diagnosis optimization method - the Du Pont financial control system, that has an important role in the financial analysis of the company because it is related to the return on assets and the return on equity of the company as a result of the interaction of several factors synthesized through reports built based on information taken from the annual financial statements.
Keywords: financial diagnosis, financial performance, economic rate of return, financial rate of return;
JEL Clasification: G01, G10, M10, M20
1. Introduction
One of the significant characteristics of the economic and financial rates of return is the possibility to break it
down on influencing factors, synthesized by means of certain financial ratios. This breakdown is made through the so-called Du Pont financial control system, named after the famous American company that “patented” this financial analysis technique.
The return on assets ROA and the return on equity ROE are indicators that highlight the contribution of each funding source to the overall efficiency of the company. I analysed, in this paper, and I commented upon methods of expressing rates of return, highlighting their role within the financial analysis. A popular method of optimising company performance diagnosis is to break down rates of return based on the Du Pont financial control system.
The research method used to prepare this paper implies the theoretic substantiation of notions specific to company performance, in agreement with the opinions expressed in the specialized literature.
For the preparation of this paper we used as documentary material data and information sources provided by the profit and loss account, which is the most important annual financial statement part, used with the purpose of assessing the financial performance of the company.
2. Research results
The Du Pont financial control system starts from the idea that the return on assets and the return on equity of
the company represent the result of the interaction of several factors synthesized through reports built based on information from the balance sheet and the profit and loss account.
According to this methodology, the return on assets ROA can be formulated as the product between a margin rate (the share of the net operating result in the turnover) and a capital turnover rate (the ratio between the turnover and the average economic assets). The purpose of this breakdown is to highlight the factors that influence the return on assets, since one is a quantitative factor (the margin rate, which shows what share of the turnover the company manages to retain as operational profit) and the other is a qualitative one (the turnover rate, which allows for assessing the efficiency with which the company uses its economic capital).
Thus, according to the Du Pont system, the return on assets of the company can be expressed as the product of two financial rates: a margin rate and a capital turnover ratio [4]. The margin rate indicates the value structure of the turnover by means of the ratio between the net operating profit and the turnover. Marking this margin rate as RM, the calculation formula is as follows:
( )1
1
CAt1EBIT
RM−⋅
= (1),
where:
236
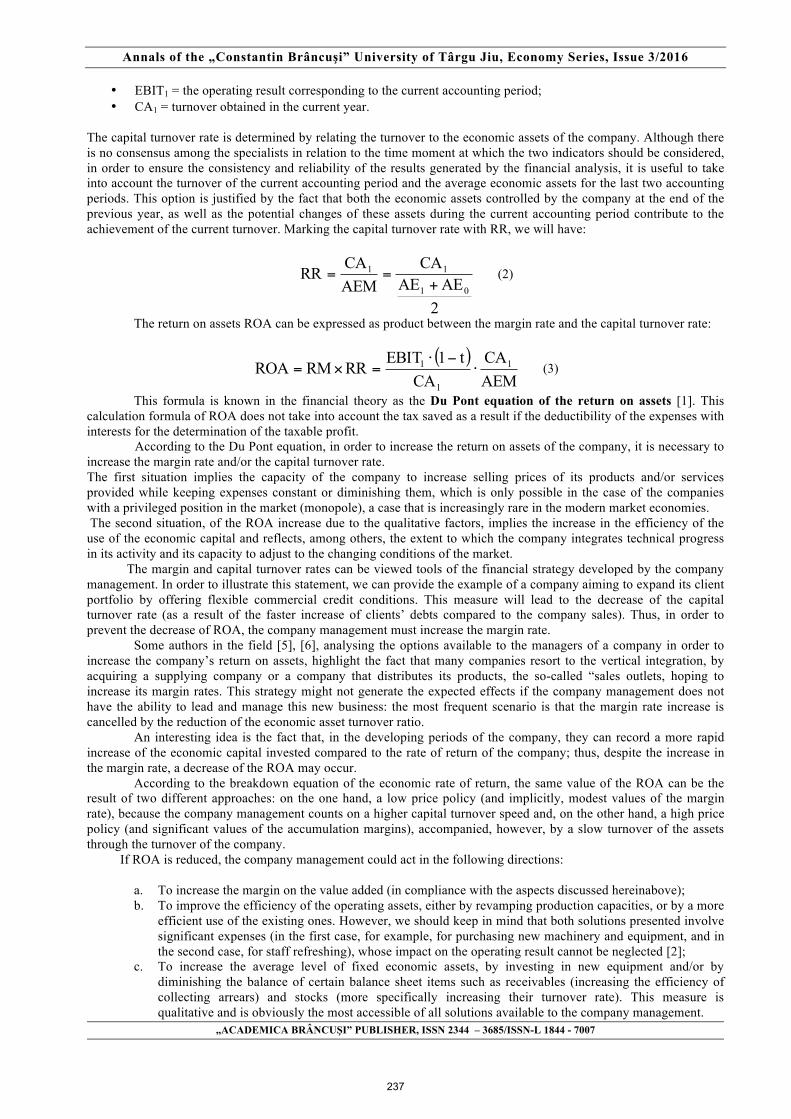
Annals of the „Constantin Brâncuşi” University of Târgu Jiu, Economy Series, Issue 3/2016
„ACADEMICA BRÂNCUŞI” PUBLISHER, ISSN 2344 – 3685/ISSN-L 1844 - 7007
• EBIT1 = the operating result corresponding to the current accounting period; • CA1 = turnover obtained in the current year.
The capital turnover rate is determined by relating the turnover to the economic assets of the company. Although there is no consensus among the specialists in relation to the time moment at which the two indicators should be considered, in order to ensure the consistency and reliability of the results generated by the financial analysis, it is useful to take into account the turnover of the current accounting period and the average economic assets for the last two accounting periods. This option is justified by the fact that both the economic assets controlled by the company at the end of the previous year, as well as the potential changes of these assets during the current accounting period contribute to the achievement of the current turnover. Marking the capital turnover rate with RR, we will have:
2AEAE
CAAEMCARR
01
11
+== (2)
The return on assets ROA can be expressed as product between the margin rate and the capital turnover rate:
( )AEMCA
CAt1EBIT
RRRMROA 1
1
1 ⋅−⋅
=×= (3)
This formula is known in the financial theory as the Du Pont equation of the return on assets [1]. This calculation formula of ROA does not take into account the tax saved as a result if the deductibility of the expenses with interests for the determination of the taxable profit.
According to the Du Pont equation, in order to increase the return on assets of the company, it is necessary to increase the margin rate and/or the capital turnover rate. The first situation implies the capacity of the company to increase selling prices of its products and/or services provided while keeping expenses constant or diminishing them, which is only possible in the case of the companies with a privileged position in the market (monopole), a case that is increasingly rare in the modern market economies. The second situation, of the ROA increase due to the qualitative factors, implies the increase in the efficiency of the use of the economic capital and reflects, among others, the extent to which the company integrates technical progress in its activity and its capacity to adjust to the changing conditions of the market. The margin and capital turnover rates can be viewed tools of the financial strategy developed by the company management. In order to illustrate this statement, we can provide the example of a company aiming to expand its client portfolio by offering flexible commercial credit conditions. This measure will lead to the decrease of the capital turnover rate (as a result of the faster increase of clients’ debts compared to the company sales). Thus, in order to prevent the decrease of ROA, the company management must increase the margin rate. Some authors in the field [5], [6], analysing the options available to the managers of a company in order to increase the company’s return on assets, highlight the fact that many companies resort to the vertical integration, by acquiring a supplying company or a company that distributes its products, the so-called “sales outlets, hoping to increase its margin rates. This strategy might not generate the expected effects if the company management does not have the ability to lead and manage this new business: the most frequent scenario is that the margin rate increase is cancelled by the reduction of the economic asset turnover ratio. An interesting idea is the fact that, in the developing periods of the company, they can record a more rapid increase of the economic capital invested compared to the rate of return of the company; thus, despite the increase in the margin rate, a decrease of the ROA may occur. According to the breakdown equation of the economic rate of return, the same value of the ROA can be the result of two different approaches: on the one hand, a low price policy (and implicitly, modest values of the margin rate), because the company management counts on a higher capital turnover speed and, on the other hand, a high price policy (and significant values of the accumulation margins), accompanied, however, by a slow turnover of the assets through the turnover of the company. If ROA is reduced, the company management could act in the following directions:
a. To increase the margin on the value added (in compliance with the aspects discussed hereinabove); b. To improve the efficiency of the operating assets, either by revamping production capacities, or by a more
efficient use of the existing ones. However, we should keep in mind that both solutions presented involve significant expenses (in the first case, for example, for purchasing new machinery and equipment, and in the second case, for staff refreshing), whose impact on the operating result cannot be neglected [2];
c. To increase the average level of fixed economic assets, by investing in new equipment and/or by diminishing the balance of certain balance sheet items such as receivables (increasing the efficiency of collecting arrears) and stocks (more specifically increasing their turnover rate). This measure is qualitative and is obviously the most accessible of all solutions available to the company management.
237
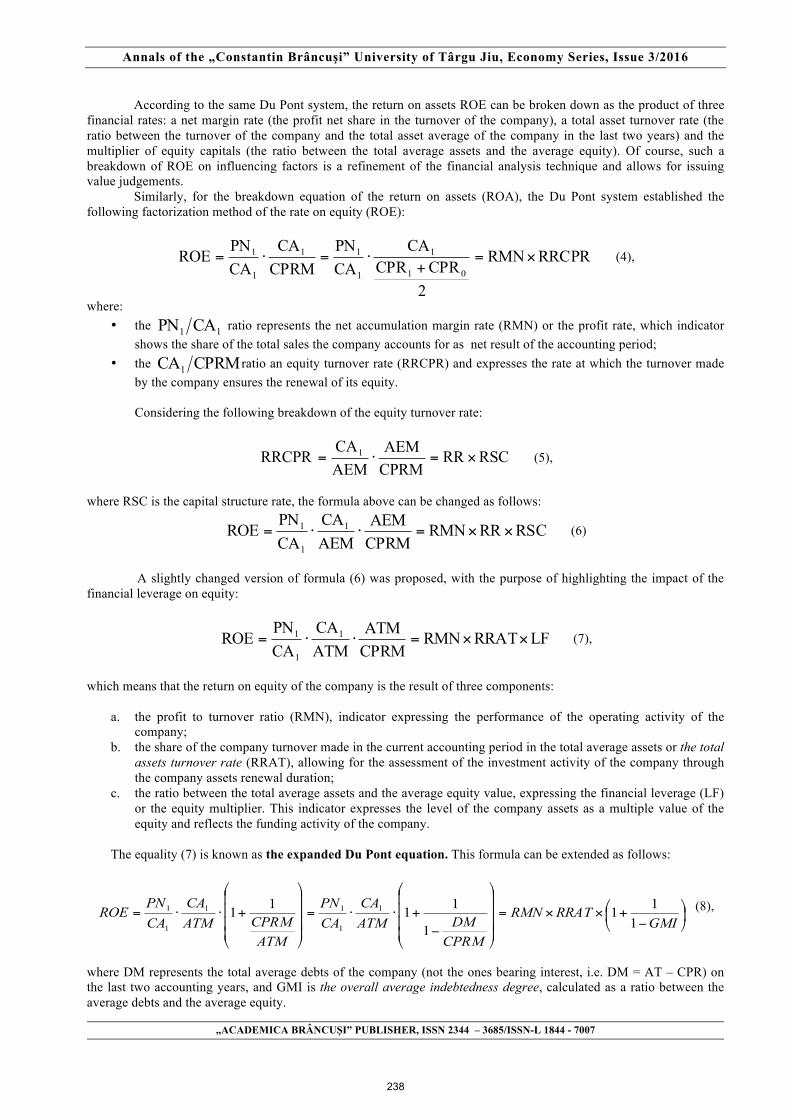
Annals of the „Constantin Brâncuşi” University of Târgu Jiu, Economy Series, Issue 3/2016
„ACADEMICA BRÂNCUŞI” PUBLISHER, ISSN 2344 – 3685/ISSN-L 1844 - 7007
According to the same Du Pont system, the return on assets ROE can be broken down as the product of three
financial rates: a net margin rate (the profit net share in the turnover of the company), a total asset turnover rate (the ratio between the turnover of the company and the total asset average of the company in the last two years) and the multiplier of equity capitals (the ratio between the total average assets and the average equity). Of course, such a breakdown of ROE on influencing factors is a refinement of the financial analysis technique and allows for issuing value judgements.
Similarly, for the breakdown equation of the return on assets (ROA), the Du Pont system established the following factorization method of the rate on equity (ROE):
RRCPRRMN
2CPRCPR
CACAPN
CPRMCA
CAPNROE
01
1
1
11
1
1 ×=+
⋅=⋅= (4),
where: • the 11 CAPN ratio represents the net accumulation margin rate (RMN) or the profit rate, which indicator
shows the share of the total sales the company accounts for as net result of the accounting period; • the CPRMCA1 ratio an equity turnover rate (RRCPR) and expresses the rate at which the turnover made
by the company ensures the renewal of its equity.
Considering the following breakdown of the equity turnover rate:
RSCRRCPRMAEM
AEMCARRCPR 1 ×=⋅= (5),
where RSC is the capital structure rate, the formula above can be changed as follows:
RSCRRRMNCPRMAEM
AEMCA
CAPN
ROE 1
1
1 ××=⋅⋅= (6)
A slightly changed version of formula (6) was proposed, with the purpose of highlighting the impact of the financial leverage on equity:
LFRRATRMNCPRMATM
ATMCA
CAPN
ROE 1
1
1 ××=⋅⋅= (7),
which means that the return on equity of the company is the result of three components:
a. the profit to turnover ratio (RMN), indicator expressing the performance of the operating activity of the company;
b. the share of the company turnover made in the current accounting period in the total average assets or the total assets turnover rate (RRAT), allowing for the assessment of the investment activity of the company through the company assets renewal duration;
c. the ratio between the total average assets and the average equity value, expressing the financial leverage (LF) or the equity multiplier. This indicator expresses the level of the company assets as a multiple value of the equity and reflects the funding activity of the company.
The equality (7) is known as the expanded Du Pont equation. This formula can be extended as follows:
⎟⎠
⎞⎜⎝
⎛−
+××=
⎟⎟⎟⎟
⎠
⎞
⎜⎜⎜⎜
⎝
⎛
−+⋅⋅=
⎟⎟⎟⎟
⎠
⎞
⎜⎜⎜⎜
⎝
⎛
+⋅⋅=GMI
RRATRMN
CPRMDMATM
CACAPN
ATMCPRMATM
CACAPN
ROE111
1
1111 1
1
11
1
1 (8),
where DM represents the total average debts of the company (not the ones bearing interest, i.e. DM = AT – CPR) on the last two accounting years, and GMI is the overall average indebtedness degree, calculated as a ratio between the average debts and the average equity.
238

Annals of the „Constantin Brâncuşi” University of Târgu Jiu, Economy Series, Issue 3/2016
„ACADEMICA BRÂNCUŞI” PUBLISHER, ISSN 2344 – 3685/ISSN-L 1844 - 7007
This last formula is another proof of the apparently surprising fact that the financial profitability of a company can grow with its indebtedness degree. For a rigorous mathematical justification of this statement it is necessary to calculate the partial derivative of the ROE function in relation to GMI:
( )0
GMI11RRATRMN
GMIROE
2>
−××=
∂
∂ ,
which shows that there is a direct relationship between ROE and GMI. Nevertheless, we should not omit the fact that an increase in the indebtedness degree results not only in an increase in ROE, but also in a corresponding increase in the financial risk associated to the business in question. The expanded Du Pont equation can be broken down as follows:
( )( ) tDOBt1EBITPN
CPRMAEM
AEMCA
CAtDOBt1EBIT
CPRMAEM
AEMCA
CAPN
ROE1
11
1
11
1
1
⋅+−⋅⋅⋅⋅
⋅+−⋅=⋅⋅=
RSRRSCRRRMROE ×××= (9),
where: RSR is the remuneration structure rate, which is expressed as the share of the net operating result accounted for by the company as net profit. Taking into account that the return on assets can be written as RRRMROA ×= , we will conclude that the return on equity is equal to the product between the return on assets, the capital structure rate and the remuneration structure rate:
RSRRSCROAROE ××= (10),
where the product between RSC and RSR is a measure of the financial leverage. The Du Pont financial dashboard represents a graphical method of financial analysis developed by the same company in the American chemical industry and which subsequently became very popular in the company finance practice [3]. This analysis method is based on the following breakdown of the return on equity (ROE):
CPRMATM**ROAROE ⋅= (11),
where ROA** is the return on assets calculated using the formula:
ATMPN**ROA 1= (12)
Subsequently, ROA** is broken down according to the Du Pont equation:
RRATRMNATMCA
CAPN
**ROA 1
1
1 ×=⋅= (13),
then the Du Pont dashboard proposes highlighting each (main) category of incomes and expenses incurred by the company separately (which are deducted from the sales volume in order to obtain the net profit), which will allow for the identification of the causes of the possible inappropriate evolution of the margin rate (RMN). The Du Pont dashboard also comprises the categories of assets controlled by the company. 3. Conclusions
This paper was prepared in such a way as to highlight the role of the return on assets and the return on equity
in the assessment of company performance. Certainly, the return on assets and the return on equity represent essential indicators for the assessment of the
239
Annals of the „Constantin Brâncuşi” University of Târgu Jiu, Economy Series, Issue 3/2016
„ACADEMICA BRÂNCUŞI” PUBLISHER, ISSN 2344 – 3685/ISSN-L 1844 - 7007
company performance. However, in order to carry out a pertinent financial analysis, I recommend the cautious interpretation of the indicators, because there are many cases where numbers show a “more beautiful” reality when, for example, the significant stock variation artificially increased the operating incomes of the company.
I also recommend the simultaneous analysis of the two indicators, because they have an informative value only if they are considered together: o a very high return on equity can be accompanied by a low return on assets, is the company manly relies on debts as financing sources.
The optimization of the financial analysis techniques implies, in my opinion, the study of the rates of return together with the analysis of the equity turnover rate, viewed as the qualitative indicators for the assessment of the efficiency of the company activity. The turnover rates should be calculated for the representative items of the current assets and liabilities of the company, more specifically stocks, receivables, debts to suppliers (basically, those items that have a decisive impact on the need for working capital), and also for the operating fixed assets of the company.
References
[1] Brigham, E., Ehrhard M., Financial management: theory and practice, South Western College Pub, 2002, pag. 388-389; [2] Gadoiu M., Perfecționarea diagnosticului financiar al întreprinderii, Editura Universitară, București, 2015, pag. 156;
[3] Helfert, E., Financial analysis tools and techniques – a guide for managers, The McGraw – Hill Companies, 2001, pag. 103; [4] Stancu, I., Finance, Fourth Edition, Economic Publishing House, 2007, pag. 762; [5] Vasile, I., Financial Management of the Enterprise, Meteor Press Publishing House, 2006, pag 215; [6] Vintila, G., Financial Management of the Enterprise, Didactic and Pedagogical Publishing House, 2005, pag.199.
240

Annals of the „Constantin Brâncuşi” University of Târgu Jiu, Economy Series, Issue 3/2016
„ACADEMICA BRÂNCUŞI” PUBLISHER, ISSN 2344 – 3685/ISSN-L 1844 - 7007
CLUSTERS’ ROLE IN REGIONAL DEVELOPMENT
BORDEI CONSTANTIN
PHD. STUDENT ALEXANDRU IOAN CUZA UNIVERSITY OF IAŞI, ROMANIA, e-mail:[email protected]
Abstract
The cluster type initiatives represent concentrated efforts for the improvement of well-being and competitiveness in a certain area, including companies, local administration, research and training societies. The new approaches regarding regional development raise the question – “Which is the role of clusters in regional development?”. The analyses of a cluster can support the diagnose of the threats and opportunities of an economic region and the identification of the measures one region can adopt in order to influence its economic future. The general thinking on clusters shows that these are essential to the economy and development. They create competitive advantages for their members, influence the structural changes, revive the industrial sectors and insure the needed framework for development, innovation and regional development. The objectives to be reached aim at the review of some studies regarding the relation between clusters and regions and the displaying of the clusters’ activities benefits on the regional development. Keywords: Theory; Cluster; Factors; Regions; Competitiveness; Firms; Groups JEL Classification: F23; O10; F43 1. Introduction
Clusters represent the subject of different documents and papers of the international and national
organizations, and, starting from the previous experience, more authorities promote the idea that clusters determine competitiveness growths, the specialization of the workforce, the growth of companies and the development of regional economies. Clusters are geographical concentrations of interconnected companies, with ties to other related organizations, such as professional cooperatives, governmental agencies and research or teaching institutions. The economic activity tends to naturally concentrate from a variety of reasons, such as the presence of unique natural resources, the low distance from the markets and the low trading costs. The entertainment in Hollywood and the fashion in Milano are common cluster examples. An example of world clusters in an emerging country is represented by the informational technology in Bangalore, India.
The concentration of the economic activity has been observed for more than one century. In the book “The principles of Economics” (1890) Alfred Marshall has approached the positive collateral effects which appear when the economic activity is co-located. The “concentration” economics has been acknowledged by economists, at least from that moment. In the period after the release of Marshall’s book, cluster research has been dominated by the economic geographers that studied the cities’ formation and development. In 1990, Michael Porter, professor at Harvard, brought the cluster concept into the main debates regarding the business strategies and economic development, through his extended study on clusters, “The Competitive Advantage of Nations”. 2. Conceptual approaches of the clusters’ role in regional development
When we define the cluster, we can claim that there is no unique definition. Starting from the 50’s, the subject has started gaining attention and has been debated by the specialists in regional sciences, architecture, urbanism, urban and regional economy, political sciences and business organizing. They all defined the cluster concept, underlying the determinants and its positive or negative effects. For example, urbanists consider that cities play a major role in cluster development; in regional economics, it is considered that clusters are influenced by economic factors such as localization, transports, infrastructure or workforce.
Cluster theory and its appliance and the economic development policy based on clusters are in the top of the regional economic development theory and practice in the last decade. Cluster theory suggests that companies in a well-defined geographic cluster have numerous advantages which lead to the growth of the region’s economic output. These advantages appear as a result of co-location or geographic proximity, which, in turn, generate lower production costs for the companies due to the agglomeration economies and ease the dissemination of knowledge which support the innovation and the growth of productivity. As a result, companies in the clusters that generate these benefits will be more competitive, and the regions with efficient clusters will report a higher growth.
241

Annals of the „Constantin Brâncuşi” University of Târgu Jiu, Economy Series, Issue 3/2016
„ACADEMICA BRÂNCUŞI” PUBLISHER, ISSN 2344 – 3685/ISSN-L 1844 - 7007
The phenomenon which is nowadays known as the cluster theory has been initially elaborated by Michael Porter in his paper regarding the competitive advantage. The competitive advantage concept and the theory Porter developed started from the comparative advantage theory, initially proposed by David Ricardo, which represented the basis of early theories regarding the location and concentration.
The main initial concern of Porter was to identify the conditions in which companies might become and remain competitive and, thus, to succeed on international markets, which is a condition for the regions and nations to become competitive. He concluded that, for the companies to succeed, they must build their strategies on permanent optimization and innovation, on their firm desire to compete and on the realistic understanding of the national and local environments, with and essential role in this process.
From this perspective, Porter described a such-called “diamond of competitive advantage” in his work, which stands at the basis of clusters. The diamond’s main elements are the production factors (qualified workforce), the nature of the domestic demand (the demand influences the innovation in companies), the related and providing industries (due to the intermediate network, the distance between providers and producers gets lower) and competition, the structure and strategy of the company (in order to remain competitive, companies must continuously innovate and invest) (Porter, 1998). Subsequently, he developed this theory claiming that the interactions within the competitive advantages are more intense, and, as a result, more efficient when companies operate in the immediate proximity (Porter, 2000).
As a proof, Porter underlined the fact that clusters that are consist of companies from similar industries are “amazingly familiar worldwide” and that the most prosperous global companies in one country might be grouped. He also noticed that 99% of the workforce occupation at the level of regional economies in the USA is concentrated in local clusters (Martin, Sunley, 2003). At this scale, clusters can generate competitive advantages through high productivity levels, superior innovation and the development of new businesses (Porter, 1998).
Porter identifies the local and national competition, and, especially, the exposure to the international competition as the main forces of the clusters’ emergence and growth, considering the systemic nature of the diamond. From his point of view, once the competitive companies succeed in growing through innovation and productivity, a demand is also generated for the companies in the related industries and a competition between the developing companies. Competition determines companies to be more productive and create new technologies and competences, which, in turn, support the development and lead to the creation of new companies in the area, as a result of higher and higher demand.
Porter’s definition is just one of the many existing in the literature. The meaning of “cluster” is somehow ambiguous, and the concept is frequently used in different ways by different authors. Despite the large scale use of the cluster’s analysis and strategy, the real meaning of the concept is somehow imprecise and ambiguous. Martin and Sunley (2003), in an extremely critical article, claim that the cluster concept “has gained so much uses, meanings and significations, that, from many perspective, it has become a chaotic concept”.
The modelling of the cluster definition has become more and more complex, with academicians using it in different conditions, by adapting, transforming and redefining the significance of a cluster. A large part of this work has been robust and useful (for example, Bassett et al, 2002; Henry, Pinch, 2000; Henry et al, 1996; Nachum, Keeble, 2003), but, in most case, the clusters cartography hasn’t allowed the identification and understanding of the ties, externalities and the flows within an industry and outside a region (Bathelt et al, 2004; Dunford, Greco, 2006; Saxenian, 2006).
The search for a coherent definition did not succeed, and, at the middle of the 2000’s, the “cluster” concept was used to address a “localized industrial configuration, such as a local or regional concentration of industrial companies, as well as the supporting infrastructure, which are strongly related through commercial and non-commercial interdependences” (Bathelt, 2005). Porter’s cluster concept was now so large that it included tens of years of academic work. Such an “indulging thinking”, though, led the academicians to the act of describing the cluster concept as “unclear” (Markusen, 1999), “chaotic” (Martin, Sunley, 2003) and, as a “conceptual headache” (Malmberg, Power, 2006). These critics focused on the methodological aspects, attacking the use of case studies that cannot be generalized and by “soft” hard to evaluate features (Markusen, 1999), the lack of accuracy in definitions (Martin, Sunley, 2003), the weak explanation of key-features (Noteboom, 2006), the ambiguous use of etiquettes (Belussi, 2006) and the confusing appliance of previously elaborated concepts (Malmberg, Power, 2006). As Taylor (2010) claimed, “the cluster model was built through accumulations of intervention layers, generated by interpretation, reinterpretation, assumption and extrapolation of some stylized facts supported by a weak empirism”.
3. The benefits of cluster development over companies and regions
When searching for competitive advantages, regions and local actors must specify the methods of restructuring the spatial organization of production in order to improve the performance and social relations. Industrial clusters are known as playing an important role, both in the regional economic development and in the improvement of the living standards. Clusters are frequently example of good practice in production and can be used to stimulate the modernization of local companies (Altenburg, Meyer-Stamer, 1999) and of the local artisanal activities.
242
Annals of the „Constantin Brâncuşi” University of Târgu Jiu, Economy Series, Issue 3/2016
„ACADEMICA BRÂNCUŞI” PUBLISHER, ISSN 2344 – 3685/ISSN-L 1844 - 7007
Though, at a first glance, the concentration of similar companies might seem negative due to the generation of an excessive level of competition, it is positive both for each of the involved companies and for the regional and national economy. Clusters provide the companies with numerous benefits that wouldn’t have been reached if they would have activated in isolation. These are the direct result of the advantages reached through the high proximity activity with companies and institutions that provide complementary goods and services or other specialized performances. Significant benefits also result from the collaboration between similar companies, as it allows lower costs and the access to ideas, information, technologies and good practices.
Concentration economies represent external benefits that are gained by companies as a result of co-location. In other words, these are real benefits for the companies under the form of input costs’ reductions or productivity growths. As Phelps (2004) notes, the development of the cluster based on the external agglomeration economies favors the economic growth through one or both of these processes:
ü through the reduction of input costs (pecuniary economies) of a company benefiting from external economies;
ü through the increase in the companies’ productivity, so that they become capable of producing more output per input unit (technological economies).
There are many different processes that can produce these benefits. These include the workforce concentration, the separation of inputs, the providers’ specialization through the increase of the providing industries and branches, the development of a common infrastructure, the reduction of the transportation costs, niche consumers’ markets, the dissemination of knowledge (which can result from the social interaction), competition and behavior modelling. Bergman and Feser (1999) provide additional proximity examples based on the concentration economies, such as “the higher market power through intermediate selling and buying, a better availability and use of the specialized repairing technologies, the common infrastructure, the reduction of risk and of the uncertainty for the aspiring entrepreneurs, as well as a better informing”.
Clusters provide a series of potential positive benefits, above the lower production costs, which lead to innovation and productivity growth. Such benefits include their role as a useful platform for the knowledge exchange, as an environment that favors a higher specialization and a higher level of challenge that motivates competition. The main reason of the clusters’ policy interest is that productivity, salaries and the workforce occupation, seem, at least in some cases, to be higher in these groups that in the general economy (OCDE, 2007).
Clusters assume a better cooperation and a higher competition between direct competitors than between the geographically spread industries. High cooperation within clusters can be manifested through the fact that there are more activities the related companies can share, such as the en detail buying, common investments in infrastructure, the environmental control and the basic training than in the case of spread companies (Enright, 2001). Success stories show that clusters, through the growth of individual companies’ competitiveness growth, provide macroeconomic benefits, of which (European Commission, 2002):
ü the augmentation of regions’ attractiveness - the clusters and the networks will contribute to the stimulation of competences’ development in the region, as well as to the motivation of the individuals not the migrate;
ü the growth of the orientation towards the needs of the business supporting services – efficient clusters and networks that strongly operate in the field of research and development will cooperate with the research institutes and universities. As a result, they contribute to the continuous development of regional competences and the research infrastructure.
ü the insurance of workforce occupation and the promoting of the entrepreneurial spirit – the production field is a large provider of work and contributes to the GDP; this is due to the SME-s which represent the providers of large producers. The advantage of clusters can vary in time, but, generally, the cluster allows a certain flexibility degree in the
structure of the company and within the activities’ management, which can evaluate at once with the technological changes, the tastes, the company’s strategy and the competitive environment. Many of these processes lead to scale yields, which are external to an individual company and which result from the localization of a large number of companies that are located close to each other. Krugman (1991) and others consider these scale yields as the basic economic process through which concentration economies emerge. 3.1.The effects on companies’ competitiveness
Clusters ensure the companies from within an economic environment which leads to the growth of productivity, at least on the following ways:
ü companies within that cluster have access to a diversified qualified workforce and to input providers, which leads to the reduction of the transaction costs, the reduction of raw materials stocks, materials, components and the elimination of possible delays due to the external providers. The emergence of a local specialized workforce deposit for a certain field can reduce the transaction costs of the adequate personnel searching process.
243
Annals of the „Constantin Brâncuşi” University of Târgu Jiu, Economy Series, Issue 3/2016
„ACADEMICA BRÂNCUŞI” PUBLISHER, ISSN 2344 – 3685/ISSN-L 1844 - 7007
ü another benefit gained by companies is the access to local specialized information (from the technical field, marketing and commerce, organizing and management, etc.) through which they can optimize their activity.
ü the access to public institutions and goods: superior research, professional training programs, testing laboratories, quality control centers, etc.
ü the complementarities resulting from the benefic activities of clusters on other fields. ü the evaluation and comparison of performance (benchmarking – local competition, competitive pressure and
pride, factors that motivate companies to improve their productivity and the other performance parameters). 3.2. Effects on the innovation activity
Clusters generate an environment that eases innovation through the easier access to a large variety of information, knowledge, market analyses and contacts. At the same time, the competitive pressure of similar companies located in the immediate proximity represents an permanent stimulus for the improvement of processes, technologies, products and services form the own offer of each company in the cluster. Geographical proximity eases the transfer of new ideas and even innovations regarding the technologies, products and services from a company to another, thus contributing to a fast spreading of good practices. Clusters ease the innovational process of the companies within, at least through:
ü the improvement of the company’s ability to understand the opportunities regarding the innovation by easing the contact with new sophisticated clients and creating some long term business relations with them, which are to allow the providing companies to become aware of the market needs and technological evolution in a faster manner.
ü companies have the ability to gain the needed materials through the permanent contact with providing companies and institutions.
ü the competitive environment is the one that encourages the companies to react through innovation against the competitive pressure and the comparisons that are constantly made between the companies in a cluster
ü the cluster provides more advantageous conditions for the easing of experiments at lower costs. 3.3. The effects on the emergence of new companies
The emergence of new companies also represents a good way of introducing new products and services and new business methods. And, from this point of view, the presence of clusters is benefic, as they support the emergence of new businesses, as:
ü the existing delays, lacks and opportunities are better noticed by the possible investors in a cluster. ü the local financial institutions seem to be more willing to give loans within clusters, as they know better the
respective activity field and the implied persons. ü due to the clients’ base, the lower costs and risks resulting from the high ease with which one can identify the
opportunities the market provides, the providers are more willing to locate themselves in a cluster. ü the specialization eases the transition from the dependent to the independent work.
3.4. The effects on transaction costs
Extremely high transaction costs can slow down the companies’ growth, especially of the ones which aim at becoming global companies. Companies which activate within a cluster can reduce these transaction costs by developing specialized consortiums, by exchanging information and by taking part in informal networks, by accessing some specialized services, provided by governmental agencies (market information, information that is specific to different countries, statistical data, etc.) and by establishing some working relations with technical high-schools and universities (Ammirato, Kulkarni, Latina, 2003). 3.5. Effects regarding the management of change
Companies must face, as much as possible, the need of adapting themselves to the changes of the demand, given the growing competition on the international markets. This is why we even speak about their ability to manage the change, from the perspective of the ability to notice and take advantage of the opportunities it creates and also to avoid the traps it lays. To this extent, companies need more information regarding all the economic, judicial and political aspects that influence the business environment. As well, they require access to technical and management abilities, access to technology, research and development, financing and market information. Clusters serve as a proper environment for the development of business, thus ensuring the regional development. Stimson and others (2006) claim that clusters are the promoters of regional development and are used to frame the
244

Annals of the „Constantin Brâncuşi” University of Târgu Jiu, Economy Series, Issue 3/2016
„ACADEMICA BRÂNCUŞI” PUBLISHER, ISSN 2344 – 3685/ISSN-L 1844 - 7007
regional development policy. However the business development in a certain region does not depend only on the cluster’s existence and development. According to Chapman (2009), important factors for the location of a company in certain geographical areas are the costs (materials, energy, field, workforce, capital), the incomes and the incomes-costs factors (transportation, infrastructure, concentration, policy). The cluster consists of the interaction of all these factors and provide favorable conditions for a business through the reduction of costs and the increase of the incomes.
The cluster theory claims that productivity, the innovation ability and the cluster’s competitiveness lead to the increase of the productivity of work (Puga, 2009), to the emergence of more numerous and better employment opportunities (Fullerton, Villemez, 2011; Matano, Naticchioni, 2012) and to the increase of the salaries (Katz, Liu, Vey, 2006). W.C. Wheaton and M.J. Lewis (2002) show that an equal number of employees in the industry gain more when the company is in the urban area and if the workforce occupation in the industry covers a high percentage of the occupation in the region. A study carried out in Colorado (Patton, Rewete, 2003) show that the strong competition in the cluster leads to the fact that companies are not only forced to offer higher salaries for their employees, but also better working and living standards and privileges. Brenner and Gildner (2006) claim that companies in the cluster provide the local authorities with the resources needed to improve the infrastructure trough the payment of taxes. The increase of the taxes cashing leads to a better education and transportation infrastructure and to a higher attractiveness of the region, which, in turn, stimulates the growth cycles.
The theoretician and economist that related the regional development of businesses to the growth of salaries and of the living standards in the theory of the regional cluster is the founder of the modern theory of the cluster, Michael Porter, in his work, “The economic performance of regions”. He analyzed the regional differences, such as the average salary and the growth of the workforce occupation, the emergence of new businesses and the patent acts per 100.000 inhabitants and the correlation between these indicators in the USA between 1990 and 2000. After that he divided the industries in the USA as it follows: trading, local and resource dependent industries. In what concerns local industries, the workforce occupation is dispersed across the regions in a homogeneous manner – which implies that the workforce occupation is almost corresponding to the population in a region. Local industries provide goods and services on the local or regional market where the workforce is occupied. In the resource-dependent industries, the workforce occupation firstly happens where the needed natural resources are found, but these industries compete with other internal and international companies. Trading industries are the ones that sell products and services over the regional and national boundaries. They are located in a certain region, but not based on the resources, but based on wider competitive reasons, and the concentration of the workforce occupation is significantly different depending on the region. The statistical analysis shows that the identified clusters strongly influence the average salaries and the regional growth of the salaries, as well as other regional development indicators, such as the productivity, the workforce occupation, the innovation ability. As Porter concludes, the regional economies’ performance is strongly influenced by the power of the local clusters and the vitality and the amplitude of innovation. Porter’s additional researches show that clusters are found both in the metropolitan areas and in the rural areas that create similar economic benefits.
Porter, alongside with M. Delgado and S. Stern, carried out the “Clusters and entrepreneurship” (2010) and “Clusters, convergence and economic performance” (2010) studies, which continue Porter’s studies regarding the interactions between clusters and regional development. First of all, authors found a positive correlation between clusters and the development of the regional entrepreneurial spirit, and continued the researches on two different dimensions: industry-region and region-cluster. In the studies of the industry-region dimension, the authors show that the existence of a cluster in a certain sector leads to regional development, which can be evaluated through indicators such as the occupation of the workforce, the development of new businesses, salaries, the patenting ability. In the studies regarding the region-cluster dimensions, the authors have confirmed that the cluster develops in a faster manner if it has strong related relations to other clusters. Based on the empirical researches which have emphasized positive interactions between the presence of the cluster and the development of the region, C.H.M. Ketels (2008) summarizes that the clusters are the important moving force of regional development.
A debate regarding the benefits of the specialization and of the clusters would be incomplete without mentioning the potential risks associated to a politic strategy that favor the clusters. The risk concept has more dimensions. As for the strategy, industries’ attractiveness with high growth can lead to a cluster approach that tries, in an unrealistic manner in most of the cases, to generate a critical mass in fields such as the sciences of life and the IT-C in which the competition is significantly strong and the public investments requirements are relatively high. This raises the question whether the clusters can be created and, if the answer is positive, at which costs. There are also risks regarding the structure of the cluster. Regional economies based on small companies which activate in the same fields or in related fields can be vulnerable to the shocks in the market that simultaneously weaken all the companies in the cluster. Also, the Hub and state owned industrial clusters can be seen as vulnerable if the essential company leaves or lowers its activity. Another form of risks is the one that the companies in one cluster can become closed or rigid, thus resulting the blocking effects (when the major investments that support the fields or the clusters will make the subsequent adaptation of the strategies to the new conditions more difficult) as the cluster is less available to adaptation (OCDE, 2007).
245

Annals of the „Constantin Brâncuşi” University of Târgu Jiu, Economy Series, Issue 3/2016
„ACADEMICA BRÂNCUŞI” PUBLISHER, ISSN 2344 – 3685/ISSN-L 1844 - 7007
4. Conclusions The studies of the clusters have represented the basis of the industrial policy that has been adopted by many countries. Clusters are now seen as an important policy instrument that can be used to stimulate innovation and to support the competitive advantage of companies, and, as a result, to increase the competitiveness of regional and national economies. Nowadays, it is considered that the cluster management supposes the creation of good relations between partners and of some cooperation links between local authorities and governmental agencies, companies and the research communities. The efficient cooperation between these three spheres is crucial in order to ensure the economic growth in a region. The government, the industry and the research community interact through the mutual knowledge exchange, thus creating an innovative spiral. The economic literature emphasizes the positive relation between clusters and the companies’ productivity and efficiency, supposing that the geographical concentration and the collaboration relations of companies promote the efficiency and the productivity. As well, there are positive relations between clusters and the innovation ability of companies, the companies that cooperate with other companies and institutions, creating and implementing the innovations in a more efficient manner. Productivity, the innovation ability and the growth of the growth of the geographically concentrated companies’ efficiency contribute to the company’s competitiveness. Researchers have also found out the existence of some positive relations between clusters and the development of the existing companies and the appearance and the survival of start-ups. The mentioned positive aspects lead to the regional growth and development. Empirical and theoretical studies have emphasized the fact that clusters create a proper environment for business growth and development, which ensure the growth and development of regions.
6. Reference list
[1] Altenburg, T., Meyer-Stamer, J. (1999), “How to Promote Clusters: Policy Experiences from Latin America”, World Development, vol. 27, no. 9:1693-1714 [2] Ammirato, P., Kulkarni, A. and Latina, D. (2003), “Clusters -Victorian Businesses Working Together in a Global Economy”, Discussion Paper, Cluster Working Group, Department of Innovation, Industry and Regional development, Melbourne, Australia, October 2003 [3] Bassett, K., Griffiths, R., and Smith, I. (2002), “Cultural industries, cultural clusters and the city: the example of natural history film-making in Bristol”, Geoforum, 33, 165 – 177 [4] Bathelt, H., Malmberg, A. and Maskell, P. (2004), “Clusters and knowledge: local buzz, global pipelines and the process of knowledge creation”, Progress in Human Geography 28: 31-56 [5] Belussi, F. (2006), "In search of a useful theory of spatial clustering" in Asheim, B., Cooke, P. and Martin, R. (eds.) Clusters and Regional Development, Routledge, pp. 69-89 [6] Bergman, E., Feser, E. (1999), “Industrial and Regional Clusters: Concepts and Comparative Applications”, The Web Book of Regional Science, Research Institute, West Virginia University, http://www.rri.wvu.edu// WebBook/Bergman-Feser [7] Brenner, T., Gildner, A. (2006), “Long-term Implications of Local Industrial Clusters”, European Planning Studies. 14 (9): 1315-1328. http://www.tandfonline.com/doi/abs/10.1080/09654310600933371? journalCode=ceps20. DOI: 10.1080/09654310600933371 [8] Chapman, K. (2009), “Industrial Location” in Kitchin, R., Thrift, N. (eds.) International Encyclopedia of Human Geography, Elsevier Science. p. 396–401 [9] Dunford, M., Greco, L. (2006), After the Three Italies: Wealth, Inequality and Industrial Change. Blackwell, London [10] Enright, M. (2001), "Regional clusters: What we know and what we should know", International workshop on innovation clusters and interregional competition, Kiel, 12-13 November [11] Fullerton, A. S., Villemez, W. J. (2011), “Why Does thebSpatial Agglomeration of Firms Benefit Workers? Examining the Role of Organizational Diversity in U.S. Industries and Labor Markets”. Social Forces. 89 (4): 1145–1164. http://muse.jhu.edu/journals/social_forces/summary/v089/89.4.fullerton.html [12] Henry, N., Pinch, S. (2000). “Spatialising knowledge: Placing the knowledge community of Motor Sport Valley”, Geoforum 31(2):191–208 [13] Katz, B., Liu, A., Vey, J. (2006), Making Sense of Clusters. Regional Competitiveness and Economic Development. http://www.brookings.edu/~/media/research/files/reports/2006/3/cities%20 cortright/20060313_clusters [14] Ketels, C.H.M., (2008), Clusterpolitik fuer Deutschlands Wettbewebrsfaehigkeit. 1. Deutsche Clusterkonferenz, Leipzig
246

Annals of the „Constantin Brâncuşi” University of Târgu Jiu, Economy Series, Issue 3/2016
„ACADEMICA BRÂNCUŞI” PUBLISHER, ISSN 2344 – 3685/ISSN-L 1844 - 7007
[15] Krugman, P. (1991), Geography and trade, London: MIT Press/Leuven UP [16] Malmberg, A., Power, D. (2006). “True Clusters / A Sever Case of Conceptual Headache” in Asheim, B., Cooke, P. and Martin, R. (eds.) Clusters and Regional Development, Routledge, Routledge: 50-68 [17] Markusen, A. (1999). “Fuzzy concepts, scanty evidence, policy distance: the case for rigour and policy relevance in critical regional studies.” Regional Studies 33: 869-884 [18] Martin, R., Sunley, P. (2003), “Deconstructing Clusters: Chaotic Concept or Policy Panacea?” Journal of Economic Geography, 3 (1), pp. 5-35 [19] Matano, A., Naticchioni, P. (2012) “What Drives the Urban Wage Premium? Evidence along the Wage Distribution”.: http://www.ub.edu/irea/working_papers/2012/201203.pdf [20] Nachum, L. & Keeble, D. (2003). Neo-Marshallian Clusters and Global Networks: the Linkages of Media Firms in Central London, Long Range Planning, 36(5) [21] Nooteboom, B. (2006), “Innovation, learning and cluster dynamics”, in Asheim, B., Cooke, P. and Martin, R. (eds.) Clusters and Regional Development: Critical reflections and explorations, Routledge, London. (137-163) [22] Patton, O.M., Rewete, W.S.J. (2003), Industry Clusters for a State of Colorado: Workforce Research and Analysis. Colorado: Colorado Department of Labor and Employment [23] Phelps, N. A. (2004). “Clusters, dispersion and the spaces in between: for an economic geography of the banal”. Urban Studies 41: 971. [24] Porter, M.E. (1998), On competition, Boston: Harvard Business School Press [25] Porter, M. (2000), “Location, competition and economic development: local clusters in the global economy”, Economic Development Quarterly 14, 15-31. [26] Puga, D. (2009) “The Magnitude and Causes of Agglomeration Economies”, Journal of Regional Science. 50 (1): 203–219. onlinelibrary.wiley.com/doi/10.1111/j.1467-9787.2009.00657.x/abstract. DOI: 10.1111/j.1467- 9787.2009.00657.x [27] Saxenian, A. (2006). The new argonauts: Regional advantage in a global economy. Cambridge, MA: Harvard University Press [28] Stimson, R. J., Stough, R., Roberts, H. (2006), Regional Economic Development: Analysis and Planning Strategy Revised Edition., Berlin, Springer Taylor, M. (2010). "Clusters: a Mesmerising Mantra," Tijdschrift voor Economische en Sociale Geografie 101(3): 276-286. [29] Wheaton, W. C., Lewis, M. J. (2002) “Urban Wages and Labor Market Agglomeration”, Journal of Urban Economics. 51 (3): 542–562. http://www.sciencedirect.com/science/article/pii/S0094119001922570. [30] ***, (2002). Innovation Clusters in Europe: A Statistical Analysis and Overview of Current Policy Support, PRO INNO Europe Paper No. 5, 26 [31] ***, (2007). Competitive Regional Clusters: National Policy Approaches, OCDE, http://www.oecd.org/gov/regional-policy/competitiveregionalclustersnationalpolicyapproaches.htm
247

Annals of the „Constantin Brâncuşi” University of Târgu Jiu, Economy Series, Issue 3/2016
„ACADEMICA BRÂNCUŞI” PUBLISHER, ISSN 2344 – 3685/ISSN-L 1844 - 7007
VIRTUAL CURRENCY "BITCOIN" – CHALLENGES AND CONTROVERSIES
ȘOAVĂ GEORGETA
PHD PROFESSOR, UNIVERSITY OF CRAIOVA, FACULTY OF ECONOMICS AND BUSINESS ADMINISTRATION,
e-mail: [email protected]
MEHEDINȚU ANCA PHD ASSOCIATE PROFESSOR, UNIVERSITY OF CRAIOVA, FACULTY OF ECONOMICS AND
BUSINESS ADMINISTRATION, e-mail: [email protected]
SITNIKOV CĂTĂLINA
PHD PROFESSOR, UNIVERSITY OF CRAIOVA, FACULTY OF ECONOMICS AND BUSINESS ADMINISTRATION,
e-mail: [email protected]
Abstract In the knowledge society, when there is a rapidly evolving information technology, the virtual markets, namely
the online transactions, have created the premises emergence and development of new technologies of using of finances, namely virtual coin (Bitcoin). Use of this coin appears as an alternative to traditional currencies, but they are not under the control of no body, are devoid of inflation and maintain the anonymity of users. Following the evolution of this new type of coin, we proposed in this paper to present some general aspects of this coin focusing on global controversies on using Bitcoin. We have reviewed several myths that have arisen with the development and penetration of its on market and because it is a volatile coin can generate huge gains but and huge losses, we have studied fluctuation and implications for users and investors and the attraction of the drug dealers and criminals for using virtual currency, Bitcoin. At the end of the paper, based on the analysis we have tried to outline the future of this modern payment system. Thus, we found that lately, in that its value has fluctuated strongly, and increased buyer confidence, but appeared and increased cyber attacks, and the fear that if the state has no a role in protecting citizens from fraud, we can assist at the development of financial schemes extremely dangerous. The financial experts believe that if the world banks would jointly solve all the problems, the virtual money will have a real chance of life. Key-words: virtual coin, fluctuation, transaction, controversies, financial instrument JEL classifications codes: D53, E42, G21 1. Introduction
In the era of globalization, of the knowledge society, the money world had to adapt continuously, being in
continuous transformation. The evolution of information technologies and development of virtual markets have led to the development of a new way to trade in the online environment, faster, secure and all accessible. In this way, palpable cash transactions were replaced first of cards, smartcards, for as in recent years to develop virtual coin, Bitcoin, a modern technology which is expected to have a huge potential in the future business. Digital coin, is not tangible, it is basically a secret number transferred from one part to another, through network software based on public cryptic passwords.
The idea of a digital coin, however is not new, virtual coins are used more time of the fans of video games (World of Warcraft or Second Life), or on online trading platforms (Amazon). The overall objective of using this coin was to support the global economy, the big corporations and the very rich persons to avoid paying taxes. These issues have incited us to a deeper study, and thus in this paper we aimed to highlight some of the controversies arising from using Bitcoin worldwide. For this we analyzed several myths that have emerged with the development and penetration of its market and because it is a volatile currency can generate huge gains and huge losses we have studied fluctuations and implications for users and investors.
Nowadays, people are accustomed keep to shelter their money through banks, while for Bitcoin disappears protection offered by banks, so they are at any moment in danger of being robbed. Nevertheless, the success of virtual coin Bitcoin has inspired a lot of anonymous programmers to create other virtual currencies, and financial experts
248
Annals of the „Constantin Brâncuşi” University of Târgu Jiu, Economy Series, Issue 3/2016
„ACADEMICA BRÂNCUŞI” PUBLISHER, ISSN 2344 – 3685/ISSN-L 1844 - 7007
believes that if the world banks would jointly solve all the problems, the virtual money will have a real chance of life. Although the developers consider as it one of the most interesting and challenging problems of informatics in recent years, they are both concerned and intrigued by Bitcoin.
New technology has completely changed how to use finance, offering a multitude of options trading, both for individual users as well as investors and governments. At government level, these may be opportunities to reduce costs, simplify processes and closeness to citizens. The new financing systems are not yet ready to replace those now existing, more complex, but their tendency is constantly growing, especially due to the anonymity and low operating costs. 2. Bitcoin - pros and cons
Virtual currency Bitcoin is an alternative to traditional coins (supported by a government) because it does not depend on a specific bank or state, is not controlled by any state and is devoid of inflation. In this way, Bitcoins is a digital coin that allows users to transfer capital from some "wallets" virtual, without the use of banks, what you making transactions to be difficult to pursue. The software, hold controls regarding the number of Bitcoins, unlike real money run by banks.
When we refer to Bitcoin, we regard the decentralized electronic payment system for the use of coin and inventory of transactions, which involves open-source software, which involves investing a significant amount (millions of dollars).
Expert opinion was from the beginning both pro and con. Some believe that by making this digital coins, it has released the first global financial network, fully decentralized cryptographic (information is transmitted encrypted) in which is allowed to hold and transfer securities anonymous. Others, however, warn that this coin has all the characteristics of a speculative bubble, especially after Satoshi Nakamoto (Bitcoin creator's name) has disappeared from the internet sphere. Many skeptics, since the advent of the coin, put the question "Why use virtual currency instead of traditional payment instruments?"
Investors attracted to new technology and virtual coins followers, believes there are a number of advantages of using them:
§ ensure maximum protection of privacy of individuals; virtual coin holders can retain their anonymity, which is very attractive for investors, given that keeping assets offshore is becoming more dangerous;
§ facilitates people's ability to buy of anywhere in the world, regardless of local monetary situation and restrictions; ü transactions are cheaper to process and sometimes faster, thus: ü taxes on transactions for virtual coin payments tend to be around one percent, compared with the required
percentage of credit cards between 2 and 5 percent; ü there is no charge for transactions abroad; ü because the payments are not made with banks, money transfers from buyer to seller is done in the same
day; § financial data are more secured than when using credit cards; § the system doesn’t allow seizure. Although Bitcoin market is volatile, which somewhat limits the behavior Bitcoin as coin, more and more users
consider it as an exchange coin that is traded instant, on a free market, price is determined by supply-demand ratio. According to David Jones, analyst at IG Markets, coins Bitcoin give a sense of stability and safety, since they
have a limitation in terms of their number, just like gold [1]. The fact that virtual currencies are not subject to regulations, make them very attractive. This, however, can also
be a big disadvantage, because hackers can penetrate, abusive, illegal in the system and to generate a lot of Bitcoins. Being a virtual currency is vulnerable to hackers, but coin can not be attacked, but digital wallets in that is virtual money. Even if Bitcoin is only in its infancy and firet annual reports showed large increases, economists have not great confidence in the strength of the coin which, they say, in the absence of well-defined rules and clear coverage, is far too unstable and is doomed to end as any other virtual currency so far [2].
This has fueled the controversy regarding digital coin, Bitcoin, being equally pros and cons, of using it as means real money, which led to multiple comments from different categories, economists, journalists, investors and speculators alike.
It is natural that the emergence of this new coin offers the specialists a new area to explore and analyze, with specific controversies. Because the Internet is much erroneous information, it is natural to have a lot of misunderstandings about the virtual currency Bitcoin. We'll try to go over some myths emerged on based using of virtual coin Bitcoin, and we try to shatter:
1. Bitcoin hasn’t value - some specialists believe that Bitcoin have no value because it does not have any support (bank, government, etc.). In reality, the value is determined subjectively, acting in a free market, price is dictated by supply and demand, having the value attached to it by users;
249

Annals of the „Constantin Brâncuşi” University of Târgu Jiu, Economy Series, Issue 3/2016
„ACADEMICA BRÂNCUŞI” PUBLISHER, ISSN 2344 – 3685/ISSN-L 1844 - 7007
2. Bitcoin is established as a broad pyramid schemes. To constitute such a scheme, requires however, of an organization to guarantee investors a profit. But Bitcoin not is palpable, is a virtual currency that does not have a specific regulation, with no one to guarantee a certain profit;
3. Bitcoins is created to conduct illegal activities. As was noticed lately because of unpleasant events related to drug trafficking, use this coin has acquired a bad reputation. But do not must abstracted the use mode of digital currency, should be highlighted and other means of use of coin, and investors which trust this modern means of payment;
4. Direct method of obtaining Bitcoin (mining) is harmful to the environment. This is based on the huge energy use, but comparing the amount of energy used in other industries, this consumption is very small, and thus less harmful to the environment;
5. Impossibility of using Bitcoin coins. The myth developed because it is relatively new, the currency is not widely used in banking. But a simple check on the Internet, it is observed that there are several markets online and offline where you can trade with Bitcoin.
3. The implications fluctuation of the coins "Bitcoin"
It can be seen that Bitcoin is a volatile coin that can generate huge gains for those who bet initially on coin
appreciation but and massive losses due to fluctuations. Since the first transactions from 2009, Bitcoin has had a relatively stable until 2011, when prices fluctuated heavily between cycles the various appreciation and depreciation, the value of Bitcoin has grown at a fast from $ 0.30 to $ 32 after which fell to $ 2. At the end of 2012, Bitcoin was traded almost $ 13 before being widely accepted and the speculators to rise the prices.
2011 and 2012 are considered periods of consolidation Bitcoin rate at the end of 2012, Bitcoin was traded almost with $ 13, before being widely accepted and prices to climb by speculators. Even thoughhad many fluctuations, been strongly affected by every rumor which predicted apocalypse Bitcoin, the virtual currency resisted all attacks and became in 2013 rescue the some Cypriots with digital dexterity, who afraid of domestic banks bankruptcy, and they turned all savings into Bitcoin. Largest coin appreciation came after its entry in the Chinese market. Cyprus crisis has led to double the value of Bitcoin, which has attracted a lot of investors from Spain and Greece, are looking for a safe investment. Another factor which led to increased Bitcoin price has been the massive investment in infrastructure and the involvement of investors from WallStreet, among the most famous being the Winklevoss twins. Also, very high volatility of this coin, leads bankers and brokers to consider them as a speculation likened to gambling. In early April 2013, only two days, virtual coin, Bitcoin depreciated by over 70%, which proved most experts predict, that "the currency issued by private individuals can’t increase indefinitely" [3].
Thus, during the Cypriot financial crisis, Bitcoin price soared, reaching a maximum of $ 266 on April 10, 2013, then plunged to $ 50 / Bitcoin.
At the beginning of 2013, a Bitcoin cost $ 20, in just three months and a half, reached the value of 270 dollars, practically observe that appreciated to 1300%, and considering that the early investors were paid five cents for Bitcoin, we realize that profits were astronomical. But note, that after this massive increase, immediately had drastic drop to about $ 70. I believe that this was possible due to the lack of a regulatory body, and failure against powerful financial flows.
Until in November 2013 was on the market about 12 million Bitcoin, so the new price increased capital Bitcoin on market, reaching 7.2 billion dollars, as of November 23, 2013, to cross the threshold of $ 10 billion. The highest price of all time of Bitcoin's was on November 29, 2013, when it was valued at $ 1.242 on Mt. Gox, then fell to $ 640 after the largest Internet market in China has not accepted deposits. The increase in such proportion Bitcoin's value has generated optimism in the use of digital coin with assumption that in the future will be more widely used. In this regard, in November 2013, the police and security agencies in the United States Senate hearings, emphasized that Bitcoin could be a legitimate means of exchange (the end of 2013, circulated on the Internet over 12 million coins Bitcoin).
The price increase for digital coin was achieved silent with Bitcoins accepting of merchants for any product on the internet. Zynga Inc. is one of the most recent merchants that accept Bitcoins to buy games on the Internet and after saying this, the price for Bitcoin again exceeded $ 1,000.
Bitcoin's price reached in early January 2014, $ 1,000 at exchange agency Mt. Gox, based in Japan, which caused Overstock.com to accept Bitcoin as payment method. Overstock's decision (based in Salt Lake City) to accept Bitcoin, as and Zynga interest to test Bitcoin on his platform, contributed to increasing the interest in digital coin, and thus on January 7 the price of on Gox has reached $ 1041.99. Overstock largest organization which accepted the Bitcoin won $ 130,000 after the first day of sales, evidenced by 840 orders. This success has led other companies (Newegg, electronics retailer), to accept the Bitcoin soon.
If Bitcoin's acceptance by powerful companies Bitcoin's price increases, the opposite is true, namely, Bitcoin prices plummeting after negative news (the Chinese news from December, when Baidu and China Telecom have ceased to accept Bitcoin).
250

Annals of the „Constantin Brâncuşi” University of Târgu Jiu, Economy Series, Issue 3/2016
„ACADEMICA BRÂNCUŞI” PUBLISHER, ISSN 2344 – 3685/ISSN-L 1844 - 7007
The price clearly contributes to increased interest from investors strong. In this respect, Fortress Investments planned using some significant funds in transactions with Bitcoin. An interest manifested and the Department of Financial Services of New York, which conducted a hearing on virtual coin policy and even the possibility of issuing some "Bit Licenses" for virtual users of money.
2014 has seen a rise in popularity of virtual currency but a massive fall in the value of them. Bitcoin has recorded spectacular falls, and the decline was not caused by cyber-attacks. Thus, many companies were forced to liquidate their reserves held in virtual currency.
By 2015, any discussion on Bitcoin was contradictory, due to controversies arising its use. But during 2015 Bitcoin position was strengthened, and the voices of skeptics are increasingly less vehement. Analyzing the price evolution (figure 1), we see that on 2015 Bitcoin started with extremely low levels appeared on the virtual collapse of massive currency from 2014 and made a slow increase yet firm.
Figure1. Bitcoin price evolution in 2015 [4]
2015 has meant continued growth in transaction volume and legitimization by a number of leaders (Larry
Summers, the head of US Department of the Treasury under the Clinton Administration, and UK Chancellor George Osborne) and financial institutions. Thus, people from different fields (from politicians to musicians) try to find multiple modalities to use this virtual currency.
Bitcoin price at the end of 2015 was $ 434, much lower than that at the end of 2013, when it was $ 1.216. But it is important not only the Bitcoin price, but also the number of daily transactions and we see in figure 2 that had reached a record level (over two times higher) in December 2015 compared to December 2014 [5].
Figure 2. Number of transactions feb.2015-ian.2016 [6]
Adam White, Coinbase vice president, said that in San Francisco, runs the largest Bitcoin exchange in the
world (2.8 million Bitcoin) and about 20 percent of his network activities involving payments in Bitcoin and 2016 is projected to importance increase. According to him, 2015 was the year that blockchain moved beyond digital currency, analysts considering that digital money can still change the world. Thus, the beginning of 2016 marks a special attention to Bitcoin because the blockchain support technology is used in reinventing the exchange of shares and
251

Annals of the „Constantin Brâncuşi” University of Târgu Jiu, Economy Series, Issue 3/2016
„ACADEMICA BRÂNCUŞI” PUBLISHER, ISSN 2344 – 3685/ISSN-L 1844 - 7007
securities. Blockchain is a database running on independent stations, oversees the exchange of Bitcoin, but can monitor and exchange of values (shares, bonds and futures, houses, cars) [5].
The fact that Bitcoin is the most popular way to run blockchain and transactions are growing, will certainly lead to a huge increase in Bitcoin price. Thus, if in 2015 Bitcoin has fared relatively calm, the year 2016 is expected to be more agitated. Specialists consider that the price of Bitcoin in 2016 will mark a significant increase in this sense Daniel Masters, co-founder of Global Advisors, predicts that the price of Bitcoin could rise to $ 4.400 by the end of 2017 [7].
Bitcoin price prediction for 2016 will depend on how are solved scalability problems and of use of viable Bitcoin platforms to attract the investors.
4. Developers position towards Bitcoin
In general, investors marched to purchase coin Bitcoin, once with the banking crisis in Cyprus (March 2013,
when deposits greater than $ 100,000 would be taxed at about 60%), which led to some fear in the financial markets, but also because central banks interventions on traditional coins.
For serious investors and for the stock exchange players are a professional variant of Bitcoin, SecondMarket platform where Bitcoin transactions are possible, as the input amount of $ 25,000. Among the big investors are world renowned players as FirstMark Capital, Social + Capital Partnership, Li Ka-shying Foundation and Temasek Holdings.
According to "The Economist" [8], most Bitcoin owners do not spend coins, they are kept in the hope that their value will increase. As the main means of holding these coins (Bitcoin wallet) was preferred for a fairly long time, Coinbase (December 2013 had over 650,000 users), which processes payments in Bitcoin digital coin on behalf of traders. In early 2014 received $ 25 million by funds from a group of investors led by Andreessen Horowitz.
BitMonet Company was concentrated on building some systems that forbid users to perform micro-transactions internet without paying a subscription, but from 2014 turned to mobile payments. Micropayments could become a big deal for the digital coin Bitcoin, but still there is a deadly micropayment application. Open source projects, such as BitMonet and TipperCoin, promoted the use of digital currency Bitcoin for small payments. Now, more and more profile companies, is oriented to mobile, as the future of payment, and Bitcoin digital coin can play an important role in this change. In this respect, Android, came to support the use of digital currency transactions by including an app that offers open source collaboration with BitMonet Coinbase digital wallet. The two companies have collaborated to create a software development package (SDP), for transactions achieving with Bitcoin in-app on Android, allowing users to send and are to receive digital currency Bitcoin on platform, which will increase the volume of transactions.
The main developer behind BitMonet, Ankur Nandwani, said that due to the use of this package could increase micro transactions in Bitcoin digital coin, especially since being small amounts for payment, does not relevant to the credit card processors due to their tiny charges . Also, application programming interface allows developers to send money after receiving permission from the consumer through a single click, without the need as users to enter Coinbase account whenever they want to make a certain payment [9].
Creators of virtual coins Bitcoin believes that Bitcoin is the currency of large equity holders, doge coin is for crowds on internet, and Coinye West is used to facilitate the use crypto-coin. After you in December 2013, Mel B of the Spice Girls sold her music on Bitcoins, and Snoop Dogg has expressed interest in using virtual coin for future launches. This made as Coinye creators to want to attract world music (from the purchase the virtual tickets to concerts at purchasing music).
Developers are preoccupied and intrigued by Bitcoin, considering it is one of the most interesting and challenging problems in computer science at this moment [10].
Generally people are accustomed to serve to shelter them money through banks, while for Bitcoin disappears the protection offered by banks, so they are at any moment in danger of being robbed. But at the same time Bitcoin is an open source and based on equity, which include the economy, accounting and many other markets, is actually an alternative to the current monetary system. In this way, Bitcoin becomes a challenge for the government, political systems and for companies.
In terms of financial support, the balance of coins increased, reaching 25 million at the beginning of January 2014 and Internet Financial Circle, led by former CEO Jeremy Allaire has a fund of $ 9 million to establish the payment platform for consumers and sellers. It is estimated that to be successful, Bitcoin has needs of development, more than anything [11].
So, Britain's chief scientific adviser urged the government to adopt blockchains technology to run Bitcoin in various public services. In Japan, began to use Bitcoin in the world of gambling (in the online gaming site Gesoten) for the payment of subscriptions and purchases of games.
Following the survey, it is observed that with increasing interest for Bitcoin grew and skeptics concerns, so Jason Calacanis [12] stated that "is the most dangerous technological project since the advent of the internet".
In this moment we can not know the total amount of virtual money on the market, but it is estimated that Bitcoin would be worth nearly a billion dollars. This makes the states of the world, governments are increasingly
252

Annals of the „Constantin Brâncuşi” University of Târgu Jiu, Economy Series, Issue 3/2016
„ACADEMICA BRÂNCUŞI” PUBLISHER, ISSN 2344 – 3685/ISSN-L 1844 - 7007
concerned about Bitcoin transactions, in provided that they want to constantly adapt to developments in information technology and communications.
Thus, in the G8 meeting were discussed transactions with digital coins, Bitcoin, these becoming an undeniable presence in the market. Consumers are exposed to significant risks using digital currencies, primarily due to major fluctuations but also because it doesn’t benefit from regulations to protect users. Thus, in several US states, is prepared the legislation for Bitcoin, and in October 2015 was established Alliance Blockchain a forum public-private (companies Bitcoin, US and foreign agencies, including the Department of Justice, FBI and the Commission Commodity Futures Trading), which helps to combat criminal activities related to Bitcoin and blockchain. Also, in September 2015 the European Court of Justice declared that Bitcoin transactions will be exempt from consumption tax, which could lead to an increase in the number with virtual currency transactions [13].
Silicon Valley although it is open to innovation, has received with skepticism new technology from the financial sector, Bitcoin, considering that it is difficult to rival the traditional banks. While they agree that digital currency would be the element that would complement the concept of commerce, believes that the digital currency market may develop for the interests not just legal. Thus, the digital coins payments can be made anonymous (like Internet made enable anonymous interactions), which can lead to fraud. However, are enough entrepreneurs which not rule out of using digital exchange, and consider exploring such a payment instrument.
The biggest problem is that Bitcoin users do not know how fast can be processed transactions since block size added in blockchain has grown steadily and so the transaction processing was slowed. It is certain that Bitcoin remains popular, and there is still huge interest in developing of currency and blockchain technologies of data recording. 5. Illegal business and Bitcoin
But once with the companies that perform legal activities, were attracted by Bitcoin's use, and drug dealers and
criminals that quickly get the taste of money and began to fund their operations using Bitcoin. According to The Economist [14], digital currencies have gained popularity because they claimed the dubious transactions, and processing fees and administration were lower than normal transactions.
Bitcoin is vulnerable to hacker attacks and can be used in criminal activity and money laundering. Some of the people have no confidence in their national coins, they believes that this digital coin is a really paradise, based on anonymity and protected from inflation. Thus, due to ensuring anonymity, can be purchased without any problems, the prohibited goods (drugs, weapons, etc.), which leads to a natural concern from regulators. In support of Bitcoin coin critics, that these would be used for illegal transactions, came and the arrest of two people in the company New Liberty Standard in January 2014, for buying black market narcotics with Bitcoin on black market and money laundering.
Two computer experts from Israel launched the hypothesis that virtual coin, Bitcoin, was created specifically for black market transactions, they basing on the link between founder anonymous of the coin Bitcoin and the Silk Road online store that sells drugs, weapons and smuggled goods. According to Israeli experts, the link between virtual coin founder and possibly of one of the investors of this illegal business is demonstrated by cashing in the store account 1000 of Bitcoin in January 2009, the month when he appeared Bitcoin as coin. In early 2013, because the amount was too high even for smuggled goods, bought from the Silk Road, the Israelis consider that would actually an investment of the virtual coin founder in online store. On October 1, at arrest of the store manager, U.S. federal authorities have seized nearly 145,000 Bitcoin, which was a part of the store receipts. Thus was recorded the biggest catch of Bitcoin obtained from illegal business by seizing of the Bitcoin wallet of the "Silk Road" market administrator, the equivalent of about 28 million dollars [15].
Through their work, Israeli experts have demonstrated that Bitcoin transactions are not perfectly hidden, but they are able to be traced by the authorities, in the conditions knowing of the certain details about the ones which handling Bitcoins. Supporters of Bitcoin consider this event, as an accident.
Colorado has legalized cannabis, drug addiction is strong, so at least one marijuana dispensary from Colorado, accepted the virtual coin Bitcoin. Because, the federal law forced the pharmacies to accept only cash, Bitcoin has become a tempting alternative.
There are about 350 licensed pharmacies in Colorado, and many analysts believe that the annual income by marijuana may be $ 500 million the amount is relatively large for a population of 5.2 million people. Nationally, marijuana market regulated by government is expected to double to $ 2.3 billion, and the state added at income the taxes $70 million from the sale of cannabis in 2014. In this respect, it is expected that Bitcoin transactions to grow rapidly [16].
The doubtful Business which could be able to trade, have been the reason for the Bitcoin virtual coin came under the attention of the FBI. The Securities and Exchange Commission of the U.S. accused a Texan (Trendon Shavers), which through virtual coin produced a similar fraud of Ponzi scheme. The charge was the fact that he cheated investors with Bitcoin coin in worth 4.5 million dollars, diverting some of the funds raised in their own interest. He sold virtual coins to pay their rent, car expenses, meals, shopping and entertainment at the casino. Shavers promised the people that investing in Bitcoin will increase by 7% per week through some arbitration services that he offers. His
253

Annals of the „Constantin Brâncuşi” University of Târgu Jiu, Economy Series, Issue 3/2016
„ACADEMICA BRÂNCUŞI” PUBLISHER, ISSN 2344 – 3685/ISSN-L 1844 - 7007
company, Bitcoin Savings & Trust, was originally called First Pirate Savings & Trust. Investors come from Connecticut, Hawaii, Illinois, Louisiana, Massachusetts, North Carolina and Pennsylvania [17].
The Texan, actually defended himself saying that Bitcoin (BTCST) is not really a coin, thus, no exist indictment head. The judge, however, argued that digital coin "is closer, as definition of a precious metal or other valuable resource, than of a dollar or other coin." In this way, the judge gave a favorable verdict of the Bitcoin (July 2013), which was an important step in ascension Bitcoin. However, the Department of Financial Services in New York, the FMI and the Department of Homeland Security conducted an extensive investigation, which has resulted in a hearing in August 2013 of several companies related with Bitcoin. The result was the creation by the U.S. of a set of rules to prevent the use of this currency in money laundering and other illegal activities.
A major problem for security agencies, government and the public is the lately quite frequent terrorist attacks in Europe (attack from Brussels Airport and the Maalbeek metro station came just four months away from attacks in Paris). Terrorist financing put Bitcoin under scrutiny because of the possibility of illegal use of virtual currency by terrorists and by their sympathizers.
Regarding the use of this currency in the purchasing, Russia drew attention the sellers about using Bitcoin in illegal activities, and error to consider it, as coin.
Although virtual, the Bitcoin coin has managed to persuade bankers to take action against it. This was determined by the major risks that may occur in the global financial elite and its potential propagation that is totally out of the big banks centralized, virtual money is hard to follow and can not guarantee the route or origin thereof. Financial elite considers it "is coin which attracts criminal activities, as tax evasion, drug trafficking, terrorism and gambling," which led to the determination of major central banks to close the accounts of the Bitcoin dealers. 6. The Bitcoin Risks
After analyzing the digital coin, Bitcoin, we have seen that the value has fluctuated strongly, which had a
significant influence about buyer confidence. We noticed that frequent cyber attacks made to increase suspicion, if technological progress will work against people. We can thus say that, although digital money are a reality that we can not ignore, if the state will not attempt through its institutions to play a role in protecting citizens from fraud, it would be possible to develop extremely dangerous financial schemes.
Analysts were skeptical, about spectacular evolution, the Bitcoin currency and their skepticism was fueled of suspending the activity of two of its operators (BitFloor and Bitstamp).
House exchange BitFloor, headquartered in New York (one of the largest markets for Bitcoin Exchange) announced in April 2013, which stops any operation indefinitely, and intend to return the funds the involved [18]. Cessation was due to an attack by hackers in September 2012, who stole 24,000 Bitcoins (the coin was valued at $ 10.4), which caused a loss of nearly a quarter million dollars.
Although the digital currencies have recently appeared, and at their level the can speak of the mini-crashes in virtual exchange market. Being used in an area where the temptations are great, the information’s travels fast and not always verified, with automated participants and often highly emotional, market volatility can often become huge. Crashes on virtual exchange market is characterized by rapidity, and could cause loss of tens of percent in less than an hour, for example, in early February 2014, on one of the stock exchanges where trading virtual currency Bitcoin has lost more than 8/10 from the value [19].
On February 6, 2014, Apple withdrew the app that provides an overview of Bitcoin transactions from its online store. On February 10, one of the "fellowships" large, which provides the virtual coin trading, has suspended withdrawals, a few days after the imposition of limitation, because found ways that the system can be tricked to spend the same amount again. However, on two of the "fellowships", the Bitcoin value had no prices less than 500 USD for 1 Bitcoin, but on one of them reached the minimum was 102 USD. The rebound was very fast, bringing prices in line with those of other comparable sites.
Knowing appetite for automated trading of the virtual coin enthusiasts, a hypothesis emerges clearly: trading robots connect to BTC-E notified pressure selling and went into action. So we can say that the virtual world has its own flash-crash (capital markets had on the 6 May 2010).
In January 2014, Hong Kong's Secretary for Financial Services and the Treasury, Caejer Chan Ka-keung, in a statement, warned the public "that Bitcoin is a highly speculative commodity, which represents many risks." Risks of use and/or possession of Bitcoin are very high because it not has a value within, and tends to have a large fluctuation [20].
The most recent problems occurring on Bitcoin market, we can remember the Mt. Gox firm, which is a currency exchange firm for Bitcoin from Tokyo, Japan. The company was founded in 2009, and from 2010 went into business with Bitcoin, and for a long period had a significant amount. However, February of 2014, meant for the Mt.Gox a dark period, the company frozen the accounts initially for a few days due to some software issues. After this, Mark Karpeles, CEO Mt. Gox, has resigned from the board of Bitcoin Foundation, and all the messages on his Twitter account was deleted. In the following days, the company Mt. Gox has suspended all transactions after that its website has been disconnected. The same day, a blogger calling itself "The Two-Bit Idiot" posted a document showing that the
254

Annals of the „Constantin Brâncuşi” University of Târgu Jiu, Economy Series, Issue 3/2016
„ACADEMICA BRÂNCUŞI” PUBLISHER, ISSN 2344 – 3685/ISSN-L 1844 - 7007
company became insolvent, by the loss of 744 408 Bitcoin ($ 383 million) following a robbery that lasted several years. Mark Karpeles said, however, that money has not been lost, just "temporarily unavailable" [21].
Because the Bitcoin business, not any regulation in Japan or Japanese central bank, nor finance ministry can not act.
A study conducted by the largest risk consulting firm in the world, Eurasia Group, Ian Bremmer, a specialist in global risk, says that "ultimately, larger players will enter this market and will eliminate shortcomings Bitcoin "and believes that" will be very surprised if there Bitcoin in ten years " [22]. 7. Authorities' position from various countries, towards use Bitcoin
The first country to recognize Bitcoin as private coin was Germany in the spring of 2013, when the Ministry of
Finance of Germany officially recognized Bitcoin as a financial instrument. In support of digital currency, Bitcoin, Frank Schaeffler, a member of the German Parliament's finance
committee, said that "Bitcoin is the first step in the process of denationalization of money. According to Schaeffler, Bitcoin success will depend on the fair treatment of regulatory authorities and the existence of conditions equal to those of other coins" [2].
The German authorities have achieved regulation of taxation of Bitcoin transactions is considered a financial instrument, which means that the profits obtained by using virtual coin, to be taxed [23].
Kathleen Brooks, director at FOREX.com, believes that accepting digital coin as a financial instrument, it gives legitimacy to use in one of the most developed economies in the world, which prints the big advantage of the Bitcoin movement. Brooks even consider that given that the euro would disappear, the German government could collect taxes, given that people would start using Bitcoin.
Once this financial instrument recognition by Germany, Bitcoin value increased from 80 to 120 dollars, which led to the enrichment of more people overnight, the market is very sensitive, and any news can influence the value. For example, a young Norwegian (Kristopher Koch), concerned about the new technologies, discovered the digital coin, Bitcoin immediately after launch, in 2009, and bought 5,000 units with only 20 euros. He forgot then these coins, and after a few years, when he remembered Bitcoins purchase, found that the 20 euro turned in the amount of 643,000 euros, which materialized in an apartment in the most expensive residential neighborhood in the capital of Norway, purchased with 1,000 Bitcoin.
However, Germany Bank has sent warnings population on the huge risks, which they should assume, who invests in Bitcoin.In this respect, the German government wants to take control of digital currency transactions to follow of Bitcoin transactions in order to prevent terrorist financing [24].
In July 2013, the Central Bank of Thailand said Bitcoin transactions in across the country as illegal, due to the lack of a law to regulate the management of virtual coin. In this way, Bitcoin Co., has suspended her operations in Thailand, but the activity websites was not disturbed. In the situation of ban on the use of the Bitcoin of companies, Thailand was the first country which bans Bitcoin. It prohibited the registration of sites trading this coin at government agencies, which would have enabled its use legally.
Following numerous irregularities discovered at Bitcoin users in the U.S., the state regulated as any transaction that exceeds the equivalent of $ 10,000 to be declared. Lately, however, the U.S. Treasury has decided to apply of the Bitcoin coin, rules on money laundering. In Canada, Virtex, the online market, which traded Bitcoin, running more than $ 13 million, was closed, and all virtual markets by Canada was announced of the Bank dealers that "can not collaborate".
Chinese authorities have discovered that people have made massive purchases, despite restrictions on Yuan move out of the country, by buying Bitcoins. China's central bank announced that Chinese financial institutions do not accept deposits from businesses with Bitcoin, by prohibiting of domestic banks to accept foreign exchange currency online. Beijing authorities have announced that Bitcoin not satisfying the conditions to be considered currency and individual investors may trade in virtual coin further on their own risk. Following this announcement, the price Bitcoin relative to the U.S. dollar plummeted 30%, from 1,240 dollars to 870 U.S. dollars. In December 2013, the government banned financial institutions to exchange of Bitcoin and the price of a Bitcoin dropped from $ 1,200 to less than $ 500.
On the Business Channel of China Central Television Business of the China's national television station (CCTV2) has achieved a whole campaign to throw a negative light on Bitcoin and its community, comparing Bitcoin with a Ponzi scheme, and focusing only the stories involving people who have suffered financial losses due to investments Bitcoin. The program has also caused some speculation as to whether it could be a precursor for a future government intervention.
Although was an overwhelming portrait of negativity, a ray of optimism managed to shine even from a person who has had a loss in investment, Wang Yizhou, aged 19 years: "Once, no one thought they would be planes but were then. As such planes, will be and Bitcoin, a revolution [25].
Regulators in Hong Kong, along with those from mainland China and the region, attaches the utmost attention Bitcoin phenomenon, to stop any money laundering activities, but also unhindered development of this system. And what is remarkable is that, Honk Kong special administrative region, although it is a part of China, but has not followed
255
Annals of the „Constantin Brâncuşi” University of Târgu Jiu, Economy Series, Issue 3/2016
„ACADEMICA BRÂNCUŞI” PUBLISHER, ISSN 2344 – 3685/ISSN-L 1844 - 7007
the lead of the continent in terms of reducing Bitcoin transactions. This may be a springboard to adopt Bitcoin and in mainland China, especially since the local regulatory authorities do not introduce stricter measures. At this time in China, it is more difficult to change capital rather than sell Bitcoin currency. The financial system of Hong Kong, although Monetary Authority not identified any local bank engaged in the Bitcoin and none seem to emit products and services related to Bitcoin, supervise closely the development of Bitcoin transactions, for to prevent any disruption in the stability of the financial market.
Amid public warning on currency speculation by Reserve Bank of India, a group of Bitcoin traders in Mumbai has initiated a clarification of the legality of this instrument, considered highly volatile. Bitcoin Alliance from India comprises ten Bitcoins traders, among members which control more than 80% of trade in Bitcoins through four trading platforms. In India it is assumed that there are over 30,000 Bitcoins owners who possess 1% of the 12 million Bitcoins in circulation internationally. After the alarm signal pulled of the Reserve Bank of India, according to which "all virtual transactions, including those with Bitcoins, were irregular instruments of speculation and protected them against potential security risks financial, operational and legal", the volume of market declined massively [26].
Bank of France warned also about the dangers of using Bitcoin, and the European Central Bank and Bank of England have notified that monitors the evolution of the virtual coins. Norway has announced that it will not recognize Bitcoins as legal tender, and Denmark seeks to harmonize consumer protection regulations.
The European Banking Authority (which brings together regulators from the 28 EU countries), has not responsibilities that prohibit virtual coins, but they analyzed and found "should be regulated and supervised." Believes that users expose themselves to significant risks when using digital currencies, examples are the major fluctuations, when they do not have regulations to protect them [27]. In this respect, the European Banking Authority recommends buying digital coins on condition that people can afford to lose them. The warning came just days after China's central bank announced that Chinese financial institutions should not accept deposits from businesses that relate to Bitcoin or to ensure access to this coin within their own services.
European Union following the terrorist attacks wants to bring stricter regulations since June 2016 for both Bitcoin and prepaid cards. 8. The future of the virtual coins
After the virtual market developments, the developer’s predictions on Bitcoin as a business are optimistic.
Thus, GitHub [28] launched the idea taken over from Bitcoin Pulse, according to which the encrypted coin, is a successful for developers. Bitcoin Pulse tries to make a connection between currency Bitcoin and basic services (Coinbase, Coinmap and Github), the investment services (consumer services), and the discussion groups. It also, presents the latest exchange rates on Mt. Gox, BTC China and services such as Bitstamp. Developers are the first to adopt new technology, works with modern devices and most have an account on GitHub, where they post their own projects (open source).
We presented the position of the main countries, in which found the most of the users of Bitcoin, and even find that lost a lot of credibility, it is expected to grow more virtual coins that will support large companies, thus:
ü American Express, created a real currency, Amex, enabling customers to consume more than they could afford;
ü Amazon, one of the most famous online stores in the world, has launched its own virtual currency, "Coins Monday", can be used by users for the Kindle or Amazon stores, to purchase applications and games;
ü Facebook has something like digital coins, or "Facebook Credit". The success of the virtual coin, Bitcoin has inspired a lot of anonymous programmers to create other virtual
currencies. Thus, they created some serious projects funded by hundreds of millions of pounds (Litecoin) but and other with fun character (Dogecoin, Coinye West - "Cryptomoneda for the masses"). The site coinywest.com involves an algorithm based on a scenario that will "lead the fight with Bitcoin."
However, the banknotes and coins will still have long life, "the cash money facilitates corruption and there are many governments in the world which want avoid leaving traces for each transaction on they performing" [29].
Giant of the online commerce, the Amazon.com site, in May 2013 announced the creation of its own virtual coins, for the Kindle Fire tablet owners. Thus, they had in mind from the start, 500 of "Amazon Coins" (the equivalent of five U.S. dollars), being able to buy games and applications on the site [30]. Thus, Amazon hopes to support customers to purchase applications, attracting as many customers as well as developers of applications for as the Amazon Store can rival with Play Store (Google) and App Store (Apple). In this respect, Amazon has created its own store for Android applications, which can be accessed from the Amazon devices, but and own a smart phone with 3D screen TV console. Users can purchase Amazon Coins on site (one dollar for 100 virtual coins, but only multiple of 500 virtual coins), they do not expire and no fees for use. Also, Microsoft provides such an option via the Xbox Live Points.
There were, however analysts (Patrick Moorhead, an analyst at Moor Insights & Strategy), which estimated that the use of such systems can induce confusion among consumers [31].
U.S. bank, JPMorgan Chase, the largest in the world by assets, has applied to the U.S. to obtain a patent for a payment system similar in some ways with the digital currency, Bitcoin. Like Bitcoin, JPMorgan system allow
256
Annals of the „Constantin Brâncuşi” University of Târgu Jiu, Economy Series, Issue 3/2016
„ACADEMICA BRÂNCUŞI” PUBLISHER, ISSN 2344 – 3685/ISSN-L 1844 - 7007
anonymous users to make electronic payments online, without having to reveal his name, account number or pay fees, show documents submitted to obtain the patent. It provides for the creation of "virtual money" which to be kept in a wallet online, like files used for Bitcoin. The bank method aims also setting up a public register of transactions made using this technology - similar Bitcoin characteristic. Bitcoin critics have pointed out that the action JPMorgan highlights vulnerabilities of the digital currency against imitators. Have already appeared new coins digital, which seeking to improve the aspects of the Bitcoin perceived as deficient. A person informed of the original patent of the JPMorgan said the bank introduced the first time idea of anonymous payments in 2003, and this continued to be discussed internally within the bank. JPMorgan request put in light the race between the major banks, the card operators and companies like Google, Apple and PayPal, all eager to get a bigger profit on the booming market of the online payment services. The active companies traditionally in the financial sector must compete with virtual coins, which some people consider them viable payment alternative systems, able to competing in future major banks and card companies. JPMorgan said the new payment systems will competethe cards as the main way of making online transactions. Some believe, however, that the bank wants to get patent for payment technology that borrows features Bitcoin, until now the most popular digital coin [32].
Russia is preparing a competitor's Bitcoin, which has as basic electronic payment system Yandex DENGHY. According to experts, the virtual money advantage is that the will be officially released after the transparent scheme, i.e. with authorization of a monetary regulator, in this case the Bank of Russia.
Talking about creating a Bitcoin's analog, Gherman Gref said that for such at currencies is need a global regulator. Obtaining it, the virtual money will be protected from volatility. For example, the Bitcoin may be lost in one day to a half its cost. There is no insurance against theft. There have been cases where criminals have managed to empty electronic wallets, worth tens of millions of dollars. 9. Conclusions
Although we cann’t say exactly who were the creators of Bitcoin, this has gained notoriety in recent years,
with the unprecedented development of online transactions. Bitcoin can be traded with keeping the secret identity, paying much lower commission than those paid to pay by credit card or through pay-pal, and can sell anything. So we noticed that the digital currency Bitcoin has an advantage that other traditional currency can not guarantee. Gives users full power over their own finances, which lead to turning it into a "gold mine", and this enhances the interest from strong investors. But alongside companies that legal were operating and were attracted Bitcoin's use, and drug dealers and criminals which quickly get the taste of money and began to fund operations using Bitcoin. Also the terrorists and criminals use all kinds of technology to try to hide their Internet activities and try to use digital currencies to help financing of operations.
We found that virtual currency can be converted into real money, or can be kept in virtual wallets. Because Bitcoin is a volatile currency, by their trading can generate huge gains for those who bet initially appreciation and massive losses due to fluctuations. Thus, consumers are exposed to significant risks by using digital currencies and do not have regulations to protect users.
Following the analysis performed, we noted that in 2015 the price of Bitcoin has experienced slow growth and stable compared to previous years when in the crypto-currency world were a number of unknowns that led to a number of anxieties justified because the currency Bitcoin was new and various problems arose. Stabilization of Bitcoin led to the need that more governments and financial institutions to legitimize it and to support because transaction volume permanent increased. An important role is played by the media that began in 2015 to conduct an open support for virtual coin and technologies specific to it, stressing their importance in trade, public administration and financial institutions which will lead to an increase in credibility. In the Bitcoin evolution was controversies between optimists and skeptics, but from 2015 the debate is more complex and focuses on keeping its currency value and penetration in world financial institutions.
The forecast for 2016 is extremely optimistic, transaction volumes will continue to grow continuously and Bitcoin price will evolve a lot.
Although the virtual currency infrastructure has matured, which gives an incentive to investors, their reaction will be quite hard to predict, because many of the good days of Bitcoin were reactions to crises by Greece, China and Argentina, which means that by After all, it's hard to predict what will happen to the price.
From the study of conducted, we observed that with increasing investor interest for Bitcoin increased and worries and concerns of the world countries, given that they want to constantly adapt to developments from information and communication technology, the trend being cloud networks. Fact that Bitcoin isn't a currency of a particular government, but includes an extensive network of independent computers spread around the world, evolution has been slow due to lack of regulations.
At the beginning of 2016 many regulatory agencies were prepared as soon as possible to provide regulations on Bitcoin and blockchain and handling of coins digital, focusing on businesses providing financial services (MSB's), which is at the intersection of Bitcoin or other digital coins and fiat money.
257
Annals of the „Constantin Brâncuşi” University of Târgu Jiu, Economy Series, Issue 3/2016
„ACADEMICA BRÂNCUŞI” PUBLISHER, ISSN 2344 – 3685/ISSN-L 1844 - 7007
We believe, however, that acceptance of digital currency as a financial instrument will give legitimacy, which prints a big advantage Bitcoin movement. In general, experts believe that if global banks will find methods to solve with all the problems, the virtual money will have a real chance of life. Indicated would be addressing such financial instruments by clients or prospective clients to achieve only informed after preliminary documentation.
Blockchain alliance will help government agencies understand the benefits of currency and technology specific, and thus will be able to make an approach to regulations to support innovation and growth, so as to be able to develop increasingly more.
Taking into account the factors that come into favor Bitcoin price increase we observe that are more prominent than those that might negatively influence.
Indicated would be addressing such financial instruments by clients or prospective clients to achieve only informed after preliminary documentation.
10. Bibliografie
[1] CNBC, Germany recognized virtual currency "Bitcoin" as a financial instrument, 2013, http://www.1asig.ro/Germania-a-recunoscut-moneda-virtuala-bitcoin-ca-instrument-financiar-articol-2,3,102-47180.htm, accessed 2015-10-17 [2] Wall Street Journal, Germany bitcoin - currency virtual, 2014, http://www.wall-street.ro/articol/Economie/ 152915/ germania-bitcoin - currency-virtuala.html, accessed 2015-07-20 [3] The guardian, Man buys $27 of bitcoin, forgets about them, finds they're now worth $886k, 2015, http://www.theguardian.com/technology/2015/dec/09/bitcoin-forgotten-currency-norway-oslo-home, accessed 2016-01-26 [4] Bitcoinaverage, What Could Shape the Bitcoin Price Chart in 2016?, 2016, https://bitcoinaverage.com/ blog/ what-could-shape-bitcoin-price-chart-in-2016, accessed 2016-03-10 [5] Wired.com, Thought Bitcoin Was Dead? 2016 Is the Year It Goes Big, 2016, http://www.wired.com/2016/ 01/thought-bitcoin-was-dead-2016-is-the-year-it-goes-big/, accessed 2015-03-10 [6] Blockchain.info, accessed 2015-05-12 [7] Richell, R., Why I'm Predicting a $650 Bitcoin in 2016, CoinDesk, 2016, http://www.coindesk.com /predict-650-bitcoin-2016/, accessed 2016-03-10 [8] The Economist, Bitcoins, 2014 http://www.economist.com/topics/bitcoins, accessed 2015-10-10 [9] Wordpress.com, 2014, accessed 2015-10-10 [10] Eliot Lee, blog, Why an Altcoin Could Beat Bitcoin, 2014, http://www.intelliot.com/2014/08/why-an-altcoin-could-beat-bitcoin/ accessed 2014-11-15 [11] Wordpress, BitCoindeVanzare, The future of Bitcoin currencies Predicted of the creator of the moment, 2014, http://bitcoindevanzare. wordpress.com/2014/01/14/ viitorul-monedelorbitcoin-prezis-de-creatorul-de-top-al-mometului/, accessed 2015-02-10 [12] Calacanis, J., Who invented Bitcoin?, 2014, http://www.cineainventat.ro/bitcoin/, accessed 2015-02-10 [13] Business Insider, Bitcoin is off to the races again, 2015, http://www.business insider.com/bitcoin-is-off-to-the-races-again-heres-whats-different-this-time-2015-11, accessed 2016-01-10 [14] The Economist, Bitcoin, Monetarists Anonymous, 2012, http://www.economist.com/node/21563752, accessed 2015-02-10 [15] Digi24.ro, Hypothesis: Bitcoin was created specifically for black market transactions, 2014, http://www. digi24.ro/Stiri/Digi24/Economie/Stiri/Ipoteza+Bitcoin+pentru+tranzactii+piata+neagra+contrabanda, accessed 2015-02-10 [16] Wordpress, BitCoindeVanzare, Pharmacies of marijuana in Colorado using Bitcoin to evade federal laws, 2014, http://bitcoindevanzare.wordpress.com/2014/01/14/farmacii-de-marijuana-din-colorado-utilizeaza-bitcoin-pentru-a-se-sustrage-legilor-federale/, accessed 2015-04-15 [17] Business24.ro, $ 4.5 million fraud committed by Bernard Madoff of the virtual currency Bitcoin, 2015, http://www.business24.ro/articole/frauda+bitcoin, accessed 2015-09-15 [18] CNET News, Bitcoin bubble. The business shoot the shutters, but ensure the clients as will recover their investment, 18 April 2013, http://www.incont.ro/international/bula-bitcoin-afacerea-trage-obloanele-dar-asigura-clientii-ca-isi-vor-recupera-investitia.html, accessed 2015-02-10 [19] XTB Online Trading, Crypto-flash-crash: crashes and the robots trading in virtual currencies, 2015, http://www.xtb.ro/analiza/analiza-fundamentala/articles-directory/10feb2,2014,20,140,210, accessed 2016-02-02 [19] Wordpress, BitCoindeVanzare, Official Issues Warning Bitcoin of the Treasury Hong Kong, 2014, http://bitcoindevanzare.wordpress.com/2014/01/14/problemele-oficiale-de-avertizare-bitcoin-ale-trezoreriei-hong-kong/, accessed 2015-04-15 [20] Sfetcu, N., Bitcoin mining in decline, 2014, http://www.sfetcu.com/mineritul-de-bitcoin-in-declin/, accessed 2015-02-10 [21] CNN Money, Virtual coins, future money?, 2013, http://www.ziare.com/bani /moneda/monedele-virtuale-
258

Annals of the „Constantin Brâncuşi” University of Târgu Jiu, Economy Series, Issue 3/2016
„ACADEMICA BRÂNCUŞI” PUBLISHER, ISSN 2344 – 3685/ISSN-L 1844 - 7007
viitorul-banilor-1235281, accessed 2014-11-15 [22] Die Welt, Erfolg für die digitale Währung: Das Bundesfinanzministerium erkennt Bitcoin erstmals als "privates Geld" an. Noch ungeklärt ist, ob auf gewerbliche Transaktionen möglicherweise Umsatzsteuer anfällt, 2013, http://www.welt.de/finanzen/geldanlage/article119086297/Deutschland-erkennt-Bitcoin-als-privates-Geld-an.html, accessed 2014-11-15 [23] Die Welt, Das ist der neue große Rivale des Bitcoin, 2016, http://www.welt.de/wirtschaft/webwelt/ article153228987/Das-ist-der-neue-grosse-Rivale-des-Bitcoin.html, accessed 2016-03-14 [25] Wordpress, BitCoindeVanzare, The Chinese government has supported the TV program Bashes Bitcoin, offended Community, 2014, http://bitcoindevanzare.wordpress.com/2014/01/14/guvernul-chinez-a-sprijinit-programul-tv-bashes-bitcoin-comunitatea-ofensata/, accessed 2015-04-15 [26] Wordpress, BitCoindeVanzare, Bitcoin Corporation warn the public to keep away, seek legal clarity, 2014, http://bitcoindevanzare.wordpress.com/2014/01/14/corporatia-bitcoin-avertizeaza-publicul-sa-se-tina-la-distanta-cauta-claritate-juridica/, accessed 2015-04-15 (http://bitcoindevanzare.wordpress.com/2014/01/14/corporatia-bitcoin-avertizeaza-publicul-sa-se-tina-la-distanta-cauta-claritate-juridica/) [27] European Banking Authority, Warning from the European Banking Authority. What risks you take if you use Bitcoin, 2013, http://www.incont.ro/international/autoritatea-bancara-europeana-avertizeaza-in-privinta-riscurilor-utilizarii-bitcoin.html, accessed 2015-04-15 [28] Wordpress, BitCoindeVanzare, Coinbase in partnership with Bitmonet, to provide the application including payment in Bitcoin Digital Currency, 2014, http://bitcoindevanzare.wordpress.com/2014/01/14/ coinbase-in-parteneriat-cu-bitmonet-pentru-a-oferi-aplicatia-inclusa-pentru-plati-in-valuta-digitala-bitcoin/, accessed 2015-02-10 [29] Ziare.com, Virtual currency, the future of money?, 2013, http://www.ziare. com/bani/moneda/monedele-virtuale-viitorul-banilor-1235281, accessed 2015-04-15 [30] ABC News, Bitcoin has competition. Amazon introduces its own virtual currency for Kindle Fire tablet owners, 15.05.2013, http://www.incont.ro/tehnologie -si-media/bitcoin-are-concurenta-amazon-introduce-propriile-monede-virtuale-destinate-posesorilor-de-tablete-kindle.html, accessed 2015-04-15 [31] Incont.ro, JPMorgan, the largest bank in the world, patenting a payment system similar to Bitcoin, 11.12.2013, http://www.incont.ro/companii/banca-americana-jpmorgan-vrea-sa-patenteze-un-sistem-de-plati-similar-cu-bitcoin.html, accessed 2015-04-16
259

Annals of the „Constantin Brâncuşi” University of Târgu Jiu, Economy Series, Issue 3/2016
„ACADEMICA BRÂNCUŞI” PUBLISHER, ISSN 2344 – 3685/ISSN-L 1844 - 7007
ACCOUNTING TREATMENT OF THE FINANCIAL INCOMES AND EXPENSES
HOLT GHEORGHE PROF.PHD, CONSTANTIN BRANCUSI UNIVERSITY FROM TARGU JIU
Abstract The possibility of appearance of temporarily available capital determines a number of economic operations of
placing them, operations that give content in business operations. The financial result, used as a measure of performance or as a reference for other indicators is presented using two types of structures: expenditure and revenues. The definitions of revenues and expenditure capture their essential characteristics, but they must complete by the criteria that must be met in order to be recognized in the profit or loss account. Revenues constitutes increases in economic benefits during the accounting period in the form of inflows or increases in assets or decreases in liabilities, which is reflected in increases in equity other than those resulting from contributions by investors. Financial expenses comprise in their structure the receivables related to equity losses, expenses on disposal of financial investments, unfavorable foreign exchange differences, interest on the current financial year, discounts to customers, receivables from financial losses.
1. General presentation of financial expenses and income Financial income and expenses of companies are generated by financial and economical operations. Regarded
by the frequency of the operations that gives rise, the financial expenditure and revenues of companies belong to the current activity and are reported in this way, with operating income and expenses through profit or loss account.
The structure of financial revenues and expenses is determined by the nature of the operations they are generated by and their effects on the treasury.
If we consider the nature of the operations that generate them, we found the following types of financial income and expenses:
-from financial assets; -of short-term investments; -from operations generating foreign exchange differences -of interest; -of discounts; -from other financial or economic operations. If we consider the effects on cash companies, are distinguished: - actual income and expenses, ie those found in the current year, received or receivable or paid or payable. From
a financial perspective these revenues and expenditures generate cash flows in the form of receipts/payments; - revenues and expenses calculated, ie those found in the current year, the amount determined based on
calculations and we generate/commit cash flows (receipts or payments). Returning on the structure of financial revenues and expenses regarded as nature of the operations that
generated they are customized for each structure mentioned the fact that the operations in question generates one or more categories of income and/or expenses. So:
- some operations generate both revenue and expenses. For example, financial assets generate income from dividends from the sale of shares of adjustments for impairment and disposal charges occasions (cost actions) and finding the loss of value;
- other operations only generate revenue or expenditure occasions only. For example, loans to related parties as income generating interest due and loans received occasions as accrued interest expenses;
- other operations generate revenues or expenses occasions. For example, the settlement of foreign currency amounts can generate revenues from exchange rate differences and expenses from foreign exchange differences according to the settlement rate to the rate of registration;
- there are operations that, although generate income and expenses. Accounting records only financial result as earnings when revenues are greater than the losses, or losses as when expenses are greater than income. For example, short term disposal of an investment in shares.
2. Accounting treatment of expenditure and income by type of operations they generate 2.1. Income and expenses from financial assets Financial assets represent financial amounts invested in the capital of other companies and claims attached
financial amounts invested as follows: shares in affiliates, participating interests, investments held as assets, loans to
260

Annals of the „Constantin Brâncuşi” University of Târgu Jiu, Economy Series, Issue 3/2016
„ACADEMICA BRÂNCUŞI” PUBLISHER, ISSN 2344 – 3685/ISSN-L 1844 - 7007
affiliated entities and entities which hold participating interests, shares affiliated entities. They are called equity or equity holdings in affiliates for purposes other than getting dividends. These shares shall entitle the investor to significantly intervene in the management of the investee entity affiliated, meaning participation of its take strategic decisions.
Note that the year in which the investment is made, the investor benefits from the advantages of shareholder throughout the year regardless of the date of their acquisition. As such, investor reveals fully charged or received as dividends from financial income.
Participating interests are securities holdings in associated companies to obtain financial income as dividends and ensuring contribution to activities of such companies with investor can interfere in their management.
Investments held as fixed assets are securities held for a long period in the capital of other entities various affiliates and associates. They can be acquired through purchase or by contribution law. During their detention financial imobilizăile generate financial income as dividends. At the end of each financial year, during the annual inventory, financial assets may give rise to financial expenses in the form of adjustments for impairment or financial income from adjustments for impairment.
On the disposal of financial assets, financial investor recognizes revenue from the sale price of the securities and, simultaneously, financial expenses at their cost.
Specific accounts used are: - Securities accounting for financial assets: 261 "Shares in affiliates" 263 "Investments in associates" and 265
"Other long term investments"; - Accounting for revenue and financial expenses 761 "Income from financial assets 764" Income from disposal
of financial investments "and 664" Expenses on disposal of financial assets; 6863 "Financial expenses for impairment value adjustments of financial assets" and 7863 "Financial income from adjustments for impairment of financial assets".
Long-term loans granted to entities that have invested in financial values, also called receivables, generates only financial income as interest.
Unlike income from dividends that are income to the investor vary from one financial year to another, interest income is fixed, regardless of the borrower's financial results.
Interest income is constituted in accordance with the principle of independence of the year in proportion to the use of the borrower, regardless of their date of receipt.
Specific accounts used: - Accounting for receivables on loans 267 "Claims assets, with two distinct sub-grade for receivables from loans
and related interest due (2671-2678) and 453; - Interest income 763 "Income from receivables". Examples: 1. There are purchased and are paid 10.000 actions, the acquisition cost being 5 lei/action: 261 = 269 50.000 269 = 5121 50.000 2. There are collected all dividends for the 2015 year:
5121 = 761 10.000
2.2. Income and expenses from short-term investments Short-term investments are securities held by a company in order to secure the fulfillment of commitments in
the short-term cash by converting their easy cash on the stock market and gains from trading them at a higher price higher than the purchase price.
Distinct, while holding their short-term investments generate financial income as dividends or interest depending on how the investments made and the length of time during which they are held.
The structure of short-term investments comprise short-term actions, bonds issued and redeemed bonds, other short-term investments.
a) Short-term actions are short-term securities held to affiliates. They generate the following financial income and expenses: while holding, whether they are held until the end of the financial year, generating financial income as dividends; at the end of each financial year may cause financial expenses and income from their inventory assessment, the difference between the carrying value and inventory; the failure can be achieved financial income and expenses as financial gains or losses, as the difference between the transfer price and their book value.
Specific accounts used: - Accounting shares: 501 "Shares in affiliates" 509 "Payments made for short-term investments"; - Accounting for revenue while holding shares: 762 "Income from short-term financial investments;
261

Annals of the „Constantin Brâncuşi” University of Târgu Jiu, Economy Series, Issue 3/2016
„ACADEMICA BRÂNCUŞI” PUBLISHER, ISSN 2344 – 3685/ISSN-L 1844 - 7007
- Financial accounting for revenue and expenditure at year end inventory; 668 "Other financial expenses" and 768 "Other financial income" or 686 "Financial expenses adjustments for impairment of current assets" and 7864 "Financial income from adjustments for impairment of current assets" as actions or not listed;
- Accounting for revenue and expenditure fail: 7642 "Gain on disposal of short-term investments" and 6642 "Losses from disposal of short-term investments."
b) Bonds issued and redeemed Sometimes, financial considerations, companies that have issued bonds and long-term borrower decides to
redeem them before maturity to cancel. In issuing the bond loan is highlighted in account 161 "Loans from the bonds” value repayment of the bonds
and accounts 461 "Sundry debtors" to the value of the issue and 169" Premium on redemption of bonds "the difference between the redemption value and the value issuance of bonds. Bond issuance expenses are recorded as an intangible asset account 201 "Formation expenses".
At maturity loan rates rates shall be reimbursed and paid interest due, and at the end of each year that company records the expense: the first repayment of bonds, amortization of bond issuance costs and annual interest due.
On redemption, the bonds are recorded in account 505 "Issued and redeemed bonds” redemption value. The difference between the surrender value and the redemption value is considered gain redemption (account 7642 "Gains from investments in short-term marketable") or loss on redemption (account 6642 "Losses from short-term investments ceded") as redemption value it is lower or higher than the reimbursement.
Simultaneously with the cancellation of repurchased bonds must register expensed unamortized bond premium and reimbursement of expenses unamortized bond issuance.
c) Bonds Short-term investments in bonds generate financial returns for the investor as interest if held to maturity annual
coupons attached (maturity of collecting interest). At the annual inventory, short term bonds still held, can generate financial expenses and income gap between
asset value (value of trading bonds admitted to trading on a regulated market or probable negotiation value for unlisted bonds) and book value.
On the disposal of bonds can be realized financial gains if the sale price is higher than the book value, or financial loss if the sale price lower than the carrying amount east.
Specific accounts used: - Accounting for bonds: 506 "Bonds"; - Accounting for expenses and financial income in assessing the inventory of bonds: 668 "Other financial
expenses" and 768 "Other financial income" for the bonds listed or 6864 "Financial expenses adjustments for impairment of current assets" and 7864 "financial income from adjustments for impairment of current assets in unlisted bonds;
- Accounting for revenue and expenditure fail: 7642 "Gains from investments short-term marketable" and 6642 "Losses from disposal of short-term investments."
d) Other short-term investments In this structure include term investments that have a low frequency and / or a small share. Examples of such
investments mention: treasury bills, certificates of deposit, warrants, options contracts etc. Treasury bills are securities issued by the state for a period of up to one year in order to ensure available cash to
its current liabilities. They are issued at an issue price (selling price) lower than the redemption price (nominal value), the difference representing the gain investor.
Certificates of deposit are securities issued by the state or by banks for up to one year. Financial income they generate for the investor as interest payable at maturity certificates.
Examples: 1. The redemption obligations at repurchase price of 13 lei/obligation:
505 = 5121 130.000
2. Canceling repurchased bonds: % = 505 130.000 161 80.000 6642 50.000
2. 3. Income and expenses from foreign exchange differences Are generated by daily fluctuations of exchange rates and, therefore, are calculated for all assets and liabilities
in foreign currency. Some of them are calculated during the reporting periods, others at the end of reporting periods. During the reporting periods ie the months of the year, foreign exchange differences are calculated when
conducting settlement of receivables and payables in foreign currencies. The calculation of exchange rate in this
262

Annals of the „Constantin Brâncuşi” University of Târgu Jiu, Economy Series, Issue 2016
„ACADEMICA BRÂNCUŞI” PUBLISHER, ISSN 2344 – 3685/ISSN-L 1844 - 7007
category is the difference between the exchange rates on the date of receipt of receivables or payment of debts and exchange rate at the date of their creation or the end of the previous month if the date of constitution of receivables or debt, preceded the previous month.
It follows that when a receivable or liability is settled in foreign currency during the same month that was formed around the exchange difference is recognized in that month. When the debt or foreign currency debt is settled in a month later, the exchange difference recognized in each month following is calculated based on the exchange rate of the last banking day of the current month and the exchange rate on the last day of month previous respective settlement date of the exchange rate and the exchange rate of the last working day of the preceding month.
At the end of reporting periods, ie each month and hence the financial year, foreign exchange differences arise from the need to update the balance in lei currency receivables, liabilities and cash in foreign currency.
The calculation of exchange rate at the end of reporting periods is the difference between the present value of the balance in lei of items listed in currency and lei existing value in the balance. Present value in lei corresponding value exchange rate on the last day of month.
Regardless of where or for which period is calculated, exchange differences may be favorable or unfavorable. To claims in foreign currency exchange differences when exchange rates are favorable settlement date is higher than that of its establishment or the end of the previous month for claims previously established. In the reverse situation is unfavorable exchange differences.
If debt in foreign currency exchange differences when exchange rates are favorable to their settlement date is lower than that of its establishment or the end of the previous month to its previously established debt. In the reverse situation is unfavorable exchange differences.
If cash foreign currency exchange differences are calculated at the end of each month with the updating of the balance in their foreign currency lei. They are favorable when the present value in lei at the end of the corresponding rate is higher than the existing value in lei in balance and reverse the unfavorable situation.
With some exceptions on short-term investments outstanding at the end of the month, traded on a regulated market, all exchange differences favorable increase the existing value in lei of claims, liabilities or cash in foreign currency and, accordingly, increased financial income (cont 765 "Income from foreign exchange differences"). Unfavorable differences diminish the existing value in lei of claims, liabilities or cash in foreign currency and, accordingly, increased financial expenses (account 665 "Expenses from foreign exchange differences").
Examples: 1. The delivery of goods to external customers:
411 = % 45.100 707 44.700 472 400
2. The receipt of the value of goods sold to external customers at the rate of 4.51 lei/euro 5124 = % 45.500 4112 44.700 765 800
2.4. Interest income and expense They are generated or incurred for financial operations, banking, trade and assimilated, made by companies.
Examples of such operations: grant-receiving money loans between companies, sale and purchase of goods on trade credit. It is understood that when it comes to relationships between two people, one who advances funds levy and collect interests (financial income) during the immobilization of funds, and the receiving fund pays interest (financial expenses) during the use of funds received. Fiecăreria in the accounts of the two companies Financial income from interest is recorded in account 766 "Interest income" and financial costs account interest 666 "Interest expense".
Interest income and expense recognition is the principle-based accounting and collection - interest payments as agreed by the parties: rates on loans with maturities money, on receipt - payment of goods etc.
The main problem of interest income and expenses is their calculation, which is based on the length of operations that generate them and the maturity date or maturities loan rates.
2.5.Income and expenses from discounts Are generated from the sales and purchase of financial discounts from suppliers and customers of financial
transactions carried out with banks and various creditors or debtors are granted or obtained discounts. Financial income and expenses from discounts are accounted for using the account 767 "Income from discounts
obtained" 667 "Expenditure on discounts granted." Price reductions of financial providers are granted to customers to pay debts before the deadline chargeability.
These reductions are agreed typically in commercial contracts in two ways:
263

Annals of the „Constantin Brâncuşi” University of Târgu Jiu, Economy Series, Issue 3/2016
„ACADEMICA BRÂNCUŞI” PUBLISHER, ISSN 2344 – 3685/ISSN-L 1844 - 7007
- Recorded in the original invoice; - Subsequently granted invoicing goods. To differences of commercial discounts price (except those granted-received after invoicing), which is not
accounted for nor the supplier nor the buyer, financial cuts price is booked to the supplier and the buyer using the account specified 667 and 767.
Discounts settlement of operations carried out with banks. The most representative case is the settlement operations with bills drawn forward and submitted for cashing (discounting) before the due date. In financial language discounting operation is referred to as the mobilization trade credit as a result of processing receivables into cash before the payment deadline.
By discounting bank pays the seller conditioning bills face value less the bank commission and discounting proper settlement (accrued interest for the period from paying bills to its maturity.
Settlement discount is calculated based on the interest rate formula: Rediscount rate = (Interest rate x t) / T
in which t = number of days from the date of actual payment until maturity; T = number of calendar days in a year. Conditional payment by the bank of the effect of trade must be understood as lending. Although the bank has
counterpart claim ownership, vendor bills remain liable to the bank, if the drawee has matured financial difficulties. As a result, the bank recovers its effect nominal value from the seller, are expected to follow the path of
protesters (suing in the courts of the drawee). 2.6. Other financial income and expenses This category includes, according to accounting rules, the following: differences favorable or unfavorable to
assets and internal debt denominated in lei whose settlement is based on a foreign currency resulting from their valuation at the end, at the close of the financial year, or at their settlement; favorable or unfavorable differences from valuation at year-end short-term securities admitted to trading on a regulated market.
Differences related receivables and payables internal expressed in lei whose settlement is based on the rate of a currency is calculated similar exchange differences related to assets and liabilities denominated in foreign currencies, but their accounting is done using accounts: 768 "Other financial income" and 668 "Other financial expenses".
For those differences, results from assessments at the end, namely the closure of the financial year or during the settlement of their supplier/creditor is obliged by law to issue invoice.
Conclusion The economic potential of each enterprise, in any form of organization or the business, is the consequence of
echnical, productive, commercial or managerial potential tthereof and will be characterized by its ability to create revenue as the sole source of covering the expenses they carry. In a modern economy, the issue of ongoing assessment of needs and resources, knowledge and human constant effort resulted in material costs along with final financial effect resulted in revenue is a vital needs for exerting effective managerial acts.
The movements and transformations of patrimonial assets and liabilities as a result of events and transactions that occurred in conducting a business, generate inter-conditionings, causation, causing interference between expenditure and revenue resulting the financial results of the undertaken.work. In tackling recognition of revenues and expenses have gone from two general accounting principles: recognition of revenue and expenses- revenues connection. The first principle states that when revenue should be recognized, and the second moment of recognition of expenses. This second principle is actually a consequence of applying the first and asking to clarify first time recognition of revenue and expenses recognized only after that time.
Bibliography 1. Cotlet D., Megan O.. Pistol I. - Raportările financiare ale entităţilor economice Editura Mirton Timişoara
2007 2. Ionel Jianu, Evaluarea în contabilitate, Ed. Economică, București, 2012 3. Mateș D. și colab., Contabilitate financiară, Ed. Mirton, Timișoara, 2012 4. Matiș D., Pop A., Contabilitate financiară, Ed. Alma Mater, Cluj Napoca, 2010 5. Ristea M., Contabilitate financiară, Ed. CECCAR, București, 2012
264
Annals of the „Constantin Brâncuşi” University of Târgu Jiu, Economy Series, Issue 3/2016
„ACADEMICA BRÂNCUŞI” PUBLISHER, ISSN 2344 – 3685/ISSN-L 1844 - 7007
THE ANALYSIS OF RESOURCES, MARKET AND THE INDICATORS OF THE
ACCOMODATION STRUCTURES FOR THE TOURISTIC PRODUCT BOCSA AREA
GHERGHINA LILIANA LECTOR PHD, UNIVERSITY “EFTIMIE MURGU” OF REŞIŢA, ROMANIA,
e-mail: [email protected] Abstract In the paper titled The Analysis of Resources, Market and the Indicators of the Accomodation Structures for the Touristic Product Bocsa area, I have highlighted the importance of this area which is valued as touristic product on the basis of the resources patrimony, of the infrastructure and touristic services which are available. I have shown that although the main attraction of tourists in an area is the touristic potential, however the seasons influence the touristic demand which leads to the increase of the use of the technical-material basis and touristic services.
Having in view the increase of the number of consumers, the offer of the touristic product Bocşa area must be adapted to the demand, taking into consideration the expectations, preferences and motivations of the tourists. I have observed that most visitors in the area develop activities such as: rest, trips, sport, swimming, fishing, hunting, they participate in cultural and religious events, attend meetings and conferences, do business, rent hydro-bicycles, kayaks and small boats. The prices are accessible to many categories of consumers.
Therewith, we have highlighted that any touristic activity of high quality must be developed in a controlled way without endangering the touristic patrimony which should be the heritage of the future generations. Presenting and analysing the natural and anthropic resources, the market dimensions and the indicators of the profit and loss account of the main structures of touristic accomodation in the area, we observed that most structures have registered profit in the last year, which proves that the demand for this product is in a continuous evolution. Key words: touristic product, natural resources, anthropic resources, touristic accomodation structures, market, indicators Classification JEL: L8, L83 1. Introduction From the specialised studies and the legislation of tourism we know that a geographical entity of area type can be considered a touristic product if it disposes of material assets and basic touristic services which can be offered to the touristic consumption directly or through the means of tourism agencies in the form of touristic package. The material assets of the touristic product area type are part of the touristic offer having in their componence, on the one hand, the touristic potential of attracting tourists on the basis of forthcoming natural and anthropic resources and on the other hand, the general and specific touristic technical-material base which contributes to the satisfaction of the torurists’demands, respectively: structures of touristic accomodation, structures of public alimentation, means of transport, equipment of recreation and treatment, access roads, functional phone and internet networks. Among the basic touristic services of the touristic product, the recreation service is indispensable because it represents one of the reasons of the journey. For the understanding of the concept of touristic product, we present below some definitions elaborated by the specialists in the field of tourism or forthcoming in the tourism legislation. Thus, the touristic product: - represents “a complex of material assets and services focused in a specific activity and offered as a package to the touristic consumption” (The tourism law, art. 3 letter ee); - represents “a cluster of material and non-material elements offered to the consumption and which should bring some advantages to the buyer, meaning to satisfy him” (Stănciulescu G. (coord.), 2002, p. 177); - can be regarded under the form of the results “of associations, interdependencies between the attractiveness of an area and the facilities offered to the buyer, where the resources will take the form of different products only through the means of specific services (accomodation, alimentation, transport, recreation)” (Costencu M., 2004, p. 101) a reason for the customization of the touristic products; - can be defined as “the assembly of material and non-material services which are offered to the market with the aim of satisfying the desires or the expectations of the tourists” (Henche G. B., 2004, p. 112); - is “through the measure of the touristic activity essentially regarded as economic activity in a certain dimension, volume, structure or quality, and by its destinations, the touristic product can be constituted as a message addressed to
265
Annals of the „Constantin Brâncuşi” University of Târgu Jiu, Economy Series, Issue 3/2016
„ACADEMICA BRÂNCUŞI” PUBLISHER, ISSN 2344 – 3685/ISSN-L 1844 - 7007
tourists who concretized their presence in the moment of performing the component services” (Nistoreanu P., 1999, p. 97). We observe that the touristic product in order to satisfy the requirements and demands of the consumers has in its componence both tangible and intangible elements. Thus, “knowing the expectances, preferences and motivations of the consumers, the touristic offer must be adapted to the demand, in such a way that the touristic product should include the benefits both for the tourist and for the local population offering it” (Henche G. B., 2004, p. 121). We all know, that the objective of each economic operator is to obtain profit, this is the reason why it is very important that in the development of the touristic activity to highlight the relation quality-price. This relation depends in great extent on the experience and professional preparation of the employed staff because the tourists want to benefit of very good services at an acceptable price. 2. The analysis of resources, market and indicators of the touristic accomodation structures
of the touristic product Bocşa area 2.1. The analysis of the natural and anthropic resources of the touristic product Bocşa area
Analysing the touristic potential of Bocşa area, we highlighted its importance for tourists because it is part of the touristic offer. Although the touristic potential, the natural and anthropic resources of Bocşa area generate the main attraction for tourists the tenderers know the fact that during the season the number of tourists increases as compared to the extra-season and thus, it also increases the use of the technical-material base and the services offered. In this way, due to the imobil character of the offer, the tourists should go in the basin of the offer for the achievement of the touristic consumption because the touristic service cannot be stored for a future consumption in the high season or low seson period. So that the touristic product should be accessible for more segments of consumers, some optimal and efficient policies of prize, distribution and promotion should be practiced.
From the geographical point of view, Bocşa lies in the South-Western part of Romania, in Caras-Severin county, on the national road DN 58B which ensures the access of means of transport between the city of Timişoara and the town of Reşiţa. Its positioning between the two towns represents an advantage for the touristic product Bocşa area because it can attract a larger number of people from both towns. The touristic product Bocşa area disposes of a rich touristic patrimony, offering to the tourists a diversity of natural resources which can be admired due to the relief formed by hills and mountains, of its placement in the Northern part of the Dognecea Mountains which are formed of hard rocks crystalline schist and banatites. The climate is specific to the continental-submediteranean area, the yearly average temperature in Bocşa has values between -2 and +20 degrees Celsius, the average temperature of the air being +10,3 degrees Celsius. From the hydrographic point of view, the river Bârzava crosses Bocşa and it flows into the Timiş. There are some important lakes in the area namely: Ferendia Lake, Vârtoape Lake, Medreş Lake, Big Lake, Small Lake, the Lake with Water Lillies. Vârtoape Lake is a natural lake which was formed by the sliding of the cesspool favorising the appearance of the lake which is presently used for recreation both for tourists and for fishermen. The Medreş Lake is an artifical lake placed above the Vârtoape Lake and it is used for recreation during the estival season. In the neighbourhood of Bocşa, in the village Dognecea, there is the Big Lake which occupies a surface of 5,8 ha, having a volume of about 450.000 cubic metres and the Small Lake known as the Lake with Water Lillies which lies on a surface of 3,1 ha, having a volume of 156.400 cubic metres. The fauna in Bocşa area is much diversified, we can meet such mammals as: squirrels, wolves, deer, foxes, hares. In the category of reptiles we can include the grey lizard, snake or vipers, respectively fish: pike, chub or carp. The flora of Bocşa area is represented by leanders, lemon trees, meadow grass, magnolia as well as forests of linden, oak or hornbeam with a rich vegetation of fern, reed, clouch grass or meadow grass. In the coniferous forests we fiind the pine, spruce, fir-tree while in the broadleaf forests we meet especially the oak, holm.
“The climatic town Bocșa Montană enjoys all the rights and endowments provided by laws and regulations regarding the hydro-mineral and climateric resorts” according to the Decision no. 46713 of 21.07.1931. In this sense, the tourists who got to Bocşa can visit the Pringhel Area, which represents an area which owns some features which are very similar to those of the climatic resorts. In the town Bocşa Română, the Pescăruş Park was achieved from European funds, and it is a place where the tourists can relax because there are benches, chess tables and an alley paved with square stones. In the Pescăruş Park there is a monument of nature The Ginkgo Biloba tree, which is very rare in the area and its extract is extremely beneficial for the treatment of various health problems such as: blood circulation, mintal illnesses, lung illnesses. The most important anthropic resources and historical monuments in Bocşa area are:
- The ruins of the Cuieşti Fortress „placed on a peak of the hill the Turk’s Lip, Cuieşti fortress was the headquarters of a nobiliary castle with a polygonal plan, a long period of time being the home of a Romanian nobiliary family and the proper beginnings of its building remain unknown” (Jurjica T., 1981, p. 306). In the same time „some recent archeologic researches attest the fact that Bocşa was the center of the district Cuieşti, which was documentary attested in 1349, but also a fortress, documentary attested in the 14th- 15th century in the ruins of the fortress at Turk’s Lip.” (Vişan M., Crecan D., 2013, p. 33);
266

Annals of the „Constantin Brâncuşi” University of Târgu Jiu, Economy Series, Issue 3/2016
„ACADEMICA BRÂNCUŞI” PUBLISHER, ISSN 2344 – 3685/ISSN-L 1844 - 7007
- Saint Ilie Monastery built in the 20th century and whose “Church was sainted on the date of 19th June 1907 in the wake of Saint Prophet Ilie, by the archimandrite Filaret Musta, together with the prior PhD. Iosif Traian Bădescu and a synod of priests (Mureşianu I. B., 1976, p. 129-130). The Monastery Saint Ilie represents an oasis of spirituality for the entire area, this is the reason why “some places for accomodation were arranged for those who look for peace and they can stay for three days according to the monastery’s tradition. A library was also arranged and a monastery museum is going to be opened.” (Timiş C. A., 2011, p. 17); - “Constantin Lucaci” Museum – Space and Light, museum where there are 17 sculptures of stainless steel realised under diverse forms and coal drawings. The tourists who visit the museum can feel the light in their soul which overflows on them when they look at the master’s cultures because the landscape from the light museum “ressembles the one from the native garden, with plum-trees in Bocşa before the sunrise because under moon light, the plum-trees garden seems of steel. The moon landscape with metallic irisation” (Popovici G., 2013, p. 127);
- The Wooden church the Birth of God’s Mother in Calina represents a “reservation of religious popular architecture” (Potoceanu N., 2009, p. 23). Today the Church of Calina owns only two of the three bells that it had originally and it was decalred a historical monument. Its wake is God’s Mother Deliverance being the first church in Romania built of wood by intercalating on the walls the vertical pillars which are called “in little dogs”.
- The Chapel of Dognecea on which there are two miners made of plaster ”Bergmandl” is an important objective and “which must be linked to the valorization of religious habits, of local traditions specific for the miners community” (Ebert F., 2000, p. 110).
- The Furnace of Dognecea „built between : 1857-1858, the residence of Maria Theresa,the former prison dating from the time of the queen, the ruins of the foundry” (Ebert F., 2000, p. 108).
The folklore of Bocşa area is represented by the existing events during the time, namely: the Prayer of Bocşa Română, the Prayer Vasiova, the Prayer of Montana, the Festival of singing Aurelia Fătu Răduţu, respectively the Festival of Poetry in Banatian speech ,”Father Oancea” organised in October. In the neighbourhood of Bocşa, repectively the village Dognecea, there are numerous events such as: the Easter Prayer, the Prayer of the Izvor Community in Dognecea, the Prayer of Calina, the festival of donuts which is usually held in February, Fărşang which is celebrated in the first half of February.
2.2. The analysis of the touristic product Bocșa area
The market of the touristic product represents the geographical or virtual place where the needs and desires of consumers take the form of the demand and the totality of material assets and touristic services available to satisfy them form the offer. Thus, the market of the turistic product contains the totality of producers and beneficiaries of material assets and touristic services. The real offer represents the effective achievement of the touristic service by using the equipment and the service staff by the client. The real offer is identified with the supplied effective product. The demand of touristic services express the need of services of high order and it has a certain variability in space and time and a strong local character from the geographical point of view. Having in view the improvement of the quality of the touristic product Bocşa area it is necessary to know the motivations which are the base of taking decision of choice by the turists of that area. Therewith, we must know the preferances of the tourists having in view to ensure the necessary conditions which will determine them to come back with pleasure in this area. We all know that tourists want to find in the structures of touristic accomodation an ambient environment as pleassant as possible, silence, tidiness, a staff profesionally prepared and polite of whose services they should benefit the whole period of staying.
By the dimensions of the market of the touristic product Bocşa area, we must analyse the structure, the area and the capacity of the market. The structure of the market of the touristic product Bocşa is formed from effective consumers, potential consumers and non-consumers. The segmentation of the tourists can be achieved taking into consideration the needs and preferences of the tourists, according to many criteria and it helps to establish the marketing policy. From the information gathered in the interview of the tourists who were in the area we observed that a part of the tourists prefer the Medreş Lake for fishing and recreation, the Pescăruş Park for walks and for rest the Bed and Breakfast Stejarul and Nufărul. Another part of the tourists who are accomodated at B&B Colţ de Rai want to relax in nature or to benefit of the recreation services of the B&B’s or to go fishing on one of the two lakes: Small Lake and Big Lake. We observed that part of the structures of the touristic accomodation adopt a concentrated strategy thus, determining that the touristic services to be addressed between one and three segments of the market consumers and the other part should adopt a differentiated strategy which has in view the segmentation of the market and the orientation of the policies regarding the product, price, distribution and promotion for each segment.Thus, the touristic services are offered to consumers according to their preferences according to their age, social-professional category and the income they have because the touristic structures sell through the tourism agencies some touristic packages according to the tourists’ preferences. In the market area in Bocşa region there is the local market formed by tourists which prefer to spend the free time on the banks of the rivers but also the national market because in the town we meet tourists both from the Western part of Romania but also from other parts of the country, followed by the international market which bring foreign tourists in the area with the occasion of some yearly events for relaxation,
267

Annals of the „Constantin Brâncuşi” University of Târgu Jiu, Economy Series, Issue 3/2016
„ACADEMICA BRÂNCUŞI” PUBLISHER, ISSN 2344 – 3685/ISSN-L 1844 - 7007
spending holidays or for business. According to the characteristics of services we can meet: the market of the sojourn tourism, the market of circulation tourism, the market of business tourism.
Regarding the capacity of the touristic market of Bocşa area, this is influenced by the low season and high season period. Meaning the high season, the months May-November the demand is continuously increasing, there are even periods when the demand cannot be covered, while during the low season the number of tourists is very low. According to the geographical criterion, most segments of consumers in the towns such as Reşiţa, Timişoara, Bocşa, and in a more reduced percentage from the other parts of the country or from abroad. Likewise, according to the age criterion most tourists are young and adults with the age between 25 and 59 and a reduced percentage of people over 60 years. The frequency of the consumers from the urban enviroment predominates, they declare that they are pleased with the touristic potential and touristic services which Bocşa owns and they will come back in other occasions as well. Most of the tourists have chosen to spend their holidays or their free time only in week-end by mountain trips, rest and recreation benefiting of the recreation services near the lakes, at an accessible price. Another segment of tourists are people from abroad or from our country who practice the business tourism and they appeal to the services of accomodation structures in Bocşa area. Other tourists choose Bocşa area for fishing, trips or relaxation in nature, without spending the night in the area, a situation in which they do not benefit of accomodation services. There are also tourists who spend the night in a tent, a fact which can have negative effects on the environment by polution and destroying the natural resources which Bocşa area owns. 2.3. The presentation and analysis of the indicators of the profit and loss account of the
touristic accomodation structures in Bocşa area The analysis of the indicators of the profit and loss account of the firms which own the most used structures of touristic accomodation in Bocşa area was achieved on the basis of the information available on the site of Public Finances Ministry. Due to the fact that there are no statistical information in the Statistic Directory of Romania about the indicators of the touristic market capacity and not about `the measurement indicators of touristic circulation on areas just on regions, we proceeded to the analysis of indicators of the profit and loss account of the most used structures of touristic accomodation in the Bocşa area. We have analysed the turnover, total income, total expenses, gross profit, the average number of employees and we have calculated the work eficiency. Information about the most used structures of touristic accomodation in the Bocşa area were taken from the firms and from the sites: National Authority for Tourism, The list of classified touristic structures http://turism.gov.ro/informatii-publice/; Public Finances Ministry, Fiscal information and balances, www.mfinante.ro.
Table no. 1 Indicators of the profit and loss account of the touristic accomodation in Bocşa area Year Rate of
turnover [lei]
Total income
[lei]
Total expenses
[lei]
Gross profit [lei]
Average number of employees
[persons] Bed and breakfast Stejarul 2011 3361692 3385931 3345667 40264 34 2012 2601123 2711027 2782713 0 32 2013 1830236 1872991 1989382 0 31 Bed and breakfast Nufărul 2011 2392160 2374378 2368480 5898 31 2012 2970118 4390140 4354759 35381 31 2013 2525847 3175202 3169379 5823 36 Bed and breakfast Lyn 2011 61828 61828 65694 0 3 2012 105997 105997 103655 2342 3 2013 88810 94196 84088 10108 3 Bed and breakfast Izvor 2010 247529 247533 223952 23581 1 2012 92908 92919 98892 0 1 2013 70036 114441 100794 13647 1 Bed and breakfast A Corner of Heaven 2011 3381604 3383843 3342138 41705 12 2012 2818218 2821511 2791167 30344 11 2013 2055048 2629226 2608782 20444 11
Source: The Ministry of Public Finances, Fiscal Information and balances, available on 12.01.2016 on www.mfinante.ro
268

Annals of the „Constantin Brâncuşi” University of Târgu Jiu, Economy Series, Issue 3/2016
„ACADEMICA BRÂNCUŞI” PUBLISHER, ISSN 2344 – 3685/ISSN-L 1844 - 7007
The B&B Stejarul owned by S.C. DOLY COM S.R.L. is placed near the Lake Medreş in Bocşa, no. 27,
Medresului Street is classified with 3 stars and has 17 rooms with a capacity of 35 accomodation places. It has a restaurant with 100 places, offering recreation services through means of a swimming-pool and a terrace in the yard of the guesthouse. In the B&B Stejarul the tourists are offered several means of spending the free time, namely: fishing, swimming, organisation of the trips in the neighbouring forests, respectively hunting in the especially arranged places. Besides accomodation and alimentation, in the guesthouse there can be organised some recreative activities, business reunions, baptisements, weddings, anniversaries, activities type team-building, conferences. The prices on rooms are differentiated according to the number of tourists, these prices starting from 70 lei/night.
From the indicators presented we observe that in the last three years of activity, the turnover decreased with 22,63% in 2012 and with 44,56% in 2013, as compared to the year 2011. The decrease of the turnover led implicitly to the decrease of the income with 19,91% in 2012 and in 44,69% in 2013, as compared to 2011. In the case of total expenses, they were in a continuous decrease. Thus, as compared to 2011 with 16,93% in 2012 and with 40,54% in 2013. The reduction of the income in relation to the expenses had unfavourable consequences on the guesthouse, registering thus a gross profit only in 2011, while in the other two years there was no profit. Regarding the average number of employees, in the firm there were decreases as compared to 2011, with 5,89% in 2012, respectively 8,83% in 2013. The work efficiency was : W = 3.361.692/34 = 98.873,29 lei/employee, in 2011; W = 2.601.123/32 = 81.128,09 lei/employee, in 2012; W = 1.830.236/31 = 59.039,87 lei/employee, in 2013. Thus, the reduction of the number of employees was determined by the reduction of the work efficiency as compared to 2011 with 17,95% in 2012 and with 40,29% in 2013.
The B&B Nufărul belongs to S.C. AUTO TRANS MAN S.R.L. and it is placed at the bottom of the hill Medreşul Mare, in the neighbourhood of Lake Medreş, the town of Bocşa, no. 25, Medresului Street representing a modern and elegant guesthouse being classified with 3 stars. We can say that in the guesthouse we find a whole touristic complex, which lies on a surface of 8.000 m2, composed of a main building. The guesthouse has 5 rooms, with a capacity of 10 places, a restaurant with 90 places which can be anytime transformed into a conference room, due to the modular character of the room, a terrace with a capacity of 100 places, a swimming-pool and a lake with water lillies for recreation or pisciculture. The B&B Nufărul offers the tourists the room at the price of 120 lei/night with breakfast included.
On the basis of the presented indicators, we observed that in the last two years, the turnover has increased with 24,16% in 2012 and with 5,58% in 2013. Likewise, the increase of the turnover has led implicitly to the increase of income with 84,89% in 2012 and with 33,72% in 2013. The total expenses recorded increased as compared to 2011 with 83,86% in 2012 and with 33,81% in 2013. With the increase of total income, the expenses have also increased which has led to the obtainance of the gross profit which has registered a remarkable evolution, thus, as compared to 2011, the gross profit has increased with 499 % in 2012, while in 2013 there was recorded a small decrease of the profit with 1,28%. Regarding the average number of employees in the firm mentioned above, in 2011 and 2012 the firm had 31 employees while in 2013 there was an increase with 16,12%. The efficiency of the work registered by S.C. AUTO TRANS MAN S.R.L. was: W = 2.392.16 /31 = 77.166,45 lei/employee, in 2011; W = 2.970.118/31 = 95.810,25 lei/employee, in 2012; W = 2525847/36 = 70.162,41 lei/employee, in 2013.
The B&B Lyn belonging to S.C. LYN COM 2007 S.R.L is placed in Bocşa Română, Dacia Street, classified with 3 stars, offers to the tourists besides the accomodation and alimentation services, the possibility to organise diverse events. The guesthouse Lyn has a number of 10 rooms with a capacity of 20 places, a restaurant with a capacity of 80 to 100 places, respectively the conference room, with a capacity of 60 places. The guesthouse Lyn has a price of 80 lei/night/room.
Analysing the economical-financial indicators of society, we observe that in the last two years analysed, as compared to 2011, the turnover has increased with 71,43% in 2012 and with 43,64% in 2013. The increase of the turnover has also determined the increase of income with 71,43% in 2012 and with 52,35% in 2013. Although with the increase of income the expenses have also increased but in a more reduced rythm which has led to the obtainance of gross profit. Thus, if in 2011 the guesthouse has not recorded gross profit, starting with the year 2012 and this was even more decreased with 76,84% as compared to the year 2013. Thus, although income has increased with the expenses and the firm has not registered profit in the first year of reference, however due to the quality of tourisitic services offered it succeeded to attract the clients and maintain on the market. Regarding the average number of employees in the firm this was maintained constant during the whole period, there are no recordings of hiring or dismissing staff. Regarding the work efficiency recorded by S.C. LYN COM 2007 S.R.L., this was: W = 61.828/3 = 20.609,33 lei/employee, in 2011; W = 105.997/3 = 35.332,33 lei/employee, in 2012; W = 88.810/3 = 29.603,33 lei/employee, in 2013. Likewise, we observe that the constant number of employees has determined the increase of the work efficiency as compared to 2011with 71,43% in 2012 and with 43,64% in 2013.
The B&B Izvor belongs to S.C. SI TOP TOUR S.R.L and is placed in Bocşa Montană, no. 51, Izvor street, next to the dam on Bârzava, it is classified with 2 stars, offering the tourists very good conditions for recreation and hiking towards Vârtoape Lake and the area Colţani. In the guesthouse many events can be organised: weddings, baptisms, anniverseries, thus, the tourists being both inhabitants of Bocşa but also Austrian, Serbian or Dutch people. It
269

Annals of the „Constantin Brâncuşi” University of Târgu Jiu, Economy Series, Issue 3/2016
„ACADEMICA BRÂNCUŞI” PUBLISHER, ISSN 2344 – 3685/ISSN-L 1844 - 7007
has 9 rooms with a capacity of 22 places and in the restaurant there are 90 places. Besides the accomodation and alimentation services, the guesthouse has a terrace in free air, used in case of events but also a sport field which can be used to practice all kinds of sports. Because S.C. SI TOP TOUR S.R.L. did not have activity in 2011, we will take the indicators from the previous year 2010. The B&B Izvor has a price of 50 lei/night for single rooms and 80 lei/night for double rooms and the appartment for a price of 150 lei/night. In the case of the firm S.C. SI TOP TOUR S.R.L. we observe that in the last two years, as compared to 2011, the turnover has decreased with 62,47% in 2012 and with 71,71% in 2013, which has led to the decrease of the firm’s income with 62,47% in 2012 and with 53,77% in 2013. In the case of total expenses, these were reduced as compared to 2011 with 55,85% in 2012 and with 55% in 2013. As compared to 2012, the firm registered a decrease of the gross profit with 42,12% in 2013, while in 2012 it had no profit. The average number of employees in the firm was maintained constant during the whole period, not recording changes with the employees. Regarding the work efficiency recorded by the firm in the period 2010-2013, this was: W = 247.529/1 = 247.529 lei/employee in 2010; W = 92.908/1 = 92.908 lei/employee, in 2012; W = 70.036/1 = 70.036 lei/employee, in 2013. Likewise, we observe the fact that the constant number of employees has determined the decrease of work efficiency as compared to 2011 with 62,47% in 2012 and with 71,71% in 2013.
The B&B A Corner of Heaven belongs to S.C. CLR-DENIS MONTAJ S.R.L being classified with 3 flowers, has 13 rooms with a capacity of 28 places. Tourists can serve meals in the alimentation unit of the restaurant A Corner of Heaven whose capacity is 100 places, thus, in the restaurant the tourist can have both Romanian type of food and international cuisine meals having to choose from a very diverse meniu. The installation and equipment necessary for recreation are varied and can be put at the tourists’ disposal at the complex ”A Corner of Heaven” by renting. Thus, tourists that choose to spend their free time in a recreative way on the banks of the Big Lake, have at their disposal: hydro-bicycles, kayaks, little boats, ATV’s, aquatic tobbogans, equipment necessary for achieving horse rides. We recomand the analysis of indicators also for S.C. CLR-DENIS MONTAJ S.R.L. – B&B A Corner of Heaven in Dognecea, no. 782 because it is closest to Bocşa. The B&B A Corner of Heaven has a price of 150 lei/night per room. The recreation services have the following prices: horse ride with companion 70 lei/hour, renting hydro-bicycles 20 lei/hour, kayaks 15 lei/hour or boat 25 lei/hour for journeys on the lake and for billiard fans and ping-pong fans the price is 20lei/hour in the guesthouse. The guesthouse A Corner of Heaven, is available for the tourists must be paied with 150 lei/hour.
We observe that in the last two years as compared to 2011, the turnover decreased: with 16,66% in 2012 and with 39,23% in 2013. Likewise, the decrease of the turnover has led to the reduction of income with 16,62% in 2012 and with 22,30% in 2013. The total expenses decreased as compared to 2011 with16,49% in 2012 and with 21,94% in 2013. From those presented above we observe that the gross profit decreased with 27,24% in 2012 and with 50,97% in 2013. The most important thing is represented by the fact that although the income has decreased, the firm had a profit, thus, succeeding to beat the concurence by means of their services offered. Regarding the average number of employees in the firm mentioned above in 2011 the firm had 12 employees and in 2012 and 2013 the number of employees decreased with 8,33% (100%-91,67%), reaching 11 employees. The work efficiency was: W = 3.381.604/12 = 281.800,33 lei/employee, in 2011; W = 2.818.218/11 = 256.201,63 lei/employee, in 2012; W = 2.055.048/11 = 186.822,54 lei/employee, in 2013. Likewise, we observe that the reduction of employees number has led to the decrease of work efficiency as compared to 2011 with 9,08% (100%- 90,92%) in 2012 and with 33,70% (100%- 66,30%) in 2013.
In order to improve the relation demand-offer in the Bocşa area I propose to improve the touristic product by the diversification of touristic services, which should lead to the enhancement of the quality according to the tourists’ demands in accordance with the environment protection and natural and anthropic resources of the area. 3. Conclusions
From the specialised studies and the legislation in force we can conclude that the touristic product represents
the complex of material assets and touristic services which generate the tourists’satisfaction. The touristic product Bocşa area owns a touristic patrimony which enforces to be protected against destructions and polution because the quality of the touristic product depends the beauty of landscapes and the purity of the air. The tourists who want to benefit of spiritual enlightment can visit the Monastery Saint Ilie, the Wooden Church the Birth of God’s Mother in Calina and the Chapel of Dognecea, those who want to relax, to breathe fresh air can visit the area Pringhel, Pescăruş Park where they can see the Ginko Biloba tree and the fishing activities, recreation and walks can be achieved on the banks of the lakes: Medreş, Big Lake and the Lake with Water Lillies. Regarding the cultural-artistic events and the customs and traditions of the area, the tourists can participate in such events as: the Prayers of the towns, the Donuts Festival, the Festival of singing Aurelia Fătu Răduţu, respectively the Festival of Poetry in Banatian speech ,”Father Oancea” The tourists interested in culture and history can visit the unique exhibits offered by the great master Constantin Lucaci to the town of Bocşa, in the museum which bears his name but also The ruins of the Cuieşti Fortress placed on a peak of the hill the Turk’s Lip. In order to rest the tourists can benefit of accomodation and alimentation services in the area the most used are: Stejarul B&B, Nufărul B&B, Lyn B&B, Izvor B&B, A Corner of Heaven B&B.
270
Annals of the „Constantin Brâncuşi” University of Târgu Jiu, Economy Series, Issue 3/2016
„ACADEMICA BRÂNCUŞI” PUBLISHER, ISSN 2344 – 3685/ISSN-L 1844 - 7007
The main forms of tourism which can be practiced in Bocşa are the mountaineous tourism, week-end tourism, agroturismul, hunting and fishing tourism, cultural-historical tourism, religious tourism, hiking. The market of the touristic product is in accordance with the necessities and preferences of the tourists so that a durable balance of tourism should be beneficial both for tourists and for the local community. Known the fact that the main intermediaries of the firms of touristic accomodation in Bocşa area are the tourism agencies in Bocşa and Reşiţa and taking into consideration the facts mentioned above, we recomand the implementation of a strategy of attracting and making the clients faithful. Thus, the services offered to tourists must be achieved by qualified staff if you want to obtain a competitive advantage as compared to the competition and with the help of equipment and modern infra-structure and by offering touristic services of high quality and high personalised we can determine the clients’ fathfulness.
Most tourists before choosing a certain destination for spending vacation informs themselves about the touristic potential of the area, reason for which it is necessary tat this one should be preserved and to benefit of improvement works where it is needed and where the touristic legislation in force allows. The consumption behaviour of the tourists in Bocşa area differ according to each tourist’s demands, to their age and social category, observing thus that younger tourists when leaving the visited area they leave garbage on the green space, ignoring the negative effects of poluting the environment. Due to the patrimony of the existing resources in the area and the quality of services offered there appears the need for the promotion of the touristic product Bocşa area by means, techniques and instruments specific for marketing. We mention that lately the most efficient promotion of Bocşa area was achieved by the online environment on the sites of touristic destinations or structures of touristic accomodation.
From the marketing point of view, the tourists’ behaviour is essential because nowadays the quality is the main aspect for which the tourist chooses a touristic area and the satisfaction of the tourist’s needs being the only reason which guarantees the success on the market. 4. References [1] Costencu M., The economy of tourism - a university course, second part, Eftimie Murgu Printing House, Reşita, 2004; [2] Ebert F., Integrated Tourism. Banat and Maramureş, InterGraft Printing House, Reşiţa, 2000; [3] Henche G. B., Marketing in rural tourism, Bucureşti, Irecson Printing House, 2004; [4] Jurjica T., The counties of the motherland. Caraş–Severin, Bucureşti, 1981; [5] Mureşianu I. B., Monasteries in Banat, Banat’s Mitropoloy Printing House, Timişoara, 1976; [6] Nistoreanu P., Rural tourism a small business with big perspectives, Didactic and Pedagogic Printing House, Bucureşti, 1999; [7] Popovici G., The touristic guide of Mountaineous Banat, Eftimie Murgu Printing House, Reşiţa, 2013; [8] Potoceanu N., Rocks and minerals in the history of Mountaineous Banat, Marineasa Printing House, Timisoara, 2009; [9] Stănciulescu G. (coord.), The lexicon of touristic terms, Oscar Print Printing House, Bucureşti, 2002; [10] Timiş C. A., Monasteries and sketes in the Episcopacy of Caransebeş, Diocesan Printing House, Caransebeş, 2011; [11] Vişan M., Crecan D., History and administration in the multicentennial Bocşa, Mirton Printing House, Timişoara, 2013; [12] *** http://www.certificareiso.ro/article/13091/Bocsa/3, Decision no. 46.713/21.07 1931, published in The Official Monitor – First Part - no. 176 of 1 August 1931, 2016; [13] ***http://turism.gov.ro/informatii-publice/, National Authority for Tourism, The Classified List of Touristic accommodation, 2016; [14] ***http://www.mdrl.ro/_documente/transparenta/consultari_publice/consultare135/lege_turism,The tourism law, 2016; [15] ***www.mfinante.ro, Ministry of Public Finances, Fiscal Information and balances, 2016.
271

Annals of the „Constantin Brâncuşi” University of Târgu Jiu, Economy Series, Issue 3/2016
„ACADEMICA BRÂNCUŞI” PUBLISHER, ISSN 2344 – 3685/ISSN-L 1844 - 7007
REFLECTIONS ON THE IMPLEMENTATION OF INFORMATION SOCIETY IN ROMANIA
PAUL BOGDAN ZAMFIR
LECTURER PH. D. CONSTANTIN BRÂNCUŞI UNIVERSITY OF TÂRGU-JIU, ROMANIA e-mail:[email protected]
Abstract: This paper aims to synthesize main aspects regarding the implementation of the information society in Romania in the the current period of post-accession to European Union. This approach of scientific research is based essentially on a set of official documents between which are highlighted National Strategy on the Digital Agenda for Romania 2020, corroborated with Digital Agenda for Europe. In this sense, it is important to mention that the Information Society (IS) involves not only a rethinking of the way in which Romanian companies should identify efficiency and performance solutions to requirements of more ever specialized consumers, which could allow to maintain on the advantageous positions ahead of stiff trade competition intra and extra EU trade competition but also a greater awareness of behavior and valorisation mutations generated by the complexity of globalization phenomenon which could appear at national consciousness level. Also in the equation process of Romania's integration into the paradigm of information society, the innovation and technological changeshave an important role in achieving economic performances and changes in their dynamic, that can irreversibly influence the mechanism for implementing the strategies of modernization, growth and sustainable development. Finally, it is important to emphasize that from this perspective it is porposed only a schematic approach to the framework of IS implementation in Romania, without the intention of making an exhaustive presentation of the issue highlighted in this paper. Keywords: information society, information and communication technologies, innovation, technological progress, National Strategy on the Digital Agenda for Romania 2020. Classification JEL: O3, O31, O33, D8, D83 1. INTRODUCTION The development of information and communication technology (ICT) combined with the proliferation of the internet on a global scale has led to a new phase of society development -Information Society. In the same order of ideas, ICT is more and more used in all human activities, that are in an indissoluble connection with economic growth. Although there is in the specialized literature a wide variety of authorized opinions formulated in sphere of conceptual approach of information society (Ramsamy, 2010; Webster, 2014; Hilbert, 2015), however it is widely spread the idea that IS is considered to be a society in which the creation, distribution, use, integration and manipulation of information is an economical, political and cultural activity, with high degree of complexity registered at contemporary international community level. In the same time, it is important to note that the driving force of information society, essentially consists in digital information and communication technologies, that lead in an irreversible way to explosion of information and profound changes in all aspects of social organization, economics, education, health, environment and administration. Moreover, all members of IS that have the necessary means to participate at this type of society are suggestively called digital citizens. This is one of the many labels that have been used to suggest that people enter into a new phase of evolution of society. Also, it is a truth universally acknowledged that the international economic environment is currently characterized by outstanding mobility, determined by several factors, which are distinguished: the acceleration of technological innovation; the stronger impact of information society and its imperatives in the field of capitalization of human resources; the appearance of new service activities; improvement of operating conditions of companies, that can stimulate the dynamic of entrepreneurial activity, and any specific requirements resulting from the new objective of world development respectively sustainable development, namely integrating the various components of growth in a framework that confers of policies and development programs to long term viability. [7] An empirical analysis of the characteristics of the international economic environment shows that some indicators, such as accelerating the growth of multifactor (global) productivity, the increasing importance of
272

Annals of the „Constantin Brâncuşi” University of Târgu Jiu, Economy Series, Issue 3/2016
„ACADEMICA BRÂNCUŞI” PUBLISHER, ISSN 2344 – 3685/ISSN-L 1844 - 7007
technological progress incorporated in goods and equipment, primarily the development and spread of ICT, enhancing the competence of human capital, demonstrates that innovative activity and technological change are fundamental factors for the improvement performance in terms of sustainable economic growth. 2. INNOVATION AND TECHNOLOGICAL PROGRESS - KEY FACTORS IN THE IMPLEMENTATION OF THE INFORMATION SOCIETY In the building process of information society is highlighted the innovation factor that has a leading role in the performance level of firms and hence for the economic growth. The innovation activity is mainly supported by market, becoming nowadays more than ever increasingly faster and more intense, being closely conected to scientific progress and knowing a widespread in the entire national economy. In general, the innovation is reflected in the development, introduction and economic use of products, processes and new services. Thus, range of innovations is very wide, including both radical innovations - creative products, processes and entirely new services, as well as innovations that contribute to the upgrading of products, processes and services, which are already on the market. Innovative ideas are manifested in technology, manufacturing processes, products, and forms of activities organization, qualification and professional specialization, marketing forms and also all types of market demand.
The process of innovation is expanding in geometric progression in all economic sectors, service sector also tends to increase its share of total research and development expenditures. Thus, fields as financial services and those registered in the companies are on the first places in terms of ICT investments. Certain elements tend to suggest that, for service fields such as banking services, transport and retail trade, ICT investments have enabled innovation of products and processes that stimulated productivity growth. In the same time, the success of innovation act directly or indirectly depends on extent and quality of the investment effort in the research and development field, associated with the evolution of investments in development and modernization of production capacities, marketing activity and human resources.[4]
Innovation is not always based inevitably on the activity of research and development it involves often a technological and organizational change and requires a large volume of investments in complementary areas such as: (qualification of workers, manufacturing process, marketing activity). However, a higher intensity of research and development activity favors a better economic performance. In addition, the research and development grows in importance as the national economy is based more and more on knowledge and the industrial activity with sustained dynamics is founded mostly on science. In these circumstances, the specific characteristics of national system of research, development and innovation have an important role. Considering the increasing trend of costs and risks resulted from innovation activity, Romanian companies involved in ICT must become more specialized, focusing mainly interational economic environment. Also, it is necessary a change in the direction of rising role of scientific research in trade strategies of enterprises from our country, in the conditions of accelerated diversification from the range of technologies required for innovation activity and the enhacement of complexity level of those tehnologies. In these circumstances, for Romanian economic environment, it becomes imperative to provide a favourable framework for innovation, receptive to new technical inventions that allow more efficient use of advantages resulted from exploitation of information and communications technology. Therefore, the information and communication technology is one of the best examples of major technology that transforms substantially the activity throughout the economy.
In these circumstances, the new technologies determine profound transformations in all fields of activity, and the government of our country is called to assume the new challenge and ensure the adoption of adequate policies to enable for domestic entrepreneurial environment to obtain the benefits offered by these technologies, and in the same time, minimizing the negative effects resulted inexorably from economic activity. More than that, the new technology represents the catalyst for profound changes, by essence of international business environment, partially responsible for a major restructuring of companies modification of work organization, reorganization entrepreneurial activity associated with cost reduction, rationalization and restructuring the value chain of products and generally, of supply.
In these conditions it is important to note that ICT consists in technologies with high power, wide range of applications, whose productivity becomes maximal if they are disseminated and used in combination with organizational transformations, education and training (increasing professional competence). Obtaining the benefits from implementation of new technology depends on investments in complementary fields of action and the activity of public and private companies.
Concidering the arguments previously formulated, it is necessary to take into consideration one of the postulates of information society according to which, the capital accumulation from the ICT sector by Romanian companies will inevitably lead to increased production and productivity. In other words In other words the, the widespread introduction of ICT equipment in the production process of enterprises from our country, will favorably influence the aspects of performance and competitiveness of Romanian companies on the international market generally and EU single market particularly. [2]
273

Annals of the „Constantin Brâncuşi” University of Târgu Jiu, Economy Series, Issue 3/2016
„ACADEMICA BRÂNCUŞI” PUBLISHER, ISSN 2344 – 3685/ISSN-L 1844 - 7007
3. GENERAL FRAMEWORK FOR IMPLEMENTING INFORMATION SOCIETY IN ROMANIA
The structural transformation of contemporary society in IS requires a variety of elements which must be promoted. As it can seen in Figure No. 1 The International Telecommunication Union emphasizes four critical factors that are assimilated with the structural elements and principles of the information society. From this perpective, it further appreciates, that these factors can contribute to the successful implementation of information society not only at the macro level national but also in individual sectors and industries plan, and even to the the level of citizens (micro level).
Figure No.1. Key factors in the implementation of information society
Source: http://www.ict-pulse.com From the point of view of implementing IS, it is necessary it is necessary to refer at two elements that define the
new mode of production, namely workforce and innovative technology. These factors are placed into an economic and social context which favors the transition to IS. [6]
Although, obviously the issue of specific characteristics is not reduced at computing and communications, the latter can act as proxy for the following reasons:
Ø digitization is the leading technology for the knowledge economy and makes possible the transition from the economy of scale to niche;
Ø information technology enables the creation of networks and systems based on self-organization and democratization of leadership both at micro and macro level;
Ø information technology is the base of globalization phenomenon. In addition, the network efficiency of knowledge dissemination depends directly on the development of information and communication technologies. The approach of the knowledge economy development through creation of legal and institutional basic infrastructure (infrastructure of the information society), it is a coherent approach practiced into accelerated rythm, in accordance with the need of gaps recovery for Romania in the economic plan compared to western developed countries from EU. The main pillars of implementation policy of information society in Romania are: increasing endowment with ICT equipments in the public sector (especially in education); stimulation (obligation) of interaction by electronic means between companies and administration; generation of a learning process at society level through state action as an exemplary consumer; trying to correlate the infrastructure investments to offer content designed to stimulate the development of online environment.[1]
Universal
Rights
Egality
Access
IS
Various Content
274

Annals of the „Constantin Brâncuşi” University of Târgu Jiu, Economy Series, Issue 3/2016
„ACADEMICA BRÂNCUŞI” PUBLISHER, ISSN 2344 – 3685/ISSN-L 1844 - 7007
In addition to previous arguments regarding the fundamentals of policy implementation of Information Society in Romania, are required to be emphasized and identified some aspects with direct incidence on the problem of best practices application established at EU level in the transformation process of Romanian society into a modern IS. On this background it should be noted that Romania, as a member state of European Union with full rights and obligations was active manifested in this direction, through the adoption of the communautaire acquis and its implementation in the construction of appropriate institutional framework for e-government, e-commerce, electronic transaction security, telecommunications, intellectual and industrial property rights, etc. On the other hand, the application of best practice in the implementation of SI by our country should couplate by the stimulation of modern technology consumption in the private sector, either directly or indirectly, by creating the conditions for appearance of business forms that lead to innovation such as: the proliferation of green entrepreneurship in ICT. Although the Romanian ICT market is one of the most dynamic that registers significant increases, however, there is a slowdown of the growth rates at hardware and office equipment, projected for the next period, nevertheless it can be observed today a tendency of market saturation. In order to increase the level of digital economy and society Index (DESI) in the medium and long term, the Ministry of Communications and Information Society, elaborated in July 2014 National Strategy on the the Digital Agenda for Romania subsequently approved by Government Decision no. 245/2015. The strategy has been developed on the basis of Digital Agenda for Europe 2020, which is the reference framework for the development of the digital economy 2014-2020 in Romania. Furthermore it is required to remember that National Strategy on the the Digital Agenda for Romania, directly aimed at ICT sector, and at the same time aims at contributing to economic growth and competitiveness of the national economy, both through direct actions oriented towards the development emotional Romanian ICT sector and by the indirect actions such as: increasing efficiency and reducing public sector costs in Romania, improving the private sector productivity by reducing the administrative barriers in relationship with state and increasing the labor force competitiveness in Romania and not only that. The principle on which the National Strategy is based consists in creating a competitive environment that will encourage and attract the citizens and companies that pay taxes and which in turn, provide a sustainable growth in long-term. Some of the objectives set by the European Digital Agenda were taken and adapted at the current context from Romania, to the extent that they are relevant and aligned with the strategic vision of ICT Romania for the period 2014 – 2020. The purpose of this action is to ensure the development OF ICT sector in Romania at the level of European Union countries namely to establish the premises of Romania integration, in terms of ICT, in European digital single market. [3] In the current period of EU postadheration, Romania has made significant progress in ICT sector, but regarding the digital economy and society Index (DESI), in 2015 registered a total score of 0.32 being situated on 28th place of the 28 EU Member States. Although compared to last year, a larger proportion of population are subscribed to broadband networks, nevertheless the low level of skills and confidence of consumers seems to be an obstacle in the digital economy development of our country. Using the Internet has increased, mainly due to the higher participation into social networks. On the other hand, Romanian enterprises should exploit better the advantages of social networks, online trade and cloud applications. The share of users who interact with the public authorities increased, but is still the lowest in the EU.[8] In relation to, the issue of specific technology must be analyzed also the quality of human factor that is important in the light of double role of knowledge producers and consumers. Thus, the characteristics of human factor are also elements that can support K-exclusion in Romanian society and especially the need to stimulate knowledge demand incorporated goods or their specific qualities to information society. The negative demographic evolution at national level reflects reducing and aging population, resulted in the risk of knowledge gap into between generations, which in turn requires major investments in the supplementation and development of continuing education offer in order to reduce them. Underutilization of highly qualified labor is an issue that is felt acutely in the case of Romania and is reflected in the phenomenon of "brain drain". Enhancing the share of computing products, as well as those from education and culture category in the structure of household expenditure, although significant, should maintain the upward trend and continue to provide the critical mass necessary for the information society functioning. On supply side, the knowledge production is circumscribed to research-innovation. The research activity at the firm level, as well as innovation is a relatively low stage of development. In particular, small and medium enterprises, although theoretically are the main innovators, by their natural dynamism, are inhibited through the state of undercapitalization in which they are and barriers that affects the business environment. [5] Finally it must also add that the research budget funding is decreasing and the overwhelming preponderance of budget funds and research fund of enterprises draws attention to the lack of quasi-competitive innovation market, with specific funding mechanisms.
275

Annals of the „Constantin Brâncuşi” University of Târgu Jiu, Economy Series, Issue 3/2016
„ACADEMICA BRÂNCUŞI” PUBLISHER, ISSN 2344 – 3685/ISSN-L 1844 - 7007
4. CONCLUSIONS In the specific context of the information society is transformed digital information into economic and social valuecreates the new business opportunities and simultaneously profoundly changes people's lives. Information society is a new higher quality lifestyle that involves an intensive use of information in all areas of human existence and activity, generating a major economic and social impact. This pattern of contemporary society development allows the amplification of entrepreneurial activities in a sustained rhythm amplification, and offers them the opportunity to take the best decisions, which could lead at sustainable economic growth, taking into account the fact that the information society offers a complete and rapid system of informations for business environment. In relation to the implementation of information society in Romania should be noted that through imeasures ntroduced by the public authorities in particular after 1 January 2007 through various normative acts was build a system of sufficient prerequisites for starting of sustainable development process of knowledge economy. Thus, it becomes obvious that the state has assumed the leading role in the process of Information Society construction in Romania. In this regard, it can be notice many positive results obtained so far, among which are distinguished, those registered in direction of infrastructure development and reform of the education and administration system. The problem that arises increasing clearly, is that the state intervention does not generate sufficiently fast behavioral changes at the company level. As a corollary of all the scientific arguments previously formulated it can be said that the information society will have to become finally a reality of authentic democracy and of the free market, where actors and main authors are citizens, civic initiative and private economic enterprise - essential ingredients for sustainable development. 5. BIBLIOGRAPHY [1] Drăgănescu, M., De la societatea informaţională la societatea cunoaşterii, Editura Tehnică, București, 2003 [2] Erincz, A., Entrepreneurship in the information society, Revista Economică Nr.67/2015 [3] Guvernul României, Strategia Națională privind Agenda Digitală pentru România – 2020 [4] Hilbert, M. Digital Technology and Social Change [Open Online Course at the University of California] freely available at: https://canvas.instructure.com/courses/949415, 2015 [5] Popa, A., Uritu, D., Evaluating the information society in Romania, Proceedings of the 8th International Management Conference, "Management challenges for sustainable Development", November 6th-7th, 2014, Bucharest, Romania [6] Ștefan, I., Necessity for the development of an information society, Studia Universitatis Petru Maior, Series Oeconomica, Fasciculus 1, anul VII, 2013, Târgu Mureș [7] Webster, F, Theories of the information society, Routledge Publishing House, 4th edition, 2014 [8] ∗∗∗ https://ec.europa.eu/digital-single-market/en/digital-scoreboard
276

Annals of the „Constantin Brâncuşi” University of Târgu Jiu, Economy Series, Issue 3/2016
„ACADEMICA BRÂNCUŞI” PUBLISHER, ISSN 2344 – 3685/ISSN-L 1844 - 7007
THE IMPORTANCE OF COLLECTING ECONOMIC AND OTHER GENERAL FACTORS’ INFLUENCE ON THE VALUE OF PUBLIC COMPANIES IN SERBIA
SLOBODAN POPOVIĆ ASSISTANT PROFESSOR, INTERNAL AUDITOR, JKP GRADSKO ZELENILO, SUTJESKA 2,
2100 NOVI SAD, SERBIA [email protected]
DRAGAN ĐURANOVIĆ ASSOCIATE PROFESSOR, UNIVERSITY OF NOVI SAD, AND FACULTY OF ECONOMICS IN
SUBOTICA, SERBIA [email protected] JELENA TOŠKOVIĆ
PHD, AD MLEKARA ŠABAC, KRSMANOVAČA BB, 15000 ŠABAC, SERBIA, [email protected] MENSUR CEMALOVIC
ASSISTANT PROFESSOR, COLLEGE OF ECONOMICS AND STATISTICS PRIJEDOR, STREET MITROPOLITA PETRA ZIMONJICA BB, 79000 PRIJEDOR
BOSNA I HERCEGOVINA, [email protected]
RANKO MIJIĆ ASSISTANT PROFESSOR, COLLEGE OF ECONOMICS AND STATISTICS PRIJEDOR, STREET
MITROPOLITA PETRA ZIMONJICA BB, 79000 PRIJEDOR BOSNA I HERCEGOVINA
[email protected] Abstract
To make the right decision in regard to the expression of the value of property, equipment or something else, first for appraiser it is necessary to examine the general economic and other factors that may affect the expression of the value of the company. Especially there is a need to pay attention to devote to the expression value of a public company, because the public companies manage property that stems in part by funds from the budget. This is especially important in the case of a country that aspires to become an EU member.
The Republic of Serbia signed the first two chapters with the EU in December 2015. Chapter 32 imperatively requires that the Republic of Serbia begins important application of fair expression of value of the property of public enterprises, because it is a section that requires audit activities of the entire public users, and therefore the company. Keywords: financial statements, management, fair reporting. Classification JEL : M41 1. Introduction
Management of public companies, among other things requires respect for fair valuation of the assets and all
that the company uses in its operations. To be clear, comprehensive, and fair presentations, there must be expressed standardization in reporting of management or other state bodies.
One of the great assistance is the acceptance of fully the International Accounting Standards [1], which can speed up corporate governance [2]. At the same time thus starts to increase security the very financial statements [3] as part of the real financial reporting [4], [5]. Management of public companies can therefore affect the other global situation and understanding broader sense. In a word, we can talk about the process of socio-economic changing in the Republic of Serbia [6]. It is indisputable that only clear and fair financial reports can truthfully inform management about the actual state of events within the company.
277
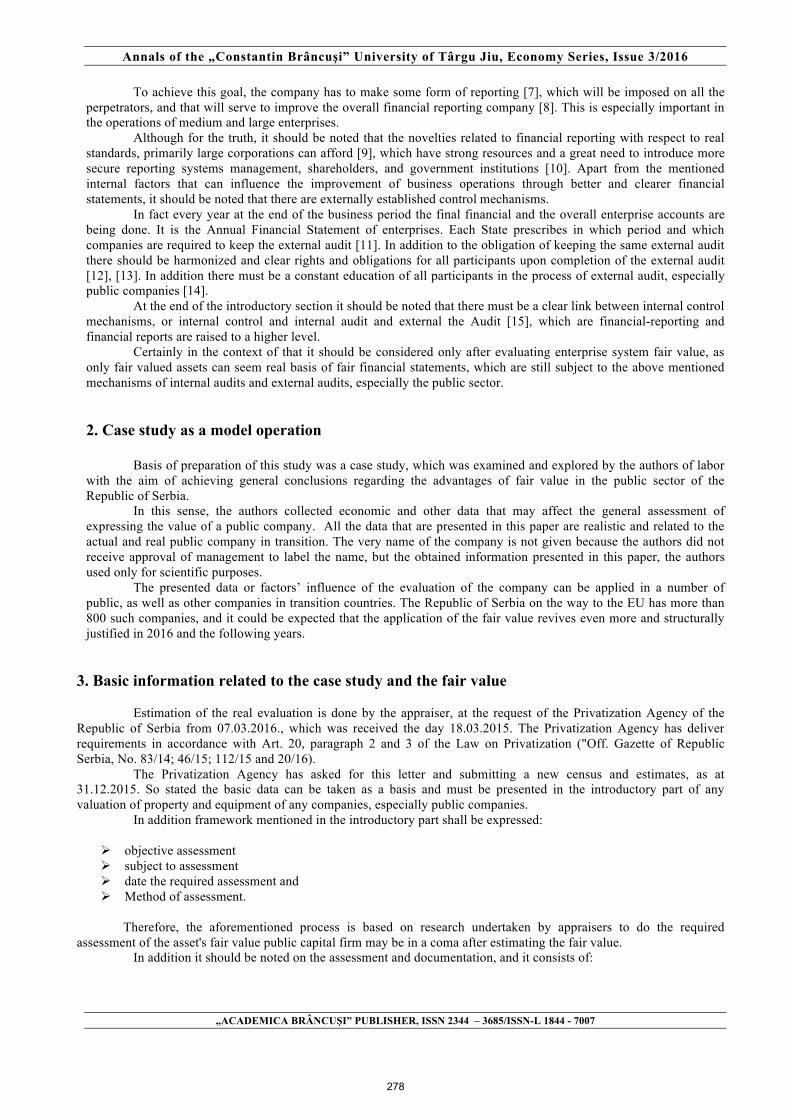
Annals of the „Constantin Brâncuşi” University of Târgu Jiu, Economy Series, Issue 3/2016
„ACADEMICA BRÂNCUŞI” PUBLISHER, ISSN 2344 – 3685/ISSN-L 1844 - 7007
To achieve this goal, the company has to make some form of reporting [7], which will be imposed on all the perpetrators, and that will serve to improve the overall financial reporting company [8]. This is especially important in the operations of medium and large enterprises.
Although for the truth, it should be noted that the novelties related to financial reporting with respect to real standards, primarily large corporations can afford [9], which have strong resources and a great need to introduce more secure reporting systems management, shareholders, and government institutions [10]. Apart from the mentioned internal factors that can influence the improvement of business operations through better and clearer financial statements, it should be noted that there are externally established control mechanisms.
In fact every year at the end of the business period the final financial and the overall enterprise accounts are being done. It is the Annual Financial Statement of enterprises. Each State prescribes in which period and which companies are required to keep the external audit [11]. In addition to the obligation of keeping the same external audit there should be harmonized and clear rights and obligations for all participants upon completion of the external audit [12], [13]. In addition there must be a constant education of all participants in the process of external audit, especially public companies [14].
At the end of the introductory section it should be noted that there must be a clear link between internal control mechanisms, or internal control and internal audit and external the Audit [15], which are financial-reporting and financial reports are raised to a higher level.
Certainly in the context of that it should be considered only after evaluating enterprise system fair value, as only fair valued assets can seem real basis of fair financial statements, which are still subject to the above mentioned mechanisms of internal audits and external audits, especially the public sector.
2. Case study as a model operation
Basis of preparation of this study was a case study, which was examined and explored by the authors of labor with the aim of achieving general conclusions regarding the advantages of fair value in the public sector of the Republic of Serbia.
In this sense, the authors collected economic and other data that may affect the general assessment of expressing the value of a public company. All the data that are presented in this paper are realistic and related to the actual and real public company in transition. The very name of the company is not given because the authors did not receive approval of management to label the name, but the obtained information presented in this paper, the authors used only for scientific purposes.
The presented data or factors’ influence of the evaluation of the company can be applied in a number of public, as well as other companies in transition countries. The Republic of Serbia on the way to the EU has more than 800 such companies, and it could be expected that the application of the fair value revives even more and structurally justified in 2016 and the following years.
3. Basic information related to the case study and the fair value
Estimation of the real evaluation is done by the appraiser, at the request of the Privatization Agency of the Republic of Serbia from 07.03.2016., which was received the day 18.03.2015. The Privatization Agency has deliver requirements in accordance with Art. 20, paragraph 2 and 3 of the Law on Privatization ("Off. Gazette of Republic Serbia, No. 83/14; 46/15; 112/15 and 20/16).
The Privatization Agency has asked for this letter and submitting a new census and estimates, as at 31.12.2015. So stated the basic data can be taken as a basis and must be presented in the introductory part of any valuation of property and equipment of any companies, especially public companies.
In addition framework mentioned in the introductory part shall be expressed:
Ø objective assessment Ø subject to assessment Ø date the required assessment and Ø Method of assessment.
Therefore, the aforementioned process is based on research undertaken by appraisers to do the required assessment of the asset's fair value public capital firm may be in a coma after estimating the fair value.
In addition it should be noted on the assessment and documentation, and it consists of:
278

Annals of the „Constantin Brâncuşi” University of Târgu Jiu, Economy Series, Issue 3/2016
„ACADEMICA BRÂNCUŞI” PUBLISHER, ISSN 2344 – 3685/ISSN-L 1844 - 7007
Ø Financial statements of the company for the past 6 years (estimated to be only the actual state established a list of the assessment date 31.12.2015);
Ø Accounting documentation that supports the statements in the Ø Financial statements in the period analyzed past 6 years, and the rate for the purposes of the objectives of the
assessment; Ø Non-financial information obtained from the contracting authority; Ø Information received by permanent workers and responsible managers in order to strengthen estimate beliefs, Ø Legal documentation regarding capital; Ø Information in public documents regarding registration with APR, Ø Credit worthiness of the National Bank of Serbia, Ø With information of actual real estate market, Ø Specialist opinions related to the assessment of the equipment with which the company has and all.
In making the assessment as a document has to be noted that the assessor is responsible for the quality of the evaluation. Purchaser is responsible for the quality of information presented and delivered. The amount of compensation which he contracted assessor, cannot be grounds for the contracting authority to influence the estimated value of the transaction by the assessor expressed in this report.
The structure of materials evaluation logic has a few basic units and to: Ø Economic and business positions the company, Ø Financial Analysis, Ø The basis for the preparation and presentation of financial statements and Ø Assessment of the value and structure of capital a certain method.
4. Expression of the capital
Expression of the capital of public enterprises as mandatory there are mandatory parts of the assessment
evaluation company that must be met, and they are primarily related to the obligation of expressing the determination of capital which is entered in the ledgers of the company, the state of the Agency for Privatization and potential differences. In this sense, the authors provide an overview of the capital, which is determined by the appraiser in the evaluation and is given in Table 1. Table No. 1: OVERVIEW OF THE CAPITAL OF THE COMPANY COMPREHENSIVELY EXPRESSED IN EUR AND RSD
No.
Description
Paid cash capital
Entered cash capital in assets
and rights
IN TOTAL:
€ RSD € RSD € RSD
1 The accounting records
571.663,64
47.412.792,72
1.989.499,03
128.920.056,80
2.561.162,67
176.332.849,62
2
Status The Agency for Business Registers
571.663,64
48.496.456,07
1.989.499,03
168.776.961,80
2.561.162,67
217.273.417,87
DIFFERENCE 0,00 1.083.663,35 0,00 39.856.905,00 0,00 40.940.568,25 Source: Production authors. 4.1. Expression of enterprise location in relation to the positioning of the enterprise physical
279

Annals of the „Constantin Brâncuşi” University of Târgu Jiu, Economy Series, Issue 3/2016
„ACADEMICA BRÂNCUŞI” PUBLISHER, ISSN 2344 – 3685/ISSN-L 1844 - 7007
The company or the company where the estimation must be located in the assessment that shows the assessor and location. Thus giving the name of the seat or the street and number, in this case, the address is: Bulevar Oslobođenja 100 is located in Novi Sad, Bulevar Oslobodjenja. 100, a highly useful to locate more detailed location, and I see by the appraiser provided in Figure 1 in the form of a mapped view.
Figure No. 1: ONLY SHOWN IMMEDIATE LOCATION WHERE THE COMPANY IS EVALUATED IN THE CONTEXT OF A REVIEW OF THE WIDER AREA OF NOVI SAD. 4.2. View 10 customers with the highest turnover in the preceding business year
The authors provide an overview of the possible and obligatory inspections is essential for the adoption of a general and comprehensive picture of important events and activities at the company in which an evaluation is done by the fair valuation.
Table no. 2 authors provide an overview of 10 customers with the highest turnover in the preceding business year. Table No. 2: OVERVIEW OF THE 10 CUSTOMERS WITH THE HIGHEST TURNOVER IN THE PRECEDING BUSINESS YEAR
No. Code Name of company The city Amount in dinars 1 1 Eps Distribucija D.O.O. Novi Sad 230.600.461,15 2 11 Eps Distribucija D.O.O. Beograd Masarikova 1-3 Novi Sad 46.067.566,62 3 899 Jp-Ems "Elektromreza Srbije" Beograd 25.117.726,70 4 12296 Vp 4100 Novi Sad-Vojna Posta
(Minist.Odbrane61040 Beograd 17.264.124,00
5 31 Energotehnika-Juzna Backa Doo Novi Sad 13.598.109,22 6 12969 Naftagas Transport Doo Novi Sad 13.533.149,08 7 9101 Novosadska Toplana Jkp Novi Sad 12.678.697,00 8 9298 Jp Zavod Za Izgradnju Grada *Zig* St. Pazova 11.979.486,15 9 13487 Securitas Services Doo Beograd Novi Sad 6.635.570,04 10 13413 Miva Plus Company Doo Novi Sad 6.412.588,41
280
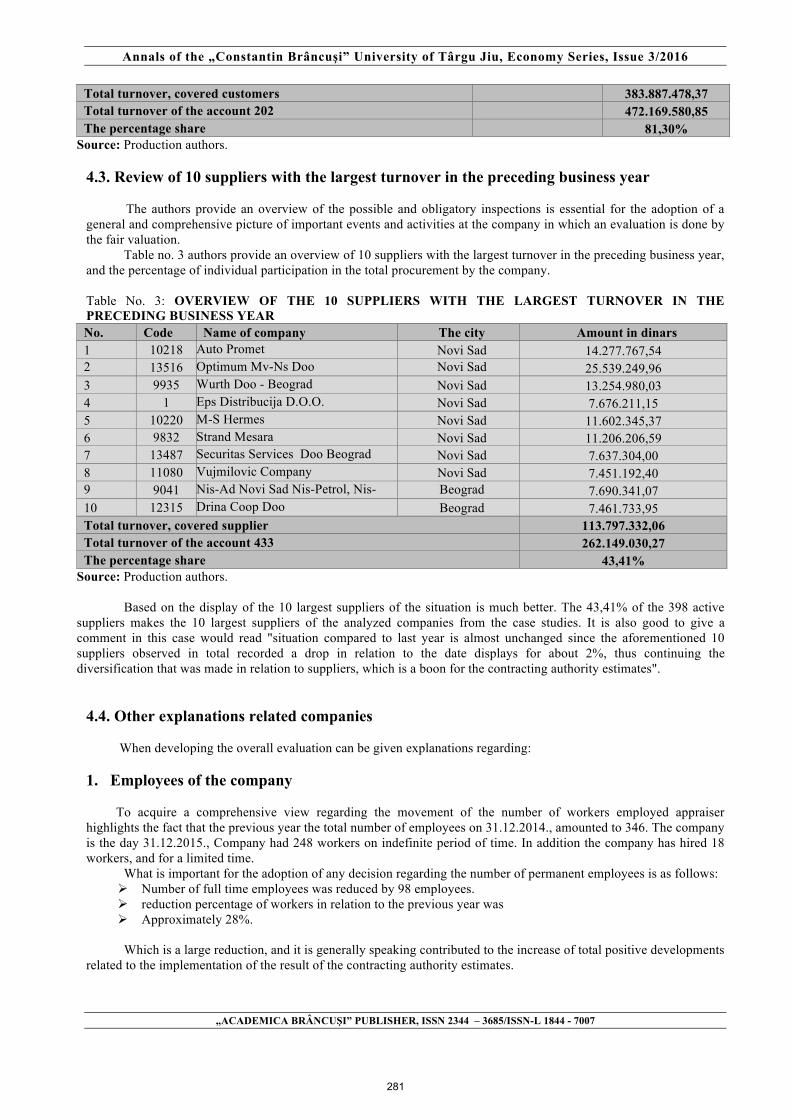
Annals of the „Constantin Brâncuşi” University of Târgu Jiu, Economy Series, Issue 3/2016
„ACADEMICA BRÂNCUŞI” PUBLISHER, ISSN 2344 – 3685/ISSN-L 1844 - 7007
Total turnover, covered customers 383.887.478,37 Total turnover of the account 202 472.169.580,85 The percentage share 81,30%
Source: Production authors. 4.3. Review of 10 suppliers with the largest turnover in the preceding business year
The authors provide an overview of the possible and obligatory inspections is essential for the adoption of a general and comprehensive picture of important events and activities at the company in which an evaluation is done by the fair valuation.
Table no. 3 authors provide an overview of 10 suppliers with the largest turnover in the preceding business year, and the percentage of individual participation in the total procurement by the company. Table No. 3: OVERVIEW OF THE 10 SUPPLIERS WITH THE LARGEST TURNOVER IN THE PRECEDING BUSINESS YEAR No. Code Name of company The city Amount in dinars 1 10218 Auto Promet Novi Sad 14.277.767,54 2 13516 Optimum Mv-Ns Doo Novi Sad 25.539.249,96 3 9935 Wurth Doo - Beograd Novi Sad 13.254.980,03 4 1 Eps Distribucija D.O.O. Novi Sad 7.676.211,15 5 10220 M-S Hermes Novi Sad 11.602.345,37 6 9832 Strand Mesara Novi Sad 11.206.206,59 7 13487 Securitas Services Doo Beograd Novi Sad 7.637.304,00 8 11080 Vujmilovic Company Novi Sad 7.451.192,40 9 9041 Nis-Ad Novi Sad Nis-Petrol, Nis-
Nap Beograd 7.690.341,07
10 12315 Drina Coop Doo Beograd 7.461.733,95 Total turnover, covered supplier 113.797.332,06 Total turnover of the account 433 262.149.030,27 The percentage share 43,41%
Source: Production authors.
Based on the display of the 10 largest suppliers of the situation is much better. The 43,41% of the 398 active suppliers makes the 10 largest suppliers of the analyzed companies from the case studies. It is also good to give a comment in this case would read "situation compared to last year is almost unchanged since the aforementioned 10 suppliers observed in total recorded a drop in relation to the date displays for about 2%, thus continuing the diversification that was made in relation to suppliers, which is a boon for the contracting authority estimates".
4.4. Other explanations related companies
When developing the overall evaluation can be given explanations regarding: 1. Employees of the company
To acquire a comprehensive view regarding the movement of the number of workers employed appraiser highlights the fact that the previous year the total number of employees on 31.12.2014., amounted to 346. The company is the day 31.12.2015., Company had 248 workers on indefinite period of time. In addition the company has hired 18 workers, and for a limited time.
What is important for the adoption of any decision regarding the number of permanent employees is as follows: Ø Number of full time employees was reduced by 98 employees. Ø reduction percentage of workers in relation to the previous year was Ø Approximately 28%.
Which is a large reduction, and it is generally speaking contributed to the increase of total positive developments
related to the implementation of the result of the contracting authority estimates.
281

Annals of the „Constantin Brâncuşi” University of Târgu Jiu, Economy Series, Issue 3/2016
„ACADEMICA BRÂNCUŞI” PUBLISHER, ISSN 2344 – 3685/ISSN-L 1844 - 7007
2. Management
Management of the company is carried out through administration bodies. Bodies are:
Ø Assembly of the Ø Director of the company.
3. Organization
The Company is organized as a single entity, except that the technology has caused the organization of activities within the company by departments as follows:
Ø Management Department; Ø Department for Economic and Financial Affairs; Ø Maintenance Department; Ø Department of Hospitality; Ø Department fleet; Ø Legal department, human resources and job security. A brief comment on the issue appraiser organization would be that this is a very complex undertaking which has
serious organized various parts of the organization that usually has a heterogeneous equipment of different ages. 5. CONCLUSION
Also this work emphasizes the importance of the fair value of a large number of enterprises in the Republic of Serbia, and above all it is about public companies. The aim of the research case study in a company, where the valuation of the property was conducted, was acquiring a general picture of the company as part of the new valuation. In order to do valuation properly, it is necessary to consider a complete company.
The authors provide an overview of several obligatory components that must include assessments, such as: the display of the general view regarding the obligation to assess, the display and documentation base that assessment must contain, the display of Economics and Business Position companies, financial analysis, Basis of preparation and presentation of financial statements and valuation and capital structure of a particular method.
Except prominent, the authors for the preparation of this labor used and explanations of important parts of the assessment in the form: Expression of the capital of a public company, the location of a public company, presenting the 10 largest customers and suppliers, as well as some other explanation, because they are basis for the acquisition credible opinions by appraisers who make an overall assessment of enterprise evaluation.
Thus, the authors with certainty can point out that there is no general written rule for fair valuation of the company, especially public company in transition countries, but they with the display just the opposite highlighted some of them, each assessor or the team that makes the evaluation is to choose the optimum in his opinion, so that they fairer expressed the value of a company, on requirements of management.
6. References [1] Greuning, H., Međunarodni standardi finansijskog izveštavanja, Beograd, MATE, 2006. [2] Soltani, B., Revizija, Međunarodni pristup, Zagreb, Mate, 2009. [3] Majstorović, A., Popović, S. and Volf, D., Teorija i politika bilansa, Novi Sad, Alfa-graf, 2015. [4] Ivaniš, M., 2012. Finansije preduzeća, Beograd, R&B College, 2012. [5] Mramor, C., Uvod V poslovne finance, Ljubljana, Gospodarski Vestnik, 1993. [6] Popović S., Socio-ekonomski faktori ograničenja razvoja agrara, Monografija, Fimek, Novi Sad, 2014. [7] Veselinović, B., Vunjak, N. and Radakov, S., Praktikum Poslovne finansije, Bečej, Proleter ad Bečej, 2012. [8] Veselinović, B. And Vunjak, N., Poslovne Finansije, Teorija i praksa, Novi Sad, “Proleter” ad Bečej, 2014. [9] Cantino, V., Korporativno uptravjanje, merenje performansi i normativna usaglašenost sistema internih kontrola, Beograd, Data Status, 2009. [10] Damodaran, A., Korporativne finansije: teorija i praksa, Podgorica, Modus, 2007. [11] Andrić, M., Revizija računovodstvenih iskaza, Subotica, D.D. „Minerva“, 1996. [12] Gritsenko O.I. and Skorba O.A., Internal business control of service quality costs: managerial aspect, Actual problems of economics, 3(165) 365-373, 2015.
282

Annals of the „Constantin Brâncuşi” University of Târgu Jiu, Economy Series, Issue 3/2016
„ACADEMICA BRÂNCUŞI” PUBLISHER, ISSN 2344 – 3685/ISSN-L 1844 - 7007
[13] Panchuk P., Harmonization of accounting and taxation accounting at reporting formation on income. Аctual problems of economy, 165(3), 373-379, 2015. [14] Drăguşin, P, Brabete, V, The accounting instrumentation of the financing through the operational programs in case of public institutions of academic education, Annals of the „Constantin Brâncuşi” University of Târgu Jiu, Economy Series, Issue 1/2016. [15] Dumitrescu, D, Bobiţan, N, Cooperation and coordination between internal and external auditing, Annals of the „Constantin Brâncuşi” University of Târgu Jiu, Economy Series, Issue 1/2016.
283

Annals of the „Constantin Brâncuşi” University of Târgu Jiu, Economy Series, Issue 3/2016
„ACADEMICA BRÂNCUŞI” PUBLISHER, ISSN 2344 – 3685/ISSN-L 1844 - 7007
ARTIFICIAL CONDITIONS AND THE ABSORPTION OF EUROPEAN FUNDS IN THE
FIELD OF AGRICULTURE IN ROMANIA
DEACONU SORIN-CONSTANTIN ASSOC. PROF. PHD, UNIVERSITY “1 DECEMBRIE 1918” ALBA IULIA
e-mail: [email protected] Abstract
We must acknowledge that the accession of the European funds represents a problem in Romania. The present article intends to present the main causes of a mediocre absorption of the European funds, the effects of this problem. We also present a series of practical solutions for the benefit both of the contributors and of the authorities. We often hear the questions: Why Poland is able and Romania isn’t? There are multiple causes and we intend to present them in order to be avoided and eliminated. The effects are visible because there is no improvement in the rural areas and it is very difficult to find entities that are profitable in the field of agriculture. We will focus on the approach of the artificial conditions invoked by the control teams when deciding the eligibility of a project in 2007-2013. Thus, we created a questionnaire we sent to 100 entities in Alba County. The results show several cause for the mediocre absorption of funds in Romania in 2007-2013. Some of the artificial conditions (real cause) the control teams invoke are: the same administrator for two entities, activities on the same relevant market etc. Key words: European funds, accountancy, artificial condition, scope of activity Classification JEL: M40, M41 1. Introduction
Almost everybody in the country hope nowadays to be able to access European funds. It is a justified hope
because Romania is part of the big family named The European Union and must respect the rules and principles of this family.
This article aims to present from a statistic perspective the absorption degree of the European funds for the period 2007-2013, because is an interesting and often debated theme. Our opinion is that the official statistics related to the European funds are not always the real situations. It is said that Mark Twain affirmed: “There are three kinds of lies: lies, damned lies, and statistics”.
We intend to present part of the real reasons for the mediocre access to the European funds for agriculture, because the syntagma “granary of Europe” is not characteristic to Romania anymore. Thus, acknowledging part of the reason for the lack of implementation in the field of agriculture means a possibility to avoid the same mistakes in the period 2014-2020.
We focus the present article around the so-called “artificial condition”. According to DEX, “artificial” is defined as follows: “1. imitating a natural product; fabricated. 2. mendacious, dissimulated. 3. (Adverb) made using subjective, arbitrary criteria”. [3]
“Artificial condition” is a syntagma frequently use in relation with the European funds for agriculture. Creating artificial conditions defines a deliberate action or inaction of the beneficiary of the non-refundable
funds and/or one/several third party (individual or company) that results into a modification of an existing situation, in order to benefit of payments based on a diagram, with the intention of obtaining an unfair advantage. This is accompanied by the identification of at least one situation of broking one or more general or specific objects related to the agrarian legal issue mentioned by the legal community regulations and/or in the technical lists of measures/ sub measures.[4]
We mention that the above definition is emitted by the authorities only in 2016, when part of the measures for agriculture was timidly launched. Still, in practice, the control team for the projects implemented in 2007-2014 used the definition in an abusive manner and incorrectly applied it. This is one of the reasons that determined us to dedicate the article to this issue.
We created a questionnaire and sent it for completion to the entities that accessed European funds in 2007-2014 in the area of Alba County in the field of agriculture.
The questionnaire was sent to 100 private entities with financing contracts, selected from the Selection Reports published on the official web site www.apdrp.ro. 62 entities responded to the questionnaire.
The content of the questionnaire is presented as follows:
284

Annals of the „Constantin Brâncuşi” University of Târgu Jiu, Economy Series, Issue 3/2016
„ACADEMICA BRÂNCUŞI” PUBLISHER, ISSN 2344 – 3685/ISSN-L 1844 - 7007
Questionnaire (please encircle the correct answer) 1. Did the entity benefit of European funds? a. YES b. NO 2. Which programme/ measure did you access? a. The programme/ the measure..... 3. Is the entity registered for VAT? a. YES b. NO 4. Which is the value of the financing contract? a. between 50.000 – 100.000 EUR b. between 100.000 – 150.000 EUR c. between 150.000 – 200.000 EUR d. another interval (please specify) 5. Which is the stage of the accessed programme? a. Contraction b. Implementation c. Monitoring d. Finalized and monitoring period 6. Have you met/ do you have legal problems related to the access to the programme? a. YES b. NO 7. Which is the object of the process? a. Artificial conditions b. Failure to comply with the contractual conditions (the contractual indicators) 8. If the answer for the precedent question is “a”, which are the concrete motifs presented by the control team in
the record of disorders and establishment of the budgetary claims: a. unique administrator for two entities b. the insurance of co-financing by another entity c. the entity share the registered office with another entity d. the entity has the same main activity as another entity in partnership for commercial activities e. activities on the same relevant market of the entities that are partners in commercial activities f. others (please detail) 9. Which is the stage of the process? a. Court of Justice b. High Court c. Court of Appeals d. High Court of Cassation and Justice 10. Is there any definitive sentence in the legal process? a. YES b. NO 11. If the answer to the precedent question is affirmative, in whose behalf is the sentence? a. beneficiary b. the state authority The necessary time to respond to the questionnaire is maximum 5-7 minutes and the information will be used
exclusively for scientific research.
2. Research methodology Our research used a series of methods and techniques as follows: - The method of “questionnaire”. A set of 11 questions were established in a questionnaire and the entities could
an answer and with a reasonable completing time. - The qualitative approach requiring an intimate approach of the real and imaginary structures, through
interpretation, naturalist explanation, concord and comprehension. Thus, it was possible to generate the passage from individual to general appealing to induction. We analysed the effects of the incorrect framing of a project to “artificial conditions” by a control team for an entity form Alba County.
Other methods were used, too, for easy information of the reader. The arguments present in this article are based on phenomena, operations, specific transactions of a limited number of entities. The results permitted a general formulation.
285
Annals of the „Constantin Brâncuşi” University of Târgu Jiu, Economy Series, Issue 3/2016
„ACADEMICA BRÂNCUŞI” PUBLISHER, ISSN 2344 – 3685/ISSN-L 1844 - 7007
3. Discussion upon the artificial conditions
We highlight the fact that there was no guide regulating the artificial conditions in accessing European funds for
agriculture in 2007-2013. Still, the control teams used regulations emitted by the European Commission, which were not included in the Romanian legislation in that period.
Instructions for avoiding the artificial conditions appeared to each financing guide published on the web site of Agency for Financing the Rural Investments (AFIR) for the implementation during the interval 2014-2020. .
We present hereinafter a series of “Artificial conditions” invoked by the control team for European projects in the stage of the final implementation in 2007-2013 (we assume the case of two entities: Alpha and Beta, with the same administrator and the same registered office; Alpha started in 1995 and its main activity is the production of furniture and Beta started its activity in 2012 and have the same main activity; Beta signed a financing contract with the management authority for measure 312 Support for the establishment and development of micro enterprises):
A. same administrator for both entities (Alpha and Beta) B. Beta’s project is co-financed by Alpha C. same registered office (Alpha and Beta) D. same main object (Alpha and Beta) E. activities on the same relevant market A. Same administrator for both entities (Alpha and Beta) – This aspect raises numerous problems in practice
both for accessing European funds and for taxation. For accessing European funds, many control teams considers this condition as an artificial one, an administrator
controlling more entities. T members of the control team commit most of the time, regrettable errors and confusion in the interpretation of “associate” and “administrator”. A common administrator is not forbidden by the Romanian legislation; the Office of Commercial Registry even permits this aspect and mentions it in the certificate.
According to the Law 346/2004, article 4: The connected enterprises are the enterprises where any of the following relation is established:
a) an enterprise has the majority of votes from the shareholders or associates of another enterprise; b) an enterprise has the right to nominate or revoke the majority of the members in any board of the other
enterprise; c) an enterprise has the right to influence in a dominant manner the other enterprise, based on a contract
between them or based on a statutory provision; d) an enterprise is shareholder or associate of the other enterprise and detains alone, based on a written
agreement between the shareholder or associates, the majority of votes from the shareholder or associates of the respective enterprise. [2]
We recommend to take in consideration, too, the definition of the autonomous enterprise from the same law: “An autonomous enterprise is any enterprise that is not classified as connected enterprise or partner enterprise in the spirit of the present law. An enterprise is autonomous if it detains less than 25% from the social capital or the voting right (any of them is bigger) in one or more enterprises or if one or more enterprises do not detain more than 25% from the social capital or voting rights in the respective enterprise.”
Nor Alpha, neither Beta does not detain social parts in the other enterprise. No associate from one enterprise have participation in the other enterprise.
The unique administrator of two or more enterprises induces the idea of exercising a significant control upon the price for the transfer of goods. The prices may be real or unreal. There are special regulations that must be respected by the entity in the field of the transfer price.
More than this, the entities applying for European funds and are start-ups will be registered as VAT free. They have to register for VAT at the maximum limit of 220.000 Ron as turnover. In order to register for VAT, the entity must complete Form 088 ““Declaration on owns account for the evaluation of the intention and capacity of developing economical activities implying VAT operations”. This form contains a set of 20 questions. The ministry of Finance announced that the new form will contain 17 questions. [7] Form 088 solicits the enterprise to present information upon the administrator, including his experience in the fields. It is reached a paradox situation when the entity accessing the European funds (obliged to have an “immaculate” administrator, with no experience in the sense given by the guides present on www.apdrp.ro) is put in the dramatic situation of not being able to register for VAT (or annulling VAT code) because the administrator has no experience. Which are the effects? The entity applies for financing and signs a financing contract. The entity may not develop its activity after the acquisitions because it may not obtain a VAT code and is forced to stop the implementation of the project (unable to deliver in the community and unable to deduce VAT).
We forward the next solutions for avoiding such dramatic situations:
286

Annals of the „Constantin Brâncuşi” University of Târgu Jiu, Economy Series, Issue 3/2016
„ACADEMICA BRÂNCUŞI” PUBLISHER, ISSN 2344 – 3685/ISSN-L 1844 - 7007
- The abolishment of restrictions related to the common administrator of several entities. (in the guide and in Form 088). We agree that a project is ineligible if the administrator is under the incidence of law (fiscal debts to the local and central budget; the entity transfers profits abroad etc.)
- The existence of cooperation between the evaluation team and the control team from AFIR, the Commerce Register and the Ministry of Finance. This is an opportunity to eliminate a suspect entity during the application stage.
We also suggest changes for Form 088 through the elimination of several questions: - eliminating from the declaration the following questions: do you own spaces with the destination of declared
secondary offices? - Did you register at the Office of Commerce Register the declaration on owns account based on Law 359/2004
art. 15 alin. (1) lit. b) or art. 15 alin. (2), resulting that you have activities at the registered office or at the work centres? -Are there any associates and/or administrators in the position of associate and/or administrator for imposable
entities with fiscal debts to the consolidated general central budget? - Specify the gross income realised by associates and administrators (natural persons) in the last previous 12
month to the declaration - Specify the identification data for the persons registering the fiscal declaration to the registry of the fiscal
organ and/or possess a valid digital certificate to register online fiscal declaration, respecting the provisions of Order emitted by the Ministry of Public finance under the number 858/2008 for the imposable person
The answers for these questions are to be found in the confirmation of the company emitted by the Commerce Registry and in the data base monitored by the National Agency for Fiscal Administration (most information are previously registered for other departments, e. Form 150, legal mandate, the confirmation document, copy of the identity card of a digital certificate holder etc.
Other information may be easily identified by the fiscal authority using Form 205, “Informative declaration upon the source excise tax and the incomes/losses realised, on income beneficiaries” where the name, the personal code number, the function, calculation base for the excise tax and the excise tax are presented.
The fiscal authorities also have online access to the confirmation of the company without soliciting it in print from the contributor. Thus, the entity may concentrate on developing a correct business, creating working places, contracting commands etc. rather than concentrating on delivering already existing information to the fiscal authorities.
B. Entity Alpha borrowed entity Beta a certain amount of money to prove the self-financing capacity based on
an account extract (the account extract is a mandatory condition for proving the financing). Entity Alpha assured the necessary sum to prove its co-financing capacity together with the application based
on a loan contract and the control team must mention the regulation that is broken when this aspect appears. We highlight the fact that loans between commercial entities are permitted by the Romanian legislation and are
generally defined under the name as immobilised claims (art. 265 alin 2 from Order 1802/2004 for the approval of Accountancy Regulations related to the individual annual financial situations and the consolidated annual financial situations , M.Of. 963/30.12.2014, which mentions: the sum attributed to third parties based in contract for the entity that requires interests according to the law are registered in the account of immobilised claims). [1]
Our opinion is that co-financing is an essential key in accessing the European Funds and requires excellent regulation, Many times; the financing contracts were cancelled because the beneficiary could not ensure the implementation. The comfort letter emitted by a bank is valid from a practical point of view only to prove co-financing and to push the project in the category of eligible projects. To avoid the cancelation of the financing contracts due to the lack of co-financing, we propose that the beneficiaries should be required to constitute a credential (an account with available sums) at the disposition of the future contractors. This measure must be necessarily correlated with a short term of selection and signing the financing contract. For the moment, the time interval between the application and signing the financing contract may be years (one, two, even three years).
Diagram 1. Conditions for an improved attraction of European funds
Credentials Short interbal for selection and signing the financing
contract selecție și semnare contract
Proposals for improving the absorption of European funds
287

Annals of the „Constantin Brâncuşi” University of Târgu Jiu, Economy Series, Issue 3/2016
„ACADEMICA BRÂNCUŞI” PUBLISHER, ISSN 2344 – 3685/ISSN-L 1844 - 7007
The credential may be constituted in the accounting evidence as follows: 5411 “RON credentials” = 5121 “RON bank accounts” 5411 “RON credentials” = 5191 “Short term bank loans” The first accounting formula constitutes the credential based on the liquid dispositions of the entity. The second
accounting formula shows the constitution of a credential approved by a bank. We recommend the entities to sign conventions with the banking institutions for fluid operations related to the financing credits.
C. Same registered office. There are numerous cases when two or more entities share the address of the
registered office, due to the fact that the initial registration at the Commerce Registry requires proof for a space (land register extract, leasing contract, evidence from the Major’s office for the address etc.). we consider that more attention should be paid for the confirmation of the company, because this is the document showing the addresses of the offices and the authorised activities inside the space. The control team must correctly interpret the information. We propose for the elimination of the “artificial condition” of “same registered office” in 2014-2020. Our motivation is that a building in the rural area may have several rooms, the same address, without numbers for the individualisation of each room. The land register extract refers only to an address and not to a location in a building.
In the interval between 2007 and 2014, the normative acts regulating the rural investments do not establish as
prohibitive condition that the registered office of an entity should not be inside the space of another enterprise. D. The same main object (Alpha and Beta). Any entity is kept to choose for its establishment at least one code
from a detailed structure and the explanatory notes in CAEN (Classification of Activities in the National Economy). There are no restrictions upon the main object, excluding the liberal occupations (lawyer, doctor, accountancy expert, auditor) and the expertise entities (e.g. an entity with the code 6920 as the main object “Activities of accountancy and financial audit; fiscal consultancy” may have as secondary only the activities with the following codes: 5829 – “Editing other software products”; 6201 – “Creating software (client dedicated software); 6202 – “Consultancy in the informational technology”; 6209 – Other activities in the field of informatics; 6311 – Data processing, web sites management and connected activities; 6420 – Activities for holdings; 6619 – Auxiliary activities for the financial mediation, exclusively insurance and retirement funds; 6621 – Evaluation of risks for insurance and damages; 6810 – Buying and selling buildings for its own property; 6820 – letting and subletting own or rent properties; 7022 – Business and management consultancy; 7320 – Market studies and surveys; 7490 – Other professional, scientifically and technical activities; 7820 – Contracting personnel on temporary bases; 7830 – Other services of offering labour forces; 8211 – Secretariat services; 8219 – Copying and preparing documents and special secretariat procedures; 8299 – Other support activities for enterprises ; 8559 – Other educational activities [6]
In the example we presented, entity Alpha has the same main object as entity Beta: furniture fabrication (3109)
and the Commerce Registry approved the functioning of both entities because there are no limitation for this. Entities Alpha and Beta respected the regulations for functioning and may develop activities for obtaining
profit, becoming tax payers. Still, the vision of the control upon the entities Alpha and Beta is that developing the same operations and activities is against the provisions of the guise and the project is ineligible. No control team has the right of forbidding an activity authorised by the Commerce Registry. But we agree that the project is ineligible if the entity presents debts from taxes and contributions to the budget or there are signs of tax evasion. If both entities do not break the Romanian and European regulations, there is no motif for the project to become ineligible and the contrary decision of the control team becomes an abuse.
E. Activities of both entities on the same relevant market. This condition may not be practically verified, only
from a subjective perspective, because there is no limit for the ales and there is no explanation on the syntagma “relevant market”.
A concrete case is presented as follows: 90% from Alpha’s sales are on the Romanian market and 85% from
Beta’s sales are on the German market. Approximately 10% in the sales of both entities are on the same market and are not desirable in the opinion of the authorities. This rule limiting the commercial relations is in contradiction with the principle of free circulation operating in the European Union, a fundamental liberty in the Union for persons, goods, services and capitals.
288

Annals of the „Constantin Brâncuşi” University of Târgu Jiu, Economy Series, Issue 3/2016
„ACADEMICA BRÂNCUŞI” PUBLISHER, ISSN 2344 – 3685/ISSN-L 1844 - 7007
4. Conclusions The present article contains a few elements related to the artificial conditions from the practical point of view of
accessing European funds for agriculture. We consider that the legislator must redefine “artificial conditions” and replace “at least one situation of
broking one or more general or specific objects related to the agrarian legal legislation” with “breaking the regulations of the financing contract”. Thus, the beneficiary of the funds will take notice of all the indicators through the financing contract, avoiding the unpleasant situation of a project in a final stage of the implementation being declared ineligible by the control teams, after the same institution approved all the acquisition and payment files. Our research used a specially created questionnaire that was sent to 100 entities in Alba County, beneficiaries of financing contract on various measures for agriculture in 2007-2013. The centralization of the answers to our questionnaire generated the following results:
- Approximately 15% are entities with projects considered ineligible for reasons of “artificial conditions” - A quantum of the sums that have to be returned by these entities is 1.600.000 EUR. This sum is calculated for
Alba County for the period between 2007 and 2013. More than this, almost all entities started legal processes, generating costs and more time until a definitive sentence
- It is necessary to eliminate the “artificial condition” of “activities of the two entities on the relevant market” from the instructions transmitted by the Ministry for Agriculture and Rural Development, because is a contravention to the principle that is at the core of the European Union’s formation
We propose the following solutions for the period 2014-2020 in order to increase the absorption percentage of the European funds:
- the contracting authority should solicit from the potential beneficiary, together with the financing application, the proof of a credential for the payment of the future contractors of goods, services etc.
- an adequate instruction of the control teams for the evaluation process in order to emit more professional solutions
- cooperation between the control teams from The Agency for Financing the Rural Investments with the teams from the initial evaluation and the teams that approves the files for acquisitions and payments
- a continuous and efficient cooperation of the control teams from The Agency for Financing the Rural Investments with the teams from the Ministry of Finance (specialised especially in the field of transfer prices)
- a radical rethinking of form 088, “Declaration on owns account for the evaluation of the intention and capacity of developing economical activities implying VAT operations”. The present form will generate a decrease of start-ups and in the number of entities willing to access the European funds. This appreciation is based on a simple reasoning: reaching the maximum of selling (turnover) forcing the entity to complete Form 088 leads to the annulment of VAT code (because there is a VAT code in the first stage) and the entity will keep only the right to collect and not the right to deduce VAT.
- The associates and administrators of a start-up entity must have a clean charge sheet and must be chosen with precaution in order to protect the activity of the future entity (in other words, Romania needs decision factors for the resources of an entity in order to respect “the principle of activity continuation”).
We do not intend to transmit pessimist aspects to our readers and to the potential investors, but the present article is an alarm signal for authorities so they will correctly prepare the trance for 2014-2020 (although only a few measures are launched until the present time and no financing contract is signed) related to the evaluation of the projects.
5. The limits and the perspective of the research
Any research presents limit and we shortly present the limits of our research as follows: - The questionnaire was sent to entities accessing specific measure in the field of agriculture activities. A
classification of the entities on accessed measures could increase the informational capacity and could offer solutions dedicated to each programme type launched for 2014-2020.
- A discussion upon the transfer price is useful both for contributors and the control teams, because the practice presents sensible aspect related to the transfer of the profit abroad through “buying” fictive services by the local entities.
A future research direction is dedicated to the reciprocal operations inside a group of entities from an accountancy perspective, especially under the aspect of fiscal taxation.
289

Annals of the „Constantin Brâncuşi” University of Târgu Jiu, Economy Series, Issue 3/2016
„ACADEMICA BRÂNCUŞI” PUBLISHER, ISSN 2344 – 3685/ISSN-L 1844 - 7007
6. References [1] ***, Ordinul nr. 1802/2014 pentru aprobarea reglementărilor contabile privind situațiile financiare
individuale și situațiile financiare consolidate, Monitorul Oficial nr. 963/2014. [2] ***, Legea nr. 346 din 14 iulie 2004 privind stimularea înfiinţării şi dezvoltării întreprinderilor mici şi
mijlocii, Monitorul Oficial nr. 681 din 29 iulie 2004. [3] ∗∗∗ https://dexonline.ro/definitie/artificial, mai 2016. [4] ∗∗∗ http://static.anaf.ro/static/10/Anaf/Declaratii_R/AplicatiiDec/D088Anexa3_XML_2016_v111_020220
16.pdf, mai 2016. [5] *** http://www.apdrp.ro/, mai 2016 [6] *** http://www.onrc.ro/index.php/ro/caen, mai 2016. [7] *** https://static.anaf.ro/static/10/Anaf/Declaratii_R/88.html, mai 2016.
290
Annals of the „Constantin Brâncuşi” University of Târgu Jiu, Economy Series, Issue 3/2016
„ACADEMICA BRÂNCUŞI” PUBLISHER, ISSN 1844 – 7007
RESPONSABILITY AND TRANSPARENCY ON NON-FINANCIAL REPORTING
GĂDĂU LIANA
LECTURER DR. SPIRU HARET UNIVERSITY, BUCHAREST e-mail:[email protected]
Abstract
Starting from the reality that in the current economy financially is not the only nor the most important to evaluate the performance, should be considered the extension of performance reporting from the financial (traditional) to the global including social and environmental.
Therefore, present and future research efforts regarding the reporting and economic entities will be focused on these two components developed environmental and social dimensions that can not be ignored.
Keywords: non-financial reporting, environmental reporting, social reporting JEL Classification: M40, M41 1. Introduction
If not long ago economic entities would have reported aspects of social and environmental norms issued ,today
through the European Commission, large companies and large groups of companies are obliged to report these issues. These issues are indispensable to users of information to judge the overall performance of the business and
those entities. Therefore, the present requirements of the European Union institutions on reporting non-financial enterprises
and large groups of enterprises require that they report to both environmental and social as well as issues regarding compliance with human rights issues on combating corruption and bribery.
In this chosen study , we will focus on legislative updates on non-financial reporting and their degree of assimilation of the economic environment in Romania. 2. Compulsory non-financial reporting
In the reporting companies, European Council Directive 2014/95 / EU introduce a requirement that certain companies to publish information related to the impact they have on the environment and society.
The new directive amending Directive 2013/34 / EU on the annual consolidated financial statements and related reports of companies. The first reports made by non-financial companies due to the introduction of this requirement are reporting the financial year commencing 1 January 2016 or during the calendar year 2017.
Significant causes of the introduction of non-financial reporting requirement in mind [2]: ◄ The market and social and environmental pressures on businesses that have increased in recent years; ◄ Increase the share of the importance and role of sustainability in corporate activity; ◄The growing importance given to non-financial performance calculations and investment strategies of the
organization. Most stakeholders, and here we consider particularly investors, NGOs and other beneficiaries appreciated the
current level of transparency does not meet the information needs both in terms of quantity and quality of social and environmental information available [1].
The quality of non-financial information presented by companies remains a big problem in the sense that non-financial information published by companies in the sense investors are not sufficiently relevant, balanced, accurate, timely and comparable.
By introducing mandatory reporting of non-financial for the financial year beginning with1 th of January 2016, meaning the new directive are concerned entities have more than 500 employees, here comes enterprises listed on stock exchanges in any Member State, credit institutions, insurance institutions and reinsurance, financial institutions or companies designated by the Member States that have significant relevance for investors by nature of their size or number of employees.
291

Annals of the „Constantin Brâncuşi” University of Târgu Jiu, Economy Series, Issue 3/2016
„ACADEMICA BRÂNCUŞI” PUBLISHER, ISSN 1844 – 7007
3. Arrangements for non-financial reporting
Non-financial reporting in accordance with the requirements of the new Directive for the categories of entities
mentioned can be done in two different ways [3]: - Either a non-financial statements as the management report, but distinct from it; - Either a separate report. We find that both ways of reporting directive does not prescribe a format default presentation, but sets certain
requirements to fulfill. Thus, for the report as a non-financial statements, the Directive provides a minimum set of information to be disclosed, copied below:
◄ A short description of the business organization; ◄ A description of the policies adopted by the organization on environmental issues, issues social and personal,
human rights and fighting corruption and of bribery; ◄An analysis of the main risks associated issues mentioned both in the organization's operations and in terms
of business relationships, products or services that could have a negative impact; ◄non-financial performance indicators relevant to the organization; ◄ references and explanations of amounts reported in the financial statements. The condition imposed by the current European legislation is that statement non-financial is stated clearly
reporting framework used such as the national, EU or international (UMAS, Glabe Reporting Initiative, United Nations Global Compact, ISO 2600 etc.) . Where is chosen as the method of reporting separate report, the report distinct management requirements to keep are:
◄To be published together with the report of management; ◄To be made available to users within relatively quickly, not to exceed six months from the balance sheet date,
the website of the company; ◄To be mentioned in the Management Report. It should be noted that for this reporting alternative report need not rely on a national, EU or international one.
So the organization can opt to use and develop their own instrument, reporting framework, in compliance with the above requirements.
The second component of Directive 2014/95 / EU is the obligation of presenting a diversity policy descriptions used terms governing bodies, management of the enterprise. The description should cover at least the age, gender, education and professional experience, diversity policy objectives, the way it was implemented and the results of this policy during the reporting period [3]. This obligation builds on the work of European institutions to promote gender balance in the bodies of administration, management, control for large companies and groups of companies [3].
As we have already pointed out, new european legislation does not impose a strict model to non-financial report or report template diversity policy. What must be respected, regardless of the manner of reporting chosen is related to content in that it is obligatory to retrieve information on environmental, social information and personnel, and the degree of novelty are mandatory information on rights man, fight against corruption and of bribery.
Please note that the current European legislation on non-financial reporting does not come with any clarification on the order of information presented, detail or compression-related information required to address these four sections.
In the event that organization or large groups that do not have policies to reduce the risks of compulsory subjects in the four sections to tackle, new European legislation to non-financial reporting requires them to clearly explain the absence of these policies and why.
The purpose of all the provisions presented and analyzed above, brought by the new european legislation for non-financial reporting, we can summarize as representative [6]:
◄ to achieve a more complete, relevant, real activity concerned entities; ◄is the result of awareness that currently profit is not the only value creation, environmental issues, social also
have an important role in creating value for both the entity and the community with which it interacts; ◄ requires covered entities that through their work have a greater concern for the environment and humans.
4. Reporting Accepted Standards
Companies with over 500 employees covered by the European Directive 2014/95 / EU, providing non-financial information can be used as a standard reporting [4]:
Ø National frameworks already exist; Ø Personnel of the European Union (System of Environmental Management and Audit); Ø International framework: United Nations Global Compact (UNGC); Guiding principles on business and
human rights UN; Ø OECD guidelines for multinational enterprises: ISO 26000; Global Reporting Initiative (GRI), etc.
292

Annals of the „Constantin Brâncuşi” University of Târgu Jiu, Economy Series, Issue 3/2016
„ACADEMICA BRÂNCUŞI” PUBLISHER, ISSN 1844 – 7007
5. The impact of Directive 2014/95 / EU on the business environment in Romania
European Commission Directive obliges large companies with over 500 employees to produce an annual environmental and social impact, and anti-corruption practices. A study on data from the National Trade Register Office show that Romania will be covered by Directive 720 private organizations and public interest entities which will be the first since 2017 to publish non-financial reports under the new legislation [7].
The version voted, subsidiaries may choose to be exempted from reporting provision provided that the information relating to them be included in the Consolidated group level. It is a practical measure that will allow a large number of companies to shirk from non-financial reporting.
According to statistics from the Trade Register in Romania, the top 50 companies in terms of the number of employees, about half are subsidiaries of international companies. This means that out of 720 companies with over 500 employees, some may choose not to report.
If you are currently in Romania, of companies with over 500 employees reporting non-financial information less than 10% of them, since 2017, the year will appear first reports under the new legislation, their number will increase.
In the long term it is expected that the existence of legislative non-financial reporting empower companies concerned to conduct a serious and sustainable quality reporting. 6. Conclusions:
We believe that transparency in social and environmental reporting should be essential for any organization, regardless of industry part only and simply because of the respect of peers and the space in which it operates.
New legislative measures imposed by adopting and implementing the provisions of European Directive 2014/95 / EU on non-financial reporting has II Project, to ensure greater transparency and non-financial responsibility among companies concerned.
It aims to increase the transparency and comparability among large companies. The information they provide will be available direct investors interested in sustainable development of target companies, investors can have a complete image on the position and performance not only in economic and financial matters but also in aspects of sustainable development.
The need to improve quality and non-quality financial information is part of the EU strategy to promote corporate social responsibility (CSR).
Currently the focus is on the fact that non-financial reporting is essential for the transition to a sustainable economy which combines long-term profitability with social inclusion and protection of natural resources. 7. References
[1] CRPerspectives 2013, Global CR Reporting Trends and Stakeholder Views; CorporateRegister.com, 2013. [2] Eccles, R., et al., Meaning and Momentum in the Integrated Reporting Movement, Lournal of Applied Corporate Finance, Vol.27, Issue 2, 2015, pag 8-17; [3] European Comission , Directive 2014/34/UE of the European Parliament and of the Concil,www.eurlex.europa.eu; [4] G4 Sustainability Reporting Guidelines. Reporting Principles and Standard Disclosures; Global Reporting Initiative, 2014; [5] Integrated Reporting. The Future of Corporate Reporting; PwC, 2012; [6] New Transparency Rules on Social Responsibility for Big Companies; Press Release, ST 13606/14, Brussels, 29.9.2014; [7] „Tendinţe şi realităţi CSR în România”, studii realizate de Erns &Young, ediţiile 2013, 2014, 2015.
293
Annals of the „Constantin Brâncuşi” University of Târgu Jiu, Economy Series, Issue 3/2016
„ACADEMICA BRÂNCUŞI” PUBLISHER, ISSN 2344 – 3685/ISSN-L 1844 - 7007
PLACE AND ROLE OF THE STRUCTURAL FUNDS IN THE LOCAL BUDGET REVENUES
CRISTINEL ICHIM, PH. D. LECTURER ON „STEFAN CEL MARE” UNIVERSITY OF SUCEAVA, ROMANIA,
Summary: In this study we aim to analyse the place and role manifested within local budgets of Romania by a new category of revenues available to local authorities namely those from the Structural and Cohesion Funds of the EU. At the beginning of our scientific approach we have outlined the scope of local government revenues highlighting that in the section development of local budgets are also set off funds from the European Union. The research continues with a characterization of the structural funds in which, on the one hand, we have emphasized their importance to the development of territorial administrative units in Romania and on the other hand we showed some difficulties arising in the process of absorption of European funds. The analysis of financial resources from the EU funds within the local budgets from Romania is the last part of the article and is based on the quantitative analysis of the budget indicator, "amounts of the EU in the payments made and pre-financing" from existing data in the Statistical Yearbook of Romania, and highlights the place occupied by such income within local public revenues. This analysis shows that local public authorities from Romania have made significant progress in terms of accessing European funds, their share in total revenues of local budgets increased during 2008-2014. Keywords: revenues, local budget, structural funds, development, operational programs JEL classification: F 36, H 71 Introduction Becoming a Member State of the European Union gave Romania a number of benefits and development opportunities. The most important of these is the Structural Funds available to Member States in order to help create an economic simulative system, stable and uniform within the European Union Member States and their regions. The Structural Funds are the most important measure of economic policy adopted by the European Commission to stimulate the economic development of the states that are part of the European Union. The main goal pursued by the European Union by granting these funds is the harmonization of economic development levels between countries, leading to the stop of economic decline of Europe and reducing disparities between advanced regions and those lagging behind. The way these funds are managed relies on Member States, who are responsible both to determine in which areas will be allocated these resources and to attract and actually spend this money.
The importance and the high part of these funds in the develeopment of a country, have peaked the interest of various authour that in their papers (Voinea, 2011), (Florescu, Gibescu, 2009), (Roman, 2010) have studied and revealed the various problems that the financial resources brought by the European Union, rise in the process of their accesion and implementation. In the context of our paper, the oppinion that must be noted is the one that states, that the financial recources from the strutctural funds of the European Union are ment to supplement the revenues of local budgets and transfers from the state budget to them in order to support local investments, „without leading to increased resources ordinary budget without adversely affect the general governemnt balance. "(Cigu, 2011) Unlike loans from local public resources they are not refundable and have no interest charges.
The main objective of the above mentioned study is to analize the place and the role that revenues from structural funds and the cohesion of the European Union have within local authority budgets in Romania. We also intend to study the dynamics of revenue in local budgets in Romania during 2008-2014. 1. Coverage and classification of local budget revenues
The local revenues represent the total financial resources that local authorities perceive and/or receive directly, either from government or other resources, to fulfil their duties in delivering public services. To establish the ’local‘ feature of a source of income, the main determinant is the fact that the authority has full power to set conditions for the mobilization of that income or has the power to decide on its use.
294

Annals of the „Constantin Brâncuşi” University of Târgu Jiu, Economy Series, Issue 3/2016
„ACADEMICA BRÂNCUŞI” PUBLISHER, ISSN 2344 – 3685/ISSN-L 1844 - 7007
The local revenues express the financial resources acquired in administrative territorial units which are mobilized for local executive authorities to carry out activities within their jurisdiction. The local budget revenues are financial resources for local budgets based on legal provisions, they consist of revenues, income from amounts deducted from certain state income taxes, subsidies received from the state budget and other budgets, donations and sponsorships, and other financial operations1.
In addition to the revenues collected in local budgets, local authorities have also at their disposal other extra budgetary funds (cash contributions, income for self-financed actions or income from special funds). Local revenues are broader in scope than the revenues of local budgets as they include other revenues that are mobilized and redistributed locally. There are mutual influences between local revenues and the economy of the local administrations, meaning that local revenues depend on the level of development of the local economy, and these revenues influence the local economy by ensuring the achievement of some economic and social activities. Local revenues have a complex structure. According to the Government Emergency Ordinance no. 63/20102, revenues are presented in the section operating income and revenue development section of local budgets.
Revenues of local budgets from operating section include: a) own revenues excluding income from the capitalization of goods; b) revenues of local public institutions wholly or partly funded from own revenues; c) grants to finance current expenditures; d) amounts from certain revenues of the state budget to finance current expenditures; e) income from loans granted to institutions and local public services or activities entirely financed from own revenues; f) contributions from the operating section to finance development section, which are reflected of negative value.
Revenues of local budgets from development section include: a) contributions from the operating section; b) proceeds from the capitalization of goods; c) grants for capital expenditures; d) amounts from certain revenues of the state budget to finance capital expenditures; e) amounts received from the European Union and / or other donors in the payments made and pre-financing. This classification of revenues followed grouping them by destination and to finance certain operating costs or capital expenses. In our opinion, grouping local budget revenues in operating revenues and incomes of the development section is open to criticism because it does not take into account the specific investment projects which also involve operating costs throughout the length of time of the objective achieved. The rule that should be applied is that of current revenues to cover current expenditure and capital expenditure to be financed by capital income. This division of revenues is complex and confusing regarding the mechanism of mutual transfers of incomes. 2. Financial resources from structural funds and cohesion funds of the European Union The European Union supports the economic progress of the member countries after accession through programs financed from structural funds aimed at removing regional disparities, harmonious and sustainable development of member countries in order to strengthen economic and social cohesion. As EU financial mechanisms to promote harmonious and sustainable development of member countries, the Structural Funds are distinguished by the following features: (Voinea, 2011)
• projects / programs proposed for funding from the Structural Funds are based on the multi-annual development plans of member countries;
• financial resources from the Structural Funds are allocated to priority objectives from the development plans of member countries;
• national authorities are responsible for selecting projects of proposed programs to be financed by the Structural Funds;
• grants from Structural Funds meet beneficiaries' own resources to enhance their accountability programs in implementing programs and in managing financial resources;
• The European Commission and national authorities collaborate in national development plans, formulating and supporting the programs, in monitoring and evaluation of project impact on the economy of the member countries;
• financial resources from the Structural Funds and Cohesion Fund are meant to complement the efforts of programs’ beneficiaries in member countries;
• The European Commission presents every three years a report to the European Parliament, the European Economic and Social Committee on the progress in achieving economic and social cohesion;
• The Council acts on The European Commission’s proposal after the European Parliament's opinion and after consulting the Economic and Social Committee on the objectives and administration of structural funds. European Council governs on the principles that are the basis for using the Structural Funds, to ensure their efficiency of use and the joint of their action with other financial instruments;
• transparency set at the base of administration of structural funds is designed to ensure the knowledge of development strategies, programs embodying objectives from national development plans, of the performance in implementing the program and their impact on the economic development of member countries;
295

Annals of the „Constantin Brâncuşi” University of Târgu Jiu, Economy Series, Issue 3/2016
„ACADEMICA BRÂNCUŞI” PUBLISHER, ISSN 2344 – 3685/ISSN-L 1844 - 7007
• The management of the financial resources from the Structural Funds takes place within an institutional framework through procedures designed to follow allocation and use of financial resources for programs.
European Commission and Member States negotiate the National Strategic Reference Framework (NSRF) from which community priorities and connections between national and regional priorities from Member States are identified. National Strategic Reference includes: National Development Strategy, National targets, the list of Operational Programmes (OPs) that are priorities and financial planning on operational programs. The National Development Plan reflects the objectives of the socio-economic development of the member countries under EU cohesion policy and structural funds intervention areas. On the basis of the National Development Plan is elaborated the National Strategic Reference which becomes the strategy agreed by the European Union for using the Structural Funds. Romania's national development priorities for the period 2007-2013 were represented by:
• economic competitiveness and development of the economy based on knowledge; • development and modernization of transport infrastructure; • protect and improve the environment quality ; • human resource development, promotion of employment and social inclusion and strengthening of administrative
capacity; • rural economic development and labour productivity growth in the agricultural sector; • reducing development disparities between the regions.
The fundamental policy of the European Union is Economic and Social Cohesion Policy, whose transposition into practice is achieved via three instruments, namely the European Regional Development Fund, European Social Fund and the Cohesion Fund. For the period 2014-2020 the following Operational Programmes are financed: - Human Capital Operational Programme (POCU) establishes investment priorities, specific objectives and actions undertaken by Romania in the field of human resources, thus continuing investments made under the European Social Fund during 2007-2013 and also contributing to the overall objective of the Agreement Partnership (AP 2014-2020) and hence the European Structural Funds and Investment in Romania, namely, to reduce economic and social development disparities between Romania and EU Member States. - Operational Programme Competitiveness (POC) supports investments aimed at meeting the needs and challenges of the low level of economic competitiveness, particularly regarding insufficient support for research, development and innovation (RDI) and underdeveloped infrastructure of ICT and default services underdeveloped thus positioning itself as a generator factor of horizontal interventions in the economy and society, able to stimulate growth and sustainability. - Operational Programme Large Infrastructure (POIM) was developed to meet the development needs identified in the Partnership Romania from 2014 to 2020 and in accordance with the Common Strategic Framework and the Position Paper of the European Commission services. POIM strategy is geared towards the Europe 2020 objectives, in conjunction with the National Programme for Reform and country specific recommendations, focusing on sustainable growth by promoting an economy based on low carbon, through energy efficiency measures and promoting green energy and by promoting environmentally friendly means of transport and more efficient use of resources. Financing priorities established by POIM contribute to the overall objective of the Partnership by directly targeting two of the five challenges identified in national development: infrastructure and resources. POIM finances activities in four sectors: transport infrastructure, environmental protection, risk management and adaptation to climate change, energy and energy efficiency, contributing to the European Union strategy for smart, sustainable and inclusive growth. - Operational Programme Technical Assistance (OPTA) aims at ensuring that the efficient and effective implementation of European Structural Funds and Investment in Romania in accordance with the principles and rules on partnership, programming, evaluation, communication, management, including financial management, monitoring and control based on shared responsibilities between Member States and the European Commission. The overall objective of OPTA 2014-2020 is to ensure the capacity and tools necessary for effective coordination, management and control of the interventions of the European Structural Funds and Investment and effective implementation, but also targeted and fair Operational Programme Technical Assistance (OPTA), Operational Programme Infrastructure Mare (POIM) and Competitiveness Operational Programme (POC). The program is based on the general framework described by the provisions of the Agreement Partnership and the strategic approach of OPTA is linked to relevant strategic documents at European and national level, respectively specific provisions arising from the AT domain of the Europe 2020 Strategy, the National Reform Plan 2013-2014 as well as the strategy for public administration capacity building in Romania 2014-2020. - Regional Operational Programme (ROP) is the successor of the Regional Operational Programme 2007-2013 and one of the programs through which Romania will be able to access EU structural funds and investment from the European Regional Development Fund (ERDF) 2014-2020. ROP 2014-2020 aims the overall objective of economic competitiveness and improving the living conditions of local and regional communities by supporting business
296

Annals of the „Constantin Brâncuşi” University of Târgu Jiu, Economy Series, Issue 3/2016
„ACADEMICA BRÂNCUŞI” PUBLISHER, ISSN 2344 – 3685/ISSN-L 1844 - 7007
development, infrastructure and services for sustainable development of regions, so that they can effectively manage their resources and their potential for innovation and assimilation of technological progress. These objectives are translated into 11 priority axes (plus technical assistance axis), which have a total estimated allocation of 8.25 billion euros, of which 6.7 billion euros is supported by the EU through the European Regional Development Fund (ERDF) and 1.5 billion euros - national contribution. - Operational Programme Administrative Capacity (PO CA) will promote the creation of modern public administration, able to facilitate socio-economic development through competitive public services, investment and quality regulations, thereby contributing to the objectives of Europe 2020. To fulfil this role the public administration needs competent human resources and well-managed, efficient and transparent management of resource use, institutional and adequate administrative structure, as well as clear, simple and predictable operation. Such an administration should be able to provide policy makers the necessary tools to support and implement public policies in the interest of citizens. Optimizing administration is an important condition for the implementation of any structural changes towards smart, sustainable and inclusive growth. POCA 2014-2020 addresses all 8 regions of Romania. The Program will be able to obtain financing following beneficiaries: authorities and public central institutions, autonomous administrative authorities, NGOs, social partners, accredited higher education and research institutions, Romanian Academy, authorities and local institutions at county level and municipalities, local authorities and public institutions benefiting ITI, judiciary institutions. The financial allocation of the European Social Fund program for 2014-2020 is 553.19 million EUR. - Helping disadvantaged Operational Programme (OP AD) ensures through the entire period 2014-2020 free distribution of food aid in all localities in the country in favour of disadvantaged people. POAD is a continuation of the European program of aid to underprivileged (REAP) undertaken between 2007 -2013. The program is funded at 85% of European aid fund for the most deprived people and 15% of the national budget. 3. Difficulties in absorbing EU funds Especially among new EU member states, although the volume of structural and cohesion commitments is considerable, an important issue is their low absorption capacity due to difficulties arising in complex management of European funds. Firstly, it is known that substantial documentation with a strong bureaucratic component is likely to discourage potential beneficiaries in the effort to attract grants. We emphasize that this large number of permits and authorizations are not an imposition of the managing authorities, but they reflect the requirements of Romanian legislation, harmonized with the European legislation. Most private firms and especially local government carry out poor management of documents. Secondly low expertise of beneficiaries in writing projects is an obstacle to accessing European funds. There are very rare cases where those who want to access grants have specialized staff responsible for carrying out bureaucratic steps and even technical steps required. Of course, there is the solution of outsourcing these efforts to specialized consulting firms -but small amounts that circulate within projects make difficult hiring competitive consulting firms. Thirdly, another problem is the lack of capacity of the beneficiaries to finance or co-finance projects. In what concerns us this obstacle is more difficult to remove because administrative units do not have the revenues to provide co-financing, but especially full funding to repayment. The large number of taxes (Florescu, Gibescu, 2009) payable in process of preparing the dossier for financing, but also during project implementation, each notice or authorization having a corresponding fee is a deterrent to those who wish to invest. Moreover, fees and costs related to bank loans, interest and costs of administration of the bank account are considered ineligible costs, thus increasing considerably the beneficiary's contribution to financing the project. Among other obstacles arising in the process of accessing European funds can be listed: lack of transparency in project evaluation and selection, poor information on funding opportunities, cumbersome procurement procedure. We believe that in the forthcoming period, the authorities must find solutions to these problems so that the procedures for accessing European funds become simpler and more effective. 4. Analysis of financial resources from the EU funds within local budgets in Romania To highlight the influence of financial resources from the EU funds in Romania on local budgets we will make an analysis of the evolution of receipts and the weights these resources occupy within the centralized budget of the territorial administrative units in Romania. This scientific approach will be done based on data available in the Statistical Yearbook of Romania, which are presented in the table below.
297

Annals of the „Constantin Brâncuşi” University of Târgu Jiu, Economy Series, Issue 3/2016
„ACADEMICA BRÂNCUŞI” PUBLISHER, ISSN 2344 – 3685/ISSN-L 1844 - 7007
Table no. 1 - The evolution of receipts and the share of financial resources from EU funds in local budgets during 2008-2014
million lei 2008 2009 2010 2011 2012 2013 2014 Total Revenues 43629,1 43526,1 43922,2 44803,9 45419,3 48092,6 53666,2 Amounts from EU in the payments made and pre-financing
0 708,2 2245,1 3600,2 3490,4 4227,3 3366,1
Weight of EU amounts in total revenues of local budgets (%)
- 1,62 5,11 8,03 7,68 8,78 6,27
Source: Own elaboration using data contained in The Statistical Yearbook of Romania 2010-2015 The data in the table shows an upward trend of revenues to local budgets from Romania to financial resources from EU funds in 2008-2013 but for 2014 it registers a setback In the graphical representation of this evolution a clear upward trend is observed in the first four years of the interval to be analysed. So if in 2009 708.2 million lei were collected, in 2010 local authorities in Romania have benefited from 2.2451 billion lei, which means progress but timid compared with the opportunities offered by the European Union. In 2011 it was recorded a significant increase of these revenues amounted to 3.6002 billion lei.
Figure no. 1. The evolution of receipts from the EU in the payments made and pre-financing from local budgets in Romania during 2008-2014 The graph shows that in 2012 there is a slight decrease in revenues from the EU Structural Funds, but in 2013 is registered a tip of 4.2273 billion lei. The period under review ends with a decrease in receipts from this category of revenues to local budgets, due to the end of the implementation of Multiannual Financial Framework 2007-2013. We notice that in 2008 there were not collected such amounts since launching programs was realized only in the second half of 2007, which led to the entry of the first European money in the accounts of local administrations only at the beginning of 2009 and for certain financing components, even later. In terms of share of financial resources from EU funds in the total local budget revenues in Romania we can say that the situation is similar to that shown above.
Figure no. 2 - The weight of financial resources from EU funds in the total of local budgets revenues of Romania during 2008-2014
0
708.2
2245.1
3600.2 3490.4
4227.3
3366.1
0 500
1000 1500 2000 2500 3000 3500 4000 4500
2008 2009 2010 2011 2012 2013 2014 Year
Million Lei
0 1.62
5.11
8.03 7.68 8.78
6.27
0 1 2 3 4 5 6 7 8 9
10
2008 2009 2010 2011 2012 2013 2014 Year
%
298

Annals of the „Constantin Brâncuşi” University of Târgu Jiu, Economy Series, Issue 3/2016
„ACADEMICA BRÂNCUŞI” PUBLISHER, ISSN 2344 – 3685/ISSN-L 1844 - 7007
The figure above shows that the weight of financial resources from EU funds in the total of local budget revenues increased steeply from 2008 until 2011 when it recorded a rate of 8.03%. In the next period the trend followed by this proportion is tortuous since in 2012 decreased (7.68%) and in 2014 rose to 8, 78% for 2014 to fall to 6.27%. From this analysis results that the public local authorities in Romania have made exquisite progress when it comes to accesing European funds, but the downside is that they did so, but in a manner that does not meet with the needs of the comunity. On the other hand we can state that given the experience acquired by the public administration, the local government budgets will benefit from more consistent revenue from the Structural Funds during the implementation of the 2014-2020 Multiannual Financial Framework. 5. Conclusions By accessing structural and cohesion funds of the European Union local communities can solve a large part of public needs, develop their infrastructure achieving investments that will later attract investors, thus increasing local incomes. For our country, the structural funds are a way to economic recovery, continuing change and accelerate reform, to achieve the degree of development of other European countries. The absorption of these funds allocated from the EU budget represents a challenge, but mostly a big responsibility for local authorities. Reality shows that especially among new EU member states, although the volume of structural and cohesion commitments is considerable, an important issue is their low absorption capacity due to complex challenges that arise in managing European funds, such as unruly documentation with a strong bureaucratic component; low expertise of beneficiaries in writing projects; lack of beneficiaries' capacity to finance or co-finance projects; lack of transparency in the evaluation and selection of projects; poor information on funding opportunities, cumbersome procurement procedure. The analysis carried out within this paper shows that local authorities in Romania have made significant progress in terms of European funds but not in a satisfactory manner. Thus the weight of financial resources from EU funds in the total of local budget revenues occupies a proportion revolving around 8%. We are able to say that, taking into account the experience, local authorities in Romania will register higher receipts from the Structural Funds during the implementation of the Multiannual Financial Framework 2014-2020. We conclude by emphasizing that the financial resources from the EU funds constitute the tools for the implementation and strengthening of the local autonomy, with effects on improving the local budget process.
Endnotes (1) Law no. 273/2006 on local public finances, published in Of. M, Part I, no. 618 of July 18, 2006, annex 1
(2) G.E.O. no. 63/2010 amending and supplementing Law no. 273/2006 on local public finances, and establishing financial measures, published in Of. M. no. 450 of July 2, 2010, art. I, para. 6, aproved with amendments by Law no. 13/2011 published in Of. M. no. 179 of March 14, 2011
(3) http://www.fonduri-ue.ro
BIBLIOGRAPHY
[1] Daniela Florescu, Octavia Maria Gibescu, Problems encountered in accessing European funds, International conference "Finance and economic stability in the financial crisis", 11 to 12 December 2009, ASE Bucharest, Theoretical and Applied Economics. Supplement, General Association of Economists in Romania – AGER
[2] Elena Cigu, Local public finances. Their part in establishing the reign of local administrative units, Tehnopress Publishing , Iaşi, 2011 [3] Ligia Roman, Structural Funds in Romania, 3 rd International Conference Managerial Challenges of the Contemporary Society, June 4-5, 2010, Cluj Napoca, Romania
[4] Iulian Văcărel and colab., Public finances, Didactic and Pedagogic Publishing House, Bucharest, 2006 [5] Gheorghe M. Voinea, Local public finances and their efficient administration, Economic Publishing House, Bucharest, 2011 *** Law no. 273/2006 on local public finances, published in Of. M, Part I, no. 618 of July 18, 2006 *** G.E.O. no. 63/2010 amending and supplementing Law no. 273/2006 on local public finances, and establishing financial measures, published in Of. M. no. 450 of July 2, 2010, art. I, para. 6, aproved with amendments by Law no. 13/2011 published in Of. M. no. 179 of March 14, 2011 *** Romanian Statistical Yearbook 2010-2015 *** http://www.fonduri-ue.ro
299

Annals of the „Constantin Brâncuşi” University of Târgu Jiu, Economy Series, Issue 3/2016
„ACADEMICA BRÂNCUŞI” PUBLISHER, ISSN 2344 – 3685/ISSN-L 1844 - 7007
USES OF THE BALANCED SCORECARD SYSTEM IN THE STRATEGIC PLANNING
AND THE IMPROVEMENT OF THE JUDICIARY FUNCTIONING
HULPUŞ IOANA ALEXANDRA PHD. STUDENT, FACULTY OF ECONOMICS, "LUCIAN BLAGA" UNIVERSITY, SIBIU, ROMÂNIA,
e-mail: [email protected]
MIRICESCU DAN DOCTOR OF SCIENCES, ASSOCIATE PROFESSOR, FACULTY OF
ENGINEERING,"LUCIAN BLAGA." UNIVERSITY, SIBIU, ROMÂNIA, e-mail: [email protected]
Abstract, The necessary steps for the implementation of quality management in the Romanian judiciary must be focused
on each of its phases, respectively throughout the whole cycle planning - execution - evaluation - improvement. Starting from the reality that quality management in the Romanian courts was taken fragmented, disregarding some essential phases, like the importance of strategic planning or the quality principle of customer orientation, the study proposes a useful tool for judicial managers -the Balanced Scorecard system. The challenge of the research is to answer whether it is possible to adapt a model designed for commercial organizations and to prove its utility in improving judicial management.
Keywords: Balanced Scorecard, judicial management, strategic planning, quality improvement JEL Classification:K00, H11. 1. Introductory aspects regarding quality as part of the public domain development Total Quality Management (TQM) was initially used in the private sector, to achieve an integrated monitoring and estimation of all relevant activities of an organization in order to accomplish excellent results in business operations, including those in progress.[6] "Quality" is no longer a new concept for the public sector. On the contrary, the quality was, at least implicitly, a concept in public administration since the establishment of the modern administrative state, when it was associated with the obedience of rules and procedures, formal correctness, reliability and absence of arbitrary decisions. [2] An overview of the occurrence of quality in public domain is found in Engel (2004), which emphasizes the idea that "the impulse for quality" (Massey, 1999, p. 2) comprised the public sector in the last half of the '80s and in a much larger scale in the 90s, allowing quality to become "a central term in our contemporary rethoric" (Pollitt, Bouckaert 1995, p. 3), one of the topics and central concerns of the administrative modernization in Western Europe and even as some authors express, "a recent epidemic" (Pollitt, Bouckaert, 2000, p. 168). Consequently, TQM is regarded as a"holistic" tool and by the late 80s was implemented increasingly in the public sector. [6] Like public organizations everywhere, justice systems have shown an increasing interest in understanding and developing quality. As a consequence, in the justice domain as well, total quality management should be seen as the approach through which management tries to provide a quality service and therefore tries to act qualitatively in all areas and at all levels of the judicial organization in question.
2. Quality Management in the Judiciary
The concern to find certain quality standards in justice has become a priority for European countries that have joined forces repeatedly through the establishment of associations of judicial councils, working groups or other organizations to find common solutions and promote examples of best practices. In order to ensure quality management of the Romanian judiciary strategic documents, as a result of joint efforts of European jurisdictions, included important measures such as: • introduction of quality standards regarding efficiency and effectiveness of the courts, the development of specific indicators;
300
Annals of the „Constantin Brâncuşi” University of Târgu Jiu, Economy Series, Issue 3/2016
„ACADEMICA BRÂNCUŞI” PUBLISHER, ISSN 2344 – 3685/ISSN-L 1844 - 7007
• the transposer of certain fundamental principles, namely independence and accountability in performance indicators; • training and human resource development; • the increase of transparency and accessibility of judicial services; • the use of modern information-communication technologies in public services; • increasing ethics in the judiciary and reducing corruption. These efforts are praiseworthly, but on a careful analysis of the progress in the domain serious shortcomings in understanding the concept of quality management can be revealed. The most serious problems in our view are the lack of a strategic management focused on improving, disregarding the principle of focusing on the customer of judicial services and not least a very formal evaluation, which results in difficulties in the implementation of improvement measures. 3. Why Balanced Scorecard? Quality assurance in judicial courts must naturally proceed with quality planning. In this context the vision, mission and strategy, choosing a philosophy, a quality policy takes on special meanings. Visions must be connected to quality and the policies must reflect these values and perspectives to gain the management commitment at all levels, which is vital in implementing quality management.
Quality planning should be based on a strategic management of the judiciary, a strategic approach for leading judicial organizations is impetuously requested to meet quality requirements.
Romania does not have a clear vision and or mission of quality, proving shortcomings in the implementation of a strategic management focused on improving results. This emerges easily from studying the documents of Quality Management Working Group, established at the initiative of ENCJ (European Network of Judicial Councils). Other subsequent data, for example the analysis requested by the Government, financed by the European Union and carried out by the World Bank to assess the need for further reform in the judicial system, noted the same shortcomings. According to the analysis, ˶ a problem encountered at all levels, affecting the functioning of the justice sector is the lack of management and a strategic planning of the system. These are not developed in a generalized way at the judicial system's level, and for a country like Romania, this is essential.[9]
Under the circumstances, judicial managers must asses the following priorities: • the establishment of a mission statement and a vision on quality. • based on the grounds that vision and values are the core of activities related to quality, managers, in addition
to identifying the values and vision, must promote them, brining to the attention of their staff and the citizens as a commitment to quality, the shortest way through the courts' website.
• in each court, managers should focus their efforts to establish a strategic management focused on improving results. It requires clear strategic objectives for a meaningful assessment of the existing resources and needs of the judicial system (human resources, financial, ICT). The quality of the system depends on the way resources (financial, human resources, information technology and communications, infrastructure and others) are planned in an integrated manner and how quality principles are translated into strategic objectives.
In this context, BSC is a very valuable tool for the judicial manager as the essence of this system is the placement of the organization's strategy in the center of the performance measuring process. [4],[5]
The management of public services and its quality is directly related to the use of quality management systems, modern tools of monitoring, evaluation and control. For example, the Direction of Quality and Efficiency supports Balanced Scorecard (BSC) in public organizations as a tool for goal setting and performance measurement in projects financed mainly by European Union. Unfortunately there is no unified approach to the implementation of a unique recognized system. (Strategy to strengthen public administration 2014-2020)
4. The Balanced Scorecard (BSC)
Balanced Scorecard (BSC) is a management system and a strategic planning tool, prevalent in business institutions and industry, public state institutions, and nonprofit organizations. BSC improves external and internal communication and also monitors the performance of an organization based on its strategic objectives. [14] What differentiates BSC system for measuring organizational performance from specific traditional efforts in the field is turning from evaluation work preponderance to value creation preponderance. [9]
In our view, the added value by adapting this strategic system to the needs and specificities of the Judiciary lies in effective communication of vision within the organization and secure the commitment of staff.
301
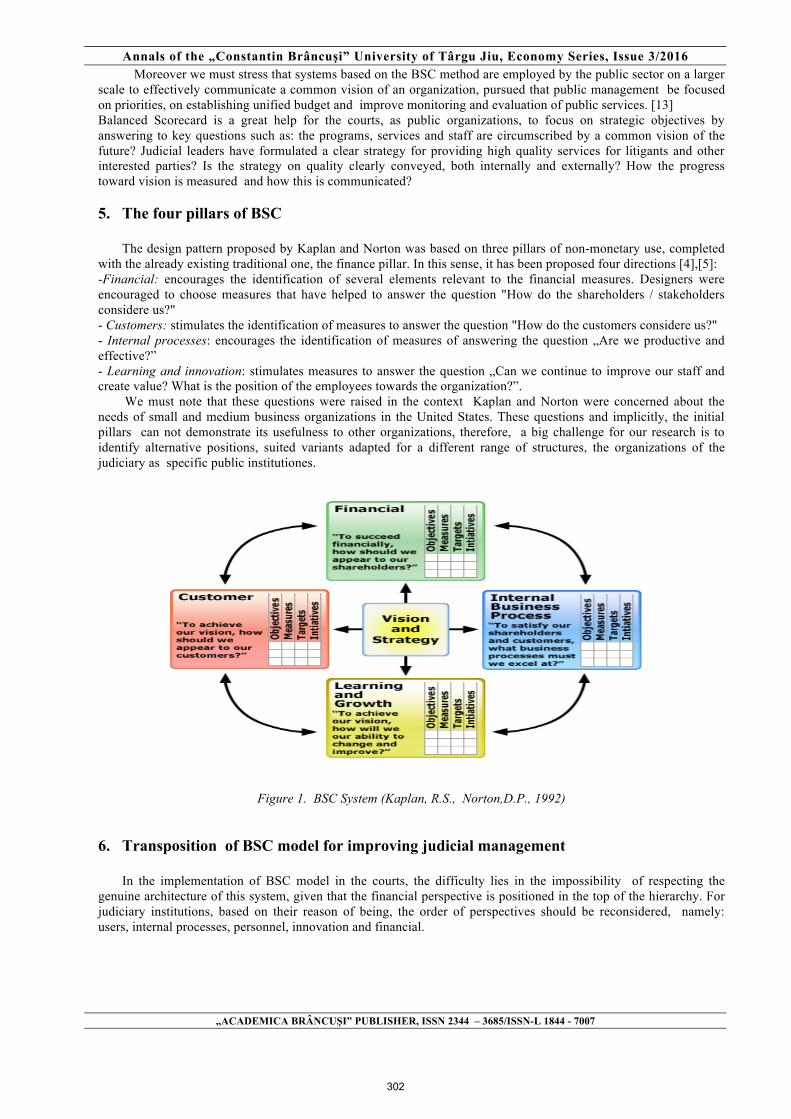
Annals of the „Constantin Brâncuşi” University of Târgu Jiu, Economy Series, Issue 3/2016
„ACADEMICA BRÂNCUŞI” PUBLISHER, ISSN 2344 – 3685/ISSN-L 1844 - 7007
Moreover we must stress that systems based on the BSC method are employed by the public sector on a larger scale to effectively communicate a common vision of an organization, pursued that public management be focused on priorities, on establishing unified budget and improve monitoring and evaluation of public services. [13] Balanced Scorecard is a great help for the courts, as public organizations, to focus on strategic objectives by answering to key questions such as: the programs, services and staff are circumscribed by a common vision of the future? Judicial leaders have formulated a clear strategy for providing high quality services for litigants and other interested parties? Is the strategy on quality clearly conveyed, both internally and externally? How the progress toward vision is measured and how this is communicated? 5. The four pillars of BSC
The design pattern proposed by Kaplan and Norton was based on three pillars of non-monetary use, completed with the already existing traditional one, the finance pillar. In this sense, it has been proposed four directions [4],[5]: -Financial: encourages the identification of several elements relevant to the financial measures. Designers were encouraged to choose measures that have helped to answer the question "How do the shareholders / stakeholders considere us?" - Customers: stimulates the identification of measures to answer the question "How do the customers considere us?" - Internal processes: encourages the identification of measures of answering the question „Are we productive and effective?” - Learning and innovation: stimulates measures to answer the question „Can we continue to improve our staff and create value? What is the position of the employees towards the organization?”. We must note that these questions were raised in the context Kaplan and Norton were concerned about the needs of small and medium business organizations in the United States. These questions and implicitly, the initial pillars can not demonstrate its usefulness to other organizations, therefore, a big challenge for our research is to identify alternative positions, suited variants adapted for a different range of structures, the organizations of the judiciary as specific public institutiones.
Figure 1. BSC System (Kaplan, R.S., Norton,D.P., 1992)
6. Transposition of BSC model for improving judicial management
In the implementation of BSC model in the courts, the difficulty lies in the impossibility of respecting the genuine architecture of this system, given that the financial perspective is positioned in the top of the hierarchy. For judiciary institutions, based on their reason of being, the order of perspectives should be reconsidered, namely: users, internal processes, personnel, innovation and financial.
302

Annals of the „Constantin Brâncuşi” University of Târgu Jiu, Economy Series, Issue 3/2016
„ACADEMICA BRÂNCUŞI” PUBLISHER, ISSN 2344 – 3685/ISSN-L 1844 - 7007
Figure 2. Adapted BSC to the judicial system specificities
6.1. Customer / user perspective. The major question in this pillar is based on how judicial customers perceive the justice structures? The main objective is to enhance and strengthen the confidence in justice and the degree of satisfaction in assessing the quality of the operation of justice. We should mention that in this dimension should be taken into consideration that category of people that has a direct contact with the courts as parties, witnesses, etc., thus effectively benefiting on justice services.
In this respect the judicial manager must rely on subjective data and specific tools such as the administration of questionnaires to measure perception of the litigants about the quality of judicial services, discussions between classes involved (judges, lawyers and experts) to identify and debate issues. Some judicial systems even appeal to academic experts to diagnose the functioning of justice and to formulate appropriate improvement measures.
Related to these considerations the following measures would be helpful: • the knowledge of areas of importance to litigants and the monitoring of the costomers' satisfaction towards
the operation mode of justice activities; • the development of consultation mechanisms of independent professional categories of justice (lawyers,
legal experts) regarding the operation of the system; • working with academia and scientific research to identify and implement innovative concepts and methods. 6.2. Personal perspective and innovation. Within this dimension should be emphasized that the court staff is
the main resource of the judiciary. In the current circumstances where requirements frecquently develop, the legislative changes are a reality and technology is skyrocketing, there is a need for staff to be in a continuous learning process.
We must emphasize that Norton and Kaplan differentiate instruction from learning, the latter assuming mentors and tutors within the organization and effective communication between employees which helps them easily find solutions to problems when necessary.
In the context of adopting and implementing the new legal codes, given the large number of revisions and changes that took place, the need for training of all practitioners in the justice system - judges, prosecutors, lawyers, clerks, staff from the probation system, etc. - increased significantly. In the key domain of human resources of the judiciary, the main problems are the need to ascertain the training needs of staff and also to balance personnel schemes to ensure an optimal workload and increase the quality of work and the act of justice. Through training of the judiciary personnel and also of the legal professionals, through debates regarding the developments in national and international law and the practice of courts, the level of knowledge will improve.
So the most important measures for this dimension should be: • to increase the professionalism of courts through a better management of human resources; • to make effective the coordination of staff training and skills development; • increasing integrity of judiciary personnel; • the extension of the justice personnel involvement.
It was found that some objectives are more difficult to measure. A controversial question related to this issue is -how can we measure innovation? On the Balanced Scorecard Institute official internet page important clarifications are brought, innovation is defined as the process of ideation, evaluation, selection, development and implementation of products, services or new or improved programs. We see therefore that innovation is inextricably linked with the
303
Annals of the „Constantin Brâncuşi” University of Târgu Jiu, Economy Series, Issue 3/2016
„ACADEMICA BRÂNCUŞI” PUBLISHER, ISSN 2344 – 3685/ISSN-L 1844 - 7007
role assigned to staff, on how learning takes place, in a word on how ˶ the organization means to invest in personnel ̋. So the expected results of this are:
• To increase the number of new ideas. • To improve the quality of ideas. • A more effective implementation of quality ideas. • Improvement achieved from the implementation of new ideas. 6.3. The internal perspective must identify the inner processes the organization needs to be focused on. In the context of this dimension, an important strategic objective of judicial management is linked to the celerity
of justice, the steps that should be taken to shorten the procedures and judgments within a reasonable timeframe, while finding solutions to the problem of scheduling the hearing in terms of decreasing the waiting time of litigants.
Also, continuing the efforts of the development of E-Justice will make an important contribution to improve strategic management and the efficiency of justice, therefore should be included in our view in the dimention of internal processes.
In line with the strategic objectives the following measures schould be taken: • improving the system of judicial statistics; • the development of e-justice in line with the strategic priorities of the judiciary; • professional training of staff in the IT domain, simultaneously with a better informing of the citizens on
efforts made to increase accessibility of information and services overall. 6.4. Financial perspective. Even if the financial perspective does not have the same representation as in the
BSC traditionally model, opportunity data obtained accurately on funding will always be important issues for judiciary managers, who changing the initial approach, schould reporte continuously their activity to the questions:Are we optaining highest results with each resource costs? Or, how financial resources should be allocated to achieve maximum social effect? However, if in the initial model the structures pertained to how the organization was regarded by the resource providers, in the model proposed by us, judicial bodies should report on how citizens perceive the institution. Citizens, in their position as taxpayers, are people interested in the welfare of the public domain and judicial managers should be concerned about how the community considers the institution of justice.
According to the latest Euro-barometer survey on Justice, 34, 44% of Romanian showed confidence in the judiciary, a good result, which indicates an increase of over 15% since Romania has joined the European Community. Unfortunately, Romania continues to be below the EU average of public confidence in justice.
Under this strategic objective the measures should be: • Improve decision-making and efficiency of public spending at all levels; • Changing the perception of citizen, of the entire community, through open communication by organizing
sessions dedicated to inform citizens. Conclusions:
In our opinion, the BSC model exposed by Kaplan and Norton, emphasizing the importance of a complex, multidimentional approache of performance evaluation, can be adapted successfully by the judicial managers as a useful aid in determining both the strategic objectives and the specific performance measurement in close correlation with the vision and strategy.
Given the fact that the instruments of quality management shows its effectiveness in shaping a framework for operation in direct correlation with the needs and requirements of the beneficiaries of the services provided by the courts, it is important that, at national level, to stimulate the development and use of these tools by judicial managers.
In conclusion, the BSC model is proving a useful aid for judicial manager in strategic planning and in evaluating performance and identifing improvement measures achieving consistency between strategy and indicators, and moreover, ensures its communication inside and outside the organization.
Using these quality tools the results will be a performant strategic management in courts and thus in the entire judicial system, an improvement of professional knowledge and managerial skills of the managerial staff, an amelioration of public policies, of the strategic planning process , measurement, monitoring and evaluation of results.
References: [1] BSI ( Balance Scorecard Institute) , How to Measure “Innovation” disponibil online pe balancedscorecard.org/Portals/0/PDF/How%20to%20Measure%20Innovation%20Final.pdf, accesat la 15.05.2016 [2]Engel, C., Instrumentele managementului calităţii în ţările candidate din Europa Centrală şi de Est, Editura Economică, Bucureşti,2004 [3]Fulea, G.L., Borzan, M., Bulgaru, M., Dezvoltări actuale privind instrumentele casice ale calităţii, , a XIII-a Conferinţă Naţională Multidisciplinară , disponibil online pe http://stiintasiinginerie.ro/wp-
304

Annals of the „Constantin Brâncuşi” University of Târgu Jiu, Economy Series, Issue 3/2016
„ACADEMICA BRÂNCUŞI” PUBLISHER, ISSN 2344 – 3685/ISSN-L 1844 - 7007
content/uploads/2013/12/6-DEZVOLT%C4%82RI-ACTUALE-PRIVIND-INSTRUMENTELE-CLASICE-ALE-CALIT%C4%82%C8%9AII-I.pdf, accesat la 13.05.2016 [4]Kaplan, R.S., Norton, D.P., The balanced scorecard:Measures that drive performance. Harvard Business Review (January-February),1992 [5]Kaplan R. S., Norton D P, Balanced Scorecard: Translating Strategy into Action, Harvard Business School Press, 1996 [6]Matei, A., Andreescu, S., Managementul calităţii totale în sectorul public. Experienţe europene, Proceedings, 2005, Editor Matei, L., International Conference Public administration at the beginning of the third millennium. Disseminating the best Japanese practices in Romania, Bucharest, Romania, http://www.admpubl.snspa.ro/ fisiere/Proceedings.pdf, accesat la 01.12.2015 [7]Matei,L., Lazăr, C.Managementul calităţii şi reforma administraţiei publice în unele state din sud-estul Europei. Analiză comparativă, Economie teoretică şi aplicată Volumul XVIII (2011), No. 4(557), pp. 65-98, disponibil online pe http://www.store.ectap.ro/articole/581_ro.pdf, accesat la 13.05.2016 [8]Ministerul dezvoltării regionale şi administraţiei publice, Strategia pentru consolidarea administraţiei publice 2014-2020, disponibilă online pe www.fonduri-ue.ro accesat la 13.05.2016 [9]Ministerul Justiţiei, Analiză funcţională a sectorului justiţiei, disponibilă pe www.just.ro, accesat la 01.02.2016 [10]Miricescu, D., Metode şi tehnici manageriale utilizate în managementul industrial, Editura Universităţii ˶ Lucian Blaga ̋ din Sibiu, Sibiu 2008 [11]Pollitt, C., Bouckaert, G., Public management Reform. A Comparative Analysis, Oxford: Oxford University Press, 2000 [12]Pollitt, C., Bouckaert, G. , Quality Improvement in European Public Services. Concept, Cases and Commentary, London: Sage Publications, 1995 [13]Rohm, H., Improving Government Performance Using the Balanced Scorecard to Plan and Manage Strategically, Balanced Scorecard Institute, disponibil online pe http://balancedscorecard.org/Portals/0/PDF/Improve_Government_Performance_with_a_BSCl_HR2.pdf accesat la 14.05.2016 [14]Ştefănescu, D., Silvestru, M., Balanced Scorecard - instrument de planificare strategică ,Romanian Statistical Review nr. 2 / 2012, disponibil online pe http://www.revistadestatistica.ro/, accesat la 15.05.2016
305

Annals of the „Constantin Brâncuşi” University of Târgu Jiu, Economy Series, Issue 3/2016
FINANCIAL RESOURCES MANAGEMENT AND THE IMPACT ON THE FINANCIAL POSITION OF THE ENTITIES IN THE ROMANIAN ENERGY SECTOR
MIRON VASILE CRISTIAN IOACHIM
PH.D STUDENT “1 DECEMBRIE 1918” UNIVERSITY OF ALBA IULIA, ROMANIA e-mail: [email protected]
FOCȘAN ELEONORA IONELA
PH.D STUDENT “1 DECEMBRIE 1918” UNIVERSITY OF ALBA IULIA, ROMANIA e-mail: [email protected]
BOTA CRISTIAN FLORIN
PH.D STUDENT “1 DECEMBRIE 1918” UNIVERSITY OF ALBA IULIA, ROMANIA e-mail: [email protected]
Abstract
The way in which resources (material, human, financial, technical, etc.) are managed within an economic entity is an issue that can have a significant influence on the financial position of an entity. Applying this axiom in the Romanian energy sector, a sector in which financial management often has a high importance in the overall management of the business due to the high investment of financial resources, we can say that the analysis of the impact that falls upon the financial position of the entity is a goal worthy of study.
This study has as main objective analysis of how different indicators of financial management can influence the financial position of an entity in the energy sector. Anticipated results of this study predict that the financial position of the entities analyzed in the Romanian energy sector is often significantly influenced by the management of financial resources by the entity.
Correlating these results with further analysis, such as those related to the risk of bankruptcy, we can say that the usefulness of the study is one wholesaler, providing interested stakeholders a set of complex and useful information for making optimal decisions in order to maximize the benefits that they can obtain.
Keywords: financial position, financial resources, management, sustainable development JEL Code: M40, M41
1. Introduction
Financial management issues are one of the main concerns of researchers in accounting and this trend was
accentuated with the establishment of the financial crisis started in 2007-2008. Various authors [19] put the financial crisis on the account of some outdated financial management systems, arguing that businesses have evolved continuously while financial management systems are still relying on outdated principles enunciated by Luca Pacioli in 1494.
Some case studies show that, especially for small and medium entities there is an influence that financial management can have on the financial position. Thus, Ispas, R. M., and Simon, D. M. [7] states that a improper financial management, characterized by mismanagement and ignorance of financial risk can affect the liquidity of an entity or even lead to insolvency or bankruptcy on the horizon extended time (3-5 years). In our view, these issues apply in the large and very large entities. However, we must admit that bending over financial management in achieving and maintaining an optimal financial position is higher in large companies than in small and medium enterprises.
2. Review of the literature
Financial management issues are complex and often treated in the literature, especially in terms of theory.
Moreover, financial management approach is often founded in other sectors than the economic entities: public [12]
306

Annals of the „Constantin Brâncuşi” University of Târgu Jiu, Economy Series, Issue 3/2016
or personal [13]. In our view, the sector that has the power to influence either of the two previously mentioned is private, and its analysis can replace all or part of certain aspects of the analysis of the other two.
Some bibliographical sources[17] emphasize the relationship between management and taxation sphere. In our opinion, tax issues are just one component of the financial management system; we believe that financial management is a more complex side of the general management of the business, where items such as financing policy, financial cycles, remuneration policies, cost standards, etc., are perhaps as important to be carefully controlled as the elements related to the taxation. Also, investment policies practiced by companies are also ways of expressing financial management, which may influence financial position of the entities.
According to the opinion submitted by Jindrichovska, I., [8], financial management is very important in the overall management of the business, or even the most important factor that can influence the general business management for small and medium companies. In our opinion, this rule can be extended and applied to large companies, and especially for large companies.
The financial position of an entity, concept whose analysis is performed most often based on information provided by accounting, is a particularly sensitive issue for optimal decision making in which financial management plays an important role. This close link between financial management and accounting is often brought to light in the specialized literature, Chiriță, I., and Grigoraş-Ichim, C., [5] in their study stating that financial management is often the result of a well-organized accounting syste, allowing the decision makers to issue the optimal directions action.
However, analysis of the impact that financial management can have on the financial position can perform more detailed analyzes, such as analysis of the concepts related to financial management which may influence financial position. In this context, we can argue that the concept ot financial position is characterized of financial balance and financial risk [11], and individual management of these concepts certainly put its mark on the overall management of the business. Obviously, this approach may in turn analyzed and deeper, for example, the influences that certain categories of financial risk (market risk, credit risk and price risk [14]), may have on the general financial risk. Moreover, there are specialized studies [4] showing that the system of risk management can often be influenced by factors that even apparently would not be related to risk factors such as corporate governance.
Although the literature emphasizes the existence of financial risk especially in areas such as equity, banking, insurance [18], etc., we must admit that the energy sector is one in which financial resources are often among the most important for doing business, it is equally a sector in which financial risk and financial management should be handled with caution. Specialized studies [9] shows that proper risk management can provide for the entity an opportunity to magnify the area of funding and investment of financial resources.
A key element in ensuring a proper financial management (leading to a balanced financial position) is represented by minimizing the financial risk. This occurs most often by the existence of an insurance against fraud and error in the information in the annual financial statements, ensuring that most often takes the form of audit reports. At the same time, we subscribe to the idea presented by Puican, L., [15], which states that it is imperative for the financial managers to familiarize with knowledge in the field of planning and financial control, evaluation of investment techniques, financial management and economic diagnoses, as a prerequisite for insuring the performance of the entities.
The source data for analysis and interpretation of the manifestation of financial management in assessing how it can affect the financial position of entities is represented by the annual financial statements. However, we must admit that in order to make optimal decisions, information taken from the annual financial statements must reflect reality [20]. This is often reinforced by the existence of audit reports are presented unqualified opinion.
In our view, a simple defining of the financial management could be that it represents all the actions or inactions of persons engaged in the entity, leading to optimal management of financial resources available or accessible to the entity in order to maximize its short term, medium and long term goals. In other words, a proper financial management will cancel the idea that high profits are the result of high financial risks [2].
On the other hand, neither financial equilibrium, the specific financial management tool should not be neglected; in the opinion presented by Costi, B., et. al., [6], maintaining a financial balance involves careful management of two important aspects, namely, investment decisions and financing decisions. We subscribe to this view, and furthermore, emphasize that information (or raw data to assist in obtaining information) to assist in making the best decisions are most often available to all stakeholders, particularly those within the entity.
Although to ensure proper financial management should be paid attention to all aspects of the entity, we believe that each stakeholder must admit that there is a clear distinction between financial and non-financial elements that influence the activity of the entity. An example of this is provided by Berk, J., et. al., [3], which draws attention to the differences between the concepts of "operational cycle" (one that refers to the amount generated by
307

Annals of the „Constantin Brâncuşi” University of Târgu Jiu, Economy Series, Issue 3/2016
running the entire chain of transactions), and "financial cycle" (which covers only the intervals between receipts and payments).
Often, the perception of the financial management of an entity may be affected by factors including subjective and independent by the entity: for example, in a study published by Anderson, R., et. al., [1] it is highlighted that the entities with large number of governing bodies have easier access to cheaper funds due to the trust emerging in creditors vision, the trust being generated by the existence of more rigorous filters for taking the final decision.
Since the financial position of an entity is given mainly by the indicators presented in the balance sheet (or other indicators compiled using data from the annual financial statements), we can say that the financial position is affected by the manner of accounting recordings (whose finality is founded in the financial statements) but also of financial decisions taken by management.
According to the aspects outlined above, it is obvious that the financial management of an entity can influence the modes of expression of the financial position, whether we refer to financial balance or financial risk. However, we believe that controlling these instruments of manifestation of the financial management (and thus the financial position) must be made by taking and implementing financial control systems adequate [16].
In order to analyze empirically how these issues manifest in the Romanian energy sector, it was intended to analyze a sample of entities whose shares are traded on the Bucharest Stock Exchange, respectively Romgaz (SNG), Petrom (SNP), Electrica (EL), Transgaz (TGN), Transelectrica (TEL), Nuclearelectrica (SNN), Conpet (COTE), Rompetrol Rafinare (RRC), Oil Terminal (OIL), Petrolexportimport (PEI) and Dafora (DAFR).
3. Results and discussions
It is obvious that the analysis of the impact that financial management can have on the financial position,
must start from choosing an indicator of expressing the financial position. The literature devoted many indicators as well as many ways to analyze financial position. In our opinion, among the most eloquent indicators we can mention the overall solvency, general liquidity, indebtedness degree, etc.
However, choosing an indicator from those ones (or other specific indicators) is a sensitive and often subjective issue. Each category of stakeholders has its own interests and their own vision over an entity's financial position and therefore any firm choice of one of the named indicators can be easily challenged.
Thus, it is necessary that choosing a particular indicator that expresses generally the financial position, has to be confirmed by specific mathematical methods. In our view, a healthy financial position is expressed by a low financial risk, which has a direct result a decreased risk of bankruptcy. Thus, we believe the risk of bankruptcy might be a more suitable indicator to express the financial position of the entities, but only to the extent that we can prove that this is dependent on the evolution of classical indicators for assessing the financial position.
For this purpose, in the following we simulate through an econometric model how risk of bankruptcy of energy sector companies listed on the Bucharest Stock Exchange, achieved by scores method using Conan-Holder model (model proposed and supported by Miron , V. C. I., et. al., [10]), is influenced by the classic indicators of expression of financial position (overall solvency, liquidity and indebtedness degree). The dependence between this model and remembered indicators is based on data sets from an interval of 4 consecutive years (2011-2014), cumulating over 40 datasets.
The statistical simulation result generated the following function: a[t] = -1.66297 + 0.015722b[t] + 14.9943c[t] -27.4662d[t] + e[t] (1) in which: a[t] – the score of banckrupcy risk given by Conan-Holder model; b[t] – overall solvency; c[t] – liquidity; d[t] – indebtedness degree. From the analysis of the functional relationship between the analyzed indicators, there is a fairly high
dependence of bankruptcy risk to the elements of expression financial position, especially general liquidity and indebtedness degree. These issues confirms the hypothesis initially assumed, that the bankruptcy risk score calculated by the Conan-Holder model is a good indicator of expression of the financial position of the entities in the energy sector.
308
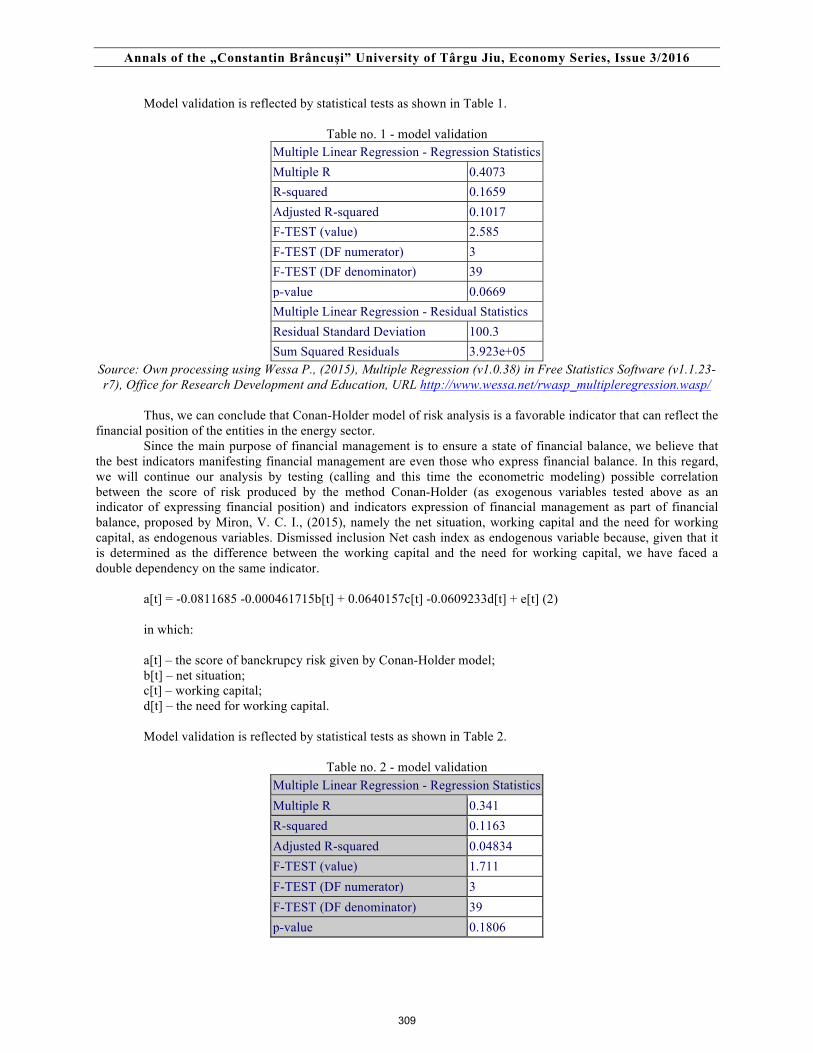
Annals of the „Constantin Brâncuşi” University of Târgu Jiu, Economy Series, Issue 3/2016
Model validation is reflected by statistical tests as shown in Table 1.
Table no. 1 - model validation Multiple Linear Regression - Regression Statistics Multiple R 0.4073 R-squared 0.1659 Adjusted R-squared 0.1017 F-TEST (value) 2.585 F-TEST (DF numerator) 3 F-TEST (DF denominator) 39 p-value 0.0669 Multiple Linear Regression - Residual Statistics Residual Standard Deviation 100.3 Sum Squared Residuals 3.923e+05
Source: Own processing using Wessa P., (2015), Multiple Regression (v1.0.38) in Free Statistics Software (v1.1.23-r7), Office for Research Development and Education, URL http://www.wessa.net/rwasp_multipleregression.wasp/
Thus, we can conclude that Conan-Holder model of risk analysis is a favorable indicator that can reflect the financial position of the entities in the energy sector.
Since the main purpose of financial management is to ensure a state of financial balance, we believe that the best indicators manifesting financial management are even those who express financial balance. In this regard, we will continue our analysis by testing (calling and this time the econometric modeling) possible correlation between the score of risk produced by the method Conan-Holder (as exogenous variables tested above as an indicator of expressing financial position) and indicators expression of financial management as part of financial balance, proposed by Miron, V. C. I., (2015), namely the net situation, working capital and the need for working capital, as endogenous variables. Dismissed inclusion Net cash index as endogenous variable because, given that it is determined as the difference between the working capital and the need for working capital, we have faced a double dependency on the same indicator.
a[t] = -0.0811685 -0.000461715b[t] + 0.0640157c[t] -0.0609233d[t] + e[t] (2) in which: a[t] – the score of banckrupcy risk given by Conan-Holder model; b[t] – net situation; c[t] – working capital; d[t] – the need for working capital. Model validation is reflected by statistical tests as shown in Table 2.
Table no. 2 - model validation Multiple Linear Regression - Regression Statistics Multiple R 0.341 R-squared 0.1163 Adjusted R-squared 0.04834 F-TEST (value) 1.711 F-TEST (DF numerator) 3 F-TEST (DF denominator) 39 p-value 0.1806
309

Annals of the „Constantin Brâncuşi” University of Târgu Jiu, Economy Series, Issue 3/2016
Multiple Linear Regression - Residual Statistics Residual Standard Deviation 103.2 Sum Squared Residuals 4.157e+05
Source: Own processing using Wessa P., (2015), Multiple Regression (v1.0.38) in Free Statistics Software (v1.1.23-r7), Office for Research Development and Education, URL http://www.wessa.net/rwasp_multipleregression.wasp/
The determined model show a correlation between the calculated risk score based on the Conan-Holder
method and the proposed indicators for assessing financial management. 4. Conclusions From the above analysis it can be seen that there is a close correlation between financial position (expressed by Conan-Holder model risk) and financial management (expressed by net situation, working capital and the need of working capital). We note in particular the manifestation of a higher intensity by the need for working capital and working capital, and less influence for the net situation. In other words, we can conclude that the financial position is strongly influenced by the practical way of managing the balance between economic resources and sources of origin (financing current assets in the short term sources) than the property owners (in our case the net situation). This is essential information, which should be understood to be a motto for any owner: financial management of the business itself is more wealth than the wealth generated by the business in anticipation of liquidation (theory enshrined based on net situation approach, showing wealth business owners subtracting total liabilities from total assets as if the entity would cease to exist). 5. References [1] Anderson, R., et. al., (2004), Board Characteristics, Accounting Report Integrity and the Cost of Debt, Journal of Accounting and Economics, 37, pp. 315-342; [2] Bălăceanu, V. A., (2009), The Influences Financial Management In Developing The Future Firm`S Business, The Annals of the "Stefan cel Mare" University of Suceava. Fascicle of The Faculty of Economics and Public Administration, Volume 9, Issue 2, pp. 112-118; [3] Berk, J., et. al., (2012), Fundamentals of Corporate Finance, Pearson Education, Inc.; [4] Brezeanu, P., și Al Essawi, M. S., (2011), The Relation Between Financial Management And Corporate Governance: Analytical Approach At The Level Of The Risk Management Strategies, Article provided by Economic Publishing House in its journal Management & Marketing, Volume 6, Issue 1, pp. 151-162; [5] Chirita, I., și Grigoraș-Ichim, C., (2009), The Relationship Between Financial Management And The Information Supplied By Accountancy In The Process Of Substantiating The Financial Decisions At The Level Of An Economical Entity, The Annals of the "Stefan cel Mare" University of Suceava. Fascicle of The Faculty of Economics and Public Administration, Volume 9, Issue 2, pp. 238-243; [6] Costi, B., et. al., (2014), Financial Management Of The Company Through The Capitalization Of Financial-Accounting Information, Article provided by Fundația Română pentru Inteligența Afacerii, Editorial Department in its journal SEA - Practical Application of Science, Issue 4, pp. 499-504; [7] Ispas, R. M., şi Simion, D. M., (2010), The Financial Management Of The Small And Medium Sized Companies In Romania, Article provided by University of Craiova, Faculty of Economics and Business Administration in its journal Annals of Computational Economics, Volume 2, Issue 38, Pages: 288-295; [8] Jindrichovska, I., (2013), European Research Studies Journal, Volume XVI, Issue 4, pp. 79-96; [9] Milos Sprcic, D., (2007), The Derivatives as Financial Risk Management Instruments: The Case of Croatian and Slovenian Non-financial Companies, Financial Theory and Practice 31 (4), pp. 395-420; [10] Miron, V. C. I., (2015), Financial Position and Its Relevance to Stakeholders, Article provided by Constantin Brancusi University, Faculty of Economics in its journal Constatin Brancusi University of Targu Jiu Annals - Economy Series, Issue 2/2015, pp. 356-365; [11] Miron,V. C. I., (2015), Financial Balance – An Important Objective for the Stakeholders in Romania’s Energy Sector, Procedia Economics and Finance 30, pp. 324 – 335; [12] Murphy, D. S., (2009), The evolution of public sector financial management in Bulgaria, International Journal of Managerial and Financial Accounting (IJMFA), Vol. 1, No. 4;
310
Annals of the „Constantin Brâncuşi” University of Târgu Jiu, Economy Series, Issue 3/2016
[13] Pham, T. H., et. al.,(2012), The impact of financial management practices and financial attitudes on the relationship between materialism and compulsive buying, Journal of Economic Psychology Volume 33, Issue 3, pp. 461–470; [14] Priermeier, T., (2005), Finanzrisikomanagement im Unternehmen, Ed. Vahlen, Munchen; [15] Puican, L., (2015), Utility Of Annual Financial Statements In The Management Process, Article provided by Constantin Brancusi University, Faculty of Economics in its journal Constatin Brancusi University of Targu Jiu Annals - Economy Series, Volume 3, pp. 164-169; [16] Puican, L., și Țogoe, G. D., (2012), Annual Financial Statements - Instrument Used In The Management Of Economic Entities, Article provided by University of Craiova, Faculty of Economics and Business Administration in its journal Annals of Computational Economics, Volume 2, Issue 40, pp. 175-180; [17] Risti, L., (2009), Cosiderations Regarding The Organisation Of Financial Management Of The Economic Entities, The Annals of the "Stefan cel Mare" University of Suceava. Fascicle of The Faculty of Economics and Public Administration, Volume 9, Issue 2, pp. 223-230ș [18] Stănescu, C. F., și Simion, L. M., (2011), Financial Risk Management, Article provided by University of Craiova, Faculty of Economics and Business Administration in its journal Annals of Computational Economics, Volume 1, Issue 39, pp. 132-137; [19] Svasta, M., (2009), Existence crises of actual financial management systems, Article provided by Faculty of Management, Academy of Economic Studies, Bucharest, Romania in its journal Economia. Seria Management, Volume 12, Issue 1 Special, pp. 23-28; [20] Veronel, A., et. al., (2012), Financial Annual Statements – Source of Information for Determining the Company’s Financial Position and Performance, “Ovidius” University Annals, Economic Sciences Series, Volume XII, Issue 2, pp. 982-986; [21] Wessa P., (2015), Multiple Regression (v1.0.38) in Free Statistics Software (v1.1.23-r7), Office for Research Development and Education, URL http://www.wessa.net/rwasp_multipleregression.wasp/
311
Annals of the „Constantin Brâncuşi” University of Târgu Jiu, Economy Series, Issue 3/2016
„ACADEMICA BRÂNCUŞI” PUBLISHER, ISSN 2344 – 3685/ISSN-L 1844 - 7007
ROMANIAN YOUNG LEADERS CAPABILITIES: AN EMPIRICAL SURVEY
ANGELA-OLIMPIA LOBONEA OLTEAN
PHD STUDENT, WEST UNIVERSITY OF TIMISOARA, e-mail: [email protected]
Abstract
This paper aims to disseminate the results of a study focused on young leaders, designed to fill the gap in the specialty literature about the capabilities of young leaders in Romania.
Capabilities - in our opinion, represents the leader's potentialities, the engine of transformation. They exist in a latent state and by activation they generate economic effects.
Through this study we want to identify young Romanian people's attitudes towards capabilities; when we say capabilities, we understand potential. In this article we will present the capabilities from the perspective of potential. Sure, there are also other classifications, but from an economical perspective we consider that the potential of a leader is relevant through the following components: emotional potential, social potential, cognitive potential, managerial potential and behavioral potential.
The overall conclusion is that in the realized study we have identified the following key capabilities of young Romanian leaders: character, confidence, empathy, credibility, leadership style, vision, memory, ability to be proactive, optimism, ability to generate respect. Keywords: potential, capabilities, young Romanian leaders, leadership; JEL classification: M10, M12, M29; 1. Introduction
There are many studies which are linking the leadership and the economic development. Knowing the factors that contribute to an effective leadership is a precondition for the selection of managers who will operate in positions of leadership. Unfortunately, the specialty literature is not so generous in terms of leadership among youth. To want, to know, to can or to have the necessary potential, that's why young leaders need certain capabilities. When the potential of the young Romanian leader is analyzed there are only a few data available. In Romania the term "leadership" is not very understood, primarily because there are no relevant examples of the successful Romanian companies. It also highlights the empirical practices of leaders and the lack of an adequate theoretical training able to give to the professional leader the security, confidence and support that any training on an academic field gives to the graduates of that domain, which leads to a permanent confusion between management and leadership, to a rare approach of discussions about leadership in Romanian organizations.
2. Literature review
Overtime, studies regarding leadership indicate the fact that most of them refer to the understanding of a good and effective leadership (Shaw, Erickson & Harvey, 2011). Many times, wrongly, the terms "youth development" and "youth leadership" are used interchangeably. Thus, some authors (Pittman & Cahill, 1991) see "youth development" as a process in which young people become competent or able to develop skills necessary for success and challenges. Most definitions (Astaroth, Brown, Pure & Timm, 2002, Carnegie, Council on Adolescent Development, 1989 et.al) also, refer either to specific results that young people want to achieve, or to critical tasks that young people must fulfill in order to achieve positive results. According to the National Collaborative on Workforce and Disability for Youth, "youth development" is a more comprehensive process, which prepares young people to respond to the challenges of adolescence and adulthood through a series of activities and experiences coordinated progressively and help them become competent socially, morally, emotionally, physically and cognitively speaking.
A study made by Scales and Leffert (1999) concluded that "youth development" contributes to: increasing self-esteem, popularity, self-control, increasing the capacity of leading and taking public decisions, increasing responsibility towards the work place, better family communication, decreasing psychosocial problems such as
312

Annals of the „Constantin Brâncuşi” University of Târgu Jiu, Economy Series, Issue 3/2016
„ACADEMICA BRÂNCUŞI” PUBLISHER, ISSN 2344 – 3685/ISSN-L 1844 - 7007
loneliness, shyness, and despair; low involvement in risky behaviors such as drug use, decreasing juvenile delinquency; increasing academic achievement and safety of the environment in which it operates.
Some definitions of the “leadership for young people” describes it as being the process through which a person sets a goal or direction for one or more people and gets them to act together with competence and complete dedication in order to achieve their full.(Nicolescu, 2006).
Leadership is a process in which members of the organization interact with one another, they objectify themselves and they become more responsible (Bailesteanu&Burz, 2008:24). Leadership is the behavior of an individual when he leads activities towards a common goal (Hemphill, JK, & Coons, AE., 1957). In other words, it implies a certain level of voluntary support from group members. Most often, definitions of leadership are focused on the ability of leaders to lead and work with others to establish their priorities properly, create synergy, to be popular but not populist, being authoritarian by recognition, not by imposing (Lobonea, 2014).
Wehmeyer, Agranand Hughes, (1998) define “leadership for young people”, on the one hand as the ability to guide or direct others in the course of proceedings, to influence opinion and behavior of other people and guide them, and on the other hand as the ability to analyze their own points and weaknesses, setting goals and achieving their personal and professional objectives.
This includes the ability to identify community resources and to use them, not only to live independently, but also to establish support networks for participation in community life and to achieve a positive social change. Based on these definitions, we can make the difference between “youth leadership” and “youth development”. We can say that “youth development” at the same time includes “youth leadership” competences, comprises a wider process of growth of development that occurs during adolescence and that will determine both, teens and adult behavior. Although the leading ability is part of the full range of skills and results achieved in the process of young people development, the leadership for young people is a distinct area of "youth development", with a primary focus on mastery of skills needed for effective leadership, including responsibility, teamwork and vision.
In each case, these skills and results include a wide range of fields, such as: cognitive, social, emotional, managerial, behavioral field.
The empirical study was divided into five parts: A. Emotional potential of young leaders, which in our view includes the following capabilities: character,
adaptability, stress tolerance, self-confidence; B. Social potential of young Romanian leaders with the following capabilities: flexibility, empathy, charisma,
credibility, authenticity; C. Managerial potential of young Romanian leaders with the following capabilities: leadership style,
creativity, vision, appreciative capacity; D. Cognitive potential of young Romanian leaders which includes the following capabilities: concentration,
communication skills, mental agility, perseverance, memory and inspiration; E. Behavioral potential of young Romanian leaders which includes the following capabilities: confidence in
people, courage, optimism, ability to generate respect and the ability to be proactive. Finally, we highlighted the main capabilities of young Romanian leaders as they were ranked according to the
opinion poll. 3. Methodology
To obtain the necessary information in practice, we used an investigation based on a questionnaire, the research tool being the questionnaire. The investigation was doubled by making an interview with every respondent. Thus, we can say that both quantitative methods and qualitative methods of investigation were merged.
Once the basic method of research was established, all the steps necessary for a proper development were followed: the preliminary stage or the pre-investigation, the choice of techniques and drafting of the questionnaire, the actual development of the research, processing the obtained data and the last stage, data analysis and interpretation, writing and communication of the report. a) The questionnaire
The questionnaire was structured so as to allow the obtaining of relevant information about the capabilities of young Romanian leaders and their profile. It was met with general rules of the theory of questionnaire: presentation, questions sequencing, their difficulty, etc. These questions were divided into five thematic modules: A. Emotional potential of young leaders which in our view includes the following capabilities: character, adaptability, stress tolerance, self-confidence. So for this kind of potential we formulated four key questions focusing on the emotional capabilities of young leaders. B. Social potential of young Romanian leaders with the following capabilities: flexibility, empathy, charisma, credibility, authenticity. For this kind of potential we formulated a number of 5 questions focused on the social potential of young Romanian leaders.
313

Annals of the „Constantin Brâncuşi” University of Târgu Jiu, Economy Series, Issue 3/2016
„ACADEMICA BRÂNCUŞI” PUBLISHER, ISSN 2344 – 3685/ISSN-L 1844 - 7007
C. Managerial potential of young leaders with the following capabilities: leadership style, creativity, vision, appreciative capacity. For this kind of potential we formulated a number of 4 questions that emphasize the managerial potential of young Romanian leaders. D. Cognitive potential of young Romanian leaders which includes the following capabilities: concentration, communication skills, mental agility, perseverance, memory and inspiration. It comprises a number of 6 questions focused on the cognitive potential young Romanian leaders. E. Behavioral potential of young Romanian leaders which includes the following capabilities: confidence in people, courage, optimism, ability to generate respect and the ability to be proactive. For the behavioral potential we formulated a number of 5 questions. b) The sample The analysis was done on a sample of 20 SMEs-micro, small and medium-lead by young leaders, women and men belonging to the age group of 18-35 years. Subjects were chosen at random, according to three criteria: 1) They have to be young leaders (18-35 years); 2) They must be employed (not less than 3 years of employment); 3) They must be willing to participate in the study. According to their age, 5% of leaders surveyed had between 18-20 years, 15% had between 21-25 years, while 32% had between 26-30 years (table no.2). The largest percentage, 48%, belongs to leaders aged 31-35 years (figure no.1).
Table no. 1. Sample according to age
No. of respondents / Age 18-20 years 21-25 years 26-30 years 31-35 years TOTAL 196 10 (5%) 29 (15%) 63 (32%) 94 (48%)
Figure no. 1: Sample according to age
By gender, 35% of leaders interviewed were females and 65% males (table no. 2).Although they do not hold a majority share, women still occupy a large percentage, which means that during the last years, they are increasingly involved in the management of companies (figure no. 2):
Table no. 2: Sample according to gender No. of respondents/Gender Male Female Total 196 130 (65%) 66 (35%)
314

Annals of the „Constantin Brâncuşi” University of Târgu Jiu, Economy Series, Issue 3/2016
„ACADEMICA BRÂNCUŞI” PUBLISHER, ISSN 2344 – 3685/ISSN-L 1844 - 7007
Figure no. 2: Sample according to gender
Regarding the size of the enterprises from where the young leaders were interviewed: - Micro-enterprises represent 32% of all SME survey; - Small businesses represent 46%; - Medium-sized enterprises represent only 22%. This classification was made according to the number of employees declared in the questionnaire, namely: 1-9 employees for micro, 10- 49 employees for small and 50-249 employees for medium-sized enterprises (figure no. 3):
Figure no. 3: Sample according to size of young SMEs
Regarding the legal form, 68% of surveyed companies are limited liability companies (SRL), 32% are joint stock companies (SA). It can be said that the legal form of a limited liability company is preferred by young leaders, being also the most comfortable for them, because it is more flexible than other forms of organization (figure no. 4):
Figure no. 4: Sample according to legal form of young SMEs
Based on their activity, the structure of the investigated companies is the following: 19% of companies are operating in services, 24% in retail, 10 % in tourism, 14% are operating in industry, 5% are active in agriculture, the rest in construction (14%)and transportation (14%). We have considered the main activity, and many of the companies surveyed include more fields (figure no. 5):
315

Annals of the „Constantin Brâncuşi” University of Târgu Jiu, Economy Series, Issue 3/2016
„ACADEMICA BRÂNCUŞI” PUBLISHER, ISSN 2344 – 3685/ISSN-L 1844 - 7007
Figure no. 5: Sample according to main activity of young SMEs
4. Results A. Emotional potential of young Romanian leaders. The first part of the research targeted the emotional potential of young leaders. On the question related to the importance of capability called character, 56% of respondents said that it characterizes them to the greatest extent, while 25% of respondents gave full points to self-esteem, 10% gave importance to adaptability, and 9 % felt that stress tolerance characterizes them the most (figure no. 6):
Figure no. 6: Emotional Potential of Romanian young leaders
B. The second category of potential that we analyzed was represented by the social potential of young Romanian leaders. This dimension which includes outdoor-oriented skills contains the following capabilities: flexibility, empathy, charisma, credibility and authenticity. As a result, respondents gave the following answers: 50% gave importance to empathy, 15% to credibility, 14%to flexibility, 11% to authenticity and 10% to charisma (figure no. 7):
316

Annals of the „Constantin Brâncuşi” University of Târgu Jiu, Economy Series, Issue 3/2016
„ACADEMICA BRÂNCUŞI” PUBLISHER, ISSN 2344 – 3685/ISSN-L 1844 - 7007
Figure no. 7: Social Potential of Romanian young leaders
C. Regarding the managerial potential of young Romanian leaders, 55% of the respondents gave the highest score to the leadership style, 16% to creativity, 7% focused on the appreciative capacity and 22% of the respondents considered vision to be the most important (figure no.8):
Figure no. 8: Managerial Potential of Romanian young leaders
D. The cognitive potential reflects the ability of intellectual analytical and rational order and includes the following capabilities: communication, mental agility, perseverance, inspiration, concentration and memory. Hence: 40% of the respondents put a maximum emphasis on communication, 16% on perseverance, 12% gave importance to mental agility, 12% to inspiration, 12% give importance to memory and only 8%were focused on concentration (figure no. 9):
317

Annals of the „Constantin Brâncuşi” University of Târgu Jiu, Economy Series, Issue 3/2016
„ACADEMICA BRÂNCUŞI” PUBLISHER, ISSN 2344 – 3685/ISSN-L 1844 - 7007
Figure no.9: Cognitive Potential of Romanian young leaders
E. For behavioral potential of young Romanian leaders we analyzed the following capabilities: confidence in
people, optimism, courage, and capacity to generate respect and capacity to be proactive. A big percentage of the evaluated young leaders (34%) gave importance to courage, 24% gave importance to the capacity to be proactive, optimism was chosen by 17%, 13% chose the capacity to generate respect and 12% chose confidence in people (figure no. 10):
Figure no. 10: Behavioral Potential of Romanian young leaders
5. Conclusions The survey allowed us to identify some key capabilities of Romanian young leaders:
§ Young leaders like to take full responsibility regardless of context; § They are able to detect social networks and correctly interpret the power relations within the organization in
which they operate; § They are people who always have a strong self-confidence; § Under stressful conditions they manage to remain calm and to keep control; § They are flexible, accept change as an opportunity;
We can say that Romanian young leaders are able to create stronger interpersonal relationships, they motivate themselves and motivate easily subordinates, they adjust to change, cooperate more easily, are at peace with themselves, create resonance and are regarded with trust by subordinates (Lobonea, 2015). Besides the fact that they must automatically identify what people around them feel, they are able to imagine very well how that person should feel even if they have never been exactly through the same situation.
318

Annals of the „Constantin Brâncuşi” University of Târgu Jiu, Economy Series, Issue 3/2016
„ACADEMICA BRÂNCUŞI” PUBLISHER, ISSN 2344 – 3685/ISSN-L 1844 - 7007
§ Education and educational institutions have positively influenced their career; § A democratic leader is someone who can work with people with particular focus on: the importance of feed-
back; employee support initiatives; staff contributions to the organization's performance; § The young Romanian leaders have the ability to see how the future evolves from the present; they have the
capacity to find a way to make the vision be seen, implemented and increased by others. § Accept uncertainty as something natural in business, they have an appetite for risk, see more opportunities in
difficulties. For them, competition is a real challenge. § The ability of young leaders to be proactive helps to intuit and prevent problems before they occur (24% of
respondents gave importance to this capability).We believe that what stops the young Romanian leaders and others from having their own anticipatory strategies and become themselves trendsetters, is the economic environment as the Romanian one, characterized by legal changes, inflation, price fluctuations in raw materials, equipment and transport, low bank rates that make it difficult to stay in business. It’s hard for young Romanian leaders to be leaders of market, as long as they are still in a learning phase. Today, the Romanian economy adopts methods and strategies brought by international companies in all the areas: banking, legal, real estate etc. To become a leader you must have a solid base and this solid base must be built now. All you need is patience, because young leaders have everything they need to become proactive in the future. It takes time until young Romanian leaders will have their own strategies and become trendsetters themselves.
§ Unfortunately the Romania market suffers from the absence of a reliable capital of trust (12% of respondents said they trust others). We believe that in those 25 years since the collapse of communism a moral value was lost in the Romanian society: trust. Trust between people. In business, for example, you need some time to make sure your potential partners are men of confidence and proof, to demonstrate, in return, that you can be trusted. In Romania businesses have always run into uncertainties, suspicions and fear. Confidence is gained through competence and professionalism. Trust is communication. Trust is a resource for prosperity. Trust is hope.
§ In our opinion, leadership in Romanian companies is not necessarily dependent on the age of the leaders. We can say that some leaders have a lot of enthusiasm, a lot of desire to learn new things. A top manager of a company needs several years to obtain good results and we believe that this is a great challenge for young leaders: to remain captivated in a process of knowledge.
6. References
[1] Astroth, K. A., Brown, D., Poore, J., &Timm, D. (2002), Avenues to adulthood or avenues to civic anemia.
CYD Anthology 2002. Sudbury, MA: Institute for Just Communities; [2] Bailesteanu G., Burz, R. (2008), The leader, Mirton Press, Timisoara, p. 24-25; [3] Carnegie Council on Adolescent Development. (1989), Turning points: Preparing American youth for the 21st
century. New York, N.Y.: Carnegie Corporation of New York; [4] Hemphill, J. K., & Coons, A. E. (1957), Development of the leader behavior description questionnaire. In RM
Stodgill and AE Coons (Eds.), "Leader behavior: Its description and measurement". Columbus, Ohio: Bureau of Business Research, Ohio State University, p. 6-38;
[5] Lobonea (Oltean), A., O., (2014), Vision, requirement for a successful leader, Annals of the ”Constantin Brâncuși”, University of Târgu-Jiu, Economy Series, Issue 6/2014, p. 530.
[6] Lobonea (Oltean), A.,O.,(2015), Empathy – a capability of a successful leader, Annals of "Eftimie Murgu". Volume 2015, Fascicule II. Economic studies;
[7] NCWD/Youth 1-877-871-0744 (toll free) www.ncwd-youth.info,[email protected]. [8] Nicolescu, O., Verboncu, I. (2006), Fundamentals of management organizations, Tribuna Economica Press,
Bucharest; [9] Pittman, K. & Cahill, M. (1991), A new vision: Promoting youth development. Testimony of Karen Johnson
Pittman before the US House of Representatives Select Committee on Children, Youth, and Families. Washington, DC: Center for Youth Development and Policy Research, Academy for Educational Development;
[10] Scales, P. &Leffert, N. (1999), Developmental assets: A synthesis of the scientific research on adolescentdevelopment. Minneapolis: Search Institute;
[11] Shaw, J. B., Erickson, A., & Harvey, M. (2011), A method for measuring destructive leadership and identifying types of destructive leaders in organizations. The Leadership Quarterly, 22, p.575-590;
[12] Wehmeyer, M. L., Agran, M., & Hughes, C. (1998), Teaching self-determination to students with disabilities: Basic skills for successful transition.Baltimore, MD: Paul H. Brookes Publishing Co.
319
Related Documents


![Constantin Brancusi - Guggenheim...Constantin Brancusi b. 1876, Hobitza, Romania d. 1957, Paris Little French Girl (The First Step [III]) (La jeune fille française) ca. 1914–18](https://static.cupdf.com/doc/110x72/613928a0a4cdb41a985b86da/constantin-brancusi-guggenheim-constantin-brancusi-b-1876-hobitza-romania.jpg)