The Forest Conversion in Thap-lan National Park after World Heritage Inscription THAMMANOON TEMCHAI 1 SONGTAM SUKSAWANG 2 1 Chief, National Park and Protected Area Innovation Center. Phetchaburi Province 2 Expert for Forest and Wildlife conservation, DNP

Welcome message from author
This document is posted to help you gain knowledge. Please leave a comment to let me know what you think about it! Share it to your friends and learn new things together.
Transcript

The Forest Conversion in Thap-lan
National Park after World Heritage
Inscription
THAMMANOON TEMCHAI 1 SONGTAM SUKSAWANG2
1 Chief, National Park and Protected Area Innovation Center. Phetchaburi Province2 Expert for Forest and Wildlife conservation, DNP

DPKY World Heritage site
Khaoyai NP.
Thap Lan NP.
Pang Sida NP.
Ta phraya NP.
Dong Yai WS.

The Objectives
Study on The Forest Conversion in Thap-lan National Park after World Heritage Inscription (2006 – 2014)
Mapping the risk area Create new forest type map of the
PA in Dong PhayaYen – KhaoyaiForest Complex

Method
Informed by LANDSAT satellite imagery
Classification of plant Community and
other Land use patterns were analysed
by comparing the imagery during 2006 and 2013.


The Results
Forest types in Thap-lan NPLand use changeRisk areas

ดบิแล้งต ่า (Lower dry evergreen f.)
ดบิแล้ง (Dry evergreen f.)
ดบิแล้งผสมไผ่ (Df. mixed with bamboo)
ดบิชืน้ (Moist evergreen f.)

ป่าเตง็รัง (Dry dipterocarp f.)
ป่าละเมาะ (Scrub f.)ป่าฟ้ืนสภาพ (Secondary f.)
เบญจพรรณ (Mixed deciduous f.)
พืน้ที่เกษตรกรรม(Agricultural area)ทุ่งหญ้า (Range land)
สวนยูคาลิปตสั (Eucalyptus plantation)

Area of focus
for this presentation

Land use in Thap-Lan NP. In 2014

Land Use Area (Ha) Area (Rai) Percent cover
Moist evergreen forest 2,511.00 15,693.75 1.11Dry evergreen forest 92,100.33 575,627.06 40.55
Lowland dry evergreen forest 41,403.78 258,773.63 18.23
Dry evergreen forest mixed with bamboo 15,176.43 94,852.69 6.68Mixed deciduous forest 6,365.07 39,781.69 2.80Dry dipterocarp forest 9,405.99 58,787.44 4.14Secondary forest 6,902.82 43,142.63 3.04Scrub forest 846.99 5,293.69 0.37Forest plantation 681.21 4,257.56 0.30

Land Use Area (Ha) Area (Rai)Percent cover
Eucalyptus plantation 3,043.26 19,020.38 1.34
Range land 4,300.65 26,879.06 1.89
Old clearing area 140.04 875.25 0.06
Open area 87.39 546.19 0.04
Road area 13.41 83.81 0.01
Water body 1,739.52 10,872.00 0.77
Agrcultural area 38,300.58 239,378.63 16.86
Paddy field 3,408.03 21,300.19 1.50
Urban area 672.21 4,201.31 0.30
Government housing 14.58 91.13 0.01
Total 227,113.29 1,419,458.06 100.00

2014
2006

Wang Nam Khiew Subdistrict
2006 2014

Land Use
Area (Ha) Percent cover Percent
Change2006 2014 2006 2014
Moist evergreen forest 2,511.63
2,511.00 1.106 1.106 0.000
Dry evergreen forest 91,555.02
92,100.33 40.312 40.553 -0.240
Lowland dry evergreen forest 41,123.79
41,403.78 18.107 18.230 -0.123Dry evergreen forest mixed with
bamboo 15,195.78
15,176.43 6.691 6.682 0.009
Mixed deciduous forest 6,671.52
6,365.07 2.938 2.803 0.135
Dry dipterocarp forest 9,359.10
9,405.99 4.121 4.142 -0.021
Secondary forest 5,749.92
6,902.82 2.532 3.039 -0.508
Scrub forest 1,942.02
846.99 0.855 0.373 0.482
Forest plantation 621.45
681.21 0.274 0.300 -0.026

Land UseArea (Ha)
Percent
coverPercent
Change2006 2014 2006 2014
Eucalyptus plantation 5,512.05 3,043.26 2.427 1.340 1.087
Range land 3,159.81 4,300.65 1.391 1.894 -0.502
Old clearing area 140.04 140.04 0.062 0.062 0.000
Open area 87.39 87.39 0.038 0.038 0.000
Road area 13.41 13.41 0.006 0.006 0.000
Water body 1,706.22 1,739.52 0.751 0.766 -0.015
Agrcultural area 37,673.82
38,300.58 16.588 16.864 -0.276
Paddy field 3,408.03 3,408.03 1.501 1.501 0.000
Urban area 672.21 672.21 0.296 0.296 0.000
Government housing 10.08 14.58 0.004 0.006 -0.002
Total 227,113.29
227,113.29 100.000 100.000


• Positive trend 3,275.01 Ha (20,468.81 Rai)
• Negative trend1,781.19 Ha (11,132.44 Rai)

Thap – Lan Np
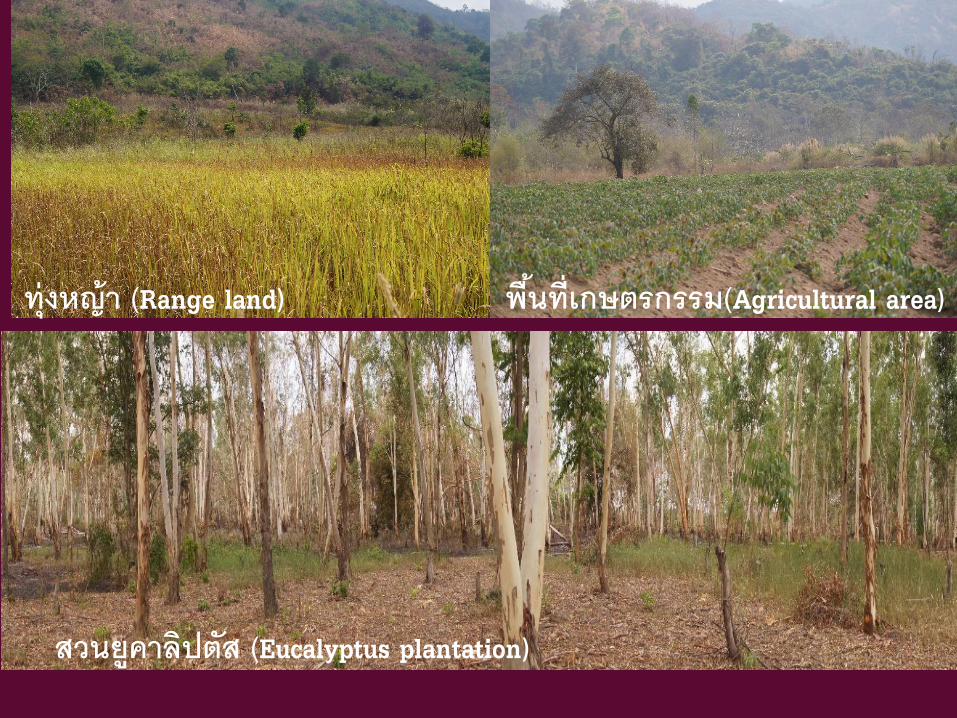
From Past to Future- forecasts

2014
2006

2019
2024

2029
2034

2014 (ปจัจุบนั)
2034 (อกี 20 ปีข้างหน้า)

2006 2014
Wang Nam Khiew subdistrict

20342029
20242019

2006
2014
Lam Plai Mas Reservoir

2024
2019

2034
2029

0
10000
20000
30000
40000
50000
60000
70000
80000
90000
100000
Mo
ist
eve
rgre
en f
.
Dry
eve
rgre
en f
.
Low
er d
ry e
verg
reen
f.
Dry
eve
rgre
en w
ith
bam
bo
o
Mix
ed
dec
idu
ou
s f.
Dry
dip
tero
carp
f.
Seco
nd
ary
f.
Scru
b f
.
Fore
st p
lan
tati
on
Euca
lyp
tus
pla
nta
tio
n
Ran
ge la
nd
Go
vern
men
t h
ou
sin
g
Old
cle
arin
g ar
ea
Op
en a
rea
Ro
ad a
rea
Wat
er
bo
dy
Agr
icu
ltu
re a
rea
Pad
dy
fiel
d
Urb
an
Are
a (H
a)Forecasts to Thap Lan NP landuse trend

0
10000
20000
30000
40000
50000
60000
70000
80000
90000
100000
Mo
ist
eve
rgre
en
f.
Dry
ev
erg
ree
n f
.
Low
er
dry
eve
rgre
en
f.
Dry
ev
erg
ree
n w
ith
ba
mb
oo
Mix
ed
de
cid
uo
us
f.
Dry
dip
tero
carp
f.
Se
con
da
ry f
.
Scr
ub
f.
Fo
rest
pla
nta
tio
n
Eu
caly
ptu
s p
lan
tati
on
Ra
ng
e la
nd
Go
ve
rnm
en
t h
ou
sin
g
Old
cle
ari
ng
are
a
Op
en
are
a
Ro
ad
are
a
Wa
ter
bo
dy
Ag
ricu
ltu
re a
rea
Pa
dd
y f
ield
Urb
an
Are
a (
Ha
)Forecasts to Thap Lan NP landuse trend
2510.6
2510.7
2510.8
2510.9
2511
2511.1
2511.2
2511.3
2511.4
2511.5
2511.6
2511.7
Are
a (
Ha
)
Moist evergreen f.

0
10000
20000
30000
40000
50000
60000
70000
80000
90000
100000
Mo
ist
eve
rgre
en
f.
Dry
ev
erg
ree
n f
.
Low
er
dry
eve
rgre
en
f.
Dry
ev
erg
ree
n w
ith
ba
mb
oo
Mix
ed
de
cid
uo
us
f.
Dry
dip
tero
carp
f.
Se
con
da
ry f
.
Scr
ub
f.
Fo
rest
pla
nta
tio
n
Eu
caly
ptu
s p
lan
tati
on
Ra
ng
e la
nd
Go
ve
rnm
en
t h
ou
sin
g
Old
cle
ari
ng
are
a
Op
en
are
a
Ro
ad
are
a
Wa
ter
bo
dy
Ag
ricu
ltu
re a
rea
Pa
dd
y f
ield
Urb
an
Are
a (
Ha
)Forecasts to Thap Lan NP landuse trend
40800
40900
41000
41100
41200
41300
41400
41500
41600
41700
41800
Are
a (
Ha
)
Lower dry evergreen f.

0
10000
20000
30000
40000
50000
60000
70000
80000
90000
100000
Mo
ist
eve
rgre
en
f.
Dry
ev
erg
ree
n f
.
Low
er
dry
eve
rgre
en
f.
Dry
ev
erg
ree
n w
ith
ba
mb
oo
Mix
ed
de
cid
uo
us
f.
Dry
dip
tero
carp
f.
Se
con
da
ry f
.
Scr
ub
f.
Fo
rest
pla
nta
tio
n
Eu
caly
ptu
s p
lan
tati
on
Ra
ng
e la
nd
Go
ve
rnm
en
t h
ou
sin
g
Old
cle
ari
ng
are
a
Op
en
are
a
Ro
ad
are
a
Wa
ter
bo
dy
Ag
ricu
ltu
re a
rea
Pa
dd
y f
ield
Urb
an
Are
a (
Ha
)Forecasts to Thap Lan NP landuse trend
15080
15100
15120
15140
15160
15180
15200
15220
Are
a (
Ha
)
Dry evergreen with bamboo

0
10000
20000
30000
40000
50000
60000
70000
80000
90000
100000
Mo
ist
eve
rgre
en
f.
Dry
ev
erg
ree
n f
.
Low
er
dry
eve
rgre
en
f.
Dry
ev
erg
ree
n w
ith
ba
mb
oo
Mix
ed
de
cid
uo
us
f.
Dry
dip
tero
carp
f.
Se
con
da
ry f
.
Scr
ub
f.
Fo
rest
pla
nta
tio
n
Eu
caly
ptu
s p
lan
tati
on
Ra
ng
e la
nd
Go
ve
rnm
en
t h
ou
sin
g
Old
cle
ari
ng
are
a
Op
en
are
a
Ro
ad
are
a
Wa
ter
bo
dy
Ag
ricu
ltu
re a
rea
Pa
dd
y f
ield
Urb
an
Are
a (
Ha
)Forecasts to Thap Lan NP landuse trend
5200
5400
5600
5800
6000
6200
6400
6600
6800
Are
a (
Ha
)
Mixed deciduous f.

0
10000
20000
30000
40000
50000
60000
70000
80000
90000
100000
Mo
ist
eve
rgre
en
f.
Dry
ev
erg
ree
n f
.
Low
er
dry
eve
rgre
en
f.
Dry
ev
erg
ree
n w
ith
ba
mb
oo
Mix
ed
de
cid
uo
us
f.
Dry
dip
tero
carp
f.
Se
con
da
ry f
.
Scr
ub
f.
Fo
rest
pla
nta
tio
n
Eu
caly
ptu
s p
lan
tati
on
Ra
ng
e la
nd
Go
ve
rnm
en
t h
ou
sin
g
Old
cle
ari
ng
are
a
Op
en
are
a
Ro
ad
are
a
Wa
ter
bo
dy
Ag
ricu
ltu
re a
rea
Pa
dd
y f
ield
Urb
an
Are
a (
Ha
)Forecasts to Thap Lan NP landuse trend
9250
9300
9350
9400
9450
9500
9550
Are
a (
Ha
)
Dry dipterocarp f.

0
10000
20000
30000
40000
50000
60000
70000
80000
90000
100000
Mo
ist
eve
rgre
en
f.
Dry
ev
erg
ree
n f
.
Low
er
dry
eve
rgre
en
f.
Dry
ev
erg
ree
n w
ith
ba
mb
oo
Mix
ed
de
cid
uo
us
f.
Dry
dip
tero
carp
f.
Se
con
da
ry f
.
Scr
ub
f.
Fo
rest
pla
nta
tio
n
Eu
caly
ptu
s p
lan
tati
on
Ra
ng
e la
nd
Go
ve
rnm
en
t h
ou
sin
g
Old
cle
ari
ng
are
a
Op
en
are
a
Ro
ad
are
a
Wa
ter
bo
dy
Ag
ricu
ltu
re a
rea
Pa
dd
y f
ield
Urb
an
Are
a (
Ha
)Forecasts to Thap Lan NP landuse trend
0
1000
2000
3000
4000
5000
6000
7000
8000
9000
Are
a (
Ha
)
Secondary f.

0
10000
20000
30000
40000
50000
60000
70000
80000
90000
100000
Mo
ist
eve
rgre
en
f.
Dry
ev
erg
ree
n f
.
Low
er
dry
eve
rgre
en
f.
Dry
ev
erg
ree
n w
ith
ba
mb
oo
Mix
ed
de
cid
uo
us
f.
Dry
dip
tero
carp
f.
Se
con
da
ry f
.
Scr
ub
f.
Fo
rest
pla
nta
tio
n
Eu
caly
ptu
s p
lan
tati
on
Ra
ng
e la
nd
Go
ve
rnm
en
t h
ou
sin
g
Old
cle
ari
ng
are
a
Op
en
are
a
Ro
ad
are
a
Wa
ter
bo
dy
Ag
ricu
ltu
re a
rea
Pa
dd
y f
ield
Urb
an
Are
a (
Ha
)Forecasts to Thap Lan NP landuse trend
0
500
1000
1500
2000
2500
Are
a (
Ha
)
Scrub f.

0
10000
20000
30000
40000
50000
60000
70000
80000
90000
100000
Mo
ist
eve
rgre
en
f.
Dry
ev
erg
ree
n f
.
Low
er
dry
eve
rgre
en
f.
Dry
ev
erg
ree
n w
ith
ba
mb
oo
Mix
ed
de
cid
uo
us
f.
Dry
dip
tero
carp
f.
Se
con
da
ry f
.
Scr
ub
f.
Fo
rest
pla
nta
tio
n
Eu
caly
ptu
s p
lan
tati
on
Ra
ng
e la
nd
Go
ve
rnm
en
t h
ou
sin
g
Old
cle
ari
ng
are
a
Op
en
are
a
Ro
ad
are
a
Wa
ter
bo
dy
Ag
ricu
ltu
re a
rea
Pa
dd
y f
ield
Urb
an
Are
a (
Ha
)Forecasts to Thap Lan NP landuse trend
560
580
600
620
640
660
680
700
720
740
760
Are
a (
Ha
)
Forest plantation

0
10000
20000
30000
40000
50000
60000
70000
80000
90000
100000
Mo
ist
eve
rgre
en
f.
Dry
ev
erg
ree
n f
.
Low
er
dry
eve
rgre
en
f.
Dry
ev
erg
ree
n w
ith
ba
mb
oo
Mix
ed
de
cid
uo
us
f.
Dry
dip
tero
carp
f.
Se
con
da
ry f
.
Scr
ub
f.
Fo
rest
pla
nta
tio
n
Eu
caly
ptu
s p
lan
tati
on
Ra
ng
e la
nd
Go
ve
rnm
en
t h
ou
sin
g
Old
cle
ari
ng
are
a
Op
en
are
a
Ro
ad
are
a
Wa
ter
bo
dy
Ag
ricu
ltu
re a
rea
Pa
dd
y f
ield
Urb
an
Are
a (
Ha
)Forecasts to Thap Lan NP landuse trend
2500
2600
2700
2800
2900
3000
3100
3200
Are
a (
Ha
)
Eucalyptus plantation

0
10000
20000
30000
40000
50000
60000
70000
80000
90000
100000
Mo
ist
eve
rgre
en
f.
Dry
ev
erg
ree
n f
.
Low
er
dry
eve
rgre
en
f.
Dry
ev
erg
ree
n w
ith
ba
mb
oo
Mix
ed
de
cid
uo
us
f.
Dry
dip
tero
carp
f.
Se
con
da
ry f
.
Scr
ub
f.
Fo
rest
pla
nta
tio
n
Eu
caly
ptu
s p
lan
tati
on
Ra
ng
e la
nd
Go
ve
rnm
en
t h
ou
sin
g
Old
cle
ari
ng
are
a
Op
en
are
a
Ro
ad
are
a
Wa
ter
bo
dy
Ag
ricu
ltu
re a
rea
Pa
dd
y f
ield
Urb
an
Are
a (
Ha
)Forecasts to Thap Lan NP landuse trend
0
1000
2000
3000
4000
5000
6000
Are
a (
Ha
)
Range land

0
10000
20000
30000
40000
50000
60000
70000
80000
90000
100000
Mo
ist
eve
rgre
en
f.
Dry
ev
erg
ree
n f
.
Low
er
dry
eve
rgre
en
f.
Dry
ev
erg
ree
n w
ith
ba
mb
oo
Mix
ed
de
cid
uo
us
f.
Dry
dip
tero
carp
f.
Se
con
da
ry f
.
Scr
ub
f.
Fo
rest
pla
nta
tio
n
Eu
caly
ptu
s p
lan
tati
on
Ra
ng
e la
nd
Go
ve
rnm
en
t h
ou
sin
g
Old
cle
ari
ng
are
a
Op
en
are
a
Ro
ad
are
a
Wa
ter
bo
dy
Ag
ricu
ltu
re a
rea
Pa
dd
y f
ield
Urb
an
Are
a (
Ha
)Forecasts to Thap Lan NP landuse trend
0
2
4
6
8
10
12
14
16
Are
a (
Ha
)
Government housing

0
10000
20000
30000
40000
50000
60000
70000
80000
90000
100000
Mo
ist
eve
rgre
en
f.
Dry
ev
erg
ree
n f
.
Low
er
dry
eve
rgre
en
f.
Dry
ev
erg
ree
n w
ith
ba
mb
oo
Mix
ed
de
cid
uo
us
f.
Dry
dip
tero
carp
f.
Se
con
da
ry f
.
Scr
ub
f.
Fo
rest
pla
nta
tio
n
Eu
caly
ptu
s p
lan
tati
on
Ra
ng
e la
nd
Go
ve
rnm
en
t h
ou
sin
g
Old
cle
ari
ng
are
a
Op
en
are
a
Ro
ad
are
a
Wa
ter
bo
dy
Ag
ricu
ltu
re a
rea
Pa
dd
y f
ield
Urb
an
Are
a (
Ha
)Forecasts to Thap Lan NP landuse trend
140.04
140.04
140.04
Are
a (
Ha
)
Old clearing area

0
10000
20000
30000
40000
50000
60000
70000
80000
90000
100000
Mo
ist
eve
rgre
en
f.
Dry
ev
erg
ree
n f
.
Low
er
dry
eve
rgre
en
f.
Dry
ev
erg
ree
n w
ith
ba
mb
oo
Mix
ed
de
cid
uo
us
f.
Dry
dip
tero
carp
f.
Se
con
da
ry f
.
Scr
ub
f.
Fo
rest
pla
nta
tio
n
Eu
caly
ptu
s p
lan
tati
on
Ra
ng
e la
nd
Go
ve
rnm
en
t h
ou
sin
g
Old
cle
ari
ng
are
a
Op
en
are
a
Ro
ad
are
a
Wa
ter
bo
dy
Ag
ricu
ltu
re a
rea
Pa
dd
y f
ield
Urb
an
Are
a (
Ha
)Forecasts to Thap Lan NP landuse trend
87.39
87.39
Are
a (
Ha
)
Open area

0
10000
20000
30000
40000
50000
60000
70000
80000
90000
100000
Mo
ist
eve
rgre
en
f.
Dry
ev
erg
ree
n f
.
Low
er
dry
eve
rgre
en
f.
Dry
ev
erg
ree
n w
ith
ba
mb
oo
Mix
ed
de
cid
uo
us
f.
Dry
dip
tero
carp
f.
Se
con
da
ry f
.
Scr
ub
f.
Fo
rest
pla
nta
tio
n
Eu
caly
ptu
s p
lan
tati
on
Ra
ng
e la
nd
Go
ve
rnm
en
t h
ou
sin
g
Old
cle
ari
ng
are
a
Op
en
are
a
Ro
ad
are
a
Wa
ter
bo
dy
Ag
ricu
ltu
re a
rea
Pa
dd
y f
ield
Urb
an
Are
a (
Ha
)Forecasts to Thap Lan NP landuse trend
13.404636
13.432797
Are
a (
Ha
)
Road area

0
10000
20000
30000
40000
50000
60000
70000
80000
90000
100000
Mo
ist
eve
rgre
en
f.
Dry
ev
erg
ree
n f
.
Low
er
dry
eve
rgre
en
f.
Dry
ev
erg
ree
n w
ith
ba
mb
oo
Mix
ed
de
cid
uo
us
f.
Dry
dip
tero
carp
f.
Se
con
da
ry f
.
Scr
ub
f.
Fo
rest
pla
nta
tio
n
Eu
caly
ptu
s p
lan
tati
on
Ra
ng
e la
nd
Go
ve
rnm
en
t h
ou
sin
g
Old
cle
ari
ng
are
a
Op
en
are
a
Ro
ad
are
a
Wa
ter
bo
dy
Ag
ricu
ltu
re a
rea
Pa
dd
y f
ield
Urb
an
Are
a (
Ha
)Forecasts to Thap Lan NP landuse trend
1670
1680
1690
1700
1710
1720
1730
1740
1750
1760
1770
1780
Are
a (
Ha
)
Water body

0
10000
20000
30000
40000
50000
60000
70000
80000
90000
100000
Mo
ist
eve
rgre
en
f.
Dry
ev
erg
ree
n f
.
Low
er
dry
eve
rgre
en
f.
Dry
ev
erg
ree
n w
ith
ba
mb
oo
Mix
ed
de
cid
uo
us
f.
Dry
dip
tero
carp
f.
Se
con
da
ry f
.
Scr
ub
f.
Fo
rest
pla
nta
tio
n
Eu
caly
ptu
s p
lan
tati
on
Ra
ng
e la
nd
Go
ve
rnm
en
t h
ou
sin
g
Old
cle
ari
ng
are
a
Op
en
are
a
Ro
ad
are
a
Wa
ter
bo
dy
Ag
ricu
ltu
re a
rea
Pa
dd
y f
ield
Urb
an
Are
a (
Ha
)Forecasts to Thap Lan NP landuse trend
36500
37000
37500
38000
38500
39000
39500
40000
40500
Are
a (
Ha
)
Agriculture area

0
10000
20000
30000
40000
50000
60000
70000
80000
90000
100000
Mo
ist
eve
rgre
en
f.
Dry
ev
erg
ree
n f
.
Low
er
dry
eve
rgre
en
f.
Dry
ev
erg
ree
n w
ith
ba
mb
oo
Mix
ed
de
cid
uo
us
f.
Dry
dip
tero
carp
f.
Se
con
da
ry f
.
Scr
ub
f.
Fo
rest
pla
nta
tio
n
Eu
caly
ptu
s p
lan
tati
on
Ra
ng
e la
nd
Go
ve
rnm
en
t h
ou
sin
g
Old
cle
ari
ng
are
a
Op
en
are
a
Ro
ad
are
a
Wa
ter
bo
dy
Ag
ricu
ltu
re a
rea
Pa
dd
y f
ield
Urb
an
Are
a (
Ha
)Forecasts to Thap Lan NP landuse trend
3408.03
3408.03
Are
a (
Ha
)
Paddy field
0
10000
20000
30000
40000
50000
60000
70000
80000
90000
100000
Mo
ist
eve
rgre
en
f.
Dry
ev
erg
ree
n f
.
Low
er
dry
eve
rgre
en
f.
Dry
ev
erg
ree
n w
ith
ba
mb
oo
Mix
ed
de
cid
uo
us
f.
Dry
dip
tero
carp
f.
Se
con
da
ry f
.
Scr
ub
f.
Fo
rest
pla
nta
tio
n
Eu
caly
ptu
s p
lan
tati
on
Ra
ng
e la
nd
Go
ve
rnm
en
t h
ou
sin
g
Old
cle
ari
ng
are
a
Op
en
are
a
Ro
ad
are
a
Wa
ter
bo
dy
Ag
ricu
ltu
re a
rea
Pa
dd
y f
ield
Urb
an
Are
a (
Ha
)Forecasts to Thap Lan NP landuse trend
0
100
200
300
400
500
600
700
800
Are
a (
Ha
)
Urban

Areas at risk for future land conversion


Conclusion• Comparing forest conversion before and after
inscription as a World Heritage site, the analysis
found that forest conversion trend is positive to Outstanding Universal Value (OUV) of the World
Heritage criteria
• Within the core area, an old clearing site has
been rehabilitated by a forest Plantation Project
and natural succession
• Forest loss has occurred in around the edges and
buffer zone of Thap-lan National Park, but this might not impact the OUV of World Heritage site

Conclusion• Forecasting land use change for the next 20 years
found that future land use change in Thap-lan
National Park might have a small negative impact
on OUV
• The results of this study could be used for land use
planning in order to protect the natural World Heritage site for the long-term

Acknowledgement
Mr.Sarascha Suriyakul Na Ayuthaya
Head of Thap-Lan Np.
Head of Tham-Khang-Kao Non-Hunting Area
Head of Nakhonratchasima National Parks Innovation Center
Clark Lab, Clark University
Ms. Hathairat Nukool and staffs

www.nprcenter.com
Related Documents