...Vous accompagne sur les marchés internationaux TUNISIAN

Welcome message from author
This document is posted to help you gain knowledge. Please leave a comment to let me know what you think about it! Share it to your friends and learn new things together.
Transcript
...Vous accompagne sur les marchés internationaux
T U N I S I A N

INDICATORS5
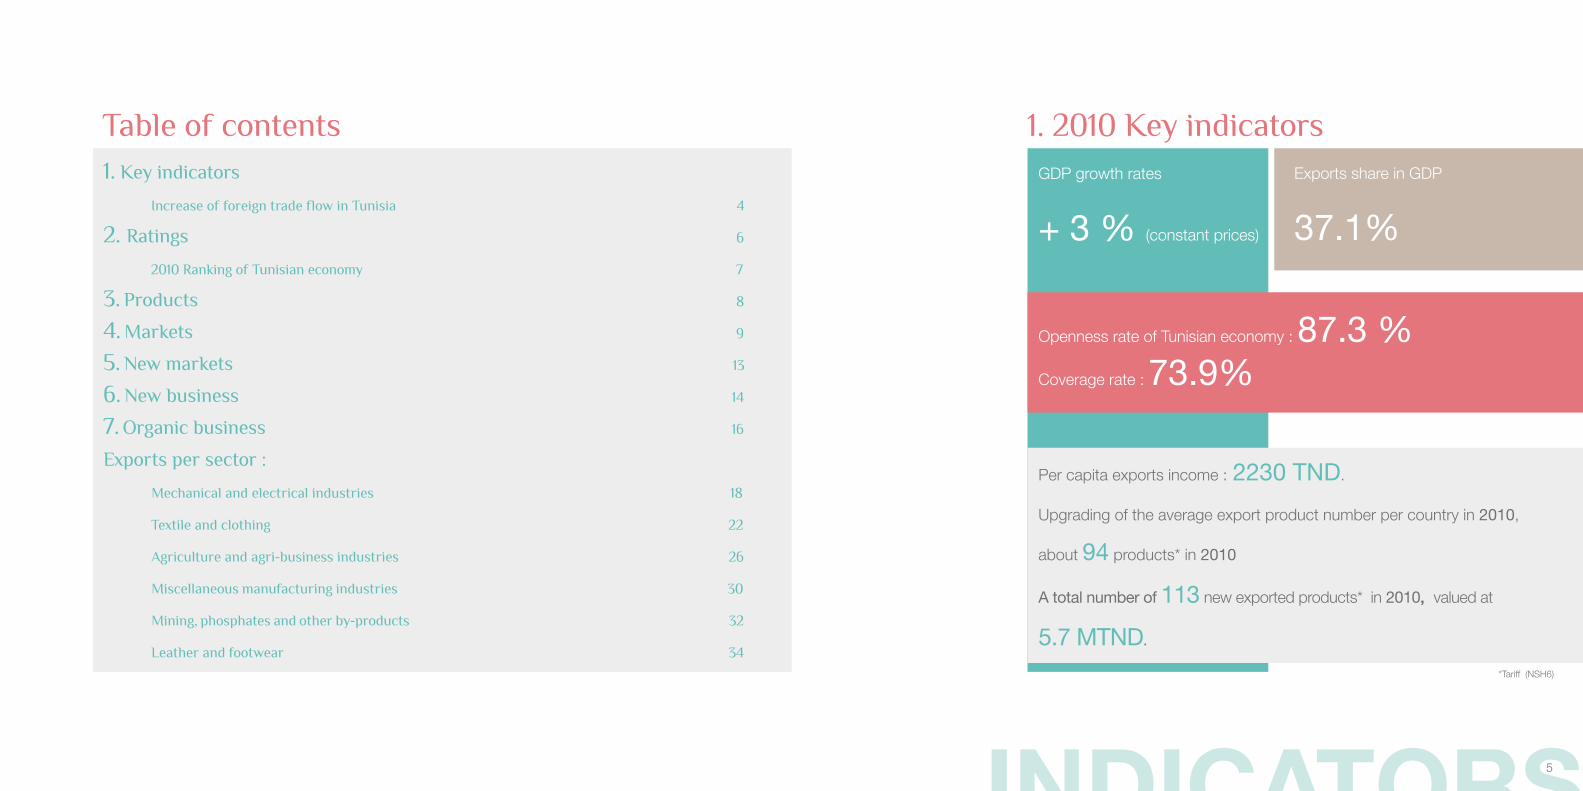
1. 2010 Key indicators
+ 3 % (constant prices)
Per capita exports income : 2230 TND.
Upgrading of the average export product number per country in 2010,
about 94 products* in 2010
A total number of 113 new exported products* in 2010, valued at
5.7 MTND.
Openness rate of Tunisian economy : 87.3 % Coverage rate : 73.9%
Exports share in GDP
37.1%
*Tariff (NSH6)
GDP growth rates
Table of contents1. Key indicators
Increase of foreign trade flow in Tunisia 4
2. Ratings 6
2010 Ranking of Tunisian economy 7
3. Products 8
4. Markets 9
5. New markets 13
6. New business 14
7. Organic business 16
Exports per sector :
Mechanical and electrical industries 18
Textile and clothing 22
Agriculture and agri-business industries 26
Miscellaneous manufacturing industries 30
Mining, phosphates and other by-products 32
Leather and footwear 34
EVOLUTION6 7
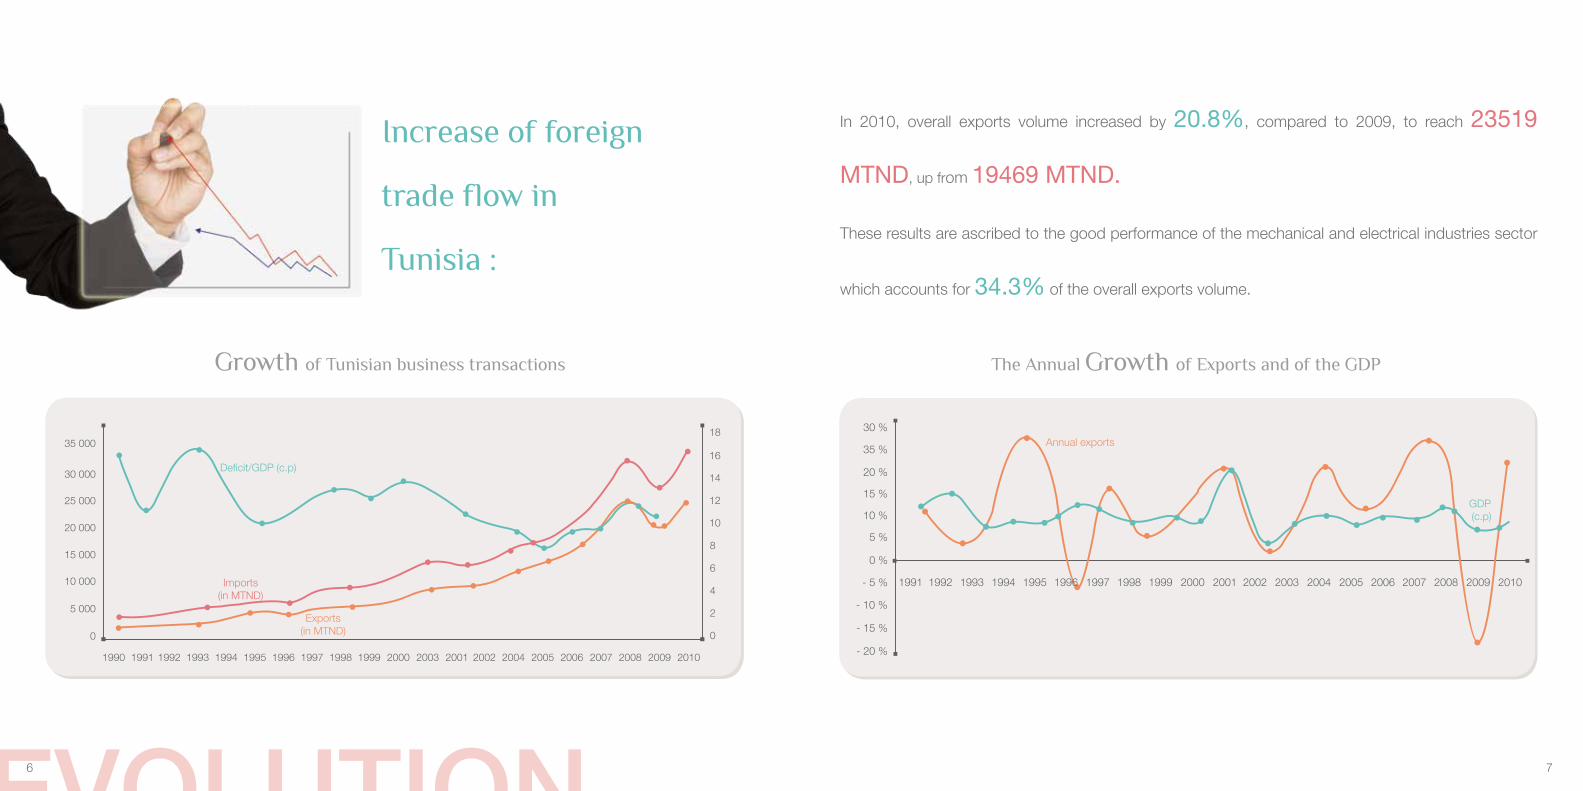
Increase of foreign
trade flow in
Tunisia :
In 2010, overall exports volume increased by 20.8%, compared to 2009, to reach 23519
MTND, up from 19469 MTND.
These results are ascribed to the good performance of the mechanical and electrical industries sector
which accounts for 34.3% of the overall exports volume.
Growth of Tunisian business transactions
Deficit/GDP (c.p)
Imports (in MTND)
Exports (in MTND)
The Annual Growth of Exports and of the GDP
Annual exports
GDP (c.p)
8 9
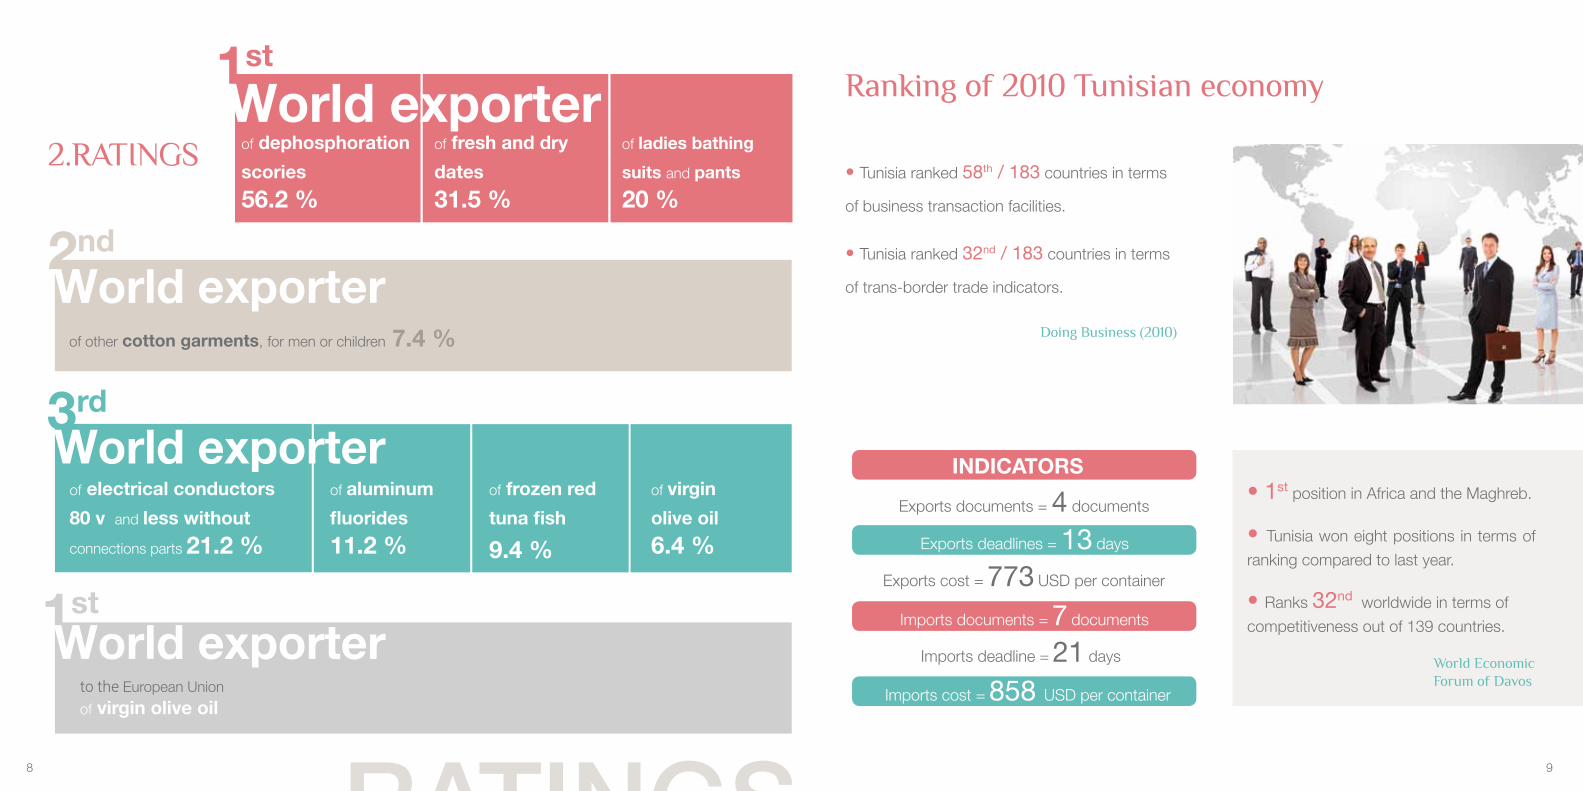
2nd
1stRanking of 2010 Tunisian economy
Doing Business (2010)
RATINGS
INDICATORS
Exports documents = 4 documents
Exports deadlines = 13 days
Exports cost = 773 USD per container
Imports documents = 7 documents
Imports deadline = 21 days
Imports cost = 858 USD per container
2.RATINGS of dephosphoration
scories
56.2 %
of fresh and dry
dates
31.5 %
of ladies bathing
suits and pants
20 %
to the European Union
of virgin olive oil
of electrical conductors
80 v and less without
connections parts 21.2 %
of aluminum
fluorides
11.2 %
of frozen red
tuna fish
9.4 %
of virgin
olive oil
6.4 %
3rd
1st
of other cotton garments, for men or children 7.4 %
• Tunisia ranked 58th / 183 countries in terms
of business transaction facilities.
• Tunisia ranked 32nd / 183 countries in terms
of trans-border trade indicators.
• 1st position in Africa and the Maghreb.
• Tunisia won eight positions in terms of
ranking compared to last year.
• Ranks 32nd worldwide in terms of
competitiveness out of 139 countries.
World Economic Forum of Davos
10 11
Geographical DISTRIBUTION
of trade flow
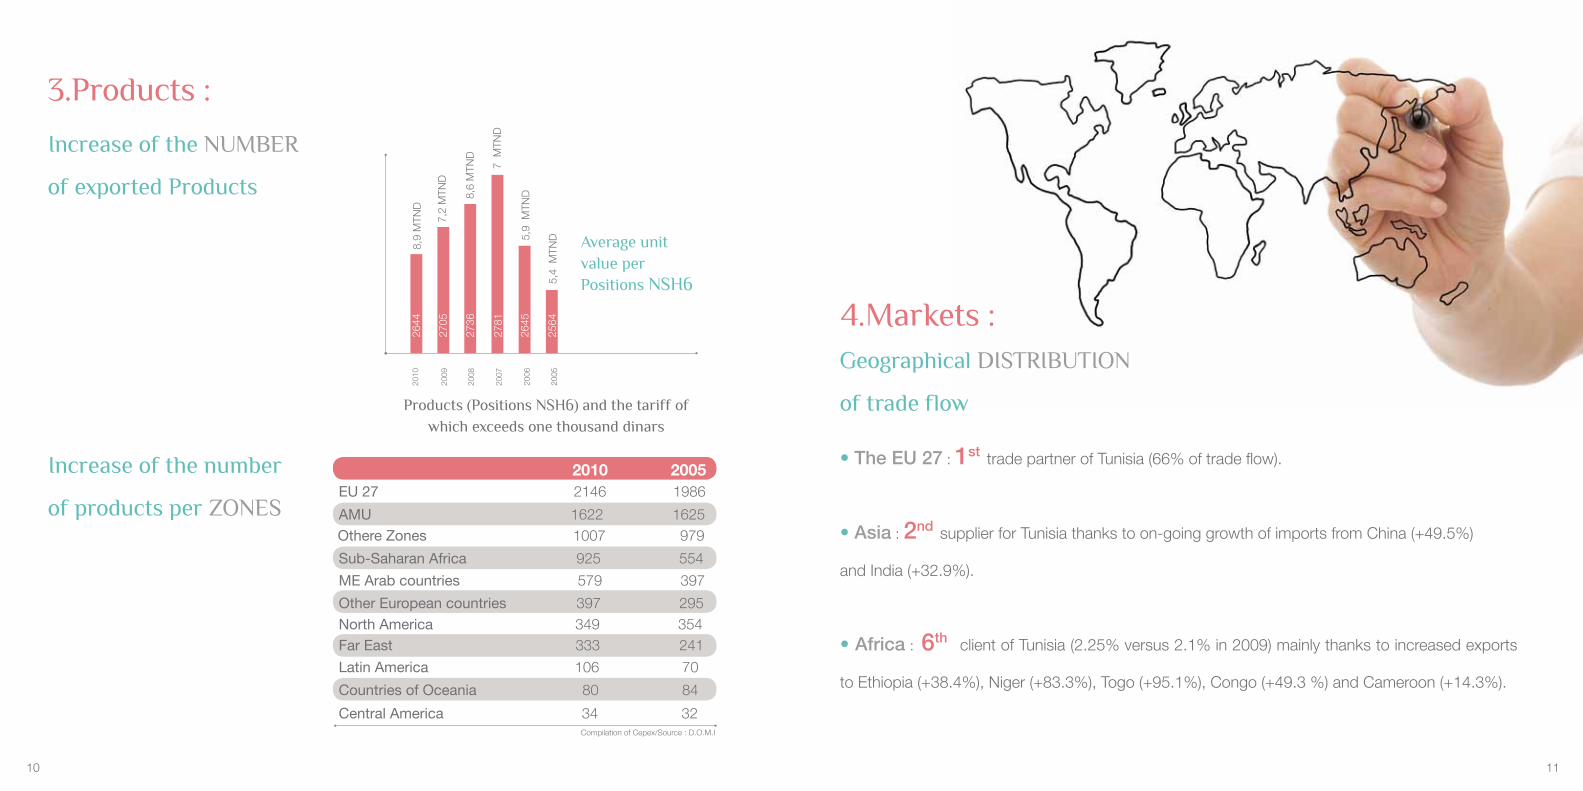
Increase of the number
of products per ZONES
3.Products :
2010
2009
2008
2006
2005
2007
2644
2705
2736
2645
2564
2781
8,9
MTN
D
7,2
MTN
D
8,6
MTN
D
7 M
TND
5,9
MTN
D
5,4
MTN
D
Compilation of Cepex/Source : D.O.M.I
EU 27 2146 1986
Sub-Saharan Africa 925 554
ME Arab countries 579 397
Other European countries 397 295North America 349 354Far East 333 241
Latin America 106 70
Countries of Oceania 80 84
Central America 34 32
Othere Zones 1007 979AMU 1622 1625
2010 2005
4.Markets :
• The EU 27 : 1st trade partner of Tunisia (66% of trade flow).
• Asia : 2nd supplier for Tunisia thanks to on-going growth of imports from China (+49.5%)
and India (+32.9%).
• Africa : 6th client of Tunisia (2.25% versus 2.1% in 2009) mainly thanks to increased exports
to Ethiopia (+38.4%), Niger (+83.3%), Togo (+95.1%), Congo (+49.3 %) and Cameroon (+14.3%).
Increase of the NUMBER
of exported Products
Average unit value per Positions NSH6
Products (Positions NSH6) and the tariff of which exceeds one thousand dinars
IMPORT12 13
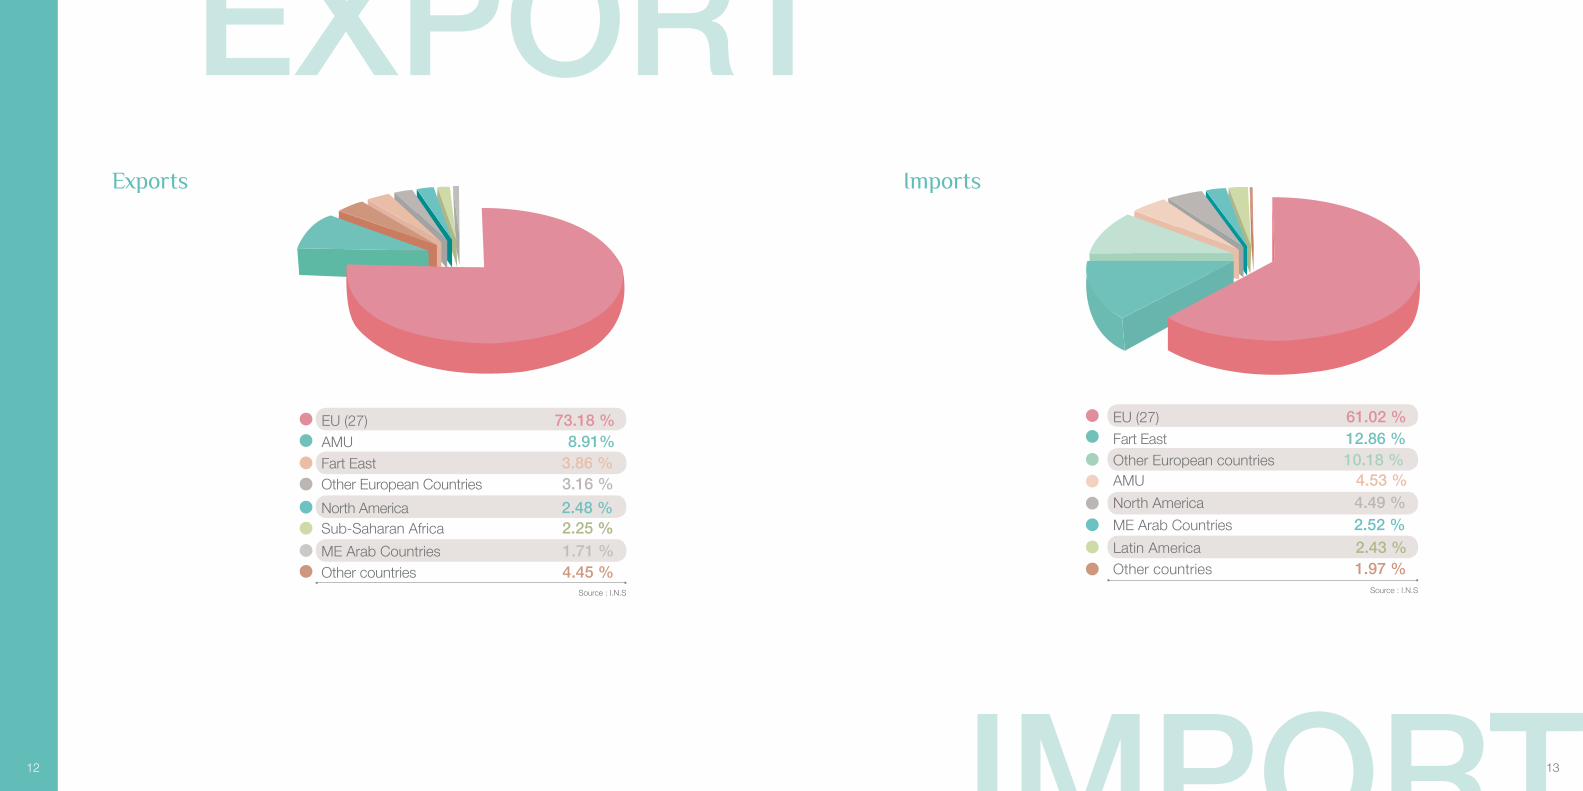
EXPORTExports Imports
EU (27) 73.18 %
Fart East 3.86 %
North America 2.48 %
ME Arab Countries 1.71 %
AMU 8.91%
Other European Countries 3.16 %
Sub-Saharan Africa 2.25 %
Other countries 4.45 % Source : I.N.S
EU (27) 61.02 %
Other European countries 10.18 %
North America 4.49 %
Latin America 2.43 %
Fart East 12.86 %
AMU 4.53 %
ME Arab Countries 2.52 %
Other countries 1.97 % Source : I.N.S
14 15
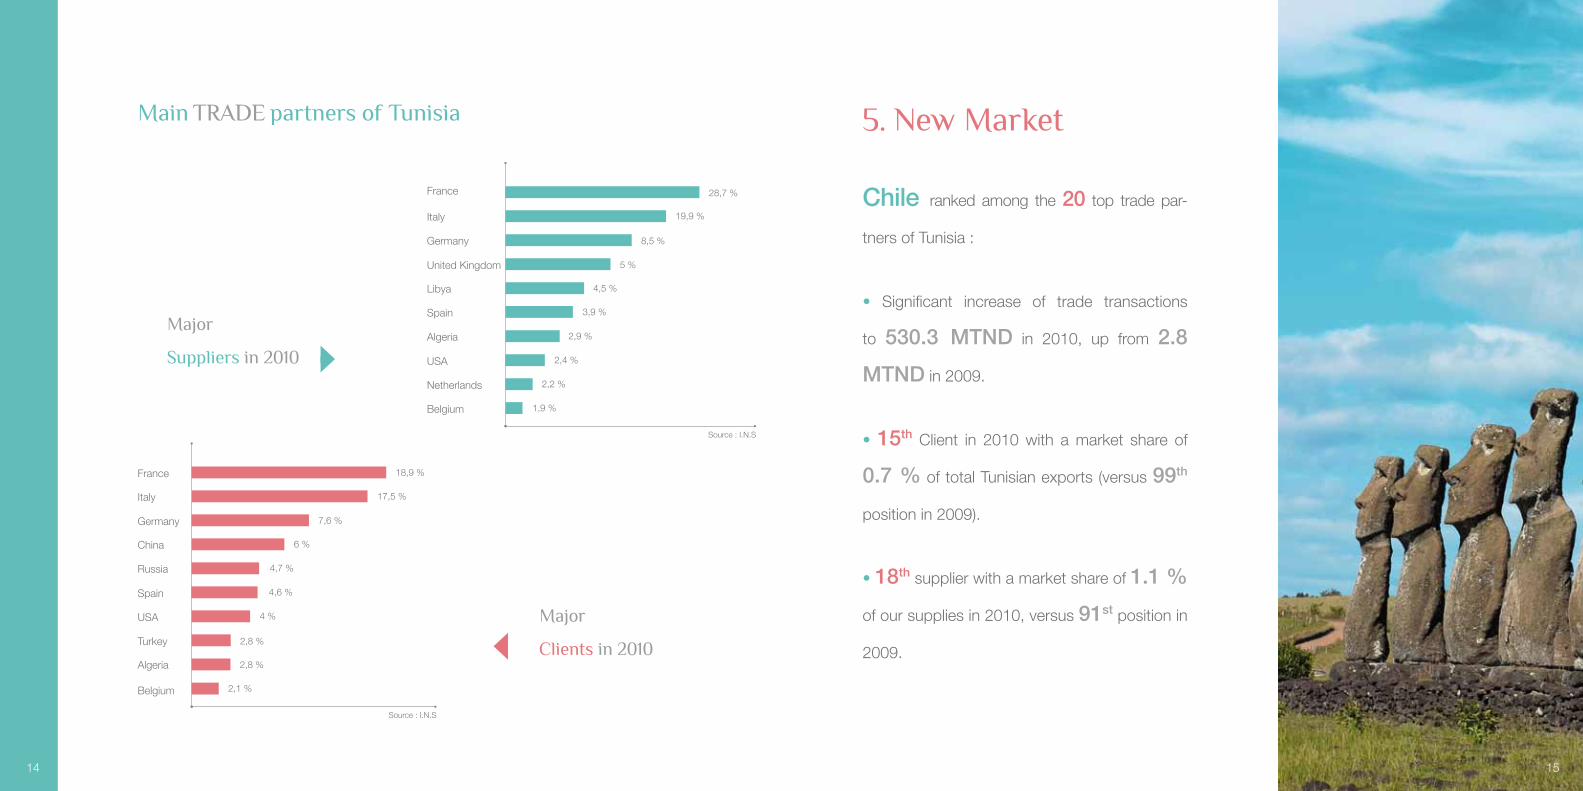
France
Italy
Germany
Spain
Netherlands
Algeria
Belgium
Libya
United Kingdom
USA
Source : I.N.S
28,7 %
19,9 %
8,5 %
5 %
4,5 %
3,9 %
2,9 %
2,4 %
2,2 %
1,9 %
France
Italy
Germany
Spain
Russia
China
Belgium
USA
Source : I.N.S
18,9 %
17,5 %
7,6 %
6 %
4,7 %
4,6 %
4 %
Algeria 2,8 %
Turkey 2,8 %
2,1 %
5. New Market
Chile ranked among the 20 top trade par-
tners of Tunisia :
• Significant increase of trade transactions
to 530.3 MTND in 2010, up from 2.8
MTND in 2009.
• 15th Client in 2010 with a market share of
0.7 % of total Tunisian exports (versus 99th
position in 2009).
• 18th supplier with a market share of 1.1 %
of our supplies in 2010, versus 91st position in
2009.
Major
Suppliers in 2010
Major
Clients in 2010
Main TRADE partners of Tunisia
1716
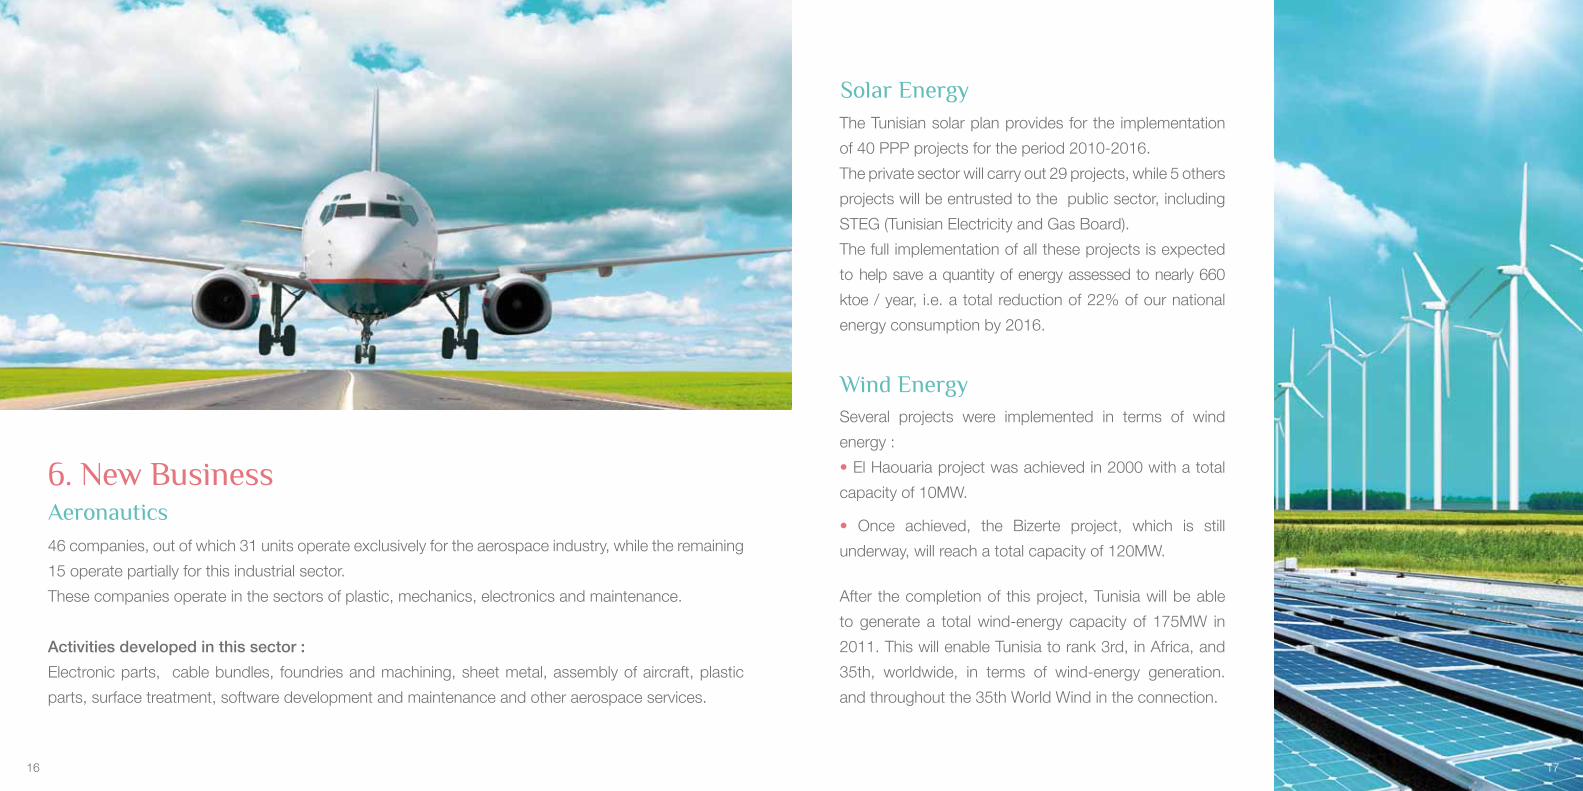
6. New Business
Solar EnergyThe Tunisian solar plan provides for the implementation
of 40 PPP projects for the period 2010-2016.
The private sector will carry out 29 projects, while 5 others
projects will be entrusted to the public sector, including
STEG (Tunisian Electricity and Gas Board).
The full implementation of all these projects is expected
to help save a quantity of energy assessed to nearly 660
ktoe / year, i.e. a total reduction of 22% of our national
energy consumption by 2016.
Aeronautics46 companies, out of which 31 units operate exclusively for the aerospace industry, while the remaining
15 operate partially for this industrial sector.
These companies operate in the sectors of plastic, mechanics, electronics and maintenance.
Activities developed in this sector :
Electronic parts, cable bundles, foundries and machining, sheet metal, assembly of aircraft, plastic
parts, surface treatment, software development and maintenance and other aerospace services.
Wind EnergySeveral projects were implemented in terms of wind
energy :
• El Haouaria project was achieved in 2000 with a total
capacity of 10MW.
• Once achieved, the Bizerte project, which is still
underway, will reach a total capacity of 120MW.
After the completion of this project, Tunisia will be able
to generate a total wind-energy capacity of 175MW in
2011. This will enable Tunisia to rank 3rd, in Africa, and
35th, worldwide, in terms of wind-energy generation.
and throughout the 35th World Wind in the connection.
1918
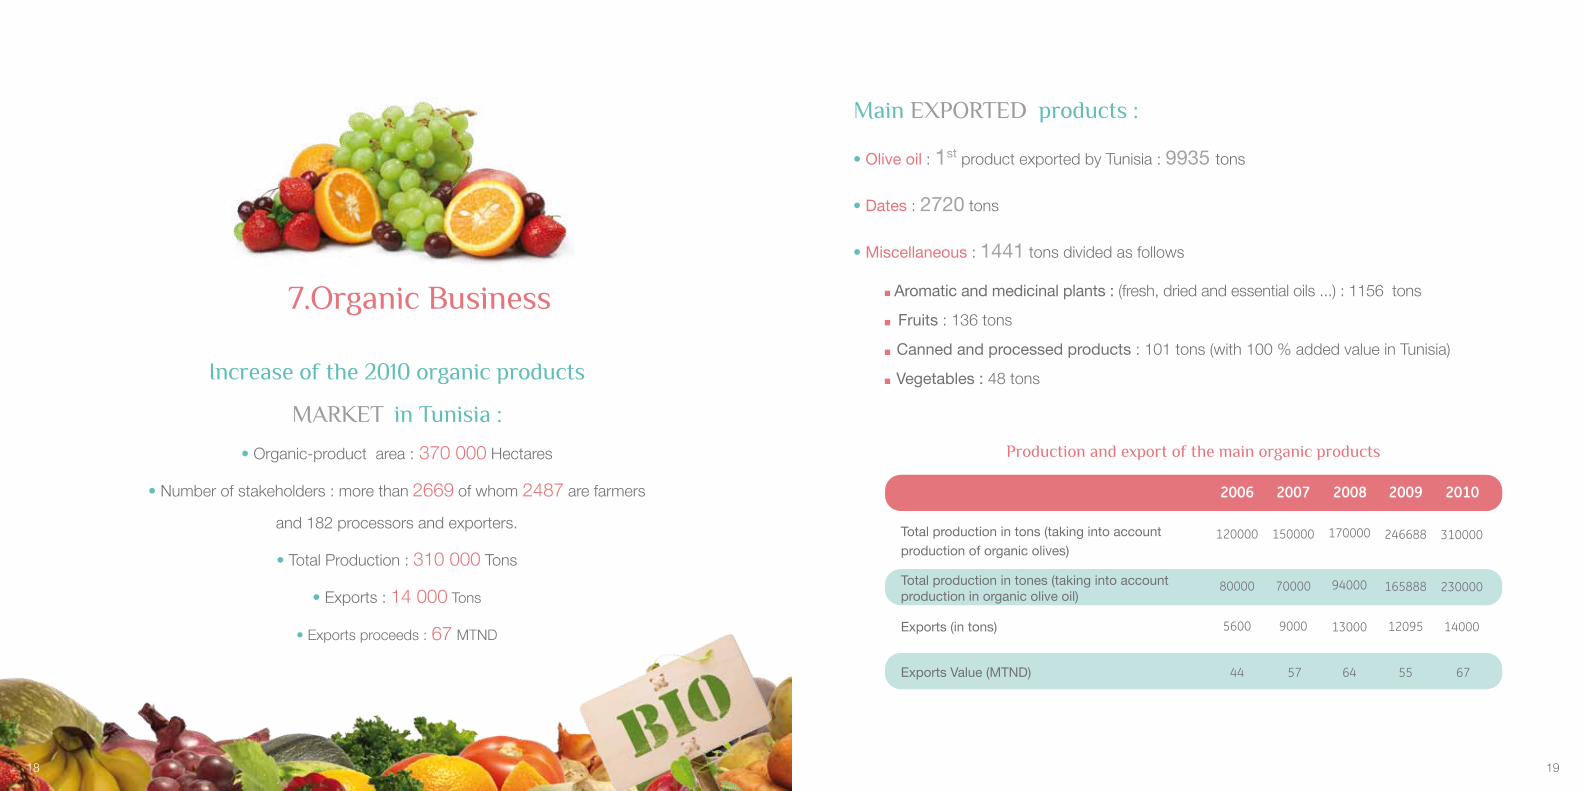
Main ExPORTED products :
• Olive oil : 1st product exported by Tunisia : 9935 tons
• Dates : 2720 tons
• Miscellaneous : 1441 tons divided as follows
Aromatic and medicinal plants : (fresh, dried and essential oils ...) : 1156 tons
Fruits : 136 tons
Canned and processed products : 101 tons (with 100 % added value in Tunisia)
Vegetables : 48 tons
7.Organic Business
Increase of the 2010 organic products
MARKET in Tunisia :
• Organic-product area : 370 000 Hectares
• Number of stakeholders : more than 2669 of whom 2487 are farmers
and 182 processors and exporters.
• Total Production : 310 000 Tons
• Exports : 14 000 Tons
• Exports proceeds : 67 MTND
Total production in tons (taking into account production of organic olives)
Production and export of the main organic products
Total production in tones (taking into account production in organic olive oil)
120000
2006
80000
150000
2007
70000
170000
2008
94000
246688
2009
165888
310000
Exports (in tons) 5600 9000 13000 12095 14000
2010
230000
Exports Value (MTND) 44 57 64 55 67
21
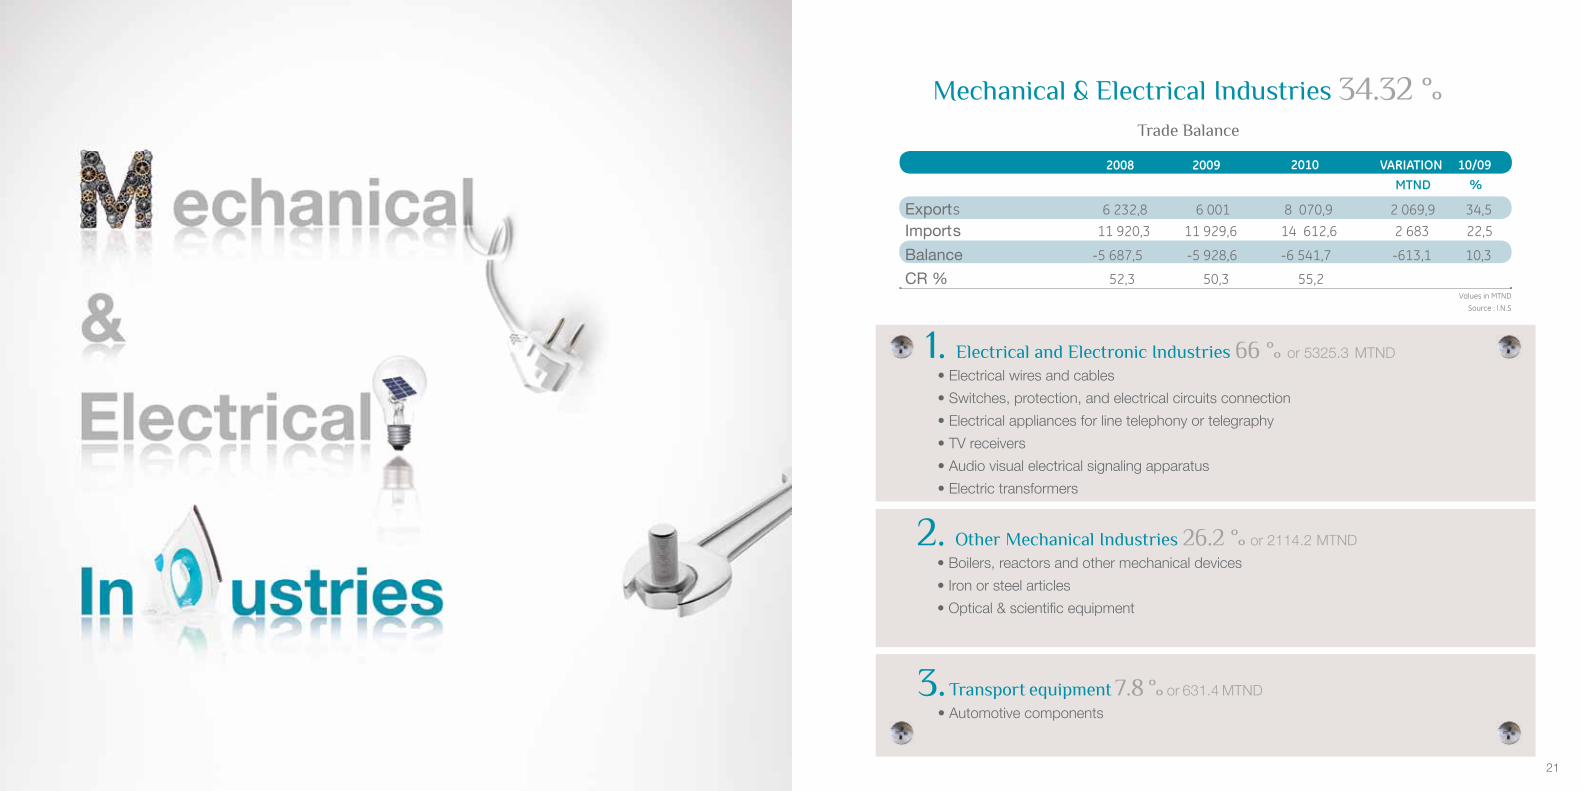
Mechanical & Electrical Industries 34.32 %Trade Balance
Export s 6 232,8 6 001 8 070,9 2 069,9 34,5Import s 11 920,3 11 929,6 14 612,6 2 683 22,5
Balance -5 687,5 -5 928,6 -6 541,7 -613,1 10,3
CR % 52,3 50,3 55,2
2008 2009 2010 VARIATION 10/09MTND %
Source : I.N.S Values in MTND
1. Electrical and Electronic Industries 66 % or 5325.3 MTND
• Electrical wires and cables
• Switches, protection, and electrical circuits connection
• Electrical appliances for line telephony or telegraphy
• TV receivers
• Audio visual electrical signaling apparatus
• Electric transformers
2. Other Mechanical Industries 26.2 % or 2114.2 MTND
• Boilers, reactors and other mechanical devices
• Iron or steel articles
• Optical & scientific equipment
3. Transport equipment 7.8 % or 631.4 MTND
• Automotive components
2322
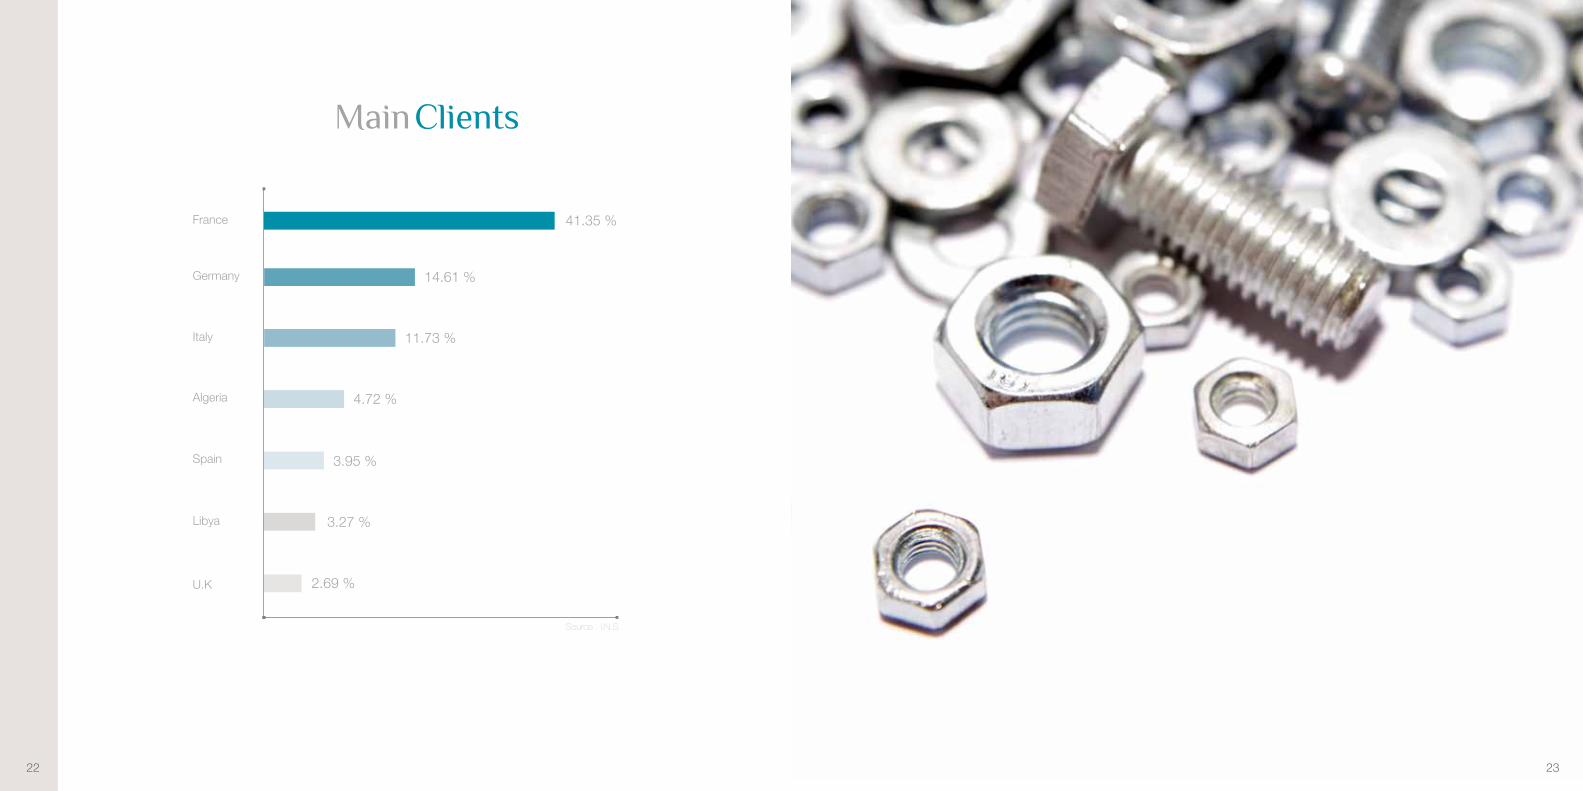
41.35 %France
Italy
Germany
Libya
Spain
Algeria
U.K
14.61 %
11.73 %
4.72 %
3.95 %
3.27 %
2.69 %
Source : I.N.S
Main Clients
25
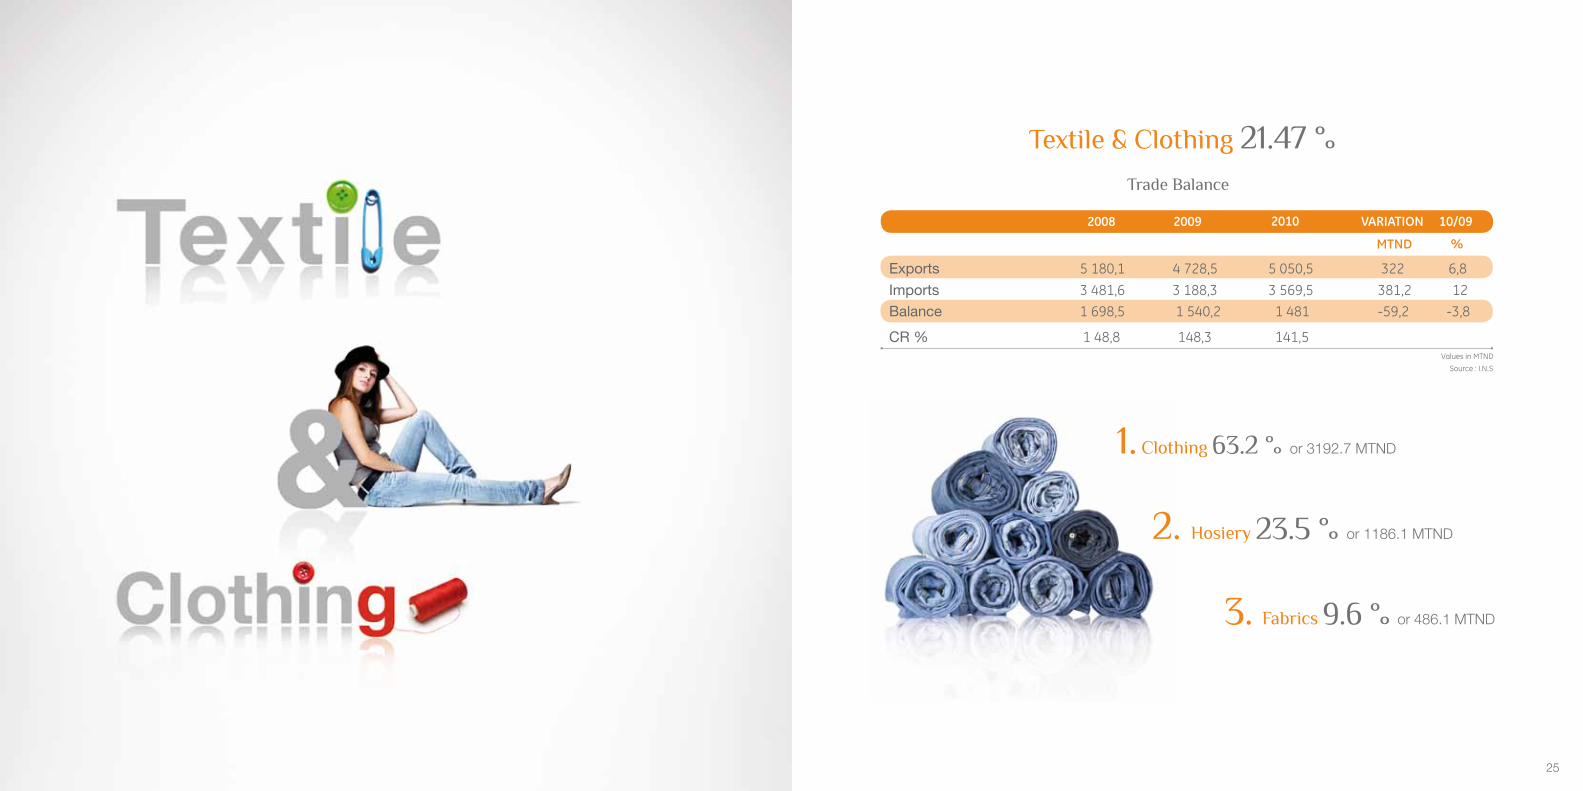
Source : I.N.S
Exports 5 180,1 4 728,5 5 050,5 322 6,8Imports 3 481,6 3 188,3 3 569,5 381,2 12Balance 1 698,5 1 540,2 1 481 -59,2 -3,8
CR % 1 48,8 148,3 141,5
2008 2009 2010 VARIATION 10/09
MTND %
Values in MTND
1. Clothing 63.2 % or 3192.7 MTND
2. Hosiery 23.5 % or 1186.1 MTND
3. Fabrics 9.6 % or 486.1 MTND
Textile & Clothing 21.47 %Trade Balance
2726
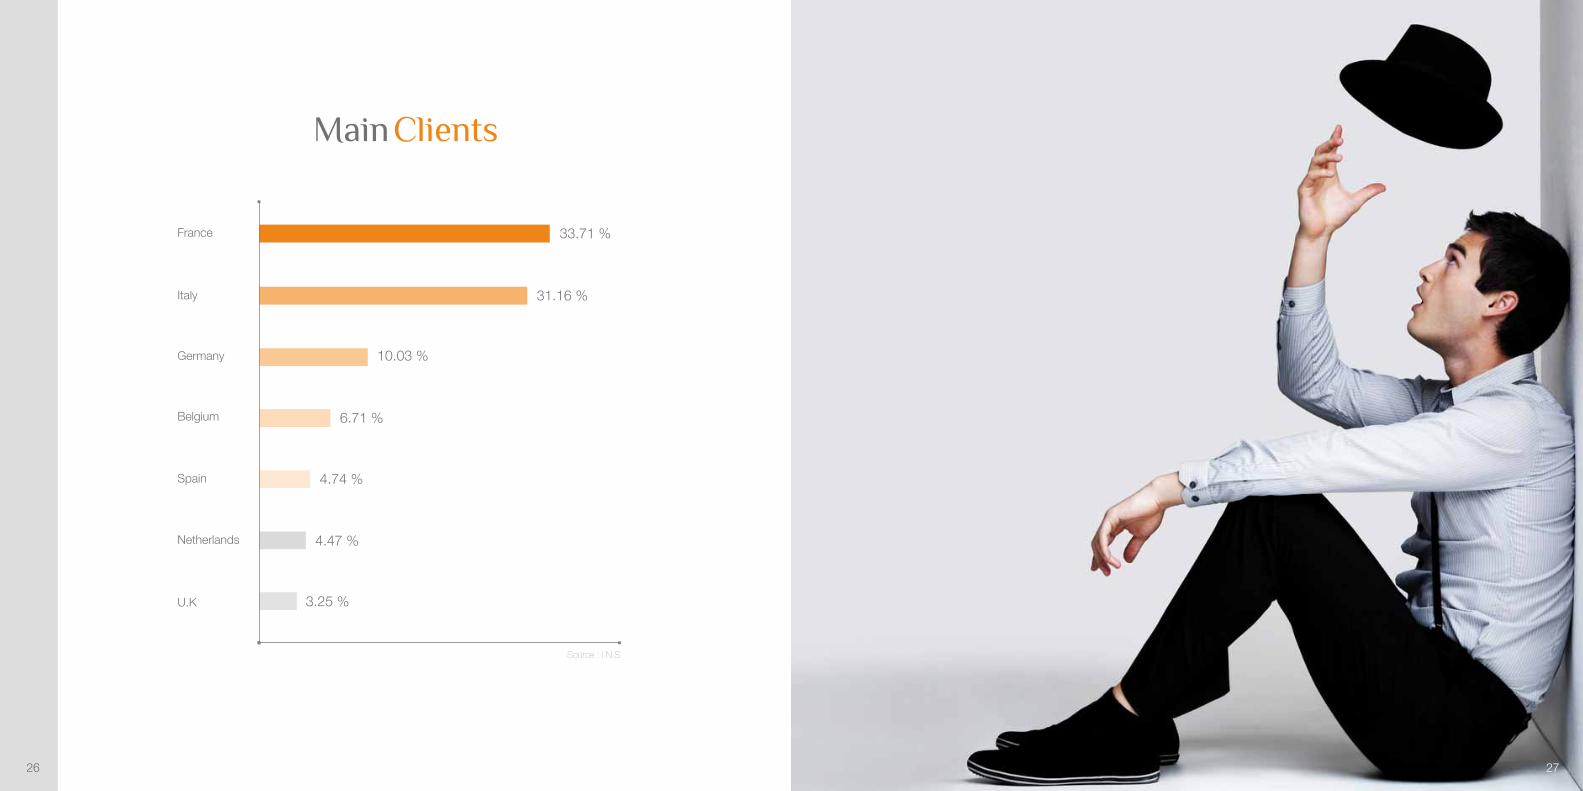
Netherlands
Spain
U.K
4.74 %
4.47 %
3.25 %
France
Belgium
Germany
Italy
Source : I.N.S
33.71 %
10.03 %
6.71 %
31.16 %
Main Clients
2929
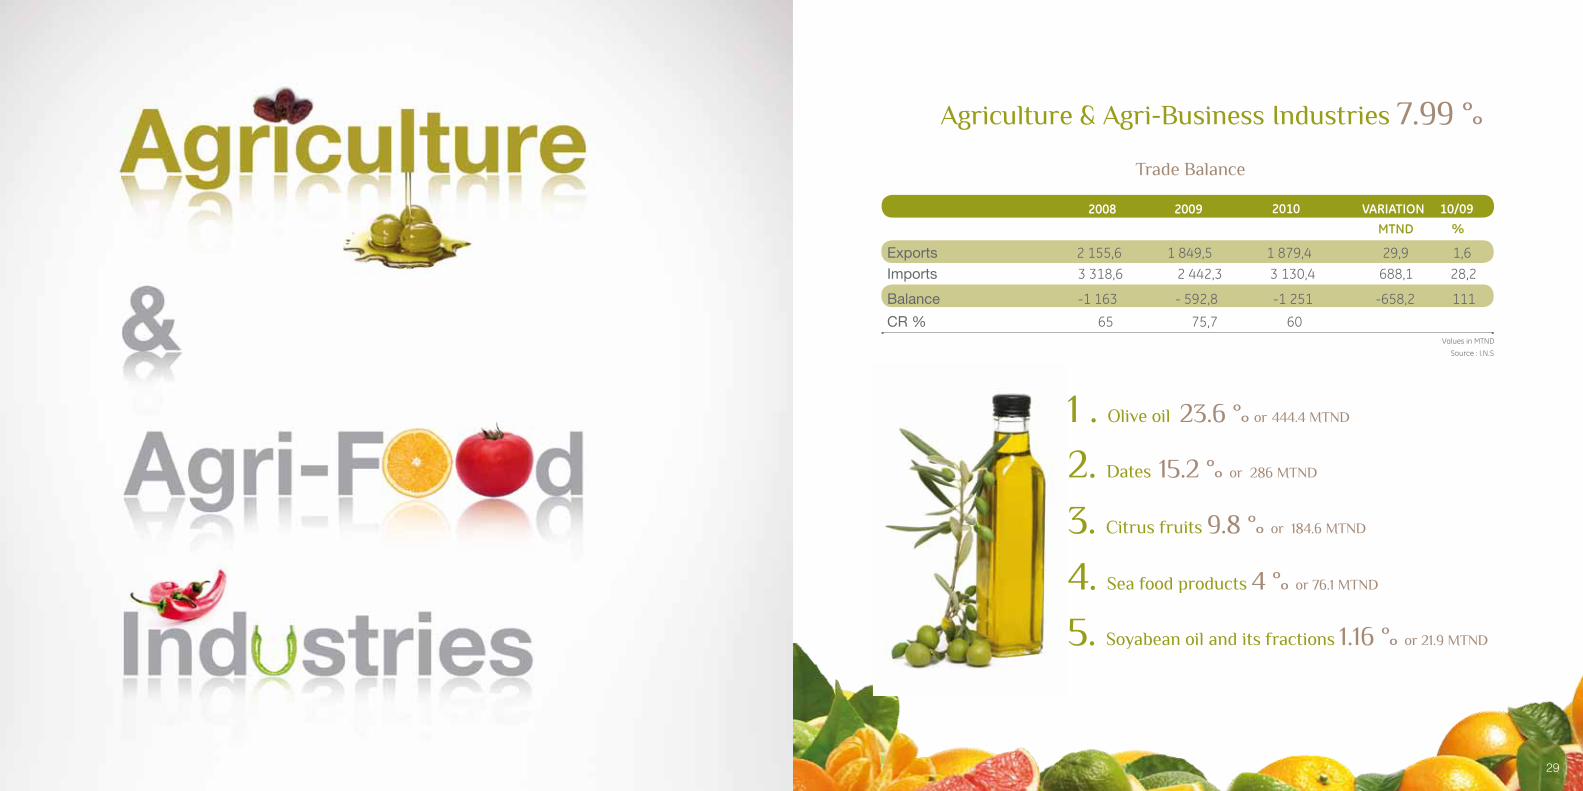
Exports 2 155,6 1 849,5 1 879,4 29,9 1,6Imports 3 318,6 2 442,3 3 130,4 688,1 28,2
Balance -1 163 - 592,8 -1 251 -658,2 111
CR % 65 75,7 60
2008 2009 2010 VARIATION 10/09MTND %
1 . Olive oil 23.6 % or 444.4 MTND
3. Citrus fruits 9.8 % or 184.6 MTND
4. Sea food products 4 % or 76.1 MTND
5. Soyabean oil and its fractions 1.16 % or 21.9 MTND
2. Dates 15.2 % or 286 MTND
Trade Balance
Agriculture & Agri-Business Industries 7.99 %
Source : I.N.S Values in MTND
3030
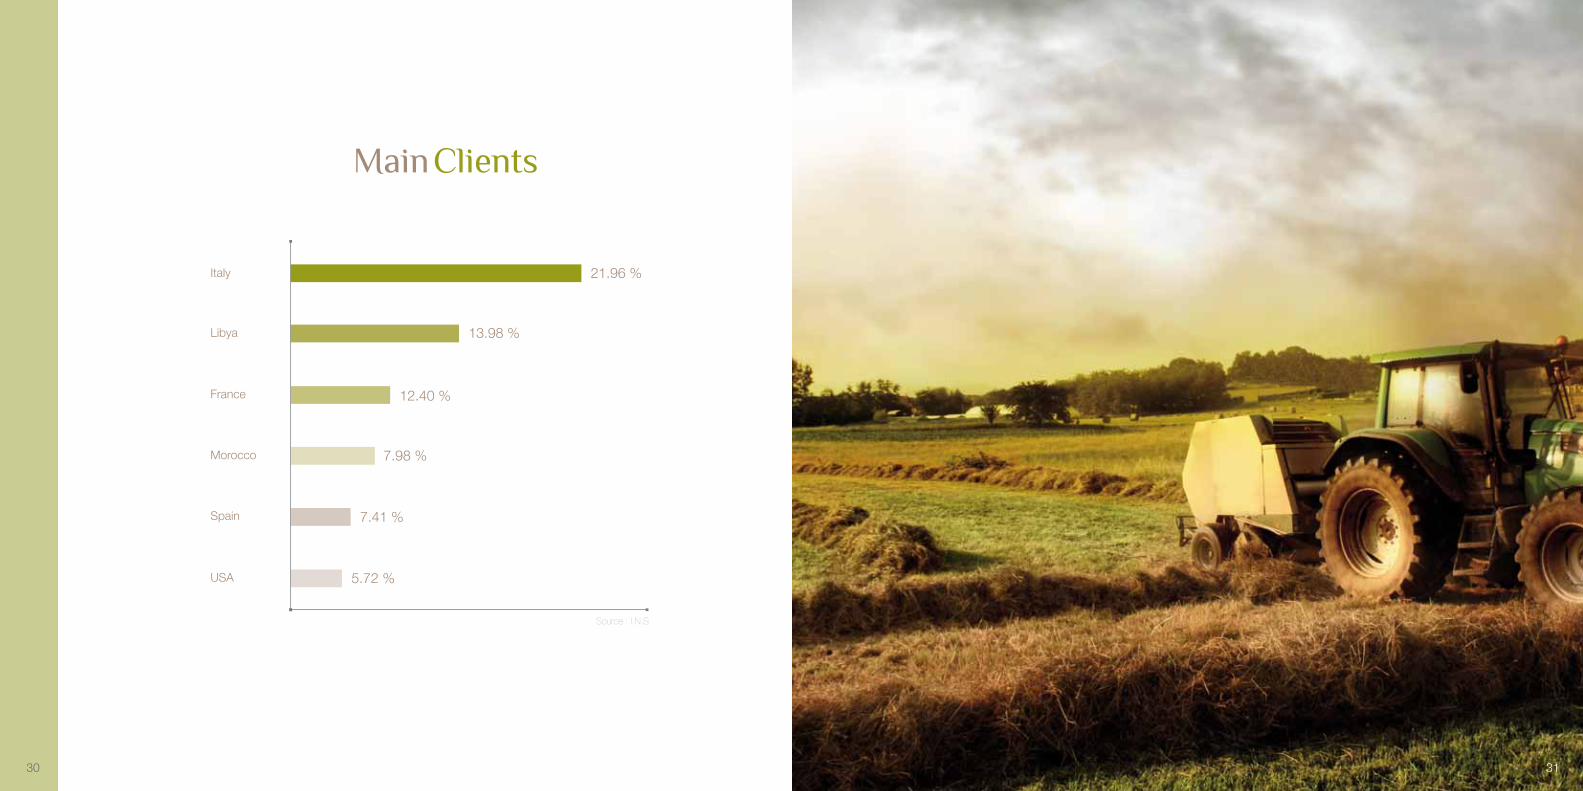
Main Clients
Morocco
France
Libya
Italy
USA
Spain
Source : I.N.S
12.40 %
13.98 %
7.98 %
7.41 %
5.72 %
21.96 %
31
3333
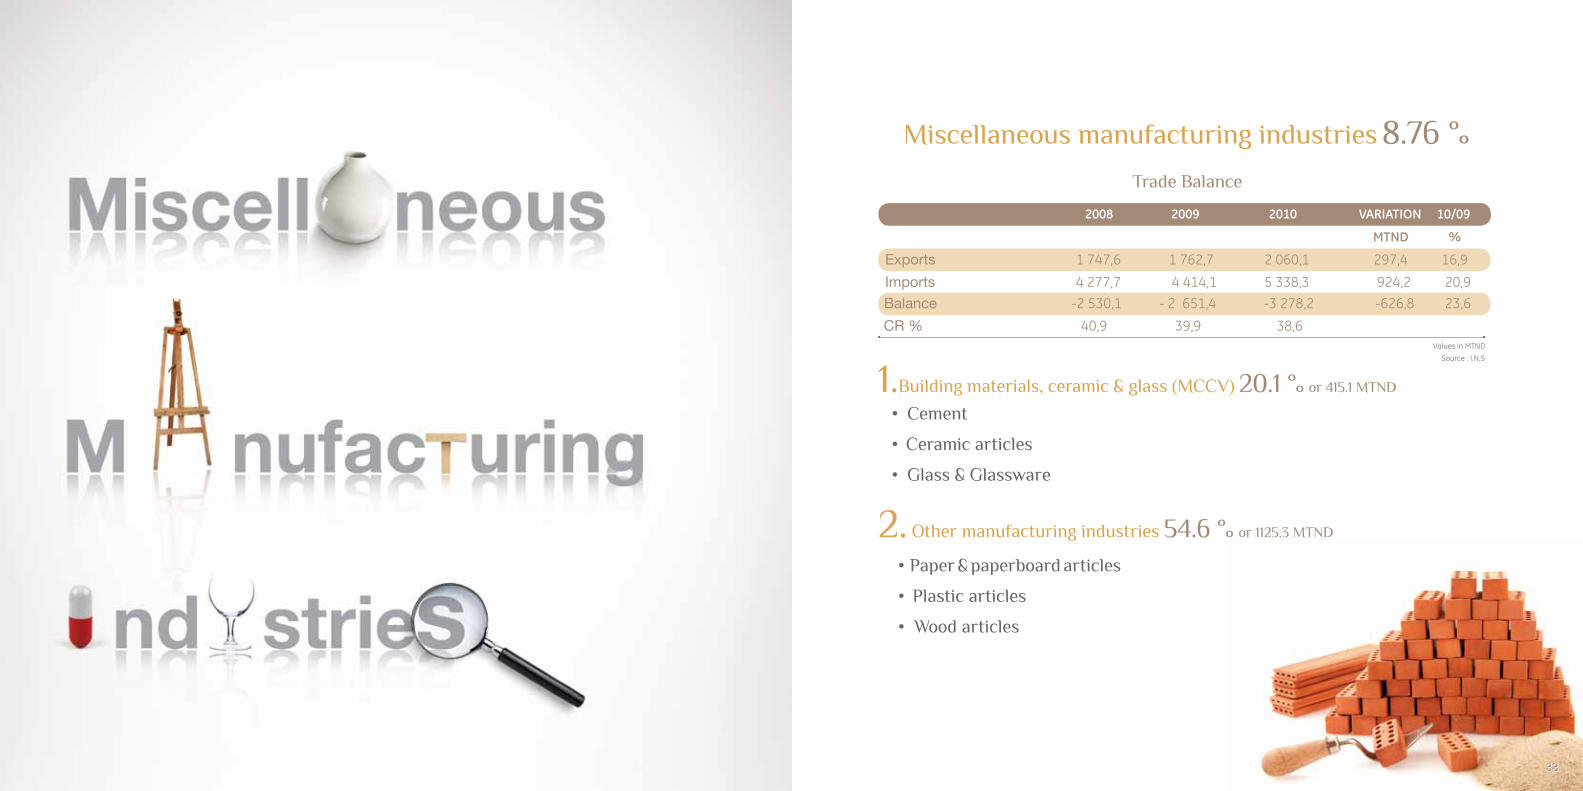
1.Building materials, ceramic & glass (MCCV) 20.1 % or 415.1 MTND
2. Other manufacturing industries 54.6 % or 1125.3 MTND
• Cement
• Ceramic articles
• Glass & Glassware
• Paper & paperboard articles
• Plastic articles
• Wood articles
Exports 1 747,6 1 762,7 2 060,1 297,4 16,9Imports 4 277,7 4 414,1 5 338,3 924,2 20,9Balance -2 530,1 - 2 651,4 -3 278,2 -626,8 23,6
2008 2009 2010 VARIATION 10/09
MTND %
Miscellaneous manufacturing industries 8.76 %
CR % 40,9 39,9 38,6
Trade Balance
Source : I.N.S Values in MTND
35
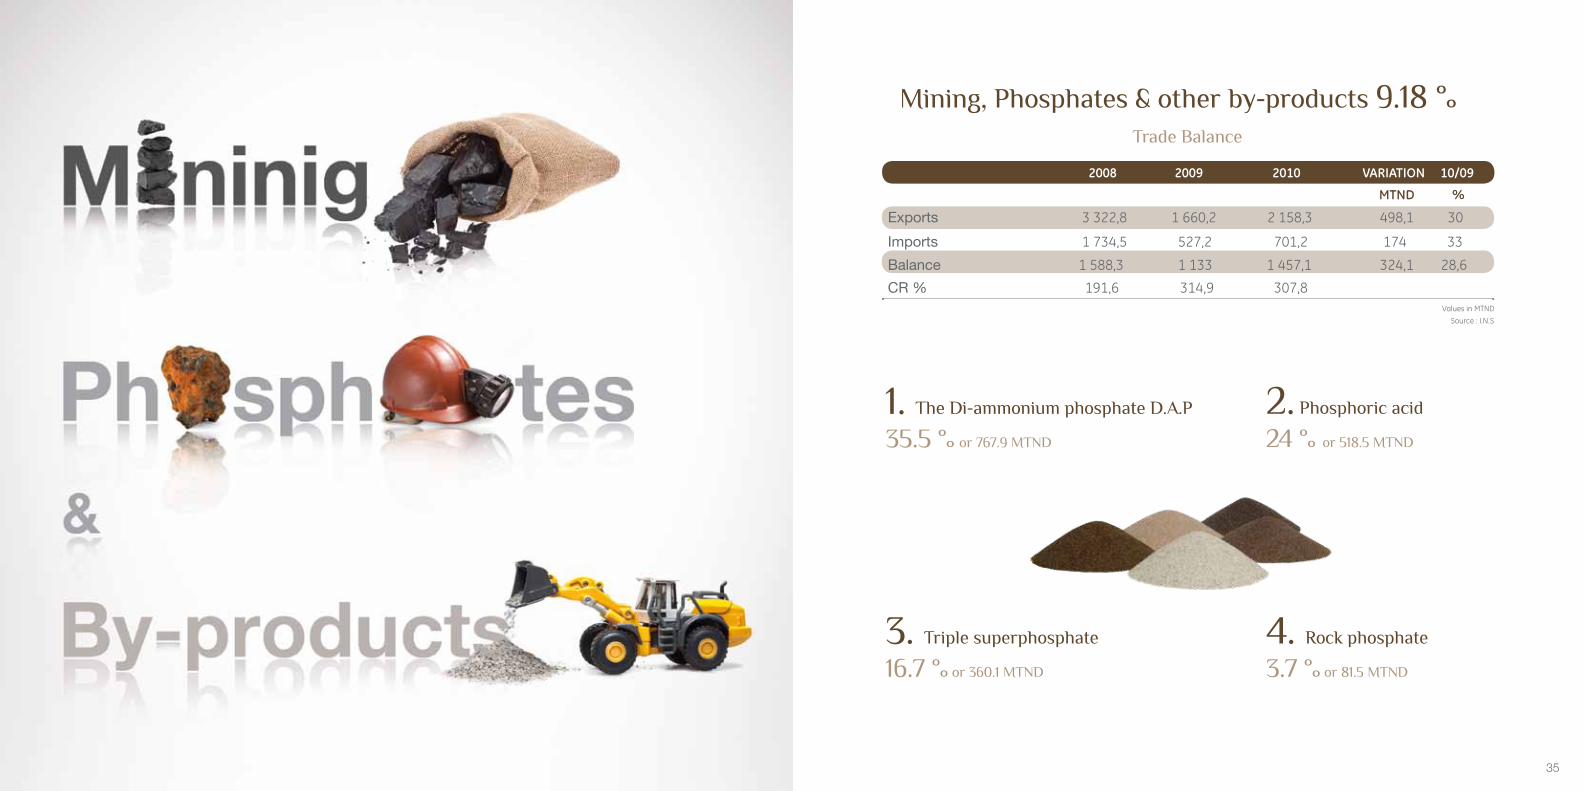
Mining, Phosphates & other by-products 9.18 %
1. The Di-ammonium phosphate D.A.P 35.5 % or 767.9 MTND
2. Phosphoric acid
24 % or 518.5 MTND
3. Triple superphosphate
16.7 % or 360.1 MTND
4. Rock phosphate
3.7 % or 81.5 MTND
Exports 3 322,8 1 660,2 2 158,3 498,1 30
Imports 1 734,5 527,2 701,2 174 33
Balance 1 588,3 1 133 1 457,1 324,1 28,6
CR % 191,6 314,9 307,8
2008 2009 2010 VARIATION 10/09
MTND %
Trade Balance
Source : I.N.S Values in MTND
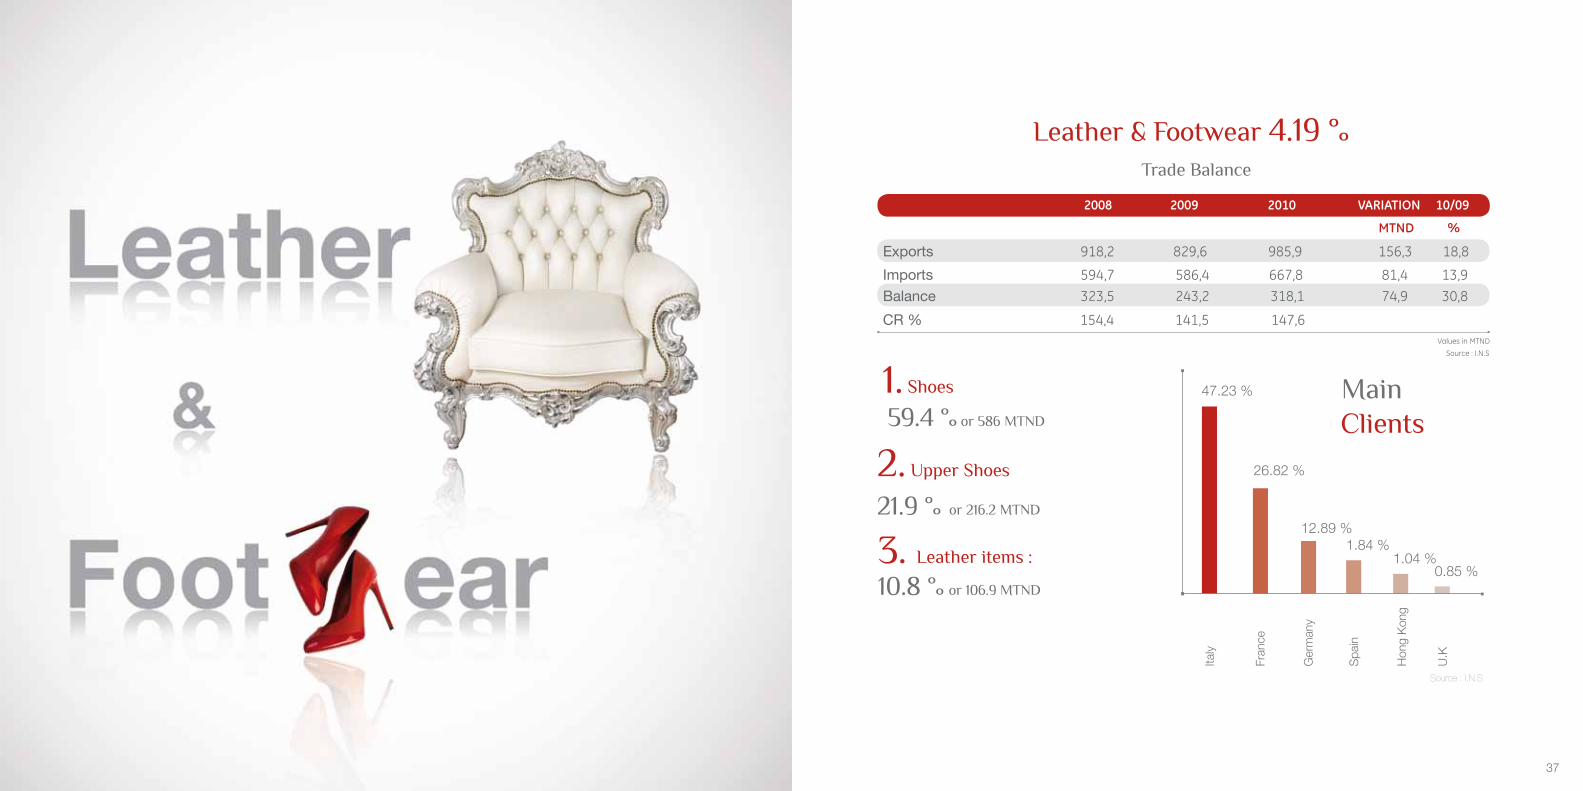
37
1. Shoes
59.4 % or 586 MTND
2. Upper Shoes
21.9 % or 216.2 MTND
3. Leather items :
10.8 % or 106.9 MTND
Trade Balance
Leather & Footwear 4.19 %
Exports 918,2 829,6 985,9 156,3 18,8
Imports 594,7 586,4 667,8 81,4 13,9Balance 323,5 243,2 318,1 74,9 30,8
CR % 154,4 141,5 147,6
2008 2009 2010 VARIATION 10/09
MTND %
MainClients
Italy
Ger
man
y
Fran
ce
Hon
g K
ong
U.K
Spa
in
47.23 %
12.89 %1.84 %
1.04 %0.85 %
26.82 %
Source : I.N.S
Source : I.N.S Values in MTND

Centre Urbain Nord - Bp 225 - 1080 Tunis Cedex : ( +216 ) 71 234 200 : ( +216 ) 71 237 [email protected] - www.tunisiaexport.com
Tunisiaexport Network : Abidjan - Amman - Algeria
Benghazi - Casablanca - Dubai - Milan - Rotterdam - Moscou
GA
RC
ICO
M +
216
71
28 1
1 87
Related Documents