arXiv:0807.3746v1 [astro-ph] 23 Jul 2008 T-Lyr1-17236: A Long-Period Low-Mass Eclipsing Binary Jonathan Devor 1,2 , David Charbonneau 1,3 , Guillermo Torres 1 , Cullen H. Blake 1 , Russel J. White 4 , Markus Rabus 5 , Francis T. O’Donovan 6 , Georgi Mandushev 7 , Gaspar Bakos 1 ,G´aborF˝ ur´ esz 1 , and Andrew Szentgyorgyi 1 ABSTRACT We describe the discovery of a 0.68+0.52 M ⊙ eclipsing binary (EB) with an 8.4-day orbital period, found through a systematic search of ten fields of the Trans-atlantic Exoplanet Survey (TrES). Such long-period low-mass EBs consti- tute critical test cases for resolving the long standing discrepancy between the theoretical and observational mass-radius relations at the bottom of the main sequence. It has been suggested that this discrepancy may be related to strong stellar magnetic fields, which are not properly accounted for in current theoreti- cal models. All previously well-characterized low-mass main sequence EBs have periods of a few days or less, and their components are therefore expected to be rotating rapidly as a result of tidal synchronization, thus generating strong magnetic fields. In contrast, the binary system described here has a period that is over three times longer than previously characterized low-mass main sequence EBs, and its components rotate relatively slowly. It is therefore expected to have a weaker magnetic field and to better match the assumptions of theoretical stellar models. Our follow-up observations of this EB yield preliminary stellar properties that suggest it is indeed consistent with current models. If further observations confirm a low level of activity in this system, these determinations would provide support for the hypothesis that the mass-radius discrepancy is at least partly due to magnetic activity. 1 Harvard-Smithsonian Center for Astrophysics, 60 Garden Street, Cambridge, MA 02138 2 Email: [email protected] 3 Alfred P. Sloan Research Fellow 4 Physics Department, University of Alabama in Huntsville, Huntsville, AL 35899 5 Instituto de Astrof´ ısica de Canarias, La Laguna, Tenerife, Spain 6 California Institute of Technology, 1200 East California Boulevard, Pasadena, CA 91125 7 Lowell Observatory, 1400 West Mars Hill Road, Flagstaff, AZ 86001

Welcome message from author
This document is posted to help you gain knowledge. Please leave a comment to let me know what you think about it! Share it to your friends and learn new things together.
Transcript

arX
iv:0
807.
3746
v1 [
astr
o-ph
] 2
3 Ju
l 200
8
T-Lyr1-17236: A Long-Period Low-Mass Eclipsing Binary
Jonathan Devor1,2, David Charbonneau1,3, Guillermo Torres1,
Cullen H. Blake1, Russel J. White4, Markus Rabus5, Francis T. O’Donovan6,
Georgi Mandushev7, Gaspar Bakos1, Gabor Furesz1, and Andrew Szentgyorgyi1
ABSTRACT
We describe the discovery of a 0.68+0.52 M⊙ eclipsing binary (EB) with an
8.4-day orbital period, found through a systematic search of ten fields of the
Trans-atlantic Exoplanet Survey (TrES). Such long-period low-mass EBs consti-
tute critical test cases for resolving the long standing discrepancy between the
theoretical and observational mass-radius relations at the bottom of the main
sequence. It has been suggested that this discrepancy may be related to strong
stellar magnetic fields, which are not properly accounted for in current theoreti-
cal models. All previously well-characterized low-mass main sequence EBs have
periods of a few days or less, and their components are therefore expected to
be rotating rapidly as a result of tidal synchronization, thus generating strong
magnetic fields. In contrast, the binary system described here has a period that
is over three times longer than previously characterized low-mass main sequence
EBs, and its components rotate relatively slowly. It is therefore expected to
have a weaker magnetic field and to better match the assumptions of theoretical
stellar models. Our follow-up observations of this EB yield preliminary stellar
properties that suggest it is indeed consistent with current models. If further
observations confirm a low level of activity in this system, these determinations
would provide support for the hypothesis that the mass-radius discrepancy is at
least partly due to magnetic activity.
1Harvard-Smithsonian Center for Astrophysics, 60 Garden Street, Cambridge, MA 02138
2Email: [email protected]
3Alfred P. Sloan Research Fellow
4Physics Department, University of Alabama in Huntsville, Huntsville, AL 35899
5Instituto de Astrofısica de Canarias, La Laguna, Tenerife, Spain
6California Institute of Technology, 1200 East California Boulevard, Pasadena, CA 91125
7Lowell Observatory, 1400 West Mars Hill Road, Flagstaff, AZ 86001

– 2 –
Subject headings: binaries: eclipsing — binaries: close — stars: late-type —
stars: fundamental parameters — stars: individual (T-Lyr1-17236)
1. Introduction
Despite a great deal of work that has been done to understand the structure of low-
mass (< 0.8 M⊙) main sequence stars (e.g., Chabrier & Baraffe 2000), models continue
to underestimate their radii by as much as 15% (Lacy 1977a; Torres & Ribas 2002; Ribas
2006). This is a significant discrepancy, considering that for solar-type stars the agreement
with the observations is typically within 1–2% (Andersen 1991, 1998). In recent years an
intriguing hypothesis has been put forward, suggesting that strong magnetic fields may have
bloated these stars, either through chromospheric activity (e.g., Ribas 2006; Torres et al.
2006; Lopez-Morales 2007; Chabrier et al. 2007) or through magnetically induced convective
disruption (Torres et al. 2006). Such strong magnetic fields are expected to be formed by the
dynamo mechanism of rapidly rotating stars.1 To test this hypothesis, one needs to measure
both the masses and radii of low-mass stars, which thus far can be done most accurately with
eclipsing binary (EB) systems. However, all well characterized low-mass main sequence EBs
have orbital periods shorter than three days (see Table 1) and are therefore expected to have
synchronization timescales shorter than ∼100 Myr (Zahn 1977, 1994, see Figure 1 and further
description in § 6). As a result of these short periods and short synchronization timescales,
the rotations of these binary components are expected to have accelerated to the point that
they now match the rapid angular velocity of their orbits. With such rapid rotations, these
binary components could have a wide range of dynamo-induced magnetic field strengths.
To better constrain current stellar models, we set out to find systems with slowly rotating
components. Such systems would presumably have comparably weak magnetic fields, thus
being more consistent with the model assumptions. Furthermore, by comparing the mass-
radius relations of binary components with well determined levels of magnetic activity, one
could test various magnetic disruption models.
We note here that in addition to EB analysis, long-baseline optical interferometry has
also been used recently to measure the radii of nearby low-mass stars (Lane et al. 2001;
Segransan et al. 2003; Berger et al. 2006). While these stars are single and are therefore
1Dynamo theory predicts that this mechanism operates only in partially convective stars. However,
the strong magnetic activity observed in fully convective low-mass stars indicates that they also possess a
mechanism for generating strong magnetic fields (see Browning & Basri 2007, and references therein).

– 3 –
expected to rotate slowly, their masses can only be estimated through empirical mass-
luminosity relations or other indirect methods. Those determinations are thus less fun-
damental, in a sense, and arguably of lesser value for accurately constraining stellar models
and testing the magnetic disruption hypothesis.
2. Initial Photometric Observations
T-Lyr1-17236 was first identified as a likely low-mass EB candidate in the Devor et al.
(2008) catalog, following a systematic analysis of the light curves (LCs) within ten fields of
the Trans-atlantic Exoplanet Survey (TrES; Alonso et al. 2004). TrES employs a network of
three automated telescopes to survey 6◦ × 6◦ fields of view. To avoid potential systematic
noise, we performed our initial search using data from only one telescope, Sleuth, located at
the Palomar Observatory in Southern California (O’Donovan et al. 2004), and we combined
additional data at subsequent follow-up stages. Sleuth has a 10-cm physical aperture and
a photometric aperture radius of 30′′. The number of LCs in each field ranges from 10,405
to 26,495, for a total of 185,445 LCs. The LCs consist of ∼2000 Sloan r-band photometric
measurements binned to a 9-minute cadence. The calibration of the TrES images, identifica-
tion of stars therein, and the extraction and decorrelation of the LCs are described elsewhere
(Dunham et al. 2004; Mandushev et al. 2005; O’Donovan et al. 2006, 2007).
An automated pipeline was used to identify and characterize the EBs among the TrES
LCs. This pipeline has been described in detail in a previous paper (Devor et al. 2008). At
the heart of this analysis lie two computational tools: the Detached Eclipsing Binary Light
curve fitter2 (DEBiL; Devor 2005), and the Method for Eclipsing Component Identification3
(MECI; Devor & Charbonneau 2006a,b). DEBiL fits each LC to a geometric model of a
detached EB that consists of two luminous, limb-darkened spheres that describe a Newtonian
two-body orbit. MECI then incorporated some of the DEBiL results, and together with
2MASS color information (Skrutskie et al. 2006), refit each LC to a physical model that
is constrained by the solar metallicity Yonsei-Yale theoretical isochrones (Yi et al. 2001;
Kim et al. 2002). Thus, using only photometric data, the DEBiL/MECI pipeline provided
initial estimates of the absolute physical properties of each EB. These estimates were then
used to locate promising candidates for follow-up.
2The DEBiL source code, utilities, and example files are available online at:
http://www.cfa.harvard.edu/∼jdevor/DEBiL.html
3The MECI source code and running examples are available online at:
http://www.cfa.harvard.edu/∼jdevor/MECI.html

– 4 –
Using this pipeline a total of 773 EBs were identified within the TrES dataset. Of these,
427 EBs were both detached and had small out-of-eclipse distortions, thereby enabling the
DEBiL/MECI pipeline to estimate their component masses. These results, together with
many other properties, are listed for each EB in an online catalog4 (Devor et al. 2008). Of
these characterized EBs, we then identified a handful of promising long-period low-mass can-
didates and chose one, T-Lyr1-17236 (α2000 = 19h07m16s.621, δ2000 = +46◦39′53′′.21, P =
8.429441 ± 0.000033 days ; see Table 2 for additional information), for further follow-up
and analysis. As with all of our low-mass candidates, we repeated the MECI analysis us-
ing the Baraffe et al. (1998) solar-metallicity isochrones (with a mixing length parameter of
αML = 1.0), which are more accurate than the Yonsei-Yale isochrones in this regime. The
resulting MECI mass-mass likelihood contour plot of T-Lyr1-17236 is shown in Figure 2.
Since the MECI analysis incorporates data from theoretical stellar models, we cannot use it
to constrain stellar models. Rather, once we identified the candidate, we followed it up pho-
tometrically and spectroscopically, and used only these follow-up data to derive the binary’s
absolute properties.
3. Follow-up Photometric Observations
In order to characterize T-Lyr1-17236 we combined photometric data from four tele-
scopes: (1) Sleuth and (2) PSST (Dunham et al. 2004) of the TrES network, (3) the Instituto
de Astrofısica de Canarias telescope (IAC80; Galan & Cobos 1987), and (4) the Hungarian
Automated Telescope Network (HATNet; Bakos et al. 2004). With the exception of the
IAC80, we obtained our photometric data from archived survey datasets that were intended
for locating exoplanets.
As part of the TrES network (see § 2), Sleuth and PSST are operated similarly. However,
PSST, which is located at the Lowell Observatory in Arizona, observes in the Johnson R-band
whereas Sleuth observes in the Sloan r-band (see Figures 3 and 4). Furthermore, PSST has a
20′′ photometric aperture radius compared to Sleuth’s 30′′ radius, which provides PSST with
a higher resolving power than Sleuth. However, the smaller aperture of PSST also causes it
to have noisier photometry, with an RMS of 0.031 mag for T-Lyr1-17236, compared to the
Sleuth photometry that has an RMS of 0.028 mag. Though these differences are small, they
would have affected our analysis. We therefore chose not to use the PSST data for fitting
the photometric model, though we did use them to improve the determination of the orbital
period and the epoch of eclipse (see § 5).
4http://www.cfa.harvard.edu/∼jdevor/Catalog.html

– 5 –
In an effort to better constrain the eclipses of T-Lyr1-17236, we obtained data from the
IAC80, an 82-cm aperture telescope with a 14′×14′ field of view, located at the Observatorio
del Teide in the Canary Islands. We produced an I-band LC at a 1.3-minute cadence
using the 1024×1024-pixel Tromso CCD Photometer (TCP), resulting in 0.008 mag RMS
photometry for T-Lyr1-17236. Unfortunately, we were only able to observe a primary eclipse
with the IAC80. We therefore incorporated archival HATNet observations so as to provide
coverage of the secondary eclipse in a similar bandpass (see Figures 3 and 5).
HATNet is a network of six 11-cm aperture, fully-automated telescopes (HATs) located
at the F. L. Whipple Observatory in Arizona and at the Submillimeter Array site atop Mauna
Kea, Hawaii. The HATs have an 8◦ × 8◦ field of view, a response that peaks in the I-band,
and operate at a 5.5-minute cadence. To reduce the photometric noise, the HAT point spread
function (PSF) is broadened to a ∼15′′ aperture radius through microstepping (Bakos et al.
2002). Even so, the HATNet photometric RMS for T-Lyr1-17236 was comparably large, at
0.084 mag. Nevertheless, to provide more complete coverage of the primary and secondary
eclipses in the I-band, we combined the IAC80 observations with data from HAT-7 (Whipple
Observatory) and from HAT-8 (Mauna Kea). Due to the very different characteristics of
these two systems, however, we chose not to adopt any of the model parameters derived
from these data, and only used these results as an independent confirmation of the Sleuth
r-band LC analysis.
4. Spectroscopic Observations
T-Lyr1-17236 was observed spectroscopically with two instruments: The Near-Infrared
Spectrometer (NIRSPEC; McLean et al. 1998, 2000) at the W. M. Keck Observatory in
Hawaii, and the Tillinghast Reflector Echelle Spectrograph (TRES; Szentgyorgyi & Furesz
2007), installed on the 1.5-meter Tillinghast telescope at the F. L. Whipple Observatory in
Arizona.
NIRSPEC was operated using a 3-pixel slit (0.432′′) and an N7 blocking filter, thus
producing a spectral resolving power of R = λ/∆λ ≃ 25,000. The duration of the exposures,
which ranged from 420 to 900 seconds, was adjusted according to observing conditions. The
spectra were gathered in two consecutive nods, producing a total of five NIRSPEC nod pairs.
The nods of each pair were then subtracted one from the other, removing much of the sky
emission. We extracted the spectra of both nods using the optimal extraction procedure
outlined in Horne (1986), and then co-added the two resulting one-dimensional spectra. We
calibrated the wavelengths of the resulting spectrum using its atmospheric telluric features,
and then corrected for both the telluric absorption and the blaze of the spectrograph by

– 6 –
dividing this spectrum by the spectrum of an A0V-type star (HR 5511). Finally, we cross-
correlated each spectrum with the spectrum of an M0.5V template star (GJ 182). To this
end, we used a single NIRSPEC order (2290–2320 nm), which is within the K-band, and
has a scale of 0.0336nmpixel−1 at its center. This order covers the CO 2-0 bandhead, which
includes a rich forest of R-branch transition lines, as well as many telluric absorption features
due to methane in the Earth’s atmosphere. The advantages offered by this spectral region
and the details of the instrument setup are described in Blake et al. (2008).
TRES is a high-resolution fiber-fed optical echelle spectrograph designed to cover a
large range of wavelengths (390–934 nm) in 51 orders. We employed the medium-size fiber
(2.3′′) so as to cover the full stellar PSF, while providing a spectral resolving power of R
≃ 47,000. Following each of our three 900–1000 second exposures, the TRES data were
read from a 4638×1090-pixel CCD, which we set to a 2×2 binning mode for a more rapid
read-out. We then used a dedicated IRAF toolset to process and extract 51 spectral or-
ders simultaneously, ultimately producing 2319 data points along each order. The IRAF
processing of the TRES data involved merging the mosaic FITS files, removing cosmic ray
hits, flattening fringing effects, and then extracting the orders. We wavelength-calibrated
the TRES spectra using Thorium-Argon (ThAr) exposures, and then corrected the telluric
absorption and spectroscopic blazing by dividing each spectrum by a TRES spectrum of a
rapidly-rotating B0IV-type star (HR 264). Though TRES produces 51 spectral orders, we
used only four of them, covering wavelengths of 665–720 nm (similar to the R-band), and
having a post-binning scale of ∼0.0065 nmpixel−1. These orders contain a diverse array of
absorption features, including those of TiO, Fe I, Ca I, Ni I, and Cr I. We limited ourselves
to these orders because at shorter wavelengths there was insufficient flux from our red tar-
get, while at longer wavelengths the spectra were dominated by telluric absorption features,
produced largely by terrestrial O2 and H2O. We cross-correlated these four orders with the
corresponding orders of an M1.5V template star (GJ 15A, also known as GX And A) and av-
eraged their cross-correlation functions. We repeated this final calculation using the Zucker
(2003) maximum-likelihood method, which reproduced our results to within a fraction of
their uncertainties, although with slightly larger errors.5
In total, we produced five RV measurements of each component with NIRSPEC and
three with TRES. In all cases we were able to measure the RVs of both binary components
by employing a cross-correlation method that transforms the spectra to Fourier-space using
5The Zucker (2003) method is more accurate than simple cross-correlation averaging for large N. However,
because it takes the absolute value of the correlation, it loses some information and effectively increases the
noise baseline. This increased noise will negate its advantage when combining a small number of correlations,
as is the case in our TRES analysis (N = 4).

– 7 –
the Lomb-Scargle algorithm (Press et al. 1992). This method allowed us to cross-correlate
spectra with arbitrary sampling, without having to interpolate or resample them onto an
equidistant grid. We then multiplied the Fourier-transformed target and template spectra,
inverse-Fourier-transformed the product, and normalized it. Since the resulting two peaks
in the cross-correlation functions were always well separated, we were able to fit each with
a parabola, and thus measure their offsets and widths. The uncertainties of these RVs
are somewhat difficult to determine with our procedures, but tests indicate that they are
approximately 1.0 km s−1 and 1.4 km s−1 for the primary and secondary in our NIRSPEC
spectra, and about 0.5 km s−1 and 1.2 km s−1 in our TRES spectra. These internal errors are
adopted below in the spectroscopic analysis, but have relatively little effect on the results.
Finally, the RVs were transformed to the barycentric frame, and the TRES RV measurements
were further offset by −2.82 km s−1 in order to place them on the same reference frame as
the NIRSPEC measurements, which were obtained with a different template (GJ 182). This
offset was determined by including it as an additional free parameter in the Keplerian RV
model (see § 5). Once the offset was determined, we held its value fixed in all subsequent
analyses. The final velocities are listed in Table 3 and include this offset. Note that these
listed RVs are all relative to GJ 182, for which Montes et al. (2001) have measured the value
+32.4 ± 1.0 km s−1.
5. Orbital Analysis
We began our analysis by determining the orbital period (P ) and the epoch of primary
eclipse (t0), and constraining the eccentricity (e) of T-Lyr1-17236 through eclipse timing.
The times of eclipse determined from our photometric observations listed in Table 4. Since
our data span 3.5 years, we were able to determine the period to an accuracy of 3 seconds
(see Table 5). To estimate the binary’s eccentricity, we first measured the observed minus
calculated (O−C) timing difference between the primary and secondary eclipses in all avail-
able LCs, which provided an upper bound of |e cos ω| . 0.0008, where ω is the argument
of periastron (see Figure 6). Though ω and e cannot be determined separately in this way,
this result indicates that the orbit of T-Lyr1-17236 is likely to be circular or very nearly
so. This conclusion is further supported by a weaker upper limit of |e sinω| . 0.06, ob-
tained through preliminary LC model fitting (see below). Theoretical estimates (Zahn 1977,
1978, 1994) of this binary suggest a circularization timescale of tcirc ≃ 390 Gyr (see also
Devor et al. 2008). Being many times the age of the binary, this long timescale suggests
that T-Lyr1-17236 formed in a circular orbit. However, this timescale value is an instanta-
neous estimate for the current epoch, and is likely to have been significantly different in the
past (see Zahn & Bouchet 1989; Mazeh 2008, and references therein). Therefore, it is quite
– 8 –
possible that the binary circularized while it was in the pre-main sequence, however, to the
extent that this theory is correct, it is unlikely to have circularized once settling on the main
sequence.
A Keplerian model was fitted to the radial velocities to determine the elements of the
spectroscopic orbit of T-Lyr1-17236. We assumed the eccentricity to be zero based on the
evidence above and the lack of any indications to the contrary from preliminary spectroscopic
solutions. The period and t0 were held fixed at the values determined above. We solved
simultaneously for the velocity semi-amplitudes of the components (KA,B) and the RV of
their center of mass (Vγ). The results are shown graphically in Figure 7, and the elements
are listed in Table 6. The minimum masses MA,B sin3 i are formally determined to better
than 2%. However, because of the small number of observations (N = 8), the possibility of
systematic errors cannot be ruled out and further observations are encouraged to confirm
the accuracy of these results.
We then proceeded to find the remaining photometric parameters of T-Lyr1-17236. To
this end, we analyzed the Sleuth r-band LC using JKT-EBOP (Southworth et al. 2004a,b),
a LC modeling program based on the EPOB light curve generator (Nelson & Davis 1972;
Etzel 1981; Popper & Etzel 1981). We assumed a circular orbit, as before, a mass ratio
of q = 0.7692 from the spectroscopic model, and the period determined above. We solved
simultaneously for the orbital inclination (i), the fractional radii (rA,B), the central surface
brightness ratio of the secondary in units of the primary (J), the time of primary eclipse
(t0), and the out-of-eclipse magnitude (zero point). We estimated the uncertainties of the
fitted parameters by evaluating the distribution generated by 1000 Monte Carlo simulations
(Southworth et al. 2005).
Because of the large photometric aperture of Sleuth, the presence of significant con-
tamination from the light of additional stars is a distinct possibility. Unfortunately, due
to its degeneracy with the orbital inclination and the fractional radii, we were not able to
simultaneously determine the fractional third light of the system (l3). We therefore sequen-
tially refit the LC model parameters with fixed fractional third-light values ranging from
0 to 0.2 (see Figure 8). We repeated this routine with the I-band IAC80/HATNet LC as
well, although these results were not used because of their larger uncertainties. We obtained
an external estimate of the third-light fraction affecting the Sleuth observations using the
USNO-B catalog (Monet et al. 2003), which lists two dim objects within 30′′ of T-Lyr1-17236
(USNO-B1.0 1366-0314297 and 1366-0314302). Assuming that these objects are completely
blended into T-Lyr1-17236, we expect an R-band third-light fraction of l3 = 0.085 ± 0.018,
and we adopted this value for the r-band LC. Fortunately, the fitted parameters are quite
insensitive to third light, so that the uncertainty in l3 only moderately increases their un-

– 9 –
certainties. No objects were listed within the smaller photometric apertures of either IAC80
or HATNet, so we conclude that the I-band LC should have little or no third-light contam-
ination. It is important to note that these third-light estimates assume that there are no
further unresolved luminous objects that are blended with T-Lyr1-17236 (e.g., a hierarchical
tertiary component). However, the divergence of the r-band and I-band solutions at higher
third-light fractions (see Figure 8), and the deep primary eclipse in both the r- and I-bands
(0.649 mag and 0.604 mag, respectively), suggest that if such unresolved objects exist, they
are unlikely to account for more than ∼0.1 of the total flux, and therefore would not bias
the fitted results beyond the current estimated uncertainties. The final results of our LC fits
are given in Table 5.
6. Physical Parameters
The fundamental parameters of T-Lyr1-17236, such as their absolute masses and radii,
were derived by combining the results of the spectroscopic analysis (Table 6) with those
from the photometric analysis (Table 5). These and other physical properties are listed in
Table 7. Our estimates of the primary and secondary component masses, MA = 0.6795 ±0.0107 M⊙ and MB = 0.5226 ± 0.0061 M⊙, lead us to infer spectral types of K5V and M0V,
respectively, according to empirical tables (Cox 2000). We are not able to make independent
estimates of the effective temperatures of the stars from the data in hand. This could be
done, for example, if we had individual color indices based on combined light values and
light ratios in two different bands, but we can only derive a reliable estimate of the light
ratio in the r-band. The comparison with stellar evolution models by Baraffe et al. (1998) in
§ 8 suggests primary and secondary component temperatures of approximately 4150 K and
3700 K, respectively, although the accuracy of these values is difficult to assess.
No trigonometric parallax is available for T-Lyr1-17236. A rough distance estimate to
the system may be made using the JHKs brightness measurements in the 2MASS Catalog,
collected in Table 2, along with estimates of the absolute magnitudes. For these we must
rely once again on models. The Galactic latitude of +16.8◦ suggests the possibility of some
interstellar extinction. From the reddening maps of Schlegel et al. (1998) we infer E(B −V ) ≃ 0.07 in the direction of the object (total reddening), which corresponds to extinctions of
A(J) ≃ 0.061, A(H) ≃ 0.038, and A(K) ≃ 0.011, assuming RV = 3.1 (Cox 2000). Under the
further assumption that this extinction applies to T-Lyr1-17236, we derive a mean distance
of 230± 20 pc, after conversion of the near-infrared magnitudes in the CIT system from the
Baraffe et al. (1998) models to the 2MASS system, following Carpenter (2001). With the
proper motion components from the USNO-B Catalog listed in Table 2, the center-of-mass

– 10 –
velocity Vγ from the spectroscopic solution corrected for the velocity of GJ 182 (Montes et al.
2001), and the distance above, we infer space velocity components in the Galactic frame of
(U ,V ,W ) ≃ (+41,+21,+2) km s−1, where U points in the direction of the Galactic center.
Because of the relevance of the rotational velocities of the stars for the interpretation
of the chromospheric activity results of § 7, we have made an effort here to measure the
rotational broadening of both components from the widths of the cross-correlation functions
derived from our TRES spectra. We rely on the fact that to first order, the width of a cross-
correlation peak is approximately equal to the quadrature sum of the line broadening of the
two spectra. We began our estimation procedure by finding the effective resolution of the
instrument (σi) in the four TRES orders we used. This was done by auto-correlating a TRES
ThAr spectrum that was taken just before the second T-Lyr1-17236 observation. We found
that the four orders produced peaks with an average FWHM of 8.90 ± 0.17 km s−1. Thus,
assuming that the intrinsic widths of the ThAr emission lines are negligible compared to
the instrumental resolution, we found that σi = 6.29 ± 0.12 km s−1. This value corresponds
to a spectral resolving power of R = 47,630 ± 930, which is consistent with the TRES
specifications. Next, we determined the intrinsic spectral line broadening of the template
star, GJ 15A (σt). We auto-correlated the template spectrum and found that it produced
peaks with an average FWHM of 9.7 ± 1.4 km s−1. This value should be equal to√
2(σ2i +
σ2t )
1/2, from which we infer that σt = 2.7 ± 2.5 km s−1. Note that this result is well within
the upper bound provided by Delfosse et al. (1998), following their non-detection of any
rotational broadening in GJ 15A. Using this information, we can now find the intrinsic
spectral line broadening of the T-Lyr1-17236 components (σA,B). The average FWHM of the
primary and secondary peaks, resulting from the cross-correlation of each observed spectrum
of T-Lyr1-17236 against the template, were measured to be 12.6 ± 2.0 km s−1 and 12.0 ±2.4 km s−1, respectively. These widths are expected to be equal to [(σ2
i +σ2t )+(σ2
i +σ2A,B)]1/2,
from which we calculate that σA = 8.4 ± 3.0 km s−1 and σB = 7.6 ± 3.8 km s−1.
The rotational profile FWHM expected for a homogeneous stellar disk is√
3 v sin ir,
where v is the star’s equatorial rotational velocity, and ir is the inclination of its rotational
axis. Stellar limb darkening, however, will narrow the rotational profile, thus decreasing
the observed FWHM (Gray 1992). Adopting the R-band PHOENIX linear limb darkening
coefficients from Claret (1998), we find that the expected FWHM values for the primary
and secondary components of T-Lyr1-17236 are, respectively, 1.495 v sin ir and 1.499 v sin ir.
Using these results we can set upper bounds to the components’ v sin ir. These upper bounds
represent the limiting case whereby the spectral line broadening is due entirely to stellar
rotation, and we neglect all other line broadening mechanisms, such as microturbulence and
the Zeeman effect. We thus determine the maximum rotational velocities of the T-Lyr1-17236
primary and secondary components to be v sin ir = 5.6 ± 2.0 km s−1 and 5.1 ± 2.3 km s−1,

– 11 –
respectively.
An estimate of the timescale for tidal synchronization of the stars’ rotation with their
orbital motion may be obtained from theory following Zahn (1977), and assuming simple
power-law mass-radius-luminosity relations (Cox 2000). Thus, for stars less massive than
1.3 M⊙,
tsync ≃ 0.00672 Myr (k2/0.005)−1q−2(1 + q)2 (P/day)4 (M/M⊙)−4.82 , (1)
where k2 is determined by the structure and dynamics of the star and can be obtained by
interpolating published theoretical tables (Zahn 1994). This calculation leads to timescales
of tsync ≃ 0.56 Gyr and 1.02 Gyr for the primary and secondary components of T-Lyr1-17236,
respectively, which are much shorter than the circularization timescale determined in § 5. We
note that similar to the circularization timescale, the synchronization timescales estimated
above are the current instantaneous values, and are likely to have changed over time. The
age of the system is undetermined (see § 8), but assuming its age is at least a few Gyr, as is
typical for field stars, it would not be surprising if tidal forces between the components had
already synchronized their rotations. This is illustrated in Figure 1, where T-Lyr1-17236
is shown along with the other systems in Table 1 and with curves representing theoretical
estimates of the synchronization timescale as a function of orbital period.
If we assume that the components are indeed rotationally synchronized, we can compute
their rotational velocities more accurately using vA,B = 2πRA,B/P . We thus derive synchro-
nized velocities of (v sin ir)sync = 3.81 ± 0.26 km s−1 and 3.15 ± 0.31 km s−1 for the primary
and secondary components, respectively. These values are slightly below but still consistent
with the maximum rotational velocities measured above. Thus, observational evidence sug-
gests that the stars’ rotations may well be synchronized with their orbital motion, although
more precise measurements would be needed to confirm this. Our conclusion from this cal-
culation is that regardless of whether we assume that the components of T-Lyr1-17236 are
synchronized, their rotational velocities do not appear to be large.
7. Chromospheric Activity
Our absolute mass and radius determinations for T-Lyr1-17236 offer the possibility of
testing stellar evolution models in the lower main sequence, and in particular testing the idea
that the discrepancies noted in § 1 are related to chromospheric activity and the associated
magnetic fields in systems where the components are rotating relatively rapidly. Thus, es-
tablishing the level of the activity in the system presented here is of considerable importance.
We have shown in § 6 that the relatively long period of T-Lyr1-17236 (P ≃ 8.429441 days)

– 12 –
implies that even if the components are synchronized, their rotational velocities are slow,
and therefore are not expected to induce a great deal of chromospheric activity. However,
demonstrating that the stars are indeed inactive requires more direct evidence, given that
some stars of similar masses as these are still found to be quite active at rotation periods
as long as 8 days (see, e.g., Pizzolato et al. 2003). We present here the constraints avail-
able on the surface activity of T-Lyr1-17236 from its X-ray emission, optical variations, and
spectroscopic indicators.
The present system has no entry in the ROSAT Faint Source Catalog (Voges et al. 1999),
suggesting the X-ray luminosity, usually associated with activity, is not strong. Examination
of the original ROSAT archive images leads to a conservative upper limit to the X-ray flux
of 6.71× 10⁻¹⁴ erg cm−2 s−1 in the energy range 0.1–2.4 keV, and together with information
from Table 7, we infer an upper limit for the ratio of the X-ray to bolometric luminosity of
log LX/Lbol . −3.13 . Values for the four best studied cases of CM Dra, YY Gem, CU Cnc,
and GU Boo, which are all very active, are respectively −3.15, −2.88, −3.02, and −2.90
(see Lopez-Morales 2007). These are at the level of our limit or higher, although we do not
consider this evidence conclusive.
There are no detectable variations in the r-band light curve out of eclipse, within the
uncertainties. Such variations would be expected from activity-related surface features show-
ing significant contrast with the photospheres. We estimate an upper limit of ∼0.01 mag
in r for the night-to-night variations (see Figure 3). Because the secondary components is
significantly dimmer, it has a weaker variability upper limit of ∼0.09 mag. We note, how-
ever, that this evidence for inactivity is not conclusive either, since the observed photometric
variations can depend significantly on the distribution of spots on the surface.
A number of spectroscopic activity indicators (the Ca II H and K lines, Hα, etc.)
should in principle allow a more direct assessment of the activity level in T-Lyr1-17236.
Unfortunately, however, the quality of our spectroscopic material in the optical makes this
difficult. The flux in the blue for this very red system is too low to distinguish the Ca II H
and K lines, and even at Hα the noise is considerable (typical signal-to-noise ratios at this
wavelength are ∼12 pixel−1). Two of the three TRES spectra show the Hα line in absorption,
and the other appears to show Hα in emission. This suggests some degree of chromospheric
activity, although perhaps not at such a high level as to sustain the emission at all times, as
is seen in other stars. Hβ appears to be in absorption in all three TRES spectra.
Clearly more spectra with higher signal-to-noise ratios are needed to better characterize
the level of activity, but from the sum of the evidence above it would not appear that the
activity in T-Lyr1-17236 is as high as in other low-mass eclipsing binaries studied previously,
thus more closely aligning it with the assumptions of current standard stellar models. The

– 13 –
system may therefore constitute a useful test case for confirming or refuting the magnetic
disruption hypothesis (see § 1), which predicts that the absolute properties of its slowly
rotating components should match the theoretical models of convective stars.
8. Comparison with Models and Conclusions
A comparison with solar-metallicity models by Baraffe et al. (1998) for a mixing length
parameter of αML = 1.0 is presented in Figure 9. Our mass and radius determinations for
T-Lyr1-17236 (see Table 7) are shown along with those of the low-mass systems listed in Ta-
ble 1. The location of the models in this diagram depends only slightly on age because these
stars evolve very slowly. The age of T-Lyr1-17236 is difficult to establish independently. The
space motions derived in § 6 do not associate the system with any known moving group, and
are quite typical of the thin disk. Thus, all we can say is that it is not likely to be very
old. We display in Figure 9 two models for ages of 1 Gyr and 10 Gyr, which likely bracket
the true age of T-Lyr1-17236. Within the errors, our measurements for the two components
are consistent with the models, which would in principle support the magnetic disruption
hypothesis. Unfortunately, however, the uncertainties in the radius measurements (∼7%
and ∼10%) are still large enough that our statement cannot be made more conclusive. Fur-
ther follow-up observations, especially rapid-cadence and precise photometric measurements
during multiple eclipses, should significantly reduce the uncertainties in the radii and thus
provide far stronger constraints on the theoretical models of low-mass stars. Additionally,
higher-quality spectroscopic observations than ours are needed to confirm that the level of
chromospheric activity in the system is relatively low. If after such observations, the masses
and radii of the T-Lyr1-17236 components remain consistent with the stellar models, then
the magnetic disruption hypothesis will be strengthened. However, if further observations
find that the components of T-Lyr1-17236 are larger than predicted by current stellar mod-
els, as is the case with most other similar systems investigated in sufficient detail, then this
will provide evidence that additional mechanisms need to be included in the models of the
structure of low-mass main sequence stars (see, e.g., Chabrier et al. 2007).
It is important to note here that T-Lyr1-17236 falls within the field of view of the up-
coming NASA Kepler Mission (Borucki et al. 2003). The Kepler Mission will not return data
for all stars within its field of view; rather, the targets will be selected by the Kepler team.
We see at least two reasons why such monitoring of T-Lyr1-17236 would be of significant
value. First, the data would greatly refine the estimates of the physical parameters of the
component stars and may permit a search for their asteroseismological modes. Second, the
data would enable a search for transits of exoplanets, which are expected to orbit in the

– 14 –
same plane as that defined by the stellar orbits.
Finally, we note that our findings in this paper confirm the accuracy of the MECI
algorithm (see Figure 2), which can be further used to find additional long-period low-mass
EBs, and indeed a variety of other interesting targets. We have shown in a recent paper
(Devor et al. 2008) how this can be done with comparable ease by systematically searching
the ever-growing body of LC survey datasets. We hope that this new approach for locating
rare EBs will motivate additional studies of these vast, largely untapped datasets, which
likely harbor a wealth of information on the formation, structure, dynamics, and evolution
of stars.
We would like to thank Joel Hartman and Doug Mink for their help in operating a few of
the software analysis tools used for this paper, and we would like to thank Sarah Dykstra for
her editorial assistance. Valeri Hambaryan provided expert assistance in examining archival
ROSAT images of T-Lyr1-17236, for which we are grateful, and we thank the referee for
a number of helpful comments that have improved the paper. GT acknowledges partial
support from NSF grant AST-0708229 and NASA’s MASSIF SIM Key Project (BLF57-04).
This research has made use of NASA’s Astrophysics Data System Bibliographic Services, as
well as the SIMBAD database operated at CDS, Strasbourg. This publication also used data
products from the Two Micron All Sky Survey, which is a joint project of the University
of Massachusetts and the Infrared Processing and Analysis Center/California Institute of
Technology, and is funded by NASA and NSF. Some of the data presented herein were
obtained at the W.M. Keck Observatory, which is operated as a scientific partnership among
Caltech, the University of California and NASA. The Observatory was made possible by the
generous financial support of the W.M. Keck Foundation. The authors wish to recognize
and acknowledge the very significant cultural role and reverence that the summit of Mauna
Kea has always had within the indigenous Hawaiian community. We are most fortunate to
have the opportunity to conduct observations from this mountain.
REFERENCES
Alonso, R., et al. 2004, ApJ, 613, L153
Andersen, J. 1991, A&A Rev., 3, 91
Andersen, J. 1998, IAU Symp. 189: Fundamental Stellar Properties, 189, 99
Bakos, G. A., Lazar, J., Papp, I., Sari, P., & Green, E. M. 2002, PASP, 114, 974

– 15 –
Bakos, G., Noyes, R. W., Kovacs, G., Stanek, K. Z., Sasselov, D. D., & Domsa, I. 2004,
PASP, 116, 266
Baraffe, I., Chabrier, G., Allard, F., & Hauschildt, P. H. 1998, A&A, 337, 403
Becker, A. C., et al. 2008, MNRAS, 386, 416
Berger, D. H., et al. 2006, ApJ, 644, 475
Blake, C. H., Torres, G., Bloom, J. S., & Gaudi, B. S. 2007, ArXiv e-prints, arXiv:0707.3604
Blake, C. H., Charbonneau, D., White, R. J., Torres, G., Marley, M. S., & Saumon, D. 2008,
ApJ, 678, L125
Borucki, W. J., et al. 2003, Proc. SPIE, 4854, 129
Browning, M. K., & Basri, G. 2007, American Institute of Physics Conference Series, 948,
157
Carpenter, J. M. 2001, AJ, 121, 2851
Chabrier, G., & Baraffe, I. 2000, ARA&A, 38, 337
Chabrier, G., Gallardo, J., & Baraffe, I. 2007, A&A, 472, L17
Claret, A. 1998, A&A, 335, 647
Cox, A. N. 2000, Allen’s astrophysical quantities (New York: AIP Press; Springer)
Creevey, O. L., et al. 2005, ApJ, 625, L127
Delfosse, X., Forveille, T., Perrier, C., & Mayor, M. 1998, A&A, 331, 581
Delfosse, X., Forveille, T., Mayor, M., Burnet, M., & Perrier, C. 1999, A&A, 341, L63
Devor, J. 2005, ApJ, 628, 411
Devor, J., & Charbonneau, D. 2006a, Ap&SS, 304, 351
Devor, J., & Charbonneau, D. 2006b, ApJ, 653, 648
Devor, J., Charbonneau, D., O’Donovan, F. T., Mandushev, G., & Torres G. 2008, AJ, 135,
850
Dunham, E. W., Mandushev, G. I., Taylor, B. W., & Oetiker, B. 2004, PASP, 116, 1072

– 16 –
Etzel, P. B. 1981, Photometric and Spectroscopic Binary Systems, 111
Evans, D. W., Irwin, M. J., & Helmer, L. 2002, A&A, 395, 347
Galan, M. J., & Cobos, F. J. 1987, Revista Mexicana de Astronomia y Astrofisica, 14, 767
Gray, D. F. 1992, The Observation and Analysis of Stellar Photospheres (Cambridge, UK:
Cambridge Univ. Press), 368
Hebb, L., Wyse, R. F. G., Gilmore, G., & Holtzman, J. 2006, AJ, 131, 555
Horne, K. 1986, PASP, 98, 609
Kim, Y., Demarque, P., Yi, S. K., & Alexander, D. R. 2002, ApJS, 143, 499
Kron, G. E. 1952, ApJ, 115, 301
Lacy, C. H. 1977a, ApJS, 34, 479
Lacy, C. H. 1977b, ApJ, 218, 444
Lane, B. F., Boden, A. F., & Kulkarni, S. R. 2001, ApJ, 551, L81
Lopez-Morales, M., & Ribas, I. 2005, ApJ, 631, 1120
Lopez-Morales, M., Orosz, J. A., Shaw, J. S., Havelka, L., Arevalo, M. J., McIntyre, T., &
Lazaro, C. 2006, ArXiv e-prints, arXiv:astro-ph/0610225
Lopez-Morales, M. 2007, ApJ, 660, 732
Maceroni, C., & Montalban, J. 2004, A&A, 426, 577
Mandushev, G., et al. 2005, ApJ, 621, 1061
Maxted, P. F. L., O’Donoghue, D., Morales-Rueda, L., Napiwotzki, R., & Smalley, B. 2007,
MNRAS, 376, 919
Mazeh, T. 2008, EAS Publications Series, 29, 1
McLean, I. S., et al. 1998, Proc. SPIE, 3354, 566
McLean, I. S., Graham, J. R., Becklin, E. E., Figer, D. F., Larkin, J. E., Levenson, N. A.,
& Teplitz, H. I. 2000, Proc. SPIE, 4008, 1048
Metcalfe, T. S., Mathieu, R. D., Latham, D. W., & Torres, G. 1996, ApJ, 456, 356

– 17 –
Monet, D. G., et al. 2003, AJ, 125, 984
Montes, D., Lopez-Santiago, J., Galvez, M. C., Fernandez-Figueroa, M. J., De Castro, E., &
Cornide, M. 2001, MNRAS, 328, 45
Morrison, J. E., Roser, S., McLean, B., Bucciarelli, B., & Lasker, B. 2001, AJ, 121, 1752
Nelson, B., & Davis, W. D. 1972, ApJ, 174, 617
O’Donovan, F. T., Charbonneau, D., & Kotredes, L. 2004, The Search for Other Worlds,
AIP Conference Proceedings, 713, 169
O’Donovan, F. T., et al. 2006, ApJ, 644, 1237
O’Donovan, F. T., et al. 2007, ApJ, 662, 658
Pizzolato, N., Maggio, A., Micela, G., Sciortino, S., & Ventura, P. 2003, A&A, 397, 147
Popper, D. M., & Etzel, P. B. 1981, AJ, 86, 102
Press, W. H., Teukolsky, S. A., Vetterling, W. T., & Flannery, B. P. 1992, Numerical Recipes
in C. The Art of Scientific Computing (Cambridge, UK: Cambridge Univ. Press)
Ribas, I. 2003, A&A, 398, 239
Ribas, I. 2006, Ap&SS, 304, 87
Schlegel, D. J., Finkbeiner, D. P., & Davis, M. 1998, ApJ, 500, 525
Segransan, D., Kervella, P., Forveille, T., & Queloz, D. 2003, A&A, 397, L5
Skrutskie, M. F., et al. 2006, AJ, 131, 1163
Southworth, J., Maxted, P. F. L., & Smalley, B. 2004a, MNRAS, 351, 1277
Southworth, J., Zucker, S., Maxted, P. F. L., & Smalley, B. 2004b, MNRAS, 355, 986
Southworth, J., Smalley, B., Maxted, P. F. L., Claret, A., & Etzel, P. B. 2005, MNRAS, 363,
529
Szentgyorgyi, A. H., & Furesz, G. 2007, Revista Mexicana de Astronomia y Astrofisica
Conference Series, 28, 129
Torres, G., & Ribas, I. 2002, ApJ, 567, 1140

– 18 –
Torres, G., Lacy, C. H., Marschall, L. A., Sheets, H. A., & Mader, J. A. 2006, ApJ, 640,
1018
Voges et al. 1999, A&AS, 349, 389
Yi, S., Demarque, P., Kim, Y.-C., Lee, Y.-W., Ree, C. H., Lejeune, T., & Barnes, S. 2001,
ApJS, 136, 417
Young, T. B., Hidas, M. G., Webb, J. K., Ashley, M. C. B., Christiansen, J. L., Derekas, A.,
& Nutto, C. 2006, MNRAS, 370, 1529
Zahn, J.-P. 1977, A&A, 57, 383
Zahn, J.-P. 1978, A&A, 67, 162
Zahn, J.-P., & Bouchet, L. 1989, A&A, 223, 112
Zahn, J.-P. 1994, A&A, 288, 829
Zucker, S. 2003, MNRAS, 342, 1291
This preprint was prepared with the AAS LATEX macros v5.2.
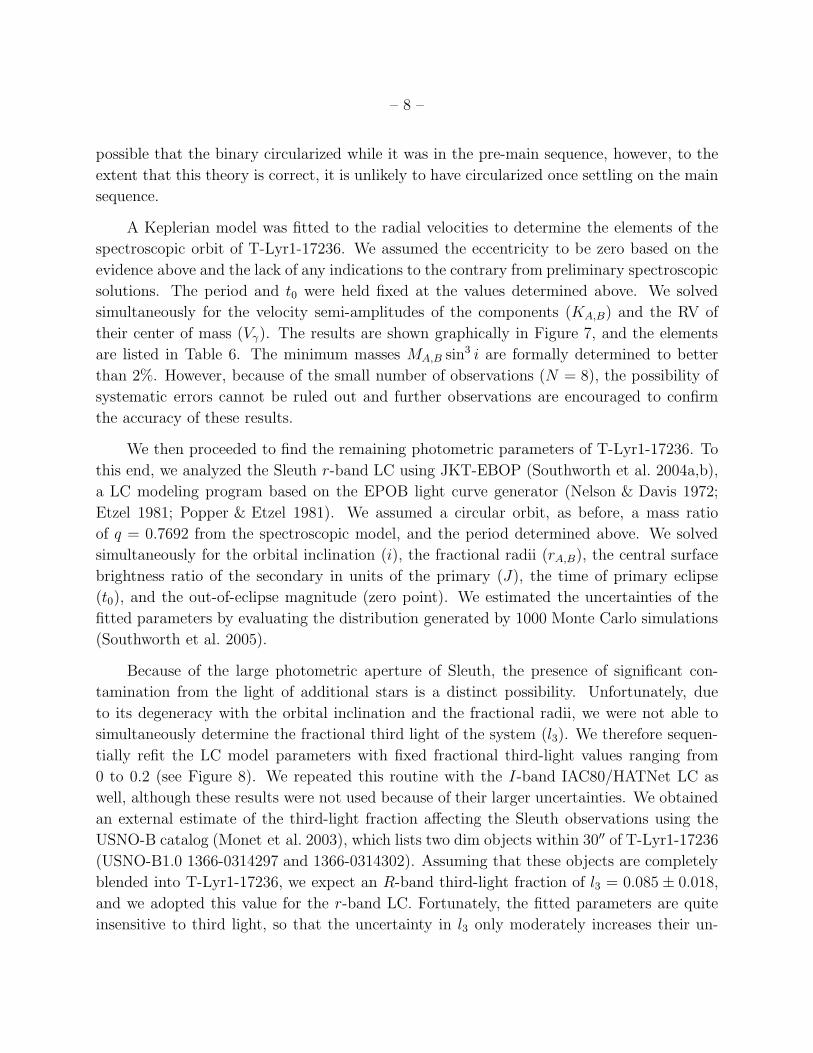
– 19 –
Table 1. Periods of well characterized main sequence EBs with both component masses
below 0.8 M⊙
Name Period [days] Citation
OGLE BW5 V38a 0.198 Maceroni & Montalban (2004)
RR Caelib 0.304 Maxted et al. (2007)
NSVS01031772 0.368 Lopez-Morales et al. (2006)
SDSS-MEB-1 0.407 Blake et al. (2007)
GU Boo 0.489 Lopez-Morales & Ribas (2005)
2MASS J04463285+1901432 0.619 Hebb et al. (2006)
YY Gem 0.814 Kron (1952); Torres & Ribas (2002)
T-Her0-07621 1.121 Creevey et al. (2005)
CM Dra 1.268 Lacy (1977b); Metcalfe et al. (1996)
UNSW-TR-2 2.117 Young et al. (2006)
2MASS J01542930+0053266 2.639 Becker et al. (2008)
CU Cnc 2.771 Delfosse et al. (1999); Ribas (2003)
aThis binary might not be detached, as its components seem to be undergoing significant
mutual heating and tidal interactions due to their proximity (a = 1.355 ± 0.066R⊙).
bThis is an unusual case of an EB containing a white-dwarf (primary) and an M-dwarf
(secondary). As such, the primary component is likely to have transferred mass to the
secondary component, and perhaps even enveloped it during the red-giant phase of its
evolution.
Table 2. Catalog information for T-Lyr1-17236
Source Catalog Parameter Value
2MASSa α (J2000) 19:07:16.621
2MASS δ (J2000) +46:39:53.21
USNO-Bb B mag 16.11 ± 0.2
GSC2.3c V mag 14.37 ± 0.28
USNO-B R mag 14.41 ± 0.2
CMC14d r′ mag 14.073 ± 0.029
2MASS J mag 12.019 ± 0.015
2MASS H mag 11.399 ± 0.015
2MASS Ks mag 11.235 ± 0.015
USNO-B µα (mas yr−1) −2 ± 3
USNO-B µδ (mas yr−1) −28 ± 2
2MASS identification 19071662+4639532
CMC14 identification 190716.6+463953
GSC2.3 identification N2EH033540
USNO-B identification 1366-0314305
aTwo Micron All Sky Survey catalog (Skrutskie et al.
2006).
bU.S. Naval Observatory photographic sky survey
(Monet et al. 2003).
cGuide Star Catalog, version 2.3.2 (Morrison et al. 2001).
dCarlsberg Meridian Catalog 14 (Evans et al. 2002).

– 20 –
Table 3. Radial velocity measurements for T-Lyr1-17236 in the barycentric frame, relative
to GJ 182
Epoch (BJD)Primary RV
(km s−1)
Secondary RV
(km s−1)
Exposure Time
(sec)Template Instrument
2453927.9400 −2.87 −45.24 480 GJ 182 NIRSPEC
2453930.9258 −68.09 38.85 900 GJ 182 NIRSPEC
2453946.8846 −64.26 36.53 600 GJ 182 NIRSPEC
2453948.9100 −43.45 7.03 420 GJ 182 NIRSPEC
2454312.7985 7.66 −57.68 480 GJ 182 NIRSPEC
2454372.6179 23.99 −80.14 900 GJ 15A TRES
2454377.6382 −68.03 40.10 1000 GJ 15A TRES
2454377.6624 −67.97 39.73 1000 GJ 15A TRES
Table 4. Eclipse timings measured for T-Lyr1-17236
Eclipse Type Epoch (HJD) O-C [sec] Data Source
Primary 2453152.96121 −299+232−236
HATNet
Secondary 2453157.17593 −546+6868−849
HATNet
Primary 2453169.82009 48+126−131
HATNet
Primary 2453186.67897 237+214−221
HATNet
Secondary 2453190.89369 −231+431−423
HATNet
Primary 2453195.10841 −333+263−238
HATNet
Secondary 2453207.75258 225+642−648
HATNet
Secondary 2453544.93022 −452+346−332
Sleuth
Secondary 2453561.78910 312+97−98
Sleuth + PSST
Secondary 2453578.64798 515+206−208
Sleuth
Primary 2453582.86270 159+99−98
Sleuth
Primary 2453599.72158 94+64−64
Sleuth
Secondary 2453603.93630 1047+424−371
Sleuth + PSST
Primary 2453616.58046 −57+175−175
Sleuth
Primary 2453861.03425 238+280−233
PSST
Primary 2454417.37736 −1+10−10
IAC80
Table 5. Photometric parameters of T-Lyr1-17236
Parameter Symbol Value
Period (days) P 8.429441 ± 0.000033
Epoch of eclipse (HJD) t0 2453700.87725 ± 0.00041
Primary fractional radius rA 0.0342 ± 0.0023
Secondary fractional radius rB 0.0283 ± 0.0028
Orbital inclination [deg] i 89.02 ± 0.26
Eccentricity e 0.0 (fixed)
Sum of fractional radii rA + rB 0.06256 ± 0.00095
Ratio of radii (RB/RA) k 0.83 ± 0.15
Light ratio (r-band) LB/LA 0.173 ± 0.073
Surface brightness ratio (r-band) JB/JA 0.2525 ± 0.0099

– 21 –
Table 6. Spectroscopic parameters of T-Lyr1-17236
Parameter Symbol Value
Primary radial velocity semi-amplitude (km s−1) KA 48.36 ± 0.23
Secondary radial velocity semi-amplitude (km s−1) KB 62.86 ± 0.46
Barycentric radial velocity, relative to GJ 182a (km s−1) Vγ −21.01 ± 0.18
Binary separation with projection factor (R⊙) a sin i 18.526 ± 0.083
Primary mass with projection factor (M⊙) MA sin3 i 0.6792 ± 0.0107
Secondary mass with projection factor (M⊙) MB sin3 i 0.5224 ± 0.0061
Mass ratio (MB/MA) q 0.7692 ± 0.0069
aMontes et al. (2001) list the radial velocity of GJ 182 as +32.4 ± 1.0 km s−1.
Table 7. System parameters of T-Lyr1-17236
Parameter Symbol Component A Component B
Mass (M⊙) M 0.6795 ± 0.0107 0.5226 ± 0.0061
Radius (R⊙) R 0.634 ± 0.043 0.525 ± 0.052
Log surface gravity (cgs) log g 4.666 ± 0.059 4.718 ± 0.086
Semimajor axis (106 km) a 5.606 ± 0.027 7.288 ± 0.053
Maximum rotational velocitya (km s−1) v sin ir 5.6 ± 2.0 5.1 ± 2.3
Synchronized rotational velocitya (km s−1) (v sin ir)sync 3.81 ± 0.26 3.15 ± 0.31
Absolute visual magnitudeb (mag) MV 8.03 9.67
Bolometric luminosityb (L⊙) L 0.110 0.039
Effective temperatureb (K) Teff 4150 3700
Distanceb (pc) D 230 ± 20
aSee description in §6.
bInferred using stellar evolution models by Baraffe et al. (1998) assuming solar metallicity and an age
of 2.5 Gyr.

– 22 –
Fig. 1.— The predicted synchronization timescales due to turbulent dissipation (Zahn 1977,
1994) for well characterized low-mass EBs from Table 1. The lines trace constant synchro-
nization timescales of binary components for which q = 1 (see §6 for further details on this
calculation). The black circles indicate primary components and the grey circles indicate
secondary components. Note that in some cases the primary and secondary symbols nearly
overlap.
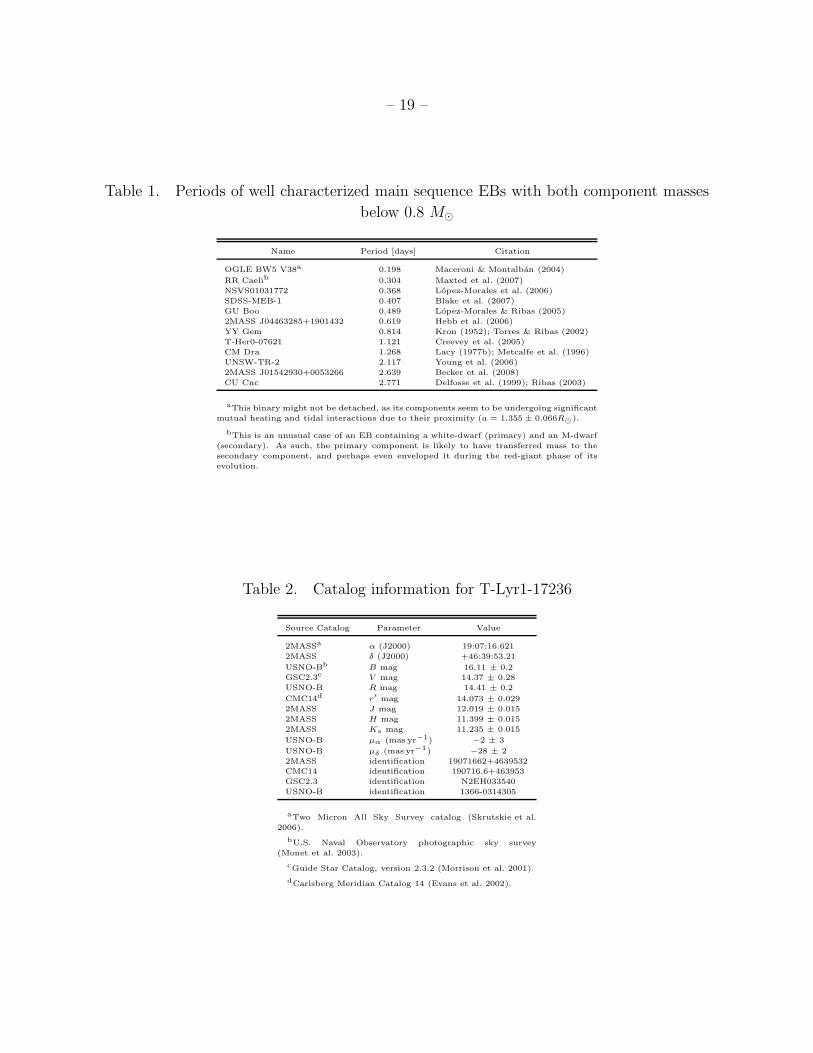
– 23 –
Fig. 2.— The mass-mass likelihood plot for T-Lyr1-17236 created with MECI, using the
Baraffe et al. (1998) isochrones for an age of 2.5 Gyr. This analysis incorporated the r-band
LC and the 2MASS colors of the target. The contour lines indicate the weighted reduced
chi-squared values of each component mass pairing, using w = 10 (Devor & Charbonneau
2006b). The white point indicates the our final mass estimate from this paper, and the white
square approximates our current mass uncertainties.

– 24 –
Phase-0.25 0.00 0.25 0.50 0.75
No
rmal
ized
Mag
nit
ud
e -0.25
0.00
0.25
0.50
0.75
1.00
1.25
1.50
T-Lyr1-17236 r/R-mag + 0.75(Sleuth & PSST)
T-Lyr1-17236 I-mag(IAC80 & HAT)
Fig. 3.— Phased light curves of T-Lyr1-17236. The top curve is from the IAC80 (black) and
HATNet (grey) telescopes, both of which observed in I-band. Note the tight cluster of IAC80
observations near phase 0.7; these points determine the IAC80 LC zero point. The bottom
curve is from the Sleuth (black) and PSST (grey) telescopes, which observe, respectively, in
the r-band and R-band. The secondary eclipse is about twice as deep in the I-band as it
is in the r- or R-bands, indicating that the secondary component is significantly redder and
therefore cooler than the primary.
– 25 –
r-band
X Data
-0.02 -0.01 0.00 0.01 0.49 0.50 0.51 0.52
No
rmal
ized
Mag
nit
ud
e
-0.2
0.0
0.2
0.4
0.6
-0.02 -0.01 0.00 0.01 0.49 0.50 0.51 0.52
Res
idu
als
-0.1
0.0
0.1
Phase
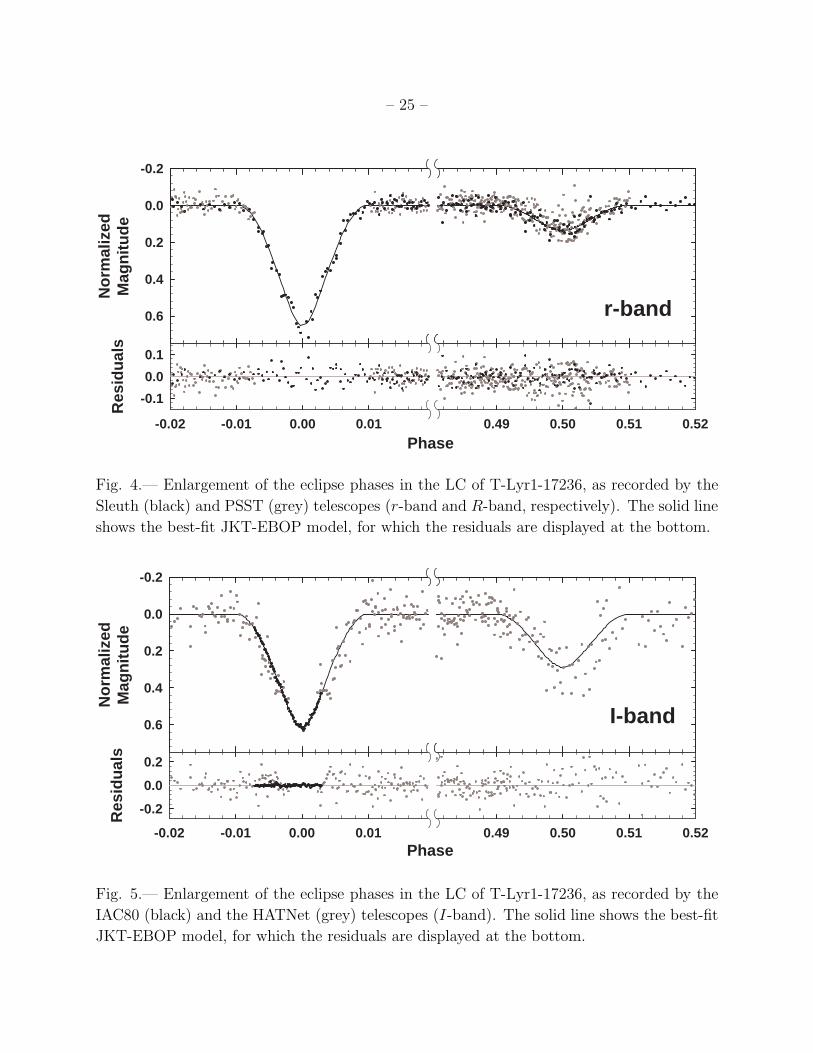
Fig. 4.— Enlargement of the eclipse phases in the LC of T-Lyr1-17236, as recorded by the
Sleuth (black) and PSST (grey) telescopes (r-band and R-band, respectively). The solid line
shows the best-fit JKT-EBOP model, for which the residuals are displayed at the bottom.
I-band
-0.02 -0.01 0.00 0.01 0.49 0.50 0.51 0.52
No
rmal
ized
Mag
nit
ud
e
-0.2
0.0
0.2
0.4
0.6
-0.02 -0.01 0.00 0.01 0.49 0.50 0.51 0.52
Res
idu
als
-0.2
0.0
0.2
Phase
Fig. 5.— Enlargement of the eclipse phases in the LC of T-Lyr1-17236, as recorded by the
IAC80 (black) and the HATNet (grey) telescopes (I-band). The solid line shows the best-fit
JKT-EBOP model, for which the residuals are displayed at the bottom.

– 26 –
Fig. 6.— Eclipse timing (O−C) measurements of T-Lyr1-17236. The solid triangles indicate
primary eclipses, and the starred symbols indicate secondary eclipses. The large error bars
are generally due to eclipses that are constrained by only a few observations, or for which only
the ingress or egress was observed. The cluster of points at the very left (HJD < 2,453,300)
are measurements from HATNet, the single data point at HJD 2,454,417 is from the IAC80,
and the remaining data are from Sleuth and PSST. The two parallel dashed lines indicate
the expected O−C location of the primary (bottom) and secondary (top) eclipses, in the
best-fit eccentric model (|e cos ω| ≃ 0.0005). This eccentric model provides only a very
small improvement in the fit compared to the circular model (F-test: χ2ν,circ/χ
2ν,ecc ≃ 1.29,
indicating a p ≃ 0.33 significance).
– 27 –
0.0 0.2 0.4 0.6 0.8 1.0
Rad
ial V
elo
city
[km
/sec
]
-80
-60
-40
-20
0
20
40
0.0 0.2 0.4 0.6 0.8 1.0
Pri
mar
yR
esid
ual
s[k
m/s
ec]
-3
0
3
Photometric Phase
0.0 0.2 0.4 0.6 0.8 1.0
Sec
on
dar
yR
esid
ual
s[k
m/s
ec]
-3
0
3
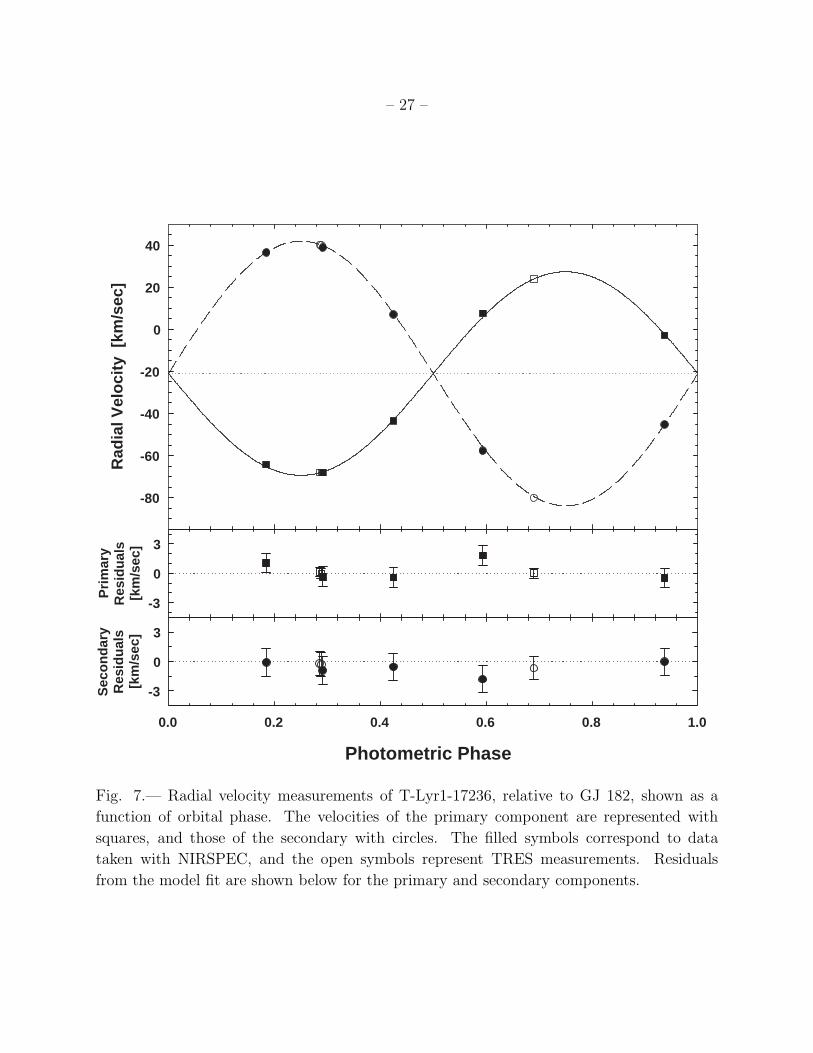
Fig. 7.— Radial velocity measurements of T-Lyr1-17236, relative to GJ 182, shown as a
function of orbital phase. The velocities of the primary component are represented with
squares, and those of the secondary with circles. The filled symbols correspond to data
taken with NIRSPEC, and the open symbols represent TRES measurements. Residuals
from the model fit are shown below for the primary and secondary components.

– 28 –
Fig. 8.— The JKT-EBOP parameter fits over a range of values for the third light fraction.
The panels show the best-fit values and uncertainties for: (A) The fractional radii of the
primary (rA), and (B) secondary (rB) components; (C) The sum of the fractional radii
(rA + rB), and (D) the radius ratio (k = rB/rA); (E) The binary orbital inclination (i), and
(F) the central surface brightness ratio (J , secondary over primary). Note that in contrast
to other panels, panel (F) shows distinct values for the I- and r-band LCs. This is expected
since the two components have different colors, and therefore different relative fluxes through
different filters. In all cases the estimated third light fractions for the r-band and the I-band
LCs are indicated by boxes.

– 29 –
Fig. 9.— Mass-radius diagram for T-Lyr1-17236 and other low-mass eclipsing binaries under
0.8 M⊙ from Table 1. Theoretical isochrones for solar metallicity from Baraffe et al. (1998)
are shown for ages of 1 and 10 Gyr. The components of T-Lyr1-17236 are indicated with
arrows. Most of these binary components (particularly those with smaller uncertainties)
display a systematic offset in which their measured radii are larger than predicted from
models.
Related Documents