INTEGRAL-BASED IDENTIFICATION OF A INTEGRAL-BASED IDENTIFICATION OF A PHYSIOLOGICAL INSULIN AND GLUCOSE PHYSIOLOGICAL INSULIN AND GLUCOSE MODEL ON EUGLYCAEMIC CLAMP AND MODEL ON EUGLYCAEMIC CLAMP AND IVGTT TRIALS IVGTT TRIALS T Lotz 1 , J G Chase 1 , K A McAuley 2 , J Lin 1 , J Wong 1 , C E Hann 1 and S Andreassen 3 1 Centre for Bioengineering, University of Canterbury, Christchurch, New Zealand 2 Edgar National Centre for Diabetes Research, University of Otago, Dunedin, New Zealand 3 Centre for Model-based Medical Decision Support, Aalborg University, Denmark

T Lotz 1 , J G Chase 1 , K A McAuley 2 , J Lin 1 , J Wong 1 , C E Hann 1 and S Andreassen 3
Dec 30, 2015
INTEGRAL-BASED IDENTIFICATION OF A PHYSIOLOGICAL INSULIN AND GLUCOSE MODEL ON EUGLYCAEMIC CLAMP AND IVGTT TRIALS. T Lotz 1 , J G Chase 1 , K A McAuley 2 , J Lin 1 , J Wong 1 , C E Hann 1 and S Andreassen 3 1 Centre for Bioengineering, University of Canterbury, Christchurch, New Zealand - PowerPoint PPT Presentation
Welcome message from author
This document is posted to help you gain knowledge. Please leave a comment to let me know what you think about it! Share it to your friends and learn new things together.
Transcript

INTEGRAL-BASED IDENTIFICATION OF A INTEGRAL-BASED IDENTIFICATION OF A PHYSIOLOGICAL INSULIN AND GLUCOSE PHYSIOLOGICAL INSULIN AND GLUCOSE MODEL ON EUGLYCAEMIC CLAMP AND MODEL ON EUGLYCAEMIC CLAMP AND
IVGTT TRIALS IVGTT TRIALS
T Lotz1, J G Chase1, K A McAuley2, J Lin1, J Wong1, C E Hann1 and S Andreassen3
1Centre for Bioengineering, University of Canterbury, Christchurch, New Zealand2Edgar National Centre for Diabetes Research, University of Otago, Dunedin, New Zealand
3Centre for Model-based Medical Decision Support, Aalborg University, Denmark
Why model glucose and insulin Why model glucose and insulin kinetics?kinetics?
• Glycaemic control from critically ill to diabetic individuals– Tight glycaemic control in ICU reduces mortality by up to 45%
– Type 1 and insulin dependent Type 2 diabetes growing rapidly
• Diagnosis of insulin resistance– Requires knowledge of glucose and insulin kinetics
– Currently, diagnosis occurs ~7 years after initial occurrence
• Current models not physiological, difficult to identify, or do not provide high resolution in clinical validation!

ID - GoalsID - Goals
1. Physiologically accurate model identification• Higher predictive power and resolution
2. Simple application in a clinical setting• Simple identification without the need of complicated tests
(minimal data required)• Use population parameters where possible, fit critical
parameters• Computationally efficient
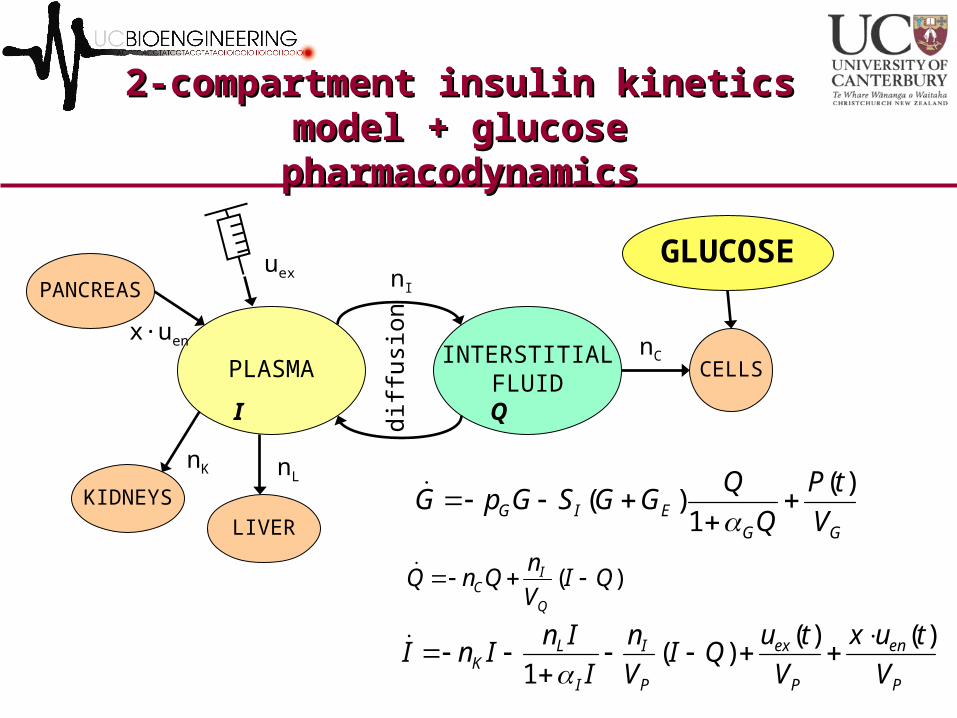
2-compartment insulin kinetics model 2-compartment insulin kinetics model + glucose pharmacodynamics+ glucose pharmacodynamics
PLASMAINTERSTITIAL
FLUID
KIDNEYS
LIVER
diff
usio
nCELLS
PANCREAS
nC
nK nL
nI
x·uen
uexGLUCOSE
GGEIG V
tP
Q
QGGSGpG
)(
1)(
P
en
P
ex
P
I
I
LK V
tux
V
tuQI
V
n
I
InInI
)()()(
1
)( QIV
nQnQ
Q
IC
I Q
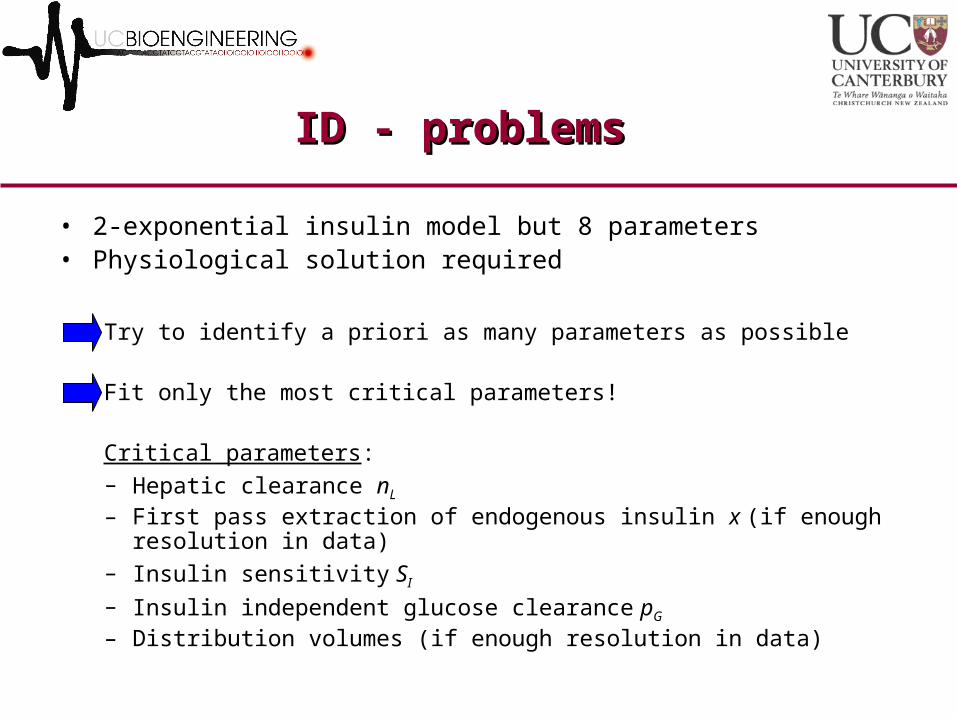
ID - problemsID - problems
• 2-exponential insulin model but 8 parameters• Physiological solution required
Try to identify a priori as many parameters as possible
Fit only the most critical parameters!
Critical parameters:– Hepatic clearance nL
– First pass extraction of endogenous insulin x (if enough resolution in data)– Insulin sensitivity SI
– Insulin independent glucose clearance pG
– Distribution volumes (if enough resolution in data)

A priori ID - Similarities with A priori ID - Similarities with C-peptideC-peptide
PLASMAVP
INTERSTITIALFLUID
VQ
KIDNEYS
PANCREAS
nK
nI
uen
PLASMAVP
INTERSTITIALFLUID
VQ
KIDNEYSLIVER
CELLS
PANCREAS
nC
nK
nL
nI
x·uen
Additional losses
C-peptide(Van Cauter et al 1992)
Insulin
Equimolarsecretion

A priori ID – insulin modelA priori ID – insulin model
• Distribution volumes (VP, VQ), transcapillary diffusion (nI), kidney clearance (nK) assumed to match values for C-peptide (similar molecular size, equimolar secretion)
• Parameters taken from well validated population model for C-peptide kinetics(Van Cauter et al. 1992)
• Saturation of hepatic clearance (αI) fixed from published literature
• Clearance by the cells (nC) fixed to achieve ss-concentration gradient between the compartments (Iss/Qss=5/3) (Sjostrand et al 2005)
1 (2) key insulin parameters to be estimated, liver clearance nL (+ first pass hepatic extraction x if data available)
P
en
P
ex
P
I
I
LK V
tux
V
tuQI
V
n
I
InInI
)()()(
1
)( QI
V
nQnQ
Q
IC

A priori ID – glucose modelA priori ID – glucose model
• Glucose clearance saturation αG= 1/65 (from literature mean, validated in glycemic control trials)
• Equilibrium glucose concentration GE= fasting glucose level
• Glucose distribution volume VG= 0.19 x body weight (can be estimated if data allows)
• Estimate pG, SI, (VG)
GGEIG V
tP
Q
QGGSGpG
)(
1)(
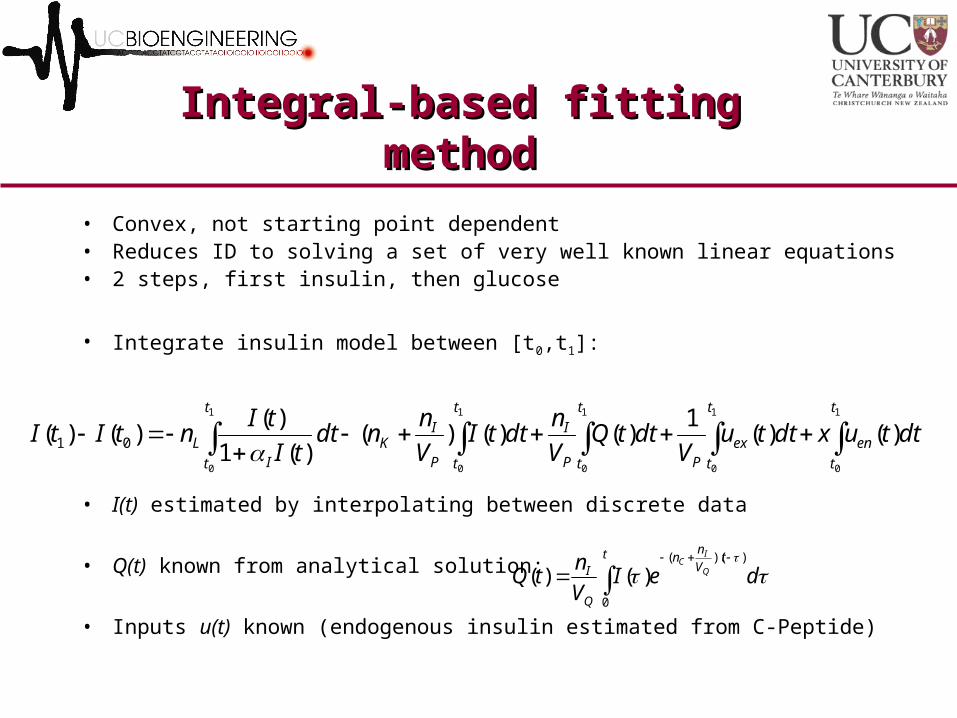
Integral-based fitting methodIntegral-based fitting method
• Convex, not starting point dependent• Reduces ID to solving a set of very well known linear equations• 2 steps, first insulin, then glucose
• Integrate insulin model between [t0,t1]:
• I(t) estimated by interpolating between discrete data
• Q(t) known from analytical solution:
• Inputs u(t) known (endogenous insulin estimated from C-Peptide)
1
0
1
0
1
0
1
0
1
0
)()(1
)()()()(1
)()()( 01
t
t
en
t
t
ex
t
t P
t
t P
I
P
IK
t
t IL dttuxdttu
VdttQ
V
ndttI
V
nndt
tI
tIntItI
t t
V
nn
Q
I deIV
ntQ Q
IC
0
))((
)()(

Integral-based fitting methodIntegral-based fitting method
• Repeat for different time-steps [t0,t1] ... [tn-1,tn]:
1
0
1
0
1
0
1
0
1
0
)()(1
)()()()(1
)()()( 01
t
t
t
t
enex
t
t P
t
t P
I
P
IK
t
t IL dttuxdttu
VdttQ
V
ndttI
V
nndt
tI
tIntItI
knownknownidentify
00
,
,0
,
,0
n
L
xn
x
nn
n
d
d
x
n
C
C
C
C
L
L
solve
identifyknown

Integral-based fitting methodIntegral-based fitting method
• ID glucose model – same approach as shown on insulin
dttPV
dttGGSdttGptGtGt
tG
t
t
EI
t
t
G 1
0
1
0
1
0
)(1
))(()()()( 01
00
,
,0
,
,0
nI
G
Sn
S
pn
p
d
d
S
p
C
C
C
C
I
I
G
G
solve

Example of result accuracyExample of result accuracy
• Estimation of two parameters in insulin model, nL and x
0.10.2
0.30.4
0.5
0
0.5
1
0
50
100
xnL
RM
SE
2D error grid
Identified values in 1 iteration!
nL= 0.21
x= 0.3
0.3
0.21
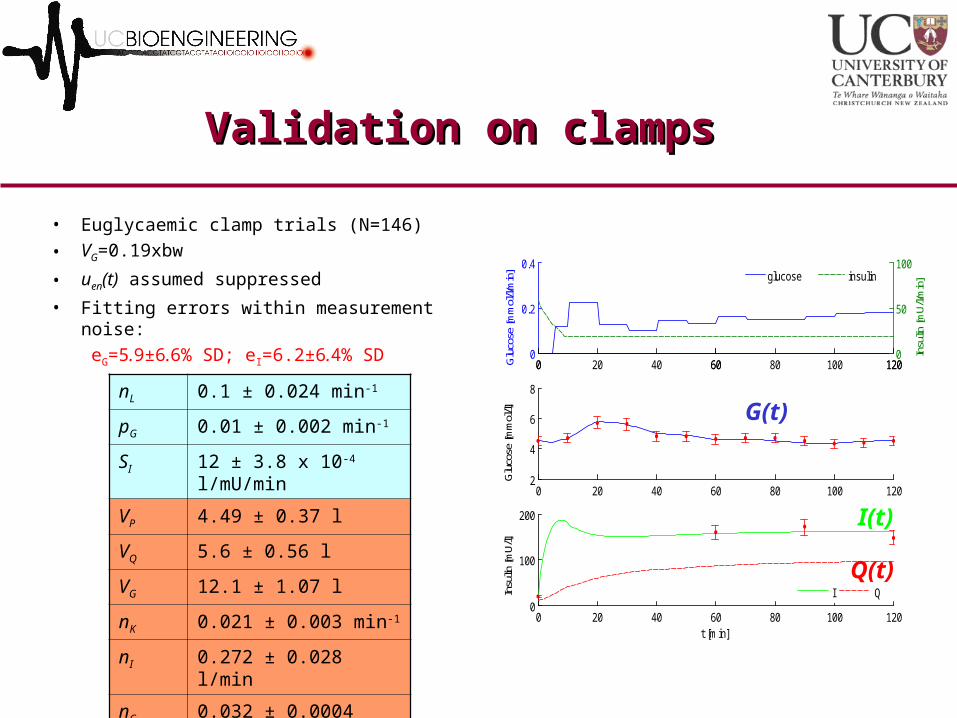
Validation on clampsValidation on clamps
• Euglycaemic clamp trials (N=146)
• VG=0.19xbw
• uen(t) assumed suppressed
• Fitting errors within measurement noise:
eG=5.9±6.6% SD; eI=6.2±6.4% SD 0 60 1200
0.2
0.4
Glu
cose
[mm
ol/l/
min
]
0 20 40 60 80 100 1200
50
100
Insu
lin [m
U/l/m
in]
0 20 40 60 80 100 1202
4
6
8
Glu
cose
[mm
ol/l]
0 20 40 60 80 100 1200
100
200
t [min]
Insu
lin [m
U/l]
insulin
I Q
glucose
nL 0.1 ± 0.024 min-1
pG 0.01 ± 0.002 min-1
SI 12 ± 3.8 x 10⁻⁴ l/mU/min
VP 4.49 ± 0.37 l
VQ 5.6 ± 0.56 l
VG 12.1 ± 1.07 l
nK 0.021 ± 0.003 min-1
nI 0.272 ± 0.028 l/min
nC 0.032 ± 0.0004 min-1
GE 4.85 ± 0.59 mmol/l
G(t)
I(t)
Q(t)
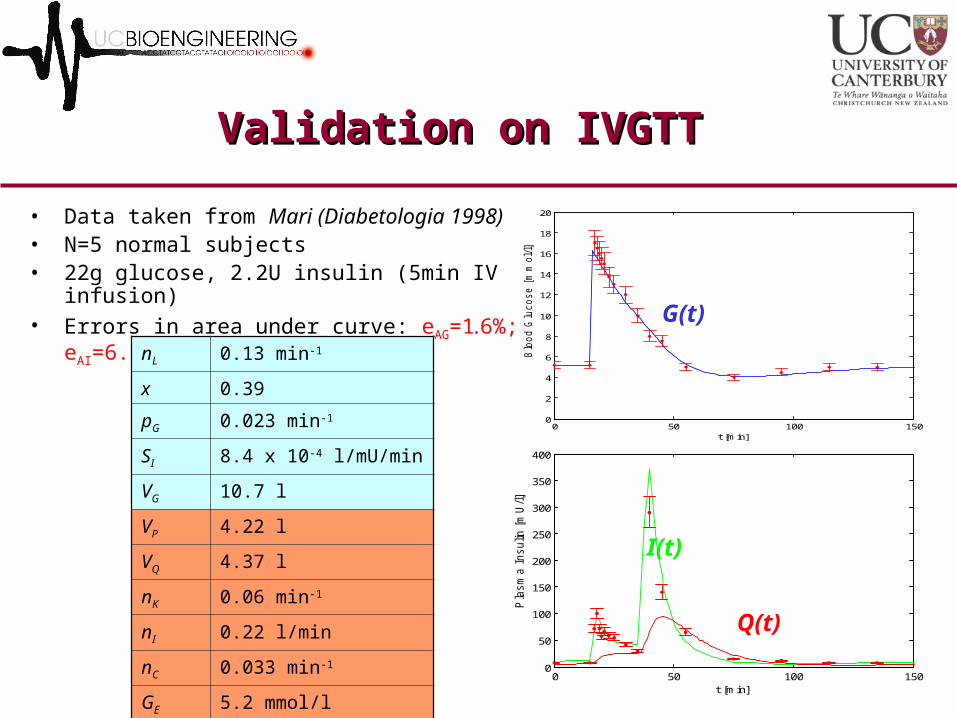
Validation on IVGTTValidation on IVGTT
• Data taken from Mari (Diabetologia 1998)• N=5 normal subjects• 22g glucose, 2.2U insulin (5min IV infusion)• Errors in area under curve: eAG=1.6%; eAI=6.7%
0 50 100 1500
2
4
6
8
10
12
14
16
18
20
t [min]
Blo
od G
lucose [
mm
ol/l]
0 50 100 1500
50
100
150
200
250
300
350
400
t [min]
Pla
sm
a I
nsulin
[m
U/l]
nL 0.13 min-1
x 0.39
pG 0.023 min-1
SI 8.4 x 10⁻⁴ l/mU/min
VG 10.7 l
VP 4.22 l
VQ 4.37 l
nK 0.06 min-1
nI 0.22 l/min
nC 0.033 min-1
GE 5.2 mmol/l
I(t)
Q(t)
G(t)
0 10 20 30 40 50 602
4
6
8
10
12
14
t [min]
Blo
od G
luco
se
[mm
ol/l]
0 10 20 30 40 50 600
100
200
300
400
t [min]
Pla
sma
Insu
lin [
mU
/l]
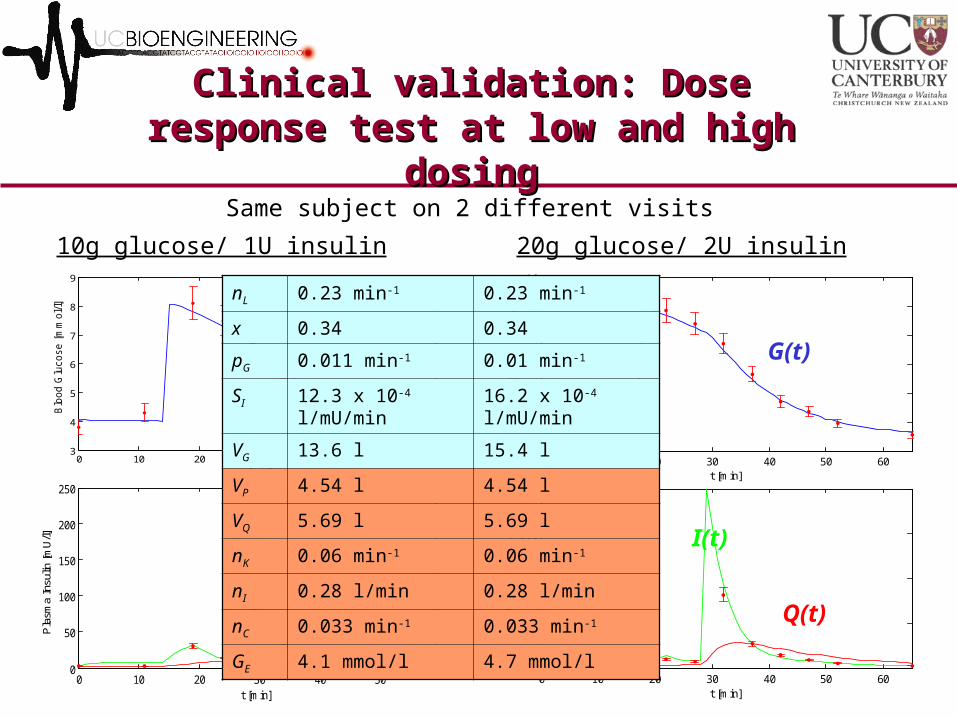
Clinical validation: Dose response test Clinical validation: Dose response test at low and high dosingat low and high dosing
0 10 20 30 40 500
50
100
150
200
250
t [min]
Pla
sma
Insu
lin [
mU
/l]
0 10 20 30 40 503
4
5
6
7
8
9
t [min]
Blo
od
Glu
co
se
[m
mo
l/l]
I(t)
Q(t)
G(t)
10g glucose/ 1U insulin 20g glucose/ 2U insulin
I(t)
Q(t)
G(t)
nL 0.23 min-1 0.23 min-1
x 0.34 0.34
pG 0.011 min-1 0.01 min-1
SI 12.3 x 10⁻⁴ l/mU/min 16.2 x 10⁻⁴ l/mU/min
VG 13.6 l 15.4 l
VP 4.54 l 4.54 l
VQ 5.69 l 5.69 l
nK 0.06 min-1 0.06 min-1
nI 0.28 l/min 0.28 l/min
nC 0.033 min-1 0.033 min-1
GE 4.1 mmol/l 4.7 mmol/l
Same subject on 2 different visits

ConclusionsConclusions
• Physiological insulin kinetics model
• Easy a-priori identification with C-peptide population model
• Additional fitting of key parameters (1(2) for insulin, 2(3) for glucose)
• Integral-based fitting method convex, accurate and not starting point dependent
• Great potential for use in clinical applications

Acknowledgements – Questions?Acknowledgements – Questions?
Geoff ChaseGeoff Shaw
Dominic LeeSteen Andreassen
Jim MannKirsten McAuley
Jessica Lin Chris HannJason Wong
Related Documents


