University of Central Florida University of Central Florida STARS STARS Electronic Theses and Dissertations, 2004-2019 2013 Systems Geometry: A Methodology For Analyzing Emergent Systems Geometry: A Methodology For Analyzing Emergent System Of Systems Behaviors System Of Systems Behaviors Christina Bouwens University of Central Florida Part of the Industrial Engineering Commons Find similar works at: https://stars.library.ucf.edu/etd University of Central Florida Libraries http://library.ucf.edu This Doctoral Dissertation (Open Access) is brought to you for free and open access by STARS. It has been accepted for inclusion in Electronic Theses and Dissertations, 2004-2019 by an authorized administrator of STARS. For more information, please contact [email protected]. STARS Citation STARS Citation Bouwens, Christina, "Systems Geometry: A Methodology For Analyzing Emergent System Of Systems Behaviors" (2013). Electronic Theses and Dissertations, 2004-2019. 2800. https://stars.library.ucf.edu/etd/2800

Welcome message from author
This document is posted to help you gain knowledge. Please leave a comment to let me know what you think about it! Share it to your friends and learn new things together.
Transcript
University of Central Florida University of Central Florida
STARS STARS
Electronic Theses and Dissertations, 2004-2019
2013
Systems Geometry: A Methodology For Analyzing Emergent Systems Geometry: A Methodology For Analyzing Emergent
System Of Systems Behaviors System Of Systems Behaviors
Christina Bouwens University of Central Florida
Part of the Industrial Engineering Commons
Find similar works at: https://stars.library.ucf.edu/etd
University of Central Florida Libraries http://library.ucf.edu
This Doctoral Dissertation (Open Access) is brought to you for free and open access by STARS. It has been accepted
for inclusion in Electronic Theses and Dissertations, 2004-2019 by an authorized administrator of STARS. For more
information, please contact [email protected].
STARS Citation STARS Citation Bouwens, Christina, "Systems Geometry: A Methodology For Analyzing Emergent System Of Systems Behaviors" (2013). Electronic Theses and Dissertations, 2004-2019. 2800. https://stars.library.ucf.edu/etd/2800

SYSTEMS GEOMETRY: A METHODOLOGY FOR ANALYZING EMERGENT SYSTEM OF SYSTEMS BEHAVIORS
by
CHRISTINA LOUISE BOUWENS B.S. Geneva College, 1984
M.S. University of Central Florida, 1990
A dissertation submitted in partial fulfillment of the requirements for the degree of Doctor of Philosophy
in the Department of Industrial Engineering and Management Systems in the College of Engineering and Computer Science
at the University of Central Florida Orlando, Florida
Summer Term 2013
Major Professor: Jose A. Sepulveda

ii
© 2013 Christina L. Bouwens

iii
ABSTRACT Recent advancements in technology have led to the increased use of integrated ‘systems
of systems’ (SoS) which link together independently developed and usable capabilities into an
integrated system that exhibits new, emergent capabilities. However, the resulting SoS is often
not well understood, where secondary and tertiary effects of tying systems together are often
unpredictable and present severe consequences. The complexities of the composed system stem
not only from system integration, but from a broad range of areas such as the competing
objectives of different constituent system stakeholders, mismatched requirements from multiple
process models, and architectures and interface approaches that are incompatible on multiple
levels. While successful SoS development has proven to be a valuable tool for a wide range of
applications, there are significant problems that remain with the development of such systems
that need to be addressed during the early stages of engineering development within such
environments. The purpose of this research is to define and demonstrate a methodology called
Systems Geometry (SG) for analyzing SoS in the early stages of development to identify areas of
potential unintended emergent behaviors as candidates for the employment of risk management
strategies.
SG focuses on three dimensions of interest when planning the development of a SoS:
operational, functional, and technical. For Department of Defense (DoD) SoS, the operational
dimension addresses the warfighter environment and includes characteristics such as mission
threads and related command and control or simulation activities required to support the mission.
The functional dimension highlights different roles associated with the development and use of
the SoS, which could include a participant warfighter using the system, an analyst collecting data
iv
for system evaluation, or an infrastructure engineer working to keep the SoS infrastructure
operational to support the users. Each dimension can be analyzed to understand roles, interfaces
and activities. Cross-dimensional effects are of particular interest since such effects are less
detectable and generally not addressed with conventional systems engineering (SE) methods.
The literature review and the results of this study have identified key characteristics or
dimensions that should be examined during SoS analysis and design. Although many methods
exist for exploring system dimensions, there is a gap in techniques to explore cross-dimensional
interactions and their effect on emergent SoS behaviors. The study has resulted in a
methodology for capturing dimensional information and recommended analytical methods for
intra-dimensional as well as cross-dimensional analysis. A problem-based approach to the
system analysis is recommended combined with the application of matrix methods, network
analysis and modeling techniques to provide intra- and cross-dimensional insight.
The results of this research are applicable to a variety of socio-technical SoS analyses
with applications in analysis, experimentation, test and evaluation and training.

v
This dissertation is dedicated to my late mother, Arnolda Clara Mannie, who taught me that it is
never too late in life to reinvent yourself.

vi
ACKNOWLEDGMENTS
Anyone who has walked this path understands that such an endeavor is not possible
without the generous support of a number of individuals.
I would like to acknowledge the members of my doctoral committee, Dr.Waldemar
Karwowski, Dr. Petros Xanthopoulos, and Dr. Naim Kapucu for all their support throughout the
dissertation process at the University of Central Florida. A special thanks to Dr. David Pratt who
provided helpful feedback on my research and writing along with friendly encouragement and
advice during the more challenging moments in my dissertation development.
I would like to express a special acknowledgment to my major professor, Dr. Jose
Sepulveda, for his patient guidance while providing space for my intellectual “wandering
through the wilderness” and for joining me on my path of academic discovery.
To my daughters, Carolyn and Jamie, for their support while their mom spent many
nights and weekends studying and researching. And lastly, to my partner in life who has always
encouraged me to follow my dream to finish my Ph.D. and held me together when it looked like
it would fall apart, to James Bouwens, my husband and best friend.

vii
TABLE OF CONTENTS
LIST OF FIGURES ..................................................................................................................... xiv
LIST OF TABLES ...................................................................................................................... xvii
LIST OF ABBREVIATIONS / ACRONYMS ............................................................................ xix
CHAPTER ONE: INTRODUCTION ............................................................................................. 1
Introduction ................................................................................................................................. 1
The Problem ................................................................................................................................ 1
Purpose of the Study ................................................................................................................... 3
Background / Context ................................................................................................................. 4
Interoperability ........................................................................................................................ 4
Systems of Systems................................................................................................................. 5
System of Systems Analysis ................................................................................................... 6
Enterprise Architectures.......................................................................................................... 6
Emergence............................................................................................................................... 7
Test and Evaluation SoS Characteristics ................................................................................ 7
Inspiration for Systems Geometry: Pure Sociology............................................................. 10
Definitions................................................................................................................................. 11
Research Questions ................................................................................................................... 12

viii
Methodology ............................................................................................................................. 13
Assumptions and Limitations ................................................................................................... 14
Significance of the Study .......................................................................................................... 14
Future Research ........................................................................................................................ 16
Dissertation Outline .................................................................................................................. 17
CHAPTER TWO: LITERATURE REVIEW ............................................................................... 19
Introduction to the Literature Review ....................................................................................... 19
Literature Search Methodology ................................................................................................ 19
Systems Thinking...................................................................................................................... 21
Systems of Systems................................................................................................................... 22
SoS Engineering Approach: Reductionist vs Holistic ............................................................. 25
Systems Engineering of Systems of Systems ........................................................................... 27
Interoperability .......................................................................................................................... 29
Architecture Frameworks.......................................................................................................... 30
Enterprise Architecture in the Literature and On-line .......................................................... 30
Overview of System Framework Literature ......................................................................... 33
Comparisons of Frameworks ................................................................................................ 34
SoS Process Approaches ........................................................................................................... 35
ix
Qualitative Knowledge Construction .................................................................................... 36
DoDAF Six-Step Process ...................................................................................................... 37
TOGAF ADM ....................................................................................................................... 38
Capability to Requirements................................................................................................... 39
SoS Analysis Methods .............................................................................................................. 40
SoS Architecture and Modeling Approaches ........................................................................ 40
Matrix Modeling Methods .................................................................................................... 42
Model-Based Systems Engineering (MBSE)........................................................................ 43
Executable Architectures ...................................................................................................... 45
Assessing SoS Configuration Options .................................................................................. 46
Managing the Evolution of SoS ............................................................................................ 48
Summary of Analysis Methods ............................................................................................. 48
SoS Model Simulation .............................................................................................................. 48
System Archetypes................................................................................................................ 49
System Behavior Simulation – Modeling and Simulation Methods ..................................... 52
System Dynamics Modeling ............................................................................................. 52
Agent-based simulation .................................................................................................... 53
Comparison of System Dynamic and Agent-Based Simulation ....................................... 54

x
Hybrid Modeling Approaches........................................................................................... 56
Network Structure and Behavior Modeling ...................................................................... 58
Network Analysis and Social Network Analysis ...................................................................... 60
Introduction to Social Network Analysis .............................................................................. 60
Network Structures ............................................................................................................... 63
SoS Structure ........................................................................................................................ 64
Characteristics of Social Networks ....................................................................................... 65
Analysis of Social Networks ................................................................................................. 66
Tools to Support SG Processes and Methods ........................................................................... 68
CHAPTER THREE: METHODOLOGY AND ANALYSIS ...................................................... 71
Research Methodology ............................................................................................................. 71
Summary of Research Approach & Activities.......................................................................... 72
Understanding the Problem................................................................................................... 72
Review of the Literature ....................................................................................................... 73
Develop a Recommended Methodology ............................................................................... 73
Validation of the Methodology: The Case Study ................................................................ 73
Summary of Methodology and Analysis .................................................................................. 74
CHAPTER FOUR: THE SYSTEMS GEOMETRY METHODOLOGY ................................... 75
xi
Background for T&E SoS ......................................................................................................... 75
Characteristics of Distributed SoS for T&E. ........................................................................ 75
Lessons Learned During Distributed SoS Events ................................................................. 77
Systems Geometry Architecture Framework ............................................................................ 81
Systems Geometry Process Definition...................................................................................... 84
Approaches to SoS Engineering ........................................................................................... 84
SoS Process Approaches ....................................................................................................... 85
Systems Geometry Process Needs ........................................................................................ 86
The Systems Geometry Process Defined .............................................................................. 87
Systems Geometry Methods Definition .................................................................................... 89
Traditional Systems Engineering: Traditional Structured Analysis .................................... 89
Analysis Methods Applicable to SoS for SG ........................................................................ 89
Matrix Modeling Methods .................................................................................................... 92
Network Analysis Methods................................................................................................... 93
Characteristics of T&E SoS Networks ............................................................................. 93
Characteristics of T&E SoS Nodes ................................................................................... 94
SG Analysis Method ............................................................................................................. 95
Systems Geometry Tools Definition ......................................................................................... 97

xii
SG Methodology Summary ...................................................................................................... 99
Introduction to the Systems Geometry Case Study ................................................................ 100
CHAPTER FIVE: CASE STUDY IMPLEMENTATION OF SYSTEMS GEOMETRY ........ 102
Introduction ............................................................................................................................. 102
SG Implementation for CAGE II ............................................................................................ 103
1. Identify Areas for Analysis ......................................................................................... 103
2. Identify SG Dimensions .............................................................................................. 106
Constituent System Maturity .......................................................................................... 106
Integration and Interoperability ...................................................................................... 106
Experimentation .............................................................................................................. 106
3. Use an Architectural Framework to Capture Dimensional Information ..................... 107
4. Develop SoS Models and SoS Component Models .................................................... 114
5. Perform Dimensional and Cross Dimensional Analysis ............................................. 118
Object x Object Analysis ................................................................................................ 118
Function x Function Analysis ......................................................................................... 131
Function x Function Analysis ......................................................................................... 134
Function x Objectives Analysis ...................................................................................... 135
6. Review Results............................................................................................................ 143

xiii
7. Iterations of Process Steps .......................................................................................... 145
Verification of the SG Methodology Case Study Results ...................................................... 146
CAGE Case Study Conclusions .............................................................................................. 148
CHAPTER SIX: RESEARCH RESULTS, SUMMARY, RECOMMENDATIONS AND
FUTURE RESEARCH ............................................................................................................... 149
APPENDIX – SIMULATION AND C2 SYSTEM NETWORK STATISTICS ....................... 161
LIST OF REFERENCES ............................................................................................................ 164

xiv
LIST OF FIGURES
Figure 1. Publication on ‘enterprise architecture frameworks’ on Web of Science .................... 31
Figure 2. Search of “enterprise architecture frameworks” on Google Scholar on 3/21/2013 ..... 32
Figure 3. Google Trends Search Interest for Various EAs .......................................................... 33
Figure 4. Geographic Location of Searches on various EAs ....................................................... 33
Figure 5. Basic system thinking components: Reinforcing and Balancing Loops ..................... 49
Figure 6. Classic System Dynamics Model Showing Stock and Flows: Bass Diffusion (from
Anylogic® tool) ............................................................................................................................ 53
Figure 7. State Diagram for Agent Based Representation of the Bass Diffusion Model (from
AnyLogic® Tool) ......................................................................................................................... 54
Figure 8. Example of Network Topologies That Could Impact Emergent System Behaviors .... 59
Figure 9. Systems Geometry Process........................................................................................... 88
Figure 10. SG Methodology Summary ........................................................................................ 99
Figure 11. High Level Summary View for Operational Dimension .......................................... 115
Figure 12. Organizational/Functional Structure for CAGE II Development ............................. 116
Figure 13. High Level Summary View for Technical Dimension ............................................. 117
Figure 14. CAGE II Object x Object Matrix – Simulation and Support Systems ..................... 119
Figure 15. Network View of Simulation Systems and Tools: Degree Centrality ...................... 121
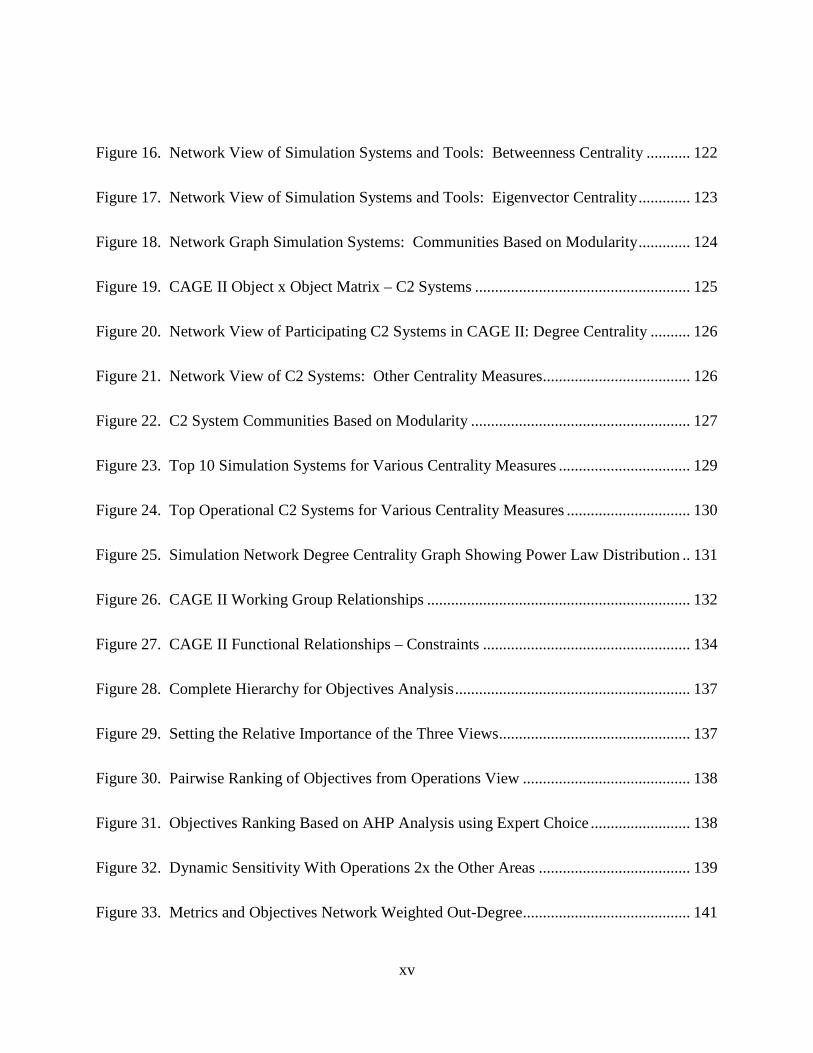
xv
Figure 16. Network View of Simulation Systems and Tools: Betweenness Centrality ........... 122
Figure 17. Network View of Simulation Systems and Tools: Eigenvector Centrality ............. 123
Figure 18. Network Graph Simulation Systems: Communities Based on Modularity ............. 124
Figure 19. CAGE II Object x Object Matrix – C2 Systems ...................................................... 125
Figure 20. Network View of Participating C2 Systems in CAGE II: Degree Centrality .......... 126
Figure 21. Network View of C2 Systems: Other Centrality Measures ..................................... 126
Figure 22. C2 System Communities Based on Modularity ....................................................... 127
Figure 23. Top 10 Simulation Systems for Various Centrality Measures ................................. 129
Figure 24. Top Operational C2 Systems for Various Centrality Measures ............................... 130
Figure 25. Simulation Network Degree Centrality Graph Showing Power Law Distribution .. 131
Figure 26. CAGE II Working Group Relationships .................................................................. 132
Figure 27. CAGE II Functional Relationships – Constraints .................................................... 134
Figure 28. Complete Hierarchy for Objectives Analysis ........................................................... 137
Figure 29. Setting the Relative Importance of the Three Views ................................................ 137
Figure 30. Pairwise Ranking of Objectives from Operations View .......................................... 138
Figure 31. Objectives Ranking Based on AHP Analysis using Expert Choice ......................... 138
Figure 32. Dynamic Sensitivity With Operations 2x the Other Areas ...................................... 139
Figure 33. Metrics and Objectives Network Weighted Out-Degree .......................................... 141

xvi
Figure 34. Metrics and Objectives Network Weighted In Degree ............................................. 142
Figure 35. Simulation System Network Statistics ..................................................................... 162
Figure 36. Operational C2 System Network Statistics .............................................................. 163
xvii
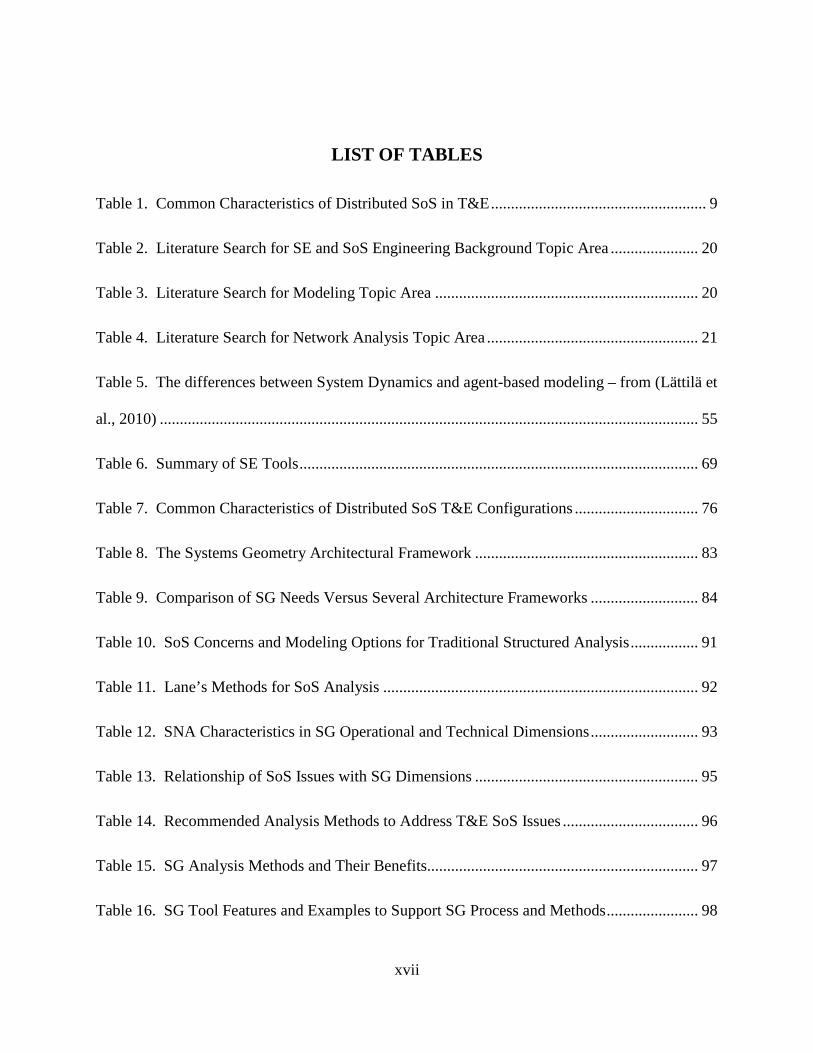
LIST OF TABLES
Table 1. Common Characteristics of Distributed SoS in T&E ...................................................... 9
Table 2. Literature Search for SE and SoS Engineering Background Topic Area ...................... 20
Table 3. Literature Search for Modeling Topic Area .................................................................. 20
Table 4. Literature Search for Network Analysis Topic Area ..................................................... 21
Table 5. The differences between System Dynamics and agent-based modeling – from (Lättilä et
al., 2010) ....................................................................................................................................... 55
Table 6. Summary of SE Tools .................................................................................................... 69
Table 7. Common Characteristics of Distributed SoS T&E Configurations ............................... 76
Table 8. The Systems Geometry Architectural Framework ........................................................ 83
Table 9. Comparison of SG Needs Versus Several Architecture Frameworks ........................... 84
Table 10. SoS Concerns and Modeling Options for Traditional Structured Analysis ................. 91
Table 11. Lane’s Methods for SoS Analysis ............................................................................... 92
Table 12. SNA Characteristics in SG Operational and Technical Dimensions ........................... 93
Table 13. Relationship of SoS Issues with SG Dimensions ........................................................ 95
Table 14. Recommended Analysis Methods to Address T&E SoS Issues .................................. 96
Table 15. SG Analysis Methods and Their Benefits.................................................................... 97
Table 16. SG Tool Features and Examples to Support SG Process and Methods ....................... 98

xviii
Table 17. SoS Characteristics as Found in CAGE II ................................................................. 102
Table 18. Systems Geometry Dimensions Characterized within the ESM Domains ................ 107
Table 19. ESM Domain Interactions for the SG problem with CAGE II .................................. 109
Table 20. Capture / Analysis approaches for SG within ESM framework ................................ 112
Table 21. Mapping of T&E and CAGE I Issues to ESM Matrix Methods ................................ 113
Table 22. CAGE II Functions and Objectives ........................................................................... 135
Table 23. Summary of the Metrics Mapped to the Objectives and Hypotheses ........................ 140
Table 24. SG Observations, Identified Potential Issues and Recommendations ....................... 144
Table 25. SG Observations, Identified Opportunities and Recommendations .......................... 145
Table 26. Case Study Results Versus SG Analysis Results: Issues .......................................... 146
Table 27. Case Study Results Versus SG Analysis Results: Opportunities ............................. 147
Table 28. Summary of SG Tools ............................................................................................... 151

xix
LIST OF ABBREVIATIONS / ACRONYMS
AB Agent-based
ABM Agent-based Modeling
ACM Association for Computing Machinery
ADM Used with TOGAF – Architecture Development Method
AF Architecture Framework
AHP Analysis Hierarchy Process
AOR Area of Responsibility
ARL Army Research Laboratory
ASA(ALT) Assistant Secretary of the Army (Acquisition, Logistics and Technology)
AV All View
AWG Analysis Working Group
BPMN Business Process Modeling Notation
C2 Command and Control
CAGE Coalition Attack Guidance Experiment
CM Configuration Management
xx
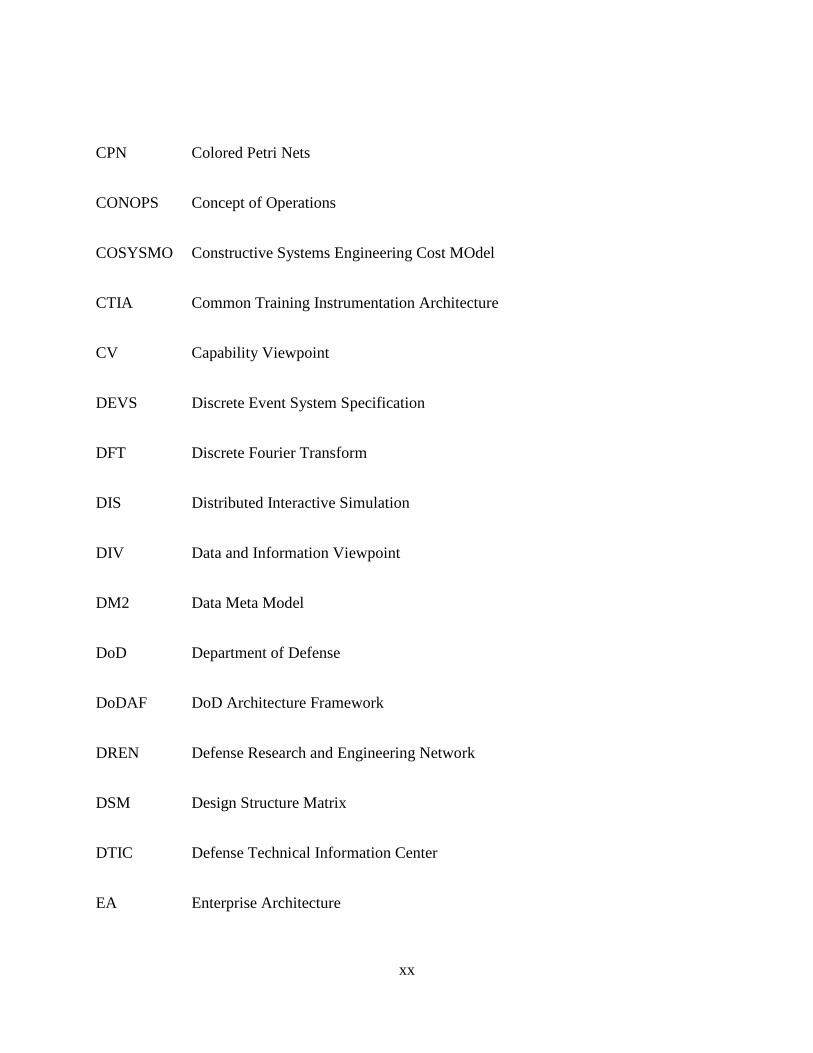
CPN Colored Petri Nets
CONOPS Concept of Operations
COSYSMO Constructive Systems Engineering Cost MOdel
CTIA Common Training Instrumentation Architecture
CV Capability Viewpoint
DEVS Discrete Event System Specification
DFT Discrete Fourier Transform
DIS Distributed Interactive Simulation
DIV Data and Information Viewpoint
DM2 Data Meta Model
DoD Department of Defense
DoDAF DoD Architecture Framework
DREN Defense Research and Engineering Network
DSM Design Structure Matrix
DTIC Defense Technical Information Center
EA Enterprise Architecture

xxi
EEA Epoch Era Analysis
ESG Executive Steering Group
ESM Engineering Systems Multiple-Domain Matrix
FEAF Federal Enterprise Architecture Framework
HLA High Level Architecture
HW Hardware
INCOSE International Council on Systems Engineering
IDEF Integration Definition
IEEE Institute of Electrical and Electronics Engineers
IP Internet Protocol
MAUT Multi-Attribute Utility Theory
MBSE Model-Based Systems Engineering
MBSI Model-Based System Integration
MDA Model Driven Architecture
MDSD Model Driven Systems Development
MoDAF Ministry of Defence Architecture Framework (Great Britain)

xxii
MPT Methods, Processes, Tools and Modern Portfolio Theory
NIPR Non-Classified Internet Protocol Router (network)
OPM Object Process Methodology
OWG Operational Working Group
OV Operational Viewpoint
POSA Problem-Oriented System Architecture
PV Project Viewpoint
QKC Qualitative Knowledge Construction
RAAM Rapid Architecture Alternative Modeling
SDREN Secret Defense Research and Engineering Network
SD System Dynamics
SE Systems Engineering
SG Systems Geometry
SGAF Systems Geometry Architecture Framework
SIPR Secure Internet Protocol Router (network)
SNA Social Network Analysis
xxiii
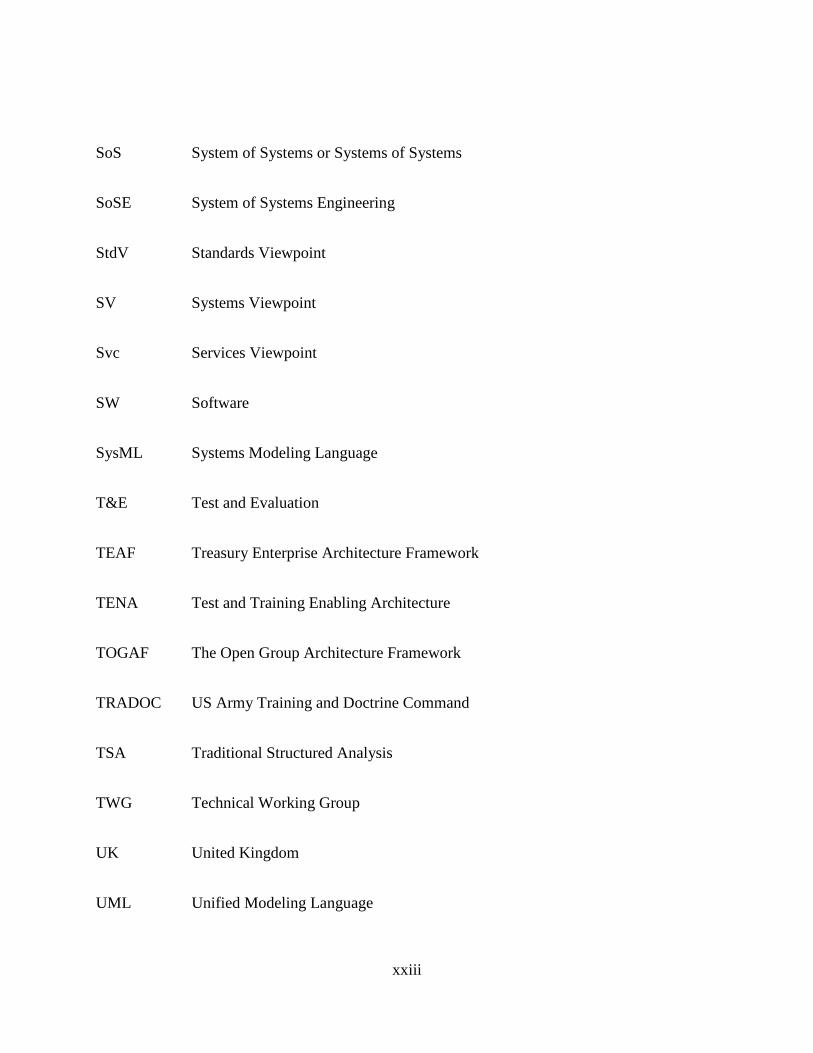
SoS System of Systems or Systems of Systems
SoSE System of Systems Engineering
StdV Standards Viewpoint
SV Systems Viewpoint
Svc Services Viewpoint
SW Software
SysML Systems Modeling Language
T&E Test and Evaluation
TEAF Treasury Enterprise Architecture Framework
TENA Test and Training Enabling Architecture
TOGAF The Open Group Architecture Framework
TRADOC US Army Training and Doctrine Command
TSA Traditional Structured Analysis
TWG Technical Working Group
UK United Kingdom
UML Unified Modeling Language

xxiv
UPDM UML Profile for DoDAF MoDAF
VOIP Voice Over Internet Protocol
XML eXtensible Markup Language
1
CHAPTER ONE: INTRODUCTION
Introduction
Advances in the past 20 years in technologies such as computers, networks and software
architectures have led to the development of more and more complex tools and integrated
systems used for everything from making phone calls, to playing games, socializing with friends
or taking university courses. In technology savvy cultures, we have come to expect all of these
‘systems’ to work with each other in a straight forward, coherent way. However, the resulting
‘system of systems’ is not well understood, where secondary and tertiary effects of tying systems
together are often unpredictable with severe consequences. The Department of Defense (DoD)
has championed the concept of system of systems (SoS) in its adoption of such integrated
technologies. Over the years, a number of standards and system engineering approaches have
been developed to allow these SoS to operate within a “virtual” world environment, not unlike
World of Warcraft®, to support operational testing of new equipment, research into application
of new technologies to improve warfighter performance, and to provide a robust training
environment allowing real equipment to be seamlessly employed within a computer generated
environment with a mix of live players and computer generated forces.
While these SoS have proven to be a valuable tool for a wide range of applications, there
are significant problems that remain with the implementation of such systems that need to be
addressed during the early stages of development and integration.
The Problem
SoS can be characterized along different “dimensions” of definition, depending on the
view or perspective that is desired. For DoD SoS, there are three dimensions of particular

2
interest when planning the development of a SoS: operational, functional, and technical. The
operational dimension addresses the warfighter environment and includes characteristics such as
mission threads and related command and control or simulation activities required to support the
mission. The functional dimension highlights different roles within the SoS whether a
participant is a warfighter using the system, an analyst collecting data for system evaluation, or
an infrastructure engineer working to keep the individual systems up and running to support the
mission exercise. Finally, the technical dimension addresses the specific systems, the computers
and the network infrastructure required to support the functional and operational activities. Each
dimension can be analyzed to understand roles, interfaces and activities. While a wide variety of
analysis and systems engineering (SE) techniques exist to analyze each dimension of a SoS, such
methods fail to explore the cross-dimensional effects found in SoS. A methodology is required
to understand how the failure of a particular technical system can impact the ability to carry out
an operational mission or to understand how executing a particular mission thread impacts
network throughput between participating systems.
This research addresses a gap in SoS analysis where a methodology is needed that allows
investigation of system interactions within and between system dimensions with the purpose to
understand emergent behaviors of the SoS. Such analysis, when performed during the early
phases of SoS development, can contribute to greater confidence that the developed SoS will
exhibit the emergent behaviors that are intended by the system designers while proactively
addressing risks caused by unintended emergent behaviors. This methodology is called Systems
Geometry.

3
Purpose of the Study
The purpose of this research is to:
1. Develop the concept and scientific underpinnings for systems geometry (SG).
2. Apply SG in conjunction with analysis of complex integrated systems of systems.
3. Demonstrate the applicability and utility of the SG concept by applying it to a specific
case study and comparing the insight provided by the method to actual events that
occurred during the case study’s execution.
The case study is based on the Coalition Attack Guidance Experiment (CAGE)
campaign. To date, two experiment events have been conducted (CAGE I in 2011 and CAGE II
in 2012). The CAGE campaign is a series of experiment events seeking to develop new concepts
of military operations while exploring new tools and processes to assist joint coalition operations
at the brigade and division headquarters levels. CAGE II is implemented to demonstrate the SG
methodology while CAGE I serves as a source of issues for focusing the analysis for CAGE II.
SG dimensions have been analyzed using selected architecture constructs, matrix methods and
network analysis to assess emergent SoS vulnerabilities and to provide insight into the
characteristics of the SoS. Lessons learned analysis documented in the CAGE II final report is
combined with informal interviews with CAGE experiment participants to determine if the SG
methodology succeeds in identifying the emergent vulnerabilities and issues that actually
occurred during the experiment.
Conclusions based on the implementation of SG with CAGE II have been developed
which highlight general problem areas for the Test and Evaluation (T&E) community as well as
the broader SoS community that may benefit from the application of the SG analysis approach.

4
Background / Context
Interoperability
Interoperability techniques developed over the past 24 years have allowed many different
systems and simulations to be integrated into a common environment allowing new uses for
systems that were previously designed to work stand-alone. However, the quality of the
integrated “system of systems” is not well understood. Interoperability by itself is a complex
problem and has multiple dimensions of definition (Choi & Sage, 2012; Wang, Tolk, & Wang,
2009). Although computational systems may physically exchange data, it does not ensure that
true “information” (common understanding of the data) is exchanged. And even when
information is exchanged, the use of that information may or may not be valid. One of the most
challenging issues with integration continues to be the lack of understanding of how different
independently developed systems developed for separate, standalone purposes are able to truly
interoperate as part of a combined SoS in a meaningful and valid way.
It is also true that today’s systems are more integrated with people than ever before. One
result of this has been the development of the “Human View” (H. A. H. Handley & Smillie,
2010; H. A. H. Handley, 2012; H. A. Handley & Tolk, 2012) which is an architectural
framework developed to highlight the relationships between people and systems as well as
people and people within the overall system. Social Network Analysis (SNA) has been a useful
approach to study the interactions of social systems, which by themselves are highly complex
and chaotic. Human view architecture concepts allows for SNA and other engineering
approaches to be applied to the multi-dimensional analysis of humans and systems. A highly
complex SoS whose constituent systems are developed by a wide array of stakeholders requires

5
the analysis of social-system interactions early in the engineering life cycle to best understand
the full breadth of vulnerabilities and risks associated with system use as well as potential
problems that could occur during integration and the eventual use of the resulting SoS.
Systems of Systems
Defining the concept of a SoS has been challenging for the engineering community, and
multiple definitions have been developed over the years. The DoD has provided the following
definition for Systems of Systems (Defense Acquisition Guidebook (Guidebook, D. A. (2004))
as cited in the Systems Engineering Guide for Systems of Systems (Office of the Deputy Under
Secretary of Defense for Acquisition and Technology (2008) ):
“An SoS is defined as a set or arrangement of systems that results when
independent and useful systems are integrated into a larger system that delivers
unique capabilities.”
Sage and Cuppan have identified five characteristics of SoS (Sage & Cuppan, 2001):
• “Operational Independence of the Individual Systems
• Managerial Independence of the Systems
• Geographic Distribution
• Emergent Behavior
• Evolutionary Development”
SG is focused on analyzing emergent behaviors but takes into account other
characteristics which influence the creation of the emergent system behaviors.
6
System of Systems Analysis
The analysis of developing systems has evolved over the years from traditional systems
engineering methods through the current use of sophisticated modeling tools. System science
continues to explore new methods for analyzing and understanding the behavior and
performance of SoS.
The reviewed literature has focused on the development of system models that can be
used to explore SoS design concepts, configuration options, and cost impacts associated with
SoS configuration evolution. Although traditional engineering approaches are still well
entrenched within the practicing systems engineering community, standards, tools and
government support are allowing the practice to evolve to more modern system development
methods.
Enterprise Architectures
The growth of Enterprise Architecture (EA) frameworks and analysis methods has made
a significant contribution to the understanding and analysis of SoS. An analysis of publications
on EA (details in Chapter 2) shows that beyond Zachman’s groundbreaking framework for
information architectures developed in the late 1980’s (J. A. Zachman, 1987), most of the
published work on the subject has occurred in the past 20 years, with the most significant
number of publications in the past 5-10 years. As technology has exploded in growth since
2000, interest in enterprise architecture frameworks has grown significantly. Such recent
development could explain why there is a lack of standardization regarding what should be
included in an architecture framework and how it should be used. Efforts with The Open Group
7
Architecture Framework (TOGAF) represent a focus on developing such standards; however,
other frameworks continue to persist while the slow process of standardization continues.
Emergence
Emergent behaviors are those that arise through the interaction of individual actors or in
this case, constituent systems (El-Sayed, Scarborough, Seemann, & Galea, 2012). By definition,
SoS experience emergent behaviors based on its composition of individual, independent systems
and the overall goal to achieve certain behaviors that are not possible in the individual
constituent systems. Emergence recognizes the significance of the individual systems to affect
the combined SoS. When utilizing SoS, particularly for T&E, the target behaviors are emergent
behaviors. Unintended system behaviors are also considered emergent.
A key missing piece in traditional methods is the ability to adequately address SoS
emergence. Development of SoS analysis methods is critical for providing system architects
with the tools they need to analyze developing SoS architectures for the emergence of various
behaviors. These behaviors would include intended (planned) behaviors, unintended and
unanticipated new behaviors (synergies), problems (bottlenecks, interface issues, etc.), as well as
opportunities (alternative designs for overall objectives). Examining SoS risks due to unintended
emergent behaviors is an important part of engineering a SoS to support T&E (Judith Dahmann,
2012).
Test and Evaluation SoS Characteristics
SG is developed based on experience and data from the T&E community. T&E provides
an excellent context for studying SoS characteristics and analysis methods. A trade group SoS
engineering test committee identified SoS along with T&E as areas of interest and a good
8
candidate for studying challenges from both communities (Judith Dahmann, 2012). A review of
T&E experiment environments reveals eight common characteristics. These are summarized in
Table 1.
A characteristic of T&E environments that distinguishes it from many other SoS
communities is its functional need to support a disciplined experiment process. Experimentation
requires an environment with controlled conditions and the ability to collect data from all parts
of the SoS. In a SoS environment, control is difficult to achieve while instrumenting a wide
variety of SoS constituent systems. A SoS in a T&E environment needs to be able to address a
variety of experiment objectives, addressed by hypotheses that are measured using selected
metrics – all in the context of a designed set of mission threads that represent the operational
environment intended to test the capabilities of the system(s) under test. This environment
requires the implementation of constituent systems whose goal is to support experimentation
needs. In this complex environment of SoS, the integration of experimentation systems has the
potential to impact other dimensions including technical as well as operational.
The T&E community normally has a testing environment containing many constituent
systems that can be composed into a useful integrated system. This reuse of resources is critical
to the affordability of the T&E activity. From a SoS development perspective, rather than design
a complex distributed SoS from scratch using a top down approach, the T&E community uses
system components that they already have.

9
Table 1. Common Characteristics of Distributed SoS in T&E Characteristic Explanation Examples
Geographic location
This is the location of the component system of interest. This could also account for multiple “sites” at a particular location.
Military post, laboratory, city, country
Participants / Stakeholders
There are many “sub” dimensions of stakeholders within an event. It could represent a particular service, command, or division. It could also represent a particular lab, program, or company. It includes funding sources, sponsors, users, developers, etc.
Army, Navy, Air Force, Marines, Canadian Forces, UK Forces, TRADOC, ARL, Contractors, Universities, etc.
Purpose / Mission
Each event or capability has a specific mission or purpose. There is some overlap between capabilities – but not in the resources. There is also overlap in the resources used but not the proposed mission (reuse). This represents the motivation for the desired emergent SoS behaviors.
Training, developmental testing, operational testing, research, network evaluation, etc.
Constituent Systems
Systems can be over many types. Operational equipment represents constituent systems that are typically used in the field by a warfighter in a real warfare situation. Modeling and simulation is used to explore concepts, augment a SoS environment containing operational equipment, or develop courses of action. A variety of tools are used for operating and monitoring the SoS environment, collection of data for analysis, assessment of the event activities, and so on.
Live, virtual and constructive simulations, command and control equipment, network monitoring tools, test tools, statistical tools, data loggers, etc.
Capabilities – Functional
Functional capabilities highlight the role that an event participant plays in the overall SoS event. These may be tied at a very high level to operational activities but only in overall role. These functional capabilities are more at the event level.
Technical operation and control, blue ground maneuver, engineering support, communication effects, etc.
Capabilities – Operational
Operational capabilities directly address the military or operational scenario represented in the event while designating which components of the scenario are represented by which systems.
Air defense, logistics support, blue ground forces, etc.
Network Connectivity
There are several types of networks supporting SoS events – these include:
• Physical networks – the actual networking infrastructure (hardware, routers, etc.) used to link the component systems
• Operational communications – this represents the operational network that is used for scenario connectivity.
• Support / Coordination communications – this network allows the functional teams to coordinate efforts for the system.
Physical: SIPR/NIPRnet, SDREN/DREN, etc. Operational: various tactical networks Support: chat, text, VOIP
Interoperability (layers)
This addresses the ability of the constituent systems to interact in a valid and meaningful way during an event. There are levels of interoperability from simple exchange of raw data to common interpretation of received information. This consists of a number of interoperability architectures and integrating capability (such as gateways) that address interoperability at the various layers.
DIS, HLA, TENA, CTIA, IP, etc.
10
The development of a particular T&E instance is based on developing a top down
operational test and experimentation concept (defining operational and functional dimensions
leading to a desired emergent behavior) in conjunction with a bottom-up system composition
(defining technical and some functional dimensions supporting the defined emergent behavior).
If these two efforts are not well coordinated and “meet” in the middle, the intended emergent
SoS behaviors may not be the same as the realized emergent behaviors in the composed system.
An analysis of cross-dimensional relationships during system design is critical for the success of
the T&E experiment.
From the perspective of the SG dimensions, the T&E community operationally works
with mission threads or scenarios, functionally the community supports experimentation
activities and technically they need to provide a network of constituent systems that can address
all of the above.
The gap addressed by SG in this context is the need to perform cross-dimensional
analysis that relates operational, functional and technical system requirements along with their
influence upon each other. This analysis should be performed early in the SoS design cycle in
order to ensure the development of a SoS that exhibits the emergent behaviors that have been
designed without the emergent behaviors that are not desired.
Inspiration for Systems Geometry: Pure Sociology
The concept of systems geometry is inspired by the work of sociologist Donald Black and
his concept of pure sociology and social geometry (Black, 2002, 2004). He explored the various
dimensions of social behavior and their use to analyze social behavior outside the confines of

11
psychology by focusing on social dimensions (i.e. cultural, social and political) instead of mental
state to assess the likelihood of a criminal or terrorist act. Similarly, SG seeks to capture
“dimensions” of distributed SoS in order to analyze and understand the SoS behavior in a more
holistic manner. Here the goal is to implement a methodology that allows exploration of
emergent behaviors based on system dimensions (i.e. operational, functional and technical).
Using a grounded theory inspired approach (Chakraborty & Dehlinger, 2009; Strauss & Corbin,
1994), the SG concept has emerged as the details of DoD SoS have been more closely examined.
Definitions
Key definitions supporting this research include:
Systems Geometry – Systems geometry is defined as a methodology for exploring emergent
system behaviors (planned and unplanned) of multi-dimensional SoS through the capture and
analysis of intra- and cross-dimensional characteristics of a targeted SoS.
System of Systems - “A SoS is defined as a set or arrangement of systems that results when
independent and useful systems are integrated into a larger system that delivers unique
capabilities.” (Office of the Deputy Under Secretary of Defense for Acquisition and Technology,
Systems and Software Engineering, 2008)
Emergent System Behavior – Emergent system behaviors are defined for the purposes of this
study as actions and characteristics exhibited by a SoS as a result of integrating the constituent
systems into a SoS whole. Although developers can design a SoS to perform a general category
of intended behaviors, precise behaviors are not predictable but emergent. In the same way, SoS
can also exhibit unintended behaviors that result from constituent system integration.

12
Test and Evaluation – “Test and Evaluation is the process by which a system or components are
compared against requirements and specifications through testing. The results are evaluated to
assess progress of design, performance, supportability, etc. Developmental test and evaluation is
an engineering tool used to reduce risk throughout the defense acquisition cycle. Operational test
and evaluation is the actual or simulated employment, by typical users, of a system under
realistic operational conditions.” (DAU T&E CoP Website accessed 05/23/2013).
Constituent Systems – Constituent systems are independent systems that make up a system of
systems.
Interoperability – Interoperability is the ability of two or more systems to interact with each other
in a meaningful way. Interoperability can be defined at a number of levels as described in Wang,
et. al (Wenguang Wang, A. Tolk and Weiping Wang 2009)
Research Questions
The primary research question is: What is the definition of a Systems Geometry
methodology that would allow a SoS to be analyzed within a system dimension and across
different system dimensions? Related questions include:
1. What kind of emergent SoS behaviors can be explored using SG?
2. What SG dimensions are most applicable for exploring intra-dimensional system
characteristics vs. cross-dimensional relationships?
3. Can SG be used during the design phase of a SoS to understand the impact of
integrating new systems into an established SoS so that an engineering team can take
actions to maintain the integrity and validity of the overall system?

13
This research uses existing system architecture techniques to develop an over-arching
methodology that can capture not only the different system dimensions but allow for the analysis
of the emergent behaviors within each dimension as well as between dimensions.
Methodology
The research consists of the following elements:
• A review and distillation of the relevant academic and scientific literature that
provides the basis for and overview of SG.
• A detailed written description of SG and the “dimensions” or components of the
framework along with a description of the relationship between them.
• A methodology for implementing the SG concept using SoS definition and
analysis techniques.
• Recommendations for further research to develop the SG concept.
The subject research is initiated by exploring candidate architectural frameworks and
analysis techniques within the context of T&E community needs to determine which framework
approaches would be most applicable for analyzing these types of SoS. The results are used to
generate the initial SG methodology definition. The defined SG methodology is then applied to
the selected case study to demonstrate its utility and to further refine the definition of the SG
concept.
The prototype SG methodology is based on the application of the Engineering Systems
Multiple-Domain Matrix (ESM) (J. E. Bartolomei, Hastings, de Neufville, & Rhodes, 2012)
along with network analysis to generate system views for analysis. System dimensions have
14
been selected for modeling and further analysis to demonstrate the SG concept. The research
approach has been validated by demonstrating its capabilities with the case study and reviewing
the results with key stakeholders involved with the case study.
Assumptions and Limitations
• This research has been conducted based on information from the T&E community.
Application outside of this community is the subject of future research.
• The research will select a few key system dimensions to create the systems geometry,
chosen out of convenience in order to demonstrate the analysis concept. There may be,
in fact, certain sets of system dimensions that lead to different or even more complete
system results. This will not be explored as part of this study.
Significance of the Study
There are a number of reasons why this research and its findings are important:
• There is significant cost associated with the development of complex distributed SoS.
Emergent problems are usually not uncovered until integration, which severely limits
options for addressing the problems while attempting to meet the SoS requirements.
Issues discovered this late in the development process increase the cost of the SoS
tremendously.
• Understanding SoS from an emergence standpoint highlights shortcomings of traditional
system analysis techniques and opens the door to implementing new approaches for
better understanding of the SoS behaviors – both desired and undesired.
• The engineering community needs to explore utilizing new techniques and tools available
today for performing more effective engineering analysis of complex SoS. Engineering

15
education needs to better equip our future systems engineers with these tools and
techniques to more effectively and efficiently develop modern SoS.
The contribution of this research to the field of systems engineering and the practice of
systems engineering includes:
To the field of systems engineering:
• Identification and description of the multi-dimensional nature of SoS problems
and the relationship between those dimensions.
• A methodology called Systems Geometry that provides:
o a problem-oriented process targeting early SoS lifecycle analysis activities
on key areas of interest representing potential risk areas for a developing
SoS.
o a summary of methods that can be applied to analyze system dimensions
and the relationships between those dimensions.
o recommended tool capabilities that facilitate the execution of the process
and its associated methods.
• Groundwork for cross-dimensional problem identification and analysis.
• Enterprise architecture methodology and its contribution to early SE lifecycle
analysis of developing complex SoS.
16
To the practice of systems engineering:
• A methodology for early life cycle analysis of system behaviors, risks and
opportunities for SoS.
• A summary of available methods for analyzing different facets of a complex
engineering SoS that go beyond simple capture of SoS information.
To the T&E community, this research provides a clear path for relating experiment
development activities to the operational and technical development process, addressing a
significant need to ensure that experiment design and testing methodologies are addressed in the
operational (mission thread development) and technical (SoS hardware and infrastructure
development) activities. This synergistic development approach (using SG) allows for the
collection of data that will support evaluation of T&E objectives and their associated hypotheses
while providing the means to account for both technical system complexities and the operational
context of the developing SoS. This interaction of system dimensions has not yet been mastered
– SG provides an approach to address them.
Future Research
Future research would involve the analysis of additional SG dimensions, particularly the
organization and geographic domains, to highlight influence on technical dimension design.
Sensitivity analysis could expose which aspects of particular dimensions have the most impact
on the targeted problem areas. A multi-criteria approach to selecting dimensional analysis
options could help to further focus the analysis based on specific SoS implementation needs and
stakeholder preferences. Additional study of the literature in emergence and complex systems

17
could provide added avenues of analysis for better understanding SoS behaviors. For the T&E
community, the application of option analysis with SG could help in the selection of SoS
compositions to support experimentation events. Future research should integrate the SG
methodology with the DoD Architecture Framework (DoDAF) to provide the DoD community
guidance on using DoDAF views to analyze SoS.
Dissertation Outline
Chapter One introduces the research by providing a summary of the background and
motivation, a statement of the problem, the purpose of the research, the research questions at
hand, an overview of the research approach and the contributions that this research provides to
the systems engineering field.
Chapter Two describes the literature review providing the background on the state of
research supporting the systems geometry and the basis for SG concepts which includes: systems
engineering, systems of systems engineering and analysis, enterprise architectures, systems
thinking, simulation modeling, network analysis, and social network analysis.
Chapter Three presents the methodology and analysis approach used in the development
of SG.
Chapter Four describes the application of the research methodology to develop SG. It
also provides a summary of the SG methodology and introduces the sample case study.
Chapter Five presents the implementation of the SG methodology with the case study. It
provides the results of implementing the SG methodology with the case study to include

18
verification of the methodology, the selected data sources (and how applied), the data generated
and the results of the study analysis.
Chapter Six presents the results and conclusions of the SG research along with
suggestions for further study for expanding research in this area.
19
CHAPTER TWO: LITERATURE REVIEW
Introduction to the Literature Review
The development of SG originated with a practical need to understand emergent
behaviors found in complex, distributed SoS. As a methodology, SG has three components:
process, methods and tools. These three areas are the focal points in the literature review.
The review begins with a summary of systems in general and the unique characteristics of
SoS. It then explores the engineering of such systems, identifying the characteristics of systems
engineering (SE) in the SoS domain. More recent developments in enterprise architecture
frameworks are explored, which provide taxonomies, processes and analysis approaches for
complex socio-technical SoS. This provides a summary of more recent approaches to address
21st century SoS engineering challenges.
This background is used to develop the SG components for SoS process, methods and
tools. The literature review continues with an exploration of applicable processes for SoS
development. Next, it explores details regarding SoS analysis methods, including system
modeling techniques. The review concludes with a summary of SoS engineering tools that are
useful in supporting SG processes and analyses.
Literature Search Methodology
The search of the literature includes specific searches on Google Scholar, IEEE Xplore,
and ScienceDirect. Later searches are more targeted based on resources referenced within initial
documents consulted. Table 2, Table 3 and Table 4 summarize the search terms used, databases
consulted and journals consulted for systems engineering, SoS engineering, modeling and
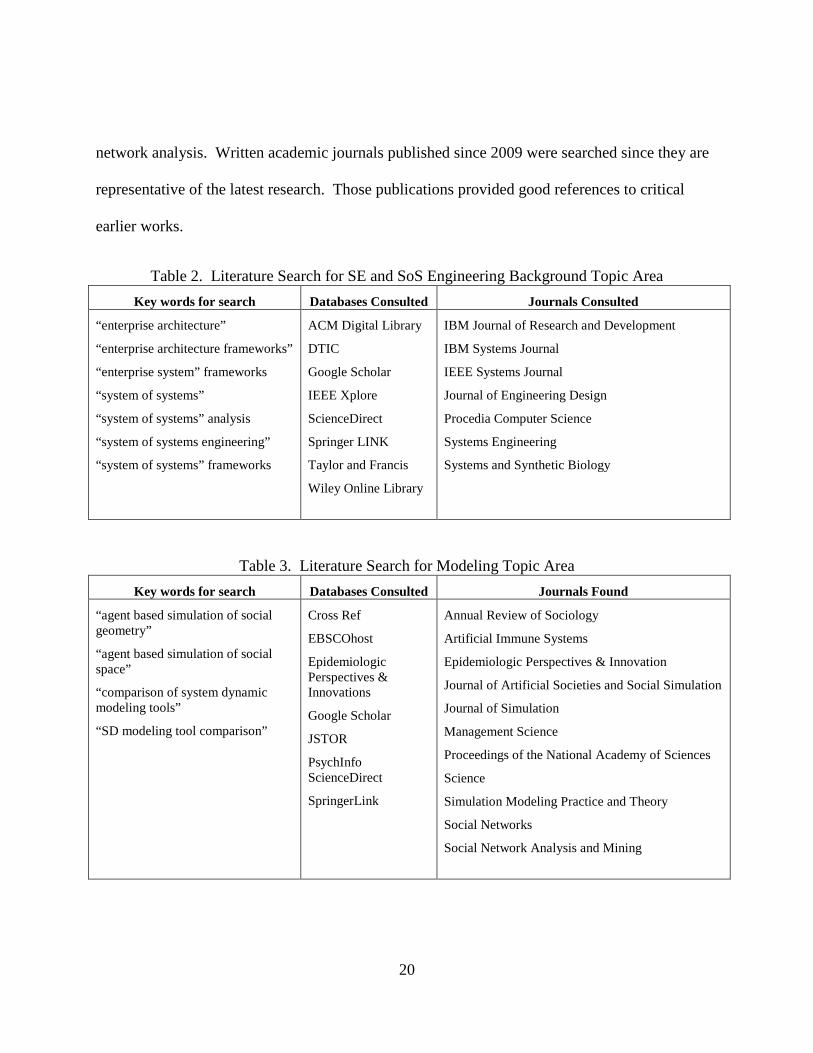
20
network analysis. Written academic journals published since 2009 were searched since they are
representative of the latest research. Those publications provided good references to critical
earlier works.
Table 2. Literature Search for SE and SoS Engineering Background Topic Area Key words for search Databases Consulted Journals Consulted
“enterprise architecture”
“enterprise architecture frameworks”
“enterprise system” frameworks
“system of systems”
“system of systems” analysis
“system of systems engineering”
“system of systems” frameworks
ACM Digital Library
DTIC
Google Scholar
IEEE Xplore
ScienceDirect
Springer LINK
Taylor and Francis
Wiley Online Library
IBM Journal of Research and Development
IBM Systems Journal
IEEE Systems Journal
Journal of Engineering Design
Procedia Computer Science
Systems Engineering
Systems and Synthetic Biology
Table 3. Literature Search for Modeling Topic Area Key words for search Databases Consulted Journals Found
“agent based simulation of social geometry”
“agent based simulation of social space”
“comparison of system dynamic modeling tools”
“SD modeling tool comparison”
Cross Ref
EBSCOhost
Epidemiologic Perspectives & Innovations
Google Scholar
JSTOR
PsychInfo ScienceDirect
SpringerLink
Annual Review of Sociology
Artificial Immune Systems
Epidemiologic Perspectives & Innovation
Journal of Artificial Societies and Social Simulation
Journal of Simulation
Management Science
Proceedings of the National Academy of Sciences
Science
Simulation Modeling Practice and Theory
Social Networks
Social Network Analysis and Mining
21
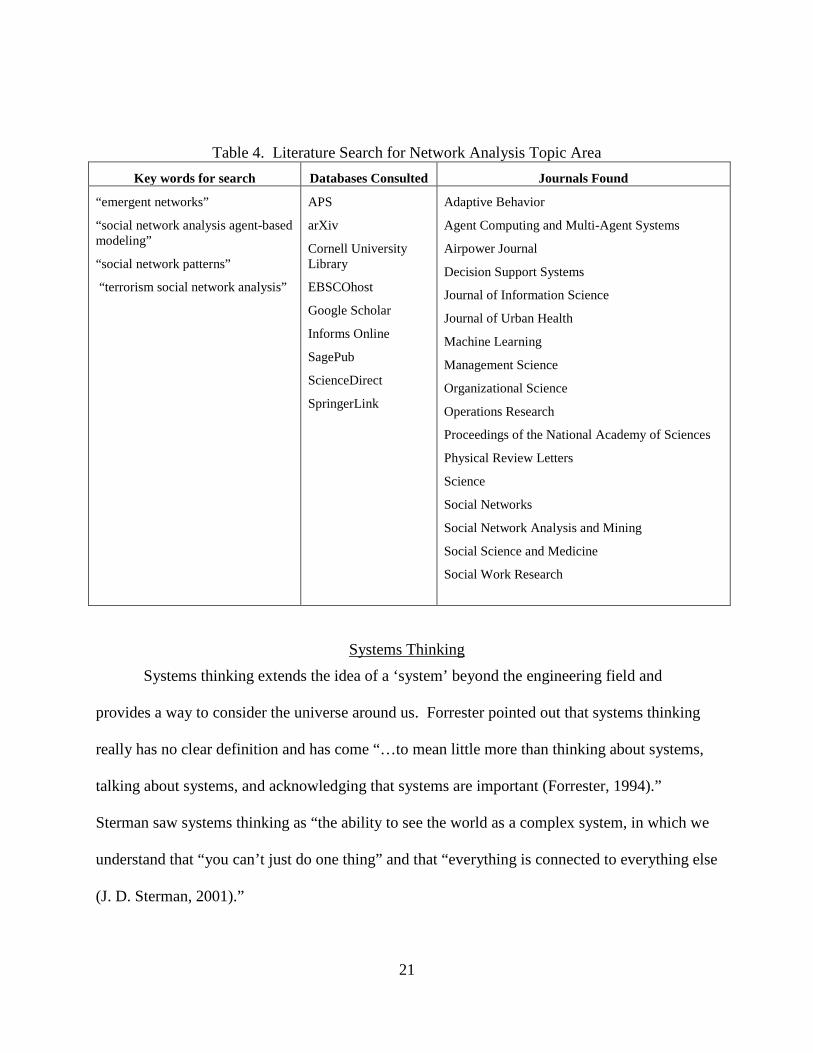
Table 4. Literature Search for Network Analysis Topic Area Key words for search Databases Consulted Journals Found
“emergent networks”
“social network analysis agent-based modeling”
“social network patterns”
“terrorism social network analysis”
APS
arXiv
Cornell University Library
EBSCOhost
Google Scholar
Informs Online
SagePub
ScienceDirect
SpringerLink
Adaptive Behavior
Agent Computing and Multi-Agent Systems
Airpower Journal
Decision Support Systems
Journal of Information Science
Journal of Urban Health
Machine Learning
Management Science
Organizational Science
Operations Research
Proceedings of the National Academy of Sciences
Physical Review Letters
Science
Social Networks
Social Network Analysis and Mining
Social Science and Medicine
Social Work Research
Systems Thinking
Systems thinking extends the idea of a ‘system’ beyond the engineering field and
provides a way to consider the universe around us. Forrester pointed out that systems thinking
really has no clear definition and has come “…to mean little more than thinking about systems,
talking about systems, and acknowledging that systems are important (Forrester, 1994).”
Sterman saw systems thinking as “the ability to see the world as a complex system, in which we
understand that “you can’t just do one thing” and that “everything is connected to everything else
(J. D. Sterman, 2001).”

22
Others view systems thinking as more of a centralizing framework. Senge saw systems
thinking as “a conceptual framework, a body of knowledge and tools that have been developed
over the past 50 years, to make the full (system) patterns clearer, and to help us see how to
change them effectively (Senge, 1994).” Aronson’s definition blends the framework concept
with thinking of the world as a system. He observed that “systems thinking allows people to
make their understanding of social systems explicit and improve them in the same way that
people use engineering principles to make explicit and improve their understanding of
mechanical systems (Aronson, 1996).”
For the purposes of this research, systems thinking is defined as follows:
Systems thinking is about considering the world and its components as
complex systems that are capable of being investigated by applying system
tools and processes.
It is this interconnectedness between everything; technology, people, roles, activities,
etc., within this system of systems world, that motivates the development of a SG that can look
across it all using system tools and techniques.
Systems of Systems
SoS is a relatively new area of study as highlighted in Gorod et. al. (Gorod, Sauser, &
Boardman, 2008) which shows the modern history of SoS extending back to 1991 in the
academic community and only back to 2001 in industry and government applications. There is
much work going on in the SoS engineering (SoSE) field which has struggled with a definitive
definition for SoS. In fact, there have been over 40 independent formulations for a SoS

23
definition (Gorod et al., 2008). Jamshidi in his recent compilation of system of systems
writings (Jamshidi, 2010) defines SoS in the following way:
“Systems of systems are large-scale integrated systems which are heterogeneous
and independently operable on their own, but are networked together for a
common goal.”
Maier provides a definition of a system of systems with a focus on its characteristics
(Maier, 1998):
“A system-of-systems is an assemblage of components which individually may be
regarded as systems, and which possesses two additional properties:
• Operational Independence of the Components: If the system-of-systems is
disassembled into its component systems the component systems must be able
to usefully operate independently. That is, the components fulfill customer-
operator purposes on their own.
• Managerial Independence of the Components: The component systems not
only can operate independently, they do operate independently. The
component systems are separately acquired and integrated but maintain a
continuing operational existence independent of the system-of-systems.”
(Maier, 1998)
Sage and Cuppan add three more characteristics to Maier’s definition, citing a total of
five characteristics of SoS (Sage & Cuppan, 2001):
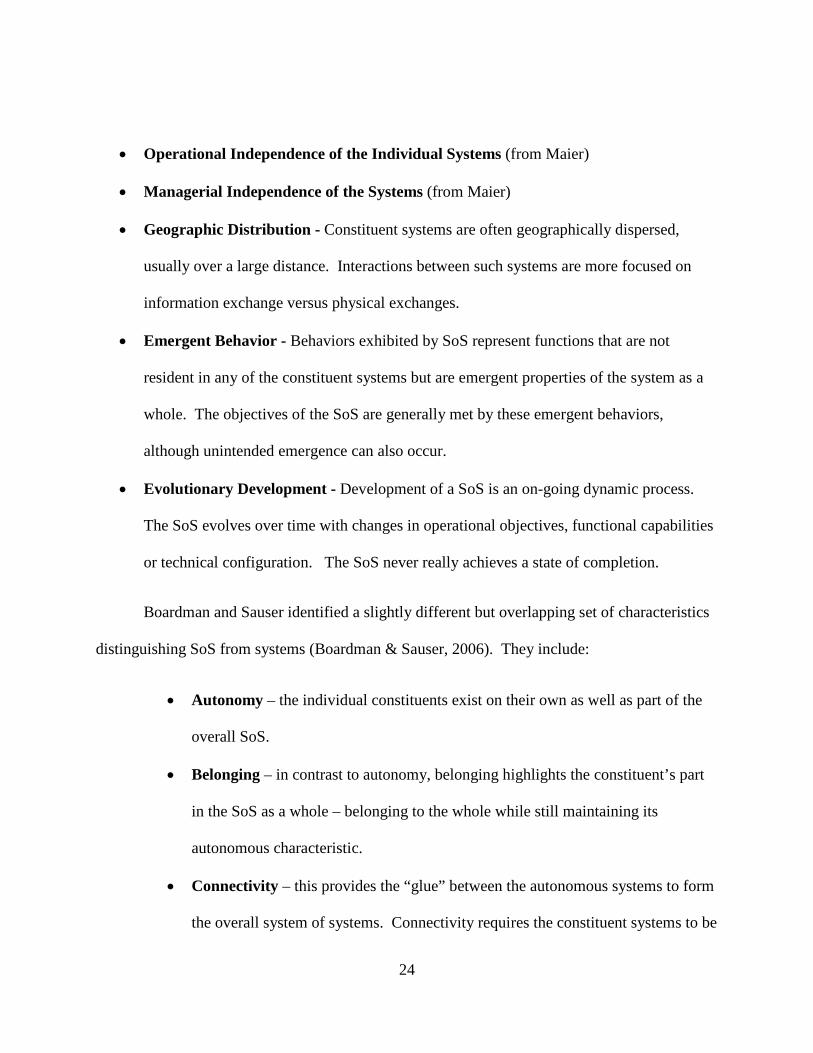
24
• Operational Independence of the Individual Systems (from Maier)
• Managerial Independence of the Systems (from Maier)
• Geographic Distribution - Constituent systems are often geographically dispersed,
usually over a large distance. Interactions between such systems are more focused on
information exchange versus physical exchanges.
• Emergent Behavior - Behaviors exhibited by SoS represent functions that are not
resident in any of the constituent systems but are emergent properties of the system as a
whole. The objectives of the SoS are generally met by these emergent behaviors,
although unintended emergence can also occur.
• Evolutionary Development - Development of a SoS is an on-going dynamic process.
The SoS evolves over time with changes in operational objectives, functional capabilities
or technical configuration. The SoS never really achieves a state of completion.
Boardman and Sauser identified a slightly different but overlapping set of characteristics
distinguishing SoS from systems (Boardman & Sauser, 2006). They include:
• Autonomy – the individual constituents exist on their own as well as part of the
overall SoS.
• Belonging – in contrast to autonomy, belonging highlights the constituent’s part
in the SoS as a whole – belonging to the whole while still maintaining its
autonomous characteristic.
• Connectivity – this provides the “glue” between the autonomous systems to form
the overall system of systems. Connectivity requires the constituent systems to be

25
interoperable, and by being interoperable it influences the other constituents by
dictating methods for interoperability. Connectivity may also require additional
constituents to address the interoperability needs of the SoS.
• Diversity – this characteristic comes in both the variety of constituents as well as
the variety of the connections between them. This naturally leads a SoS to be
extremely diverse.
• Emergence – emergence is designed into a SoS to create an intended behavior. It
also provides opportunity for unplanned but possibly desired behaviors as well as
unintended, undesired behaviors. SoS are developed to encourage emergence
and the SoS engineering discipline needs to balance the creation of an
environment that encourages desired emergent behaviors while quickly
addressing the occurrence of undesirable, unintended behaviors.
The characteristics of SoS requires the SoS engineer to reconsider the application of
engineering techniques to a much more dynamic and complex engineering environment.
SoS Engineering Approach: Reductionist vs Holistic
Traditional systems engineering methods generally take a reductionist view – where a
complex system is broken down into components, and those components into sub components.
At this low level, the various components are analyzed, each with their own requirements and
functionality, then later integrated to create an aggregate system. Interfaces between the system
components are typically explored using N-squared matrix diagrams. The problem with this
approach is that unlike a system, the SoS “whole” is not the sum of its parts. It seems natural to
use a reductionist approach by treating the constituent systems as the components; however, this
26
provides a static view of the system and cannot address changes in the constituents or their
interactions over time. It also fails to address emergent system behaviors that result from the
integrated SoS, producing both intended system-level behaviors that represent the objective of
the SoS endeavor, as well as unintended behaviors that were not planned when the SoS was
reduced into its constituent parts.
Systems thinking takes a more holistic view – exploring a SoS as a whole and
representing its aggregate behavior at the high level using constructs such as system dynamics
(SD) and a well-defined set of SD archetypes. Although overall SoS emergence is more easily
explored, the holistic approach makes it more difficult to represent details for the component
systems (Lewe, DeLaurentis, & Mavris, 2004). Agent-based modeling (ABM) can help in this
regard, but some aspects of the system may be difficult to model in this way.
A number of authors have recommended alternatives to a pure reductionist or holistic
approach. Beckerman (Beckerman, 2000) recommends an iterative reductionist view. She
points out that a concept of operations (CONOPS) for a SoS is really a statement of the desired
emergent behavior of the system. Employing a CONOPS approach at lower hierarchical levels
with elements which, when combined, will create desired observable behaviors will help reduce
the overall complex problem but still maintain an emergent behavior mindset. She also suggests
that such behavior-oriented descriptions would be better for defining system acceptance criteria
than a requirements-based approach that may not account for emergence. Beckerman also
recommends that interface definition go beyond the pairwise N-squared process and define all
interactions. Lewe, et. al (Lewe et al., 2004) used an entity-centric and time variant abstraction

27
of a transportation system (reductionist in representation of system parts) to allow the
construction of agent-based models in order to study emergent behaviors (holistic result) in their
transportation network.
Robertson-Dunn (Robertson-Dunn, 2012) presents his problem-oriented system
architecture (POSA) which also takes an iterative approach to the solution of complex or wicked
problems (of which SoS is a special case). Robertson-Dunn used cybernetic and control theory
to characterize the behavior of complex systems where the feedback from the system solution
has an impact on the problem the system is attempting to solve. Developed system solutions
need to iterate to ensure that they solve the problem (as it evolves) as well as meet the original
objective that was characterized by the problem. In a problem-oriented approach, the focus on
solution shifts from a requirements-based approach to a problem-based approach.
Systems Engineering of Systems of Systems
SE activities associated with SoS need to provide unique engineering services to the
developing SoS in addition to the typical SE activities in order to address the unique
characteristics of SoS.
The Director, Systems and Software Engineering, Deputy Under Secretary of Defense
(Acquisition and Technology) within the Office of the Under Secretary of Defense (Acquisition,
Technology and Logisitics) has published a Systems Engineering Guide for SoS (Office of the
Deputy Under Secretary of Defense for Acquisition and Technology, Systems and Software
Engineering, 2008) which provides SE guidance specifically for DoD SoS.

28
The guide identifies seven core elements for SE of SoS:
1. “Translating SoS capability objectives into high level SoS requirements over time
2. Understanding the constituent systems and their relationships over time
3. Assessing extent to which SoS performance meets capability objectives over time
4. Developing, evolving and maintaining an architecture for the SoS
5. Monitoring and assessing potential impacts of changes on SoS performance
6. Addressing SoS requirements and solution options
7. Orchestrating upgrades to SoS”
These core elements represent process areas of focus for the engineering of SoS that
address the SoS characteristics previously defined. SG focuses on #2 - Understanding the
constituent systems and their relationships. SG has a particular focus on addressing problems or
issues encountered with previous SoS implementations and concentrating the analysis on
identifying potential unintended emergent behaviors that need to be addressed during system
design.
In her chapter on SoS emergence and complexity Micouin points out that SoS
engineering is really all about the integration of the constituent systems and designing
interoperable interfaces (Luzeaux, 2013). This requires the SoS developer to consider the
various layers of interoperability which enable interactions between constituent systems to move
beyond a simple exchange of raw data to an collaboration between independent systems.

29
Interoperability
Interoperability techniques developed over the past 24 years have allowed many different
systems and simulations to be integrated into a common environment allowing new uses for
systems that were previously designed to work stand-alone. However, the quality of the
integrated “system of systems” is not well understood. Interoperability by itself is a complex
problem and has multiple dimensions of definition (Choi & Sage, 2012; Wang et al., 2009).
Although computational systems may physically exchange data, it does not ensure that true
“information” (common understanding of the data) is exchanged. And even when information is
exchanged, the use of that information may or may not be valid. One of the most challenging
issues with integration continues to be the lack of understanding of how different independently
developed systems developed for separate, standalone purposes are able to truly interoperate as
part of a combined SoS in a meaningful and valid way.
It is also true that today’s systems are more integrated with people than ever before. One
result of this has been the development of the “Human View” (H. A. H. Handley & Smillie,
2010; H. A. H. Handley, 2012; H. A. Handley & Tolk, 2012) which is an architectural
framework developed to highlight the relationships between people and systems as well as
people and people within the overall system. Social Network Analysis (SNA) has been a useful
approach to study the interactions of social systems, which by themselves are highly complex
and chaotic. Human view architecture concepts allows for SNA and other engineering
approaches to be applied to the multi-dimensional analysis of humans and systems. A highly
complex SoS whose constituent systems are developed by a wide array of stakeholders requires
the analysis of social-system interactions early in the engineering life cycle to best understand
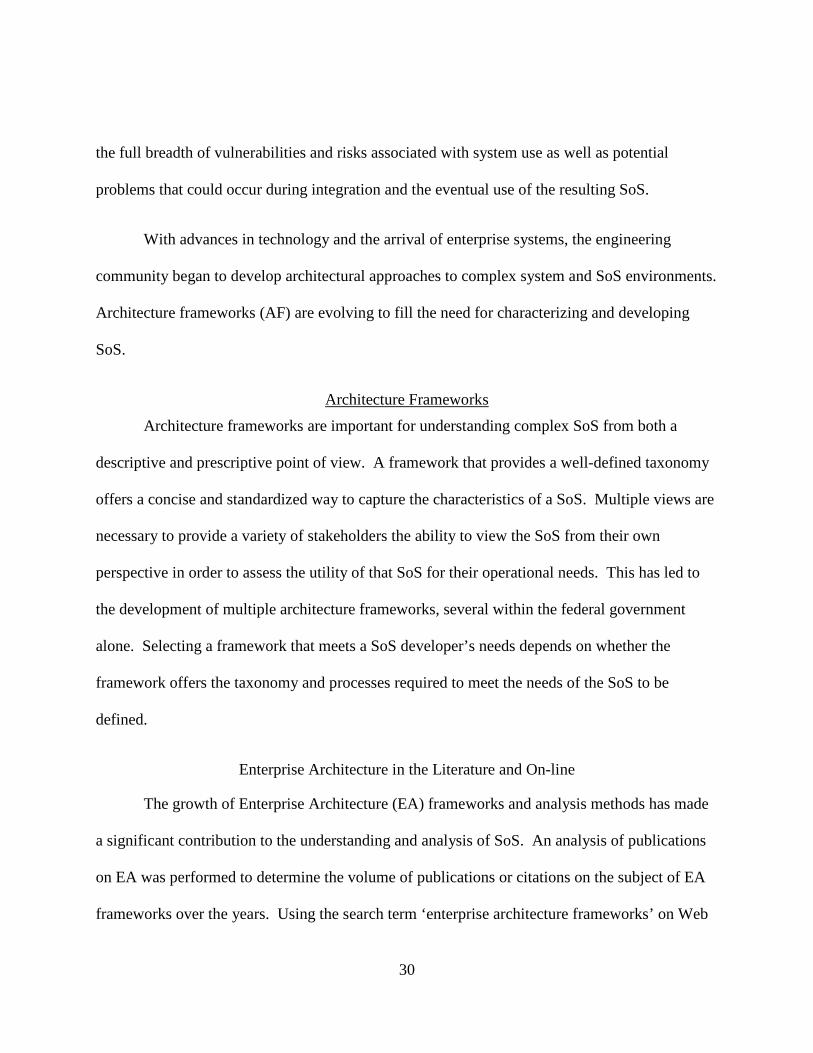
30
the full breadth of vulnerabilities and risks associated with system use as well as potential
problems that could occur during integration and the eventual use of the resulting SoS.
With advances in technology and the arrival of enterprise systems, the engineering
community began to develop architectural approaches to complex system and SoS environments.
Architecture frameworks (AF) are evolving to fill the need for characterizing and developing
SoS.
Architecture Frameworks
Architecture frameworks are important for understanding complex SoS from both a
descriptive and prescriptive point of view. A framework that provides a well-defined taxonomy
offers a concise and standardized way to capture the characteristics of a SoS. Multiple views are
necessary to provide a variety of stakeholders the ability to view the SoS from their own
perspective in order to assess the utility of that SoS for their operational needs. This has led to
the development of multiple architecture frameworks, several within the federal government
alone. Selecting a framework that meets a SoS developer’s needs depends on whether the
framework offers the taxonomy and processes required to meet the needs of the SoS to be
defined.
Enterprise Architecture in the Literature and On-line
The growth of Enterprise Architecture (EA) frameworks and analysis methods has made
a significant contribution to the understanding and analysis of SoS. An analysis of publications
on EA was performed to determine the volume of publications or citations on the subject of EA
frameworks over the years. Using the search term ‘enterprise architecture frameworks’ on Web

31
of Science as of 03/21/2013, Figure 1 shows that beyond Zachman’s groundbreaking framework
for information architectures work in the late 1980’s (J. A. Zachman, 1987), most of the
published work on the subject has been in the past 20 years, with the most significant number of
publications in the past 10 years. Citations follow a similar trend, showing that as technology
has exploded in growth since 2000, interest in enterprise architecture frameworks has grown
significantly.
• Publications in the past 20 years
o 466 results (no quotes) o 9 on Zachman’s Framework o 2 on DODAF o 2 on FEAF o 0 on TEAF o 13 on MDA
• Citations in the past 20 years
Figure 1. Publication on ‘enterprise architecture frameworks’ on Web of Science
A similar analysis on Google Scholar which takes into account a broader base of
information (including websites, conference presentations and others) shows a similar growth
pattern (Figure 2). Here, the publication analysis shows how the growth in the subject area has
been focused primarily in the past 20 years with the most significant growth in the past 5 years.
This supports the notion that the study of enterprise architecture frameworks has grown
significantly in recent years and could explain why there is a lack of standardization regarding
what should be included in an architecture framework and how it should be used. The Open
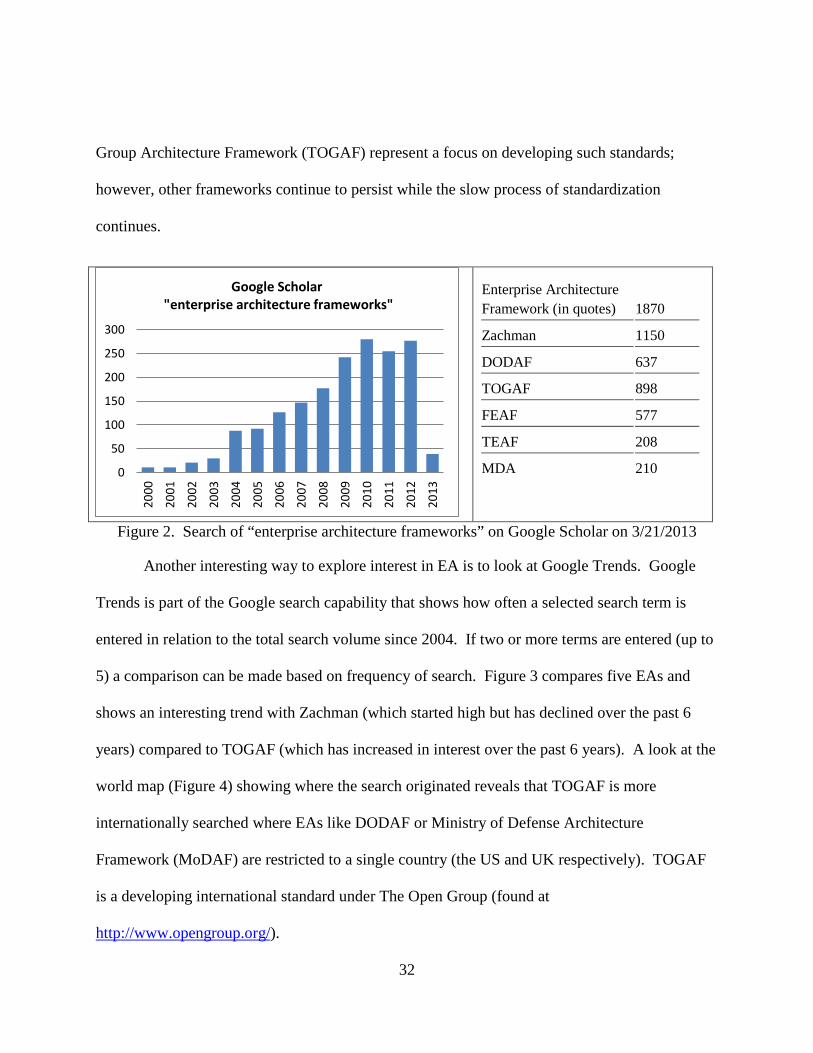
32
Group Architecture Framework (TOGAF) represent a focus on developing such standards;
however, other frameworks continue to persist while the slow process of standardization
continues.
Enterprise Architecture Framework (in quotes) 1870
Zachman 1150
DODAF 637
TOGAF 898
FEAF 577
TEAF 208
MDA 210
Figure 2. Search of “enterprise architecture frameworks” on Google Scholar on 3/21/2013
Another interesting way to explore interest in EA is to look at Google Trends. Google
Trends is part of the Google search capability that shows how often a selected search term is
entered in relation to the total search volume since 2004. If two or more terms are entered (up to
5) a comparison can be made based on frequency of search. Figure 3 compares five EAs and
shows an interesting trend with Zachman (which started high but has declined over the past 6
years) compared to TOGAF (which has increased in interest over the past 6 years). A look at the
world map (Figure 4) showing where the search originated reveals that TOGAF is more
internationally searched where EAs like DODAF or Ministry of Defense Architecture
Framework (MoDAF) are restricted to a single country (the US and UK respectively). TOGAF
is a developing international standard under The Open Group (found at
http://www.opengroup.org/).
0
50
100
150
200
250
300
2000
2001
2002
2003
2004
2005
2006
2007
2008
2009
2010
2011
2012
2013
Google Scholar "enterprise architecture frameworks"

33
Figure 3. Google Trends Search Interest for Various EAs
TOGAF Interest
DoDAF Interest
MODAF Interest
Figure 4. Geographic Location of Searches on various EAs
Overview of System Framework Literature
Architecture frameworks supporting DoD SoS are generally referred to in the literature as
‘Enterprise Architecture’ frameworks. The earliest and most commonly referenced enterprise
architecture framework is Zachman’s Framework (Sowa & Zachman, 1992; J. A. Zachman,
1996; J. Zachman, 1987, 2009). Zachman developed a two dimensional classification scheme
for describing an “enterprise” or complex system. His approach is straight forward, where the
architect seeks to answer six basic questions or “interrogatives” (what, how, where, who, when

34
and why) from five different perspectives (planner, owner, designer, builder and sub-contractor)
which help to capture a complete picture of a developing enterprise system.
Other frameworks commonly referenced in the literature (Bartolomei, 2007; “DODAF,”
2009; Griffin, 2005; Leist & Zellner, 2006; Urbaczewski & Mrdalj, 2006) include:
o DoD Architecture Framework (DODAF)
o The Open Group Architecture Framework (TOGAF)
o Federate Enterprise Architecture Framework (FEAF)
o Treasury Enterprise Architecture Framework (TEAF)
o Model Driven Architecture (MDA)
Comparisons of Frameworks
Comparison of architecture frameworks is the topic of a number of published papers.
There is some overlap with the architecture frameworks selected for comparison, but the method
for comparison varied.
• Sessions (Sessions, 2007) evaluated 4 different frameworks against 12 criteria he
developed for evaluating enterprise architecture methodologies.
• Davis et. al (Davis, Mazzuchi, & Sarkani, 2012) developed a list of 18 requirements for
architecture frameworks to support transition management types of projects.
• Urbaczewski et. al (Urbaczewski & Mrdalj, 2006) evaluated 5 popular frameworks by
comparing them against the Zachman Framework views and perspectives and against the
System Development Life Cycle (SDLC).

35
• Leist and Zellner (Leist & Zellner, 2006) compared 7 different EA frameworks against
the five elements of Methods Engineering.
• Bartolomei (J. E. Bartolomei, 2007) compared 7 different modeling frameworks and a
new methodology he proposed called Engineering Systems Multiple-Domain Matrix
(ESM) against 9 evaluation criteria for scope.
A number of other authors have compared one or two different frameworks against each
other. What is clear from these analyses is that comparing modeling or enterprise architecture
frameworks can be challenging since the scope of the different frameworks varies. Some
frameworks focus on providing a complete taxonomy where others focus on process or present a
methodology. Selection of a systems framework approach for any class of SoS problems begins
with an exploration of the requirements of the community developing the system of interest and
the goal of implementing the framework whether it is to capture a “view” of the system or to
perform specific analysis of system characteristics.
For SG, the system architecture framework used needs to address distributed SoS, while
offering the ability to analyze key relationships among the various dimensions of interest within
the SoS. AFs are an important component of the SG methodology which includes process,
methods and tools for analyzing SoS.
SoS Process Approaches
The SoS development process needs go beyond normal SE process steps to address the
SoS characteristics not present in a less complex system. Dahmann et al. (Judith Dahmann,
Baldwin, & Rebovich Jr, 2009) provide a comparison of systems to SoS that takes into

36
consideration activities related to: management and oversight, operational environment,
implementation, and engineering and design. A more complete analysis of SE versus SE of SoS
is included in the DoD SE Guide for SoS (Office of the Deputy Under Secretary of Defense for
Acquisition and Technology, Systems and Software Engineering, 2008).
Based on the basic needs of the DoD SoS development community, several SoS analysis
processes have been selected for further study for their applicability in SG: Qualitative
Knowledge Construction (QKC), DoDAF 6-step process, TOGAF Architecture Development
Method (ADM), and Capability to Requirements Process for SoS.
Qualitative Knowledge Construction
Bartolomei developed a systematic method (J. E. Bartolomei, 2007; J. Bartolomei,
Silbey, Hastings, De Neufville, & Rhodes, 2009) for analyzing systems of interest. The steps
for QKC (J. Bartolomei et al., 2009) are as follows:
1. Identify a system of interest
2. Define objectives for analysis
3. Collect data
4. Code raw data
5. Organize coded data into a systems model
6. Examine model for missing and/or conflicted data
7. Resolve missing and/or conflicted data
8. Perform analysis
9. Iterate
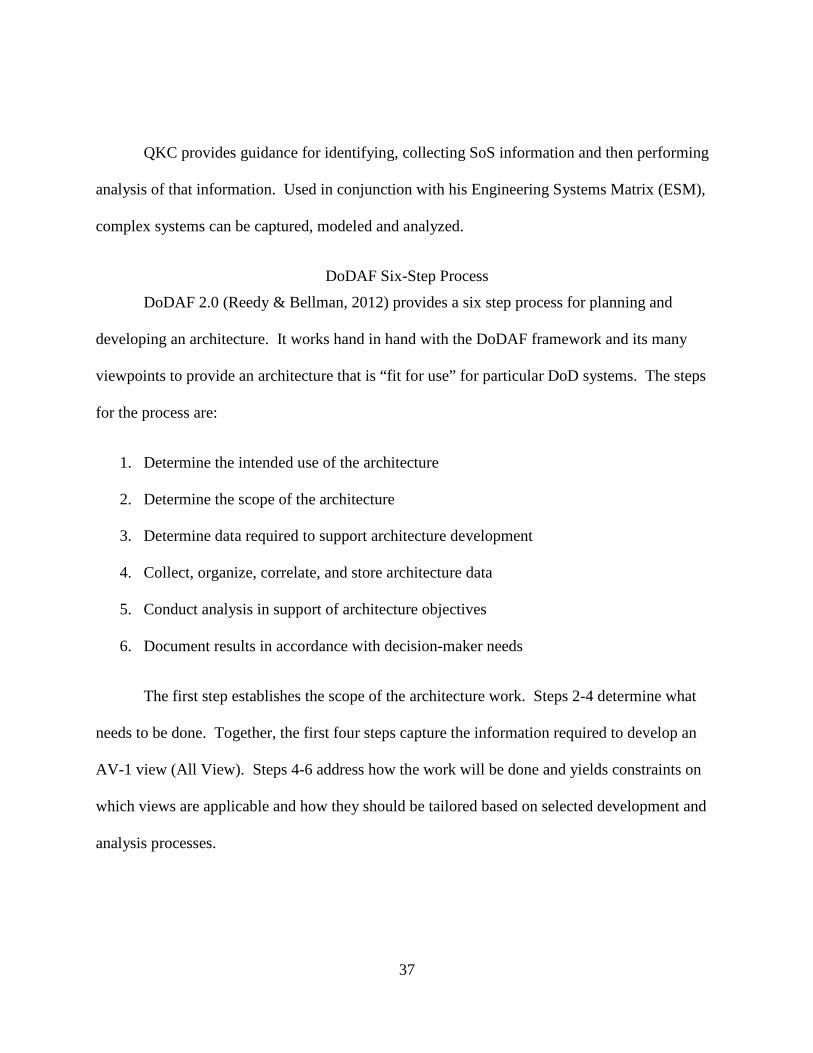
37
QKC provides guidance for identifying, collecting SoS information and then performing
analysis of that information. Used in conjunction with his Engineering Systems Matrix (ESM),
complex systems can be captured, modeled and analyzed.
DoDAF Six-Step Process
DoDAF 2.0 (Reedy & Bellman, 2012) provides a six step process for planning and
developing an architecture. It works hand in hand with the DoDAF framework and its many
viewpoints to provide an architecture that is “fit for use” for particular DoD systems. The steps
for the process are:
1. Determine the intended use of the architecture
2. Determine the scope of the architecture
3. Determine data required to support architecture development
4. Collect, organize, correlate, and store architecture data
5. Conduct analysis in support of architecture objectives
6. Document results in accordance with decision-maker needs
The first step establishes the scope of the architecture work. Steps 2-4 determine what
needs to be done. Together, the first four steps capture the information required to develop an
AV-1 view (All View). Steps 4-6 address how the work will be done and yields constraints on
which views are applicable and how they should be tailored based on selected development and
analysis processes.

38
TOGAF ADM
TOGAF provides a framework for developing enterprise architectures (Tang, Han, &
Chen, 2004). ADM is the process specified for developing TOGAF EAs. This is a general
architecture development method targeted for IT architecture projects. It has been designed to
provide a great amount of flexibility to allow architects to apply the method to a wide range of
EA problems. The ADM cycle features phases of development lettered A – H and include the
following:
• (A) Architecture Vision – addresses “as is” and “to be” high- level descriptions
• (B) Business Architecture – provides a description for the base line business architecture
and allows for analysis of gaps with the target architecture
• (C) Information System Architecture – addresses the data and application requirements
• (D) Technology Architecture – related to the technology and hardware that will support
implementation
• (E) Opportunities and Solutions – evaluates and selects options for implementation
• (F) Migration Planning – examines the dependencies of projects and prioritizes plans for
implementation
• (G) Implementation Governance – addresses management / governance of the overall
architecture project
• (H) Architecture Change Management – monitors changes in technology and the overall
business environment for changes that could cause new developments
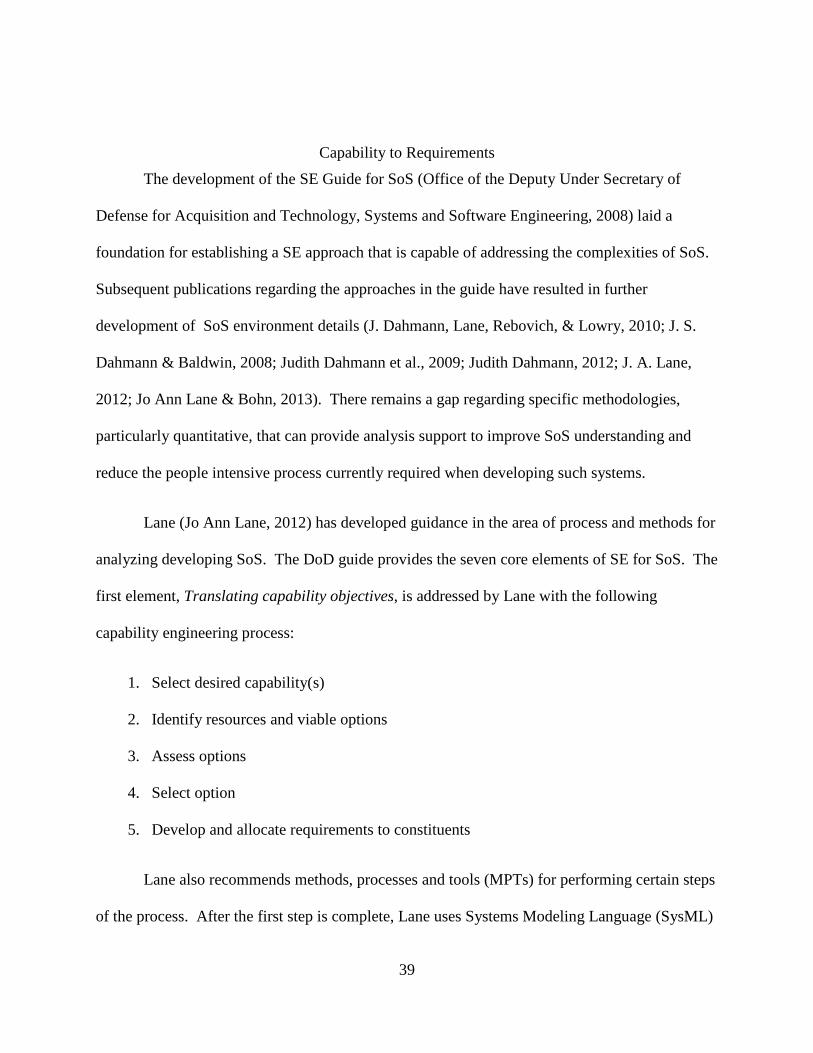
39
Capability to Requirements
The development of the SE Guide for SoS (Office of the Deputy Under Secretary of
Defense for Acquisition and Technology, Systems and Software Engineering, 2008) laid a
foundation for establishing a SE approach that is capable of addressing the complexities of SoS.
Subsequent publications regarding the approaches in the guide have resulted in further
development of SoS environment details (J. Dahmann, Lane, Rebovich, & Lowry, 2010; J. S.
Dahmann & Baldwin, 2008; Judith Dahmann et al., 2009; Judith Dahmann, 2012; J. A. Lane,
2012; Jo Ann Lane & Bohn, 2013). There remains a gap regarding specific methodologies,
particularly quantitative, that can provide analysis support to improve SoS understanding and
reduce the people intensive process currently required when developing such systems.
Lane (Jo Ann Lane, 2012) has developed guidance in the area of process and methods for
analyzing developing SoS. The DoD guide provides the seven core elements of SE for SoS. The
first element, Translating capability objectives, is addressed by Lane with the following
capability engineering process:
1. Select desired capability(s)
2. Identify resources and viable options
3. Assess options
4. Select option
5. Develop and allocate requirements to constituents
Lane also recommends methods, processes and tools (MPTs) for performing certain steps
of the process. After the first step is complete, Lane uses Systems Modeling Language (SysML)

40
to develop object models representing the candidate systems, functions, relationships and
interfaces in step 2. Matrix methods are used to map responsibilities to resources to analyze
options in step 3. Data views to support step 4 are modeled using another matrix method which
captures levels of interoperability between various stakeholders. Finally, use cases and sequence
diagrams are implemented to show how the available options would work.
SoS Analysis Methods
The analysis of developing systems has evolved over the years from traditional systems
engineering methods through the use of sophisticated modeling tools. System science continues
to explore new methods for analyzing and understanding the behavior and performance of SoS.
The reviewed literature has focused on the development of system models that can be
used to explore SoS design concepts, configuration options, and cost impacts associated with
SoS configuration evolution. Although traditional engineering approaches are still well
entrenched within the practicing systems engineering community, standards, tools and
government support are allowing the practice to evolve to more modern system development
methods.
SoS Architecture and Modeling Approaches
Recent research in SoS modeling has been focused on advancing the methodology
beyond static views that supports traditional systems engineering analysis to more modern,
object-oriented approaches that can be simulated for more dynamic analysis. With traditional
systems analysis (TSA) methods still entrenched in the systems engineering field, modeling
41
approaches consider TSA support while looking forward with innovative application of object-
oriented tools.
Grady (Grady, 2009) has recommended a universal architecture description framework
that is focused on integrating the process of software architecture with system and hardware
processes, a goal which is similar to the goals of SoS engineering. He remains dedicated to the
TSA philosophy but provides some excellent recommendations for using systems engineering
modeling methods (particularly Unified Modeling Language (UML) and SysML) to improve the
development process. The framework he recommends is agnostic to specific modeling methods,
which gives a developer flexibility to use the tools they are more accustomed to. Some modeling
methods, however, are more suited for his architectural approach. His recommendation is for
any modeling method to include elements of TSA with SysML.
Lane and Bohn (Jo Ann Lane & Bohn, 2013) present a modeling approach to SoS
development and evolution based on Lane’s earlier work (Jo Ann Lane, 2012) that puts SoS
modeling in the context of the DoD’s SE Guide for SoS (DoD, 2008). The recommended
approach is based on earlier implementations of Model-Driven Systems Development (MDSD)
(Balmelli, Brown, Cantor, & Mott, 2006) which provides a modeling approach for system or SoS
development. Lane and Bohn focus on the use of SysML to understand SoS capabilities and to
explore the effect of SoS evolution. Like Grady, this approach has an emphasis on using the
SysML constructs for capability analysis. In general, modeling approaches to develop SoS using
SysML and similar tools provide a more holistic view of the SoS under development and helps to
42
ensure that the emergent behaviors are more aligned with stakeholder needs. Lane has
implemented a suite of methods to assist in SoS development (Jo Ann Lane, 2012).
Matrix Modeling Methods
Matrix methods have been a staple in SE analysis for many years. N-squared matrices
are a prime example of their use to define interfaces or other relationships between different
aspects of complex systems. The Design Structure Matrix (DSM) (Eppinger & Browning, 2012)
is actually described as a network modeling tool that uses a matrix format to explore
interconnection between components in a format that is easy to read, scalable and can be applied
to a wide variety of system “architectures.” DSM has been used in product architectures (system
components), organization architectures (social or team interactions), and process architectures
(activities that accomplish work). The DSM approach has been leveraged to develop the ESM
(J. E. Bartolomei et al., 2012).
Bartolomei et. al. (J. E. Bartolomei et al., 2012) seek to address a broader range of
complex systems (beyond the DoD model) and to provide engineers with methods to organize
multiple dimensions of systems information in order to facilitate the SE process. His paper
supports the notion that there exists a gap in SE that fails to embrace methods for more holistic
analysis of complex systems – where focus has been on the reductionist approach. The paper’s
recommendation is to utilize a matrix based method called ESM to capture and analyze
interactions between various dimensions of complex systems. This approach goes beyond the
typical N-squared matrix and produces hyper-graph relationships (between dimensions) as well
as multi-graph relationships (multiple relationships between the same nodes). This methodology

43
has the flexibility to explore many combinations of interactions between SoS dimensions and is a
basis for SG analysis.
Osmundson and Huynh (Osmundson & Huynh, 2005) explore interoperability within a
SoS by using a process model representing the constituent system interactions. The system
model is captured in UML and then converted to an executable object-oriented simulation model.
This model is then used to run a series of designed experiments to evaluate the architecture of the
system of systems. Biltgen (Biltgen, 2007) developed a methodology that enables quantitative
assessment of SoS capability-based technologies. Similar to Osmundson and Huynh, Biltgen’s
methodology is based on developing an object-oriented simulation of the SoS under study to
model the capability and to explore its performance in a variety of scenarios. Biltgen’s models
are focused on the performance of the constituent systems and includes detailed physics based
models of key systems under evaluation. This is in contrast to the process-based model
developed by Osmundson and Huynh.
Model-Based Systems Engineering (MBSE)
MBSE has modeling at the core of its definition. Traditional systems engineering
processes result in the production of documentation and conduct of system reviews as the
primary means to develop a system definition and design. Advances in technology and the
increased use of SoS requires a better methodology that can capture the wide range of system
components and views along with the complex interactions between them. Recent developments
in software and system modeling methods (Integration Definition (IDEF), UML, SysML) along
with computer-based modeling tools have presented the opportunity to improve the system

44
engineering process by providing robust models of the developing system, allowing for enhanced
analysis of system capabilities along with identification of potential system problems.
The International Council on Systems Engineering (INCOSE) has developed the
following definition for MBSE:
“Model-based systems engineering (MBSE) is the formalized application of modeling to
support system requirements, design, analysis, verification and validation activities beginning in
the conceptual design phase and continuing throughout development and later life cycle phases.”
(Technical Operations, INCOSE, 2007)
Ramos et. al (Ramos, Ferreira, & Barcelo, 2012) provides a rich background on the
history of SE and its evolution toward the use of MBSE. She highlights two modeling methods,
SysML and Object Process Methodology (OPM), as two developing approaches for system
modeling. Estefan (Estefan, 2007) developed a detailed survey of MBSE methodologies,
however the report, which was sponsored by the INCOSE MBSE Initiative, is somewhat dated.
Much of the work in MBSE to date has focused on modeling the system in the early
system engineering phases (conceptual development, requirements and design) however a
number of initiatives are expanding the use of MBSE to latter phases of system development.
Bjorkman et al (Bjorkman, Sarkani, & Mazzuchi, 2012) implemented an MBSE framework
along with Monte Carlo simulation to support the development of test strategies and test designs
during T&E activities. Montgomery has developed a Model-Based System Integration (MBSI)
(Montgomery, 2013) approach that uses MBSE tools and techniques to introduce integration
activities and concepts earlier in the system engineering process (during concept development
45
and design) by allowing engineering teams to model the integrated system before build or
integration, ultimately reducing integration risks. Dabkowski et al have implemented network
methods for modeling system components and their interactions (Dabkowski, Estrada, Reidy, &
Valerdi, 2013). Their model is based on DoDAF system views and the implementation of a cost
model (based on the Constructive Systems Engineering Cost Model (COSYSMO)) as part of the
MBSE. This allowed the authors to examine the cost implications of adding new components to
their modeled system.
Executable Architectures
Executable architectures allow for the evaluation of architecture configurations by
creating simulations of the developing architecture. This is an extension of static architecture
modeling which is most commonly represented by AF views such as those defined in DoDAF,
Zachman’s Framework or others (Shuman, 2010). Shuman focuses his efforts within the
DoDAF context, using the selection of DoDAF views to drive the selection of a modeling
method (i.e. Structured modeling / IDEF, UML / SysML or Business Process Modeling Notation
(BPMN)). Future work will explore the application of Discrete Event System Specification
(DEVS) to develop an executable architecture for evaluation. Garcia’s research (Garcia, 2011)
explored the generation of DEVS models by converting Extensible Markup Language (XML)
representations of DODAF views to create the executable model. Wagenhals, et al (Wagenhals,
Liles, & Levis, 2009) prototyped a capability to automatically generate an executable
architecture from static architecture views developed using either structured analysis (using
IDEF views) or object-oriented analysis (using UML). These views are translated into an
executable model meta model and then converted to a discrete event model based on colored
46
petri nets (CPN). This work complements the efforts by Shuman. Ge et al (Ge, Hipel, Yang, &
Chen, 2013) take a different approach to developing an executable architecture. Unlike
Shuman’s conversion of static architecture views to an executable model, this research follows a
data-centric capability approach based on the DoDAF 2.0 Data Meta-Model (DM2) used with
the six interrogatives (what, how, where, who, when and why).
Assessing SoS Configuration Options
Several interesting studies have explored techniques for comparing SoS configuration
options. Iacobucci (Iacobucci, 2012) developed a Rapid Architecture Alternative Modeling
(RAAM) framework for capability based analysis of SoS architectures. His work also explores
methods for selecting different architecture configurations. In this approach, the problem is
treated as an assignment problem where the different constituent systems are assigned different
tasks related to the capability under evaluation. Configuration selection represents an optimized
solution to the assignment problem. The configurations for comparison are randomly generated.
In T&E, constraints can be applied to reduce the number of options and before evaluating them
using an optimization approach.
Griendling and Mavris (K. A. Griendling, 2011; K. Griendling & Mavris, 2010) explore
the generation of potential SoS configurations based on a manipulation of selected DODAF
views, taking care to understand the ripple effect of manipulating one view on the other views of
the system, potentially creating an infeasible architecture. A matrix of alternatives is used to
ensure that the integrity of the architecture capabilities is maintained. Iacobucci’s RAAM
framework is used to generate alternatives for exploration. Griendling generates alternatives
based on manipulation of the architecture based on selected DoDAF views, where Iacobucci

47
provides a method for selecting optimal alternatives generated based on architecture
requirements.
Pape et al (Pape et al., 2013) prototyped an agent based model representing SoS
interactions integrated with a genetic algorithm to develop architecture alternatives. The
architecture alternatives were assessed using fuzzy evaluation methods based on four attributes:
Performance, Affordability, Developmental Flexibility and Operational Robustness. Although
this method is at the proof of concept stage, it demonstrates the ability to take into account
stakeholder views to make SoS architecture decisions based on a qualitative assessments of
alternatives.
Another approach to considering stakeholder views was explored by Chattopadhyay et al
(Chattopadhyay, Ross, & Rhodes, 2009) who introduced a quantitative method based on multi-
attribute utility theory (MAUT) for making trades between different SoS designs. In this
method, system performance is defined through interviews with stakeholders which are then
used to generate concept independent system attributes. The candidate system designs are
functionally modeled and the value of each design (its utility) calculated using MAUT. The
authors also employ Epoch Era Analysis (EEA) to explore system evolution over time during
different ‘eras’. Ricci and Ross (Ricci, Ross, & Rhodes, 2012) build on Chattopadhyay’s work
by applying Modern Portfolio Theory (MPT) in conjunction with the EEA for the selection of
constituent systems and their interconnections to compose multiple SoS configuration options.
MPT allows the method to address uncertainty while EEA allows for analysis of ‘dynamic
contexts’ on the SoS.
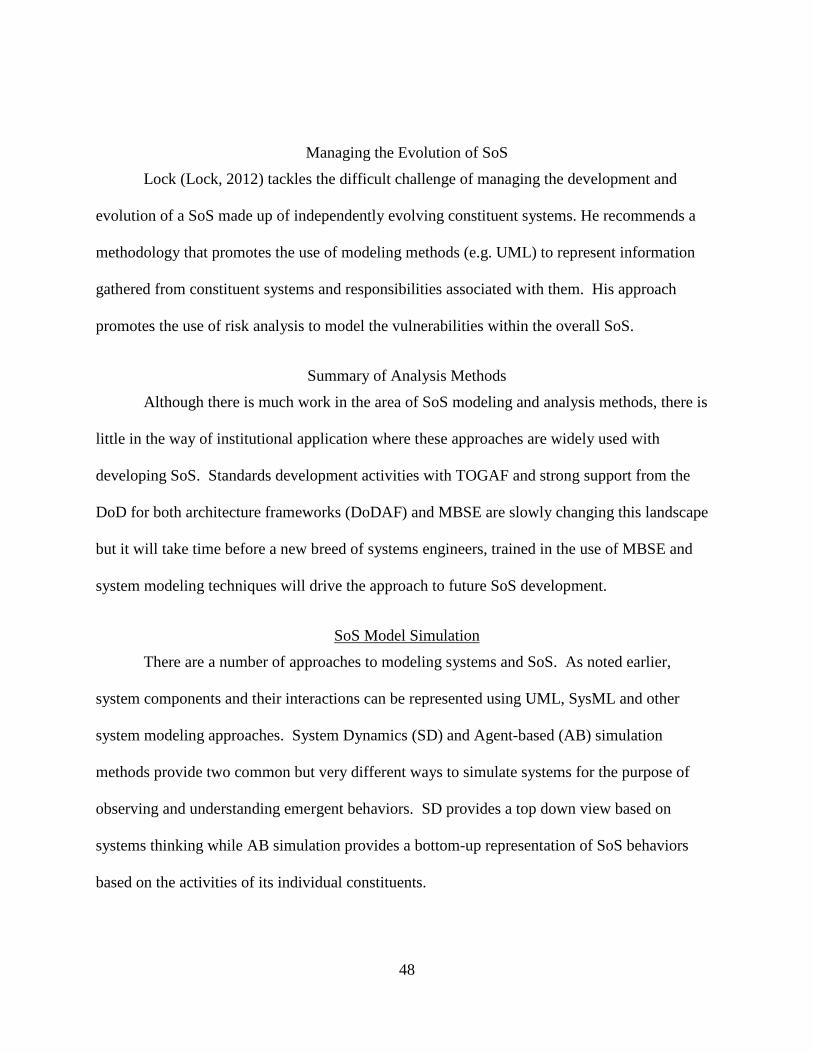
48
Managing the Evolution of SoS
Lock (Lock, 2012) tackles the difficult challenge of managing the development and
evolution of a SoS made up of independently evolving constituent systems. He recommends a
methodology that promotes the use of modeling methods (e.g. UML) to represent information
gathered from constituent systems and responsibilities associated with them. His approach
promotes the use of risk analysis to model the vulnerabilities within the overall SoS.
Summary of Analysis Methods
Although there is much work in the area of SoS modeling and analysis methods, there is
little in the way of institutional application where these approaches are widely used with
developing SoS. Standards development activities with TOGAF and strong support from the
DoD for both architecture frameworks (DoDAF) and MBSE are slowly changing this landscape
but it will take time before a new breed of systems engineers, trained in the use of MBSE and
system modeling techniques will drive the approach to future SoS development.
SoS Model Simulation
There are a number of approaches to modeling systems and SoS. As noted earlier,
system components and their interactions can be represented using UML, SysML and other
system modeling approaches. System Dynamics (SD) and Agent-based (AB) simulation
methods provide two common but very different ways to simulate systems for the purpose of
observing and understanding emergent behaviors. SD provides a top down view based on
systems thinking while AB simulation provides a bottom-up representation of SoS behaviors
based on the activities of its individual constituents.

49
System Archetypes
Systems thinking provides an effective process for analyzing the behavior of complex
systems. Researchers have found that certain types of behaviors are common amongst a broad
set of systems. These common behaviors are called system archetypes. System archetypes have
been associated with wide range of behaviors including disruptive behaviors such as terrorist
activities, social engineering, economic espionage and political unrest. Archetypes may help to
explain certain SoS behaviors and provide insight into how they can be addressed.
There are two basic components used to represent concepts in systems thinking:
Reinforcing and Balancing loops (Figure 5). All system archetypes are based on combinations
of these two constructs.
Figure 5. Basic system thinking components: Reinforcing and Balancing Loops
Reinforcing loops represent situations where there is an action that causes the state of a
system to grow (or decline). By itself, the system will simply continue to grow (or decline)
unless some kind of “balancing” force acts on it. This could take the form of a balancing loop,
where control of the growth (or decline) of a system is based on a goal supported by a corrective
action.

50
There are a number of system archetypes that the systems community has accepted as the
general components describing patterns of behaviors in systems (Braun, 2002; Senge, 1994; E. F.
Wolstenholme, 2003). There are ten archetypes that are found in the literature:
• Limits to Growth
• Fixes that Fail
• Shifting the Burden
• Eroding Goals
• Growth and Underinvestment
• Success to the Successful
• Accidental Adversaries
• Escalation
• Tragedy of the Commons
• Attractiveness Principle
As a rule, these archetypes do not appear by themselves in a system description.
Researchers have defined special archetypes as special cases of these ten basic forms.
Wolstenholme determined that these archetypes could be condensed down to a smaller
set of generic archetypes based on various combinations of a single pair of reinforcing and
balancing loops (E. F. Wolstenholme, 2003; Eric Wolstenholme, 2004, Sarriegi & Gonzalez,
2008). The four generic archetypes, based on the four different combinations of these loops, are
defined as follows:
• Underachievement: intended achievement fails to be realized
• Out of Control: intended control fails to be realized
• Relative achievement: achievement is gained but at the expense of another

51
• Relative control: control is gained but at the expense of another
Wolstenholme also notes that there are two different forms for these archetypes. One is
the problem archetype which specifies how the behavior over time is not what was intended by
the individuals creating the system. The second is the solution archetype which seeks to
minimize the side effects and undesired consequences resulting from the problem archetype (E.
F. Wolstenholme, 2003). A third component in the Wolstenholme generic archetypes is the
concept of the organizational boundary. This boundary represents an obstacle to be addressed
within the solution to the problem representation and that the solution should seek to “penetrate
or to make the boundaries transparent.” Wolstenholme goes on to map the existing archetype set
into the reduced generic set (Eric Wolstenholme, 2004). SoS issues that can be associated with
one of the generic archetypes may be addressable through the corresponding solution archetype.
BenDor and Kaza have developed a theory for the representation and application of
spatial system archetypes (BenDor & Kaza, 2012). Their focus was on bringing spatial concepts
to system dynamics in a disciplined way, developing the concept of spatial-dynamic processes.
The authors show that “by ‘spatializing’ SD models, modelers can explicitly (i) simulate system
structure that is heterogeneous over space, as well as (ii) consider how spatial interactions affect
systems.” Spatial concepts are initially understood in the context of Newtonian space but are
extended to include alternative “space” representations. Non-Newtonian dimensions of space are
of particular interest to SG since some SG dimensions can be represented in this manner.
BenDor and Kaza use the concept of archetypes to provide a framework for including spatial
dimensions in their system definition, thereby allowing the modeler to develop dynamic system
structures that lead to behaviors that can be defined in a spatially explicit manner. This

52
archetype approach also allows the authors to show how static archetype representations (defined
above) can be expressed in terms of dynamic spatial representations.
System Behavior Simulation – Modeling and Simulation Methods
Simulation modeling methods provide an essential tool for experimenting with the
characteristics of targeted system behaviors. Such approaches can be employed to model a
subset of SoS target behaviors when, for example, Beckerman’s iterative reductionist approach
(Beckerman, 2000) is employed. There are a number of simulation modeling methods that are
available to support system behavior analysis. The selection of a modeling method depends on a
number of factors which includes the abstraction level desired for representation and the types of
objects and interactions that the model must represent. Borshechev and Filippov (Borshchev &
Filippov, 2004) analyzed the various simulation modeling approaches and summarized their
characteristics along with the relationship between the various methods.
System Dynamics Modeling
SD is a methodology developed to characterize and understand complex systems (G.
Figueredo, Aickelin, & Siebers, 2011; J. Sterman, 2000). SD simulation is a continuous
simulation method that “uses stocks, flows and feedback loops (Figure 6) as concepts to study
the behavior of complex systems.” SD models are based on a set of differential equations solved
for a certain time interval (G. Figueredo et al., 2011; Macal, 2010). This “top-down” approach
to modeling represents a system at the aggregate level with lower level concepts represented as
part of a stock. It is important to note that in an SD model, items in the same stock “are
indistinguishable, they do not have individuality” (Borshchev & Filippov, 2004).
53
Figure 6. Classic System Dynamics Model Showing Stock and Flows: Bass Diffusion (from Anylogic® tool)
Borshchev and Filippov also point out that SD models are captured in terms of global
structures and proper representation requires the modeler to provide accurate quantitative data
for them.
SD’s historical roots in the representation of complex systems have made it the
representation of choice for system archetype behaviors. SG explores emergent system patterns
that may be characteristic of system archetypes behaviors based on a lower level of system
representation. For such emergent behaviors, AB methods should be considered for modeling
the system.
Agent-based simulation
AB simulation is used to model “complex systems composed of interacting, autonomous
‘agents’.” (Macal & North, 2010). The behavior of each agent is defined by a set of rules that

54
define how the agents interact with each other, adapt and learn. AB models are usually
represented using a state diagram (Figure 7).
This “bottom-up” modeling approach focuses on modeling the individual agent and
allows the global behavior to “emerge” as each agent follows its assigned rules (Borshchev &
Filippov, 2004).
Figure 7. State Diagram for Agent Based Representation of the Bass Diffusion Model (from AnyLogic® Tool)
Macy and Willer explored modeling social processes using AB models instead of
traditional factor based representations (Macy & Willer, 2002). This allows the researchers to
explore emergent behaviors from within social processes.
Comparison of System Dynamic and Agent-Based Simulation
Both SD and AB simulation have been used to represent social, socio-economic models
and other phenomenon. Several studies have explored these two simulation methods side by
side, using a few innovative methods for translating from one simulation paradigm to the other.

55
A side by side comparison of the two simulation approaches (Table 5) summarizes the major
differences between system dynamics and agent-based modeling.
Table 5. The differences between System Dynamics and agent-based modeling – from (Lättilä et al., 2010)
Component System Dynamics Agent-Based Modeling Level of analysis Aggregates/quantities (homogeneity) Individual agents (heterogeneity) Unit of analysis Structure of the system Rules of agents Crucial mechanism Feedbacks between different parts of
the system Emergent behavior due to interaction
Building Blocks Equations, feedback-loops, stock and flow diagrams
Individual agents and their decisions (logic)
System structure Fixed Flexible Application Problem-solving Exploring Origin of dynamics Levels Events Handling of time Continuous Discrete or continuous
Schieritz and Milling characterize the difference between modeling using SD or AB
methods as the difference between “modeling the forest or modeling the trees (Schieritz &
Milling, 2003). Among the author’s observations, one interesting observation is with the
perspective difference. For AB modeling, the modeler focuses on the agent’s behavior and the
larger system behavior emerges from that. There is no need to know in advance what the
emergent behavior might be (and from a pure AB standpoint, there is no way to know). On the
other hand, SD modeling requires the modeler to actually model the expected or desired system
behavior (there is no “emergence”). For some SoS, it may be useful to use both modeling
approaches, using an SD modeling method to represent intended SoS behaviors while using AB
methods to represent the constituent systems and their behaviors. The AB modeling will allow
behaviors to emerge that could represent undesired or opportunistic emergent behaviors.

56
Figueredo, et. al. sought to develop a framework to assist a modeler to choose between
SD and AB methods for immune system problems (G. Figueredo et al., 2011). Their approach
was to develop equivalent SD and AB models and compare the simulation results. Their
conclusion for the immune system problem is that both SD and AB were able to produce the
same results; therefore it was preferable to use the SD simulation method since it was less
computationally expensive. Figueredo went on to explore the same framework with tumor
growth and its interaction with effector cells (G. P. Figueredo & Aickelin, 2011). In this second
study, for the models produced in the experiment they found that the SD and AB models did not
produce the same result, so they were unable to assess which method would be better for this
particular problem.
Other authors provided insight regarding how to select a modeling method (Borshchev &
Filippov, 2004; Schieritz & Milling, 2003; Swinerd & McNaught, 2012). In general, the method
selection depends on the characteristics found back in Table 5.
Hybrid Modeling Approaches
Although some modeling situations appear to lend themselves naturally to one type of
representation or another, there are some situations where a hybrid approach allows the modeler
to take advantage of both approaches. Swinerd and McNaught defined three basic types of
hybrid designs (Swinerd & McNaught, 2012) for SD and AB combinations which include:
• Integrated hybrid design – e.g. in an AB model, the internal structure of the agent is
represented by an SD model. Or in an SD model, individual components are represented
using agents.
57
• Interfaced hybrid design – SD is used to represent one portion of the system which then
interfaces with an AB model and communicates information.
• Sequential hybrid design – the first portion of the simulation executes and provides input
to the next portion, then terminates before the second portion begins its simulation.
Implementation of a hybrid approach begins with decomposing a system to determine the
best design representations. These are the same as the characteristics to consider when selecting
either SD or AB and include: system scale (aggregate representation or individual), management
of units and time (time stepped or event based) and degrees and representation of agency (how
agents are represented to include their states, attributes and behaviors) (Swinerd & McNaught,
2012).
Schieritz and Milling describe a number of studies where a hybrid of SD and AB
approaches were used. In one case, SD modeling was used to simulate the internal structure of
agents in a larger AB model. Future research could explore the use of AB models at the SoS
level to represent interoperability rules while using SD modeling at the node level to represent
the constituent system behaviors.
In summary, the selection of a simulation modeling approach, whether SD, AB or hybrid,
depends on many different factors that a system modeler needs to examine. Questions to
consider include: What kind of information /data is available concerning the phenomenon to be
modeled, its environment and its behavior? At what level of detail is the information provided?
What kind of computational resources are available for running the models? And, in our case,
what does the modeler want to learn about the system to be modeled?

58
Network Structure and Behavior Modeling
Modeling behaviors using AB simulation methods requires a definition of the
characteristics of the agents as well as the rules for their interaction with other agents. Another
critical aspect of defining agent interactions is the underlying framework for those interactions,
which can be defined as a network structure. How do you arrange the agents for the beginning
of your simulation run? Who can they interact with? This is not an issue for SD models since
SD modeling considers the individuals as homogeneous pools, and individual interactions are not
considered. For SoS modeling, the underlying network could represent the physical network
connecting systems that represent the operational scenario. The emergence of the SoS behaviors
over one physical network infrastructure could be different from the behavior over a different
physical network configuration. Such information is vital in determining what physical network
topologies are considered viable options for a developing SoS.
To illustrate the effect of different network structures it is useful to examine three simple
network structures (Figure 8). Panel A shows a circular structure where each agent or node is
connected to exactly two others – one on each side. In this structure, A can only interact with B
or H. A cannot directly interact with any of the other nodes. In Panel B, A can connect with all
the other nodes, however, everyone else can only interact with A. In Panel C, A is well
connected and can interact with many of the nodes but not all of them. Nodes on the left wanting
to interact with those on the right would need to do so through A.

59
Figure 8. Example of Network Topologies That Could Impact Emergent System Behaviors
Depending on the type of simulated behavior your model represents, the end results will
differ in each of the network structure situations represented here. When developing a behavior
model, the decision for selecting the underlying network structure is critical due to the potential
impact such a decision can have on the behavior model results.
In addition to underlying network structure effects on behavior simulation outcomes,
Alam and Geller noted that the size of the network (number of agents or nodes) along with the
defined connections (which could be dynamic over time) will also affect the outcome of the
simulation behavior (Alam & Geller, 2012). In their comparison of AB and SD methodologies,

60
Rahmandad and Sterman noted that there were differences in the mean behavior for models
involving small populations. In fact, they concluded that AB and SD models representing the
same phenomenon will sometimes diverge for smaller populations (Rahmandad & Sterman,
2008).
Network Analysis and Social Network Analysis
In addition to defining underlying relationships between agents in an AB simulation,
networks also play a role in analyzing SoS architecture designs. SNA can assist in evaluating
stakeholder relationships in the SG organization dimension, but the SNA statistics are also useful
for understanding the importance of various constituents or ‘nodes’ and the overall behavior of
the network.
Introduction to Social Network Analysis
The focus of SNA is on relationships between social entities (Wasserman & Faust, 1994).
It explores patterns of those relationships and their implications. As a relationship-focused
discipline, it is well suited for social and behavioral science which is evidenced by the wide use
of SNA within those disciplines. SNA identifies “structure” in relationships through the
identification of certain patterns.
Mathematics supports SNA from three main areas: graph theory, statistical and
probability theory, and algebraic models. Recent work in the field has added more mathematical
methods to enhance the analysis capabilities of SNA (Alderson, 2008; Kas, Carley, & Carley,
2011; Kim & Kawachi, 2006; T. Yang, Chi, Zhu, Gong, & Jin, 2011).
61
Fundamental concepts found in SNA include (Wasserman & Faust, 1994):
• Actor – Social entities represented in SNA. Actors can represent individuals or
groups.
• Relational Tie – Connection between actors. There are many possible ways for
actors to be tied together which may include:
o Friendship or kinship
o Business relationship
o Association, club or hobby
o Physical connections like roads or bridges
• Dyad – Linkage between 2 actors.
• Triad – Linkage between 3 actors.
• Subgroup – Any subset of actors and all their ties.
• Group – Collection of actors on which ties are to be analyzed and measured.
• Relation – The collection of ties found with the members of a group.
Given this, a social network is defined as “a finite set or sets of actors and the relation or
relations defined on them.” (Wasserman & Faust, 1994).
There are two primary forms of SNA studied: 1) ego network analysis and 2) global
network analysis (Otte & Rousseau, 2002). Where ‘ego’ studies focus on a single actor, global
network analysis looks at all actors in the network and their relational ties. Within SoS defined
networks, global analysis may highlight patterns that could have implications at the ego level.

62
A number of SNA statistics or measures allow for assessing the relationship of the actors
in the network with other actors. Measures of interest include:
Degree Centrality – Degree centrality represents the number of connections that a particular
node or actor has with other nodes in the network. For directed networks, this can also be
measured in terms of in-degree (number of connections coming into a node) and out-degree
(number of connections going out of a node).
Betweenness Centrality – Betweenness centrality represents the number of shortest paths on the
network that pass through a particular node or actor.
Closeness Centrality – Closeness centrality measures the connectivity of a particular node with
other nodes in the network. It is computed based on the inverse of the distance between the node
and all the other nodes.
Eigenvector Centrality – Eigenvector centrality measures influence of a node on a network. Its
value is based on connectivity of the node to highly connected nodes in the network.
Although the application of SNA has been the domain of the social scientists for some
years, lately other scientific disciplines have helped to further the knowledge in this area. A key
area where physicists have contributed to this field is in the area of network dynamics, allowing
researchers to get a view into transformation of networks and explanation of network processes
(Scott, 2011).
The operations research community sees SNA as another tool for providing insight into
analysis problems. There are some who caution over-reliance on the results of SNA since certain
63
assumptions in generating the network under study could cause the loss of critical information
regarding the underlying complex system (Alderson, 2008). The same data, under different
assumptions, could yield conflicting results. Yet, SNA is still viewed as a useful tool for
analyzing complex systems involving social elements and many different factors supporting
disciplines such as epidemiology (El-Sayed et al., 2012). The maturity of the discipline can only
grow as the community continues to research and publish on the subject.
Network Structures
As discussed earlier in this chapter, the selection of network structure for defining the
relational paths between agents in an AB simulation is critical to the outcome of the simulation
itself. A number of approaches have been used to explore the impact of network structure on
simulation outcomes. Rahmandad and Sterman implemented a design of experiments to explore
the behavior of their simulation models across five selected network structures: fully connected,
random, small world, scale-free, and lattice (Rahmandad & Sterman, 2008). Kuypers et. al. used
the following structures: fully connected, hub network, circular network and a combined
network of a fully connected and circular network (Kuypers, Beyeler, Glass, Antognoli, &
Mitchell, 2012). Kearns, et. al. (Kearns, Judd, Tan, & Wortman, 2009) in their empirical studies
used network structures generated randomly using an Erdos-Renyi method and a structure
generated using preferential attachment. Another approach to network structure selection would
be to develop a custom network structure that resembles the interaction network expected for the
modeled behavior, perhaps based on the operational interactions defined for a SoS event. A third
approach that has not been deeply explored is to represent the dynamic nature of networks by
allowing the network structure to vary over time while the simulation executes. This was done

64
in two studies where the structure of the network was altered by varying the number of nodes or
links in a network dynamically (Albert & Barabási, 2000; van Klaveren, Monsuur, Janssen,
Schut, & Eiben, 2009). These approaches may serve as a good basis for exploring archetype
behaviors and SoS emergent behaviors.
SoS Structure
Closely related to network structure is the SoS structure. SoS structure selection may
have network characteristics. For example, one study developed a concept for nested networks.
This provides a hierarchical structure for a SoS where a node may itself be a network that is part
of a larger network (Harary & Batell, 1981). For example, the connection between families in a
neighborhood would form a network, but representation of each family at the individual level
would allow each family node to be a network itself. For participation in a T&E event by
multiple geographic sites, each site could be represented by a network and the overall exercise
would also be a network containing those networks. This would allow network analysis at the
site level as well as at the overall SoS level. SoS structure has also been represented using
various “layers” of connectivity. In SoS analysis, several layers of connectivity may occur
between nodes. The layers include economic, political, military, social, information and
infrastructure aspects of connectivity (Vego, 2006). Warden developed a 5 ring model to capture
characteristics of the enemy in a military context. These rings include: leadership, organic
essentials, infrastructure, population and fighting mechanism (Warden III, 1995). Representing a
network of systems across various layers allows for multi-modal analysis of the relationships
between the constituent systems.

65
Characteristics of Social Networks
Central to SNA is the premise that there exists a network that reflects social or interactive
behaviors. In fact, social network models should:
• “Create relationships between those who are physically proximate and have
similar characteristics (homophily)
• Create relationships that are reciprocal: if A knows B, B knows A
• Create some very well connected individuals to provide short cuts
• Permit modeling of ties of different strengths” (Hamill & Gilbert, 2008)
Networks that support these types of behaviors have a number of common characteristics:
1. Scale-free – these are networks whose degree follows a power-law distribution
(Franks, Noble, Kaufmann, & Stagl, 2008; Hamill & Gilbert, 2008; Kas et al.,
2011; Yuasa & Shirayama, 2012) also (Alderson, 2008). This is also referred to as
“positively skewed” (Franks et al., 2008) or fat-tailed. The implication is that
some nodes in the network have far more connections than other nodes.
2. Small-world – in these networks, each node can be reached in relatively few steps
(Alderson, 2008; Franks et al., 2008). Small world networks exhibit clustering
(high transitivity) with short paths (average path length) (Hamill & Gilbert,
2008).
3. Assortivity – in networks is associated with the degree of connectivity where
nodes with many links are linked to other nodes with many links (Hamill &
Gilbert, 2008; Newman & Park, 2003). This can be caused by preferential

66
attachment where nodes will tend to connect with well-connected nodes (Barabási
& Albert, 1999; Franks et al., 2008).
4. Non-linear- with the inherent complexity of social networks, it is not surprising
that they exhibit non-linear characteristics (Franks et al., 2008; Israel & Wolf-
Branigin, 2011). Network connections do not need to be binary. By representing
the relationship on a continuum (e.g. -1 to 1), the importance of certain
relationships and components of the networks can be examined.
These types of behaviors have been observed with T&E SoS networks, which suggests
that SNA may be appropriate for understanding T&E SoS behaviors.
Analysis of Social Networks
In addition to the application of network theory, SG can also apply theory of networks to
explore the network structures that result from simulation behaviors and to identify structural
characteristics of the network to look for patterns that may be associated with unintended
behaviors. Analysis of social networks is most associated with examining specific network
statistics like density, centrality, closeness, betweenness and cliques (Otte & Rousseau, 2002).
These statistics will provide some very basic information about the actors in the network and
their relationship to one another. However, additional methods are needed to gain real insight
into the problems that may be represented by the network. A deeper study of a social network
was conducted that explored the content of what was exchanged between actors. A social
network was generated based on the relationship defined by content exchanged (Cucchiarelli,
D’Antonio, & Velardi, 2012). This type of analysis goes beyond relational connections and
provides deeper insight into the operation of the network. Similar approaches can be used in SG

67
to provide greater insight into interactions within a SoS based on the types of communications
(e.g. simulation vs C2) exchanged across the network.
Graph theory has provided a means to visualize social networks in terms of actors and
their ties. Such visualizations can be useful in highlighting key SNA features for specific nodes
of interest such as high betweenness or high centrality. However, graphs can quickly become
difficult, even impossible to visualize well as the number of nodes increases. To simplify the
networks but still take advantage of visualizing the graph, work has been done using fractals to
abstract complex objects and control the amount of information displayed (C. C. Yang &
Sageman, 2009). In addition to graphs, innovative visualizations such as 2D lattice tables, heat
maps (Yuasa & Shirayama, 2012) and contour plots (Franks et al., 2008) have been used to
examine influence in social networks.
In addition to these, other analysis methods have been applied to aid in data mining the
social network data. Millet highlighted three types of pattern recognition techniques that
researchers should use if exploring network patterns.
• Type I (Background) – Knowing the background the researcher looks for changes
from the norm
• Type II (Signals) – look for specific signals, signatures or trends
• Type III (Scatters) – detection of signals without context that need to be explored
through emerging pattern recognition
Multilevel analysis allows for the exploration of multiple factors (Kim & Kawachi, 2006)
and the potential for using response surface methodologies. Discrete fourier transforms (DFT)
were used to transform time data into the frequency domain, allowing an analysis of

68
periodicities of recurring activity in a social network (Kas et al., 2011). Much work has been
initiated in the area of community detection. One study established a framework to express the
social network as a tree structure and used a developed algorithm to explore the dynamic
evolution of organizational structures (Qiu & Lin, 2011). Branting (Branting, 2011) performed a
localized network search and focused on vertex selection based on relative centrality. Hamill
(Hamill & Gilbert, 2008) implemented “circle models” to explore network structure,
communities and assortivity. Bayesian approaches to parameter estimation have become a
method for identifying communities within a dynamic social network (T. Yang et al., 2011).
Studies of SoS architectures using SNA and network analysis have focused primarily on
centrality measures. There are many opportunities for future research to analyze utilization of
the networks with some of the other approaches highlighted above.
Tools to Support SG Processes and Methods
Tools are the third component of any methodology and are developed to support the
processes and methods of the methodology. SE tools have thus evolved around the SE processes
and methods that have been established over the years. As researchers have developed new
methodologies, a number of tools have emerged. The most widely used of these tools
correspond to general SE development trends and community standardization activities in SE
processes and methods. General approaches to SE include: Traditional Top-Down, Waterfall
Model, Spiral Model, and Object-Oriented Design. A host of tools have developed around each
one of these SE approaches. Many of these tools are templates and documents used to capture
the results of the process or method steps. Computer-based tools have been used to expedite the

69
analysis process, coordinate products and results between different steps in the SE process, or for
collaboration between stakeholders involved in the SoS development activity.
SoS SE utilizes the existing SE toolset in the context of the SoS SE process activities
(Office of the Deputy Under Secretary of Defense for Acquisition and Technology, Systems and
Software Engineering, 2008). Research in SoS engineering approaches provides guidance in the
application of SE tools for SoS process challenges (Jo Ann Lane & Bohn, 2013; Jo Ann Lane,
2012).
A summary of the main areas of SE process (Martin, 1997) and associated tools are
summarized in Table 6.
Table 6. Summary of SE Tools SE Process Activities Types of Tools
Program / Engineering management – these include support for plan / document development, task scheduling and tracking tools.
Planning tools, office products for documentation, collaboration tools, monitor and tracking tools for project performance (cost, schedule and technical), video and audio conferencing
Requirements – support for the entire life cycle of requirements development including capture, tracking and management.
Requirements management plans, requirements tracking tools
Functional Analysis & Architecture design – focus on decomposition of the system and the interactions between the components.
Functional decomposition (functional hierarchy, functional flow), System Modeling tools (such as UML, SysML, IDEF, simulation tools), architecture development tools, network analysis tools
Design and Development – detailed design of the system components and their development.
Tools for HW and SW design and development activities including 2D and 3D drawing tools, software design and development tools.
Integration and Verification – bringing the individual components back together as a whole system and ensuring they meet the identified system requirements.
Software development tools to support integration, requirements tracking to track verification / compliance

70
The literature highlights a number of processes, methods and tools that can be used to
analyze SoS. There is a gap in methodologies that address the “wickedness” of SoS analysis
through investigation focused on the problem (instead of requirements) while considering the
cross dimensional effects and interactions that can introduce the unintended SoS behaviors.
SG has a rich system science background to draw from to design a methodology that will
take a problem-based approach toward capturing, analyzing, and improving SoS designs.
Enterprise architecture approaches have provided well developed taxonomies for capturing SoS
dimensions of interest. Processes associated with the EA, along with other process
methodologies developed by researchers provide a baseline approach to analysis planning.
Many methodologies related to modeling and network analysis show great promise for better
understanding SoS emergent behaviors. These processes and methods are supported by a
number of tools that can facilitate the implementation of SG processes and methods.

71
CHAPTER THREE: METHODOLOGY AND ANALYSIS
Research Methodology
SG has been developed using qualitative research methods. Selection of this approach is
based on the types of data available for the development of the methodology. The qualitative
research method used is similar to reflexive inquiry and grounded theory (Lehmann, 2010;
VanderStoep & Johnson, 2008).
Based on extensive reading, a number of unstructured interviews and the researcher’s
20+ years of professional engineering experience, a number of themes emerged which then
became the focus for further analysis. Discussions with other practitioners in the field during the
research and after the preliminary conclusions were reached has provided reflexive and
phenomenological validity (VanderStoep & Johnson, 2008) to the study results.
Summary of method components:
• Informal (unstructured) interviews – These included exploratory questions and
discussion about problems and challenges in the T&E SoS environment. These
served to provide direction for further inquiry and validity to the developing
results.
• Researcher professional experience - 20+ years working in distributed SoS
engineering has provided a depth of personal hands on experience with the types
of problems defined by the problem statement.
72
• Analysis of documents – These reviews included T&E system documentation as
well as the academic readings summarized in the literature review and throughout
the methodology development.
• Analysis Methods – Based on the previous steps, a number of analysis methods
are employed for analyzing the SG dimensions. These include matrix modeling
(using Excel), network analysis (using Excel and Gephi) and analytic hierarchy
process (using ExpertChoice).
• Case Study – The methodology was validated using a case study. The CAGE I &
II experiments provided a venue for demonstrating the SG methodology and
assessing its ability to forecast system problems that actually occurred during the
execution of the case study experiment.
Summary of Research Approach & Activities
Understanding the Problem
Chapter 1 summarizes the problem that is addressed by this study. The problem is
identified based on the experience with engineering SoS and discussions with peers regarding the
engineering of SoS for T&E activities. The first step of the research approach is to study the
problem more deeply. Documentation, published papers and presentations for seven different
T&E events are reviewed for information related to the problem statement to look for
commonalities between such events. Such commonalities point to systemic problems with T&E
SoS that could be addressed by SG. Unstructured interviews were conducted with engineers
with extensive (20+ years) experience working in the T&E community to discuss findings
regarding the common characteristics of T&E events and the common problems identified when
73
reporting on lessons learned after an event has been executed. This information has been used to
refine the problem statement and to focus the exploration of SG methodology concepts.
Review of the Literature
With the problem refined and the context characterized, the next step is to review the
literature to establish the current state of the art for addressing the problem area. The literature
review focuses on applicable technologies and their application as it directly relates to the SoS
and, in some cases, DoD application areas. The information gained from the literature review
provides a summary of a number of approaches to the problem and identified gaps where the
approaches do not fully address the characteristics identified for the T&E SoS problem space.
The gaps represent areas that SG could address. The different approaches are compared against
each other and against the characteristics and issue areas found while exploring the problem
space.
Develop a Recommended Methodology
A SG methodology has been developed based on existing approaches that addressed SoS
but tailored to address the specific problems identified in T&E with added guidance for filling
some of the gaps identified during the review of the literature. This methodology is described in
three parts: SG process, SG methods, and SG tools. This is the focus of Chapter 4.
Validation of the Methodology: The Case Study
A representative case study has been used to validate the developed SG methodology.
The process, methods and tools have been applied to the Coalition Attack Guidance Experiments
(CAGE) based on the CAGE I & II final reports, development documentation and unstructured
interviews with CAGE event participants. Validation is based on whether the SG methodology
74
is able to identify emergent behaviors that were, in fact, actually experienced during the
execution of the CAGE II event. Results have been used to refine the SG methodology and to
provide recommendations for future research.
Further validation has been obtained by discussing the case study results with CAGE II
participants and confirming that the conclusions from applying the methodology represented the
actual CAGE situation.
Summary of Methodology and Analysis
Review of the literature shows that there has been significant work in the area of
analyzing SoS, some of which are directly applicable to the T&E area. A proliferation of such
methodologies suggests that the state of practice for this kind of analysis is not yet mature with
much of the published work being more of an academic exercise of system science methods
rather than institutionalization for industrial application. There are a number of activities in the
DoD which suggest that this is changing, and methods and tools are beginning to emerge that
could be required for implementation for new DoD SoS efforts.

75
CHAPTER FOUR: THE SYSTEMS GEOMETRY METHODOLOGY
Systems Geometry (SG) is a methodology for analyzing complex SoS in order to better
understand the relationships between constituent systems and emergent behaviors of the
composed SoS. SG methodology also seeks to provide critical insight into the integration and
operational risks of a proposed SoS composition so they can be addressed early in the SoS
lifecycle.
As a methodology, SG consists of three parts: processes, methods and tools (Estefan,
2007; Martin, 1997). The SG processes includes a sequence of activities performed by an
analyst or architect to characterize and model the SoS target environment for SG analysis. SG
methods define how the SG process is executed, while the tools serve to enable the execution of
the process and methods.
Background for T&E SoS
Characteristics of Distributed SoS for T&E.
Seven distributed SoS T&E configurations were reviewed and eight common
characteristics were identified. The characteristics in Table 7 highlight the types of information
generally available for SoS analyses. The SG process addresses the identification and collection
of this type of information. SG methods address how to capture and analyze the information.
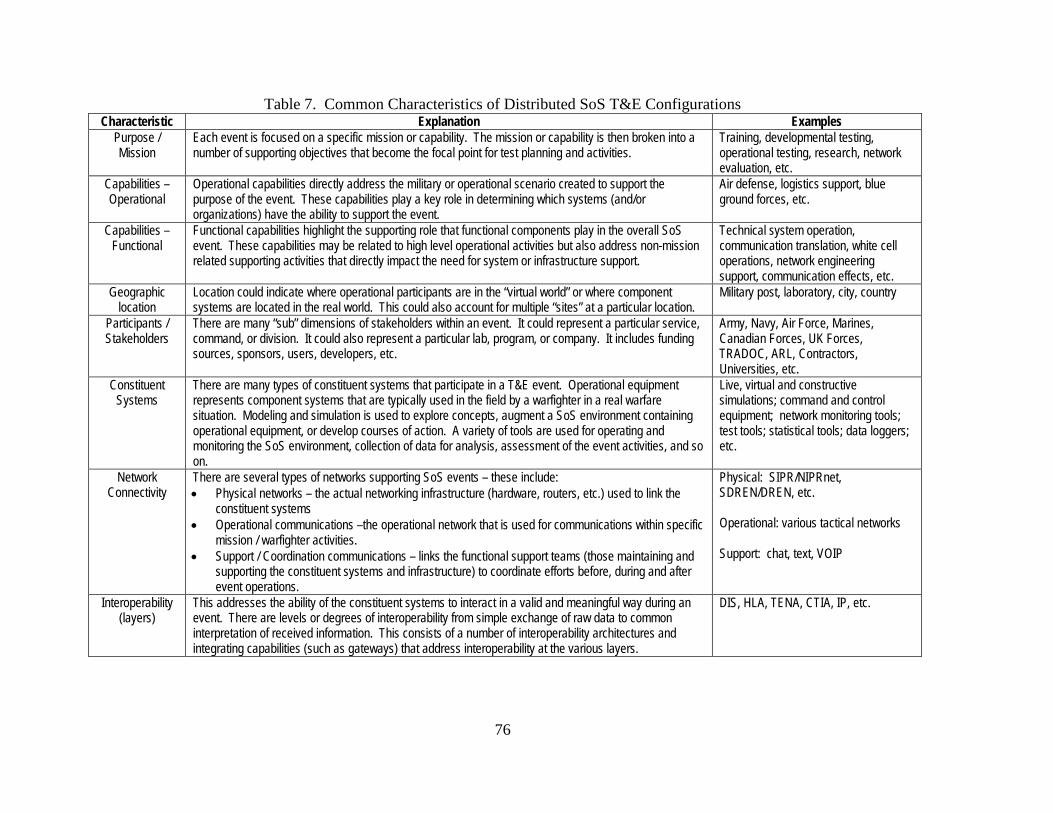
76
Table 7. Common Characteristics of Distributed SoS T&E Configurations Characteristic Explanation Examples
Purpose / Mission
Each event is focused on a specific mission or capability. The mission or capability is then broken into a number of supporting objectives that become the focal point for test planning and activities.
Training, developmental testing, operational testing, research, network evaluation, etc.
Capabilities – Operational
Operational capabilities directly address the military or operational scenario created to support the purpose of the event. These capabilities play a key role in determining which systems (and/or organizations) have the ability to support the event.
Air defense, logistics support, blue ground forces, etc.
Capabilities – Functional
Functional capabilities highlight the supporting role that functional components play in the overall SoS event. These capabilities may be related to high level operational activities but also address non-mission related supporting activities that directly impact the need for system or infrastructure support.
Technical system operation, communication translation, white cell operations, network engineering support, communication effects, etc.
Geographic location
Location could indicate where operational participants are in the “virtual world” or where component systems are located in the real world. This could also account for multiple “sites” at a particular location.
Military post, laboratory, city, country
Participants / Stakeholders
There are many “sub” dimensions of stakeholders within an event. It could represent a particular service, command, or division. It could also represent a particular lab, program, or company. It includes funding sources, sponsors, users, developers, etc.
Army, Navy, Air Force, Marines, Canadian Forces, UK Forces, TRADOC, ARL, Contractors, Universities, etc.
Constituent Systems
There are many types of constituent systems that participate in a T&E event. Operational equipment represents component systems that are typically used in the field by a warfighter in a real warfare situation. Modeling and simulation is used to explore concepts, augment a SoS environment containing operational equipment, or develop courses of action. A variety of tools are used for operating and monitoring the SoS environment, collection of data for analysis, assessment of the event activities, and so on.
Live, virtual and constructive simulations; command and control equipment; network monitoring tools; test tools; statistical tools; data loggers; etc.
Network Connectivity
There are several types of networks supporting SoS events – these include: • Physical networks – the actual networking infrastructure (hardware, routers, etc.) used to link the
constituent systems • Operational communications –the operational network that is used for communications within specific
mission / warfighter activities. • Support / Coordination communications – links the functional support teams (those maintaining and
supporting the constituent systems and infrastructure) to coordinate efforts before, during and after event operations.
Physical: SIPR/NIPRnet, SDREN/DREN, etc. Operational: various tactical networks Support: chat, text, VOIP
Interoperability (layers)
This addresses the ability of the constituent systems to interact in a valid and meaningful way during an event. There are levels or degrees of interoperability from simple exchange of raw data to common interpretation of received information. This consists of a number of interoperability architectures and integrating capabilities (such as gateways) that address interoperability at the various layers.
DIS, HLA, TENA, CTIA, IP, etc.

77
Lessons Learned During Distributed SoS Events
Lessons learned and improvement recommendations reported for multiple distributed
SoS events were collected and reviewed to identify candidate areas for analysis that represent
unintended emergent behaviors in the SoS used for the events. The lessons learned /
observations include the following:
1. Interoperability – Interoperability has been an issue for many years in the distributed
simulation / systems community and has led to the development of multiple
interoperability frameworks (HLA, DIS, TENA, CTIA, etc.). These frameworks are
not directly interoperable with one another, so a mix of gateway or bridging systems
built around different interoperability frameworks are needed to bridge that gap. SoS
operation is nearly always hampered by a lack of interoperability between the
constituent systems. Interoperability can be defined at multiple levels (Wang et al.,
2009) from basic exchange of data to establishing a common interpretation of
information conveyed in the data. Several types of interoperability standards and
guidelines are available to facilitate interoperability in a distributed SoS environment.
2. Constituent system maturity – Reduced budgets combined with challenging schedules
result in SoS integration proceeding with immature constituent systems. Maturity of
constituent systems and the maturity of their interfaces with other systems is a
significant problem with distributed SoS. Addressing this issue is more a stakeholder
scheduling and project management problem, however, analysis that involves system
maturity ratings may support risk analysis during preliminary design.

78
3. Collaboration – A critical component of geographically distributed SoS is the ability
of the engineering staff supporting operations to collaborate and share vital
information to support the event. With multiple sites supporting a wide array of
capabilities, there is the tendency to have some redundancy of function or capability
at the various sites. It is important for teams to collaborate and understand
capabilities and overlaps early in the process to avoid unnecessary (and potentially
harmful) redundancies. The flip side of this problem occurs when vital
communication is not sufficiently supported resulting in a lack of collaboration.
4. Integration requirements – In distributed SoS, it is critical to understand exactly
which constituent systems need to be integrated with other systems along with the
depth of that integration or interoperability. Integration could involve functional or
operational as well as basic physical levels. Early understanding of what options are
available for the various constituent systems will provide insight into what can be
supported during the planning process.
5. Constituent system training – With resource challenges there is generally less time to
prepare for a distributed SoS event. Training is usually planned at the beginning of
the same time frame as the conduct of the scheduled event. However, integration
issues cause delays which can shorten or even eliminate training opportunities. This
causes the systems to be used incorrectly or even not at all, invalidating the planned
experiment and reducing the amount of usable data for event analysis. This includes
engineering and data collection tools as well as the operational equipment and
simulations.

79
6. Resource assessment / utilization – A complete and accurate assessment of resources
for a specific event is generally not available until shortly before or at the actual time
of the event due to the dynamic nature of the environment. Although general
capabilities are available early in the planning process, performance problems can be
encountered when estimates for network bandwidth don’t consider all the tools and
functional systems that participate. A better understanding of resources and their
capabilities available from various sites may offer multiple configuration options that
could meet the event requirements. Modeling of these resources and configurations
early in the planning process and maintaining of these models throughout the time
leading up to the event can help to reduce the risk of infrastructure resource issues.
Staffing issues also arise when there is limited availability for infrastructure or
constituent system engineering support. Staffing support is heavily dependent on
stakeholder involvement from constituent systems and infrastructure resources –
resources that generally don’t have as much financial support for the event.
7. Analysis and experimentation support – Event planners generally focus on the
operational context and support for a particular event with less focus on the analysis
and experimentation preparations. Such preparations need to be performed
collaboratively with the SoS development to ensure that analysis and experimentation
needs are met by the SoS configuration. SoS configuration limitations may bound the
type of data that can be collected and ultimately limit the experiment analysis
opportunities. This can result in an inability to assess whether the event was able to
meet the overall objectives or capabilities.

80
8. Implementing architectural views – Architecture views, particularly DODAF, are
becoming more common in planning distributed SoS events for T&E. These views
are typically used to communicate high level information regarding the event. There
is limited use of architectural views across the various DoD event activities for
analyzing system configurations early in the development cycle and throughout the
system of systems development process.
Three types of issues are identified within the reviewed T&E events. Operational issues
are associated with the specific mission thread or operational environment that is being
represented during the event (e.g. close air support operation, red forces engagements, etc.).
Developed scenarios or mission threads are used for “scripting” the environment for use of the
systems participating in the event and for assessing the effectiveness of the participating systems
in contributing to the overall objective or capabilities that define the focus of the event.
Functional issues are related to both simulations and support tools used during the event. These
issues occurred when tools did not perform or “function” as intended, that is, they didn’t provide
the kind of function and support expected by the participants. Technical issues are related to the
environment in which the constituent systems operated. This includes the networks, computers,
and the ability of the systems to interact with each other. Technical issues are also associated
with the need for engineers supporting an event to collaborate on the operation of the constituent
systems. Issues associated with interoperability are part of the technical area but they have a
significant impact on functional and operational activities as well. The SG processes and related
methods include strategies to address these problems identified within the T&E community.

81
Systems Geometry Architecture Framework
Enterprise architecture framework approaches are well suited to address the analysis
needs for SG. Frameworks generally provide a taxonomy that allows the capture of a broad
range of SoS information that can later be used to perform analysis on the SoS. Some
frameworks include processes for capturing system information and for developing specific SoS
architectures. For this research, the SG architecture framework (SGAF) provides a taxonomy for
identifying and capturing information critical to the execution of the SG methodology.
An architectural framework to support analysis of the issues identified for T&E SoS
would need to support a taxonomy that can capture operational, functional and technical system
information along with the business rules behind how the systems (or their operators) interact
along each of these dimensions. In addition to these dimensions, organizational considerations
must also be addressed since part of the technical and functional disparities occur because
constituent systems are developed by different organizations and for different purposes.
Geographic location of the systems is also a critical consideration to help define logistical and
network performance needs.
To develop a framework for distributed SoS, several factors are considered:
• T&E Event Characteristics and Lessons Learned – The analysis of the T&E event
characteristics provide insight into the availability of information for analysis while the
lessons learned provides clues regarding the types of unintended emergent behaviors that
should be addressed early in the SoS development process.
82
• General SoS characteristics – DoD SoS share many features with complex enterprise
architectures. A study of SE for SoS was performed to explore any unique features or
systems engineering considerations for such systems that may have not been present with
the T&E specific information.
• Other architecture comparison approaches – Previous architecture framework comparison
studies were reviewed to see if the comparison approach used, or some variation of the
approach, would be appropriate for assessing frameworks with distributed SoS.
• Analysis to be performed – The application of matrix methods and network analysis
requires a framework taxonomy that captures dimensions and relationships of interest to
support development of networks for study.
The initial systems geometry framework captures these distributed SoS “dimensions” and
is summarized in Table 8. The columns in the figure highlight the dimensions of SG with the
columns within the bold box (Operational, Functional, and Technical) defining the primary
dimensions for any SoS. The last column (Network) highlights a need to consider the
interactions that take place along each of the three primary dimensions, and represents a special
instance of the other three. The rows address critical aspects of each of the dimensions in SG.
The last row on Experiment Design / Data Collection is really a special case of the preceding
Business Process row but is highlighted here because of its particular interest to the T&E
community.

83
Table 8. The Systems Geometry Architectural Framework System Geometry Dimensions Operational Functional Technical Network Organization Organizations and
role players participating in a scenario
Organizations and participants supporting component systems – engineering support
Organizations and engineering staff supporting technical execution of event
Relationships between organizations participating from an operational, functional or technical perspective. Collaboration.
Geographic Location of functional, technical systems supporting an operational scenario.
Location of technical systems supporting functional activities.
Location of component systems supporting the event. Also location of engineering specific support.
Physical networks connecting virtual and physical component systems.
Business Process
Scenario or mission threads.
Describes how component systems support the operational process. Also includes processes for using the component systems.
Process for conducting the event to include scheduling, system set up, system start up, network connectivity, etc.
Flow of information over the physical network to support operational activities and support activities. Also physical flow of information between sites from both operational and technical view.
Experiment Design / Data Collection
Experiment design and data collection related to the operational scenario activities.
Experiment design and data collection related to the use of component systems and how data is collected with these systems to support operational data collection.
Experiment design and data collection regarding the use of the physical infrastructure and how data is collected to support functional and operational needs.
Flow of data collected to support event experimentation activities. Includes local / site flows as well as inter-site data flows.
An assessment of various enterprise architecture frameworks was conducted to determine
the applicability of existing frameworks to meet the needs of the T&E SoS community. Based
on review of the literature, five frameworks are considered for use with distributed SoS and
compared against the elements in the SG dimensions (Table 9): Zachman’s Framework,
DoDAF, FEAF, TOGAF and ESM.

84
Table 9. Comparison of SG Needs Versus Several Architecture Frameworks Systems
Geometry (needs)
Zachman Framework
DODAF FEAF TOGAF ESM
Operational Business CV, OV Business (B-1, B-5) Phase B, E Objectives Functional Scope, System Svc, SV, PV Business (B-1, B-2),
Data Phase A, B, C, D, F, H
Functions
Technical What (Structure) SV, StdV Applications (D-5) Phase D Objects Network In matrix Varies Infrastructure Phase B, C, D In matrix Organization Who (People) AV Business (B-4) Phase A Stakeholders Geographic Where
(Locations) AV ? Phase A, C Parameter
Business Process How (Processes) When (Events)
AV, OV, PV Data (D-4, D-7. D-8) Phase D Activities
Experiment / Data Collection
How (Processes) What (Data)
DIV Data, Strategy Phase A, B, C Activities
Table 9 demonstrates that all of the frameworks provide a means to express all of the SG
dimensions and are able to capture the required taxonomy. This provides the analyst with a
number of choices for expressing SG dimensions. Final selection of an AF will depends on SG
analysis needs and closer examination of additional features of the framework. Stakeholder
requirements may also influence architecture selection (e.g. DoD requires the use of DoDAF for
architecture development).
Systems Geometry Process Definition
Approaches to SoS Engineering
SG recognizes the need to quantitatively investigate SoS approaches before developing
the SoS. Recommended SoS engineering approaches tend to rely on qualitative methods that are
manpower intensive, require deep SE experience and can become unwieldy in very large SoS
efforts. The view of SoS engineering is shaped by how SE has traditionally approached complex
problems. Systems science employs either reductionist or holistic approaches to reduce a
complex problem to something more solvable. Systems engineering methods today generally

85
take a reductionist view, but this does not account for the fact that a SoS “whole” is not equal to
the sum of its parts. The behaviors of a SoS are better characterized as emergent since the
overall SoS behavior only exists as a result of the functioning SoS and does not exist within the
individual constituent systems (Maier, 1998; Sage & Cuppan, 2001). SoS approaches need to
address the occurrence of unintended emergent behaviors, while providing a way to address
changes in the constituent systems or their interactions over time without redoing the entire
analysis. The implications for SG analysis is that a purely reductionist approach will not
properly address the behaviors of the SoS.
A holistic approach based on systems thinking exploits emergence to understand SoS
behaviors. Though on its own, it is unable to address the detailed representation of constituent
systems, holistic approaches make it possible to include external factors into the SoS analysis
such as stakeholders and other system drivers. SG mimics Robertson-Dunn’s method to system
architecture by taking a problem-based approach to modeling and analyzing SoS.
SoS Process Approaches
The SoS development process needs go beyond normal SE process steps. In general, SE
activities associated with SoS are much more complex, rely on a much higher degree of
collaboration between many stakeholders and capabilities, and trade-offs are weighed
continuously. For very large SoS the effort could be extremely resource intensive. Tools and
techniques that can facilitate the process or allow for more automated, quantitative analysis has
the potential to greatly reduce this effort.
86
A number of SoS analysis processes were reviewed in chapter 2. Processes that appear to
be most applicable to SG are: Qualitative Knowledge Construction (QKC), DoDAF 6-step
process, TOGAF Architecture Development Method (ADM), and Capability to Requirements
Process for SoS. Their applicability is determined by comparing the process approaches to the
SG process needs.
Systems Geometry Process Needs
SG has been developed to focus on identifying unintended emergent behaviors in SoS,
particularly those caused by interactions between different SG “dimensions” of the SoS under
study. The SGAF was formed around this concept. The SGAF was developed based on the
common characteristics identified in T&E systems as well the issues typically identified during
T&E event lessons learned. A number of existing architecture frameworks (AF) were examined
to see if they could address the architecture needs for SG by capturing and analyzing the SG
dimensions.
The processes examined as part of this research provide several good approaches for
defining the objectives and high level architecture requirements for a targeted SoS and using
those requirements to compose a SoS, verifying that it meets the defined objectives. These
processes are silent on preparing for and performing cross-dimensional analysis. Cross-
dimensional analysis is defined to be analysis of interactions between different dimensions in
SG. Some cross-dimensional considerations are implied when attention is focused on system
configurations (SG dimension: technical) that meet capability objectives (SG dimension:
operational), but nothing beyond a functional decomposition / allocation matrix has been

87
recommended in the literature reviewed to address analysis across SoS dimensions. Other
processes and methods are required to model cross-dimensional aspects of the SoS to explore the
criticality of SoS components, their interactions and their impact on emergent SoS behaviors.
Several of the AF studied include their own architecture development processes as part of
the framework (e.g. TOGAF). Not all of these are compatible with the SoS engineering
activities identified earlier in this section. The process for SG needs to support a combination of
reductionist and holistic approaches that can reduce the complexity of the SoS problem without
sacrificing the detail required for analysis. The process needs to capture key information
regarding the architecture in a form that can be used for further analysis, both within a particular
dimension as well as between dimensions. SG dimensions can fit into all of the reviewed AFs.
Only one AF has demonstrated the ability to perform cross-dimensional analysis and that is the
ESM.
The Systems Geometry Process Defined
SG process needs to go beyond the typical SoS definition needs identified in the
processes above. Most of the approaches include a step in the process for identifying high level
goals or objectives, defining context for meeting those objectives (systems, stakeholders,
locations, etc.), development of SoS configuration options, selection and development of the
SoS; then review, modify, rinse and repeat. Since SG is focused on looking at the cross-
dimensional effects that cause bad behaviors to emerge from the system, the SG process is
focused on gathering the right information to perform the appropriate analysis. Therefore, the
SG process comprises the following steps and is summarized in Figure 9:

88
Figure 9. Systems Geometry Process
1. Determine which SoS problem areas are going to be of most concern for the developing
SoS. This can be done using previous lessons learned from final reports and interviews
with participating stakeholders for previous events.
2. Based on the identified problem areas, determine what SG dimensions are necessary to
perform analysis for those problems – what information needs to be collected from the
SoS and constituent system stakeholders to support dimensional and cross-dimensional
analysis?
3. Collect the SG dimensional information using an architecture framework that can capture
information critical to the planned analysis.
89
4. Develop models of the SoS or key behavioral components of the SoS to allow
representation of the intra and cross-dimensional relationships between SG components.
5. Perform the analysis.
6. Review analysis results against the identified problems, operational objectives and other
defined system capabilities. Review with stakeholders to see if the analysis results make
sense or if the SoS information needs to be updated and the analysis repeated.
7. Update and re-run as needed.
Systems Geometry Methods Definition
Traditional Systems Engineering: Traditional Structured Analysis
In the past, systems engineers have employed traditional structured analysis (TSA)
methods for defining, analyzing and developing a target system. The SE Guide for SoS points
out that each step of the TSA method is impacted by the complexity of SoS and requires
significantly more effort and coordination to ensure the SoS environment is properly addressed
(DoD, 2008). A number of approaches to SoS are identified based on a review of the literature.
Although not yet institutionalized across the DoD, the methods available are starting to grow in
their use and maturity.
Analysis Methods Applicable to SoS for SG
Because of the nature of SoS characteristics, a blend of qualitative and quantitative
analysis methods are necessary to evaluate SoS behaviors. Qualitative methods are employed
because of the availability and use of descriptive data captured in constituent system and SoS
documentation. SoS engineers carry out inductive analysis of available documentation,
presentations and team meetings conducted during the development of the SoS. Some of the

90
information captured and used is subjective in nature, based on the judgment of the engineer
collecting the information. Quantitative analysis methods are also employed in support of
experimentation activities. Test and experimentation analysts develop disciplined experiment
designs, data collection plans and analysis approaches to determine whether targeted system or
SoS capabilities (objectives) are achieved. Experiment objectives are identified, hypotheses
developed to support the objectives, and metrics identified and collected to evaluate achievement
of the hypotheses. Experiment construction in a SoS environment is challenging due to the
inability to tightly control the experiment environment and the potential for the occurrence of
unintended emergent behaviors that can skew or invalidate experiment results. Part of the
motivation for the development of SG methods is to proactively address such SoS behavior
issues.
Grady’s (Grady, 2009) recommends that modeling of the system be performed, and
modeling methods include elements of TSA with SysML. Grady’s discussion of TSA steps
provides a good back drop to point out SoS concerns as well as his specific modeling
recommendations. This is summarized in Table 10.
Lane and Bohn (Jo Ann Lane & Bohn, 2013) also recommend a modeling approach to
SoS development and evolution. Their work and Lane’s earlier work (Jo Ann Lane, 2012) puts
SoS modeling in the context of the DoD’s SE Guide for SoS (DoD, 2008), developing methods
for performing analysis activities recommended in the guide.
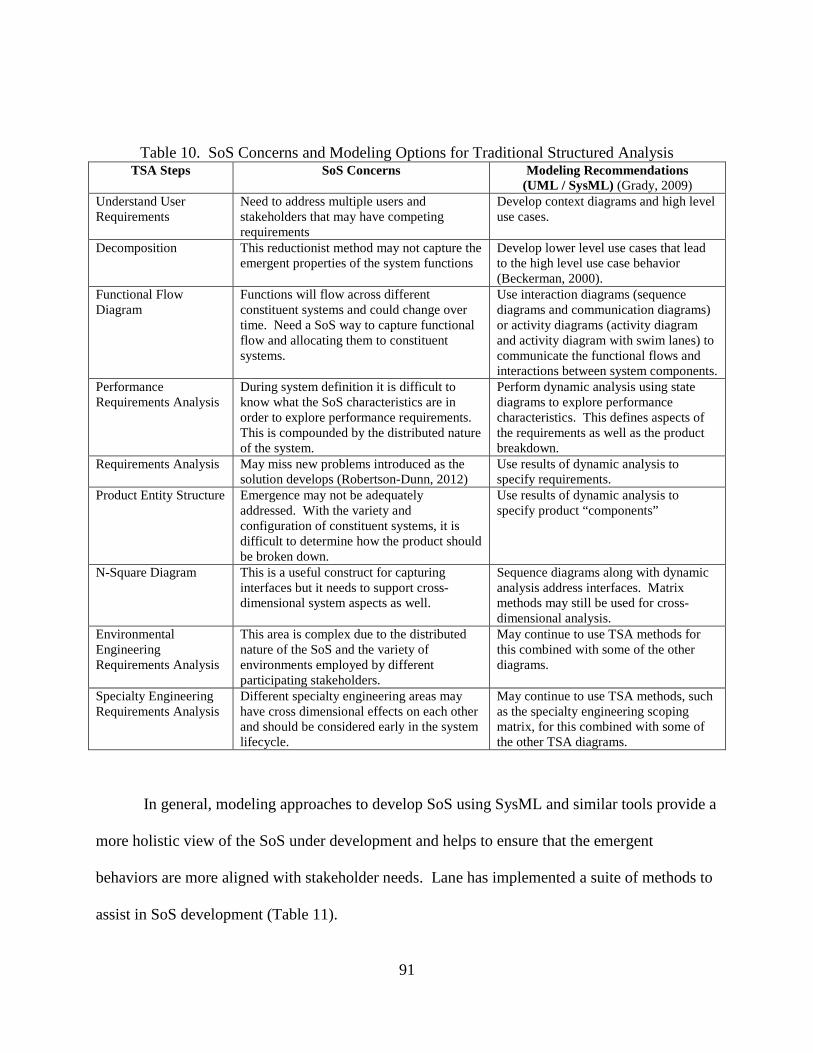
91
Table 10. SoS Concerns and Modeling Options for Traditional Structured Analysis TSA Steps SoS Concerns Modeling Recommendations
(UML / SysML) (Grady, 2009) Understand User Requirements
Need to address multiple users and stakeholders that may have competing requirements
Develop context diagrams and high level use cases.
Decomposition This reductionist method may not capture the emergent properties of the system functions
Develop lower level use cases that lead to the high level use case behavior (Beckerman, 2000).
Functional Flow Diagram
Functions will flow across different constituent systems and could change over time. Need a SoS way to capture functional flow and allocating them to constituent systems.
Use interaction diagrams (sequence diagrams and communication diagrams) or activity diagrams (activity diagram and activity diagram with swim lanes) to communicate the functional flows and interactions between system components.
Performance Requirements Analysis
During system definition it is difficult to know what the SoS characteristics are in order to explore performance requirements. This is compounded by the distributed nature of the system.
Perform dynamic analysis using state diagrams to explore performance characteristics. This defines aspects of the requirements as well as the product breakdown.
Requirements Analysis May miss new problems introduced as the solution develops (Robertson-Dunn, 2012)
Use results of dynamic analysis to specify requirements.
Product Entity Structure Emergence may not be adequately addressed. With the variety and configuration of constituent systems, it is difficult to determine how the product should be broken down.
Use results of dynamic analysis to specify product “components”
N-Square Diagram This is a useful construct for capturing interfaces but it needs to support cross-dimensional system aspects as well.
Sequence diagrams along with dynamic analysis address interfaces. Matrix methods may still be used for cross-dimensional analysis.
Environmental Engineering Requirements Analysis
This area is complex due to the distributed nature of the SoS and the variety of environments employed by different participating stakeholders.
May continue to use TSA methods for this combined with some of the other diagrams.
Specialty Engineering Requirements Analysis
Different specialty engineering areas may have cross dimensional effects on each other and should be considered early in the system lifecycle.
May continue to use TSA methods, such as the specialty engineering scoping matrix, for this combined with some of the other TSA diagrams.
In general, modeling approaches to develop SoS using SysML and similar tools provide a
more holistic view of the SoS under development and helps to ensure that the emergent
behaviors are more aligned with stakeholder needs. Lane has implemented a suite of methods to
assist in SoS development (Table 11).
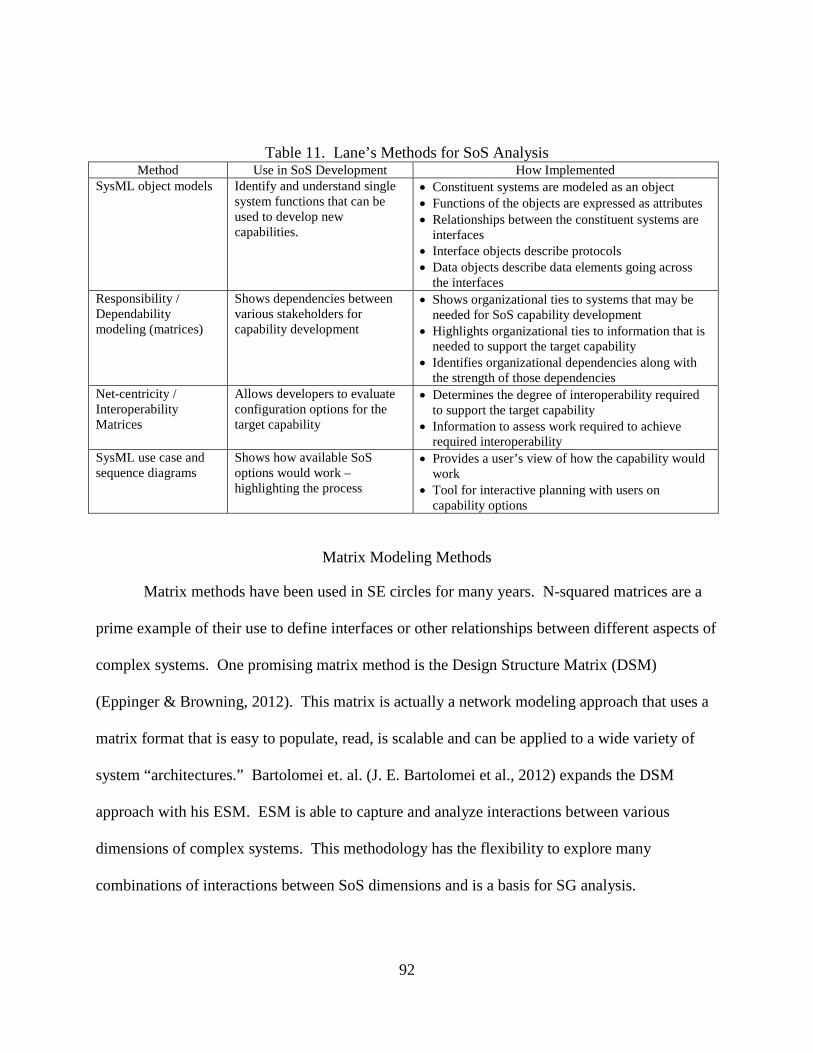
92
Table 11. Lane’s Methods for SoS Analysis Method Use in SoS Development How Implemented
SysML object models Identify and understand single system functions that can be used to develop new capabilities.
• Constituent systems are modeled as an object • Functions of the objects are expressed as attributes • Relationships between the constituent systems are
interfaces • Interface objects describe protocols • Data objects describe data elements going across
the interfaces Responsibility / Dependability modeling (matrices)
Shows dependencies between various stakeholders for capability development
• Shows organizational ties to systems that may be needed for SoS capability development
• Highlights organizational ties to information that is needed to support the target capability
• Identifies organizational dependencies along with the strength of those dependencies
Net-centricity / Interoperability Matrices
Allows developers to evaluate configuration options for the target capability
• Determines the degree of interoperability required to support the target capability
• Information to assess work required to achieve required interoperability
SysML use case and sequence diagrams
Shows how available SoS options would work – highlighting the process
• Provides a user’s view of how the capability would work
• Tool for interactive planning with users on capability options
Matrix Modeling Methods
Matrix methods have been used in SE circles for many years. N-squared matrices are a
prime example of their use to define interfaces or other relationships between different aspects of
complex systems. One promising matrix method is the Design Structure Matrix (DSM)
(Eppinger & Browning, 2012). This matrix is actually a network modeling approach that uses a
matrix format that is easy to populate, read, is scalable and can be applied to a wide variety of
system “architectures.” Bartolomei et. al. (J. E. Bartolomei et al., 2012) expands the DSM
approach with his ESM. ESM is able to capture and analyze interactions between various
dimensions of complex systems. This methodology has the flexibility to explore many
combinations of interactions between SoS dimensions and is a basis for SG analysis.
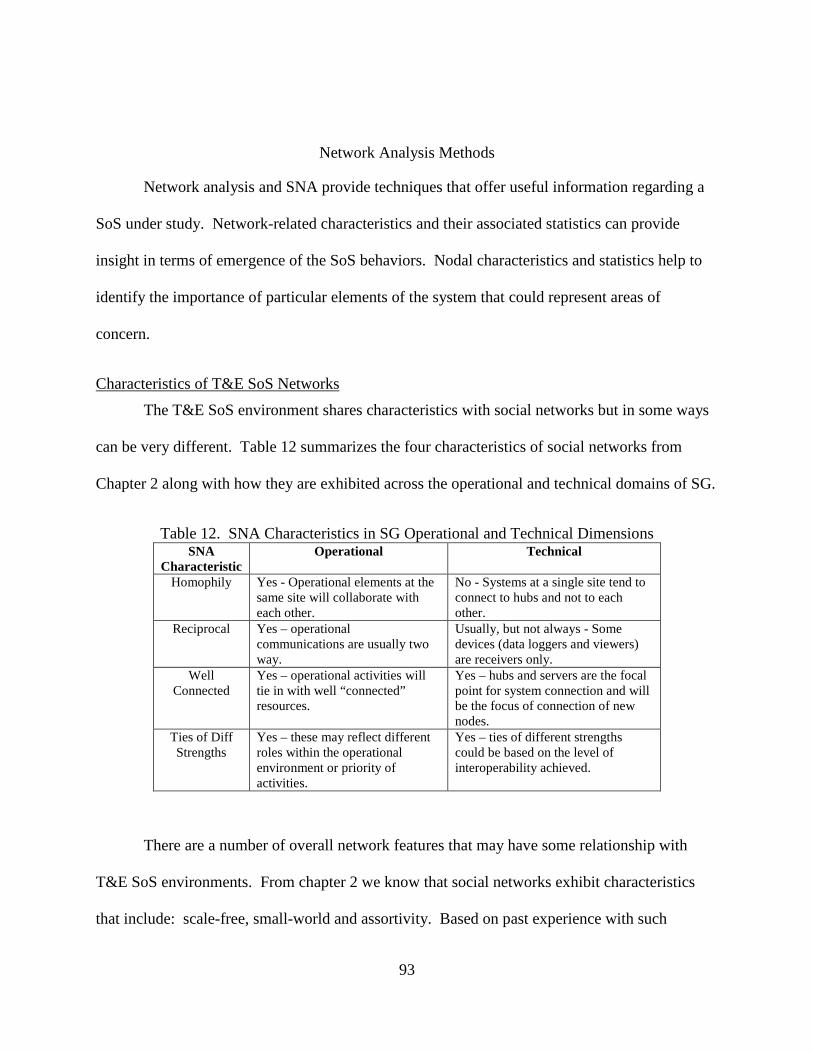
93
Network Analysis Methods
Network analysis and SNA provide techniques that offer useful information regarding a
SoS under study. Network-related characteristics and their associated statistics can provide
insight in terms of emergence of the SoS behaviors. Nodal characteristics and statistics help to
identify the importance of particular elements of the system that could represent areas of
concern.
Characteristics of T&E SoS Networks
The T&E SoS environment shares characteristics with social networks but in some ways
can be very different. Table 12 summarizes the four characteristics of social networks from
Chapter 2 along with how they are exhibited across the operational and technical domains of SG.
Table 12. SNA Characteristics in SG Operational and Technical Dimensions SNA
Characteristic Operational Technical
Homophily Yes - Operational elements at the same site will collaborate with each other.
No - Systems at a single site tend to connect to hubs and not to each other.
Reciprocal Yes – operational communications are usually two way.
Usually, but not always - Some devices (data loggers and viewers) are receivers only.
Well Connected
Yes – operational activities will tie in with well “connected” resources.
Yes – hubs and servers are the focal point for system connection and will be the focus of connection of new nodes.
Ties of Diff Strengths
Yes – these may reflect different roles within the operational environment or priority of activities.
Yes – ties of different strengths could be based on the level of interoperability achieved.
There are a number of overall network features that may have some relationship with
T&E SoS environments. From chapter 2 we know that social networks exhibit characteristics
that include: scale-free, small-world and assortivity. Based on past experience with such
94
environments, one would expect to observe scale-free behaviors on the technical dimension
based on the frequent use of gateways and servers (which would have high connectivity to other
nodes) and on the operational dimension based on the organization focus on higher and lower
level commands. In terms of small-world features, the number of “hops” for communication is
likely small (short path length) but communication from each individual to everyone else (high
clustering) is probably not exhibited on both the technical and operational dimensions.
Assortivity, as reflected by preferential attachment, is likely to be a feature of T&E SoS since
bringing new systems into a configuration usually involves them connecting to an existing hub or
server. None of the reviewed literature has explored these network features in the context of
T&E SoS. Chapter 5 examines these concepts with the case study.
Characteristics of T&E SoS Nodes
To address the identified SoS issues in the T&E environment, SG includes a study of
networks to look for nodes (which could be systems, objectives, stakeholders, etc.) which have
significance for the overall SoS activity. Important nodes are identified using SNA centrality
measures. In the technical dimension, important nodes tended to be highly connected on the
network (high degree centrality) or are critical for nodes to reach other nodes on the network
(high betweenness centrality). From an operational standpoint, the communications aspect of
operations may be reflected in connections to existing highly connected individuals (eigenvector
centrality) or how quickly communications can get spread to others (closeness centrality).
The selection of network node statistics for SG analysis will depend on the SG dimension
and the problem area being explored.

95
SG Analysis Method
SoS issues from the T&E community were reviewed against the SG dimensions and
aspects (from Table 8 on page 83) to assess which dimensions are critical for consideration with
specific issues (Table 13).
Table 13. Relationship of SoS Issues with SG Dimensions
SG Dimensions
SoS Issues Operational Functional Technical Network Organi-zation Geographic Business
Process
Experiment / Analysis Support
Interoperability x x x x x x x x Constituent System Maturity x x
Collaboration x x x x x x x Integration x x x x Training x x x x x x Resource Assessment / Utilization
x x
Analysis & Experimentation Support
x x x x x
Implementing Architectural Views
x x x x x x x x
Table 13 highlights the importance of many of the SG dimensions to address issues
related to interoperability, collaboration, training and implementation of architectural views.
Technical and organization dimensions appear to impact the greatest number of issue areas.
Analysis methods that relate across the SG dimensions will provide a more complete picture of
how to address SoS T&E issues.

96
Researchers have published on a number of approaches to address SoS areas of concern.
By reviewing the analysis methods found in the literature in relationship to the SoS issues, a set
of analysis methods emerge that are most relevant to SG (Table 14).
Table 14. Recommended Analysis Methods to Address T&E SoS Issues T&E SoS Issues Recommended Methods
Interoperability & Integration
SysML sequence diagrams along with interface attribute information for all three dimensions will provide important insight into the SoS needs for integration and interoperability.
Constituent System Maturity
Matrix and network methods to show stakeholder relationships with one another and with candidate constituent relationships. Capability analysis (and other SoS configuration alternative techniques) will consider maturity when providing constituent system options to the SoS developer.
Collaboration Matrix and network methods showing stakeholder relationships along various collaborative areas to include operational collaboration, functional and technical.
Training Matrix methods mapping processes, systems and stakeholders can determine what kind of training is needed and who needs to be trained. Traditional project management methods of planning and tasking can ensure that proper training takes place.
Resource Assessment / Utilization
Matrix methods help to identify system resources required to support operational and functional activities. Network methods could be used to examine which resources are most critical to the success of the event.
Analysis & Experimentation Support
SysML use case and sequence diagrams can be used to show the business process for analysis and experimentation activities, ensuring that they are supported. Matrix methods will relate the needed capabilities with specific systems for implementation. Network analysis methods can reveal the importance of certain metrics or hypotheses for performing capability analysis.
Implementing Architectural Views
Utilize DoDAF which is recommended for use in the DoD T&E environment and can capture the information required for other analysis techniques.
The exploration of various SoS analysis methods relative to the T&E SoS issue areas
leads to the selection of a candidate set of SG methods. These methods are:
1. System Modeling Methods: includes UML/SysML potentially supported by
other modeling approaches such as AB or SD simulation.
2. Matrix Methods: Matrix methods for expressing complex relationships between
SG dimensions to include DSM or ESM.

97
3. Network Analysis Techniques: Network analysis to identify areas of importance
within the composed SoS.
Table 15 summarizes the selected methods and the benefits provided to SG goals and
recommended process.
Table 15. SG Analysis Methods and Their Benefits SysML • Identification of SoS components, attributes and interactions
• Exploration of operational, functional and technical business processes supported by the SoS
Matrix methods • Interoperability and system interactions • Operational support mapped to specific systems • Identification of redundancies of function and systems • Implementation to analyze experimentation needs: Objectives mapped to
Hypothesis mapped to Metrics allowing an exploration of which metrics are most important (mentioned on some of the SE for SoS material)
Network analysis methods
• Bottlenecks in interfaces or networks • Critical systems that interface with many others • Analysis of alternative configurations • Stakeholder analysis
Systems Geometry Tools Definition
Tools are the third component of the SG methodology and are selected to support the
processes and methods discussed in the previous sections. Tool capability is focused on
collaboration between SoS stakeholders, support for the execution of the SoS engineering
process, modeling of the SoS or components, and network modeling for exploring relationships
between SoS constituents or dimensional relationships. Much of the activity for collecting data
to support SG analysis is performed using common office based tools such as MS Excel® but
such work can be very tedious, and depending on the size of the system, can be very time
consuming. Based on the tailored nature of the SG process and selected methods, tool selection
should be flexible depending on the type of analysis that is needed to address the problem areas
identified at the start of an SG analysis.

98
Outside of the more traditional SE support tools, recent developments in social media
applications have provided a number of innovative tools for collaboration activities. There are
also a few tools available for performing the type of intra and cross-dimensional analysis
required by SG (Table 16).
Table 16. SG Tool Features and Examples to Support SG Process and Methods SG Process Step SG Analysis Methods Tool Features Examples Identify Areas for Analysis
Review lessons learned and capability requirements through stakeholder meetings
Brainstorming tools, office products for documentation, desktop sharing, whiteboard applications, audio and video teleconferencing
MindManager, Text 2 Mindmap, Skype, WebEx, Adobe Connect
Identify SG Dimensions
Discussion with stakeholders, review of analysis areas, previous experience
Brainstorming tools, office products for documentation, desktop sharing, whiteboard applications, audio and video teleconferencing
MindManager, Text 2 Mindmap, Skype, WebEx, Adobe Connect
Use an Arch Framework to Capture Dimensional Information
Use an available architecture framework such as TOGAF, DoDAF and/or ESM to capture key dimensional information.
Office products for documentation, tools for developing architecture views
Office products (MS Excel, MS Word, etc.), Innoslate, Genesys, IBM Rational Tools, MagicDraw, Open System Engineering Environment
Develop SoS Models and Functional Models
Use SysML, AB and SD to model SoS and key SoS functional areas
System level models development supporting model-based systems engineering to include UML, SysML, discrete event simulation, system dynamic and agent based models
IBM Rational Tools, MagicDraw, Arena, AnyLogic, NetLogo, Expert Choice
Perform Dimensional and Cross Dimensional Analysis
Use previous experience and network analysis methods to explore cross dimensional relationships
Functional block diagrams, data flow diagrams, N2 Charts, IDEF Diagrams, UML diagrams, SysML diagrams Tools for generating network graphs and calculating node and network statistics MS Excel, Gephi, ORA (CASOS tool), Statistical tools
Office products (MS Excel, MS Word, etc.), Innoslate, Genesys, IBM Rational Tools, MagicDraw, Open System Engineering Environment Gephi, Ora, Pajek, NetLogo, NodeXL, UCInet, R
Review Results Meet with stakeholders to review results and update dimensional information and methods as needed
Brainstorming tools, office products for documentation, desktop sharing, whiteboard applications, audio and video teleconferencing
MindManager, Text 2 Mindmap, Skype, WebEx, Adobe Connect

99
SG Methodology Summary
A methodology has been developed to examine the emergence of behaviors in SoS that
are both unintended and undesirable. Based on lessons learned and issues identified in the DoD
T&E community, a process has been developed to analyze developing SoS to detect the issues
before the system is developed. Existing methods have been reviewed and explored for their
applicability to T&E issue areas. Tools have been identified that can assist in the execution of
the process and methods identified. A summary of the methodology components is provided in
Figure 10.
SG Methodology Component How used with SG SG Process
SG Process focused on performing analysis based on issues targeted early in the engineering process.
SG Methods SysML, ABM and SD Modeling Matrix Methods Network Analysis
SG methods based on SG dimensions of interest and analysis required to address issue areas.
SG Tools Office products, Brainstorming tools Collaboration tools: WebEx®, Adobe Connect® or Skype® SE Tools: IBM Rational®, MagicDraw ® ABM/SD: AnyLogic®, NetLogo, Arena® Gephi, ORA, NetLogo, R (with SNA) Statistical Tools: Minitab, R, SPSS, etc.
SG Tools based on process steps and methods employed for analysis.
Figure 10. SG Methodology Summary

100
Introduction to the Systems Geometry Case Study
SG methodology development has been based on a qualitative analysis of SoS
characteristics and SoS experience as published in the literature. Reflexive validation of the
qualitative results has been performed throughout the development process through several
unstructured interviews and email exchanges with experts in the field of SoS implementation.
To further validate the recommended methodology, a case study is performed to demonstrate the
implementation of the methodology and to show how analysis results are able to identify
emergent unintended behaviors. At the conclusion of the case study implementation,
phenomenological validation is performed through a debrief with the same SoS experts.
The case study is based on a specific T&E event conducted in 2012 called the Coalition
Attack Guidance Experiment (CAGE) II. CAGE II is part of a series of multi-national
experiments to explore new concepts of operations through experimentation with tools and
processes that assist joint coalition operations at the brigade and division headquarters level. The
focus of CAGE II was on a joint and coalition task force facing battlespace integration, joint fire
systems interoperability, and cross-boundary control issues at the brigade level.
The CAGE II investigation was based on two experimental conditions: Condition 1 used
a baseline of systems, personnel and processes, and Condition 2 used potential future systems,
personnel and processes. Based on the CAGE II experiment objectives, several hypotheses were
developed to focus the investigation. Metrics to support the investigation of the hypotheses were
identified along with methods for collecting the data. A set of scenarios or mission threads were
developed for executing the Condition 1 and Condition 2 settings. The results of the CAGE II

101
experiments are recorded in an unpublished draft final report. Information from the final report
along with discussion with the participants is used for implementing SG with the case study.

102
CHAPTER FIVE: CASE STUDY IMPLEMENTATION OF SYSTEMS GEOMETRY
Introduction
CAGE II has all the characteristics of a classic SoS as well as a T&E SoS. Table 17
summarizes how CAGE II embodies the SoS characteristics identified in Chapter 4.
Table 17. SoS Characteristics as Found in CAGE II SoS
Characteristic CAGE II Characteristic
Purpose / Mission The purpose of the CAGE II experiment was to explore new concepts of operations through experimentation with tools and processes that assist joint coalition operations at the brigade and division headquarters level. The focus of CAGE II was on a joint and coalition task force facing battlespace integration, joint fire systems interoperability, and cross-boundary control issues at the brigade level.
Capabilities – Operational
CAGE II have several operational objectives: • Improve the tactical air picture • Improve coalition fire support center’s ability to distribute and consume the tactical air picture
information digitally • Improve digital messaging between coalition partner fire control systems for airspace
integration issues observed in CAGE I • Improve target development and cross boundary target prosecution
Capabilities – Functional
A number of functional roles were supported in CAGE II. These roles were: experimentation and analysis, engineering support for the infrastructure, and operational / mission support for the development of a realistic scenario for testing the targeted objectives.
Capabilities – Technical
The experiment had two technical objectives: • Build a persistent test infrastructure in which distributed experimentation can be conducted • Improve the methodology and analysis tools for scientific analysis of cross-boundary issues in
distributed experimentation Geographic
location Operational location: Horn of Africa, land, air and sea , US, AR and CA areas of responsibility (AOR) Technical locations: Systems were located in Canada, Australia and the United States
Participants / Stakeholders
Stakeholders for this event were from the three participating countries. They included warfighters for participating in the exercise, analysts for defining and executing the experiment and performing analysis of the results, engineering staff that developed the distributed system design, developed the integrated capability, maintained and monitored it during the event execution.
Constituent Systems
CAGE II was comprised of a set of simulations, operational systems (servers and clients), gateways, and tools.
Network Connectivity
Key to the operation of the CAGE distributed event is the network. • Physical networks – this included the long haul networks between the three international sites as
well as local area networks at each site. • Operational communications – An operational network was “simulated” using the provided systems
to allow warfighter communications. Operational communication devices and nets were defined for the event.
• Support / Coordination communications – The engineering staff used the physical network infrastructure to set up communications between sites for coordinating system set up and trouble shoot issues encountered.
Interoperability (layers)
Participating systems used a variety of protocols to allow communications. At the operational level this included Link 16 communications. At the physical level this included Ethernet, TCP/IP and at a more semantic level HLA, DIS and TENA interoperability architectures were employed.
103
SG Implementation for CAGE II
The SG process steps are implemented with the CAGE II case study. The numbering of
the process steps is captured in the section headers.
1. Identify Areas for Analysis
CAGE II is the second in the series of experiments being conducted for the CAGE
campaign. To identify areas for analysis the general results from previous T&E experiments
have been reviewed along with the specific results from the CAGE I experiment. The numbered
items were issues experienced in CAGE I. The information in parenthesis indicates the related
issue area identified in chapter 4 as an issue for T&E events.
1. Several of the command and control systems that were under evaluation had
significant technical issues that were either not resolved at all or resolved late in
the experiment. This greatly reduced the available data for evaluation, reducing
the confidence in results and hypothesis testing capability (constituent system
maturity).
2. A latency problem with the dissemination of tracking information between
systems resulted in having operators rely on verbal exchange of information –
reducing the confidence in overall reliability of the system being evaluated
(system interoperability).
3. The results of the evaluation may have been skewed because the same scenario
was used for both test conditions, leading to more experienced use later in the
104
experiment time frame when condition 2 was being tested (experiment planning
and scenario development).
4. Data collection was limited to a subset of all the systems under review with
critical systems left out. This made it impossible to evaluate performance
associated with certain systems (data collection planning).
5. More training is needed to ensure that the selected tactics, techniques and
procedures (TTPs) are adequately followed (constituent system training).
6. More cross coordination between the working groups (analysis, technical and
scenario) for experiment planning is needed (stakeholder coordination – cross
collaboration).
7. More effort is required with technical standards and common philosophies on
evolution and management of the standards is needed to ensure proper technical
integration (system integration and interoperability).
8. Technical issues with the tools led to participants relying heavily on alternative
methods of communication (chat, discussions, etc.) that run counter to the purpose
of the tools under test or the operational actions that were being evaluated (system
maturity and integration testing).
9. There was a lack of available technical expertise / support for various tools
(operational as well as for data collection) during the experiment. This led to
unnecessary delays in resolving issues (resource assessment/utilization).
10. Data collection planning needs to be included in the technical architecture
planning. An alternative network (and potentially other tools) should be

105
considered for this activity. Like other systems in the event architecture, the tools
need to be mature enough to participate (analysis and experimentation support).
Given these issues, the most significant areas of focus for analysis to support CAGE II
design should be:
• Constituent System (Interface) Maturity – Coordination throughout the SoS
development process is critical. Pre-event integration testing is vital to help
ensure success. CM needs to be maintained so that changes made between pre-
event testing events and the actual event are minimized (CAGE I issues: 1 & 8).
• Integration and Interoperability – This is related to the system maturity area.
Systems that need to interact operationally, functionally and technically, need to
have a clear path for integration and consistent use of proper standards all
complete in time for the event (CAGE I issues: 2, 7 & 8).
• Experimentation related items represent a common issue area. Better
collaboration of experiment and data collection activities with the other event
areas will help to ensure that proper data are collected, proper tools are part of the
system architecture, and coordination takes place to ensure that key scenario
components are executed so that the objectives and hypotheses can be evaluated
(Issues: 3, 4, 6 & 10).
• Training and Technical Expertiese (Issues 5 & 9) are not addressed as part of this
study.

106
2. Identify SG Dimensions
To analyze the above issue areas, SG dimensions are selected for analysis along with the
analysis method that supports the investigation.
Constituent System Maturity
To address constituent system maturity, T&E events rely heavily on stakeholder
coordination. The SG analysis needs to include the organizational aspect of the functional,
technical, and network dimensions. Cross dimensional analysis focuses on collaboration
between groups working on different dimensions of the problem (e.g. operational, functional and
technical).
Integration and Interoperability
Since this issue area is related to the system maturity area, an analysis of the
organizational aspect indicated above should also contribute to understanding this problem area
as well. In addition, integration and interoperability investigation needs SG analysis of the
business process aspect of the three primary dimensions: operational, functional, and technical.
Cross dimensional analysis should include a look at operational dimension interaction with the
technical dimension. It should also explore the relationship between the various dimension
networks but this is left for future study.
Experimentation
As discussed in chapter 4, experiment design and data collection are a special instance of
the business process aspect of SG. Because this process is such a central part of T&E, it is
highlighted separately in the SG framework. The experiment aspect of the system is analyzed in

107
the context of the operational and technical dimensions. Cross dimensional analysis includes a
look at operational and technical dimension interaction for better understanding of how technical
collection of data can meet the analysis needs for operational (experiment) objectives and to
explore how the experiment processes may impact the operational processes.
3. Use an Architectural Framework to Capture Dimensional Information
The ESM has been selected to capture the CAGE II dimensional information identified in
step 2 above. Table 18 provides a summary of the ESM domains and their definitions alongside
the corresponding SG dimensions. It then summarizes how the SG problems are addressed by
the various domains/dimensions
Table 18. Systems Geometry Dimensions Characterized within the ESM Domains ESM
Component ESM Component
Definition SG
Dimension Implementation for CAGE II SG
Objectives Purpose of the integrated system. Includes the identified need for the system as well as implied needs.
Operational • User objectives at the SoS level includes application objectives (testing, experimentation, analysis, training, etc.) as well as operational objectives for representation within the environment.
• User objectives for the component systems as part of their participation in the larger SoS event
• Interdependencies between objectives Functions Functions or capabilities
that the system performs to meet the objectives
Functional • Applies across the various objectives areas to include: operational, testing, system support, etc.
• Includes operations, analysis and technical functions as performed by the associated working groups
Objects Physical components of the system
Technical • The actual systems and infrastructure to include simulations, operational equipment, physical networks, data collection tools, gateways, etc.
In matrix Relationships between different matrix components
Network • Interactions between the warfighters and the simulated components during the operational scenario.
• Connectivity between system components – need for communications.
• Functional support via the network – experimentation data collection and movement.

108
ESM Component
ESM Component Definition
SG Dimension
Implementation for CAGE II SG
Stakeholders Human entities / org that contribute to the SoS. Includes who pays, benefits, provides and loses
Organization • Funding agent, sponsoring organization, acquisition agent • User – end user for each component as well as for the overall
integrated system • Developer – developer of the individual components of the
system • Infrastructure owner – Maintain and run the lab and/or network
infrastructure used for the SoS integration effort • Integrator – SoS integration lead and/or architect – in charge of
bringing it all together – generally separately funded from the component systems
Parameter The geographic location of objects in ESM is represented using the parameter for that object.
Geographic • Location within the scenario to support operational activities (e.g. scenario setting of Horn of Africa, locations in the field such as the US, CA or AU AOR)
• Location of key support functions (data collection, system monitoring)
• Exploring how the physical location of participants can impact the execution of the experiment
Activities Processes, procedures and tasks performed using the system
Business Process &
Experiment – Data
Collection
• Business processes represented whether they are operational mission threads, experimentation processes with data collection and analysis, system operation and support
Table 19 provides a summary of the ESM domains interactions and how they apply to the
SG analysis of CAGE II. The System Drivers dimension for ESM has been combined with the
Stakeholder category. For this case study, it is assumed that the stakeholders (organizational and
objectives) are the primary system drivers for CAGE II.
There are a number of analysis techniques that can be applied for the various cross
dimensional analyses indicated in the table entries. Selection of methods depends on the level of
data that is gathered and the form in which that information is captured. In many cases, a simple
list or matrix summarizing the relationships can provide great insight into the relationship of SG
components.
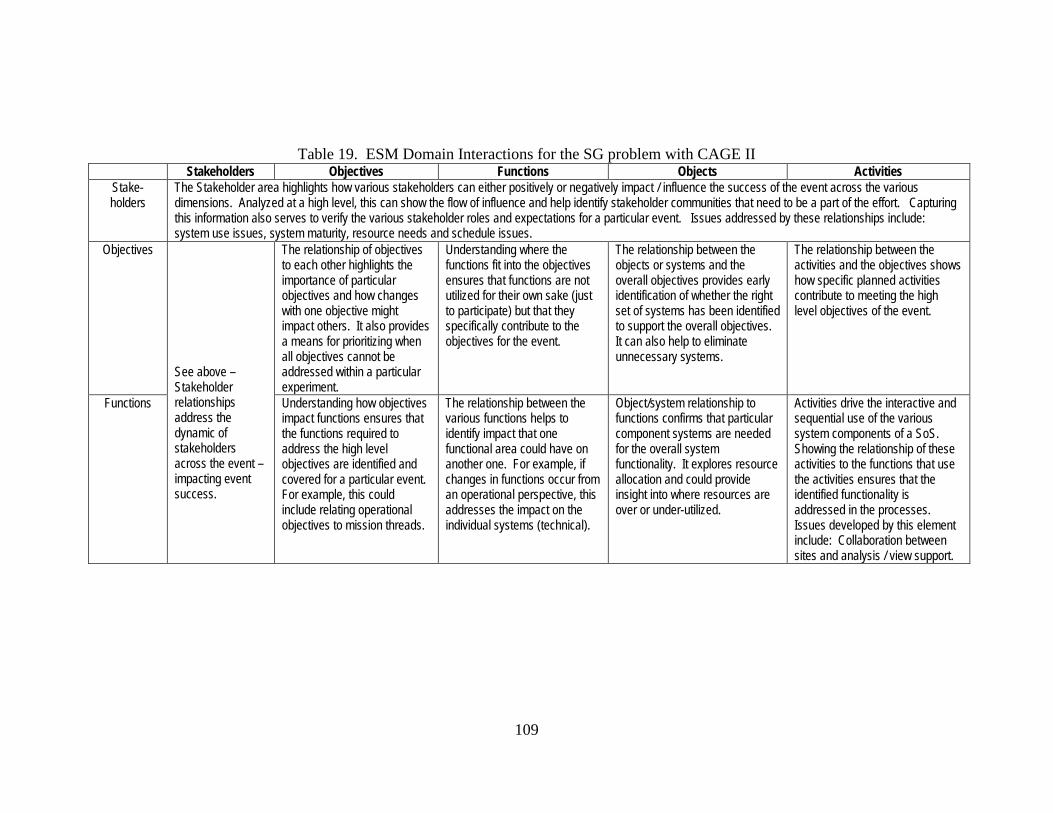
109
Table 19. ESM Domain Interactions for the SG problem with CAGE II Stakeholders Objectives Functions Objects Activities
Stake-holders
The Stakeholder area highlights how various stakeholders can either positively or negatively impact / influence the success of the event across the various dimensions. Analyzed at a high level, this can show the flow of influence and help identify stakeholder communities that need to be a part of the effort. Capturing this information also serves to verify the various stakeholder roles and expectations for a particular event. Issues addressed by these relationships include: system use issues, system maturity, resource needs and schedule issues.
Objectives See above –Stakeholder relationships address the dynamic of stakeholders across the event – impacting event success.
The relationship of objectives to each other highlights the importance of particular objectives and how changes with one objective might impact others. It also provides a means for prioritizing when all objectives cannot be addressed within a particular experiment.
Understanding where the functions fit into the objectives ensures that functions are not utilized for their own sake (just to participate) but that they specifically contribute to the objectives for the event.
The relationship between the objects or systems and the overall objectives provides early identification of whether the right set of systems has been identified to support the overall objectives. It can also help to eliminate unnecessary systems.
The relationship between the activities and the objectives shows how specific planned activities contribute to meeting the high level objectives of the event.
Functions Understanding how objectives impact functions ensures that the functions required to address the high level objectives are identified and covered for a particular event. For example, this could include relating operational objectives to mission threads.
The relationship between the various functions helps to identify impact that one functional area could have on another one. For example, if changes in functions occur from an operational perspective, this addresses the impact on the individual systems (technical).
Object/system relationship to functions confirms that particular component systems are needed for the overall system functionality. It explores resource allocation and could provide insight into where resources are over or under-utilized.
Activities drive the interactive and sequential use of the various system components of a SoS. Showing the relationship of these activities to the functions that use the activities ensures that the identified functionality is addressed in the processes. Issues developed by this element include: Collaboration between sites and analysis / view support.

110
Stakeholders Objectives Functions Objects Activities Objects Providing resources that meet
the event objectives are addressed by relating the SoS objectives to the specific system components to be utilized. This can identify early in the planning process whether the right systems are participating. Issues addressed by this element includes: system resource needs.
Function mapping to objects ensures that the systems are available that are needed to provide the needed functionality. Issues addressed here include: system performance issues, systems performing as expected, and resource needs.
Mapping of objects to objects, or in this instance, component systems to each other, is critical for understanding potential interoperability issues as well as integrated system performance issues. Inconsistencies even between different instances of the same tool can be identified by analysis of this element. Issues addressed include: system interoperability (lower level) and stability, system performance issues, and collaboration between sites.
The activities relating to objects / systems show how the systems are to be used to support the event. It provides a means to “script” the event so that specific data can be collected. It can also unveil if a system or object is really needed to support event functionality.
Activities Identifying how objectives relate to the activities will ensure that the right business processes have been identified to support the system objectives.
Functions related to an event, whether related to warfighter participation, data collection or system administration, need to be supported by activities or processes for performing those functions. This element ensures that the functions provided support the processes and activities anticipated for the system use. For example, SoS operational support functions will address the business process for performing system support between various sites.
Relating the component systems with their specific role in the event shows how a particular system configuration addresses the activity / process needs for the mission threads and metrics collection activities – perhaps also the management of system. Issues addressed here include: interoperability (higher level), system performance issues, systems performing as expected, system use issues, resource needs and documentation / information needs.
Mapping activities to activities show the interrelationship between the different processes/ activities and could highlight perturbations that can occur when changes with one process are made and not effectively communicated other stakeholders.

111
Such representations allow for a qualitative analysis of the system dimensions and components.
Converting such views to network diagrams allows for a more rigorous, quantitative analysis of
relationships represented in the network. When explored over a period of time, SoS emergence
can be investigated. Table 20 summarizes the capture and analysis approaches for SG analysis
within the ESM framework. Note that only half the table is filled in since the expression of the
interactive relationship is captured in both directions in the table summary.
The issues that occurred for CAGE I have been mapped in Table 21 to the dimensional
analysis that can be used to address them.
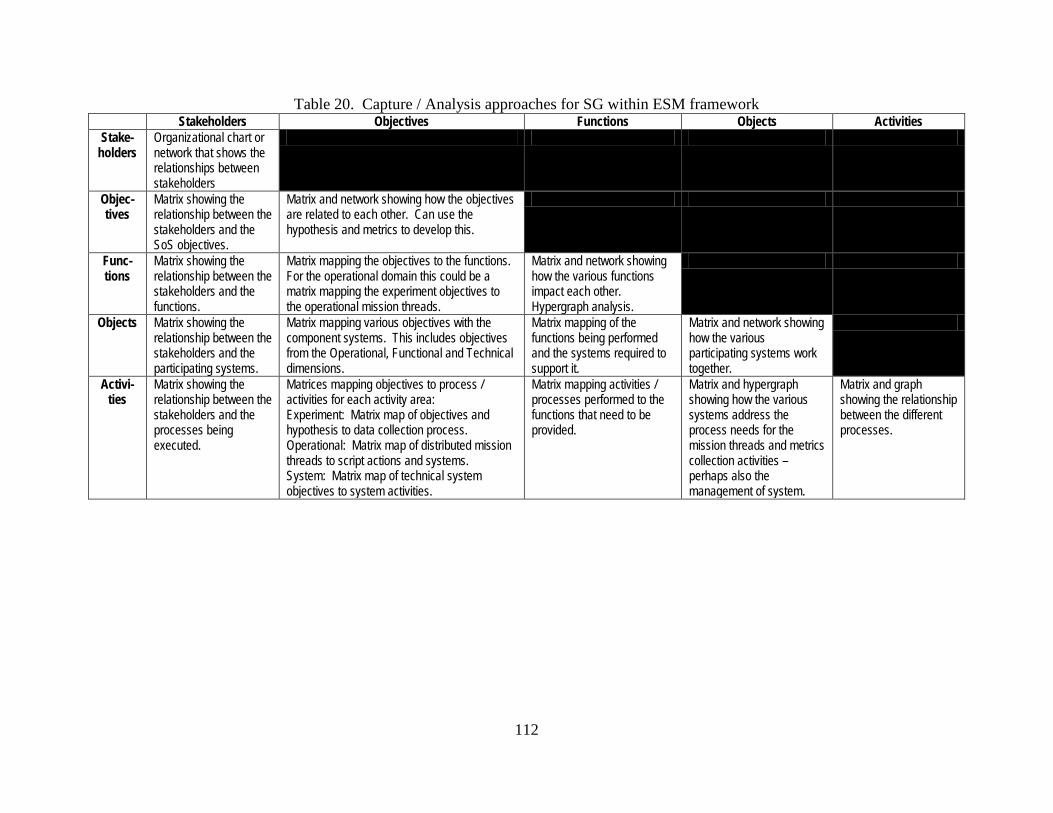
112
Table 20. Capture / Analysis approaches for SG within ESM framework Stakeholders Objectives Functions Objects Activities
Stake-holders
Organizational chart or network that shows the relationships between stakeholders
Objec-tives
Matrix showing the relationship between the stakeholders and the SoS objectives.
Matrix and network showing how the objectives are related to each other. Can use the hypothesis and metrics to develop this.
Func-tions
Matrix showing the relationship between the stakeholders and the functions.
Matrix mapping the objectives to the functions. For the operational domain this could be a matrix mapping the experiment objectives to the operational mission threads.
Matrix and network showing how the various functions impact each other. Hypergraph analysis.
Objects Matrix showing the relationship between the stakeholders and the participating systems.
Matrix mapping various objectives with the component systems. This includes objectives from the Operational, Functional and Technical dimensions.
Matrix mapping of the functions being performed and the systems required to support it.
Matrix and network showing how the various participating systems work together.
Activi-ties
Matrix showing the relationship between the stakeholders and the processes being executed.
Matrices mapping objectives to process / activities for each activity area: Experiment: Matrix map of objectives and hypothesis to data collection process. Operational: Matrix map of distributed mission threads to script actions and systems. System: Matrix map of technical system objectives to system activities.
Matrix mapping activities / processes performed to the functions that need to be provided.
Matrix and hypergraph showing how the various systems address the process needs for the mission threads and metrics collection activities – perhaps also the management of system.
Matrix and graph showing the relationship between the different processes.

113
Table 21. Mapping of T&E and CAGE I Issues to ESM Matrix Methods General T&E
Issues Categories Problem
in CAGE I
Issue Detail ESM Analysis
Interoperability and Integration
2,4,7,8 Systems do not work together making it impossible to execute the experiment – and it interferes with functional and operational activities.
Objectives x Objects Functions x Objects Objects x Objects
Constituent System Maturity
1,8 Systems or interfaces are immature making it difficult to achieve stable integrated function or interoperability. At the SoS level this is more a collaboration on interface development vs stand-alone system maturity (which we assume already exists)
Objects x Objects Objectives x Objects Functions x Objects Stakeholders x Objects
Collaboration 6 Sometimes system failure is due to failure to communicate / collaborate. This is particularly true in complex SoS where actions of one group (function) can impact another.
Stakeholders x Stakeholders Stakeholders x Objects Stakeholders x Functions Functions x Functions
Constituent System Training
5 Inability to use systems correctly results in poor experiment results and can interfere with other experiment activities.
Stakeholder x Functions
Resource assessment / utilization
9 Lack of resources during development can delay development and result in immature systems and lack of interoperability. Lack of resources during an event results in slow response to system issues.
Stakeholder x Objects Stakeholder x Functions
Analysis and Experimentation Support
3,4,6,10 This area often gets left until late in the planning development process and is often significantly affected by decisions in other functional areas (operational or technical)
Functions x Objects Functions x Objectives Objectives x Objects
*Green highlighted areas – Areas providing the most coverage of identified issues.
*Italicized / Underlined text – specific analysis selected for exploration in this study.

114
A full analysis of the targeted problem areas is possible by performing the analyses
recommended in Table 20, however resource and time constraints usually limit the amount of
analysis that is possible. Highlighted in green, in Table 21, are the analysis areas that provide the
most coverage of issue areas of interest. For the purposes of this research, the analysis is focused
on key areas of interest to demonstrate the SG technique. The text for these is in italics and
underlined. This includes: Objects x Objects, Functions x Functions, and Functions x
Objectives analyses. Objects x Objects is based on a single dimension analysis of the
interactions between the component systems. Functions x Functions is based on a single aspect
(Organization / Stakeholders) but cross functional look at the collaboration between different
communities of stakeholders developing components of the SoS design. Functions x Objectives
is a cross-dimensional investigation of how the various functional groups are related to the
overall event objectives. It also addresses the relationship between experimentation functions
and overall experiment objectives.
4. Develop SoS Models and SoS Component Models
This step in the SG process focuses on modeling aspects of the system that will facilitate
analysis of problem areas identified in Step 2 and 3. To facilitate analysis, a high level view of
CAGE II for each dimension is developed.
For the operational dimension, Figure 11 summarizes the components of the operational
context. The operational context could be further represented based on the participating
country’s area of responsibility (AOR). Operational interactions within the operational systems

115
view can be represented using sequence diagrams. Due to the sensitive nature of the CAGE II
operational information, this is not included in this analysis.
Figure 11. High Level Summary View for Operational Dimension
The high level view for the functional dimension can be found in the organization of the
teams working on the different functional components of the CAGE II exercise. The teams are
organized according to the three main development activities necessary for developing CAGE II:
Operations, Analysis and Technical. The organization chart (Figure 12) shows the working
group structure to support each of those areas. This structure provides a good representation of
the primary functional activities in CAGE II.

116
Figure 12. Organizational/Functional Structure for CAGE II Development
The high level view for the technical dimension is shown in Figure 13. The three
geographic locations featured in the event are shown along with the major components of the
network infrastructure, simulations and operational C2 equipment used to support the CAGE
experiment. Additional views were developed by the technical team highlighting further detail at
each of the country sites.
Additional SoS component models are developed as part of the analysis activity.

117
Figure 13. High Level Summary View for Technical Dimension

118
5. Perform Dimensional and Cross Dimensional Analysis
Object x Object Analysis
Object x Object interaction analysis addresses interoperability by identifying which
systems have the need to interact at the system level. Lack of interoperability at the object or
system level interferes with operational activities, in some cases imposing unplanned constraints
on operational tasks.
Two Object x Object matrices have been developed. One highlights the interaction
between the various simulation systems participating in CAGE II and the second matrix
addresses operational C2 system interactions. These matrices are analyzed using matrix methods
and network analysis. Centrality measures are collected to look for important nodes in the
network that may be critical for successful CAGE execution. Node degree is graphed to show
power law characteristics.
Simulation Object Interactions
There are a large number of simulation systems and gateways involved with the CAGE II
event. Figure 14 shows the connections for simulation traffic between the 33 simulation systems
in the analysis. A ‘1’ in the matrix indicates that there is a connection going from the system in
the column to the system in the row. For example, the CA-CFWC-TENA-DIS GW Server (row
24) sends traffic to four different systems: AU-TENA-DIS GW, US-RTC-TENA-DIS-GW, CA-
CFWC-SIMDIS1, and CA-CFWC-Bender (columns 5, 6, 7, and 9, respectively). This is shown
by placing a ‘1’ at the intersection of column 24 and rows 5, 6, 7, and 9. For this analysis, the
strength of all the connections is considered the same (thus the use of ‘1’) but the methodology
allows for representing different degrees or strengths of connections by using different values in
the matrix.

119
Figure 14. CAGE II Object x Object Matrix – Simulation and Support Systems
1 2 3 4 5 6 7 8 9 10 11 12 13 14 15 16 17 18 19 20 21 22 23 24 25 26 27 28 29 30 31 32 331 AU-JSAF2 AU-RTI-S RTI 1 1 13 AU-JSAF Link 16 GW 14 AU-JSAF DIS GW 1 15 AU-TENA-DIS GW 1 16 US-RTC-TENA-DIS GW 17 CA-CFWC-SIMDIS1 1 1 18 CA-CFWC-SIMDIS2 19 CA-CFWC-Bender 1 1 1 1 1 1 1
10 CA-CFWC-VBS2-Coord 111 CA-CFWC-VBS2-UAV OP1 1 112 CA-CFWC-VBS2-Op 113 CA-CFWC-VBS2-UAV OP2 114 CA-CFWC-JCATS Client 1 115 CA-CFWC-JCATS Client 2 116 CA-CFWC-JCATS Client 3 117 CA-CFWC-JCATS Client 4 118 CA-CFWC-JCATS Server 1 1 1 1 119 CA-CFWC-JSAF3 120 CA-CFWC-JSAF4 121 CA-CFWC-JSAF5 122 CA-CFWC-RTI-S RTI 1 1 1 1 123 CA-CFWC-CSV Sim logger 124 CA-CFWC-TENA-DIS GW 1 1 125 CA-CFWC-VCCI GW 126 CA-CFWC-JSAF-DIS GW 1 127 CA-CFWC-JSAF-OthGold GW 128 CA-CFWC-JSAF-Link 16 GW 129 CA-CFMWC-JSAF-DIS GW 1 130 CA-CFMWC-VBS2-UAV 131 CA-CFMWC-JSAF1 132 CA-CFMWC-JSAF2 133 CA-CFMWC-RTI-S-RTI 1 1 1
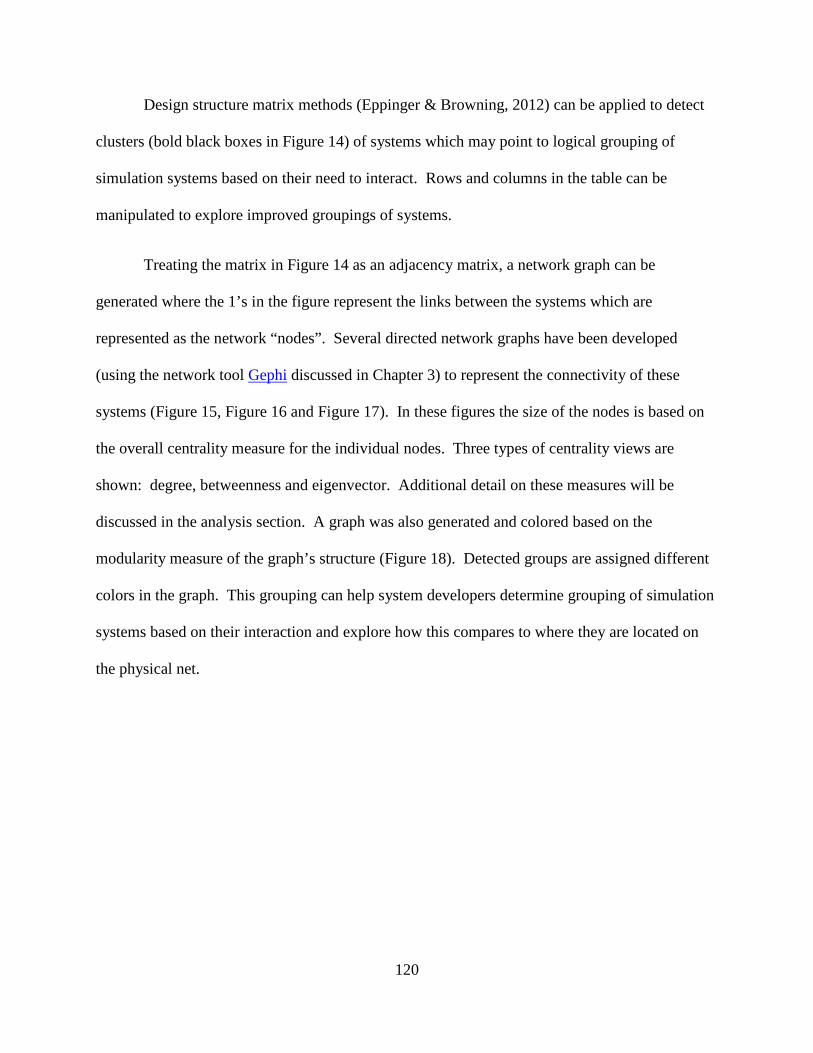
120
Design structure matrix methods (Eppinger & Browning, 2012) can be applied to detect
clusters (bold black boxes in Figure 14) of systems which may point to logical grouping of
simulation systems based on their need to interact. Rows and columns in the table can be
manipulated to explore improved groupings of systems.
Treating the matrix in Figure 14 as an adjacency matrix, a network graph can be
generated where the 1’s in the figure represent the links between the systems which are
represented as the network “nodes”. Several directed network graphs have been developed
(using the network tool Gephi discussed in Chapter 3) to represent the connectivity of these
systems (Figure 15, Figure 16 and Figure 17). In these figures the size of the nodes is based on
the overall centrality measure for the individual nodes. Three types of centrality views are
shown: degree, betweenness and eigenvector. Additional detail on these measures will be
discussed in the analysis section. A graph was also generated and colored based on the
modularity measure of the graph’s structure (Figure 18). Detected groups are assigned different
colors in the graph. This grouping can help system developers determine grouping of simulation
systems based on their interaction and explore how this compares to where they are located on
the physical net.

121
Figure 15. Network View of Simulation Systems and Tools: Degree Centrality

122
Figure 16. Network View of Simulation Systems and Tools: Betweenness Centrality

123
Figure 17. Network View of Simulation Systems and Tools: Eigenvector Centrality

124
Figure 18. Network Graph Simulation Systems: Communities Based on Modularity

125
C2 Object Interactions
For T&E events such as CAGE II, the interactions between operational C2 systems are
critical for success within an operational scenario. Figure 19 shows the connection of
communications traffic between the fifteen C2 systems in the analysis. A ‘1’ in the matrix
indicates that there is a connection going from the system in the column to the system in the row.
For example, The CA-CFWC-GCCS-J Server (column 10) sends traffic to the CA-CFWC-
JADOCS Server (row 6), therefore there is a ‘1’ at the intersection of column 10 and row 6. As
with the simulation network, the strength of all the connections is considered the same (thus the
use of ‘1’) but the methodology allows for representing different degrees or strengths of
connections by using different values in the matrix.
Figure 19. CAGE II Object x Object Matrix – C2 Systems
The C2 systems are depicted as a network in the same manner as the simulation systems.
A directed network graph has been developed to represent the connectivity of these systems
(Figure 20). For this graphic, the size of the nodes is based on the overall degree centrality for
1 2 3 4 5 6 7 8 9 10 11 12 13 14 151 US-RTC-FTT Server 12 US-RTC-GCCS-A Server 13 US-RTC-JADOCS Server 1 14 US-RTC-TAIS Server 15 CA-CFWC-LCCS Server 16 CA-CFWC-JADOCS Server 1 1 1 1 1 17 CA-MNDIV-JADOCS Server 1 1 18 CA-CFWC-GCCS-M Server 1 1 19 CA-CFWC-ADSI Server 1 1 1
10 CA-CFWC-GCCS-J Server 111 CA-CFMWC-JADOCS Server 1 1 1 112 AU-AMDWS Server 113 AU-TMS-ITRACKS 114 AU-JADOCS Server 1 1 115 AU-GCCS-M Server 1

126
the individual nodes (includes both in degree and out degree). Figure 21 shows betweenness and
eigenvector centrality graphs.
Figure 20. Network View of Participating C2 Systems in CAGE II: Degree Centrality
Panel A: C2 Network View: Betweenness Centrality Panel B: C2 Network View: Eigenvector Centrality
Figure 21. Network View of C2 Systems: Other Centrality Measures

127
As with the simulation systems, community detection is also applicable to the C2
systems. In this case, (Figure 22) there are only two communities identified by the Gephi
software.
Figure 22. C2 System Communities Based on Modularity
System and C2 Node Analysis
Figure 14 (page 119) through Figure 22 (page 127) provide graphical information
regarding the relationships between simulations and between operational C2 systems. The size
of the nodes and the connectivity in the graphs highlight systems that appear central to the
system and most connected to other systems. In addition to the graphical view, a summary of all
the node statistics for the simulation systems is provided in the Appendix (page 161).

128
As part of the analysis, the node statistics were sorted to determine the top ten systems
across several centrality measures (Figure 23). Several of the most connected simulation nodes
in the SoS show up in the top ten across all four centrality measures. These same systems also
appeared as the larger nodes in the earlier graphs. Except for a couple of exceptions, these
systems are gateways (which translate protocols in order to allow systems to interoperate),
servers, or interoperability interfaces. These high degree / high betweenness nodes are critical
components to the overall SoS. Failure at these nodes will impact a large portion of the SoS. It
is important that these nodes are mature and well tested to ensure success for the overall
experimentation effort. An analysis of where the most central nodes are geographically located
would be important when addressing risk associated with reliability and performance of wide
area networks.
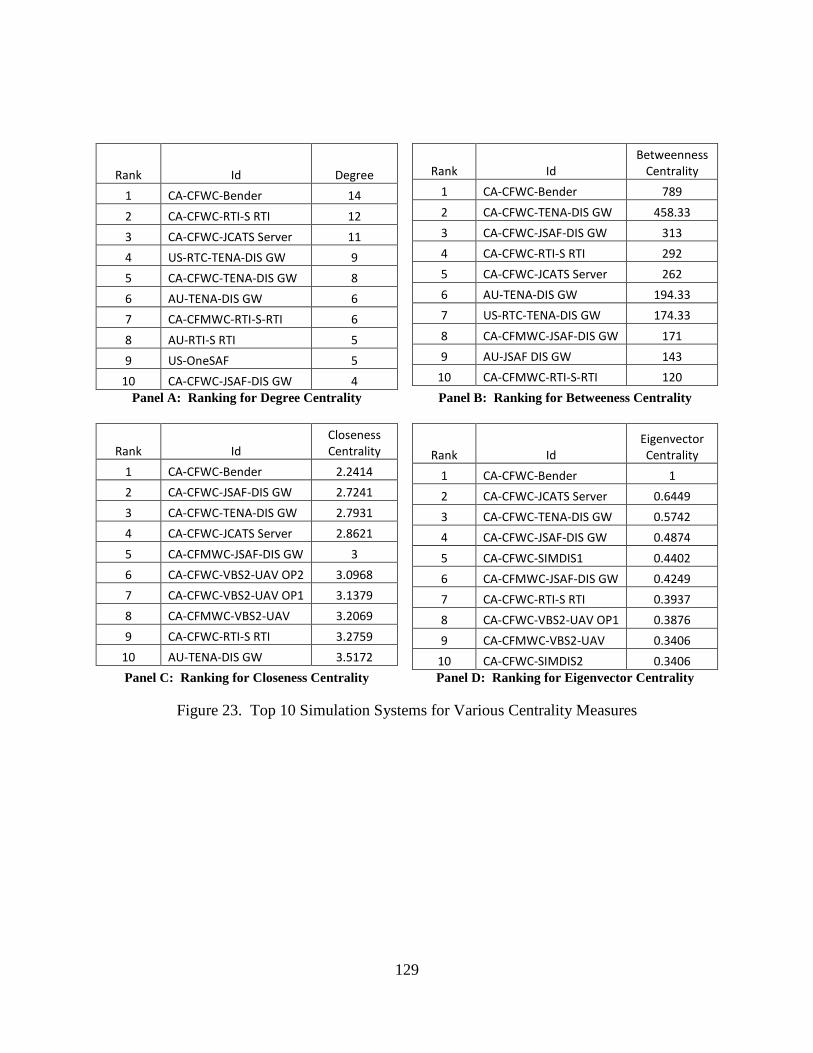
129
Rank Id Degree 1 CA-CFWC-Bender 14 2 CA-CFWC-RTI-S RTI 12 3 CA-CFWC-JCATS Server 11 4 US-RTC-TENA-DIS GW 9 5 CA-CFWC-TENA-DIS GW 8 6 AU-TENA-DIS GW 6 7 CA-CFMWC-RTI-S-RTI 6 8 AU-RTI-S RTI 5 9 US-OneSAF 5
10 CA-CFWC-JSAF-DIS GW 4
Rank Id Betweenness
Centrality 1 CA-CFWC-Bender 789 2 CA-CFWC-TENA-DIS GW 458.33 3 CA-CFWC-JSAF-DIS GW 313 4 CA-CFWC-RTI-S RTI 292 5 CA-CFWC-JCATS Server 262 6 AU-TENA-DIS GW 194.33 7 US-RTC-TENA-DIS GW 174.33 8 CA-CFMWC-JSAF-DIS GW 171 9 AU-JSAF DIS GW 143
10 CA-CFMWC-RTI-S-RTI 120
Panel A: Ranking for Degree Centrality
Panel B: Ranking for Betweeness Centrality
Rank Id Closeness Centrality
1 CA-CFWC-Bender 2.2414 2 CA-CFWC-JSAF-DIS GW 2.7241 3 CA-CFWC-TENA-DIS GW 2.7931 4 CA-CFWC-JCATS Server 2.8621 5 CA-CFMWC-JSAF-DIS GW 3 6 CA-CFWC-VBS2-UAV OP2 3.0968 7 CA-CFWC-VBS2-UAV OP1 3.1379 8 CA-CFMWC-VBS2-UAV 3.2069 9 CA-CFWC-RTI-S RTI 3.2759
10 AU-TENA-DIS GW 3.5172
Rank Id Eigenvector Centrality
1 CA-CFWC-Bender 1 2 CA-CFWC-JCATS Server 0.6449 3 CA-CFWC-TENA-DIS GW 0.5742 4 CA-CFWC-JSAF-DIS GW 0.4874 5 CA-CFWC-SIMDIS1 0.4402 6 CA-CFMWC-JSAF-DIS GW 0.4249 7 CA-CFWC-RTI-S RTI 0.3937 8 CA-CFWC-VBS2-UAV OP1 0.3876 9 CA-CFMWC-VBS2-UAV 0.3406
10 CA-CFWC-SIMDIS2 0.3406
Panel C: Ranking for Closeness Centrality Panel D: Ranking for Eigenvector Centrality
Figure 23. Top 10 Simulation Systems for Various Centrality Measures
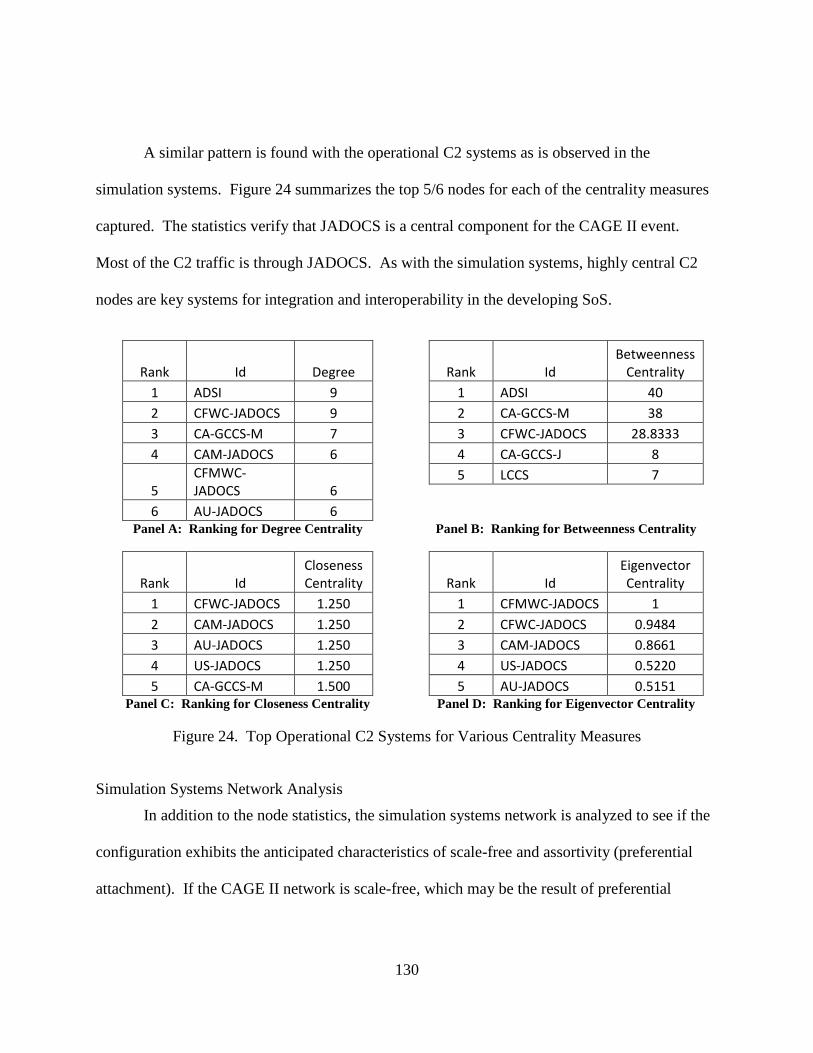
130
A similar pattern is found with the operational C2 systems as is observed in the
simulation systems. Figure 24 summarizes the top 5/6 nodes for each of the centrality measures
captured. The statistics verify that JADOCS is a central component for the CAGE II event.
Most of the C2 traffic is through JADOCS. As with the simulation systems, highly central C2
nodes are key systems for integration and interoperability in the developing SoS.
Rank Id Degree 1 ADSI 9 2 CFWC-JADOCS 9 3 CA-GCCS-M 7 4 CAM-JADOCS 6
5 CFMWC-JADOCS 6
6 AU-JADOCS 6
Rank Id Betweenness
Centrality 1 ADSI 40 2 CA-GCCS-M 38 3 CFWC-JADOCS 28.8333 4 CA-GCCS-J 8 5 LCCS 7
Panel A: Ranking for Degree Centrality
Panel B: Ranking for Betweenness Centrality
Rank Id Closeness Centrality
1 CFWC-JADOCS 1.250 2 CAM-JADOCS 1.250 3 AU-JADOCS 1.250 4 US-JADOCS 1.250 5 CA-GCCS-M 1.500
Rank Id Eigenvector Centrality
1 CFMWC-JADOCS 1 2 CFWC-JADOCS 0.9484 3 CAM-JADOCS 0.8661 4 US-JADOCS 0.5220 5 AU-JADOCS 0.5151
Panel C: Ranking for Closeness Centrality Panel D: Ranking for Eigenvector Centrality
Figure 24. Top Operational C2 Systems for Various Centrality Measures
Simulation Systems Network Analysis
In addition to the node statistics, the simulation systems network is analyzed to see if the
configuration exhibits the anticipated characteristics of scale-free and assortivity (preferential
attachment). If the CAGE II network is scale-free, which may be the result of preferential
131
attachment, its degree would follow a power-law distribution. Figure 25 shows that this is,
indeed, the case.
Figure 25. Simulation Network Degree Centrality Graph Showing Power Law Distribution
Function x Function Analysis
Relationship Between the Three Functions
The three primary functions within CAGE II, operations, technical, and analysis, are
closely connected to each other (Figure 26).
Operations Working Group (OWG) – This group defines the operational scenario and the
mission threads to be executed by warfighters during the experiment in order to assess the
operational objectives identified for the event. This group also provides warfighter
support required to role play during scenario execution.
y = 13.637x-1.077 R² = 0.8521
0
2
4
6
8
10
12
14
16
0 2 4 6 8 10 12 14 16
# N
odes
Degree
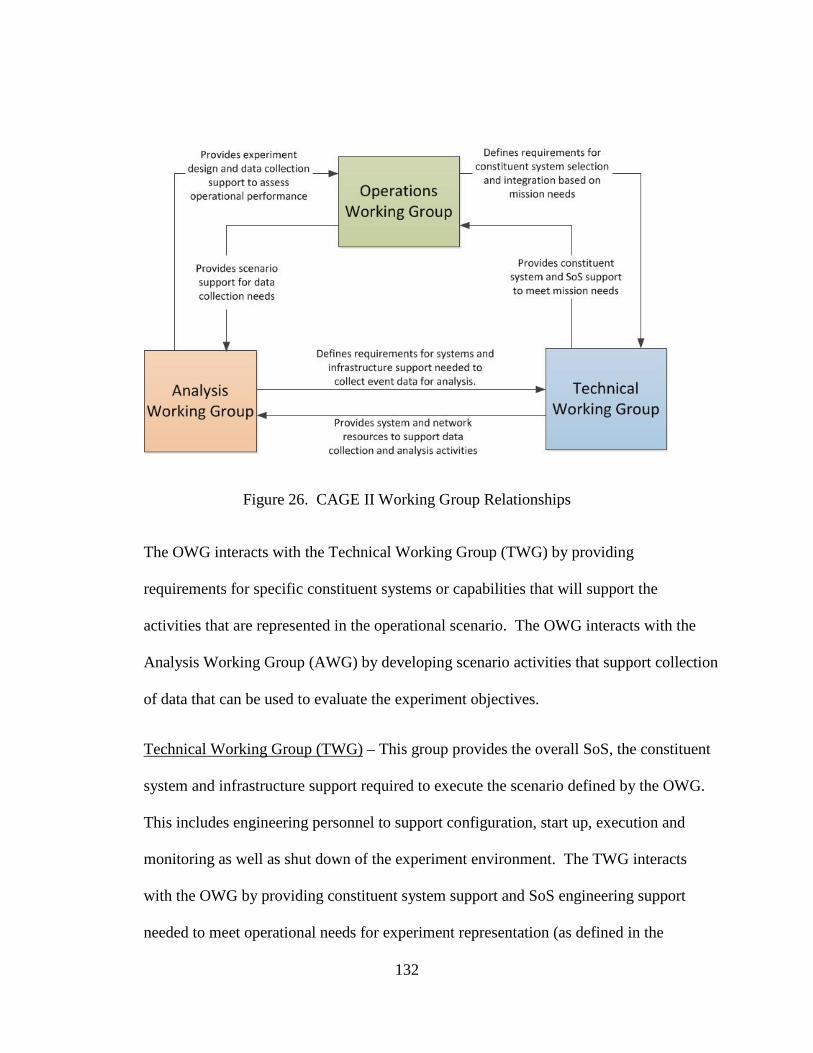
132
Figure 26. CAGE II Working Group Relationships
The OWG interacts with the Technical Working Group (TWG) by providing
requirements for specific constituent systems or capabilities that will support the
activities that are represented in the operational scenario. The OWG interacts with the
Analysis Working Group (AWG) by developing scenario activities that support collection
of data that can be used to evaluate the experiment objectives.
Technical Working Group (TWG) – This group provides the overall SoS, the constituent
system and infrastructure support required to execute the scenario defined by the OWG.
This includes engineering personnel to support configuration, start up, execution and
monitoring as well as shut down of the experiment environment. The TWG interacts
with the OWG by providing constituent system support and SoS engineering support
needed to meet operational needs for experiment representation (as defined in the
133
scenario) as well as technical support during scenario execution, should any of the
systems or infrastructure components have problems. The TWG interacts with the AWG
by providing infrastructure and constituent system support for data collection and
analysis activities.
Analysis Working Group (AWG) – This group designs the experiment that will collect
data necessary to evaluate the objectives for the T&E event. This group defines a set of
hypotheses related to experiment objectives and the associated metrics required to
evaluate the hypotheses. The AWG interacts with the OWG by defining an experiment
design and data collection plan that will allow assessment of operational objectives. The
AWG works with the OWG to integrate data collection activities with the operational
scenario being developed. The AWG interacts with the TWG by defining system and
infrastructure requirements needed to support data collection and analysis requirements.
This interdependency highlights the critical need for focused collaboration between the
three working groups. Another view of these relationships shows the constraints that each
function places on the other (Figure 27). Collaboration is necessary to develop the tradeoffs
required to balance the design of the overall SoS while meeting the objectives for the
experiment. The frequency and timely scheduling of collaboration activities is critical to ensure
that the proper constituent systems are selected and integrated early in the SoS lifecycle to allow
for training and dry runs of the experiment. Early scenario development can provide time for the
analysis team to design the experiment and plan for collection of data, which drives system and
infrastructure needs.
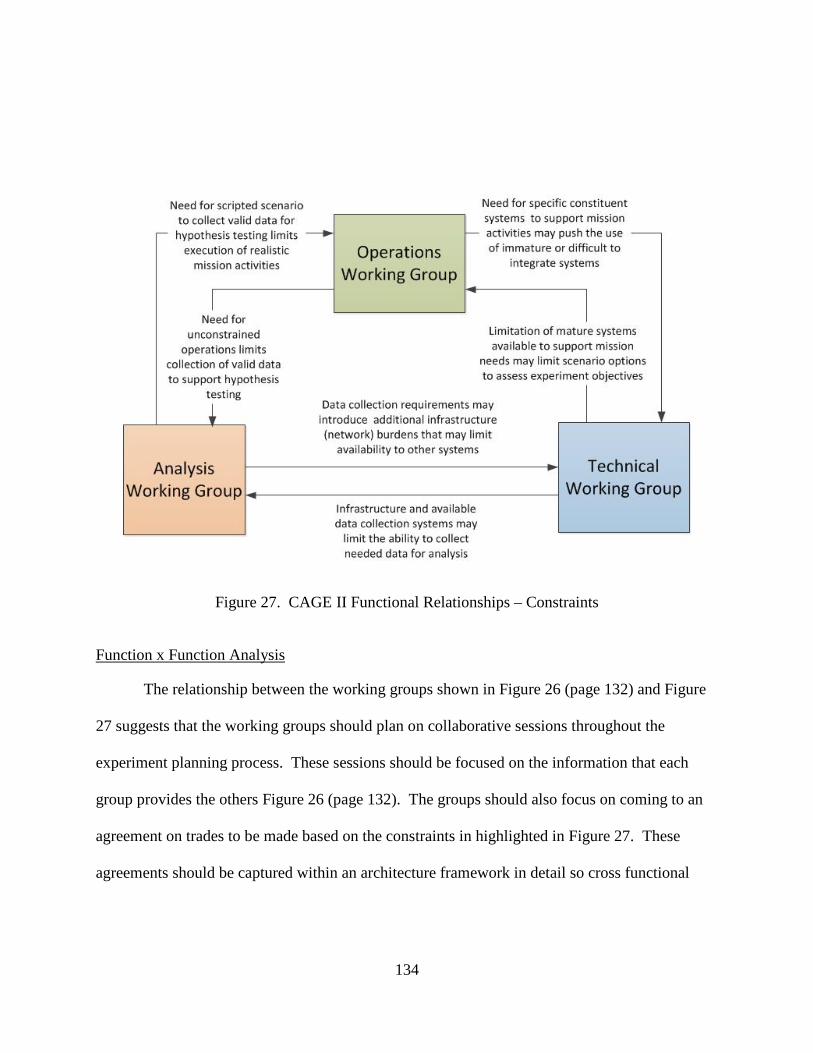
134
Figure 27. CAGE II Functional Relationships – Constraints
Function x Function Analysis
The relationship between the working groups shown in Figure 26 (page 132) and Figure
27 suggests that the working groups should plan on collaborative sessions throughout the
experiment planning process. These sessions should be focused on the information that each
group provides the others Figure 26 (page 132). The groups should also focus on coming to an
agreement on trades to be made based on the constraints in highlighted in Figure 27. These
agreements should be captured within an architecture framework in detail so cross functional

135
analysis can be performed to identify areas for potential problems or unplanned emergent
behaviors.
If the groups fail to properly coordinate, resulting problems would include:
• Systems not capable of proper integration because they were selected too late in the
process and were not capable of timely integration.
• Scenario mission threads that do not produce the behaviors that are being tested in the
hypotheses, therefore not allowing proper evaluation of the experiment objectives.
• Systems, tools and processes not in place to collect the metrics necessary for evaluating
the hypotheses.
The intergroup collaboration can take many forms but is important for the group or a
subset of the group to provide the collaboration. A single liaison between groups would not
sufficient to coordinate the trades between them.
Function x Objectives Analysis
A summary of the CAGE II Functions and Objectives is provided in Table 22:
Table 22. CAGE II Functions and Objectives CAGE II Functions CAGE II Objectives
Operations
Technical
Analysis
Objective 1: Improve the tactical air picture. Objective 2: Improve coalition fire support centers’ ability to distribute and consume tactical air picture information digitally Objective 3: Improve digital messaging between coalition partner fires control systems for airspace integration issues observed in CAGE I. Objective 4: Improve target development and cross-boundary target prosecution Objective 5: Build a persistent test infrastructure in which distributed experimentation can be conducted. Objective 6: Improve the methodology and analysis tools for scientific analysis of cross-boundary issues in distributed experimentation
136
The table lists six objectives for the experiment. The first four (objectives 1-4) are
operational in focus. Objective 5 is technical in focus and objective 6 is analytical in its focus.
An analysis of the functional groups and objectives is performed to assess the relative
importance of the objectives given the differing views of the three groups. For example, the
OWG will be very focused on objectives 1-4 and may not pay as much attention to objective 6.
They may be somewhat interested in objective 5 since it enables the scenario execution required
to achieve objectives 1-4. The TWG will be very focused on objective 5 and somewhat
concerned about objectives 1-4 but may not be as concerned about objective 6. The AWG will
focus on objective 6 but will be very interested in objectives 1-4 which support objective 6 and
also interested in objective 5 which enables the collection of data.
Based on these different views and potentially competing objectives, an Analytic
Hierarchy Process (AHP) (Saaty, 2008) analysis is conducted using the Expert Choice
(http://expertchoice.com/) application to rank order the objectives of the experiment based on the
functional focus of the three working groups. This implementation is just a demonstration of the
technique. The working groups were not consulted for their input. However, the tool is
designed to allow such inputs to be gathered when performing such an analysis early in the
planning stages.
Figure 28 shows the hierarchy for the decision process. The goal is to identify the most
critical objective, however the resulting analysis provides a weighting that allows the objectives
to be rank ordered.

137
Figure 28. Complete Hierarchy for Objectives Analysis
The six objectives represent the six options to be ranked from the perspective of the
OWG, AWG and TWG. First, the three perspectives are pairwise ranked to determine their level
of importance. For the sake of this analysis, all three were weighted equally, which is
represented in the tool with a 1 (Figure 29).
Figure 29. Setting the Relative Importance of the Three Views
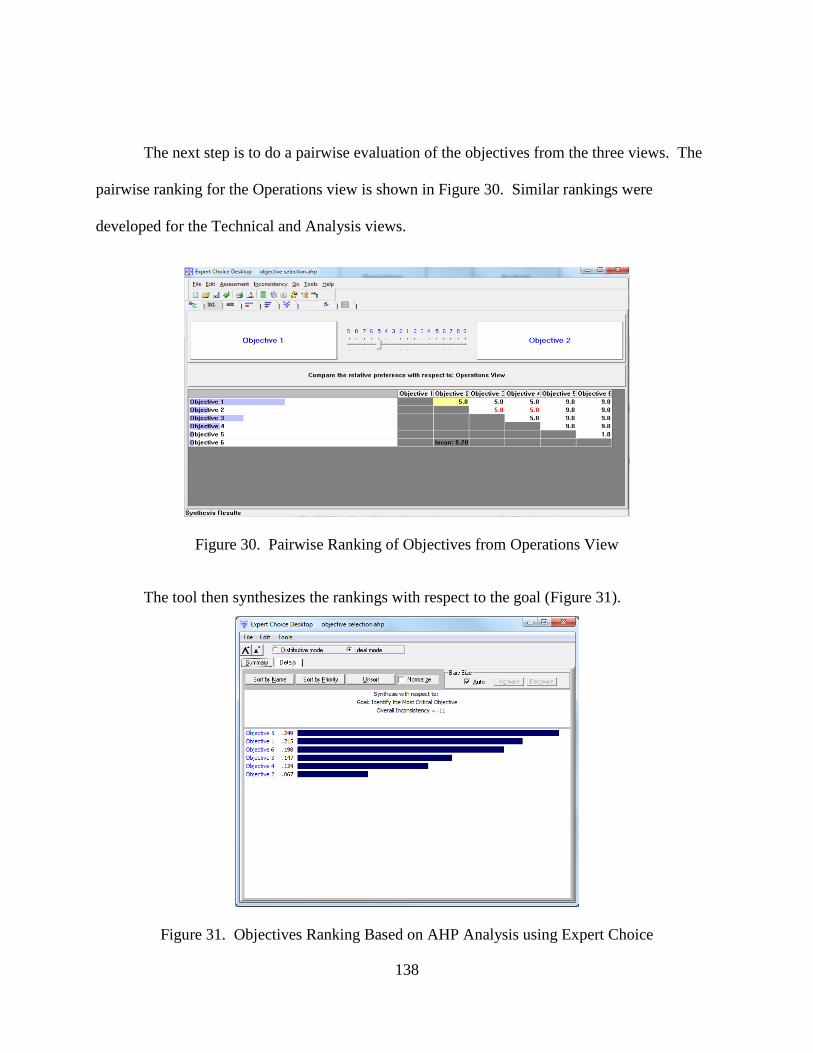
138
The next step is to do a pairwise evaluation of the objectives from the three views. The
pairwise ranking for the Operations view is shown in Figure 30. Similar rankings were
developed for the Technical and Analysis views.
Figure 30. Pairwise Ranking of Objectives from Operations View
The tool then synthesizes the rankings with respect to the goal (Figure 31).
Figure 31. Objectives Ranking Based on AHP Analysis using Expert Choice

139
The tool also supports dynamic sensitivity analysis that allows the analyst to adjust the
level of influence of the three functional areas. If, in fact, the influence of all three areas were
not all equal, would the ranking of the objectives change? Figure 32 shows the result. The
ranking of the objectives changes with the new setting, making objective 1 the highest ranking.
Objective 3 has also increased in importance.
Figure 32. Dynamic Sensitivity With Operations 2x the Other Areas
Objectives vs Function Analysis
Another assessment of the objectives versus the functions is to explore the relationship
between the experiment objectives and the metrics that were collected to assess them. An Excel
table was used to capture the relationships between the objectives, their supporting hypotheses
and the metrics used to assess the hypotheses (Table 23).
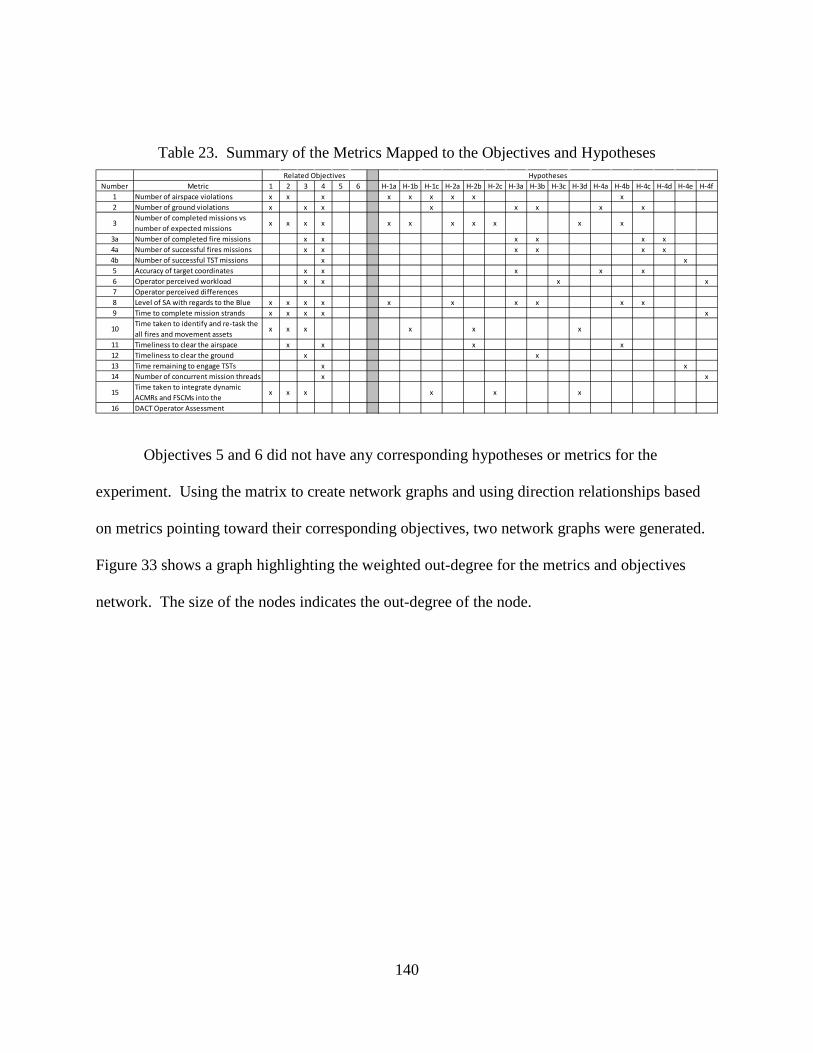
140
Table 23. Summary of the Metrics Mapped to the Objectives and Hypotheses
Objectives 5 and 6 did not have any corresponding hypotheses or metrics for the
experiment. Using the matrix to create network graphs and using direction relationships based
on metrics pointing toward their corresponding objectives, two network graphs were generated.
Figure 33 shows a graph highlighting the weighted out-degree for the metrics and objectives
network. The size of the nodes indicates the out-degree of the node.
Number Metric 1 2 3 4 5 6 H-1a H-1b H-1c H-2a H-2b H-2c H-3a H-3b H-3c H-3d H-4a H-4b H-4c H-4d H-4e H-4f1 Number of airspace violations x x x x x x x x x2 Number of ground violations x x x x x x x x
3Number of completed missions vs number of expected missions
x x x x x x x x x x x
3a Number of completed fire missions x x x x x x4a Number of successful fires missions x x x x x x4b Number of successful TST missions x x5 Accuracy of target coordinates x x x x x6 Operator perceived workload x x x x7 Operator perceived differences8 Level of SA with regards to the Blue x x x x x x x x x x9 Time to complete mission strands x x x x x
10Time taken to identify and re-task the all fires and movement assets
x x x x x x
11 Timeliness to clear the airspace x x x x12 Timeliness to clear the ground x x13 Time remaining to engage TSTs x x14 Number of concurrent mission threads x x
15Time taken to integrate dynamic ACMRs and FSCMs into the
x x x x x x
16 DACT Operator Assessment
Related Objectives Hypotheses

141
Figure 33. Metrics and Objectives Network Weighted Out-Degree
This view shows the criticality of metrics 3, 8 and 9 which are used across all four of the
measured objectives. This view also highlights the fact that metrics are typically used with
multiple objectives. If the analyst is unable to collect a critical metric, it can interfere with
evaluation of most if not all of the objectives.
A look at the in-degree graph (Figure 34) shows that Objective 4 has a high dependency
on many metrics. On closer inspection, it turns out that objective 4 has five different experiment

142
hypotheses related to it. For each hypothesis there are multiple metrics (up to five in one case).
There is some overlap, but it is clear that the evaluation of objective 4 is very complex.
Figure 34. Metrics and Objectives Network Weighted In Degree
This type of analysis of the experimental design can help to highlight complexities that
may add risk to the experiment. Failure to collect certain metrics could render the hypotheses
unable to be evaluated, failing to provide an experiment-based assessment of the objectives. The
results of the AHP analysis did not highlight the criticality of the Analysis function with regard
to the success in assessing achievement of the experiment objectives. This additional analysis of
143
metrics and objectives provides illuminating insight regarding the experiment design provided by
the analysis functional area.
6. Review Results
The result of applying the SG methodology to the case study is summarized as follows:
1. SoS characteristics were compared against the CAGE II experiment to show that the
CAGE II represents a proper SG candidate system.
2. Areas for SG analysis have been selected based on a review of T&E lessons learned
(covered in Chapter 4) and specific lessons learned during the CAGE I experiments
as reported in the CAGE I final report.
3. SG dimensions have been selected as the focus of SG analysis based on the areas
identified in 2.
4. The ESM architecture framework has been selected to capture the SG related
dimensional information and to serve as a guide for selecting analysis techniques,
particularly cross-dimensional analyses which include:
o Object x Object analysis using matrix and network methods
o Function x Function analysis exploring functional group interactions and
constraints
o Function x Objective analysis investigating the influence of competing
functional activities toward focus on experiment objectives.
o Function x Activities analysis exposing problems with the experiment design.
5. High level SoS and Component SoS representations have been developed to provide
context to the CAGE II activities.

144
6. Analysis of the SG information has been performed leading to identification of
potential issues (Table 24) and opportunities (Table 25) while providing
recommendations to address potential unintended and intended emergent SoS
behaviors:
Table 24. SG Observations, Identified Potential Issues and Recommendations SG Analysis Observation Potential Unintended Behavior Recommendation
System x System network analysis highlighted a number of systems with high centrality measures, indicating potential significance of proper operation of those nodes.
Issue: Major SoS execution problems can occur if system nodes with high centrality measures have problems
Ensure such nodes are well tested and configuration controlled before an event.
System x System network analysis highlighted a number of systems with high betweenness measures indicating potential bottlenecks in the network (operational and technical).
Issue: Systems that represent nodes with high betweenness may represent a network bottleneck.
Care should be taken to ensure that bandwidth is adequate to support the high betweenness node and its interactions with others.
Development of a Design Structure matrix for the simulation and the C2 systems showed clusters of systems. This was also highlighted in the network analysis where clustering algorithms (in Gephi tool) highlighted multiple community of systems.
Issue: Identified clusters or communities of systems highlight needs for collaboration between system developers and opportunities for preliminary integration testing by community. Failure to do this may lead to integration problems later in the SoS lifecycle.
Collaboration activities should be planned for systems in same community. Early integration events should focus on community of systems identified in analysis.
Analysis of the interactions between the various functional groups (Operations, Analysis and Technical) highlighted dependencies and constraints where decisions from one group could directly impact the other two. Discussions with users on previous experiences with CAGE I also highlighted lessons learned from previous interactions between groups.
Issue: Lack of collaboration between functional groups could lead to: • Systems not integrating in a timely manner
because they were selected for use too late in the development process.
• Systems, tools and processes not in place to collect necessary metrics because experimental design occurred too late in the process.
• Developed scenario threads not producing the behaviors that are the subject of the experiment, leading to lack of data to assess achievement of the objectives.
Collaboration activities should be planned within and between functional groups early in the SoS process
Network analysis of experimental design (relating the planned metrics to the targeted objectives) showed complexity from two perspectives: Out-degree from metrics to objectives showed that several metrics were critical to evaluating
Issue: Overly complex experiment design (too many hypotheses with too many metrics) could make it difficult to evaluate achievement of objectives if certain metrics are unavailable
Analyze experiment objectives early and review design for reduced complexity (e.g. fewer hypotheses for evaluation or less use of the same metrics for
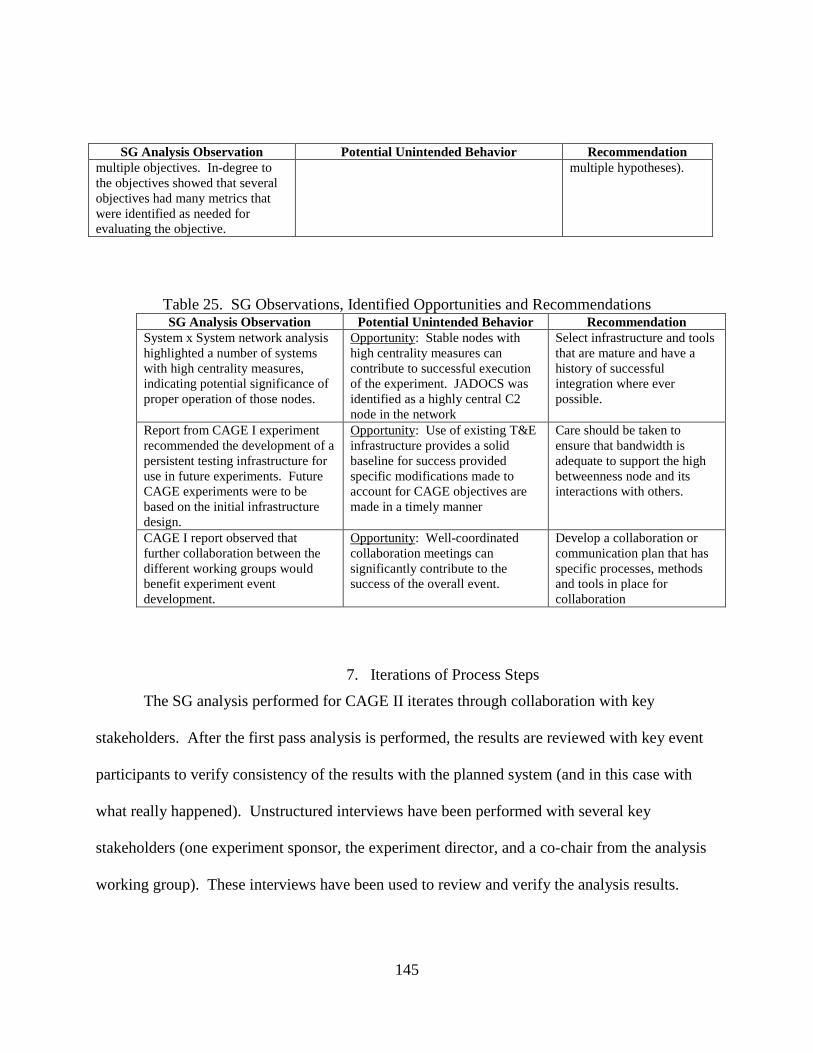
145
SG Analysis Observation Potential Unintended Behavior Recommendation multiple objectives. In-degree to the objectives showed that several objectives had many metrics that were identified as needed for evaluating the objective.
multiple hypotheses).
Table 25. SG Observations, Identified Opportunities and Recommendations SG Analysis Observation Potential Unintended Behavior Recommendation
System x System network analysis highlighted a number of systems with high centrality measures, indicating potential significance of proper operation of those nodes.
Opportunity: Stable nodes with high centrality measures can contribute to successful execution of the experiment. JADOCS was identified as a highly central C2 node in the network
Select infrastructure and tools that are mature and have a history of successful integration where ever possible.
Report from CAGE I experiment recommended the development of a persistent testing infrastructure for use in future experiments. Future CAGE experiments were to be based on the initial infrastructure design.
Opportunity: Use of existing T&E infrastructure provides a solid baseline for success provided specific modifications made to account for CAGE objectives are made in a timely manner
Care should be taken to ensure that bandwidth is adequate to support the high betweenness node and its interactions with others.
CAGE I report observed that further collaboration between the different working groups would benefit experiment event development.
Opportunity: Well-coordinated collaboration meetings can significantly contribute to the success of the overall event.
Develop a collaboration or communication plan that has specific processes, methods and tools in place for collaboration
7. Iterations of Process Steps
The SG analysis performed for CAGE II iterates through collaboration with key
stakeholders. After the first pass analysis is performed, the results are reviewed with key event
participants to verify consistency of the results with the planned system (and in this case with
what really happened). Unstructured interviews have been performed with several key
stakeholders (one experiment sponsor, the experiment director, and a co-chair from the analysis
working group). These interviews have been used to review and verify the analysis results.
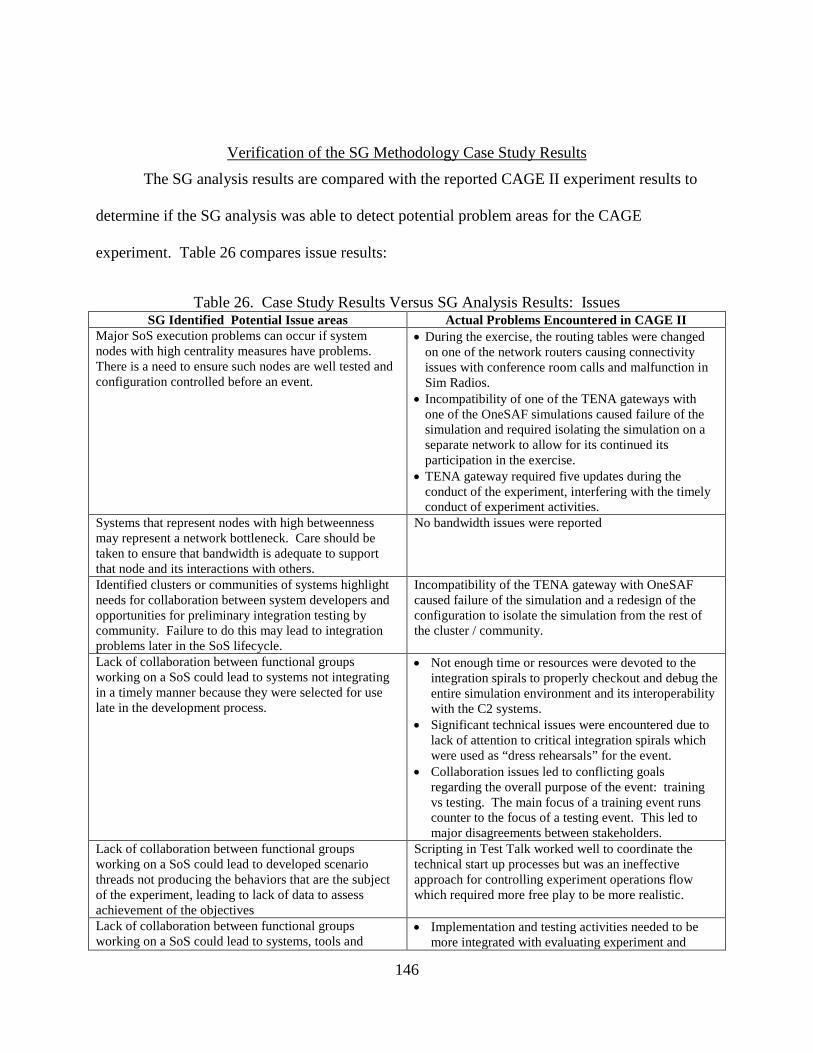
146
Verification of the SG Methodology Case Study Results
The SG analysis results are compared with the reported CAGE II experiment results to
determine if the SG analysis was able to detect potential problem areas for the CAGE
experiment. Table 26 compares issue results:
Table 26. Case Study Results Versus SG Analysis Results: Issues SG Identified Potential Issue areas Actual Problems Encountered in CAGE II
Major SoS execution problems can occur if system nodes with high centrality measures have problems. There is a need to ensure such nodes are well tested and configuration controlled before an event.
• During the exercise, the routing tables were changed on one of the network routers causing connectivity issues with conference room calls and malfunction in Sim Radios.
• Incompatibility of one of the TENA gateways with one of the OneSAF simulations caused failure of the simulation and required isolating the simulation on a separate network to allow for its continued its participation in the exercise.
• TENA gateway required five updates during the conduct of the experiment, interfering with the timely conduct of experiment activities.
Systems that represent nodes with high betweenness may represent a network bottleneck. Care should be taken to ensure that bandwidth is adequate to support that node and its interactions with others.
No bandwidth issues were reported
Identified clusters or communities of systems highlight needs for collaboration between system developers and opportunities for preliminary integration testing by community. Failure to do this may lead to integration problems later in the SoS lifecycle.
Incompatibility of the TENA gateway with OneSAF caused failure of the simulation and a redesign of the configuration to isolate the simulation from the rest of the cluster / community.
Lack of collaboration between functional groups working on a SoS could lead to systems not integrating in a timely manner because they were selected for use late in the development process.
• Not enough time or resources were devoted to the integration spirals to properly checkout and debug the entire simulation environment and its interoperability with the C2 systems.
• Significant technical issues were encountered due to lack of attention to critical integration spirals which were used as “dress rehearsals” for the event.
• Collaboration issues led to conflicting goals regarding the overall purpose of the event: training vs testing. The main focus of a training event runs counter to the focus of a testing event. This led to major disagreements between stakeholders.
Lack of collaboration between functional groups working on a SoS could lead to developed scenario threads not producing the behaviors that are the subject of the experiment, leading to lack of data to assess achievement of the objectives
Scripting in Test Talk worked well to coordinate the technical start up processes but was an ineffective approach for controlling experiment operations flow which required more free play to be more realistic.
Lack of collaboration between functional groups working on a SoS could lead to systems, tools and
• Implementation and testing activities needed to be more integrated with evaluating experiment and

147
SG Identified Potential Issue areas Actual Problems Encountered in CAGE II processes not in place to collect necessary metrics because experimental design occurred too late in the process.
operations activities / objectives. • The level of complexity of the experiment using
distributed simulation inputs led to an unworkable complex experiment control structure.
• A key metric for the experiment was the detection of airspace and ground space violations. The tool for detecting the violations was unstable and subsequently unavailable for much of the experiment, leading to lack of data collected on this key metric.
Overly complex experiment design (too many hypotheses with too many metrics) could make it difficult to evaluate achievement of objectives if certain metrics are unavailable
Overlapping hypotheses and metrics where multiple hypotheses had numerous metrics and many metrics were associated with multiple hypotheses led to confusion and also trouble with assigning causality to observed behavior.
Emergent SoS behaviors can include opportunities as well as potential issues. Stating the
analysis results in terms of opportunities, these are compared with the CAGE II experiment
results reporting where things went well (Table 27).
Table 27. Case Study Results Versus SG Analysis Results: Opportunities SG Identified Opportunity areas Other Experiment Results
Stable nodes with high centrality measures can contribute to successful execution of the experiment. JADOCS was identified as a highly central C2 node in the network.
JADOCS provided an excellent integration of the tactical air picture from all partners. JADOCs operated well across all the objective areas.
Use of existing T&E infrastructure provides a solid baseline for success provided specific modifications made to account for CAGE objectives are made in a timely manner.
• The experiment infrastructure provided a relatively stable experiment environment by the end of the experiment.
• The test talk collaboration tool provided excellent support for technical start up activities.
• Use of an established test center along with experienced staff contributed to the success of the experiment. Last minute adjustments led to a better operation and experiment environment for participants.
Well-coordinated collaboration meetings can significantly contribute to the success of the overall event.
Conduct of in-person planning meetings was very useful for coordinating effort and considered worth the time and cost.
148
CAGE Case Study Conclusions
The CAGE II T&E Experiment serves as a case study to demonstrate the SG
methodology. Using a problem-oriented approach to SoS analysis, key areas of concern are
identified based on lessons learned from the T&E community as well as issues encountered at
the CAGE I experiment event. The problem areas identified became the focal point for system
analysis to identify specific areas of concern to allow risk mitigation strategies to be identified.
Validation of the SG methodology results against the CAGE II experiment results
demonstrates that potential issue and opportunity areas highlighted for attention as part of the SG
analysis are areas where actual problems / opportunities occurred during the CAGE II event.
This supports the potential of SG as a methodology for use early in a SoS development activity
to highlight areas of potential risk and opportunity for unplanned emergent SoS behaviors.

149
CHAPTER SIX: RESEARCH RESULTS, SUMMARY, RECOMMENDATIONS AND FUTURE RESEARCH
As a teacher of mathematics almost 30 years ago, I would tell my students that when they
were answering a question and were successful in finding a solution, they should always check
the result to make sure that:
• it answers the original question, and
• the result makes sense.
This chapter reviews the questions posed in chapter 1 and summarizes how they were
addressed by the research in this study. The significance of the research findings are discussed
including the contribution to the systems engineering discipline as well as to practicing system of
system architects. The chapter concludes with a summary of research areas for further
developing SG and supporting the SoS engineering discipline at large.
The Questions
The Definition of Systems Geometry
The research started with the primary question: What is the definition of a Systems
Geometry methodology that would allow a SoS to be analyzed within a system dimension and
across different system dimensions?
Systems Geometry (SG) is a methodology for analyzing complex SoS in order to better
understand the relationships between constituent systems and emergent behaviors of the
composed SoS. SG methodology also seeks to provide critical insight into the integration and
operational risks of a proposed SoS composition so they can be addressed early in the SoS
lifecycle.

150
The SG methodology consists of three parts: processes, methods and tools.
The SG process includes the following steps:
1. Determine which SoS problem areas are going to be of most concern for the
developing SoS.
2. Based on the identified problem areas, determine what SG dimensions are
necessary to perform analysis for those problems.
3. Collect the SG dimensional information using an architecture framework that can
capture information critical to the planned analysis.
4. Develop models of the SoS or key behavioral components of the SoS to allow
representation of the intra and cross-dimensional relationships between SG
components.
5. Perform the analysis.
6. Review analysis results against the identified problems, operational objectives and
other defined system capabilities. Review with stakeholders to see if the analysis
results make sense or if the SoS information needs to be updated and the analysis
repeated.
7. Update and re-run as needed.
The SG methods include a blend of qualitative and quantitative analysis approaches that
are used to evaluate SoS behaviors. The methods selected for a particular SG study depends on
the problems that are targeted for analysis. These methods include:
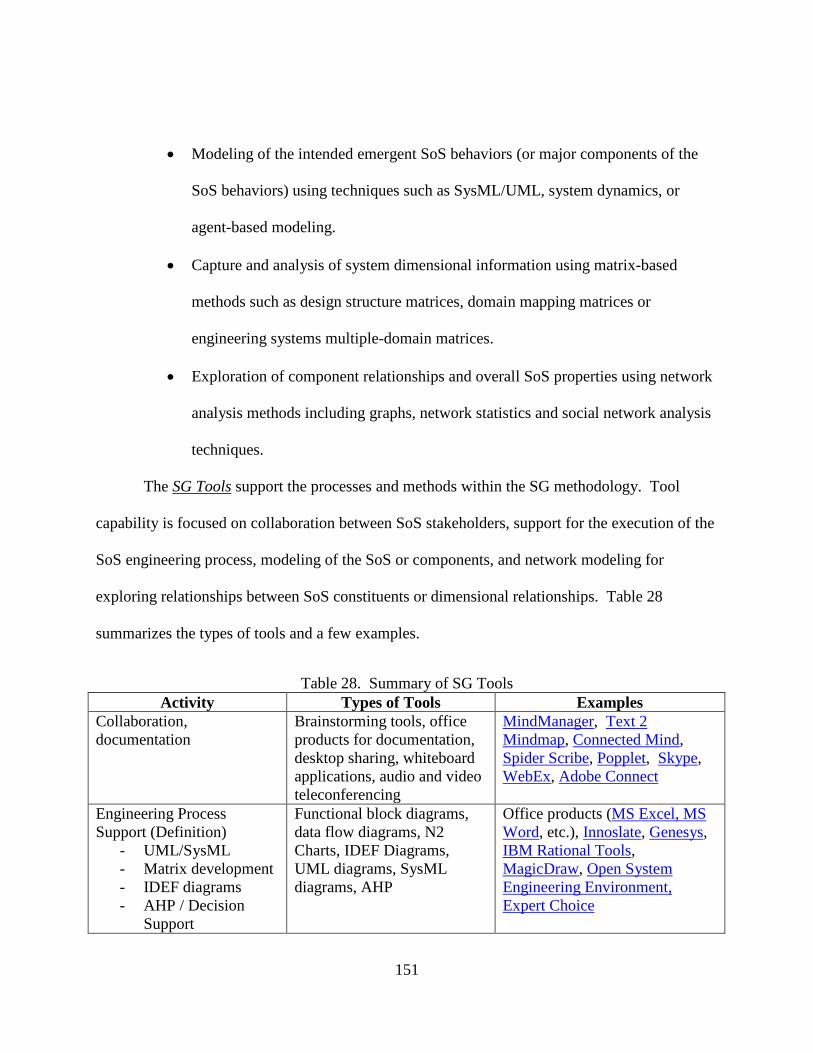
151
• Modeling of the intended emergent SoS behaviors (or major components of the
SoS behaviors) using techniques such as SysML/UML, system dynamics, or
agent-based modeling.
• Capture and analysis of system dimensional information using matrix-based
methods such as design structure matrices, domain mapping matrices or
engineering systems multiple-domain matrices.
• Exploration of component relationships and overall SoS properties using network
analysis methods including graphs, network statistics and social network analysis
techniques.
The SG Tools support the processes and methods within the SG methodology. Tool
capability is focused on collaboration between SoS stakeholders, support for the execution of the
SoS engineering process, modeling of the SoS or components, and network modeling for
exploring relationships between SoS constituents or dimensional relationships. Table 28
summarizes the types of tools and a few examples.
Table 28. Summary of SG Tools Activity Types of Tools Examples
Collaboration, documentation
Brainstorming tools, office products for documentation, desktop sharing, whiteboard applications, audio and video teleconferencing
MindManager, Text 2 Mindmap, Connected Mind, Spider Scribe, Popplet, Skype, WebEx, Adobe Connect
Engineering Process Support (Definition)
- UML/SysML - Matrix development - IDEF diagrams - AHP / Decision
Support
Functional block diagrams, data flow diagrams, N2 Charts, IDEF Diagrams, UML diagrams, SysML diagrams, AHP
Office products (MS Excel, MS Word, etc.), Innoslate, Genesys, IBM Rational Tools, MagicDraw, Open System Engineering Environment, Expert Choice

152
Activity Types of Tools Examples System Modeling System level models
supporting model-based systems engineering to include UML, SysML, discrete event simulation, system dynamic and agent based models
IBM Rational Tools, MagicDraw, Arena, AnyLogic, NetLogo
Network Modeling Tools for generating network graphs and calculating node and network statistics
Gephi, Ora, Pajek, NetLogo, NodeXL, UCInet, R
Related Questions
The multi-part question posed in Chapter 1 included several related questions:
1. What kind of emergent SoS behaviors can be explored using SG?
As a system architect or developer, there is intense interest in all of the potential
emergent system behaviors that can be exhibited by a developing SoS. One class of
behaviors includes the behaviors the system is being developed to perform – the intended
behaviors. These behaviors should be explored as a means to verify that they are correct
and address the system’s intended purpose. These can be explored using the SG methods
discussed above. The other types of behaviors are the unintended emergent behaviors.
These behaviors are exhibited by the SoS but not necessarily planned. Many times these
behaviors are negative in their implication since it reflects the system doing something it
isn’t supposed to do, that it wasn’t designed to do, and generally, that the system architect
did not want it to do. They represent risks because they are not wanted and may consume
resources needed for intended behaviors. There are occasions that these unintended
consequences represent opportunities, behaviors that were not planned but provide a
153
benefit or useful result to the SoS stakeholders. SG analysis of SoS has the potential to
uncover both.
2. What SG dimensions are most applicable for exploring intra-dimension system
characteristics vs cross-dimensional relationships?
This question should be answered on a SoS basis since the motivation for dimension
selection is based on anticipated problem areas identified by the system analyst. Based
on the study of frameworks and the definition of the SG AF, the importance of the wide
range of available dimensions would imply that all are applicable for intra- and cross-
dimensional analysis. For our case study, all three primary dimensions were explored
(operational, functional and technical).
3. Can SG be used during the design phase of a SoS to understand the impact of
integrating new systems into an established SoS so that an engineering team can
take actions to maintain the integrity and validity of the overall system?
Yes. SG can be used during the design phase, even earlier in the SoS development
process, to investigate concepts of behavior emergence during the development and use
of the proposed SoS. Information about the developing system can be investigated to
identify problem conditions that can then be addressed as the development process
proceeds. This includes changes associated with the addition of new systems.
What does this all mean?
The findings from this study include the following:
154
• Systems Geometry shows promise for identifying emergent SoS behaviors that
present both problems and opportunities for SoS integration and performance.
• The study of systems and systems of systems has highlighted the benefits of
applying a holistic engineering approach alongside a reductionist approach that
allows breaking the problem into more manageable pieces while not losing the
emergent SoS behaviors.
• A study of enterprise architectures has demonstrated the variety of perspectives
that need to be considered for any developing complex system and has introduced
methods for identifying and capturing these perspectives even if just to bring them
to awareness during the planning process.
• More research is needed to expand the techniques applied in SoS analysis to
implement other valuable analysis approaches such as AHP, data mining,
emergence and complexity techniques.
• Exploration of system of systems analysis techniques has underscored that
practical techniques are just beginning to emerge that can provide the type of
system analysis and insight required early in a SoS SE lifecycle.
• There is so much more that can be drawn from the area of emergence that would
benefit this analysis – but a brief study of emergence has shown that the system
behaviors, intended and unintended, are simply the emergence of the overall SoS
behavior based on the composition of the constituent systems.

155
• Although SoS are difficult to analyze and their behaviors difficult to predict, there
are methods available to explore the characteristics and behaviors of SoS in order
to better design and develop them.
• There is a lot of valuable research in system science that can continue to
contribute to enhancing our understanding of SoS characteristics and behaviors.
There are a number of reasons why the research and its findings are important:
• There is significant cost associated with the development of complex distributed
SoS. Emergent problems are usually not uncovered until integration, which
severely limits options for addressing the problems while attempting to meet the
SoS requirements. Issues discovered this late in the development process increase
the cost of the SoS tremendously.
• Understanding SoS from an emergence standpoint highlights shortcomings of
traditional system analysis techniques and opens the door to implementing new
approaches for better understanding of the SoS behaviors – both desired and
undesired.
• The engineering community needs to explore utilizing new techniques and tools
available today for performing more effective engineering analysis of complex
SoS. Engineering education needs to better equip our future systems engineers
with these tools and techniques to more effectively and efficiently develop
modern SoS.

156
The contribution of this research to the field of systems engineering and the practice of
systems engineering includes:
To the field of systems engineering:
• Identification and description of the multi-dimensional nature of SoS problems
and the relationship between those dimensions.
• A methodology called Systems Geometry that provides:
o a problem-oriented process targeting early SoS lifecycle analysis activities
on key areas of interest representing potential risk areas for a developing
SoS.
o a summary of methods that can be applied to analyze system dimensions
and the relationships between those dimensions.
o recommended tool capabilities that facilitate the execution of the process
and its associated methods.
• Groundwork for cross-dimensional problem identification and analysis.
• Enterprise architecture methodology and its contribution to early SE lifecycle
analysis of developing complex SoS.
To the practice of systems engineering:
• A methodology for early life cycle analysis of system behaviors, risks and
opportunities for SoS.
157
• A summary of available methods for analyzing different facets of a complex
engineering SoS.
To the T&E community, this research provides a clear path for relating experiment
development activities to the operational and technical development process, addressing a
significant need to ensure that experiment design and testing methodologies are addressed in the
operational (mission thread development) and technical (SoS hardware and infrastructure
development) activities. This synergistic development approach (using SG) allows for the
collection of data that will support evaluation of T&E objectives and their associated hypotheses
while providing the means to account for both technical system complexities and the operational
context of the developing SoS. This interaction of system dimensions has not yet been mastered
– SG provides an approach to address them.
What’s next?
There are many avenues of research that can further develop SG. Additional study of the
literature in emergence and complex systems could provide added avenues of analysis for better
understanding of SoS behaviors. Deeper exploration of SoS modeling methods and a
comparative study of those methods could provide guidance for which modeling approaches are
most appropriate for particular types of SoS or even for particular dimensions of a SoS under
study. Additional SG dimensions could be developed and analyzed, particularly the organization
and geographic domains, to highlight influence on technical dimension design. Sensitivity
analysis could highlight which aspects of particular dimensions have the most impact on the
targeted problem areas. A multi-criteria approach to selecting dimensional analysis options
158
could help to further focus the analysis based on specific SoS implementation needs and
stakeholder preferences.
A future study should seek a case study that represents an active SoS development
activity. The study should identify high potential areas for SG analysis development, implement
the methodology directly with the SoS development activity, gather targeted data to perform a
detailed comparison of SG results vs actual SoS development results. For the T&E community,
the application of option analysis with SG could help in the selection of SoS compositions to
support experimentation events. Other research could explore measures of complexity based on
selected SG dimensional analysis. These could then be used to explore the relationship between
the intended use of an integrated SoS (testing, training, research) and the level of complexity that
is allowable while maintaining validity. Future research should integrate the SG methodology
with DoDAF to provide the DoD community guidance on using DoDAF views to analyze SoS.
Other areas for future research include:
• Explore the use of system dynamic archetypes, like generic archetypes (E.
Wolstenholme, 2004) to characterize complex SoS problems and use the solution
archetype for exploring general solutions for such SoS configurations.
• Prototype the concept of spatial archetypes (BenDor & Kaza, 2012) to represent
constituent behaviors at the nodes and the effect of such behaviors on the overall
system (network).
159
• Apply other architecture framework approaches to the same problem to explore
effectiveness of different framework designs for specific types of SoS
configurations.
• Explore the relationship of network density measures to SoS network behaviors.
Investigate the application of network level statistics to identify emergence
patterns that may have implications for the SoS behaviors. Apply network
analysis for different types of SoS configurations using techniques like quadratic
assignment procedure to select an optimal configuration. Utilize network
modeling for representing the three dimensions and their inter-relationships
(operational, functional and technical). Explore multi-level graphs for the three
SG dimensions and various combinations of the dimensions for exploring SoS
complexity characteristics.
• Perform sensitivity analysis on network configurations to determine which types
of systems / nodes have the most influence on overall SoS performance and
potential problems.
• Use matrix methods to capture outcome variables and investigate optimal
outcomes using methods such as AHP and network analysis.
• Using the existing research in options analysis, develop an approach for technical
configuration options given an operational interaction requirements. Utilize
decision analysis tools to develop configuration recommendations based on the
identified options and other factors such as system availability, cost for system

160
implementation and infrastructure costs. Rate various options based on the
multiple dimensions of analysis.

161
APPENDIX – SIMULATION AND C2 SYSTEM NETWORK STATISTICS

162
Figure 35. Simulation System Network Statistics
Id In-Degree Out-Degree DegreeModularity
ClassClustering Coefficient
Eigenvector Centrality Eccentricity
Closeness Centrality
Betweenness Centrality
CA-CFWC-SIMDIS1 3 0 3 1 0.6667 0.4402 0 0 0CA-CFWC-SIMDIS2 1 0 1 2 0 0.3406 0 0 0CA-CFWC-VCCI GW 1 0 1 3 0 0.2200 0 0 0CA-CFWC-CSV Sim logger 1 0 1 4 0 0.1468 0 0 0CA-CFWC-JSAF-OthGold GW 1 0 1 4 0 0.1468 0 0 0CA-CFWC-Bender 7 7 14 2 0 1 5 2.2414 789CA-CFWC-JSAF-DIS GW 2 2 4 4 0 0.4874 6 2.7241 313CA-CFWC-TENA-DIS GW 4 4 8 1 0.2 0.5742 4 2.7931 458.33CA-CFWC-JCATS Server 5 6 11 3 0 0.6449 6 2.8621 262CA-CFMWC-JSAF-DIS GW 2 2 4 5 0 0.4249 6 3 171CA-CFWC-VBS2-UAV OP2 1 2 3 2 0 0.0131 6 3.0968 30CA-CFWC-VBS2-UAV OP1 2 2 4 2 0 0.3876 6 3.1379 61CA-CFMWC-VBS2-UAV 1 1 2 2 0 0.3406 6 3.2069 0CA-CFWC-RTI-S RTI 5 7 12 4 0 0.3937 7 3.2759 292AU-TENA-DIS GW 3 3 6 1 0.1667 0.2812 5 3.5172 194.33US-SIMDIS 0 3 3 1 0.6667 0 5 3.5333 0US-RTC-TENA-DIS GW 7 2 9 1 0.0714 0.2701 5 3.7241 174.33CA-CFMWC-RTI-S-RTI 3 3 6 5 0 0.2181 7 3.8276 120CA-CFWC-JCATS Client 1 1 1 2 3 0 0.2200 7 3.8276 0CA-CFWC-JCATS Client 2 1 1 2 3 0 0.2200 7 3.8276 0CA-CFWC-JCATS Client 3 1 1 2 3 0 0.2200 7 3.8276 0CA-CFWC-JCATS Client 4 1 1 2 3 0 0.2200 7 3.8276 0CA-CFWC-VBS2-Op 1 1 2 2 0 0.0131 7 4.0645 0CA-CFWC-VBS2-Coord 1 1 2 2 0 0.1313 7 4.1034 0CA-CFWC-JSAF3 1 1 2 4 0 0.1468 8 4.2414 0CA-CFWC-JSAF4 1 1 2 4 0 0.1468 8 4.2414 0CA-CFWC-JSAF5 1 1 2 4 0 0.1468 8 4.2414 0CA-CFWC-JSAF-Link 16 GW 1 1 2 4 0 0.1468 8 4.2414 0AU-JSAF DIS GW 2 2 4 0 0 0.1585 6 4.3448 143US-OneSAF 2 3 5 1 0.1667 0.0386 6 4.3750 32US-STEN 1 2 3 1 0.5 0.0271 6 4.4063 0US-Flightlab/ Cockpit Sim 0 1 1 1 0 0 6 4.6 0US-VBS2 0 1 1 1 0 0 6 4.6 0US-TENA-Ex-Mgr 0 1 1 1 0 0 6 4.6 0CA-CFMWC-JSAF1 1 1 2 5 0 0.0842 8 4.7931 0CA-CFMWC-JSAF2 1 1 2 5 0 0.0842 8 4.7931 0AU-RTI-S RTI 3 2 5 0 0 0.0988 7 5.2414 89US-OneSAF C2 Adapter 1 1 2 1 0 0.0271 7 5.3438 0AU-JSAF 0 1 1 0 0 0 8 6.0667 0AU-JSAF Link 16 GW 1 1 2 0 0 0.0504 8 6.2069 0

163
Figure 36. Operational C2 System Network Statistics
IdModularity
Class In-DegreeOut-
Degree DegreeClustering Coefficient
Eigenvector Centrality Eccentricity
Closeness Centrality
Betweenness Centrality
CFMWC-JADOCS 2 4 2 6 0.6667 1 2 1.500 0.6667CFWC-JADOCS 2 6 3 9 0.2381 0.9484 2 1.250 28.8333CAM-JADOCS 2 3 3 6 0.6667 0.8661 2 1.250 2.3333US-JADOCS 2 2 3 5 0.75 0.5220 2 1.250 1.3333AU-JADOCS 2 3 3 6 0.5 0.5151 2 1.250 1.8333CA-GCCS-M 1 3 4 7 0.05 0.1162 2 1.500 38LCCS 1 1 2 3 0.3333 0.0667 2 1.600 7GCCS-A 1 1 1 2 0 0.0667 3 2.375 0AU-GCCS-M 1 1 1 2 0 0.0667 3 2.375 0ADSI 0 3 6 9 0 0.0600 3 1.857 40AMSWS 0 1 0 1 0 0.0420 0 0.000 0TMS-ITRACKS 0 1 0 1 0 0.0420 0 0.000 0CA-GCCS-J 0 1 1 2 0 0.0420 3 2.000 8FTT 0 1 1 2 0 0.0420 4 2.786 0TAIS 0 1 1 2 0 0.0420 4 2.786 0AMDWS 0 0 1 1 0 0 4 2.733 0

164
LIST OF REFERENCES
Alam, S. J., & Geller, A. (2012). Networks in Agent-Based Social Simulation. In A. J.
Heppenstall, A. T. Crooks, L. M. See, & M. Batty (Eds.), Agent-Based Models of
Geographical Systems (pp. 199–216). Springer Netherlands. Retrieved from
http://www.springerlink.com.ezproxy.lib.ucf.edu/content/h328t536877um556/abstract/
Albert, R., & Barabási, A.-L. (2000). Topology of Evolving Networks: Local Events and
Universality. Physical Review Letters, 85(24), 5234–5237.
doi:10.1103/PhysRevLett.85.5234
Alderson, D. L. (2008). Catching the “Network Science” Bug: Insight and Opportunity for the
Operations Researcher. Operations Research, 56, 1047–1065. doi:Article
Aronson, D. (1996). Overview of Systems Thinking. Thinking Page (website for author).
Retrieved from http://www.thinking.net/Systems_Thinking/systems_thinking.html
Balmelli, L., Brown, D., Cantor, M., & Mott, M. (2006). Model-driven systems development.
IBM Systems Journal, 45(3), 569–585. doi:10.1147/sj.453.0569
Barabási, A.-L., & Albert, R. (1999). Emergence of Scaling in Random Networks. Science,
286(5439), 509–512. doi:10.1126/science.286.5439.509
Bartolomei, J. E. (2007). Qualitative knowledge construction for engineering systems : extending
the design structure matrix methodology in scope and procedure (Thesis). Massachusetts
Institute of Technology. Retrieved from http://dspace.mit.edu/handle/1721.1/43855

165
Bartolomei, J. E., Hastings, D. E., de Neufville, R., & Rhodes, D. H. (2012). Engineering
Systems Multiple-Domain Matrix: An organizing framework for modeling large-scale
complex systems. Systems Engineering, 15(1), 41–61. doi:10.1002/sys.20193
Bartolomei, J., Silbey, S., Hastings, D., De Neufville, R., & Rhodes, H. (2009). Bridging the
Unspannable Chasm: Qualitative Knowledge Construction for Engineering Systems. In
Second International Symposium on Engineering Systems (pp. 15–17). Retrieved from
http://esd.mit.edu/staging/symp09/submitted-papers/bartolomei-paper.pdf
Beckerman, L. P. (2000). Application of complex systems science to systems engineering.
Systems Engineering, 3(2), 96–102.
BenDor, T. K., & Kaza, N. (2012). A theory of spatial system archetypes. System Dynamics
Review, 28(2), 109–130. doi:10.1002/sdr.1470
Biltgen, P. T. (2007). A methodology for capability-based technology evaluation for systems-of-
systems (Ph.D.). Georgia Institute of Technology, United States -- Georgia. Retrieved
from
http://search.proquest.com.ezproxy.lib.ucf.edu/pqdtft/docview/304878144/abstract/13B2
670A81B1A679FD8/25?accountid=10003
Bjorkman, E. A., Sarkani, S., & Mazzuchi, T. A. (2012). Using model-based systems
engineering as a framework for improving test and evaluation activities. Systems
Engineering, n/a–n/a. doi:10.1002/sys.21241
Black, D. (2002). Pure Sociology and the Geometry of Discovery. Contemporary Sociology,
31(6), 668–674. doi:10.2307/3089917

166
Black, D. (2004). The Geometry of Terrorism. Sociological Theory, 22(1), 14–25.
doi:10.1111/j.1467-9558.2004.00201.x
Boardman, J., & Sauser, B. (2006). System of Systems–the meaning of of. Presented at the 2006
IEEE/SMC International Conference on System of Systems Engineering, Los Angeles,
CA: IEEE. Retrieved from http://datafedwiki.wustl.edu/images/a/a2/Boardman_-
_System_of_Systems_%E2%80%93_the_meaning_of_of.pdf
Borshchev, A., & Filippov, A. (2004). From system dynamics and discrete event to practical
agent based modeling: reasons, techniques, tools. In Proceedings of the 22nd
International Conference of the System Dynamics Society. Retrieved from
http://www.econ.iastate.edu/tesfatsi/systemdyndiscreteeventabmcompared.borshchevfilip
pov04.pdf
Branting, L. (2011). Context-sensitive detection of local community structure. Social Network
Analysis and Mining, 1–11. doi:10.1007/s13278-011-0035-7
Braun, W. (2002). The system archetypes. System, 2002, 27.
Chakraborty, S., & Dehlinger, J. (2009). Applying the Grounded Theory Method to Derive
Enterprise System Requirements. In 10th ACIS International Conference on Software
Engineering, Artificial Intelligences, Networking and Parallel/Distributed Computing,
2009. SNPD ’09 (pp. 333–338). Presented at the 10th ACIS International Conference on
Software Engineering, Artificial Intelligences, Networking and Parallel/Distributed
Computing, 2009. SNPD ’09. doi:10.1109/SNPD.2009.102
167
Chattopadhyay, D., Ross, A. M., & Rhodes, D. H. (2009). Demonstration of system of systems
multi-attribute tradespace exploration on a multi-concept surveillance architecture. In 7th
Conference on Systems Engineering Research. Retrieved from
http://cser.lboro.ac.uk/papers/S06-40.pdf
Choi, D., & Sage, A. P. (2012). A framework for interoperability assessments in Systems of
Systems and Families of Systems. Information, Knowledge, Systems Management, 11(3),
275–295. doi:10.3233/IKS-2012-0211
Cucchiarelli, A., D’Antonio, F., & Velardi, P. (2012). Semantically interconnected social
networks. Social Network Analysis and Mining, 2(1), 69–95. doi:10.1007/s13278-011-
0030-z
Dabkowski, M., Estrada, J., Reidy, B., & Valerdi, R. (2013). Network Science Enabled Cost
Estimation in Support of MBSE. Procedia Computer Science, 16, 89–97.
doi:10.1016/j.procs.2013.01.010
Dahmann, J., Lane, J. A., Rebovich, G., & Lowry, R. (2010). Systems of systems test and
evaluation challenges. In System of Systems Engineering (SoSE), 2010 5th International
Conference on (pp. 1–6). Retrieved from
http://ieeexplore.ieee.org.ezproxy.lib.ucf.edu/xpls/abs_all.jsp?arnumber=5543979
Dahmann, J. S., & Baldwin, K. J. (2008). Understanding the current state of US defense systems
of systems and the implications for systems engineering. In Systems Conference, 2008
2nd Annual IEEE (pp. 1–7). Retrieved from
http://ieeexplore.ieee.org/xpls/abs_all.jsp?arnumber=4518994

168
Dahmann, Judith. (2012). Integrating systems engineering and test & evaluation in system of
systems development. In Systems Conference (SysCon), 2012 IEEE International (pp. 1–
7). Retrieved from http://ieeexplore.ieee.org/xpls/abs_all.jsp?arnumber=6189468
Dahmann, Judith, Baldwin, K. J., & Rebovich Jr, G. (2009). Systems of Systems and Net-Centric
Enterprise Systems. In 7th Annual Conference on Systems Engineering Research,
Loughborough. Retrieved from
http://192.52.194.10/work/tech_papers/2010/09_0497/09_0497.pdf
Davis, K., Mazzuchi, T., & Sarkani, S. (2012). Architecting technology transitions: A
sustainability-oriented sociotechnical approach. Systems Engineering, n/a–n/a.
doi:10.1002/sys.21226
DODAF Architecture Framework Version 2.02. (n.d.). DODAF 2.02. Retrieved March 19, 2013,
from http://dodcio.defense.gov/dodaf20.aspx
El-Sayed, A. M., Scarborough, P., Seemann, L., & Galea, S. (2012). Social network analysis and
agent-based modeling in social epidemiology. Epidemiologic Perspectives &
Innovations, 9(1), 1. doi:10.1186/1742-5573-9-1
Eppinger, S. D., & Browning, T. R. (2012). Design structure matrix methods and applications.
MIT Press. Retrieved from
http://books.google.com/books?hl=en&lr=&id=MPQoumoGXHYC&oi=fnd&pg=PR7&d
q=design+structure+matrix+methods+and+applications&ots=tsBtfi_5j_&sig=2SEozETE
Lz4wQclD71czGPLEMRA
169
Estefan, J. A. (2007). Survey of model-based systems engineering (MBSE) methodologies.
Incose MBSE Focus Group, 25. Retrieved from
http://pdf.aminer.org/000/260/416/towards_a_unified_paradigm_for_verification_and_va
lidation_of_systems.pdf
Figueredo, G., Aickelin, U., & Siebers, P. O. (2011). Systems dynamics or agent-based
modelling for immune simulation? Artificial Immune Systems, 81–94.
Figueredo, G. P., & Aickelin, U. (2011). Comparing system dynamics and agent-based
simulation for tumour growth and its interactions with effector cells. In Proceedings of
the 2011 Summer Computer Simulation Conference (pp. 52–59). Vista, CA: Society for
Modeling & Simulation International. Retrieved from
http://dl.acm.org.ezproxy.lib.ucf.edu/citation.cfm?id=2348196.2348204
Forrester, J. W. (1994). System dynamics, systems thinking, and soft OR. System Dynamics
Review, 10(2-3), 245–256.
Franks, D. W., Noble, J., Kaufmann, P., & Stagl, S. (2008). Extremism propagation in social
networks with hubs. Adaptive Behavior, 16(4), 264–274.
doi:10.1177/1059712308090536
Garcia, J. J. (2011). Adding executable context to executable architectures: Enabling an
executable context simulation framework (ECSF) (Ph.D.). Old Dominion University,
United States -- Virginia. Retrieved from
http://search.proquest.com.ezproxy.net.ucf.edu/docview/874157355/abstract/13D6BF835
8C39519320/1?accountid=10003

170
Ge, B., Hipel, K. W., Yang, K., & Chen, Y. (2013). A data-centric capability-focused approach
for system-of-systems architecture modeling and analysis. Systems Engineering, 1–15.
Gorod, A., Sauser, B., & Boardman, J. (2008). System-of-Systems Engineering Management: A
Review of Modern History and a Path Forward. IEEE Systems Journal, 2(4), 484–499.
doi:10.1109/JSYST.2008.2007163
Grady, J. O. (2009). Universal Architecture Description Framework. Systems Engineering, 12(2),
91–116. doi:10.1002/sys.20112
Griendling, K. A. (2011). Architect: the architecture-based technology evaluation and capability
tradeoff method. Retrieved from http://smartech.gatech.edu/handle/1853/42880
Griendling, K., & Mavris, D. (2010). An architecture-based approach to identifying system-of-
systems alternatives. In 2010 5th International Conference on System of Systems
Engineering (SoSE) (pp. 1–6). Presented at the 2010 5th International Conference on
System of Systems Engineering (SoSE). doi:10.1109/SYSOSE.2010.5544088
Griffin, L. K. (2005). Analysis and comparison of DODAF and ZACHMAN framework for use as
the architecture for the United States Coast Guard’s maritime patrol (WPC). Monterey,
California Naval Postgraduate School. Retrieved from
http://calhoun.nps.edu/public/handle/10945/2037
Hamill, L., & Gilbert, N. (2008). A simple but more realistic agent-based model of a social
network. Presented at the Proceedings of European Social Simulation Association Annual
Conference, Brescia, Italy.

171
Handley, H. A. H. (2012). Incorporating the NATO Human View in the DoDAF 2.0 Meta
Model. Systems Engineering, 15(1), 108–117. doi:10.1002/sys.20206
Handley, H. A. H., & Smillie, R. J. (2010). Human view dynamics—The NATO approach.
Systems Engineering, 13(1), 72–79. doi:10.1002/sys.20133
Handley, H. A., & Tolk, A. (2012). A Human View Model for Socio-Technical Interactions.
Retrieved from http://ntrs.nasa.gov/search.jsp?R=20130008678
Harary, F., & Batell, M. F. (1981). What is a system? Social Networks, 3(1), 29–40.
doi:10.1016/0378-8733(81)90003-4
Iacobucci, J. V. (2012). Rapid Architecture Alternative Modeling (RAAM): a framework for
capability-based analysis of system of systems architectures. Retrieved from
http://smartech.gatech.edu/handle/1853/43697
Israel, N., & Wolf-Branigin, M. (2011). Nonlinearity in social service evaluation: A primer on
agent-based modeling. Social Work Research, 35(1), 20–24.
Jamshidi, M. (2010). Systems of systems engineering: principles and applications. CRC Press.
Retrieved from
http://books.google.com/books?hl=en&lr=&id=YvxUon2vAfUC&oi=fnd&pg=PP1&dq=
system+of+systems+engineering+jamshidi&ots=1JgZaEUR7i&sig=5SODgT7p3dUNzv
Qrs_sWe-HH4jo
Kas, M., Carley, K., & Carley, L. (2011). Trends in science networks: understanding structures
and statistics of scientific networks. Social Network Analysis and Mining, 1–19.
doi:10.1007/s13278-011-0044-6

172
Kearns, M., Judd, S., Tan, J., & Wortman, J. (2009). Behavioral experiments on biased voting in
networks. Proceedings of the National Academy of Sciences, 106(5), 1347–1352.
doi:10.1073/pnas.0808147106
Kim, D., & Kawachi, I. (2006). A Multilevel Analysis of Key Forms of Community- and
Individual-Level Social Capital as Predictors of Self-Rated Health in the United States.
Journal of Urban Health, 83(5), 813–826. doi:10.1007/s11524-006-9082-1
Kuypers, M. A., Beyeler, W. E., Glass, R. J., Antognoli, M., & Mitchell, M. D. (2012). The
impact of network structure on the perturbation dynamics of a multi-agent economic
model. In Proceedings of the 5th international conference on Social Computing,
Behavioral-Cultural Modeling and Prediction (pp. 331–338). Berlin, Heidelberg:
Springer-Verlag. doi:10.1007/978-3-642-29047-3_40
Lane, J. A. (2012). System of Systems Engineering: What it is How to Get Started What is
Important at the SoS Level. Retrieved from
http://www.ssqi.org.au/files/GUS%20SSQI/JLane%20ISSEC%202012%20(1).pdf
Lane, Jo Ann. (2012). System of Systems Capability-to-Requirements Engineering. presentation.
Retrieved from http://www.sdincose.org/wp-content/uploads/2012/02/JLane-Capability-
Engineering.pdf
Lane, Jo Ann, & Bohn, T. (2013). Using SysML modeling to understand and evolve systems of
systems. Systems Engineering, 16(1), 87–98. doi:10.1002/sys.21221

173
Lehmann, H. (2010). Research Method: Grounded Theory for Descriptive and Exploratory Case
Studies. In The Dynamics of International Information Systems (pp. 53–65). Springer US.
Retrieved from http://link.springer.com/chapter/10.1007/978-1-4419-5750-4_5
Leist, S., & Zellner, G. (2006). Evaluation of current architecture frameworks. In Symposium on
Applied Computing: Proceedings of the 2006 ACM symposium on Applied computing
(Vol. 23, pp. 1546–1553). Retrieved from
http://dl.acm.org.ezproxy.lib.ucf.edu/ft_gateway.cfm?id=1141635&type=pdf
Lewe, J. H., DeLaurentis, D. A., & Mavris, D. N. (2004). Foundation for study of future
transportation systems through agent-based simulation. In 24th ICAS Congress. Retrieved
from http://www.icas.org/ICAS_ARCHIVE/ICAS2004/PAPERS/455.PDF
Lock, R. (2012). Developing a methodology to support the evolution of System of Systems using
risk analysis. Systems Engineering, 15(1), 62–73. doi:10.1002/sys.20194
Luzeaux, D. (2013). Systems of systems. Wiley-ISTE. Retrieved from
http://books.google.com/books?hl=en&lr=&id=TYAbYuuJtD0C&oi=fnd&pg=PT10&dq
=%22systems+of+systems%22+Luzeaux&ots=V5v3clMNvS&sig=y19z9_RFd9rTKpjzP
F-08HBqXjw
Macal, C. M. (2010). To agent-based simulation from system dynamics. In Simulation
Conference (WSC), Proceedings of the 2010 Winter (pp. 371–382). Retrieved from
http://ieeexplore.ieee.org.ezproxy.lib.ucf.edu/xpls/abs_all.jsp?arnumber=5679148
Macal, C. M., & North, M. J. (2010). Tutorial on agent-based modelling and simulation. Journal
of Simulation, 4(3), 151–162. doi:10.1057/jos.2010.3

174
Macy, M. W., & Willer, R. (2002). From Factors to Actors: Computational Sociology and
Agent-Based Modeling. Annual Review of Sociology, 28, 143–166.
Maier, M. W. (1998). Architecting principles for systems-of-systems. Systems Engineering, 1(4),
267–284. doi:10.1002/(SICI)1520-6858(1998)1:4<267::AID-SYS3>3.0.CO;2-D
Martin, J. N. (1997). Systems Engineering Guidebook: A process for developing systems and
products (Vol. 10). CRC PressI Llc. Retrieved from
http://books.google.com/books?hl=en&lr=&id=0CitVinlKiQC&oi=fnd&pg=PA1&dq=S
ystems+engineering+guidebook&ots=9oJKYBwp2h&sig=fLBaZk19jIzNc8AOjqpxMFX
ab5k
Montgomery, P. R. (2013). Model-Based System Integration (MBSI) – Key Attributes of MBSE
from the System Integrator’s Perspective. Procedia Computer Science, 16, 313–322.
doi:10.1016/j.procs.2013.01.033
Newman, M. E. J., & Park, J. (2003). Why social networks are different from other types of
networks. arXiv:cond-mat/0305612. doi:10.1103/PhysRevE.68.036122
Office of the Deputy Under Secretary of Defense for Acquisition and Technology, Systems and
Software Engineering. (2008, August). Systems Engineering Guide for Systems of
Systems. ODUSD(A&T)SSE. Retrieved from http://www.acq.osd.mil/se/docs/SE-Guide-
for-SoS.pdf
Osmundson, J. S., & Huynh, T. V. (2005). A systems engineering methodology for analyzing
systems of systems. In Proceedings of 1st Annual System of Systems Engineering
Conference, Johnstown, PA (Vol. 7, pp. 13–14). Retrieved from
175
http://www.sosece.org/pdfs/1stSOSeceConf/presentations/osmundson/OSD%20paper%2
01-2-3-4.pdf
Otte, E., & Rousseau, R. (2002). Social Network Analysis: A Powerful Strategy, Also for the
Information Sciences. Journal of Information Science, 28(6), 441–453.
doi:10.1177/016555150202800601
Pape, L., Giammarco, K., Colombi, J., Dagli, C., Kilicay-Ergin, N., & Rebovich, G. (2013). A
Fuzzy Evaluation method for System of Systems Meta-architectures. Procedia Computer
Science, 16, 245–254. doi:10.1016/j.procs.2013.01.026
Qiu, J., & Lin, Z. (2011). A framework for exploring organizational structure in dynamic social
networks. Decision Support Systems, 51(4), 760–771. doi:10.1016/j.dss.2011.01.011
Rahmandad, H., & Sterman, J. (2008). Heterogeneity and network structure in the dynamics of
diffusion: Comparing agent-based and differential equation models. Management
Science, 54(5), 998–1014.
Ramos, A. L., Ferreira, J. V., & Barcelo, J. (2012). Model-Based Systems Engineering: An
Emerging Approach for Modern Systems. IEEE Transactions on Systems, Man, and
Cybernetics, Part C: Applications and Reviews, 42(1), 101–111.
doi:10.1109/TSMCC.2011.2106495
Reedy, A., & Bellman, B. (2012, April 12). Selecting DoDAF 2.0 Views and Models for Use in
DoD Projects and Their Integration & Analysis. Retrieved from
http://www.dodenterprisearchitecture.org/program/Documents/BellmanBeryl_ReedyAnn

176
Ricci, N., Ross, A. M., & Rhodes, D. H. (2012). Developing a Dynamic Portfolio-Based
Approach for Systems of Systems Composition. WP-2012-2-1. Retrieved from
http://seari.mit.edu/documents/working_papers/SEAri_WP-2012-2-1.pdf
Robertson-Dunn, B. (2012). Beyond the Zachman framework: Problem-oriented system
architecture. IBM Journal of Research and Development, 56(5), 10–1.
Saaty, T. L. (2008). Decision making with the analytic hierarchy process. International Journal
of Services Sciences, 1(1), 83–98. doi:10.1504/IJSSci.2008.01759
Sage, A. P., & Cuppan, C. D. (2001). On the systems engineering and management of systems of
systems and federations of systems. Information, Knowledge, Systems Management, 2(4),
325–345.
Schieritz, N., & Milling, P. M. (2003). Modeling the forest or modeling the trees. In Proceedings
of the 21st International Conference of the System Dynamics Society (pp. 20–24).
Retrieved from
http://www.systemdynamics.org/conferences/2003/proceed/PAPERS/140.pdf
Scott, J. (2011). Social network analysis: developments, advances, and prospects. Social Network
Analysis and Mining, 1(1), 21–26. doi:10.1007/s13278-010-0012-6
Senge, P. M. (1994). The Fifth Discipline: The Art & Practice of the Learning Organization (1st
ed.). Doubleday Business.
Sessions, R. (2007). Comparison of the top four enterprise architecture methodologies. Retrieved
from http://www.citeulike.org/group/4795/article/4619058
177
Shuman, E. A. (2010). Understanding executable architectures through an examination of
language model elements. In Proceedings of the 2010 Summer Computer Simulation
Conference (pp. 483–497). San Diego, CA, USA: Society for Computer Simulation
International. Retrieved from
http://dl.acm.org.ezproxy.net.ucf.edu/citation.cfm?id=1999416.1999479
Sowa, J., & Zachman, J. (1992). Extending and Formalizing the Framework for Information
Systems Architecture. IBM Systems Journal, 31(3), 590.
Sterman, J. (2000). Business Dynamics: Systems Thinking and Modeling for a Complex World.
Boston: Irwin/McGraw-Hill.
Sterman, J. D. (2001). System Dynamics Modeling. California management review, 43(4), 8–25.
Strauss, A., & Corbin, J. (1994). Grounded theory methodology. Handbook of qualitative
research, 273–285.
Swinerd, C., & McNaught, K. R. (2012). Design classes for hybrid simulations involving agent-
based and system dynamics models. Simulation Modelling Practice and Theory, 25(0),
118–133. doi:10.1016/j.simpat.2011.09.002
Tang, A., Han, J., & Chen, P. (2004). A comparative analysis of architecture frameworks. In
Software Engineering Conference, 2004. 11th Asia-Pacific (pp. 640–647). Retrieved
from http://ieeexplore.ieee.org/xpls/abs_all.jsp?arnumber=1371981
Technical Operations, INCOSE. (2007, September). Systems Engineering Vision 2020.
Retrieved from
http://www.incose.org/ProductsPubs/pdf/SEVision2020_20071003_v2_03.pdf
178
Urbaczewski, L., & Mrdalj, S. (2006). A comparison of enterprise architecture frameworks.
Issues in Information Systems, 7(2), 18–23.
Van Klaveren, P. D., Monsuur, H., Janssen, R. H. P., Schut, M. C., & Eiben, A. E. (2009).
Exploring stable and emergent network topologies. In Proceedings of the 21st Benelux
Conference on Artificial Intelligence, to appear. Retrieved from
http://wwwis.win.tue.nl/bnaic2009/papers/bnaic2009_paper_82.pdf
VanderStoep, S. W., & Johnson, D. D. (2008). Research methods for everyday life: Blending
qualitative and quantitative approaches (Vol. 24). Jossey-Bass. Retrieved from
http://books.google.com/books?hl=en&lr=&id=afnz6c61tewC&oi=fnd&pg=PR5&dq=%
22research+methods+for+everyday+life%22&ots=NcuG6qKUOK&sig=lQebDQJLcVwJ
ANRM5X0CekOBIMg
Vego, M. N. (2006). Effects-Based Operations: A Critique. Retrieved from
http://stinet.dtic.mil/oai/oai?&verb=getRecord&metadataPrefix=html&identifier=ADA52
1851
Wagenhals, L. W., Liles, S. W., & Levis, A. H. (2009). Toward executable architectures to
support evaluation. In International Symposium on Collaborative Technologies and
Systems, 2009. CTS ’09 (pp. 502–511). Presented at the International Symposium on
Collaborative Technologies and Systems, 2009. CTS ’09.
doi:10.1109/CTS.2009.5067520
Wang, W., Tolk, A., & Wang, W. (2009). The levels of conceptual interoperability model:
applying systems engineering principles to M&S. In Proceedings of the 2009 Spring
179
Simulation Multiconference on ZZZ (p. 168). Retrieved from
http://dl.acm.org/citation.cfm?id=1655398
Warden III, J. A. (1995). The enemy as a system. Airpower Journal, 9(1), 40–55.
Wasserman, S., & Faust, K. (1994). Social Network Analysis: Methods and Applications (1st
ed.). Cambridge University Press.
Wolstenholme, E. (2004). Using generic system archetypes to support thinking and modelling.
System Dynamics Review, 20(4), 341–356.
Wolstenholme, E. F. (2003). Towards the definition and use of a core set of archetypal structures
in system dynamics. System Dynamics Review, 19(1), 7–26. doi:10.1002/sdr.259
Yang, C. C., & Sageman, M. (2009). Analysis of Terrorist Social Networks with Fractal Views.
Journal of Information Science, 35(3), 299–320. doi:10.1177/0165551508099089
Yang, T., Chi, Y., Zhu, S., Gong, Y., & Jin, R. (2011). Detecting communities and their
evolutions in dynamic social networks—a Bayesian approach. Machine Learning, 82,
157–189. doi:10.1007/s10994-010-5214-7
Yuasa, T., & Shirayama, S. (2012). A new analysis method for simulations using node
categorizations. Social Network Analysis and Mining, 1–8. doi:10.1007/s13278-012-
0048-x
Zachman, J. (1987). The zachman framework for enterprise architecture. The Zachman Institute
for Framework Advancement,(last opened: 14/12/2004). Retrieved from
http://www.businessrulesgroup.org/BRWG_RFI/ZachmanBookRFIextract.pdf
180
Zachman, J. (2009). The Zachman FrameworkTM Evolution. Retrieved from
http://www.cob.unt.edu/itds/faculty/becker/BCIS5520/Readings/The%20Zachman%20Fr
amework%E2%84%A2%20Evolution.pdf
Zachman, J. A. (1987). A framework for information systems architecture. IBM systems journal,
26(3), 276–292.
Zachman, J. A. (1996). Concepts of the framework for enterprise architecture. Los Angels, CA.
Retrieved from
http://slashdemocracy.org/links/files/Zachman_ConceptsforFrameworkforEA.pdf
Related Documents