Systems Analysis & Design 7 th Edition Chapter 4

Systems Analysis & Design 7 th Edition Chapter 4.
Dec 17, 2015
Welcome message from author
This document is posted to help you gain knowledge. Please leave a comment to let me know what you think about it! Share it to your friends and learn new things together.
Transcript

Systems Analysis & Design
7th Edition
Chapter 4
2
Chapter Objectives
Describe data and process modeling concepts and tools, including data flow diagrams, a data dictionary, and process descriptions
Describe the symbols used in data flow diagrams and explain the rules for their use
Draw data flow diagrams in a sequence, from general to specific
Explain how to level and balance a set of data flow diagrams

3
Chapter Objectives
Describe how a data dictionary is used and what it contains
Use process description tools, including structured English, decision tables, and decision trees
Describe the relationship between logical and physical models
4
Introduction
In chapter 4 & 5, you will develop a logical model of the proposed system and document the system requirements
– Logical model shows what the system must do
– Physical model describes how the system will be constructed

5
Overview of Data and Process Modeling Tools
Systems analysts use many graphical techniques to describe an information system
A data flow diagrams (DFD) uses various symbols to show how the system transforms input data into useful information

6
Data Flow Diagrams
A data flow diagram (DFD) shows how data moves through an information system but does not show program logic or processing steps
A set of DFDs provides a logical model that shows what the system does, not how it does it
7
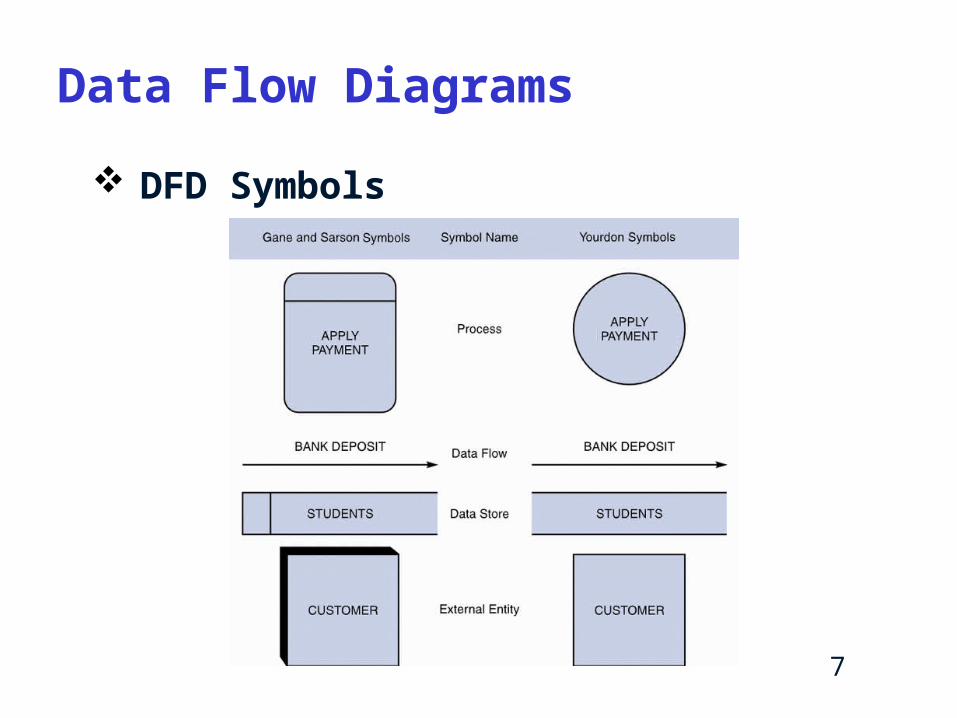
Data Flow Diagrams
DFD Symbols

8
Data Flow Diagrams
DFD Symbols
– Process symbol• Receives input data and produces output that has
a different content, form, or both
• Contain the business logic, also called business rules
• Referred to as a black box
9
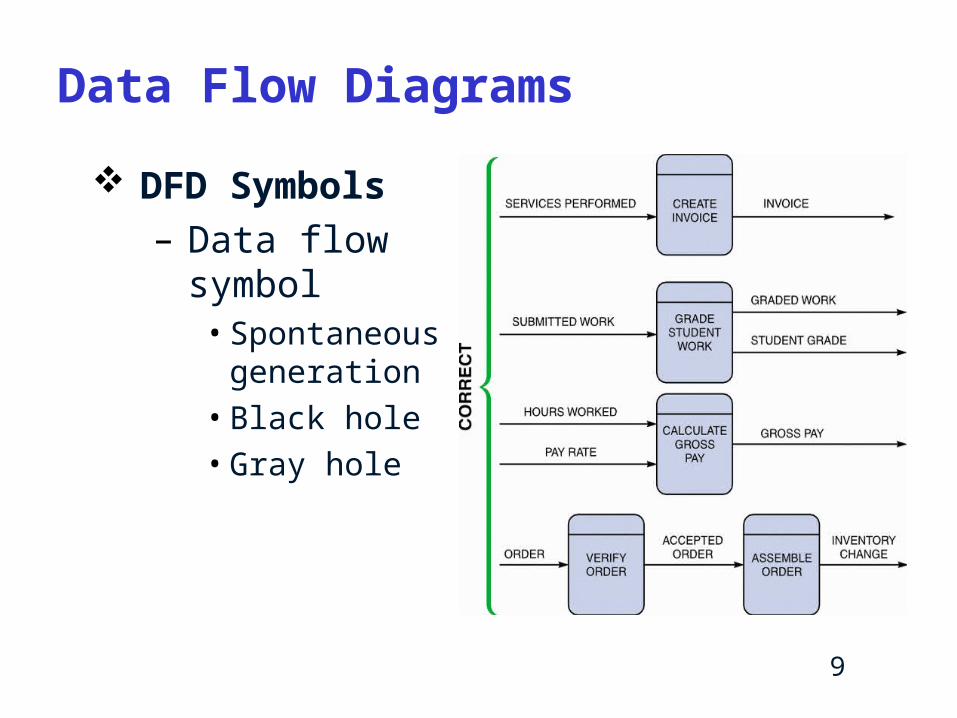
DFD Symbols
– Data flow symbol• Spontaneous
generation
• Black hole
• Gray hole
Data Flow Diagrams

10
Data Flow Diagrams
DFD Symbols
– Data store symbol
11
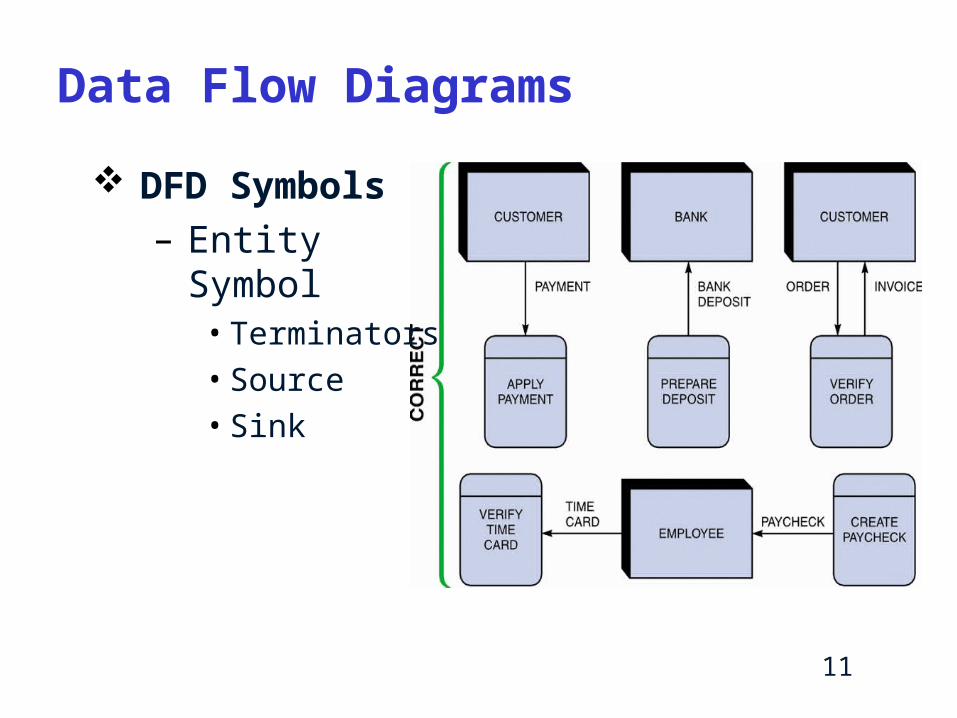
Data Flow Diagrams
DFD Symbols
– Entity Symbol• Terminators
• Source
• Sink

12
Creating a Set of DFDs
Create a graphical model of the information system based on your fact-finding results
Three-step process
– Step 1: Draw a context diagram
– Step 2: Draw a diagram 0 DFD
– Step 3: Draw the lower-level diagrams

13
Creating a Set of DFDs
Guidelines for Drawing DFDs
– Draw the context diagram so that it fits on one page
– Use the name of the information system as the process name in the context diagram
– Use unique names within each set of symbols

14
Creating a Set of DFDs
Guidelines for Drawing DFDs
– Do not cross lines
– Provide a unique name and reference number for each process
– Obtain as much user input and feedback as possible
15
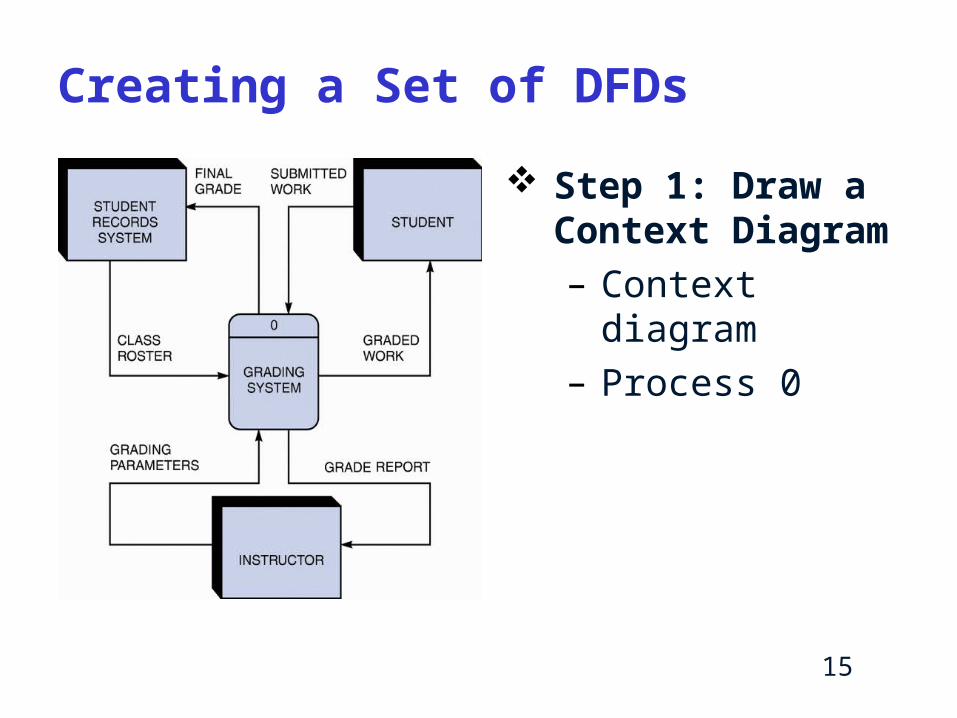
Creating a Set of DFDs
Step 1: Draw a Context Diagram
– Context diagram
– Process 0
16
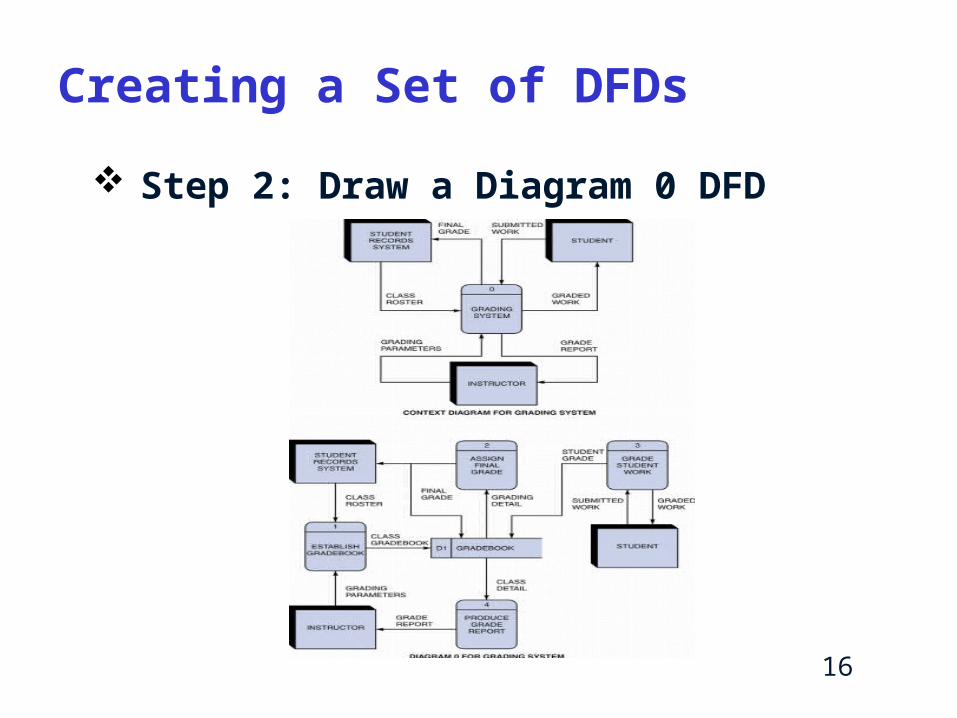
Creating a Set of DFDs
Step 2: Draw a Diagram 0 DFD
17
Creating a Set of DFDs
Step 2: Draw a Diagram 0 DFD
– If same data flows in both directions, you can use a double-headed arrow
– Diagram 0 is an exploded view of process 0
– Parent diagram
– Child diagram
– Functional primitive

18
Creating a Set of DFDs
Step 3: Draw the Lower-Level Diagrams
– Must use leveling and balancing techniques
– Leveling examples• Exploding,
partitioning, or decomposing

19
Creating a Set of DFDs
Step 3: Draw the Lower-Level Diagrams
– Balancing• Ensures that the input and output data flows of
the parent DFD are maintained on the child DFD
20
Data Dictionary
A data dictionary, or data repository, is a central storehouse of information about the system’s data
An analyst uses the data dictionary to collect, document, and organize specific facts about the system
Also defines and describes all data elements and meaningful combinations of data elements

21
Data Dictionary
A data element, also called a data item or field, is the smallest piece of data that has meaning
Data elements are combined into records, also called data structures
A record is a meaningful combination of related data elements that is included in a data flow or retained in a data store

22
Data Dictionary
Documenting the Data Elements
– You must document every data element in the data dictionary
– The objective is the same: to provide clear, comprehensive information about the data and processes that make up the system

23
Data Dictionary
Documenting the Data Elements
– The following attributes usually are recorded and described
• Data element name and label
• Alias
• Type and length
• Default value
• Acceptable values - Domain and validity rules
24
Data Dictionary
Documenting the Data Elements
– The following attributes usually are recorded and described
• Source
• Security
• Responsible user(s)
• Description and comments

25
Data Dictionary
Documenting the Data Flows
– The typical attributes are as follows• Data flow name or label
• Description
• Alternate name(s)
• Origin
• Destination
• Record
• Volume and frequency
26
Data Dictionary
Documenting the Data Stores
– Typical characteristics of a data store are• Data store name or label
• Description
• Alternate name(s)
• Attributes
• Volume and frequency

27
Data Dictionary
Documenting the Processes
– Typical characteristics of a process • Process name or label
• Description
• Process number
• Process description

28
Data Dictionary
Documenting the Entities
– Typical characteristics of an entity include• Entity name
• Description
• Alternate name(s)
• Input data flows
• Output data flows
29
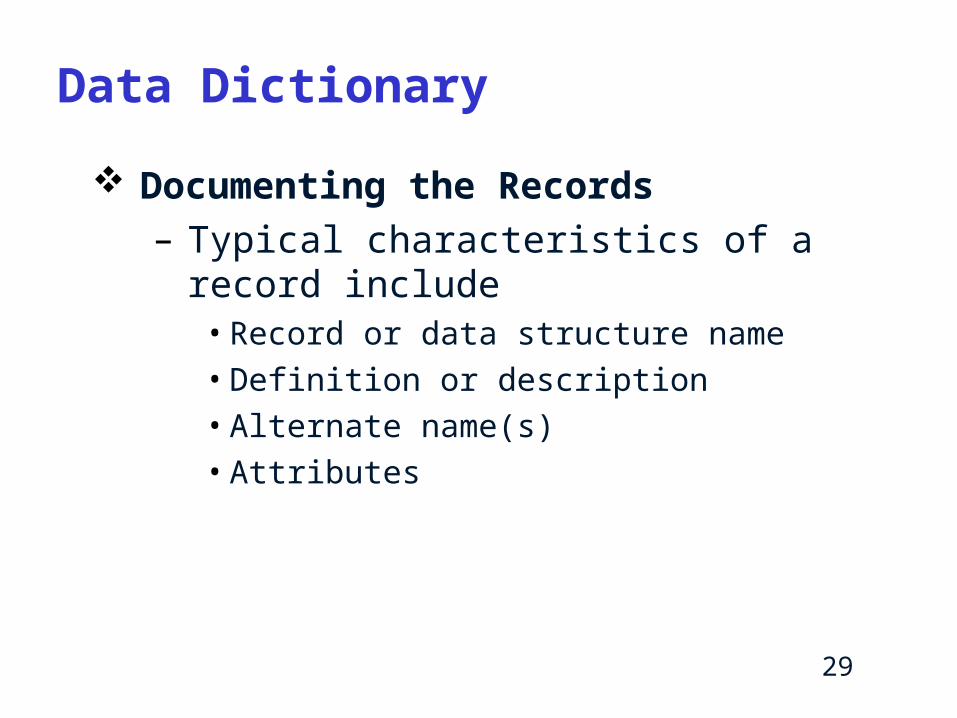
Data Dictionary
Documenting the Records
– Typical characteristics of a record include• Record or data structure name
• Definition or description
• Alternate name(s)
• Attributes

30
Data Dictionary
Data Dictionary Reports
– Many valuable reports• An alphabetized list of all data elements by name
• A report describing each data element and indicating the user or department that is responsible for data entry, updating, or deletion
• A report of all data flows and data stores that use a particular data element
31
Process Description Tools
A process description documents the details of a functional primitive, which represents a specific set of processing steps and business logic

32
Process Description Tools
Modular Design
– Based on combinations of three logical structures, sometimes called control structures which serve as building blocks for the process1. Sequence
2. Selection
3. Iteration - looping
33
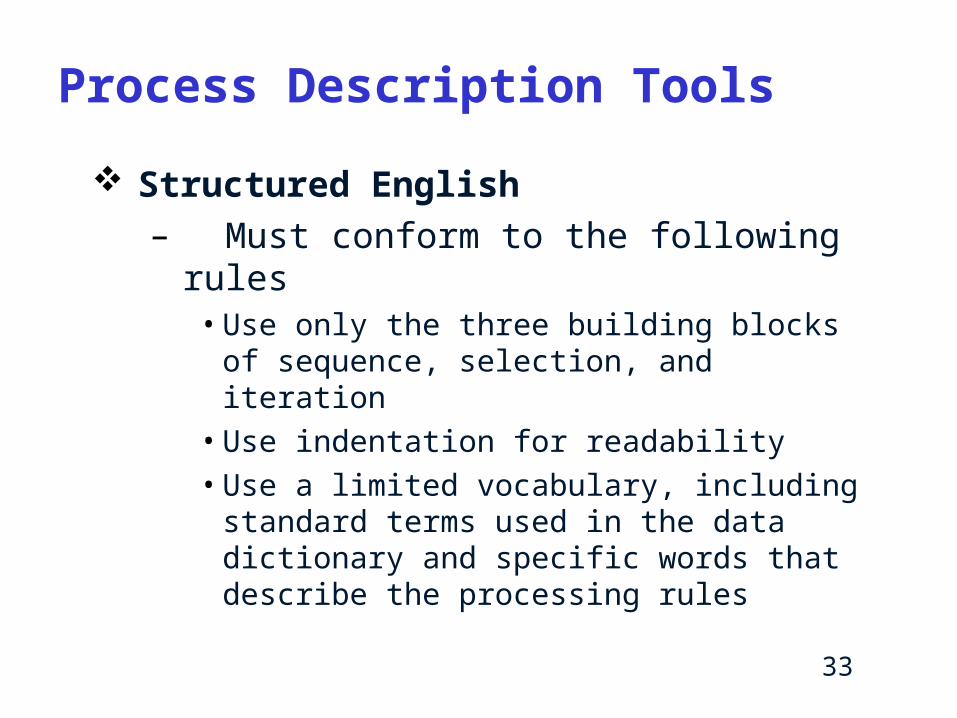
Process Description Tools
Structured English
– Must conform to the following rules• Use only the three building blocks of sequence,
selection, and iteration
• Use indentation for readability
• Use a limited vocabulary, including standard terms used in the data dictionary and specific words that describe the processing rules

34
Process Description Tools
Structured English
– Might look familiar to programming students because it resembles pseudocode

35
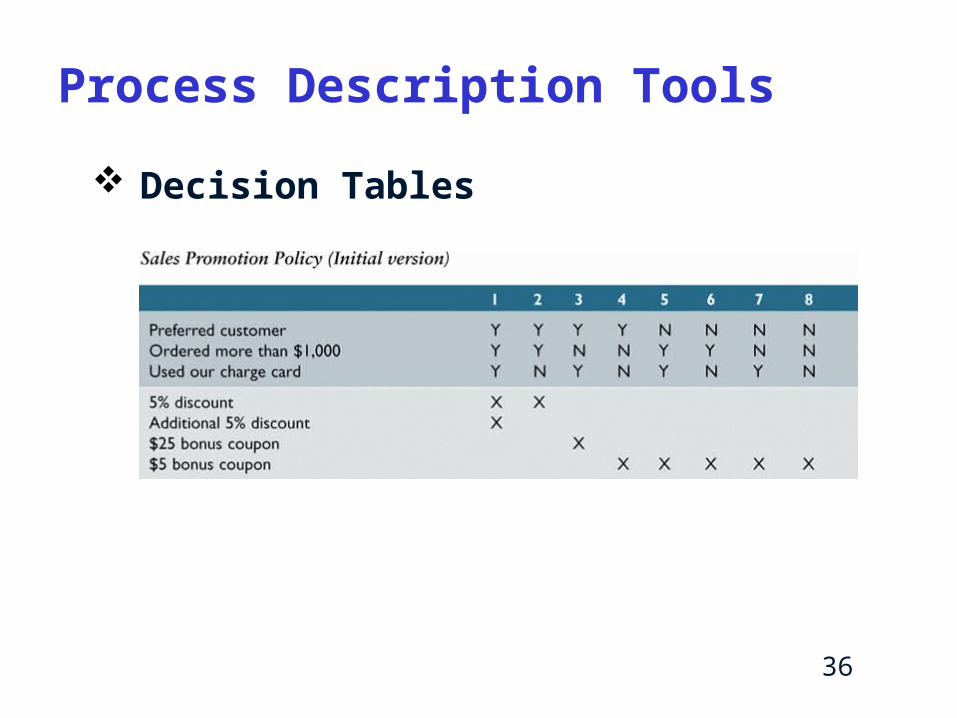
Process Description Tools
Decision Tables
36
Process Description Tools
Decision Tables

37
Process Description Tools
Decision Trees
38
Logical Versus Physical Models
While structured analysis tools are used to develop a logical model for a new information system, such tools also can be used to develop physical models of an information system
A physical model shows how the system’s requirements are implemented

39
Logical Versus Physical Models
Sequence of Models
– Many systems analysts create a physical model of the current system and then develop a logical model of the current system before tackling a logical model of the new system
– Performing that extra step allows them to understand the current system better

40
Logical Versus Physical Models
Four-Model Approach
– Develop a physical model of the current system, a logical model of the current system, a logical model of the new system, and a physical model of the new system
– The only disadvantage of the four-model approach is the added time and cost

41
Chapter Summary
During data and process modeling, a systems analyst develops graphical models to show how the system transforms data into useful information
The end product of data and process modeling is a logical model that will support business operations and meet user needs
Data and process modeling involves three main tools: data flow diagrams, a data dictionary, and process descriptions

42
Chapter Summary
Data flow diagrams (DFDs) graphically show the movement and transformation of data in the information system
DFDs use four symbols A set of DFDs is like a pyramid with the
context diagram at the top
43
Chapter Summary
The data dictionary is the central documentation tool for structured analysis
Each functional primitive process is documented using structured English, decision tables, and decision trees
Structured analysis tools can be used to develop a logical model during one systems analysis phase, and a physical model during the systems design phase

44
Chapter Summary
Chapter 4 Complete
Related Documents