Systematic Regional Planning for Multiple Objective Natural Resource Management A Case Study in the South Australian River Murray Corridor Brett Bryan 1 , Neville Crossman 2 , Tiffany Schultz 3 , Jeff Connor 1 & John Ward 1 1 Policy and Economic Research Unit, CSIRO Land and Water 2 Systematic Conservation Planning Group, University of Adelaide 3 South Australian Department of Water, Land & Biodiversity Conservation Stage 2 Report for the River Murray Dryland Corridor Project CSIRO Land and Water Client Report ISBN 0 643 09196 3 Folio No. S/05/225 April 2005

Welcome message from author
This document is posted to help you gain knowledge. Please leave a comment to let me know what you think about it! Share it to your friends and learn new things together.
Transcript

Systematic Regional Planning for Multiple Objective Natural Resource Management A Case Study in the South Australian River Murray Corridor
Brett Bryan1, Neville Crossman2, Tiffany Schultz3, Jeff Connor1 & John Ward1 1Policy and Economic Research Unit, CSIRO Land and Water
2Systematic Conservation Planning Group, University of Adelaide
3South Australian Department of Water, Land & Biodiversity Conservation
Stage 2 Report for the River Murray Dryland Corridor Project CSIRO Land and Water Client Report ISBN 0 643 09196 3 Folio No. S/05/225 April 2005

Copyright and Disclaimer © 2005 CSIRO To the extent permitted by law, all rights are reserved and no part of this publication covered by copyright may be reproduced or copied in any form or by any means except with the written permission of CSIRO Land and Water.
Important Disclaimer: CSIRO Land and Water advises that the information contained in this publication comprises general statements based on scientific research. The reader is advised and needs to be aware that such information may be incomplete or unable to be used in any specific situation. No reliance or actions must therefore be made on that information without seeking prior expert professional, scientific and technical advice. To the extent permitted by law, CSIRO Land and Water (including its employees and consultants) excludes all liability to any person for any consequences, including but not limited to all losses, damages, costs, expenses and any other compensation, arising directly or indirectly from using this publication (in part or in whole) and any information or material contained in it.

CSIRO Land and Water Page 1
Systematic Regional Planning for Multiple Objective Natural Resource Management A Case Study in the South Australian River Murray Corridor
Brett Bryan1, Neville Crossman2, Tiffany Schultz3, Jeff Connor1 & John Ward1 1Policy and Economic Research Unit, CSIRO Land and Water
2Systematic Conservation Planning Group, University of Adelaide
3South Australian Department of Land, Water & Biodiversity Conservation
Stage 2 Report for the River Murray Dryland Corridor Project CSIRO Land and Water Client Report ISBN 0 643 09196 3 Folio No. S/05/225 March 2005
CSIRO Land and Water Page 2
Table of Contents Table of Contents ..................................................................................................... 2 List of Figures ........................................................................................................... 4 List of Tables............................................................................................................. 8 Acronyms ................................................................................................................ 10 Executive Summary................................................................................................ 11 Acknowledgements ................................................................................................ 27 1. Introduction......................................................................................................... 28 2. Decisions and Multiple Objective NRM............................................................. 32
2.1. Decision Theory..................................................................................................... 32 2.2. Spatial Multi-Criteria Decision Analysis.............................................................. 33 2.3. Integrated Natural Resource Assessment, Modelling and Planning ................ 34
3. Description of the Study Area ........................................................................... 36 4. Resource Condition Targets and NRM Actions in the Corridor ..................... 40
4.1. Salinity.................................................................................................................... 40 4.2. Wind Erosion ......................................................................................................... 42 4.3. Biodiversity ............................................................................................................ 42 4.4. Carbon .................................................................................................................... 43 4.5. Remnant Vegetation Management....................................................................... 45 4.6. Revegetation of Local Native Species................................................................. 47 4.7. Revegetation of Biomass...................................................................................... 47 4.8. Revegetation of Fodder Crops ............................................................................. 48
5. Analysis ............................................................................................................... 50 5.1. Preliminary Analyses and Assembly of Evaluation Criteria Layers ................. 50
5.1.1 Salinity .................................................................................................................................. 50 5.1.1.1 Methods ......................................................................................................................... 51 5.1.1.2 Results and Discussion ................................................................................................. 57
5.1.2 Biodiversity ........................................................................................................................... 63 5.1.2.1 Methods and Results ..................................................................................................... 66
5.1.2.1.1 Vegetation Management Attribute Maps ................................................................ 67 5.1.2.1.2 Revegetation Attribute Maps .................................................................................. 80
5.1.2.2 Costs of Vegetation Management and Revegetation for Biodiversity ........................... 88 5.1.3 Opportunity Costs ................................................................................................................. 92 5.1.4 Biomass ................................................................................................................................ 95
5.1.4.1 Methods ......................................................................................................................... 95 5.1.4.2 Results......................................................................................................................... 102
5.1.4.2.1 Most Likely Scenario ............................................................................................ 102 5.1.4.2.2 Sensitivity Analysis ............................................................................................... 113
5.1.5 Wind Erosion ...................................................................................................................... 120 5.2. Decision Alternatives .......................................................................................... 122 5.3. Criterion Weights................................................................................................. 124 5.4. Decision Rules..................................................................................................... 125

CSIRO Land and Water Page 3
5.4.1 Remnant Vegetation Management .................................................................................... 126 5.4.1.1 Methods....................................................................................................................... 126 5.4.1.2 Results......................................................................................................................... 129
5.4.2 Revegetation for Biodiversity.............................................................................................. 135 5.4.2.1 Methods....................................................................................................................... 135 5.4.2.2 Results......................................................................................................................... 138
5.4.3 Revegetation for Biomass .................................................................................................. 144 5.4.3.1 Methods....................................................................................................................... 144 5.4.3.2 Results......................................................................................................................... 147
6. Key Findings and Policy Implications .............................................................152 6.1. Salinity.................................................................................................................. 152
6.1.1 Key Findings....................................................................................................................... 152 6.1.2 Policy Implications.............................................................................................................. 152
6.2. Biomass ............................................................................................................... 152 6.2.1 Key Findings....................................................................................................................... 152 6.2.2 Policy Implications.............................................................................................................. 153
6.3. Wind Erosion ....................................................................................................... 154 6.3.1 Key Findings....................................................................................................................... 154 6.3.2 Policy Implications.............................................................................................................. 154
6.4. Carbon.................................................................................................................. 154 6.4.1 Key Findings....................................................................................................................... 154 6.4.2 Policy Implications.............................................................................................................. 154
6.5. Vegetation Management for Biodiversity.......................................................... 155 6.5.1 Key Findings....................................................................................................................... 155 6.5.2 Policy Implications.............................................................................................................. 155
6.6. Revegetation for Biodiversity ............................................................................ 156 6.6.1 Key Findings....................................................................................................................... 156 6.6.2 Policy Implications.............................................................................................................. 156
6.7. Revegetation for Biomass .................................................................................. 157 6.7.1 Key Findings....................................................................................................................... 157 6.7.2 Policy Implications.............................................................................................................. 157
7. Policy Options and Design ...............................................................................159 7.1. Invited Tender for NRM Contracts ..................................................................... 159 7.2. NRM Credits......................................................................................................... 160 7.3. Biomass Industry Development......................................................................... 161 7.4. A Policy Mix for NRM .......................................................................................... 162
8. Directions for Future Research........................................................................163 8.1. Extending Systematic Regional Planning......................................................... 163 8.2. Systematic Planning for NRM under Climate Change ..................................... 163 8.3. Linking Systematic Planning with Real Outcomes .......................................... 163
9. Conclusion.........................................................................................................165 10. Appendices ......................................................................................................167
10.1. Appendix 1 ....................................................................................................... 167 11. References .......................................................................................................169

CSIRO Land and Water Page 4
List of Figures Figure 1 – Location map of the South Australian River Murray Corridor. .............................. 36 Figure 2 –River Murray including lower lying floodplain areas (left and foreground) and
dryland Corridor areas above the cliffs to the right (Photo T.E. Schultz 2004)............. 37 Figure 3 – Dryland agricultural landscape near Blanchetown (Photo T.E. Schultz 2004). .... 37 Figure 4 – Irrigated horticulture including grapes in the foreground west of Kingston-on-
Murray (Photo T.E. Schultz 2004). ............................................................................... 38 Figure 5 – Dryland agricultural landscape near Loxton. The removal of deep-rooted perennial
native vegetation and replacement with shallow rooted cereal crops has led to increased groundwater recharge an saline discharge to the River Murray. Farming practices may also increase the exposure of soils to wind erosion. ............................. 41
Figure 6 – Remnant mallee community east of Blanchetown (Photo T.E. Schultz 2004)...... 46 Figure 7 – Remnant grassy chenopod shrubland community east of Swan Reach (Photo T.E.
Schultz 2004)................................................................................................................ 46 Figure 8 – Old Man Saltbush fodder crop plantation near Waikerie (Photo T. E. Schultz
2004)............................................................................................................................. 49 Figure 9 – Salinity benefits of revegetation as output from SIMPACT II in kg/ha/yr. ............. 52 Figure 10 – Salinity benefits of revegetation in 100s of tonnes/cell/day. ............................... 53 Figure 11 – Example of a bent stick function used to estimate the increasing salinity benefits
achieved through revegetation of a grid cell over time. Individual bent stick functions are modelled for each grid cell and may be convex or concave depending on the hydrogeological and geographical disposition of each cell........................................... 54
Figure 12 – Interpolated EC at Morgan conversion coefficient layer derived by DEH from the MDBC BigMod Ready Reckoner data which provides multipliers to convert salinity benefits from 100s of tonnes per day into EC at Morgan at flow rates of <10,000 ML/day. ......................................................................................................................... 55
Figure 13 – Interpolated costs to downstream users conversion coefficient layer derived by DEH from the MDBC BigMod Ready Reckoner data which provides multipliers to convert salinity benefits from 100s of tonnes per day into $1,000s of dollars per year in downstream costs at flow rates of <10,000 ML/day. .................................................... 56
Figure 14 – Relationship between salinity benefits in EC at Morgan after 100 years achieved through revegetation, area of revegetation, and total present value of costs of salinity to downstream users avoided by revegetation. Grid cells are ranked from highest to lowest salinity benefit. Most of the benefit comes from an area of around 10,000 hectares. ....................................................................................................................... 59
Figure 15 – Salinity benefits from revegetation in units of ECs at Morgan after 100 years. .. 60 Figure 16 – Total present value of costs of salinity to downstream users avoided by
revegetation in present value terms over a timeframe of 100 years............................. 61 Figure 17 – Spatial distribution of the 10,000 ha of land in the Corridor that has the highest
cost to downstream users avoided by revegetation. This layer is used in MCDA. ....... 62 Figure 18 – Area of remnant vegetation patches in the study area classified into 5 classes
with largest patches having the lowest cost score (1) and smallest patches having the highest cost score (5). Hence, in MCDA the algorithm will prefer larger patches over smaller for vegetation management as it tries to minimise costs. ................................ 68
CSIRO Land and Water Page 5
Figure 19 – Shape index of remnant vegetation patches in the study area classified into 5 cost scores with patches of simplest shape having the lowest cost scores (1) and patches of most complex shape having the highest cost scores (5). Hence, in MCDA the algorithm will prefer more simply shaped patches over more complex shapes for vegetation management. .............................................................................................. 69
Figure 20 – Fragmentation of remnant vegetation grid cells in the study area classified into 4 classes with cells whose neighbourhood is intact (>90% of land in 5km radius is vegetated) having the lowest cost score (1) and cells whose neighbourhood is relictual (<10% of land in 5km radius is vegetated) having the highest cost score (4). Hence, in MCDA the algorithm will prefer intact cells for vegetation management. ..................... 70
Figure 21 – Habitat quality of remnant vegetation patches in the study area. This attribute is the distance of each vegetated grid cell to the nearest patch edge linearly rescaled to continuous values between 1 and 5 with vegetated cells furthest from the patch edge having the lowest cost score (1) and cells closest to the patch edge having the highest cost score (5). Hence, in MCDA the algorithm will prefer cells further from the patch edge over those closer to the edge for vegetation management. ................................ 71
Figure 22 – Remnant vegetation communities types in the Corridor. There are too many communities to clearly distinguish but this map provides an appreciation of the spatial complexity of community distribution. The MCDA will select cells for vegetation management that include a percentage of each vegetation community. ..................... 75
Figure 23 – Mean annual precipitation. Note that class breaks are selected based on the entire SA MDB and some classes may not occur in the Corridor................................. 76
Figure 24 – Mean annual temperature. Note that class breaks are selected based on the entire SA MDB and some classes may not occur in the Corridor................................. 77
Figure 25 – Climate zones occurring in the Corridor. The MCDA will include a representative proportion of each climate zone in selecting cells for vegetation management. .......... 78
Figure 26 – Maps of the spatial distribution of significant species habitat in the Corridor. .... 80 Figure 27 – Landscape context. Distance from dryland non-vegetated cells to the nearest
vegetated cell linearly rescaled to values between 1 and 5. ........................................ 82 Figure 28 – Fragmentation status of dryland non-vegetated cells. Derived from the
percentage of the area of remnant vegetation occurring within a 5km radius of each cell and classified based on the McIntyre and Hobbs (1999) schema for classifying landscape fragmentation. ............................................................................................. 83
Figure 29 – Distribution of pre-European vegetation communities in the Corridor as mapped by DEH. Note: there are too many classes to be clearly represented at this scale but the complexity of spatial distribution is evident............................................................. 86
Figure 30 – Distribution of Soil Land Systems in the Corridor as mapped by PIRSA. Note: there are too many classes to be clearly represented at this scale but the complexity of spatial distribution is evident. ....................................................................................... 88
Figure 31 – Dryland agricultural land use in the Corridor. ..................................................... 93 Figure 32 – Opportunity costs in the Corridor based on land use, climate and estimated gross
margin values. Note that 7 classes are used in this map to aid visual interpretation. Costs scores are continuously valued between 1 and 5. ............................................. 94
Figure 33 – Agricultural production schedule and cash flow for Eucalyptus oleosa grown for biomass. ....................................................................................................................... 96
Figure 34 – Stemwood productivity of Eucalyptus oleosa in the Corridor downscaled from Bennell et al. (2004). .................................................................................................... 97

CSIRO Land and Water Page 6
Figure 35 – Spatial distribution of transport costs ($/tonne) for the Corridor based on the price of $0.046/tonne/km. ........................................................................................... 100
Figure 36 – Annual green biomass productivity (tonnes) for the Corridor from second and subsequent harvests................................................................................................... 103
Figure 37 – Present value of harvest costs ($) for the Corridor based on the value of $12/ tonne and 7% discount rate calculated over 100 years. ............................................. 104
Figure 38 – Present value of opportunity costs ($) for the Corridor based on Figure 32 and a 7% discount rate calculated over 100 years. .............................................................. 105
Figure 39 – Present value of total transport costs ($) for the Corridor based on a transport cost of $0.046/t/km and a 7% discount rate calculated over 100 years...................... 106
Figure 40 – Present value of total costs of biomass production ($) for the Corridor based on a 7% discount rate calculated over 100 years. .............................................................. 107
Figure 41 – Present value of total revenue from biomass production ($) per cell for the Corridor based on a 7% discount rate calculated over 100 years. ............................. 108
Figure 42 – Net present value of biomass production ($) per cell for the Corridor based on a 7% discount rate calculated over 100 years. .............................................................. 109
Figure 43 – Modified Internal Rate of Return from biomass production ($) for the Corridor based on a 7% discount rate calculated over 100 years. ........................................... 110
Figure 44 – Equal Annual Equivalent returns from biomass production ($) per cell for the Corridor based on a 7% discount rate calculated over 100 years. ............................. 111
Figure 45 – Location of viable areas for biomass production in the Corridor based on a factory gate price of $30 per green tonne................................................................... 112
Figure 46 – Cash flow for biomass production of four sites with different economic and production characteristics at a discount rate of 7%. ................................................... 113
Figure 47 – Mean, lower and upper 95% confidence intervals of Net Present Value of biomass production summarised for 1,000 model runs at each discount rates of 0%, 3%, 6%, and 9%. ........................................................................................................ 115
Figure 48 – Relationship between the mean Net Present Value of biomass production for all dryland non-vegetated grid cells and cost parameters calculated over 1,000 iterations, at a discount rate of 7%, and over a time horizon of 20 years.................................... 116
Figure 49 – Relationship between the mean Net Present Value of biomass production for all dryland non-vegetated grid cells and revenue parameters of productivity and price calculated over 1,000 iterations, at a discount rate of 7%, and over a time horizon of 20 years. .......................................................................................................................... 117
Figure 50 – Supply curves for biomass production at discount rates of 0% and 9%. .......... 117 Figure 51 –Price per tonne vs. NPV of returns for biomass at discount rates of 0% and 9%.
.................................................................................................................................... 118 Figure 52 – Risk of non-viability of biomass production based on the range of parameter
values tested and calculated at a discount rate of 7%. Green areas denote lower risk..................................................................................................................................... 119
Figure 53 – Wind erosion potential and long term eroding areas in the Corridor. The cross-hatched area north of the River Murray represents the areas of unmapped wind erosion potential. ..................................................................................................................... 121
Figure 54 – Private and public land tenure. ......................................................................... 123 Figure 55 – Protected areas and conservation status. ........................................................ 124
CSIRO Land and Water Page 7
Figure 56 – Geographic priorities for Vegetation Management in the Corridor identified by Models 1-3.................................................................................................................. 131
Figure 57 – Geographic priorities for vegetation management identified by Model 4. The insets zoom in on four areas of interest that display the relationship between areas selected for vegetation management, existing remnant vegetation and existing protected/managed areas. ......................................................................................... 134
Figure 58 – Geographic priorities for revegetation in the Corridor identified by Models 1-4.141 Figure 59 – Geographic priorities for revegetation in the Corridor identified by Model 5. The
insets zoom in on 4 areas of interest where Model 5 has identified grid cells for revegetation that buffer, infill and link existing remnants............................................ 143
Figure 60 – Geographic priorities for biomass production concentrated in the north-east of the Corridor identified by Models 1-3. ........................................................................ 148
Figure 61 – Geographic priorities for biomass production in the Corridor identified by Model 4. Sites identified in Inset 1 are mostly suitable except some areas of native vegetation and a golf course. Inset 2 displays sites that are again mostly suitable but also some irrigated land not classified as irrigated in the Crops2003 database. Inset 3 displays sites selected that are mostly suitable but includes some native vegetation not mapped as such by DEH. Inset 4 displays sites selected adjacent to an irrigated area and on the edge of the flood plain which would be very beneficial for salinity mitigation. ...... 151
CSIRO Land and Water Page 8
List of Tables Table 1 – Decision matrix for a MADM problem. xij , score for the ith alternative (i = 1, 2,…,m)
with respect to the jth attribute (j = 1, 2,…,n) (Source Malczewski 1999)...................... 33 Table 2 – Resource conditions and natural resource management actions and their linkages.
...................................................................................................................................... 40 Table 3 – Biodiversity layers generated as attributes and used as either constraints or in the
objective function in the MCDA for both vegetation management and revegetation. Attributes used as constraints are followed by the number of classes in brackets. Objective function attributes are continuously scaled between 1 and 4 or 5. ............... 67
Table 4 – Area classification and prioritisation of remnant vegetation patches. .................... 67 Table 5 – Shape classification and prioritisation of remnant vegetation patches. ................. 69 Table 6 – Landscape context classification based on the McIntyre and Hobbs (2000)
schema. ........................................................................................................................ 70 Table 7 – Vegetation communities in the Corridor as classified and mapped by DEH.......... 74 Table 8 – Mean annual precipitation and mean annual temperature classes based on data
for the whole SA MDB INRM region used to construct climatic domains for use as a biodiversity attribute in MCDA. ..................................................................................... 76
Table 9 – Climate domain classes occurring in the Corridor including area of each domain and precipitation and temperature range...................................................................... 77
Table 10 – List of 21 significant fauna species for which the spatial extent of habitat has been estimated and mapped in the SA MDB INRM region. The 11 significant species occurring in the Corridor are in bold. ............................................................................ 79
Table 11 – Fragmentation classes in the dryland areas of the Corridor. ............................... 83 Table 12 – Pre-European vegetation communities mapped by DEH in the mallee areas of the
Corridor......................................................................................................................... 85 Table 13 – Area of the 60 Soil Land Systems occurring in the dryland areas of the Corridor.
The Land System code refers to PIRSA mapping codes. The area of unknown Soil Land System is 80,180 ha. ........................................................................................... 87
Table 14 - Estimates of costs of fencing per linear metre. Source (Coopers Rural and Hardware Supply, pers. comm., 2005; David Hein, Trees for Life, pers. comm., 2005; Mitchell Fencing, pers. comm., 2005)........................................................................... 89
Table 15 - Estimates of costs of revegetation activities. Source (David Hein, Trees for Life, pers. comm. 2005)........................................................................................................ 90
Table 16 – Upper and lower estimates of the cost of weed control activities for areas of different levels of weed infestation and ecosystem disturbance from clearance or grazing. Costs are inclusive of materials and labour. Source (Riverland Animal and Plant Control Board, pers. comm. 2005, Tony Golder, Spray Contractor, pers. comm., 2005)............................................................................................................................. 91
Table 17 - Estimates of the costs of vegetation management per hectare for areas of different levels of weed infestation and ecosystem disturbance from clearance or grazing. ......................................................................................................................... 91
Table 18 - Estimates of the cost of undertaking revegetation per hectare............................. 92 Table 19 – Multipliers for adjusting the costs of transport of biomass over different surfaces.
...................................................................................................................................... 99
CSIRO Land and Water Page 9
Table 20 – Model parameters and parameter ranges for economic analysis and sensitivity analysis of biomass (Note: t = green tonnes of biomass). The Most Likely Values are used in the Most Likely Scenario and the Value Ranges specify the range of values used in the sensitivity analysis. .................................................................................. 102
Table 21 – Mean grid cell values for each statistical grid (mean, -95% and +95% confidence intervals) for each economic measure (NPV, MIRR, EAE) calculated over 1,000 runs at each discount rate (0, 3, 6, 9%). ................................................................................ 114
Table 22 – Wind erosion potential classification for use in MCDA. Note that the DWLBC Soil Mapping Classes are the inverse of this. ................................................................... 121
Table 23 – Description of the layers used in setting geographic priorities for vegetation management in MCDA. .............................................................................................. 126
Table 24 – Baseline information about the conservation status and land tenure for comparison with MCDA model outputs for vegetation management.......................... 129
Table 25 – Post planning indicators of the four models assessed in this study................... 130 Table 26 – Representativeness of Vegetation Communities, Climate Zones and Significant
Species Habitat of existing managed/protected remnant vegetation (Before) and after implementation of Model 4. Model 4 includes the representativeness targets as do Models 2 and 3........................................................................................................... 133
Table 27 – Description of the layers used in setting geographic priorities for revegetation for biodiversity in MCDA. ................................................................................................. 135
Table 28 – Level of representation of Pre-European Vegetation Communities, Climate Zones and Soil Land Systems by existing remnant vegetation (Before) and by remnant vegetation and revegetation after Model 5. Model 5 includes the representativeness targets as do Models 2, 3 and 4 which display similar levels of representation of biophysical features.................................................................................................... 139
Table 29 – Post planning indicators of the five revegetation models assessed in this study.................................................................................................................................... 140
Table 30 – Description of the layers used in setting geographic priorities for revegetation for biodiversity in MCDA. ................................................................................................. 144
Table 31 – Post planning indicators of the five revegetation models assessed in this study.................................................................................................................................... 147
Table 32 – Proportions (%) of Pre-European Vegetation Communities, Climate Domains and Soil Land Systems not covered by biomass production for Model 1 and Model 4 and therefore able to be represented by native vegetation. Model 4 has the biodiversity constraint but it has little effect as the straight profit maximising Model 1 does not preclude options for revegetation for biodiversity in the Corridor. .............................. 149

CSIRO Land and Water Page 10
Acronyms ALUMC – Australian Land Use and Mapping Classification
DEH – South Australian Department of Environment and Heritage
DWLBC – Department of Water, Land and Biodiversity Conservation
EAE – Equal Annual Equivalent
EC – Electrical Conductivity units (µS/cm)
EPBC – Environmental Protection and Biodiversity Conservation
GAMS – General Algebraic Modelling System
GIS – Geographic Information Systems
GM – Gross Margin
INRM – Integrated Natural Resource Management
ITP – Integrated Tree Processing
LAP – Local Action Planning
LSCP – Location Set Covering Problem
LTE – Long-Term Eroding
MADM – Multiple Attribute Decision Making
MCDA – Multi-Criteria Decision Analysis
MCLP – Maximal Covering Location Problem
MDD – Murray-Darling Depression
MIRR – Modified Internal Rate of Return
ML – Megalitre (106 litres)
MODM – Multiple Objective Decision Making
MW – Megawatt (106 Watts)
NAP - National Action Plan for Salinity and Water Quality
NHT – Natural Heritage Trust
NPV – Net Present Value
NPWS – National Parks and Wildlife Service
NRM – Natural Resource Management
PIRSA – Department of Primary Industries and Resources of South Australia
RCT – Resource Condition Target
RMCWMB – River Murray Catchment Water Management Board
SA MDB – South Australian Murray-Darling Basin
SCP – Systematic Conservation Planning
SLS – Soil Land System
SRP – Systematic Regional Planning
UNESCO – United Nations Educational, Scientific and Cultural Organisation
CSIRO Land and Water Page 11
Executive Summary
Introduction Agricultural production has facilitated the economic and social development of many regions in Australia and elsewhere, often at the significant public cost of widespread land, water and biological degradation. To ensure the sustainability of the environmental, economic and social systems in these regions, complex decisions have to be made about the nature and location of the natural resource management actions required to mitigate and reverse multiple natural resource management objectives. The concept of systematic regional planning (SRP) for natural resource management (NRM) as developed in the context of the South Australian River Murray Corridor (the Corridor) provides a structured and quantitative approach to the analysis of complex natural resource management decisions.
In the Corridor, the large scale clearance of deep-rooted native vegetation for agriculture and the grazing of remnant vegetation by livestock have led to the degradation of the native biodiversity, an increase in groundwater recharge and river salinity, and increased soil wind erosion (INRM Group 2003a). Regional targets have been set to address these multiple natural resource management objectives (INRM Group 2003c). Carbon sequestration is also discussed as another NRM objective in the Corridor.
The aim of this study is to assess the feasibility of different policy options for encouraging the large scale NRM actions required for achieving stated regional resource condition targets for NRM. To achieve this, the concept of systematic regional planning is developed to identify geographic priorities for NRM actions that most cost effectively meet multiple-objective regional targets based on established biophysical and economic principles. Systematic regional planning also involves the estimation of the cost of meeting regional targets and suggests policy instruments, especially market-based instruments that will provide the greatest chance that the targets will be met.
In this study we concentrate on three main NRM actions – vegetation management, revegetation of local native species and revegetation of biomass species. Note that the term vegetation management involves managing vegetation for biodiversity conservation values. Biomass provides a market-based incentive for encouraging large scale revegetation with associated NRM benefits. Fodder crops are also discussed as a potential NRM action.
For the purposes of this study, these three NRM actions address NRM objectives of salinity, biodiversity, wind erosion and carbon sequestration. Vegetation management and revegetation of local native species can address all four NRM objectives of biodiversity, salinity, wind erosion and carbon sequestration. Biomass can address salinity, wind erosion and carbon. Fodder are considered to address salinity and wind erosion targets only.
Systematic regional planning is a process based on decision theory and implemented within a spatial Multi-Criteria Decision Analysis framework. The MCDA framework involves 7 stages including problem definition, assembly of the evaluation criteria data layers, identification of the decision variables, specification of the criterion weights, formulation of the decision rules, conducting sensitivity analysis, and making recommendations:
1. The decision problem involves the selection of geographic priority locations for vegetation management and revegetation of local native species and biomass that most cost effectively achieve multiple natural resource management objectives.
2. Assembly of evaluation criteria data layers includes using a variety of spatial modelling techniques based on established biophysical and planning principles to create a series of GIS layers. The foundation data structure is based on raster GIS where the Corridor study area is tessellated into 188,655 x 254 m resolution (approximately 6.5 ha) grid cells. Creation of each of these layers involves distinct
CSIRO Land and Water Page 12
GIS-based methods and the results of these individual analyses have policy implications. The analyses include the quantification of the spatial distribution of:
• Salinity benefit to the River Murray achieved through revegetation using the SIMPACT salinity model
• Biodiversity priorities for both vegetation management and revegetation using established systematic conservation planning principles including costing these actions
• Opportunity costs of agriculture based on land use data
• Economic viability of biomass production including a full sensitivity analysis
• Soil wind erosion potential and long term eroding areas
3. The decision variables are grid cells and the decision to be made is which grid cells should be subject to which NRM action to most cost effectively reach regional NRM targets
4. Criterion weights are not used to manipulate the influence of specific attributes but weights are incorporated into the models for future modification
5. The decision rules use spatial optimisation to identify geographic priorities for the NRM actions of vegetation management and revegetation of local native species such that resource condition targets are met at minimum cost. Decision rules for biomass aim to identify cells for biomass production that meet production and NRM targets and maximise the economic returns.
6. Outputs from MCDA quantify the spatial distribution of priority NRM actions in the Corridor. Multiple models of increasing planning sophistication provide flexibility for the decision maker and quantify the costs of meeting NRM targets in the Corridor. Outputs are used to assess and discuss the feasibility of meeting resource condition targets
7. Policy options for encouraging large scale NRM actions in the Corridor are outlined and the best options are discussed in the context of the economic, environmental, social, and institutional outcomes.
Preliminary Analyses and Assembly of Evaluation Criteria Layers A number of analyses are conducted to provide essential input into the spatial MCDA in systematic regional planning. Many of these analyses involve the creation of spatial data layers used later as attributes in MCDA. These are described below:
Salinity
Methods The quantity and costs of salinity benefit to the River Murray achieved through revegetation of deep rooted perennials are calculated based on the latest model outputs from SIMPACT that characterise the total salinity benefit for the River Murray from revegetating dryland areas in kg/ha/yr. These are converted to units of Electrical Conductivity (EC) at Morgan (µS/cm) and the costs of salinity to downstream users avoided by revegetation is calculated at a flow rate of 10,000 ML/day using the Murray-Darling Basin Commission’s (MDBC) Ready Reckoner. Avoided costs are calculated in present value terms over a timeframe of 100 years using a discount rate of 3%. The magnitude of the effect of revegetation in dryland

CSIRO Land and Water Page 13
areas on river salinity levels is reassessed and geographic priorities are identified for revegetation to contribute to salinity resource condition targets for NRM.
Key Findings
• The total salinity contribution from the dryland areas of the Corridor in 100 years has been estimated to be around 30 EC at Morgan (Barnett and Yan 2004). However, the salinity benefits achieved through revegetation as modelled by SIMPACT over a 100 year time frame is 1.96 EC at Morgan after 50 years and 4.14 EC at Morgan. This is considered to be a conservative estimate and research is required to improve this estimate.
• Based on these estimates the total cost to downstream users of river salinity avoided by revegetation in the dryland areas of the Corridor is just over $3.15 Million in present value terms over 100 years.
• Most of the salinity benefits can be achieved by revegetating an area of 10,000 ha.
Policy Implications The modelled river salinity benefits and the associated costs to downstream users avoided by revegetation in the dryland areas of the Corridor are low. They also occur well into the future and hence, are heavily discounted in economic analyses. Conversely, the costs involved in revegetation and the opportunity costs are high and immediate. Hence, based on these estimates, the implementation of a scheme that encourages revegetation for salinity alone is not a cost effective policy option for the Corridor. The integration of salinity credits into integrated NRM policies could however, complement other incentives for landholders to undertake NRM actions. The cost of salinity to downstream users may provide a suitable guide as to the appropriate level of payment for salinity credits in the Corridor.
Salinity mitigation has potential to be an economic driver of NRM actions in the Corridor. More accurate estimates of the salinity benefit of revegetation are required. Revegetation policy for salinity benefits needs to be specifically targeted to encourage revegetation in the high salinity benefit areas.
Biodiversity
The conservation of biodiversity is a high priority in regional NRM (Kahrimanis et al. 2001). Resource condition targets specified for terrestrial biodiversity in the Investment Strategy (INRM Group 2000c) specify that 50% of remnant vegetation on private land should be managed and that the area of native vegetation should be increased by 1%. However, if these large scale NRM actions are not targeted in high priority biodiversity areas they will not be maximally effective at conserving biodiversity. Targeting high priority areas needs planning.
Systematic conservation planning principles (Margules and Pressey 2000) underlie geographic priority setting for both vegetation management and revegetation for biodiversity. A series of data layers have been created for setting geographic priorities for both remnant vegetation management and revegetation for biodiversity for input into MCDA including a suite of layers produced by Crossman et al. (2004):
Vegetation Management Revegetation Patch Area Landscape Context Patch Shape Fragmentation Fragmentation Pre-European Vegetation Communities Habitat Quality Climate Zones Vegetation Communities Soil Land Systems Climate Zones Rare and Threatened Species Habitat
CSIRO Land and Water Page 14
Costs of Vegetation Management and Revegetation for Biodiversity
The cost of undertaking NRM actions is highly variable from one location to another due to the heterogeneous nature of the physical and biological environments of the Corridor. The NRM actions of vegetation management and revegetation have three major components – fencing, revegetation and weed management. Fencing costs vary according to the types of fence required and the substrate. Revegetation costs vary according to the method used which include tube stock planting, direct seeding and natural regeneration. Weed management costs vary according to the level of disturbance of the vegetation and the level of infestation. Low and high estimates of the average cost for both vegetation management and revegetation are put at $500 - $3,000 per hectare in the Corridor. These figures are used to estimate the total costs of meeting regional resource condition targets.
Carbon
Assessment of the economic potential of carbon trading in this study was limited to initial estimates based on indicative figures because at the time when the research was conducted the carbon market was not sufficiently developed to justify a full analysis. By the time of writing the report, the price of carbon on the European market had doubled and higher estimates of carbon productivity in the Corridor were published (Hobbs and Bennell 2005). We now consider that carbon trading has considerable potential as an economic driver of large scale NRM.
Key Findings
• Given recent empirical productivity estimates (Hobbs and Bennell 2005), trading the carbon produced by revegetation in the Corridor could produce annual returns between $50 and $105 per hectare which is comparable to current agriculture.
• It is possible that vegetation management activities could attract carbon credits.
• Revegetation of local native species for biodiversity is ideally suited for carbon trading and the restored native community not only has multiple NRM benefits but an income may also be generated from carbon trading.
• Revegetation of fodder crops such as saltbush is unlikely to attract substantial carbon credits because of the low productivity of the species.
• Biomass species are also suited for attracting carbon credits and there may be 2 options for carbon accounting of biomass species. Although they are harvested periodically and burned, the carbon stored in the woody lignotuber may be counted. The other option is that the carbon emissions avoided by producing clean electricity may be counted. This is around $1,375,000 per annum in carbon credits at current prices from a single 5MW ITP plant.
Policy Implications The carbon market is developing rapidly. Initial estimates suggest that current carbon trading prices are sufficient to provide farmers a viable income source to support revegetation and possibly vegetation management in the Corridor. Market-based policy may involve either integrating carbon credits within other NRM schemes or creating a stand alone carbon program similar to the Victorian CarbonTender program.
Although the current economic returns from carbon trading in the Corridor may potentially be economically viable, barriers to trade from Australia’s non-participation in the Kyoto protocol and market uncertainty obstruct the widespread land use change in the Corridor. If these can be overcome, carbon trading has the potential to provide additional incentives for participation in other programs such as biomass production. Carbon trading may also have

CSIRO Land and Water Page 15
the potential to become a stand alone economic driver for widespread land use change. Carbon provides an ideal incentive for encouraging the revegetation and restoration of native habitat which has NRM benefits for biodiversity, salinity and wind erosion.
Any stand alone carbon trading program needs to offset both the cash flow problem and the uncertainty involved in the carbon market. This can be done by tendering for carbon contracts where the government pays the landholder upfront for the first few years carbon production which may be paid back by the landholder from selling the carbon at a later date on the market. After that the landholder is free to trade the carbon on the open market. This involves some risk to both parties and speculation on the price of carbon.
Opportunity Costs
Opportunity costs are the cost of foregone income from agricultural land uses such as grazing and cereal cropping and are calculated based on the current value of agricultural production. The spatial distribution of dryland agriculture was quantified and mapped using catchment scale land use and based on average gross margin figures for 5 categories of dryland land use: Cereals; Grazing; Hay & Silage; Legumes; and Other Minimal Use. Gross margin figures were adjusted according to rainfall as modelled using BIOCLIM.
Opportunity costs of dryland agriculture as modelled in this study range from $7.83/ha to $199.00 per hectare with a mean of $46.53 and the total opportunity costs to agriculture in the Corridor is $29.25 Million per year. A layer of opportunity costs is used as an attribute in the MCDA to identify the least expensive locations for NRM actions.
Biomass
Biomass production involves monoculture plantings of E. oleosa harvested initially after a 6-year establishment period followed by three-yearly harvests. In full production, the ITP plant needs a constant supply of 100,000 green tonnes of biomass each year. The crops require minimal annual maintenance and fertilisation following harvest. Economic returns to biomass production depend on the production of the site and the price per tonne of biomass. The costs of biomass production include establishment costs, maintenance costs, harvest costs, fertiliser costs, opportunity costs, and transport costs. Different costs occur at different times in the production schedule. The location selected for establishment of the ITP is Kingston-on-Murray because of the plentiful supply of land nearby and the situation in the heart of the areas providing the greatest salinity benefits from revegetation.
Economic models are built in GIS using layers describing biomass productivity, opportunity costs, travel costs and the scalar parameters of harvest costs, maintenance costs and fertiliser costs. The economic measures of Net Present Value (NPV), Modified Internal Rate of Return (MIRR) and Equal Annual Equivalent (EAE) are calculated to quantify the costs and returns to biomass occurring at irregular intervals using discounting to account for time preference. The economic assessment is conducted in two phases. First, the Most Likely Scenario performs a single analysis of the profitability of biomass production using the most likely parameter values over a 100 year time period. The biomass productivity and Net Present Value layers from the Most Likely Scenario are used as attributes in MCDA. Second, a sensitivity analysis conducted using Monte Carlo techniques quantifies the effects of parameter uncertainty on the economic potential of biomass. The risk layer from the sensitivity analysis is used as an attribute in MCDA.
Key Findings
• Biomass production for supplying an Integrated Tree Processing (ITP) plant is very likely to be as profitable as, or more profitable than, existing agriculture in the Corridor. Under the Most Likely Scenario (time frame of 100 years and discount rate of 7%) the total net present value of biomass production for each 6.4 ha grid cell

CSIRO Land and Water Page 16
ranges between $5,000 less, to $25,000 more, than returns from existing agriculture with an average NPV of $7,168. The Modified Internal Rate of Return ranges between 6.8% and 7.7% and the Equal Annual Equivalent payments range from -$54 to $271 per year per grid cell or -$8.37/ha/yr to $42/ha/yr. The total potentially viable area for biomass production is 625,231 ha or 99.6% of the dryland area of the Corridor. The potential tonnage of green biomass supplied by the economically viable area (490 million tonnes per annum) far exceeds the production required to supply an ITP plant (100,000 tonnes per annum).
• The most profitable locations for biomass production were found to be interspersed with existing irrigation areas. Biomass production in these areas may also have synergistic salinity benefits in lowering water tables and reducing recharge whilst at the same time increasing biomass production through soil water mining. The synergies between biomass and irrigation in the Corridor should be investigated further.
• Cash flow is a problem for production of biomass as farmers do not register a positive cash flow for at least 7 years. Biomass production may take much longer than this to return a positive net cash flow for the farmer depending on site characteristics.
• Sensitivity analysis shows that no parts of the Corridor are profitable under all possible parameter values. Under average conditions many parts of the Corridor are viable for biomass production but some are not. An optimistic view of biomass production which assumes low costs and high prices and productivities would state that all areas have the potential to be viable and some areas have the potential to be considerably more profitable than existing agriculture.
• The factory gate price of biomass is the single most important factor affecting the profitability of biomass production in the Corridor.
• Conservatively, a robust supply of >100,000 tonnes of biomass per year can be expected when the factory gate price of biomass exceeds $35 per green tonne. At this price biomass production becomes more profitable than current agriculture over a large enough area to produce a supply of > 100,000 tonnes.
Policy Implications Biomass production is probably viable as a stand alone economic exercise in the Corridor. However, establishment of a viable biomass industry involves much more than demonstrating its potential viability. To achieve a viable biomass industry in the Corridor, an Integrated Tree Processing plant has to be established and landholders have to be contracted to grow biomass. These steps will require significant industry development initiative to be taken, either by the SA government or other relevant agencies such as the Regional Development Board. There are several ways forward for establishing a biomass industry including private contractual arrangements with the commercial sector (e.g. energy companies) and landholders, farmers co-operatives and other models.
Carbon sequestration and trading also looms as another potential driver of a biomass industry in the Corridor and elsewhere in SA for that matter. In addition, the additional income generated from a potential involvement in carbon trading would significantly increase the profitability of biomass. An issue to be overcome however, is the cash flow problem. Contractual arrangements may need to be established that provide a regular payment to landholders such as the Equal Annual Equivalent payment.
Based on recent modelling, the salinity and wind erosion benefits of biomass in particular mitigation, have been shown to be somewhat less than expected. However, the NRM benefits are significant and may justify the effort and expenditure required to establish a biomass industry. The larger the area of biomass production the greater the NRM benefits. Market research is required to quantify the market for biomass products such as renewable

CSIRO Land and Water Page 17
energy. Economies of scale may quickly be achieved for NRM benefits if the market for biomass products would support more than one ITP plant in the Corridor. Once the initial industry development work has been done the industry should prove to be viable on its own and contribute significant public NRM benefits. For a single plant the cost-benefit of establishing a biomass industry is fairly equivocal but for more than one plant the NRM benefits may justify industry development if the market is there for the ITP products.
Wind Erosion
Wind erosion layers include both long-term eroding lands and wind erosion potential of soil landscape units as mapped by DWLBC.
Key Findings
• The total area of long-term eroding land in the Corridor is 312 ha.
• The total area of soils with a wind erosion potential of moderately high to high is 40,000 hectares or 4% of the study area.
Policy Implications Wind erosion is a significant NRM problem in the Corridor with substantial public costs. However, public wind erosion benefits do not provide sufficient incentive to drive private investment in NRM actions. Wind erosion benefits could be integrated into a broader public NRM policy in the Corridor. Policy incentives for addressing wind erosion would also need to be specifically targeted at high priority sites.
Decision Rules for Systematic Regional Planning The decision rules used in this study for prioritising grid cells for NRM actions that most cost-effectively meet resource condition targets are based on spatial optimisation using integer programming. Spatial optimisation models select grid cells for particular types of NRM action that minimise or maximise an objective function whilst satisfying certain targets/constraints. Spatial optimisation models select the optimal set of grid cells for vegetation management, revegetation for biodiversity, and revegetation for biomass. Models are built in GAMS.
Remnant Vegetation Management
A number of layers are used to set geographic priorities for vegetation management. The layers are either used as a cost in the objective function, or as a constraint in the optimisation model. In addition to the vegetation management attributes, we integrate opportunity costs and other NRM attributes into the vegetation management model. The overarching resource condition target affecting remnant vegetation management is that 50% of remnant vegetation on private land should be managed.
Cost Layers in Objective Function Constraint Layers
Attribute Use Attribute Use Area Bigger patches better Vegetation Communities 50% managed on private land Shape Simple shape better Significant Species Habitats 50% managed on private land Fragmentation Least fragmented better Climate Zones 50% managed on private land
Habitat Quality Further from patch edge better Long-Term Eroding Land All vegetated LTE areas managed on private land
Opportunity Costs Lower cost better Salt Benefit Areas All vegetated salt benefit areas managed on private land
Wind Erosion Potential Higher erosion potential better Vegetated Areas Only vegetated areas can be managed
Private Land Only private land can be managed Protected Areas Protected areas already managed
CSIRO Land and Water Page 18
Four models are created to assess the trade-offs involved with including increasingly sophisticated systematic regional planning principles in the setting of geographic priorities for achieving vegetation management targets. Model 1 finds the set of cells for vegetation management that satisfies the broad regional target of managing 50% of native vegetation on private land at the minimum Opportunity Costs. Model 2 extends Model 1 to include the representativeness targets for biodiversity (50% of each Vegetation Community, Climate Zone and Significant Species Habitat) and minimises opportunity costs. Model 3 extends Model 2 to include the natural resource management targets of Salt Benefit Areas and Long-Term Eroding Land and minimises opportunity costs. Model 4 extends Model 3 and minimises not only Opportunity Costs but also the landscape ecology costs of patch Area and Shape, Fragmentation and Habitat Quality, and Wind Erosion Potential.
Key Findings
• Over 25% of remnant vegetation on private land is already managed. Meeting the NRM resource condition targets of managing 50% of remnant vegetation on private land will require a doubling of the existing managed area of remnant vegetation on private land - an increase of 99,751 ha.
• The distribution of current protected/managed areas of remnant vegetation is not representative of the range of biological and physical environments of the Corridor.
• The establishment costs of meeting the resource condition target for vegetation management range from $49 Million to $300 Million.
• The least expensive way of meeting regional resource condition targets for vegetation management has a total annual opportunity cost of $1,204,297 although the biodiversity and NRM benefits of this solution are poor.
• Including representativeness targets in vegetation management (i.e. ensuring at least 50% of each Vegetation Community, Climate Zone and Significant Species Habitat is managed) has an additional opportunity cost of only $84,000 per year (7%). The benefits for biodiversity of including these targets are likely to be substantially greater as will the effectiveness of vegetation management efforts in conserving biodiversity.
• Including the NRM targets in vegetation management (i.e. managing all remnant vegetation on Long-Term Eroding Land and Salinity Benefit Areas) has negligible extra biophysical or economic cost.
• Significant improvements in the Area, Shape, Fragmentation, Habitat Quality, and Wind Erosion Potential of managed areas of remnant vegetation can be achieved for minimal extra opportunity cost of only $40,000 per year (3% increase)
Policy Implications
• The establishment costs and opportunity costs of implementing resource condition targets in the Corridor are high compared to current government NRM funding. Sufficient funding to encourage vegetation management on the scale required to achieve regional resource condition targets is unlikely to become available in the foreseeable future. Hence, if vegetation management is to occur on a scale commensurate with resource condition targets there will need to be significant costs borne by private landholders. Market-based policy is required to have any chance of reaching regional NRM targets for vegetation management.
• Systematic regional planning can increase the biodiversity and NRM benefits of vegetation management actions at only marginal extra cost. Sites funded for vegetation management actions need to be spatially targeted for optimal NRM benefit and cost effectiveness.

CSIRO Land and Water Page 19
• The shape of many areas selected in the spatial optimisation models is often complex and impractical for implementing vegetation management. Policy options need to be flexible and iterative to cope with the preferences of landholders for locating vegetation management actions on the ground whilst still working toward the most cost effective solution identified in the models.
Revegetation for Biodiversity
In addition to vegetation management, MCDA is used to identify geographic priorities for revegetation of local native species that satisfy NRM objectives at minimum cost. The regional resource condition target states that revegetation for biodiversity should increase the area of native vegetation by 1%. This target is not based on any ecological or conservation planning principles and systematic planning is required to identify priority sites for action to have maximum benefit for biodiversity. In this study we extend the 1% target and take a longer term view. This involves setting targets for revegetation so that 15% of each Pre-European Vegetation Community, Climate Zone and Soil Land System are represented by native vegetation either remnant or restored. A number of layers are used as costs and constraints in setting geographic priorities for revegetation for biodiversity:
Cost Layers in Objective Function Constraint Layers
Attribute Use Attribute Use
Landscape Context Cells closer to remnant vegetation better
Pre-European Vegetation Communities 15% of each community vegetated
Fragmentation Fragmented best, then relictual, variegated, and lastly, intact
Climate Zones 15% of each Zone vegetated
Opportunity Costs Lower cost better Soil Land Systems 15% of each SLS vegetated
Wind Erosion Potential Higher erosion potential better Long-Term Eroding Land All Long-Term Eroding Land vegetated
Salt Benefit Areas All Salt Benefit Areas vegetated
Five different models were created to identify priority sites for revegetation for biodiversity to assess the influence of incorporating increasingly sophisticated regional planning principles. Model 1 selects sites for revegetation that increase remnant vegetation by 1% at the minimum Opportunity Costs. Model 2 implements the more sophisticated representativeness targets for revegetation for biodiversity at minimum Opportunity Costs. Model 3 extends Model 2 by integrating the costs of Landscape Context, Fragmentation and Wind Erosion Potential. Model 4 also extends Model 2 to include the natural resource management targets of Salt Benefit Areas and Long-Term Eroding Land at the minimum Opportunity Costs. Model 5 combines Models 3 and 4 and includes both the NRM targets and the suite of cost attributes in the objective function.
Key Findings
• The minimum opportunity cost involved in increasing remnant native vegetation by 1% in the Corridor is $41,685 per year and requires an area of revegetation of 5,107 ha. The establishment costs of reaching the 1% revegetation target ranges between $2.5 and $15 Million. The most cost effective sites for revegetation would have minimal benefits for biodiversity and NRM and undertaking revegetation in these locations would not be a cost-effective use of NRM resources.
• Implementation of a 15% representativeness target in the Corridor (i.e. ensure at least 15% of each Pre-European Vegetation Community, Climate Zone and Soil Land System are represented by either remnant vegetation or revegetation) has a significantly higher opportunity cost of $706,000 per annum, requires 4 times the area of the 1% target (21,578 ha) and the establishment costs range between $13.8 and

CSIRO Land and Water Page 20
$83 Million. However, the resulting geographic priorities for revegetation have a much better chance of conserving regional biodiversity.
• Further enhancement of the biodiversity and NRM benefits of revegetation by including Landscape Context, Fragmentation and Wind Erosion Potential costs) involves an increase in opportunity costs of nearly $150,000 per annum (a 21% increase).
• Including the NRM benefits of revegetating all Long-Term Eroding Land and Salinity Benefit Areas (not irrigated) requires an extra 6,000 ha of revegetation and around $215,000 per annum extra opportunity costs. The opportunity and establishment costs of revegetation to achieve wind erosion and salinity benefits are likely to be many times higher than the public benefits from reductions in these NRM benefits.
• The spatial distribution of areas for revegetation are a mix of new patches, infill of existing remnants, stepping stone patches and linking areas.
Policy Implications
• Current levels of funding for revegetation is unlikely to achieve the scale of revegetation required to achieve regional biodiversity targets. If the stated resource condition target of achieving a 1% increase in vegetation and the additional 15% representativeness target are to be met, significant costs must be borne by private landholders. Market-based policy mechanisms may greatly enhance the likelihood that these revegetation goals are met.
• Sites funded for revegetation actions need to be spatially targeted for optimal NRM benefit. The sites selected for short term funding should coincide with the high priority sites identified for meeting the long term 15% representativeness target.
• It is prudent to include Landscape Context, Fragmentation and Wind Erosion Potential in enhancing the location of revegetation for biodiversity, as the enhanced likelihood of success of revegetation in these priority locations and the increase in biodiversity benefits is likely to be cost effective.
• Including the NRM objectives of Salinity Benefit Areas and Long-Term Eroding Land in setting priorities for revegetation is very expensive and the costs far outweigh the benefits of revegetating these areas for biodiversity based on the parameters used in this study.
Revegetation for Biomass
The biomass model takes an economic rationalist point of view and selects the locations for biomass production that are the most profitable and have the lowest risk. The major constraint is that 100,000 green tonnes of biomass must be produced annually to supply the ITP plant. Returns can come from biomass production or from NRM credit payments. Constraints are also set so that biomass production does not cover more than 85% of each Pre-European Vegetation Community, Climate Zone and Soil Land System and hence preclude the achievement of biodiversity goals of representing 15% of each of these features.
Layers in Objective Function Constraint Layers Attribute Use Attribute Use Returns from biomass Higher returns better Biomass production Minimum of 100,000 tonnes
Salinity credits Higher returns better Pre-European Vegetation Communities
No more than 85% of each community under biomass
Wind Erosion Potential Higher returns better Climate Zones No more than 85% of each zone under biomass
Risk of production Lower risk better Soil Land Systems No more than 85% of each SLS under biomass

CSIRO Land and Water Page 21
Four different models of biomass production are assessed. Model 1 is a straight profit maximising model which identifies the most profitable grid cells for biomass production that yield 100,000 tonnes per year. Model 2 maximises profit but also ensures that biomass production does not preclude the ability to represent 15% of each biophysical feature through revegetation. Model 3 extends Model 2 and includes consideration of the risk involved in biomass production and attempts to maximise the expected value of returns (returns x risk). Finally, Model 4 extends Model 3 and includes not only expected returns from biomass but also the returns from salinity and wind erosion credits.
Key Findings
• The network of sites that yield 100,000 tonnes of biomass at the highest NPV returns from biomass production include a total of 14,215 ha of land and return a NPV of just over $24 Million more than current land use (over a time frame of 100 years and discount rate of 7%). This estimate of profitability is however, likely to be conservative given the latest estimates of biomass species productivity in the Corridor (Hobbs and Bennell 2005). The spin-off salinity benefits total $584,576 in avoided costs to downstream users and wind erosion benefits total $364,046 in credits given the potential payment system developed in this study. The economic risk of these higher profit sites is fairly low.
• The most economic sites for biomass production occur mainly in spatially contiguous zones and tend to occur adjacent to irrigated areas and the flood plain. This is because these areas tend to be classified as minimal use land and hence are given a low opportunity cost. Biomass production in areas interspersing irrigated areas may have synergistic benefits whereby production is increased and raised water tables may be decreased.
• The most economic sites for biomass production for supplying 100,000 tonnes for a single Integrated Tree Processing plant do not preclude the implementation of biodiversity goals in the Corridor. However, the impact of biomass production on biodiversity may need further investigation if production is required to supply 2 or more ITP plants.
• Depending on landholder attitudes to risk, the returns to biomass production can be traded-off for increased certainty in production using the expected value of returns.
• The inclusion of market-based policy instruments like payments in the form of credits for public benefits of salinity and wind erosion mitigation will cost in the order of $1 Million in public funds and have only a minor impact on the total amount of public NRM benefits.
Policy Implications
• Experience from Western Australia suggests that the location of biomass production adjacent to cereal crops may reduce elevated water tables and provide the NRM benefit of mitigating dryland salinity. As a corollary, locating biomass production adjacent to irrigated areas in the Corridor may have similar salinity benefits in reducing land and river salinity.
• Thus, the NRM benefits of biomass production including salinity, wind erosion and potentially carbon, adds significant weight to investment in establishing a biomass industry in the Corridor. Biomass production seems to be a fairly attractive option with dual economic and environmental benefits.
• The establishment of biomass production not only represents an economic driver for private parties motivated by profit, but also yields significant public NRM benefits. However, the adoption of a credit scheme involving payments for NRM benefits such as salinity and wind erosion mitigation is expensive and does little to increase NRM benefits.

CSIRO Land and Water Page 22
Policy Options and Design A range of policy options exist to encourage large-scale vegetation management and revegetation (Connor and Bryan 2005). The most promising include invited tender grant systems, NRM credit systems, and biomass-based industry development. The policy options are required to provide incentives for large scale natural resource management actions that provide the multiple objective NRM benefits of salinity, biodiversity, wind erosion and carbon benefits (Connor and Bryan 2005). None of these policy options alone could feasibly facilitate the scale of revegetation and vegetation management required to meet multi-objective INRM resource condition targets in the Corridor. The best potential for achieving the targets is a multi-faceted policy mix involving the best elements from a variety of different policy options and tailored specifically to the different types of revegetation and vegetation management in the River Murray Corridor.
Invited Tender for NRM Contracts
• Invited tender for NRM contracts involves an auction design where tenders are specifically invited for vegetation management and revegetation contracts from landholders and community groups which propose action in high priority areas. This will facilitate the high degree of spatial targeting required to address high priority sites for NRM
• Tendering approaches may be applied to individual landholders, Local Action Planning (LAP) groups, or larger investors willing to negotiate on behalf of landholders
• Tenders should be invited from all landholders and groups with influence over high priority sites. However, prioritisation reduces market size and caution is required to avoid problems arising from thin markets
• Bids may be submitted that propose either the revegetation of local native species for biodiversity, or the management of remnant vegetation. There should be 2 classes of bids which are evaluated separately – revegetation and vegetation management.
• Differentiation in tender selection can be done based on the NRM benefits offered per dollar and the tenders offering the most cost effective actions selected for funding. Essentially, tenders offering revegetation and vegetation management over the largest area in high priority locations are a high priority for funding
• A reserve price may be set that specifies the maximum that will be paid per hectare of NRM action
• One advantage of this approach is that the maximum expenditure by the government will be known
• This approach is likely to increase the cost effectiveness of government money spent on revegetation, particularly for biodiversity. Our experience (Bryan et al. 2004a) suggests that around twice the environmental benefits can be gained from NRM funding using a tendering approach
• Tendering approaches have the advantage of requiring little institutional change. A tendering approach simply adds value to existing devolved grant schemes. In addition, the existing institutional infrastructure is already in place. All funded NRM actions should involve putting a management agreement or Heritage Agreement on sites proposed for NRM action
• Tendering approaches for individual landholders and groups are particularly suited to the less economic local native species plantings required for biodiversity goals. Whilst tendering approaches could also be applied to encourage other types of NRM actions such as revegetation such as fodder crops and woodlots, the NRM benefits of these

CSIRO Land and Water Page 23
types of revegetation are limited and funding spent on these efforts may be better spent of high priority actions with multiple NRM benefits in high priority sites.
• Established techniques and appropriate data for tender ranking and selection are available (Bryan et al. 2004a)
• Significant investment is required to get the auction scheme off the ground as the responsibility for the design of revegetation projects is devolved to the landholders and substantial information is required upfront to support their bid
• A key to the success of tendering schemes in NRM is the supply of adequate information to landholders to support their bid
• Capital, time preference and information constraints would likely be more significant for a tendering policy focussed on individual smaller enterprises rather than larger institutional investors
• Capital and information constraints may be overcome by offering contracts with evenly spread annual payments. This may also increase certainty on behalf of the funding agency as payments are made contingent upon performance.
• The tendering system needs to be ongoing. Priorities for NRM action can be recalculated and updated each round. This iterative approach enables consideration of the NRM impacts expected from the projects funded in the previous round and an assessment of how these change future geographic priorities. This iterative approach can also integrate new information affecting geographic priorities as this becomes available. Tools can be developed to support this (Bryan et al. 2004b).
NRM Credits
• An NRM credit system (Ward and Connor 2004, Willis and Johnson 2004) could be integrated with the tendering system suggested above. Credit systems can be set up as a straight payment to landholders for actions that achieve NRM benefits initially, with a cap and trade system potentially implemented at a later date.
• Salinity credits could include payments for revegetation that reduces the cost of future salt loads to the River Murray. A well developed technical capacity is established to assess salinity impacts of revegetation and dollar benefits to downstream users. However, there is some risk due to the uncertainty surrounding the effectiveness of revegetation in reducing salt loading over time. To alleviate this, risk management could involve setting an upper bound on payments for revegetation at some fraction of the estimated cost of salinity to downstream users (e.g. 50%).
• A salinity credit scheme may be extended to a broader-focussed NRM (or Ecosystem Services) credit system where landholders receive payments for improving biodiversity or reducing wind erosion. However, there is significantly more risk attached to the extended credit system as measurement of the value of benefits to wind erosion and biodiversity is more difficult.
• A credit system involving government payments to landholders and groups for addressing the multiple objective resource condition targets of salinity, wind erosion and biodiversity may encourage some NRM actions. However, given the level of government funding likely to be available in the foreseeable future and typical levels of costs borne by landholders, an NRM credit system consisting of payments for salinity, wind erosion and biodiversity benefits is unlikely to encourage the scale of actions required to achieve resource condition targets. Additional economic drivers are required to facilitate NRM action on this scale.
• The potential of carbon trading as an economic driver for achieving large scale NRM actions in the Corridor is considerable. Thus, whilst a detailed assessment of the economic potential of carbon sequestration in the Corridor is required, initial

CSIRO Land and Water Page 24
calculations based on the latest production estimates and price figures suggest that landholders may make an income from carbon trading comparable with existing agriculture. Carbon credits may also be integrated with salinity, biodiversity and wind erosion credits. NRM actions such as vegetation management and revegetation of local native species can have multiple objective salinity, biodiversity, wind erosion and carbon benefits. A policy mix involving salinity, biodiversity, wind erosion and carbon credits may provide a combined income from these sources large enough to provide sufficient incentive to encourage the scale of NRM actions required to meet resource condition targets.
• The fact that the Commonwealth has not ratified the Kyoto protocol has not dissuaded other states from initiating programs focussing on carbon trading. Victoria’s CarbonTender program combines a tendering system for revegetation for biodiversity like the one outlined above with the future option of selling carbon credits earned from revegetation efforts on the global market.
• Before a multiple NRM benefit credit system could be implemented, research would be required to fully develop standard and accounting frameworks for quantifying appropriate credit payment levels for biodiversity and wind erosion mitigation and carbon sequestration actions. This should build on existing work quantifying the value of biodiversity (Hatton MacDonald and Morrison 2005), wind erosion (Williams and Young 1999) and the extensive literature and standards for carbon sequestration and trading.
Biomass Industry Development
• A biomass industry in the corridor is likely to be profitable as a private enterprise and can result in considerable NRM benefits at minimal government expense. An industry development policy may hasten the uptake of the opportunity.
• This policy option involves putting out to tender a single biomass industry contract which involves managing the complete operations of a biomass industry plant in the Corridor as a commercial enterprise including the local production, processing and marketing of biomass products. Industry development may also involve market research and local extension work. It is not envisaged that biomass industry development will be expensive.
• Tendering approaches involving larger investors may be best aimed at utility-type companies looking to run a biomass processing plant and contract local landholders to revegetate for biomass industries. However, a farmer co-operative type model may also be a possibility.
• This kind of model is widely used in forestry contracts and a similar model is used in the context of biomass production in Western Australia.
• A private enterprise model achieves economies of scale as all of the processes from production to market are managed by a private company
• Much of the risk involved in the biomass industry is borne by the company rather than the public
• For a biomass industry model to be successful, cash flow timing constraints that make perennial plantings unattractive to landholders would have to be addressed. Contracts guaranteeing fixed annual payments may be required to encourage adoption of perennial woody species. This would be the responsibility of the company.
• Extra payments for NRM benefits such as salinity and wind erosion credits may not result in cost-effective additional NRM benefits. However, the market may support 2 or more ITP plants which will increase the NRM benefits of a biomass industry.

CSIRO Land and Water Page 25
Market research should include a quantitative investigation into the size of the market for biomass products in the Corridor.
A Policy Mix for NRM As mentioned above, no single policy is likely to encourage the scale of NRM actions required to meet resource condition targets in the Corridor. The three options discussed above used together, may have the potential to achieve multiple objective NRM targets. The biomass industry development option has potential to encourage large scale revegetation of biomass species. This is a low cost option for government as biomass seems to be an economically viable exercise in the Corridor. Biomass plantings motivated solely by profit can also provide considerable salinity and wind erosion benefits. However, biomass production does not offer significant biodiversity benefits. The tendering system for NRM contracts has the potential to encourage some NRM actions, especially those contributing biodiversity benefits such as vegetation management and revegetation of local native species. The NRM credit payment system though, which includes payments for salinity, biodiversity, wind erosion and carbon credits, has the greatest potential to encourage cost effective, large scale, multiple objective NRM actions especially for biodiversity. Overcoming the barriers to carbon trading is the key precursor to the success of this policy option.
Conclusion Systematic regional planning was developed in this study to assess the feasibility of different policy options for encouraging the large scale NRM actions, including vegetation management and revegetation, required for achieving stated regional resource condition targets for NRM. Geographic priorities are identified for the NRM actions of vegetation management and revegetation based on biophysical and economic principles for input into a spatial multi-criteria decision analysis framework. Spatial optimisation techniques are used within the MCDA to identify priority sites for NRM actions that simultaneously and cost-effectively achieve the multiple NRM objectives of salinity, biodiversity, wind erosion and carbon. In this study we present a full implementation of systematic regional planning for multiple objective NRM in the South Australian River Murray Corridor.
Systematic regional planning revealed that given the current levels of government funding, regional resource condition targets are unlikely to be met by either vegetation management or revegetation without private landholders bearing a significant portion of the cost. It was also found that by implementing systematic and intelligent planning, salinity and wind erosion benefits could be achieved by vegetation management in addition to the biodiversity goals at minimal extra cost.
In planning for revegetation, we considered that the resource condition target of a 1% increase in vegetation was not likely to greatly enhance regional biodiversity, especially if the least expensive options were taken. Instead, we design and implement SRP based on a 15% representativeness target as a long term goal for revegetation. The amount of revegetation required to meet this target is about 4 times more expensive than the 1% target but the NRM benefits are likely to be substantially more. Including consideration of Landscape Context, Fragmentation status and Wind Erosion Potential in the model increased the likely NRM benefits from revegetation at some extra cost. Including the NRM benefits of revegetating all Salinity Benefit Areas (as modelled by SIMPACT over a 100 year time frame) and Long-Term Eroding Land was not cost effective.
Biomass production was found to be potentially viable in the Corridor and the most profitable sites could return a net present value of $24 Million more than existing land uses. Biomass production could also provide significant NRM benefits for salinity and wind erosion at very little cost to government. The integration of a NRM credit system to encourage biomass

CSIRO Land and Water Page 26
plantings in high priority areas for salinity and wind erosion benefits is not likely to be cost effective.
Market-based policy mechanisms are suggested for encouraging vegetation management and revegetation of local native species to achieve multiple objective NRM benefits. An invited tendering system is suggested which provides a spatially targeted approach for encouraging NRM actions. Multiple benefit NRM credit systems could also be implemented and possibly combined with the tendering system. Carbon credits especially have considerable potential for encouraging the large scale NRM actions required to meet the multiple objectives of salinity, biodiversity, wind erosion and additionally, carbon sequestration, in the Corridor. A biomass industry development program is also proposed which may involve market research and tendering of a biomass production contract to utility and similar companies with experience in biomass industries.
In this study we have identified future options for most cost effectively addressing NRM targets in the South Australian River Murray Corridor. We have quantified the cost, feasibility and impacts of achieving a few selected resource condition targets and discussed policy instruments which may provide the greatest chance of meeting targets. Future directions for research include extending the concept of SRP, integrating climate change impacts, and designing policy that optimally encourages NRM actions in the priority locations identified by SRP.
CSIRO Land and Water Page 27
Acknowledgements This study is the Stage 2 report of the project entitled Development of Market-Based Investment Programs for NRM along the River Murray Mallee Dryland Corridor, a joint initiative between the South Australian Department of Water, Land and Biodiversity Conservation (DWLBC) and the South Australian Murray Darling Basin Integrated Natural Resource Management Group. The project was funded by the National Action Plan for Salinity and Water Quality - a joint initiative between the Australian, State and Territory Governments. The authors acknowledge the support of these agencies and programs.
In addition, the authors acknowledge the support of CSIRO’s Water for Healthy Country Lower Murray Landscape Futures project. The Water for a Healthy Country National Research Flagship is a research partnership between CSIRO, state and federal governments, private and public industry and other research providers. The Flagship was established in 2003 as part of the CSIRO National Research Flagship Initiative.
We are grateful for the guidance of the project Steering Committee. Several people also helped us at various stages in this project. Matt Miles from the SA Department for Environment and Heritage (DEH) provided support for use of the SIMPACT data. Trevor Hobbs from the CRC for Plant-based Solutions for Dryland Salinity provided models for biomass productivity from their FloraSearch work and advice on preparing the biomass layers. Darran King ably assisted in the final stages of production of this report. DEH provided useful criticism of our biodiversity methods. Glenn Gale and Dr Douglas Bardsley from the SA Department of Water, Land and Biodiversity Conservation, and David Freudenberger of CSIRO Sustainable Ecosystems all provided extremely thoughtful, thorough and valuable comments on a draft manuscript which improved the report immeasurably. We are grateful to all of the above.
CSIRO Land and Water Page 28
1. Introduction In many human-dominated regions, development of natural resources has resulted in environmental degradation. Development has occurred primarily for agriculture which usually involves both the broadacre clearance of deep-rooted native vegetation and replacement with shallow-rooted annual crops and pastures, and the grazing of remnant vegetation by livestock. The effects of this large scale land clearance commonly results in the degradation of biological, land, and water resources. Biological resources are degraded through the direct removal of native habitat. Soil resources are degraded through the increased susceptibility to erosion, compaction, and changes in physical and chemical properties. Water resources are degraded through increased recharge of groundwater, rising water tables and salinisation of surface waterways. Degradation of natural resources occurs over geographically and biophysically diverse parts of the landscape and natural resource management (NRM) actions are required over a broad spatial scale to address these degrading processes. In this study, we focus on the South Australian River Murray Corridor (or simply the Corridor) where clearance of native vegetation for agricultural development in the Corridor has lead to environmental problems such as biodiversity degradation, wind erosion and increased salinity in the River Murray.
In natural resource management complex decisions are required to prioritise the type, timing and location of actions that most cost effectively redress multiple degrading processes. The concept of integrated natural resource management (INRM) provides a framework for the integrated management of natural resources like land degradation, biodiversity, water quality, and climate change. Furthermore, INRM involves the integration of economic and social aspects of natural resource management. These range from agricultural land use and regional economic and social impacts of land use change to the integration of private landholders, community groups, government and non-government organisations in the planning administration and implementation of natural resource management. This study embraces the entire concept of INRM.
Planning for natural resource management in Australia and elsewhere has become increasingly regional in focus and administration. This has been evident in Australia with the regional implementation of major natural resource management schemes such as the Natural Heritage Trust (NHT) and National Action Plan for Salinity and Water Quality (NAP). Regional planning for natural resource management in South Australia is now the responsibility of regionally-based Integrated Natural Resource Management Groups. South Australia has been divided into eight INRM regions and INRM Groups have been charged within planning and administering funds for natural resource management.
Many regional agencies have developed, or are in the process of developing, NRM plans and associated investment strategies to identify the major environmental assets and threatening processes, and the NRM actions required to address them. The centerpiece of regional NRM plans and investment strategies is usually a set of resource condition targets. However, these plans rarely provide sufficient information, especially spatial detail, to prioritise specific on-ground investment of limited funds for natural resource management actions to achieve these targets. Assessment of the costs and impacts of achieving NRM targets is rare as is any planning for the most cost effective ways to achieve NRM targets. Systematic planning based on biophysical and economic principles is required to guide regional investment in NRM by identifying geographic priorities for NRM actions that maximise the benefits of these actions and enable regional NRM targets to be achieved cost effectively.
The scale of NRM actions required to achieve regional resource condition targets can be large as is the case in the Corridor. NRM actions are expensive and are required on largely privately-owned land. Landholders are currently unwilling to undertake substantial investments in NRM actions as establishment is costly and there is a long term loss of

CSIRO Land and Water Page 29
revenue from current land use. The on-farm economic benefits of NRM actions are generally regarded as insufficient to compensate for their costs. In the case of NRM actions the costs are usually incurred by the private landholder whilst most of the benefits are realised over long time periods and accrue predominately off-farm to the wider community who do not share in the initial investment costs. In addition there is usually some uncertainty surrounding the benefits received.
The aim of this study is to assess the feasibility of achieving the scale of NRM actions, including vegetation management and revegetation, required to meet stated regional resource condition targets for NRM. We address the multi-objective natural resource management issues of salinity, biodiversity, wind erosion and carbon, provide support for complex NRM decision making, and assess policy options for providing incentives to encourage NRM actions.
To achieve this, we develop the concept of systematic regional planning (SRP) for multiple objective natural resource management. Systematic regional planning is conducted within a spatial multi-criteria decision analysis (MCDA) framework and enables the identification of geographic priorities for NRM actions that most cost effectively address multiple natural resource management objectives. Trade-offs between NRM benefits and the cost of NRM actions are quantified and this information is used to support decision making. The cost of the large scale NRM actions required to meet regional resource condition targets is quantified and policy options are assessed for their ability to encourage large scale NRM actions.
The Corridor study area falls within the South Australian Murray-Darling Basin (SA MDB) INRM Region. Strategic INRM planning has primarily focused on the development of the Catchment Plan (RMCWMB 2003) and subsequently the INRM plan (INRM Group 2003a) and its associated investment strategies (INRM Group 2003b&c). On-ground NRM actions are largely carried out by Local Action Planning (LAP) groups (AACM International 1997, Murray Mallee Local Action Planning Association Inc 2001) and private individuals. The NRM plans are supported by the biodiversity plan for the SA MDB (Kahrimanis et al. 2001) and Land and Water Management Plans. In the INRM Plan and Investment Strategies (INRM Group 2003b&c) the SA MDB INRM Group has committed to specific resource condition targets (Appendix 1) for large scale vegetation management and revegetation of perennial species to ameliorate biodiversity degradation, and decrease river salinity and wind erosion.
SA MDB INRM resource condition targets (INRM Group 2003c) are multi-objective and those specific to this project include river salinity, biodiversity, and wind erosion. The SA MDB INRM Plan does not specifically address carbon sequestration for abatement of the enhanced greenhouse effect and associated climate change. However, we consider carbon to be an important objective in natural resource management and there is increasing government interest in the potential implications of the Kyoto Protocol if Australia ratifies it. In addition, carbon trading has considerable potential as an economic driver for revegetation. Hence, we include discussion of carbon as an objective for NRM in the Corridor.
The NRM actions of vegetation management and revegetation have many diverse benefits (Ive and Abel 2001). However, for the purposes of this study, vegetation management, which includes all of the activities necessary to manage remnant vegetation for biodiversity conservation values, is considered to have benefits only for biodiversity. In reality, there may also be some salinity and wind erosion benefits if badly degraded vegetation is rehabilitated through management but these effects are not considered in this study. Vegetation management can be expensive and the market-based opportunities for encouraging large scale vegetation management are limited. Revegetation can also have substantial costs (Ive and Abel 2001). However, market-based mechanisms exist that may encourage the scale of revegetation required to reach regional resource condition targets in the Corridor. Thus, we consider three different types of revegetation in this study (although fodder crops are not analysed in detail):
CSIRO Land and Water Page 30
1. Revegetation of eucalypts for biomass industries
2. Revegetation of fodder crops for stock feed
3. Revegetation of local native species
In this study, different revegetation types are considered to have distinct NRM benefits. All revegetation types are considered to have the same salinity impact as they are all thought to reduce groundwater recharge to zero upon establishment by eliminating recharge and thereby reducing river salt load contribution from dryland areas. They are also all considered to eliminate the impact of wind erosion upon establishment through the soil binding effect of the roots. However, revegetation of local native species is the only type that is considered to provide biodiversity benefits. Biomass monocultures may offer some biodiversity benefits such as food sources for high motility species and habitat for soil biota (Salt et al. 2004) but these effects are not considered in this study. Revegetation of local native species and biomass may also have carbon sequestration benefits.
As discussed above, processes of environmental degradation operate heterogeneously across the landscape and NRM actions at different sites in the Corridor offer different levels of NRM benefit. For maximum NRM benefit, actions need to be targeted in high priority geographic locations. The benefit of vegetation management and revegetation for biodiversity depends of the spatial arrangement of the NRM actions. A range of principles exist for identifying geographic priorities for vegetation management and revegetation derived from conservation biology and landscape ecology (Margules and Pressey 2000). The benefit of revegetation for salinity and wind erosion also depends on the spatial location of the plantings. Salinity benefits are dependant upon the geohydrologic and groundwater characteristics of the site of the plantings. The benefit of revegetation in wind erosion mitigation depends upon the location of revegetation and the susceptibility of soil to erosion. Economic processes also vary spatially. The profitability of biomass production varies spatially with productivity, opportunity and transport costs.
Systematic regional planning is implemented within a spatial multi-criteria decision analysis framework which provides a structured approach to analysing complex decisions like those required in planning for multi-objective NRM (Prato 1999). The spatial MCDA framework involves a number of stages. The first stage is the definition of the decision problem. The multiple decision criteria or attributes are then constructed. This requires the quantification of the spatial distribution of the underlying biophysical and economic processes that influence NRM decisions. These attributes take the form of a number of GIS layers and can be used as cost layers or as targets. The decisions involved in spatial MCDA for systematic regional planning involve selecting geographic locations to undertake specific NRM actions. The decision rules are the analytical engine of the MCDA. The decision rules used in SRP are spatial optimisation techniques based on integer programming. Integer programming enables the quantitative formulation of the multi-objective NRM decision problem. The MCDA framework then involves sensitivity analysis and finally making recommendations for the strategic implementation of specific NRM actions in specific geographic locations.
The objectives of this study are listed below and these also provide a road map outlining the structure of the report:
• Provide the necessary background and concept development of strategic regional planning for multiple objective natural resource management;
• Review NRM targets and actions relevant to the SA River Murray Corridor;
• Implement strategic regional planning for multiple objective NRM in the River Murray Corridor using a spatial MCDA framework. This involves:
o Definition of the problem

CSIRO Land and Water Page 31
o Assembly of evaluation criteria data which includes using a variety of spatial modelling techniques based on established biophysical and planning principles to create GIS layers of:
Salinity benefits
Biodiversity priorities for both vegetation management and revegetation including costing these actions
Opportunity costs of agriculture
Economic returns from biomass production including a sensitivity analysis
Wind erosion
o Define the decision alternatives
o Define and implement the decision rules using spatial optimisation to identify geographic priorities for the NRM actions of vegetation management, revegetation of local native species, and revegetation of biomass such that resource condition targets are met cost effectively
o Provide flexibility in outputs, assess the spatial distribution of priority NRM actions, and assess and discuss the feasibility of meeting resource condition targets
• Discuss the policy options available for encouraging large scale NRM actions in the Corridor. Recommend the best alternative option(s) in the context of the economic, environmental, social, and institutional outcomes. Discuss barriers and how to overcome them, and compare alternative option(s).
It should be noted here that the solutions provided by the systematic regional planning models presented in this study are not intended for rigorous implementation. The funds available to buy the necessary land, or to cover the considerable opportunity or establishment costs to landholders involved in undertaking NRM actions for public environmental benefits are unlikely to become available. The models are designed for two purposes. Firstly, they provide estimates of the costs involved and the trade-offs that need to be made in implementing the most cost effective means of achieving regional natural resource management targets. Secondly, they identify geographic priorities for on-ground actions for achieving regional NRM targets as a basis for smart use of policy instruments to best encourage NRM actions in these priority locations. The mapped priorities are indicative of priority areas rather than absolutes. They are not intended as a top-down directive, but rather guide for assessing bottom up willingness of private land holders to improve NRM outcomes.

CSIRO Land and Water Page 32
2. Decisions and Multiple Objective NRM Modern environmental issues are characterised by a number of physical, biotic, social and economic factors that complexly interact over geographic space. Management of these issues requires an interdisciplinary focus and the ability to systematically integrate many diverse processes and perspectives. In the context of the natural resource management issues characteristic of agricultural regions, a number of factors are involved and complexly interact including biodiversity, surface and groundwater quality and quantity, soil erosion, dryland and irrigated agricultural production, and community. Management involves making decisions within this world of complex, conflicting parameters.
Making complex decisions that involve a trade-off between multiple criteria is a natural process. Decision theory has long been used in agriculture, economics and engineering to help structure and support complex decisions (Anderson et al. 1977). Spatial multi-criteria decision analysis is a decision theory technique for evaluating trade-offs involved in making complex decisions in geographical space. In this study we use decision theory to structure the problem of achieving natural resource management goals most cost effectively and MCDA to identify the geographic priorities for NRM actions.
Research into the assessment and management of complex environmental issues is increasing. However, probably because of its inherent interdisciplinarity, research has lacked a common framework and terminology, and a coherent set of methods for addressing these hard problems. In this study we propose a decision theory framework for structuring and analysing NRM decisions. This section begins by explaining the decision theory and spatial multi-criteria decision analysis methodologies. This is followed by an overview of how the methodologies are applied to systematic regional planning for multiple objective NRM.
2.1. Decision Theory Decision theory provides a framework which can be used to support decisions which meet explicitly stated objectives as to the desired state of nature resulting from the decision. Decision theory caters for decisions made under certainty, uncertainty and risk. In decisions made under certainty the decision-maker has perfect information on the states of nature and has only to analyse this information in order to make the optimal decision. In decisions made under uncertainty, the decision-maker has no knowledge about the states of nature resultant from the decision. In decisions made under risk, the decision-maker has knowledge of the probabilities of different states of nature and this can be used to inform the decision. Decision theory also allows for different decision strategies such as optimism and pessimism. Under an optimistic strategy, the decision-maker strives to either choose the option that maximise the maximum benefit or minimises the minimum cost. In a pessimistic strategy, the decision-maker aims to make the decision that maximises the minimum benefit or minimises the maximum cost (Anderson et al. 1977, Webster 1995).
Decision theory also provides a formal protocol for structuring decision analysis problems from the statement of objectives to making the decision (Possingham 2001, Possingham et al. 2001). Four steps have been distinguished in the rational decision making model (McKenna 1980):
1. Problem definition
2. Search for alternatives and selection criteria
3. Evaluation of alternatives
4. Selection of alternatives

CSIRO Land and Water Page 33
2.2. Spatial Multi-Criteria Decision Analysis Multi-criteria decision analysis (MCDA) is a powerful tool for supporting complex decisions constrained by multiple competing objectives and criteria. Spatial MCDA is a subset of MCDA techniques in which location plays a role in the decision variables. The spatial dimension adds a new level of complexity to natural resource management decisions. Spatial MCDA is ideally suited to the analysis of the kind of complex decisions required within a spatial context as are common in natural resource management (Hajkowicz et al. 2000). There are two main types of spatial MCDA – spatial Multi-Attribute Decision Making (MADM) and spatial Multi-Objective Decision Making (MODM) (Malczewski 1999).
MADM involves a set of alternatives and a set of attributes. The alternatives are decision variables which, in this study, are grid cells in a raster GIS which are used to represent the landscape. Let the number of grid cells equal m. Examples of the kind of decision that can be made in this study include whether to revegetate a grid cell for biodiversity or not, or whether to manage the vegetation of a grid cell or not. Attributes describe the state of nature for each decision variable. Within a GIS, attributes are stored as layers that capture the spatial variation in attribute values. Examples of the type of attributes relevant to this study include the biodiversity priority of each patch for vegetation management or the river salinity benefit achieved by revegetating each grid cell. Let the number of attributes equal n. We can designate attribute values as xij , which represents the value of the jth attribute for each alternative i such that i = 1, 2,…, m and j = 1, 2, …, n.
We can then construct a decision matrix for the MADM problem described above which describes the alternative-attribute relationships. The rows of the decision matrix represent each decision variable (or grid cell) and the columns represent the attributes. The cells of the matrix contain the measured data values for each alternative i of each attribute j (Table 1).
Attribute 1 Attribute 2 … Attribute n Alternative 1 x11 x12 … x1n Alternative 2 x21 x22 … x2n … … … … Alternative m xm1 xm2 … xmn
Table 1 – Decision matrix for a MADM problem. xij , score for the ith alternative (i = 1, 2,…,m) with respect to the jth attribute (j = 1, 2,…,n) (Source Malczewski 1999).
MADM analyses are essentially selection procedures because each attribute is considered an objective. Alternatives are selected providing they satisfy some objective condition for each attribute. These kinds of analysis are common in GIS- and database-type queries. However, in MODM analyses, the objectives are distinct from but functionally related to the attributes. In MCDA terms, the objectives can take two forms – that of an objective function and constraints. Objectives are a set of functional relationships between the decision variables and the attributes. The objective function in MODM analyses usually tries to minimise or maximise some function of the attributes. Constraints are a set of conditions (also functions of the decision variables and the attributes) that limit the set of feasible alternatives and ensure that the system meets some explicit state of nature. In this study, the MODM technique is used to identify sites for natural resource management actions that meet resource condition targets at minimum cost.
Malczewski (1999) identifies seven aspects of spatial MCDA which operationalise the stages of decision theory listed above specific to spatial MCDA:
• Problem Definition - In spatial MCDA, problem definition involves thinking through the structure of the decision problem, assembling, visualising and manipulating data (usually in a GIS) and gaining a thorough understanding of the complexity of the system of interest.

CSIRO Land and Water Page 34
• Evaluation Criteria – Evaluation criteria are the objectives and attributes of the decision problem. This includes specification of a comprehensive set of objectives (including the objective function and constraints) that characterise all aspects of the problem and the attributes that provide a measure or indicator for achieving the objectives. Attributes with different scales may need to be rescaled so that they can be numerically compared in a coherent and commensurate way.
• Alternatives – Alternative are the decision variables. In spatial MCDA they are the spatial units, usually grid cells or polygons. Each spatial unit is a decision variable which may be considered to take on a particular state (e.g. change land use type) or value of some entity (e.g. increase the amount of production). Constraints may also be used to mask out areas where decisions are inappropriate or not relevant (e.g. urban areas or water bodies).
• Criterion Weights – Weights are commonly used to reflect the priorities of the decision maker with respect to the relative importance of the attributes. Weights are used to help combine attributes measured in different units and incorporate the bias of the decision maker in an explicit way.
• Decision Rules – Decision rules or aggregation rules are the means by which alternatives are evaluated. The form of decision rules is dependent upon the nature of the decision variables, objectives and attributes. In MODM this usually takes the form of an optimisation procedure such as mathematical programming, genetic algorithms or simulated annealing. The decision rules attempt to find a set of alternatives that meet the objective function and satisfy the constraints of the decision problem.
• Sensitivity Analysis - Undertaken to assess the robustness of the decision outcome to changes in all parts of the decision problem.
• Recommendation - Involves making prescriptions for future action based on the decision outcomes.
Spatial MCDA is often conducted within a GIS environment (Carver 1991, Chakhar and Martel 2003). Apart from a notable exception (Idrisi), few GIS packages have the functionality to inherently support complex multiple objective decision making. Decision theory tools such as MADM and MODM have been developed and integrated with GIS (Jankowski 1994, Chakhar and Martel 2003) often on an ad-hoc basis. In this study, we use GIS to manage the underlying spatial data, to create new data layers based on spatial process models, and to present the results of decision analyses. The MCDA occurs externally to the GIS.
2.3. Integrated Natural Resource Assessment, Modelling and Planning
There is an increasing realisation that biological, physical, economic and social processes are inextricably linked and quantitative analyses for supporting multiple objective NRM decisions have to consider and account for this complexity. As a result, an increasing number of studies are moving away from single issue simplification and analysis for informing NRM decisions and tackling complex multiple objective NRM assessment, modelling and decision analysis. This is an essential evolutionary step for quantitative NRM studies if these studies are to provide realistic and implementable policy recommendations.
However, coherent theoretical foundations for the quantitative, systematic, multiple objective assessment, modelling and planning for supporting complex spatial NRM decisions have not been well developed. Recently emerging is a new, integrated hard problem science which deals with complex problems that are impossible to deal with within the confines of any single discipline (Costanza and Jorgensen 2002). The fundamental tenets of hard problem
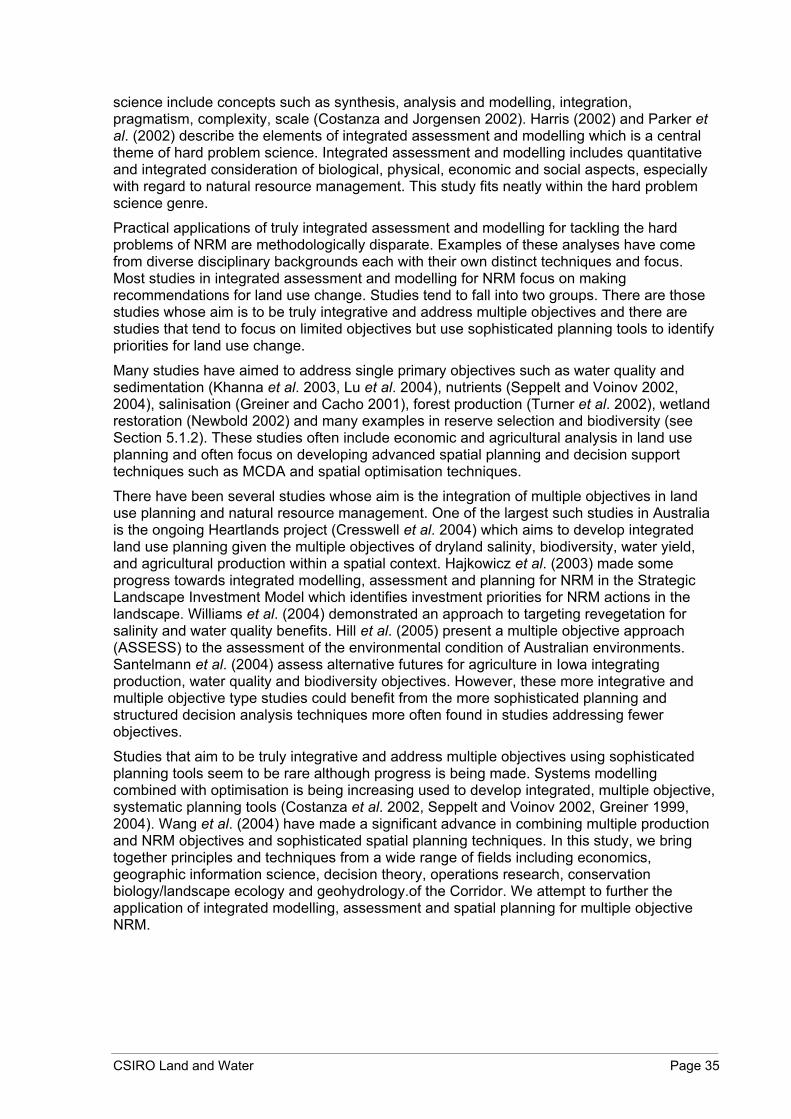
CSIRO Land and Water Page 35
science include concepts such as synthesis, analysis and modelling, integration, pragmatism, complexity, scale (Costanza and Jorgensen 2002). Harris (2002) and Parker et al. (2002) describe the elements of integrated assessment and modelling which is a central theme of hard problem science. Integrated assessment and modelling includes quantitative and integrated consideration of biological, physical, economic and social aspects, especially with regard to natural resource management. This study fits neatly within the hard problem science genre.
Practical applications of truly integrated assessment and modelling for tackling the hard problems of NRM are methodologically disparate. Examples of these analyses have come from diverse disciplinary backgrounds each with their own distinct techniques and focus. Most studies in integrated assessment and modelling for NRM focus on making recommendations for land use change. Studies tend to fall into two groups. There are those studies whose aim is to be truly integrative and address multiple objectives and there are studies that tend to focus on limited objectives but use sophisticated planning tools to identify priorities for land use change.
Many studies have aimed to address single primary objectives such as water quality and sedimentation (Khanna et al. 2003, Lu et al. 2004), nutrients (Seppelt and Voinov 2002, 2004), salinisation (Greiner and Cacho 2001), forest production (Turner et al. 2002), wetland restoration (Newbold 2002) and many examples in reserve selection and biodiversity (see Section 5.1.2). These studies often include economic and agricultural analysis in land use planning and often focus on developing advanced spatial planning and decision support techniques such as MCDA and spatial optimisation techniques.
There have been several studies whose aim is the integration of multiple objectives in land use planning and natural resource management. One of the largest such studies in Australia is the ongoing Heartlands project (Cresswell et al. 2004) which aims to develop integrated land use planning given the multiple objectives of dryland salinity, biodiversity, water yield, and agricultural production within a spatial context. Hajkowicz et al. (2003) made some progress towards integrated modelling, assessment and planning for NRM in the Strategic Landscape Investment Model which identifies investment priorities for NRM actions in the landscape. Williams et al. (2004) demonstrated an approach to targeting revegetation for salinity and water quality benefits. Hill et al. (2005) present a multiple objective approach (ASSESS) to the assessment of the environmental condition of Australian environments. Santelmann et al. (2004) assess alternative futures for agriculture in Iowa integrating production, water quality and biodiversity objectives. However, these more integrative and multiple objective type studies could benefit from the more sophisticated planning and structured decision analysis techniques more often found in studies addressing fewer objectives.
Studies that aim to be truly integrative and address multiple objectives using sophisticated planning tools seem to be rare although progress is being made. Systems modelling combined with optimisation is being increasing used to develop integrated, multiple objective, systematic planning tools (Costanza et al. 2002, Seppelt and Voinov 2002, Greiner 1999, 2004). Wang et al. (2004) have made a significant advance in combining multiple production and NRM objectives and sophisticated spatial planning techniques. In this study, we bring together principles and techniques from a wide range of fields including economics, geographic information science, decision theory, operations research, conservation biology/landscape ecology and geohydrology.of the Corridor. We attempt to further the application of integrated modelling, assessment and spatial planning for multiple objective NRM.

CSIRO Land and Water Page 36
3. Description of the Study Area The outer boundary of the River Murray Corridor study area in South Australia has been defined as a 15 km buffer from the 1956 floodplain stretching from the Victorian/NSW border in the east to Tailem Bend in the south (Figure 1). The Corridor covers an area of 1,217,000 hectares or 12,170 square kilometres. This includes some 108,000 ha of floodplain (defined as the area submerged by the 1956 flood, Figure 2), approximately 628,000 ha of cleared dryland area (Figure 3) and 511,000 ha of remnant native vegetation. In addition, there is approximately 50,000 ha of irrigated agriculture (Figure 4). An area of 193,000 ha is protected for conservation purposes including National Parks and Wildlife Reserves, voluntary Heritage Agreement Areas and the Bookmark Biosphere Reserve. Approximately 956,000 ha is unreserved land privately owned as freehold or managed within crown lease tenure.
Berri
Morgan
Mannum
Loxton
RenmarkWaikerie
Swan Reach
Tailem Bend
Blanchetown
Murray Bridge
Kingston-On-Murray
350,000
350,000
400,000
400,000
450,000
450,000
500,000
500,000
6,10
0,00
0
6,10
0,00
0
6,15
0,00
0
6,15
0,00
0
6,20
0,00
0
6,20
0,00
0
6,25
0,00
0
6,25
0,00
0
0 10 20 30
Kilometres
Australia
Native Vegetation
1956 Floodplain
River Murray Corridor Boundary
Irrigated Areas
Cleared Areas
Native Vegetation in Floodplain
Figure 1 – Location map of the South Australian River Murray Corridor.
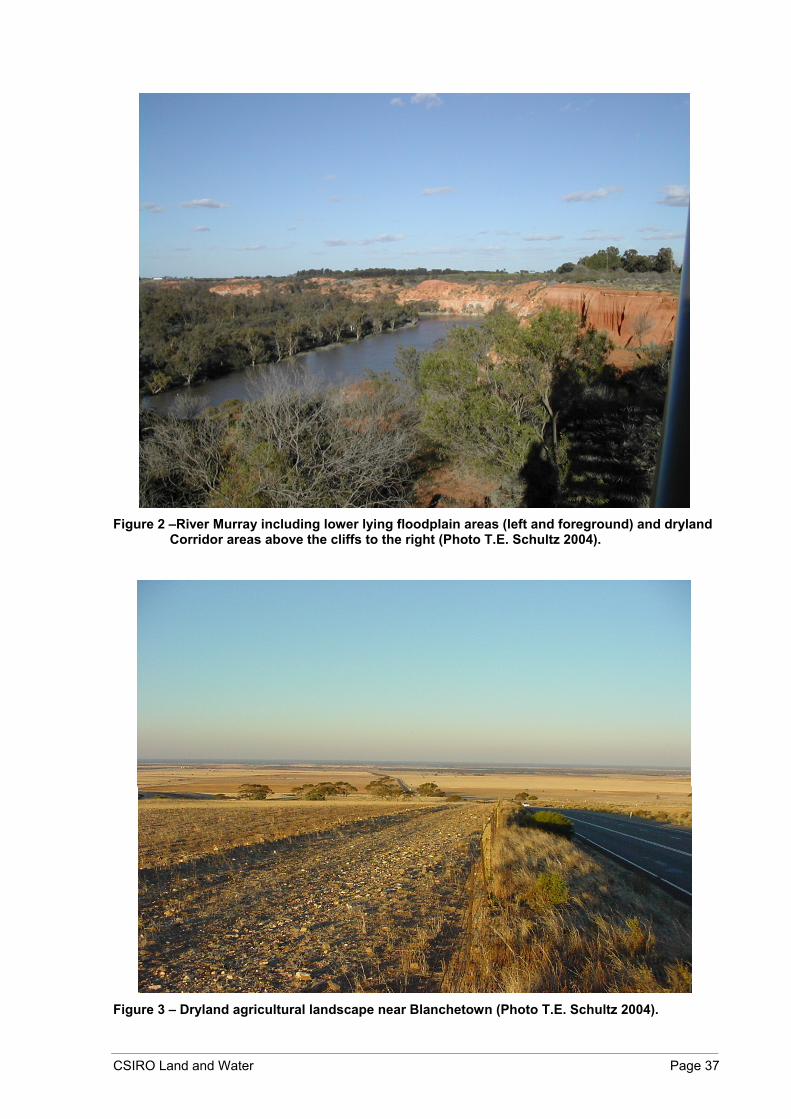
CSIRO Land and Water Page 37
Figure 2 –River Murray including lower lying floodplain areas (left and foreground) and dryland
Corridor areas above the cliffs to the right (Photo T.E. Schultz 2004).
Figure 3 – Dryland agricultural landscape near Blanchetown (Photo T.E. Schultz 2004).

CSIRO Land and Water Page 38
Figure 4 – Irrigated horticulture including grapes in the foreground west of Kingston-on-Murray
(Photo T.E. Schultz 2004).
The Corridor covers a diverse range of landscapes from the moist, cool, hilly eastern edge of the Mt. Lofty Ranges in the south-west of the study area to the warm dry plains of the Mallee in the north-east of the Corridor. Mean annual rainfall varies from 226 mm/yr in the north-east to 662 mm/yr. Mean annual temperature ranges from 13.2 oC in the south-west to 16.8 oC in the north-east. The South Australian Department for Environment and Heritage (DEH) has identified and mapped remnant native vegetation communities in the Corridor. About 42% of the Corridor remains in a semi-natural state under remnant vegetation. This is high compared to other agricultural regions in South Australia. However, much of this remnant vegetation is degraded to varying degrees, predominantly by livestock grazing. Remnant vegetation communities in the dryland areas include native grassland and shrubland, mallee woodland and open woodland in the eastern Mt. Lofty Ranges. Many remnants provide existing and potential habitat for rare and threatened species (Kahrimanis et al. 2001). The floodplain also includes ecologically significant wetland ecosystems.
Soils in the Corridor are commonly sandy and nutrient poor. However, parts of the Corridor near the river are characterised by rich alluvial soils suitable for intensive irrigated agriculture. Regional groundwater systems are naturally saline and flow towards the River Murray, delivering a natural influx of salt to the river. Land clearance has exacerbated this process through increased groundwater recharge (Cook et al. 2004).
Land use in the Corridor is a mosaic of irrigated and dryland agriculture. Irrigated agriculture occurs close to the River Murray and is dominated by dairy, fruit and grapes. Irrigated agriculture in this region, especially fruit and grapes, is some of the highest value irrigated agricultural production in the Murray-Darling Basin and irrigated agriculture in the region is developing rapidly (Bryan and Marvanek 2004). Irrigated areas are not considered in this study. Rather, we concentrate largely on the dryland parts of the Corridor and on the flood plain. Dryland agriculture is dominated by livestock grazing, particularly sheep grazing, and

CSIRO Land and Water Page 39
cereals such as wheat and barley, with some smaller areas of oilseeds and legumes (Bryan and Marvanek 2004). Dryland agriculture tends to be of lower value per hectare than irrigated agriculture, especially horticulture. Approximately 80,000 people reside in the Corridor, with major centres presented in Figure 1. Other important industries such as recreation, tourism and manufacturing also flourish in the Corridor.
The Corridor is important from a geographic perspective because it encapsulates the South Australian length of the River Murray. The River Murray is an important source of water for Adelaide (approximately 1.1 million people) and many rural South Australian towns. Land use and natural resource management in the SA River Murray Dryland Corridor is especially important because of the linkages between dryland and riverine systems.
Natural resource management in the Corridor is coordinated and administered by the Integrated Natural Resource Management Group for the South Australian Murray-Darling Basin Inc. (SA MDB INRM Group). The SA MDB INRM Group was formed by the South Australian Government and includes representatives from various groups involved in natural resource management within the region. The Group administers funds from the NHT and NAP programs. Much of the on-ground NRM works in the Corridor are undertaken by Local Action Planning Groups and individual landholders. The principal means of distributing NRM funds for on-ground works is through direct payments in a devolved grant scheme.

CSIRO Land and Water Page 40
4. Resource Condition Targets and NRM Actions in the Corridor
The linkages between resource condition targets and natural resource management actions are complex. Different natural resource management actions address different resource condition targets. For example, revegetation for biomass may reduce wind erosion, salinity and carbon but not enhance biodiversity. Additionally, different resource condition targets may be achieved through one or more NRM actions. For example, biodiversity may be addressed through revegetation of local native species and vegetation management but not revegetation for biomass production or fodder crops. Resource condition targets, NRM actions and their linkages are summarised in Table 2. This section describes each of the resource condition targets and natural resource management actions in more detail and discusses the linkages between them.
Resource Conditions Addressed by NRM Actions 1. Salinity 1, 2, 3, 4 2. Wind Erosion 1, 2, 3, 4 3. Biodiversity 3, 4 4. Carbon 1, 3 NRM Actions Addresses Resource Conditions 1. Revegetation of Biomass 1, 2, 4 2. Revegetation of Fodder 1, 2 3. Revegetation of Local Native Species 1, 2, 3, 4 4. Vegetation Management 1, 2, 3, 4
Table 2 – Resource conditions and natural resource management actions and their linkages.
4.1. Salinity Predictions have been made that if current trends are followed “Adelaide’s drinking water from the Murray River will be too salty to drink two days out of five by 2020” (ACF et al. 2004). Understandably, there is significant government and community interest in reversing this trend. South Australia has a responsibility to meet salinity targets under the Murray Darling Basin Salinity Management Strategy (MDBC 2001).
It has been documented that a substantial proportion of the salt contribution to the River Murray originates from the dryland areas of the South Australian River Murray Corridor (Barnett et al. 2002). The projected increase in salt contribution has been estimated at 82 EC at Morgan (MDBMC 1999) and later revised down to 30 EC at Morgan (Barnett and Yan 2004) over a timeframe of around 100 years. The salt contribution has been enhanced by the widespread clearance of native vegetation and the subsequent increase in recharge and intrusion of saline groundwater into the river (Cook et al. 2004, Figure 5). The idea that widespread revegetation of deep rooted perennials may be able to reverse this effect was the main driver for this study. Recently, Cook et al. (2004) provide new estimates for recharge rates in the Corridor based on empirical data and this data has been used to update salinity models. Recent studies have shown that the salinity benefits of revegetation in the Corridor may be limited (Barnett and Yan 2004).

CSIRO Land and Water Page 41
Figure 5 – Dryland agricultural landscape near Loxton. The removal of deep-rooted perennial
native vegetation and replacement with shallow rooted cereal crops has led to increased groundwater recharge an saline discharge to the River Murray. Farming practices may also increase the exposure of soils to wind erosion.
In this study we quantify the river salinity benefits achieved by revegetation in the dryland areas of the Corridor in the light of the latest SIMPACT modelling results. The salinity driver of large scale revegetation of perennials is reassessed in the light of these results both in terms of the actual amount of river salinity benefits achieved through revegetation in the dryland areas and the avoided costs to downstream users of the salinity reduction.
Land clearance has increased the salt load contribution from the dryland areas of the Corridor. The removal of deep-rooted perennial native vegetation leads to greater leaching of salts from the soil profile, an increase in saline groundwater recharge and base flow, and an increase in the delivery of salt load to the river. Groundwater in the SA Murray-Darling Basin is saline and travels towards the River Murray as base flow and is discharged directly into the river. This process has been well documented in the SA River Murray (Cook et al. 2004).
Revegetation of high salinity benefit areas of the Corridor with deep-rooted perennial species was considered to have the effect of eliminating recharge and, over time, eliminating the salt contribution to the river from the revegetated localities. Any deep rooted perennial species is considered to effectively eliminate groundwater recharge and hence the salt load contribution including the revegetation of saltbush for fodder, eucalypts for biomass or local native species for biodiversity. There are no specific resource condition targets in the Investment Strategy that address the reduction in river salinity through revegetation in dryland areas. However, revegetation can assist in achieving the three river salinity resource condition targets which are listed below (as numbered in INRM Group (2003c)):
7. By 2020, have salinity of water in the River Murray less than 800 EC for 95% of the time at Morgan to ensure drinking water standards

CSIRO Land and Water Page 42
8. By 2020, have salinity of water in the River Murray less than 543 EC for 80% of the time at Berri Irrigation Pump Station to ensure drinking water standards
9. By 2020, have salinity of water in the River Murray less than 770 EC for 80% of the time at Murray Bridge Pump Station to ensure drinking water standards
This study furthers research into achieving the salinity resource condition targets by integrating and extending previous work assessing the salinity benefits of revegetation in the dryland areas of the River Murray Corridor. We also assess the feasibility of revegetation for achieving salinity benefits. Salinity mitigation is an objective in systematic regional planning for multiple objective NRM in the Corridor. Geographic priorities for revegetation are identified that address salinity objectives as well as other resource condition targets of wind erosion and biodiversity.
4.2. Wind Erosion Soils in the Corridor have varying levels of susceptibility to wind erosion according to the level of clay content in the soil profile. Sandy soils of low clay content are common and tend to have an inherently higher susceptibility to erosion by wind. Land clearance has exacerbated the problem of wind erosion on susceptible soils. Land clearance involves the removal of deep-rooted perennial native vegetation and replacement with shallow-rooted annual crops and pastures. Removal of the soil-binding action and wind speed mitigation provided by deep-rooted perennials increases the risk of soil erosion (see Figure 5). In addition, there are localised areas of long term actively eroding land in the Corridor. Thus, there are two forms of wind erosion of interest for natural resource management in the Corridor. For the purposes of this study it is assumed that any type of deep-rooted perennial vegetation will mitigate soil wind erosion through the permanent soil-binding action of the root systems and the improved protection of the soil from wind exposure. The resource condition target relevant to wind erosion in the SA River Murray Corridor is (INRM Group 2003c):
18. By 2020, reduce the area of agricultural land at risk of wind erosion during June each year by 40%
Mitigation of wind erosion is an objective in systematic regional planning for NRM in the Corridor. Geographic priorities for revegetation are identified that target high wind erosion potential areas as well as the other resource condition targets of salinity and biodiversity.
4.3. Biodiversity Biodiversity includes diversity in genes, species, communities and ecosystems. The diverse physical environments of the Corridor have given rise to high levels of regional biological diversity. Ecosystems include dry and desertic rangelands, grasslands and chenopod shrublands, dune ecosystems, mallee and woodland, and wetland ecosystems of the flood plain. Kahrimanis et al. (2001) provide a detailed assessment of the biodiversity of the SA MDB and identify numerous ecological values and threats affecting the Corridor.
Terrestrial and wetland/riverine ecosystems have both experienced biodiversity decline but for very different reasons. Floodplain, wetland and riverine ecosystems have been degraded by changes to environmental flows resulting from river regulation, and invasion by introduced species. However, in this study we are concerned mainly with terrestrial biodiversity.
Land clearance and agricultural development have been the main contributors to the degradation of terrestrial biodiversity in the Corridor. These processes have led to reduced populations of native plants and animals through both direct habitat removal and indirect population responses to fragmentation. Several species of plant and animal have

CSIRO Land and Water Page 43
disappeared altogether from the region and several more are now threatened with extinction (Kahrimanis et al. 2001). Thus, Kahrimanis et al. (2001) rate the loss of native vegetation as the greatest threat to native biodiversity in the region.
However, several other processes threaten biodiversity in the dryland parts of the Corridor. Over-grazing of remnant vegetation by livestock is the next most serious threat after direct habitat loss and fragmentation (Kahrimanis et al. 2001). Livestock grazing changes plant community composition and structure through the removal of understorey species and the prevention of natural regeneration. Other threatening processes include invasion by pest plant and animal species such as rabbits, goats, and foxes. These species compete with native species for resources or directly predate upon native species.
Kahrimanis et al. (2001) recognise that a comprehensive biodiversity plan needs to include actions that address all of the processes threatening biodiversity in the Corridor and surrounding regions. In this study we focus on setting priorities that address the most serious threat to biodiversity identified by Kahrimanis et al. (2001) – that of native vegetation loss. The resource condition targets for biodiversity in the Corridor that we focus on in this study include (as numbered by INRM Group 2003c):
22. By 2020 improve or maintain condition of terrestrial native vegetation focusing on identified priority areas and improve condition of 50% of remnant vegetation on private land as well as increasing vegetation cover by 1% in the agricultural region.
23. Maintain and improve the conservation status of all threatened National and State listed species and regionally threatened communities and species by 2020.
In addressing these resource condition targets, revegetation of biomass or fodder species are not considered to have any biodiversity benefits as they are typically monocultures and are either periodically harvested or grazed by livestock. Commercial revegetation involves the broadacre planting of a monoculture (e.g. giant mallee (Eucalyptus oleosa) for biomass or old man saltbush (Atriplex nummularia Lindl.) for fodder). In this study, we consider both vegetation management for the maintenance of biodiversity on private land, and revegetation of local native species for the restoration of native habitat. We identify the geographic priorities for both vegetation management and revegetation of local native species for biodiversity according to well established conservation principles adapted to existing spatial data of biological resources. Other NRM objectives of salinity and wind erosion are also considered along with biodiversity.
4.4. Carbon Carbon is an emerging priority in natural resource management. Carbon dioxide accumulation in the Earth’s atmosphere is one of the major factors behind the enhanced greenhouse effect and associated climate change. Under the Kyoto protocol, signatories have committed to a 5.2% reduction in their collective greenhouse gases compared to the year 1990, calculated as an average over the years 2008 – 2012. Different countries have different reduction targets due to the nature of their economies. Australia’s target is an 8% increase on 1990 levels. If signatories wish to increase their emission beyond their target they need to buy carbon credits to offset this increase. However, Australia has not ratified the Kyoto protocol and as a result, any carbon sequestration offsets achieved in Australia are not recognised under the protocol. As such, the ability of Australia to participate in the global carbon market is limited, until it is ratified. However, Australia has signed a greenhouse agreement with the US in which it commits to emission targets. The government has been criticised for limiting its carbon trading market to the US.
The revegetation of cleared landscapes sequesters carbon from the atmosphere. Significant interest exists in Australia in revegetation for carbon sequestration with a view to future participation in a global carbon market. New South Wales and Victoria are in the process of

CSIRO Land and Water Page 44
setting up carbon markets with tradable property rights in anticipation. There has also been substantial interest in the purchase of carbon credits from large-scale Australian revegetation projects from international corporations. Media reports claim that “NSW has already engaged in international carbon trades with a Swiss-Italian electronics company and a Tokyo power utility, but their trades will not be recognised by Kyoto while Australia remains outside the system” (Lane 2004).
Technically, any revegetation done since 1990 is eligible to be traded as carbon credits. Clearly, the larger and faster growing the species and the more productive the climate, the more carbon able to be sequestered. Very recent results from Hobbs and Bennell (2005) suggest that a short cycle eucalypt plantation can sequester between 2.5 and 4.2 tonnes of carbon per hectare per year in the Corridor depending on the climate.
This figure does not include two other important aspects which may contribute to carbon credits. Firstly, mallee species grow a large woody lignotuber underground which acts as a carbon reservoir. Thus, much of the carbon storage of mallee biomass species is underground and any carbon accounting of mallee biomass species must consider this. Secondly, where carbon sequestration replaces grazing as a land use, there may also be carbon offset benefits involved in reducing livestock numbers and associated methane production.
At the time of writing (23.03.05) carbon is trading at €14.85 per tonne on the European market and has doubled in price over the past 2 months. Thus, based on the Hobbs and Bennell (2005) productivity figures alone, potential benefits from carbon credits from eucalypt plantations in the Corridor range between $50 and $105 per hectare per year in today’s market. In perspective, this level of economic return is substantially greater than livestock grazing and is comparable with cereal cropping. Eucalypts are also likely to be more resilient to potential climate change than traditional forms of agriculture.
Carbon credits may be integrated with biomass production. The major area of discordance is that the biomass is burned during processing for electricity and the carbon is released back into the atmosphere. Thus, apart from the subsurface storage, the carbon sequestration involved in biomass production is a zero sum game. However, the production of clean electricity through biomass offsets the need to burn coal to produce electricity. For example, Howard and Olszak (2004) state that on average, 1.363 tonnes of CO2 is produced per megawatt hour of electricity production in Victoria. Typical electricity production from a 5 MW ITP plant is approximately around 40,000 MWh/yr (Enecon 2001) which would offset about 55,000 tonnes of CO2 per year. At today’s prices, this amounts to $1,375,000 AUD in carbon credits per year. This benefit is currently accounted for under the Renewable Energy Credits scheme in Australia which provides payments at a rate of around $40 per Megawatt.
The revegetation of local native species is ideally suited for carbon trading. The revegetated stands must remain in perpetuity for carbon trading, which suits biodiversity goals because communities have the chance to undergo natural successional processes. The restored community has biodiversity benefits and an income may be generated from carbon trading. Different community types are able to sequester different amounts of carbon per hectare. Whilst, revegetation of local native species for biodiversity may have lower productivity rates than those used in the calculations above, the total carbon sequestration could still be significant.
A conservation reserves established after 1990 are eligible for carbon credits under the Kyoto protocol it may also be possible that vegetation management activities could attract carbon credits. However, revegetation of fodder crops such as saltbush are unlikely to attract significant carbon credits because of the low productivity of the species. However, this needs more research.
There are several obstacles to landholders undertaking revegetation for carbon trading, specifically:

CSIRO Land and Water Page 45
• There are significant upfront establishment costs, maintenance and opportunity costs;
• There is some uncertainty about the market for carbon especially given that Australia has not ratified the Kyoto protocol;
• Trading rules and standards could change at any time.
Carbon trading was not pursued further in this study because at the time this research was designed and conducted the level of return per hectare combined with the obstacles to trade meant that it was not likely to be a viable option at the time. The carbon trading landscape has changed dramatically since then. Carbon has emerged as a potentially viable option mainly as a result of a doubling in both the estimates of carbon production in the Corridor and the European market price of carbon. Carbon trading has increasing potential as an economic driver capable of encouraging the large scale land use changes required to achieve NRM targets in the Corridor and elsewhere. Carbon credits can be integrated into a biomass industry and/or revegetation for biodiversity program and would significantly enhance the success of these programs. However, whilst the viability of carbon trading has increased, the barriers to trade still persist and will need to be addressed if carbon trading is to be adopted on a broad scale. More research is required to design policy based on carbon trading that encourages NRM actions in high priority locations and assess factors affecting uptake and impacts (Wang and Medley 2004).
4.5. Remnant Vegetation Management Achieving biodiversity resource condition targets also requires vegetation management actions on a large scale. Vegetation management includes the removal of threatening processes from remnant vegetation patches (i.e. stock exclusion), as well as weed removal and reintroduction of local native species in degraded remnants (Figure 6). The location of vegetation management actions is important to provide the greatest benefits to regional biodiversity. Conservation principles can be used to identify regional geographic priorities for vegetation management. For example, we may seek to make sure that a certain percentage of each climate zone, soil type and vegetation community is managed. We may want to manage a certain proportion of rare and threatened species habitat. Landscape ecological principles also say that we want to concentrate our efforts on the largest, most well connected, least fragmented and most simply shaped patches (Fahrig 2003).

CSIRO Land and Water Page 46
Figure 6 – Remnant mallee community east of Blanchetown (Photo T.E. Schultz 2004).
Figure 7 – Remnant grassy chenopod shrubland community east of Swan Reach (Photo T.E.
Schultz 2004).

CSIRO Land and Water Page 47
The systematic regional geographic priorities identified for vegetation management in this study are also intended as a guide for regional policy and need to be interpreted and adapted to actions on a local scale. Regional geographic priorities need to be converted into on-ground actions in specific locations by local landholders. This includes implementing vegetation management actions such as stock exclusion from specific areas in the landscape and engaging in other supporting management actions such as weed removal as dictated by local conditions. Guidelines for the management of native vegetation also exist (e.g. PIRSA 2001) and these provide appropriately detailed information for landholders to implement on-ground vegetation management actions.
4.6. Revegetation of Local Native Species Revegetation has the potential to assist the conservation of biodiversity in agricultural areas (Hobbs 1993). Revegetation to improve biodiversity should involve a complex suite of indigenous canopy and understorey flora. Native communities must be re-established in geographic priority areas for the greatest regional biodiversity benefit. Geographic priority areas can be identified according to a number of well established conservation principles such as representativeness and landscape ecological principles such as area, connectivity, fragmentation and shape (Saunders et al. 1991, McIntyre and Hobbs 2000, Bryan 2003, Fahrig 2003, Crossman and Bryan in review).
The regional geographic prioritisation of revegetation for biodiversity examined in this study provides a systematic way of ensuring regional resource condition targets are met in the most cost effective way. The geographic priorities identified in this study are aimed at guiding regional INRM policy and subsequent distribution of funds for revegetation for biodiversity, rather than to prescribe the species and communities to be established in the precise locations in the landscape. The systematic regional geographic priorities are too broad in scale to guide local revegetation efforts on the ground. Priority areas need to be interpreted and adapted on a local basis with high resolution geographic information and combined with local knowledge. Many excellent guides to revegetation for biodiversity exist that have been prepared for the Local Action Planning groups in the region (Bennett 1994, Good 1994, Creation Care 1999a, 1999b, 1999c, 1999d, Murray Mallee Local Action Planning Association Inc. 2001, PIRSA 1999, 2001). These guides contain detailed information about revegetation and the reconstruction of native habitat for biodiversity purposes suitable for on-ground application by landholders. They cover issues such as seed sources, how to determine species mixes and community structure for specific sites. In addition, revegetation of local native species needs to occur in conjunction with other actions that enhance biodiversity conservation such as stock removal and pest plant and animal control. These processes occur on a scale that is impossible to consider as part of systematic regional planning and need to be guided by fine scale local on-ground knowledge.
4.7. Revegetation of Biomass Large-scale revegetation of deep-rooted perennials is required to meet resource condition targets in the Corridor. The benefits of these actions are largely public and the costs of which in terms of time and effort are considerable. Revegetation is required largely on private land and the incentives for private landholders and community groups to undertake such a task do not currently exist. Market-based policy initiatives such as biomass industries have the potential to encourage the scale of revegetation necessary. Bennell et al. (2004) investigated a range of economic options for the large scale planting of deep-rooted perennials across the low rainfall areas of southern Australia. Options investigated by Bennell et al. (2004) include pulpwood production, fibre and particle board, bioenergy, Eucalyptus oil and fodder crops. Broadacre planting of Eucalyptus species for bioenergy and oil, and fodder crops for grazing,
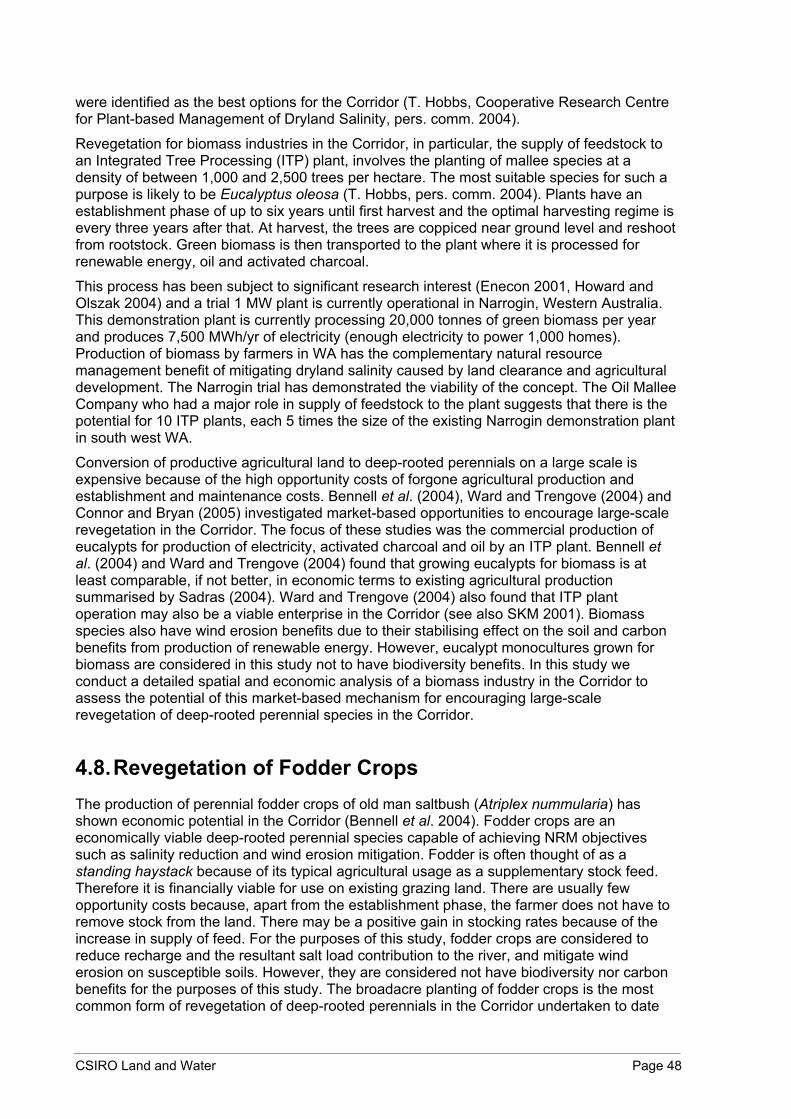
CSIRO Land and Water Page 48
were identified as the best options for the Corridor (T. Hobbs, Cooperative Research Centre for Plant-based Management of Dryland Salinity, pers. comm. 2004).
Revegetation for biomass industries in the Corridor, in particular, the supply of feedstock to an Integrated Tree Processing (ITP) plant, involves the planting of mallee species at a density of between 1,000 and 2,500 trees per hectare. The most suitable species for such a purpose is likely to be Eucalyptus oleosa (T. Hobbs, pers. comm. 2004). Plants have an establishment phase of up to six years until first harvest and the optimal harvesting regime is every three years after that. At harvest, the trees are coppiced near ground level and reshoot from rootstock. Green biomass is then transported to the plant where it is processed for renewable energy, oil and activated charcoal.
This process has been subject to significant research interest (Enecon 2001, Howard and Olszak 2004) and a trial 1 MW plant is currently operational in Narrogin, Western Australia. This demonstration plant is currently processing 20,000 tonnes of green biomass per year and produces 7,500 MWh/yr of electricity (enough electricity to power 1,000 homes). Production of biomass by farmers in WA has the complementary natural resource management benefit of mitigating dryland salinity caused by land clearance and agricultural development. The Narrogin trial has demonstrated the viability of the concept. The Oil Mallee Company who had a major role in supply of feedstock to the plant suggests that there is the potential for 10 ITP plants, each 5 times the size of the existing Narrogin demonstration plant in south west WA.
Conversion of productive agricultural land to deep-rooted perennials on a large scale is expensive because of the high opportunity costs of forgone agricultural production and establishment and maintenance costs. Bennell et al. (2004), Ward and Trengove (2004) and Connor and Bryan (2005) investigated market-based opportunities to encourage large-scale revegetation in the Corridor. The focus of these studies was the commercial production of eucalypts for production of electricity, activated charcoal and oil by an ITP plant. Bennell et al. (2004) and Ward and Trengove (2004) found that growing eucalypts for biomass is at least comparable, if not better, in economic terms to existing agricultural production summarised by Sadras (2004). Ward and Trengove (2004) also found that ITP plant operation may also be a viable enterprise in the Corridor (see also SKM 2001). Biomass species also have wind erosion benefits due to their stabilising effect on the soil and carbon benefits from production of renewable energy. However, eucalypt monocultures grown for biomass are considered in this study not to have biodiversity benefits. In this study we conduct a detailed spatial and economic analysis of a biomass industry in the Corridor to assess the potential of this market-based mechanism for encouraging large-scale revegetation of deep-rooted perennial species in the Corridor.
4.8. Revegetation of Fodder Crops The production of perennial fodder crops of old man saltbush (Atriplex nummularia) has shown economic potential in the Corridor (Bennell et al. 2004). Fodder crops are an economically viable deep-rooted perennial species capable of achieving NRM objectives such as salinity reduction and wind erosion mitigation. Fodder is often thought of as a standing haystack because of its typical agricultural usage as a supplementary stock feed. Therefore it is financially viable for use on existing grazing land. There are usually few opportunity costs because, apart from the establishment phase, the farmer does not have to remove stock from the land. There may be a positive gain in stocking rates because of the increase in supply of feed. For the purposes of this study, fodder crops are considered to reduce recharge and the resultant salt load contribution to the river, and mitigate wind erosion on susceptible soils. However, they are considered not have biodiversity nor carbon benefits for the purposes of this study. The broadacre planting of fodder crops is the most common form of revegetation of deep-rooted perennials in the Corridor undertaken to date

CSIRO Land and Water Page 49
(Figure 8). As the NRM action of revegetation of fodder crops is known to be economically viable, it is not quantitatively assessed in systematic regional planning in this study. Revegetation of fodder can be thought of as a reliable fallback NRM action that can be used to address both salinity and wind erosion in areas that are currently grazed.
Figure 8 – Old Man Saltbush fodder crop plantation near Waikerie (Photo T. E. Schultz 2004).
CSIRO Land and Water Page 50
5. Analysis In this section we present the methods and results of systematic regional planning for multi-objective NRM in the River Murray Corridor. The spatial multi-criteria decision analyses are presented and the geographic priorities for vegetation management, revegetation of local native species, and revegetation of biomass that most cost effectively address regional resource condition targets are assessed. We follow the steps outlined by Malczewski (1999) and described in Section 2.2. The MCDA is very much a spatial analysis. Much of the analysis is centred on the development of attribute or criteria layers for input into the MCDA. The decision rules of the MCDA use an integer programming spatial optimisation model to solve the multi-objective decision problem. Attribute layers are included in spatial optimisation either as part of the objective function where they can be minimised or maximised, or as constraints where targets can be set.
The problem is defined below:
At the highest level, we want to identify cost-effective ways of achieving the following major resource condition targets:
• 50% of remnant vegetation on private land is managed
• 1% of native habitat is restored on cleared land
In addition, other targets involving salinity and wind erosion are also adapted and operationalised from the resource condition targets stated in the Investment Strategy (NRM Group 2003c) and are described in detail in the relevant sections below.
Resource condition targets can be met by identifying geographic priorities for the following NRM actions:
• Management of remnant native vegetation
• Revegetation of local native species for biodiversity
• Revegetation of biomass species
5.1. Preliminary Analyses and Assembly of Evaluation Criteria Layers
A significant part of spatial MCDA is the generation of the criteria or attribute layers for input into the decision analysis. Attribute layers are GIS-based data layers that describe the spatial distribution of each decision criteria. In this study we use a raster data structure based on grid cells of 254 m resolution (6.4516 ha). Creating attribute layers can involve an array of GIS-based spatial process modelling techniques depending on the nature of the attributes modelled. The attribute layers include the salinity layers, biodiversity layers, biomass layers, wind erosion layers, and the opportunity cost layer. The methods and results of developing these layers are presented below. Often the generation of attribute layers is a distinct study in itself with useful results that provide insight for the policy process.
5.1.1 Salinity
One policy option that has potential in the Corridor is the payment of landholders for public salinity benefits of revegetation as part of a salinity credit system (Ward and Connor 2004). A logical payment amount for salinity is the cost of salinity to downstream users avoided by revegetation through recharge reduction. To calculate the spatial distribution of the cost to downstream users we use outputs from SIMPACT that characterise the total salinity benefits for the River Murray achieved through revegetation in the dryland areas in kg/ha/yr. These

CSIRO Land and Water Page 51
are converted to units of Electrical Conductivity (EC) at Morgan and the total present value of avoided costs to downstream users is calculated. A time frame of 100 years is used in this study to conform with the time frames used by the MDBC’s salinity register. The magnitude of the benefits of revegetation in dryland areas for river salinity is reassessed and geographic priorities are identified for revegetation to achieve salinity resource condition targets for NRM.
SIMPACT is an established model originally developed to assess the impact of new irrigation developments on the salinity of the River Murray. SIMPACT is a GIS-based model that uses spatial data describing several biophysical parameters to calculate the spatial distribution of salinity benefits. Now in its second version, SIMPACT II uses the unsaturated zone method and combines information about drainage rates, depth to groundwater and clay thickness with equations linking subsoil moisture content to estimate recharge over time (Wang et al. 2004). The unit response equation (Knight et al. 2002) is used to estimate the impact of increased recharge on discharge to the river and this is multiplied by the acquifer salinity at discharge to calculate salt load to the river (Wang et al. 2004). SIMPACT II works in a raster GIS environment based on 254m grid cell resolution. A derivative of SIMPACT II – SIMRAT (Fargher et al. 2003), has been accredited by the MDBC for assessing the salinity impacts of irrigation developments for charting on the Salinity Register under the MDBC’s Basin Salinity Management Strategy.
SIMPACT is also able to characterise the salinity benefits of revegetating dryland areas to the salt load in the River Murray if revegetation is assumed to eliminate groundwater recharge. However, SIMPACT model can only calculate the impact of revegetation on reducing salt loads to the river for those parts of the landscape where recharge to the aquifer is equal to root zone drainage. These are the areas where root zone drainage has wetted up the soil and sediments from the roots down to the water table. In general, the areas that have sandy soils and a shallower depth to the water-table are the first to reach this fully wetted up state. Most of the land in the dryland parts of the Corridor not yet reached this state, but will do so over the next 10 to 20 years. Hence, SIMPACT cannot be used to calculate the impacts of revegetation undertaken now on salt loads to the river across most of the Corridor. Whilst revegetation in these areas will have salinity benefits for the River Murray, the current version of the SIMPACT model cannot quantify the magnitude of these benefits. Hence, the SIMPACT estimates of the salinity benefits of revegetation used in this study are conservative.
5.1.1.1 Methods SIMPACT calculates the salinity benefit of revegetating each grid cell in kg/ha/yr and this information is converted into units of EC at Morgan and used to calculate the costs of salinity to downstream users avoided by revegetating each grid cell. To do this we first need to convert salt load measured in kg/ha/yr (Figure 9) into units of 100s tonnes/cell/day as these are the units required in the conversion process (Figure 10). This is done by multiplying SIMPACT outputs by the area in hectares of each cell (6.4516 ha), then dividing by the number of days in a year (365.25) and 100,000 to convert kg into 100s of tonnes. Note that all operations are conducted in a raster GIS and the values for all grid cells are calculated simultaneously using raster functions within the GIS.

CSIRO Land and Water Page 52
Berri
Morgan
Mannum
Loxton
RenmarkWaikerie
Swan Reach
Tailem Bend
Blanchetown
Murray Bridge
Kingston-On-Murray
350,000
350,000
400,000
400,000
450,000
450,000
500,000
500,000
6,10
0,00
0
6,10
0,00
0
6,15
0,00
0
6,15
0,00
0
6,20
0,00
0
6,20
0,00
0
6,25
0,00
0
6,25
0,00
0
0 10 20
Kilometres
Salinity Benefits from Revegetation(kg/ha/yr)
Native Vegetation1956 FloodplainCleared Areas
Irrigated AreasTowns
1 - 55.1 - 2121.1 - 6464.1 - 126126.1 - 231231.1 - 510510.1 - 944944.1 - 6,638
River Murray
Corridor Boundary
Figure 9 – Salinity benefits of revegetation as output from SIMPACT II in kg/ha/yr.
The conversion is:
100,000365.25
4516.6×
×= k
kSIMPACT
SL
Where:
SLk = Salinity benefit of revegetating each grid cell (k) measured in 100s tonnes/cell/day
SIMPACTk = Salinity benefit of revegetating each grid cell (k) measured in kg/ha/yr as output by SIMPACT
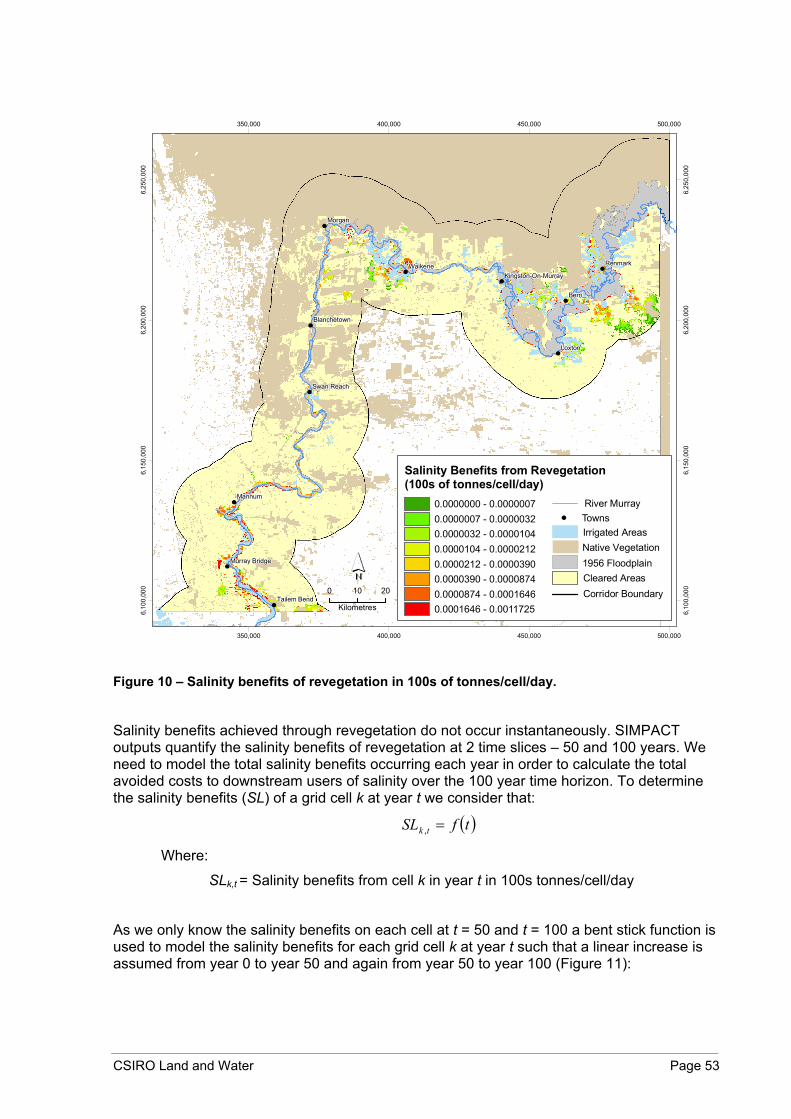
CSIRO Land and Water Page 53
Berri
Morgan
Mannum
Loxton
RenmarkWaikerie
Swan Reach
Tailem Bend
Blanchetown
Murray Bridge
Kingston-On-Murray
350,000
350,000
400,000
400,000
450,000
450,000
500,000
500,000
6,10
0,00
0
6,10
0,00
0
6,15
0,00
0
6,15
0,00
0
6,20
0,00
0
6,20
0,00
0
6,25
0,00
0
6,25
0,00
0
0 10 20
Kilometres
Salinity Benefits from Revegetation(100s of tonnes/cell/day)
Native Vegetation1956 FloodplainCleared Areas
Irrigated AreasTowns
0.0000000 - 0.00000070.0000007 - 0.00000320.0000032 - 0.00001040.0000104 - 0.00002120.0000212 - 0.00003900.0000390 - 0.00008740.0000874 - 0.00016460.0001646 - 0.0011725
River Murray
Corridor Boundary
Figure 10 – Salinity benefits of revegetation in 100s of tonnes/cell/day.
Salinity benefits achieved through revegetation do not occur instantaneously. SIMPACT outputs quantify the salinity benefits of revegetation at 2 time slices – 50 and 100 years. We need to model the total salinity benefits occurring each year in order to calculate the total avoided costs to downstream users of salinity over the 100 year time horizon. To determine the salinity benefits (SL) of a grid cell k at year t we consider that:
( )tfSL tk =, Where:
SLk,t = Salinity benefits from cell k in year t in 100s tonnes/cell/day
As we only know the salinity benefits on each cell at t = 50 and t = 100 a bent stick function is used to model the salinity benefits for each grid cell k at year t such that a linear increase is assumed from year 0 to year 50 and again from year 50 to year 100 (Figure 11):

CSIRO Land and Water Page 54
50
50,,
tSLSL k
tk
×=
for t <= 50
( )( )50,
50,100,
5050
kkk
kt SLtSLSL
SL +−−
= for 50 < t <= 100
Where:
SLk,50 = Known salinity benefits of revegetating cell k in year 50 in 100s tonnes/cell/day
SLk,100 = Known salinity benefits of revegetating cell k in year 100 in 100s tonnes/cell/day
Figure 11 – Example of a bent stick function used to estimate the increasing salinity benefits achieved through revegetation of a grid cell over time. Individual bent stick functions are modelled for each grid cell and may be convex or concave depending on the hydrogeological and geographical disposition of each cell.
The outputs of SIMPACT modelling are then converted into Electrical Conductivity units measured at Morgan (Figure 1) in SA (i.e. ECs at Morgan). This is done to assess the salinity benefits of revegetation in the units used by MDBC salinity targets (i.e. 800 EC at Morgan 95% of the time). Salinity benefits of revegetation output from SIMPACT are converted to units of EC at Morgan using information contained in the Murray-Darling Basin Commission’s BigMod Ready Reckoner. This information provides conversion coefficients which convert salt load in 100s of tonnes/cell/day into EC at Morgan at several points in the river at an assumed flow rate of <10,000 ML/day. Conversion coefficients had been converted into GIS by DEH using a linear interpolation of point-based Ready Reckoner data along the river. Dryland grid cells are attributed values under the assumption that groundwater flows from each cell to the nearest point in the river (Figure 12). By multiplying the GIS layers we calculate the total salinity benefits of revegetating each grid cell in EC at Morgan at t = 50 and 100 years as:
ktktk ECMSLEC ×= ,,
SLk (
kg/h
a/yr
)
50 100
0.5
1
0 Year
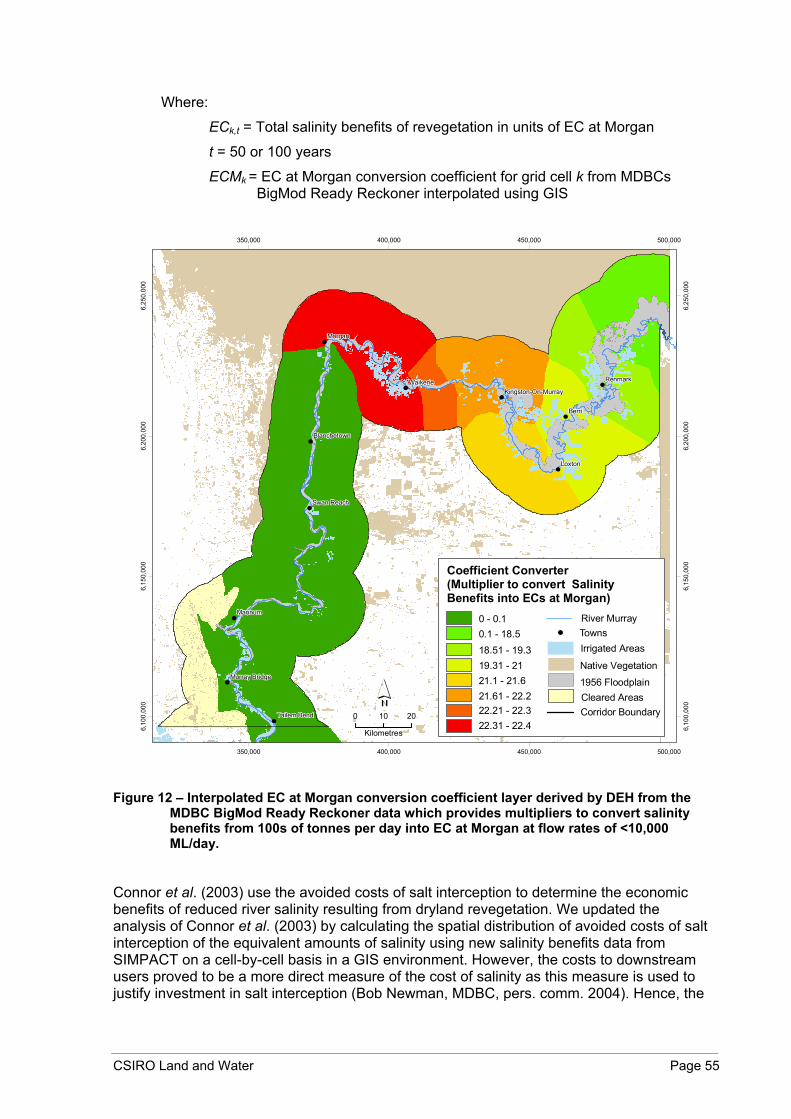
CSIRO Land and Water Page 55
Where:
ECk,t = Total salinity benefits of revegetation in units of EC at Morgan
t = 50 or 100 years
ECMk = EC at Morgan conversion coefficient for grid cell k from MDBCs BigMod Ready Reckoner interpolated using GIS
Berri
Morgan
Mannum
Loxton
RenmarkWaikerie
Swan Reach
Tailem Bend
Blanchetown
Murray Bridge
Kingston-On-Murray
350,000
350,000
400,000
400,000
450,000
450,000
500,000
500,000
6,10
0,00
0
6,10
0,00
0
6,15
0,00
0
6,15
0,00
0
6,20
0,00
0
6,20
0,00
0
6,25
0,00
0
6,25
0,00
0
0 10 20
Kilometres
Coefficient Converter (Multiplier to convert Salinity Benefits into ECs at Morgan)
Native Vegetation
1956 FloodplainCleared Areas
Irrigated AreasTowns
0 - 0.10.1 - 18.518.51 - 19.319.31 - 2121.1 - 21.621.61 - 22.222.21 - 22.322.31 - 22.4
River Murray
Corridor Boundary
Figure 12 – Interpolated EC at Morgan conversion coefficient layer derived by DEH from the
MDBC BigMod Ready Reckoner data which provides multipliers to convert salinity benefits from 100s of tonnes per day into EC at Morgan at flow rates of <10,000 ML/day.
Connor et al. (2003) use the avoided costs of salt interception to determine the economic benefits of reduced river salinity resulting from dryland revegetation. We updated the analysis of Connor et al. (2003) by calculating the spatial distribution of avoided costs of salt interception of the equivalent amounts of salinity using new salinity benefits data from SIMPACT on a cell-by-cell basis in a GIS environment. However, the costs to downstream users proved to be a more direct measure of the cost of salinity as this measure is used to justify investment in salt interception (Bob Newman, MDBC, pers. comm. 2004). Hence, the

CSIRO Land and Water Page 56
results of the avoided costs of salt interception are not presented here but are available from the authors.
We determine the avoided costs of salinity to downstream users achieved by revegetating each grid cell k using the SIMPACT salinity benefit outputs and indicative estimates of the costs of salinity to downstream users described by GHD (1999). This is done in a similar way as the calculation of ECs at Morgan. The GHD (1999) figures are also represented in the BigMod Ready Reckoner for flow rates of <10,000 ML/day and include cost coefficients at several points along the river in thousands of dollars per year per 100 tonnes/day. This information has been spatially interpolated and converted to GIS format by DEH (Figure 13). By multiplying the modelled salinity benefits of revegetation of each dryland cell in 100s tonnes/cell/day by the cost to downstream users in thousands of dollars per 100 tonnes of salt per day we arrive at the total cost to downstream users of river salinity avoided by revegetating each grid cell.
Berri
Morgan
Mannum
Loxton
RenmarkWaikerie
Swan Reach
Tailem Bend
Blanchetown
Murray Bridge
Kingston-On-Murray
350,000
350,000
400,000
400,000
450,000
450,000
500,000
500,000
6,10
0,00
0
6,10
0,00
0
6,15
0,00
0
6,15
0,00
0
6,20
0,00
0
6,20
0,00
0
6,25
0,00
0
6,25
0,00
0
0 10 20
Kilometres
Coefficient Converter (Multiplier to convert Salinity Benefits into cost to downstream users)
Native Vegetation
1956 FloodplainCleared Areas
Irrigated AreasTowns
0 - 350351 - 700701 - 1,0401,041 - 1,3901,391 - 1,7401,741 - 2,0802,081 - 2,4302,431 - 2,780
River Murray
Corridor Boundary
Figure 13 – Interpolated costs to downstream users conversion coefficient layer derived by
DEH from the MDBC BigMod Ready Reckoner data which provides multipliers to convert salinity benefits from 100s of tonnes per day into $1,000s of dollars per year in downstream costs at flow rates of <10,000 ML/day.
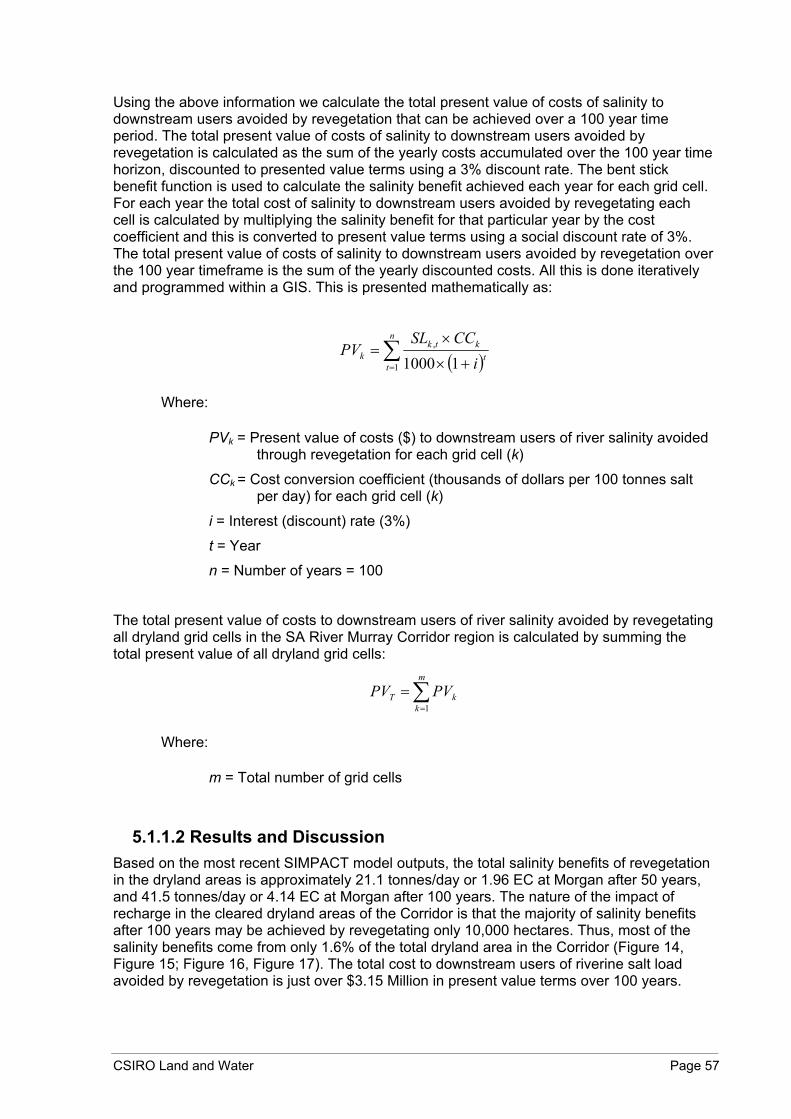
CSIRO Land and Water Page 57
Using the above information we calculate the total present value of costs of salinity to downstream users avoided by revegetation that can be achieved over a 100 year time period. The total present value of costs of salinity to downstream users avoided by revegetation is calculated as the sum of the yearly costs accumulated over the 100 year time horizon, discounted to presented value terms using a 3% discount rate. The bent stick benefit function is used to calculate the salinity benefit achieved each year for each grid cell. For each year the total cost of salinity to downstream users avoided by revegetating each cell is calculated by multiplying the salinity benefit for that particular year by the cost coefficient and this is converted to present value terms using a social discount rate of 3%. The total present value of costs of salinity to downstream users avoided by revegetation over the 100 year timeframe is the sum of the yearly discounted costs. All this is done iteratively and programmed within a GIS. This is presented mathematically as:
( )∑
= +×
×=
n
tt
ktkk i
CCSLPV
1
,
11000
Where:
PVk = Present value of costs ($) to downstream users of river salinity avoided through revegetation for each grid cell (k)
CCk = Cost conversion coefficient (thousands of dollars per 100 tonnes salt per day) for each grid cell (k)
i = Interest (discount) rate (3%)
t = Year
n = Number of years = 100
The total present value of costs to downstream users of river salinity avoided by revegetating all dryland grid cells in the SA River Murray Corridor region is calculated by summing the total present value of all dryland grid cells:
∑=
=m
kkT PVPV
1
Where:
m = Total number of grid cells
5.1.1.2 Results and Discussion Based on the most recent SIMPACT model outputs, the total salinity benefits of revegetation in the dryland areas is approximately 21.1 tonnes/day or 1.96 EC at Morgan after 50 years, and 41.5 tonnes/day or 4.14 EC at Morgan after 100 years. The nature of the impact of recharge in the cleared dryland areas of the Corridor is that the majority of salinity benefits after 100 years may be achieved by revegetating only 10,000 hectares. Thus, most of the salinity benefits come from only 1.6% of the total dryland area in the Corridor (Figure 14, Figure 15; Figure 16, Figure 17). The total cost to downstream users of riverine salt load avoided by revegetation is just over $3.15 Million in present value terms over 100 years.

CSIRO Land and Water Page 58
The outputs of SIMPACT modelling suggest that a geographically targeted approach is required to encourage revegetation in dryland areas that offer large salinity benefits. The costs of salinity to downstream users avoided through revegetation of the highest salinity benefit grid cells is over $2,500/ha (Figure 14). This decreases rapidly to the point where the total avoided costs tends to zero after the highest 10,000 ha of salinity benefit areas.
Salinity benefits may take many years until full realisation as they tend to occur over long time scales. As a result, the benefits are greatly discounted and there is significant risk surrounding the delivery of these benefits. By comparison, Salt Interception Schemes have much greater certainty surrounding their impact on salt reduction and the impact reaches maximum effectiveness after just a few years of operation. Hence, the investment in revegetation as a means of salinity reduction in the river is not as cost effective as it commands lower returns and there is a high level of risk involved in the investment. The adoption of a salinity credit scheme for encouraging revegetation would probably not justify the costs of design, implementation and administration in the Corridor. It may however, add weight to an integrative NRM policy mix for natural resource management. The cost of salinity to downstream users may provide a suitable guide as to the appropriate level of payment for salinity credits in the Corridor.

CSIRO Land and Water Page 59
Figure 14 – Relationship between salinity benefits in EC at Morgan after 100 years achieved through revegetation, area of revegetation, and total present value of costs of salinity to downstream users avoided by revegetation. Grid cells are ranked from highest to lowest salinity benefit. Most of the benefit comes from an area of around 10,000 hectares.
Area of Revegetation and Downstream Costs per Hectare
0
500
1,000
1,500
2,000
2,500
3,000
0 10,000 20,000 30,000 40,000 50,000
Area of Revegetation (ha)
Dow
nstr
eam
Cos
ts
($N
PV /
Ha)
Area of Revegetation and Downstream Costs of Salinity
0
500,000
1,000,000
1,500,000
2,000,000
2,500,000
3,000,000
3,500,000
0 10,000 20,000 30,000 40,000 50,000
Area of Revegetation (ha)
Dow
nstr
eam
Cos
t R
educ
tion
($N
PV)
Area of Revegetation and EC Reduction
0
1
2
3
4
5
0 10,000 20,000 30,000 40,000 50,000
Area of Revegetation (ha)
EC R
educ
tion
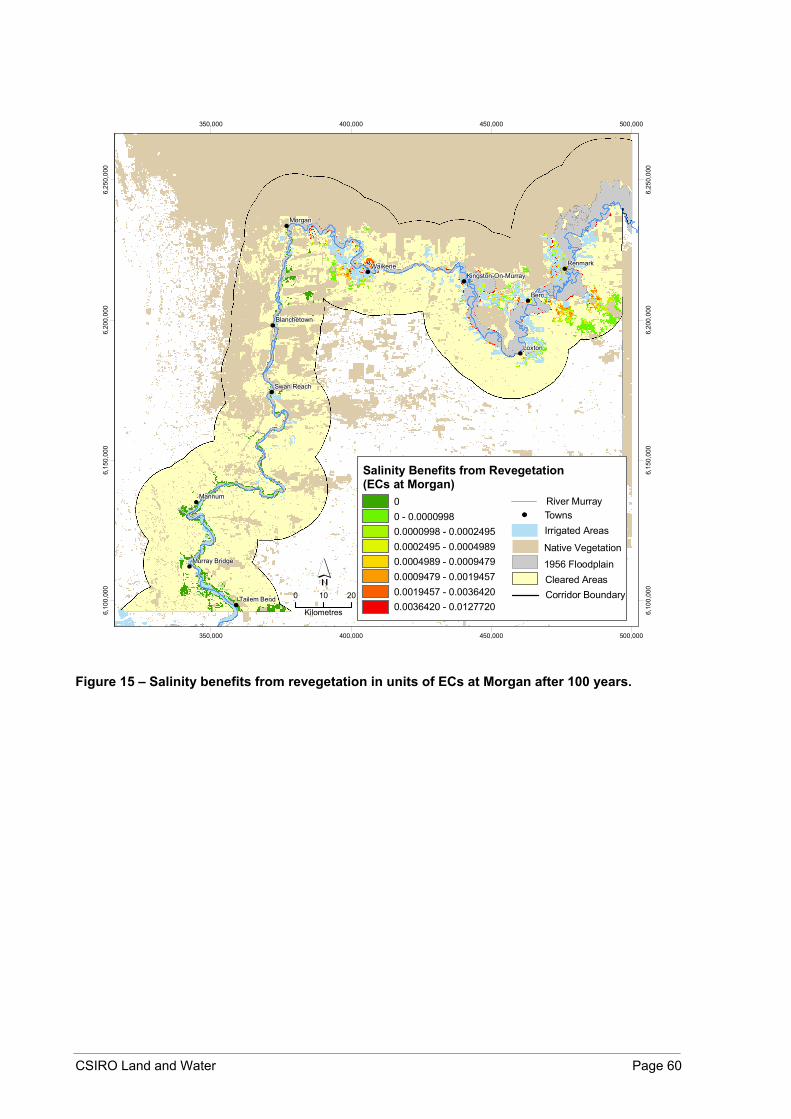
CSIRO Land and Water Page 60
Berri
Morgan
Mannum
Loxton
RenmarkWaikerie
Swan Reach
Tailem Bend
Blanchetown
Murray Bridge
Kingston-On-Murray
350,000
350,000
400,000
400,000
450,000
450,000
500,000
500,000
6,10
0,00
0
6,10
0,00
0
6,15
0,00
0
6,15
0,00
0
6,20
0,00
0
6,20
0,00
0
6,25
0,00
0
6,25
0,00
0
0 10 20
Kilometres
Salinity Benefits from Revegetation(ECs at Morgan)
Native Vegetation1956 FloodplainCleared Areas
Irrigated AreasTownsRiver Murray0
0 - 0.00009980.0000998 - 0.00024950.0002495 - 0.00049890.0004989 - 0.00094790.0009479 - 0.00194570.0019457 - 0.00364200.0036420 - 0.0127720
Corridor Boundary
Figure 15 – Salinity benefits from revegetation in units of ECs at Morgan after 100 years.

CSIRO Land and Water Page 61
Berri
Morgan
Mannum
Loxton
RenmarkWaikerie
Swan Reach
Tailem Bend
Blanchetown
Murray Bridge
Kingston-On-Murray
350,000
350,000
400,000
400,000
450,000
450,000
500,000
500,000
6,10
0,00
0
6,10
0,00
0
6,15
0,00
0
6,15
0,00
0
6,20
0,00
0
6,20
0,00
0
6,25
0,00
0
6,25
0,00
0
0 10 20
Kilometres
Total Present Value of Avoided Costs of Salinity to Downstream Users from Revegetation
Native Vegetation1956 FloodplainCleared Areas
Irrigated AreasTowns
$0.00$0.01 - $66.00$66.01 - $198.00$198.01 - $397.00$397.01 - $728.00$728.01 - $1,390.00$1,390.01 - $2,978.00$2,978.01 - $16,948.00
River Murray
Corridor Boundary
Figure 16 – Total present value of costs of salinity to downstream users avoided by
revegetation in present value terms over a timeframe of 100 years.
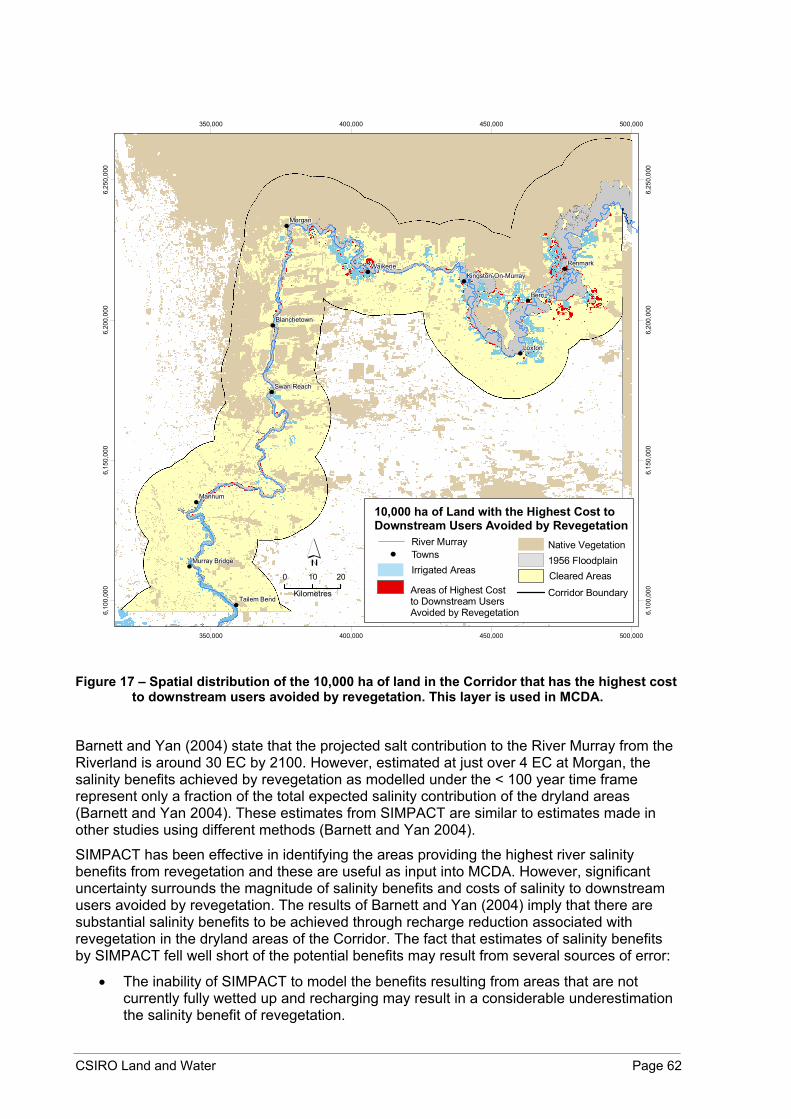
CSIRO Land and Water Page 62
Berri
Morgan
Mannum
Loxton
RenmarkWaikerie
Swan Reach
Tailem Bend
Blanchetown
Murray Bridge
Kingston-On-Murray
350,000
350,000
400,000
400,000
450,000
450,000
500,000
500,000
6,10
0,00
0
6,10
0,00
0
6,15
0,00
0
6,15
0,00
0
6,20
0,00
0
6,20
0,00
0
6,25
0,00
0
6,25
0,00
0
Native Vegetation1956 FloodplainCleared AreasIrrigated Areas
Towns
10,000 ha of Land with the Highest Cost to Downstream Users Avoided by Revegetation
0 10 20
Kilometres Areas of Highest Cost to Downstream UsersAvoided by Revegetation
River Murray
Corridor Boundary
Figure 17 – Spatial distribution of the 10,000 ha of land in the Corridor that has the highest cost
to downstream users avoided by revegetation. This layer is used in MCDA.
Barnett and Yan (2004) state that the projected salt contribution to the River Murray from the Riverland is around 30 EC by 2100. However, estimated at just over 4 EC at Morgan, the salinity benefits achieved by revegetation as modelled under the < 100 year time frame represent only a fraction of the total expected salinity contribution of the dryland areas (Barnett and Yan 2004). These estimates from SIMPACT are similar to estimates made in other studies using different methods (Barnett and Yan 2004).
SIMPACT has been effective in identifying the areas providing the highest river salinity benefits from revegetation and these are useful as input into MCDA. However, significant uncertainty surrounds the magnitude of salinity benefits and costs of salinity to downstream users avoided by revegetation. The results of Barnett and Yan (2004) imply that there are substantial salinity benefits to be achieved through recharge reduction associated with revegetation in the dryland areas of the Corridor. The fact that estimates of salinity benefits by SIMPACT fell well short of the potential benefits may result from several sources of error:
• The inability of SIMPACT to model the benefits resulting from areas that are not currently fully wetted up and recharging may result in a considerable underestimation the salinity benefit of revegetation.

CSIRO Land and Water Page 63
• The time taken for revegetation to result in riverine salinity benefits for the River Murray may be longer than the 100 year time frame used in this study resulting in an underestimation the long term salinity benefit of revegetation.
• All SIMPACT models use 1920 as the date of vegetation clearance. However, clearance of remnant vegetation in the region occurred over the period from 1920 to 1970. This will cause salinity benefits to be overestimated and to occur earlier than expected.
• The assumption of SIMPACT that revegetation causes the immediate cessation of recharge may not reflect reality as plants may take some years before they are able to fully intercept rainfall and eliminate recharge. This would also result in an overestimation of salinity benefits of revegetation.
Hence, there is an urgent need for further model calibration and improvement of the SIMPACT algorithms to more accurately represent the processes driving the impact of revegetation on river salinity over time in the Corridor, particularly the wetting and drying scenarios. A better understanding of the salinity benefits of revegetation in the dryland areas of the Corridor to the River Murray may also be gained from taking a longer term modelling approach.
5.1.2 Biodiversity
The conservation of biodiversity is a high priority in regional NRM (Kahrimanis et al. 2001) as is reflected by the resource condition targets for vegetation management and revegetation of local native species and native habitat. The resource condition targets specified for terrestrial biodiversity in the Investment Strategy (INRM Group 2000c) specify that 50% of remnant vegetation on private land should be managed and that the area of native vegetation should be increased by 1%. However, NRM actions need to be targeted in high priority areas where the greatest biodiversity benefits can be achieved. Otherwise, conservation efforts will not have optimum benefits for biodiversity. Targeting high priority areas needs planning.
Conservation planning invariably occurs in a highly competitive environment. To ensure the maintenance of biodiversity in a region, nature conservation has to occur within the matrix of competing, productive land uses, and the proportion of the landscape required for biodiversity conservation is not insignificant (Andren, 1994; Freudenberger et al., 2004).
Nature conservation generally precludes the undertaking of traditional agricultural land uses including livestock grazing. Non agricultural economic benefits can include more passive uses such as honey production, recreation, carbon sequestration, salinity mitigation and other ecosystem services. However, markets for these more passive economic uses are not nearly as well developed as the existing agricultural land uses and there is limited potential for these in the Corridor. Hence, conservation involves an opportunity cost. Therefore, one of the most important criteria for planning realistic and implementable conservation plans is efficiency (Pressey and Nicholls 1989, Ando et al. 1998, Rodrigues et al. 2000). The planned system of conservation areas needs to satisfy ecological goals at the minimum cost both in terms of opportunity costs and establishment costs of revegetation.
The resource condition targets specified in the Investment Strategy (INRM Group 2000c) relevant to biodiversity are high level targets and refer only to the total area of vegetation management and revegetation actions required. However, the geographic location of these actions is critically important to their overall benefit to the stated goal of biodiversity conservation. Without smart planning, conservation actions may have very little benefit for biodiversity. The benefit to biodiversity of vegetation management and revegetation actions can be maximised if they occur in high priority locations. General principles are available for the spatially-explicit identification of high priority areas for conservation actions and these are termed systematic conservation planning (SCP) principles (Margules and Pressey, 2000). SCP principles can be used to maximise the benefits to biodiversity of expensive
CSIRO Land and Water Page 64
conservation actions such as vegetation management and revegetation. This will enhance the existing resource condition targets for the Corridor to the point where vegetation management actions not only address high level resource condition targets but they also have maximum benefit for biodiversity by also meeting ecological goals.
Systematic conservation planning principles (Margules and Pressey 2000) are commonly used to set regional conservation priorities (Kirkpatrick 1983, Margules et al. 1988, Bedward et al. 1992, Pressey et al. 1993, Underhill 1994, Csuti et al. 1997, Margules et al. 2002, Bryan 2003, Gerner and Bryan 2003a&b). They provide an ideal framework on which to base geographic priority setting for both vegetation management and revegetation for biodiversity. These principles also underpin other regional-scale vegetation protection and management projects (e.g. Moritz and Moss 2003, Oliver 2003, Parkes et al. 2003, Dominelli and Smith 2004). These approaches aim to design reserve systems that satisfy established conservation principles most efficiently. SCP principles include comprehensiveness, adequacy, representativeness, efficiency, flexibility, irreplaceability and complementarity. Comprehensiveness refers to the inclusion of the full range of biophysical variation across bioregions. Similarly, representativeness refers to the inclusion of the range of biophysical variation within a bioregion (Austin and Margules 1986). Adequacy is a much more nebulous concept and refers to the ability of a landscape to maintain ecological viability and the integrity of populations, species and communities. Flexibility refers to the design options presented to decision makers as conservation plans need to be flexible to changes dictated by non-biophysical factors. Irreplaceability considers the potential contribution of a site to a reservation goal and the extent to which conservation options are lost if the site is lost (Pressey et al. 1994, Ferrier et al. 2000). Complementarity involves the selection of sites that are most complementary to existing reserve networks (e.g. Howard et al. 1998).
Comprehensiveness operates on an inter-regional scale and is not applicable in this regional scale analysis of the Corridor. For the principle of representativeness (Austin and Margules 1986), vegetation management and revegetation actions should aim to target the range of biophysical diversity as measured by the available data. The concept of representativeness is one of the most widely used systematic conservation planning principles (Margules and Pressey 2000, JANIS 1997). The underlying premise is that if the full diversity of biophysical features is covered then the full range of biodiversity, even the species we have no knowledge of, is also represented by conservation actions. For example, we could set targets of managing 50% of each vegetation community type and each climate type.
Adequacy is a complex concept but should consider all processes affecting the long-term maintenance of biodiversity. It includes the removal of threatening processes, provision for adaptation to climate change and for evolutionary development. With the lack of detailed information on these processes with respect to the biota of the Corridor, adequacy is loosely applied in terms of targeting areas for conservation actions based on the size, shape, fragmentation and connectivity of habitat patches. Targeting locations that have particular landscape structural characteristics may help maintain populations of individual species and/or taxonomic groups because size, shape and juxtaposition of habitat influence the persistence of species (see Fahrig 2003 for a detailed review). Efficient conservation planning minimises the cost of conservation actions whilst still satisfying conservation principles and flexible planning presents options for restoration activities. Complementarity is related to efficiency and is inherently applied in this study as we select the network of sites for conservation actions that together are maximally complementary. The irreplaceability of sites is not considered in this study but may be considered in future analyses.
These conservation planning design concepts provide a useful theoretical basis for setting geographic priorities for both vegetation management and for revegetation of local native species for biodiversity in the Corridor. Systematic conservation planning principles can be directly applied to setting priorities for vegetation management and Bryan (2003) and Crossman and Bryan (in review) have adapted these principles to geographic priority setting for revegetation for biodiversity. However, principles need to be interpreted in the light of the

CSIRO Land and Water Page 65
available spatial data and transformed into targets for both vegetation management and revegetation.
Compiling data on the distribution of biodiversity is a precursor to systematic conservation planning (Margules and Pressey, 2000). Comprehensive data of the autecology of all or even some species in a region can rarely be obtained and surrogate data is widely used as a supplement or alternative (e.g. Pressey and Nichols 1989, Bedward et al. 1992, Belbin 1993, Wessels et al. 1999). The use of biophysical surrogates to characterise the distribution of biodiversity is based on niche theory (Giller 1984). All species are limited in abundance and distribution by a set of environmental variables controlling survival and reproduction (Austin 1985, Austin et al. 1990). Thus, theoretically, surrogates that describe the physical environment, and hence, biological potential, are considered to be appropriate measurements of species fundamental niches. The aim in conservation planning should then be to represent homogenous units found within environmental data (i.e. soil land systems), hence maximising the chances of capturing species niches as described by that data. When working with remnant vegetation some biological data can be used such as the distribution of vegetation communities. However, in cleared areas surrogates are often limited to physical environmental variables. Occasionally, records exist of the distribution of pre-disturbance communities, such as in historical databases and ‘pre-European’ vegetation maps (Bickford and Mackey, 2004). However, these communities may only have been one of many that could have potentially occurred.
Debate surrounds the use of most data types in conservation planning including biophysical surrogates and individual species habitat data as a determinant of biodiversity (e.g. Lambeck 1997, Andelman and Fagan 2000, Lindenmayer et al. 2002, Brooks et al. 2004, Pressey 2004). It is becoming increasingly evident that we need to include all types of data – biological and physical, modelled and empirical, surrogate and direct (Maddock and du Plessis 1999). In addition, we need to include data on all of the known ecological processes in a region. The most common approach is to include a combination of biological species-based data and biological (e.g. vegetation communities) and physical environmental (e.g. climate) surrogates. This is a conservative approach to conservation planning because the more processes and data types included the greater the chance of capturing the range of biodiversity and enhancing the persistence of biota.
Biodiversity plans are an important first step in planning for the conservation of biodiversity in regions. Biodiversity plans have a valuable role to play in the cataloguing and documenting biodiversity resources and threats to these resources. However they tend not to provide sufficient spatial detail of systematic priorities for efficient conservation based on ecological theory. The role of systematic conservation plans is to take the valuable information assembled in biodiversity plans and apply general SCP principles to guide decision-makers. In this study we use the most relevant and best available data synthesised in the Biodiversity Plan for the South Australian Murray-Darling Basin by Kahrimanis et al. (2001).
Comprehensive systematic conservation plans have been developed for a only a few well studied regions of the world, most notably western New South Wales, the fynbos global biodiversity hotspot of South Africa (Cowling et al. 2003), and the Klamath-Siskiyou Ecoregion in the US (Noss et al. 1999). For well-studied data-rich regions comprehensive systematic conservation plans are able to extend the standard SCP principles and select areas that enhance the long term persistence of species. Often, data from metapopulation analyses and autecological studies in these regions can identify key areas for conservation that are essential for maintaining critical ecological processes such as adaptation to climate change through migration along climatic gradients, spatial knowledge of source-sink population dynamics and hotspot areas.
However, in regions that are not yet so well studied we must rely on existing commonly available data on the distribution of vegetation communities, soils, climate and perhaps some rare and threatened species information to set geographic priorities for conservation. The

CSIRO Land and Water Page 66
beauty of systematic conservation plans is that they are designed to be iterative and flexible. They can be updated as new information and data becomes available on many factors including species ecology and habitat requirements, migration and dispersal routes and climate change. They can also be updated as conservation actions develop and the priority of different actions changes. In this study we provide a first attempt at identifying geographic priorities for vegetation management and revegetation in the Corridor. The methods used are flexible and can be enhanced with the addition of new information and priorities.
The principles of systematic regional planning for biodiversity as developed in this study are closely aligned with the Naturelinks principles that have been adopted in South Australia (DEH 2003). Specifically, SRP enables the planning of biodiversity conservation activities at a landscape scale and habitat restoration at a large spatial scale. Landscape design principles are incorporated to facilitate the enhanced functioning of metapopulations. An ecological community approach is used in SRP as representative samples of each community type are targeted for conservation and restoration. SRP takes a long term approach to conservation. Finally, SRP includes all available ecological knowledge and provides a flexible framework that enables the inclusion of new concepts and information. Thus, systematic regional planning provides a structured and quantitative approach to implementing the Naturelinks principles for biodiversity conservation and extends these in taking a multiple-objective approach to NRM.
5.1.2.1 Methods and Results Crossman et al. (2004) assembled a variety of existing spatial data layers characterising individual elements of the biodiversity of the SA Murray-Darling Basin to provide input into this study. Extra data layers have been created for setting geographic priorities for both remnant vegetation management and revegetation for biodiversity in this study to supplement those produced by Crossman et al. (2004). The data layers were created for the entire SA MDB NRM region and are clipped to the River Murray Corridor. Some rescaling has also been done to prepare the layers for input into the spatial optimisation procedures in MCDA.
The generation of biodiversity layers for input into MCDA are relevant to two NRM actions:
• Remnant vegetation management for biodiversity, and;
• Revegetation of local native species for biodiversity.
Biodiversity layers are included in the MCDA as attributes/criteria and may be used in 2 ways - either as costs in the objective function or as targets in the constraints. The nature of the data layers determines how they are best used in MCDA. Continuous (or real) valued data layers are more suited for use in the objective function. In this case the layers are set up as costs with the most desirable aspects of the layer having low values and the least desirable having high values. The objective is then to minimise the cost of the grid cells selected for NRM actions. Categorical data layers such as vegetation communities are best included as constraints. In this case conditional targets are set (e.g. revegetate 15% of each climate zone or revegetate all long term eroding areas). The layers and their usage in MCDA are summarised in Table 3 and described in more detail below and in Crossman et al. (2004).

CSIRO Land and Water Page 67
Objective Type Vegetation Management Revegetation Objective Function Area Landscape Context Shape Fragmentation Fragmentation Habitat Quality Constraint Vegetation Communities (125) Pre-European Vegetation Communities (23) Climate Zones (8) Climate Zones (8) Significant Fauna Habitat (11) Soil Land Systems (61) Table 3 – Biodiversity layers generated as attributes and used as either constraints or in the
objective function in the MCDA for both vegetation management and revegetation. Attributes used as constraints are followed by the number of classes in brackets. Objective function attributes are continuously scaled between 1 and 4 or 5.
5.1.2.1.1 Vegetation Management Attribute Maps There are 7 biodiversity attributes relevant to the management of native vegetation (Table 3) with 4 attributes suitable for use in the objective function and three as constraints in MCDA. The Area, Shape, Fragmentation and Habitat Quality attributes derived from DEH regional floristic vegetation datasets are continuously valued cost scores suitable for use in the objective function. Each attribute has either integer or real cost scores ranging between 1 and 4 or 5 to enable numerically unbiased combination of criteria. Cost scores are ranked based on conservation priority with highest priority given the lowest cost score of 1 and lowest priority given the highest cost score of 5. The objective is to minimise the total cost scores.
Area A generally accepted conservation principle is that bigger patches are better for biodiversity conservation (e.g. Diamond 1975, Diamond and May 1976, Gilpin and Soule 1986, Saunders et al. 1991, Hanski 1994, Fahrig 2003). In general, larger areas can support larger populations and are generally able to support more species. We calculate the area of each patch of remnant vegetation, categorise into five classes, and prioritise according to this principle (Table 4; Figure 18).
Area Categories Cost Score Area (ha) Number of Patches
>= 500 ha 1 449,173 161 200 ha – 499 ha 2 17,781 123 100 ha – 199 ha 3 12,310 141 50 ha – 99 ha 4 8,877 178 < 50 ha 5 22,735 1602
Table 4 – Area classification and prioritisation of remnant vegetation patches.

CSIRO Land and Water Page 68
Berri
Morgan
Mannum
Loxton
RenmarkWaikerie
Swan Reach
Tailem Bend
Blanchetown
Murray Bridge
Kingston-On-Murray
350,000
350,000
400,000
400,000
450,000
450,000
500,000
500,000
6,10
0,00
0
6,10
0,00
0
6,15
0,00
0
6,15
0,00
0
6,20
0,00
0
6,20
0,00
0
6,25
0,00
0
6,25
0,00
0
0 10 20
Kilometres
Native Vegetation1956 FloodplainCleared Areas
Irrigated AreasTownsRiver Murray Area
(ha)CostScore
Remnant Vegetation Area
1
< 50
2
50 - 993 100 - 1994
200 -499
5
>= 500
Corridor Boundary
Figure 18 – Area of remnant vegetation patches in the study area classified into 5 classes with
largest patches having the lowest cost score (1) and smallest patches having the highest cost score (5). Hence, in MCDA the algorithm will prefer larger patches over smaller for vegetation management as it tries to minimise costs.
Shape Another well-established conservation principle is that patches with simpler shapes are better for biodiversity conservation than patches with more complex shapes (Diamond 1975, Diamond and May 1976, Saunders et al. 1991, Fahrig 2003). Linear strips and small patches with complex edges will be more susceptible to deleterious edge effects such as weed invasion, wind and other microclimatic changes, changed nutrient and water regimes and increased predation levels. Crossman et al. (2004) calculates the shape index of each patch of remnant vegetation as the patch perimeter divided by the square root of the patch area and adjusted for circular standard. Shape index is then categorised into five classes, and given a cost score according to the complexity of the patch shape index. Patches with simple shape have a low cost score and patches with a complex shape have a high cost score (Table 5; Figure 19).

CSIRO Land and Water Page 69
Shape Categories Cost Score Area (ha) Number of Patches
1 – 1.499 1 17,103 940 1.5 – 1.999 2 19,987 527 2 – 2.999 3 33,852 388 3 – 4.999 4 35,406 204 >= 5 5 404,528 241
Table 5 – Shape classification and prioritisation of remnant vegetation patches.
Berri
Morgan
Mannum
Loxton
RenmarkWaikerie
Swan Reach
Tailem Bend
Blanchetown
Murray Bridge
Kingston-On-Murray
350,000
350,000
400,000
400,000
450,000
450,000
500,000
500,000
6,10
0,00
0
6,10
0,00
0
6,15
0,00
0
6,15
0,00
0
6,20
0,00
0
6,20
0,00
0
6,25
0,00
0
6,25
0,00
0
0 10 20
Kilometres
Native Vegetation1956 FloodplainCleared Areas
Irrigated AreasTownsRiver Murray Shape
IndexCostScore
1 < 1.52 1.5 - 1.9993 2 - 2.9994 3 - 4.9995 >= 5
Remnant Vegetation Shape Index (1 = simple shape, 5 = complex shape)
Corridor Boundary
Figure 19 – Shape index of remnant vegetation patches in the study area classified into 5 cost
scores with patches of simplest shape having the lowest cost scores (1) and patches of most complex shape having the highest cost scores (5). Hence, in MCDA the algorithm will prefer more simply shaped patches over more complex shapes for vegetation management.
Fragmentation Recent attention has focussed on landscape planning and the conceptualisation of human-modified landscapes (McIntyre and Hobbs 1999, 2000, Fischer et al. 2004). McIntyre and Hobbs (1999) suggest a set of four states of landscape fragmentation – intact, variegated,
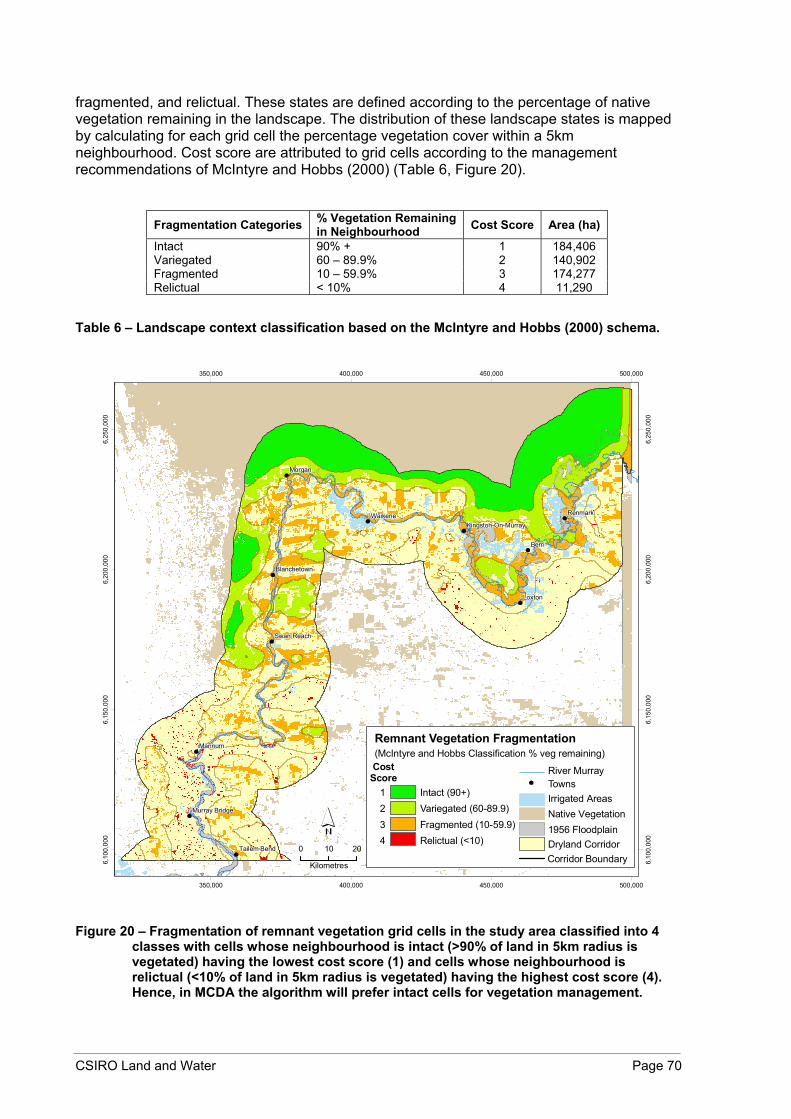
CSIRO Land and Water Page 70
fragmented, and relictual. These states are defined according to the percentage of native vegetation remaining in the landscape. The distribution of these landscape states is mapped by calculating for each grid cell the percentage vegetation cover within a 5km neighbourhood. Cost score are attributed to grid cells according to the management recommendations of McIntyre and Hobbs (2000) (Table 6, Figure 20).
Fragmentation Categories % Vegetation Remaining in Neighbourhood Cost Score Area (ha)
Intact 90% + 1 184,406 Variegated 60 – 89.9% 2 140,902 Fragmented 10 – 59.9% 3 174,277 Relictual < 10% 4 11,290
Table 6 – Landscape context classification based on the McIntyre and Hobbs (2000) schema.
Berri
Morgan
Mannum
Loxton
RenmarkWaikerie
Swan Reach
Tailem Bend
Blanchetown
Murray Bridge
Kingston-On-Murray
350,000
350,000
400,000
400,000
450,000
450,000
500,000
500,000
6,10
0,00
0
6,10
0,00
0
6,15
0,00
0
6,15
0,00
0
6,20
0,00
0
6,20
0,00
0
6,25
0,00
0
6,25
0,00
0
0 10 20
Kilometres
Native Vegetation1956 FloodplainDryland Corridor
Irrigated AreasTownsRiver Murray Cost
Score1234
Remnant Vegetation Fragmentation(McIntyre and Hobbs Classification % veg remaining)
Relictual (<10)Fragmented (10-59.9)Variegated (60-89.9)Intact (90+)
Corridor Boundary
Figure 20 – Fragmentation of remnant vegetation grid cells in the study area classified into 4
classes with cells whose neighbourhood is intact (>90% of land in 5km radius is vegetated) having the lowest cost score (1) and cells whose neighbourhood is relictual (<10% of land in 5km radius is vegetated) having the highest cost score (4). Hence, in MCDA the algorithm will prefer intact cells for vegetation management.
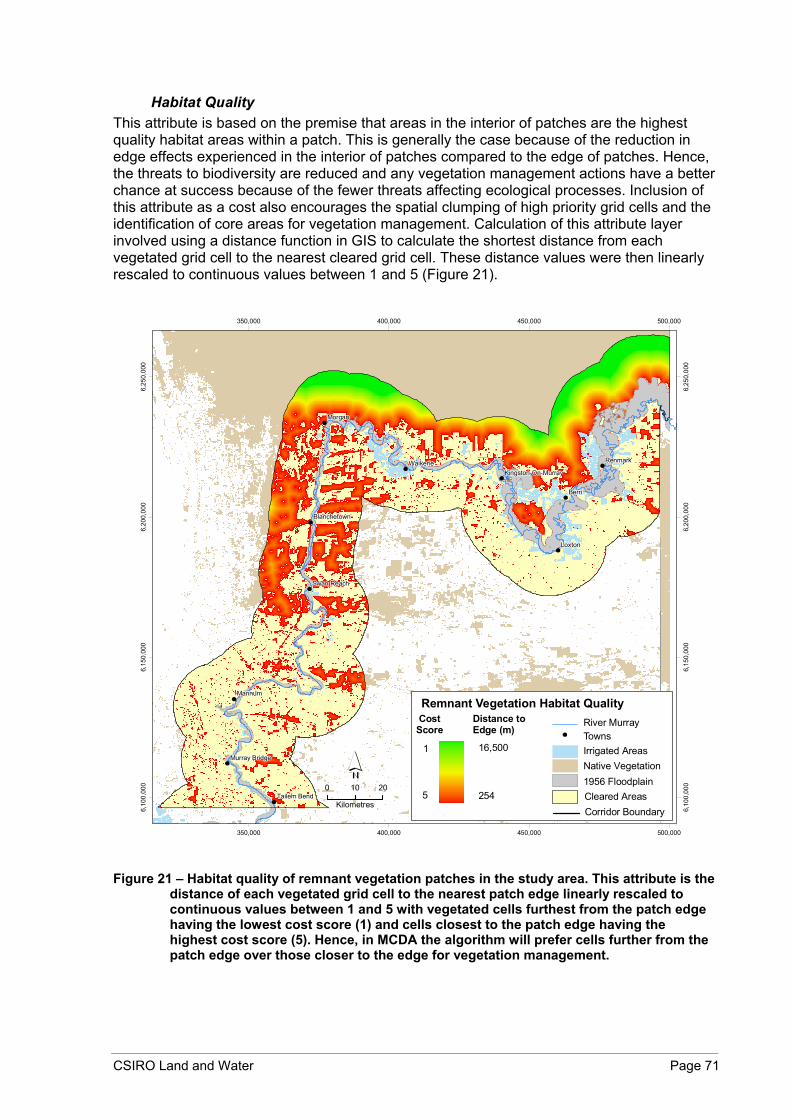
CSIRO Land and Water Page 71
Habitat Quality This attribute is based on the premise that areas in the interior of patches are the highest quality habitat areas within a patch. This is generally the case because of the reduction in edge effects experienced in the interior of patches compared to the edge of patches. Hence, the threats to biodiversity are reduced and any vegetation management actions have a better chance at success because of the fewer threats affecting ecological processes. Inclusion of this attribute as a cost also encourages the spatial clumping of high priority grid cells and the identification of core areas for vegetation management. Calculation of this attribute layer involved using a distance function in GIS to calculate the shortest distance from each vegetated grid cell to the nearest cleared grid cell. These distance values were then linearly rescaled to continuous values between 1 and 5 (Figure 21).
Berri
Morgan
Mannum
Loxton
RenmarkWaikerie
Swan Reach
Tailem Bend
Blanchetown
Murray Bridge
Kingston-On-Murray
350,000
350,000
400,000
400,000
450,000
450,000
500,000
500,000
6,10
0,00
0
6,10
0,00
0
6,15
0,00
0
6,15
0,00
0
6,20
0,00
0
6,20
0,00
0
6,25
0,00
0
6,25
0,00
0
0 10 20
Kilometres
Native Vegetation1956 FloodplainCleared Areas
Irrigated AreasTownsRiver Murray
Remnant Vegetation Habitat Quality
5
1
CostScore
Distance to Edge (m)
254
16,500
Corridor Boundary
Figure 21 – Habitat quality of remnant vegetation patches in the study area. This attribute is the
distance of each vegetated grid cell to the nearest patch edge linearly rescaled to continuous values between 1 and 5 with vegetated cells furthest from the patch edge having the lowest cost score (1) and cells closest to the patch edge having the highest cost score (5). Hence, in MCDA the algorithm will prefer cells further from the patch edge over those closer to the edge for vegetation management.

CSIRO Land and Water Page 72
The three attributes of Vegetation Communities, Climate Zones and Rare and Threatened Species Habitat are categorical attributes suitable for use as constraints in MCDA. Each attribute layer consists of categorical data and the four have different numbers of classes (Table 3). To use as constraints we create a binary grid for each class of each attribute layer where grid cells are given a value of 1 or 0 depending on whether the grid cell supports the class or not. In the maps below however, the classes are presented as categories on a single map for each attribute where possible. The principle of representativeness is implemented using the constraint layers. Each layer characterises the spatial distribution of some element of biophysical diversity and constraints are set such that a certain proportion of each biophysical class is represented by the conservation action of vegetation management.
Remnant Vegetation Communities Vegetation management actions should cover the range of remnant vegetation communities. Theoretically, the full diversity of habitats and component plant and animal species will then benefit from vegetation management actions in the Corridor. Vegetation communities have been mapped by DEH using a combination of field survey and aerial photography interpretation. A total of 131 vegetation communities are identified by DEH in the Corridor. The vegetation mapping has a high spatial resolution which needed to be rasterised into 254 m grid cells for inclusion in the MCDA. Some detail is necessarily generalised in this process. In particular, some communities are very small in area and 6 communities disappeared altogether when rasterised into grid format. Thus, a total of 125 vegetation communities are used in MCDA (Table 7).
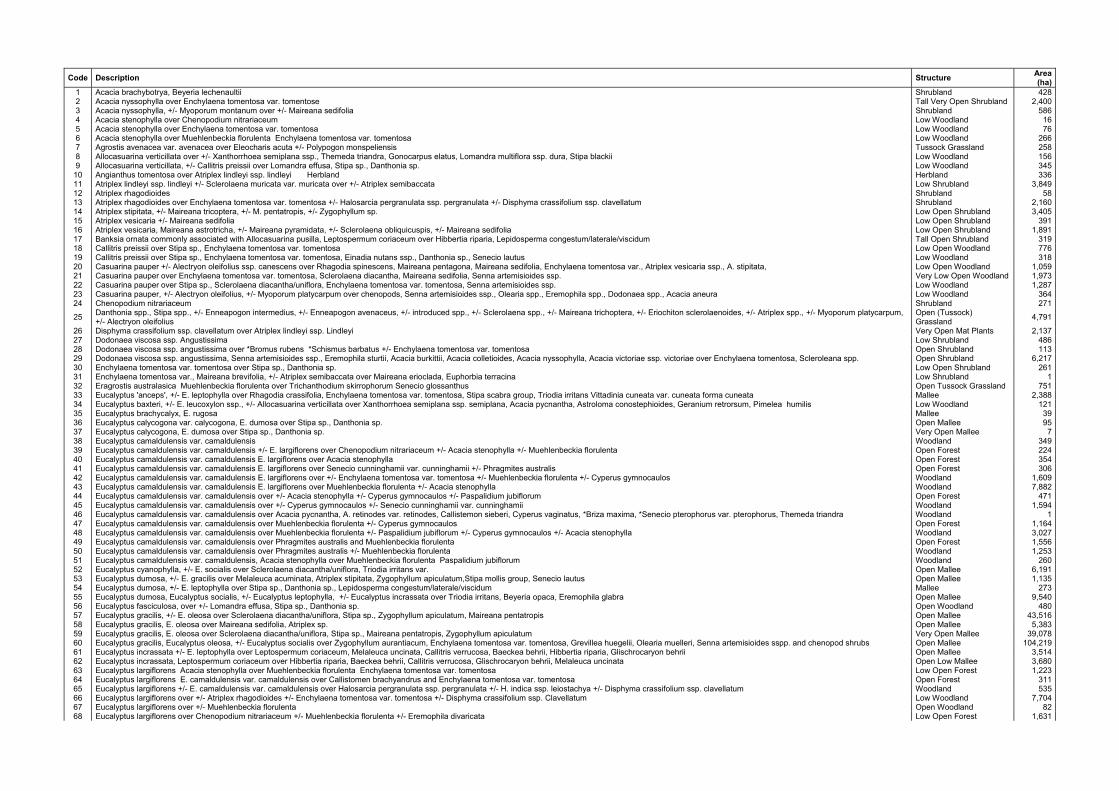
Code Description Structure Area (ha)
1 Acacia brachybotrya, Beyeria lechenaultii Shrubland 428 2 Acacia nyssophylla over Enchylaena tomentosa var. tomentose Tall Very Open Shrubland 2,400 3 Acacia nyssophylla, +/- Myoporum montanum over +/- Maireana sedifolia Shrubland 586 4 Acacia stenophylla over Chenopodium nitrariaceum Low Woodland 16 5 Acacia stenophylla over Enchylaena tomentosa var. tomentosa Low Woodland 76 6 Acacia stenophylla over Muehlenbeckia florulenta Enchylaena tomentosa var. tomentosa Low Woodland 266 7 Agrostis avenacea var. avenacea over Eleocharis acuta +/- Polypogon monspeliensis Tussock Grassland 258 8 Allocasuarina verticillata over +/- Xanthorrhoea semiplana ssp., Themeda triandra, Gonocarpus elatus, Lomandra multiflora ssp. dura, Stipa blackii Low Woodland 156 9 Allocasuarina verticillata, +/- Callitris preissii over Lomandra effusa, Stipa sp., Danthonia sp. Low Woodland 345
10 Angianthus tomentosa over Atriplex lindleyi ssp. lindleyi Herbland Herbland 336 11 Atriplex lindleyi ssp. lindleyi +/- Sclerolaena muricata var. muricata over +/- Atriplex semibaccata Low Shrubland 3,849 12 Atriplex rhagodioides Shrubland 58 13 Atriplex rhagodioides over Enchylaena tomentosa var. tomentosa +/- Halosarcia pergranulata ssp. pergranulata +/- Disphyma crassifolium ssp. clavellatum Shrubland 2,160 14 Atriplex stipitata, +/- Maireana tricoptera, +/- M. pentatropis, +/- Zygophyllum sp. Low Open Shrubland 3,405 15 Atriplex vesicaria +/- Maireana sedifolia Low Open Shrubland 391 16 Atriplex vesicaria, Maireana astrotricha, +/- Maireana pyramidata, +/- Sclerolaena obliquicuspis, +/- Maireana sedifolia Low Open Shrubland 1,891 17 Banksia ornata commonly associated with Allocasuarina pusilla, Leptospermum coriaceum over Hibbertia riparia, Lepidosperma congestum/laterale/viscidum Tall Open Shrubland 319 18 Callitris preissii over Stipa sp., Enchylaena tomentosa var. tomentosa Low Open Woodland 776 19 Callitris preissii over Stipa sp., Enchylaena tomentosa var. tomentosa, Einadia nutans ssp., Danthonia sp., Senecio lautus Low Woodland 318 20 Casuarina pauper +/- Alectryon oleifolius ssp. canescens over Rhagodia spinescens, Maireana pentagona, Maireana sedifolia, Enchylaena tomentosa var., Atriplex vesicaria ssp., A. stipitata, Low Open Woodland 1,059 21 Casuarina pauper over Enchylaena tomentosa var. tomentosa, Sclerolaena diacantha, Maireana sedifolia, Senna artemisioides ssp. Very Low Open Woodland 1,973 22 Casuarina pauper over Stipa sp., Sclerolaena diacantha/uniflora, Enchylaena tomentosa var. tomentosa, Senna artemisioides ssp. Low Woodland 1,287 23 Casuarina pauper, +/- Alectryon oleifolius, +/- Myoporum platycarpum over chenopods, Senna artemisioides ssp., Olearia spp., Eremophila spp., Dodonaea spp., Acacia aneura Low Woodland 364 24 Chenopodium nitrariaceum Shrubland 271
25 Danthonia spp., Stipa spp., +/- Enneapogon intermedius, +/- Enneapogon avenaceus, +/- introduced spp., +/- Sclerolaena spp., +/- Maireana trichoptera, +/- Eriochiton sclerolaenoides, +/- Atriplex spp., +/- Myoporum platycarpum, +/- Alectryon oleifolius
Open (Tussock) Grassland 4,791
26 Disphyma crassifolium ssp. clavellatum over Atriplex lindleyi ssp. Lindleyi Very Open Mat Plants 2,137 27 Dodonaea viscosa ssp. Angustissima Low Shrubland 486 28 Dodonaea viscosa ssp. angustissima over *Bromus rubens *Schismus barbatus +/- Enchylaena tomentosa var. tomentosa Open Shrubland 113 29 Dodonaea viscosa ssp. angustissima, Senna artemisioides ssp., Eremophila sturtii, Acacia burkittii, Acacia colletioides, Acacia nyssophylla, Acacia victoriae ssp. victoriae over Enchylaena tomentosa, Scleroleana spp. Open Shrubland 6,217 30 Enchylaena tomentosa var. tomentosa over Stipa sp., Danthonia sp. Low Open Shrubland 261 31 Enchylaena tomentosa var., Maireana brevifolia, +/- Atriplex semibaccata over Maireana erioclada, Euphorbia terracina Low Shrubland 1 32 Eragrostis australasica Muehlenbeckia florulenta over Trichanthodium skirrophorum Senecio glossanthus Open Tussock Grassland 751 33 Eucalyptus 'anceps', +/- E. leptophylla over Rhagodia crassifolia, Enchylaena tomentosa var. tomentosa, Stipa scabra group, Triodia irritans Vittadinia cuneata var. cuneata forma cuneata Mallee 2,388 34 Eucalyptus baxteri, +/- E. leucoxylon ssp., +/- Allocasuarina verticillata over Xanthorrhoea semiplana ssp. semiplana, Acacia pycnantha, Astroloma conostephioides, Geranium retrorsum, Pimelea humilis Low Woodland 121 35 Eucalyptus brachycalyx, E. rugosa Mallee 39 36 Eucalyptus calycogona var. calycogona, E. dumosa over Stipa sp., Danthonia sp. Open Mallee 95 37 Eucalyptus calycogona, E. dumosa over Stipa sp., Danthonia sp. Very Open Mallee 7 38 Eucalyptus camaldulensis var. camaldulensis Woodland 349 39 Eucalyptus camaldulensis var. camaldulensis +/- E. largiflorens over Chenopodium nitrariaceum +/- Acacia stenophylla +/- Muehlenbeckia florulenta Open Forest 224 40 Eucalyptus camaldulensis var. camaldulensis E. largiflorens over Acacia stenophylla Open Forest 354 41 Eucalyptus camaldulensis var. camaldulensis E. largiflorens over Senecio cunninghamii var. cunninghamii +/- Phragmites australis Open Forest 306 42 Eucalyptus camaldulensis var. camaldulensis E. largiflorens over +/- Enchylaena tomentosa var. tomentosa +/- Muehlenbeckia florulenta +/- Cyperus gymnocaulos Woodland 1,609 43 Eucalyptus camaldulensis var. camaldulensis E. largiflorens over Muehlenbeckia florulenta +/- Acacia stenophylla Woodland 7,882 44 Eucalyptus camaldulensis var. camaldulensis over +/- Acacia stenophylla +/- Cyperus gymnocaulos +/- Paspalidium jubiflorum Open Forest 471 45 Eucalyptus camaldulensis var. camaldulensis over +/- Cyperus gymnocaulos +/- Senecio cunninghamii var. cunninghamii Woodland 1,594 46 Eucalyptus camaldulensis var. camaldulensis over Acacia pycnantha, A. retinodes var. retinodes, Callistemon sieberi, Cyperus vaginatus, *Briza maxima, *Senecio pterophorus var. pterophorus, Themeda triandra Woodland 1 47 Eucalyptus camaldulensis var. camaldulensis over Muehlenbeckia florulenta +/- Cyperus gymnocaulos Open Forest 1,164 48 Eucalyptus camaldulensis var. camaldulensis over Muehlenbeckia florulenta +/- Paspalidium jubiflorum +/- Cyperus gymnocaulos +/- Acacia stenophylla Woodland 3,027 49 Eucalyptus camaldulensis var. camaldulensis over Phragmites australis and Muehlenbeckia florulenta Open Forest 1,556 50 Eucalyptus camaldulensis var. camaldulensis over Phragmites australis +/- Muehlenbeckia florulenta Woodland 1,253 51 Eucalyptus camaldulensis var. camaldulensis, Acacia stenophylla over Muehlenbeckia florulenta Paspalidium jubiflorum Woodland 260 52 Eucalyptus cyanophylla, +/- E. socialis over Sclerolaena diacantha/uniflora, Triodia irritans var. Open Mallee 6,191 53 Eucalyptus dumosa, +/- E. gracilis over Melaleuca acuminata, Atriplex stipitata, Zygophyllum apiculatum,Stipa mollis group, Senecio lautus Open Mallee 1,135 54 Eucalyptus dumosa, +/- E. leptophylla over Stipa sp., Danthonia sp., Lepidosperma congestum/laterale/viscidum Mallee 273 55 Eucalyptus dumosa, Eucalyptus socialis, +/- Eucalyptus leptophylla, +/- Eucalyptus incrassata over Triodia irritans, Beyeria opaca, Eremophila glabra Open Mallee 9,540 56 Eucalyptus fasciculosa, over +/- Lomandra effusa, Stipa sp., Danthonia sp. Open Woodland 480 57 Eucalyptus gracilis, +/- E. oleosa over Sclerolaena diacantha/uniflora, Stipa sp., Zygophyllum apiculatum, Maireana pentatropis Open Mallee 43,516 58 Eucalyptus gracilis, E. oleosa over Maireana sedifolia, Atriplex sp. Open Mallee 5,383 59 Eucalyptus gracilis, E. oleosa over Sclerolaena diacantha/uniflora, Stipa sp., Maireana pentatropis, Zygophyllum apiculatum Very Open Mallee 39,078 60 Eucalyptus gracilis, Eucalyptus oleosa, +/- Eucalyptus socialis over Zygophyllum aurantiacum, Enchylaena tomentosa var. tomentosa, Grevillea huegelii, Olearia muelleri, Senna artemisioides sspp. and chenopod shrubs Open Mallee 104,219 61 Eucalyptus incrassata +/- E. leptophylla over Leptospermum coriaceum, Melaleuca uncinata, Callitris verrucosa, Baeckea behrii, Hibbertia riparia, Glischrocaryon behrii Open Mallee 3,514 62 Eucalyptus incrassata, Leptospermum coriaceum over Hibbertia riparia, Baeckea behrii, Callitris verrucosa, Glischrocaryon behrii, Melaleuca uncinata Open Low Mallee 3,680 63 Eucalyptus largiflorens Acacia stenophylla over Muehlenbeckia florulenta Enchylaena tomentosa var. tomentosa Low Open Forest 1,223 64 Eucalyptus largiflorens E. camaldulensis var. camaldulensis over Callistomen brachyandrus and Enchylaena tomentosa var. tomentosa Open Forest 311 65 Eucalyptus largiflorens +/- E. camaldulensis var. camaldulensis over Halosarcia pergranulata ssp. pergranulata +/- H. indica ssp. leiostachya +/- Disphyma crassifolium ssp. clavellatum Woodland 535 66 Eucalyptus largiflorens over +/- Atriplex rhagodioides +/- Enchylaena tomentosa var. tomentosa +/- Disphyma crassifolium ssp. Clavellatum Low Woodland 7,704 67 Eucalyptus largiflorens over +/- Muehlenbeckia florulenta Open Woodland 82 68 Eucalyptus largiflorens over Chenopodium nitrariaceum +/- Muehlenbeckia florulenta +/- Eremophila divaricata Low Open Forest 1,631

69 Eucalyptus largiflorens over Enchylaena tomentosa var. tomentosa +/- Paspalidium jubiflorum Low Open Forest 557 70 Eucalyptus largiflorens over Maireana pyramidata Low Woodland 120 71 Eucalyptus largiflorens over Muehlenbeckia florulenta Open Woodland 2,840 72 Eucalyptus largiflorens over Muehlenbeckia florulenta +/- Enchylaena tomentosa var. tomentosa Open Forest 982 73 Eucalyptus largiflorens over over Stipa sp., Einadia nutans ssp., Enchylaena tomentosa var. Low Woodland 18 74 Eucalyptus leptophylla, E. socialis over Triodia irritans var., Stipa sp. Open Mallee 5,702 75 Eucalyptus leucoxylon ssp. over +/- Lomandra effusa Open Woodland 51 76 Eucalyptus leucoxylon ssp., +/- E. viminalis ssp. over Acacia pycnantha, Scaevola albida Woodland 18 77 Eucalyptus odorata over Acacia acinacea, Chenopodium desertorum ssp. desertorum, Dianella revoluta var. revoluta, Lomandra densiflora, Eutaxia microphylla var. microphylla Low Woodland 23 78 Eucalyptus porosa Acacia stenophylla over Muehlenbeckia florulenta Low Open Woodland 1 79 Eucalyptus porosa over Stipa sp., Lomandra effusa, Helichrysum leucopsideum, Senecio lautus, Clematis microphylla, Danthonia sp. Low Open Woodland 1,770 80 Eucalyptus porosa over Stipa sp., Lomandra effusa, Helichrysum leucopsideum, Senecio lautus Low Woodland 1,782 81 Eucalyptus socialis, +/- Eucalyptus oleosa, +/- Eucalyptus dumosa over Enchylaena tomentosa var. tomentosa, Zygophyllum spp., Olearia muelleri, Westringia rigida, Triodia irritans Open Mallee 56,264 82 Gahnia filum +/- Gahnia trifida +/- Juncus kraussii over Suaeda australis + - Samolus repens Sedgeland 1
83 Geijera linearifolia, Myoporum platycarpum ssp., +/- Alectryon oleifolius ssp. canescens over Acacia nyssophylla, Senna artemisioides nothossp. coriacea, Zygophyllum aurantiacum ssp., Eriochiton sclerolaenoides, Sclerolaena obliquicuspis Low Open Woodland 23,221
84 Halosarcia indica ssp. leiostachya over +/- Suaeda australis +/- Disphyma crassifolium ssp. Clavellatum Low Shrubland 492 85 Halosarcia pergranulata ssp. pergranulata +/- Halosarcia indica ssp. leiostachya over +/- Disphyma crassifolium ssp. Clavellatum Low Shrubland 3,347 86 Halosarcia pergranulata ssp. pergranulata over +/- *Critesion marinum +/- Disphyma crassifolium ssp. clavellatum +/- Suaeda australis Low Shrubland 3,917 87 Halosarcia sp. over Disphyma crassifolium ssp. Clavellatum Low Very Open Shrubland 823 88 Halosarcia sp., Sclerostegia sp. Low Open Shrubland 117 89 Juncus kraussii over +/- Suaeda australis +/- Samolus repens Sedgeland 2 90 Lomandra effusa with Lepidosperma congestum/laterale/viscidum, Asphodelus fistulosus, Cryptandra amara var. Open Sedgeland 704 91 Lomandra effusa, +/- Helichrysum leucopsideum Open Tussock Grassland 201 92 Maireana aphylla over Lomandra multiflora ssp. dura, L. effusa, Danthonia caespitosa, Vittadinia sp. Low Shrubland 56 93 Maireana brevifolia over Enchylaena tomentosa var. tomentosa Low Open Shrubland 438 94 Maireana pyramidata over +/- Atriplex lindleyi ssp. lindleyi +/- *Schismus barbatus Low Open Shrubland 1,362 95 Maireana pyramidata over Stipa sp., Enchylaena tomentosa var. tomentosa, Rhagodia spinescens Very Open Shrubland 467 96 Maireana pyramidata, +/- Atriplex vesicaria ssp., +/- Maireana georgei, +/- Maireana turbinata, +/- Maireana sedifolia, +/- Enchylaena tomentosa var. tomentosa, +/- Sclerolaena obliquicuspis Low Open Shrubland 7,107 97 Maireana sedifolia over Enchylaena tomentosa var. tomentosa, Eriochiton sclerolaenoides, Rhagodia spinescens, Sclerolaena obliquicuspis Very Open Shrubland 9,556 98 Maireana sedifolia, +/- *Lycium australe over Sclerolaena obliquicuspis, Rhagodia spinescens, Rhagodia ulicina Shrubland 7,964 99 Maireana sedifolia, +/- Sclerolaena obliquicuspis, +/- Eriochiton sclerolaenoides, +/- Enchylaena tomentosa var. tomentosa, +/- Carrichtera annua Low Open Shrubland 28,059
100 Melaleuca acuminata, M. lanceolata +/- Eucalyptus socialis, +/- E. leptophylla over Stipa sp., Danthonia sp. Tall Open Shrubland 3,022 101 Melaleuca halmaturorum ssp. halmaturorum Tall Open Shrubland 20 102 Melaleuca halmaturorum ssp. halmaturorum over +/- Juncus kraussii +/- Samolus repens +/- Suaeda australis +/- Sarcocornia quinqueflora Very Low Open Forest 5 103 Melaleuca lanceolata ssp. lanceolata +/- Eucalyptus largiflorens over +/- Enchylaena tomentosa var. tomentosa Low Open Forest 1,367 104 Melaleuca lanceolata ssp. lanceolata +/- Melaleuca acuminata over Dodonaea hexandra, Gahnia deusta, Lepidosperma viscidum Shrubland 1,051 105 Melaleuca lanceolata ssp. lanceolata over Beyeria lechenaultii Shrubland 139 106 Melaleuca lanceolata ssp. lanceolata, +/- Callitris preissii over Enchylaena tomentosa var., Atriplex sp., Stipa sp. Tall Open Shrubland 96 107 Melaleuca uncinata Closed Shrubland 58 108 Muehlenbeckia florulenta Shrubland 170 109 Muehlenbeckia florulenta over +/- Enchylaena tomentosa var. tomentosa +/- Halosarcia pergranulata ssp. pergranulata +/- Suaeda australis Tall Shrubland 7,863 110 Muehlenbeckia florulenta over +/- Sporobolus mitchellii +/- Sporobolus virginicus Shrubland 3,979 111 Myoporum platycarpum Low Woodland 1,362 112 Nitraria billardierei over Salsola kali Low Open Shrubland 35 113 Nitraria billardierei, Lycium australe, Sclerostegia tenuis, Disphyma crassifolium ssp. clavellatum, +/- Maireana aphylla, +/- Sclerolaena brachyptera, +/- Maireana pyramidata, +/- Eragrostis australasica, +/- Muehlenbeckia florulenta Low Open Shrubland 2,065 114 Pachycornia triandra over +/- Disphyma crassifolium ssp. clavellatum Low Open Shrubland 1,016
115 Phragmites australis +/- Typha domingensis +/- Schoenoplectus validus over +/- *Paspalum vaginatum +/- *Paspalum distichum Closed (Tussock) Grassland 794
116 Phragmites australis over +/- Muehlenbeckia florulenta +/- Bolboschoenus caldwellii Closed (Tussock) Grassland 356
117 Phragmites australis, +/- Juncus sp., +/- Typha sp. Sedgeland 196 118 Polycalymma stuartii +/- Enchylaena tomentosa var. tomentosa Herbland 94 119 Sarcocornia quinqueflora over +/- Samolus repens +/- Suaeda australis Low Shrubland 24 120 Sclerolaena tricuspis Sclerolaena brachyptera over +/- Brachycome lineariloba +/- Plantago cunninghamii Low Open Shrubland 1,576 121 Sclerostegia arbuscula over +/- Sarcocornia quinqueflora +/- *Critesion marinum +/- Suaeda australis Low Shrubland 198 122 Senna artemisioides, +/- Acacia calamifolia, +/- Eremophila longifolia Shrubland 279 123 Sporobolus virginicus or Sporobolus mitchellii over +/- Sclerolaena tricuspis Tussock Grassland 1,497 124 Stipa sp. with sparse low shrubs occasionally present including Sclerolaena diacantha/uniflora Open Tussock Grassland 35,652 125 Stipa sp., +/- Sclerolaena diacantha/uniflora, Danthonia sp., Hyalosperma semisterile Open Tussock Grassland 1,951 126 Suaeda australis +/- Sarcocornia quinqueflora over +/- Samolus repens Low Closed Shrubland 85 127 Triodia irritans Hummock Grassland 213 128 Typha domingensis over +/- *Paspalum vaginatum +/- *Paspalum distichum Sedgeland 100 129 Typha domingensis, over Schoenoplectus validus, Aster subulatus Paspalum distichum, Hydrocotyle verticillata Sedgeland 76 130 Typha orientalis over +/- Schoenoplectus validus Sedgeland 69 131 Willows Introduced 95
Table 7 – Vegetation communities in the Corridor as classified and mapped by DEH.
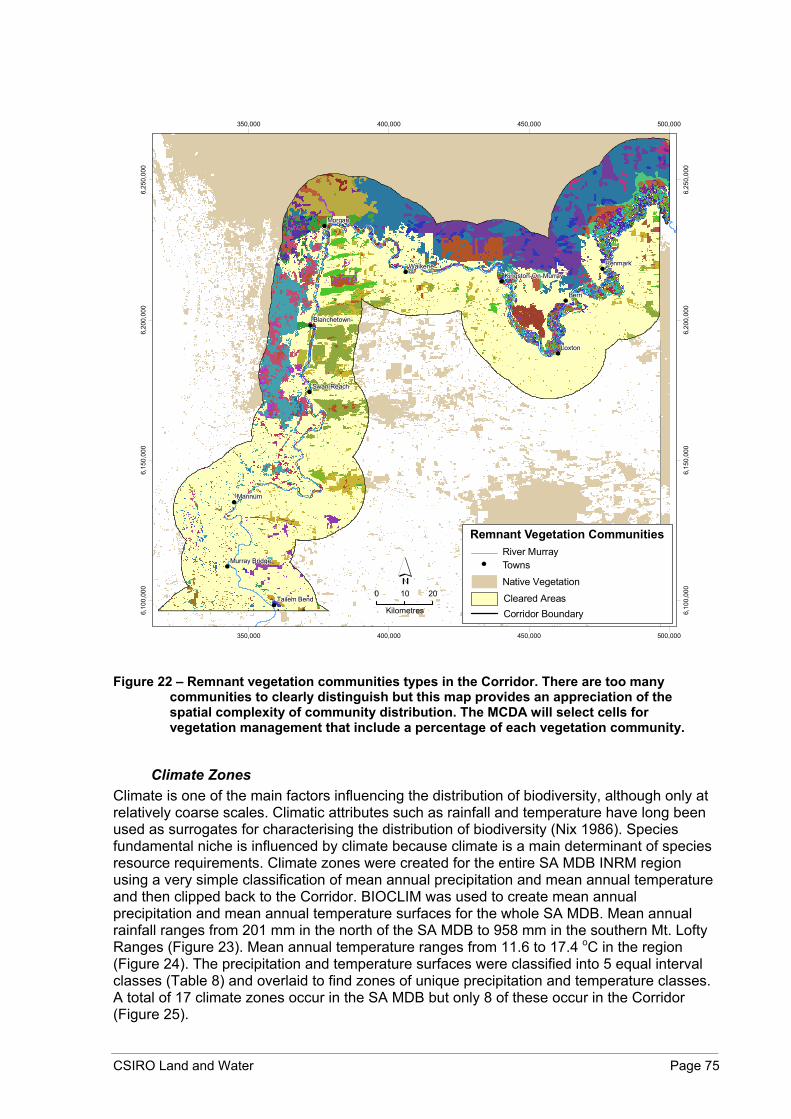
CSIRO Land and Water Page 75
Berri
Morgan
Mannum
Loxton
RenmarkWaikerie
Swan Reach
Tailem Bend
Blanchetown
Murray Bridge
Kingston-On-Murray
350,000
350,000
400,000
400,000
450,000
450,000
500,000
500,000
6,10
0,00
0
6,10
0,00
0
6,15
0,00
0
6,15
0,00
0
6,20
0,00
0
6,20
0,00
0
6,25
0,00
0
6,25
0,00
0
0 10 20
Kilometres
Native Vegetation
Corridor Boundary
TownsRiver Murray
Remnant Vegetation Communities
Cleared Areas
Figure 22 – Remnant vegetation communities types in the Corridor. There are too many
communities to clearly distinguish but this map provides an appreciation of the spatial complexity of community distribution. The MCDA will select cells for vegetation management that include a percentage of each vegetation community.
Climate Zones Climate is one of the main factors influencing the distribution of biodiversity, although only at relatively coarse scales. Climatic attributes such as rainfall and temperature have long been used as surrogates for characterising the distribution of biodiversity (Nix 1986). Species fundamental niche is influenced by climate because climate is a main determinant of species resource requirements. Climate zones were created for the entire SA MDB INRM region using a very simple classification of mean annual precipitation and mean annual temperature and then clipped back to the Corridor. BIOCLIM was used to create mean annual precipitation and mean annual temperature surfaces for the whole SA MDB. Mean annual rainfall ranges from 201 mm in the north of the SA MDB to 958 mm in the southern Mt. Lofty Ranges (Figure 23). Mean annual temperature ranges from 11.6 to 17.4 oC in the region (Figure 24). The precipitation and temperature surfaces were classified into 5 equal interval classes (Table 8) and overlaid to find zones of unique precipitation and temperature classes. A total of 17 climate zones occur in the SA MDB but only 8 of these occur in the Corridor (Figure 25).

CSIRO Land and Water Page 76
Berri
Morgan
Mannum
Loxton
RenmarkWaikerie
Swan Reach
Tailem Bend
Blanchetown
Murray Bridge
Kingston-On-Murray
350,000
350,000
400,000
400,000
450,000
450,000
500,000
500,000
6,10
0,00
0
6,10
0,00
0
6,15
0,00
0
6,15
0,00
0
6,20
0,00
0
6,20
0,00
0
6,25
0,00
0
6,25
0,00
0
0 10 20
Kilometres
Native Vegetation1956 Floodplain
Irrigated AreasTownsRiver Murray
Precip Class (mm)
Class
1 201 - 352.42 352.4 - 503.83 503.8 - 655.24 655.2 - 806.65 806.6 - 958
Mean Annual Precipitation
Corridor Boundary
Figure 23 – Mean annual precipitation. Note that class breaks are selected based on the entire
SA MDB and some classes may not occur in the Corridor.
Class Precipitation Classes (mm) Temperature Classes (deg C)
1 201 – 352.4 11.6 – 12.76 2 352.4 – 503.8 12.76 – 13.92 3 503.8 – 655.2 13.92 – 15.08 4 655.2 – 806.6 15.08 – 16.24 5 806.6 – 958 16.24 – 17.4
Table 8 – Mean annual precipitation and mean annual temperature classes based on data for the whole SA MDB INRM region used to construct climatic domains for use as a biodiversity attribute in MCDA.

CSIRO Land and Water Page 77
Berri
Morgan
Mannum
Loxton
RenmarkWaikerie
Swan Reach
Tailem Bend
Blanchetown
Murray Bridge
Kingston-On-Murray
350,000
350,000
400,000
400,000
450,000
450,000
500,000
500,000
6,10
0,00
0
6,10
0,00
0
6,15
0,00
0
6,15
0,00
0
6,20
0,00
0
6,20
0,00
0
6,25
0,00
0
6,25
0,00
0
0 10 20
Kilometres
Native Vegetation1956 Floodplain
Irrigated AreasTownsRiver Murray
Temp Class (deg C)Class
1 11.6 - 12.762 12.76 - 13.923
15.08 - 16.24413.92 - 15.08
5 16.24 - 17.4
Mean Annual Temperature
Corridor Boundary
Figure 24 – Mean annual temperature. Note that class breaks are selected based on the entire
SA MDB and some classes may not occur in the Corridor.
Class Area (ha) Temperature Class (deg C) Precipitation Class (mm)
1 492851 15.08-16.24 201-352.4 2 3026 13.92-15.08 201-352.4 4 612579 16.24-17.4 201-352.4 6 39961 13.92-15.08 352.4-503.8 7 3045 12.76-13.92 503.8-655.2
10 62135 15.08-16.24 352.4-503.8 11 3503 13.92-15.08 503.8-655.2 12 26 12.76-13.92 655.2-806.6
Table 9 – Climate domain classes occurring in the Corridor including area of each domain and precipitation and temperature range.
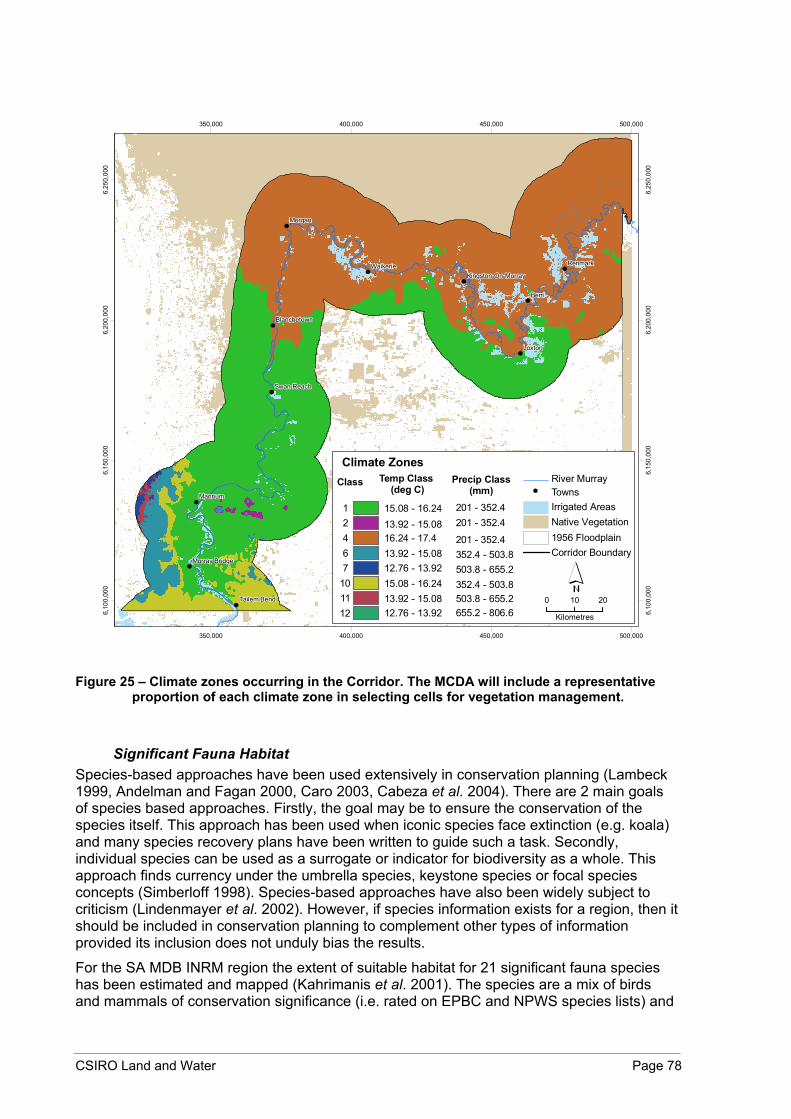
CSIRO Land and Water Page 78
Berri
Morgan
Mannum
Loxton
RenmarkWaikerie
Swan Reach
Tailem Bend
Blanchetown
Murray Bridge
Kingston-On-Murray
350,000
350,000
400,000
400,000
450,000
450,000
500,000
500,000
6,10
0,00
0
6,10
0,00
0
6,15
0,00
0
6,15
0,00
0
6,20
0,00
0
6,20
0,00
0
6,25
0,00
0
6,25
0,00
0
Native Vegetation1956 FloodplainCorridor Boundary
Irrigated AreasTownsRiver Murray Temp Class
(deg C)Class
12.76 - 13.92
16.24 - 17.4
Climate Zones
12467
101112 12.76 - 13.92
Precip Class(mm)
655.2 - 806.6
201 - 352.4201 - 352.4
201 - 352.4352.4 - 503.8
352.4 - 503.8503.8 - 655.2
503.8 - 655.2 0 10 20
Kilometres
15.08 - 16.2413.92 - 15.08
15.08 - 16.2413.92 - 15.08
13.92 - 15.08
Figure 25 – Climate zones occurring in the Corridor. The MCDA will include a representative
proportion of each climate zone in selecting cells for vegetation management.
Significant Fauna Habitat Species-based approaches have been used extensively in conservation planning (Lambeck 1999, Andelman and Fagan 2000, Caro 2003, Cabeza et al. 2004). There are 2 main goals of species based approaches. Firstly, the goal may be to ensure the conservation of the species itself. This approach has been used when iconic species face extinction (e.g. koala) and many species recovery plans have been written to guide such a task. Secondly, individual species can be used as a surrogate or indicator for biodiversity as a whole. This approach finds currency under the umbrella species, keystone species or focal species concepts (Simberloff 1998). Species-based approaches have also been widely subject to criticism (Lindenmayer et al. 2002). However, if species information exists for a region, then it should be included in conservation planning to complement other types of information provided its inclusion does not unduly bias the results.
For the SA MDB INRM region the extent of suitable habitat for 21 significant fauna species has been estimated and mapped (Kahrimanis et al. 2001). The species are a mix of birds and mammals of conservation significance (i.e. rated on EPBC and NPWS species lists) and

CSIRO Land and Water Page 79
icon species (Kahrimanis et al. 2001; Table 10). The habitat extent of 11 species of significant fauna occurs in the Corridor (Figure 26). This group of birds and mammals has not been systematically selected, they do not constitute a focal group, nor are they keystone or umbrella species. However, we are taking a conservative approach to conservation in this study and the inclusion of representative proportions of the habitat of each of these significant species in MCDA can only increase the effectiveness of vegetation management in conserving biodiversity.
Species Area (ha) Number of Patches Bassian Thrush - - Black Eared Miner 136,296 12 Chestnut Heath Wren - - Chestnut Quail Thrush 294,573 64 Common Dunnart 138,077 25 Diamond Firetail - - Striated Grass Wren 187,328 31 Little Pygmy Possum - - Major Mitchell Cockatoo 142,006 69 Mallee Emu Wren - - Mallee Fowl 209,625 258 Mitchell’s Mouse - - Redlored Whistler 100,045 37 Regent Parrot 354,825 1083 Silky Mouse - - Slender Billed Thornbill - - Southern Hairy Nosed Wombat 943,354 312 Striped Honeyeater 374,786 146 Western Whipbird - - Western Pygmy Possum 54,703 10 Yellow-tailed Black Cockatoo - -
Table 10 – List of 21 significant fauna species for which the spatial extent of habitat has been estimated and mapped in the SA MDB INRM region. The 11 significant species occurring in the Corridor are in bold.

CSIRO Land and Water Page 80
Western Pygmy-possumCercartetus concinnus
Southern Hairy-nosed Wombat
Lasiorhinus latifrons
Black-eared Miner Chestnut Quail-thrush
Major Mitchell’s Cockatoo Malleefowl
Red-lored Whistler Regent Parrot
Common Dunnart
Pachycephala rufogularis
Manorina flavigula melanotis
Cacatua leadbeateri Leipoa ocellata
Polytelis anthopeplus monarchoides
Cinclosoma castanotus
Plectorhyncha lanceolata
Sminthopsis murina
Striped Honeyeater
Striated GrasswrenAmytornis striatus striatus
0 15075Kilometres
Rare and Threatened Fauna
Cleared Areas
Corridor Boundary
Predicted Habitat > 200ha
Native Vegetation
Figure 26 – Maps of the spatial distribution of significant species habitat in the Corridor.
5.1.2.1.2 Revegetation Attribute Maps There is increasing interest in landscape-scale planning for the restoration of natural habitat for the conservation of biodiversity. By and large, the focus of recent developments remains concentrated on the restoration of the spatial structure of habitat (Loehle 1999, Wickham et al. 1999, Meurk and Swaffield 2000, Peterken 2000, Weber and Wolf 2000, George and Zack 2001). However, recent work has begun to extend this to consider concepts such as the restoration of ecosystem composition, diversity, structure, and function in a landscape

CSIRO Land and Water Page 81
context (Sieg et al. 1999, Palik et al. 2000, Scott et al. 2001). Further, some studies have begun to ask the more holistic question of what kind of patch-mosaic landscape is required for wildlife to survive (George and Zack 2001, Scott et al. 2001). Bryan (2003) and Bryan and Crossman (in review) use systematic conservation planning principles to set geographic priorities for revegetation for biodiversity and this is the approach we take in the Corridor.
Five biodiversity attribute maps are generated to guide geographic priority setting for the revegetation of local native species for biodiversity conservation (Table 3) with 2 attributes (Landscape Context and Fragmentation) suitable for use as costs in the objective function and 3 (Pre-European Vegetation, Climate Zones and Soil Land Systems) as targets in the constraints in spatial optimisation.
The Landscape Context and Fragmentation attributes suitable for use in the objective function are given continuously valued cost scores derived from the DEH regional floristic vegetation datasets. Again, each attribute has either integer or continuous cost scores ranging between 1 and 4 or 5 to enable numerically unbiased combination of criteria. Cost scores are based on conservation priority with highest priority given the cost score of 1 and lowest priority given the cost score of 5.
Landscape Context It has long been recognised that patch size and isolation are fundamental factors determining species distributions and survival (MacArthur and Wilson 1967, Levin 1974, Doak et al. 1992. Taylor et al. 1993, Lindenmayer and Possingham 1996). Therefore, when considering revegetation and landscape restoration as a method for conserving biodiversity the geographic locations targeted for restoration should facilitate the expansion and linkage of remnants, particularly in fragmented and relictual landscapes (McIntyre and Hobbs 2000). We use a simple linear distance function to prioritise sites that buffer and link remnant patches of native vegetation. The distance from each non-vegetated dryland grid cell in the Corridor to the nearest remnant vegetation patch is calculated and this distance is rescaled to create cost scores between 1 and 5. Cells closest to remnant vegetation have the highest priority for revegetation and are given cost scores of 1. Cells furthest away from remnant vegetation have lowest priority for revegetation and are given cost scores of 5 (Figure 27).

CSIRO Land and Water Page 82
Berri
Morgan
Mannum
Loxton
RenmarkWaikerie
Swan Reach
Tailem Bend
Blanchetown
Murray Bridge
Kingston-On-Murray
350,000
350,000
400,000
400,000
450,000
450,000
500,000
500,000
6,10
0,00
0
6,10
0,00
0
6,15
0,00
0
6,15
0,00
0
6,20
0,00
0
6,20
0,00
0
6,25
0,00
0
6,25
0,00
0
0 10 20
Kilometres
Native Vegetation1956 Floodplain
Irrigated AreasTowns
Landscape Context
River MurrayCostScore
Distance (m)
(Distance to Patch)
1
5
254
4,792 Corridor Boundary
Figure 27 – Landscape context. Distance from dryland non-vegetated cells to the nearest
vegetated cell linearly rescaled to values between 1 and 5.
Fragmentation McIntyre and Hobbs (1999, 2000) prescribe priorities for vegetation management and revegetation for biodiversity conservation in the landscape given various stages of fragmentation. In this study we need to identify geographic priorities for meeting revegetation targets based on the fragmentation of remnant vegetation. Based on the discussion of McIntyre and Hobbs (1999) we consider that if revegetation is to occur in a landscape it is probably most benefit in fragmented landscapes, then relictual, variegated and lastly, intact landscapes. The fragmentation status of each dryland non-vegetated cell in the Corridor is calculated using the same method as for vegetation management by calculating the percentage of remnant vegetation in a 5km radius around each cell. The four McIntyre and Hobbs (1999) states of fragmentation are defined according to the percentage area of native vegetation remaining in the neighbourhood. Cells are ranked according to management priorities recommended by McIntyre and Hobbs (2000) such that fragmented cells receive a cost score of 1, relictual cells 2, variegated cells 3 and intact cells 4 (Figure 28).

CSIRO Land and Water Page 83
Fragmentation Categories % Vegetation in Neighbourhood
CostScore Area (ha)
Fragmented 10 – 59.9% 1 365,186 Relictual < 10% 2 235,173 Variegated 60 – 89.9% 3 27,058 Intact 90%+ 4 993
Table 11 – Fragmentation classes in the dryland areas of the Corridor.
Berri
Morgan
Mannum
Loxton
RenmarkWaikerie
Swan Reach
Tailem Bend
Blanchetown
Murray Bridge
Kingston-On-Murray
350,000
350,000
400,000
400,000
450,000
450,000
500,000
500,000
6,10
0,00
0
6,10
0,00
0
6,15
0,00
0
6,15
0,00
0
6,20
0,00
0
6,20
0,00
0
6,25
0,00
0
6,25
0,00
0
0 10 20
Kilometres
Native Vegetation1956 Floodplain
Irrigated AreasTowns
Fragmentation
River MurrayCostScore
1 Fragmented (10-59.9)2 Relictual (<10)3 Variegated (60-89.9)4 Intact (90+)
(McIntyre and Hobbs % of Veg in Neighbourhood)
Corridor Boundary
Figure 28 – Fragmentation status of dryland non-vegetated cells. Derived from the percentage
of the area of remnant vegetation occurring within a 5km radius of each cell and classified based on the McIntyre and Hobbs (1999) schema for classifying landscape fragmentation.
Three categorical attributes including Pre-European Vegetation Communities, Climate Zones and Soil Land Systems have been widely used as surrogates for the distribution of biodiversity (Pressey and Nichols 1989, Bedward et al. 1992, Belbin 1993, Wessels et al. 1999). Hence, they are suitable for use as constraints for setting geographic priorities for revegetation for biodiversity in MCDA. Each attribute layer consists of categorical data (Table

CSIRO Land and Water Page 84
3). Each attribute is again converted to a number of binary layers – one for each class where grid cells are given a value of 1 or 0 depending on whether the grid cell supports the class or not. The principle of representativeness is implemented using the constraint layers. Constraints are set for revegetation of local native species so that a certain percentage of each Pre-European Vegetation Community, Climate Zone and Soil Land System is represented by native vegetation (either remnant or revegetated). In this way revegetation efforts will address shortcomings in the representation of the existing system of remnants and provide the greatest chance of ensuring the full range of potential biodiversity has the opportunity to flourish.
Pre-European Vegetation Communities Pre-European vegetation is a concept that attempts to describe the distribution of vegetation communities prior to broadacre land clearance by Europeans. Records of plant community composition, structure and spatial distribution are usually lacking. Pre-European vegetation maps bring together small pieces of disparate information such as herbarium records, explorers and surveyors notes, pollen records, indigenous stories, local knowledge, remnant communities and their environmental correlates (Bickford and Mackey 2004).
The pre-European community may be only one of many communities that may successfully occur on a site and the development of any one community in favour of another is significantly affected by stochastic events such as regeneration, seed source availability and disturbance history. Nonetheless, the distribution of pre-European vegetation communities is a useful surrogate for the distribution of some elements of biodiversity. Pre-European vegetation communities have been described and mapped by DEH for part of the study area. Areas to the north and west of the River Murray have not yet been mapped. For the purposes of generating the Pre-European Vegetation Communities attribute layer for MCDA, all dryland non-vegetated grid cells with no pre-European vegetation mapping were grouped into the unknown class and treated as a single class in the same manner as the other pre-European vegetation classes (i.e. revegetation of a certain percentage of the unknown class is also set as a constraint). A total of 22 pre-European vegetation communities have been described and mapped in the Corridor (or 23 including the unknown class) (Table 12; Figure 29).
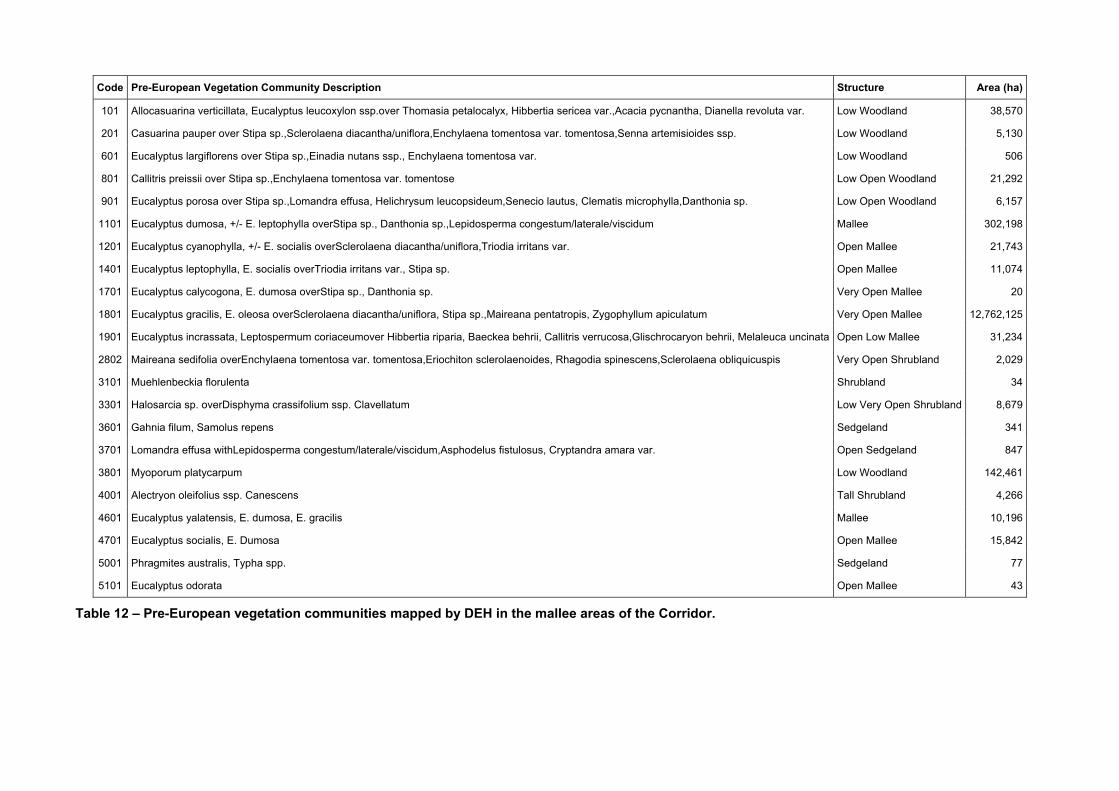
Code Pre-European Vegetation Community Description Structure Area (ha)
101 Allocasuarina verticillata, Eucalyptus leucoxylon ssp.over Thomasia petalocalyx, Hibbertia sericea var.,Acacia pycnantha, Dianella revoluta var. Low Woodland 38,570
201 Casuarina pauper over Stipa sp.,Sclerolaena diacantha/uniflora,Enchylaena tomentosa var. tomentosa,Senna artemisioides ssp. Low Woodland 5,130
601 Eucalyptus largiflorens over Stipa sp.,Einadia nutans ssp., Enchylaena tomentosa var. Low Woodland 506
801 Callitris preissii over Stipa sp.,Enchylaena tomentosa var. tomentose Low Open Woodland 21,292
901 Eucalyptus porosa over Stipa sp.,Lomandra effusa, Helichrysum leucopsideum,Senecio lautus, Clematis microphylla,Danthonia sp. Low Open Woodland 6,157
1101 Eucalyptus dumosa, +/- E. leptophylla overStipa sp., Danthonia sp.,Lepidosperma congestum/laterale/viscidum Mallee 302,198
1201 Eucalyptus cyanophylla, +/- E. socialis overSclerolaena diacantha/uniflora,Triodia irritans var. Open Mallee 21,743
1401 Eucalyptus leptophylla, E. socialis overTriodia irritans var., Stipa sp. Open Mallee 11,074
1701 Eucalyptus calycogona, E. dumosa overStipa sp., Danthonia sp. Very Open Mallee 20
1801 Eucalyptus gracilis, E. oleosa overSclerolaena diacantha/uniflora, Stipa sp.,Maireana pentatropis, Zygophyllum apiculatum Very Open Mallee 12,762,125
1901 Eucalyptus incrassata, Leptospermum coriaceumover Hibbertia riparia, Baeckea behrii, Callitris verrucosa,Glischrocaryon behrii, Melaleuca uncinata Open Low Mallee 31,234
2802 Maireana sedifolia overEnchylaena tomentosa var. tomentosa,Eriochiton sclerolaenoides, Rhagodia spinescens,Sclerolaena obliquicuspis Very Open Shrubland 2,029
3101 Muehlenbeckia florulenta Shrubland 34
3301 Halosarcia sp. overDisphyma crassifolium ssp. Clavellatum Low Very Open Shrubland 8,679
3601 Gahnia filum, Samolus repens Sedgeland 341
3701 Lomandra effusa withLepidosperma congestum/laterale/viscidum,Asphodelus fistulosus, Cryptandra amara var. Open Sedgeland 847
3801 Myoporum platycarpum Low Woodland 142,461
4001 Alectryon oleifolius ssp. Canescens Tall Shrubland 4,266
4601 Eucalyptus yalatensis, E. dumosa, E. gracilis Mallee 10,196
4701 Eucalyptus socialis, E. Dumosa Open Mallee 15,842
5001 Phragmites australis, Typha spp. Sedgeland 77
5101 Eucalyptus odorata Open Mallee 43
Table 12 – Pre-European vegetation communities mapped by DEH in the mallee areas of the Corridor.

CSIRO Land and Water Page 86
Berri
Morgan
Mannum
Loxton
RenmarkWaikerie
Swan Reach
Tailem Bend
Blanchetown
Murray Bridge
Kingston-On-Murray
350,000
350,000
400,000
400,000
450,000
450,000
500,000
500,000
6,10
0,00
0
6,10
0,00
0
6,15
0,00
0
6,15
0,00
0
6,20
0,00
0
6,20
0,00
0
6,25
0,00
0
6,25
0,00
0
0 10 20
Kilometres Native Vegetation
1956 FloodplainIrrigated AreasTowns
Pre-European VegetationRiver Murray
Unknown Class
Corridor Boundary
Figure 29 – Distribution of pre-European vegetation communities in the Corridor as mapped by
DEH. Note: there are too many classes to be clearly represented at this scale but the complexity of spatial distribution is evident.
Climate Zones The Climate Zones described above in Section 5.1.2.1.1are used as a constraint attribute for revegetation. Revegetation needs to be prioritised with the aim of having remnant vegetation and revegetated areas representing the full range of climate zones in the Corridor. Some climate zones such as the hot, dry regions north of the stretch of river between Waikerie and the border are well represented by existing remnant vegetation. However, other climate zones, such as the more productive wetter, cooler climates of the eastern Mt. Lofty Ranges may require significant amounts of revegetation to bring the total amount of vegetation (remnant and revegetated) up to the required level of representation.
Soil Land Systems Soil data is commonly available for many regions especially if agriculture is a potential land use in the region. This is because information on the spatial distribution of soil characteristics can be used to estimate the agricultural capability of land and is an important precursor for modern agricultural development. Soil information is also a useful surrogate for the
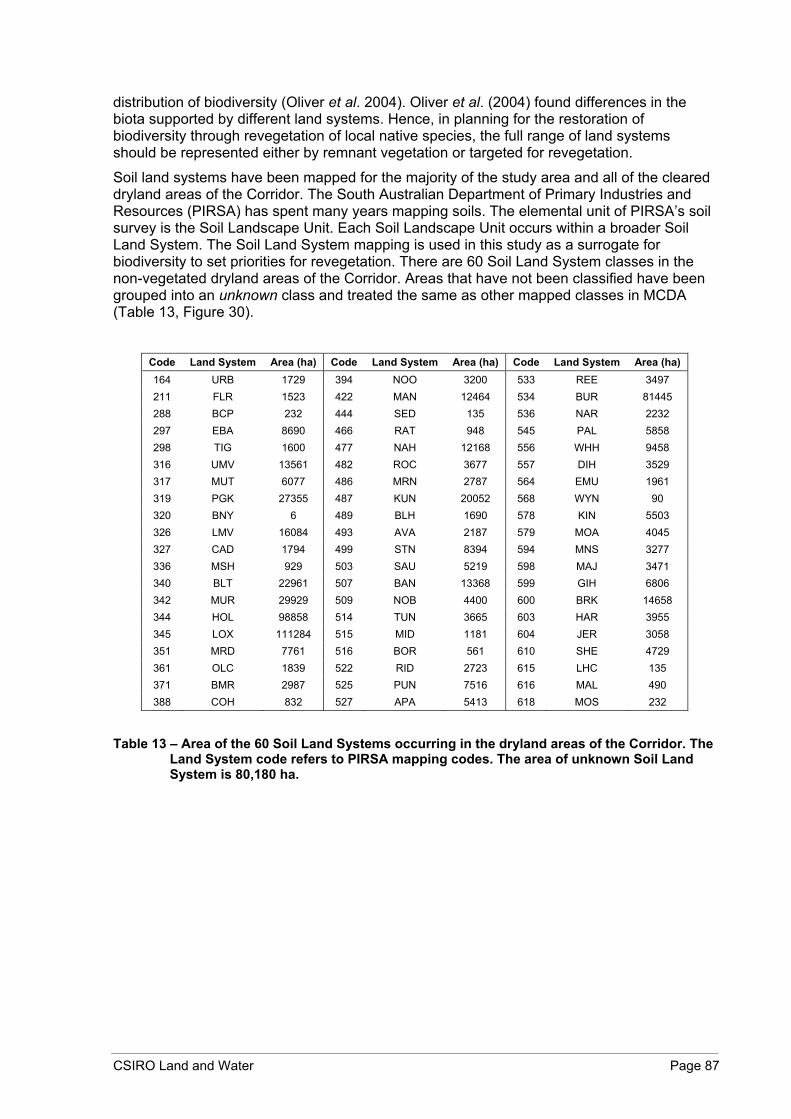
CSIRO Land and Water Page 87
distribution of biodiversity (Oliver et al. 2004). Oliver et al. (2004) found differences in the biota supported by different land systems. Hence, in planning for the restoration of biodiversity through revegetation of local native species, the full range of land systems should be represented either by remnant vegetation or targeted for revegetation.
Soil land systems have been mapped for the majority of the study area and all of the cleared dryland areas of the Corridor. The South Australian Department of Primary Industries and Resources (PIRSA) has spent many years mapping soils. The elemental unit of PIRSA’s soil survey is the Soil Landscape Unit. Each Soil Landscape Unit occurs within a broader Soil Land System. The Soil Land System mapping is used in this study as a surrogate for biodiversity to set priorities for revegetation. There are 60 Soil Land System classes in the non-vegetated dryland areas of the Corridor. Areas that have not been classified have been grouped into an unknown class and treated the same as other mapped classes in MCDA (Table 13, Figure 30).
Code Land System Area (ha) Code Land System Area (ha) Code Land System Area (ha) 164 URB 1729 394 NOO 3200 533 REE 3497 211 FLR 1523 422 MAN 12464 534 BUR 81445 288 BCP 232 444 SED 135 536 NAR 2232 297 EBA 8690 466 RAT 948 545 PAL 5858 298 TIG 1600 477 NAH 12168 556 WHH 9458 316 UMV 13561 482 ROC 3677 557 DIH 3529 317 MUT 6077 486 MRN 2787 564 EMU 1961 319 PGK 27355 487 KUN 20052 568 WYN 90 320 BNY 6 489 BLH 1690 578 KIN 5503 326 LMV 16084 493 AVA 2187 579 MOA 4045 327 CAD 1794 499 STN 8394 594 MNS 3277 336 MSH 929 503 SAU 5219 598 MAJ 3471 340 BLT 22961 507 BAN 13368 599 GIH 6806 342 MUR 29929 509 NOB 4400 600 BRK 14658 344 HOL 98858 514 TUN 3665 603 HAR 3955 345 LOX 111284 515 MID 1181 604 JER 3058 351 MRD 7761 516 BOR 561 610 SHE 4729 361 OLC 1839 522 RID 2723 615 LHC 135 371 BMR 2987 525 PUN 7516 616 MAL 490 388 COH 832 527 APA 5413 618 MOS 232
Table 13 – Area of the 60 Soil Land Systems occurring in the dryland areas of the Corridor. The
Land System code refers to PIRSA mapping codes. The area of unknown Soil Land System is 80,180 ha.

CSIRO Land and Water Page 88
Berri
Morgan
Mannum
Loxton
RenmarkWaikerie
Swan Reach
Tailem Bend
Blanchetown
Murray Bridge
Kingston-On-Murray
350,000
350,000
400,000
400,000
450,000
450,000
500,000
500,000
6,10
0,00
0
6,10
0,00
0
6,15
0,00
0
6,15
0,00
0
6,20
0,00
0
6,20
0,00
0
6,25
0,00
0
6,25
0,00
0
0 10 20
Kilometres Native Vegetation
1956 FloodplainCorridor Boundary
Irrigated AreasTowns
Soil Land Systems
Unknown ClassRiver Murray
Figure 30 – Distribution of Soil Land Systems in the Corridor as mapped by PIRSA. Note: there
are too many classes to be clearly represented at this scale but the complexity of spatial distribution is evident.
5.1.2.2 Costs of Vegetation Management and Revegetation for Biodiversity
The cost of undertaking any NRM activity is highly variable from one location to another due to the heterogeneous nature of the landscape and the ecosystems it supports. The fundamental question facing all natural resource managers is how to achieve the maximum benefit from the limited funds available to undertake NRM activities. Within the Corridor the diversity of factors influencing the cost of NRM activities in particular locations is complex. We attempt to simplify this complexity and provide an assessment of the range of possible costs involved in improving biodiversity through vegetation management and revegetation with local native species. In this study vegetation management occurs where some form of remnant vegetation exists and revegetation occurs in situations where the land has been previously cleared. Under a broader context these activities have three major components:
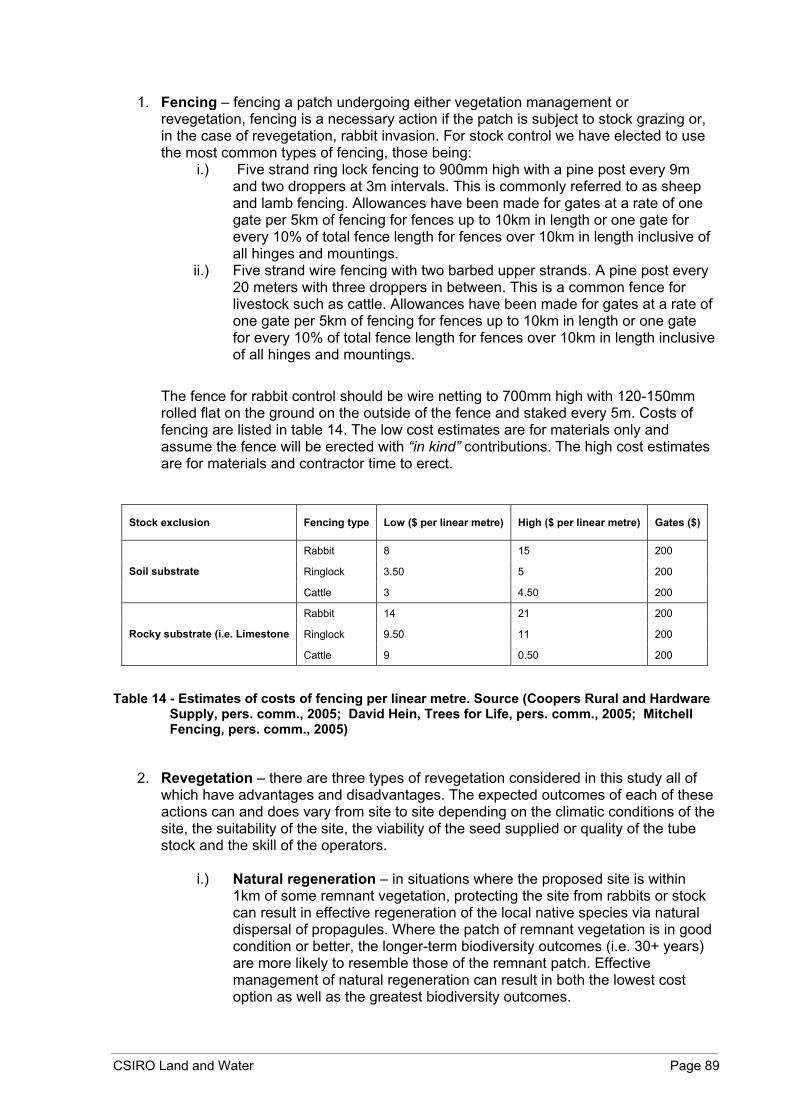
CSIRO Land and Water Page 89
1. Fencing – fencing a patch undergoing either vegetation management or revegetation, fencing is a necessary action if the patch is subject to stock grazing or, in the case of revegetation, rabbit invasion. For stock control we have elected to use the most common types of fencing, those being:
i.) Five strand ring lock fencing to 900mm high with a pine post every 9m and two droppers at 3m intervals. This is commonly referred to as sheep and lamb fencing. Allowances have been made for gates at a rate of one gate per 5km of fencing for fences up to 10km in length or one gate for every 10% of total fence length for fences over 10km in length inclusive of all hinges and mountings.
ii.) Five strand wire fencing with two barbed upper strands. A pine post every 20 meters with three droppers in between. This is a common fence for livestock such as cattle. Allowances have been made for gates at a rate of one gate per 5km of fencing for fences up to 10km in length or one gate for every 10% of total fence length for fences over 10km in length inclusive of all hinges and mountings.
The fence for rabbit control should be wire netting to 700mm high with 120-150mm rolled flat on the ground on the outside of the fence and staked every 5m. Costs of fencing are listed in table 14. The low cost estimates are for materials only and assume the fence will be erected with “in kind” contributions. The high cost estimates are for materials and contractor time to erect.
Stock exclusion Fencing type Low ($ per linear metre) High ($ per linear metre) Gates ($)
Rabbit 8 15 200
Ringlock 3.50 5 200 Soil substrate
Cattle 3 4.50 200
Rabbit 14 21 200
Ringlock 9.50 11 200 Rocky substrate (i.e. Limestone
Cattle 9 0.50 200
Table 14 - Estimates of costs of fencing per linear metre. Source (Coopers Rural and Hardware
Supply, pers. comm., 2005; David Hein, Trees for Life, pers. comm., 2005; Mitchell Fencing, pers. comm., 2005)
2. Revegetation – there are three types of revegetation considered in this study all of which have advantages and disadvantages. The expected outcomes of each of these actions can and does vary from site to site depending on the climatic conditions of the site, the suitability of the site, the viability of the seed supplied or quality of the tube stock and the skill of the operators.
i.) Natural regeneration – in situations where the proposed site is within 1km of some remnant vegetation, protecting the site from rabbits or stock can result in effective regeneration of the local native species via natural dispersal of propagules. Where the patch of remnant vegetation is in good condition or better, the longer-term biodiversity outcomes (i.e. 30+ years) are more likely to resemble those of the remnant patch. Effective management of natural regeneration can result in both the lowest cost option as well as the greatest biodiversity outcomes.

CSIRO Land and Water Page 90
ii.) Direct seeding – in situations where the site is readily accessible and the clay content of the soil is not too high, direct seeding is generally an effective option. Gaining access to a suitable quantity of viable seed is usually the greatest impediment to this method of revegetation as it may be necessary to use as much as five kilograms of seed for each hectare (David Hein, Trees for Life, pers comm. 2005). However when the seed is dispersed in a mixed form the resulting germination allows the processes of competition to encourage vegetation structure more similar to natural regeneration than tube stock planting. Over the longer term (i.e. 30+ years) the expected biodiversity outcomes can vary dramatically depending on the diversity and success of the seeding, the proximity to other patches of remnant vegetation. Direct seeding is generally more effective in sandier soils. Where the clay content of the soil is quite high revegetation with tube stock is generally more successful.
iii.) Planting of tube stock – tube stock planting is the preferred option where access is difficult (i.e. steep river banks or gullies) or where infill planting is required, and natural regeneration is likely to be impeded. Effective survival rates rely on correct planting techniques. Survivability can be up to 80% when correct planting techniques are used, supplied tube stock is vigorous and healthy, and pests are effectively controlled. Although technological improvements have led to increases in the cost efficiency of tube stock planting, it can still be an expensive exercise because of the high cost of inputs (labour and materials). Tube stock planting may however, complement direct seeding approaches.
Table 15 lists the upper and lower cost estimates for revegetating with tube stock and direct seeding. Natural regeneration has no direct costs. The low cost option for tube stock planting assumes a large degree of in-kind contributions and the high cost options are based on contractor costs.
Tube stock revegetation previously grazed
Price ($) per stem Price ($) per ha at 1m centres
Low High Low High
Site Preparation 0.10 1.50 100.00 1,500.00
Plant Supply 0.06 1.50 60.00 1,500.00
Planting 0.00 2.00 0.00 2,000.00
Aftercare 0.10 1.50 100.00 1,500.00
Total 0.26 6.50 260.00 6,500.00
Direct seeding revegetation previously grazed
Without Site Preparation With Site Preparation
Low High Low High
100.00 500.00 200.00 800.00
Table 15 - Estimates of costs of revegetation activities. Source (David Hein, Trees for Life, pers.
comm. 2005)
3. Bushcare/weed control – estimating the cost of weed control activities is a difficult task. Control efficacy is reliant on the skills of the operators and their knowledge of the correct methods, materials and timings. Application of incorrect weed control

CSIRO Land and Water Page 91
methods can result in a biodiversity reduction. For example actively spraying a non-aquatically safe glyphosate product across a water course can kill or damage aquatic species such as fish, frogs or macroinvertebrates. For this reason, costs are derived from operators who are actively used by natural resource management groups such as the River Murray Catchment Water Management Board or the Riverland Plant and Animal Control Board. Table 16 outline the costs of undertaking weed control works in patches of remnant native vegetation with varying degrees of weed infestation and patch disturbance.
Level of infestation
Low Moderate High Level of disturbance Low ($) High ($) Low ($) High ($) Low ($) High ($)
Low 912 1,936 1,140 2,640 1,710 3,520
Moderate 684 1,496 1,026 2,288 1,425 2,992
High 342 880 570 1,584 855 2,376
Table 16 – Upper and lower estimates of the cost of weed control activities for areas of
different levels of weed infestation and ecosystem disturbance from clearance or grazing. Costs are inclusive of materials and labour. Source (Riverland Animal and Plant Control Board, pers. comm. 2005, Tony Golder, Spray Contractor, pers. comm., 2005)
The range of possible costs vary on a site-by-site basis depending on the biophysical characteristics and the threats operating at the site (e.g. the level of weed infestation and the degree of disturbance of the native community). For vegetation management the low cost alternatives assume that only weed control is required. Table 17 lists the combined figures from Table 14 and Table 16. The low cost options include the cost of weed control only and the high cost options include the cost of weed control and fencing. The high cost options assume that both weed control and a rabbit proof fence in rocky or limestone substrate are required.
Level of infestation
Low Moderate High Level of disturbance Low ($) High ($) Low ($) High ($) Low ($) High ($)
Low 912 10,536 1,140 11,240 1,710 12,120
Moderate 684 10,096 1,026 10,888 1,425 11,592
High 342 9,480 570 10,184 855 10,976
Table 17 - Estimates of the costs of vegetation management per hectare for areas of different
levels of weed infestation and ecosystem disturbance from clearance or grazing.
For revegetation, all sites assume an open or cleared paddock located near a patch of remnant vegetation in reasonable condition. It has also been assumed that the low cost alternative requires boom spraying only and the high cost alternatives require boom spraying and a rabbit proof fence in rocky or limestone substrate. Table 18 outlines high and low estimates of the costs of undertaking each of the three revegetation alternatives.

CSIRO Land and Water Page 92
Natural Regeneration Direct Seeding Tube stock
Low ($) High ($) Low ($) High ($) Low ($) High ($)
33 8,665 200 9,400 260 15,100
Table 18 - Estimates of the cost of undertaking revegetation per hectare.
The above discussion outlines all of the many factors involved in the costs of both vegetation management and revegetation. It is a difficult step then to take this complexity and use it to make estimates of the total cost of meeting regional resource condition targets through these NRM actions. To make an accurate assessment more information is required on such things as the length of fencing required, the distribution of rabbits, limestone substrate, and the level of disturbance of native communities, the distribution and level of threat of weed invasion, and also the preference for different revegetation types. Nonetheless, we can use this information to make low and high estimates of the average price per hectare of vegetation management and revegetation in the Corridor in order to estimate the total cost of establishment of these NRM actions.
Cost estimates are similar for vegetation management and revegetation activities. Past rates of funding can help us estimate the costs of vegetation management and revegetation. Low estimates for revegetation which have involved direct seeding, no fencing and minimal weed control are around $300/ha. Average figures are around $300 - $500 per ha excluding fencing (Graham Gates, Project Officer, Coorong District Local Action Planning Group, pers. comm. 2005). To estimate the total establishment costs of vegetation management and revegetation in meeting resource condition targets in the Corridor in this study we use a low estimate of $500 per hectare and a high estimate of $3,000 per hectare.
5.1.3 Opportunity Costs
Opportunity costs are the costs of foregone income from agricultural land uses such as grazing and cereal cropping. A layer of opportunity costs is a necessary attribute in the MCDA to identify the least expensive locations for vegetation management and revegetation actions. In this study opportunity costs are calculated based on the current value of agricultural production. The real opportunity costs may be much greater than those modelled, especially in cases where agricultural land adjoins expanding townships and the potential real estate value is greater than the current agricultural production. Dryland agriculture close to existing irrigation infrastructure and near rapidly expanding irrigation developments may also have greater value than the current value of agricultural production. However, these issues are not considered in this study.
Opportunity costs were mapped in a sequence of steps. Initially, the spatial distribution of dryland agriculture was quantified and mapped using the DWLBC catchment scale land use mapping. Despite having a lower commodity resolution that Bryan and Marvanek (2004), the DWLBC catchment scale mapping is used because of its higher spatial resolution. DWLBC land use mapping classifies land parcels according to the Australian Land Use and Mapping Classification standard Version 4 (ALUMC V.4).
Land use classes were then generalised to 5 categories of dryland land use: Cereals; Grazing; Hay & Silage; Legumes; and Other Minimal Use (Figure 31). The Cereals class includes ALUMC V.4 classes of cereals and cropping, and the Grazing class includes the ALUMC V.4 classes of grazing native vegetation and grazing modified pastures. All native vegetation on private land is considered to be under the agricultural landuse of grazing and to have the same opportunity cost as grazing.

CSIRO Land and Water Page 93
Berri
Morgan
Mannum
Loxton
RenmarkWaikerie
Swan Reach
Tailem Bend
Blanchetown
Murray Bridge
Kingston-On-Murray
350,000
350,000
400,000
400,000
450,000
450,000
500,000
500,000
6,10
0,00
0
6,10
0,00
0
6,15
0,00
0
6,15
0,00
0
6,20
0,00
0
6,20
0,00
0
6,25
0,00
0
6,25
0,00
0
0 10 20
Kilometres
Native Vegetation
1956 FloodplainCleared Areas
Irrigated AreasTowns
Dryland Agricultural LanduseCerealsGrazingHay & SilageLegumesOther minimal use
River Murray Corridor Boundary
Figure 31 – Dryland agricultural land use in the Corridor.
Each class was given an average gross margin (GM) in present value terms for the region based on figures from Sadras (2004), Bryan and Marvanek (2004) and Ward and Trengove (2004):
• Cereals $80/ha • Grazing $37.50/ha • Hay & silage $150/ha • Legumes $120/ha • Remnant vegetation on private land $15/ha • Other minimal use $10/ha
The spatial extent of dryland agriculture mapped by DWLBC differs from the SIMPACT modelling and other parameters in this study. Spatial operations were used to estimate the opportunity costs for areas not mapped as dryland agriculture by DWLBC. These cells were given the opportunity cost of the nearest cell mapped by DWLBC.
Although soil quality and other factors have a strong influence, the primary driver of dryland agricultural productivity in the Corridor is rainfall. There exists a steep climatic gradient over the Corridor study area (Figure 23; Figure 24). Similar dryland agriculture types can return

CSIRO Land and Water Page 94
very different gross margins depending on the rainfall. Hence, in order to gain better representation of opportunity costs, average gross margin figures were redistributed following the spatial distribution of rainfall. Gross margin figures for each grid cell were adjusted using the ratio of the mean annual precipitation of the cell to the average mean annual precipitation of the SA MDB region (300 mm/yr). The mean annual precipitation layer was modelled using BIOCLIM (Figure 23). As a result, agricultural land uses in drier climates were attributed lower opportunity costs and land uses in moister climates were attributed higher opportunity costs (Figure 32).
Opportunity costs of dryland agriculture as modelled in this study range from $7.83/ha to $199.00 per hectare with a mean of $46.53 and a standard deviation of $22.54. The total economic returns to agriculture in gross margin terms and hence, the total opportunity costs to agriculture in the Corridor as calculated using the methods described above is $29.25 Million per year. This amount of gross margin agrees well with the $21.4 Million in returns to agriculture found by Bryan and Marvanek (2004) when they estimated profit at full equity. Opportunity costs are linearly rescaled to values between 1 and 5 for input as an attribute in MCDA (Figure 32).
Berri
Morgan
Mannum
Loxton
RenmarkWaikerie
Swan Reach
Tailem Bend
Blanchetown
Murray Bridge
Kingston-On-Murray
350,000
350,000
400,000
400,000
450,000
450,000
500,000
500,000
6,10
0,00
0
6,10
0,00
0
6,15
0,00
0
6,15
0,00
0
6,20
0,00
0
6,20
0,00
0
6,25
0,00
0
6,25
0,00
0
0 10 20
Kilometres
Native Vegetation
1956 Floodplain
Irrigated AreasTowns
Opportunity Costs
River MurrayPublic Land$7 - $14
$14 - $24$24 - $38$38 - $57$57 - $81$81 - $134$134 - $199
$/haCostScore
1
5 Corridor Boundary
Figure 32 – Opportunity costs in the Corridor based on land use, climate and estimated gross margin values. Note that 7 classes are used in this map to aid visual interpretation. Costs scores are continuously valued between 1 and 5.

CSIRO Land and Water Page 95
5.1.4 Biomass
A significant amount of research has examined the potential for the broad-scale production of Eucalyptus species for biomass industries in southern Australia and elsewhere (Rozakis et al. 2001), in particular, for Integrated Tree Processing (ITP). Ellis (2001) provided an early assessment of the potential for biomass production in the low rainfall agricultural areas of South Australia. Enecon (2001) and Howard and Olszak (2004) found that an ITP plant is potentially economically viable in southern Australia and the Enecon (2001) study led to the implementation of the trial ITP plant at Narrogin in Western Australia. Ward and Trengove (2004) and Howard and Olszak (2004) review the market opportunities for the products of an ITP including renewable energy, oil and activated charcoal. Ward and Trengove (2004) found that the broadacre production of biomass and processing in an ITP plant is a potentially viable economic proposition on both sides of the production system. In this part of the study we generate attribute maps of the spatial distribution of the economic profitability of biomass for landholders in the Corridor over time and provide a comprehensive assessment of the sensitivity to the model parameters.
In an exhaustive search, Bennell et al. (2004) found that the best species for supplying biomass to an ITP plant in the Corridor are Eucalyptus oleosa and Eucalyptus porosa. In this study we assess the economics of revegetating areas in the Corridor with Eucalyptus oleosa to supply an ITP plant, compared to current agricultural production. Economic and financial measures are calculated to provide some sense of the profitability of biomass to farmers. This work integrates strongly with the FloraSearch (Bennell et al. 2004) and Biomass (Ward and Trengove 2004) projects and builds significantly upon them.
Maps of biomass profitability were developed using the spatially varying parameters of biomass productivity, opportunity costs, travel costs and scalar parameters including harvest costs, maintenance costs and fertiliser costs. Costs and returns to biomass occur at irregular intervals so the economic analysis is conducted in net present value terms. Maps of economic indicators of biomass profitability become attributes for input into the MCDA model.
5.1.4.1 Methods Economic analysis of agricultural and forestry enterprises should consider the timing of costs and returns to the enterprise in the context of people’s time preference. This is particularly relevant for biomass production because it involves significant up-front establishment costs, some delay until first harvest, and regular harvest at 3 yearly intervals. People’s time preference is founded on the premise that any future value is equivalent to some current sum of money invested at a certain percentage interest rate and a certain rate of inflation, and is dependent upon their attitude to risk. Time preference is usually incorporated in economic analyses using discounting. This involves the use of interest (or discount rates) that discount future sums of money (both costs and revenue) compared with those of today. The economic measures of Net Present Value (NPV), Modified Internal Rate of Return (MIRR) and Equal Annual Equivalent (EAE) incorporate irregular cash flow and time preference (Jacobson 1998) and are used to assess the economic potential of biomass industries in the Corridor.
Economic analysis of biomass in the Corridor involves calculation of the revenue from biomass and the costs of production over some time frame. Hobbs (pers comm. 2004), based on Bennell et al. (2004), suggests that the optimal harvesting regime for E. oleosa in the Corridor is a 6-year establishment period followed by three-yearly harvests. Harvest involves coppicing of the plant near ground level from which it will reshoot. E. oleosa does not need replanting after harvest thereby saving a significant cost and delay in waiting for the new crop to become established. In normal production, the ITP plant needs a constant supply of 100,000 green tonnes of biomass each year. To provide this amount we assume the staggered planting regime of one third of the crop planted at the beginning of year 1, one third in year 2 and the final third in year 3. We also assume a staggered harvest after the 6-year establishment period of one third of the crop harvested each year and each hectare of
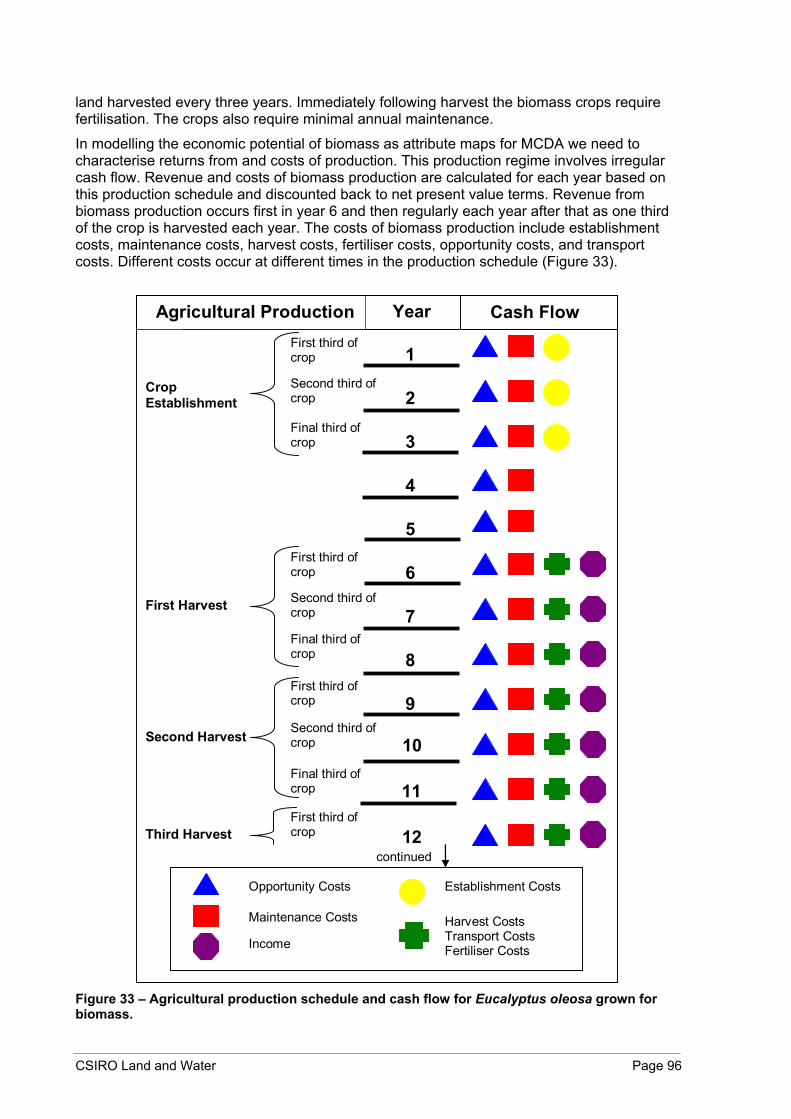
CSIRO Land and Water Page 96
land harvested every three years. Immediately following harvest the biomass crops require fertilisation. The crops also require minimal annual maintenance.
In modelling the economic potential of biomass as attribute maps for MCDA we need to characterise returns from and costs of production. This production regime involves irregular cash flow. Revenue and costs of biomass production are calculated for each year based on this production schedule and discounted back to net present value terms. Revenue from biomass production occurs first in year 6 and then regularly each year after that as one third of the crop is harvested each year. The costs of biomass production include establishment costs, maintenance costs, harvest costs, fertiliser costs, opportunity costs, and transport costs. Different costs occur at different times in the production schedule (Figure 33).
Maintenance Costs
Opportunity Costs
Harvest Costs Transport Costs Fertiliser Costs
Establishment Costs
Income
First Harvest
First third of crop
Second third of crop
Final third of crop
Second Harvest
First third of crop
Second third of crop
Final third of crop
Crop Establishment
First third of crop
Second third of crop
Final third of crop
continued
Third Harvest First third of crop
10
11
12
1
3
2
5
4
6 7
9
8
Year Cash Flow Agricultural Production
Figure 33 – Agricultural production schedule and cash flow for Eucalyptus oleosa grown for biomass.

CSIRO Land and Water Page 97
Returns to the farmer are factory gate prices. These include transport costs based on the distance to the ITP plant and the quality of the roads required for travel. The location selected for establishment of the ITP is Kingston-on-Murray because there is a good selection of available land nearby. The plant is located in the heart of the highest salt-contributing land to facilitate the greatest public NRM benefits of biomass.
Economic returns to biomass production depend on the production of the site and the price per tonne of biomass. The principal input is the GIS layer of green biomass productivity of Eucalyptus oleosa in m3/ha/yr. Bennell et al. (2004) produced a suitable layer capturing the spatial distribution of productivity based on experimental growth rates of E. oleosa. Originally created at a resolution of 5km grid cells, this layer was downscaled using bilinear resampling to 254m grid cell resolution to match the other GIS data used in the MCDA (Figure 34).
Berri
Morgan
Mannum
Loxton
RenmarkWaikerie
Swan Reach
Tailem Bend
Blanchetown
Murray Bridge
Kingston-On-Murray
350,000
350,000
400,000
400,000
450,000
450,000
500,000
500,000
6,10
0,00
0
6,10
0,00
0
6,15
0,00
0
6,15
0,00
0
6,20
0,00
0
6,20
0,00
0
6,25
0,00
0
6,25
0,00
0
0 10 20
Kilometres
Native Vegetation1956 Floodplain
Irrigated AreasTowns
Stemwood Productivity
River Murray
m3/ha/yr1.1 - 2.12.1 - 2.62.6 - 3.13.1 - 3.73.7 - 4.44.4 - 5.45.4 - 6.9 Corridor Boundary
Figure 34 – Stemwood productivity of Eucalyptus oleosa in the Corridor downscaled from Bennell et al. (2004).
To calculate the revenue from biomass (Rt) at harvest at year (t) for each grid cell (k) we first calculate the production (Pt) as a layer with values for green tonnes of biomass calculated for each grid cell. To do this we multiply the stemwood volume productivity at harvest (s) of each cell (Figure 34) by the cell area (a) and the time in years since last harvest (mt). A coppicing productivity multiplier (φt) is then applied which attempts to capture the increased productivity
CSIRO Land and Water Page 98
of the species after coppicing compared with establishment productivity rates. A stemwood fraction conversion factor (θt) is also applied which converts the stemwood volumes into total tonnes of green biomass (wood, twigs, leaves inclusive). This is all divided by a harvest schedule staggering component (g). In this case we use g = 1/3 because we are harvesting a third of the area each year.
Pt = 0 for t < 6
for t < 6 Where:
Pt = production (green tonnes of biomass) s = stemwood volume productivity (m3/ha/yr) a = cell area (6.4516 ha) mt = time since last harvest (years) φt = coppicing productivity multiplier (green tonnes per m3) θt = stemwood fraction conversion factor (scalar) g = harvest schedule staggering component (g = 1/3) t = year
For t >=6 and t <= 8 φt = 1 θt = 1.9074 mt = 6
For t > 8 φt = 1.5 θt = 1.7521 mt = 3
Finally, the revenue in dollars for each cell is calculated as a layer by multiplying the production in green tonnes of biomass of each grid cell by the factory gate price per green tonne in dollars (p). In the Most Likely Scenario we use a factory gate price of $30 per green tonne. Ward and Trengove (2004) found that the factory gate price of $47 per green tonne is the highest price for biomass that could be paid to farmers that still returns an internal rate of return to the ITP plant >= 15% (the sensitivity analysis also addresses factory gate price):
Rt = Pt.p
All costs are calculated as layers with values in dollars for each grid cell. Significant establishment costs are incurred from planting one third of the biomass crop at the beginning of years 1, 2 and 3 such that:
ECt = ec.a.g for t >=1, t <= 3
ECt = 0 for t > 3
Where: ECt = Total establishment costs for year t ($) ec = Establishment costs ($/ha)
Maintenance costs are incurred every year (but only occur for the total area of crop after year 3 due to staggered plantings) and are calculated as:
MCt = mc.a.t.g for t >=1, t <= 3
MCt = mc.a for t > 3
Where: MCt = Total maintenance costs for year t ($) mc = Maintenance costs ($/ha)
gmasP tttt .... θϕ=

CSIRO Land and Water Page 99
Harvest costs occur first at year 6 and then every year after that for one third of the total crop area harvested each year:
HCt = Pt.hc for all t
Where: HCt = Total harvest costs for year t ($) hc = Harvest costs ($ per green tonne of biomass)
Fertiliser costs follow harvest and are calculated as:
FCt = 0 for t < 6
FCt = fc.a.g for t >= 6
Where: FCt = Total fertiliser costs for year t ($) fc = Fertiliser costs ($/ha)
Opportunity costs are also incurred each year as the growing of biomass is considered to require the cessation of all prior agricultural land uses. On the local scale however, biomass may be integrated into agriculture and grown in strips to complement existing practices (e.g. provide wind breaks for livestock or lower water tables for reducing salinity effects on cropping). Opportunity costs are calculated for each cell by multiplying the opportunity costs per hectare (Figure 32) by the cell area:
OCt = oc.a for all t
Where: OCt = Total opportunity costs for year t ($) oc = Opportunity costs ($/ha, see Figure 32)
Transport costs involve the costs incurred from trucking green biomass from each grid cell to the proposed ITP plant located at Kingston-on-Murray along the existing road system. Transport costs were calculated as a layer for the entire SA MDB INRM region using a costdistance function in a GIS. To construct this layer a cost multiplier layer was created using a variety of data sources to characterise the relative cost of traversing cells of different surfaces. The South Australian roads database (PlanningSA) was used to identify sealed and unsealed roads. Areas of irrigated and dryland agriculture, flood plain and remnant vegetation were also identified. A cost multiplier of 1 is used when travelling on sealed roads. The cost multipliers for different travel surfaces are summarised in Table 19. Transportation costs are lowest along sealed roads, slightly higher along unsealed roads and higher again over open paddocks. Transport is permitted across native vegetation and irrigated areas but the cost multiplier is high and so traversal of these surfaces is not favoured in the costdistance analysis. No travel across the flood plain is permitted unless it is along a road. The cost multiplier layer is multiplied by a transport price (tp) to calculate for each grid cell the total cost in dollars per tonne per kilometre ($/t/km) for traversing the cell and this layer is used as input into costdistance analysis.
Surface Cost Multiplier Sealed roads 1 Unsealed roads 1.2 Open paddock 1.4 Irrigated area or native vegetation 3 Flood plain Not permitted
Table 19 – Multipliers for adjusting the costs of transport of biomass over different surfaces.

CSIRO Land and Water Page 100
Costdistance analysis is a global function in raster GIS that is able to calculate the least expensive route from each cell to a target cell. Costdistance analysis combines the cost of traversal layer in $/t/km with distance measurement to the ITP plant at Kingston-on-Murray to calculate for each grid cell of the minimum cost of transport per green tonne of biomass to the ITP in dollars per tonne (tc) (Figure 35). This layer is then clipped to the Corridor study area.
Figure 35 – Spatial distribution of transport costs ($/tonne) for the Corridor based on the price of $0.046/tonne/km.
To calculate the total transport cost layer we multiply this by the total production for each cell:
TCt =Pt .tc for all t
Where: TCt = Total transport costs for year t ($) tc = Transport costs ($ per green tonne of biomass, see )

CSIRO Land and Water Page 101
The six different types of costs involved in biomass production (establishment costs, maintenance costs, harvest costs, fertiliser costs, opportunity costs, and transport costs) can be used to calculate total biomass production costs in year t (ct):
ct = ECt + MCt + HCt + FCt + OCt + TCt Three economic measures are used to assess the economic potential of biomass based on the above revenue and cost layers. Net Present Value is the total net returns to growing biomass (revenue – costs) discounted to present day dollars. Internal Rate of Return is the discount rate that results in the NPV of growing biomass equalling zero or, in other words, the percentage rate of revenue over costs. Equal Annual Equivalent is the equivalent annual payment required to return the NPV derived from growing biomass considering all of the irregular revenues and costs over time. Using these measures we can assess the profitability of growing biomass over current agricultural practices. By incorporating spatially varying data on production and cost parameters we can calculate the spatial distribution of the profitability of biomass for the Corridor as an attribute for input into MCDA.
More formally, Net Present Value (NPV) can be calculated as:
∑= +
−=
n
tttt
icr
NPV1 )1(
)(
Where:
i = interest (discount) rate rt = the revenue at year t ct = costs at year t n = the number of years.
The Modified Internal Rate of Return assumes that all revenue will be reinvested as it comes in and is a function of the ratio of the present value of all costs (PVc) to the future value of all returns (FVr) from biomass. MIRR is calculated as:
1−= n
c
r
PVFV
MIRR
where
∑= +
=n
tt
tc i
cPV
1 )1()(
and
∑=
−+=n
t
tntr irFV
1)1)((
Using the NPV of biomass production, the Equal Annual Equivalent can be calculated as:
1)1()1(−+
+×= t
t
iiiNPVEAE
Economic assessment of biomass in this study is necessarily highly parameterised. It involves specification of a range of values for model parameters that significantly affect the results of the analysis. There is some uncertainty surrounding all of the specified parameters. The economic assessment is conducted in two phases to cope with this uncertainty. First, the Most Likely Scenario performs a single analysis of the profitability of biomass production using the most likely parameter values. Second, a sensitivity analysis quantifies the effects of
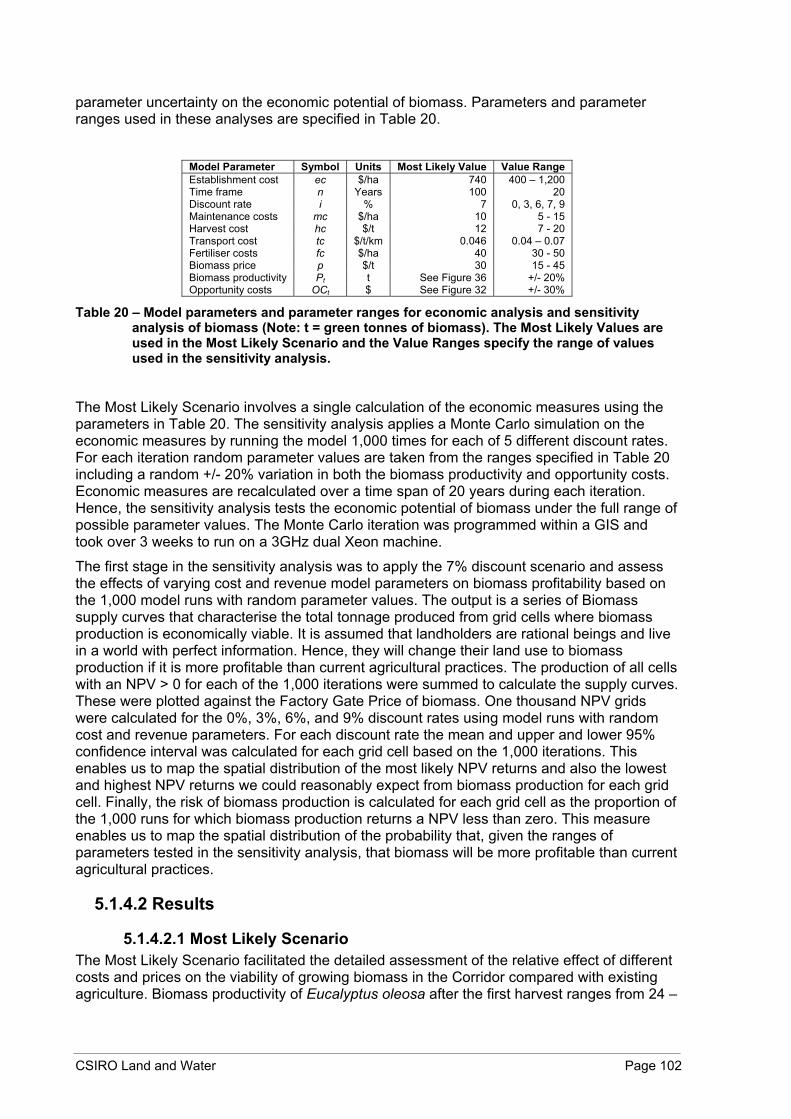
CSIRO Land and Water Page 102
parameter uncertainty on the economic potential of biomass. Parameters and parameter ranges used in these analyses are specified in Table 20.
Model Parameter Symbol Units Most Likely Value Value Range Establishment cost ec $/ha 740 400 – 1,200 Time frame n Years 100 20 Discount rate i % 7 0, 3, 6, 7, 9 Maintenance costs mc $/ha 10 5 - 15 Harvest cost hc $/t 12 7 - 20 Transport cost tc $/t/km 0.046 0.04 – 0.07 Fertiliser costs fc $/ha 40 30 - 50 Biomass price p $/t 30 15 - 45 Biomass productivity Pt t See Figure 36 +/- 20% Opportunity costs OCt $ See Figure 32 +/- 30%
Table 20 – Model parameters and parameter ranges for economic analysis and sensitivity analysis of biomass (Note: t = green tonnes of biomass). The Most Likely Values are used in the Most Likely Scenario and the Value Ranges specify the range of values used in the sensitivity analysis.
The Most Likely Scenario involves a single calculation of the economic measures using the parameters in Table 20. The sensitivity analysis applies a Monte Carlo simulation on the economic measures by running the model 1,000 times for each of 5 different discount rates. For each iteration random parameter values are taken from the ranges specified in Table 20 including a random +/- 20% variation in both the biomass productivity and opportunity costs. Economic measures are recalculated over a time span of 20 years during each iteration. Hence, the sensitivity analysis tests the economic potential of biomass under the full range of possible parameter values. The Monte Carlo iteration was programmed within a GIS and took over 3 weeks to run on a 3GHz dual Xeon machine.
The first stage in the sensitivity analysis was to apply the 7% discount scenario and assess the effects of varying cost and revenue model parameters on biomass profitability based on the 1,000 model runs with random parameter values. The output is a series of Biomass supply curves that characterise the total tonnage produced from grid cells where biomass production is economically viable. It is assumed that landholders are rational beings and live in a world with perfect information. Hence, they will change their land use to biomass production if it is more profitable than current agricultural practices. The production of all cells with an NPV > 0 for each of the 1,000 iterations were summed to calculate the supply curves. These were plotted against the Factory Gate Price of biomass. One thousand NPV grids were calculated for the 0%, 3%, 6%, and 9% discount rates using model runs with random cost and revenue parameters. For each discount rate the mean and upper and lower 95% confidence interval was calculated for each grid cell based on the 1,000 iterations. This enables us to map the spatial distribution of the most likely NPV returns and also the lowest and highest NPV returns we could reasonably expect from biomass production for each grid cell. Finally, the risk of biomass production is calculated for each grid cell as the proportion of the 1,000 runs for which biomass production returns a NPV less than zero. This measure enables us to map the spatial distribution of the probability that, given the ranges of parameters tested in the sensitivity analysis, that biomass will be more profitable than current agricultural practices.
5.1.4.2 Results
5.1.4.2.1 Most Likely Scenario The Most Likely Scenario facilitated the detailed assessment of the relative effect of different costs and prices on the viability of growing biomass in the Corridor compared with existing agriculture. Biomass productivity of Eucalyptus oleosa after the first harvest ranges from 24 –

CSIRO Land and Water Page 103
115 green tonnes of biomass per year per grid cell (6.4516 ha) with an average of 51 tonnes per cell (Figure 36).
The value of establishment costs involved in a planting density of 1,000 plants per hectare is the same for all cells and was specified at $740/ha/yr. This equates to a present value of $4,468 for each grid cell. Maintenance costs are also specified on a per hectare basis and are the same for each grid cell. Specified in the Most Likely Scenario model at a nominal $10 per hectare, the total present value of maintenance costs is $860. Harvest costs vary spatially with biomass productivity. Specified at $12/tonne, the total present value of harvest costs of grid cells in the Corridor ranges between $3,400 and $16,300 (Figure 37). Fertiliser costs are based on area and so are the same for each cell. Specified in the Most Likely Model at $40/ha this equates to a present value of $935 for each cell. Opportunity costs vary spatially according to land use and climate. The present value of opportunity costs ranges from $771 - $19,600 per cell (Figure 38). Transport costs also vary spatially according to production and distance to the ITP plant at Kingston-on-Murray. Present value of transport costs ranges from $0 for cells adjacent to the proposed ITP at Kingston-on-Murray to $12,180 for grid cells far from the plant (Figure 39). Present value of total costs of biomass production for grid cells ranges from $11,600 to $46,200 over a time period of 100 years and at an discount rate of 7% (Figure 40).
Berri
Morgan
Mannum
Loxton
RenmarkWaikerie
Swan Reach
Tailem Bend
Blanchetown
Murray Bridge
Kingston-On-Murray
350,000
350,000
400,000
400,000
450,000
450,000
500,000
500,000
6,10
0,00
0
6,10
0,00
0
6,15
0,00
0
6,15
0,00
0
6,20
0,00
0
6,20
0,00
0
6,25
0,00
0
6,25
0,00
0
0 10 20
Kilometres
Native Vegetation1956 Floodplain
Irrigated AreasTowns
Green Biomass Productivity
River Murray
Tonnes24 - 4040 - 4747 - 5555 - 6565 - 7676 - 9393 - 116 Corridor Boundary
Figure 36 – Annual green biomass productivity (tonnes) for the Corridor from second and
subsequent harvests.

CSIRO Land and Water Page 104
Berri
Morgan
Mannum
Loxton
RenmarkWaikerie
Swan Reach
Tailem Bend
Blanchetown
Murray Bridge
Kingston-On-Murray
350,000
350,000
400,000
400,000
450,000
450,000
500,000
500,000
6,10
0,00
0
6,10
0,00
0
6,15
0,00
0
6,15
0,00
0
6,20
0,00
0
6,20
0,00
0
6,25
0,00
0
6,25
0,00
0
0 10 20
Kilometres
Native Vegetation1956 Floodplain
Irrigated AreasTowns
Present Value of Harvest Costs
River Murray$3,400 - $5,700$5,700 - $6,600$6,600 - $7,800$7,800 - $9,100$9,100 - $10,800$10,800 - $13,100$13,100 - $16,400 Corridor Boundary
Figure 37 – Present value of harvest costs ($) for the Corridor based on the value of $12/ tonne
and 7% discount rate calculated over 100 years.

CSIRO Land and Water Page 105
Berri
Morgan
Mannum
Loxton
RenmarkWaikerie
Swan Reach
Tailem Bend
Blanchetown
Murray Bridge
Kingston-On-Murray
350,000
350,000
400,000
400,000
450,000
450,000
500,000
500,000
6,10
0,00
0
6,10
0,00
0
6,15
0,00
0
6,15
0,00
0
6,20
0,00
0
6,20
0,00
0
6,25
0,00
0
6,25
0,00
0
0 10 20
Kilometres
Native Vegetation1956 Floodplain
Irrigated AreasTowns
Present Value of Opportunity Costs
River Murray$700 - $2,000$2,000 - $3,700$3,700 - $4,600$4,600 - $6,000$6,000 - $8,100$8,100 - $13,200$13,200 - $19,700 Corridor Boundary
Figure 38 – Present value of opportunity costs ($) for the Corridor based on Figure 32 and a 7%
discount rate calculated over 100 years.
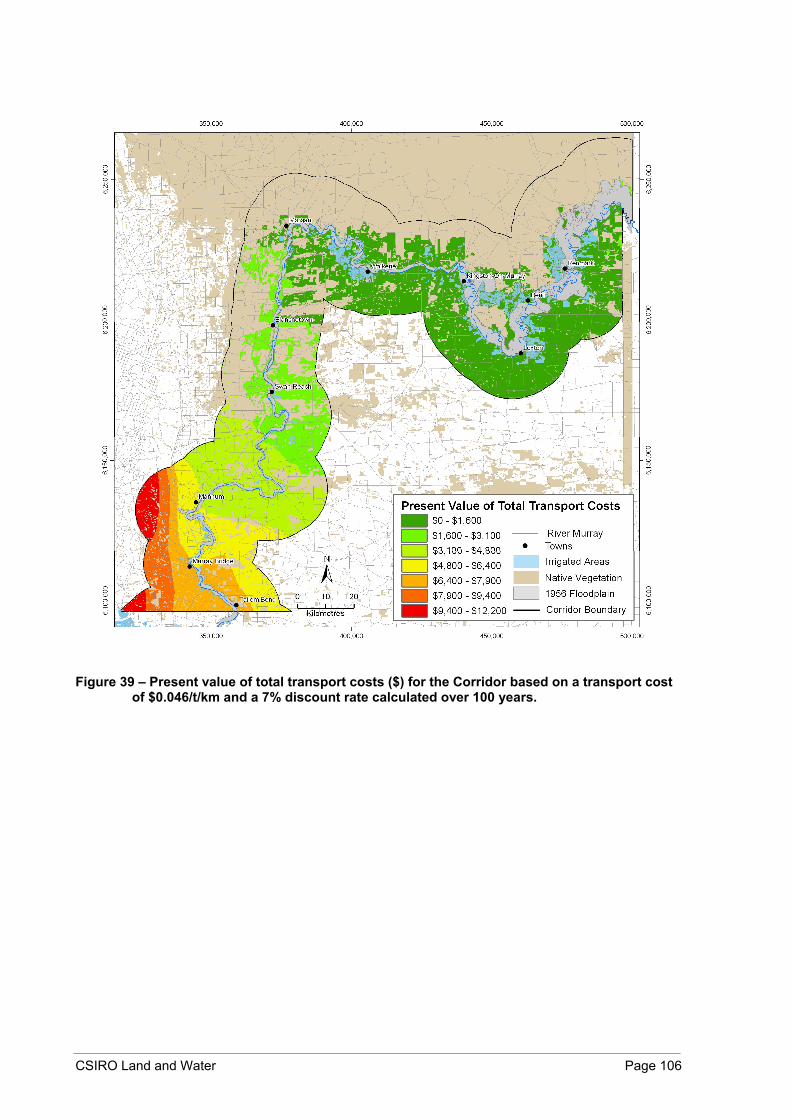
CSIRO Land and Water Page 106
Figure 39 – Present value of total transport costs ($) for the Corridor based on a transport cost
of $0.046/t/km and a 7% discount rate calculated over 100 years.

CSIRO Land and Water Page 107
Berri
Morgan
Mannum
Loxton
RenmarkWaikerie
Swan Reach
Tailem Bend
Blanchetown
Murray Bridge
Kingston-On-Murray
350,000
350,000
400,000
400,000
450,000
450,000
500,000
500,000
6,10
0,00
0
6,10
0,00
0
6,15
0,00
0
6,15
0,00
0
6,20
0,00
0
6,20
0,00
0
6,25
0,00
0
6,25
0,00
0
0 10 20
Kilometres
Native Vegetation1956 Floodplain
Irrigated AreasTowns
Present Value of Total Costs of Biomass Production
River Murray$11,500 - $17,600$17,600 - $20,800$20,800 - $23,600$23,600 - $26,600$26,600 - $30,100$30,100 - $34,700$34,700 - $46,200 Corridor Boundary
Figure 40 – Present value of total costs of biomass production ($) for the Corridor based on a
7% discount rate calculated over 100 years.
Present value of revenue from biomass production in the Most Likely Scenario ranges from $13,300 to $63,900 per grid cell (Figure 41). Assessment of economic measures in the Most Likely Scenario values reveals that biomass is more profitable than current agriculture in most parts of the Corridor. The total Net Present Value of biomass production ranges between $5,000 less, to $25,000 more, than returns from existing agriculture with an average NPV of $7,168 per cell (Figure 42). The Modified Internal Rate of Return ranges between 6.8% and 7.7% (Figure 43), which is acceptable, given that opportunity costs of existing agriculture are included in this analysis. Equal Annual Equivalent payments range from -$54 to $271 per year per grid cell or -$8.37/ha/yr to $42/ha/yr (Figure 44). We can consider biomass production to be potentially viable where the Net Present Value of production, which includes the opportunity costs of existing agriculture, is greater than zero. As a result, the total potentially viable area for biomass production under the Most Likely Scenario is 625,231 ha or 99.6% of the dryland area of the Corridor (Figure 45). The potential tonnage of green biomass supplied by the economically viable area (490 million tonnes) is considerably more than the required supply (100,000 tonnes).

CSIRO Land and Water Page 108
Berri
Morgan
Mannum
Loxton
RenmarkWaikerie
Swan Reach
Tailem Bend
Blanchetown
Murray Bridge
Kingston-On-Murray
350,000
350,000
400,000
400,000
450,000
450,000
500,000
500,000
6,10
0,00
0
6,10
0,00
0
6,15
0,00
0
6,15
0,00
0
6,20
0,00
0
6,20
0,00
0
6,25
0,00
0
6,25
0,00
0
0 10 20
Kilometres
Native Vegetation1956 Floodplain
Irrigated AreasTowns
Present Value of Total Revenue from Biomass Production
River Murray$13,300 - $22,400$22,400 - $26,000$26,000 - $30,500$30,500 - $35,800$35,800 - $42,400$42,400 - $51,500$51,500 - $64,000
Corridor Boundary
Figure 41 – Present value of total revenue from biomass production ($) per cell for the Corridor
based on a 7% discount rate calculated over 100 years.
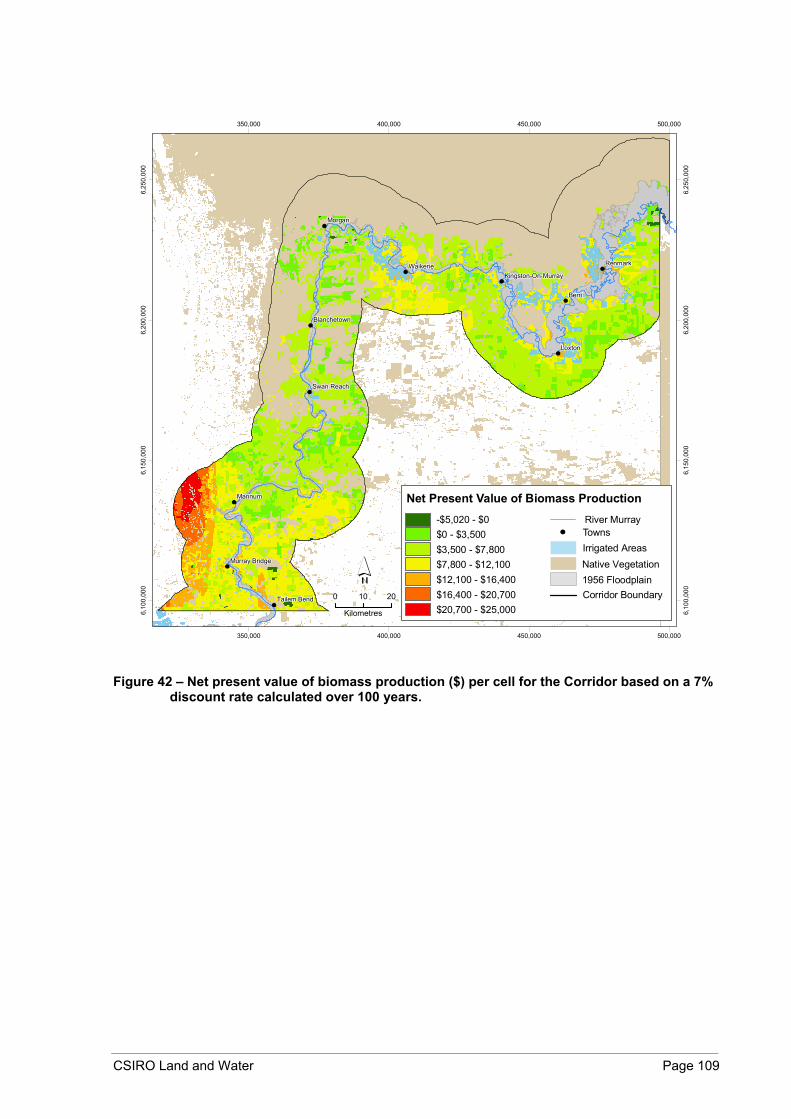
CSIRO Land and Water Page 109
Berri
Morgan
Mannum
Loxton
RenmarkWaikerie
Swan Reach
Tailem Bend
Blanchetown
Murray Bridge
Kingston-On-Murray
350,000
350,000
400,000
400,000
450,000
450,000
500,000
500,000
6,10
0,00
0
6,10
0,00
0
6,15
0,00
0
6,15
0,00
0
6,20
0,00
0
6,20
0,00
0
6,25
0,00
0
6,25
0,00
0
0 10 20
Kilometres
Native Vegetation1956 Floodplain
Irrigated AreasTowns
Net Present Value of Biomass ProductionRiver Murray-$5,020 - $0
$0 - $3,500$3,500 - $7,800$7,800 - $12,100$12,100 - $16,400$16,400 - $20,700$20,700 - $25,000
Corridor Boundary
Figure 42 – Net present value of biomass production ($) per cell for the Corridor based on a 7%
discount rate calculated over 100 years.
CSIRO Land and Water Page 110
Berri
Morgan
Mannum
Loxton
RenmarkWaikerie
Swan Reach
Tailem Bend
Blanchetown
Murray Bridge
Kingston-On-Murray
350,000
350,000
400,000
400,000
450,000
450,000
500,000
500,000
6,10
0,00
0
6,10
0,00
0
6,15
0,00
0
6,15
0,00
0
6,20
0,00
0
6,20
0,00
0
6,25
0,00
0
6,25
0,00
0
0 10 20
Kilometres
Native Vegetation1956 Floodplain
Irrigated AreasTowns
Modified Internal Rate of Return fromBiomass Production (%)
River Murray6.81 - 6.96.91 - 7.07.01 - 7.27.21 - 7.37.31 - 7.47.41 - 7.67.61 - 7.7
Corridor Boundary
Figure 43 – Modified Internal Rate of Return from biomass production ($) for the Corridor
based on a 7% discount rate calculated over 100 years.

CSIRO Land and Water Page 111
Berri
Morgan
Mannum
Loxton
RenmarkWaikerie
Swan Reach
Tailem Bend
Blanchetown
Murray Bridge
Kingston-On-Murray
350,000
350,000
400,000
400,000
450,000
450,000
500,000
500,000
6,10
0,00
0
6,10
0,00
0
6,15
0,00
0
6,15
0,00
0
6,20
0,00
0
6,20
0,00
0
6,25
0,00
0
6,25
0,00
0
0 10 20
Kilometres
Equal Annual Equivalent Returns fromBiomass Production
-$50 - $0$0 - $40$40 - $80$80 - $130$130 - $180$180 - $220$220 - $270
Native Vegetation1956 Floodplain
Irrigated AreasTownsRiver Murray
Corridor Boundary
Figure 44 – Equal Annual Equivalent returns from biomass production ($) per cell for the
Corridor based on a 7% discount rate calculated over 100 years.
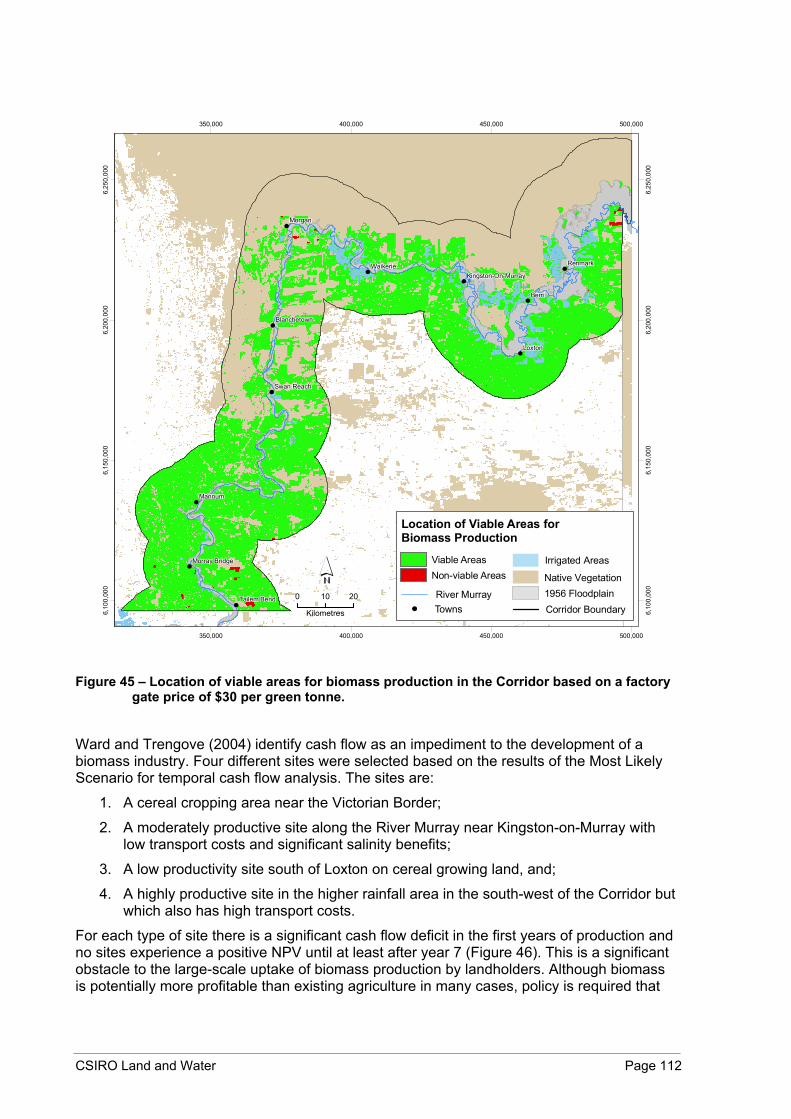
CSIRO Land and Water Page 112
Berri
Morgan
Mannum
Loxton
RenmarkWaikerie
Swan Reach
Tailem Bend
Blanchetown
Murray Bridge
Kingston-On-Murray
350,000
350,000
400,000
400,000
450,000
450,000
500,000
500,000
6,10
0,00
0
6,10
0,00
0
6,15
0,00
0
6,15
0,00
0
6,20
0,00
0
6,20
0,00
0
6,25
0,00
0
6,25
0,00
0
0 10 20
Kilometres
Native Vegetation1956 Floodplain
Irrigated Areas
Towns
Location of Viable Areas for Biomass Production
River Murray
Non-viable AreasViable Areas
Corridor Boundary
Figure 45 – Location of viable areas for biomass production in the Corridor based on a factory
gate price of $30 per green tonne.
Ward and Trengove (2004) identify cash flow as an impediment to the development of a biomass industry. Four different sites were selected based on the results of the Most Likely Scenario for temporal cash flow analysis. The sites are:
1. A cereal cropping area near the Victorian Border;
2. A moderately productive site along the River Murray near Kingston-on-Murray with low transport costs and significant salinity benefits;
3. A low productivity site south of Loxton on cereal growing land, and;
4. A highly productive site in the higher rainfall area in the south-west of the Corridor but which also has high transport costs.
For each type of site there is a significant cash flow deficit in the first years of production and no sites experience a positive NPV until at least after year 7 (Figure 46). This is a significant obstacle to the large-scale uptake of biomass production by landholders. Although biomass is potentially more profitable than existing agriculture in many cases, policy is required that
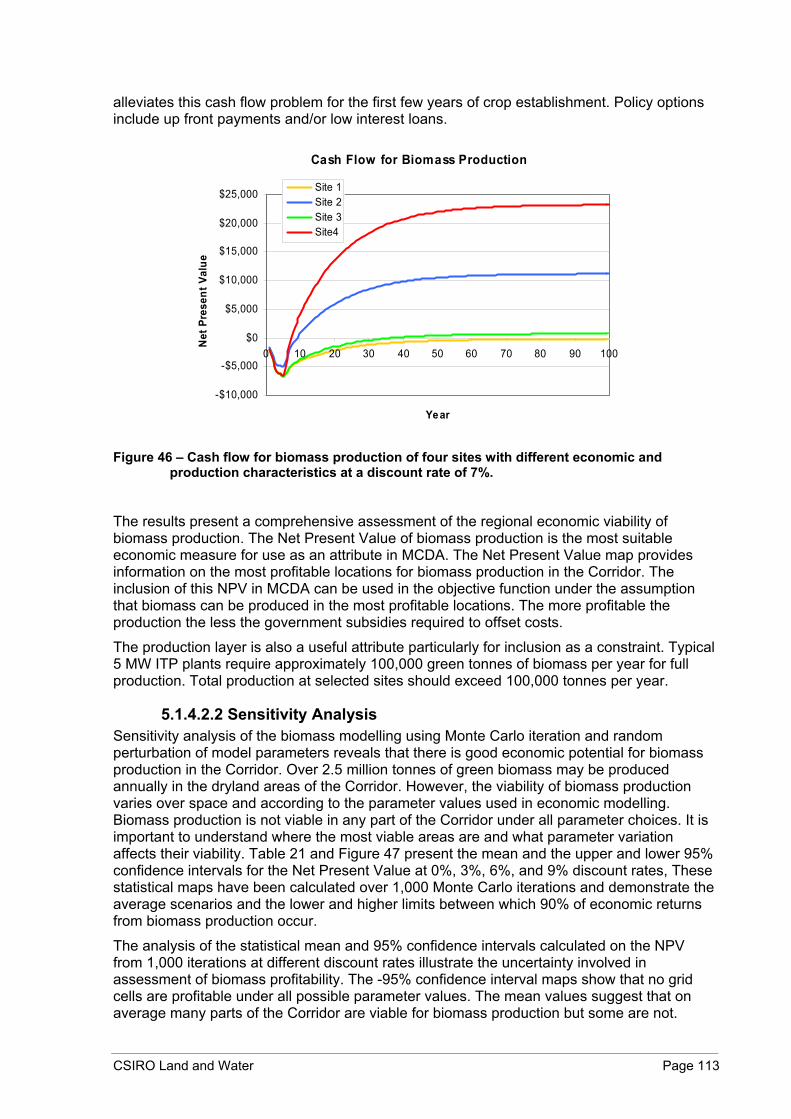
CSIRO Land and Water Page 113
alleviates this cash flow problem for the first few years of crop establishment. Policy options include up front payments and/or low interest loans.
Cash Flow for Biomass Production
-$10,000
-$5,000
$0
$5,000
$10,000
$15,000
$20,000
$25,000
0 10 20 30 40 50 60 70 80 90 100
Year
Net
Pre
sent
Val
ueSite 1Site 2Site 3Site4
Figure 46 – Cash flow for biomass production of four sites with different economic and
production characteristics at a discount rate of 7%.
The results present a comprehensive assessment of the regional economic viability of biomass production. The Net Present Value of biomass production is the most suitable economic measure for use as an attribute in MCDA. The Net Present Value map provides information on the most profitable locations for biomass production in the Corridor. The inclusion of this NPV in MCDA can be used in the objective function under the assumption that biomass can be produced in the most profitable locations. The more profitable the production the less the government subsidies required to offset costs.
The production layer is also a useful attribute particularly for inclusion as a constraint. Typical 5 MW ITP plants require approximately 100,000 green tonnes of biomass per year for full production. Total production at selected sites should exceed 100,000 tonnes per year.
5.1.4.2.2 Sensitivity Analysis Sensitivity analysis of the biomass modelling using Monte Carlo iteration and random perturbation of model parameters reveals that there is good economic potential for biomass production in the Corridor. Over 2.5 million tonnes of green biomass may be produced annually in the dryland areas of the Corridor. However, the viability of biomass production varies over space and according to the parameter values used in economic modelling. Biomass production is not viable in any part of the Corridor under all parameter choices. It is important to understand where the most viable areas are and what parameter variation affects their viability. Table 21 and Figure 47 present the mean and the upper and lower 95% confidence intervals for the Net Present Value at 0%, 3%, 6%, and 9% discount rates, These statistical maps have been calculated over 1,000 Monte Carlo iterations and demonstrate the average scenarios and the lower and higher limits between which 90% of economic returns from biomass production occur.
The analysis of the statistical mean and 95% confidence intervals calculated on the NPV from 1,000 iterations at different discount rates illustrate the uncertainty involved in assessment of biomass profitability. The -95% confidence interval maps show that no grid cells are profitable under all possible parameter values. The mean values suggest that on average many parts of the Corridor are viable for biomass production but some are not.

CSIRO Land and Water Page 114
Looking at the +95% confidence interval, all areas are viable and some are considerably more profitable than existing agriculture (Figure 47). Therefore, there is no guarantee of the viability of biomass under all potential economic situations. This is the nature of agriculture in dry regions such as the Corridor and biomass is likely to be viable in many areas under typical cost and revenue situations. Landholders can use this kind of information to base their land use decisions according to their own level of risk aversion (see Section 0).
Dis
coun
t
Stat
istic
NPV ($) MIRR (%) EAE
-95% -20,486 -2.70 -204.9Mean 6,284 0.77 62.80% 95% 33,055 4.24 330.6
-95% -16,106 -0.06 -167.8Mean 2,829 3.42 29.53% 95% 21,764 6.91 226.7
-95% -13,316 2.48 -179.9Mean 535 6.02 7.26% 95% 14,386 9.55 194.4
-95% -11,809 4.81 -200.5Mean -739 8.62 -12.69% 95% 10,330 12.43 175.4
Table 21 – Mean grid cell values for each statistical grid (mean, -95% and +95% confidence
intervals) for each economic measure (NPV, MIRR, EAE) calculated over 1,000 runs at each discount rate (0, 3, 6, 9%).
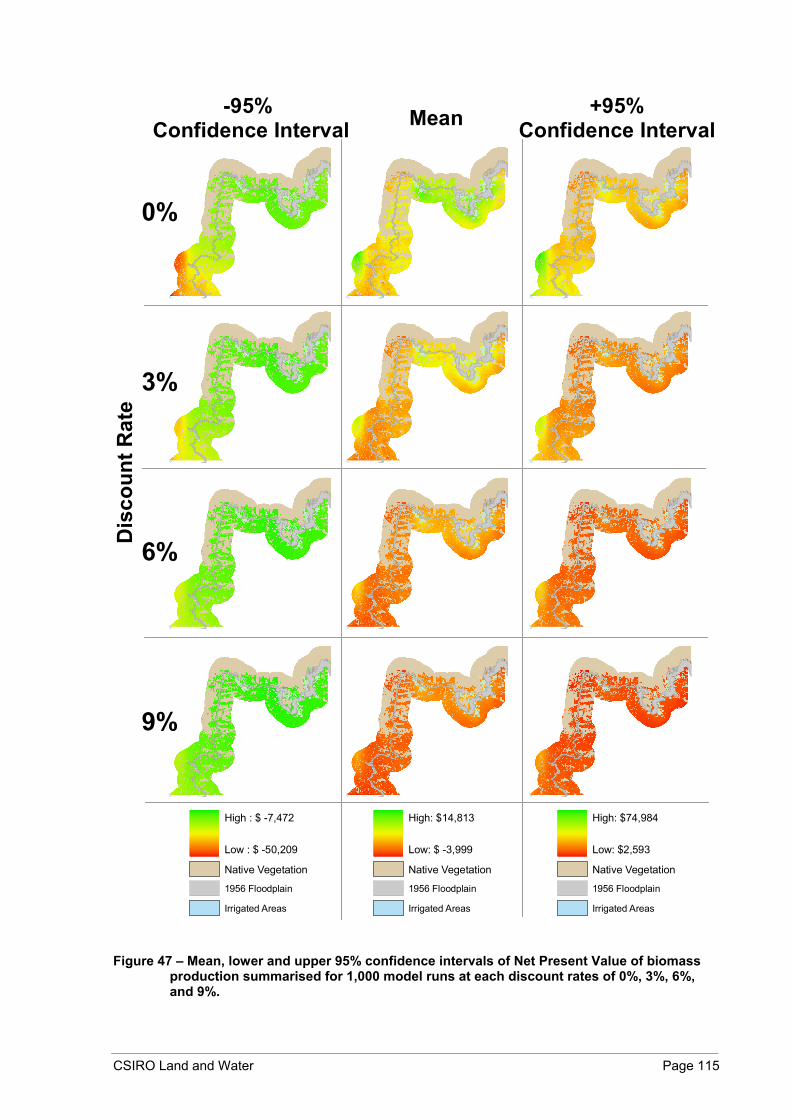
CSIRO Land and Water Page 115
-95% Confidence Interval Mean +95%
Confidence IntervalD
isco
unt R
ate
0%
3%
6%
9%
1956 Floodplain
High : $ -7,472 Low : $ -50,209
Native Vegetation
Irrigated Areas
1956 Floodplain
High: $14,813 Low: $ -3,999
Native Vegetation
Irrigated Areas
1956 Floodplain
High: $74,984 Low: $2,593
Native Vegetation
Irrigated Areas Figure 47 – Mean, lower and upper 95% confidence intervals of Net Present Value of biomass
production summarised for 1,000 model runs at each discount rates of 0%, 3%, 6%, and 9%.

CSIRO Land and Water Page 116
Variation in cost parameters tends to have only very slight effects on the mean net present value of grid cells. Variation in maintenance and fertiliser costs have no effect on mean NPV. Transport, establishment, harvest and opportunity cost parameter variation have a slight inverse relationship with mean net present value because the higher the costs, the lower the returns. In all cases there is significant variation about these trends (Figure 48).
Establishment Costs vs. Returns
-20,000
-15,000
-10,000
-5,000
0
5,000
10,000
15,000
20,000
400 600 800 1000 1200
Establishm ent Costs ($/ha)
Mea
n N
et P
rese
nt V
alue
($
/cel
l)
M aintenance Costs vs. Returns
-20,000
-15,000
-10,000
-5,000
0
5,000
10,000
15,000
20,000
5 7 9 11 13 15
Maintenance Costs ($/ha)
Mea
n N
et P
rese
nt V
alue
($
/cel
l)
Harvest Costs vs. Returns
-20,000
-15,000
-10,000
-5,000
0
5,000
10,000
15,000
20,000
7 9 11 13 15 17 19
Harvest Costs ($/t)
Mea
n N
et P
rese
nt V
alue
($
/cel
l)
Fertiliser Costs vs. Returns
-20,000
-15,000
-10,000
-5,000
0
5,000
10,000
15,000
20,000
30 35 40 45 50
Fertiliser Costs ($/ha)
Mea
n N
et P
rese
nt V
alue
($
/cel
l)
Opportunity Costs vs. Re turns
-20,000
-15,000
-10,000
-5,000
0
5,000
10,000
15,000
20,000
-0.3 -0.2 -0.1 0 0.1 0.2 0.3
Opportunity Costs Variation (x 100 = %)
Mea
n N
et P
rese
nt V
alue
($
/cel
l)
Transport Costs vs. Returns
-20,000
-15,000
-10,000
-5,000
0
5,000
10,000
15,000
20,000
0.04 0.045 0.05 0.055 0.06 0.065 0.07
Transport Costs ($/t/km )
Mea
n N
et P
rese
nt V
alue
($
/cel
l)
Figure 48 – Relationship between the mean Net Present Value of biomass production for all
dryland non-vegetated grid cells and cost parameters calculated over 1,000 iterations, at a discount rate of 7%, and over a time horizon of 20 years.
Variation in productivity of biomass within +/- 20% of the empirical levels found by Hobbs (pers. comm. 2004) did not affect the mean NPV of grid cells in the Corridor. However, the factory gate price of biomass has a strong influence on the mean NPV returns from biomass production (Figure 49). Thus, the price of biomass is the single most important factor affecting the profitability of biomass production in the Corridor.

CSIRO Land and Water Page 117
Biomass Productiv ity vs. Returns
-20,000
-15,000
-10,000
-5,000
0
5,000
10,000
15,000
20,000
-0.2 -0.1 0 0.1 0.2
Productivity Variation (x 100 = %)
Mea
n N
et P
rese
nt V
alue
($
/cel
l)
Biomass Price vs. Returns
-20,000
-15,000
-10,000
-5,000
0
5,000
10,000
15,000
20,000
15 20 25 30 35 40 45
Factory Gate Price ($/green tonne)
Mea
n N
et P
rese
nt V
alue
($
/cel
l)
Figure 49 – Relationship between the mean Net Present Value of biomass production for all
dryland non-vegetated grid cells and revenue parameters of productivity and price calculated over 1,000 iterations, at a discount rate of 7%, and over a time horizon of 20 years.
Taken conservatively at a 9% discount rate, the biomass supply curves (Figure 50) show that there is robust supply of >100,000 tonnes of biomass per year when the factory gate price of biomass exceeds $35 per green tonne. Supply is guaranteed at lower prices per tonnes for lower discount rates (Figure 50). This leaves a satisfactory level of flexibility in factory gate price between this price and the $47 per tonne maximum price found by Ward and Trengove (2004). Hence, a good starting price for biomass should be somewhere in the middle of this range to cater for uncertainty and other effects such as imperfect information and risk aversion of landholders.
Biomass Supply Curve - 0% Discount
15
20
25
30
35
40
45
0 500,000 1,000,000 1,500,000 2,000,000 2,500,000
Productivity (Green Tonnes)
Fact
ory
Gat
e Pr
ice
($/g
reen
to
nne)
Biomass Supply Curve - 9% Discount
15
20
25
30
35
40
45
0 500,000 1,000,000 1,500,000 2,000,000 2,500,000
Productivity (Green Tonnes)
Fact
ory
Gat
e Pr
ice
($/g
reen
to
nne)
Figure 50 – Supply curves for biomass production at discount rates of 0% and 9%.
The effect of varying people’s time preference is to moderate the extremes of economic returns. Assessment of the mean, and upper and lower 95% confidence interval grids calculated from the 1,000 models runs reveals that under a lower discount rate the high and low returns are more extreme. The other effect is that returns are generally lower at higher discount rates (Figure 47, Figure 51, Table 21).
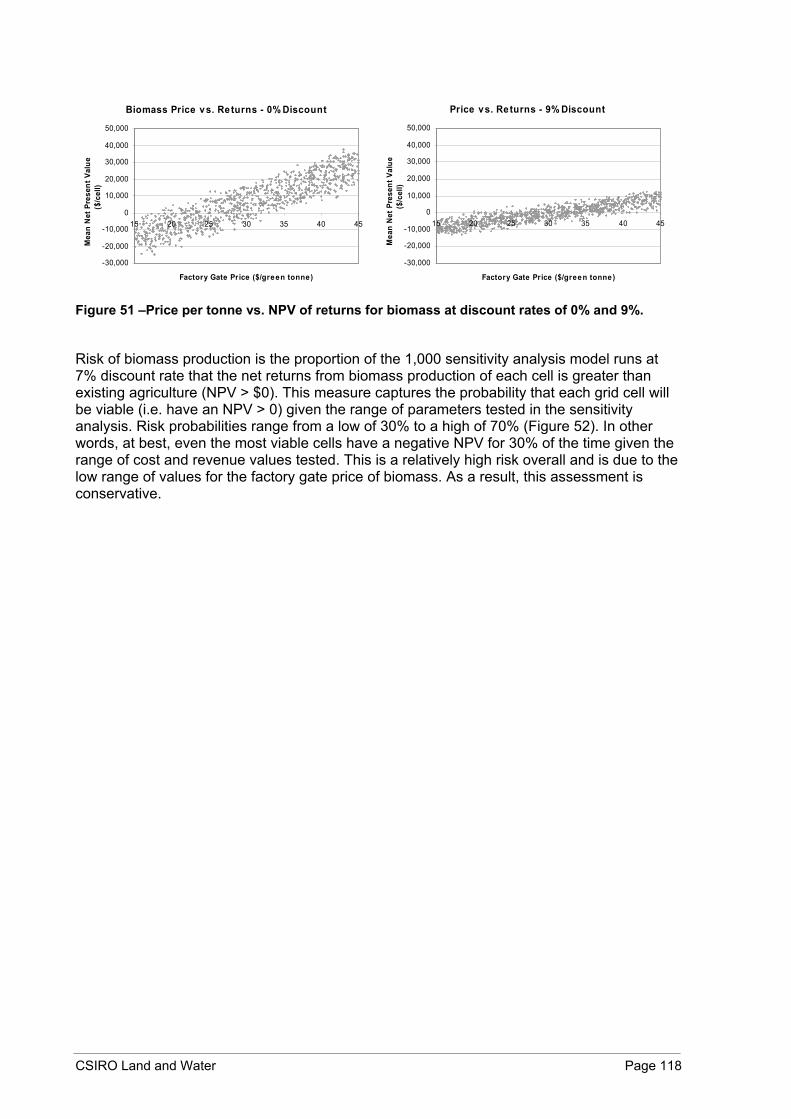
CSIRO Land and Water Page 118
Biomass Price vs. Returns - 0% Discount
-30,000
-20,000
-10,000
0
10,000
20,000
30,000
40,000
50,000
15 20 25 30 35 40 45
Factory Gate Price ($/green tonne)
Mea
n N
et P
rese
nt V
alue
($
/cel
l)
Price vs. Returns - 9% Discount
-30,000
-20,000
-10,000
0
10,000
20,000
30,000
40,000
50,000
15 20 25 30 35 40 45
Factory Gate Price ($/green tonne)
Mea
n N
et P
rese
nt V
alue
($
/cel
l)
Figure 51 –Price per tonne vs. NPV of returns for biomass at discount rates of 0% and 9%.
Risk of biomass production is the proportion of the 1,000 sensitivity analysis model runs at 7% discount rate that the net returns from biomass production of each cell is greater than existing agriculture (NPV > $0). This measure captures the probability that each grid cell will be viable (i.e. have an NPV > 0) given the range of parameters tested in the sensitivity analysis. Risk probabilities range from a low of 30% to a high of 70% (Figure 52). In other words, at best, even the most viable cells have a negative NPV for 30% of the time given the range of cost and revenue values tested. This is a relatively high risk overall and is due to the low range of values for the factory gate price of biomass. As a result, this assessment is conservative.

CSIRO Land and Water Page 119
Berri
Morgan
Mannum
Loxton
RenmarkWaikerie
Swan Reach
Tailem Bend
Blanchetown
Murray Bridge
Kingston-On-Murray
350,000
350,000
400,000
400,000
450,000
450,000
500,000
500,000
6,10
0,00
0
6,10
0,00
0
6,15
0,00
0
6,15
0,00
0
6,20
0,00
0
6,20
0,00
0
6,25
0,00
0
6,25
0,00
0
0 10 20
Kilometres
Native Vegetation1956 Floodplain
Irrigated AreasTowns
Risk of Biomass ProductionRiver Murray
30% - 40%40% - 50%50% - 60%60% - 70%70% - 80%
Corridor Boundary
Figure 52 – Risk of non-viability of biomass production based on the range of parameter values
tested and calculated at a discount rate of 7%. Green areas denote lower risk.
There is relatively low risk and good returns associated with biomass production around the stretch of high salinity benefit areas near the River Murray between Morgan and Renmark. Another interesting feature is the low risk – high return area in the eastern Mt. Lofty Ranges immediately west of Mannum. This high production area has relatively low opportunity costs as grazing is the primary agricultural activity. However, there may be other significant barriers to biomass production in this area including surface water and groundwater conservation issues and the loss of amenity value. This suggests that biomass production may have greater potential in the higher rainfall areas of South Australia. However, other higher value agroforestry products such as pulpwood production may be more economic than biomass industries in the higher rainfall areas. Bennell et al. 2004). More research is required to quantify the economic viability of biomass industries in these areas.
For the purposes of this study, three layers describing biomass productivity will be used as attribute layers in MCDA. Firstly, the net present value of biomass production from the Most Likely Scenario will be used to quantify the profitability (Figure 42). This layer will be used in the objective function with sites selected for biomass production that maximise profits. Secondly, the layer describing the total production in tonnes of green biomass from the

CSIRO Land and Water Page 120
second and subsequent harvests (Figure 36) will be used as the constraint that any biomass industry will need a supply of at least 100,000 tonnes per year. Last, the risk layer will be used to calculate the expected value so that sites can be selected for biomass production that offer the highest returns at the lowest risk.
Very recently, Hobbs and Bennell (2005) have released revised productivity estimates for mallee species in the Corridor based on their latest empirical results. New estimates of the productivity of E. oleosa are 1.5 – 2 times higher than those used in this study. Hence, the results of the economic assessment of biomass production in the Corridor is somewhat conservative. Based on these latest figures there is little doubt that biomass production in the Corridor is a viable exercise.
5.1.5 Wind Erosion
Wind erosion layers include both long-term eroding lands and wind erosion potential of soil landscape units as mapped by DWLBC (Figure 53). Long-term eroding areas will be included in the MCDA as a constraint that ensures that all vegetated long-term eroding areas must be managed and all cleared long term eroding areas must be revegetated either by local native species for biodiversity or by biomass. Wind erosion potential data will be included as a cost parameter in the objective function of the spatial optimisation. High wind erosion potential areas will form priorities for revegetation and vegetation management. Note that the long-term eroding areas and areas with high wind erosion potential may cost more to establish local native species and biomass crops as trees alone, without first establishing appropriate cover crops, may not adequately manage soils with high wind erosion potential. If not managed appropriately they may exacerbate the erosion problem because vegetation plantings with large holes (particularly on sand dunes) can tunnel wind. Local experience and expertise must be used to guide the on-ground implementation of appropriate NRM actions for these sensitive areas.
The total area of long-term eroding land in the Corridor is 312 ha and this area occurs in more than 100 locations in the Corridor. The long-term eroding areas information has been created at a fine scale and is almost incommensurate with the scale of other data layers used in this study. To counter this problem, long-term eroding area polygons are rasterised by classifying each cell that overlaps a polygon rather than the usual rasterisation process that results in many small polygons disappearing. This results in a conservative approach to the management of long term eroding land because the total area targeted for NRM actions to address erosion is substantially greater than the mapped long-term eroding areas and prioritises many neighbouring areas for NRM actions.
Wind erosion potential in the Corridor is mapped by DWLBC into 5 classes from high to low (Table 22) based on the clay content of the soil. For the purposes of this study, each class is given a cost score form 1 to 5 with 1 being high wind erosion potential. Thus, in the MCDA, high erosion potential cells will be prioritised for INRM actions. There is more than 7,200 ha mapped as high wind erosion potential in the Corridor which is considered to be unsuitable for cropping and a further 32,000 ha classed as moderately high which is only semi-arable (Table 22). Thus, wind erosion is a significant NRM issue in the Corridor.
Erosion potential is mapped for all cleared areas in the Corridor but not for all of the vegetated areas. There is a large unmapped area north of the river that represents the limit of soil landscape mapping in South Australia. Values are required for input into the MCDA and so all unclassified areas are given the value of the nearest valid cell. This process is a significant source of error in prioritising vegetation management and better solutions for dealing with unmapped areas should be developed in the future. The impact of this modelling artefact though is likely to be minimal.
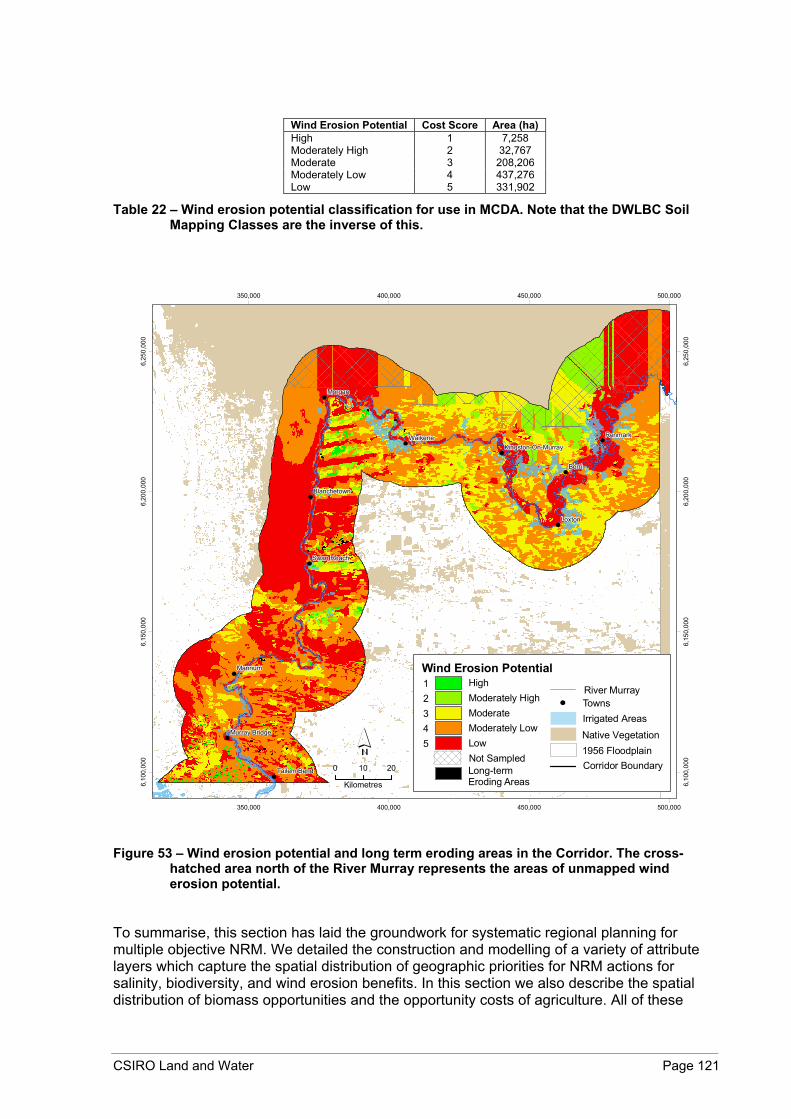
CSIRO Land and Water Page 121
Wind Erosion Potential Cost Score Area (ha) High 1 7,258 Moderately High 2 32,767 Moderate 3 208,206 Moderately Low 4 437,276 Low 5 331,902
Table 22 – Wind erosion potential classification for use in MCDA. Note that the DWLBC Soil Mapping Classes are the inverse of this.
Berri
Morgan
Mannum
Loxton
RenmarkWaikerie
Swan Reach
Tailem Bend
Blanchetown
Murray Bridge
Kingston-On-Murray
350,000
350,000
400,000
400,000
450,000
450,000
500,000
500,000
6,10
0,00
0
6,10
0,00
0
6,15
0,00
0
6,15
0,00
0
6,20
0,00
0
6,20
0,00
0
6,25
0,00
0
6,25
0,00
0
0 10 20
Kilometres
Native Vegetation1956 Floodplain
Irrigated AreasTowns
Wind Erosion Potential
River Murray12345
HighModerately HighModerateModerately LowLow
Long-term Eroding Areas
Not SampledCorridor Boundary
Figure 53 – Wind erosion potential and long term eroding areas in the Corridor. The cross-
hatched area north of the River Murray represents the areas of unmapped wind erosion potential.
To summarise, this section has laid the groundwork for systematic regional planning for multiple objective NRM. We detailed the construction and modelling of a variety of attribute layers which capture the spatial distribution of geographic priorities for NRM actions for salinity, biodiversity, and wind erosion benefits. In this section we also describe the spatial distribution of biomass opportunities and the opportunity costs of agriculture. All of these
CSIRO Land and Water Page 122
attribute layers provide insights into NRM in the Corridor and are included in the MCDA in the process of systematic regional planning for multiple objective NRM. The rest of the MCDA
5.2. Decision Alternatives The decision alternatives in the MCDA in this study are represented as grid cells. Each grid cell can either be selected for a certain NRM action (e.g. revegetation for biodiversity, vegetation management, or revegetation for biomass) or not selected for any action. The Corridor study area is tessellated into 188,655 grid cells, each covering an area of 6.4516 ha. For each NRM action, particular grid cells are masked out of the analysis according to their land tenure and protection status. Only privately-owned remnant vegetation cells can be targeted for vegetation management and only dryland cells (non-flood plain, non-irrigated, non-vegetated) can be targeted for revegetation for biomass and biodiversity. We constructed a series of land cover, land tenure, and conservation status layers to mask the appropriate grid cells out of the analysis.
The land cover layers include irrigated areas derived from the Crops2003 database created by DEH. Crops2003 identifies all land areas that were irrigated in 2003. Note that irrigated areas change regularly (Bryan and Marvanek 2004) and this information is a snapshot of the extent of irrigation in 2003. The flood plain is identified using the extent of the 1956 flood as mapped from aerial photography by DEH. Lastly, the vegetated areas were derived from spatial databases assembled from the DEH vegetation surveys of the Western Murray Flats, Southern Olary Plains, Mid North, Southern Mt. Lofty Ranges and Murray Mallee as described in Crossman et al. (2004). The databases were merged and rasterised to match the other data layers. The distribution of these land uses in the Corridor is presented in Figure 1.
Land tenure is derived from the Digital Cadastral Database (DCDB). Private land is derived by selecting land parcels identified as freehold and crown lease tenures from the DCDB. All other land is considered to be government owned public tenure (Figure 55).
We combined National Parks and Wildlife (NPWS) Reserves, Ramsar wetlands, Heritage Agreement Areas, and the Bookmark Biosphere Reserve to identify existing protected areas. National Parks and Wildlife Reserves include all gazetted parks and reserves declared under legislation (Bryan 2003). Heritage Agreement Areas are voluntary conservation agreements between the government and the landholder that protect remnant vegetation on private land. Under a Heritage Agreement the landholder undertakes to manage the land in a way conducive to nature conservation and the agreement is usually attached to the land title. Ramsar wetlands are also classified as protected although the actual level of protection of these globally important wetlands is low. The Bookmark Biosphere Reserve was declared under UNESCOs Man and the Biosphere Program and includes a diverse range of environments from semi-arid Mallee and rangeland to wetlands of international importance. Land uses in Bookmark are equally diverse, ranging from NPWS reserves to working sheep stations and wineries. The Bookmark Biosphere Reserve is assumed to be protected in this study. Datasets for the four types of protected areas were acquired from DEH and assembled into a protected areas layer by Crossman et al. (2004).

CSIRO Land and Water Page 123
Berri
Morgan
Mannum
Loxton
RenmarkWaikerie
Swan Reach
Tailem Bend
Blanchetown
Murray Bridge
Kingston-On-Murray
350,000
350,000
400,000
400,000
450,000
450,000
500,000
500,000
6,10
0,00
0
6,10
0,00
0
6,15
0,00
0
6,15
0,00
0
6,20
0,00
0
6,20
0,00
0
6,25
0,00
0
6,25
0,00
0
0 10 20
Kilometres
Native Vegetation
Land TenurePublic LandPrivate LandRiver Murray
Towns
Corridor Boundary
Figure 54 – Private and public land tenure.
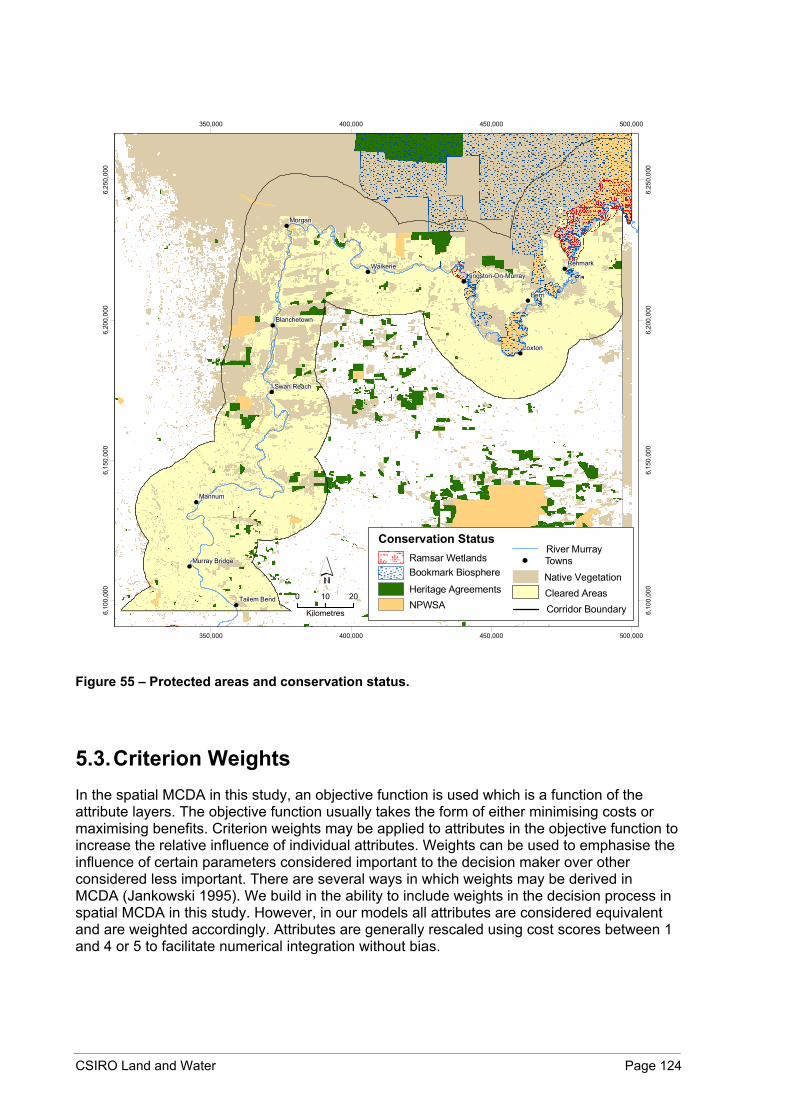
CSIRO Land and Water Page 124
Berri
Morgan
Mannum
Loxton
RenmarkWaikerie
Swan Reach
Tailem Bend
Blanchetown
Murray Bridge
Kingston-On-Murray
350,000
350,000
400,000
400,000
450,000
450,000
500,000
500,000
6,10
0,00
0
6,10
0,00
0
6,15
0,00
0
6,15
0,00
0
6,20
0,00
0
6,20
0,00
0
6,25
0,00
0
6,25
0,00
0
0 10 20
Kilometres
Native VegetationTowns
Conservation StatusRiver Murray
Bookmark BiosphereRamsar Wetlands
Heritage AgreementsNPWSA
Cleared AreasCorridor Boundary
Figure 55 – Protected areas and conservation status.
5.3. Criterion Weights In the spatial MCDA in this study, an objective function is used which is a function of the attribute layers. The objective function usually takes the form of either minimising costs or maximising benefits. Criterion weights may be applied to attributes in the objective function to increase the relative influence of individual attributes. Weights can be used to emphasise the influence of certain parameters considered important to the decision maker over other considered less important. There are several ways in which weights may be derived in MCDA (Jankowski 1995). We build in the ability to include weights in the decision process in spatial MCDA in this study. However, in our models all attributes are considered equivalent and are weighted accordingly. Attributes are generally rescaled using cost scores between 1 and 4 or 5 to facilitate numerical integration without bias.

CSIRO Land and Water Page 125
5.4. Decision Rules There are a variety of ways of integrating the disparate data layers for prioritising grid cells for NRM actions that most cost-effectively meet resource condition targets. The general class of problem is one of spatial optimisation. Spatial optimisation for landscape planning has taken the form of two classic operations research problems – the Maximal Covering Location Problem (MCLP, Church and ReVelle 1974, Church et al. 1996) and the Location Set Covering Problem (LSCP; Bryan 2003). In the MCLP, the solution is constrained by the total amount of money or area available for conservation and the objective function tries to maximise the conservation value of the reserves. In the LSCP, the solution is constrained by having to meet certain conservation targets and the objective function aims to minimise the cost of the reserve system. We use the LSCP formulation as the decision rule for NRM in this study. Optimisers used to solve this problem include techniques ranging from random search algorithms to more sophisticated techniques that conduct a more structured search of the decision space such as heuristic algorithms, genetic algorithms, simulated annealing and mathematical programming.
The application of spatial optimisation in natural resource management has focused mainly on the selection of reserves for the conservation of biodiversity (Underhill 1994, Csuti et al. 1997, Possingham et al. 2000, McDonnell et al. 2002, Cocks and Baird 1989, Saetersdal et al. 1993, Church et al. 1996, Williams and ReVelle 1996, Haight et al. 2000, ReVelle et al. 2002, Rodrigues and Gaston 2002, Perry et al. in review) although it has recently been used to manage ecosystem processes (Seppelt and Voinov 2004). Spatial optimisation is being increasingly applied to landscape restoration (Bryan 2003; Bryan et al. 2004b; Crossman and Bryan in review). In this study, we expand the use of these techniques to systematic regional planning for multiple objective natural resource management.
In spatial optimisation, mathematical programming techniques usually take the form of integer programming where each spatial unit (grid cell, site or polygon) can either be included in or excluded from some action (such as vegetation management or reserve selection). Thus, each spatial unit can be either zero or one. IP has the advantage of being able to find guaranteed optimal solutions by the application of branch-and-bound algorithms developed in operations research (see Kingsland, 2002). Integer programming has not been widely used in spatial optimisation because the problems are np hard. In other words the size of the problem increases exponentially with the number of sites available. Spatial databases are often characterized by many thousands or even millions of sites, potentially placing traditional IP beyond the realm of solvability. However, new proprietary algorithms and significantly faster computer processors have greatly increased the tractability of IP problems (Rodrigues and Gaston 2002, Bryan 2003) and made them a viable option for spatial optimisation.
As the decision rules of the MCDA we present three spatial optimisation models for prioritising the three NRM actions in the Corridor - Vegetation Management, Revegetation for Biodiversity, and Revegetation for Biomass. Together, the models identify the most cost-effective sites for each NRM action that meets explicit resource condition targets.
The integer programming models used in this study were written in the General Algebraic Modelling System (GAMS) using the CPLEX solver. CPLEX has been found to be efficient in its solution of large-scale linear IP problems in conservation planning (Church et al. 1996, Ando et al. 1998, Rodrigues and Gaston 2002). Attribute data is assembled in a GIS (see earlier sections) and exported to tabular format for input into GAMS. Outputs are exported from GAMS in tabular format suitable for input back into the GIS for visualization and mapping.
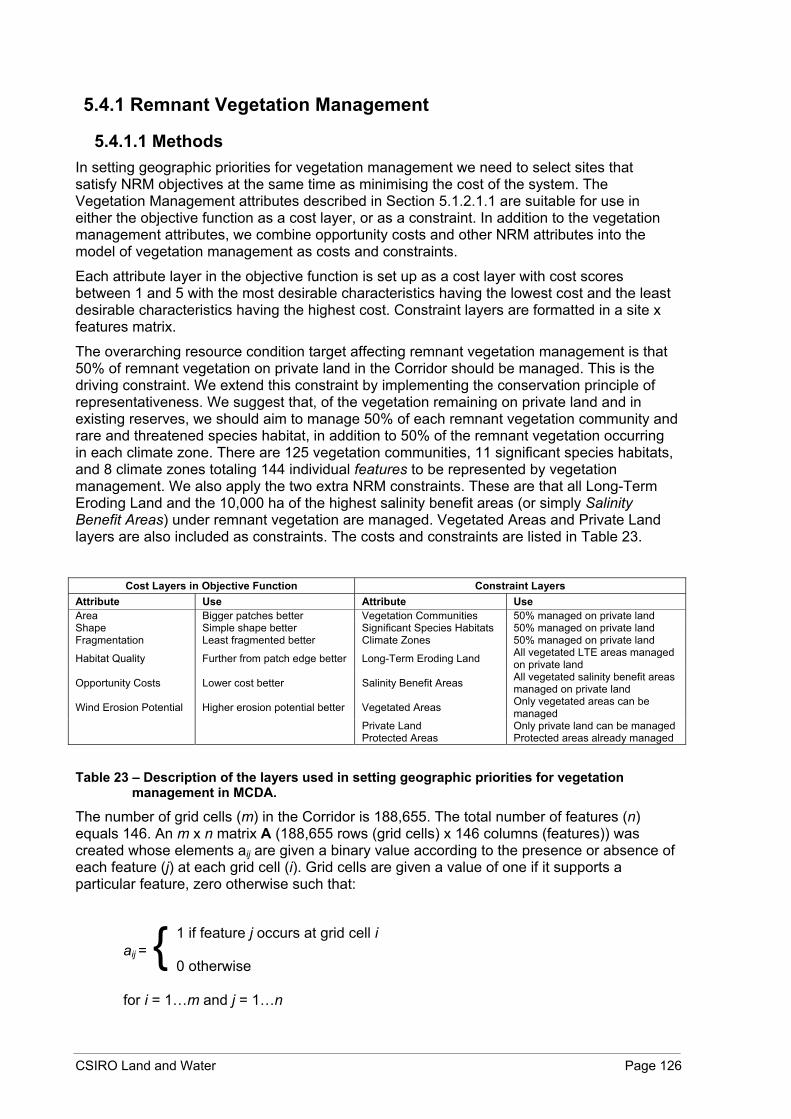
CSIRO Land and Water Page 126
5.4.1 Remnant Vegetation Management
5.4.1.1 Methods In setting geographic priorities for vegetation management we need to select sites that satisfy NRM objectives at the same time as minimising the cost of the system. The Vegetation Management attributes described in Section 5.1.2.1.1 are suitable for use in either the objective function as a cost layer, or as a constraint. In addition to the vegetation management attributes, we combine opportunity costs and other NRM attributes into the model of vegetation management as costs and constraints.
Each attribute layer in the objective function is set up as a cost layer with cost scores between 1 and 5 with the most desirable characteristics having the lowest cost and the least desirable characteristics having the highest cost. Constraint layers are formatted in a site x features matrix.
The overarching resource condition target affecting remnant vegetation management is that 50% of remnant vegetation on private land in the Corridor should be managed. This is the driving constraint. We extend this constraint by implementing the conservation principle of representativeness. We suggest that, of the vegetation remaining on private land and in existing reserves, we should aim to manage 50% of each remnant vegetation community and rare and threatened species habitat, in addition to 50% of the remnant vegetation occurring in each climate zone. There are 125 vegetation communities, 11 significant species habitats, and 8 climate zones totaling 144 individual features to be represented by vegetation management. We also apply the two extra NRM constraints. These are that all Long-Term Eroding Land and the 10,000 ha of the highest salinity benefit areas (or simply Salinity Benefit Areas) under remnant vegetation are managed. Vegetated Areas and Private Land layers are also included as constraints. The costs and constraints are listed in Table 23.
Cost Layers in Objective Function Constraint Layers
Attribute Use Attribute Use Area Bigger patches better Vegetation Communities 50% managed on private land Shape Simple shape better Significant Species Habitats 50% managed on private land Fragmentation Least fragmented better Climate Zones 50% managed on private land
Habitat Quality Further from patch edge better Long-Term Eroding Land All vegetated LTE areas managed on private land
Opportunity Costs Lower cost better Salinity Benefit Areas All vegetated salinity benefit areas managed on private land
Wind Erosion Potential Higher erosion potential better Vegetated Areas Only vegetated areas can be managed
Private Land Only private land can be managed Protected Areas Protected areas already managed Table 23 – Description of the layers used in setting geographic priorities for vegetation
management in MCDA.
The number of grid cells (m) in the Corridor is 188,655. The total number of features (n) equals 146. An m x n matrix A (188,655 rows (grid cells) x 146 columns (features)) was created whose elements aij are given a binary value according to the presence or absence of each feature (j) at each grid cell (i). Grid cells are given a value of one if it supports a particular feature, zero otherwise such that:
aij =
for i = 1…m and j = 1…n
1 if feature j occurs at grid cell i
0 otherwise {

CSIRO Land and Water Page 127
A second matrix B (188,655 rows x 3 columns) is also created which holds the mask constraints of land cover, land tenure and conservation status. The land cover constraint is whether the cell is Vegetated or not (V), the land tenure constraint is whether the grid cell is Private Land (PL) or not and the conservation status is whether the grid cell is Protected or not (P). This information is used to mask out particular grid cells for vegetation management. The elements of B, bik are given a binary value according to the presence or absence of each particular mask constraint (k) at each grid cell (i). A grid cell is given a value of one if it supports a particular mask constraint, zero otherwise such that:
bik =
for i = 1…m and k = V, PL, and P
Next, a variable is defined that reflects whether or not a site is selected for vegetation management, as the vector X with dimension m and elements xi, given by:
xi =
for i = 1…m
The objective function for the vegetation management model is an aggregate index comprised of the attribute layers listed in Table 23. The objective function minimises the total cost of the sites selected for vegetation management. Thus, considering the scaling of each attribute (as described in Section 5.1.2.1.1 the model selects the combination of sites for vegetation management that belong to patches of largest Area (A) and simplest Shape (S) and that are least Fragmented (F), it also selects sites that are of higher Habitat Quality in the interior of patches (HQ), have lowest Opportunity Costs (OC) and highest Wind Erosion Potential (E). Each layer has equal influence of the selection of grid cells. Criterion weights (w) may be adjusted so specific layers are more influential.
The objective function is then to:
Minimise
subject to the following constraints:
i) vegetation management can not occur in cleared areas:
if biV = 0, xi = 0, for i = 1,2,...,m,
ii) existing protected areas of remnant vegetation are managed:
if biV .biP = 1, xi = 1, for i = 1,2,...,m,
iii) public land not in reserves cannot be managed:
if biP + biPL = 0, xi = 0, for i = 1,2,...,m,
1 if site i is selected for vegetation management
0 otherwise {
1 if mask constraint k occurs at grid cell i
0 otherwise {
)......(
1EiOCiHQiFiSiAi
m
ii wEwOCwHQwFwSwAx +++++∑
=

CSIRO Land and Water Page 128
iv) all Long-Term Eroding Land areas covered by remnant vegetation are managed:
if biV .aij = 1, xi = 1 for j = 145 (LTE land), i = 1,2,...,m,
v) all salinity benefit areas covered by remnant vegetation are managed:
if biV .aij = 1, xi = 1 for j = 146 (Salinity Benefit Areas), i = 1,2,...,m,
vi) at least 50% of native vegetation on private land is managed:
50100.
..
1
1 ≥×
∑
∑
=
=m
iiPLiV
m
iiiPLiV
bb
xbb
vii) of the remnant vegetation either protected or on private land… at least 50% of each Vegetation Community, 50% of each Significant Species Habitat, and 50% of each Climate Zone is managed:
50100.
..
1
1 ≥×
∑
∑
=
=m
iiVij
m
iiiVij
ba
xba
for j = 1,2,…,n,
where aij, xi ∈ {0,1}, biP = 1 or biPL = 1 .
Four different analyses are run to assess the influence of using different attributes in the objective function and constraints on areal and cost indicators. Model 1 simply finds the set of cells for vegetation management that satisfies the broad regional target of managing 50% of native vegetation on private land at the minimum Opportunity Costs. It is the cheapest way of reaching resource condition targets. Model 2 extends Model 1 to include the representativeness targets for biodiversity (50% of each Vegetation Community, Climate Zone and Significant Species Habitat) and minimises Opportunity Costs. Model 3 extends Model 2 to include the natural resource management targets of Salinity Benefit Areas and Long-Term Eroding Land. Model 3 also minimises opportunity costs. Model 4 extends Model 3 and extends the attributes in the objective function to include not only Opportunity Costs but also the landscape ecology costs of patch Area and Shape, Fragmentation and Habitat Quality, and Wind Erosion Potential. By assessing these four models we can quantify the trade-offs involved with including systematic regional planning principles in the setting of geographic priorities for achieving INRM targets. The four models are summarised:
Model 1 – Regional 50% vegetation on private land managed, minimise Opportunity Costs
Model 2 – Regional 50% target, plus 50% representativeness targets, minimise Opportunity Costs
Model 3 – Regional 50% target, 50% representativeness targets, NRM targets, minimise Opportunity Costs
Model 4 - Regional 50% target, 50% representativeness targets, NRM targets, minimise function of Opportunity Costs, Area, Shape, Fragmentation, Habitat Quality, and Wind Erosion Potential

CSIRO Land and Water Page 129
5.4.1.2 Results The outcomes of the MCDA model are mapped geographic priorities for vegetation management in the Corridor. The Corridor supports approximately 510,734 ha of remnant vegetation or nearly 42% of the total area. This is a high percentage compared to other agricultural regions in South Australia. A high proportion (over 80%) of the remnant vegetation is on privately owned land. Over 176,760 ha are protected or managed for conservation, representing 14.5% of the Corridor. Over 60% of this is on private land. Thus, over 25% of remnant vegetation on private land is already managed under either Heritage Agreements or as part of the Bookmark Biosphere Reserve. To meet the NRM resource condition targets this needs to increase to 50% (Table 24). In other words, reaching the regional resource condition target will require a doubling of the existing area of remnant vegetation on private land that is managed for conservation.
However, the current protection of remnant vegetation is not representative of the different biological and physical environments of the Corridor. Most of the protected areas occur in the driest climates and on the poorest soils, especially the Mallee and rangeland regions north of the stretch of river between Waikerie and the border. The Bookmark Biosphere Reserve, which includes several NPWS reserves, is the largest protected/managed area in the Corridor. Other significant protected areas are located west of Blanchetown (Figure 55). However, protected areas cover a much lower fraction of the total remnant vegetation in other parts of the Corridor particularly around Morgan and in the better agricultural areas south and east of the River Murray (Figure 55).
Current Status Results
Total area of remnant vegetation 510,734 ha
Total area of privately owned remnant vegetation 413,489 ha
Total area of remnant vegetation currently protected/managed 176,760 ha
Total area of privately owned remnant vegetation currently protected/managed 106,993 ha
Total area of publicly owned remnant vegetation currently protected/managed 69,767 ha
Table 24 – Baseline information about the conservation status and land tenure for comparison
with MCDA model outputs for vegetation management.
All models meet the regional target of managing 50% of remnant vegetation on private land in the Corridor – a total of 99,751 ha of newly managed remnant vegetation. This sums to 206,745 ha including existing managed vegetation on private land in Heritage Agreement Areas, and 276,512 ha when public reserves are also included (Table 25). The establishment costs of meeting the resource condition target for vegetation management based on a low and high estimate of costs per hectare ranges from $49 Million to $300 Million. Putting these figures in context, the establishment costs and opportunity costs of implementing resource condition targets in the Corridor are many times greater than any amount of funding likely to become available for on-ground works in the foreseeable future. Smart market-based policy is required to have any chance of reaching regional NRM targets for vegetation management.
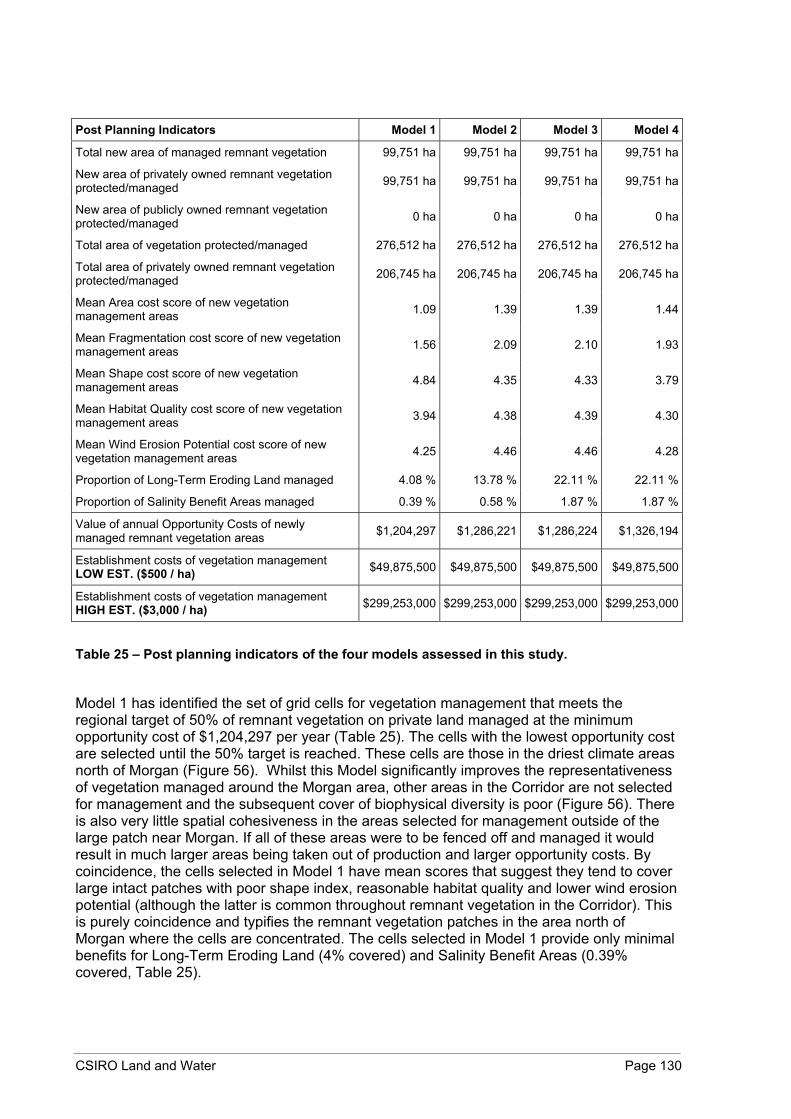
CSIRO Land and Water Page 130
Post Planning Indicators Model 1 Model 2 Model 3 Model 4
Total new area of managed remnant vegetation 99,751 ha 99,751 ha 99,751 ha 99,751 ha
New area of privately owned remnant vegetation protected/managed 99,751 ha 99,751 ha 99,751 ha 99,751 ha
New area of publicly owned remnant vegetation protected/managed 0 ha 0 ha 0 ha 0 ha
Total area of vegetation protected/managed 276,512 ha 276,512 ha 276,512 ha 276,512 ha
Total area of privately owned remnant vegetation protected/managed 206,745 ha 206,745 ha 206,745 ha 206,745 ha
Mean Area cost score of new vegetation management areas 1.09 1.39 1.39 1.44
Mean Fragmentation cost score of new vegetation management areas 1.56 2.09 2.10 1.93
Mean Shape cost score of new vegetation management areas 4.84 4.35 4.33 3.79
Mean Habitat Quality cost score of new vegetation management areas 3.94 4.38 4.39 4.30
Mean Wind Erosion Potential cost score of new vegetation management areas 4.25 4.46 4.46 4.28
Proportion of Long-Term Eroding Land managed 4.08 % 13.78 % 22.11 % 22.11 %
Proportion of Salinity Benefit Areas managed 0.39 % 0.58 % 1.87 % 1.87 %
Value of annual Opportunity Costs of newly managed remnant vegetation areas $1,204,297 $1,286,221 $1,286,224 $1,326,194
Establishment costs of vegetation management LOW EST. ($500 / ha) $49,875,500 $49,875,500 $49,875,500 $49,875,500
Establishment costs of vegetation management HIGH EST. ($3,000 / ha) $299,253,000 $299,253,000 $299,253,000 $299,253,000
Table 25 – Post planning indicators of the four models assessed in this study.
Model 1 has identified the set of grid cells for vegetation management that meets the regional target of 50% of remnant vegetation on private land managed at the minimum opportunity cost of $1,204,297 per year (Table 25). The cells with the lowest opportunity cost are selected until the 50% target is reached. These cells are those in the driest climate areas north of Morgan (Figure 56). Whilst this Model significantly improves the representativeness of vegetation managed around the Morgan area, other areas in the Corridor are not selected for management and the subsequent cover of biophysical diversity is poor (Figure 56). There is also very little spatial cohesiveness in the areas selected for management outside of the large patch near Morgan. If all of these areas were to be fenced off and managed it would result in much larger areas being taken out of production and larger opportunity costs. By coincidence, the cells selected in Model 1 have mean scores that suggest they tend to cover large intact patches with poor shape index, reasonable habitat quality and lower wind erosion potential (although the latter is common throughout remnant vegetation in the Corridor). This is purely coincidence and typifies the remnant vegetation patches in the area north of Morgan where the cells are concentrated. The cells selected in Model 1 provide only minimal benefits for Long-Term Eroding Land (4% covered) and Salinity Benefit Areas (0.39% covered, Table 25).

Vegetation Management Models
Priority Areas of Vegetation Management
River MurrayIrrigated Areas
0 5025Kilometres
Model 1 Model 2 Model 3
Existing Protected/Managed Vegetation
Native Vegetation
1956 Floodplain
Cleared Areas
Corridor Boundary Figure 56 – Geographic priorities for Vegetation Management in the Corridor identified by Models 1-3.
CSIRO Land and Water Page 132
Model 2 is a more ecologically sustainable solution because it incorporates the principle of representativeness. Managed areas of vegetation cover 50% of each Vegetation Community, Significant Species Habitat and Climate Zone, and are therefore more likely to cover a larger range of biodiversity than aiming for the least expensive way to meet vegetation management targets (Model 1). Cells selected for management include vegetation patches distributed over the entire Corridor (Figure 56). The opportunity costs are only $84,000 (7%) higher than the cheapest option in Model 1. The inclusion of representativeness targets provides much greater natural resource management benefits for only minimal extra cost.
Mean cost scores for the landscape ecological indicators of Area, Fragmentation and Habitat Quality are poorer than Model 1 but the Shape score is better. This is because the representativeness targets force selection of smaller patches of vegetation for management rather than concentration in a large patch. Wind erosion potential score is also poorer because the higher clay content soils in the south are selected for management. Significantly greater benefits are gained for Long-Term Eroding Land (13.8%) and Salinity Benefit Areas (0.6%) (Table 25).
The output of Model 3 is very similar to Model 2 when considering all indicators (Table 25). This is because the two models use the same objective function and constraints except that Model 3 includes managing all vegetated Long-Term Eroding Land and Salinity Benefit Areas. This results in a substantial increase in the proportion of the total Long-Term Eroding Land and Salinity Benefit Areas that is managed (22% and 1.87%, respectively, Table 25). The extra Opportunity Cost of managing vegetation on Long-Term Eroding Land and Salinity Benefit Areas is only $4 per year. The geographic priorities are very similar to Model 2 (Figure 56). Thus, NRM targets can be incorporated into systematic regional planning for vegetation management at little extra biophysical or economic cost.
Model 4 includes extra attributes in the objective function to enhance the spatial location of cells selected for remnant vegetation management. They are guided by landscape ecological principles and the prioritisation of vegetation management on areas of high Wind Erosion Potential. Model 4, as with Models 2 and 3, includes representative proportions of each Vegetation Community, Climate Zone and Significant Species Habitat (Table 26). The solution offers significant improvements because the objective function is a weighted aggregate index comprised of the Area, Shape, Fragmentation, Habitat Quality, Opportunity Costs, and Wind Erosion Potential. Fragmentation, Shape, Habitat Quality, and Wind Erosion Potential cost scores are lower than Model 3 but the trade off is the higher Area cost score. Whilst the solution does not represent the least expensive financial option, the extra Opportunity Cost of enhancing the spatial arrangement of grid cells for extra natural resource management benefits is only $40,000 per year (3%) more than not including them (Table 25). Again, the inclusion of smart targeting according to established systematic principles can result in significant NRM benefits at minimal extra cost.
However, the spatial arrangement of selected cells is variable (Figure 57). In many parts of the Corridor entire patches are selected for management. Often, grid cells are selected for management that also buffer and link adjacent protected/managed areas. These should be seen as priority areas because they are simplest to implement. Many shapes are complex and impractical for implementing vegetation management. We later recommend policy options that provide a practical way to target high priority land in an iterative way.

CSIRO Land and Water Page 133
Vegetation Community
% Rep. Before
% Rep. After
Vegetation Community (cont.)
% Rep. Before
% Rep. After
1 0.0 50.0 75 33.3 50.0 2 11.0 50.0 76 0.0 50.0 3 0.0 50.0 77 0.0 50.0 4 100.0 100.0 79 1.2 50.0 5 36.4 50.0 80 7.4 50.0 6 92.3 92.3 81 50.7 57.4 7 15.2 50.0 83 16.3 50.0 8 0.0 50.0 84 57.1 61.4 9 0.0 50.0 85 46.9 50.0 10 93.9 93.9 86 41.5 50.0 11 85.1 85.3 87 0.0 50.0 12 0.0 50.0 88 0.0 50.0 13 67.9 68.7 90 0.0 50.0 14 21.4 50.0 91 0.0 50.0 15 72.5 73.9 92 0.0 50.0 16 0.0 50.0 93 2.9 50.0 17 0.0 50.0 94 97.4 97.4 18 21.9 50.0 95 0.0 100.0 19 1.9 50.0 96 58.3 63.8 20 0.0 50.0 97 0.0 50.0 21 26.0 50.0 98 0.0 50.0 22 9.4 50.0 99 0.9 50.0 23 18.6 50.0 100 44.4 50.0 24 83.3 83.3 101 0.0 50.0 25 86.4 86.4 103 80.9 81.9 26 96.1 96.1 104 4.5 50.0 27 14.7 50.0 105 17.4 50.0 28 78.9 84.2 106 0.0 50.0 29 79.2 79.9 107 77.8 81.5 30 0.0 50.0 108 0.0 50.0 32 95.9 95.9 109 66.5 66.8 33 1.6 50.0 110 50.9 51.7 34 0.0 50.0 111 47.1 50.0 35 0.0 50.0 112 0.0 50.0 36 0.0 50.0 113 18.7 50.0 37 0.0 50.0 114 85.7 85.7 38 0.0 50.0 115 30.1 50.0 39 79.3 82.8 116 31.8 50.0 40 42.3 50.0 117 0.0 50.0 41 100.0 100.0 118 54.5 63.6 42 73.2 74.6 119 66.7 66.7 43 72.7 77.3 120 76.5 77.0 44 69.0 74.1 121 94.1 94.1 45 55.0 57.8 122 0.0 50.0 47 72.9 78.1 123 37.7 50.0 48 46.1 50.9 124 1.8 50.0 49 34.5 51.3 125 0.0 50.0 50 64.2 68.7 126 38.5 50.0 51 52.6 52.6 127 3.2 50.0 52 45.5 54.5 128 39.3 50.0 53 10.4 50.0 129 0.0 50.0 54 55.0 55.0 130 0.0 50.0 55 57.8 62.2 131 50.0 50.0
56 0.0 50.0 Climate Zones % Rep. Before
% Rep. After
57 21.1 50.0 1 17.7 50.0 58 0.0 50.0 2 62.5 70.8 59 20.7 50.0 4 44.1 59.9 60 60.2 63.2 6 12.6 52.4 61 31.3 50.0 7 0.0 50.0 62 17.2 50.0 10 18.9 57.1 63 82.4 82.4 11 0.0 50.0
64 37.5 50.0 Significant Species Habitat
% Rep. Before
% Rep. After
65 72.7 76.6 Black-eared miner 55.3 61.3 66 82.0 82.8 Chestnut quail 41.7 57.0 67 0.0 50.0 Common dunnart 34.8 54.0 68 86.6 86.6 Striated grass wren 55.0 61.9 69 37.5 50.0 Major Mitchell cockatoo 55.9 63.5 70 78.6 78.6 Mallee fowl 52.2 60.1 71 42.1 50.0 Red-lored whistler 68.1 72.3 72 48.4 50.8 Regent parrot 44.0 60.8
73 0.0 100.0 Southern hairy-nosed wombat 15.7 50.0
74 16.5 50.0 Striped honeyeater 47.4 60.4 Western pygmy possum 25.3 51.9
Table 26 – Representativeness of Vegetation Communities, Climate Zones and Significant Species Habitat of existing managed/protected remnant vegetation (Before) and after implementation of Model 4. Model 4 includes the representativeness targets as do Models 2 and 3.

CSIRO Land and Water Page 134
Berri
Morgan
Mannum
Loxton
RenmarkWaikerie
Swan Reach
Tailem Bend
Blanchetown
Murray Bridge
Kingston-On-Murray
350,000
350,000
400,000
400,000
450,000
450,000
500,000
500,000
6,10
0,00
0
6,10
0,00
0
6,15
0,00
0
6,15
0,00
0
6,20
0,00
0
6,20
0,00
0
6,25
0,00
0
6,25
0,00
0
Extent 1
Extent 2
Extent 3
Extent 4
Native Vegetation1956 FloodplainCleared Areas
Irrigated AreasTownsRiver Murray
Priority Areas for Vegetation Management Model 4
Priority Areas for Revegetation Existing Protected/Managed Vegetation
0 21km
0 2.51.25km
0 2.51.25km
0 2.51.25km
Corridor Boundary
0 10 20
Kilometres
Figure 57 – Geographic priorities for vegetation management identified by Model 4. The insets
zoom in on four areas of interest that display the relationship between areas selected for vegetation management, existing remnant vegetation and existing protected/managed areas.

CSIRO Land and Water Page 135
5.4.2 Revegetation for Biodiversity
5.4.2.1 Methods When setting geographic priorities for revegetation for biodiversity we need to select sites that satisfy NRM objectives whilst minimising the cost of the system. The revegetation for biodiversity attributes described in Section 5.1.2.1.2 are suitable for use in either the objective function as a cost layer or as a constraint. In addition to these attributes (Landscape Context, Fragmentation, Pre-European Vegetation Communities, Climate Zones and Soil Land Systems), we integrate Opportunity Costs and the NRM attributes of Wind Erosion Potential, Long Term Eroding Areas and Salinity Benefit Areas into the model of revegetation for biodiversity as costs and constraints.
The primary regional resource condition target states that revegetation for biodiversity should increase the area of existing vegetation by 1%. Increasing the area of vegetation by 1% would involve the revegetation/restoration of just over 5,100 ha. There is no further information guiding where revegetation for biodiversity should occur. This target is not based on any ecological or conservation planning principles. Revegetation of this area will not ensure representativeness targets are met. This is a very expensive exercise and needs to occur in high priority regional sites in order to have maximum benefit for biodiversity. The priority areas need to be identified systematically using established conservation principles.
The setting of a 1% increase target in the SA MDB is a departure from other target setting for conservation and revegetation in Australia. National Forest Policy aims to conserve 15% of each bioregion (JANIS 1997). Extending the 1% target, we take a longer term view in this study to ensure compatibility with national conservation goals. Priority sites for revegetation are identified that, together with existing remnant vegetation, ensure 15% of each Pre-European Vegetation Community, Climate Zone and Soil Land System are represented. These targets are set as constraints in the MCDA models. The 1% target can remain in place as a short term goal. However, sites selected in the short term should contribute to the longer term 15% representativeness target.
Thus, the constraints implement the conservation principle of representativeness in setting geographic priorities for revegetation. We suggest that the long-term goal of revegetation in the Corridor should be to target sites that together with existing remnant vegetation represents 15% of each of the 23 Pre-European Vegetation Communities, 8 Climate Zones, and 61 Soil Land Systems. We also apply the two extra NRM constraints that specify that all Long-Term Eroding Land and all Salinity Benefit Areas on cleared, non-irrigated land should be revegetated. This totals 94 individual features to be represented by existing vegetation and revegetation. Vegetated Areas and Private Land layers are also included as constraints. The costs and constraints are listed in Table 27.
Cost Layers in Objective Function Constraint Layers
Attribute Use Attribute Use
Landscape Context Cells closer to remnant vegetation better
Pre-European Vegetation Communities 15% vegetated
Fragmentation Fragmented best, then relictual, variegated, and intact Climate Zones 15% vegetated
Opportunity Costs Lower cost better Soil Land Systems 15% vegetated
Wind Erosion Potential Higher erosion potential better Long-Term Eroding Land All Long-Term Eroding Land vegetated
Salinity Benefit Areas All Salinity Benefit Areas vegetated
Table 27 – Description of the layers used in setting geographic priorities for revegetation for
biodiversity in MCDA.
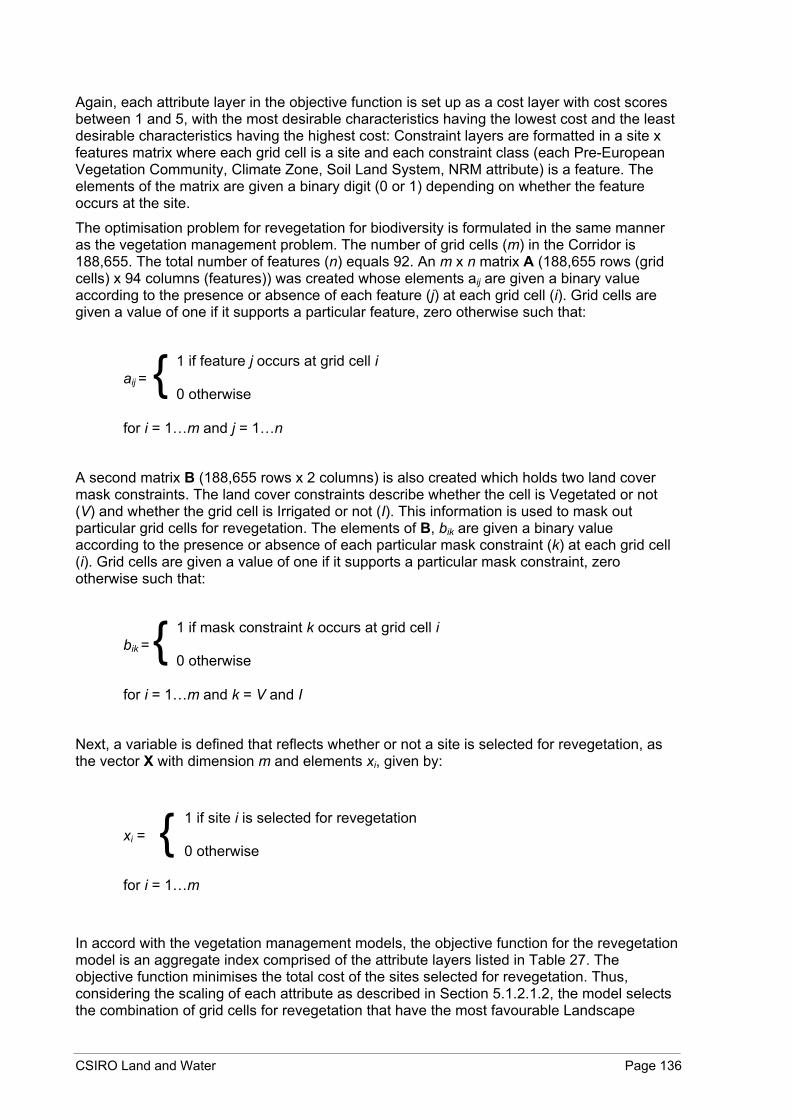
CSIRO Land and Water Page 136
Again, each attribute layer in the objective function is set up as a cost layer with cost scores between 1 and 5, with the most desirable characteristics having the lowest cost and the least desirable characteristics having the highest cost: Constraint layers are formatted in a site x features matrix where each grid cell is a site and each constraint class (each Pre-European Vegetation Community, Climate Zone, Soil Land System, NRM attribute) is a feature. The elements of the matrix are given a binary digit (0 or 1) depending on whether the feature occurs at the site.
The optimisation problem for revegetation for biodiversity is formulated in the same manner as the vegetation management problem. The number of grid cells (m) in the Corridor is 188,655. The total number of features (n) equals 92. An m x n matrix A (188,655 rows (grid cells) x 94 columns (features)) was created whose elements aij are given a binary value according to the presence or absence of each feature (j) at each grid cell (i). Grid cells are given a value of one if it supports a particular feature, zero otherwise such that:
aij =
for i = 1…m and j = 1…n
A second matrix B (188,655 rows x 2 columns) is also created which holds two land cover mask constraints. The land cover constraints describe whether the cell is Vegetated or not (V) and whether the grid cell is Irrigated or not (I). This information is used to mask out particular grid cells for revegetation. The elements of B, bik are given a binary value according to the presence or absence of each particular mask constraint (k) at each grid cell (i). Grid cells are given a value of one if it supports a particular mask constraint, zero otherwise such that:
bik =
for i = 1…m and k = V and I
Next, a variable is defined that reflects whether or not a site is selected for revegetation, as the vector X with dimension m and elements xi, given by:
xi =
for i = 1…m
In accord with the vegetation management models, the objective function for the revegetation model is an aggregate index comprised of the attribute layers listed in Table 27. The objective function minimises the total cost of the sites selected for revegetation. Thus, considering the scaling of each attribute as described in Section 5.1.2.1.2, the model selects the combination of grid cells for revegetation that have the most favourable Landscape
1 if feature j occurs at grid cell i
0 otherwise {
1 if site i is selected for revegetation
0 otherwise {
1 if mask constraint k occurs at grid cell i
0 otherwise {
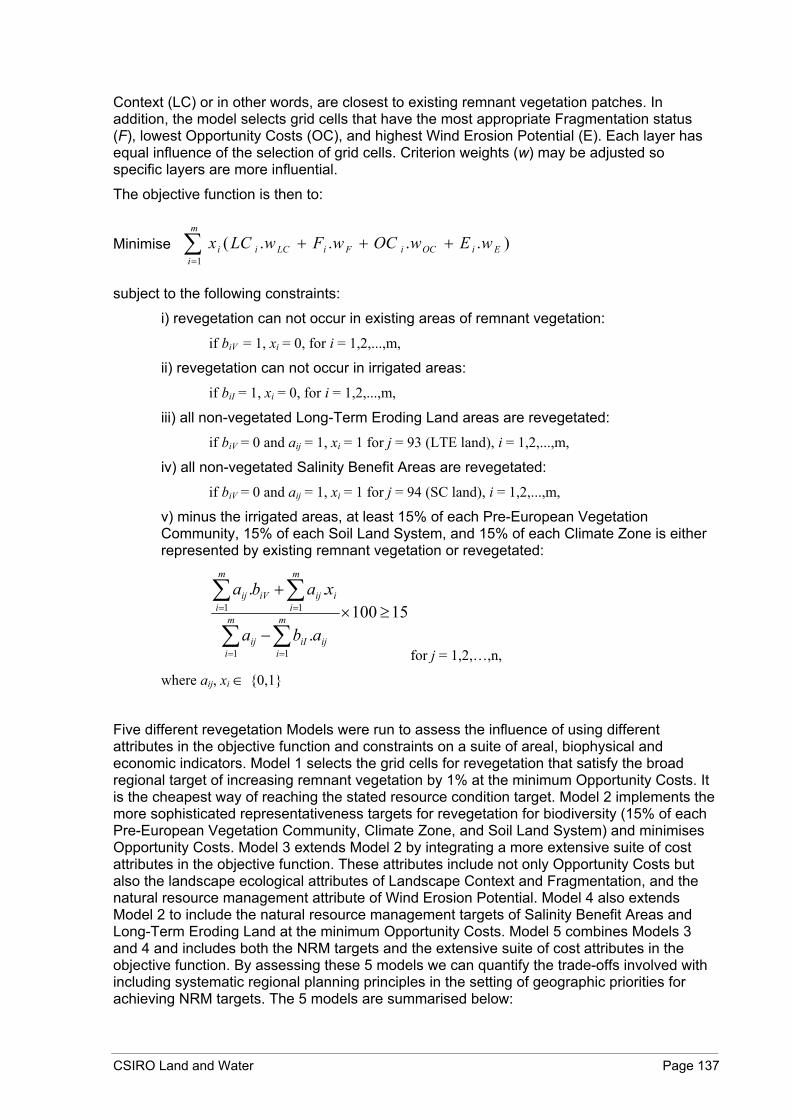
CSIRO Land and Water Page 137
Context (LC) or in other words, are closest to existing remnant vegetation patches. In addition, the model selects grid cells that have the most appropriate Fragmentation status (F), lowest Opportunity Costs (OC), and highest Wind Erosion Potential (E). Each layer has equal influence of the selection of grid cells. Criterion weights (w) may be adjusted so specific layers are more influential.
The objective function is then to:
Minimise
subject to the following constraints:
i) revegetation can not occur in existing areas of remnant vegetation:
if biV = 1, xi = 0, for i = 1,2,...,m,
ii) revegetation can not occur in irrigated areas:
if biI = 1, xi = 0, for i = 1,2,...,m,
iii) all non-vegetated Long-Term Eroding Land areas are revegetated:
if biV = 0 and aij = 1, xi = 1 for j = 93 (LTE land), i = 1,2,...,m,
iv) all non-vegetated Salinity Benefit Areas are revegetated:
if biV = 0 and aij = 1, xi = 1 for j = 94 (SC land), i = 1,2,...,m,
v) minus the irrigated areas, at least 15% of each Pre-European Vegetation Community, 15% of each Soil Land System, and 15% of each Climate Zone is either represented by existing remnant vegetation or revegetated:
15100.
..
1 1
1 1 ≥×−
+
∑ ∑
∑ ∑
= =
= =m
i
m
iijiIij
m
ii
m
iijiVij
aba
xaba
for j = 1,2,…,n,
where aij, xi ∈ {0,1}
Five different revegetation Models were run to assess the influence of using different attributes in the objective function and constraints on a suite of areal, biophysical and economic indicators. Model 1 selects the grid cells for revegetation that satisfy the broad regional target of increasing remnant vegetation by 1% at the minimum Opportunity Costs. It is the cheapest way of reaching the stated resource condition target. Model 2 implements the more sophisticated representativeness targets for revegetation for biodiversity (15% of each Pre-European Vegetation Community, Climate Zone, and Soil Land System) and minimises Opportunity Costs. Model 3 extends Model 2 by integrating a more extensive suite of cost attributes in the objective function. These attributes include not only Opportunity Costs but also the landscape ecological attributes of Landscape Context and Fragmentation, and the natural resource management attribute of Wind Erosion Potential. Model 4 also extends Model 2 to include the natural resource management targets of Salinity Benefit Areas and Long-Term Eroding Land at the minimum Opportunity Costs. Model 5 combines Models 3 and 4 and includes both the NRM targets and the extensive suite of cost attributes in the objective function. By assessing these 5 models we can quantify the trade-offs involved with including systematic regional planning principles in the setting of geographic priorities for achieving NRM targets. The 5 models are summarised below:
)....(
1EiOCiFiLCi
m
ii wEwOCwFwLCx +++∑
=
CSIRO Land and Water Page 138
Model 1 – Regional 1% revegetation target, minimum opportunity cost
Model 2 – 15% representativeness targets, minimum opportunity cost
Model 3 - 15% representativeness targets, minimise function of Opportunity Cost, Landscape Context, Fragmentation, and Wind Erosion Potential Model 4 – 15% representativeness targets, NRM targets, minimum opportunity cost
Model 5 - 15% representativeness targets, NRM targets, minimise function of Opportunity Cost, Landscape Context, Fragmentation, and Wind Erosion Potential
5.4.2.2 Results Spatial optimisation in MCDA was able to identify sites for revegetation for biodiversity according to the objectives in Models 1 to 5. The resource condition target of increasing the area of native vegetation by 1% remains a reasonable short-term target. However, we recommend that this increase in area should be part of a longer term goal based on sound ecological and conservation planning principles. The five models assess the costs and benefits of increasing the sophistication of targets for revegetation for biodiversity and included representativeness targets, landscape ecological targets and NRM targets.
Superficially, the extent of remnant vegetation in the Corridor is sufficient because over 42% of the region remains in a relatively natural state. However, the remnant vegetation is not representative of the full range of biophysical diversity. Most of the remnant vegetation is concentrated in the northern parts of the Corridor in the drier climates less suitable for broadacre cropping. Much of the Mallee and rangeland environments north of the River Murray between Morgan and the border are under remnant vegetation. Areas to the south of this stretch of river have been extensively cleared. Also, large tracts of Mallee and native grasslands remain both sides of the River Murray between Swan Reach and Morgan. Areas to the south of Swan Reach have also been extensively cleared. The revegetation targets used in this model identify areas for revegetation so that all biophysical environment types are represented by native vegetation Table 28.
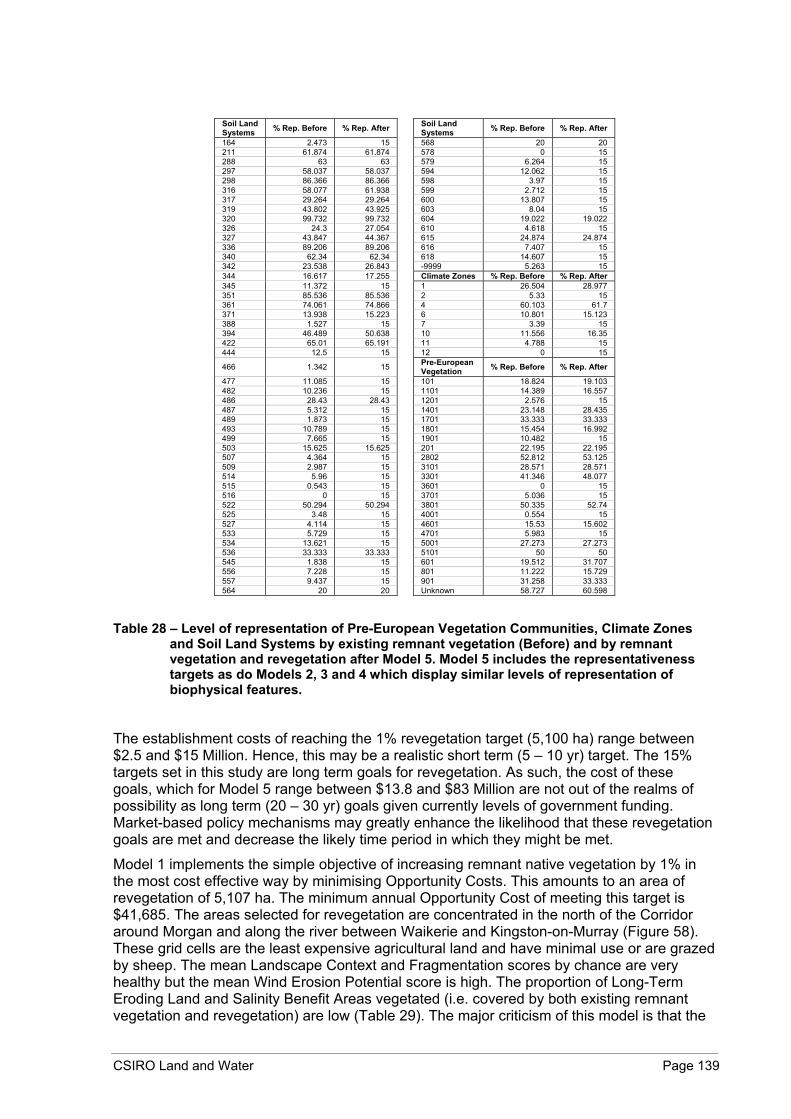
CSIRO Land and Water Page 139
Table 28 – Level of representation of Pre-European Vegetation Communities, Climate Zones
and Soil Land Systems by existing remnant vegetation (Before) and by remnant vegetation and revegetation after Model 5. Model 5 includes the representativeness targets as do Models 2, 3 and 4 which display similar levels of representation of biophysical features.
The establishment costs of reaching the 1% revegetation target (5,100 ha) range between $2.5 and $15 Million. Hence, this may be a realistic short term (5 – 10 yr) target. The 15% targets set in this study are long term goals for revegetation. As such, the cost of these goals, which for Model 5 range between $13.8 and $83 Million are not out of the realms of possibility as long term (20 – 30 yr) goals given currently levels of government funding. Market-based policy mechanisms may greatly enhance the likelihood that these revegetation goals are met and decrease the likely time period in which they might be met.
Model 1 implements the simple objective of increasing remnant native vegetation by 1% in the most cost effective way by minimising Opportunity Costs. This amounts to an area of revegetation of 5,107 ha. The minimum annual Opportunity Cost of meeting this target is $41,685. The areas selected for revegetation are concentrated in the north of the Corridor around Morgan and along the river between Waikerie and Kingston-on-Murray (Figure 58). These grid cells are the least expensive agricultural land and have minimal use or are grazed by sheep. The mean Landscape Context and Fragmentation scores by chance are very healthy but the mean Wind Erosion Potential score is high. The proportion of Long-Term Eroding Land and Salinity Benefit Areas vegetated (i.e. covered by both existing remnant vegetation and revegetation) are low (Table 29). The major criticism of this model is that the
Soil Land Systems % Rep. Before % Rep. After Soil Land
Systems % Rep. Before % Rep. After
164 2.473 15 568 20 20 211 61.874 61.874 578 0 15 288 63 63 579 6.264 15 297 58.037 58.037 594 12.062 15 298 86.366 86.366 598 3.97 15 316 58.077 61.938 599 2.712 15 317 29.264 29.264 600 13.807 15 319 43.802 43.925 603 8.04 15 320 99.732 99.732 604 19.022 19.022 326 24.3 27.054 610 4.618 15 327 43.847 44.367 615 24.874 24.874 336 89.206 89.206 616 7.407 15 340 62.34 62.34 618 14.607 15 342 23.538 26.843 -9999 5.263 15 344 16.617 17.255 Climate Zones % Rep. Before % Rep. After 345 11.372 15 1 26.504 28.977 351 85.536 85.536 2 5.33 15 361 74.061 74.866 4 60.103 61.7 371 13.938 15.223 6 10.801 15.123 388 1.527 15 7 3.39 15 394 46.489 50.638 10 11.556 16.35 422 65.01 65.191 11 4.788 15 444 12.5 15 12 0 15
466 1.342 15 Pre-European Vegetation % Rep. Before % Rep. After
477 11.085 15 101 18.824 19.103 482 10.236 15 1101 14.389 16.557 486 28.43 28.43 1201 2.576 15 487 5.312 15 1401 23.148 28.435 489 1.873 15 1701 33.333 33.333 493 10.789 15 1801 15.454 16.992 499 7.665 15 1901 10.482 15 503 15.625 15.625 201 22.195 22.195 507 4.364 15 2802 52.812 53.125 509 2.987 15 3101 28.571 28.571 514 5.96 15 3301 41.346 48.077 515 0.543 15 3601 0 15 516 0 15 3701 5.036 15 522 50.294 50.294 3801 50.335 52.74 525 3.48 15 4001 0.554 15 527 4.114 15 4601 15.53 15.602 533 5.729 15 4701 5.983 15 534 13.621 15 5001 27.273 27.273 536 33.333 33.333 5101 50 50 545 1.838 15 601 19.512 31.707 556 7.228 15 801 11.222 15.729 557 9.437 15 901 31.258 33.333 564 20 20 Unknown 58.727 60.598

CSIRO Land and Water Page 140
resulting areas of vegetation are not representative of the range of biophysical environments of the Corridor. The revegetation recommended under Model 1 is concentrated in those environments that are already over-represented in the Corridor. As a result, much of the biodiversity characteristic of unrepresented environments may not have the chance to flourish through the revegetation of local native species and the reconstruction of native habitats. Revegetation in these locations offers negligible biodiversity outcomes and would not be an effective use of conservation resources.
Post Planning Indicators Model 1 Model 2 Model 3 Model 4 Model 5
Total area of existing remnant vegetation 510,734 ha 510,734 ha 510,734 ha 510,734 ha 510,734 ha
Total area of vegetation including revegetation 515,841 ha 532,312 ha 532,312 ha 566,595 ha 566,595 ha
Total area of revegetation 5,107 ha 21,578 ha 21,578 ha 27,681 ha 27,681 ha
Mean Landscape Context cost score of revegetated areas 1.05 1.24 1.03 1.21 1.07
Mean Fragmentation cost score of revegetated areas 1.33 1.61 1.32 1.48 1.3
Mean Wind Erosion cost score of revegetated areas 3.9 3.86 3.19 3.8 3.34
Proportion of Long-Term Eroding Land vegetated 31.6 % 30.61 % 36.74 % 98.3 % 98.3 %
Proportion of Salinity Benefit Areas vegetated 6.3 % 6.0 % 5.16 % 82.58 % 82.58 %
Value of annual Opportunity Costs of revegetated areas $41,685 $705,936 $855,118 $920,957 $1,047,464
Establishment costs of revegetation LOW EST. ($500 / ha) $2,553,500 $10,789,000 $10,789,000 $13,840,500 $13,840,500
Establishment costs of revegetation HIGH EST. ($3,000 / ha) $15,321,000 $64,734,000 $64,734,000 $83,043,000 $83,043,000
Table 29 – Post planning indicators of the five revegetation models assessed in this study.

CSIRO Land and Water Page 141
Model 1 Model 2
Model 3 Model 4
Revegetation Models
Priority Areas for Revegetation
Irrigated Areas
Native Vegetation
1956 Floodplain 0 5025Kilometres
Cleared Areas
Corridor Boundary
River Murray
Figure 58 – Geographic priorities for revegetation in the Corridor identified by Models 1-4.
Model 2 is the simplest implementation of the 15% representativeness constraint. As such, the sites identified for revegetation by this model together with existing revegetation cover 15% of each Soil Land System, Climate Domain and Pre-European Vegetation Community (see Table 28) most cost effectively. Despite the relatively high proportion of remnant vegetation remaining in the Corridor, the targeting of certain environment types for land clearance for agriculture means that the Opportunity Costs of meeting representativeness targets in the Corridor are significant at nearly $706,000 per annum. The area of revegetation required represents an increase of the total area of native vegetation by more than 4% or 21,578 ha. The mean Landscape Context and Fragmentation cost scores are worse than Model 1 simply because there are 4 times more grid cells selected and the representativeness constraints are in force. The mean Wind Erosion Potential cost score is similar to Model 1 as are the proportions of both Long-Term Eroding Land and Salinity Benefit Areas (Table 29).
Model 3 includes the 15% representativeness targets and minimises a weighted linear function of Opportunity Costs, Landscape Context and Wind Erosion Potential scores. Model 3 involves revegetation of the same area as Model 2 but offers substantially better mean Landscape Context, Fragmentation and Wind Erosion Potential scores, better even than

CSIRO Land and Water Page 142
Model 1. The Opportunity Costs of this improvement is nearly $150,000 per annum over Model 2 (a 21% increase) (Table 29).
Model 4 includes the 15% representativeness constraint and targets all Long-Term Eroding Land and Salinity Benefit Areas (not irrigated) at the minimum Opportunity Cost. Including the NRM constraints requires an extra 6,000 ha or 27,681 ha in total. The Opportunity Cost of Model 4 is nearly $920,000 per annum. Hence, the extra cost of meeting the NRM targets of revegetating Long-Term Eroding Land and Salinity Benefit Areas is around $215,000 per annum – a 30% increase (i.e. compare Model 4 with Model 2). The total Net Present Value of the costs to downstream users of river salinity avoided by revegetation is just over $3 Million over 100 years. Thus, the opportunity costs alone of revegetation are many times higher than the public benefits resulting from land degradation let alone the establishment costs. By chance, the indicators of mean Landscape Context, Fragmentation and Wind Erosion Potential cost scores are as good as or better than Model 2 which does not include NRM constraints of Long-Term Eroding Land and Salinity Benefit Areas (Table 29).
Model 5 is the most sophisticated multiple objective model and includes the 15% representativeness constraint and targets all Long-Term Eroding Land and Salinity Benefit Areas (not irrigated) and minimises a weighted linear function of Opportunity Costs, Landscape Context and Wind Erosion Potential cost scores. Model 5 requires the same area of revegetation as Model 4 but the Opportunity Costs of including the Landscape Context, Fragmentation and Wind Erosion Potential are around $147,000 per annum. The indicators are all very respectable for Model 5 (Table 29). The spatial distribution of areas for revegetation are a mix of new patches, infill of existing remnants, stepping stone patches and linking areas (Figure 59).
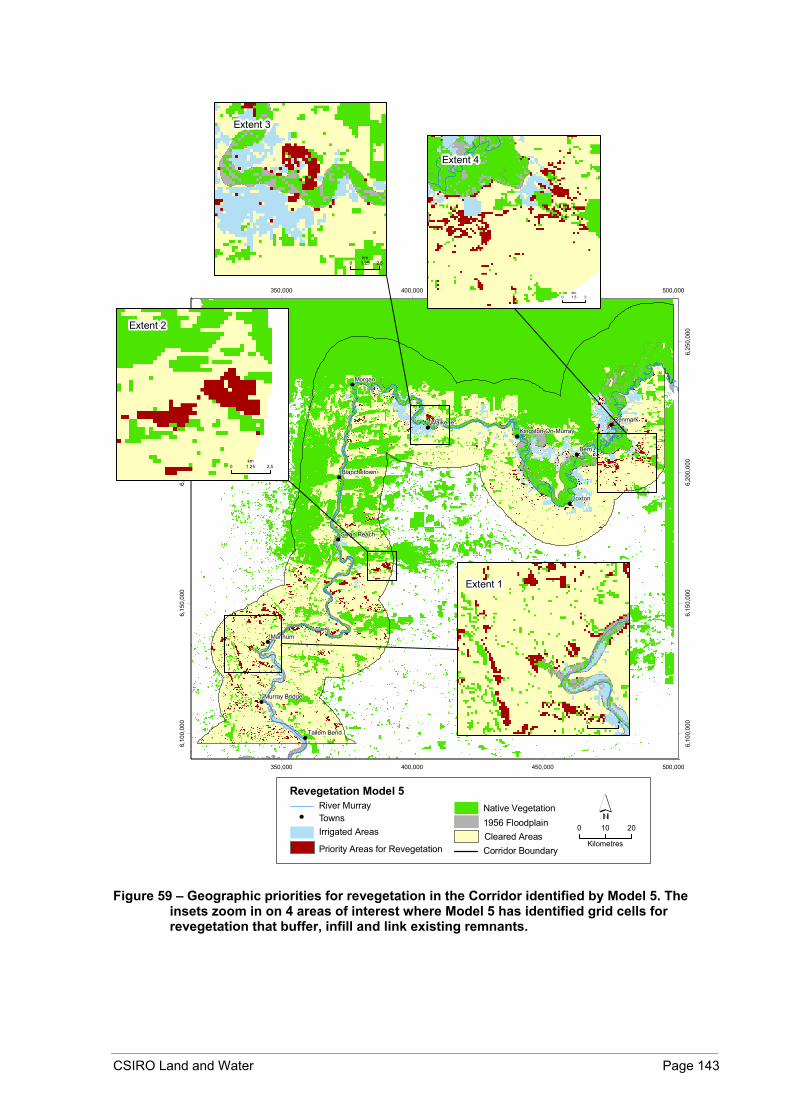
CSIRO Land and Water Page 143
Berri
Morgan
Mannum
Loxton
RenmarkWaikerie
Swan Reach
Tailem Bend
Blanchetown
Murray Bridge
Kingston-On-Murray
350,000
350,000
400,000
400,000
450,000
450,000
500,000
500,000
6,10
0,00
0
6,10
0,00
0
6,15
0,00
0
6,15
0,00
0
6,20
0,00
0
6,20
0,00
0
6,25
0,00
0
6,25
0,00
0
Extent 1
Extent 2
Extent 3
Extent 4
Native Vegetation1956 FloodplainCleared AreasIrrigated Areas
TownsRiver Murray
Revegetation Model 5
Priority Areas for Revegetation
0 10 20
Kilometres
0 42km
0 2.51.25km
0 2.51.25km
0 31.5km
Corridor Boundary
Figure 59 – Geographic priorities for revegetation in the Corridor identified by Model 5. The
insets zoom in on 4 areas of interest where Model 5 has identified grid cells for revegetation that buffer, infill and link existing remnants.
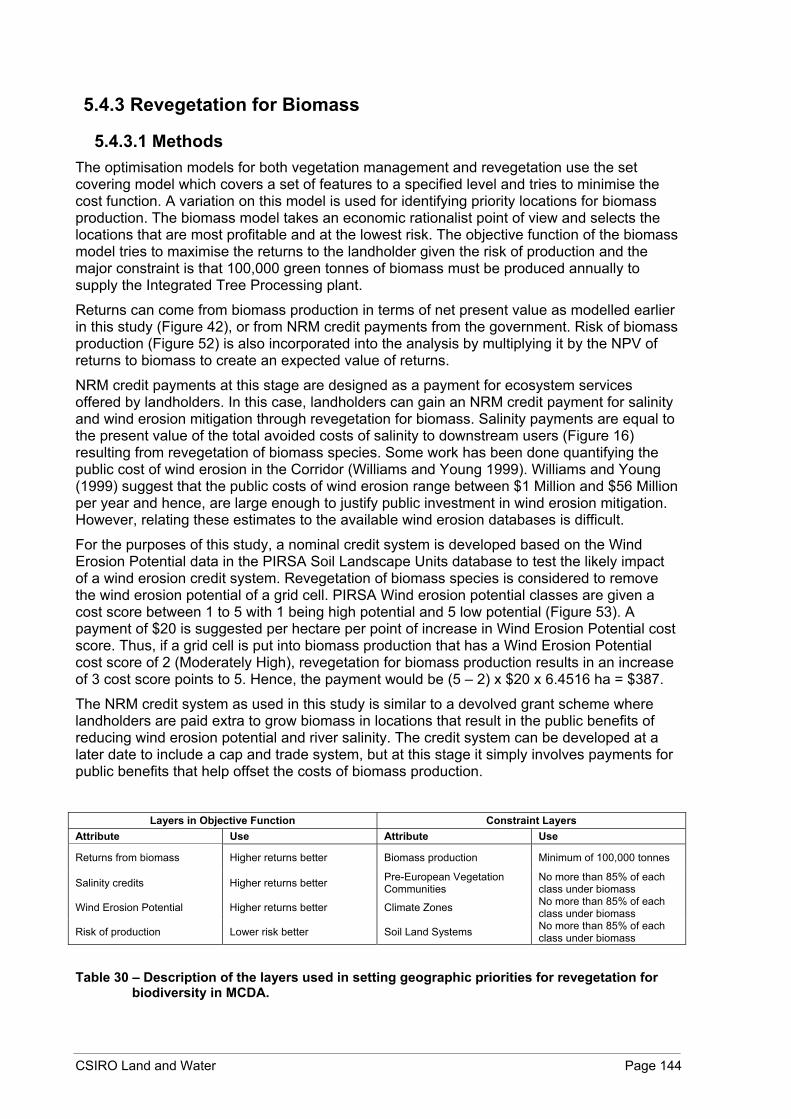
CSIRO Land and Water Page 144
5.4.3 Revegetation for Biomass
5.4.3.1 Methods The optimisation models for both vegetation management and revegetation use the set covering model which covers a set of features to a specified level and tries to minimise the cost function. A variation on this model is used for identifying priority locations for biomass production. The biomass model takes an economic rationalist point of view and selects the locations that are most profitable and at the lowest risk. The objective function of the biomass model tries to maximise the returns to the landholder given the risk of production and the major constraint is that 100,000 green tonnes of biomass must be produced annually to supply the Integrated Tree Processing plant.
Returns can come from biomass production in terms of net present value as modelled earlier in this study (Figure 42), or from NRM credit payments from the government. Risk of biomass production (Figure 52) is also incorporated into the analysis by multiplying it by the NPV of returns to biomass to create an expected value of returns.
NRM credit payments at this stage are designed as a payment for ecosystem services offered by landholders. In this case, landholders can gain an NRM credit payment for salinity and wind erosion mitigation through revegetation for biomass. Salinity payments are equal to the present value of the total avoided costs of salinity to downstream users (Figure 16) resulting from revegetation of biomass species. Some work has been done quantifying the public cost of wind erosion in the Corridor (Williams and Young 1999). Williams and Young (1999) suggest that the public costs of wind erosion range between $1 Million and $56 Million per year and hence, are large enough to justify public investment in wind erosion mitigation. However, relating these estimates to the available wind erosion databases is difficult.
For the purposes of this study, a nominal credit system is developed based on the Wind Erosion Potential data in the PIRSA Soil Landscape Units database to test the likely impact of a wind erosion credit system. Revegetation of biomass species is considered to remove the wind erosion potential of a grid cell. PIRSA Wind erosion potential classes are given a cost score between 1 to 5 with 1 being high potential and 5 low potential (Figure 53). A payment of $20 is suggested per hectare per point of increase in Wind Erosion Potential cost score. Thus, if a grid cell is put into biomass production that has a Wind Erosion Potential cost score of 2 (Moderately High), revegetation for biomass production results in an increase of 3 cost score points to 5. Hence, the payment would be (5 – 2) x $20 x 6.4516 ha = $387.
The NRM credit system as used in this study is similar to a devolved grant scheme where landholders are paid extra to grow biomass in locations that result in the public benefits of reducing wind erosion potential and river salinity. The credit system can be developed at a later date to include a cap and trade system, but at this stage it simply involves payments for public benefits that help offset the costs of biomass production.
Layers in Objective Function Constraint Layers
Attribute Use Attribute Use
Returns from biomass Higher returns better Biomass production Minimum of 100,000 tonnes
Salinity credits Higher returns better Pre-European Vegetation Communities
No more than 85% of each class under biomass
Wind Erosion Potential Higher returns better Climate Zones No more than 85% of each class under biomass
Risk of production Lower risk better Soil Land Systems No more than 85% of each class under biomass
Table 30 – Description of the layers used in setting geographic priorities for revegetation for
biodiversity in MCDA.

CSIRO Land and Water Page 145
In the biomass model, each attribute layer in the objective function has dollars for units. The major constraint in the biomass model is that 100,000 green tonnes must be produced each year. Biomass Production (BP) information is modelled earlier in this study (Figure 36). Other constraint layers are similar to the representativeness targets used in the revegetation models formatted in a site x features matrix where each grid cell is a site and each constraint class (each Pre-European Vegetation Community, Climate Zone, and Soil Land System) is a feature. The elements of the matrix are given a binary digit (0 or 1) depending on whether the feature occurs at the site. The constraint ensures that biomass production does not preclude the opportunity to represent at least 15% of each feature by revegetation for biodiversity.
The optimisation problem for biomass production is formulated in a similar way to the revegetation for biodiversity problem. The number of grid cells (m) in the Corridor is 188,655. The total number of features (n) equals 92 as Long-Term Eroding Land is not considered and salinity benefits are included as a salinity credit system in the objective function. Thus, an m x n matrix A (188,655 rows (grid cells) x 92 columns (features)) was created whose elements aij are given a binary value according to the presence or absence of each feature (j) at each grid cell (i). Grid cells are given a value of one if it supports a particular feature, zero otherwise such that:
aij =
for i = 1…m and j = 1…n
A second matrix B (188,655 rows x 2 columns) is also created which holds a land cover and a land tenure mask constraint. The constraints describe whether the cell is Dryland or not (D) and whether the grid cell is Private Land or not (P) or not. This information used to limit biomass production to dryland cells that are privately owned. Dryland areas are defined as areas within the Corridor that are not under remnant vegetation, nor irrigated, nor on the flood plain. The elements of B, bik are given a binary value according to the presence or absence of each particular mask constraint (k) at each grid cell (i). Grid cells are given a value of one if it supports a particular mask constraint, zero otherwise such that:
bik =
for i = 1…m and k = D, P
Next, a variable is defined that reflects whether or not a site is selected for biomass production, as the vector X with dimension m and elements xi, given by:
xi =
for i = 1…m
Where the biomass model differs to the previous models is that the objective function tries to maximise returns in real dollars rather than minimise an aggregate index. Returns are
1 if feature j occurs at grid cell i
0 otherwise {
1 if site i is selected for biomass production
0 otherwise {
1 if mask constraint k occurs at grid cell i
0 otherwise {

CSIRO Land and Water Page 146
calculated by summing the expected value of biomass returns (or the product of biomass returns (BR) and risk (R)) with the returns from salinity credits (S) and wind erosion credits (W) all measured in units of dollars per grid cell. There are no criterion weights to adjust in this model because the units are all in dollars. However, the payment per wind erosion credit can be modified.
The objective function is then to:
maximise ))1((1
iiii
m
ii WSRBRx ++−∑
=,
subject to the following constraints:
biomass production must be capped at 100,000 tonnes
000,100)(1
≤∑=
i
m
ii BPx ,
biomass production can only occur on dryland, privately owned land:
if biD . biP = 0, xi = 0, for i = 1,2,...,m,
biomass production must not cover more than 85% of each Pre-European Vegetation Community, Soil Land System, and Climate Zone so that opportunities for revegetation of representative samples (15%) of each biophysical type for biodiversity are not precluded:
15100.
100
1
1 ≥×−
∑
∑
=
=m
iij
i
m
iij
a
xa for j = 1,2,…,n,
where aij, xi ∈ {0,1}
Four different models of biomass production are assessed. Model 1 is a straight profit maximising model which identifies grid cells for biomass production that yield 100,000 tonnes per year and have the highest net present value returns over 100 years. Model 2 also tries to maximise the profit but also ensures that biomass production does not preclude the ability to represent 15% of each biophysical feature through revegetation. Model 3 extends Model 2 and includes consideration of the risk involved in biomass production and attempts to maximise the expected value of returns (returns x risk). Finally, Model 4 extends Model 3 and includes not only expected returns from biomass but also the returns from salinity and wind erosion credits. The four models are summarised below:
Model 1 – Maximise returns from biomass industries
Model 2 - Maximise returns from biomass industries, do not preclude revegetation options for biodiversity
Model 3 - Maximise expected returns from biomass industries, do not preclude revegetation options for biodiversity
Model 4 - Maximise expected returns from biomass industries, salinity and wind erosion credits, do not preclude revegetation options for biodiversity
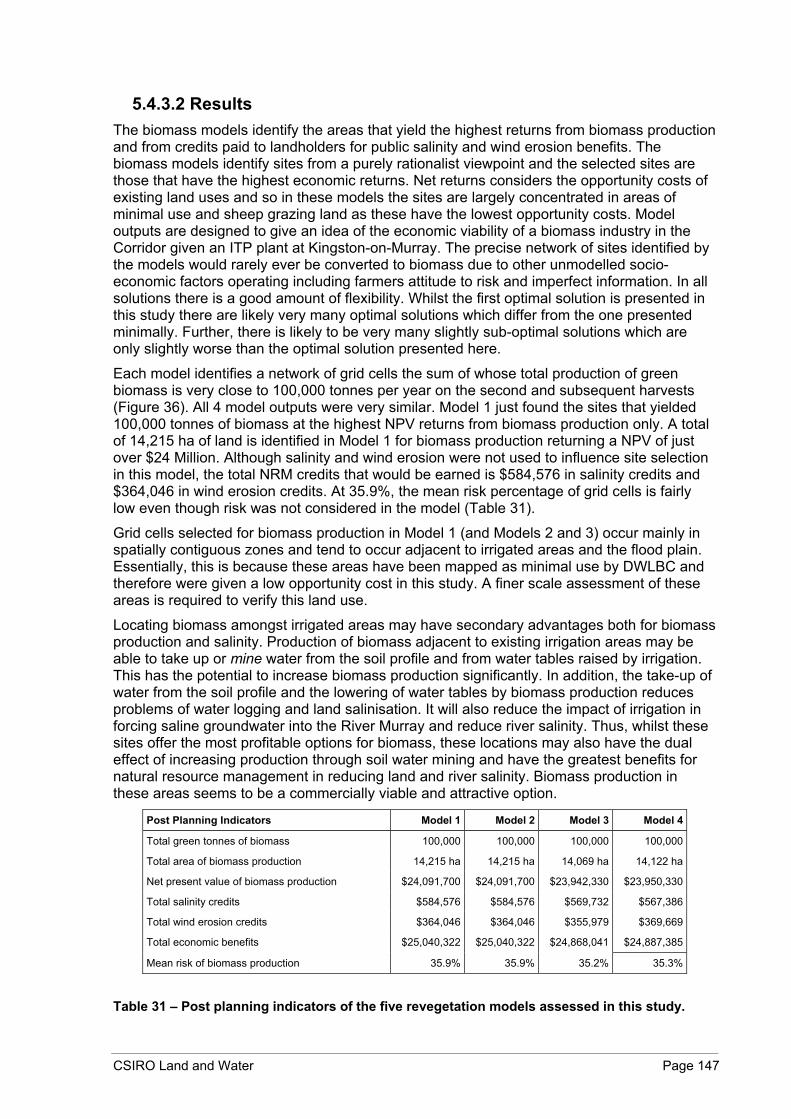
CSIRO Land and Water Page 147
5.4.3.2 Results The biomass models identify the areas that yield the highest returns from biomass production and from credits paid to landholders for public salinity and wind erosion benefits. The biomass models identify sites from a purely rationalist viewpoint and the selected sites are those that have the highest economic returns. Net returns considers the opportunity costs of existing land uses and so in these models the sites are largely concentrated in areas of minimal use and sheep grazing land as these have the lowest opportunity costs. Model outputs are designed to give an idea of the economic viability of a biomass industry in the Corridor given an ITP plant at Kingston-on-Murray. The precise network of sites identified by the models would rarely ever be converted to biomass due to other unmodelled socio-economic factors operating including farmers attitude to risk and imperfect information. In all solutions there is a good amount of flexibility. Whilst the first optimal solution is presented in this study there are likely very many optimal solutions which differ from the one presented minimally. Further, there is likely to be very many slightly sub-optimal solutions which are only slightly worse than the optimal solution presented here.
Each model identifies a network of grid cells the sum of whose total production of green biomass is very close to 100,000 tonnes per year on the second and subsequent harvests (Figure 36). All 4 model outputs were very similar. Model 1 just found the sites that yielded 100,000 tonnes of biomass at the highest NPV returns from biomass production only. A total of 14,215 ha of land is identified in Model 1 for biomass production returning a NPV of just over $24 Million. Although salinity and wind erosion were not used to influence site selection in this model, the total NRM credits that would be earned is $584,576 in salinity credits and $364,046 in wind erosion credits. At 35.9%, the mean risk percentage of grid cells is fairly low even though risk was not considered in the model (Table 31).
Grid cells selected for biomass production in Model 1 (and Models 2 and 3) occur mainly in spatially contiguous zones and tend to occur adjacent to irrigated areas and the flood plain. Essentially, this is because these areas have been mapped as minimal use by DWLBC and therefore were given a low opportunity cost in this study. A finer scale assessment of these areas is required to verify this land use.
Locating biomass amongst irrigated areas may have secondary advantages both for biomass production and salinity. Production of biomass adjacent to existing irrigation areas may be able to take up or mine water from the soil profile and from water tables raised by irrigation. This has the potential to increase biomass production significantly. In addition, the take-up of water from the soil profile and the lowering of water tables by biomass production reduces problems of water logging and land salinisation. It will also reduce the impact of irrigation in forcing saline groundwater into the River Murray and reduce river salinity. Thus, whilst these sites offer the most profitable options for biomass, these locations may also have the dual effect of increasing production through soil water mining and have the greatest benefits for natural resource management in reducing land and river salinity. Biomass production in these areas seems to be a commercially viable and attractive option.
Post Planning Indicators Model 1 Model 2 Model 3 Model 4
Total green tonnes of biomass 100,000 100,000 100,000 100,000
Total area of biomass production 14,215 ha 14,215 ha 14,069 ha 14,122 ha
Net present value of biomass production $24,091,700 $24,091,700 $23,942,330 $23,950,330
Total salinity credits $584,576 $584,576 $569,732 $567,386
Total wind erosion credits $364,046 $364,046 $355,979 $369,669
Total economic benefits $25,040,322 $25,040,322 $24,868,041 $24,887,385
Mean risk of biomass production 35.9% 35.9% 35.2% 35.3%
Table 31 – Post planning indicators of the five revegetation models assessed in this study.
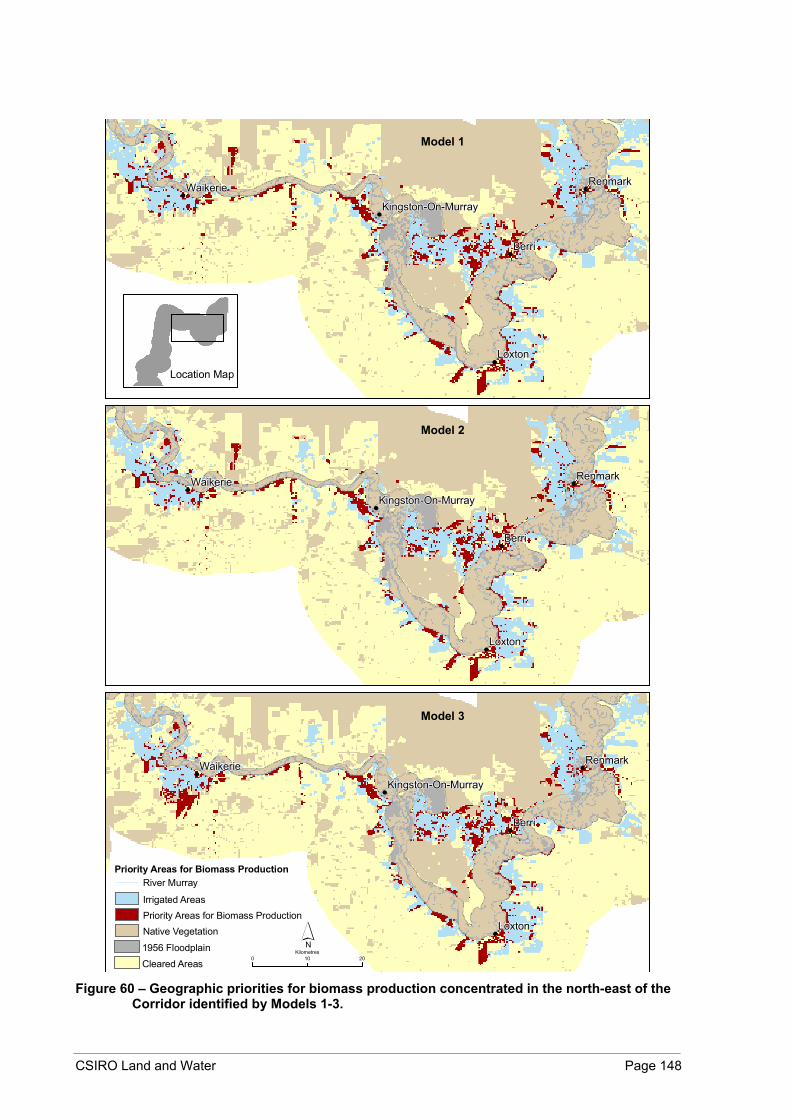
CSIRO Land and Water Page 148
Berri
Loxton
RenmarkWaikerie
Kingston-On-Murray
Berri
Loxton
RenmarkWaikerie
Kingston-On-Murray
Berri
Loxton
RenmarkWaikerie
Kingston-On-Murray
0 2010Kilometres
Location Map
Priority Areas for Biomass Production
Priority Areas for Biomass ProductionNative Vegetation
1956 FloodplainCleared Areas
Irrigated Areas
River Murray
Model 1
Model 2
Model 3
Figure 60 – Geographic priorities for biomass production concentrated in the north-east of the
Corridor identified by Models 1-3.

CSIRO Land and Water Page 149
Model 2 extends Model 1 to include the biodiversity constraint of not precluding the revegetation of 15% of each Soil Land System, Pre-European Vegetation type and Climate Zone. It is apparent that Model 1 does not preclude this biodiversity target anyway so the results for Model 2 are the same as Model 1. Biomass production only covers a low proportion of the area of most features (Table 32). This biodiversity constraint is not so important for small areas of biomass production but may be important if larger areas are to be considered (i.e. 2 or more ITP plants).
Feature Model 1 Model 4 Feature Model 1 Model 4
Soil Land Systems Soil Land Systems 164 100 100 568 100 100 211 100 100 578 100 100 288 100 100 579 100 100 297 100 100 594 100 100 298 100 100 598 100 100 316 96.15 96.475 599 100 100 317 100 100 600 100 100 319 98.597 99.643 603 100 100 320 100 100 604 100 100 326 100 100 610 100 100 327 100 100 615 100 100 336 99.222 99.222 616 100 100 340 100 100 618 100 100 342 100 100 -9999 100 100 344 97.6 96.618 Climate Domains 345 96.788 97.001 1 99.501 99.522 351 100 100 2 100 100 361 99.553 99.911 4 98.108 98.079 371 79.838 79.838 6 100 100 388 100 100 7 95.127 100 394 100 100 10 100 100 422 100 100 11 100 100 444 100 100 12 25 100 466 100 100 Pre-European Vegetation Community 477 100 100 101 100 100 482 97.008 100 1101 100 100 486 100 100 1201 98.303 98.303 487 100 100 1401 99.878 99.878 489 100 100 1701 33.333 33.333 493 100 100 1801 98.117 97.82 499 100 100 1901 100 100 503 100 100 201 100 100 507 100 100 2802 100 100 509 100 100 3101 100 100 514 98.841 100 3301 99.279 99.279 515 100 100 3601 100 100 516 100 100 3701 100 100 522 100 100 3801 98.817 99.004 525 100 100 4001 99.631 99.631 527 100 100 4601 100 100 533 100 100 4701 98.661 97.448 534 100 100 5001 100 100 536 100 100 5101 100 100 545 100 100 601 85.366 85.366 556 100 100 801 97.52 97.913 557 100 100 901 100 100 564 100 100 Unknown 99.04 99.17
Table 32 – Proportions (%) of Pre-European Vegetation Communities, Climate Domains and
Soil Land Systems not covered by biomass production for Model 1 and Model 4 and therefore able to be represented by native vegetation. Model 4 has the biodiversity constraint but it has little effect as the straight profit maximising Model 1 does not preclude options for revegetation for biodiversity in the Corridor.
Model 3 extends Model 2 to consider the risk of biomass production using the expected value of returns (returns x risk). Risk is derived from simulation and effectively represents the proportion of simulation runs for which the biomass economic model yields a negative net present value return. The area selected for biomass production is slightly less than Model 2 at 14,069 ha. In this model a trade-off is made between the total NPV returns and the risk of those returns. Hence, whilst the mean risk is slightly reduced compared to Model 2, so are the total NPV and the returns from salinity and wind erosion credits. The inclusion of the risk component in the model does not affect the selection of grid cells greatly and the mean risk is reduced by less than 1 percent. The influence of risk on the selection of land could be emphasized by weighting it more heavily if the attitudes of farmers to biomass production in the Corridor were more risk averse.

CSIRO Land and Water Page 150
Model 4 extends Model 3 insofar as it selects cells that maximise returns not only from biomass production but also from salinity and wind erosion credits. The level of credit payment used in this study involves for salinity credits to landholders is equivalent to the present value of the downstream costs of river salinity avoided by revegetation of biomass. For wind erosion, credits involve the payment of $20 per index point per hectare. Maximising not only the returns from biomass but also NRM credits results in a slight increase in the area required for production, a slight increase in the returns from biomass and from wind erosion credits, and a slight decrease in both salinity credits and mean risk. Thus, compared to Model 3 there is a slight increase in the total returns from biomass and credits combined and the trade-off is a slight increase in risk.
Again, the spatial location of biomass production identified in Model 4 suggests that the best locations are those with the lowest opportunity costs and within close proximity of the ITP plant at Kingston-on-Murray. Assessment of these areas using high-resolution aerial photography reveals mixed results, mainly related to the scale of the data used in the analysis. In many locations Model 4 selects cells than are very suitable for biomass production as they are cleared and do not appear to be supporting agriculture. However, there are also a few problems. Many sites that are selected include irrigated land that is temporarily out of production and hence was not mapped as irrigated in the 2003 DEH irrigation mapping or classified as irrigated agriculture in the DCDB. Also, many sites are selected that appear to support degraded remnant vegetation. These sites have not been mapped as remnant vegetation by DEH and so they are available for selection in the models. It would not be possible or desirable either economically or ecologically to clear this land to plant biomass species. The basic planning principle though has been distilled. Specifically, biomass has the potential to be profitable in the Corridor and should be planted in areas that have low opportunity costs and minimal use, close to the ITP plant, and preferably, interspersing irrigated areas.
The models have identified at the regional scale the most profitable grid cells for biomass production and have found that biomass production in the Corridor in the best possible sites is worth about $24 Million more than current land use. Revegetation of biomass in the most profitable grid cells has some natural resource management benefits and the inclusion of market-based policy instruments like credits are fairly expensive (in the order of $1 Million) and have very little impact on the total amount of public NRM benefits.

CSIRO Land and Water Page 151
Figure 61 – Geographic priorities for biomass production in the Corridor identified by Model 4.
Sites identified in Inset 1 are mostly suitable except some areas of native vegetation and a golf course. Inset 2 displays sites that are again mostly suitable but also some irrigated land not classified as irrigated in the Crops2003 database. Inset 3 displays sites selected that are mostly suitable but includes some native vegetation not mapped as such by DEH. Inset 4 displays sites selected adjacent to an irrigated area and on the edge of the flood plain which would be very beneficial for salinity mitigation.

CSIRO Land and Water Page 152
6. Key Findings and Policy Implications
6.1. Salinity
6.1.1 Key Findings
• The total salinity contribution from the dryland areas of the Corridor in 100 years has been estimated to be around 30 EC at Morgan (Barnett and Yan 2004). However, the salinity benefits achieved through revegetation as modelled by SIMPACT over a 100 year time frame is 1.96 EC at Morgan after 50 years and 4.14 EC at Morgan. This is considered to be a conservative estimate and research is required to improve this estimate.
• Based on these estimates the total cost to downstream users of river salinity avoided by revegetation in the dryland areas of the Corridor is just over $3.15 Million in present value terms over 100 years.
• Most of the salinity benefits can be achieved by revegetating an area of 10,000 ha.
6.1.2 Policy Implications
The modelled river salinity benefits and the associated costs to downstream users avoided by revegetation in the dryland areas of the Corridor are low. They also occur well into the future and hence, are heavily discounted in economic analyses. Conversely, the costs involved in revegetation and the opportunity costs are high and immediate. Hence, based on these estimates, the implementation of a scheme that encourages revegetation for salinity alone is not a cost effective policy option for the Corridor. The integration of salinity credits into integrated NRM policies could however, complement other incentives for landholders to undertake NRM actions. The cost of salinity to downstream users may provide a suitable guide as to the appropriate level of payment for salinity credits in the Corridor.
Salinity mitigation has potential to be an economic driver of NRM actions in the Corridor. More accurate estimates of the salinity benefit of revegetation are required. Revegetation policy for salinity benefits needs to be specifically targeted to encourage revegetation in the high salinity benefit areas.
6.2. Biomass
6.2.1 Key Findings
• Biomass production for supplying an Integrated Tree Processing (ITP) plant is very likely to be as profitable as, or more profitable than, existing agriculture in the Corridor. Under the Most Likely Scenario (time frame of 100 years and discount rate of 7%) the total net present value of biomass production for each 6.4 ha grid cell ranges between $5,000 less, to $25,000 more, than returns from existing agriculture with an average NPV of $7,168. The Modified Internal Rate of Return ranges between 6.8% and 7.7% and the Equal Annual Equivalent payments range from -$54 to $271 per year per grid cell or -$8.37/ha/yr to $42/ha/yr. The total potentially viable area for biomass production is 625,231 ha or 99.6% of the dryland area of the Corridor. The potential tonnage of green biomass supplied by the economically viable area (490 million tonnes per annum) far exceeds the production required to supply an ITP plant (100,000 tonnes per annum).
CSIRO Land and Water Page 153
• The most profitable locations for biomass production were found to be interspersed with existing irrigation areas. Biomass production in these areas may also have synergistic salinity benefits in lowering water tables and reducing recharge whilst at the same time increasing biomass production through soil water mining. The synergies between biomass and irrigation in the Corridor should be investigated further.
• Cash flow is a problem for production of biomass as farmers do not register a positive cash flow for at least 7 years. Biomass production may take much longer than this to return a positive net cash flow for the farmer depending on site characteristics.
• Sensitivity analysis shows that no parts of the Corridor are profitable under all possible parameter values. Under average conditions many parts of the Corridor are viable for biomass production but some are not. An optimistic view of biomass production which assumes low costs and high prices and productivities would state that all areas have the potential to be viable and some areas have the potential to be considerably more profitable than existing agriculture.
• The factory gate price of biomass is the single most important factor affecting the profitability of biomass production in the Corridor.
• Conservatively, a robust supply of >100,000 tonnes of biomass per year can be expected when the factory gate price of biomass exceeds $35 per green tonne. At this price biomass production becomes more profitable than current agriculture over a large enough area to produce a supply of > 100,000 tonnes.
6.2.2 Policy Implications
Biomass production is probably viable as a stand alone economic exercise in the Corridor. However, establishment of a viable biomass industry involves much more than demonstrating its potential viability. To achieve a viable biomass industry in the Corridor, an Integrated Tree Processing plant has to be established and landholders have to be contracted to grow biomass. These steps will require significant industry development initiative to be taken, either by the SA government or other relevant agencies such as the Regional Development Board. There are several ways forward for establishing a biomass industry including private contractual arrangements with the commercial sector (e.g. energy companies) and landholders, farmers co-operatives and other models.
Carbon sequestration and trading also looms as another potential driver of a biomass industry in the Corridor and elsewhere in SA for that matter. In addition, the additional income generated from a potential involvement in carbon trading would significantly increase the profitability of biomass. An issue to be overcome however, is the cash flow problem. Contractual arrangements may need to be established that provide a regular payment to landholders such as the Equal Annual Equivalent payment.
Based on recent modelling, the salinity and wind erosion benefits of biomass in particular mitigation, have been shown to be somewhat less than expected. However, the NRM benefits are significant and may justify the effort and expenditure required to establish a biomass industry. The larger the area of biomass production the greater the NRM benefits. Market research is required to quantify the market for biomass products such as renewable energy. Economies of scale may quickly be achieved for NRM benefits if the market for biomass products would support more than one ITP plant in the Corridor. Once the initial industry development work has been done the industry should prove to be viable on its own and contribute significant public NRM benefits. For a single plant the cost-benefit of establishing a biomass industry is fairly equivocal but for more than one plant the NRM benefits may justify industry development if the market is there for the ITP products.
CSIRO Land and Water Page 154
6.3. Wind Erosion
6.3.1 Key Findings
• The total area of long-term eroding land in the Corridor is 312 ha.
• The total area of soils with a wind erosion potential of moderately high to high is 40,000 hectares or 4% of the study area.
6.3.2 Policy Implications
Wind erosion is a significant NRM problem in the Corridor with substantial public costs. However, public wind erosion benefits do not provide sufficient incentive to drive private investment in NRM actions. Wind erosion benefits could be integrated into a broader public NRM policy in the Corridor. Policy incentives for addressing wind erosion would also need to be specifically targeted at high priority sites.
6.4. Carbon
6.4.1 Key Findings
• Given recent empirical productivity estimates, trading the carbon produced by revegetation in the Corridor could produce annual returns between $50 and $105 per hectare which is comparable to current agriculture.
• It is possible that vegetation management activities could attract carbon credits.
• Revegetation of local native species for biodiversity is ideally suited for carbon trading and the restored native community not only has multiple NRM benefits but an income may also be generated from carbon trading.
• Revegetation of fodder crops such as saltbush is unlikely to attract significant carbon credits because of the low productivity of the species.
• Biomass species are also suited for attracting carbon credits and there may be 2 options for carbon accounting of biomass species. Although they are harvested periodically and burned the carbon stored in the woody lignotuber may be counted. The other option is that the carbon emissions avoided by producing clean electricity may be counted. This is around $1,375,000 per annum in carbon credits at today’s prices from a single 5MW ITP plant.
6.4.2 Policy Implications
The carbon market is developing rapidly. Initial estimates suggest that current carbon trading prices are sufficient to provide farmers a viable income source to support revegetation and possibly vegetation management in the Corridor. Market-based policy may involve either integrating carbon credits within other NRM schemes or creating a stand alone carbon program similar to the Victorian CarbonTender program.
Although the current economic returns from carbon trading in the Corridor may potentially be economically viable, barriers to trade from Australia’s non-participation in the Kyoto protocol and market uncertainty obstruct the widespread land use change in the Corridor. If these can be overcome, carbon trading has the potential to provide additional incentives for participation in other programs such as biomass production. Carbon trading may also have the potential to become a stand alone economic driver for widespread land use change.

CSIRO Land and Water Page 155
Carbon provides an ideal incentive for encouraging the revegetation and restoration of native habitat which has NRM benefits for biodiversity, salinity and wind erosion.
Any stand alone carbon trading program needs to offset both the cash flow problem and the uncertainty involved in the carbon market. This can be done by tendering for carbon contracts where the government pays the landholder upfront for the first few years carbon production which may be paid back by the landholder from selling the carbon at a later date on the market. After that the landholder is free to trade the carbon on the open market. This involves some risk to both parties and speculation on the price of carbon.
6.5. Vegetation Management for Biodiversity
6.5.1 Key Findings
• Over 25% of remnant vegetation on private land is already managed. Meeting the NRM resource condition targets of managing 50% of remnant vegetation on private land will require a doubling of the existing managed area of remnant vegetation on private land - an increase of 99,751 ha.
• The distribution of current protected/managed areas of remnant vegetation is not representative of the range of biological and physical environments of the Corridor.
• The establishment costs of meeting the resource condition target for vegetation management range from $49 Million to $300 Million.
• The least expensive way of meeting regional resource condition targets for vegetation management has a total annual opportunity cost of $1,204,297 although the biodiversity and NRM benefits of this solution are poor.
• Including representativeness targets in vegetation management (i.e. ensuring at least 50% of each Vegetation Community, Climate Zone and Significant Species Habitat is managed) has an additional opportunity cost of only $84,000 per year (7%). The benefits for biodiversity of including these targets are likely to be substantially greater as will the effectiveness of vegetation management efforts in conserving biodiversity.
• Including the NRM targets in vegetation management (i.e. managing all remnant vegetation on Long-Term Eroding Land and Salinity Benefit Areas) has negligible extra biophysical or economic cost.
• Significant improvements in the Area, Shape, Fragmentation, Habitat Quality, and Wind Erosion Potential of managed areas of remnant vegetation can be achieved for minimal extra opportunity cost of only $40,000 per year (3% increase)
6.5.2 Policy Implications
The establishment costs and opportunity costs of implementing resource condition targets in the Corridor are high compared to current government funding. Sufficient funding to encourage vegetation management on the scale required to achieve regional resource condition targets is unlikely to become available in the foreseeable future.
Hence, if vegetation management is to occur on a scale commensurate with resource condition targets there will need to be significant costs borne by private landholders. Market-based policy is required to have any chance of reaching regional NRM targets for vegetation management.

CSIRO Land and Water Page 156
Systematic regional planning can increase the biodiversity and NRM benefits of vegetation management actions at only marginal extra cost. Sites funded for vegetation management actions need to be highly spatially targeted for optimal NRM benefit and cost effectiveness.
The shape of many areas selected in the spatial optimisation models is often complex and impractical for implementing vegetation management. Policy options need to be flexible and iterative to cope with the preferences of landholders for locating vegetation management actions on the ground whilst still working toward the most cost effective solution identified in the models.
6.6. Revegetation for Biodiversity
6.6.1 Key Findings
• The minimum opportunity cost involved in increasing remnant native vegetation by 1% in the Corridor is $41,685 per year and requires an area of revegetation of 5,107 ha. The establishment costs of reaching the 1% revegetation target ranges between $2.5 and $15 Million. The most cost effective sites for revegetation would have minimal benefits for biodiversity and NRM and undertaking revegetation in these locations would not be a cost-effective use of NRM resources.
• Implementation of a 15% representativeness target in the Corridor (i.e. ensure at least 15% of each Pre-European Vegetation Community, Climate Zone and Soil Land System are represented by either remnant vegetation or revegetation) has a significantly higher opportunity cost of $706,000 per annum, requires 4 times the area of the 1% target (21,578 ha) and the establishment costs range between $13.8 and $83 Million. However, the resulting geographic priorities for revegetation have a much better chance of conserving regional biodiversity.
• Further spatial enhancement of the biodiversity and NRM benefits of revegetation by including Landscape Context, Fragmentation and Wind Erosion Potential costs) involves an increase in opportunity costs of nearly $150,000 per annum (a 21% increase).
• Including the NRM benefits of revegetating all Long-Term Eroding Land and Salinity Benefit Areas (not irrigated) requires an extra 6,000 ha of revegetation and around $215,000 per annum extra opportunity costs. The opportunity and establishment costs of revegetation to achieve wind erosion and salinity benefits are likely to be many times higher than the public benefits from reductions in these NRM benefits.
• The spatial distribution of areas for revegetation are a mix of new patches, infill of existing remnants, stepping stone patches and linking areas.
6.6.2 Policy Implications
• Current levels of funding for revegetation is unlikely to achieve the scale of revegetation required to achieve regional biodiversity targets. If the stated resource condition target of achieving a 1% increase in vegetation and the additional 15% representativeness target are to be met, significant costs must be borne by private landholders. Market-based policy mechanisms may greatly enhance the likelihood that these revegetation goals are met.
• Sites funded for revegetation actions need to be spatially targeted for optimal NRM benefit. The sites selected for short term funding should coincide with the high priority sites identified for meeting the long term 15% representativeness target.
CSIRO Land and Water Page 157
• It is prudent to include Landscape Context, Fragmentation and Wind Erosion Potential in enhancing the location of revegetation for biodiversity, as the enhanced likelihood of success of revegetation in these priority locations and the increase in biodiversity benefits is likely to be cost effective.
• Including the NRM objectives of Salinity Benefit Areas and Long-Term Eroding Land in setting priorities for revegetation is very expensive and the costs far outweigh the benefits of revegetating these areas for biodiversity based on the parameters used in this study.
6.7. Revegetation for Biomass
6.7.1 Key Findings
• The network of sites that yield 100,000 tonnes of biomass at the highest NPV returns from biomass production include a total of 14,215 ha of land and return a NPV of just over $24 Million more than current land use (over a time frame of 100 years and discount rate of 7%). This estimate of profitability is however, likely to be conservative given the latest estimates of biomass species productivity in the Corridor (Hobbs and Bennell 2005). The spin-off salinity benefits total $584,576 in avoided costs to downstream users and wind erosion benefits total $364,046 in credits given the potential payment system developed in this study. The economic risk of these higher profit sites is fairly low.
• The most economic sites for biomass production occur mainly in spatially contiguous zones and tend to occur adjacent to irrigated areas and the flood plain. This is because these areas tend to be classified as minimal use land and hence are given a low opportunity cost. Biomass production in areas interspersing irrigated areas may have synergistic benefits whereby production is increased and raised water tables may be decreased.
• The most economic sites for biomass production for supplying 100,000 tonnes for a single Integrated Tree Processing plant do not preclude the implementation of biodiversity goals in the Corridor. However, the impact of biomass production on biodiversity may need further investigation if production is required to supply 2 or more ITP plants.
• Depending on landholder attitudes to risk, the returns to biomass production can be traded-off for increased certainty in production using the expected value of returns.
• The inclusion of market-based policy instruments like payments in the form of credits for public benefits of salinity and wind erosion mitigation will cost in the order of $1 Million in public funds and have only a minor impact on the total amount of public NRM benefits.
6.7.2 Policy Implications
• Experience from Western Australia suggests that the location of biomass production adjacent to cereal crops may reduce elevated water tables and provide the NRM benefit of mitigating dryland salinity. As a corollary, locating biomass production adjacent to irrigated areas in the Corridor may have similar salinity benefits in reducing land and river salinity.
• Thus, the NRM benefits of biomass production including salinity, wind erosion and potentially carbon, adds significant weight to investment in establishing a biomass

CSIRO Land and Water Page 158
industry in the Corridor. Biomass production seems to be a fairly attractive option with dual economic and environmental benefits.
• The establishment of biomass production not only represents an economic driver for private parties motivated by profit, but also yields significant public NRM benefits. However, the adoption of a credit scheme involving payments for NRM benefits such as salinity and wind erosion mitigation is expensive and does little to increase NRM benefits.

CSIRO Land and Water Page 159
7. Policy Options and Design A range of policy options exist to encourage large-scale vegetation management and revegetation including auction- or tender-based grant systems, credit systems, and biomass-based industry development. The policy options are required to provide incentives for large scale natural resource management actions that provide the multiple objective NRM benefits of salinity, biodiversity, wind erosion and carbon benefits (Connor and Bryan 2005). None of these policy options alone could feasibly facilitate the scale of revegetation and vegetation management required to meet multi-objective INRM resource condition targets in the Corridor. The best potential for achieving the targets is a multi-faceted policy mix involving the best elements from a variety of different policy options and tailored specifically to the different types of revegetation and vegetation management in the River Murray Corridor.
7.1. Invited Tender for NRM Contracts • Invited tender for NRM contracts involves an auction design where tenders are
specifically invited for vegetation management and revegetation contracts from landholders and community groups which propose action in high priority areas. This will facilitate the high degree of spatial targeting required to address high priority sites for NRM
• Tendering approaches may be applied to individual landholders, Local Action Planning (LAP) groups, or larger investors willing to negotiate on behalf of landholders
• Tenders should be invited from all landholders and groups with influence over high priority sites. However, prioritisation reduces market size and caution is required to avoid problems arising from thin markets
• Bids may be submitted that propose either the revegetation of local native species for biodiversity, or the management of remnant vegetation. There should be 2 classes of bids which are evaluated separately – revegetation and vegetation management.
• Differentiation in tender selection can be done based on the NRM benefits offered per dollar and the tenders offering the most cost effective actions selected for funding. Essentially, tenders offering revegetation and vegetation management over the largest area in high priority locations are a high priority for funding
• A reserve price may be set that specifies the maximum that will be paid per hectare of NRM action
• One advantage of this approach is that the maximum expenditure by the government will be known
• This approach is likely to increase the cost effectiveness of government money spent on revegetation, particularly for biodiversity. Our experience (Bryan et al. 2004a) suggests that around twice the environmental benefits can be gained from NRM funding using a tendering approach
• Tendering approaches have the advantage of requiring little institutional change. A tendering approach simply adds value to existing devolved grant schemes. In addition, the existing institutional infrastructure is already in place. All funded NRM actions should involve putting a management agreement or Heritage Agreement on sites proposed for NRM action
• Tendering approaches for individual landholders and groups are particularly suited to the less economic local native species plantings required for biodiversity goals. Whilst

CSIRO Land and Water Page 160
tendering approaches could also be applied to encourage other types of NRM actions such as revegetation such as fodder crops and woodlots, the NRM benefits of these types of revegetation are limited and funding spent on these efforts may be better spent of high priority actions with multiple NRM benefits in high priority sites.
• Established techniques and appropriate data for tender ranking and selection are available (Bryan et al. 2004a)
• Significant investment is required to get the auction scheme off the ground as the responsibility for the design of revegetation projects is devolved to the landholders and substantial information is required upfront to support their bid
• A key to the success of tendering schemes in NRM is the supply of adequate information to landholders to support their bid
• Capital, time preference and information constraints would likely be more significant for a tendering policy focussed on individual smaller enterprises rather than larger institutional investors
• Capital and information constraints may be overcome by offering contracts with evenly spread annual payments. This may also increase certainty on behalf of the funding agency as payments are made contingent upon performance.
• The tendering system needs to be ongoing. Priorities for NRM action can be recalculated and updated each round. This iterative approach enables consideration of the NRM impacts expected from the projects funded in the previous round and an assessment of how these change future geographic priorities. This iterative approach can also integrate new information affecting geographic priorities as this becomes available. Tools can be developed to support this (Bryan et al. 2004b).
7.2. NRM Credits • An NRM credit system (Ward and Connor 2004, Willis and Johnson 2004) could be
integrated with the tendering system suggested above. Credit systems can be set up as a straight payment to landholders for actions that achieve NRM benefits initially, with a cap and trade system potentially implemented at a later date.
• Salinity credits could include payments for revegetation that reduces the cost of future salt loads to the River Murray. A well developed technical capacity is established to assess salinity impacts of revegetation and dollar benefits to downstream users. However, there is some risk due to the uncertainty surrounding the effectiveness of revegetation in reducing salt loading over time. To alleviate this, risk management could involve setting an upper bound on payments for revegetation at some fraction of the estimated cost of salinity to downstream users (e.g. 50%).
• A salinity credit scheme may be extended to a broader-focussed NRM (or Ecosystem Services) credit system where landholders receive payments for improving biodiversity or reducing wind erosion. However, there is significantly more risk attached to the extended credit system as measurement of the value of benefits to wind erosion and biodiversity is more difficult.
• A credit system involving government payments to landholders and groups for addressing the multiple objective resource condition targets of salinity, wind erosion and biodiversity may encourage some NRM actions. However, given the level of government funding likely to be available in the foreseeable future and typical levels of costs borne by landholders, an NRM credit system consisting of payments for salinity, wind erosion and biodiversity benefits is unlikely to encourage the scale of

CSIRO Land and Water Page 161
actions required to achieve resource condition targets. Additional economic drivers are required to facilitate NRM action on this scale.
• The potential of carbon trading as an economic driver for achieving large scale NRM actions in the Corridor is considerable. Thus, whilst a detailed assessment of the economic potential of carbon sequestration in the Corridor is required, initial calculations based on the latest production estimates and price figures suggest that landholders may make an income from carbon trading comparable with existing agriculture. Carbon credits may also be integrated with salinity, biodiversity and wind erosion credits. NRM actions such as vegetation management and revegetation of local native species can have multiple objective salinity, biodiversity, wind erosion and carbon benefits. A policy mix involving salinity, biodiversity, wind erosion and carbon credits may provide a combined income from these sources may have the potential to encourage the scale of NRM actions required to meet resource condition targets.
• The fact that the Commonwealth has not ratified the Kyoto protocol has not dissuaded other states from initiating programs focussing on carbon trading. Victoria’s CarbonTender program combines a tendering system for revegetation for biodiversity like the one outlined above with the future option of selling carbon credits earned from revegetation efforts on the global market.
• Before a multiple NRM benefit credit system could be implemented, research would be required to fully develop standard and accounting frameworks for quantifying appropriate credit payment levels for biodiversity and wind erosion mitigation and carbon sequestration actions. This should build on existing work quantifying the value of biodiversity (Hatton MacDonald and Morrison 2005), wind erosion (Williams and Young 1999) and the extensive literature and standards for carbon sequestration and trading.
7.3. Biomass Industry Development • A biomass industry in the corridor is likely to be profitable as a private enterprise and
can result in considerable NRM benefits at minimal government expense. An industry development policy may hasten the uptake of the opportunity.
• This policy option involves putting out to tender a single biomass industry contract which involves managing the complete operations of a biomass industry plant in the Corridor as a commercial enterprise including the local production, processing and marketing of biomass products. Industry development may also involve market research and local extension work. It is not envisaged that biomass industry development will be expensive.
• Tendering approaches involving larger investors may be best aimed at utility-type companies looking to run a biomass processing plant and contract local landholders to revegetate for biomass industries. However, a farmer co-operative type model may also be a possibility.
• This kind of model is widely used in forestry contracts and a similar model is used in the context of biomass production in Western Australia.
• A private enterprise model achieves economies of scale as all of the processes from production to market are managed by a private company
• Much of the risk involved in the biomass industry is borne by the company rather than the public

CSIRO Land and Water Page 162
• For a biomass industry model to be successful, cash flow timing constraints that make perennial plantings unattractive to landholders would have to be addressed. Contracts guaranteeing fixed annual payments may be required to encourage adoption of perennial woody species. This would be the responsibility of the company.
• Extra payments for NRM benefits such as salinity and wind erosion credits may not result in cost-effective additional NRM benefits. However, the market may support 2 or more ITP plants which will increase the NRM benefits of a biomass industry. Market research should include a quantitative investigation into the size of the market for biomass products in the Corridor.
7.4. A Policy Mix for NRM As mentioned above, no single policy is likely to encourage the scale of NRM actions required to meet resource condition targets in the Corridor. The three options discussed above used together, may have the potential to achieve multiple objective NRM targets. The biomass industry development option has potential to encourage large scale revegetation of biomass species. This is a low cost option for government as biomass seems to be an economically viable exercise in the Corridor. Biomass plantings motivated solely by profit can also provide considerable salinity and wind erosion benefits. However, biomass production does not offer significant biodiversity benefits. The tendering system for NRM contracts has the potential to encourage some NRM actions, especially those contributing biodiversity benefits such as vegetation management and revegetation of local native species. The NRM credit payment system though, which includes payments for salinity, biodiversity, wind erosion and carbon credits, has the greatest potential to encourage cost effective, large scale, multiple objective NRM actions. Overcoming the barriers to carbon trading is the key precursor to the success of this policy option.
CSIRO Land and Water Page 163
8. Directions for Future Research
8.1. Extending Systematic Regional Planning Many of the biophysical processes modelled in this study, especially ecological processes, operate over entire regions. Systematic regional planning for NRM in the Corridor needs to be extended to take a whole-of-region approach for the Murray Darling Depression (MDD) bioregion.
Taking bioregional approach also involves integrating the different targets specified in the regional NRM planning of the four NRM groups/Catchment Management agencies occurring in the MDD. The targets addressed by SRP in the bioregion should also be extended from the limited set of NRM targets addressed in this study.
In addition to extending the analysis to the bioregion, quantification and modelling of the various attributes used as input into the model can also be enhanced. Biodiversity modelling can be improved using additional datasets. Salinity modelling needs to be improved to capture more accurately the impact of revegetation in mitigating river salinity. A model quantifying the economic potential of carbon trading across the region needs to be developed and a model of the social impacts of large scale NRM actions will enable the generation of socially resilient policy options.
8.2. Systematic Planning for NRM under Climate Change Climate change presents a major challenge to the continued biophysical, economic and social viability of the region. Planning for NRM needs to identify options that provide the greatest biophysical benefits and maximise the resilience to climate change of regional biophysical, economic and social systems.
The spatial distribution of the impacts of climate change on rainfall, temperature and carbon dioxide in the region need to be modelled including the uncertainty involved in climate change impacts. Quantification of the risk and uncertainty surrounding each of the modelled attribute layers with respect to the impacts of climate change is required. Systematic regional planning needs to incorporate consideration of climate change and to identify geographic priorities for NRM actions that enable the most cost effective and the most resilient biophysical, economic and social outcomes.
8.3. Linking Systematic Planning with Real Outcomes In this project we identified the high priority locations for revegetation to achieve multi-objective NRM targets based on the assumption that landholders act as fully informed, rational, profit maximisers. However, literature-based insights and experimental results indicate that this is rarely the case. Hence, further research required is to identify the mix and sequencing of policy instruments that best motivates landholders to undertake revegetation in high priority NRM areas.
This may be achieved through using an optimal policy design framework which links experimental economics with the systematic regional planning framework developed in this project. This would involve quantifying the real world behaviour and reactions of landholders to policy changes in an experimental economics setting. These behaviours can then be extrapolated to the region to assess the likelihood of reaching NRM targets under each policy

CSIRO Land and Water Page 164
scenario. This information may then be used to iteratively adjust the policy instruments to arrive at the policy scenario most likely to achieve regional NRM targets.

CSIRO Land and Water Page 165
9. Conclusion Natural resource management requires intensive and expensive actions over a large scale by private landholders largely for public benefit. The incentives for this to occur do not currently exist within the existing NRM policy framework. For NRM actions to occur on a scale that redresses regional threatening processes such as biodiversity decline, river salinity and wind erosion two things need to occur. Firstly, NRM actions need to be systematically planned so that multiple NRM objectives can be met most cost effectively. Secondly, policy is required that encourages these NRM actions in priority areas by providing the right incentives.
In this study we have developed the concept of systematic regional planning (SRP) for multiple objective natural resource management and present a full implementation in the South Australian River Murray Corridor. Systematic regional planning uses a Multi-Criteria Decision Analysis framework which provides an explicit structure for defining and analysing complex NRM decisions, quantifying the uncertainty involved in these decisions and making recommendations for actions. Systematic regional planning was conducted to set geographic priorities for the NRM actions of vegetation management, revegetation of local native species, and biomass production. SRP was conducted in order to quantify the minimum cost of reaching regional resource condition targets and to identify the geographic priorities for each NRM action.
In developing the concept of systematic regional planning for multiple objective natural resource management we add to existing resource condition targets. Enhanced objectives for vegetation management, revegetation and biomass production are developed based on systematic conservation planning principles, economic principles, and principles of integrated natural resource management. Implementation of the suite of principles in systematic regional planning involves the use of spatial optimisation techniques with the MCDA framework which identify geographic priorities for NRM actions that increase the likelihood that NRM actions will actually achieve the desired NRM goals.
The implementation of SRP in the Corridor involved several analyses in construction of the attribute layers for input into spatial optimisation in MCDA. These analyses had important policy implications themselves including the quantification of the influence of revegetation in river salinity mitigation as modelled over a 100 year time horizon and wind erosion mitigation, and confirmation of the economic viability of biomass production as a land use in the Corridor.
Systematic regional planning revealed that given the current levels of government funding, regional resource condition targets are unlikely to be met by either vegetation management or revegetation without private landholders bearing a significant portion of the cost. In costing the implementation of SRP principles in the Corridor it was found that the NRM issues of salinity and wind erosion could be addressed by vegetation management in addition to the biodiversity goals at minimal extra cost.
In planning for revegetation, we considered that the resource condition target of a 1% increase in vegetation was not likely to contribute to the NRM goal of conserving regional biodiversity, especially if the least expensive options were taken. Instead, we design and implement SRP based on a 15% representativeness target as a long term goal for revegetation. The amount of revegetation required to meet this target is about 4 times more expensive than the 1% target but the NRM benefits are likely to be substantially more. Including consideration of Landscape Context, Fragmentation status and Wind Erosion Potential in the model increased the likely NRM benefits from revegetation at some extra cost. Including the NRM benefits of revegetating all Salinity Benefit Areas (as modelled by SIMPACT over a 100 year time frame) and Long-Term Eroding Land was much more expensive.
CSIRO Land and Water Page 166
Biomass production was found to be potentially viable in the Corridor and the most profitable sites could return a net present value of $24 Million more than existing land uses. Biomass production could also provide significant NRM benefits for salinity and wind erosion. The integration of a NRM credit system to encourage biomass plantings in high priority areas for salinity and wind erosion benefits is not likely to be cost effective.
Market-based policy mechanisms are suggested for encouraging vegetation management and revegetation of local native species to achieve biodiversity benefits. An invited tendering system is suggested which provides a spatially targeted approach to the distribution of funds for NRM. The tendering approach has been found to achieve greater efficiency in NRM actions than standard devolved grant schemes because of the substantial costs borne by the landholders. Multiple benefit NRM credit systems could also be implemented and possibly combined with the tendering system. Carbon credits especially have considerable potential for encouraging the large scale NRM actions required to meet the multiple objectives of salinity, biodiversity, wind erosion and additionally, carbon sequestration, in the Corridor. A biomass industry development program is also proposed. Industry development may involve market research and tendering of a biomass production contract aimed at utility and similar companies with experience in biomass industries. The successful company would manage all stages of the industry from production contracts to marketing biomass products.
In this study we have identified future options for most cost effectively addressing NRM targets in the South Australian River Murray Corridor. We have quantified the cost, feasibility and impacts of achieving a few selected resource condition targets and discussed policy instruments which may provide the greatest chance of meeting targets. Future directions for research include extending the concept of SRP, integrating climate change impacts, and designing policy that optimally encourages NRM actions in the priority locations identified by SRP.

CSIRO Land and Water Page 167
10. Appendices
10.1. Appendix 1 The Resource Condition Targets for the SAMDB INRM Region (INRM Group 2003c)
1. Maintain and improve the extent and condition of 65% of current floodplain vegetation communities in areas of high priority by 2020
2. By 2020, a 30% reduction in priority areas of floodplain currently affected by salinity from groundwater discharge.
3. Maintain and improve the condition and connectedness of 60% of wetlands of high priority by 2020
4. Maintain and improve the condition of 60% of the littoral zone of high priority and high significance by 2020
5. By 2020, improve the habitat in all waters to permit successful recruitment of native fish, particularly Murray Cod, resulting from natural or manipulated flows.
6. Recover 30% of water dependent ecosystems from pest infestation and minimize any further infestations by 2020.
7. By 2020, to have salinity of water in the River Murray less than 800EC for 95% of the time at Morgan to ensure drinking water standards
8. By 2020, to have salinity of water in the River Murray less than 543EC for 80% of the time at Berri Irrigation Pump Station to ensure drinking water standards
9. By 2020, to have salinity of water in the River Murray less than 770EC for 80% of the time at Murray Bridge Pump Station to ensure drinking water standards
10. The phosphorous concentration in the River Murray is to be less than or equal to 0.05mg/L 90% of the time by 2020.
11. The nitrogen concentration in the River Murray is to be less than or equal to 1.0mg/L 90% of the time by 2020.
12. The turbidity level in the River Murray is to be equal or less than 80 NTU 90% of the time by 2020.
13. Maintain blue green algal levels below the national standard threshold level for all sections of the Murray river and the lower lakes by 2020
14. Maintain and improve the stability of river banks, lake edges, sand dunes and cliffs by 2020
15. The Murray mouth open 100% of the time through fresh water outflows with adequate tidal variation to meet the needs of Coorong ecosystems
16. 30% of flow maintained in watercourses of EMLR to sustain ecosystem function by 2020
17. By 2020 to have constrained the area of salt affected land within the region to 120,000 ha.
18. By 2020, reduce the area of agricultural land at risk of wind erosion during June each year by 40%.
19. Reduce recharge by improving dryland water use efficiency to 70% across the region by 2020
20. To have an increasing trend in Soil carbon levels in cropping soils leading to improved soil health by 2020
21. Recover 30 % of quality native vegetation, habitat and agricultural production areas from pest infestation and minimize any further infestations by 2020
22. By 2020 improve or maintain condition of terrestrial native vegetation focusing on identified priority areas and improve condition of 50% of remnant vegetation on private land as well as increasing vegetation cover by 1% in the agricultural region.

CSIRO Land and Water Page 168
23. Maintain and improve the conservation status of all threatened National and State listed species and regionally threatened communities and species by 2020.
24. By 2020 groundwater resources will not have salinity impacts on land condition and will meet the needs of dependent ecosystems.
25. By 2006 to have developed a RCT relative to irrigated and waterlogged land
26. The E.coli count in the River Murray is to be less than or equal to 150 ec/100mL for 90% of the time by 2020.

CSIRO Land and Water Page 169
11. References AACM International. (1997). Coorong and Districts Local Action Plan Final Report. AACM International.
ACF et al. (2004). The Environment Challenge: Saving our Forests, our Rivers, our Climate. Australian Conservation Foundation, Greenpeace Australia Pacific, and The Wilderness Society.
Andelman, S.J., Fagan, W.F. (2000). Umbrellas and flagships: efficient conservation surrogates or expensive mistakes? Proceedings of the National Academy of Sciences 97 (11), 5954-5959.
Anderson, J.R., Dillon, J.L. and Hardaker, B. (1977). Agricultural Decision Analysis. The Iowa State University Press.
Ando, A., Camm, J., Polasky, S., Solow, A. (1998). Species distributions, land values, and efficient conservation. Science 279 (5359), 2126-2128.
Andren, H., (1994). Effects of habitat fragmentation on birds and mammals in landscapes with different proportions of suitable habitat: a review. Oikos 71 (), 355-366.
Austin, M.P. (1985). Continuum concept, ordination methods, and niche theory. Annual Review of Ecology and Systematics 16, 39-61.
Austin, M.P., Margules, C.R., 1986. Assessing Representativeness. In: Usher M.B. (Ed.), Wildlife Conservation Evaluation. Chapman and Hall: London.
Austin, M.P., Nicholls, A.O., Margules, C.R., 1990. Measurement of the realized qualitative niche: environmental niches of five Eucalyptus species. Ecological Monographs 60 (2), 161-177.
Barnett, S.R., Yan, W., Watkins, N.R., Woods, J.A. & Hyde, K.M. (2002). Murray Darling Basin Salinity Audit: Groundwater modelling to predict future salt loads to the River Murray in South Australia. Department of Primary Industries and Resources Report DWR 2001/017.
Barnett, S.R. and Yan, W. (2004). Groundwater Modelling of Salinity Impacts on the River Murray due to Vegetation Clearance in the Riverland area of SA. South Australian Salinity Mapping and Management Support Project. Department of Primary Industries and Resources Report 2004/42.
Barry, P.J., Ellinger, P.N., Hopkin, J.A. and Baker, C.B. (1995). Financial Management in Agriculture. Interstate Publishers.
Bedward, M., Pressey, R.L. and Keith, D.A. (1992). A new approach for selecting fully representative reserve networks: addressing efficiency, reserve design and land suitability with an iterative analysis. Biological Conservation 62 (2), 115-125.
Belbin, L. (1993). Environmental representativeness: Regional partitioning and reserve selection. Biological Conservation 66 (3), 223-230.
Bennell, M., Hobbs, T. and Ellis, M. (2004). FloraSearch Species and Industry Evaluation: Low rainfall agroforestry options for southeastern Australia. A report for the RIRDC/Land and Water Australia/FWPRDC/MDBC Joint Venture Agroforestry Program. SA Department of Water, Land and Biodiversity Conservation.
Bennett, F.J. (1994) Moorook Kingston Revegetation Strategy. CARE Murray Darling Basin Commission.
Bickford, S. and Mackey, B. (2004). Reconstructing pre-impact vegetation cover in modified landscapes using environmental modelling, historical surveys and remnant vegetation data: a case study in the Fleurieu Peninsula, South Australia. Journal of Biogeography 31 (5), 787-805.
CSIRO Land and Water Page 170
Binning, C., Baker, B., Meharg, S., Cork, S. and Kearns, A. (2002). Making Farm Forestry Pay- Markets for Ecosystem services. A Report for the Rural Industries Research and Development Corporation. RIRDC Publication No 02/005. RIRDC Project No CSW-33A.
Brooks, T., Da Fonseca, G.A.B., and Rodrigues, A.S.L. (2004) Species, Data, and Conservation Planning. Conservation Biology 18(6), 1682-1688.
Bryan, B.A. (2002). Reserve Selection for Nature Conservation in South Australia: Past, Present and Future. In Australian Geographical Studies 40(2), 196 – 209
Bryan, B.A. (2003). Linking spatial optimisation and GIS: Using integer programming to find the best places to plant trees in a landscape for conservation. Presented at SSC 2003. Inaugural conference of the Spatial Sciences Institute of Australia. Canberra, Australia, 23-25 September, 2003.
Bryan, B. and Marvanek, S. (2004). Quantifying and valuing land use change for Integrated Catchment Management evaluation in the Murray-Darling Basin 1996/97 – 2000/01. Stage 2 Report to the Murray-Darling Basin Commission, CSIRO Land and Water.
Bryan, B. Connor, J., Gatti, S. and Garrod, M. (2004a). Catchment Care – Developing a Tendering Process for Biodiversity and Water Quality Gains. Milestone 13 Report. CSIRO Land and Water.
Bryan, B.A., Perry, L.M., Gerner, D., Ostendorf, B., & Crossman, N.D. (2004b). An interactive spatial optimisation tool for systematic landscape restoration. In iEMSs 2004: Complexity and Integrated Resources Management. Biennial conference of the International Environmental Modelling and Software Society, University of Osnabrück, Germany, June 14-17, 2004.
Cabeza, M., Araujo, M.B., Wilson, R.J., Thomas, C.D., Cowley, M.J.R. and Moilanen, A. (2004). Combining probabilities of occurrence with spatial reserve design. Journal of Applied Ecology, 41, 252-262.
Caro, T.M. (2003). Umbrella species: critique and lessons from East Africa. Animal Conservation 6 (2), 171-181.
Carver, S.J. (1991). Integrating multi-criteria evaluation with Geographical Information Systems. International Journal of Geographical Information Systems 5 (3), 321-339.
Chakhar, S. and Martel, J-M. (2003). Enhancing Geographical Information Systems Capabilities with Multi-Criteria Evaluation Functions. Journal of Geographic Information and Decision Analysis 7 (2), 47-71.
Church, R.L. and ReVelle, C. (1974). The maximal covering location problem. Papers of the Regional Science Association 32, 101-118.
Church, R.L., Stoms, D.M. and Davis, F.W. (1996). Reserve selection as a maximal covering location problem. Biological Conservation 76 (2), 105-112.
Cocks, K.D. and Baird, I.A. (1989). Using mathematical programming to address the multiple reserve selection problem: An example from the Eyre Peninsula, South Australia. Biological Conservation 49 (2), 113-130.
Connor, J.D. and Bryan, B.A. (2005). River Murray Dryland Corridor Revegetation Policy Options. Policy and Economic Research Unit, CSIRO Land and Water.
Connor, J., Cook, P.G. and Miles, M. (2003). Maximum Justified Investment on Alternatives to Salt Interception for the South Australian River Murray. Interim Report. CSIRO Land and Water Report No. S/03/228.
Cook, P.G., Leaney, F.W. and Miles, M. (2004). Groundwater Recharge in the North-East Mallee Region, South Australia. CSIRO Land and Water Technical Report No. 25/04.
Costanza, R. and Jorgensen, S.E. (2002). Introduction: Understanding and Solving Environmental Problems in the 21st Century: Towards a new, integrated “hard problem

CSIRO Land and Water Page 171
science”. In Costanza, R. and Jorgensen, S.E. (eds.) Understanding and Solving Environmental Problems in the 21st Century: Toward a New, Integrated Hard Problem Science. Elsevier Science, pp. 1 - 3.
Costanza, R., Voinov, A., Boumans, R., Maxwell, T., Villa, F., Wainger, L., and Voinov, H. (2002) Integrated Ecological Economic Modeling of the Patuxent River Watershed, Maryland. Ecological Monographs 72 (2), 203-231.
Cowling, R.M., Pressey, R.L., Rouget, M. and Lombard, A.T. (2003). A Conservation Plan for a Global Biodiversity Hotspot – The Cape Floristic Region, South Africa. Biological Conservation 112, 191-216.
Creation Care (1999a) Berri – Barmera Local Revegetation Plan. Berri Barmera Local Action Planning Committee.
Creation Care (1999b) Loxton to Bookpurnong Local Revegetation Plan. Loxton to Bookpurnong Local Action Planning Committee.
Creation Care (1999c) Renmark to the Border Local Revegetation Plan. Renmark to the Border Local Action Planning Association Inc.
Creation Care (1999d) Riverland West Local Revegetation Plan. Riverland West Local Action Planning Committee.
Cresswell, H., English, P., Zhang, L., Gallant, J., McKenzie, N., Austin, J., Gregory, L., Glover, M., Richardson, P., Paydar, Z., Green, T., Hickel, K., Palmer, R., Best, A., Ive, J., Abel, N., Hill, P., Langston, A., Cawsey, M., Langridge, J., Ryan, P., Plant, R., Jovanovic, T., Booth, T., Marcar, N. and Myers, B. (2004). Heartlands: Planning for Sustainable Land Use and Catchment Health, A Report of the Heartlands Initiative, CSIRO and Murray-Darling Basin Commission Publication No. HL9-04.
Crossman, N., Bryan, B. and Schultz, T. (2004). Construction of a Biodiversity Prioritisation Layer for the SA Murray-Darling Basin NRM Region. University of Adelaide, CSIRO Land and Water, SA DWLBC.
Crossman, N.D. and Bryan, B.A. (in review). Systematic landscape restoration using integer programming. Submitted to Biological Conservation, September 2004.
Csuti, B., Polasky, S., Williams, P.H., Pressey, R.L., Camm, J.D., Kershaw, M. Kiester, A.R., Downs, B., Hamilton, R., Huso, M. and Sohr, K. (1997). A comparison of reserve selection algorithms using data on terrestrial vertebrates in Oregon. Biological Conservation 80 (1), 83-97.
DEH (2003). Naturelinks: Implementing the WildCountry Philosophy in South Australia. South Australian Department of Environment and Heritage.
Diamond, J.M. (1975). The island dilemma: lessons of modern biogeographic studies for the design of natural reserves. Biological Conservation 7, 129-146.
Diamond, J.M. and May, R.M. (1976). Island biogeography and the design of nature reserves. In: May, R.M., (Ed.), Theoretical Ecology: Principles and Applications. W.B. Saunders: Pennsylvania, USA.
Doak, D.F., Marino, P.C. and Kareiva, P. (1992). Spatial scale mediates the influence of habitat fragmentation on dispersal success: implications for conservation. Theoretical Population Biology, 41, 315-16.
Dominelli, S. and Smith, F. (2004). Chowilla Conservation Values GIS Model. Draft report. South Australian Department for Environment and Heritage, Adelaide.
Ellis, M. (2001). The potential for biomass industries in the lower rainfall agricultural areas of South Australia. A Strategic Approach to New Large Scale Revegetation Opportunities. Land Management and Revegetation Program, Sustainable Resources, PIRSA.
CSIRO Land and Water Page 172
Enecon Pty Ltd. (2001). Integrated Tree Processing of Mallee Eucalypts. A Report for the RIRDC/Land and Water Australia/FWPRDC Joint Venture Agroforestry Program. RIRDC Publication No 01/160. RIRDC project No OIL-3A.
Fahrig. L. (2003). Effects of habitat fragmentation on biodiversity. Annual Review of Ecology, Evolution and Systematics 34, 487-515.
Fargher, J., Fuller, D., Watkins, N., Miles, M. and Collett, K. (2003). Tools for assessing salinity impacts of interstate water trade in the Southern Murray-Darling Basin i) SIMRAT a spatially distributed rapid assessment tool for Nyah to Lake Alexandrina ii) Scoping of a rapid assessment tool for the Riverine Plains. Final Report. SKM, DEH, AWE, URS.
Ferrier, S., Pressey, R.L. and Barrett T.W. (2000). A new predictor of the irreplaceability of areas for achieving a conservation goal, its application to real-world planning, and a research agenda for further refinements. Biological Conservation 93 (3), 303-325.
Fischer, J., Lindenmayer, D.B. and Fazey, I. (2004). Appreciating ecological complexity: habitat contours as a conceptual landscape model. Conservation Biology, 18 (5), 1245-53.
Freudenberger, D., Harvey, J., Drew, A., 2004. Predicting the biodiversity benefits of the Saltshaker Project, Boorowa, NSW. Ecological Management and Restoration 5 (1), 5-14.
George, T.L. and Zack, S. (2001). Spatial and temporal considerations in restoring habitat for wildlife. Restoration Ecology 9 (3), 272-279.
Gerner, D.B. and Bryan, B.A. (2003a). Geographic Information Systems and Optimisation Algorithms to Assist in the Design of Marine Protected Areas: A Case Study of the Encounter Region, South Australia. Presented at SSC 2003. Inaugural conference of the Spatial Sciences Institute of Australia. Canberra, Australia, 23-25 September, 2003.
Gerner, D.B. and Bryan, B.A. (2003b). Representative Marine Protected Area Selection: Setting Priorities Using Spatial Information Technology. In C.D. Woodroffe and R.A. Furness (Eds.) CoastalGIS 2003: An integrated approach to Australian coastal issues. Wollongong Papers on Maritime Policy, 14: 415-430.
GHD (1999). Salinity Impact Study. Final Report to the Murray-Darling Basin Commission. Gutteridge, Haskins and Davey Pty. Ltd. A.C.N. 008 488 373. Ref. No. 311/1048/06/00.
Giller, P.S. (1984). Community Structure and the Niche. Chapman and Hall, London.
Gilpin, M.E. and Soule, M.E. (1986). Minimum viable populations process of species extinction. In: M.E. Soule (ed). Conservation Biology: The Science of Scarcity and Diversity, Sinauer Associates, Sunderland, Massachusetts, 19-34.
Good, M. (1994). A revegetation strategy for the Murray Mallee District. Primary Industries SA.
Greiner, R. (1999) An Integrated Modelling System for Investigating the Benefits of Catchment Management. Environment International 25 (6-7), 725-734.
Greiner, R. (2004) Systems Framework for Regional-Scale Integrated Modelling and Assessment. Mathematics and Computers in Simulation 64 (1), 41-51.
Greiner, R. and Cacho, O. (2001) On the Efficient Use of a Catchment's Land and Water Resources: Dryland Salinization in Australia. Ecological Economics 38 (3), 441-458.
Haight, R.G., ReVelle, C.S. and Snyder, S.A. (2000). An integer optimisation approach to a probabilistic reserve site selection problem. Operations Research 48 (5), 697-708.
Hajkowicz, S., Perraud, J-M., De-Rose, R., Austin, J. and Dawes, W. (2003). The Strategic Landscape Investment Model. Final Report for the NSW Department of Sustainable Natural Resources. CSIRO Land and Water Report No. S/03/378.
CSIRO Land and Water Page 173
Hajkowicz, S., Young, M., Wheeler, S., Hatton MacDonald, D. and Young, D. (2000). Supporting Decisions: Understanding Natural Resource Management Assessment Techniques. A Report to Land and Water Australia. CSIRO Land and Water.
Hanski, I. (1994). Patch-occupancy dynamics in fragmented landscapes. Trends in Ecology and Evolution, 9, 131-5.
Harris, G. (2002), Integrated Assessment and Modeling – Science for Sustainability. In Costanza, R. and Jorgensen, S. E. Understanding and Solving Environmental Problems in the 21st Century: Toward a New, Integrated Hard Problem Science. Elsevier Science, pgs 5-17.
Hatton MacDonald, D. and Morrison, M. (2005). The Value of habitat and Agriculture. CSIRO Land and Water Client Report No. S/04/1017.
Heathcote, R. (1999). Carbon Credits and Carbon Trading. The Australian New Crops Newsletter. Issue No 11, January 1999.
Hill, M.J., Braaten, R., Veitch, S.M., Lees, B.G. and Sharma, S. (2005). Multi-criteria decision Analysis in Spatial Decision Support: The ASSESS Analytic hierarchy process and the Role of Quantitative methods and Spatially Explicit Analysis. Environmental Modelling and Software 20, 955-976.
Hobbs, R.J. (1993). Can revegetation assist in the conservation of biodiversity in agricultural areas? Pacific Conservation Biology 1 (1), 29-38.
Hobbs, T. and Bennell, M. (2005). Plant Biometrics and Biomass Productivity in the River Murray Dryland Corridor. A Report for the SA Centre for Natural Resource Management. Florasearch Project/SA Department of Water, Land and Biodiversity Conservation/Cooperative research Centre for Plant-based Management of Dryland Salinity.
Howard, B. and Olszak, C. (2004). Fuelling Landscape Repair: A Bioenergy Industry as a Sustainable Land-use and Energy Option for Australia. A Report Prepared for the Australian Conservation Foundation and Joint Venture Agroforestry Program, with the Assistance of the Myer Foundation. RIRDC Publication No 04/098. RIRDC Project No URS-1A.
Howard, P.C., Viskanic, P., Davenport, T.R.B., Kigenyi, F.W., Baltzer, M., Dickinson, C.J., Lwanga, J.S., Matthews, R.A., Balmford, A. (1998). Complementarity and the use of indicator groups for reserve selection in Uganda. Nature 394 (6692), 472-475.
INRM Group. (2003a). Integrated Natural Resource Management Plan for the South Australian Murray-Darling Basin. The Integrated Natural Resource Management Group for the South Australian Murray-Darling Basin Inc.
INRM Group. (2003b). Investment Strategy from 2003/04 to 2005/06. The Integrated Natural Resource Management Group for the South Australian Murray-Darling Basin Inc.
INRM Group. (2003c). INRM Investment Strategy Phase 2 2004/05 to 2008/09. The Integrated Natural Resource Management Group for the South Australian Murray-Darling Basin Inc.
Ive, J. and Abel, N.O. (2001). Preliminary Cost-Benefit Analysis of Restoration Options. CSIRO Land and Water Report No. HL 5-01.
Jacobson, M. (1998). Comparing Values of Timber Production to Agricultural Crop Production. University of Florida.
Jankowski, P. (1995). Integrating Geographical Information Systems and Multiple Criteria Decision-making Methods. International Journal of Geographical Information Systems 9 (3), 251-273.
JANIS (1997). Nationally agreed criteria for the establishment of a comprehensive, adequate and representative reserve system for forests in Australia. Joint ANZECC/MCFFA National

CSIRO Land and Water Page 174
Forest Policy Statement Implementation Sub-committee. National forest conservation reserves: Commonwealth proposed criteria. Commonwealth of Australia, Canberra.
Kahrimanis, M.J., Carruthers, S., Oppermann, A. and Inns, R. (2001). Biodiversity Plan for the South Australian Murray-Darling Basin. Department for Environment and Heritage, South Australia.
Khanna, M., Yang, W.H., Farnsworth, R., and Onal, H. (2003) Cost-Effective Targeting of Land Retirement to Improve Water Quality With Endogenous Sediment Deposition Coefficients. American Journal of Agricultural Economics 85 (3), 538-553.
Kingsland, S. (2002). Creating a science of nature reserve design: perspectives from history. Environmental Modeling and Assessment 7 (1), 61 -69.
Kirkpatrick, J.B. (1983). An iterative method for establishing priorities for the selection of nature reserves: an example from Tasmania. Biological Conservation 25 (2), 127 -134.
Knight, J.H., Gilfedder, M. and Walker, G.R. (2002). Impact of irrigation and dryland development on groundwater discharge to rivers: a unit response approach to cumulative impact analysis. CSIRO Land and Water Technical Report 3/02, Second Edition. 23p.
Lambeck, R.J. (1997). Focal species; a multi-species umbrella for nature conservation. Conservation Biology, 11, 849-56.
Lane, B. (2004). Warning on carbon trading. The Australian. December 28, 2004.
Levin, S.A. (1974). Dispersion and population interactions. American Naturalist, 108, 207-28.
Lindenmayer, D.B. and Possingham, H.P. (1996). Modelling the inter-relationship between habitat patchiness, dispersal capability and metapopulation persistence of the endangered species, Leadbeater’s possum, in South-eastern Australia. Landscape Ecology, 11, 79-105.
Lindenmayer, D.B., Manning, A.D., Smith, P.L., Possingham, H.P., Fischer, J., Oliver, I. and McCarthy, M.A. (2002). The focal-species approach and landscape restoration: a critique. Conservation Biology 16 (2), 338 -345.
Loehle, C. (1999). Optimizing wildlife habitat mitigation with a habitat defragmentation algorithm. Forest Ecology & Management 120 (1-3), 245-251.
Lu, H., Moran, C.J., Prosser, I.P., and Derose, R. (2004) Investment Prioritization Based on Broadscale Spatial Budgeting to Meet Downstream Targets for Suspended Sediment Loads - Art. No. W09501. Water Resources Research 40 (9), 9501.
MacArthur, R.H. and Wilson, E.O. (1967). The Theory of Island Biogeography. Princeton University Press, Princeton, New Jersey, USA.
Maddock, A. and du Plessis, M.A. (1999). Can species data only be appropriately used to conserve biodiversity? Biodiversity and Conservation 8 (5), 603-615
Malczewski, J. (1999). GIS and Multicriteria Decision Analysis. John Wiley & Sons Inc, Canada.
Margules, C.R., Nicholls, A.O. and Pressey, R.L. (1988). Selecting networks of reserves to maximise biological diversity. Biological Conservation 43 (1), 63-76.
Margules, C.R. and Pressey, R.L. (2000). Systematic conservation planning. Nature 405 (6783), 243-253.
Margules, C.R., Pressey, R.L. and Williams, P.H. (2002). Representing biodiversity: data and procedures for identifying priority areas for conservation. Journal of Bioscience 27 (4, s2), 309-326.
McDonnell, M.D., Possingham, H.P., Ball, I.R. and Cousins, E.A. (2002). Mathematical methods for spatially cohesive reserve design. Environmental Modeling and Assessment 7(2), 107-114.
CSIRO Land and Water Page 175
McIntyre, S. and Hobbs, R. (1999). A framework for conceptualizing human effects on landscapes and its relevance to management and research models. Conservation Biology 13 (6), 1282-1292.
McIntyre, S. and Hobbs, R. (2000). Human impacts on landscapes: Matrix condition and management priorities. In: J.L. Craig, N. Mitchell and D.A. Saunders (eds), Nature Conservation 5: Conservation in Production Environments: Managing the Matrix, Surrey Beatty & Sons, Sydney. 301-7.
McKenna, C.K. (1980). Quantitative methods for public decision making. McGraw Hill, New York.
MDBC. (2001). Basin Salinity Management Strategy 2001-2015. Murray-Darling Basin Commission, Commonwealth of Australia.
MDBMC 1999. The Salinity Audit of the Murray-Darling Basin: A 100 year perspective. Murray-Darling Basin Ministerial Council.
Meurk, C.D. and Swaffield, S.R. (2000). A landscape ecological framework for indigenous regeneration in rural New Zealand-Aotearoa. Landscape & Urban Planning 50 (1-3), 129-144.
Moritz, K and Moss, G. (2003). Regional Native Vegetation Conservation Strategy, Kangaroo Island, South Australia. Department for Environment and Heritage, South Australia.
Murray Mallee Local Action Planning Association Inc (2001) Murray Mallee Revegetation Plan. Murray Mallee Local Action Planning Association Inc.
Newbold, S.C. and Weinberg, M. (2003). Wetlands, Wildlife and Water Quality: Targeting and Trade offs. In the American Agricultural Economics Association Annual Meeting, Montreal, Canada, July 27-30, 2003.
Nix, H.A. (1986). A biogeographic analysis of the Australian elapid snakes. In: Longmore, R., (Ed.), Atlas of Elapid Snakes 7. Australian Government Publishing Service: Canberra.
Noss, R.F., Strittholt, J.R., Vance-Borland, K., Carroll, C., and Frost, P. (1999) A Conservation Plan for the Klamat-Siskiyou Ecoregion. Natural Areas Journal 19 (4), 392-411.
Oliver, I. (2003). Maximising your Biodiversity Benefits Index: A pocket guide for landholders. NSW Department of Infrastructure, Planning and Natural Resources, Parramatta.
Oliver, I., Holmes, A., Dangerfield, J.M., Gillings, M., Pik, A.J., Britton, D.R., Holley, M., Montgomery, M.E., Raison, M., Logan, V., Pressey, R.L., and Beattie, A.J. (2004) Land Systems as Surrogates for Biodiversity in Conservation Planning. Ecological Applications 14 (2), 485-503.
Palik, B.J., Goebel, P.C., Kirkman, L.K. and West, L. (2000). Using landscape hierarchies to guide restoration of disturbed ecosystems. Ecological Applications 10 (1), 189-202.
Parker, P., Letcher, R., Jakeman, A., Beck, M.B., Harris, G., Argent, R.M., Hare, M., Voinov, A., Janssen, M., Sullivan, P., Scoccimarro, M., Friend, A.,Sonnenshein, M., Barker, D., Matejicek, L., Odulaja, D., Deadman, P. , Lim, K., Larocque, G., Tarikhi, P., Fletcher, C., Put, A., Maxwell, T., Charles, A., Breeze, H., Nakatani, N., Mudgal, S., Naito, W., Osidele, O., Eriksson, I., Kautsky, U., Naeslund, B., Kumblad, L., Park, R., Maltagliati, S., Girardin, P, Rizzoli, A., Mauriello, D. Hoch, R., Pelletier, D., Reilly, J., Olafsdottir, R., Bin, S. (2002). The Potential for Integrated Assessment and Modelling to Solve Environmental Problems: Vision, Capacity, and Direction. In Costanza, R. and Jörgensen, S.E., (eds.), Understanding and solving environmental problems in the 21st Century. Toward a new, integrated hard problem science. Elsevier Science Ltd. pp. 19-39.
Parkes D., Newell G. and Cheal D. (2003). Assessing the quality of native vegetation: The Habitat Hectares approach. Ecological Management and Restoration, 4 (supplement), S29-S38.
CSIRO Land and Water Page 176
Perry, L.M., Bryan, B.A. and Crossman, N.D. (in review). CREDOS: A Conservation Reserve Evaluation and Design Optimisation System. Submitted to Environmental Modelling and Software, September 2004.
Peterken, G.F. (2000). Rebuilding networks of forest habitats in lowland England. Landscape Research 25 (3), 291-303.
PIRSA (2001) Berri Barmera Revegetation and Vegetation Guidelines. Berri Barmera Local Action Planning.
PIRSA. (1999). Revegetation: It’s role in the South Australian Region of the Murray – Darling Basin. Murraylands Local Government Association.
Possingham, H.P. (2001). The Business of Biodiversity: Applying Decision Theory Principles to Nature Conservation. The Australia Conservation Foundation, Earthwatch Institute.
Possingham, H. Andelman, S.J., Noon, B.R., Trombulak, S., and Pulliam, H.R. (2001). Making smart conservation decisions. Pages 225-244 in M.E. Soulé and G.H. Orians, (Eds). Conservation Biology: Research Priorities for the Next Decade. Island Press, Washington, D.C.
Possingham, H.P., Ball, I. and Andelman, S. (2000). Mathematical methods for identifying representative reserve retworks. In: Ferson, S., Burgman M., (Eds.), Quantitative Methods for Conservation Biology. Springer-Verlag: New York.
Prato, T. (1999) Multiple Attribute Decision Analysis for Ecosystem Management. Ecological Economics 30 (2), 207-222.
Pressey, R.L. (2004) Conservation Planning and Biodiversity: Assembling the Best Data for the Job. Conservation Biology 18 (6), 1677-1681.
Pressey, R.L., Humphries, C.J., Margules, C.R., Vane-Wright, R.I. and Williams, P.H. (1993). Beyond opportunism: key principles for systematic reserve selection. Trends in Ecology and Evolution 8 (4), 124-129.
Pressey, R.L., Johnson, R.I. and Wilson, P.D. (1994). Shades of irreplaceability: towards a measure of the contribution of sites to a reservation goal. Biodiversity and Conservation 3 (3), 242-262.
Pressey, R.L. and Nicholls, A.O. (1989). Efficiency in conservation evaluation: scoring versus iterative approaches. Biological Conservation 50 (1-4), 199-218.
ReVelle, C.S., Williams, J.C. and Boland, J.J. (2002). Counterpart models in facility location science and reserve selection science. Environmental Modeling and Assessment 7 (2), 71-80.
RMCWMB (2003). Catchment Water Management Plan for the River Murray in South Australia. River Murray Catchment Water Management Board.
Rodrigues, A.S.L. and Gaston, K.J. (2002). Optimisation in reserve selection procedures-why not? Biological Conservation 107(1), 123-129.
Rodrigues, A.S.L., Orestes Cerdeira, J. and Gaston, K.J. (2000). Flexibility, efficiency, and accountability: adapting reserve selection algorithms to more complex conservation problems. Ecography 23 (5), 565-574.
Rozakis, S., Soldatos, P.G., Kallivroussis, L. and Nicolaou, I. (2001). Multiple Criteria Analysis of Bio-energy Projects: Evaluation of Bio-Electricity Production in Farsala Plain, Greece. Journal of Geographic Information and Decision Analysis 5 (1), 49-64.
Sadras, V. (2004). Development of multi-purpose biomass industries for the South Australian Murray Mallee – Project Phase 1. CSIRO Land and Water Client Report.
CSIRO Land and Water Page 177
Saetersdal, M., Line, J.M. and Birks, H.J.B., (1993). How to maximize biological diversity in nature reserve selection: vascular plants and breeding birds in deciduous woodlands, Western Norway. Biological Conservation 66 (2), 131-138.
Salt, D., Lindenmayer, D.B., and Hobbs, R.J. (2004). Trees and Biodiversity: A Guide for Improving Biodiversity Outcomes in Tree Plantings on Farms. RIRDC, Canberra.
Santelmann, M.V., White, D., Freemark, K., Nassauer, J.I., Eilers, J.M., Vache, K.B., Danielson, B.J., Corry, R.C., Clark, M.E., Polasky, S., Cruse, R.M., Sifneos, J., Rustigian, H., Coiner, C., Wu, J., and Debinski, D. (2004) Assessing Alternative Futures for Agriculture in Iowa, Usa. Landscape Ecology 19 (4), 357-374.
Saunders, D.A., Hobbs, R.J. and Margules, C.R. (1991). Biological consequences of ecosystem fragmentation: a review. Conservation Biology, 5, 18-32.
Scott, T.A., Wehtje, W. and Wehtje, M. (2001). The need for strategic planning in passive restoration of wildlife populations. Restoration Ecology 9 (3), 262-271.
Seppelt, R. and Voinov, A. (2002) Optimization Methodology for Land Use Patterns Using Spatially Explicit Landscape Models. Ecological Modelling 151 (2-3), 125-142.
Seppelt, R. and Voinov, A. (2004). Landscape Optimization: Applications of a Spatial Ecosystem Model. In Costanza, R. and Voinov, A. (Eds). Landscape Simulation Modelling. A Spatially Explicit, Dynamic Approach. 301-326. Springer-Verlag, New York.
Sieg, C.H., Flather, C.H. and McCanny, S. (1999). Recent biodiversity patterns in the Great Plains: Implications for restoration and management. Great Plains Research 9 (2), 277-313.
Simberloff, D. (1998). Flagships, umbrellas, and keystones: is single-species management passé in the landscape era? Biological Conservation 83, 247-257.
SKM (2001). A Review of the Viability of Cogeneration in Australia. Commonwealth Department of Industry, Science and Resources. Sinclair Knight Merz. Australian EcoGeneration Association.
Taylor, P.D., Fahrig, L., Henein, K. and Merriam, G. (1993). Connectivity is a vital element of landscape structure. Oikos, 68, 571-2.
Turner, B.J., Chikumbo, O., and Davey, S.M. (2002) Optimisation Modelling of Sustainable Forest Management at the Regional Level: an Australian Example. Ecological Modelling 153 (1-2), 157-179.
Underhill, L.G. (1994). Optimal and suboptimal reserve selection algorithms. Biological Conservation. 70 (1), 85–87.
Wang, D.H. and Medley, K.E. (2004) Land Use Model for Carbon Conservation Across a Midwestern Usa Landscape. Landscape and Urban Planning 69 (4), 451-465.
Wang, E. Schultz, T., Miles, M.W., Cook, P.G., Maschmedt, D., Munday, T., Leaney, F., Walker, G.R. and Barnett, S.R. (2005). Targeting Dryland Areas in the Mallee for Controlling Groundwater Recharge and Saline Discharge to the Murray River. CSIRO Land and Water.
Ward, J. and Connor, J.D. (2004). Evaluation of options for recharge credit trade in the Bet Bet Creek Catchment, Victoria. Commonwealth MBI Pilot Project: Dryland Salinity Recharge Credit Trade, Milestone 4 Report, CSIRO Land and Water Report No. S/04/903.
Ward, J. and Trengove, G. (2004). Developing re-vegetation strategies by identifying biomass based enterprise opportunities in the mallee areas of South Australia. SA DWLBC and CSIRO “Water for a Healthy Country” project. Milestone 1 Report. CSIRO Land and Water Report No. S/04/1161.
Weber, T. and Wolf, J. (2000). Maryland's green infrastructure: using landscape assessment tools to identify a regional conservation strategy. Environmental Monitoring and Assessment 63 (1), 265-277.

CSIRO Land and Water Page 178
Webster, A.L. (1995), Applied Statistics for Business and Economics. Richard D. Irwin Inc.
Wessels, K.J., Freitag, S. and van Jaarsveld, A.S. (1999). The use of land facets as biodiversity surrogates during reserve selection at a local scale. Biological Conservation 89 (1), 21-38.
Wickham, J.D., Jones, K.B., Riitters, K.H., Wade, T.G. and O'Neill, R.V. (1999). Transitions in forest fragmentation: implications for restoration opportunities at regional scales. Landscape Ecology 14 (2), 137-145.
Williams, J.C. and ReVelle, C.S. (1996). A 0-1 programming approach to delineating protected reserves. Environment and Planning B 23 (5), 607-624.
Williams, P. and Young, M. (1999). Costing Dust: How Much Does Wind Erosion Cost the People of South Australia? Policy and Economic Research Unit, CSIRO Land and Water.
Willis, D. and Johnson, A. (2004). How to Pay for a Drain: The South Australian Biodiversity Trading Arrangement. 1st National Salinity Engineering Conference. 9-12 Nov 2004, Perth, Western Australia.
Williams, Huang and Cherry (2004). Regional NAP – North Central CMA Targeted Plantings for Salinity and Water Quality Control. PIRVic Research Report.
Related Documents