This report may be used, in whole or in part, as the basis for development of clinical practice guidelines and other quality enhancement tools, or a basis for reimbursement and coverage policies. AHRQ or U.S. Department of Health and Human Services endorsement of such derivative products may not be stated or implied. AHRQ is the lead Federal agency charged with supporting research designed to improve the quality of health care, reduce its cost, address patient safety and medical errors, and broaden access to essential services. AHRQ sponsors and conducts research that provides evidence-based information on health care outcomes; quality; and cost, use, and access. The information helps health care decisionmakerspatients and clinicians, health system leaders, and policymakers make more informed decisions and improve the quality of health care services.

Welcome message from author
This document is posted to help you gain knowledge. Please leave a comment to let me know what you think about it! Share it to your friends and learn new things together.
Transcript

This report may be used, in whole or in part, as the basis for development of clinical practice guidelines and other quality enhancement tools, or a basis for reimbursement and coverage policies. AHRQ or U.S. Department of Health and Human Services endorsement of such derivative products may not be stated or implied. AHRQ is the lead Federal agency charged with supporting research designed to improve the quality of health care, reduce its cost, address patient safety and medical errors, and broaden access to essential services. AHRQ sponsors and conducts research that provides evidence-based information on health care outcomes; quality; and cost, use, and access. The information helps health care decisionmakers�patients and clinicians, health system leaders, and policymakers�make more informed decisions and improve the quality of health care services.

Systematic Evidence Review Number 18 Counseling to Promote a Healthy Diet Prepared for: Agency for Healthcare Research and Quality U.S. Department of Health and Human Services 2101 East Jefferson Street Rockville, MD 20852 http://www.ahrq.gov Contract No. 290-97-0011 Task No. 3 Technical Support of the U.S. Preventive Services Task Force Prepared by: Research Triangle Institute/University of North Carolina 3040 Cornwallis Road PO Box 12194 Research Triangle Park, NC 27709 Alice Ammerman, Dr.P.H., R.D. Michael Pignone, M.D., M.P.H. Louise Fernandez, PA-C, R.D., M.P.H. Kathleen Lohr, Ph.D. Alissa Driscoll Jacobs, M.S., R.D. Carla Nester, M.D. Tracy Orleans, Ph.D. Nola Pender, Ph.D. Steven Woolf, M.D., M.P.H. Sonya F. Sutton, B.S.P.H Linda J. Lux, M.P.A. Lynn Whitener, Dr.P.H., M.S.L.S. April 2002

Preface
The Agency for Healthcare Research and Quality (AHRQ) sponsors the development of Systematic Evidence Reviews (SERs) through its Evidence-based Practice Program. With guidance from the third U.S. Preventive Services Task Force∗ (USPSTF) and input from Federal partners and primary care specialty societies, two Evidence-based Practice Centers�one at the Oregon Health Sciences University and the other at Research Triangle Institute-University of North Carolina�systematically review the evidence of the effectiveness of a wide range of clinical preventive services, including screening, counseling, immunizations, and chemoprevention, in the primary care setting. The SERs�comprehensive reviews of the scientific evidence on the effectiveness of particular clinical preventive services�serve as the foundation for the recommendations of the third USPSTF, which provide age- and risk-factor-specific recommendations for the delivery of these services in the primary care setting. Details of the process of identifying and evaluating relevant scientific evidence are described in the �Methods� section of each SER. The SERs document the evidence regarding the benefits, limitations, and cost-effectiveness of a broad range of clinical preventive services and will help to further awareness, delivery, and coverage of preventive care as an integral part of quality primary health care. AHRQ also disseminates the SERs on the AHRQ Web site (http://www.ahrq.gov/uspstfix.htm) and disseminates summaries of the evidence (summaries of the SERs) and recommendations of the third USPSTF in print and on the Web. These are available through the AHRQ Web site (http://www.ahrgq.gov/uspstfix.htm), through the National Guideline Clearinghouse (http://www.ncg.gov), and in print through the AHRQ Publications Clearinghouse (1-800-358-9295). We welcome written comments on this SER. Comments may be sent to: Director, Center for Practice and Technology Assessment, Agency for Healthcare Research and Quality, 6010 Executive Blvd., Suite 300, Rockville, MD 20852. Carolyn Clancy, M.D. Robert Graham, M.D. Acting Director Director, Center for Practice and Agency for Healthcare Reseach and Quality Technology Assessment Agency for Healthcare Research and Quality
∗ The USPSTF is an independent panel of experts in primary care and prevention first convened by the U.S. Public Health Service in 1984. The USPSTF systematically reviews the evidence on the effectiveness of providing clinical preventive services--including screening, counseling, immunization, and chemoprevention--in the primary care setting. AHRQ convened the third USPSTF in November 1998 to update existing Task Force recommendations and to address new topics.

Abstract
i
Abstract
Context: Diseases associated with overeating, undereating, and dietary or nutritional imbalance
rank among the leading causes of illness and death in the United States. The relationships
between specific dietary elements and specific health outcomes have been widely researched and
are reasonably well understood; similarly, the role of primary care providers in providing or
arranging for dietary counseling has been extensively investigated, but controversy exists about
the magnitude of change than can be achieved and the effectiveness of different counseling
strategies.
Objective: To update the chapter from the 1996 Guide to Clinical Preventive Services
examining the effectiveness of counseling to promote a healthy diet and to assist the US
Preventive Services Task Force in making recommendations on this topic.
Design and Data Sources: To produce this systematic evidence review, we developed an
analytic framework and 7 key questions that represent the logical chain between dietary
counseling (especially about intake of total and saturated fat, fruits and vegetables, and fiber) and
health practices and outcomes, together with linkages between diet and nutritional constituents
and health outcomes for a wide array of disorders (e.g., cardiovascular disease, cancer). To
supplement citations from the 1996 Guide, we sought studies examining the effectiveness of
dietary assessment and counseling using searches of MEDLINE for publications appearing from
1966 to 2000, by combining Medical Subject Headings related to diet and nutrition, primary care
settings and practices, and counseling. We supplemented these searches with searches of the
Cochrane Collaboration database and various bibliographies for recent systematic reviews and

Abstract
ii
meta-analyses on the link between dietary patterns and health outcomes or between counseling
and dietary behaviors.
Study Selection: To examine the relationship with diet and health outcomes, we selected
systematic reviews, observational studies, and randomized trials relating specific dietary patterns
and health outcomes. For studies of dietary assessment, we selected studies that examined test
accuracy compared with a criterion standard. For studies linking counseling interventions with
dietary change, we selected randomized controlled trials with pre- and post-test measures.
Data Extraction: Trained reviewers and the authors abstracted data from the eligible articles
onto evidence tables; the first authors checked all abstractions.
Data Synthesis: The relationships between dietary patterns and health outcomes have been
examined in a wide range of observational studies. Few randomized trials have examined the
effect of dietary interventions on health outcomes. The majority of studies show that persons
consuming diets high in fruits, vegetables, fish, and whole grains or fiber and low in saturated
and trans-unsaturated fats have lower rates of coronary heart disease and some forms of cancer.
Similarly strong evidence supports the relationship between dietary intake of calcium and the
risk of low bone mineral density. High intake of dietary sodium and low intake of dietary
potassium are associated with higher blood pressure levels and increased incidence of
hypertension. Efforts to reduce sodium intake and increase potassium have shown moderate
effects on blood pressure, with greater effects seen in African-Americans and persons with
hypertension.

Abstract
iii
Several brief, valid dietary assessment instruments are feasible for the primary care setting.
Although these instruments have not been evaluated as to their impact on health outcomes, they
serve an important role of identifying dietary counseling needs and monitoring change over time.
Many of these instruments are designed for specific patient populations or nutrients.
We identified 33 articles examining the effect of nutritional counseling in primary care
patients. Among primary care patients, nutrition counseling can produce modest improvements
in saturated and total fat consumption, as well as fruit and vegetable consumption. The evidence
is insufficient to determine the effectiveness of counseling in changing consumption of whole
grains or fiber, calcium, sodium, or fish. Intensive interventions are more likely to produce large
changes, but typical strategies pursued in primary care settings tend to be of lower intensity and
produce smaller changes. Interventions using mailed or computer-generated materials appeared
moderately effective, particularly in increasing fruit and vegetable consumption. Isolating the
effect of a single counseling approach as more or less effective is made difficult by the tendency
for counseling interventions to test multiple approaches simultaneously. Studies employing 3 or
more well-proven counseling elements were more effective than those employing fewer
elements.
Conclusions: Diets low in saturated and trans-unsaturated fat and high in fruits, vegetables, fish,
and whole grains are associated with better health outcomes. Counseling patients can improve
dietary behaviors, including reduction in dietary total and saturated fat and increases in fruit and
vegetable intake. More intensive counseling and counseling directed to higher-risk patients have
generally produced larger changes than less intensive interventions delivered to low-risk
populations.

Table of Contents
iv
Table of Contents
Abstract .................................................................................................................................. i List of Tables and Figures................................................................................................................v I. Introduction..........................................................................................................................1 II. Methods................................................................................................................................3 Analytic Framework and Key Questions.............................................................................3 Literature Search and Analysis Strategy..............................................................................4 Inclusion and Exclusion Criteria..............................................................................5 Literature Synthesis .................................................................................................5 Preparation of Systematic Evidence Review .......................................................................7 III. Results ..................................................................................................................................9 Key Question No. 1: Relationship Between Dietary Patterns and Health Outcomes.........9 Effects of Diets High in Fat Intake ........................................................................10 Effects of Diets High in Cholesterol ......................................................................14 Effects of Diets High in Fruits and Vegetables, Including Vegetarian Diets .......15 Effects of Legumes (Beans, Peas, and Nuts) on CHD...........................................20 Effects of Diets High in Whole Grains and Fiber..................................................21 Effects of Diets High in Fish or Fish Oils on CHD ...............................................24
Effects of Dietary Sodium on Blood Pressure .......................................................25 Effects of Dietary Potassium on Blood Pressure ...................................................29 Effects of Dietary Calcium ....................................................................................30 Other Dietary Elements..........................................................................................31 Special Populations................................................................................................32 Summary of the Evidence Regarding the Relationship Between Diet and Health
Outcomes ...............................................................................................................33 Key Question No. 2: Valid, Feasible Tools for Assessment of Dietary Risk and
Patterns...............................................................................................................................33 Assessment of Eating Patterns and Nutritional Factors in Selected Age
Groups....................................................................................................................34 Mediators of Dietary Change.................................................................................38 Food Insecurity and Hunger...................................................................................38 Key Question No. 3: Adverse Effects of Dietary Assessment...........................................39 Key Question No. 4: Efficacy of Primary Care Counseling and Dietary Behavior Change
Interventions ......................................................................................................................40 Impact of Dietary Counseling................................................................................40 Effect of Counseling on Intake of Total and Saturated Fat ...................................43 Effect of Counseling on Fruit and Vegetable Intake .............................................44 Effect of Counseling on Fiber Intake.....................................................................45 Factors Affecting Response to Dietary Counseling...............................................46 Summary of the Effectiveness of Dietary Counseling...........................................54 Other Systematic Reviews Related to the Effectiveness of Dietary
Interventions ..........................................................................................................55 Interventions to Enhance Dietary Counseling Behaviors Among Physicians .......55 Key Question No. 5: Adverse Effects and Associated Costs of Behavioral Interventions
to Promote Healthy Diets...................................................................................................56

Table of Contents
v
Key Question No. 6: System Influences that Facilitate or Impede Dietary Intervention ............................................................................................................57
Key Question No. 7: Nutritional Supplementation...........................................................58 Issues Relating to Quality and Strength of Evidence in this Body of Literature...............59 IV. Discussion and Conclusions ............................................................................................122 The Link Between Dietary Patterns and Health Outcomes .............................................122 Dietary Assessment..............................................................................................123 Counseling ...........................................................................................................123 Impact of Counseling on Dietary Behaviors........................................................124 Research Needs................................................................................................................125 References....................................................................................................................................128 Glossary ................................................................................................................................61 List of Tables
Table 1. Dietary Assessment Tools......................................................................................63 Table 2. Potential Mediators of Dietary Change..................................................................68 Table 3. Articles Excluded for Review in this Report, by Author and Reason for
Exclusion................................................................................................................69 Table 4. Studies of Counseling to Reduce Dietary Fat ........................................................70 Table 5. Studies of Counseling to Increase Intake of Fruit or Vegetables: Study
Descriptions ...........................................................................................................88 Table 6. Studies of Counseling to Increase Intake of Fiber ...............................................100 Table 7. Relationship Between Level of Effect of Intervention and Risk Status of
Patients.................................................................................................................108 Table 8. Relationship Between the Amount of Change in Dietary Behavior and the
Intensity of the Intervention.................................................................................109 Table 9a. Combined Effect of Risk Status and Intensity on the Amount of Change in
Dietary Behavior: Fat...........................................................................................110 Table 9b. Combined Effect of Intensity of Intervention and Risk Status on the Amount
of Change in Dietary Behavior: Fruits and Vegetables ......................................111 Table 9c. Combined Effect of Intensity of Intervention and Risk Status on Patients on
the amount of Change in Dietary Behavior: Fiber..............................................112 Table 10a. Studies Documenting the Relationship Between the Amount of Change in
Dietary Behavior and Setting: Fat.......................................................................113 Table 10b. Studies Documenting the Relationship Between the Amount of Change in
Dietary Behavior and Setting: Fruits and Vegetables.........................................114 Table 10c. Studies Documenting the Relationship Between the Amount of Change in
Dietary Behavior and Setting: Fiber ....................................................................115 Table 11a. Intervention Components: Fat..............................................................................116 Table 11b. Intervention Components: Fruits and Vegetables................................................118 Table 11c. Intervention Components: Fiber ..........................................................................120 Table 12. Relationship Between the Number of Effective Intervention Elements and the
Change in Dietary Behavior.................................................................................121 Table 13. Summary of the Size and Quality of Bodies of Evidence on Key Questions......127

Table of Contents
vi
List of Figures
Figure 1. Counseling to Promote a Healthy Diet: Analytic Framework ................................8 Figure 2. Counseling Literature Search.................................................................................60

Chapter I. Introduction
1
Introduction
Diseases associated with dietary excess and imbalance rank among the leading causes of
illness and death in the United States. Major diseases in which diet plays a role include coronary
heart disease, some types of cancer, stroke, hypertension, obesity, osteoporosis, and non-insulin-
dependent diabetes mellitus. All are major causes of morbidity and mortality in this country.
Although diet is associated with multiple health outcomes, the relationships between
specific dietary elements and specific health outcomes have been studied extensively. The role
of the primary care provider in either providing direct diet counseling or enlisting the help of
other health professionals has been studied extensively, but controversy remains about the
effectiveness of different strategies. In �Evaluating Primary Care Behavioral Counseling
Interventions: An Evidence-based Approach,� Whitlock et al. described a detailed framework
for primary care counseling.1
To address the question of the role of diet in chronic disease as well as dietary assessment
and counseling in primary care, staff of the RTI � University of North Carolina Evidence-based
Practice Center undertook this systematic evidence review (SER) on behalf of the US Preventive
Services Task Force (USPSTF). It updates the chapter on dietary counseling from the second
edition of the Guide to Clinical Preventive Services.2 In 1996, the USPSTF had recommended
counseling adults and children over 2 years of age to limit intakes of fat and cholesterol, to
maintain caloric balance in diets, and to emphasize foods containing fiber; the Task Force
concluded then that the evidence was insufficient to recommend for or against counseling the
general population to reduce dietary sodium. The Task Force also concluded that evidence was
insufficient to show that nutritional counseling by physicians has any advantage over counseling

Chapter I. Introduction
2
by dietitians or community interventions.2 This SER enabled the USPSTF to reconsider the
issues it addressed in the mid-1990s and to make recommendations concerning ways to promote
healthy dietary practices in America.
Chapter II presents our conceptual framework and documents the literature search and
synthesis approaches used in the work. Chapter III, on results, is organized in 2 parts. In the
first part, we address the relationship between diet and health outcomes. In the second part, we
address issues relating to the effectiveness of interventions to change dietary patterns, with the
focus on dietary counseling. Chapter IV discusses these findings in more detail and presents our
views of the necessary future research agenda. Tables and figures appear at the end of the
chapters where they are first called out. Appendix A presents the acknowledgments for this
report.

Chapter II. Methods
3
Methods
Analytic Framework and Key Questions
Staff of the RTI-University of North Carolina Evidence-based Practice Center (RTI-UNC
EPC), together with 3 members of the US Preventive Services Task Force (USPSTF) who are
authors of this systematic evidence review (SER), developed an analytic framework to guide the
work of producing this systematic evidence review (Figure 1). It depicts the relationship
between diet and health, feasible dietary assessment strategies, evidence that dietary
interventions delivered through primary care are effective in promoting long- and short-term
behavior change, adverse effects associated with dietary assessment or intervention, and system
influences on the delivery of diet assessment and counseling.
To guide the work more precisely, we identified 7 key questions:
1. What is the relationship between dietary patterns and health outcomes?
2. What are valid, feasible tools for assessment of dietary risk?
3. What are the adverse effects of dietary assessment?
4. What is the efficacy of primary care counseling and dietary behavior change
interventions?
5. What are the adverse effects and associated costs of dietary behavior intervention?
6. Which of the following system influences facilitate or impede dietary intervention:
features of the health care team?
features of the practice setting?
features of the health care system?
7. Can dietary supplements improve nutrition in patients identified as undernourished?

Chapter II. Methods
4
Literature Search and Analysis Strategy
To identify studies examining the question of the relationship between diet and health, we
identified existing systematic reviews from MEDLINE, the Cochrane Database of Systematic
Reviews, and the University of York Database of Reviews of Effectiveness (DARE) from 1990
to the present; we did not conduct formal searches of the primary literature. When systematic
reviews were unavailable, we also included representative individual observational studies and
randomized trials.
To find articles relevant to the questions about dietary assessment and the effectiveness
of diet counseling in the primary care setting, we searched the MEDLINE database for citations
to articles published between 1966 and 2001. The information on searches provided below and
in Chapter III pertains to those key questions about dietary behavior interventions.
We employed the following Medical Subject Heading (MeSH) terms for the 3 main types
of searches (diet, primary care, and counseling):
• Diet: "diet," "nutrition," "food frequency," �food habits," "dietary assessment," "diet
records," "diet surveys," and "nutrition assessment�;
• Primary care: "family practice," "primary health care," "primary care setting";
• Counseling: "counseling," "dietary counseling" (textword), "diet counseling"
(textword), and "nutrition counseling (textword)."
We carried out additional searches to identify articles regarding brief dietary assessment
methodology and existing systematic reviews about dietary counseling interventions. We
reviewed bibliographies of pertinent articles and consulted with experts in the field to assure
completeness.

Chapter II. Methods
5
Inclusion and Exclusion Criteria
We limited all searches to "human" populations and "English language." For counseling
interventions, we restricted searches to randomized controlled trials (RCTs).
For the diet counseling literature related to patient dietary outcomes, we included articles
if they evaluated a nutrition intervention delivered to a primary care population either within a
primary care setting or after referral. We included studies that assessed impact on dietary change
among those at risk for chronic disease (e.g., elevated cholesterol). However, we excluded
studies of individuals with a diagnosed illness that (a) might directly affect their dietary intake
(e.g., cancer), (b) required a specialized diet (e.g., diabetes or renal disease), or (c) required entry
into the study immediately following a life-threatening, disease-related event (e.g., during
hospitalization for an acute myocardial infarction).
All included articles used a RCT design with baseline and follow-up measures of relevant
dietary outcomes. We excluded studies that reported physiologic measures or biomarkers
associated with dietary change (e.g., serum vitamin levels) but no direct measure of diet
behavior. We also did not use studies in which the diet was externally controlled (provided by
researchers or in a residential institution). To include a study we required that the retention rate
be at least 50% and that studies be at least 3 months in duration.
We retained studies evaluating physician training programs to improve physician
counseling practices if a control or comparison group was a part of the evaluation and if the
counseling approach tested was relevant to the primary care setting.
Literature Synthesis
Senior investigators reviewed titles and abstracts to identify which full manuscripts to
review and made the final decisions about inclusion or exclusion. Assisted by nutrition doctoral

Chapter II. Methods
6
students, they then reviewed individual articles and abstracted selected information onto
evidence tables. Reviewers discussed any disagreements; the senior investigators made the final
decisions.
We graded the quality of the articles, in terms of internal validity, as good or fair. We
judged studies to be fair or good quality based on allocation concealment, blinding of outcomes
assessment, and completeness of follow-up. Exclusion criteria eliminated articles that would be
considered of poor quality.
We classified each study as having low, medium, or high external validity based on
representativeness of the providers and patient population as well as feasibility of replicating the
intervention in a primary care setting without additional research infrastructure. Two senior
reviewers independently rated the intensity of the dietary intervention as low, medium, or high
based on the number and length of counseling contacts, the magnitude and complexity of
educational materials provided, and the use of supplemental intervention elements, such as
support groups sessions or cooking classes. Low-intensity interventions generally involved 1
contact lasting less than 30 minutes. High-intensity interventions involved greater than 6
contacts, each lasting at least 30 minutes. Medium intensity was in between low and high.
Given the wide range of measurement and reporting strategies and the need to facilitate
comparability across studies, we also classified the effect size achieved by each study. We
developed specific cutpoints to define 3 effect size categories, denoted large, medium, or small,
for dietary fat, fruit and vegetables, and fiber. For outcomes stated in percentage of calories
from total or saturated fat, we defined effect sizes as follows: large, >10% change in total fat or
>3% change in saturated fat; medium, >5% to 10% change in total fat or >1.3% to 3% change
in saturated fat; and small, 0% to 5% change in total fat or 0% to 1.3% change in saturated fat.

Chapter II. Methods
7
We classified fruit and vegetable intake effect sizes based on the following categories: large, ≥ 1
serving change; medium, 0.2 to 0.9 serving change; and small < 0.2 serving change. For fiber,
effect size definitions were as follows: large change, > 6 grams (g); medium change, 1 g to 6 g;
and small change, < 1 g. When studies used outcomes such as amounts of intake (e.g., grams of
fat), dietary risk scores, or changes in specific dietary behaviors, we classified effect size based
on the relative change (net change divided by baseline values in controls) and by our own
qualitative estimates; when the abstractors disagreed, they resolved the discrepancy by consensus
discussion.
Preparation of Systematic Evidence Review
The authors presented the work plan and interim portions of this SER at several USPSTF
meetings in 2000 and 2001; at those times the Task Force liaisons and the entire Task Force
could discuss and clarify the breadth of the work. In particular, Task Force members encouraged
the research staff to expand their examination and review of literature pertaining to linkages
between diet and health outcomes (i.e., Key Question No. 1) and provide much more detailed
data and analysis on the components of dietary intervention strategies than had originally been
planned. The senior author, who had primary responsibility for materials relating to issues of
counseling and dietary practices, also participated in teleconferences of the USPSTF Counseling
and Behavioral Intervention Work Group. The draft SER was circulated for outside peer review
in early June 2001 and revised appropriately for this final version.
Chapter III. Results
9
Results
We present here the results of our systematic review for the US Preventive Services Task
Force (USPSTF) of issues relating to promoting healthy diets; the chapter is organized in terms
of the key questions introduced in our analytic framework (Figure 1) and the text of Chapter II.
As explained in Chapter I, the first part of the results concerns the relationships between
numerous dietary constituents and a variety of important health outcomes. The remainder of the
chapter deals with questions about the efficacy or effectiveness of counseling activities to change
dietary behaviors for the better, including the availability of reasonably brief instruments to
assess dietary behaviors feasible for use in primary care settings and populations. Tables and
Figure 2 can be found at the end of the chapter. A glossary defining all abbreviations and
acronyms used in one or more of these tables is found just ahead of Table 1.
Key Question No. 1: Relationship Between Dietary Patterns and Health Outcomes
Our search of the Database of Reviews of Effectiveness for systematic reviews using the
key word "diet" produced 215 results. Through this search and subsequent targeted MEDLINE
searches, we identified 58 references on the diet-health relationship that we included in our final
review.
Eating habits over a lifetime can have a significant impact on the incidence and severity
of many health disorders. The complete body of literature regarding the health effects of foods is
beyond the scope of this report and has been the subject of extensive reviews.3
Chapter III. Results
10
A direct relationship exists between nutritional risk factors and certain key diseases. We
focus here on the relationship between several different dietary elements and the risk of
important health outcomes. When data on health outcomes are lacking but reasonable surrogate
measures exist, we examine the surrogate measures instead. For each dietary element, we first
consider the epidemiologic evidence regarding the association between that element and various
health studies. Next, we consider any studies that examine the effect of change consumption of
the dietary element and change in health states or a well-validated surrogate outcome. Another
USPSTF review will address the crucial question of the effect of diet on obesity.4
Effects of Diets High in Fat Intake
The effects of dietary fat intake, including the effect of changes in the subfractions of
saturated, polyunsaturated, and monounsaturated fats, have been examined in relation to a wide
range of health outcomes using a variety of study designs. Whether dietary goals should
recommend limiting total fat intake or should keep the total proportion of dietary fat constant
while changing the balance of subfractions remains a topic for substantial debate and research.
This debate has not been fully elucidated through research comparing the two approaches; its full
description is beyond the scope of this review.5 Nevertheless, we will attempt to summarize
current findings with respect to the relationship between dietary fat intake and important health
outcomes such as those relating to coronary heart disease (CHD), stroke, or cancer.
Dietary Fat and Coronary Heart Disease
Observational studies. Observational studies of the relationship between the level of
dietary saturated fat and the incidence of CHD and stroke have generally, but not always, found a
positive association.6 Much of this relationship appears to be mediated through total cholesterol
Chapter III. Results
11
(TC) and low-density lipoprotein (LDL) cholesterol levels, which are related to both dietary
saturated fat intake and the incidence of CHD events.7 A recent development is the greater
appreciation that another fat subtype, trans-unsaturated fats, which are commonly used in oils for
fried foods, is also associated with unhealthy lipid levels and an increased risk of heart disease.8,9
Effect of interventions to change dietary fat on CHD and stroke. Hooper et al.
reviewed the effect of dietary interventions to lower fat intake or the incidence of CHD.10 They
identified 26 randomized trials published through January 1999 that had been intended to modify
fat or cholesterol intake, were not multi-factorial, and lasted at least 6 months. Their overall
analysis found no effect on total mortality (relative risk [RR] 0.98; 95% confidence interval [CI],
0.86-1.12), a small, statistically nonsignificant effect on cardiovascular mortality (RR, 0.91; 95%
CI, 0.77-1.07), and a 16% reduction in total cardiovascular events (RR, 0.84; 95% CI, 0.72-
0.99). Most of the trials included patients with previous history of CHD; 2 included patients
without known CHD living in institutional settings and being fed controlled diets. The data were
insufficient to measure the effect of fat-restricted diets among free-living patients without
previous CHD.10
The best data about the effect of dietary counseling on CHD incidence in persons without
previously known CHD come from several large trials that addressed multiple CHD risk factors.
Ebrahim and Smith performed a systematic review and meta-analysis of 14 such trials of at least
6 months� duration, including 5 major trials examining efforts to prevent CHD events through
changes in dietary fat for high-risk patients with no previous history of CHD.11 The dietary
interventions were designed to improve serum lipid levels and reduce CHD events. Some of the
trials also provided smoking cessation counseling or hypertension treatment. The summary
effect on serum cholesterol was a reduction of 5.4 mg/dL (0.14 mmol/L), with a standard error of
Chapter III. Results
12
0.38 mg/dl, (0.01mmol/L). Overall, the interventions did not have a significant effect on total
mortality (odds ratio [OR], 0.97; 95% CI, 0.92-1.02), CHD mortality (OR, 0.96; 95% CI, 0.88-
1.04), or nonfatal myocardial infarctions (OR, 1.0; 95% CI, 0.92-1.07).
The combined estimates, however, obscure some of the heterogeneity among individual
trial results. The Oslo trial, in particular, tested a diet that reduced saturated fats and increased
polyunsaturated fats.12 The investigators found large reductions in total and LDL cholesterol,
increases in high density lipoprotein (HDL) cholesterol, and decreased CHD events among
patients assigned to the intervention. The patients in this trial, however, had very high
cholesterol levels (average total cholesterol at entry, 327 mg/dl) and consumed diets very
different from those consumed in the United States today. Hence, the results of the Oslo trial
may not generalize well to US populations. The Multiple Risk Factor Intervention Trial
(MRFIT) study in the United States did not find important reductions in CHD events, despite
intensive dietary counseling consisting of 10 weekly group sessions followed by individualized
counseling at least every 4 months thereafter.13
Dietary fat intake and CHD risk factors in children. The benefits of reduced dietary
fat intake during childhood are uncertain. Some observational evidence suggests that high
childhood serum lipid levels are associated with higher levels in adulthood, but the relationship
is imperfect.14 The effect of reducing dietary fat intake during childhood has been examined in a
large RCT involving children ages 8 to 10 years at enrollment with LDL levels between about
115 mg/dl and 165 mg/dl. Intervention patients received a diet providing 28% of energy from
total fat. Follow-up lasted a mean of 7.4 years.15 The 3-year intervention included 18 individual
and group sessions during the first year and 4 to 6 individual or group sessions in years 2 and 3,
with monthly telephone contacts between sessions. Patients receiving the intervention were able

Chapter III. Results
13
to reduce total fat intake by 2% to 4% and saturated fat intake by 1% to 2%. Patients had no
adverse changes in mean height, ferritin levels, body mass index (BMI), or selected
psychometric indices, but they also demonstrated little or no long-term change in serum
cholesterol levels: differences in LDL cholesterol were 3% to 4% at 1 year but only 1% to 2% at
the final follow-up visit.
Dietary Fat and Stroke
Gillman et al. examined the relationship between dietary fat intake and the risk of stroke
in men using data from the Framingham Heart Study.16 They found that increasing intake of
dietary total and saturated fat was associated with lower risk of ischemic stroke (RR, 0.85 [95%
CI, 0.78-0.94] for each 3% increase in total fat intake; RR, 0.91 [95% CI 0.85, 0.98] for each 1%
increase in saturated fat). Adjustment for potential confounders did not affect the results.
Insufficient data are available to examine the relationship among women.
Dietary Fat and Cancer
The relationship between dietary fat and cancer has been difficult to elucidate. Numerous
observational studies have examined the intake of dietary fats, including total fat and the
saturated and unsaturated subfractions, and different forms of cancer.17 Most analyses have
focused on the relationship between dietary fat and cancers of the prostate, breast, or colon. We
examine these relationships in some detail here, but a full review of the topic is beyond the scope
of this report.
Dietary fat and prostate cancer. Kolonel et al recently reviewed the relationship
between dietary fat and prostate cancer.18 They examined English language studies from
MEDLINE (search dates not reported) on the relationship between dietary fat (or fat-containing

Chapter III. Results
14
foods) and incidence or mortality from prostate cancer. Ecologic and case-control studies
generally supported a relationship between dietary total or saturated fat and prostate cancer;
cohort studies have had conflicting results.
Dietary fat and breast cancer. Hunter et al. performed a meta-analysis of 7 prospective
cohort studies (including more than 337,000 women) that examined the relationship between
dietary fat and breast cancer.19 They found no significant association between dietary fat
consumption and breast cancer (RR for highest versus lowest quartile, 1.05; 95% CI, 0.94-1.16).
The lack of association persisted even when the subgroup of women with very low intake (less
than 20% of calories from total fat) were compared with women in the highest quartile of intake.
Dietary fat and colon cancer. Some studies suggest that diets high in total fat increase
the risk of colorectal cancer: relative risks for cohort studies have ranged from 1.3 to 2.2.20
Animal fats seem to be most closely associated with risk. Other reviews have not identified a
relationship between dietary fat and colorectal cancer once the investigators controlled for total
caloric consumption.21
Effects of Diets High in Cholesterol
Dietary cholesterol intake appears to have at best modest effect on serum cholesterol
levels once fat intake has been controlled for. No evidence exists to determine if reducing
dietary cholesterol specifically reduces CHD events.22,23
Chapter III. Results
15
Effects of Diets High in Fruits and Vegetables, Including Vegetarian Diets
Vegetarian Diets
To examine the relationship between a vegetarian diet and multiple health outcomes, Key
et al. identified 5 large prospective cohort studies that drew their study populations from groups
known to have a high proportion of vegetarians, defined as persons who reported not eating fish
or meat.24 These 5 studies examined health outcomes for more than 76,000 persons ages 16 to
89 years over a mean of 10.6 years, including 27,000 vegetarians. Using a random effects model
meta-analysis to combine results from the 5 studies, they found that total mortality did not
clearly differ between vegetarians and nonvegetarians (RR for death among vegetarians, 0.95;
95% CI, 0.82-1.11). CHD mortality, however, was significantly lower among vegetarians (RR,
0.76; 95% CI, 0.62-0.94). The relative risk reduction was larger at younger ages and among
those following a vegetarian diet for more than 5 years. Risk reductions persisted after
adjustment for potential confounders of age, smoking status, alcohol use, education level,
exercise level, and body mass index. Summary risk ratios for death rates from colorectal, lung,
breast, or prostate cancer did not differ, although the total numbers of events were small enough
that excluding a modest protective effect with certainty was not possible. No effect was seen on
stroke mortality.
Effects of Fruits and Vegetables on CHD and Stroke
Numerous observational studies have examined the effect of diets high in fruit and
vegetables on CHD and stroke. Persons who report consuming high levels of fruits and
vegetables appear to have a lower risk of heart disease and stroke than those who consume few

Chapter III. Results
16
of these nutrients. The evidence from studies using the strongest design (cohort studies),
however, have found mixed results for CHD.
In a systematic review of observational studies published through 1995, Ness and Powles
examined the relationship between fruit and vegetable consumption and CHD or stroke.25 They
included studies that measured dietary intake directly and that examined the association between
fruit and vegetable consumption (or a nutritional surrogate) and CHD or stroke incidence.
Almost half (8 of 19) of the cohort or case-control studies examining the relationship
between fruit and vegetable consumption and CHD found a protective effect; most studies (6 of
9) examining stroke also found fruit and vegetable consumption protective. The authors did not
combine effect estimates because of the heterogeneity of study designs and effect sizes.
Inaccuracy and imprecision in measuring fruit and vegetable consumption may have hampered
estimating the true effect of fruits and vegetables on cardiovascular events. In addition,
separating the effect of fruits and vegetables from the impact of concurrent increases in dietary
fiber and reductions in saturated fat and perhaps total calories is difficult.25
Law and Morris performed a similar systematic review of cohort studies published
through 1996 that reported at least 50 CHD events;26 11 studies met their eligibility criteria.
They re-analyzed the data from these studies and expressed the results as the relative risk of
CHD for persons consuming fruits and vegetables at the 90th percentile compared with those the
10th percentile (about a 4-fold difference in consumption). They also examined several other
markers of fruit and vegetable consumption such as potassium intake, fruit or vegetable fiber
intake, or vitamin intake levels. The correlation among results was good regardless of how
intake was measured. The median effect after adjustment for potential confounders was about a
15% lower risk of CHD events.
Chapter III. Results
17
More recent cohort studies have found mixed results. Pietinen et al. studied 21,000 men
50 to 69 years of age enrolled in the Alpha Tocopherol, Beta-carotene Cancer Prevention
Study.27 Participants with high fruit and vegetable consumption (fourth and fifth quintiles) had
relative risks for coronary death 15% to 40% lower than those controls whose consumption fell
into the first or second quintiles of consumption over the 6-year study.
Mann et al. studied more than 10,000 British men and women ages 16 to 79 years who
had no previous CHD over a mean of 13 years to examine the effect of various dietary elements
on CHD death rates and total mortality.28 Dietary patterns were measured using a semi-
quantitative food frequency questionnaire administered at baseline. They found no protective
effect against CHD death or total mortality among persons consuming large amounts of fruits,
green vegetables, carrots, or dietary fiber. Increased consumption of dietary fat and cholesterol
were both associated with increased risk of CHD death but not total mortality.
Key et al. examined the effect of different dietary elements within a cohort of 10,000
health-conscious persons in the United Kingdom recruited from health food stores, vegetarian
societies, and magazines.29 Dietary assessment involved a brief questionnaire at baseline; a
subset of participants underwent a follow-up questionnaire to determine changes in dietary
patterns. Outcomes (mean follow-up, 17 years) were tracked through the British National Health
System. Mean age of the participants was 46 years; 43% were self-described vegetarians.
Persons who reported consuming fresh fruit daily had 20% to 25% lower rates of CHD death and
30% to 40% lower rates of stroke death than those consuming these foods less often than daily.
Total mortality was 20% to 25% lower as well. Raw salad consumption was associated with
lower risk of CHD death but not stroke death. Eating whole grain bread was associated with a
10% to 15% lower total mortality rate but did not have a significant effect on CHD death or

Chapter III. Results
18
stroke death. Reporting a vegetarian diet was not a significant predictor of decreased CHD
mortality.
Joshipura et al. examined the relationship between fruit and vegetable intake and the risk
of coronary heart disease using data from the Nurses' Health Study and the Health Professionals
Follow-up Study.30 They found, after adjustment for standard cardiovascular risk factors, that
subjects in the highest quintile of intake of fruits and vegetables (9 to10 servings per day) had a
relative risk of 0.80 (95% CI, 0.69-0.93) compared to those in the lowest quintile (2 to 3 servings
per day). Each difference of 1 serving per day of fruit or vegetable was associated with a relative
risk of 0.96 (95% CI, 0.94-0.99). The risk reduction was greater specifically for consumption of
leafy green vegetable (RR, 0.77; 95% CI, 0.64-0.93).
Effects of Fruits and Vegetables on Blood Pressure
Observational evidence. Ascherio et al. examined the relationship between fruit and
vegetable consumption and blood pressure in the Nurses� Health Study and found that fruit and
vegetable consumption was associated with lower systolic and diastolic pressures.31
Dietary intervention trials. A recent large randomized trial (Dietary Approaches to
Stop Hypertension [DASH]) examined the effect of a diet high in fruits and vegetables on blood
pressure among volunteer subjects over 13 weeks at 4 centers in the United States. By design, a
majority of the 412 participants (57%) was African-American; 57% were women; and the mean
age was 48 years.32 Patients were given specially prepared meals during the trial; this factor
may limit the generalizability of this study with respect changing behavior, but it allowed the
investigators to estimate ideal efficacy.
Eligible patients had a baseline systolic blood pressure between 120 and 159 mm Hg and
a diastolic blood pressure between 80 and 95 mmHg. Subjects were randomized to a diet high in

Chapter III. Results
19
fresh fruit and vegetables with typical dietary fat (35% total fat), a combination diet high in fresh
fruits and vegetables plus low in dietary total and saturated fat (25% total fat), or a control diet
for 13 weeks.
Compared to the blood pressures for controls, blood pressure was reduced most among
those consuming the combination diet (a 5 mm Hg overall reduction in systolic pressure, 11 mm
Hg reduction in hypertensive persons); smaller reductions were achieved for the increased fruit
and vegetable/usual fat diet (3 mm Hg overall, 7 mm Hg among hypertensives).32 Two older
trials that randomized patients to a vegetarian diet low in saturated fats found similar reductions
in systolic blood pressure.33,34
Effects of Fruits and Vegetables on Lipid levels
Most interventions designed to affect serum lipid levels have focused on reducing the
amount of dietary total or saturated fat or increasing fiber consumption. Reducing dietary fat
may entail increasing fruit and vegetable consumption, and they have in some cases successfully
changed lipid levels. Zino et al. examined the specific effect of increasing fruit and vegetable
consumption on lipid levels in an 8-week randomized trial in New Zealand.35 Intervention
subjects were asked to increase fruit and vegetable consumption from 3 or fewer servings per
day to 8 servings per day but not to change consumption of nuts, oils, or butter. They found that
participants were able to increase fruit and vegetable consumption 3-fold but that lipid levels did
not change. The effect on the proportion of dietary fat intake was small (reduction from 35% to
32%).35

Chapter III. Results
20
Effects of Fruits and Vegetables on Cancer
A large body of observational evidence suggests that persons who consume higher levels
of fruits and vegetables are at lower risk for some forms of cancer, particularly gastrointestinal,
lung, and endometrial cancers. Much of this evidence comes from either ecologic studies, which
are subject to confounding, or from case-control studies, which may be subject to recall bias.
Data from cohort studies, a design thought to be less susceptible to bias, are less suggestive of
clear benefit for most types of cancer.36 Two recent cohort studies found little effect of increased
fruit and vegetable consumption on the incidence of lung or colorectal cancer.30,37
Smith-Warner et al. recently pooled data from 8 large cohort studies that had at least 200
incident cases of breast cancer.38 Persons in the highest quartile of consumption of fruits and
vegetables had risks for breast cancer that were only slightly lower than those risks among
persons in the lowest quartile (RR, 0.93; 95% CI, 0.86-1.00). These results stand in contrast to
those of another systematic review of observational data that identified 14 case-control and 3
cohort studies and found a significant risk reduction associated with higher vegetable
consumption (RR, 0.75; 95% CI, 0.66-0.85).39
Effects of Legumes (Beans, Peas, and Nuts) on CHD
Bazzano and colleagues examined the relationship between consumption of legumes
(beans, nuts, and peas) and the risk of CHD, using data from the National Health and Nutrition
Examination Survey (NHANES) Epidemiologic Follow-up Study.40 They measured legume
consumption using a 3-month food frequency questionnaire and obtained data on CHD events
from medical record review and death certificates. Persons consuming higher amounts of
legumes had lower rates of CHD events. Compared to those consuming legumes less than once
per week, those who consumed 4 or more servings of legumes per week had a relative risk for

Chapter III. Results
21
CHD of 0.78 (95% CI, 0.68-0.90). Adjustment for potential confounders did not affect the
magnitude of the estimate importantly (adjusted RR, 0.80; 95% CI, 0.69-0.91).
Effects of Diets High in Whole Grains and Fiber
Intake of dietary fiber, including whole grains, has been associated with a wide range of
positive health outcomes, including lower mortality from CHD and cancer, lower rates of
diabetes and obesity, and better gastrointestinal function.41 In some cases, separating the effects
of fiber and whole grains from other dietary constituents (e.g., fruits and vegetables, dietary fat)
is difficult.
Whole Grains and All-cause Mortality
Jacobs et al. used data from the Iowa Women's Health Study to examine the relationship
between whole grain consumption and all-cause mortality.42 In this study, women were matched
on total grain fiber intake but had varied levels of whole versus refined grains. Persons who
consumed predominantly whole grains had a lower risk of mortality compared with those
consuming refined grains (adjusted RR, 0.83; 95% CI, 0.73- 0.94). These data suggest that the
type of grain fiber may be important to consider when examining diet-health relationships and
that whole grains are more protective than refined grains.
Whole Grains and CHD
Several studies have examined the relationship between dietary intake of whole grains
and risk of CHD. Jacobs and colleagues examined this relationship in the Iowa Women's Health
Study, a prospective cohort study, and found that women who reported higher intake of whole
grains had lower rates of fatal CHD events than those rarely consuming whole grains (adjusted

Chapter III. Results
22
RR 0.71 for consumption of 1.2 servings per day compared with those consuming 0.2 servings
per day).42 More recently, Liu et al. used data from the Nurses' Health Study to examine the
effect of whole grains on first CHD events (fatal and nonfatal).43 Whole grain consumption was
inversely related to CHD incidence (adjusted RR, 0.75; 95% CI, 0.59-0.95 for highest level of
consumption [2.7 servings per day] versus the lowest level [0.13 serving per day]).
Whole Grains and Stroke
Liu et al. also examined the relationship between whole grain consumption and risk of
ischemic stroke in the Nurses' cohort.43 Higher consumption was protective against stroke as
well (adjusted RR, 0.72; 95% CI, 0.53-1.00) for the second lowest quintile [0.43 servings per
day] versus the lowest quintile [0.13 servings per day] of consumption).
Fiber and CHD
Many observational studies have found lower rates of CHD in those persons who
consume large amounts of dietary fiber compared with those who consume little fiber.41,44
However, a large trial examining the effect of fiber on CHD events among middle-aged men who
had recently had a myocardial infarction found no protective effect from advice to eat more fiber,
despite fiber intakes that were twice that of control subjects.45 The relative risk for total
mortality among those randomized to fiber was 1.23 (95% CI, 0.95-1.60).
Fiber and Lipid Levels
Soluble fiber intake of 3 grams (g) per day (roughly 3 servings of 28 g of oatmeal per
day) has been shown to reduce serum cholesterol levels by 2% to 4%, based on data from recent
systematic reviews and meta-analyses.46,47

Chapter III. Results
23
Fiber and Blood Pressure
The independent relationship between a high fiber diet and reductions in blood pressure
has been difficult to study because high fiber diets often contain large amounts of fruit, are high
in potassium, and have low levels of sodium. All these factors may also positively influence
blood pressure. He and Whelton reviewed studies of the relationship between dietary fiber and
blood pressure,48 although they did not describe search methods or eligibility criteria. Persons
consuming diets high in fiber were at lower risk for developing hypertension than those
consuming lower levels of fiber. Relative risks were 0.76 for women and 0.64 for men when
those with the highest consumption (greater than 25 g per day) were compared with those with
the lowest (less than 10 to 12 g per day). They also identified 7 randomized trials of fiber
supplementation published from 1986 to1992 that had blood pressure reduction as the primary
endpoint.48 Fiber supplements (average supplement, 14 g per day) were associated with a 1.6
mm Hg reduction in systolic blood pressure (95% CI, 0.4-2.7) and a 2.0 mm Hg reduction in
diastolic blood pressure (95% CI, 1.1-2.9).
Fiber and Cancer
A wide range of studies has explored the relationship between dietary fiber intake and
cancer. Some studies have detected an inverse association between fiber intake and cancer
incidence. This finding has not been consistent, however, especially when higher-quality data
from cohort studies are considered alone.41
For breast cancer, a meta-analysis of 12 case-control studies identified a modest decrease
in breast cancer (RR, 0.85) with increased dietary fiber.49 Newer studies (both case-control and
cohort) have not found such an association.41
Chapter III. Results
24
Numerous observational studies have examined the relationship between dietary fiber and
colorectal cancer; recent reviews have attempted to summarize the data.41,50 In general, case-
control studies and ecological data support a strong association between dietary fiber and
colorectal cancer (odds ratios of 0.50 to 0.65), but cohort studies generally have had mixed
results and overall have found only modest decreases in risk (10% to 20%).50 Two recent
randomized trials of a high-fiber or fiber-supplemented diet for patients with previous colorectal
adenomas did not find any change in the incidence of future adenomas with increased fiber.51,52
Data are not sufficient to determine the relationship between fiber intake and the
incidence of cancer at other sites. In summary, current evidence is unclear with respect to the
relationship between dietary fiber and cancer.
Effects of Diets High in Fish or Fish Oils on CHD
Marckmann and Gronbaek performed a systematic review of prospective cohort studies
examining the relationship between fish consumption and the risk of coronary heart disease
death.53 Across 11 studies (a total of 116,764 persons), fish consumption was associated with a
decreased risk of CHD death in high-risk but not low-risk populations.
The Diet and Reinfarction Trial (DART) examined the effect of different dietary
recommendations on reinfarction and mortality among 2,033 men who had recently had a
myocardial infarction.45 Those assigned to eat more fish (or to take a fish oil supplement if they
could not tolerate the fish) had a 29% reduction in total mortality over 2 years (95% CI, 7%-
46%). In an older study of a post-infarction population, Singh and colleagues found similar
results.54
The GISSI-Prevenzione trial (Gruppo Italiano per lo Studio della Sopravvivenza
nell�Infarto miocardico) examined the effect of fish oil supplements on the incidence of CHD

Chapter III. Results
25
events in patients who had recently had a nonfatal myocardial infarction.55 Mean lipid levels at
entry were 210 mg/dl for total cholesterol, 137 mg/dl for LDL cholesterol, and 41 mg/dl for HDL
cholesterol. The risk of the combined endpoint of death, nonfatal myocardial infarction, or
stroke was reduced by 10% over a mean follow-up of 3.5 years (95% CI, 1%-18%); the absolute
risk reduction was 1.3%, meaning that about 77 people would need to take fish oil supplements
for 3.5 years to prevent 1 CHD event. Total mortality was reduced (RRR, 14%; 95% CI, 3%-
24%), as were cardiovascular deaths (RRR, 17%; 95% CI, 3%-29%) but not nonfatal myocardial
infarction. Numbers needed to treat for 3.5 years were 77 and 91, respectively. No change in
lipid levels was noted.
No trial has examined the effect of a diet high in fish among lower-risk patients with no
previous history of CHD.
Effects of Dietary Sodium on Blood Pressure
Observational Studies
Numerous ecologic and observational cohort studies have shown that dietary sodium
intake and blood pressure are related. In general, the relationship between increasing levels of
dietary sodium intake and blood pressure is linear.56 The relationship is confounded somewhat
by the effect of other dietary elements, such as dietary potassium, that may be correlated with
sodium intake.

Chapter III. Results
26
Interventions
Numerous trials in persons with or without previously diagnosed hypertension have
addressed the effect of dietary sodium restriction on blood pressure. Two recent systematic
reviews and meta-analyses have summarized this evidence.57,58
Midgley and colleagues systematically reviewed the literature from 1966 to 1994.57
Reviewers identified 56 studies that randomized patients to sodium restriction or a control group,
measured sodium excretion, and presented results for changes in both systolic and diastolic blood
pressure. Patients with hypertension assigned to salt restriction averaged a 95 mmol/day
reduction in sodium excretion. After adjustment for confounders, each 100 mmol reduction in
daily sodium excretion was associated with a 3.7 mm Hg drop in systolic and a 0.9 mm Hg drop
in diastolic blood pressure. For patients without hypertension, the mean decrease in sodium
excretion was 125 mmol/day but the mean reduction in blood pressure per 100 mmol/day
reduction in sodium excretion was only 1.0 mm Hg for systolic and 0.1 mm Hg for diastolic
pressures. Decreases were larger for older patients with hypertension and smaller for free-living
normotensive patients. The authors of the review concluded that sodium restriction was
potentially useful for persons with hypertension but not for patients with normal blood pressure.
The Cutler team performed a similar systematic review in 1997, also covering literature
published from 1966 to 1994.58 They used slightly different entry criteria: studies had to be
randomized trials, be free of obvious confounding, use reasonable sodium intake goals, report
changes in sodium excretion, and present results for change in either systolic or diastolic blood
pressure. Across 32 trials (2,635 subjects), they found slightly larger estimates of effect than had
Midgley et al.57 Among hypertensive persons, reductions in systolic and diastolic pressures per
100 mmol reduction in salt excretion were 5.8 and 2.5 mm Hg, respectively. Corresponding
figures for normotensive persons were 2.3 and 1.4 mm Hg. They concluded that dietary sodium

Chapter III. Results
27
reduction was valuable, as even the smaller reductions in blood pressure could prevent many
events if implemented by the entire population.58
The DASH trial examined the effect of different levels of sodium intake in patients eating
a controlled diet.32 Patients were randomized to 1 of 3 levels of sodium intake: control (150
mmol [3.5 grams] of sodium), a 100-mmol sodium diet, or a 60-mmol sodium diet. They
followed their initial sodium content for 30 days and then crossed over to the other 2 levels in
consecutive 30-day periods. Patients� food was prepared and distributed at the study site;
participants ate some meals at the study site but took others away to be consumed at home or
work. The outcome of interest was blood pressure, measured at the study site. Sodium
restriction reduced blood pressure for both the high fruit, vegetable, and fiber diet group and the
control diet group. Participants on the control diet had a 6.7 mm Hg reduction in systolic
pressure from high to low sodium, whereas those on the high fruit and vegetable diet had a 3.0
mm Hg drop.
The combined effect of eating a diet high in fresh fruits, vegetables, and fiber and
minimizing salt intake reduced blood pressure more than either intervention alone. Low sodium
intake had a greater effect in persons with hypertension, African-Americans, and women than it
did in patients without hypertension, whites, or men.32
Trials of Hypertension Prevention
The Hypertension Prevention Trial, conducted in the mid-1980s, enrolled adults ages 25
to 49 with diastolic blood pressure between 78 and 89 mm Hg and no previous cardiovascular
disease.59 Participants were assigned to dietary counseling about sodium restriction (n = 196) or
usual care (no counseling, n = 196). Counseling occurred weekly for 10 weeks, then every 2
Chapter III. Results
28
weeks for a month, then every other month for three years. Blood pressure was assessed at 6
months and at 1-, 2-, and 3-year follow-up by personnel unaware of treatment status.
Urinary sodium excretion was reduced for intervention patients (net reduction: 3.3 mmol
per 8 hours at 6-month follow-up and 5.0 mmol per 8 hours at 3-year follow-up). These
outcomes suggested that counseling was effective in changing sodium consumption, but blood
pressure did not differ between intervention and control groups at either the 6-month or the 3-
year follow-up.
In the early 1990s, another hypertension prevention trial was conducted among a similar
population of patients.60 Eligibility criteria included diastolic blood pressure between 83 and 89
mm Hg and systolic blood pressure below 140 mm Hg. The goal of dietary counseling was to
reduce sodium intake to 80 mmol/day (less than 2 g of sodium). Intervention patients received
intensive counseling at 10 weekly group sessions followed by 4 monthly sessions, then 1 to 2
contacts per month for the duration of the trial. Participants kept logs of diet and activity and
monitored urinary sodium excretion frequently. Control patients received usual care. Sodium
excretion (mean 180 mmol/day at baseline) was reduced by 50 mmol/day for intervention
patients and 10mmol/day for controls. Systolic blood pressure was reduced by a net 2.9 mm Hg
at 6 months (P < 0.001) and 1.2 mm Hg at 3 years (P = 0.02). Development of hypertension,
defined as systolic blood pressure greater than 140 mm Hg or diastolic blood pressure over 90
mm Hg or a new prescription for hypertension medication, was lower for intervention patients
(RR = 0.82; P = 0.05).
Thus, intensive dietary counseling to reduce sodium intake among patients with high-
normal blood pressure can apparently effectively reduce dietary sodium as measured by urinary

Chapter III. Results
29
sodium excretion. However, it has little effect on mean blood pressure and only a small effect on
number of abnormal blood pressure readings or initiation of antihypertensive medication.
The adverse effects of a low sodium diet have not been well studied. Data from
systematic reviews of multiple trials have not identified important harms from sodium reduction
other than its effect on food palatability, which has not been well investigated.
Effects of Dietary Potassium on Blood Pressure
Observational Studies
Several observational studies have examined the effect on blood pressure of diets high in
potassium. They have generally found an inverse relationship between potassium intake and
blood pressure. Separating this effect from the impact of other related components of the diet,
including fiber, sodium, and the amount of fruits and vegetables, however, has been difficult.61
Interventions
Whelton et al. performed a systematic review of the effect of oral potassium
supplementation on blood pressure, they identified 33 randomized trials published before July
1995 that involved a total of 2,609 subjects.62 Using a random effects model, they found that
supplementation led to mean decreases of 3.1 mm Hg (95% CI, 1.9-4.3) in systolic blood
pressure and 2.0 mm Hg in diastolic blood pressure (95% CI, 0.5-3.4). Thus, supplementation
with potassium does seem to improve blood pressure and lends support to observational evidence
that diets high in potassium-rich foods also improve blood pressure.

Chapter III. Results
30
Effects of Dietary Calcium
Effect of Dietary Calcium on Osteoporotic Fractures
Observational data. Population-based cohort and cross-sectional studies suggest that
low calcium intake among young women leads to lower peak bone mass, a risk factor for
postmenopausal osteoporosis. Data on the effect of calcium intake among middle-aged women
are less clear. Feskanich et al. found that higher intake of dietary calcium was not associated
with a lower risk of hip fracture in the Nurses� Health Study cohort of women ages 34 to 59
years.63
Whelton et al. performed a systematic review of 33 observational and interventional
studies appearing between 1966 and 1994.62 Their analysis focused on premenopausal adult
women and adult men between the ages of 18 and 50 years. The authors examined the strength
of the correlation between dietary calcium intake and bone mass and calculated a summary
correlation coefficient (r = 0.13; 95% CI, 0.09-0.16) and a partial correlation coefficient (partial r
= 0.08; 95% CI, 0.05-0.12) that were statistically significant. They also concluded that a
difference of 1,000 mg per day of calcium intake (in the form of supplements) would prevent the
additional loss of 1% of bone at all bone sites examined except the ulna.
Cumming examined the effect of calcium intake on osteoporotic fractures in
postmenopausal women.64 They performed a meta-analysis of 16 observational studies of
dietary calcium that examined incidence of hip fracture. Pooling data from these 16 studies, the
authors found an odds ratio for fracture of 0.88 (95% CI, 0.80-0.97) for 1,000 mg or less of
higher intake of calcium. They concluded that modestly increased calcium intake among
postmenopausal women appears to be associated with a small reduction in risk of fracture.

Chapter III. Results
31
Intervention studies. Multiple randomized trials have examined the effect of increased
calcium on bone mass or fracture risk. Heaney performed a systematic review of all studies
relating calcium intake to bone health from 1977 to 1999 and identified 39 RCTs of the effect of
calcium supplementation (33 with calcium supplements alone and 6 that used dietary sources
alone or in addition to calcium).65 Of the 39 trials, 37 showed a positive effect on bone mass; 5
showed reduced fractures (all among the elderly). The concurrent use of vitamin D in the
intervention studies makes it difficult to estimate the effect of increased calcium alone.
Adverse effects. The potential adverse effects of recommending high calcium intake
include (rarely) milk alkali syndrome and increased occurrence of kidney stones in a susceptible
host. When dairy products are the source of calcium, other potential adverse effects include
exacerbation of lactose intolerance or an increase in dietary fat intake if low-fat dairy products
are not used. In men, prostate cancer risk may be increased with higher intake of dairy products,
an effect that may be mediated through reduced circulating 1,25 vitamin D levels.66 Available
data are insufficient to estimate the risk of these complications.
Other Dietary Elements
Other USPSTF reviews will deal with other potentially important dietary elements such
as dietary iron and folate. Other vitamins are examined in forthcoming work on vitamin
supplements, and infant nutrition will be covered by the review of counseling about
breastfeeding.

Chapter III. Results
32
Special Populations
Pregnant Women
Nutritional status is especially important during pregnancy. Low birth weight and
neonatal mortality are more common in pregnant women with very poor nutritional status67,68
and in those who fail to gain adequate weight during pregnancy.69,70 Factors other than nutrient
intake per se, however, may account for these outcomes. Prenatal programs providing
nutritional support for pregnant women have been associated with improved perinatal outcomes.
Pregnancy brings increased requirements for energy and specific nutrients, such as
protein, calcium, folic acid, and iron.70-72 Folate supplementation, which prevents neural tube
defects, is being considered in the specific USPSTF review for that subject. Oral iron
supplements may be beneficial in preventing iron deficiency anemia in pregnancy. They are
often prescribed routinely as part of prenatal health care, along with vitamin supplementation.
The evidence for iron supplementation will be covered in the separate review on screening for
iron deficiency.
Older Adults
The elderly also have special nutritional issues. Undernutrition, common among the
elderly, is associated with adverse health outcomes. Because clinical recognition of protein-
calorie malnutrition, especially when manifested by clinically subtle findings, is often delayed
among older adults, attempts have been made to screen older adults routinely (see Key Question
No. 2, below). The effectiveness of screening and counseling persons at risk has not been well
documented, but a systematic review about the use of nutritional supplements to treat
undernutrition is considered in Key Question No. 7 (below).

Chapter III. Results
33
Summary of the Evidence Regarding the Relationship Between Diet and Health Outcomes
Based on our review of the evidence relating various dietary elements with important
health outcomes, we found reasonably good evidence that diets low in saturated and trans-
unsaturated fats, and high in fruits, vegetables, fiber, and fish, are associated with better health
outcomes. Diets high in calcium for women, and diets low in sodium for persons with
hypertension or at high risk for developing it, are also associated with better surrogate health
measures (bone density and blood pressure, respectively) that are correlated with improved
health.
Key Question No. 2: Valid, Feasible Tools for Assessment of Dietary Risk and Patterns
We identified 18 articles related to dietary assessments designed to determine level of
risk, to guide counseling, or both. We also identified assessment questions that can inform
counseling by assessing mediators to dietary change, such as stage of readiness to change73-90
(see Table 1).
Dietary assessment tools fall into 3 broad categories. First are age-specific general
assessment tools, where attention is directed at issues relating to infants and toddlers, older
children, adults, and the elderly. For children and adults, the particular concerns may involve
assessing dietary behaviors most strongly identified with risk for chronic disease; for the elderly,
unintentional weight loss associated with chronic illness, social isolation, or other factors linked
with the aging process are of particular concern. The second category of assessments involves
those that identify factors that foster or mediate dietary behavioral interventions. The third
category includes assessment instruments to identify the presence of hunger and food insecurity.

Chapter III. Results
34
Assessment of Eating Patterns and Nutritional Factors in Selected Age Groups
Infant and Toddler Growth and Development
Comprehensive nutritional assessment includes multiple anthropometric and biochemical
parameters in addition to estimations of dietary intake patterns. Most significant nutritional
problems of infants and toddlers are manifested by a failure to follow predicted growth curves
based on height for age and weight for stature. Therefore, growth charts are used to assess
nutritional status and general health and well-being of infants, children, and adolescents. In May
2000, revised growth charts for the United States were released, representing the first major
revision since the 1977 growth charts from the National Center for Health Statistics.91 These
revisions corrected many previous concerns with the existing charts, centered on the fact that the
prior infant charts were developed from data based on a single longitudinal study of primarily
formula-fed, white, middle-class infants from a limited geographic region.
Findings of small stature or low weight for height require further evaluation to assess
organic problems versus inadequate dietary intake. Excess weight for height is most likely
related to either excess calorie intake or inadequate energy expenditure. A review of feeding
practices or a 3-day record of all dietary intake can help identify major dietary problems leading
to inadequate or excessive intake, but no brief, validated assessment tool is currently available
for this purpose.
The revised US growth charts include, for the first time, BMI-for-age charts, and all
charts for children and adolescents now extend to 20 years of age. These updated instruments
may improve detection and monitoring of pediatric obesity (which is expected to be covered in a
separate USPSTF report). Dietary assessment for overweight children above the age of 2 years

Chapter III. Results
35
should be conducted using tools available to assess dietary behavior associated with chronic
disease outcomes.
A few brief diet and health screeners have been developed and evaluated as the first part
of a 2-stage screening process to detect iron deficiency anemia in infants and toddlers. These
measures are very sensitive (95%), but specificity is quite low (15% to 30%).92-94
Children
Assessing dietary intake of children becomes more difficult as they age. Parents have
less control over intake and are less able to provide a complete and accurate picture of their
children�s food intake. In a review of dietary assessment instruments, Rockett and Colditz
concluded that for children ages 9 years and older, food frequency questionnaires administered
directly to children can provide a reasonably accurate picture of their usual patterns.95
Correlations with criterion measures on a number of instruments range from about 0.46 to about
0.79, except for sodium intake for which the correlation coefficient was much lower (0.21).
Although food frequency assessments are generally the most efficient way to estimate usual
dietary intake, the majority of the instruments reviewed were quite lengthy and designed more
for epidemiologic research than for rapid clinical assessment.
For children below the age of 9, dietary assessment relies on joint input from parents and
children and can be supplemented by written or tape-recorded methods.96,97 We identified no
brief, validated diet screeners for this age group.
Adults
A recent review of practical nutrition assessment in primary care settings by Calfas et al.
included brief instruments assessing primarily fat (various types) and, to a lesser extent, fruit and

Chapter III. Results
36
vegetable intake as well as other nutrients.98 Table 1 provides key descriptive information about
various validated instruments and others identified from the literature. Most of these instruments
can be self-administered, are easily scored, have fewer than 40 items, and take 10 minutes or less
to administer. In contrast, dietary assessment tools designed for epidemiologic research
generally require multiple 24-hour recalls, 7 days of food records, or food-frequency instruments
with 60 to 100 items requiring 45 minutes or longer to administer.
Owing to the limited number of items in the shorter assessments, only selected nutrients
found in a limited selection of foods can be assessed. These brief measures are usually
compared against criterion measures using multiple 24-hour food recalls, records, or longer food-
frequency instruments. Correlations with the criterion variable range from 0.37 to 0.60, with
higher correlations for single nutrients such as calcium (0.79).98
In a recent study not included in the Calfas team�s review, Little et al. validated 9 brief
diet screener instruments commonly used in the United Kingdom against a 7-day weighted
dietary record.99 Having found reasonable correlations in a range similar to that for the
instruments in Table 1, they concluded that brief assessment instruments perform well enough
for clinical work. However, underreporting of absolute calorie intake was common, particularly
among obese patients (60% of those with BMI ∃ 30).
Nutritional Assessment in the Elderly
Poor nutrition in the elderly is common: more than 25% of independent-living elderly
and more than 80% of home-bound elderly have moderate to high risk of malnutrition and poor
nutrition. This problem has been associated with increased mortality, more visits to physicians
and hospital admissions, higher morbidity, higher costs, and longer lengths of hospital stay.100
Risk factors for poor nutrition in older adults include low income, social isolation, loneliness,

Chapter III. Results
37
concurrent illness, compromised functional status, and polypharmacy.101 The challenge to
primary care physicians is to identify elderly patients who would benefit from dietary
intervention without subjecting all elderly persons to a battery of costly and time-consuming
anthropometric, dietary, and laboratory tests.102 However, few providers (10%) routinely assess
patients for undernutrition.103
Several brief screening instruments have been developed to assess nutritional status in the
elderly. Although many are designed for long-term-care patients,104 some have been validated in
community-living elderly and are intended for use by the primary care provider. Three
extensively used and tested instruments are described here.
The Nutrition Risk Index (NRI) was derived initially from questions used in the first
National Health and Nutrition Examination Survey (NHANES I). 105 Validity has been tested by
the ability of the NRI to predict use of health services and correlations with a variety of
anthropometric, laboratory, and clinical markers of nutritional status.
The DETERMINE instrument was developed as part of the Nutrition Screening Initiative
� a 5-year campaign begun in 1990 to promote nutrition screening and better nutritional care
among the elderly in the United States in response to the 1988 US Surgeon General�s Workshop
on Health Promotion and Aging.106 This instrument has been validated against measures of
depressive symptoms and functional disability.104
Probably the most extensively validated instrument is the Mini Nutritional Assessment
(MNA).102 Validation criteria include nutritional status determined by physicians using standard
anthropometric, clinical, and dietary measures mortality, and hospital cost.
These instruments all consist of 18 or fewer yes/no checklist items and involve a
weighted score. Nutrition factors common to all 3 instruments include unintended weight loss,

Chapter III. Results
38
problems with chewing and swallowing, polypharmacy, and concurrent illness. The
DETERMINE checklist and the MNA also include food access, social isolation, mobility,
poverty, and intake of fruits, vegetables, and protein sources. The MNA includes questions to
assess psychological problems, dementia, independent living status, and a self-assessment of
nutrition problems and relative health status.101,102,105
Mediators of Dietary Change
In addition to assessing usual dietary behavior, providers are also encouraged to assess
psychosocial factors that may mediate the effects of a counseling intervention. Such instruments
have been developed primarily as evaluation measures in nutrition education intervention
research.107 A mediator frequently used to guide counseling for a variety of health-related
behaviors is Stage of Readiness to Change.108 This measure is used to determine the degree to
which an individual is ready to begin counseling and how far he or she has advanced in the
behavior change process. Several relatively brief and validated instruments assess stage of
change for dietary fat intake; they can be implemented in the clinical setting.109-112
Table 2 lists additional mediating factors. These mediators have all been associated with
success or lack of success in counseling interventions to promote dietary change.113 Whitlock et
al., in a report to the USPSTF, discuss mediators of behavioral change in greater detail.1
Food Insecurity and Hunger
Food insecurity and hunger is often overlooked as a nutrition concern. Food insecurity
exists �whenever the availability of nutritionally adequate and safe foods or the ability to acquire
acceptable foods in socially acceptable ways is limited or uncertain� (p.1560).114 In 1995, the
Current Population Survey (CPS) of the US Census Bureau documented that approximately 12%
Chapter III. Results
39
of US households are �food insecure�; of these, 28% showed evidence of moderate hunger and
7% indicated severe hunger.115,116 Extensive work had been done to develop and validate an 18-
item assessment instrument for food insecurity in a nationally representative sample of nearly
45,000 households as part of the Food Security Measurement Project.115
A subset of 6 questions has shown acceptable accuracy and is more feasible for use in
primary care than the original (longer) version.76 Sample questions from this assessment
include: "In the last 12 months, did you ever eat less that you felt you should because there
wasn't enough money to buy food?" and "In the last 12 months, were you ever hungry but didn't
eat because you couldn't afford enough food?" Patients identified as food insecure are likely to
need referral to social services or other forms of assistance before they would be ready to attempt
dietary changes to reduce chronic disease risk.
Key Question No. 3: Adverse Effects of Dietary Assessment
We did not identify any studies that document adverse effects of dietary assessment
alone. Under Key Question 5, we discuss possible adverse effects of dietary counseling
interventions.

Chapter III. Results
40
Key Question No. 4: Efficacy of Primary Care Counseling and Dietary Behavior Change Interventions
Impact of Dietary Counseling
Overview
From 325 abstracts of articles, we identified 74 articles examining the effect of
counseling on dietary behavior (Figure 2). We excluded 41 articles (see Table 3) from our
analysis because of methodological and reporting problems, such as lack of a true control group,
lack of pre- and post-intervention measures, or retention rates below 50%. We retained 33
articles � representing 29 unduplicated studies � that met our eligibility criteria. Of these 29
studies, 12 examined more than 1 nutrient or food group: dietary fat, 25 studies; fruit and
vegetable intake, 11; and dietary fiber, 7. Based on randomized design, high retention rates, and
use of appropriate outcome measures, we considered the included studies to be of good quality or
fair quality (in the case of 1 study that had a higher and unequal loss to follow-up117).
Tables Reporting Study Design, Intervention Characteristics, Outcomes, Effect Sizes, and Other Information
Tables 4-6 on study design and outcomes. Three tables (found at the end of this
chapter) present detailed information on the 29 studies that examine the impact of dietary
counseling in the primary care setting. Specifically, Table 4 presents information on counseling
to reduce dietary fat; Table 5, counseling to increase intake of fruits or vegetables; and Table 6,
counseling to increase intake of fiber.

Chapter III. Results
41
Each table has pairs of pages, such that any given study�s information will be found on 2
adjoining pages. The first page presents information about the numbers and characteristics of the
study population (including risk status), setting (and external validity of the study), the size and
retention rates of the study, descriptions of the activities directed at the intervention and control
groups, and the level of intensity of the intervention. The second page then presents information
on outcomes, net changes between baseline and final follow-up measures for both intervention
and control groups, differences between the intervention and control groups in net changes, and
various statistical or effect size determinations.
Each separate row in a table represents a single study; if the study has multiple citations,
they are provided in the first column. When studies have multiple arms, those are shown
separated in the table by dotted lines; when studies simply have multiple outcome measures,
such as outcomes related to total fat and saturated fat (in Table 4), those are given separately
within the rows.
The study�s setting, the means of performing the counseling, and the intensity and
content of the intervention were considered especially significant variables in terms of
understanding the feasibility of these types of interventions for primary care practice. Thus, we
classified study settings (column labeled �Setting�) in 1 of 4 ways:
1. primary care providers (counseling done by physician, physician assistant, nurse
practitioner, or registered nurse [RN] in the course of his or her usual duties within
the primary care setting);
2. primary care clinic referral (referral within a primary care practice, such as a
registered dietitian [RD] or RN employed by the clinic or practice);
3. research clinic; or

Chapter III. Results
42
4. mailings or computer-generated messages and intervention materials.
In addition, we noted other elements of interventions, including the intensity of the
intervention (low, medium, or high) and whether the intervention components used had
previously been shown to be associated with improved behavioral outcomes. We rated the
study�s external validity and feasibility for replication in routine primary care as high, medium,
or low; in some studies, multiple intervention arms represented different levels of feasibility.
One column in the outcomes page of each table is entitled �Net Different in Change or
Difference at Final Follow-up�; the net difference in change is calculated as the change from
baseline to final follow-up for intervention groups minus the change for the control group and
then presented in absolute terms. We also presented 2 calculated values in these tables. The
�Relative Risk Reduction� is calculated as the absolute change in the intervention group from
baseline to follow-up divided by the baseline value of the control group; although presented in
arithmetic terms, it can be interpreted in percentage terms. The �Difference in Deltas� is
calculated according to the following formula:
[(baseline intervention - follow-up intervention) / baseline intervention] �
[(baseline control - follow-up control) / baseline control] x 100.
Finally, using all information on study outcomes and changes from baseline to final
measures for both intervention and control groups, we characterized the amount of dietary
change in dietary behaviors, i.e., effect sizes, as small, medium, or large. The specific
definitions for effect sizes are presented in the text below that deals in particular with the
individual tables. Effect sizes for each study (including each arm or each separate outcome
measure) appear in the last column of the table (on the second of the pair of pages).
Chapter III. Results
43
Tables on interactions of variables and effect on dietary behaviors. Tables 7-12 deal
in greater depth with results from reviewed studies concerning combined effects and
relationships among, e.g., risk status of patients, intervention intensity, and number of
components in the various interventions tested, setting and provider, and levels of effect size.
Data are presented separately in some cases for fats, fruits and vegetables, and fiber.
Effect of Counseling on Intake of Total and Saturated Fat
We identified 25 studies examining the effect of counseling on dietary total or saturated
fat (Table 4). For outcomes stated in percentage of calories from total or saturated fat, we
defined effect sizes as follows: large, >10% change in total fat or >3% change in saturated fat;
medium, >5% to 10% change in total fat or >1.3% to 3% change in saturated fat; and small, 0%
to 5% change in total fat or 0% to 1.3% change in saturated fat. For comparison purposes, a
daily reduction of 7% in percent of calories from fat represents, in food terms, foregoing a
medium serving of fast-food French fries or 4 pats of butter per day. For other outcomes, such as
those reported in grams of total or saturated fat, specific dietary behaviors, or various food or
dietary risk scores, the senior authors independently estimated the magnitude of relative change
and assigned effect size categories; disagreements were resolved with consensus discussion.
Of the 25 studies in Table 4, 17 studies reported the effect of counseling on the
percentage of calories derived from total dietary fat or provided data permitting us to calculate
this value (12 directly reporting percentages, and 5 reporting grams); 11 studies provided data
regarding the effect of counseling on percentage of calories from saturated fat. We considered 6
studies to have achieved large effects on change in dietary fat (in at least 1 element of the
study).118-122 An additional 7 studies achieved medium effects (in at least 1 arm or outcome
measure);12,123-128 1 achieved a medium effect size on the DINE fat score.129 Finally, 13 studies

Chapter III. Results
44
(one with 2 published articles) achieved small effects on dietary fat (in at least one part of the
study).13,119,123,130-140 Two studies had multiple study arms with different effect sizes.119,123 A
collection of 4 studies presents data from the Women�s Health Trial (WHT), which achieved
large effects during a 24-month intervention period that were maintained at the medium level
effect size for another year without further intervention. 141-144 Coates et al. examined a minority
subset of the WHT.118
Eleven studies specifically examined the effect of counseling on the percentage of
calories from saturated fats, and the net differences in these percentage reductions between
baseline and final measurement in these studies ranged from 0.9% to
5.3%.13,118,120,122,125,133,134,136,138,139,141-144 Three other studies showed small or medium changes in
other measures of saturated fats.123,129,140
Effect of Counseling on Fruit and Vegetable Intake
We identified 11 studies that examined the effect of counseling on fruit and vegetable
intake (Table 5);118,123,125,127,132-134,140,145-147 of these, 3 studies tested more than 1 type of
intervention.123,146,147 Eight studies reported their results in terms of the change in the number of
servings of fruits and vegetables consumed per day and the differences between the intervention
and control groups in their changes between baseline and the end of the
study.118,123,125,132,134,140,145,147 A serving of fruit and/or vegetables is one-half cup, the
recommended intake is 5 servings a day, and the current US average is 2.5 to 3 servings per day.
The mean increase in consumption seen with interventions ranged from 0 to 3.2 servings per day.
We defined effect sizes for studies reporting results in terms of increases in daily servings
as follows: large, ∃ 1 serving; medium, 0.2 to 0.9 servings; and small, <0.2 servings. Across

Chapter III. Results
45
these 8 studies, 1 study achieved a small effect;123 5 studies reported increases of medium
size;118,125,132,134,147 and 2 had large effect sizes. 140,145
The studies by Cupples and McKnight133 and Knutsen and Knutsen127 each used the
percentage of subjects increasing their consumption of fruits or vegetables (or both) above a
defined threshold as the main outcome variable. Both teams found little or no change in intake
of fruits or vegetables (net increases of 0 to 8 percentage points in the proportion of subjects
meeting the defined goals depending on the group being studied); we classified these as having
only a small effect size.
Finally, Siero et al. presented grams of fruits and vegetables per day as their outcome
measure in a 2-arm study.146 Group education alone achieved a 20 g increase in fruit and
vegetable intake (small effect). By contrast, group education plus tailored messages resulted in a
99 g increase (medium effect); this is approximately equivalent to an increase of one-half serving
per day.
Effect of Counseling on Fiber Intake
Seven studies, lasting from 3 months to 4 years, examined the effect of counseling on
fiber intake (Table 6).12,125,128,130,131,134,148 Of these 7 studies, 6 measured outcomes as grams of
fiber per day;12,125,128,130,134,148 1 used grams of fiber per 1,000 calories (kcal).131
For these studies, we defined effect sizes as follows: large, ∃ 6 g increase in consumption
of fiber per day; medium, 1 g to 6 g increase in daily consumption; and small, <1 g change in
consumption. Putting these changes in context, the currently recommended daily intake (RDI)
for fiber is 20 to 30 g per day; the average intake in the United States is 15 g. An apple has about
2 g of fiber.

Chapter III. Results
46
Four studies yielded increases in the amount of additional fiber consumed (range: 0.6 g to
3.0 g) classified as medium effect size,12,125,134,148 although Baron et al. reported differences in
fiber intake between intervention and control groups of 2.7 g for men and 6.0 g for women at the
1-year follow-up point.148 Two studies had only small effect sizes.128,130 The single study with
outcomes in terms of 1,000 kcal had only a small effect size (consensus decision by the senior
authors).131
Factors Affecting Response to Dietary Counseling
We examined several factors that may affect response to counseling and feasibility in a
primary care setting. These factors include risk status of the patient, intensity of the intervention,
and the setting and intervention provider. We also examined whether use of a number of specific
counseling aids and components would influence the magnitude of effect. Tables 7 and 8
provide more details on these topics. The findings presented relate to all studies combined (fat,
fruits and vegetables, fiber), because the number of studies in each group was too low for us to
make valid comparisons for each specific dietary constituent.
Risk Status of Patients
Across all nutrient groups, studies of patients at average or low risk largely produced
mainly small to medium effects on dietary behavior (Table 7). Studies of patients at moderate
risk (1 or more identified risk factors, such as elevated cholesterol or hypertension) most
frequently achieved small to medium levels of dietary change, but the amount of change tended
to depend on the intensity of the intervention. Studies of high-risk patients (those with existing
illnesses such as cancer or cardiovascular disease) were somewhat more likely to achieve large
effects than studies of non-high-risk patients, but many studies in high-risk patients still
produced only small or medium changes.

Chapter III. Results
47
Intensity of the Intervention
As shown in Tables 4-6, we classified the intensity of each counseling intervention as
low, medium, or high; the factors dictating this classification included the number and length of
counseling contacts, the magnitude and complexity of educational materials provided, and the
use of supplemental intervention elements such as support group sessions or cooking classes.
Table 8 documents the relationship between the amount of change in dietary behavior (i.e., effect
size, as recorded in Tables 4-6) and intensity of interventions (shown as low, medium, or high).
In our review, virtually all studies achieving large effect sizes fell into the high-intensity
category. At the extreme is the study conducted by Ornish and colleagues.121 In their study,
high-risk selected patients were referred to a multi-component lifestyle modification program
delivered in a retreat-like setting. Studies that combine very intensive interventions with high-
risk patients tended to show the largest impact.
The vast majority of medium-intensity studies achieved small to medium effects. Low-
intensity counseling interventions, such as those typically used in primary care settings, also
achieved only small to medium effects on dietary behavior
Combined Effect of Risk and Intensity
Tables 9a through 9c (respectively for fats, fruits and vegetables, and fiber) show the
effect of intervention intensity and risk status of subjects on the amount of change in dietary
behavior. In these tables, studies with small effect sizes are shown in Roman (regular) type,
studies with medium effect sizes in italics, and studies with large effect sizes in bold.
Across all risk groups (average/low, moderate, and high), more intensive interventions
were somewhat more likely to produce larger changes in behavior than were less intensive
interventions. Studies conducted in high-risk patients were also more likely to be of higher
intensity and, hence, more effective.

Chapter III. Results
48
Setting and Provider
As described above, we classified studies in terms of setting and provider and in terms of
external validity. The latter classification − denoted, low, medium, or high − is based on
representativeness of the providers and patient population and the feasibility of replicating the
intervention in a primary care setting without the additional research infrastructure. Factors
related to feasibility include training requirements of the providers as well as time and resource
requirements of both patients and providers. (These data are recorded in columns labeled
�Setting� and �External Validity� in Tables 4-6.)
Low-intensity interventions generally tended to be more feasible than higher-intensity
efforts, and they tended to reflect counseling interventions that are implemented within the
primary care setting today. However, some intervention strategies have achieved high levels of
intensity while remaining feasible through the use of innovative, efficient strategies rather than
relying on multiple clinic-based individual counseling sessions with the primary care provider.
Examples include using office staff to deliver group-level interventions or follow-up telephone
calls or mailings, computer-tailored newsletters or automated telephone systems to provide
dietary feedback, goal setting, and reinforcement with very limited staff interaction time
required.
In general, counseling provided by primary care providers had high external validity;
primary care referral had medium external validity, as did mailed or computer-generated
reminders. Research clinic settings had low external validity.
As shown in Tables 10a-10c and discussed in more detail below, studies conducted in
primary care settings (by primary care providers or referrals) had small to medium effects,

Chapter III. Results
49
computer-generated messages and mailings had medium effects, and efforts in special research
clinics tended to have large effects.
Primary care provider studies. We reviewed a total of 8 studies in which a primary
care provider in the office setting delivered the diet counseling intervention (2 for fat and fiber, 5
for fat only, and 1 for fiber only)(Tables 10a-10c).124,126,129-131,137-139,148 Of these, 4 achieved
small effects in dietary change and 4 achieved medium effects. All were considered to be of
high feasibility and external validity.
Three evaluated interventions delivered primarily by physicians; 1 achieved medium-
level effects,126 and 2, small effects.131,137,139 In the remaining 5 studies, the intervention
involved distribution of print materials or counseling by a nurse employed by the primary care
clinic. No study tested very brief advice by physicians against a control group receiving no such
advice.
The studies that achieved medium-sized changes in dietary behavior used either medium-
intensity126,129,148 or high-intensity123 interventions. Low-intensity interventions delivered to
average-risk patients in primary care settings, although high in feasibility and external validity,
produced only small changes in dietary fat consumption (1% to 2% reductions in total fat
intake); changes in other dietary elements have not been studied.
Primary care clinic referral studies. An additional 6 studies in a primary care clinic
used referral to a nutritionist, health educator, or other trained health professional (excluding
nurses who were considered primary care providers when performing their usual duties)
employed within that clinic.12,127,128,133,135,146 These studies produced small to medium effects on
dietary behaviors. The studies in this category were all deemed to be of low to medium
feasibility and external validity.
Chapter III. Results
50
Research clinics. The largest effects on dietary behaviors were seen in studies using
special research clinics, many of which also involved high-risk patients. All 10 of these studies
(7 examining dietary fat; 2 fruits and vegetables; 1 for both fat and fruits and vegetables; none
for fiber) were classified as having low feasibility or external validity for the typical primary care
practice setting because of the intensive nature of the intervention and because they often used
very selected study populations.13,118,120-122,125,136,140-142,145 Taking account of multiple dietary
elements or study arms, 7 studies in research clinics achieved a large dietary behavioral effect, 1
a medium effect, and 3 a small effect.
Mailings and computer-generated messages. The health communications field is
growing rapidly and has made use of various graphic and computer-based technologies to
produce individually tailored counseling interventions that replace or supplement direct contact
with providers. These interventions may be implemented alone or in conjunction with more
conventional counseling strategies. We classified interventions in this category as largely having
medium feasibility and external validity. As the technology evolves to provide "packaged"
software tailoring programs, we anticipate that these interventions will become increasingly
feasible for use within the primary care setting.
We identified 6 studies within this category, several of which tested multiple levels of
computer tailoring.119,123,125,132,134,147 All but 1 of these studies resulted in medium to small effect
sizes; the exception reported a large change in fat consumption among the siblings and offspring
of individuals with a history of myocardial infarction but was rated as only fair quality because
of unequal loss to follow up.119 More intensive tailoring seemed to result in greater dietary
change, but the evidence was not conclusive.

Chapter III. Results
51
Intervention Components
Several counseling intervention components have been shown to be associated with
improved behavioral outcomes in other studies: a dietary assessment, family involvement, social
support, group counseling, food interaction (such as taste testing or cooking), goal setting, and
ethnic specificity. To characterize the investigations reported in this review at this level of
detail, we abstracted data from each study to determine if the investigators used any of these 7
elements in their intervention; these data appear in Tables 11a, b, and c (fat, fruits and
vegetables, fiber, respectively). The total number of components used ranged from 0 to 7, with a
median of 2 components. Many authors did not describe their interventions in sufficient detail to
assure that readers could determine the absence or presence of these study components.
As summarized in Table 12, studies employing 3 or more components were more likely
to show a medium or large effect on dietary behaviors than studies using fewer than 3
components. Studies that did not report employing any of these specific components were more
likely to have a small effect than studies using 1 or more components. The number of studies
using each of the individual components was too low to permit us to determine with confidence
whether the use of any given one component was associated with a greater change in dietary
behavior.
Sample Studies Illustrating Counseling Approaches
To understand more about how different approaches to counseling may affect dietary
change, applying the 5-A framework is a useful step. The 5-A construct was initially developed
to describe the essential elements of brief provider interventions related to tobacco cessation.149
Briefly, the 5-A framework includes Assess, Advise, Agree, Assist, and Arrange. Whitlock et al.
describe it in more detail, provide an overview of counseling issues and approaches, and discuss

Chapter III. Results
52
the systems support necessary to implement behavioral counseling activities in the primary care
setting.1
We found that too few studies reported adequate detail about the intervention to use the
5-As as a guide for this analysis of counseling, but it offers a useful framework for describing
various counseling approaches. To provide more information on counseling approaches,
therefore, we describe here 4 studies that represent different counseling approaches within each
of our 4 settings categories (described earlier) that we deemed to be of higher external validity
than other investigations and that achieved a medium to high effect.
Primary care provider studies. Illustrative of studies in this category is work by
Keyserling et al.,126 who conducted a randomized trial in 21 community and rural health centers
in the southeast. The main intervention was physician counseling, followed by a prompt for
referral to a dietitian for patients not meeting their cholesterol-lowering goals after 6 months.
Physicians advised patients with elevated cholesterol of the associated risks for cardiovascular
disease. Patient diets were assessed using a 5- to 10-minute validated food frequency
instrument. Providers were then trained to work with patients to agree on goals, provide
counseling using low-literacy materials linked to the assessment (assist), and document the goals
for follow-up at the next visit (arrange/assist). Before dietitian referral, the intervention resulted
in a 3.3-point greater reduction in a dietary risk score for the intervention group than for control
group (P < 0.001). When controlling for cholesterol-lowering medication use, reduction in total
serum cholesterol was 5.5 mg/dl greater in the intervention group (95% CI, 0.3-10.7) than the
control group. Ockene et al. tested a similar counseling intervention strategy by physicians in a
group-model health maintenance organization supplemented with an office management
system.137 This work produced a modest but statistically significant reduction in percentage of
Chapter III. Results
53
calories from saturated fat (1.1%), a reduction in weight of 2.3 kg, and a decrease of 3.8 mg/dl in
LDL cholesterol. Dietary changes were not significant in the study arm that did not include an
office management system.
Primary care clinic referrals. Siero and colleagues compared 3 2-hour group education
classes only with an intervention arm including classes and a computer-tailored mailing.146
Designed to promote a �Mediterranean-style� diet, this study was conducted in a low
socioeconomic status community in the Netherlands. The authors did not mention whether the
group sessions included an assessment of dietary intake or mediating factors. Group leaders
advised participants about both the knowledge and the skills needed to implement the
Mediterranean diet and assisted them in making the behavior changes with specific guidelines
for food purchasing and preparation. Subjects randomized to the 2-part intervention also
received a computer-generated personal letter tailored to attitude, self-efficacy, social norm, and
stage of change based on an extensive assessment of dietary habits and related psychosocial
factors. The investigators did not mention either identifying and agreeing on a set of goals or
arranging for follow-up in either group. Results of the study showed an increase of 62 g in the
consumption of fruits and vegetables (approximately 0.4 to 0.5 serving) in the group- session-
only arm; the tailored letters conferred no significant additional benefit (99 g total increase).
Research clinics. In the study by Coates and colleagues,118 dietitian-led group sessions
were conducted weekly for 6 weeks, biweekly for another 6 weeks, and then monthly for 9
months. Study participants were ethnically diverse and were guided by group leaders to assess
their dietary needs and then agree on specific changes to address the problems identified.
Participants were advised by the group leaders regarding personal goals for grams of fat. The
groups leaders then assisted participants with the lifestyle change process by teaching them
Chapter III. Results
54
about low-fat substitutions, implementing a self-monitoring strategy using a specially designed
tool, guiding them through role plays and problem solving, and providing individualized
attention as needed. Because the groups met on a regular basis, arranging follow-up was not
necessary. This intervention resulted in a medium effect for fruits and vegetables (an increase of
0.53 servings of fruit and 0.27 servings of vegetables) and a large effect for fat (net reduction of
3.5% calories from saturated fat and 11.6% calories from total fat).
Mailings and computer-generated messages. This emerging technology in nutrition
counseling has the potential to tailor messages individually while requiring little time on the part
of health care providers. Campell et al. devised computer-tailored newsletters to be mailed to
family practice patients.123 The study did fit into the 5-A framework. Diet was assessed using a
self-administered food frequency instrument which provided the information needed to generate
computer tailored nutrition messages mailed to participants. Although patients were not directly
counseled by their physicians, the mailed materials helped to advise and assist them regarding
recommended dietary change. The intervention did not arrange for any follow-up other than
post-intervention measures. Relative to a control group, the tailored intervention resulted in a
significant decrease in both total and saturated fat (9 g, P = 0.03 and 4.3 g, P = 0.036,
respectively), whereas a nontailored newsletter did not show significant reduction in fat. Neither
intervention arm achieved significant increases in fruit and vegetable intake.
Summary of the Effectiveness of Dietary Counseling
The existing literature examining the effect of dietary counseling for patients in primary
care is complex. Differences in the risk status, intensity of the intervention, setting, use of
effective counseling components, dietary element(s) targeted, and outcome measures used all

Chapter III. Results
55
affect interpretation of data on the ability of counseling to change dietary behavior. We
identified a large number of high-quality studies, many of which used patients and settings very
similar to average US primary care clinics. We also identified several studies that take
advantage of computerized or mailed information to supplement direct face-to-face counseling;
these approaches are becoming more available with new advances in information technology
dissemination.
Overall, dietary counseling produced modest reductions in the consumption of dietary
total and saturated fat and modest increases in the consumption of fruits and vegetables. We did
not identify sufficient evidence to make a conclusion about changes in other dietary elements.
For studies conducted in primary care populations, interventions that were more intensive,
conducted in patients at risk for chronic disease, or employed more of the effective �counseling
elements� produce larger changes in dietary behavior. We did not identify enough studies to
determine the individual effect of specific counseling techniques.
Other Systematic Reviews Related to the Effectiveness of Dietary Interventions
Several other systematic reviews of dietary interventions have involved either a broader
or narrower range of studies relevant to primary care practice150-153 In general, these reviews
support our findings that a variety of counseling interventions result in meaningful dietary
change in fat, saturated fat, fruits and vegetables, and fiber. As in this review, effect sizes vary
widely and tend to be higher among those at higher risk for chronic disease. No clear consensus
emerges from these reviews to suggest that certain intervention components are key to success.

Chapter III. Results
56
Interventions to Enhance Dietary Counseling Behaviors Among Physicians
Of the numerous studies regarding efforts to increase dietary counseling interventions by
physicians and their office staff, only a few have included a rigorous pre-post design with
comparison groups. Kottke et al. documented an increase in reported diet counseling for
cardiovascular disease risk reduction after serving (unbeknownst to the conference attendees)
meals that qualified as the �prudent diet� at a family practice conference.154 The proportion of
physicians who reported that they considered the diet �very palatable� rose from 26% before the
conference to 64% after they were told about the nature of the meals served. Several residency
training programs were able to improve nutrition knowledge or increase dietary counseling
behaviors (or both) through the use of a physician nutrition specialist (among other
strategies).155-157 Finally, a randomized trial demonstrated that computerized reminders
increased physician dietary assessment and counseling along with other cancer prevention
behaviors.158
Key Question No. 5: Adverse Effects and Associated Costs of Behavioral Interventions to Promote Healthy Diets
Concerns have been raised about the safety of reduced-fat diets for growing
children.159,160 Case studies have reported poor growth as a result of low-fat diets,161,162 and
experts have issued warnings of nutritional inadequacy for iron and calcium resulting from low-
fat diets.163 In reviewing evidence for detrimental consequences of dietary fat restriction for
children, Kaplan and Toshima evaluated studies on secular trends, migration, and vegetarian
diets.164 They concluded that some evidence supports the contentions that dietary fat restriction
may have minor effects on growth and that children who are placed on severe dietary restriction

Chapter III. Results
57
during growth periods may experience growth stunting. They cautioned, however, that the
majority of the studies reviewed had serious methodological limitations.
The DISC Study (Dietary Intervention Study in Children) is perhaps the only systematic
attempt to evaluate the impact of a fat-reduced diet during puberty on anthropometric,
biochemical, and dietary measures of nutritional adequacy and safety.15 A recent publication
from this study concluded that a cholesterol-lowering diet for children had no adverse effect on
growth and development.165
Theoretically, assessing weight or dietary status or recommending dietary change to
populations at high risk for eating disorders can pose some adverse effects. However, we are
aware of no case reports or controlled studies regarding this issue.
Key Question No. 6: System Influences that Facilitate or Impede Dietary Intervention
Many patients look to their physicians as the most likely source of nutritional guidance
and perceive the level of expertise of physicians as equal to or just below that of a dietitian.166,167
Older national telephone surveys of practicing physicians and the adult public administered in
1983, 1986, and 1990 showed a steady increase in physician-provided diet counseling over time
and a greater willingness to begin counseling at a lower serum cholesterol level.168,169 Most
surveys suggest that physicians believe in the importance of diet counseling and perceive it to be
within their role.170,171 However, counseling rates are still far from what is recommended by
national guidelines.172,173
The epidemic of obesity in the United States is rising,174 and the USPSTF is expected to
address screening for obesity in 2 future reviews. Hiddink et al. examined surveys over a 5-year
period (1992 through 1997) and demonstrated a trend that can be characterized only as disturbing

Chapter III. Results
58
in this context, namely, a significant decrease in physician documentation and dietary counseling
for obese patients.175 In the same surveys, perceived self-efficacy for counseling dropped and
time as a barrier increased. Physicians may find weight reduction counseling less rewarding
because obesity is such a widespread and intractable diet-related problem.
Barriers to dietary counseling by physicians are numerous. Some frequently reported
barriers include perceived lack of preparation and confidence in their ability to help patients
make lifestyle changes and a overall sense that their efforts are not successful.170,171,175-177 Other
frequently documented obstacles include lack of time, perceived lack of patient interest and
nonadherence by patients, and lack of adequate educational materials.170,171,177-180 Some weak
associations between a physician's personal health habits and counseling behaviors seem to exist,
and at least 1 study has shown that younger female physicians are more likely to be
knowledgeable about diet and provide counseling than other physicians.181,182
In addition to the limited time available for preventive counseling, other system-level
barriers exist. Many physicians cite the lack of nutrition training provided in medical school.
Other describe challenges of reimbursement for physician or staff time spent on nutrition
services,179 as well as unavailability of referral sources and lack of supportive office systems to
facilitate nutrition intervention and monitoring.182
Key Question No. 7: Nutritional Supplementation
Patients with poor nutritional status may benefit from nutritional supplementation. Potter
et al. performed a systematic review of 32 studies of oral nutritional supplements.183 Persons
randomized to receive supplements showed consistently improved changes in body weight
compared with controls (weighted mean difference, 2.1%; 95% CI, 1.6%-2.5%). Treatment
patients were also at lower risk for death (OR, 0.66; 95% CI, 0.48-0.91). Too few data were

Chapter III. Results
59
available to determine whether use of ordinary food in typical daily meals was superior or
inferior to the generally more expensive prepared supplements.
Issues Relating to Quality and Strength of Evidence in this Body of Literature
The evidence for the different key questions ranges from fair to good. Articles we
reviewed had to meet relatively strict inclusion criteria (to optimize internal validity), and we
restricted studies to those conducted in primary care populations (to optimize external validity).
Randomized trials directly measuring the effect of differences in dietary intake on health
outcomes are rare because of the long lag time between dietary "exposure" and disease. Those
who wish to examine these questions must rely on observational data or evidence relating dietary
interventions to change in chronic disease risk factors.
Quality issues related to internal validity that we could not control through inclusion
criteria included the degree to which the intervention can be correctly characterized from the
published description and problems associated with self-report bias. External validity is more
difficult to characterize, given the considerable room for interpretation as to whether an
intervention delivered after referral to another health care provider is "generalizable� to the
population and conditions of general primary care practice. Although this point is not strictly a
quality issue for any one study, the tendency for counseling interventions to test multiple
intervention strategies simultaneously makes it difficult to identify evidence regarding the effect
of any one strategy.

Chapter IV. Discussion and Conclusions
122
Discussion and Conclusions
To provide information for the US Preventive Services Task Force (USPSTF) so that it
can update its previous recommendations concerning counseling to promote a healthy diet, we
conducted systematic reviews of 2 main bodies of literature and attempted to answer 7 key
questions. The first main area included relationships between dietary behaviors and various
health outcomes (the diet-health link) (Key Question No. 1 in Chapter III). The second broad
area (the remaining key questions in Chapter III) dealt with various aspects of counseling
interventions (chiefly in the primary care setting) intended to promote healthy diets (the
counseling-diet link), starting with dietary assessment itself. These topics are briefly discussed
in turn below.
Table 13 summarizes our judgments about the size and quality of the entire body of
evidence. Harris et al.221 provide USPSTF definitions for internal validity, external validity, and
coherence (consistency) of bodies of evidence.
The Link between Dietary Patterns and Health Outcomes
Dietary patterns are important determinants of health status. A wide range of
observational studies and selected randomized trials have documented the association between
multiple dietary behaviors and various health outcomes. The evidence about some specific
dietary relationships remains incomplete. Nonetheless, our review suggests that, in general, a
diet high in fruits, vegetables, whole grains, fish, and calcium and low in saturated and trans-
unsaturated fats is associated with better general health and lower morbidity.

Chapter IV. Discussion and Conclusions
123
Dietary Assessment
Dietary assessment is the first step in identifying patients in need of counseling and in
guiding the practitioner to offer advice that is directly relevant to the patient�s dietary habits and
the factors that influence them. Only about 23% to 42% of physicians nationally counsel their
patients about diet; 90% of primary care providers spend fewer than 5 minutes on dietary
assessment.181,222,223 Although few physicians conduct any sort of dietary assessment, those who
do are significantly more likely to counsel a larger proportion of their patients.179,224
Although the independent effect of dietary assessment on health outcomes has not been
well studied, such evaluations are the first step in nearly all studies that examine the effect of
dietary counseling on behavior or health outcomes. To determine nutritional risk and need for
counseling intervention, primary care providers need practical and valid means of assessing
dietary intake.225 Instruments that can be scored simply and that guide providers to offer food-
based rather than nutrient-based counseling are particularly useful. We identified more than 15
validated and moderately feasible tools for carrying out dietary assessments in primary care
patients and settings. Some are age-specific (infants and toddlers, children, adults, and the
elderly), and others are designed for specific ethnic or cultural populations.
Assessment questions that can inform counseling by assessing mediators to dietary
change (beliefs, barriers, or readiness to make dietary change) are also useful. However, they are
only infrequently included in brief assessments.109,111,112,226
Counseling
Although primary care providers endorse the importance of dietary counseling as part of
their professional role, counseling rates are far from what national guidelines recommend. 172,173

Chapter IV. Discussion and Conclusions
124
Confidence among providers that they can have a positive impact on patient behavior has never
been high, and it may be waning in the face of the growing obesity epidemic in this
country.166,170,171,177
Impact of Counseling on Dietary Behaviors
Numerous interventions are available to help patients attempting to change their diets.
We identified and reviewed a total of 29 separate studies. Nearly half of these dealt with more
than one dietary constituent. In all, 25 of these addressed dietary fat; 11, fruit and vegetable
intake; and 7, dietary fiber. Overall, such interventions had a modest effect in changing short-
term dietary behavior, but the evidence about long-term change is less clear. Publication bias
cannot be ruled out, but our findings and those of other systematic reviews support the
conclusion that dietary counseling interventions with a wide range of patients and in a wide
variety of settings can have a positive impact on dietary fat intake, on fruit and vegetable
consumption, and on dietary fiber. These were reported in a total of 33 articles (12 articles dealt
with 2 or 3 dietary constituents).
Among the factors affecting the response to dietary counseling, higher risk status of the
patient was associated with somewhat greater changes in diet. High-intensity interventions were
more likely to produce large changes than lower-intensity interventions, although many high-
intensity interventions still produced only small or medium changes.
As expected, those interventions deemed most externally valid (most easily replicated in
a standard primary care setting) achieved smaller effects: low- to medium-intensity interventions
conducted by primary care providers in the course of their usual activities had only small effects
on dietary behavior. Interventions using outside research clinic interventions were generally

Chapter IV. Discussion and Conclusions
125
more effective than those within a primary care clinic. No studies evaluated outside referral to
individual counseling or group sessions independent of a research clinic. Computer or mailed
interventions have promising effects, especially on consumption of fruits and vegetables.
Studies using more counseling elements generally seen as proven to be effective had a greater
impact in terms of dietary changes than those using fewer elements.
Only very limited data are available regarding the cost-effectiveness of different dietary
intervention approaches. One study suggested that referral to a dietitian with brief physician
reinforcement was more cost effective than referral alone.200 Adverse effects other than costs
associated with dietary assessment and /or counseling interventions appear to be limited.
Few dietary counseling interventions designed to reach primary care patients reported
including a significant number of the behavior change strategies that we identified from the
health behavior literature. This may be related in part to the inability of researchers fully to
describe their intervention approach because of journal page limitations or other considerations.
Interventions reporting the use of more components were more likely to produce large changes
than those using fewer components.
Research Needs
Several areas of controversy remain in defining the relationship between diet and health
outcomes. In areas such as cancer risk, further research would help resolve the discrepancies
between case-control and cohort studies. More research is also needed to determine better the
optimal amount and type of dietary fats that should be included in healthy diets.
Efficient but dietary assessment tools, particularly for children, should be developed and
validated. Research is also needed to clarify and evaluate the linkages among dietary screening,

Chapter IV. Discussion and Conclusions
126
additional focused dietary assessment, and assessment-based counseling. Particularly important
will be comparisons between these approaches and individual or population-level general dietary
advice.
More in-depth examination of the effectiveness of specific components and intensities of
dietary counseling is warranted. More theory-based studies will contribute to better
understanding of immediate and long-term outcomes of dietary counseling. The lack of studies
evaluating physician referral to health professionals outside their clinic setting for either one-on-
one or group counseling is striking. Studies of dietary interventions delivered by special
research clinics are common, but they are not representative of the resources commonly available
to primary care providers. Cost-effectiveness studies comparing different intervention strategies
relevant to primary care are lacking, but they will be particularly important in evaluating
technology-based intervention strategies. Finally, as we move toward more environmental and
policy-level interventions to support individual-level change, investigations should be carried out
to evaluate the potential role and impact of the primary care provider in either stimulating or
reinforcing these interventions.
References
128
References
1. Whitlock EP, Orleans CT, Pender N, Allan J. Behavioral Counseling Interventions for Health Promotion & Disease Prevention in Health Care Settings. Overview Chapter Prepared by Oregon Health and Science University Evidence-Based Practice Center. Contract No. 290-97-0018. AHRQ Publications No. XX-XXX. Rockville, Md.: Agency for Healthcare Research and Quality; In Press.
2. U.S. Preventive Services Task Force. Counseling to Promote a Healthy Diet. Guide to Clinical Preventive Services (2nd Ed.). Baltimore: Williams and Wilkins; 1996:625-642.
3. U.S. Department of Agriculture and the U.S. Department of Health and Human Services. Nutrition and Your Health: Dietary Guidelines for Americans. 5th ed. Washington, D.C.: 2000.
4. McTigue K, Harris R, Hemphill MB, Bunton A. Screening and Interventions for Overweight and Obesity in Adults. Systematic Evidence Review No. X. Prepared by RTI-University of North Carolina at Chapel Hill Evidence-Based Practice Center. Contract No. 290-97-011. AHRQ Publications No. XX-XXX. Rockville, Md.: Agency for Healthcare Research and Quality; 2002.
5. Katan MB, Grundy SM, Willett WC. Should a low-fat, high-carbohydrate diet be recommended for everyone? N Engl J Med. 1997;337.
6. Posner B.M., Cobb J.L., Bealnger A.J., Cupples L.A., D'Agostino R.B., Stokes J. Dietary lipid predictors of coronary heart disease in men. Arch Intern Med. 1991;151:1181-1187.
7. LaRosa JC, Hunninghake D, Bush D, et al. The cholesterol facts. A summary of the evidence relating dietary fats, serum cholesterol, and coronary heart disease. A joint statement by the American Heart Association and the National Heart, Lung, and Blood Institute. The Task Force on Cholesterol Issues, American Heart Association. Circulation. 1990;81:1721-1733.
8. Ascherio A, Katan MB, Zock PL, Stampfer MJ, Willett WC. Trans fatty acids and coronary heart disease. N Engl J Med. 1999;340:1994-8.
9. Oomen CM, Ocke MC, Feskens EJ, van Erp-Baart MA, Kok FJ, Kromhout D. Association between trans fatty acid intake and 10-year risk of coronary heart disease in the Zutphen Elderly Study: a prospective population-based study. Lancet. 2001;357:746-51.
10. Hooper L, Summerbell C, Higgins J, et al. ver. Issue 3. Oxford: Update Software: The Cochrane Library; 2000.

References
129
11. Ebrahim S, Smith GD. Systematic review of randomised controlled trials of multiple risk factor interventions for preventing coronary heart disease. BMJ. 1997;314:1666-1674.
12. Hjermann I, Velve Byre K, Holme I, Leren P. Effect of diet and smoking intervention on the incidence of coronary heart disease. Report from the Oslo Study Group of a randomised trial in healthy men. Lancet. 1981;2:1303-1310.
13. Neaton JD, Broste S, Cohen L, Fishman EL, Kjelsberg MO, Schoenberger J. The multiple risk factor intervention trial (MRFIT). VII. A comparison of risk factor changes between the two study groups. Prev Med. 1981;10:519-543.
14. Webber LS, Srinivasan SR, Wattigney WA, Berenson GS. Tracking of serum lipids and lipoproteins from childhood to adulthood: The Bogalusa Heart Study. Am J Epidemiol. 1991;133:884-899.
15. Obarzanek E, Hunsberger SA, Van Horn L, et al. Safety of a fat-reduced diet: the Dietary Intervention Study in Children (DISC). Pediatrics. 1997;100:51-59.
16. Gillman MW, Cupples LA, Millen BE, Ellison RC, Wolf PA. Inverse association of dietary fat with development of ischemic stroke in men. JAMA. 1997;278:2145-50.
17. Lewis CJ, Yetley EA. Health claims and observational human data: relation between dietary fat and cancer. Am J Clin Nutr. 1999;69:1357S-1364S.
18. Kolonel LN, Nomura AM, Cooney RV. Dietary fat and prostate cancer: current status. J Natl Cancer Inst. 1999;91:414-428.
19. Hunter DJ, Spiegelman D, Adami HO, et al. Cohort studies of fat intake and the risk of breast cancer--a pooled analysis. N Engl J Med. 1996;334:356-361.
20. Lipkin M, Reddy B, Newmark H, Lamprecht SA. Dietary factors in human colorectal cancer. Annu Rev Nutr. 1999;19:545-586.
21. Howe GR, Aronson KJ, Benito E, et al. The relationship between dietary fat intake and risk of colorectal cancer: evidence from the combined analysis of 13 case-control studies. Cancer Causes Control. 1997;8:215-228.
22. Hopkins PN. Effects of dietary cholesterol on serum cholesterol: a meta-analysis and review. Am J Clin Nutr. 1992;55:1060-70.
23. McNamara DJ. Dietary cholesterol and atherosclerosis. Biochim Biophys Acta. 2000;1529:310-320.
24. Key T, Fraser G, Thorogood M, et al. Mortality in vegetarians and nonvegetarians: detailed findings from a collaborative analysis of 5 prospective studies. Am J Clin Nutr . 1999;70:516S-524S.

References
130
25. Ness AR, Powles JW. Fruit and vegetables, and cardiovascular disease: a review. Int J Epidemiol. 1997;26:1-13.
26. Law MR, Morris JK. By how much does fruit and vegetable consumption reduce the risk of ischaemic heart disease? Eur J Clin Nutr. 1998;52:549-556.
27. Pietinen P, Rimm EB, Korhonen P, et al. Intake of dietary fiber and risk of coronary heart disease in a cohort of Finnish men: the alpha-tocopherol, beta-carotene cancer prevention study. 1996;94: 11:2720-2727.
28. Mann JI, Appleby PN, Key TJ, Thorogood M. Dietary determinants of ischaemic heart disease in health conscious individuals. Heart. 1997;78:450-455.
29. Key TJ, Thorogood M, Appleby PN, Burr ML. Dietary habits and mortality in 11,000 vegetarians and health conscious people: results of a 17 year follow-up. BMJ. 1996;313:775-779.
30. Joshipura KJ , Hu FB, Manson JE, et al. The effect of fruit and vegetable intake on risk for coronary heart disease. Ann Intern Med. 2001;134:1106-1114.
31. Ascherio A, Hennekens C, Willett WC, et al. Prospective study of nutritional factors, blood pressure, and hypertension among US women. Hypertension. 1996;27:1065-1072.
32. Appel LJ, Moore TJ, Obarzanek E, et al. A clinical trial of the effects of dietary patterns on blood pressure. DASH Collaborative Research Group. N Engl J Med. 1997;336:1117-1124.
33. Rouse IL, Beilin LJ, Armstrong BK, Vandongen R. Blood-pressure-lowering effect of a vegetarian diet: controlled trial in normotensive subjects. Lancet. 1983;1:5-10.
34. Margetts BM, Beilin LJ, Vandongen R, Armstrong BK. Vegetarian diet in mild hypertension: a randomized controlled trial. Br Med J. 1986;293:1468-1471.
35. Zino S, Skeaff M, Williams S, Mann J. Randomized controlled trial of effect of fruit and vegetable consumption on plasma concentrations of lipids and antioxidants. BMJ. 1997;314:1787-1791.
36. Steinmetz K, Potter J. Vegetables, fruit, and cancer prevention: a review. J Am Diet Assoc. 1996;96:1027-1039.
37. Feskanich D, Ziegler RG, Michaud DS, et al. Prospective study of fruit and vegetable consumption and risk of lung cancer among men and women. J Natl Cancer Inst. 2000;92:1812-1823.
38. Smith-Warner SA, Spiegelman D, Adami HO, et al. Types of dietary fat and breast cancer: a pooled analysis of cohort studies. Int J Cancer. 2001;92:767-774.

References
131
39. Gandini S, Merzenich H, Robertson C, Boyle P. Meta-analysis of studies on breast cancer risk and diet: the role of fruit and vegetable consumption and the intake of associated micronutrients. Eur J Cancer. 2000;36:636-646.
40. Bazzano LA, He J, Ogden LG, et al. Legume consumption and risk of coronary heart disease in US men and women: NHANES I Epidemiologic Follow-up Study. Arch Intern Med. 2001;161:2573-2578.
41. Kushi LH, Meyer KA, Jacobs DR. Cereals, legumes, and chronic disease risk reduction: evidence from epidemiologic studies. Am J Clin Nutr. 1999;70:451S-458S.
42. Jacobs DR, Pereira MA, Meyer KA, Kushi LH. Fiber from whole grains, but not refined grains, is inversely associated with all-cause mortality in older women: the Iowa women's health study. J Am Coll Nutr. 2000;19:326S-330S.
43. Liu S, Manson JE, Stampfer MJ, et al. Whole grain consumption and risk of ischemic stroke in women: A prospective study. JAMA. 2000;284:1534-1540.
44. Kromhout D, Bosschieter EB, de Lezenne Coulander C. Dietary fibre and 10-year mortality from coronary heart disease, cancer, and all causes. The Zutphen study. Lancet. 1982;2:518-522.
45. Burr ML, Fehily AM, Gilbert JF, et al. Effects of changes in fat, fish, and fibre intakes on death and myocardial reinfarction: diet and reinfarction trial (DART). Lancet. 1989;2:757-761.
46. Glore S, Van Treeck D, Knehans A, Guild. M. Soluble Fiber and serum lipids. J Am Diet Assoc. 1994;94:425-436.
47. Brown L, Rosner B, Willett WW, Sacks FM. Cholesterol-lowering effects of dietary fiber: a meta-analysis. Am J Clin Nutr. 1999;69:30-42.
48. He J, Whelton PK. Effect of dietary fiber and protein intake on blood pressure: a review of epidemiologic evidence. Clin Exp Hypertens. 1999;21:785-796.
49. Howe GR, Hirohata T, Hislop TG, Iscovich JM, Yuan JM, Katsouyanni K. Dietary Factors and Risk of Breast Cancer: Combined Analysis of 12 case-Control Studies. J Nat Cancer Inst. 1990;82:561-569.
50. Kim Y. AGA technical review: impact of dietary fiber on colon cancer occurrence. Gastroenterology. 2000;118:1235-1257.
51. Schatzkin A, Lanza E, Corle D, et al. Lack of effect of a low-fat, high-fiber diet on the recurrence of colorectal adenomas. Polyp Prevention Trial Study Group. N Engl J Med. 2000;342:1149-1155.
52. Alberts D, Martinez M, Roe D, et al. Lack of effect of a high-fiber cereal supplement on the recurrence of colorectal adenomas. N Engl J Med. 2000;342:1156-1162.

References
132
53. Marckmann P, Gronbaek M. Fish consumption and coronary heart disease mortality. A systematic review of prospective cohort studies. Eur J Clin Nutr. 1999;53:585-590.
54. Singh RB, Rastogi SS, Sircar AR, Mehta PJ, Sharma KK. Dietary strategies for risk-factor modification to prevent cardiovascular diseases. Nutrition. 1991;7:210-214.
55. GISSI-Prevenzione Investigators (Gruppo Italiano per lo Studio della Sopravvivenza nell'Infarto miocardico). Dietary supplementation with n-3 polyunsaturated fatty acids and vitamin E after myocardial infarction: results of the GISSI-Prevenzione trial. Lancet. 1999;354:447-455.
56. Law MR, Frost CD, Wald NJ. By how much does dietary salt reduction lower blood pressure? BMJ. 1991;302:811-815.
57. Midgley J, Matthew A, Greenwood C, Logan A. Effect of reduced dietary sodium on blood pressure: a meta-analysis of randomized controlled trials. JAMA. 1996;275:1590-1597.
58. Cutler J, Follmann D, Allender P. Randomized trials of sodium reduction: an overview. Am J Clin Nutr . 1997;65:643S-651S.
59. The Trials of Hypertension Prevention Collaborative Research Group. Effects of weight loss and sodium reduction intervention on blood pressure and hypertension incidence in overweight people with high- normal blood pressure. The Trials of Hypertension Prevention, phase II. Arch Intern Med. 1997;157:657-667.
60. Hypertension Prevention Trial Research Group. The Hypertension Prevention Trial: three-year effects of dietary changes on blood pressure. Arch Intern Med. 1990;150:153-62.
61. Siani A, Strazzullo P. Dietary potassium and cardiovascular disease: clinical applications. J Cardiovasc Risk. 2000;7:15-21.
62. Whelton PK, He J, Cutler JA, et al. Effects of oral potassium on blood pressure. Meta-analysis of randomized controlled clinical trials. JAMA. 1997;277:1624-1632.
63. Feskanich D, Willett WC, Stampfer MJ, Colditz GA. Milk, dietary calcium, and bone fractures in women: a 12-year prospective study. Am J Public Health. 1997;87:992-997.
64. Cumming R. Calcium intake and bone mass: a quantitative review of the evidence. Calcified Tissue International. 1990;47:194-201.
65. Heaney RP. Calcium, dairy products and osteoporosis. J Am Coll Nutr. 2000;19:83S-99S.
66. Giovannucci E, Rimm EB, Wolk A, et al. Calcium and fructose intake in relation to risk of prostate cancer. Cancer Res. 1998;58:442-7.

References
133
67. Antonov A. Children born during the siege in Leningrad in 1942. J Pediatr. 1947;30:250-295.
68. Stein A, Susser M, Saenger G, et al. Famine and human development: the Dutch hunger winter of 1944/45. New York, NY: Oxford University Press; 1974.
69. Singer JE, Westphal M, Niswander K. Relationship of weight gain during pregnancy to birth weight and infant growth and development in the first year of life. Obstet Gynecol. 1968;31:417-23.
70. Institute of Medicine, Subcommittee on Nutritional Status and Weight Gain During Pregnancy. Nutrition during pregnancy. Washington, D.C.: National Academy Press; 1990.
71. Institute of Medicine. Preventing low birthweight. Washington, D.C.: National Academy Press; 1985.
72. National Research Council, Food and Nutrition Board. Committee on Dietary Allowances. Washington, D.C.: National Academy Press; 1989.
73. Ammerman A, Haines P, DeVellis R, et al. A brief dietary assessment to guide cholesterol reduction in low-income individuals: design and validation. J Am Diet Assoc. 1991;91:12385-1390.
74. Angus RM, Sambrook PN, Pocock NA, Eisman JA. A simple method for assessing calcium intake in Caucasian women. J Am Diet Assoc. 1989;89:209-214.
75. Block G, Gillespie C, Rosenbaum EH, Jenson C. A rapid food screener to assess fat and fruit and vegetable intake. Am J Prev Med. 2000;18:284-288.
76. Blumberg SJ, Bialostosky K, Hamilton WL, Briefel RR. The effectiveness of a short form of the Household Food Security Scale. Am J Public Health. 1999;89:1231-1234.
77. Conner SJ, Gustafson JR, Sexton G, Becker N, Artaud-Wild S, Conner WE. The diet habit survey: a new method of dietary assessment that relates to plasma choolesterol changes. J Am Diet Assoc. 1992;92:41-47.
78. Gans K, Sundaram SMJ, Hixson M, Linnan L, Carleton R. Rate your plate: an eating pattern assessment and educational tool used at cholesterol screening and education programs. J Nutr Educ. 1993;25:29-36.
79. Heller RF, Pedoe HD, Rose G. A simple method of assessing the effect of dietary advice to reduce plasma cholesterol. Prev Med. 1981;10:364-370.
80. Knapp JA, Hazuda HP, Haffner SM, Yonug EA, Stern MP. A saturated fat/cholesterol avoidance scale: sex and ethnic differences in a biethnic population. J Am Diet Assoc. 1988;88:172-177.

References
134
81. Kris-Etherton P, Eissenstat B, Jaax S, et al. Validation for MEDFICTS, a dietary assessment instrument for evaluating adherence to total and saturated fat recommendations of the National Cholesterol Education Program Step 1 and Step 2 diets. J Am Diet Assoc. 2001;101:81-86.
82. Kristal A, Shattuck A, Henry H, Fowler A. Rapid assessment of dietary intake of fat, fiber, and saturated fat: validity of an instrument suitable for community intervention research and nutritional surveilllance. Am J Health Promot. 1990;4:288-295.
83. Kristal A, Shattuck A, Henry H. Patterns of dietary behavior associated with selecting diets low in fat: reliability and validity of a behavioral approach to dietary assessment. J Am Diet Assoc. 1990;90:214-220.
84. Pietinen P, Hartman AM, Haapa E, et al. Reproducibility and validity of dietary assessment instruments. I. A self-administered food use questionnaire with a portion size picture booklet. Am J Epidemiol. 1988;128:655-666.
85. Peters JR, Quiter ES, Brekke ML, et al. The Eating Pattern Assessment Tool: a simple instrument for assessing dietary fat and cholesterol intake. J Am Diet Assoc. 1994;94:1008-1013.
86. Retzlaff BM, Dowdy AA, Walden CE, Bovbjerg VE, Knopp RH. The Northwest Lipid Research Clinic Fat Intake Scale: validation and utility. Am J Public Health. 1997;87:181-185.
87. Rifas-Shiman SL, Willett WC, Lobb R, Kotch J, Dart C, Gillman MW. PrimeScreen, a brief dietary screening tool: reproducibility and comparability with both a longer food frequency questionnaire and biomarkers. Public Health Nutr. 2001;4:249-254.
88. Roe L, Strong C, Whiteside C, Neil A, Mant D. Dietary intervention in primary care: validity of the DINE method for diet assessment. Fam Pract. 1994;11:375-381.
89. Serdula M, Coates R, Byers T, et al. Evaluation of a brief telephone questionnaire to estimate fruit and vegetable consumption in diverse study populations. Epidemiology. 1993;4:455-463.
90. Shannon J, Kristal AR, Curry SJ, Beresford SA. Application of a behavioral approach to measuring dietary change: the fat- and fiber-related diet behavior questionnaire. Cancer Epidemiol Biomarkers Prev. 1997;6:355-361.
91. Kuczmarski RJ, Ogden CL, Grummer-Strawn LM, et al. CDC growth charts: United States. Adv Data. 2000;1-27.
92. Boutry M, Needlman R. Use of diet history in the screening of iron deficiency. Pediatrics. 1996;98:1138-1142.

References
135
93. US Department of Health and Human Services. Recommendations to prevent and control iron deficiency in the United States. Morb Mortal Wkly Rep. 1998;47:1-29.
94. Bogen DL, Duggan AK, Dover GJ, Wilson MH. Screening for iron deficiency anemia by dietary history in a high-risk population. Pediatrics. 2000;105:1254-1259.
95. Rockett HR, Colditz GA. Assessing diets of children and adolescents. Am J Clin Nutr. 1997;65:1116S-1122S.
96. Van Horn LV, Gernhofer N, Moag-Stahlberg A, et al. Dietary assessment in children using electronic methods: telephones and tape recorders. J Am Diet Assoc. 1990;90:412-416.
97. Lytle LA, Nichaman MZ, Obarzanek E, et al. Validation of 24-hour recalls assisted by food records in third-grade children. The CATCH Collaborative Group. J Am Diet Assoc. 1993;93:1431-1436.
98. Calfas KJ, Zabinski MF, Rupp J. Practical nutrition assessment in primary care settings: a review. Am J Prev Med. 2000;18:289-299.
99. Little P, Barnett J, Margetts B, et al. The validity of dietary assessment in general practice. J Epidemiol Commun Health. 1999;53:165-172.
100. Johnsen C, East JM, Glassman P. Management of malnutrition in the elderly and the appropriate use of commercially manufactured oral nutritional supplements. J Nutr Health Aging. 2000;4:42-46.
101. Boult CB, Krinke UB, Urdangarin CF, Skarin V. The validity of nutritional status as a marker for future disability and depressive symptoms among high-risk older adults. Am J Prev Med. 1999;47:995-999.
102. Vellas B, Guigoz Y, Garry PJ, et al. The Mini Nutritional Assessment (MNA) and its use in grading the nutritional state of elderly patients. Nutrition. 1999;15:116-122.
103. Levine BS, Wigren MM, Chapman DS, Kerner JF, Bergman RL, Rivlin RS. A national survey of attitudes and practices of primary-care physicians relating to nutrition: strategies for enhancing the use of clinical nutrition in medical practice. Am J Clin Nutr. 1993;57:115-119.
104. Thomas DR, Ashmen W, Morley JE, Evans WJ. Nutritional management in long-term care: development of a clinical guideline. Council for Nutritional Strategies in Long-Term Care. J Gerontol A Biol Sci Med Sci. 2000;55:M725-M734.
105. Wolinsky FD, Coe RM, McIntosh WmA, et al. Progress in the development of a nutritional risk index. 1990;120:1549-1553.
106. Wellman NS. The nutrition screening initiative. 1994;52: 8:S44-S47.

References
136
107. Contento I, Randell J, Basch C. Review and analysis of evaluation measures used in nutrition education intervention research. J Nutr Educ Behav. 2002;34:2-25.
108. Prochaska JO, DiClemente CC, Norcross JC. In search of how people change. Applications to addictive behaviors. Am Psychol. 1992;47:1102-1114.
109. Greene G, Rossi S, Reed G, Willey C, Prochaska J. Stages of change for reducing dietary fat to 30% of energy or less. J Am Diet Assoc. 1994;94:1105-1110; quiz 1111-1112.
110. Greene G, Rossi S, Rossi J, Velicer W, Fava J, Prochaska J . Dietary applications of the stages of change model. J Am Diet Assoc. 1999;99:673-678.
111. Glanz K, Patterson RE, Kristal AR, et al. Stages of change in adopting healthy diets: fat, fiber, and correlates of nutrient intake. Health Educ Q. 1994;21:499-519.
112. Haire-Joshu D, Auslander W, Houston C, Williams J. Staging of dietary patterns among African American women. Health Educ Behav. 1999;26:90-102.
113. Contento I, Balch G, Bronner Y, et al. The effectiveness of nutrition education and implications for nutrition education policy, programs, and research: A review of research. J Nutr Educ. 1995;27.
114. Life Sciences Research Office, Federation of American Societies for Experimental Biology. Core indicators of nutritional state for difficult-to-sample populations. J Nutr. 1990;120 (Suppl):1559-1600.
115. Hamilton W, Cook J, Thompson W, et al. Household food insecurity in the United States in 1995: Summary report of the Food Security Measurement Project. Alexandria, VA: US Dept. of Agriculture, Food and Consumer Service; 1997.
116. Carlson S, Andrews M, Bickel G. Measuring food insecurity and hunger in the United States: development of a national benchmark measure and prevalence estimates. J Nutr. 1999;129 (Suppl):510S-516S.
117. Elkeles RS, Diamond JR, Poulter C, et al. Cardiovascular outcomes in type 2 diabetes: A double-blind placebo-controlled study of bezafibrate: the St. Mary's, Ealing, Northwick Park Diabetes Cardiovascular Disease Prevention (SENDCAP) Study. Diabetes Care. 1998;21:641-648.
118. Coates RJ, Bowen DJ, Kristal AR, et al. The Women's Health Trial Feasibility Study in Minority Populations: changes in dietary intakes. Am J Epidemiol. 1999;149:1104-1112.
119. Heller RF, Walker RJ, Boyle CA, O'Connell DL, Rusakaniko S, Dobson AJ. A randomised controlled trial of a dietary advice program for relatives of heart attack victims. Med J Aust. 1994;161:529-531.

References
137
120. Lee-Han H, Cousins M, Beaton M, et al. Compliance in a randomized clinical trial of dietary fat reduction in patients with breast dysplasia. Am J Clin Nutr. 1988;48:575-586.
121. Ornish D, Brown SE, Scherwitz LW, et al. Can lifestyle changes reverse coronary heart disease? The Lifestyle Heart Trial. Lancet. 1990;336:129-133.
122. Simkin-Silverman LR, Wing RR. Management of obesity in primary care. Obesity Research. 1997; 5:603-612.
123. Campbell MK , DeVellis BM, Strecher VJ, Ammerman AS, DeVellis RF, Sandler RS. Improving dietary behavior: the effectiveness of tailored messages in primary care settings. Am J Public Health. 1994;84:783-787.
124. Campbell NC , Ritchie LD, Thain J, Deans HG, Rawles JM, Squair JL. Secondary prevention in coronary heart disease: a randomised trial of nurse led clinics in primary care. Heart. 1998;80:447-452.
125. Delichatsios HK, Friedman RH, Glanz K, et al. Randomized trial of a "talking computer" to improve adults' eating habits. Am J Health Promot. 2001;15:215-24.
126. Keyserling TC, Ammerman AS, Davis CE, Mok MC, Garrett J, Simpson RJ. A randomized controlled trial of a physician-directed treatment program for low-income patients with high blood cholesterol: the Southeast Cholesterol Project. Arch Fam Med. 1997;6:135-145.
127. Knutsen SF, Knutsen R. The Tromso Survey: the Family Intervention study--the effect of intervention on some coronary risk factors and dietary habits, a 6-year follow-up. Prev Med. 1991;20:197-212.
128. Lindholm LH , Ekbom T, Dash C, Eriksson M, Tibblin G, Schersten B. The impact of health care advice given in primary care on cardiovascular risk. CELL Study Group. BMJ. 1995;310:1105-1109.
129. Steptoe A, Doherty S, Rink E, Kerry S, Kendrick T, Hilton S. Behavioural counselling in general practice for the promotion of healthy behaviour among adults at increased risk of coronary heart disease: randomised trial. BMJ. 1999;319:943-947; discussion 947-948.
130. Beresford SA, Farmer EM, Feingold L, Graves KL, Sumner SK, Baker RM. Evaluation of a self-help dietary intervention in a primary care setting. Am J Public Health. 1992;82:79-84.
131. Beresford SA, Curry SJ, Kristal AR, Lazovich D, Feng Z, Wagner EH. A dietary intervention in primary care practice: the Eating Patterns Study. Am J Public Health. 1997;87:610-616.
132. Kristal AR, Curry SJ, Shattuck AL, Feng Z, Li S. A randomized trial of a tailored, self-

References
138
help dietary intervention: the Puget Sound Eating Patterns study. Prev Med. 2000;31:380-9.
133. Cupples ME, McKnight A. Randomised controlled trial of health promotion in general practice for patients at high cardiovascular risk. BMJ. 1994;309:993-996.
134. Delichatsios HK, Hunt MK, Lobb R, Emmons K, Gillman MW. EatSmart: efficacy of a multifaceted preventive nutrition intervention in clinical practice. Prev Med. 2001;33:91-98.
135. Hunt IF, Jacob M, Ostegard NJ, Masri G, Clark VA, Coulson AH. Effect of nutrition education on the nutritional status of low-income pregnant women of Mexican descent. Am J Clin Nutr. 1976;29:675-684.
136. Mojonnier ML, Hall Y, Berkson DM, et al. Experience in changing food habits of hyperlipidemic men and women. J Am Diet Assoc. 1980;77:140-148.
137. Ockene IS, Hebert JR, Ockene JK, et al. Effect of physician-delivered nutrition counseling training and an office-support program on saturated fat intake, weight, and serum lipid measurements in a hyperlipidemic population: Worcester Area Trial for Counseling in Hyperlipidemia (WATCH). Arch Int Med. 1999;159:725-731.
138. Roderick P, Ruddock V, Hunt P, Miller G. A randomized trial to evaluate the effectiveness of dietary advice by practice nurses in lowering diet-related coronary heart disease risk. Br J Gen Pract. 1997;47:7-12.
139. Ockene IS, Hebert JR, Ockene JK, Merriam PA, Hurley TG, Saperia GM. Effect of training and a structured office practice on physician-delivered nutrition counseling: the Worcester-Area Trial for Counseling in Hyperlipidemia (WATCH). Am J Prev Med. 1996;12:252-258.
140. Masley S, Phillips S, Copeland JR. Group office visits change dietary habits of patients with coronary artery disease-the dietary intervention and evaluation trial (D.I.E.T.). J Fam Pract. 2001;50:235-239.
141. Henderson MM, Kushi LH, Thompson DJ, et al. Feasibility of a randomized trial of a low-fat diet for the prevention of breast cancer: dietary compliance in the Women's Health Trial Vanguard Study. Prev Med. 1990; 19:115-133.
142. Insull W Jr , Henderson MM, Prentice RL, et al. Results of a randomized feasibility study of a low-fat diet. Arch Intern Med. 1990;150:421-427.
143. Kristal AR, White E, Shattuck AL, et al. Long-term maintenance of a low-fat diet: durability of fat-related dietary habits in the Women's Health Trial. J Am Diet Assoc. 1992;92:553-559.
144. White E, Shattuck AL, Kristal AR, et al. Maintenance of a low-fat diet: follow-up of the

References
139
Women's Health Trial. Cancer Epidemiol Biomarkers Prev. 1992;1:315-323.
145. Maskarinec G, Chan CL, Meng L, Franke AA, Cooney RV. Exploring the feasibility and effects of a high-fruit and -vegetable diet in healthy women. Cancer Epidemiol Biomarkers Prev. 1999;8:919-924.
146. Siero FW, Broer J, Bemelmans WJ, Meyboom-de Jong BM. Impact of group nutrition education and surplus value of Prochaska- based stage-matched information on health-related cognitions and on Mediterranean nutrition behavior. Health Educ Res. 2000;15:635-647.
147. Lutz SF, Ammerman AS, Atwood JR, Campbell MK, DeVellis RF, Rosamond WD. Innovative newsletter interventions improve fruit and vegetable consumption in healthy adults. J Am Diet Assoc. 1999;99:705-709.
148. Baron JA, Gleason R, Crowe B, Mann JI. Preliminary trial of the effect of general practice based nutritional advice. Br J Gen Pract. 1990;40:137-141.
149. Fiore M, Bailey W, Cohen S, et al.; Treating Tobacco Use and Dependence. Clinical Practice Guideline. Rockville, Md.: US Department of Health and Human Services, PHS; 2000.
150. Ammerman A, Lindquist C, Hersey J, et al. Evidence report on the efficacy of interventions to modify dietary behavior related to evidence risk. Rockville, MD: Agency for Healthcare Research and Quality; 2001.
151. Mullen PD, Simons-Morton DG, Ramirez G, Frankowski RF, Green LW, Mains DA. A meta-analysis of trials evaluating patient education and counseling for three groups of preventive health behaviors. 1997;32:157-173.
152. Thompson R, Summerbell C, Hooper L, et al. Dietary advice given by a dietician versus other health professional or self-help resources to reduce blood cholesterol (Cochrane review). The Cochrane Libray. 2001.
153. Shannon BM, Tershakovec AM, Martel JK, et al. Reduction of elevated LDL-cholesterol levels of 4- to 10-year-old children through home-based dietary education. Pediatrics. 1994;94:923-927.
154. Kottke TE, Foels JK, Hill C, Choi T, Fenderson DA. Perceived palatability of the prudent diet: results of a dietary demonstration for physicians. Prev Med. 1983;12:588-594.
155. Jack BW, Gans KM, McQuade W, et al. A successful physician training program in cholesterol screening and management. Prev Med. 1991;20:364-377.
156. Lazarus K, Weinsier RL, Boker JR. Nutrition knowledge and practices of physicians in a family-practice residency program: the effect of an education program provided by a physician nutrition specialist. Am J Clin Nutr. 1993;58:319-335.
References
140
157. Kirby RK, Chauncey KB, Jones BG. The effectiveness of a nutrition education program for family practice residents conducted by a family practice resident-dietitian. Fam Med. 1995;27:576-580.
158. McPhee SJ, Bird JA, Fordham D, Rodnick JE, Osborn EH. Promoting cancer prevention activities by primary care physicians. Results of a randomized, controlled trial. JAMA. 1991;266:538-544.
159. Olson RE. The dietary recommendations of the American Academy of Pediatrics. Am J Clin Nutr . 1995;61:271-273.
160. Anderson G. Factors affecting nutritional lifestyle changes in children. Prevention of Athersclerosis and Hypertension Beginning in Youth. Philadelphia, PA: 1994:3-10.
161. Pugliese MT , Weyman-Daum M, Moses N, Lifshitz F. Parental health beliefs as a cause of nonorganic failure to thrive. Pediatrics. 1987;80:175-182.
162. Lifshitz F, Moses N. Growth failure. A complication of dietary treatment of hypercholesterolemia. Am J Dis Child. 1989;143:537-542.
163. Mauer AM. Should there be intervention to alter serum lipids in children? Annu Rev Nutr. 1991;11:375-391.
164. Kaplan RM, Toshima MT. Does a reduced fat diet cause retardation in child growth? Prev Med. 1992;21:33-52.
165. Obarzanek E, Kimm SY, Barton BA, et al. Long-Term Safety and Efficacy of a Cholesterol-Lowering Diet in Children With Elevated Low-Density Lipoprotein Cholesterol: Seven-Year Results of the Dietary Intervention Study in Children (DISC). Pediatrics. 2001;107:256-264.
166. Hiddink GJ, Hautvast JG, van Woerkum CM, Fieren CJ, van 't Hof MA. Information sources and strategies of nutrition guidance used by primary care physicians. Am J Clin Nutr. 1997;65:1996S-2003S.
167. Serra-Majem LL, Calvo JR, Male ML, Ribas L, Lainez P. Population attitudes towards changing dietary habits and reliance on general practitioners in Spain. Eur J Clin Nutr. 1999;53 Suppl 2:S58-S61.
168. Schucker B, Wittes JT, Cutler JA, et al. Change in physician perspective on cholesterol and heart disease. 1987;258: 24:3521-3526.
169. Schucker B, Wittes JT, Santanello NC, et al. Change in cholesterol awareness and action. Results from national physician and public surveys. Arch Intern Med. 1991;151:666-673.
170. Ammerman AS, DeVellis RF, Carey TS, et al. Physician-based diet counseling for

References
141
cholesterol reduction: current practices, determinants, and strategies for improvement. Prev Med. 1993;22:96-109.
171. Morris SE, Lean ME, Hankey CR, Hunter C. Who gets what treatment for obesity? A survey of GPs in Scotland. Eur J Clin Nutr. 1999;53 Suppl 2:S44-S48.
172. Zoorob RJ, Mainous AG3. Practice patterns of rural family physicians based on the American Diabetes Association standards of care. J Commun Health. 1996;21:175-182.
173. Rafferty M. Prevention services in primary care: taking time, setting priorities. West J Med. 1998;169:269-275.
174. Troiano RP, Flegal KM, Kuczmarski RJ, Campbell SM, Johnson CL. Overweight prevalence and trends for children and adolescents. The National Health and Nutrition Examination Surveys, 1963 to 1991. Arch Pediatr Adolesc Med. 1995;149:1085-1091.
175. Hiddink GJ, Hautvast JG, van Woerkum CM, van't Hof MA, Fieren CJ. Cross-sectional and longitudinal analyses of nutrition guidance by primary care physicians. Eur J Clin Nutri. 1999;53 Suppl 2:S35-S43.
176. Mann KV, Putnam W. Physicians' perceptions of their role in cardiovascular risk reduction. Prev Med. 1989;18:45-48.
177. Holund U, Thomassen A, Boysen G, et al. Importance of diet and sex in prevention of coronary artery disease, cancer, osteoporosis, and overweight or underweight: a study of attitudes and practices of Danish primary care physicians. Am J Clin Nutr. 1997;65:2004S-2006S.
178. Kottke TE, Foels JK, Hill C, Choi T, Fenderson DA. Nutrition counseling in private practice: attitudes and activities of family physicians. Prev Med. 1984;13:219-225.
179. Secker-Walker RH, Morrow AL, Kresnow M, Flynn BS, Hochheiser LI. Family physicians' attitudes about dietary advice. Fam Pract Res J. 1991;11:161-170.
180. Kushner RF. Barriers to providing nutrition counseling by physicians: a survey of primary care practitioners. Prev Med. 1995;24:546-552.
181. Shea S, Basch CE, Zybert P. Correlates of internists' practices in caring for patients with elevated serum cholesterol. Nutrition. 1990;4:421-428.
182. Glanz K. Review of nutritional attitudes and counseling practices of primary care physicians. Am J Clin Nutr. 1997;65:2016S-2019S.
183. Potter J, Langhorne P, Roberts M. Routine protein energy supplementation in adults: systematic review. BMJ. 1998;317:495-501.

References
142
184. Aubin M, Godin G, Vezina L, Maziade J, Desharnais R. Hypercholesterolemia screening. Does knowledge of blood cholesterol level affect dietary fat intake? Can Fam Physician. 1998;44:1289-1297.
185. Bakx JC, Stafleu A, van Staveren WA, van den Hoogen HJ, van Weel C. Long-term effect of nutritional counseling: a study in family medicine. Am J Clin Nutr. 1997;65:1946S-1950S.
186. Barratt A, Reznik R, Irwig L, et al. Work-site cholesterol screening and dietary intervention: the Staff Healthy Heart Project. Steering Committee. Am J Public Health. 1994;84:779-82.
187. Brannon SD, Tershakovec AM, Shannon BM. The cost-effectiveness of alternative methods of nutrition education for hypercholesterolemic children. Am J Public Health. 1997;87:1967-1970.
188. Caggiula AW , Watson JE, Kuller LH, et al. Cholesterol-lowering intervention program. Effect of the step I diet in community office practices. Arch Intern Med. 1996;156:1205-1213.
189. Crouch M, Sallis JF, Farquhar JW, et al. Personal and mediated health counseling for sustained dietary reduction of hypercholesterolemia. Prev Med. 1986;15:282-91.
190. DeBusk RF, Miller NH, Superko HR, et al. A case-management system for coronary risk factor modification after acute myocardial infarction. Ann Intern Med. 1994;120:721-9.
191. de Lorgeril M. [Oxidative stress and lipid-protein peroxidation after cardiac transplantation. New hypotheses for explaining pathogenesis of accelerated forms of ischemic heart disease]. Arch Mal Coeur Vaiss. 1994;87:1467-73.
192. Dyson PA, Hammersley MS, Morris RJ, Holman RR, Turner RC. The Fasting Hyperglycaemia Study: II. Randomized controlled trial of reinforced healthy-living advice in subjects with increased but not diabetic fasting plasma glucose. Metabolism. 1997;46:50-55.
193. Ershoff DH, Aaronson NK, Danaher BG, Wasserman FW. Behavioral, health, and cost outcomes of an HMO-based prenatal health education program. Public Health Reports. 1983;98:536-547.
194. Family Heart Study Group. Randomised controlled trial evaluating cardiovascular screening and intervention in general practice: principal results of British family heart study. BMJ. 1994;308:313-320.
195. Fletcher V. An individualized teaching programme following primary uncomplicated myocardial infarction. J Adv Nurs. 1987;12:195-200.
196. Foreyt JP, Scott LW, Mitchell RE, Gotto AM. Plasma lipid changes in the normal

References
143
population following behavioral treatment. J Consult Clin Psychol. 1979;47:440-452.
197. George SM, Latham MC, Abel R, Ethirajan N, Frongillo EAJ. Evaluation of effectiveness of good growth monitoring in south Indian villages . Lancet. 1993;342:348-352.
198. Gosselin P, Verreault R, Gaudreault C, Guillemette J. [Dietary treatment of mild to moderate hypercholesterolemia. Effectiveness of different interventions]. [French]. Can Fam Physician. 1996;42:2160-2167.
199. Heller RF, Elliott H, Bray AE, Alabaster M. Reducing blood cholesterol levels in patients with peripheral vascular disease: dietitian or diet fact sheet? Med J Aust. 1989;151:566-568.
200. Henkin Y, Shai I, Zuk R, et al. Dietary treatment of hypercholesterolemia: do dieticians do it better? A randomized, controlled trial. Am J Med. 2000;109:549-555.
201. Howard-Pitney B, Winkleby MA, Albright CL, Bruce B, Fortmann SP. The Stanford Nutrition Action Program: a dietary fat intervention for low-literacy adults. Am J Public Health. 1997;87:1971-1976.
202. Kuehl KS, Cockerham JT, Hitchings M, Slater D, Nixon G, Rifai N. Effective control of hypercholesterolemia in children with dietary interventions based in pediatric practice. Prev Med. 1993;22:154-166.
203. Luepker RV, Smith LK, Rothchild SS, Gillis A, Kochman L, Warbasse JR. Management of hypercholesterolemia: evaluation of practical clinical approaches in healthy young adults. Am J Cardiol. 1978;41:590-596.
204. Lytle LA, Stone EJ, Nichaman MZ, et al. Changes in nutrient intakes of elementary school children following a school-based intervention: results from the CATCH Study. Prev Med . 1996;25:465-477.
205. Miettinen TA, Huttunen JK, Naukkarinen V, et al. Multifactorial primary prevention of cardiovascular diseases in middle- aged men. Risk factor changes, incidence, and mortality. JAMA. 1985;254:2097-2102.
206. Multiple risk factor intervention trial. Risk factor changes and mortality results. Multiple Risk Factor Intervention Trial Research Group. JAMA. 1982;248:1465-1477.
207. Naglak M, Mitchell DC, Kris-Etherton P, Harkness W, Pearson TA. What to consider when conducting a cost-effectiveness analysis in a clinical setting. J Am Diet Assoc. 1998;98:1149-1154.
208. Neil HA, Roe L, Godlee RJ, et al. Randomised trial of lipid lowering dietary advice in general practice: the effects on serum lipids, lipoproteins, and antioxidants. BMJ. 1995;310:569-573.
References
144
209. Neyses L, Dorst K, Michaelis J, et al. Compliance with salt restriction as a limiting factor in the primary prevention of hypertension. J Hypertens Suppl. 1985;3:S87-S90.
210. Nikolaus T, Schlierf G, Vogel G, Schuler G, Wagner I. Treatment of coronary heart disease with diet and exercise--problems of compliance. Ann Nutr Metab. 1991;35:1-7.
211. Ornish D. Avoiding revascularization with lifestyle changes: The Multicenter Lifestyle Demonstration Project. Am J Cardiol. 1998;82:72T-76T.
212. Imperial Cancer Research Fund OXCHECK Study Group. Effectiveness of health checks conducted by nurses in primary care: results of the OXCHECK study after one year. Imperial Cancer Research Fund OXCHECK Study Group . BMJ. 1994;308:308-312.
213. Imperial Cancer Research Fund OXCHECK Study Group. Effectiveness of health checks conducted by nurses in primary care: final results of the OXCHECK study. Imperial Cancer Research Fund OXCHECK Study Group. BMJ. 1995;310:1099-1104.
214. Pritchard DA, Hyndman J, Taba F. Nutritional counseling in general practice: a cost effective analysis. J Epidemiol Community Health. 1999;53:311-316.
215. Ridgeway NA , Harvill DR, Harvill LM, Falin TM, Forester GM, Gose OD. Improved control of type 2 diabetes mellitus: a practical education/behavior modification program in a primary care clinic. South Med J. 1999;92:667-672.
216. Smith LK, Luepker RV, Rothchild SS, Gillis A, Kochman L, Warbasse JR. Management of type IV hyperlipoproteinemia. Evaluation of practical clinical approaches. Ann Intern Med. 1976;84:22-28.
217. Tershakovec AM, Shannon BM, Achterberg CL, et al. One-year follow-up of nutrition education for hypercholesterolemic children. Am J Public Health. 1998;88:258-261.
218. Tomson Y, Johannesson M, Aberg H. The costs and effects of two different lipid intervention programmes in primary health care. J Intern Med. 1995;237:13-17.
219. Waber DP, Vuori-Christiansen L, Ortiz N, et al. Nutritional supplementation, maternal education, and cognitive development of infants at risk of malnutrition. Am J Clin Nutr. 1981;34:807-813.
220. Winkleby MA , Howard-Pitney B, Albright CA, Bruce B, Kraemer HC, Fortmann SP. Predicting achievement of a low-fat diet: a nutrition intervention for adults with low literacy skills. Prev Med. 1997;26:874-882.
221. Harris RP, Helfand M, Woolf SH, et al. Current Methods of the US Preventive Services Task Force: A Review of the Process. Am J Prev Med. 2001;2 (3S):21-35.

References
145
222. Centers for Disease Control and Prevention. Physician advice and individual behaviors about cardiovascular disease risk reduction: seven states and Puerto Rico. MMWR Morb Mortal Wkly Rpt. 1997;48:74-77.
223. Centers for Disease Control and Prevention. Missed opportunities in preventive counseling for cardiovascular disease. MMWR Morb Mortal Wkly Rep. 1998;47:91-95.
224. Neighbor WEJ, Scott CS, Schaad DC, Macdonald SC, Van Citters R. Assessment and counseling of coronary risk factors by family practice residents. J Fam Pract. 1991;32:273-281.
225. Ross EM, Rosenberg IH, Dawson-Hughes B, Col NF, Wong JB. Fitting nutrition into the medical model: the role of decision analytic cost-effectiveness techniques. Eur J Clin Nutr. 1999;53 Suppl 2:S25-S28.
226. Curry S, Kristal A, Bowen D. An application of the stage model of behavior change to dietary fat reduction. Health Educ Res. 1992;7:97-105.

Appendix A Acknowledgments

Appendix A. Acknowledgments
A-1
Appendix A Acknowledgments
This study was supported by Contract 290-97-0011 from the Agency of Healthcare
Research and Quality (Task No. 3). We acknowledge at AHRQ the continuing support of
Jacqueline Besteman, J.D., M.A., Director for the Evidence-based Practice Center program; and
David Atkins, M.D., M.P.H., Director of the Clinical Prevention Program for the U.S. Preventive
Services Task Force. The investigators deeply appreciate the contributions of Loraine Monroe or
RTI, for superior secretarial assistance. In addition, we are indebted to staff from the University
of North Carolina at Chapel Hill and the Cecil G. Sheps Center for Health Services Research:
Carol Krasnov for diligent administrative assistance and coordination, and Timothy S. Carey,
M.D., M.P.H., Director of the Sheps Center and Co-Director of the RTI-UNC Evidence-based
Practice Center.
We also owe our thanks to the following external peer reviewers, who provided
constructive feedback and insightful suggestions for improvement of this systematic evidence
review: Walter Willet, M.D., Dr.P.H., Harvard School of Public Health, Boston, Massachusetts;
Ronald Kahn, M.D., American Academy of Family Physicians, Little Rock, Arkansas; R. Wayne
Elford, M.D., University of Calgary Medical Clinic, Alberta, Canada; Eric Gertner, M.D.,
Lehigh Valley Physician Group, Allentown, Pennsylvania; Heidi Michels Blank, Ph.D., M.S.,
Centers for Disease Control and Prevention, Atlanta, Georgia; Chris Gibbons, M.D., M.P.H.,
Centers for Medicare and Medicaid Services, Baltimore, Maryland; Peter C. van Dyck, M.D.,
M.P.H., Health Resources and Services Administration, Rockville, Maryland; Laura McNally,
R.D., M.P.H., Health Resources and Services Administration, Rockville, Maryland; Joan M.G.

Appendix A. Acknowledgments
A-2
Lyon, M.S., R.D., L.D., U.S. Army Medicine, Aberdeen Proving Ground, Maryland; and Paul
M. Coates, Ph.D, National Institutes of Health, Bethesda, Maryland.

Chapter III. Results
61
GLOSSARY for Tables 1 Through 12
Alt Alternative
Avg Average
BRFSS Behavioral Risk Factor Surveillance Survey
C Combined
Cal Calorie
CAD Coronary artery disease
CHD Coronary heart disease
Chol Cholesterol
Cnslg Counseling
Cont Control group
Crit Criterion
CSI Cholesterol/saturated fat index
CVD Cardiovascular disease
D-gm SFA Dietary grams of saturated fatty acids
DINE Dietary Instrument for Nutrition Education
F Female
F & V Fruits and vegetables
F/U Follow-up
g Gram(s)
G/d Grams per day
HMO Health Maintenance Organization
Hr Hour(s)
Hx/o History of
Intv Intervention group
M Male
MD Medical doctor
Mo Months
Modif Modification
MPH Master of Public Health

Chapter III. Results
62
GLOSSARY, continued
Msg Message
NA Not available
NCEP National Cholesterol Education Panel
NP Nurse practitioner
NR Not reported
Poly Polyunsaturated
Poly fat Polyunsaturated fat
Pts Patients
q every
RD Registered Dietician
RN Registered Nurse
ROS Review of systems
RR Relative Risk
RRR Relative Risk Reduction
Sat fat Saturated fat
Trans Trans-saturated fat
Unsat Unsaturated
vs. versus
w/ With
Wkly Weekly
Wk(s) Week(s)
Yr(s) Year(s)

Chapter III. Results
63
Table 1. Dietary assessment tools
Citation and Instrument
Nutrients or Foods
Assessed*
Number of Items,
Time to Administer,�
Scoring Response
Metric
Diet Intake Validity�:
Correlations Criterion Measures
Population orComments
Ammerman et al., 199173 Dietary Risk Assessment
Sat fat Cholesterol F&V
38 items 10-15 minutesWeighted score for dietary atherogenic risk
Frequency Food choices Amount Food preparation
Total score: r = .60 Crit: Keys score calculated from three 24-hour recalls
Low literacy
Angus et al., 198974 Frequency Questionnaire for Calcium Intake
Calcium 24 items Time NR Calculated from master list
Frequency Amount
r = .79 Crit: 4 day weighed food record
Caucasian
Block et al., 200075 Food Intake Screener
Fat F&V Fiber
22 items Less than 6 minutes Self-scored
Frequency r = .60 to .70 for total fat, saturated fat, cholesterol, fruit & vegetable intake Crit: 100 item Block Food Frequency Questionnaire
Multi-ethnic
Blumberg, 199976
Food insecurity and hunger
6 items responses scored to distinguish levels of severity
Yes, no and scaled response options
Sensitivity: .92, Specificity: .99 6 item subset of 18 item survey Crit: comprehensive assessment of food insecurity in Current Population Survey
Food security supplement to 1995 Current Populations Survey (nationally representative sample)
Conner et al., 199277 Diet Habit Survey
Sat fat Cholesterol Crude fiber
32 items 30 minutes Calculated Carbohydrate Score and a Chol/Sat Fat Score [based on the Chol/Sat fat Index (CSI)]
Frequency Food choices Amount Food preparation
Chol/sat fat index: r = .42 Chol score: r = .14 Crit: 24-hour diet recall
Coronary heart disease prevention study

Chapter III. Results
64
Table 1. Dietary assessment tools (continued)
Citation and Instrument
Nutrients or Foods
Assessed*
Number of Items,
Time to Administer,�
Scoring Response
Metric
Diet Intake Validity�:
Correlations Criterion Measures
Population orComments
Gans et al., 199378 Rate Your Plate
Fat Sat fat Cholesterol
18 items Weighted score indicates low, medium, or highly heart-healthy diet
Food choices Amount Food preparation
Total fat: r = -.43 Sat fat: r = -.48 Cholesterol: r = -.37 Crit: Willet Food Frequency Questionnaire
Portuguese and Anglo
Heller et al., 198179
Sat fat 8 items Time NR Weighted score
Frequency Amount Food preparation
r = .60 for diet score with sat fat Crit: 3-day diet record
British
Knapp et al., 198880 Sat. fat and Cholesterol Avoidance Scale
Sat fat Cholesterol
24 items Time NR Score = sum of point value for each response item
Frequency of avoidance behaviors Food choices
Statistically significant (p < 0.001) ability to differentiate between high-fat and low-fat diets Crit: food frequency questionnaire and 24-hour recall
Hispanic
Kris-Etherton et al., 200181 MEDFICTS Assessment Tool
Total fat Sat fat Cholesterol
20 items Time NR Weighted composite score indicative of compliance with NCEP Step 1 or 2 diets
Frequency Amount
Two validation studies % calories as total fat: r = .79, r = .52 % calories as sat fat: r = .60, r = .54 Cholesterol: r = .71, r = .39 Crit: two 3-day diet records
Developed for use in cardiovascular health screening, clinical practice, or research to identify adherence to NCEP Step 1 or 2 diets

Chapter III. Results
65
Table 1. Dietary assessment tools (continued)
Citation and Instrument
Nutrients or Foods
Assessed*
Number of Items,
Time to Administer,�
Scoring Response
Metric
Diet Intake Validity�:
Correlations Criterion Measures
Population orComments
Kristal et al., 199082
Total fat % cal fat Sat fat Fiber
18 items 4.2 minutes Scores for three parts: core foods, secondary core foods, & dietary behaviors
Frequency, Food choice, Amount Food preparation
r�s with food record & food frequency, respectively: Total fat: r = .52, r = .61 % cal fat: r = .53, r = .65 Sat fat: r = .61, r= .58 Fiber: r = .40, r = .47 Crit: 4-day food record and food frequency questionnaire
Women from HMO very interested in diet and health
Kristal et al., 1990 83 Eating Patterns Questionnaire
Fat Meat
18 items Time NR 5 subscales Weighted score
Avoidance, frequency, food choice, food prep.
Avoid fat: r = .57 Avoid meat: r = - .34 Low fat modif: r = - .35 Choose low fat alt: r = .42 Replace high w/ low fat: r = -.50 Crit: % total kcal from fat
Identifies behavioral goals but not quantities consumed Also validated in 900 women in Women�s Health Trial
Pietinen et al., 198884 Qualitative Food Frequency Questionnaire
Total fat Sat fat Poly fat Fiber Antioxidant
44 items Time NR Total fat, sat fat, unsat fat, fiber & selected nutrients are ranked into quintiles
Frequency Total fat: r = .41 Sat. fat: r = .56 Poly: r = .64 Fiber: r = .63 Crit: 2-day food records
Finnish
Peters et al., 199485 Eating Patterns Assessment Tool
Total fat Cholesterol
8 multi-component items 11 minutes 4 response columns correspond to diet very high or high in fat, and to Step 1 & 2 NCEP diets
Frequency Range of r�s for concurrent validity: High fat scale: r = .54 to .56 Low fat scale: r = -.18 to -.21 Crit: 5 4-day food records
Employees of large manufacturing corporation

Chapter III. Results
66
Table 1. Dietary assessment tools (continued)
Citation and Instrument
Nutrients or Foods
Assessed*
Number of Items,
Time to Administer,�
Scoring Response
Metric
Diet Intake Validity�:
Correlations Criterion Measures
Population or Comments
Retzlaff et al., 199786 NW Lipid Clinic Fat and Intake Scale
Total fat Sat fat Cholesterol
12 items Time NR Score is summed across all items indicating low-to-moderate or high fat & cholesterol diet
Frequency Food choicesFood preparation
Total fat: r = .51 Sat fat: r = .51 Cholesterol: r = .52 Crit: 4-day food records (avg for men and women)
Identifies goals for specific foods as well as for general practices with the option for positively framed (�do more of X�) recommendations
Rifas-Shiman et al., 200187 Prime Screen
Fat (animal, sat, trans) Cholesterol Fiber Multiple nutrients and micro- nutrients
26 items 5 minutes Score indicates level of risk for common chronic diseases of adulthood
Frequency Use of supplements
Foods and food groups: mean r = .61 Nutrients: mean r = .56 (sat fat: r = .59; trans fat: r = .64; cholesterol: r = .63) Crit: semi-quantitative food frequency questionnaire Vitamin E: r= .30 Beta-carotene: r = .43 Lutein/ zeaxanthin: r = .43 Crit: plasma levels
Large managed care organization in New England
Roe et al., 199488 Dietary Instrument for Nutrition Education
Total fat Sat fat Unsat fat Fiber
19 groups of food less than 10 minutes Score is sum of individual scores for fiber, fat, sat fat, & unsat fat � all categorized as low, medium, or high intake
Frequency Total fat: r = .51 Sat fat: r = .57 Unsat fat: r = .43 Fiber: r = .46 Crit: 4-day diet record
British

Chapter III. Results
67
Table 1. Dietary assessment tools (continued)
Citation and Instrument
Nutrients or Foods
Assessed*
Number of Items,
Time to Administer,�
Scoring Response
Metric
Diet Intake Validity�:
Correlations Criterion Measures
Population orComments
Serdula et al., 199389 Telephone Questionnaire for Behavioral Risk Factor Surveillance System (BRFSS)
F & V 6 items Time NR Score is index created from sum of daily frequency of consumption of food items in fruit & vegetable module
Frequency Food choices
r = .47 to .57 with food frequency r = .29 to .54 with multiple recall Crit: varied by site
5 diverse populations BRFSS questions§
Shannon et al., 199790
Total fat Fiber
33 items Time NR Fat scale score Fiber scale score
Food choices Amount Food preparation (�dietary behavior�)
Fat scale: r = .53 Fiber: r = .50 Crit: food frequency questionnaire
Eating Patterns Study population (primary care)
*Sat fat: saturated fat; unsat fat: unsaturated fat; F&V: fruits and vegetables; poly fat: polyunsaturated fat; trans:
trans-saturated fat. � NR, not reported. NCEP, National Cholesterol Education Panel. � r = correlation coefficient; crit, criterion; modif, modification; alt, alternative; kcal, kilocalorie; avg, average. § BRFSS, Behavioral Risk Factor Surveillance Survey.

Chapter III. Results
68
Table 2. Potential mediators of dietary change Mediators
• Knowledge of healthful food options
• Social support (availability of family or friends to encourage and assist with lifestyle change)
• Barriers to change (stress-related eating, limited resources to buy nutritious foods)
• Motivators of change (a desire to lose weight, reduce risk of chronic disease, feel better)
• Environmental influences on food choice (accessibility of both healthful and unhealthful food choices in the home or workplace)

Chapter III. Results
69
Table 3. Articles excluded for review of counseling interventions, by author and reason for exclusion
Author, Year Reason for Exclusion Aubin et al., 1998184 No control group Bakx et al., 1997185 17 year follow-up of a one-time intervention in 1977 Barratt et al., 1994186 Nonclinical intervention (worksite) Brannon et al., 1997187 No control group Burr et al., 198945 Post-myocardial infarction subjects Caggiula et al., 1996188 No diet outcomes Calfas et al., 200098 No true control group; comparable diet outcomes not presented Crouch et al., 1986189 No diet outcomes DeBusk et al., 1994190 Post-myocardial infarction subjects de Lorgeril et al., 1994191 No baseline measures taken of control group; post-myocardial
infarction subjects Dyson et al., 1997192 No control group Ershoff et al., 1983193 No diet outcomes Family Heart Study Group, 1994194 No diet outcomes Fletcher, 1987195 Post-myocardial infarction subjects Ford and Sciamanna, 1997144 Not an intervention (editorial) Foreyt et al., 1979196 No control group; no diet outcomes George et al., 1993197 No diet outcomes Gosselin et al., 1996198 No diet outcomes Heller et al., 1989199 No diet outcomes Henkin, et al. 2000200 No diet outcomes Howard-Pitney et al., 1997201 Nonclinical intervention Kuehl et al., 1993202 No control group Luepker et al., 1978203 No diet outcomes Lytle et al., 1996204 Nonclinical intervention Miettinen et al., 1985205 No diet outcomes MRFIT Investigators, 1982206 No diet outcomes Naglak et al., 1998207 No control group Neil et al., 1995208 No diet outcomes Neyses et al., 1985209 Cannot calculate difference in delta; baseline and follow-up data
not reported and nonsignificant changes Nikolaus et al., 1991210 Three week inpatient metabolic ward study Ornish 1998211 Control group information not available OXCHECK Study Group 1994212 OXCHECK Study Group 1995213
No control group
Pritchard et al., 1999214 No diet outcomes, no reference for diet outcomes Ridgeway et al., 1999215 No diet outcomes Shannon et al., 1994153 Two very different intervention groups; 2 control groups (�at risk�
and �not at risk�) Smith et al., 1976216 No diet outcomes Tershakovec et al., 1998217 Two very different intervention groups; 2 control groups (�at risk� &
�not at risk�) Tomson et al., 1995218 No diet outcomes Waber et al., 1981219 No diet outcomes Winkleby et al., 1997220 Nonclinical intervention

C
hapter III. Results
70
Table 4. Studies of counseling to reduce dietary fat
Author Year
Sample Population
Level of Risk
Max Follow
-up
Baseline Patient
Numbers Retention
Rate Setting Intervention and Control Group
Counseling Provider and Resources Intensity External Validity
Beresford et al., 1992130
Adult men and women in North Carolina, USA; 35% black
Avg/Low
3 mo
Intv: 120 Cont: 122
79%
Primary care providers
Intv: RN on-site provided 5 min intro to self-help materials with phone F/U 10 d later Cont: no intervention
Low
High
Beresford et al., 1997131
Adult men and women in family practice clinics, USA
Avg/Low
12 mo
Intv: 1,010 Cont: 1,111
86%
Primary care providers
Intv: trained MD-delivered 3 min intro to self-help booklet; reminder letter from MD Cont: NR
Low
High
Campbell et al., 1998124
Adult men and women w/ diagnosis of CVD in general practice Scotland
High
12 mo
Intv: 673 Cont: 670
88%
Primary care providers
Intv: health visitor - run or RN-run clinics (fit into regular daily routine of caring for all patients on practice list) x 1yr: ROS, review medications, assess behavior, negotiate behavior change; pts recommended to attend every 2-6 months Cont: NR
High
High
*Outcomes in this table are reported in the following order of preference depending on the data available from each study: (a) percentage of kcals from saturated or total fat; (b) grams of saturated or total fat; and (c) other methods of measuring change in diet as presented by the authors of specific studies. �(Baseline minus follow-up value for the intervention group) minus (baseline minus follow-up value for the control group). Note that the calculation for
Difference at Final Follow-up is not given. �Absolute change in the intervention group from baseline to follow-up divided by the baseline value of control group. §Calculated percentage of calories from fat (either total or saturated) as (grams fat times 9 kcal divided by total kcal) x 100 �Effect size categories are assisgned based on either net difference in change or difference at final follow-up.

C
hapter III. Results
71
Table 4. Studies of counseling to reduce dietary fat (continued)
Author Year Outcome*
Baseline Values
Duration of
Follow-up Final Follow-
up Values
Change from
Baseline to Final
Follow-up
Net Difference in
Change� or Difference
at Final Follow-up P-value
Calculated Relative
Risk Reduction�
Calculated Difference in Deltas§
Effect Size�
Beresford et al., 1992130
Grams of total fat
Intv: 66g Cont: 67g
3 mo
NR
NR
3.8 g
NR
NA
NA
Small
Beresford et al., 1997131
% calories as total fat
Intv: 37.6% Cont: 37.5%
12 mo
NR
Intv: -1.5% Cont: -0.3%
1.2%
P < 0.01
0.04
NA
Small
Campbell et al., 1998124
% subjects eating a low-fat diet per DINE score <30
Intv: 49.0% Cont: 48.6%
12 mo
Intv: 56.5% Cont: 48.6%
Intv: 7.5% Cont: 0.0%
7.5%
P = 0.009
0.15
-15.3%
Medium

C
hapter III. Results
72
Table 4. Studies of counseling to reduce dietary fat (continued)
Author Year
Sample Population
Level of Risk
Max Follow
-up
Baseline Patient
Numbers Retention
Rate Setting Intervention and Control Group
Counseling Provider and Resources Intensity External Validity
Campbell et al., 1994123 Tailored msg vs. control
Adult men and women of family practices: 2 urban and 2 rural in North Carolina, USA
Avg/Low
4 mo
Intv: NR Cont: NR
82%
Mailings and computer-generated messages
Intv: Self-administered surveys in office delivered by staff; tailored messages mailed home Cont: self-administered surveys only; no messages
Low
Medium
Nontailored msg vs. control
Adult men and women of family practices: 2 urban and 2 rural in North Carolina, USA
Avg/Low
4 mo
Intv: NR Cont: NR
82%
Mailings and computer-generated messages
Intv: Self-administered surveys in office delivered by staff; nontailored messages mailed home Cont: self-administered surveys only; no messages
Low
High
Coates et al., 1999118
Post-menopausal women in research clinics of Women's Health Trial: 28% black, 16% Hispanic
Moderate
18 mo
Intv: 1324 Cont: 883
75-85%
Research clinic
Intv: RD-delivered group sessions wkly for 6wks, biweekly for 6 wks, monthly for 9 mo Cont: given Dietary Guidelines for Americans; no counseling
High
Low

C
hapter III. Results
73
Table 4. Studies of counseling to reduce dietary fat (continued)
Author Year Outcome*
Baseline Values
Duration of
Follow-up Final Follow-
up Values
Change from
Baseline to Final
Follow-up
Net Difference in
Change� or Difference
at Final Follow-up P-value
Calculated Relative
Risk Reduction�
Calculated Difference in Deltas§
Effect Size�
Campbell et al., 1994123 Tailored msg vs. control
Grams of saturated fat Grams of total fat
Intv: 18.7 g Cont: 16.3g Intv: 45.6 g Cont: 41.1g
4 mo
Intv: 13.9 g Cont: 15.8 g Intv: 35.3 g Cont: 39.8 g
Intv: -4.8 g Cont: -0.5 g Intv: -10.3 g Cont: -1.3 g
4.3 g 9 g
P = 0.036 P = 0.033
0.29 0.25
-22.6% -19.4%
Medium Medium
Nontailored msg vs. control
Grams of saturated fat Grams of total fat
Intv: 16.1 g Cont: 16.3g Intv: 40.4 g Cont: 41.1g
4 mo
Intv: 14.4 g Cont: 15.8 g Intv: 36.8 g Cont: 39.8 g
Intv: -1.7 g Cont: -0.5 g Intv: -3.6 g Cont: -1.3 g
1.2 g 2.3 g
P = 0.110 P = 0 .157
0.10 0.09
-7.5% -5.8%
Small Small
Coates et al., 1999118
% calories as saturated fat % calories as total fat
Intv: 13.2% Cont:12.9% Intv: 39.7% Cont: 39.0%
18 mo
NR
Intv: -4.4% Cont: -0.9% Intv: -14.2% Cont: -2.5%
3.5% 11.6 %
NR NR
0.34 0.36
NA
Large Large

C
hapter III. Results
74
Table 4. Studies of counseling to reduce dietary fat (continued)
Author Year
Sample Population
Level of Risk
Max Follow-
up
Baseline Patient
Numbers Retention
Rate Setting Intervention and Control Group
Counseling Provider and Resources Intensity External Validity
Cupples and McKnight 1994133
Adult men and women with angina x 6 mo at home or in a health care center or surgery center Belfast, Northern Ireland
High
24 mo
Intv: 342 Cont: 346
Intv; 93% Cont: 87%
Primary care clinic referral
Intv: Trained health visitor delivered diet assessment and health education every 4 months at home or health center or surgery center Cont: no intervention
Medium
Medium
Delichatsios, Friedman et al., 2001125
Adult men and women in a large multisite, multispecialty group practice � Harvard Vanguard Medical Associates in Massa-chusetts, USA; 72% women, 45% white, 45% black
Avg/Low
6 mo
NR
50%
Mailings and computer-generated messages
Intv: weekly diet-related educational feedback, advice, and behavioral counseling for 5-7 minutes by a totally automated, telephone-linked computer-based voice communication system Cont: weekly physical activity-related educational feedback, advice, and behavioral counseling for 5-7 minutes by a totally automated, telephone-linked computer-based voice communication system
Medium
Medium

C
hapter III. Results
75
Table 4. Studies of counseling to reduce dietary fat (continued)
Author Year Outcome*
Baseline Values
Duration of
Follow-up Final Follow-
up Values
Change from
Baseline to Final
Follow-up
Net Difference in
Change� or Difference
at Final Follow-up P-value
Calculated Relative
Risk Reduction�
Calculated Difference in Deltas§
Effect Size�
Cupples and McKnight 1994133
% of subjects with improved intake of saturated fat
NR
24 mo
NR
Intv: 10.4% Cont: 8.3%
2.1%
P = 0.013
NA
NA
Small
Delichatsios, Friedman et al., 2001125
% calories as saturated fat
Intv: 10.1% Cont: 10.3%
6 mo
Intv: 8.8% Cont: 10.5%
Intv: -1.3% Cont: +0.2%
1.5%
P < 0.05
0.13
14.8%
Medium

C
hapter III. Results
76
Table 4. Studies of counseling to reduce dietary fat (continued)
Author Year Sample
Population Level of
Risk
Max Follow-
up
Baseline Patient
Numbers Retention
Rate Setting Intervention and Control Group
Counseling Provider and Resources Intensity External Validity
Delichatsios, Hunt et al., 2001134
Adult men and women patients from 6 group HMO practices in the primary care research network of Harvard Pilgrim HealthCare, Massa-chusetts, USA
Avg/Low
3 mo
Intv: 230 Cont: 274
Intv: 85% Cont: 92%
Mailings and computer-generated messages
Intv: mailed personalized dietary recommendations and 2 educational booklets; endorsement by trained (1 hour) MD or NP; 2 motivational phone counseling sessions by trained MPH student telephone counselors. RD consultation if needed. Cont: NR
Medium
Medium
Heller et al., 1994119 Self or MD intervention vs. control
Siblings and offspring of subjects w/ hx/o MI, New South Wales, Australia
Moderate
6 mo
Self Intv: 109 MDIntv: 120 Cont: 113
69%
Mailings and computer-generated messages
Self Intv: 4 mail-outs of self-help nutritional advice for 2-4 wks MD Intv: Mailed advice to visit subjects� own general practitioner; letter and form for MD or Cont: no intervention
Medium Low
Medium Medium
Henderson et al., 1990;141 Insull et al., 1990;142 Kristal et al., 1992;143 White et al, 1992144
Adult women 45-69 yrs at increased risk of breast cancer participating in Women�s Health Trial in Ohio, Texas, Washington, USA
Moderate
30-37 mo
Intv: 448 Cont: 457
86%
Research clinic: 3 clinical research centers
Intv: RD delivered 8 weekly group counseling meetings, followed by 4 biweekly meetings, then 20 monthly meetings Cont: no intervention
High
Low

C
hapter III. Results
77
Table 4. Studies of counseling to reduce dietary fat (continued)
Author Year Outcome*
Baseline Values
Duration of
Follow-up Final Follow-
up Values
Change from Baseline to
Final Follow-up
Net Difference in
Change� or Difference
at Final Follow-up P-value
Calculated Relative
Risk Reduction�
Calculated Difference in Deltas§
Effect Size�
Delichatsios, Hunt et al., 2001134
% calories as saturated fat
Intv: 10.6% Cont: 10.3%
3 mo
Intv: 9% Cont: 9.7%
Intv: -1.6% Cont: -0.6%
1%
NR
0.15
9.3%
Small
Heller et al., 1994119 Self vs. Cont
Grams of total fat
NR 6 mo NR Intv: -29.3 g Cont:+10.2g
39.5 g
P < 0.001
NA NA Large
MD vs. Cont
Grams of total fat
NR
6 mo
NR
Intv: +1.4 g Cont: +10.2 g
8.8 g
NS
NA
NA
Small
Henderson et al., 1990;141 Insull et al., 1990;142 Kristal et al., 1992;143 White et al., 1992144
% calories as saturated fat % calories as total fat % calories as total fat
Intv: 13.8% Cont: 13.6% Intv: 39.1% Cont: 38.9% Intv: 39.9% Cont: 38.5%
24mo 24mo 30 - 37 mo
Intv: 7.2% Cont: 12.3% Intv: 22.6% Cont: 36.8% Intv: 26.5% Cont: 32.4%
Intv: -6.6% Cont: -1.3% Intv: -16.5% Cont: -2.1% Intv: -13.4% Cont: -6.1%
5.3 % 14.4 % 7.3%
P < 0.001 P < 0.0001 P = 0.001
0.49 0.42 0.35
-38.3% -36.8% -17.7%
Large Large Medium

C
hapter III. Results
78
Table 4. Studies of counseling to reduce dietary fat (continued)
Author Year
Sample Population
Level of Risk
Max Follow
-up
Baseline Patient
Numbers Retention
Rate Setting Intervention and Control Group
Counseling Provider and Resources Intensity External Validity
Hjermann et al., 198112
Adult men at increased risk for CHD in a hospital medical outpatient clinic Oslo, Norway
Moderate -High
5 yr
Intv: 604 Cont: 628
96%
Primary care clinic referral
Intv: MD delivered on-site 10-15 min of info re: CHD risk factors and RD delivered on-site diet assessment and advice; MD F/U Cont: short annual clinical re-examination
Medium
Low
Hunt et al., 1976135
Low income pregnant women of Mexican descent in a prenatal clinic Los Angeles County, California, USA
Avg/Low
35th week
Intv: 171 Cont: 173
81%
Primary care clinic referral
Intv: Spanish-speaking RD delivered nutrition ed classes Cont: usual care
Low
Medium
Keyserling et al., 1997126
Adult men and women, low income w/ hypercholesterolemia in community and rural health centers North Carolina, USA
Moderate
24 mo
Intv: 184 Cont: 188
95%
Primary care providers
Intv: On-site MD (trained for intv in 1.5 hr) delivered diet assess and 3 sessions of 5-10 min cnslg; followed up by referral to on-site (if available) or off-site RD if persistent hypercholesterolemia Cont: usual care
Medium
High

C
hapter III. Results
79
Table 4. Studies of counseling to reduce dietary fat (continued)
Author Year Outcome*
Baseline Values
Duration of
Follow-up Final Follow-
up Values
Change from
Baseline to Final
Follow-up
Net Difference in
Change� or Difference
at Final Follow-up P-value
Calculated Relative
Risk Reduction�
Calculated Difference in Deltas§
Effect Size�
Hjermann et al., 198112
% calories as saturated fat % calories as total fat
NR
4 yrs Intv: 3.3% Cont: 7.1% Intv: 11.2% Cont: 17.0%
NR NR
3.8% 5.8%
P < 0.01
NA NA
NA NA
Medium Medium
Hunt et al., 1976135
% calories as total fat
Intv: 35.1% Cont: 34.1%
35th week of preg-nancy
Intv: 33.5% Cont: 34.9%
Intv: -1.6% Cont: +0.8
2.4%
NS 0.05 -2.0% Small
Keyserling et al., 1997126
Dietary risk assessment score (scale: 0 to 98)
Intv: 22.0 Cont: 22.0
12 mo NR Intv: -5.3 Cont: -2.0
3.3%
P < 0.001 0.24 NA Medium

C
hapter III. Results
80
Table 4. Studies of counseling to reduce dietary fat (continued)
Author Year
Sample Population
Level of Risk
Max Follow
-up
Baseline Patient
Numbers Retention
Rate Setting Intervention and Control Group
Counseling Provider and Resources Intensity External Validity
Knutsen and Knutsen, 1991127
Adult men at increased risk for CVD and their families Tromso, Norway
Moderate
6 yr
M: 1373 F: 1143 C: 2838
M: 77% F: 82% C: 39%
Primary care clinic referral
Intv: MD and RD each made 1 home visit for CHD risk factor diet assessment and counseling Cont: NR
Medium
Low
Kristal et al., 2000132
Adult men and women enrollees of Group Health Cooperative of Puget Sound HMO, Washington, USA
Avg/Low
12 mo
Intv: 729 Cont: 730
86.5%
Mailings and computer-generated messages
Intv: self-help materials, dietary analysis with behavioral feedback, and semi-monthly newsletters mailed home; trained health educator delivered one motivational phone call Cont: usual care - no intervention
Medium
Medium
Lee-Han et al., 1988120
Adult women > 30 yrs with breast dysplasia enrolled in Breast Dysplasia Intervention Trial in Toronto, Canada
High
12 mo
Intv: 37 Cont: 33
81%
Research clinic
Intv: RD provided advice and education about reducing dietary fat Cont: general advice about maintaining a healthy diet according to Canada�s Food Guide; not counseled to change diet composition
Medium
Low

C
hapter III. Results
81
Table 4. Studies of counseling to reduce dietary fat (continued)
Author Year Outcome*
Baseline Values
Duration of
Follow-up Final Follow-
up Values
Change from
Baseline to Final
Follow-up
Net Difference in
Change� or Difference
at Final Follow-up P-value
Calculated Relative
Risk Reduction�
Calculated Difference in Deltas§
Effect Size�
Knutsen and Knutsen, 1991127
% of subjects using butter for cooking
NR
6 yrs
Intv: M: 20% F: 20% C: 25% Cont: M: 36% F: 36% C: 35%
NR
M: 16% F: 16% C: 10%
NR
NA
NA
Medium
Kristal et al., 2000132
Fat score: 1 to 4 fat 1 = low fat 4 = high fat
Intv: 2.29 Cont: 2.30
12 mo
Intv: 2.20 Cont: 2.3
Intv: -0.09 Cont: 0
0.09%
P < 0.001
0.04
4%
Small
Lee-Han et al., 1988120
% calories as saturated fat % calories as total fat
Intv: 14.1% Cont: 13.9% Intv: 36.4% Cont: 35.7%
12 mo
Intv: 9.5% Cont: 14.0% Intv: 25.8% Cont: 35.8%
Intv: -4.6% Cont: +0.1% Intv: -10.5% Cont: +0.2%
4.7% 11.7%
NR P < 0.001
0.33 0.29
-33.2% -29.5%
Large Large

C
hapter III. Results
82
Table 4. Studies of counseling to reduce dietary fat (continued)
Author Yearn
Sample Population
Level of Risk
Max Follow
-up
Baseline Patient
Numbers Retention
Rate Setting Intervention and Control Group
Counseling Provider and Resources Intensity External Validity
Lindholm et al., 1995128
Adult men and women at increased risk for CHD in 32 county health centers Lund, Sweden
Moderate
18 mo
Intv: 339 Cont: 342
Intv: 92% Cont: 95%
Primary care clinic referral
Intv: usual health care advice from MD (see Cont) plus trained MD or RN delivered 6 group health care advice sessions which discussed 6 separate videos about 6 risk factors for heart disease Cont: usual health care advice from MD to reduce dietary fat, reduce weight if necessary, to stop smoking; pamphlet to reinforce instructions
High
Medium
Masley et al., 2001140
Adult men and women with a diagnosis of CAD from 4 community outpatient clinics from Group Health Cooperative in Washington, USA
High
12 mo
Intv: 49 Cont: 48
81%
Research clinic
Intv: RN taught 14 90-minute group classes: weekly for 1 month then monthly; also given nutrition textbook, cooking demos, and encouraged spousal support Cont: usual care from their providers and given written materials including a handout to follow NCEP�s Step II-III diet
High
Low
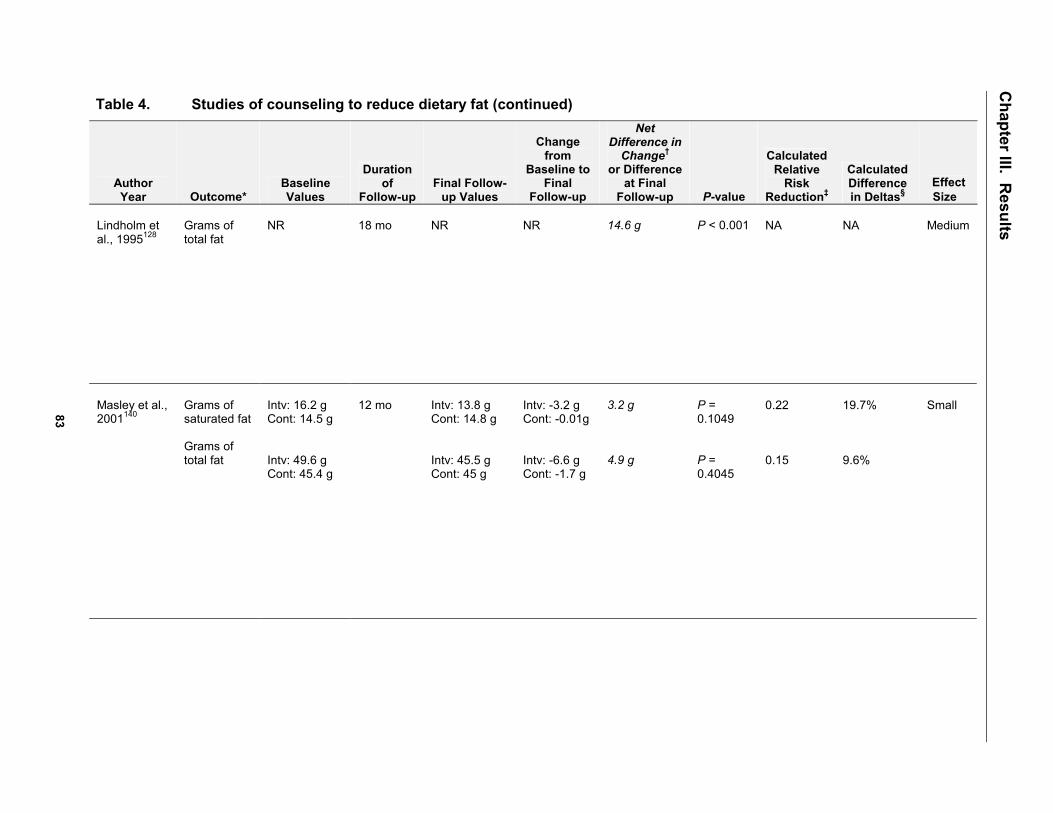
C
hapter III. Results
83
Table 4. Studies of counseling to reduce dietary fat (continued)
Author Year Outcome*
Baseline Values
Duration of
Follow-up Final Follow-
up Values
Change from
Baseline to Final
Follow-up
Net Difference in
Change� or Difference
at Final Follow-up P-value
Calculated Relative
Risk Reduction�
Calculated Difference in Deltas§
Effect Size�
Lindholm et al., 1995128
Grams of total fat
NR
18 mo
NR
NR
14.6 g
P < 0.001
NA
NA
Medium
Masley et al., 2001140
Grams of saturated fat Grams of total fat
Intv: 16.2 g Cont: 14.5 g Intv: 49.6 g Cont: 45.4 g
12 mo
Intv: 13.8 g Cont: 14.8 g Intv: 45.5 g Cont: 45 g
Intv: -3.2 g Cont: -0.01g Intv: -6.6 g Cont: -1.7 g
3.2 g 4.9 g
P = 0.1049 P = 0.4045
0.22 0.15
19.7% 9.6%
Small

C
hapter III. Results
84
Table 4. Studies of counseling to reduce dietary fat (continued)
Author Year
Sample Population
Level of Risk
Max Follow
-up
Baseline Patient
Numbers Retention
Rate Setting Intervention and Control Group
Counseling Provider and Resources Intensity External Validity
Mojonnier et al., 1980136
Adult men and women with hyperlipi-demia in study centers, USA
Moderate
9 mo
Intv: NR Cont:
70%
Research clinic
Intv: RD and nutrition aids delivered 4 different multidimensional interventions including assessment, self-teaching or group-teaching or individual teaching, or multi-method Cont: follow-up at 6 or 9 months for repeat measurements; no intervention
Medium
Low
Neaton et al., 198113 (The MRFIT Study)
Adult men at increased risk for CHD: MRFIT Multicenter Study, USA
Moderate �High
3 yrs
Intv: 5,825 Cont: 5,766
91%
Research clinic
Intv: 10 initial intensive sessions followed by counseling sessions approx. q 4 mo; provider NR Cont: 3 screenings plus annual risk factor measurement and medical exam
High
Low
Ockene et al., 1996139 and Ockene et al., 1999137
Adult men and women with hyperlipi-demia in HMOs USA
Moderate
12 mo
Intv: NR Cont: NR
80%
Primary care providers
Intv: MDs (trained for 3 hr) delivered nutrition counseling and staff provided office support Cont: usual care
Medium
High

C
hapter III. Results
85
Table 4. Studies of counseling to reduce dietary fat (continued)
Author Year Outcome*
Baseline Values
Duration of
Follow-up Final Follow-
up Values
Change from
Baseline to Final
Follow-up
Net Difference in
Change� or Difference
at Final Follow-up P-value
Calculated Relative
Risk Reduction�
Calculated Difference in Deltas§
Effect Size�
Mojonnier et al., 1980136
% calories as saturated fat % calories as total fat
Intv: 13.9% Cont: 13.3% Intv: 37.8% Cont: 36.3%
6 and 9 mo F/U combined
Intv: 10.5% Cont: 12.8% Intv: 33.9% Cont: 36.6%
NR
2.4% 2.7%
P < 0.001 P < 0.01
NA NA
-20.7% -9.5%
Small
Neaton et al., 198113 (The MRFIT Study)
% calories as saturated fat % calories as total fat
Intv: 14.0% Cont:14.0 % Intv: 38.2% Cont: 38.3%
3 yrs
Intv: 10.0% Cont: 13.5% Intv: 33.8% Cont: 38.0%
Intv: -3.9% Cont: -0.4% Intv: -4.4% Cont: -0.3%
3.5% 4.1%
NR NR
0.28 0.11
-25% -10.7%
Small
Ockene et al., 1996139 Ockene et al., 1999137
% calories as saturated fat % calories as total fat
NR
12 mo
NR
Intv: -1.1% Cont: 0% Intv: -2.3% Cont: -0.7%
1.1% 1.6%
P = 0.01 P = 0.11
NA NA
NA NA
Small

C
hapter III. Results
86
Table 4. Studies of counseling to reduce dietary fat (continued)
Author Year
Sample Population
Level of Risk
Max Follow-
up
Baseline Patient
Numbers Retention
Rate Setting Intervention and Control Group
Counseling Provider and Resources Intensity External Validity
Ornish et al., 1990121
Adult men and women with coronary atherosclerosis at study center California, USA
High
12 mo
Intv: 28 Cont: 20
Intv: 79% Cont: 95%
Research clinic
Intv: Clinical psychologist and RD provide initial 1-wk residential program followed by twice-a-wk (4 hr each) group sessions for 1 yr Cont: no intervention; usual care
High
Low
Roderick et al., 1997138
Adult men and women with hyper-cholesterolemia in general practice from 4 regions, United Kingdom
Avg/Low
12 mo
Intv: 473 Cont: 483
Intv: 86% Cont: 74%
Primary care providers
Intv: RNs on-site (trained for intv by RD) delivered dietary assessment, advice and F/U Cont: standard health education materials
Medium
High
Simkin-Silverman et al., 1997122
Premenopausal women at research centers Penn-sylvania, USA
Average
6 mo
Intv: 267 Cont: 253
97%
Research clinic
Intv: Trained RD and behavioral interventionists led wkly group meetings x 10 wks then biweekly x 10 wks Cont: no intervention
High
Low
Steptoe et al., 1999129
Adult men and women at increased risk for CHD in 20 general practices in London, England
Moderate
12 mo
Intv: 316 Cont: 567
59%
Primary care providers
Intv: RN trained (4 days) in behavioral counseling delivered 2 to 3 individual counseling sessions-20 minutes each and 1 or 2 phone follow-ups Cont: NR
Medium
High

C
hapter III. Results
87
Table 4. Studies of counseling to reduce dietary fat (continued)
Author Year Outcome*
Baseline Values
Duration of
Follow-up Final Follow-
up Values
Change from
Baseline to Final
Follow-up
Net Difference in
Change� or Difference
at Final Follow-up P-value
Calculated Relative
Risk Reduction�
Calculated Difference in Deltas§
Effect Size�
Ornish et al., 1990121
% calories as total fat
Intv: 31.5% Cont: 30.1%
12 mo
Intv: 6.8% Cont: 29.5%
Intv: -24.7% Cont: -0.6%
23.2%
P < .0001
0.23
-76.4%
Large
Roderick et al., 1997138
% calories as saturated fat % calories as total fat
Intv: 13.7% Cont: 14.0% Intv: 34.3% Cont: 34.2%
12 mo
NR
Intv: -1.5% Cont: -0.6% Intv: -2.4% Cont �0.9%
0.9% 1.4%
NR
0.11 0.07
NA
Small
Simkin-Silverman et al., 1997122
% calories as saturated fat % calories as total fat
Intv: 12.3% Cont: 11.8% Intv: 36.1% Cont: 35.5%
6 mo
NR
Intv: -4.3% Cont: -0.4% Intv: -11.1% Cont: -1.0%
3.9% 10.1%
P < 0.001
0.36 0.31
NA
Large
Steptoe et al., 1999129
DINE Fat score
Intv: 30.5 Cont: 28.2
12 mo
Intv: 23.4 Cont: 23.8
Intv: -7.1 Cont: -4.4
2.7
P < 0.05
0.10
7.7%
Medium

Chapter III. R
esults
88
Table 5. Studies of counseling to increase intake of fruit or vegetables: study descriptions
Author Year
Sample Population
Level of Risk
Max Follow-up
Baseline Patient
Numbers Retention
Rate Setting Intervention and Control Group
Counseling Provider and Resources Intensity External Validity
Campbell et al., 1994123 Tailored msg vs. control
Adult men and women of family practices: 2 urban and 2 rural in North Carolina, USA
Avg/Low 4 mo Intv: NR Cont: NR
82% Mailings and computer-generated messages
Intv: Self-administered surveys in office delivered by staff; messages mailed home Cont: self-administered surveys only; no messages
Low Medium
Nontailored msg vs. control
Adult men and women of family practices: 2 urban and 2 rural in North Carolina, USA
Avg/Low 4 mo Intv: NR Cont: NR
82% Mailings and computer-generated messages
Intv: Self-administered surveys in office delivered by staff; non-tailored messages mailed home Cont: self-administered surveys only; no messages
Low High
Coates et al., 1999118
Post-menopausal in research clinics of Women's Health Trial 28% black, 16% Hispanic
Moderate 18 mo Intv: 1324 Cont: 883
75%-85% Outside referral
Intv: RD-delivered group sessions weekly x 6wks, biweekly x 6 weeks, monthly x 9 months Cont: given Dietary Guidelines for Americans; no counseling
High Low
* Baseline minus follow-up value for the intervention group minus baseline minus follow-up value for the control group � Absolute change in the intervention group from baseline to follow-up divided by the baseline value of the control group
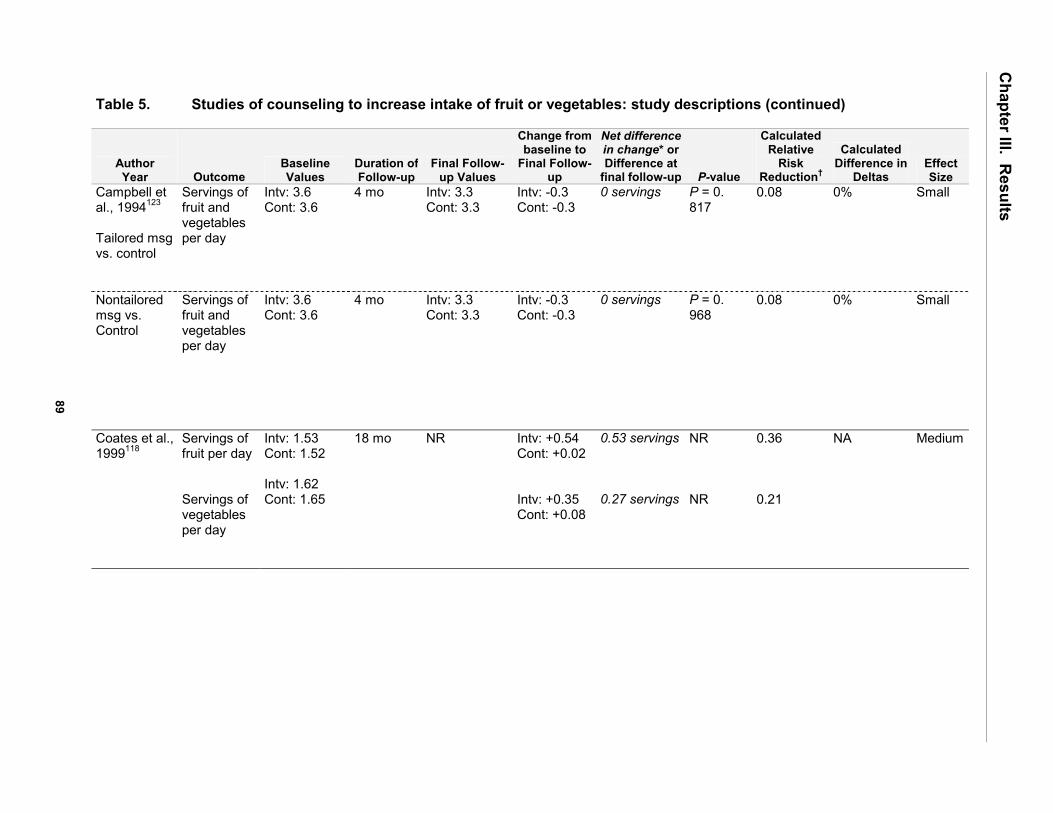
Chapter III. R
esults
89
Table 5. Studies of counseling to increase intake of fruit or vegetables: study descriptions (continued)
Author Year Outcome
Baseline Values
Duration of Follow-up
Final Follow-up Values
Change from baseline to
Final Follow-up
Net difference in change* or Difference at
final follow-up P-value
Calculated Relative
Risk Reduction�
Calculated Difference in
Deltas Effect Size
Campbell et al., 1994123 Tailored msg vs. control
Servings of fruit and vegetables per day
Intv: 3.6 Cont: 3.6
4 mo Intv: 3.3 Cont: 3.3
Intv: -0.3 Cont: -0.3
0 servings
P = 0. 817
0.08 0% Small
Nontailored msg vs. Control
Servings of fruit and vegetables per day
Intv: 3.6 Cont: 3.6
4 mo Intv: 3.3 Cont: 3.3
Intv: -0.3 Cont: -0.3
0 servings
P = 0. 968
0.08 0% Small
Coates et al., 1999118
Servings of fruit per day Servings of vegetables per day
Intv: 1.53 Cont: 1.52 Intv: 1.62 Cont: 1.65
18 mo
NR Intv: +0.54 Cont: +0.02 Intv: +0.35 Cont: +0.08
0.53 servings 0.27 servings
NR NR
0.36 0.21
NA Medium

Chapter III. R
esults
90
Table 5. Studies of counseling to increase intake of fruit or vegetables: study descriptions (continued)
Author Year
Sample Population
Level of Risk
Max Follow-
up
Baseline Patient
Numbers Retention
Rate Setting Intervention and Control Group
Counseling Provider and Resources Intensity External Validity
Cupples and McKnight 1994133
Adult men and women with angina x 6mo at home or in a health care or surgery center Belfast, Northern Ireland
High 24 mo Intv: 342 Cont: 346
Intv; 93% Cont: 87%
Primary care clinic referral
Intv: Trained health visitor delivered assessment and health education q 4 months at home or health center or surgery center Cont: assessment only
Medium Medium
Delichatsios, Friedman et al., 2001125
Adult men and women in a large multisite, multi-specialty group practice � Harvard Vanguard Medical Associates in Massa-chusetts, USA; 72% women, 45% white, 45% black
Avg/Low 6 mo NR NR Mailings and computer-generated messages: home
Intv: weekly diet-related educational feedback, advice, and behavioral counseling for 5-7 minutes by a totally automated, telephone-linked computer-based voice communication system Cont: weekly physical activity-related educational feedback, advice, and behavioral counseling for 5-7 minutes by a totally automated, telephone-linked computer-based voice communication system
Medium Medium

Chapter III. R
esults
91
Table 5. Studies of counseling to increase intake of fruit or vegetables: study descriptions (continued)
Author Year Outcome
Baseline Values
Duration of Follow-
up Final Follow-
up Values
Change from baseline to
Final Follow-up
Net difference in change* or Difference at
final follow-up P-value
Calculated Relative
Risk Reduction�
Calculated Difference in
Deltas Effect Size
Cupples and McKnight 1994133
% of subjects with �improved� vegetable intake
NR 24 mo NR Intv: 43.8% Cont: 37.7%
6.1%
P = 0.002
NA NA Small
Delichatsios, Friedman et al., 2001125
Servings of fruit per day Servings of vegetables per day
Intv: 2.8 Cont: 2.4 Intv: 3.8 Cont: 3.5
6 mo
Intv: 3.2 Cont: 2.0 Intv: 4.5 Cont: 3.6
Intv: +0.4 Cont: -0.4 Intv: +0.7 Cont: +0.1
0.8 servings 0.6 servings
P < 0.05 NR
0.17 0.20
31% 15.6%
Medium

Chapter III. R
esults
92
Table 5. Studies of counseling to increase intake of fruit or vegetables: study descriptions (continued)
Author Year
Sample Population
Level of Risk
Max Follow-
up
Baseline Patient
Numbers Retention
Rate Setting Intervention and Control Group
Counseling Provider and Resources Intensity External Validity
Delichatsios, Hunt et al., 2001134
Adult men and women patients from 6 group HMO practices in the primary care research network of Harvard Pilgrim HealthCare, Massa-chusetts, USA
Avg/Low 3 mo Intv: 230 Cont: 274
Intv: 85% Cont: 92%
Mailings and computer -generated messages
Intv: mailed personalized dietary recom-mendations and 2 educational booklets; endorsement by 1 hour-trained MD or NP; 2 motivational phone counseling sessions by trained MPH student telephone counselors. RD consultation if needed. Cont: NR
Medium Medium
Knutsen and Knutsen, 1991127
Adult men at increased risk for CVD and their families Tromso, Norway
Moderate 6 yr M: 1373 F: 1143 C: 2838
M:77% W:82% C: 39%
Primary care clinic referral
Intv: MD or RD each made 1 of made 2 home visits for CHD risk factor counseling and diet assessment and counseling Cont: NR
Medium High

Chapter III. R
esults
93
Table 5. Studies of counseling to increase intake of fruit or vegetables: study descriptions (continued)
Author Year Outcome
Baseline Values
Duration of Follow-
up Final Follow-
up Values
Change from baseline to
Final Follow-up
Net difference in change* or Difference at
final follow-up P-value
Calculated Relative
Risk Reduction�
Calculated Difference in
Deltas Effect Size
Delichatsios, Hunt et al., 2001134
Servings of fruit and vegetables per day
Intv: 2.9 Cont: 3.3
3 mo Intv: 4 Cont: 3.7
Intv: +1.1 Cont: +0.4
0.7 servings NR 0.33 25.8% Medium
Knutsen and Knutsen, 1991127
% of subjects eating > 4 fruits per week % of subjects eating vegetables with dinner
NR 6 yrs Intv: M: 28% F: 48% C: 43% Cont: M: 24% F: 44% C: 39% Intv: M: 60% F: 72% C: 51% Cont: M: 60% F: 64% C: 53%
NR M: 4% F: 4% C: 4% M: 0% F: 8% C: 2%
NR NR
NA NA Small
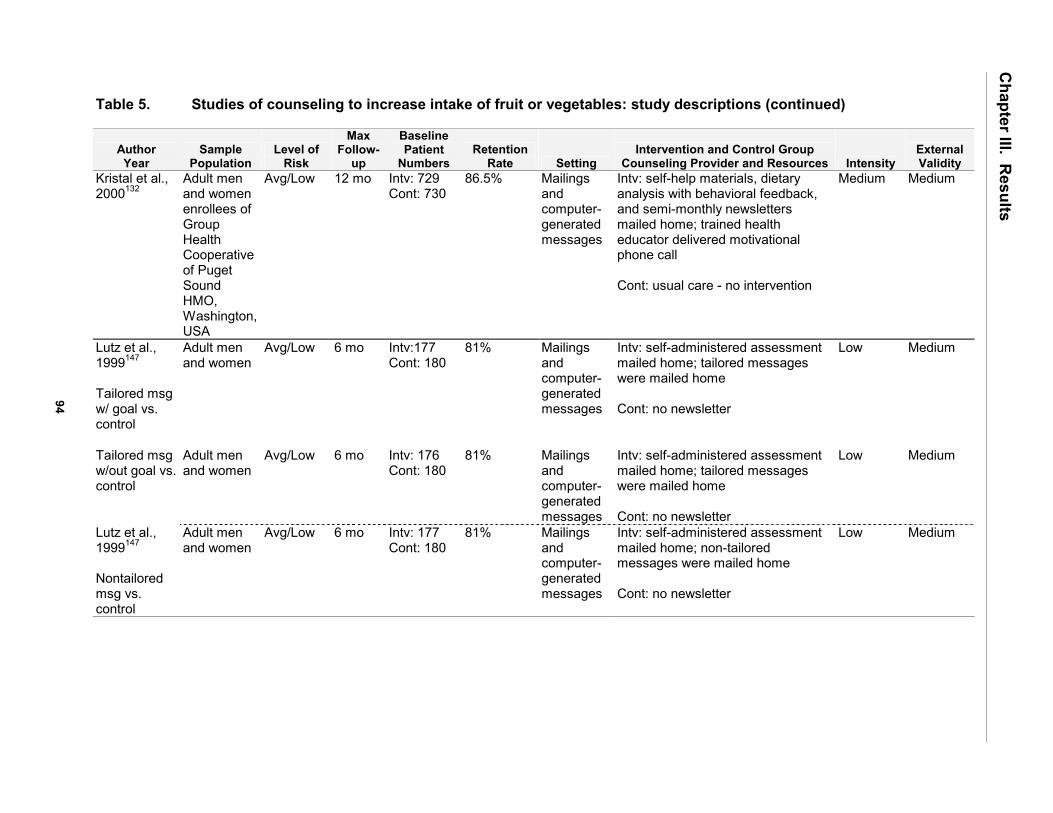
Chapter III. R
esults
94
Table 5. Studies of counseling to increase intake of fruit or vegetables: study descriptions (continued)
Author Year
Sample Population
Level of Risk
Max Follow-
up
Baseline Patient
Numbers Retention
Rate Setting Intervention and Control Group
Counseling Provider and Resources Intensity External Validity
Kristal et al., 2000132
Adult men and women enrollees of Group Health Cooperative of Puget Sound HMO, Washington, USA
Avg/Low 12 mo Intv: 729 Cont: 730
86.5% Mailings and computer-generated messages
Intv: self-help materials, dietary analysis with behavioral feedback, and semi-monthly newsletters mailed home; trained health educator delivered motivational phone call Cont: usual care - no intervention
Medium Medium
Lutz et al., 1999147 Tailored msg w/ goal vs. control
Adult men and women
Avg/Low 6 mo Intv:177 Cont: 180
81% Mailings and computer-generated messages
Intv: self-administered assessment mailed home; tailored messages were mailed home Cont: no newsletter
Low Medium
Tailored msg w/out goal vs. control
Adult men and women
Avg/Low 6 mo Intv: 176 Cont: 180
81% Mailings and computer-generated messages
Intv: self-administered assessment mailed home; tailored messages were mailed home Cont: no newsletter
Low Medium
Lutz et al., 1999147 Nontailored msg vs. control
Adult men and women
Avg/Low 6 mo Intv: 177 Cont: 180
81% Mailings and computer-generated messages
Intv: self-administered assessment mailed home; non-tailored messages were mailed home Cont: no newsletter
Low Medium

Chapter III. R
esults
95
Table 5. Studies of counseling to increase intake of fruit or vegetables: study descriptions (continued)
Author Year Outcome
Baseline Values
Duration of Follow-
up Final Follow-
up Values
Change from baseline to
Final Follow-up
Net difference in change* or Difference at
final follow-up P-value
Calculated Relative
Risk Reduction�
Calculated Difference in
Deltas Effect Size
Kristal et al., 2000132
Servings of fruit and vegetables per day
Intv: 3.62 Cont: 3.47
12 mo Intv: 4.09 Cont: 3.61
Intv: +0.47 Cont: +0.14
0.33 servings P < 0.001 0.13 9% Medium
Lutz et al., 1999147 Tailored msg w/ goal vs. control
Mean servings of fruits and vegetables per day
Intv: 3.5 Cont: 3.5
6 mo Intv: 4.4 Cont: 3.6
Intv: +0.9 Cont: +0.1
0.8 servings
P < 0.002
0.26 22.8% Medium
Tailored msg w/out goal vs. control
Mean servings of fruits and vegetables per day
Intv: 3.3 Cont: 3.5
6 mo Intv: 4.1 Cont: 3.6
Intv: +0.8 Cont: +0.1
0.7 servings
P < 0.002
0.23 21.3% Medium
Nontailored msg vs. control
Mean servings of fruits and vegetables per day
Intv: 3.4 Cont: 3.5
6 mo Intv: 4.1 Cont: 3.6
Intv: +0.7 Cont: +0.1
0.6 servings
P < 0.002
0.20 17.7% Medium

Chapter III. R
esults
96
Table 5. Studies of counseling to increase intake of fruit or vegetables: study descriptions (continued)
Author Year
Sample Population
Level of Risk
Max Follow-
up
Baseline Patient
Numbers Retention
Rate Setting Intervention and Control Group
Counseling Provider and Resources Intensity External Validity
Maskarinec et al., 1999145
Healthy adult women over age 35 consuming less than 5 servings of fruit and vegetables daily in a study center Hawaii, USA
Avg/Low 6 mo Intv: 13 Cont: 16
88% Outside referral
Intv: RD delivered monthly counseling sessions (1st 2 individual, next 3 group) with phone follow-up as needed to increase fruits and vegetables Cont: RD delivered general healthy eating counseling based on the USDA Dietary Guidelines
High Low
Masley et al., 2001140
Adult men and women with a diagnosis of CAD from 4 community outpatient clinics from Group Health cooperative in Washington, USA
High 12 mo Intv: 49 Cont: 48
81% Outside referral
Intv: RN taught 14 90-minute group classes: weekly for 1 months then monthly; also given nutrition textbook, cooking demos, and encouraged spousal support Cont: usual care from their providers and given written materials including a handout to follow NCEP�s Step II-III diet
High Low

Chapter III. R
esults
97
Table 5. Studies of counseling to increase intake of fruit or vegetables: study descriptions (continued)
Author Year Outcome
Baseline Values
Duration of Follow-up
Final Follow-up Values
Change from baseline to
Final Follow-up
Net difference in change* or Difference at
final follow-up P-value
Calculated Relative
Risk Reduction�
Calculated Difference in
Deltas Effect Size
Maskarinec et al., 1999145
Servings of fruit and vegetables per day
Intv: 3.3 Cont: 3.2
6 mo Intv: 7.4 Cont: 4.1
Intv: 4.1 Cont: 0.9
3.2 servings P = 0.0001
1.00 96% Large
Masley et al., 2001140
Servings of fruit and vegetables per day
Intv: 3.08 Cont: 3.30
12 mo Intv: 4.89 Cont: 2.88
Intv: +1.73 Cont: -0.41
2.14 servings
P = 0.0002
0.65
69%
Large

Chapter III. R
esults
98
Table 5. Studies of counseling to increase intake of fruit or vegetables: study descriptions (continued)
Author Year
Sample Population
Level of Risk
Max Follow-
up
Baseline Patient
Numbers Retention
Rate Setting Intervention and Control Group
Counseling Provider and Resources Intensity External Validity
Siero et al., 2000146 Group education vs. control
Low income adult men and women at increased risk for CVD in primary care practices and at home, The Netherlands
Moderate 16 wks Intv: NR Cont: NR
NR Primary care clinic referral
Intv: 3 group sessions 2 hr each; provider NR Cont: received printed leaflet with the Dutch nutritional guidelines
High Medium
Group education and tailored msg vs. control
Low income adult men and women at increased risk for CVD in primary care practices and at home, The Netherlands
Moderate 16 wks Intv: NR Cont: NR
NR Primary care clinic referral
Intv: messages were mailed home; group sessions 2 hr each led by group instructor not otherwise specified Cont: received printed leaflet with the Dutch nutritional guidelines
High Medium

Chapter III. R
esults
99
Table 5. Studies of counseling to increase intake of fruit or vegetables: study descriptions (continued)
Author Year Outcome
Baseline Values
Duration of Follow-up
Final Follow-up Values
Change from baseline to
Final Follow-up
Net difference in change* or Difference at
final follow-up P-value
Calculated Relative
Risk Reduction�
Calculated Difference in
Deltas Effect Size
Siero et al., 2000146 Group education vs. control
Fruits and vegetables g/day
Intv: 424 g Cont: 416 g
16 wks Intv: 465 g Cont: 395 g
Intv: +41 g Cont: -21 g
20 g
NR 0.10 14.7% Small
Group education and tailored msg vs. control
Fruits and vegetables g/day
Intv: 426 g Cont: 416 g
16 wks Intv: 494 g Cont: 395 g
Intv: +68g Cont: -21 g
+99 g
NR 0.16 21% Medium
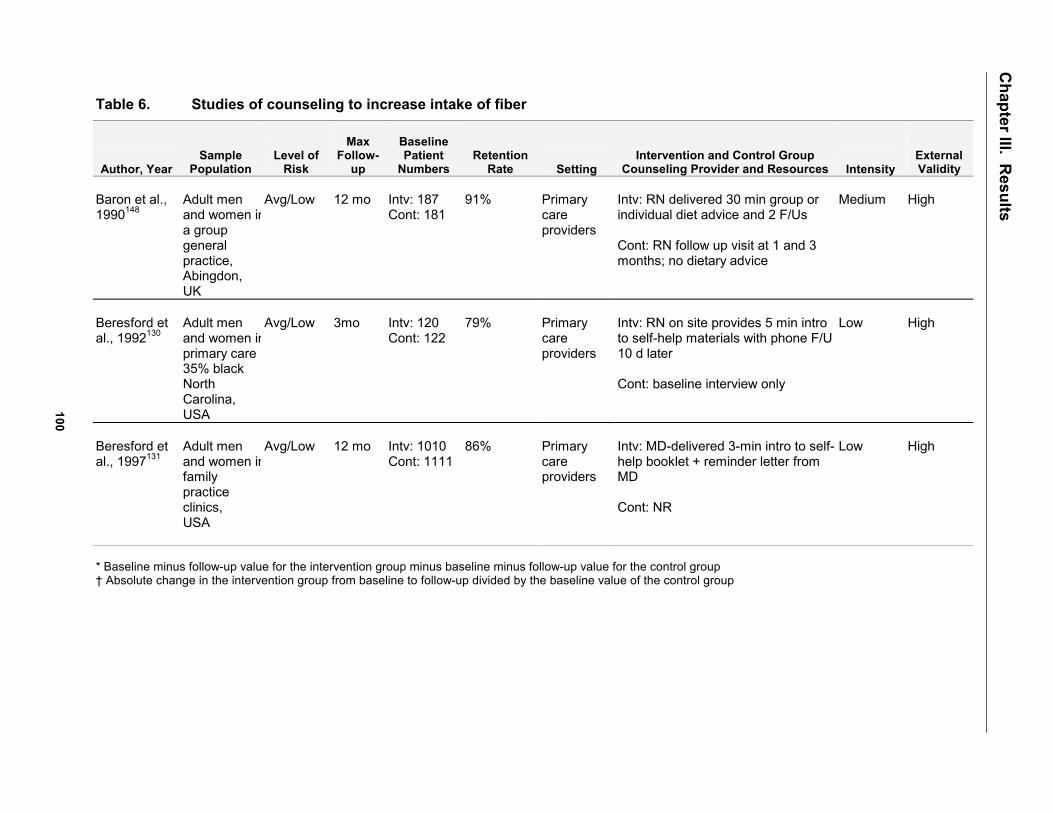
Chapter III. R
esults
100
Table 6. Studies of counseling to increase intake of fiber
Author, Year
Sample
Population
Level of
Risk
Max
Follow-up
Baseline Patient
Numbers
Retention
Rate
Setting
Intervention and Control Group
Counseling Provider and Resources
Intensity
External Validity
Baron et al., 1990148
Adult men and women ina group general practice, Abingdon, UK
Avg/Low
12 mo
Intv: 187 Cont: 181
91%
Primary care providers
Intv: RN delivered 30 min group or individual diet advice and 2 F/Us Cont: RN follow up visit at 1 and 3 months; no dietary advice
Medium
High
Beresford et al., 1992130
Adult men and women inprimary care 35% black North Carolina, USA
Avg/Low
3mo
Intv: 120 Cont: 122
79%
Primary care providers
Intv: RN on site provides 5 min intro to self-help materials with phone F/U 10 d later Cont: baseline interview only
Low
High
Beresford et al., 1997131
Adult men and women infamily practice clinics, USA
Avg/Low
12 mo
Intv: 1010 Cont: 1111
86%
Primary care providers
Intv: MD-delivered 3-min intro to self-help booklet + reminder letter from MD Cont: NR
Low
High
* Baseline minus follow-up value for the intervention group minus baseline minus follow-up value for the control group � Absolute change in the intervention group from baseline to follow-up divided by the baseline value of the control group
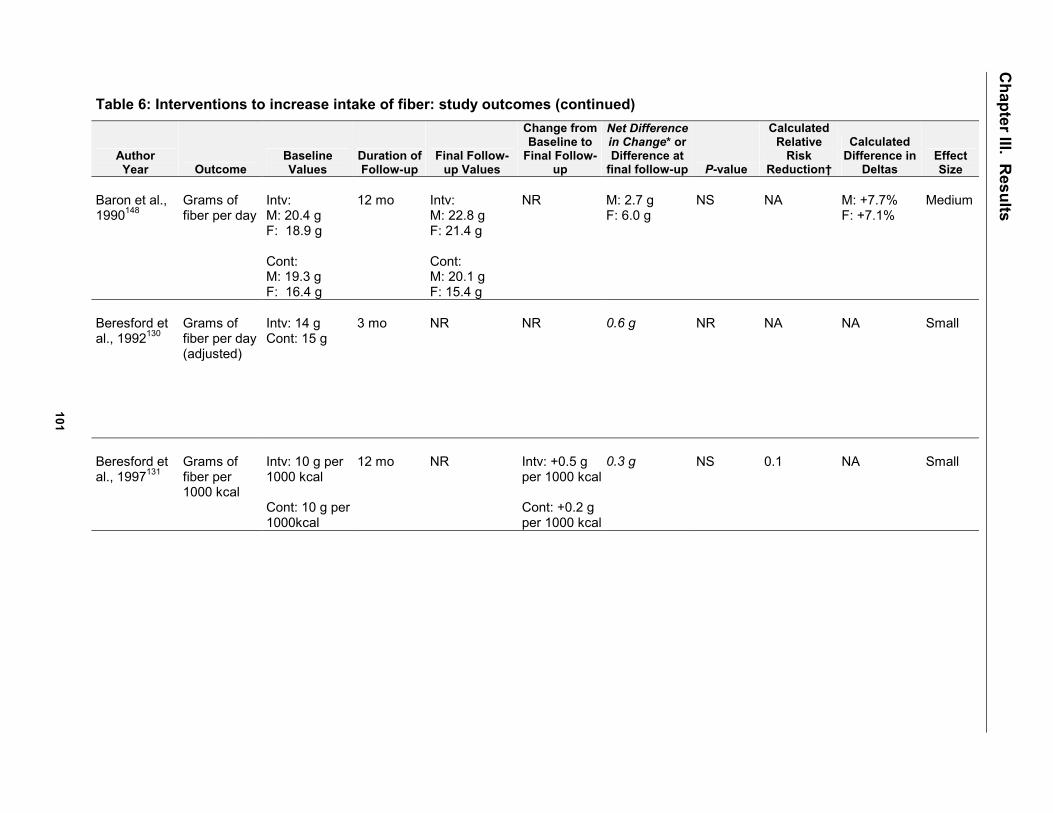
Chapter III. R
esults
101
Table 6: Interventions to increase intake of fiber: study outcomes (continued)
Author Year Outcome
Baseline Values
Duration of Follow-up
Final Follow-up Values
Change from Baseline to
Final Follow-up
Net Difference in Change* or Difference at
final follow-up P-value
Calculated Relative
Risk Reduction�
Calculated Difference in
Deltas Effect Size
Baron et al., 1990148
Grams of fiber per day
Intv: M: 20.4 g F: 18.9 g Cont: M: 19.3 g F: 16.4 g
12 mo
Intv: M: 22.8 g F: 21.4 g Cont: M: 20.1 g F: 15.4 g
NR
M: 2.7 g F: 6.0 g
NS
NA
M: +7.7% F: +7.1%
Medium
Beresford et al., 1992130
Grams of fiber per day (adjusted)
Intv: 14 g Cont: 15 g
3 mo
NR
NR
0.6 g
NR
NA
NA
Small
Beresford et al., 1997131
Grams of fiber per 1000 kcal
Intv: 10 g per 1000 kcal Cont: 10 g per 1000kcal
12 mo
NR
Intv: +0.5 g per 1000 kcal Cont: +0.2 g per 1000 kcal
0.3 g
NS
0.1
NA
Small

Chapter III. R
esults
102
Table 6. Studies of counseling to increase intake of fiber (continued)
Author, Year
Sample
Population
Level of
Risk
Max
Follow-up
Baseline Patient
Numbers
Retention
Rate
Setting
Intervention and Control Group
Counseling Provider and Resources
Intensity
External Validity
Delichatsios, Friedman et al., 2001125
Adult men and women in a large multisite, multi-specialty group practice � Harvard Vanguard Medical Associates in Massa-chusetts, USA; 72% women, 45% white, 45% black
Avg/Low
6 mo
NR
NR
Mailings and computer-generated messages
Intv: weekly diet-related educational feedback, advice, and behavioral counseling for 5-7 minutes by a totally automated, telephone-linked computer-based voice communication system Cont: weekly physical activity-related educational feedback, advice, and behavioral counseling for 5-7 minutes by a totally automated, telephone-linked computer-based voice communication system
Medium
Medium

Chapter III. R
esults
103
Table 6: Interventions to increase intake of fiber: study outcomes (continued)
Author Year
Outcome
Baseline Values
Duration of Follow-up
Final Follow-
up Values
Change from Baseline to
Final Follow-up
Net Difference in Change* or Difference at
final follow-up
P-value
Calculated
Relative Risk
Reduction�
Calculated
Difference in Deltas
Effect Size
Delichatsios, Friedman et al., 2001125
Grams of fiber per day
Intv: 21 g Cont: 20 g
6 mo
Intv: 22 g Cont: 18 g
Intv: +1 g Cont: -2 g
3 g
P < 0.05
0.05
14.8%
Medium

Chapter III. R
esults
104
Table 6. Studies of counseling to increase intake of fiber (continued)
Author, Year
Sample
Population
Level of
Risk
Max
Follow-up
Baseline Patient
Numbers
Retention
Rate
Setting
Intervention and Control Group
Counseling Provider and Resources
Intensity
External Validity
Delichatsios, Hunt et al., 2001134
Adult men and women patients from 6 group HMO practices in the primary care research network of Harvard Pilgrim HealthCare, Massa-chusetts, USA
Avg/Low
3 mo
Intv: 230 Cont: 274
Intv: 85% Cont: 92%
Mailings and computer-generated messages
Intv: mailed personalized dietary recommendations and 2 educational booklets; endorsement by 1 hour-trained MD or NP; 2 motivational phone counseling sessions by trainedMPH student telephone counselors. RD consultation if needed. Cont: NR
Medium
Medium

Chapter III. R
esults
105
Table 6: Interventions to increase intake of fiber: study outcomes (continued)
Author Year
Outcome
Baseline Values
Duration of Follow-up
Final Follow-
up Values
Change from Baseline to
Final Follow-up
Net Difference in Change* or Difference at
final follow-up
P-value
Calculated
Relative Risk
Reduction�
Calculated
Difference in Deltas
Effect Size
Delichatsios, Hunt et al., 2001134
Grams of fiber per day
Intv: 7.3 g Cont: 8.2 g
3 mo
Intv: 9.3 g Cont: 9.0 g
Intv: +2 g Cont: +0.8 g
1.2 g
NR
0.24
17.6%
Medium
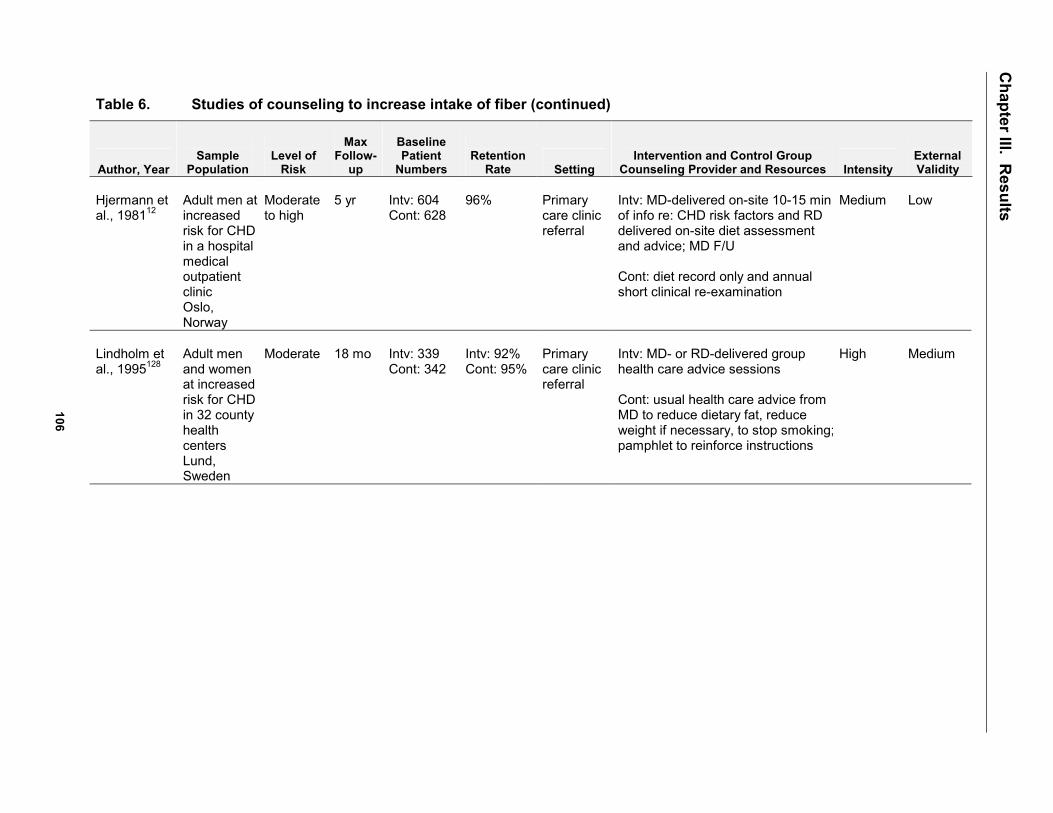
Chapter III. R
esults
106
Table 6. Studies of counseling to increase intake of fiber (continued)
Author, Year
Sample
Population
Level of
Risk
Max
Follow-up
Baseline Patient
Numbers
Retention
Rate
Setting
Intervention and Control Group
Counseling Provider and Resources
Intensity
External Validity
Hjermann et al., 198112
Adult men at increased risk for CHD in a hospital medical outpatient clinic Oslo, Norway
Moderate to high
5 yr
Intv: 604 Cont: 628
96%
Primary care clinic referral
Intv: MD-delivered on-site 10-15 min of info re: CHD risk factors and RD delivered on-site diet assessment and advice; MD F/U Cont: diet record only and annual short clinical re-examination
Medium
Low
Lindholm et al., 1995128
Adult men and women at increased risk for CHD in 32 county health centers Lund, Sweden
Moderate
18 mo
Intv: 339 Cont: 342
Intv: 92% Cont: 95%
Primary care clinic referral
Intv: MD- or RD-delivered group health care advice sessions Cont: usual health care advice from MD to reduce dietary fat, reduce weight if necessary, to stop smoking;pamphlet to reinforce instructions
High
Medium

Chapter III. R
esults
107
Table 6: Interventions to increase intake of fiber: study outcomes (continued)
Author Year
Outcome
Baseline Values
Duration of Follow-up
Final Follow-
up Values
Change from Baseline to
Final Follow-up
Net Difference in Change* or Difference at
final follow-up
P-value
Calculated
Relative Risk
Reduction�
Calculated
Difference in Deltas
Effect Size
Hjermann et al., 198112
Grams of fiber per day
NR
4 yrs
Intv: +6 g Cont: +4.4 g
NR
1.6 g
P < 0.05
NA
NA
Medium
Lindholm et al., 1995128
Grams of fiber per day
NR
18 mo
NR
NR
0.9 g
P < 0.001
NA
NA
Small

Chapter III. Results
108
Table 7. Relationship between amount of change in dietary behavior and risk status of patients
Amount of Change in
Dietary Behavior
Average/Low Risk
Moderate Risk
High Risk
Small Effect
Hunt et al., 1976135 Beresford et al., 1992130 Beresford et al., 1997131 Campbell et al., 1994123 (fruits
and vegetables) Campbell et al 1994123 Delichatsios, Hunt et al., 2001134
(fat) Kristal et al., 2000 (fat)132 Roderick, 1997138
Heller et al., 1994 (MD)119 Knutsen and Knutsen
1991127 (fruits and vegetables)
Lindholm et al., 1995128 (fiber)
Mojonnier et al., 1980136 Neaton et al., 198113 Ockene et al., 1999137
Cupples and
McKnight, 1994133 Masley et al., 2001140
(fat) Neaton et al., 198113
Medium Effect
Campbell et al., 1994123 (fat,
tailored msg) Lutz, 1999147 Baron, 1990148 Delichatsios, Friedman et al.,
2001125 Delichatsios, Hunt et al., 2001134
(fiber, fruits and vegetables) Kristal, 2000132 (fruits and
vegetables)
Coates et al., 1999118 (fruits
and vegetables) Hjermann et al., 198112 (fat,
fiber) Keyserling et al., 1997126 Knutsen and Knutsen,
1991127 (fat) Lindholm et al., 1995128
(fat) Siero et al., 2000146 Steptoe et al., 1999129
Campbell et al.,
1998124
Large Effect
Simkin-Silverman et al., 1997122 Maskarinec et al., 1999145
Coates et al., 1999118 (fat) Heller et al., 1994119 (self) Henderson et al., 1990141
and Insull et al., 1990142
Lee-Han et al.,
1988120 Ornish et al., 1990121 Masley et al., 2001140
(fruits and vegetables)

Chapter III. Results
109
Table 8. Relationship between the amount of change in dietary behavior and intensity of intervention
Amount of Change in
Dietary Behavior
Low Intensity
Medium Intensity
High Intensity
Small Effect
Beresford et al.,
1992130 Beresford et al.,
1997131 (fiber) Campbell et al.,
1994123 (nontailored msg: fat, fruits and vegetables)
Heller et al., 1994119 (MD)
Hunt et al., 1976135
Cupples and McKnight, 1994133
(fat, fruits and vegetables) Delichatsios, Hunt et al., 2001134
(fat) Knutsen and Knutsen, 1991127
(fruits and vegetables) Kristal et al., 2000132 (fat) Mojonnier et al., 1980136 Ockene et al., 1999137 Roderick et al., 1997138
Lindholm et al., 1995128
(fiber) Neaton et al., 198113
Medium Effect
Campbell et al.,
1994123 (tailored fat) Lutz, 1999
Baron et al., 1990148 Delichatsios, Friedman et al.,
2001125 Delichatsios, Hunt et al., 2001134
(fruits and vegetables, fiber) Hjermann et al., 198112 (fat and
fiber) Keyserling et al.,1997126 Knutsen and Knutsen, 1991127 (fat) Kristal et al., 2000132 (fruits and
vegetables) Steptoe et al., 1999129
Campbell et al., 1998124 Coates et al., 1999118
(fruits and vegetables) Lindholm et al., 1995128
(fat) Siero et al., 2000146
Large Effect
Beresford et al.,
1997131 (fat)
Heller et al., 1994119 Lee-Han et al., 1988120
Coates et al., 1999118
(fat) Henderson et al., 1990141
and Insull et al., 1990142 Masley et al., 2001140
(fruits and vegetables) Maskarinec et al., 1999145 Ornish et al., 1990121 Simkin-Silverman et al.,
1997122

Chapter III. Results
110
Table 9a. Combined effect of intensity of intervention and risk status of patients on the amount of change in dietary behavior: fat
Intensity Average/Low Risk Moderate Risk High Risk
Low Intensity
Beresford et al., 1992130 Beresford et al., 1997131 Campbell et al., 1994123
(nontailored) Campbell et al., 1994123
(tailored) Hunt et al, 1976135
Heller et al., 1994119 (MD)
Medium Intensity
Delichatsios, Hunt et al.,
2001134 Kristal et al., 2000132 Roderick et al., 1997138 Delichatsios, Friedman et al., 2001125
Heller et al., 1994119
(self) Hjermann et al., 198112 Keyserling et al., 1997126 Knutsen and Knutsen,
1991127 Mojonnier et al., 1980136 Ockene et al., 1996139 Steptoe et al., 1999129
Cupples and McKnight,
1994133 Lee-Han et al., 1988120
High Intensity
Simkin-Silverman et al.,
1997122
Coates, 1999118 Henderson et al, 1990141 and Insull, 1990142 Lindholm et al., 1995128 Neaton et al., 198113
Campbell et al., 1998124 Masley et al., 2001140 Ornish et al., 1990121 Neaton et al., 198113
Key
Bold = large effect: >10% change in total fat or ≥ 3% change in saturated fat Italics = medium effect: 5-10% change in total fat or 1% - 3% decrease in saturated fat Regular Font = small effect: < 5 % change in total fat or <1% decrease in saturated fat

Chapter III. Results
111
Table 9b. Combined effect of intensity of intervention and risk status on the amount of change in dietary behavior: fruits and vegetables
Intensity Average/Low Risk Moderate Risk High Risk
Low Intensity
Campbell et al., 1994123 Lutz et al, 1999147
Medium Intensity
Delichatsios, Friedman et al., 2001125 Delichatsios, Hunt et al., 2001134 Kristal et al., 2000132
Knutsen and Knutsen, 1991127
Cupples and McKnight, 1994133
High Intensity
Maskarinec et al., 1999145
Siero et al., 2000146 Coates et al., 1999118
Masley et al., 2001140
Key
Bold = large effect: >1 serving/day increase Italics = medium effect: 0.5 - 1 serving/day increase Regular Font = small effect: <0.5 serving/day increase
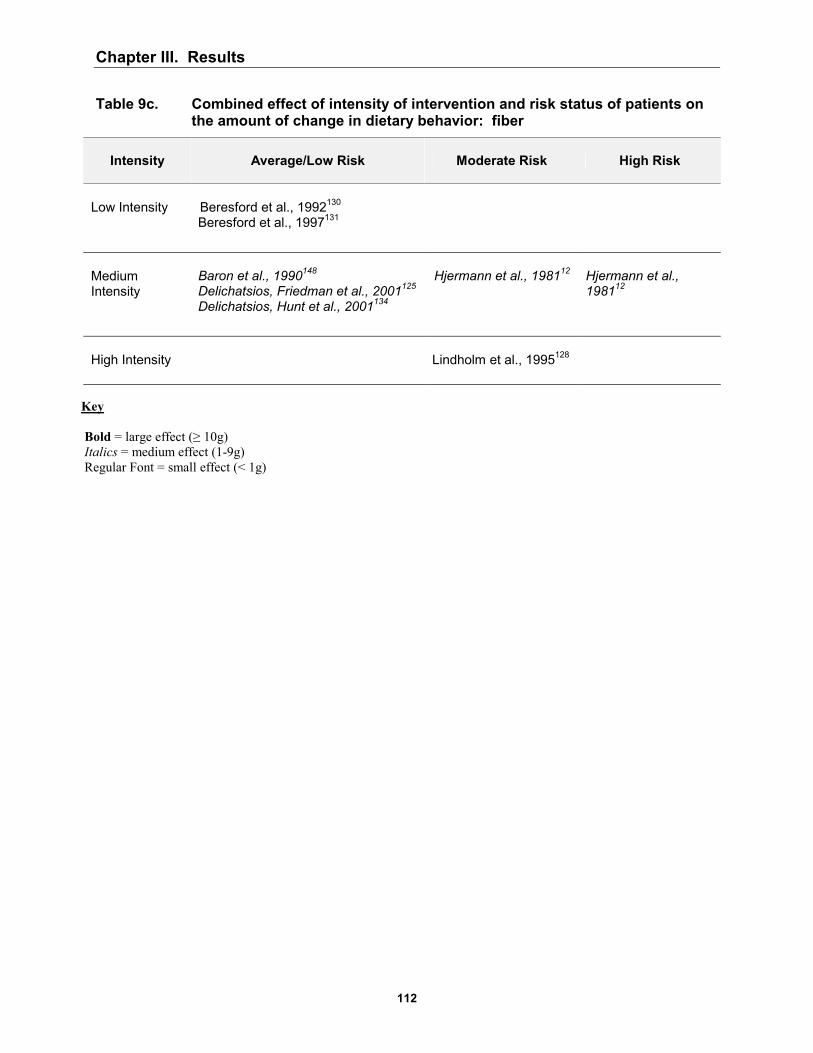
Chapter III. Results
112
Table 9c. Combined effect of intensity of intervention and risk status of patients on the amount of change in dietary behavior: fiber
Intensity Average/Low Risk Moderate Risk High Risk
Low Intensity
Beresford et al., 1992130 Beresford et al., 1997131
Medium Intensity
Baron et al., 1990148 Delichatsios, Friedman et al., 2001125 Delichatsios, Hunt et al., 2001134
Hjermann et al., 198112
Hjermann et al., 198112
High Intensity
Lindholm et al., 1995128
Key Bold = large effect (≥ 10g) Italics = medium effect (1-9g) Regular Font = small effect (< 1g)
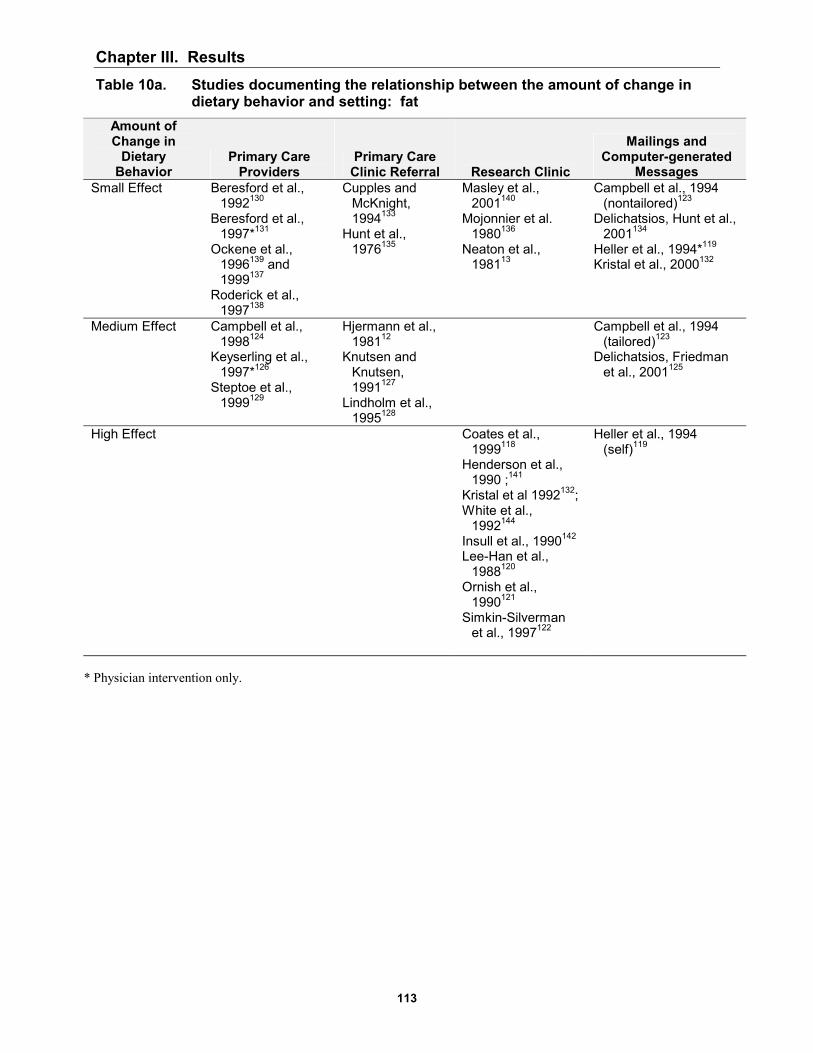
Chapter III. Results
113
Table 10a. Studies documenting the relationship between the amount of change in dietary behavior and setting: fat
Amount of Change in
Dietary Behavior
Primary Care Providers
Primary Care Clinic Referral Research Clinic
Mailings and Computer-generated
Messages Small Effect Beresford et al.,
1992130 Beresford et al.,
1997*131 Ockene et al.,
1996139 and 1999137
Roderick et al., 1997138
Cupples and McKnight, 1994133
Hunt et al., 1976135
Masley et al., 2001140
Mojonnier et al. 1980136
Neaton et al., 198113
Campbell et al., 1994 (nontailored)123
Delichatsios, Hunt et al., 2001134
Heller et al., 1994*119 Kristal et al., 2000132
Medium Effect Campbell et al., 1998124
Keyserling et al., 1997*126
Steptoe et al., 1999129
Hjermann et al., 198112
Knutsen and Knutsen, 1991127
Lindholm et al., 1995128
Campbell et al., 1994 (tailored)123
Delichatsios, Friedman et al., 2001125
High Effect Coates et al., 1999118
Henderson et al., 1990 ;141
Kristal et al 1992132; White et al.,
1992144 Insull et al., 1990142 Lee-Han et al.,
1988120 Ornish et al.,
1990121 Simkin-Silverman
et al., 1997122
Heller et al., 1994 (self)119
* Physician intervention only.
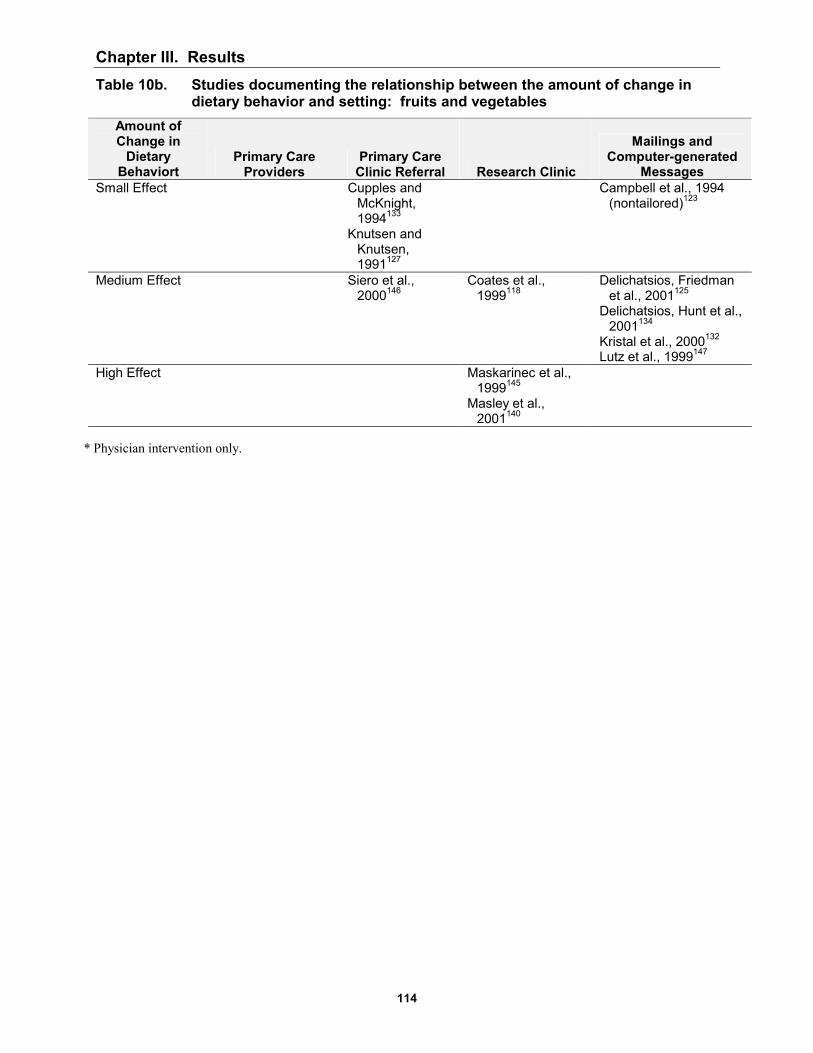
Chapter III. Results
114
Table 10b. Studies documenting the relationship between the amount of change in dietary behavior and setting: fruits and vegetables
Amount of Change in
Dietary Behaviort
Primary Care Providers
Primary Care Clinic Referral Research Clinic
Mailings and Computer-generated
Messages Small Effect Cupples and
McKnight, 1994133
Knutsen and Knutsen, 1991127
Campbell et al., 1994 (nontailored)123
Medium Effect Siero et al., 2000146
Coates et al., 1999118
Delichatsios, Friedman et al., 2001125
Delichatsios, Hunt et al., 2001134
Kristal et al., 2000132 Lutz et al., 1999147
High Effect Maskarinec et al., 1999145
Masley et al., 2001140
* Physician intervention only.

Chapter III. Results
115
Table 10c. Studies documenting the relationship between the amount of change in dietary behavior and setting: fiber
Amount of Change in
Dietary Behavior
Primary Care Providers
Primary Care Clinic Referral Research Clinic
Mailings and Computer-generated
Messages Small Effect Beresford et al.,
1992130 Beresford et al., 1997*131
Lindholm et al., 1995128
Medium Effect Baron et al., 1990148
Hjermann et al., 198112
Delichatsios, Friedman et al., 2001125
Delichatsios, Hunt et al., 2001134
High Effect
* Physician intervention only.

Counseling to Promote a Healthy Diet
116
Table 11a. Intervention components: fat
Author, Year
Dietary Assess-ment Family
Social Support Group
Food Interaction
Goal Setting
Ethnic Specificity
Total Number of Effective
Components Beresford et al., 1992130
No No No No No No No 0
Beresford et al., 1997131
No No No No No No No 0
Campbell et al., 1998124
Yes No No No No Yes No 2
Campbell et al., 1994123 Tailored vs. control Yes No No No No No No 1 Nontailored vs. control
No
No No No No No No 0
Coates et al., 1999118
Yes Yes Yes Yes Yes Yes Yes 7
Cupples and McKnight, 1994133
No
No No No No No No 0
Delichatsios, Friedman et al., 2001125
Yes No No No No Yes No 2
Delichatsios, Hunt et al., 2001134
Yes No No No No Yes No 2
Heller et al., 1994119
No No No No No No No 0
Henderson et al., 1990141 Insull et al., 1990,142 Kristal et al., 1992143
Yes No No Yes No Yes No 3
Hjermann et al., 198112
Yes Yes No Yes No No No 3
Hunt et al., 1976135
No No No Yes No No Yes 2
Keyserling et al., 1997126
Yes No No No No Yes Yes 3
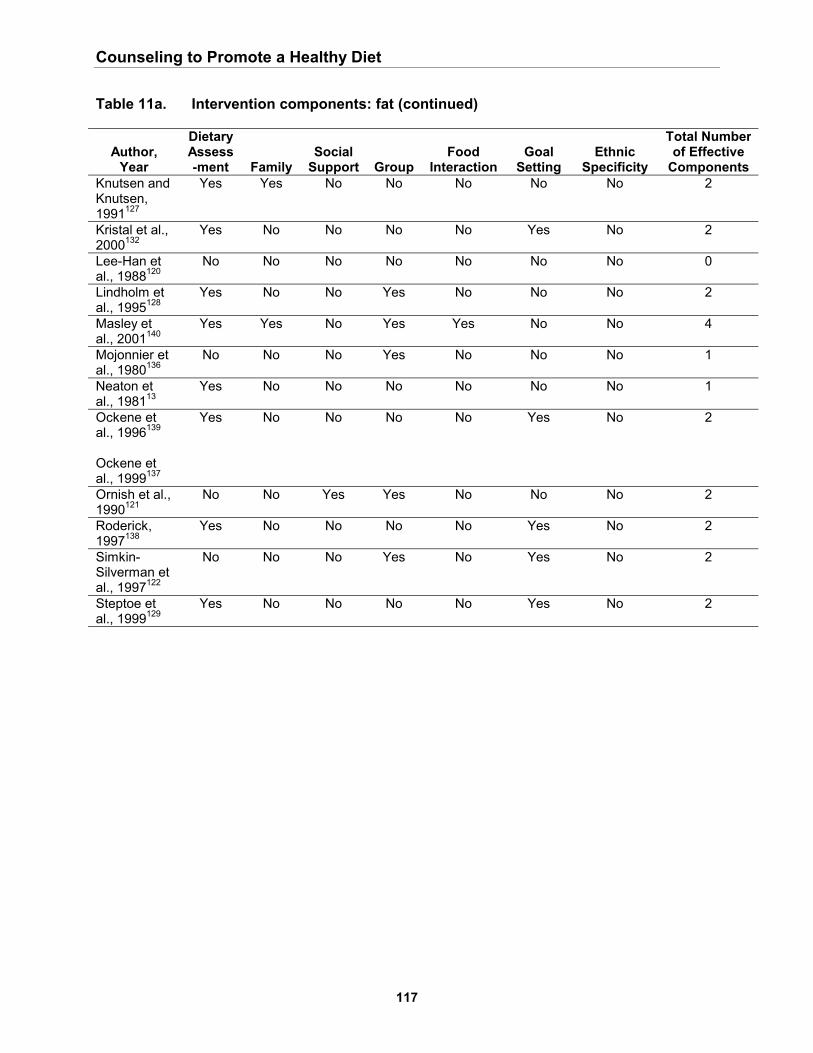
Counseling to Promote a Healthy Diet
117
Table 11a. Intervention components: fat (continued)
Author, Year
Dietary Assess-ment Family
Social Support Group
Food Interaction
Goal Setting
Ethnic Specificity
Total Number of Effective
Components Knutsen and Knutsen, 1991127
Yes Yes No No No No No 2
Kristal et al., 2000132
Yes No No No No Yes No 2
Lee-Han et al., 1988120
No No No No No No No 0
Lindholm et al., 1995128
Yes No No Yes No No No 2
Masley et al., 2001140
Yes Yes No Yes Yes No No 4
Mojonnier et al., 1980136
No No No Yes No No No 1
Neaton et al., 198113
Yes No No No No No No 1
Ockene et al., 1996139 Ockene et al., 1999137
Yes No No No No Yes No 2
Ornish et al., 1990121
No No Yes Yes No No No 2
Roderick, 1997138
Yes No No No No Yes No 2
Simkin-Silverman et al., 1997122
No No No Yes No Yes No 2
Steptoe et al., 1999129
Yes No No No No Yes No 2

Counseling to Promote a Healthy Diet
118
Table 11b. Intervention components: fruits and vegetables
Author, Year
Dietary Assess-ment Family
Social Support Group
Food Interaction
Goal Setting
Ethnic Specificity
Total Number of Effective
Components Campbell et al., 1994123 Tailored vs. control
Yes
No No No No No No 1
Campbell et al., 1994123 Nontailored vs. control
No
No No No No No No 0
Coates et al., 1999118
Yes Yes Yes Yes Yes Yes Yes 7
Cupples and McKnight 1994133
No
No No No No No No 0
Delichatsios, Friedman, et al., 2001125
Yes No No No No Yes No 2
Delichatsios, Hunt et al., 2001134
Yes No No No No Yes No 2
Knutsen and Knutsen, 1991127
Yes
Yes No No No No No 2
Kristal et al., 2000132
Yes No No No No Yes No 2
Lutz et al., 1999147 Tailored msg w/ goal vs. control
Yes
No
No
No
No
Yes
No
2
Tailored msg w/out goal vs. control
Yes
No
No
No
No
No
No
1
Nontailored msg vs. control
No
No
No
No
No
No
No
0
Maskarinec et al., 1999145
Yes No No Yes Yes No No 3
Masley et al., 2001140
Yes Yes No Yes Yes No No 4

Counseling to Promote a Healthy Diet
119
Table 11b. Intervention components: fruits and vegetables (continued)
Author, Year
Dietary Assess-ment Family
Social Support Group
Food Interaction
Goal Setting
Ethnic Specificity
Total Number of Effective
Components Siero et al., 2000146 Group education vs. control
No
No
No
Yes
No
No
No
1
Group education and tailored msg vs. control
Yes No No Yes No No No 2

Counseling to Promote a Healthy Diet
120
Table 11c. Intervention components: fiber
Author, Year
Dietary Assessment Family
Social Support Group
Food Interaction
Goal Setting
Ethnic Specificity
Total Number of Effective
Components Baron et al., 1990148
No No No Yes No No No 1
Beresford et al., 1992130
No No No No No No No 0
Beresford et al., 1997131
No No No No No No No 0
Delichatsios, Friedman et al., 2001125
Yes No No No No Yes No 2
Delichatsios, Hunt et al., 2001134
Yes No No No No Yes No 2
Hjermann et al., 198112
Yes Yes No Yes No No No 3
Lindholm et al., 1995128
Yes No No Yes No No No 2

Chapter III. Results
121
Table 12. Relationship between the number of effective intervention elements and the change in dietary behavior
Amount of Change in
Dietary Behavior 0 Components 1-2 Components 3-7 Components
Small Effect
Beresford et al., 1992130 Beresford et al., 1997131 Campbell et al., 1994123
(nontailored fat plus fruits and vegetables)
Cupples and McKnight, 1994133
Heller et al., 1994119 (MD)
Campbell et al., 1994123 (tailored fruits and vegetables)
Delichatsios, Hunt et al., 2001134 (fat)
Hunt et al., 1976135 Knutsen and Knutsen, 1991127
(fruits and vegetables) Kristal et al., 2000132 (fat) Lindholm et al., 1995128 (fiber) Mojonnier et al., 1980136 Neaton et al., 198113 Ockene et al., 1999137 Roderick et al., 1997138
Masley et al., 2001140 (fat)
Medium Effect
Lutz et al., 1999147 Baron et al., 1990148 Campbell et al., 1994123 (tailored
fat) Campbell et al., 1998124 Delichatsios, Friedman et al.,
2001125 Delichatsios, Hunt et al., 2001134
(fruits and vegetables, fiber) Knutsen and Knutsen, 1991127 (fat) Kristal et al., 2000132 (fruits and
vegetables) Lindholm et al., 1995128 (fat) Lutz et al., 1999147 Siero et al., 2000146 Steptoe et al., 1999129
Coates et al., 1999118 (fruits and vegetables)
Hjermann et al., 198112 Keyserling et al., 1997126
Large Effect Heller et al., 1994119 (self) Lee-Han et al., 1988120
Ornish et al., 1990121 Simkin-Silverman et al., 1997122
Coates et al., 1999118 (fat) Henderson et al., 1990141
and Insull et al., 1990142 Masley et al., 2001140 (fruits
and vegetables) Maskarinec et al., 1999145
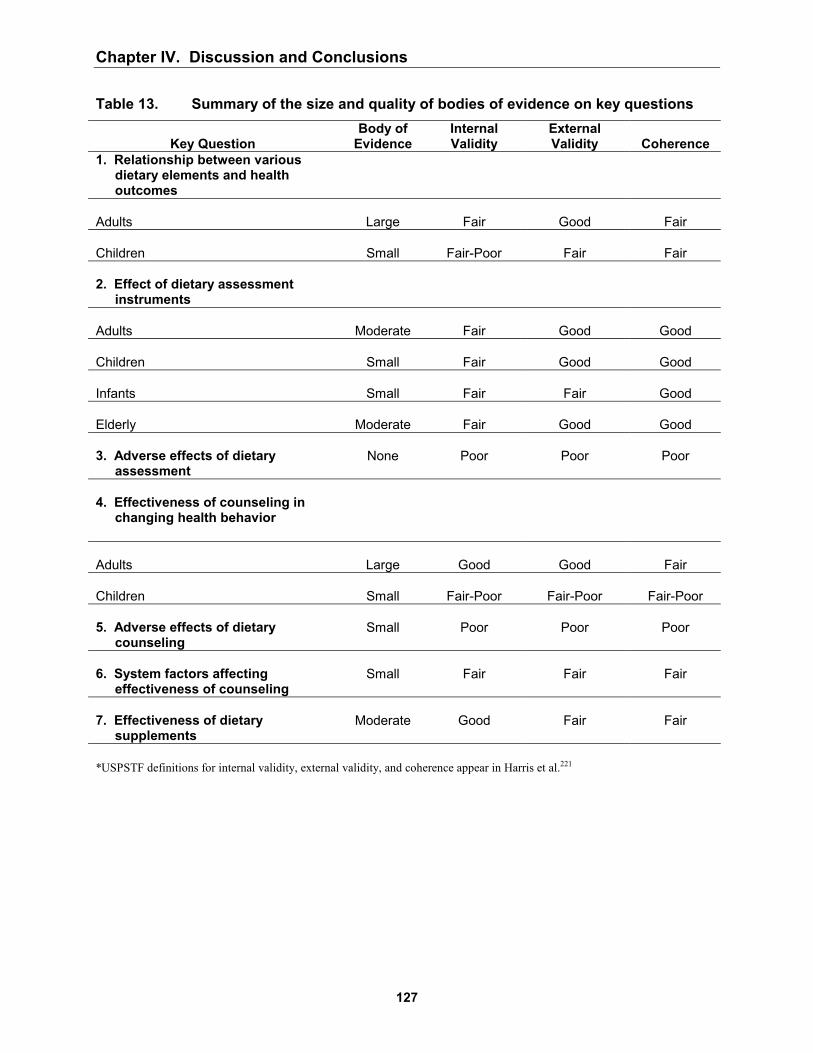
Chapter IV. Discussion and Conclusions
127
Table 13. Summary of the size and quality of bodies of evidence on key questions
Key Question Body of
Evidence Internal Validity
External Validity Coherence
1. Relationship between various dietary elements and health outcomes
Adults
Large
Fair
Good
Fair
Children
Small
Fair-Poor
Fair
Fair
2. Effect of dietary assessment
instruments
Adults
Moderate
Fair
Good
Good
Children
Small
Fair
Good
Good
Infants
Small
Fair
Fair
Good
Elderly
Moderate
Fair
Good
Good
3. Adverse effects of dietary
assessment
None
Poor
Poor
Poor
4. Effectiveness of counseling in
changing health behavior
Adults
Large
Good
Good
Fair
Children
Small
Fair-Poor
Fair-Poor
Fair-Poor
5. Adverse effects of dietary
counseling
Small
Poor
Poor
Poor
6. System factors affecting
effectiveness of counseling
Small
Fair
Fair
Fair
7. Effectiveness of dietary
supplements
Moderate
Good
Fair
Fair
*USPSTF definitions for internal validity, external validity, and coherence appear in Harris et al.221

C
hapter II. Methods
8
Figure 1. Counseling to Promote a Healthy Diet: Analytic Framework
Clinical Population
InterventionCondition (KQ 1)
InterventionCondition (KQ 2)
Measures ofDiet BehaviorChange
Ongoing orSustained DietChange
Health CareSystemInfluences
Social-Environmental
Influences
Other PositiveOutcomes
Adverse Effects
Adverse Effects
Assessment
(KQ 6)
Key Questions: 1. Relationship between dietary patterns and health 2. Valid and feasible dietary assessment tools 3. Adverse effects of dietary assessment 4. Efficacy of behavioral intervention 5. Adverse effects of behavior change 6. Health care system influences 7. Dietary supplements for undernourished patients
PositiveHealthOutcomes
(KQ 2)
(KQ 3)
(KQ 4) (KQ 4)
(KQ 4)
(KQ 1) (KQ 7)
Observational Data:Dietary Patterns
(KQ 5)

Counseling to Promote a Healthy Diet
60
Figure 2. Dietary behavioral counseling literature search
Excluded at abstract
review: 251
Excluded at full article
review: 41
Retained in final report:
33
Full articles reviewed:
74
Articles from literature
review: 325
Related Documents