System Power Report System Power Report COMPUTER NAME COMPUTER NAME DELL SYSTEM PRODUCT NAME SYSTEM PRODUCT NAME Dell Inc. Inspiron 5515 BIOS BIOS 1.2.0 05/13/2021 OS BUILD OS BUILD 19041.1.amd64fre.vb_release.191206-1406 PLATFORM ROLE PLATFORM ROLE Mobile REPORT TIME REPORT TIME 2021-07-14 10:11:26 System Power State Transitions System Power State Transitions Battery drains over the last 3 days Legend Legend GRAPH LINE GRAPH LINE DESCRIPTION DESCRIPTION Dotted Dotted AC power Solid Solid Battery power No line No line System powered off Grey Grey Active Scenario Green Green Low System Activity Orange Orange Moderate System Activity Red High System Activity Violet Abnormal Shutdown Filter Option. Filter Option. Session Length: Session Length: All > 10 min States: States: All Active Screen Off Sleep Hibernate Shutdown Bug Check START TIME START TIME DURATION DURATION STATE STATE ENERGY ENERGY CHANGE CHANGE CHANGE RATE CHANGE RATE % LOW POWER % LOW POWER STATE TIME STATE TIME % CAPACITY % CAPACITY REMAINING REMAINING AT START AT START 1 2021-07-11 17:57:19 0:00:16 Screen Off - - - Charge - 100%

Welcome message from author
This document is posted to help you gain knowledge. Please leave a comment to let me know what you think about it! Share it to your friends and learn new things together.
Transcript

System Power ReportSystem Power ReportCOMPUTER NAMECOMPUTER NAME DELLSYSTEM PRODUCT NAMESYSTEM PRODUCT NAME Dell Inc. Inspiron 5515BIOSBIOS 1.2.0 05/13/2021OS BUILDOS BUILD 19041.1.amd64fre.vb_release.191206-1406PLATFORM ROLEPLATFORM ROLE MobileREPORT TIMEREPORT TIME 2021-07-14 10:11:26
System Power State TransitionsSystem Power State TransitionsBattery drains over the last 3 days
LegendLegendGRAPH LINEGRAPH LINE DESCRIPTIONDESCRIPTIONDottedDotted AC powerSolidSolid Battery powerNo lineNo line System powered off
GreyGrey Active ScenarioGreenGreen Low System ActivityOrangeOrange Moderate System ActivityRed High System ActivityViolet Abnormal Shutdown
Filter Option.Filter Option.Session Length:Session Length:
All > 10 min
S tates:S tates:All Active Screen Off Sleep Hibernate Shutdown Bug Check
START TIMESTART TIME DURATIONDURATION STATESTATE ENERGYENERGYCHANGECHANGE CHANGE RATECHANGE RATE % LOW POWER% LOW POWER
STATE TIMESTATE TIME% CAPACITY% CAPACITYREMAININGREMAININGAT STARTAT START
1 2021-07-1117:57:19 0:00:16 Screen Off - - - Charge - 100%

2 17:57:35 1:02:23 Sleep - - - ChargeSW:97%
HW:97% 100%
3 18:59:54 0:00:14 Screen Off - - - Charge - 100%4 19:00:08 16:38:17 Sleep - - - Charge SW:
99%HW:99% 100%
5 2021-07-1211:38:21 1:02:59 Active - - - Charge - 100%
6 12:41:21 0:00:03 Screen Off - - - Charge - 100%7 12:41:24 1:31:11 Sleep - - - Charge SW:
97%HW:97% 100%
8 14:12:31 0:17:19 Active - - - Charge - 100%9 14:29:50 0:00:16 Screen Off - - - Charge - 100%10 14:30:06 2:23:22 Sleep - - - Charge SW:
98%HW:97% 100%
11 16:53:23 0:00:03 Screen Off - - - Charge - 100%12 16:53:27 2:26:55 Sleep - - - Charge SW:
99%HW:98% 100%
13 19:20:17 0:55:40 Active - - - Charge - 100%14 20:15:58 0:00:18 Screen Off - - - Charge - 100%15 20:16:17 1:02:19 Sleep - - - Charge SW:
97%HW:97% 100%
16 21:18:32 0:00:00 Screen Off - - - Charge - 100%17 21:18:32 0:00:00 Sleep - - - Charge - 100%18 21:18:33 0:00:25 Screen Off - - - Charge - 100%19 21:18:58 0:00:00 Sleep - - - Charge - 100%20 21:18:59 0:01:02 Screen Off - - - Charge - 100%21 21:20:01 0:00:00 Sleep - - - Charge - 100%22 21:20:02 0:01:01 Screen Off - - - Charge - 100%23 21:21:04 0:17:12 Sleep - - - Charge SW:
95%HW:95% 100%
24 21:38:11 0:08:04 Active - - - Charge - 100%25 21:46:15 0:00:00 Screen Off - - - Charge - 100%26 21:46:16 0:00:00 Sleep - - - Charge - 100%27 21:46:16 0:00:00 Screen Off - - - Charge - 100%28 21:46:16 14:01:03 Sleep - - - Charge SW:
100%HW:100% 100%
29 2021-07-1311:47:15 0:12:27 Active - - - Charge - 100%
30 11:59:43 0:00:29 Screen Off - - - Charge - 100%
START TIMESTART TIME DURATIONDURATION STATESTATE ENERGYENERGYCHANGECHANGE CHANGE RATECHANGE RATE % LOW POWER% LOW POWER
STATE TIMESTATE TIME% CAPACITY% CAPACITYREMAININGREMAININGAT STARTAT START
TopTop
TopTop
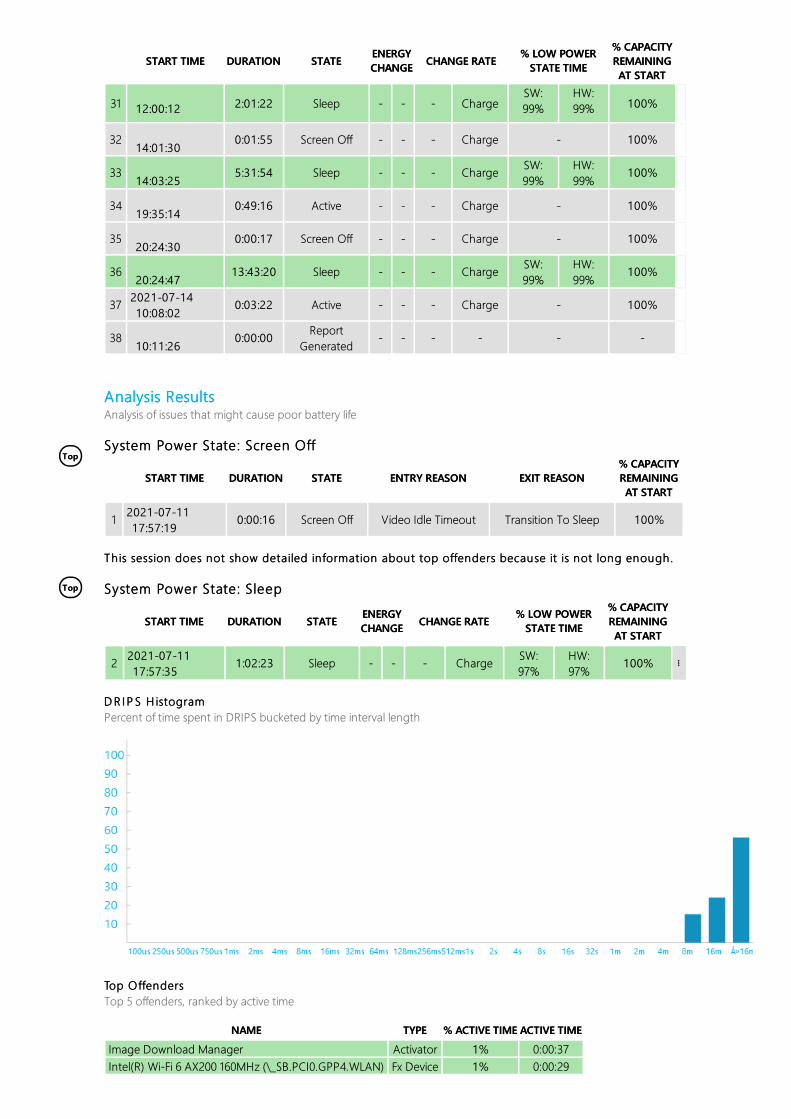
31 12:00:12 2:01:22 Sleep - - - ChargeSW:99%
HW:99% 100%
32 14:01:30 0:01:55 Screen Off - - - Charge - 100%33 14:03:25 5:31:54 Sleep - - - Charge SW:
99%HW:99% 100%
34 19:35:14 0:49:16 Active - - - Charge - 100%35 20:24:30 0:00:17 Screen Off - - - Charge - 100%36 20:24:47 13:43:20 Sleep - - - Charge SW:
99%HW:99% 100%
37 2021-07-1410:08:02 0:03:22 Active - - - Charge - 100%
38 10:11:26 0:00:00 ReportGenerated - - - - - -
START TIMESTART TIME DURATIONDURATION STATESTATE ENERGYENERGYCHANGECHANGE CHANGE RATECHANGE RATE % LOW POWER% LOW POWER
STATE TIMESTATE TIME% CAPACITY% CAPACITYREMAININGREMAININGAT STARTAT START
Analysis ResultsAnalysis ResultsAnalysis of issues that might cause poor battery life
System Power State: System Power State: Screen OffScreen Off
START TIMESTART TIME DURATIONDURATION STATESTATE ENTRY REASONENTRY REASON EXIT REASONEXIT REASON% CAPACITY% CAPACITYREMAININGREMAININGAT STARTAT START
1 2021-07-1117:57:19 0:00:16 Screen Off Video Idle Timeout Transition To Sleep 100%
This session does not show detailed information about top offenders because it is not long enough.This session does not show detailed information about top offenders because it is not long enough.
System Power State: System Power State: SleepSleep
START TIMESTART TIME DURATIONDURATION STATESTATE ENERGYENERGYCHANGECHANGE CHANGE RATECHANGE RATE % LOW POWER% LOW POWER
STATE TIMESTATE TIME% CAPACITY% CAPACITYREMAININGREMAININGAT STARTAT START
2 2021-07-1117:57:35 1:02:23 Sleep - - - Charge SW:
97%HW:97% 100% ⋮⋮
D R I P S H istogramD R I P S H istogramPercent of time spent in DRIPS bucketed by time interval length
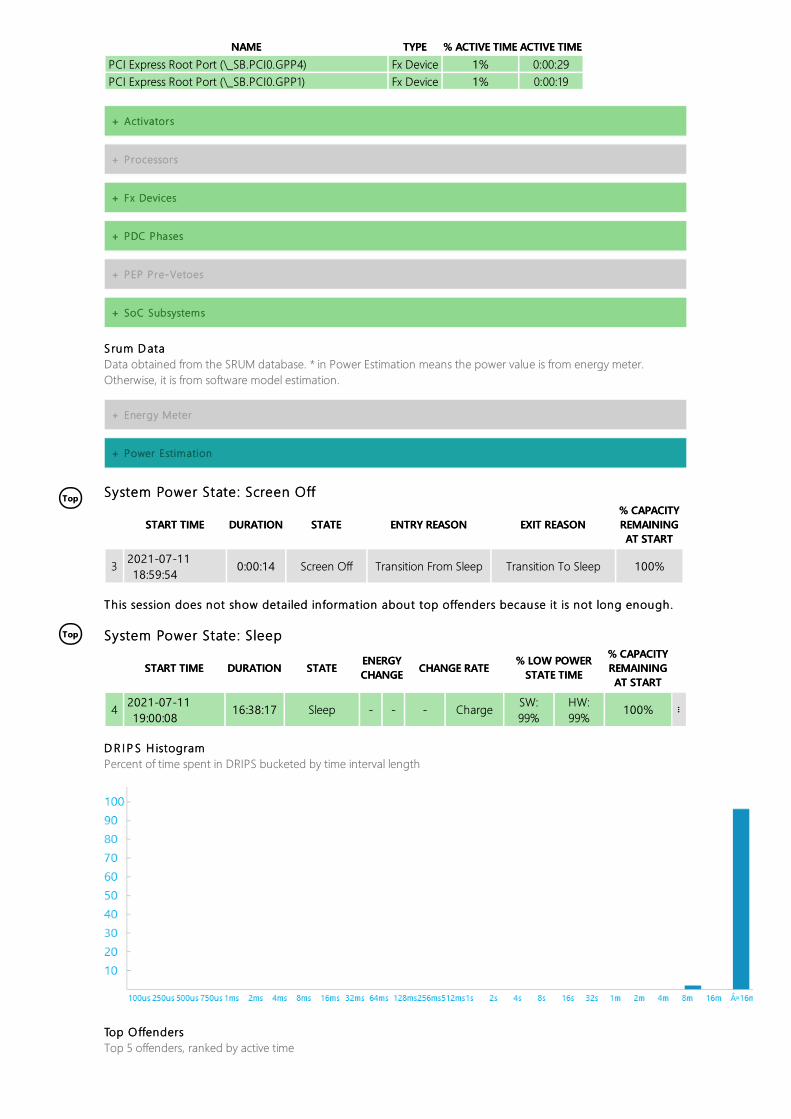
Top OffendersTop OffendersTop 5 offenders, ranked by active time
NAMENAME TYPETYPE % ACTIVE TIME% ACTIVE TIME ACTIVE TIMEACTIVE TIMEImage Download Manager Activator 1% 0:00:37Intel(R) Wi-Fi 6 AX200 160MHz (\_SB.PCI0.GPP4.WLAN) Fx Device 1% 0:00:29
TopTop
TopTop
PCI Express Root Port (\_SB.PCI0.GPP4) Fx Device 1% 0:00:29PCI Express Root Port (\_SB.PCI0.GPP1) Fx Device 1% 0:00:19
NAMENAME TYPETYPE % ACTIVE TIME% ACTIVE TIME ACTIVE TIMEACTIVE TIME
+ ActivatorsActivators
+ ProcessorsProcessors
+ Fx DevicesFx Devices
+ PDC PhasesPDC Phases
+ PEP Pre-VetoesPEP Pre-Vetoes
+ SoC SubsystemsSoC Subsystems
Srum D ataS rum D ataData obtained from the SRUM database. * in Power Estimation means the power value is from energy meter.Otherwise, it is from software model estimation.
+ Energy MeterEnergy Meter
+ Power EstimationPower Estimation
System Power State: System Power State: Screen OffScreen Off
START TIMESTART TIME DURATIONDURATION STATESTATE ENTRY REASONENTRY REASON EXIT REASONEXIT REASON% CAPACITY% CAPACITYREMAININGREMAININGAT STARTAT START
3 2021-07-1118:59:54 0:00:14 Screen Off Transition From Sleep Transition To Sleep 100%
This session does not show detailed information about top offenders because it is not long enough.This session does not show detailed information about top offenders because it is not long enough.
System Power State: System Power State: SleepSleep
START TIMESTART TIME DURATIONDURATION STATESTATE ENERGYENERGYCHANGECHANGE CHANGE RATECHANGE RATE % LOW POWER% LOW POWER
STATE TIMESTATE TIME% CAPACITY% CAPACITYREMAININGREMAININGAT STARTAT START
4 2021-07-1119:00:08 16:38:17 Sleep - - - Charge SW:
99%HW:99% 100% ⋮⋮
D R I P S H istogramD R I P S H istogramPercent of time spent in DRIPS bucketed by time interval length
Top OffendersTop OffendersTop 5 offenders, ranked by active time
TopTop
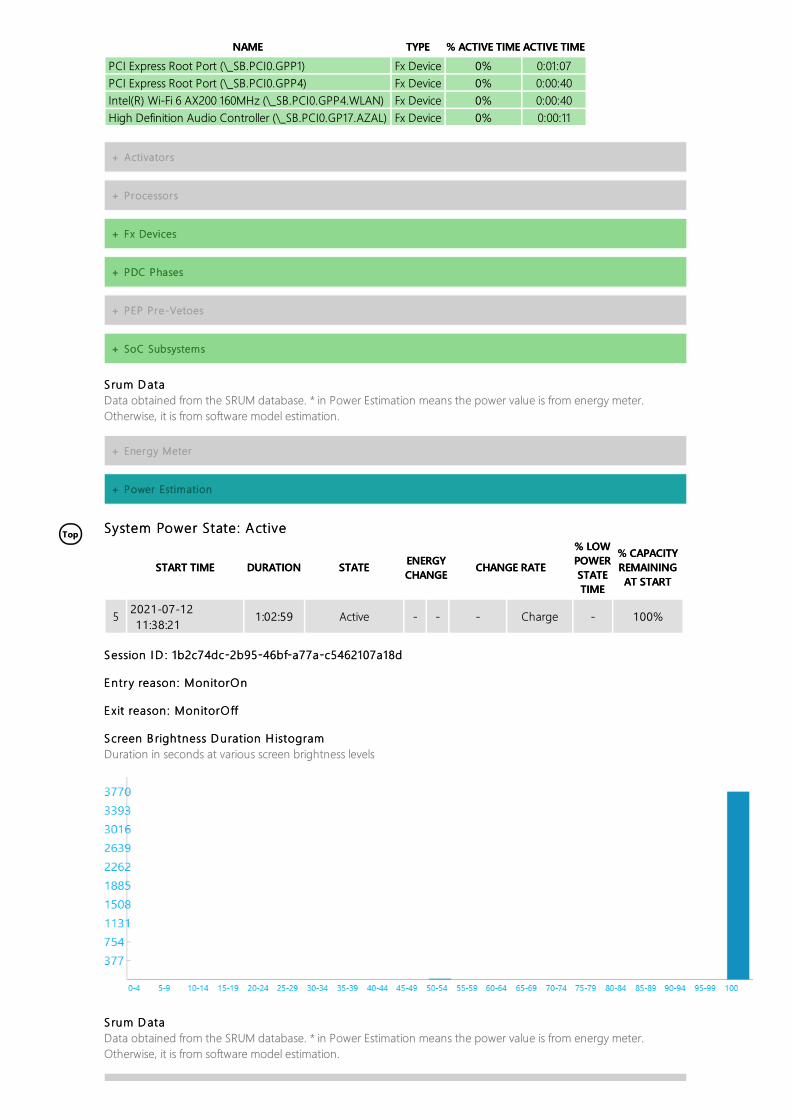
NAMENAME TYPETYPE % ACTIVE TIME% ACTIVE TIME ACTIVE TIMEACTIVE TIMEPCI Express Root Port (\_SB.PCI0.GPP1) Fx Device 0% 0:01:07PCI Express Root Port (\_SB.PCI0.GPP4) Fx Device 0% 0:00:40Intel(R) Wi-Fi 6 AX200 160MHz (\_SB.PCI0.GPP4.WLAN) Fx Device 0% 0:00:40High Definition Audio Controller (\_SB.PCI0.GP17.AZAL) Fx Device 0% 0:00:11
+ ActivatorsActivators
+ ProcessorsProcessors
+ Fx DevicesFx Devices
+ PDC PhasesPDC Phases
+ PEP Pre-VetoesPEP Pre-Vetoes
+ SoC SubsystemsSoC Subsystems
Srum D ataS rum D ataData obtained from the SRUM database. * in Power Estimation means the power value is from energy meter.Otherwise, it is from software model estimation.
+ Energy MeterEnergy Meter
+ Power EstimationPower Estimation
System Power State: System Power State: ActiveActive
START TIMESTART TIME DURATIONDURATION STATESTATE ENERGYENERGYCHANGECHANGE CHANGE RATECHANGE RATE
% LOW% LOWPOWERPOWERSTATESTATETIMETIME
% CAPACITY% CAPACITYREMAININGREMAININGAT STARTAT START
5 2021-07-1211:38:21 1:02:59 Active - - - Charge - 100%
Session I D : 1b2c74dc-2b95-46bf-a77a-c5462107a18dSession I D : 1b2c74dc-2b95-46bf-a77a-c5462107a18d
Entry reason: MonitorOnEntry reason: MonitorOn
Exit reason: MonitorOffExit reason: MonitorOff
Screen B rightness D uration H istogramScreen B rightness D uration H istogramDuration in seconds at various screen brightness levels
S rum D ataS rum D ataData obtained from the SRUM database. * in Power Estimation means the power value is from energy meter.Otherwise, it is from software model estimation.

TopTop
TopTop
+ Energy MeterEnergy Meter
+ Power EstimationPower Estimation
System Power State: System Power State: Screen OffScreen Off
START TIMESTART TIME DURATIONDURATION STATESTATE ENTRY REASONENTRY REASON EXIT REASONEXIT REASON% CAPACITY% CAPACITYREMAININGREMAININGAT STARTAT START
6 2021-07-1212:41:21 0:00:03 Screen Off Video Idle Timeout Transition To Sleep 100%
This session does not show detailed information about top offenders because it is not long enough.This session does not show detailed information about top offenders because it is not long enough.
System Power State: System Power State: SleepSleep
START TIMESTART TIME DURATIONDURATION STATESTATE ENERGYENERGYCHANGECHANGE CHANGE RATECHANGE RATE % LOW POWER% LOW POWER
STATE TIMESTATE TIME% CAPACITY% CAPACITYREMAININGREMAININGAT STARTAT START
7 2021-07-1212:41:24 1:31:11 Sleep - - - Charge SW:
97%HW:97% 100% ⋮⋮
D R I P S H istogramD R I P S H istogramPercent of time spent in DRIPS bucketed by time interval length
Top OffendersTop OffendersTop 5 offenders, ranked by active time
NAMENAME TYPETYPE % ACTIVE TIME% ACTIVE TIME ACTIVE TIMEACTIVE TIMEImage Download Manager Activator 1% 0:00:54Intel(R) Wi-Fi 6 AX200 160MHz (\_SB.PCI0.GPP4.WLAN) Fx Device 1% 0:00:45PCI Express Root Port (\_SB.PCI0.GPP4) Fx Device 1% 0:00:45PCI Express Root Port (\_SB.PCI0.GPP1) Fx Device 1% 0:00:44Low Power Phase PDC Phase 0% 0:00:05
+ ActivatorsActivators
+ ProcessorsProcessors
+ Fx DevicesFx Devices
+ PDC PhasesPDC Phases
+ PEP Pre-VetoesPEP Pre-Vetoes
+ SoC SubsystemsSoC Subsystems
Srum D ataS rum D ata
TopTop
TopTop
TopTop
Data obtained from the SRUM database. * in Power Estimation means the power value is from energy meter.Otherwise, it is from software model estimation.
+ Energy MeterEnergy Meter
+ Power EstimationPower Estimation
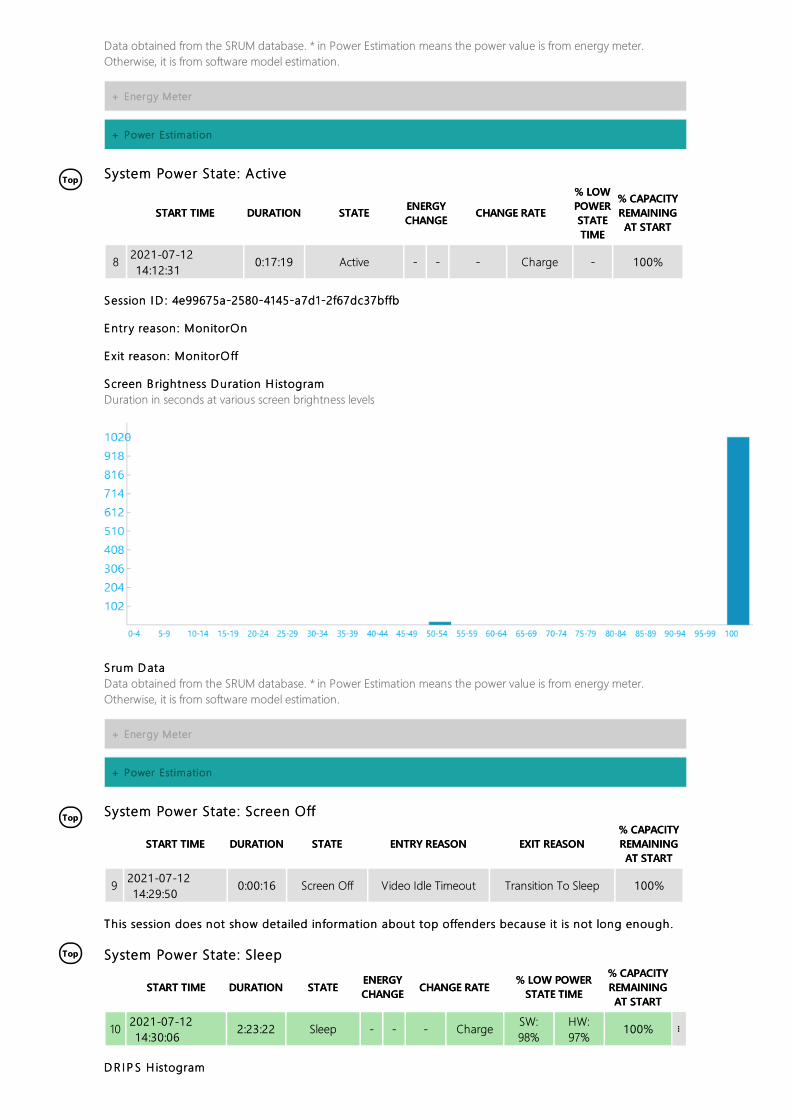
System Power State: System Power State: ActiveActive
START TIMESTART TIME DURATIONDURATION STATESTATE ENERGYENERGYCHANGECHANGE CHANGE RATECHANGE RATE
% LOW% LOWPOWERPOWERSTATESTATETIMETIME
% CAPACITY% CAPACITYREMAININGREMAININGAT STARTAT START
8 2021-07-1214:12:31 0:17:19 Active - - - Charge - 100%
Session I D : 4e99675a-2580-4145-a7d1-2f67dc37bffbSession I D : 4e99675a-2580-4145-a7d1-2f67dc37bffb
Entry reason: MonitorOnEntry reason: MonitorOn
Exit reason: MonitorOffExit reason: MonitorOff
Screen B rightness D uration H istogramScreen B rightness D uration H istogramDuration in seconds at various screen brightness levels
S rum D ataS rum D ataData obtained from the SRUM database. * in Power Estimation means the power value is from energy meter.Otherwise, it is from software model estimation.
+ Energy MeterEnergy Meter
+ Power EstimationPower Estimation
System Power State: System Power State: Screen OffScreen Off
START TIMESTART TIME DURATIONDURATION STATESTATE ENTRY REASONENTRY REASON EXIT REASONEXIT REASON% CAPACITY% CAPACITYREMAININGREMAININGAT STARTAT START
9 2021-07-1214:29:50 0:00:16 Screen Off Video Idle Timeout Transition To Sleep 100%
This session does not show detailed information about top offenders because it is not long enough.This session does not show detailed information about top offenders because it is not long enough.
System Power State: System Power State: SleepSleep
START TIMESTART TIME DURATIONDURATION STATESTATE ENERGYENERGYCHANGECHANGE CHANGE RATECHANGE RATE % LOW POWER% LOW POWER
STATE TIMESTATE TIME% CAPACITY% CAPACITYREMAININGREMAININGAT STARTAT START
10 2021-07-1214:30:06 2:23:22 Sleep - - - Charge SW:
98%HW:97% 100% ⋮⋮
D R I P S H istogramD R I P S H istogram

TopTop
TopTop
Percent of time spent in DRIPS bucketed by time interval length
Top OffendersTop OffendersTop 5 offenders, ranked by active time
NAMENAME TYPETYPE % ACTIVE TIME% ACTIVE TIME ACTIVE TIMEACTIVE TIMEImage Download Manager Activator 1% 0:01:26Intel(R) Wi-Fi 6 AX200 160MHz (\_SB.PCI0.GPP4.WLAN) Fx Device 0% 0:00:37PCI Express Root Port (\_SB.PCI0.GPP4) Fx Device 0% 0:00:37PCI Express Root Port (\_SB.PCI0.GPP1) Fx Device 0% 0:00:32
+ ActivatorsActivators
+ ProcessorsProcessors
+ Fx DevicesFx Devices
+ PDC PhasesPDC Phases
+ PEP Pre-VetoesPEP Pre-Vetoes
+ SoC SubsystemsSoC Subsystems
Srum D ataS rum D ataData obtained from the SRUM database. * in Power Estimation means the power value is from energy meter.Otherwise, it is from software model estimation.
+ Energy MeterEnergy Meter
+ Power EstimationPower Estimation
System Power State: System Power State: Screen OffScreen Off
START TIMESTART TIME DURATIONDURATION STATESTATE ENTRY REASONENTRY REASON EXIT REASONEXIT REASON% CAPACITY% CAPACITYREMAININGREMAININGAT STARTAT START
11 2021-07-1216:53:23 0:00:03 Screen Off Transition From Sleep Transition To Sleep 100%
This session does not show detailed information about top offenders because it is not long enough.This session does not show detailed information about top offenders because it is not long enough.
System Power State: System Power State: SleepSleep
START TIMESTART TIME DURATIONDURATION STATESTATE ENERGYENERGYCHANGECHANGE CHANGE RATECHANGE RATE % LOW POWER% LOW POWER
STATE TIMESTATE TIME% CAPACITY% CAPACITYREMAININGREMAININGAT STARTAT START
12 2021-07-1216:53:27 2:26:55 Sleep - - - Charge SW:
99%HW:98% 100% ⋮⋮

TopTop
D R I P S H istogramD R I P S H istogramPercent of time spent in DRIPS bucketed by time interval length
Top OffendersTop OffendersTop 5 offenders, ranked by active time
NAMENAME TYPETYPE % ACTIVE TIME% ACTIVE TIME ACTIVE TIMEACTIVE TIMEPCI Express Root Port (\_SB.PCI0.GPP1) Fx Device 0% 0:00:26PCI Express Root Port (\_SB.PCI0.GPP4) Fx Device 0% 0:00:15Intel(R) Wi-Fi 6 AX200 160MHz (\_SB.PCI0.GPP4.WLAN) Fx Device 0% 0:00:15Low Power Phase PDC Phase 0% 0:00:05
+ ActivatorsActivators
+ ProcessorsProcessors
+ Fx DevicesFx Devices
+ PDC PhasesPDC Phases
+ PEP Pre-VetoesPEP Pre-Vetoes
+ SoC SubsystemsSoC Subsystems
Srum D ataS rum D ataData obtained from the SRUM database. * in Power Estimation means the power value is from energy meter.Otherwise, it is from software model estimation.
+ Energy MeterEnergy Meter
+ Power EstimationPower Estimation
System Power State: System Power State: ActiveActive
START TIMESTART TIME DURATIONDURATION STATESTATE ENERGYENERGYCHANGECHANGE CHANGE RATECHANGE RATE
% LOW% LOWPOWERPOWERSTATESTATETIMETIME
% CAPACITY% CAPACITYREMAININGREMAININGAT STARTAT START
13 2021-07-1219:20:17 0:55:40 Active - - - Charge - 100%
Session I D : af4d4ff5-1394-41e8-9f64-80d6a4ef04dcSession I D : af4d4ff5-1394-41e8-9f64-80d6a4ef04dc
Entry reason: MonitorOnEntry reason: MonitorOn
Exit reason: MonitorOffExit reason: MonitorOff
Screen B rightness D uration H istogramScreen B rightness D uration H istogram
TopTop
TopTop
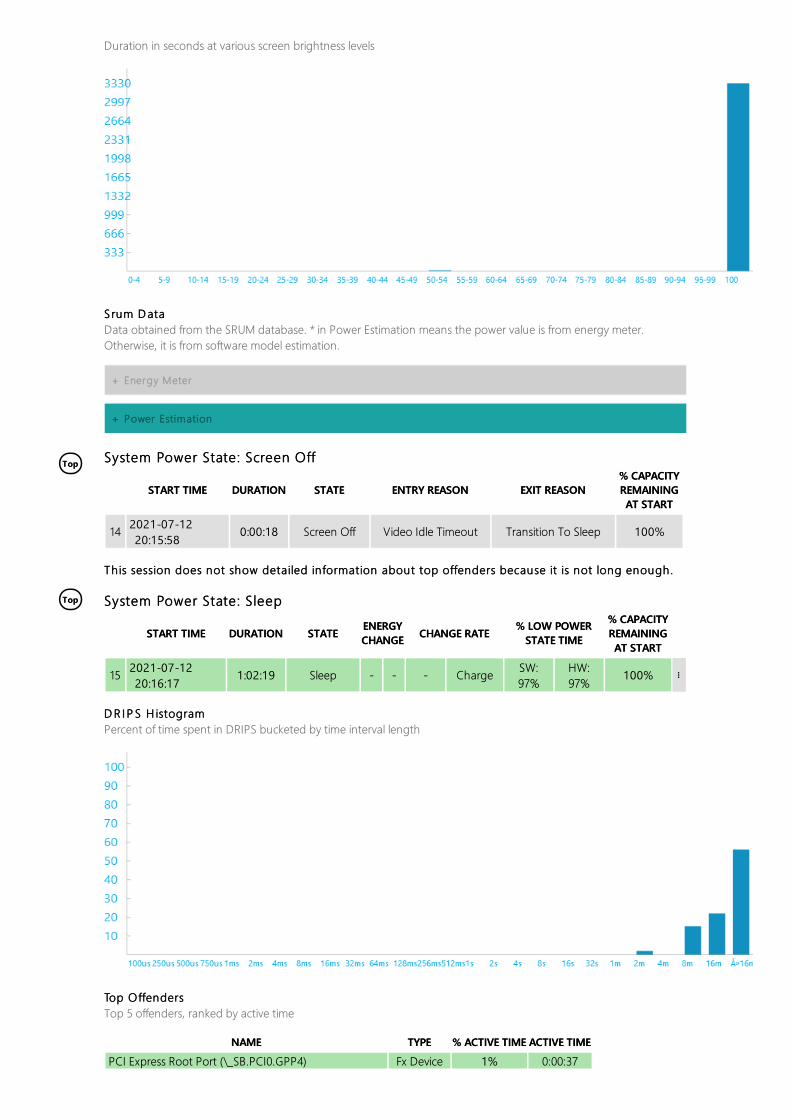
Duration in seconds at various screen brightness levels
S rum D ataS rum D ataData obtained from the SRUM database. * in Power Estimation means the power value is from energy meter.Otherwise, it is from software model estimation.
+ Energy MeterEnergy Meter
+ Power EstimationPower Estimation
System Power State: System Power State: Screen OffScreen Off
START TIMESTART TIME DURATIONDURATION STATESTATE ENTRY REASONENTRY REASON EXIT REASONEXIT REASON% CAPACITY% CAPACITYREMAININGREMAININGAT STARTAT START
14 2021-07-1220:15:58 0:00:18 Screen Off Video Idle Timeout Transition To Sleep 100%
This session does not show detailed information about top offenders because it is not long enough.This session does not show detailed information about top offenders because it is not long enough.
System Power State: System Power State: SleepSleep
START TIMESTART TIME DURATIONDURATION STATESTATE ENERGYENERGYCHANGECHANGE CHANGE RATECHANGE RATE % LOW POWER% LOW POWER
STATE TIMESTATE TIME% CAPACITY% CAPACITYREMAININGREMAININGAT STARTAT START
15 2021-07-1220:16:17 1:02:19 Sleep - - - Charge SW:
97%HW:97% 100% ⋮⋮
D R I P S H istogramD R I P S H istogramPercent of time spent in DRIPS bucketed by time interval length
Top OffendersTop OffendersTop 5 offenders, ranked by active time
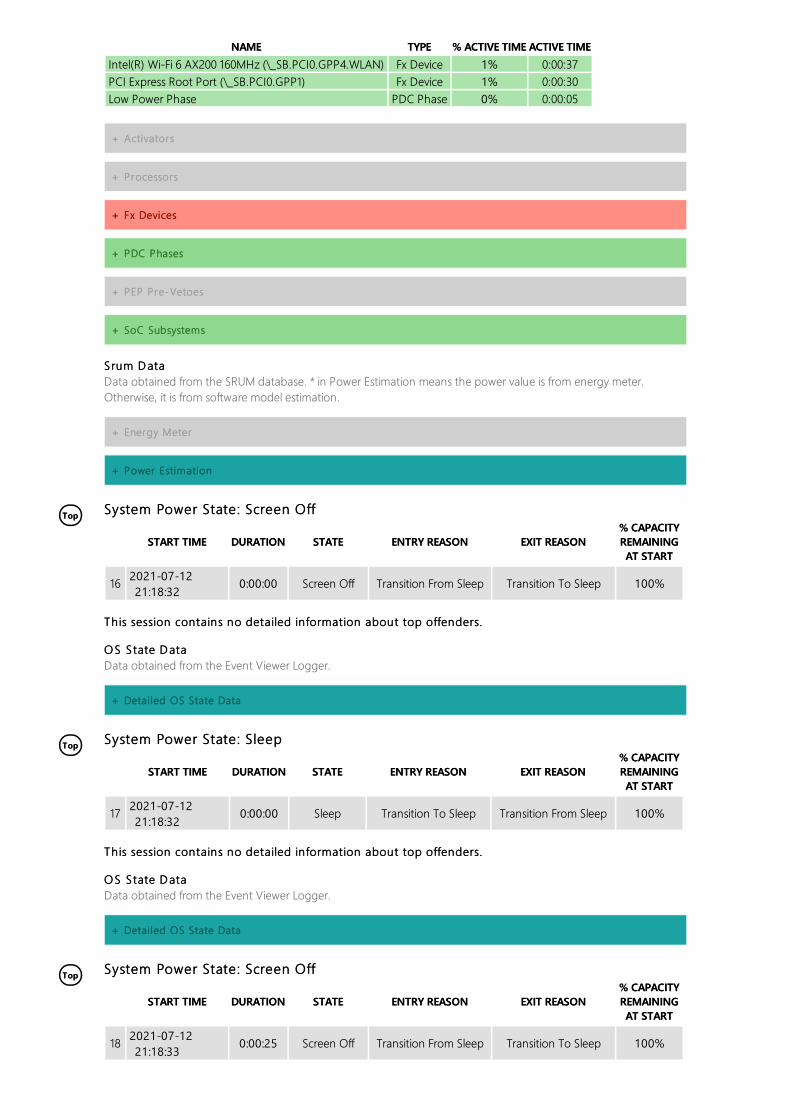
NAMENAME TYPETYPE % ACTIVE TIME% ACTIVE TIME ACTIVE TIMEACTIVE TIMEPCI Express Root Port (\_SB.PCI0.GPP4) Fx Device 1% 0:00:37
TopTop
TopTop
TopTop
Intel(R) Wi-Fi 6 AX200 160MHz (\_SB.PCI0.GPP4.WLAN) Fx Device 1% 0:00:37PCI Express Root Port (\_SB.PCI0.GPP1) Fx Device 1% 0:00:30Low Power Phase PDC Phase 0% 0:00:05
NAMENAME TYPETYPE % ACTIVE TIME% ACTIVE TIME ACTIVE TIMEACTIVE TIME
+ ActivatorsActivators
+ ProcessorsProcessors
+ Fx DevicesFx Devices
+ PDC PhasesPDC Phases
+ PEP Pre-VetoesPEP Pre-Vetoes
+ SoC SubsystemsSoC Subsystems
Srum D ataS rum D ataData obtained from the SRUM database. * in Power Estimation means the power value is from energy meter.Otherwise, it is from software model estimation.
+ Energy MeterEnergy Meter
+ Power EstimationPower Estimation
System Power State: System Power State: Screen OffScreen Off
START TIMESTART TIME DURATIONDURATION STATESTATE ENTRY REASONENTRY REASON EXIT REASONEXIT REASON% CAPACITY% CAPACITYREMAININGREMAININGAT STARTAT START
16 2021-07-1221:18:32 0:00:00 Screen Off Transition From Sleep Transition To Sleep 100%
This session contains no detailed information about top offenders.This session contains no detailed information about top offenders.
OS S tate D ataOS S tate D ataData obtained from the Event Viewer Logger.
+ Detailed OS State DataDetailed OS State Data
System Power State: System Power State: SleepSleep
START TIMESTART TIME DURATIONDURATION STATESTATE ENTRY REASONENTRY REASON EXIT REASONEXIT REASON% CAPACITY% CAPACITYREMAININGREMAININGAT STARTAT START
17 2021-07-1221:18:32 0:00:00 Sleep Transition To Sleep Transition From Sleep 100%
This session contains no detailed information about top offenders.This session contains no detailed information about top offenders.
OS S tate D ataOS S tate D ataData obtained from the Event Viewer Logger.
+ Detailed OS State DataDetailed OS State Data
System Power State: System Power State: Screen OffScreen Off
START TIMESTART TIME DURATIONDURATION STATESTATE ENTRY REASONENTRY REASON EXIT REASONEXIT REASON% CAPACITY% CAPACITYREMAININGREMAININGAT STARTAT START
18 2021-07-1221:18:33 0:00:25 Screen Off Transition From Sleep Transition To Sleep 100%

TopTop
TopTop
TopTop
TopTop
TopTop
This session contains no detailed information about top offenders.This session contains no detailed information about top offenders.
OS S tate D ataOS S tate D ataData obtained from the Event Viewer Logger.
+ Detailed OS State DataDetailed OS State Data
System Power State: System Power State: SleepSleep
START TIMESTART TIME DURATIONDURATION STATESTATE ENTRY REASONENTRY REASON EXIT REASONEXIT REASON% CAPACITY% CAPACITYREMAININGREMAININGAT STARTAT START
19 2021-07-1221:18:58 0:00:00 Sleep Transition To Sleep Transition From Sleep 100%
This session contains no detailed information about top offenders.This session contains no detailed information about top offenders.
OS S tate D ataOS S tate D ataData obtained from the Event Viewer Logger.
+ Detailed OS State DataDetailed OS State Data
System Power State: System Power State: Screen OffScreen Off
START TIMESTART TIME DURATIONDURATION STATESTATE ENTRY REASONENTRY REASON EXIT REASONEXIT REASON% CAPACITY% CAPACITYREMAININGREMAININGAT STARTAT START
20 2021-07-1221:18:59 0:01:02 Screen Off Transition From Sleep Transition To Sleep 100%
This session contains no detailed information about top offenders.This session contains no detailed information about top offenders.
OS S tate D ataOS S tate D ataData obtained from the Event Viewer Logger.
+ Detailed OS State DataDetailed OS State Data
System Power State: System Power State: SleepSleep
START TIMESTART TIME DURATIONDURATION STATESTATE ENTRY REASONENTRY REASON EXIT REASONEXIT REASON% CAPACITY% CAPACITYREMAININGREMAININGAT STARTAT START
21 2021-07-1221:20:01 0:00:00 Sleep Transition To Sleep Transition From Sleep 100%
This session contains no detailed information about top offenders.This session contains no detailed information about top offenders.
OS S tate D ataOS S tate D ataData obtained from the Event Viewer Logger.
+ Detailed OS State DataDetailed OS State Data
System Power State: System Power State: Screen OffScreen Off
START TIMESTART TIME DURATIONDURATION STATESTATE ENTRY REASONENTRY REASON EXIT REASONEXIT REASON% CAPACITY% CAPACITYREMAININGREMAININGAT STARTAT START
22 2021-07-1221:20:02 0:01:01 Screen Off Transition From Sleep Transition To Sleep 100%
This session does not show detailed information about top offenders because it is not long enough.This session does not show detailed information about top offenders because it is not long enough.
System Power State: System Power State: SleepSleep
START TIMESTART TIME DURATIONDURATION STATESTATE ENERGYENERGYCHANGECHANGE CHANGE RATECHANGE RATE % LOW POWER% LOW POWER
STATE TIMESTATE TIME% CAPACITY% CAPACITYREMAININGREMAININGAT STARTAT START

TopTop
232021-07-1221:21:04 0:17:12 Sleep - - - Charge
SW:95%
HW:95% 100% ⋮⋮
START TIMESTART TIME DURATIONDURATION STATESTATE ENERGYENERGYCHANGECHANGE CHANGE RATECHANGE RATE % LOW POWER% LOW POWER
STATE TIMESTATE TIME% CAPACITY% CAPACITYREMAININGREMAININGAT STARTAT START
D R I P S H istogramD R I P S H istogramPercent of time spent in DRIPS bucketed by time interval length
Top OffendersTop OffendersTop 5 offenders, ranked by active time
NAMENAME TYPETYPE % ACTIVE TIME% ACTIVE TIME ACTIVE TIMEACTIVE TIMEPCI Express Root Port (\_SB.PCI0.GPP4) Fx Device 1% 0:00:14Intel(R) Wi-Fi 6 AX200 160MHz (\_SB.PCI0.GPP4.WLAN) Fx Device 1% 0:00:14Image Download Manager Activator 1% 0:00:10Low Power Phase PDC Phase 1% 0:00:05
+ ActivatorsActivators
+ ProcessorsProcessors
+ Fx DevicesFx Devices
+ PDC PhasesPDC Phases
+ PEP Pre-VetoesPEP Pre-Vetoes
+ SoC SubsystemsSoC Subsystems
Srum D ataS rum D ataData obtained from the SRUM database. * in Power Estimation means the power value is from energy meter.Otherwise, it is from software model estimation.
+ Energy MeterEnergy Meter
+ Power EstimationPower Estimation
System Power State: System Power State: ActiveActive
START TIMESTART TIME DURATIONDURATION STATESTATE ENERGYENERGYCHANGECHANGE CHANGE RATECHANGE RATE
% LOW% LOWPOWERPOWERSTATESTATETIMETIME
% CAPACITY% CAPACITYREMAININGREMAININGAT STARTAT START
24 2021-07-1221:38:11 0:08:04 Active - - - Charge - 100%
TopTop
TopTop
TopTop
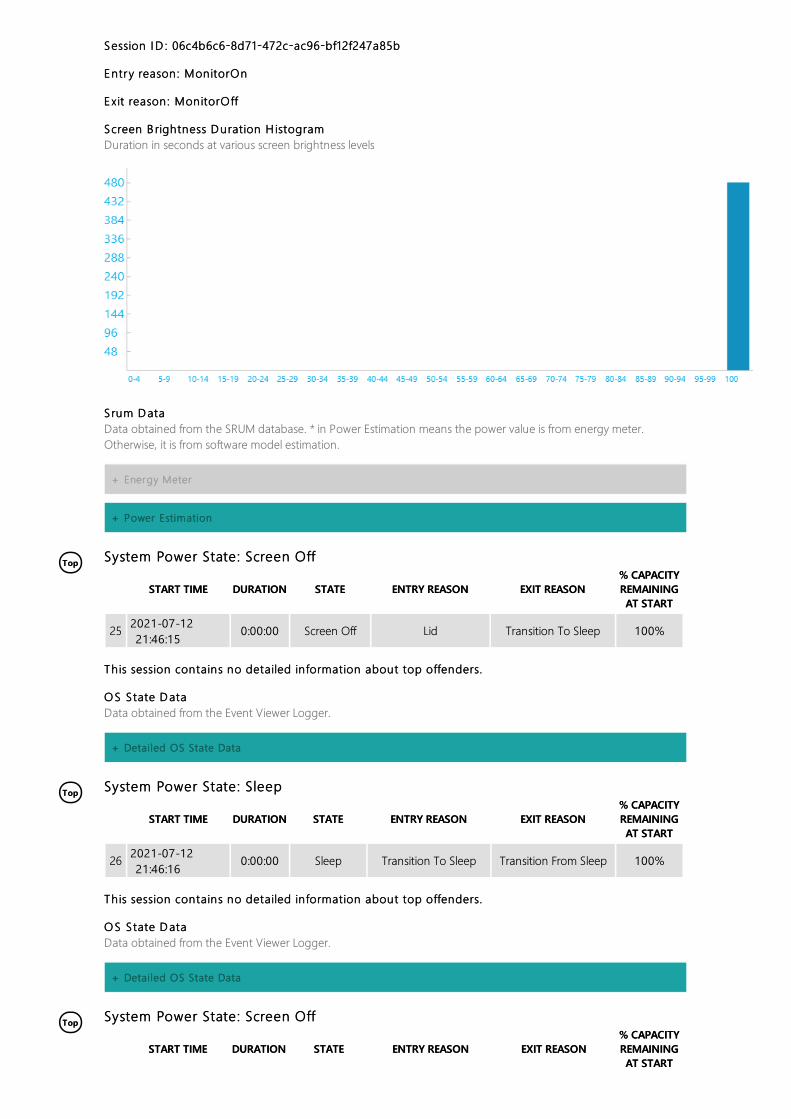
Session I D : 06c4b6c6-8d71-472c-ac96-bf12f247a85bSession I D : 06c4b6c6-8d71-472c-ac96-bf12f247a85b
Entry reason: MonitorOnEntry reason: MonitorOn
Exit reason: MonitorOffExit reason: MonitorOff
Screen B rightness D uration H istogramScreen B rightness D uration H istogramDuration in seconds at various screen brightness levels
S rum D ataS rum D ataData obtained from the SRUM database. * in Power Estimation means the power value is from energy meter.Otherwise, it is from software model estimation.
+ Energy MeterEnergy Meter
+ Power EstimationPower Estimation
System Power State: System Power State: Screen OffScreen Off
START TIMESTART TIME DURATIONDURATION STATESTATE ENTRY REASONENTRY REASON EXIT REASONEXIT REASON% CAPACITY% CAPACITYREMAININGREMAININGAT STARTAT START
25 2021-07-1221:46:15 0:00:00 Screen Off Lid Transition To Sleep 100%
This session contains no detailed information about top offenders.This session contains no detailed information about top offenders.
OS S tate D ataOS S tate D ataData obtained from the Event Viewer Logger.
+ Detailed OS State DataDetailed OS State Data
System Power State: System Power State: SleepSleep
START TIMESTART TIME DURATIONDURATION STATESTATE ENTRY REASONENTRY REASON EXIT REASONEXIT REASON% CAPACITY% CAPACITYREMAININGREMAININGAT STARTAT START
26 2021-07-1221:46:16 0:00:00 Sleep Transition To Sleep Transition From Sleep 100%
This session contains no detailed information about top offenders.This session contains no detailed information about top offenders.
OS S tate D ataOS S tate D ataData obtained from the Event Viewer Logger.
+ Detailed OS State DataDetailed OS State Data
System Power State: System Power State: Screen OffScreen Off
START TIMESTART TIME DURATIONDURATION STATESTATE ENTRY REASONENTRY REASON EXIT REASONEXIT REASON% CAPACITY% CAPACITYREMAININGREMAININGAT STARTAT START

TopTop
272021-07-1221:46:16 0:00:00 Screen Off Transition From Sleep Transition To Sleep 100%
START TIMESTART TIME DURATIONDURATION STATESTATE ENTRY REASONENTRY REASON EXIT REASONEXIT REASON% CAPACITY% CAPACITYREMAININGREMAININGAT STARTAT START
This session does not show detailed information about top offenders because it is not long enough.This session does not show detailed information about top offenders because it is not long enough.
System Power State: System Power State: SleepSleep
START TIMESTART TIME DURATIONDURATION STATESTATE ENERGYENERGYCHANGECHANGE CHANGE RATECHANGE RATE % LOW POWER% LOW POWER
STATE TIMESTATE TIME% CAPACITY% CAPACITYREMAININGREMAININGAT STARTAT START
28 2021-07-1221:46:16 14:01:03 Sleep - - - Charge SW:
100%HW:100% 100% ⋮⋮
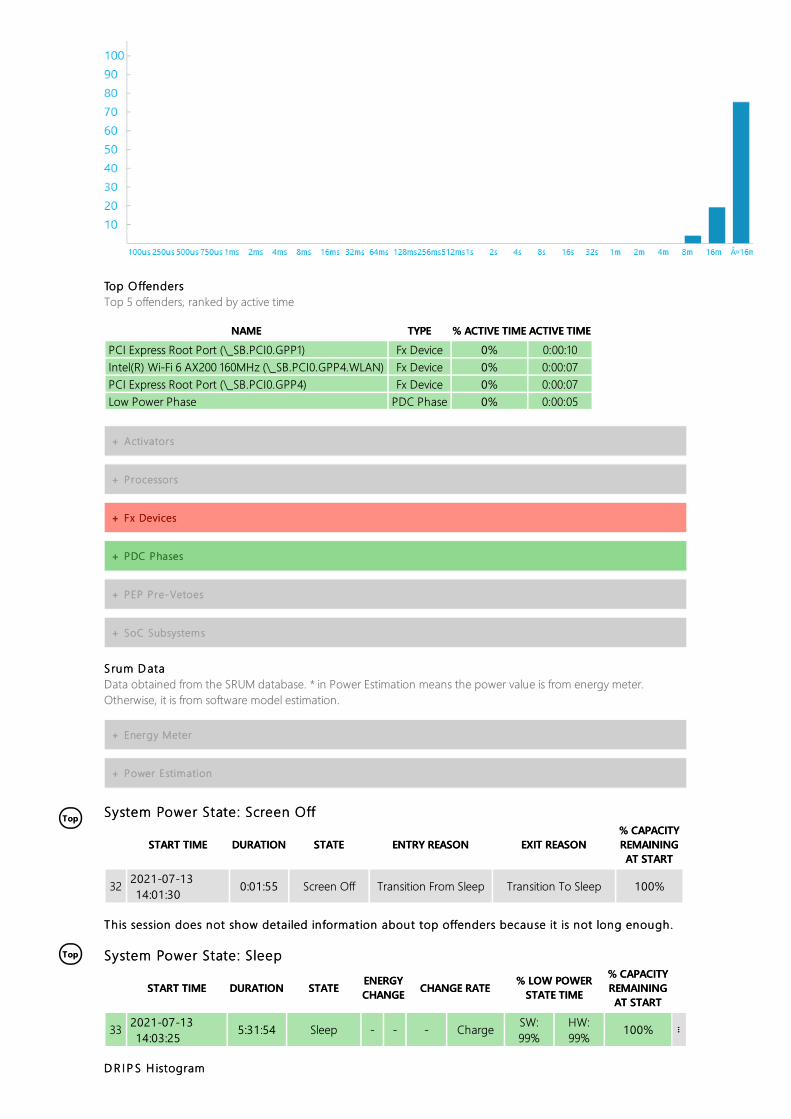
D R I P S H istogramD R I P S H istogramPercent of time spent in DRIPS bucketed by time interval length
Top OffendersTop OffendersTop 5 offenders, ranked by active time
NAMENAME TYPETYPE % ACTIVE TIME% ACTIVE TIME ACTIVE TIMEACTIVE TIMEPCI Express Root Port (\_SB.PCI0.GPP1) Fx Device 0% 0:00:48Intel(R) Wi-Fi 6 AX200 160MHz (\_SB.PCI0.GPP4.WLAN) Fx Device 0% 0:00:38PCI Express Root Port (\_SB.PCI0.GPP4) Fx Device 0% 0:00:38Low Power Phase PDC Phase 0% 0:00:05
USB xHCI Compliant Host Controller (\_SB.PCI0.GP17.XHC1) Fx Device 0% 0:00:04
+ ActivatorsActivators
+ ProcessorsProcessors
+ Fx DevicesFx Devices
+ PDC PhasesPDC Phases
+ PEP Pre-VetoesPEP Pre-Vetoes
+ SoC SubsystemsSoC Subsystems
Srum D ataS rum D ataData obtained from the SRUM database. * in Power Estimation means the power value is from energy meter.Otherwise, it is from software model estimation.
+ Energy MeterEnergy Meter

TopTop
TopTop
TopTop
+ Power EstimationPower Estimation
System Power State: System Power State: ActiveActive
START TIMESTART TIME DURATIONDURATION STATESTATE ENERGYENERGYCHANGECHANGE CHANGE RATECHANGE RATE
% LOW% LOWPOWERPOWERSTATESTATETIMETIME
% CAPACITY% CAPACITYREMAININGREMAININGAT STARTAT START
29 2021-07-1311:47:15 0:12:27 Active - - - Charge - 100%
Session I D : ea21138a-90d8-4ef1-97c7-cc87b8bedaa0Session I D : ea21138a-90d8-4ef1-97c7-cc87b8bedaa0
Entry reason: MonitorOnEntry reason: MonitorOn
Exit reason: MonitorOffExit reason: MonitorOff
Screen B rightness D uration H istogramScreen B rightness D uration H istogramDuration in seconds at various screen brightness levels
S rum D ataS rum D ataData obtained from the SRUM database. * in Power Estimation means the power value is from energy meter.Otherwise, it is from software model estimation.
+ Energy MeterEnergy Meter
+ Power EstimationPower Estimation
System Power State: System Power State: Screen OffScreen Off
START TIMESTART TIME DURATIONDURATION STATESTATE ENTRY REASONENTRY REASON EXIT REASONEXIT REASON% CAPACITY% CAPACITYREMAININGREMAININGAT STARTAT START
30 2021-07-1311:59:43 0:00:29 Screen Off Video Idle Timeout Transition To Sleep 100%
This session does not show detailed information about top offenders because it is not long enough.This session does not show detailed information about top offenders because it is not long enough.
System Power State: System Power State: SleepSleep
START TIMESTART TIME DURATIONDURATION STATESTATE ENERGYENERGYCHANGECHANGE CHANGE RATECHANGE RATE % LOW POWER% LOW POWER
STATE TIMESTATE TIME% CAPACITY% CAPACITYREMAININGREMAININGAT STARTAT START
31 2021-07-1312:00:12 2:01:22 Sleep - - - Charge SW:
99%HW:99% 100% ⋮⋮
D R I P S H istogramD R I P S H istogramPercent of time spent in DRIPS bucketed by time interval length
TopTop
TopTop
Top OffendersTop OffendersTop 5 offenders, ranked by active time
NAMENAME TYPETYPE % ACTIVE TIME% ACTIVE TIME ACTIVE TIMEACTIVE TIMEPCI Express Root Port (\_SB.PCI0.GPP1) Fx Device 0% 0:00:10Intel(R) Wi-Fi 6 AX200 160MHz (\_SB.PCI0.GPP4.WLAN) Fx Device 0% 0:00:07PCI Express Root Port (\_SB.PCI0.GPP4) Fx Device 0% 0:00:07Low Power Phase PDC Phase 0% 0:00:05
+ ActivatorsActivators
+ ProcessorsProcessors
+ Fx DevicesFx Devices
+ PDC PhasesPDC Phases
+ PEP Pre-VetoesPEP Pre-Vetoes
+ SoC SubsystemsSoC Subsystems
Srum D ataS rum D ataData obtained from the SRUM database. * in Power Estimation means the power value is from energy meter.Otherwise, it is from software model estimation.
+ Energy MeterEnergy Meter
+ Power EstimationPower Estimation
System Power State: System Power State: Screen OffScreen Off
START TIMESTART TIME DURATIONDURATION STATESTATE ENTRY REASONENTRY REASON EXIT REASONEXIT REASON% CAPACITY% CAPACITYREMAININGREMAININGAT STARTAT START
32 2021-07-1314:01:30 0:01:55 Screen Off Transition From Sleep Transition To Sleep 100%
This session does not show detailed information about top offenders because it is not long enough.This session does not show detailed information about top offenders because it is not long enough.
System Power State: System Power State: SleepSleep
START TIMESTART TIME DURATIONDURATION STATESTATE ENERGYENERGYCHANGECHANGE CHANGE RATECHANGE RATE % LOW POWER% LOW POWER
STATE TIMESTATE TIME% CAPACITY% CAPACITYREMAININGREMAININGAT STARTAT START
33 2021-07-1314:03:25 5:31:54 Sleep - - - Charge SW:
99%HW:99% 100% ⋮⋮
D R I P S H istogramD R I P S H istogram
TopTop
Percent of time spent in DRIPS bucketed by time interval length
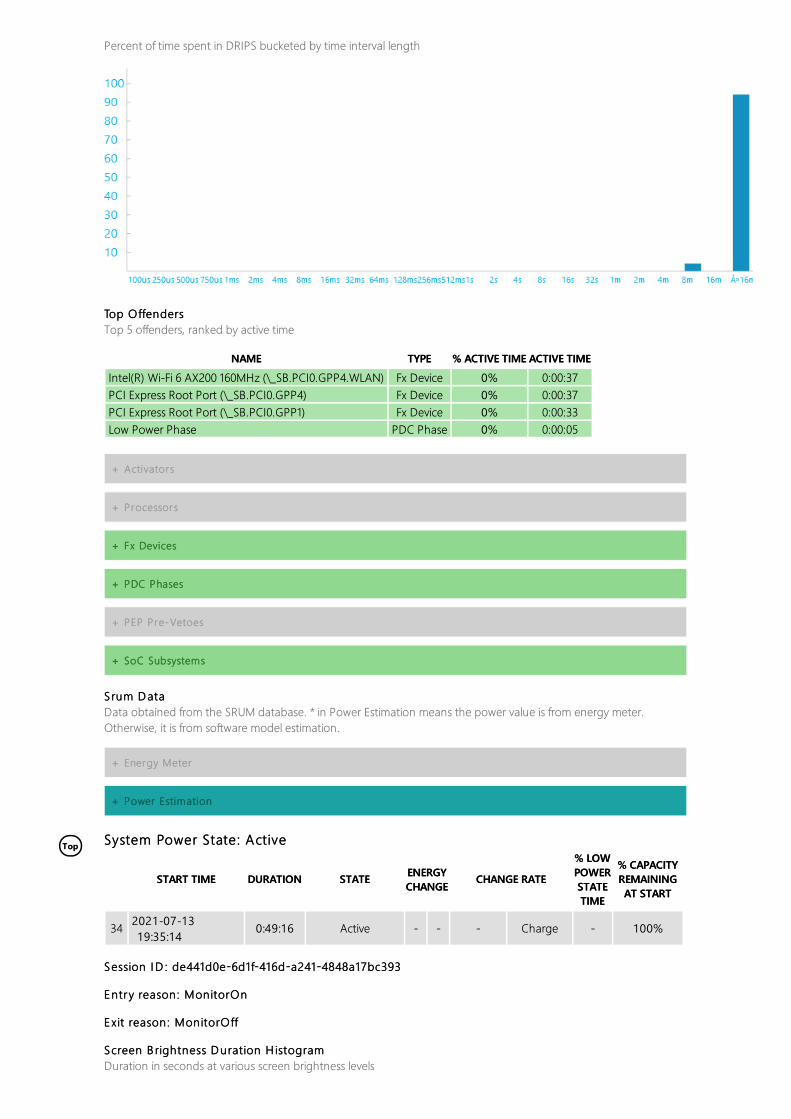
Top OffendersTop OffendersTop 5 offenders, ranked by active time
NAMENAME TYPETYPE % ACTIVE TIME% ACTIVE TIME ACTIVE TIMEACTIVE TIMEIntel(R) Wi-Fi 6 AX200 160MHz (\_SB.PCI0.GPP4.WLAN) Fx Device 0% 0:00:37PCI Express Root Port (\_SB.PCI0.GPP4) Fx Device 0% 0:00:37PCI Express Root Port (\_SB.PCI0.GPP1) Fx Device 0% 0:00:33Low Power Phase PDC Phase 0% 0:00:05
+ ActivatorsActivators
+ ProcessorsProcessors
+ Fx DevicesFx Devices
+ PDC PhasesPDC Phases
+ PEP Pre-VetoesPEP Pre-Vetoes
+ SoC SubsystemsSoC Subsystems
Srum D ataS rum D ataData obtained from the SRUM database. * in Power Estimation means the power value is from energy meter.Otherwise, it is from software model estimation.
+ Energy MeterEnergy Meter
+ Power EstimationPower Estimation
System Power State: System Power State: ActiveActive
START TIMESTART TIME DURATIONDURATION STATESTATE ENERGYENERGYCHANGECHANGE CHANGE RATECHANGE RATE
% LOW% LOWPOWERPOWERSTATESTATETIMETIME
% CAPACITY% CAPACITYREMAININGREMAININGAT STARTAT START
34 2021-07-1319:35:14 0:49:16 Active - - - Charge - 100%
Session I D : de441d0e-6d1f-416d-a241-4848a17bc393Session I D : de441d0e-6d1f-416d-a241-4848a17bc393
Entry reason: MonitorOnEntry reason: MonitorOn
Exit reason: MonitorOffExit reason: MonitorOff
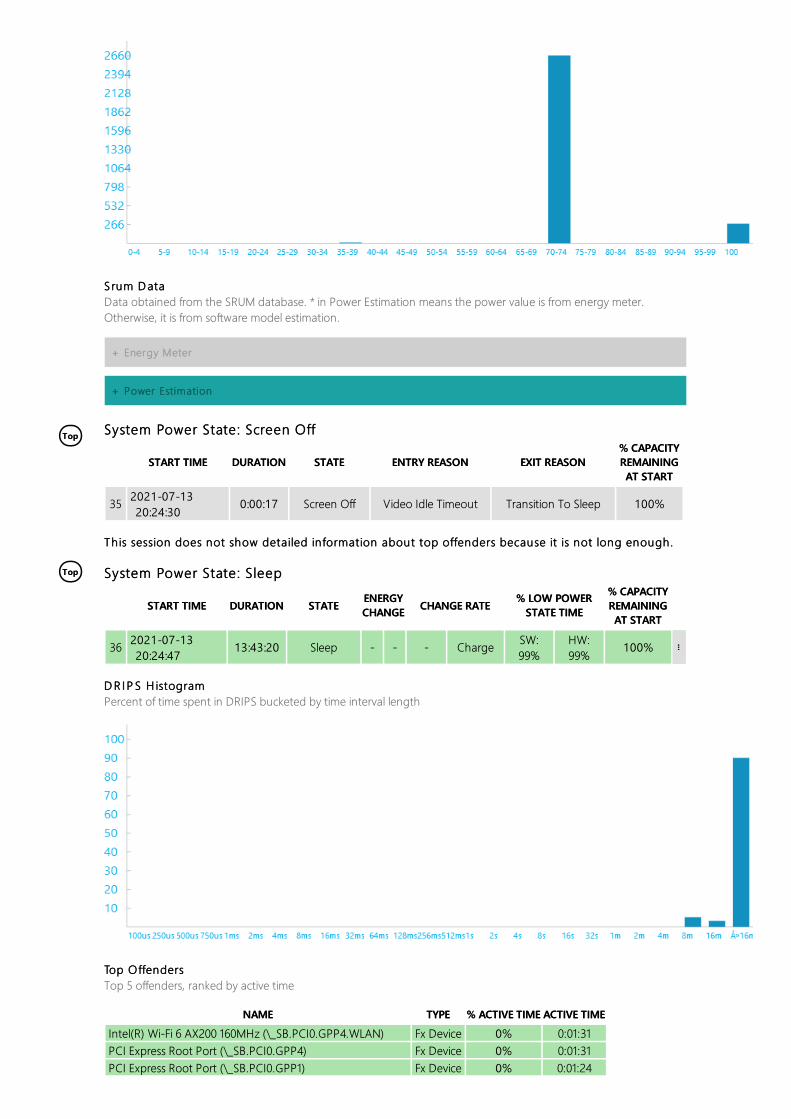
Screen B rightness D uration H istogramScreen B rightness D uration H istogramDuration in seconds at various screen brightness levels
TopTop
TopTop
Srum D ataS rum D ataData obtained from the SRUM database. * in Power Estimation means the power value is from energy meter.Otherwise, it is from software model estimation.
+ Energy MeterEnergy Meter
+ Power EstimationPower Estimation
System Power State: System Power State: Screen OffScreen Off
START TIMESTART TIME DURATIONDURATION STATESTATE ENTRY REASONENTRY REASON EXIT REASONEXIT REASON% CAPACITY% CAPACITYREMAININGREMAININGAT STARTAT START
35 2021-07-1320:24:30 0:00:17 Screen Off Video Idle Timeout Transition To Sleep 100%
This session does not show detailed information about top offenders because it is not long enough.This session does not show detailed information about top offenders because it is not long enough.
System Power State: System Power State: SleepSleep
START TIMESTART TIME DURATIONDURATION STATESTATE ENERGYENERGYCHANGECHANGE CHANGE RATECHANGE RATE % LOW POWER% LOW POWER
STATE TIMESTATE TIME% CAPACITY% CAPACITYREMAININGREMAININGAT STARTAT START
36 2021-07-1320:24:47 13:43:20 Sleep - - - Charge SW:
99%HW:99% 100% ⋮⋮
D R I P S H istogramD R I P S H istogramPercent of time spent in DRIPS bucketed by time interval length
Top OffendersTop OffendersTop 5 offenders, ranked by active time
NAMENAME TYPETYPE % ACTIVE TIME% ACTIVE TIME ACTIVE TIMEACTIVE TIMEIntel(R) Wi-Fi 6 AX200 160MHz (\_SB.PCI0.GPP4.WLAN) Fx Device 0% 0:01:31PCI Express Root Port (\_SB.PCI0.GPP4) Fx Device 0% 0:01:31PCI Express Root Port (\_SB.PCI0.GPP1) Fx Device 0% 0:01:24

TopTop
TopTop
USB xHCI Compliant Host Controller (\_SB.PCI0.GP17.XHC1) Fx Device 0% 0:00:20NAMENAME TYPETYPE % ACTIVE TIME% ACTIVE TIME ACTIVE TIMEACTIVE TIME
+ ActivatorsActivators
+ ProcessorsProcessors
+ Fx DevicesFx Devices
+ PDC PhasesPDC Phases
+ PEP Pre-VetoesPEP Pre-Vetoes
+ SoC SubsystemsSoC Subsystems
Srum D ataS rum D ataData obtained from the SRUM database. * in Power Estimation means the power value is from energy meter.Otherwise, it is from software model estimation.
+ Energy MeterEnergy Meter
+ Power EstimationPower Estimation
System Power State: System Power State: ActiveActive
START TIMESTART TIME DURATIONDURATION STATESTATE ENERGYENERGYCHANGECHANGE CHANGE RATECHANGE RATE
% LOW% LOWPOWERPOWERSTATESTATETIMETIME
% CAPACITY% CAPACITYREMAININGREMAININGAT STARTAT START
37 2021-07-1410:08:02 0:03:22 Active - - - Charge - 100%
Srum D ataS rum D ataData obtained from the SRUM database. * in Power Estimation means the power value is from energy meter.Otherwise, it is from software model estimation.
+ Energy MeterEnergy Meter
+ Power EstimationPower Estimation
System Power State: System Power State: Report GeneratedReport Generated
START TIMESTART TIME DURATIONDURATION STATESTATE ENTRY REASONENTRY REASON EXIT REASONEXIT REASON% CAPACITY% CAPACITYREMAININGREMAININGAT STARTAT START
38 2021-07-1410:11:26 0:00:00 Report
Generated ---- ---- -
OS S tate D ataOS S tate D ataData obtained from the Event Viewer Logger.
+ Detailed OS State DataDetailed OS State Data
Installed batteriesInstalled batteriesInformation about each currently installed battery
BATTERY BATTERY 11NAMENAME DELL VKYJX14MANUFACTURERMANUFACTURER SWD-ATL3.660SERIAL NUMBERSERIAL NUMBER 5834
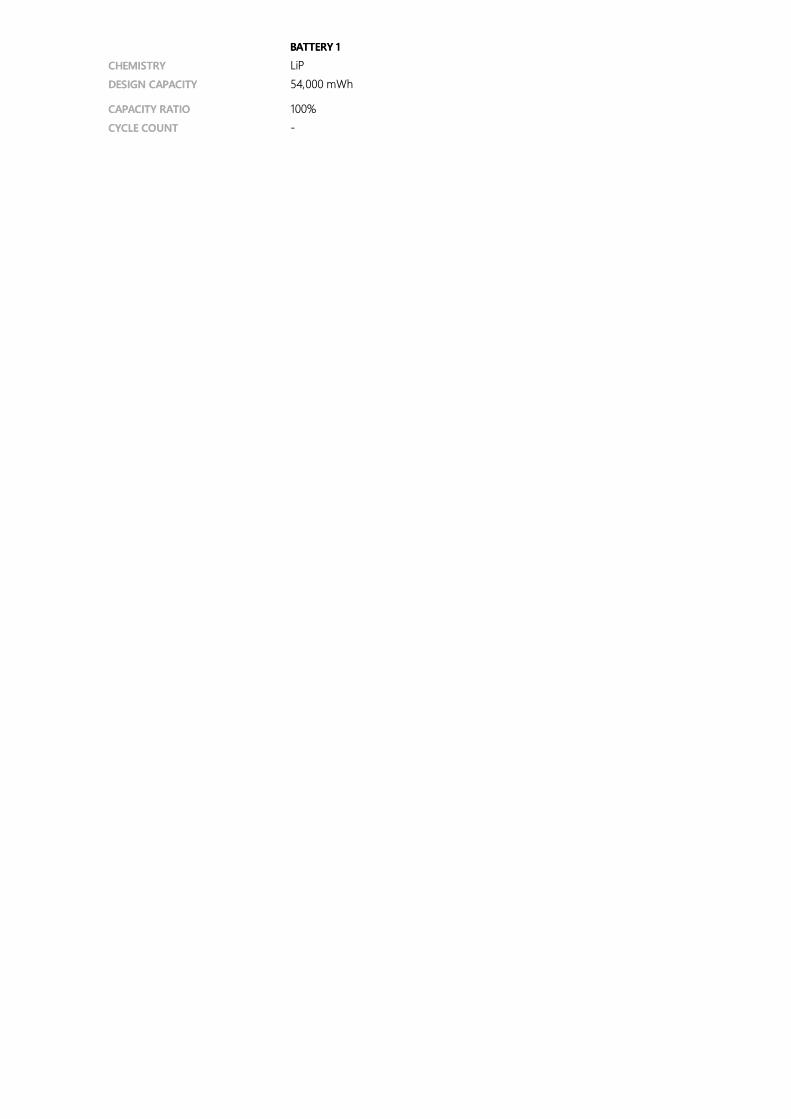
CHEMISTRYCHEMISTRY LiPDESIGN CAPACITYDESIGN CAPACITY 54,000 mWhCAPACITY RATIOCAPACITY RATIO 100%CYCLE COUNTCYCLE COUNT -
BATTERY BATTERY 11
Related Documents