System Management Principles Statement Compliance report for June 2014 to August 2014 Summary of balancing actions and breaches for June 2014 to Aug 2014 Performance compared to last year

Welcome message from author
This document is posted to help you gain knowledge. Please leave a comment to let me know what you think about it! Share it to your friends and learn new things together.
Transcript

System Management Principles Statement
� Compliance report for June 2014 to August 2014� Summary of balancing actions and breaches for June 2014 to Aug 2014� Performance compared to last year

2
Summary Report
0
0
Aug-14
00Number of Non-Material Breaches
00Number of Material Breaches
Jul-14Jun-14
22
4
18
Aug-14
1916Total
612Total Number of Sell Actions
134Total Number of Buy Actions
Jul-14Jun-14
0
0
273
Aug-13
0Number of Non-Material Breaches
(Calendar year to date)
0Number of Material Breaches
(Calendar year to date)
174Number of Balancing Actions
(Calendar year to date)
Aug-14

Operational Overview

4
Month-ahead ensemble CWV October 2013 to Sept 2014 vs. Historical Range
-5
0
5
10
15
20
01/10/2013 01/11/2013 01/12/2013 01/01/2014 01/02/2014 01/03/2014 01/04/2014 01/05/2014 01/06/2014 01/07/2014 01/08/2014 01/09/2014
Deg
rees C
WV
Maximum to seasonal normal
Actual CWV
Ensemble forecasts
Minimum to seasonal normal
Mean Ensemble

Demands

6
Gas Demand Breakdown1st October 2013 to 27th August 2014 Vs Previous Year
0
50
100
150
200
250
300
350
400
450
Oct-13 Nov-13 Dec-13 Jan-14 Feb-14 Mar-14 Apr-14 May-14 Jun-14 Jul-14 Aug-14
mcm
NDM DM [Exc Interconnectors] Total Interconnector Export
Storage Injection Previous Years Actual Demand

7
Gas Demand Statistics1st October 2013 to 27th August 2014
0
50
100
150
200
250
300
350
400
450
Gas Year 13/14 Average
Gas Year 13/14 Max
Gas Year 13/14 Min
NDM DM [Exc Interconnectors]
Storage Injection Total Interconnector Export

9
Gas Demand Vs SND / Cold / Warm 1st October 2013 to 27th August 2014
0
50
100
150
200
250
300
350
400
450
500
Oct-13 Nov-13 Dec-13 Jan-14 Feb-14 Mar-14 Apr-14 May-14 Jun-14 Jul-14 Aug-14
mcm
Total Demand SND Cold Warm

10
LDZ Actual Demand Vs LDZ SND 1st October 2013 to 28th August 2014
0
50
100
150
200
250
Gas Year 13/14 Average Winter average [Oct to Mar] Summer average [Apr to Current Date]
mcm
LDZ Actual LDZ SND
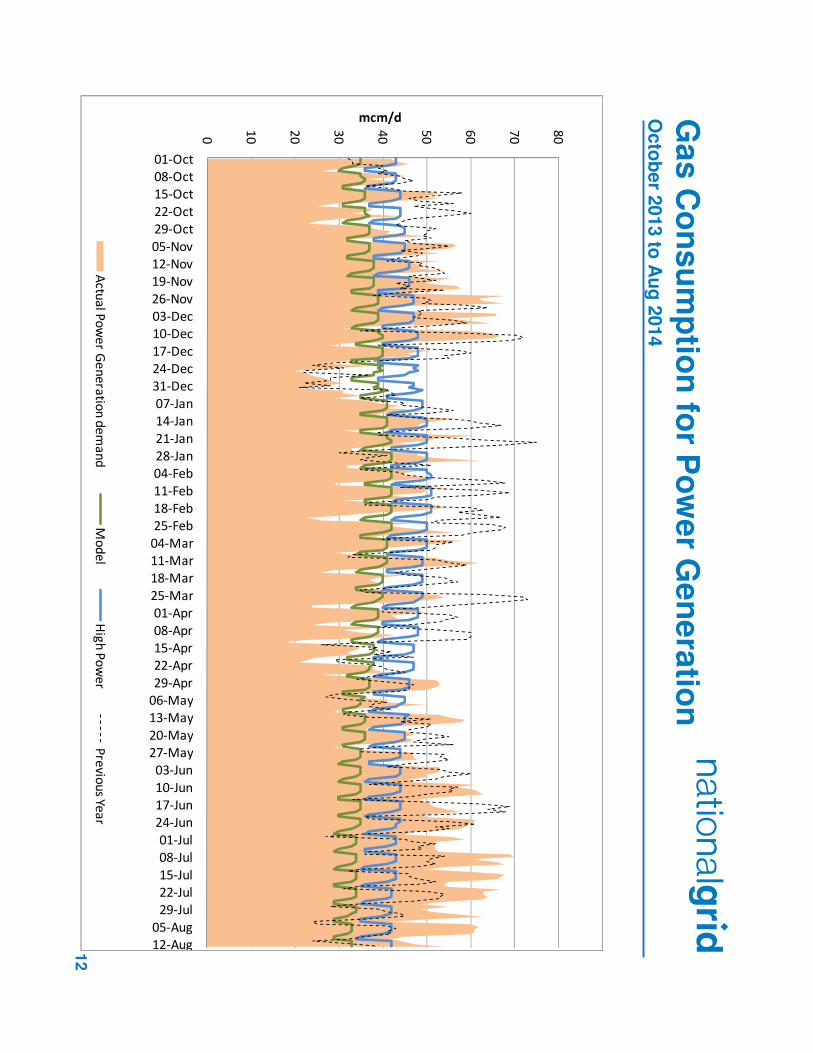
12
Gas C
on
su
mp
tion
for P
ow
er G
en
era
tion
Octo
ber 2
013 to
Au
g 2
014
0
10
20
30
40
50
60
70
80
01-Oct
08-Oct
15-Oct
22-Oct
29-Oct
05-Nov
12-Nov
19-Nov
26-Nov
03-Dec
10-Dec
17-Dec
24-Dec
31-Dec
07-Jan
14-Jan
21-Jan
28-Jan
04-Feb
11-Feb
18-Feb
25-Feb
04-Mar
11-Mar
18-Mar
25-Mar
01-Apr
08-Apr
15-Apr
22-Apr
29-Apr
06-May
13-May
20-May
27-May
03-Jun
10-Jun
17-Jun
24-Jun
01-Jul
08-Jul
15-Jul
22-Jul
29-Jul
05-Aug
12-Aug
mcm/d
Actu
al P
ow
er G
en
era
tion
de
ma
nd
Mo
de
lH
igh
Po
we
rP
revio
us Y
ea
r

Supplies

14
Gas Supply Breakdown 1st October 2013 to 26th August 2014 vs Previous Year
0
50
100
150
200
250
300
350
400
450
500
550
600
Oct-13 Nov-13 Dec-13 Jan-14 Feb-14 Mar-14 Apr-14 May-14 Jun-14 Jul-14 Aug-14
mcm
Gas Day
UKCS Norway BBL IUK LRS MRS SRS LNG Previous Year Supply

15
NSS [Non-Storage Supply] 1st October 2013 to 26th August 2014
0
50
100
150
200
250
300
350
400
450
500
550
600
Gas Year 13/14 Average
Gas Year 13/14 Max
Margins Notice Assumptions
Capacity
UKCS Norway LNG BBL IUK

16
IUK Flows Vs NBP & ZEE Price Differential1st October 2013 to 27th August 2014
-10
-8
-6
-4
-2
0
2
4
6
8
10
-80
-60
-40
-20
0
20
40
60
80
01-Oct-13 01-Nov-13 01-Dec-13 01-Jan-14 01-Feb-14 01-Mar-14 01-Apr-14 01-May-14 01-Jun-14 01-Jul-14 01-Aug-14
pp
/th d
iffe
rential (
NB
P v
s. Z
ee)
mcm
/d
IUK IUK Import Capacity IUK Export Capacity IUK Price Dif ferential
+ IMPORT TO NBP
- EXPORT TO ZEE

17
LNG Terminal Flows1st October 2013 to 31st August 2014
0
10
20
30
40
50
60
70
80
Oct-13 Nov-13 Dec-13 Jan-14 Feb-14 Mar-14 Apr-14 May-14 Jun-14 Jul-14 Aug-14
mcm
South Hook Isle of Grain Dragon Previous Year LNG

18
Norway Flows1st October 2013 to 31st August 2014
0
20
40
60
80
100
120
140
Oct-13 Nov-13 Dec-13 Jan-14 Feb-14 Mar-14 Apr-14 May-14 Jun-14 Jul-14 Aug-14
mcm
Langeled Vesterled [estimated] FLAGS [estimated] Previous Year Norway

19
Norway vs LNG Flows1st October 2013 to 31st August 2014
0
20
40
60
80
100
120
140
160
Oct-13 Nov-13 Dec-13 Jan-14 Feb-14 Mar-14 Apr-14 May-14 Jun-14 Jul-14 Aug-14 Sep-14
mcm
Total Norway Total LNG

20
Storage Withdrawal Vs Injection1st October 2013 to 31st August 2014
-80
-60
-40
-20
0
20
40
60
80
100
Oct-13 Nov-13 Dec-13 Jan-14 Feb-14 Mar-14 Apr-14 May-14 Jun-14 Jul-14 Aug-14
Mcm
Withdrawal Injection

21
Long Range Storage Stocks [LRS]1st October 2013 to 2nd September 2014 Vs Previous Years
0.00
5.00
10.00
15.00
20.00
25.00
30.00
35.00
40.00
45.00
Oct-13 Dec-13 Feb-14 Apr-14 Jun-14 Aug-14
twh
LRS 2012/2013 LRS 2013/2014

22
Medium Range Storage Stocks [MRS]1st October 2013 to 2nd September 2014 Vs Previous Years
0
2
4
6
8
10
12
14
Oct-13 Dec-13 Feb-14 Apr-14 Jun-14 Aug-14
twh
MRS 2012/2013 MRS 2013/2014

23
Short Range Storage Stocks [SRS]1st October 2013 to 2nd September 2014 Vs Previous Years
-0.05
0
0.05
0.1
0.15
0.2
0.25
0.3
0.35
0.4
01-Oct-13 01-Dec-13 01-Feb-14 01-Apr-14 01-Jun-14 01-Aug-14
twh
SRS 2012/2013 SRS 2013/2014

24
Combined EU Storage Stocks [% Full] From 1st October 2013 to 2nd September 2014 Vs Previous Years
0
10
20
30
40
50
60
70
80
90
100
01-Oct 01-Nov 01-Dec 01-Jan 01-Feb 01-Mar 01-Apr 01-May 01-Jun 01-Jul 01-Aug 01-Sep
%
2010/2011 2011/2012 2012/2013 2013/2014

25
UK Gas Prices 1st October 2013 to 31st August 2014 Vs Previous Years
30.00
40.00
50.00
60.00
70.00
80.00
90.00
100.00
110.00
01-Oct-13 01-Dec-13 01-Feb-14 01-Apr-14 01-Jun-14 01-Aug-14
p/p
therm
SAP SMPB SMPS Previous Year SAP

26
What Operational Issues Affected Users?

Transporter Actions and Neutrality
� Energy Balancing� Capacity

28
Transporter Energy Traded on the OCMNGG Monthly Buys and SellsAug 2013 to Aug 2014 Vs Previous Year
-700
-600
-500
-400
-300
-200
-100
0
100
200
300
400
500
600
700
-700
-600
-500
-400
-300
-200
-100
0
100
200
300
400
500
600
700
01-Aug-13 01-Oct-13 01-Dec-13 01-Feb-14 01-Apr-14 01-Jun-14 01-Aug-14
Gwh
Buy 2013/14 Buy Prev Year Sell 2013/14 Sell Prev Year

29
Days of Default SMP Prices [SMPB]From Sept 2013 to Aug 2014
0
10
20
30
40
50
60
70
80
90
100
Sep-13 Oct-13 Nov-13 Dec-13 Jan-14 Feb-14 Mar-14 Apr-14 May-14 Jun-14 Jul-14 Aug-14
%
SMPB [NG Set Price] SMPB [Default Marginal]

30
Days of Default SMP Prices [SMPS]From Sep 2013 to Aug 2014
0
10
20
30
40
50
60
70
80
90
100
Sep-13 Oct-13 Nov-13 Dec-13 Jan-14 Feb-14 Mar-14 Apr-14 May-14 Jun-14 Jul-14 Aug-14
%
SMPS [NG Set Price] SMPS [Default Marginal]
31
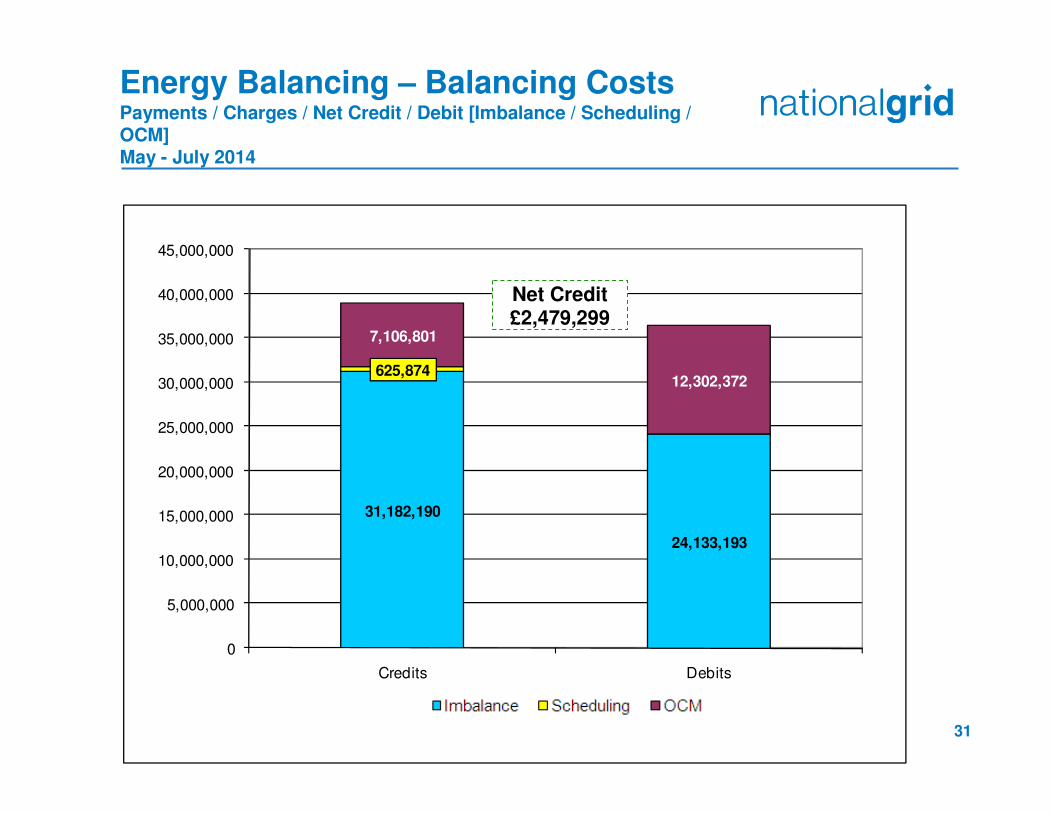
Energy Balancing – Balancing Costs Payments / Charges / Net Credit / Debit [Imbalance / Scheduling / OCM]May - July 2014
31,182,190
625,874
7,106,801
24,133,193
12,302,372
0
5,000,000
10,000,000
15,000,000
20,000,000
25,000,000
30,000,000
35,000,000
40,000,000
45,000,000
Credits Debits
Net Credit £2,479,299

32
Energy Balancing – Balancing Costs May - July 2014
May-14 Jun-14 Jul-14
Imbalance Payment £ [DCS] -6,565,892 -9,093,615 -8,473,686
Charge £ [DCT] 14,338,457 8,158,583 8,685,150
Scheduling Exit Charge £ [DXS] 6,573 6,592 11,776
Exit Charge £ [EXS] 53,737 45,037 48,898
Entry Charge £ [ESC] 114,376 109,421 229,463
OCM Payment £ [TTB] -7,632,296 -1,441,933 -3,228,143
Charge £ [TTS] 1,942,318 2,916,747 2,247,736
Balancing Costs 2,257,274 700,831 -478,805

33
Energy Balancing – Balancing CostsOCM Payments / ChargesMay - July 2014
-1,500,000
-1,000,000
-500,000
0
500,000
1,000,000
1,500,000
01/05/2014 15/05/2014 29/05/2014 12/06/2014 26/06/2014 10/07/2014 24/07/2014
£
Day
Payment [TTB] Charge £ [TTS]

34
Energy Balancing – Balancing CostsImbalance Payments / ChargesMay - July 2014
-1,500,000
-1,000,000
-500,000
0
500,000
1,000,000
1,500,000
2,000,000
01/05/2014 15/05/2014 29/05/2014 12/06/2014 26/06/2014 10/07/2014 24/07/2014
£
Day
Payment £ [DCS]
Charge £ [DCT]

35
Energy Balancing – Balancing CostsScheduling ChargesMay – Jul 2014
0
5,000
10,000
15,000
20,000
25,000
30,000
01/05/2014 15/05/2014 29/05/2014 12/06/2014 26/06/2014 10/07/2014 24/07/2014
£
Day
Exit Charge £ [DXS]
Entry Charge £ [ESC]
Exit Charge £ [EXS]

36
Capacity NeutralityNet Cost / Revenue From 1st April 2014 to 31th August 2014
-£231,039Net Revenue
£0Revenue from Locational Sells and PRI Charges
-£361Non-Obligated Sales Revenue (Entry only)
-£71,614Entry Capacity Overrun Revenue
£0Total Entry Constraint Management Operational Costs
-£159,064WDDSEC/DAI Entry Capacity Revenue
Revenue/Costs

37
Net Capacity Neutrality Revenue [Daily Obligated Entry Capacity and Interruptible Entry Capacity: WDDSEC + DAI] From 1st April 2014 to 31st August 2014
-£50,502
-£1,722
-£8,194
-£76,839
-£21,771
-£36
-90,000.00
-80,000.00
-70,000.00
-60,000.00
-50,000.00
-40,000.00
-30,000.00
-20,000.00
-10,000.00
0.00
St Fergus Teesside Barrow Theddlethorpe Easington Bacton Other
£
Net Capacity Neutrality Revenue [WDDSEC + DAI]

38
Capacity NeutralityRevenues from Entry Cap Overruns and Non-Obligated Sales,and Locational Sells and PRI Charges. Totals From 1st April 2014 to 31st August 2014
£0 (FY14/15)Total
£0Mar-15
£0Feb-15
£0Jan-15
£0Dec-14
£0Nov-14
£0Oct-14
£0Sep-14
£0Aug-14
£0Jul-14
£0Jun-14
£0May-14
£0Apr-14
Locational Sells and PRI charges revenue
Month
Total
Mar-15
Feb-15
Jan-15
Dec-14
Nov-14
Oct-14
Sep-14
Aug-14
Jul-14
Jun-14
May-14
Apr-14
Month
-£361(FY14-15)-£71,614 (FY14-15)
--
--
--
--
--
--
--
-Not yet available
--£34,442
--£23,853
-£108 -£8,271
-£253-£5,048
Non-obligated sales revenue
(entry)
Entry Cap Overrun Revenue

39
Customer Outputs (June – August 2014)
NoneMargins Notices
NoneGas Deficit Warnings
NoneOperating Margins
5 Gas Quality Breach 293 interventionsGas Quality Excursions
35 rejections127,383 OPNs received.
57,789 non-compliantRules Breached
100% successful71 Non Routine Operations completed
Maintenance
99.8129% achieved21 Breaches of Agreed / Assured Pressures
Pressure Obligations
No Scalebacks or Buy BacksNoneCapacity Constraints
Related Documents