System Impact Study Report PID 206 168 MW Plant Jacinto Prepared by: Southwest Power Pool, Independent Coordinator of Transmission (SPP ICT) 415 North McKinley, Suite 140 Little Rock, AR 72205 Revision: 1 Rev Issue Date Description of Revision Revised By Project Manager 0 10/10/2007 Final for Review BMH JDH 1 10/16/2007 Added Stability Recommendations BMH JDH

Welcome message from author
This document is posted to help you gain knowledge. Please leave a comment to let me know what you think about it! Share it to your friends and learn new things together.
Transcript

System Impact Study Report PID 206
168 MW Plant Jacinto
Prepared by: Southwest Power Pool, Independent Coordinator of
Transmission (SPP ICT) 415 North McKinley, Suite 140
Little Rock, AR 72205
Revision: 1
Rev Issue
Date Description of Revision Revised By Project Manager
0 10/10/2007 Final for Review BMH JDH
1 10/16/2007 Added Stability Recommendations BMH JDH

Objective:
This System Impact Study is the second step of the interconnection process and is based on PID-206
request for interconnection on Entergy’s transmission system at Jacinto 138 kV substation. This report
is organized in two sections, namely, Section – A, Energy Resource Interconnection Service (ERIS)
and Section – B, Network Resource Interconnection Service (NRIS – Section B).
The Scope for the ERIS section (Section – A) includes load flow (steady state) analysis, transient
stability analysis and short circuit analysis as defined in FERC orders 2003, 2003A and 2003B. The
NRIS section (Section – B) contains details of load flow (steady state) analysis only, however,
transient stability analysis and short circuit analysis of Section – A are also applicable to Section – B.
Additional information on scope for NRIS study can be found in Section – B.
Requestor for PID-206 did request ERIS, however it was determined that a load flow (steady state)
analysis was not required because the generator would not be exporting power. Therefore Section-B is
not included in this report.
PID-206 intends to install a substation with two 83.8 MW combustion turbine units with a maximum
capacity of 101.8 MVA. The point of interconnection will be connected approximately 4 miles north
of the existing Jacinto 138 kV substation. The study evaluates injection of 168 MW from the PID 206
plant to the Entergy Transmission System between the Jacinto and Shepherd substations.
The proposed in-service date for this facility is January 1, 2009.
2

Section – A
Energy Resource Interconnection Service
3

TABLE OF CONTENTS FOR SECTION –A (ERIS)
I. INTRODUCTION 5 II. SHORT CIRCUIT ANALYSIS / BREAKER RATING ANALYSIS 6
A. Model Information 6 B. Short Circuit Analysis 6 C. Analysis Results 6 D. Problem Resolution 6
III. TRANSIENT STABILITY ANALYSIS 7 A. Model Information 7 B. Transient Stability Analysis 10 C. Analysis Results 15 APPENDIX A.A DATA PROVIDED BY CUSTOMER 19 A.A.1 LARGE GENERATING FACILITY DATA 19 A.A.2 DATA USED IN POWERFLOW AND STABILITY MODELS 30 APPENDIX A.B Stability Issues in the Western Region of the Entergy System 34 APPENDIX A.C GUIDELINES FOR PSS ON THE ENTERGY SYSTEM 37 APPENDIX A.D SUBSTATION CONFIGURATION WITH AND WITHOUT PID-206 39 APPENDIX A.E Transient Stability DATA & Plots 42
4

I. Introduction
This Energy Resource Interconnection Service (ERIS) is based on the PID-206 request for
interconnection on Entergy’s transmission system at Jacinto substation. The objective of this study
is to assess the reliability impact of the new facility on the Entergy transmission system with
respect to the steady state and transient stability performance of the system as well as its effects on
the system’s existing short circuit current capability. It is also intended to determine whether the
transmission system meets standards established by NERC Reliability Standards and Entergy’s
planning guidelines when the plant is connected to Entergy’s transmission system. If not,
transmission improvements will be identified.
The System Impact Study process required a load flow analysis to determine if the existing
transmission lines are adequate to handle the full output from the plant for simulated transfers to
adjacent control areas. A short circuit analysis was performed to determine if the generation would
cause the available fault current to surpass the fault duty of existing equipment within the Entergy
transmission system. A transient stability analysis was conducted to determine if the new units
would cause a stability problem on the Entergy system.
This ERIS System Impact Study was based on information provided by PID-206 and assumptions
made by Entergy’s Transmission Technical System Planning group. All supplied information and
assumptions are documented in this report. If the actual equipment installed is different from the
supplied information or the assumptions made, the results outlined in this report are subject to
change.
5

II. Short Circuit Analysis / Breaker Rating Analysis
A. Model Information
The short circuit analysis was performed on the Entergy system short circuit model using ASPEN
software. This model includes all generators interconnected to the Entergy system or
interconnected to an adjacent system and having an impact on this interconnection request, IPP’s
with signed IOAs, and approved future transmission projects on the Entergy transmission system
including the proposed PID-206 unit.
B. Short Circuit Analysis The method used to determine if any short circuit problems would be caused by the addition of the
PID-206 generation is as follows:
1. Three phase and single phase to ground faults were simulated on the Entergy base case short
circuit model and the worst case short circuit level was determined at each station. The PID-
206 generator as well as the necessary NRIS upgrades shown in Section B, IV were then
modeled in the base case to generate a revised short circuit model. The base case short circuit
results were then compared with the results from the revised model to identify any breakers
that were under-rated as a result of additional short circuit contribution from PID-206
generation. The breakers identified to be upgraded through this comparison are mandatory
upgrades.
C. Analysis Results
The results of the short circuit analysis indicates that the additional generation due to PID 206
generator does not cause an increase in short circuit current such that they exceed the fault
interrupting capability of the high voltage circuit breakers within the Entergy Transmission
system.
D. Problem Resolution
There were no problems identified for this part of the study that were a result of the additional PID
206 generation.
6

III. Transient Stability Analysis
A. Model Information
The dynamic database representing the 2010 summer peak system was used in this transient
stability analysis. The analysis was carried out using the PSS/E powerflow case with the upgrades
identified for PID-206. Figure IV-1 provides a transmission system area map of the local Entergy
System in and around Jacinto with PID-206 identified.
The following upgrades/ changes were included in the powerflow case with PID-206.
• New Jacinto (North) 138 kV switching station approximately 4 miles from the existing
Jacinto 138/230 kV substation along the Jacinto–Shepherd 138 kV transmission line.
PID 206 includes the following key components to be installed at the proposed North Jacinto 138
kV switching station:
• two 83.8 MW combustion turbine generator units (total capacity of 168 MW) connected
at 13.8 kV
• two 120 MVA, 13.8/138 kV generator step up (GSU) transformers
• two 138 kV, circuit breakers
PID-206
Figure IV-1. Transmission System Area Map Identifying PID-206
7

Figure IV-2 shows the one-line diagram of the existing bus/breaker configuration of the existing
Jacinto 138/230 kV Substation WITHOUT PID-206, and Figure IV-3 illustrates the inclusion of
PID-206. For this analysis, the PID-206 generation was dispatched against the load in the selected
zones in the PSS/E database.
Hightower138 kV (L-887)
Series Capacitors
16525 16515 16505
16520 16510 16500
S.A.26200
Splendara138 kV (L-871)
Cleveland138 kV (L-579)
Shepherd138 kV (L-418)
Jacinto 138 kV Substation
Peach Creek138 kV (L-524)
Transformer #1230/138/13.8
China230 kV (L-568)
F8
26205
Hightower138 kV (L-887)
Series Capacitors
16525 16515 16505
16520 16510 16500
S.A.26200
Splendara138 kV (L-871)
Cleveland138 kV (L-579)
Shepherd138 kV (L-418)
Jacinto 138 kV Substation
Peach Creek138 kV (L-524)
Transformer #1230/138/13.8
China230 kV (L-568)
F8F8
26205
Figure IV-2. Existing Bus/Breaker Configuration of the Existing Jacinto 138/230 kV Substation WITHOUT PID-206
Hightower138 kV (L-887)
Series Capacitors
16525 16515 16505
16520 16510 16500
S.A.26200
Splendara138 kV (L-871)
Cleveland138 kV (L-579)
New B1 New B2
New B5
G1
New B3 New B4
East
West
Shepherd138 kV (L-418)
G2
Jacinto 138 kV Substation
Peach Creek138 kV (L-524)
New Proposed Switching Station
Transformer #1230/138/13.8
PID 206
13.8 kV
3 TO 5 MILES
China230 kV (L-568)26205
Hightower138 kV (L-887)
Series Capacitors
16525 16515 16505
16520 16510 16500
S.A.26200
Splendara138 kV (L-871)
Cleveland138 kV (L-579)
New B1 New B2
New B5
G1G1
New B3 New B4
East
West
Shepherd138 kV (L-418)
G2G2
Jacinto 138 kV Substation
Peach Creek138 kV (L-524)
New Proposed Switching Station
Transformer #1230/138/13.8
PID 206
13.8 kV
3 TO 5 MILES
China230 kV (L-568)26205
Figure IV-3. Bus/Breaker Configuration of the Proposed Jacinto 138 kV Switching Station, WITH PID 206, and the Existing Jacinto 138/230 kV Substation

The stability studies were conducted to assess the impact of the power injection of 168 MW into
Entergy’s system. The loads in the Entergy system were represented as follows: for the active part,
100% was modeled with a constant current model; all of the reactive part, on the other hand, was
modeled with a constant impedance model. The simulations were conducted with each of the PID-
206 units generating approximately 83.8 MW, thus injecting 168 MW net into the Entergy
System.
PID-206 provided dynamic model data for representation of their generation equipment in this
study. The generator was modeled using the standard PSS/E GENROU model.
PID-206 provided data for the excitation system. The data for the PID-206 excitation system
represents a static excitation system, and was modeled using the PSS/E EXAC2 dynamic model.
Also, Power System Stabilizer (PSS) data was provided with the interconnection request. The PSS
was modeled using the PSS/E PSS2A dynamic model. PID-206 provided the data for the turbine-
governor controls, which were modeled using the PSS/E GGOV1 model.
The data used for the proposed PID-206 generator, exciter, PSS and governor models is shown in
Appendix A-A.
9

B. Transient Stability Analysis
Stability simulations were run to examine the transient behavior of the PID-206 generator and its
effect on the Entergy system. Stability analysis was performed using the following procedure.
First, three-phase faults with breaker failure were simulated on the transmission lines connected to
the Proposed New Jacinto Switching Station and the Existing Jacinto Substation. If a three phase
fault with three-phase breaker failure was found to be unstable, then a single phase fault followed
by breaker failure and a normally cleared three phase fault were studied. This procedure is being
followed since if the units are stable for a more severe fault (such as three phase fault with breaker
failure), the need to study stability for a less severe fault (such as single-phase fault with breaker
failure and normally cleared three phase) does not arise. The stability analysis was performed
using the PSS/E powerflow and dynamics program. The fault clearing times used for the
simulations are given in Table IV-1.
Table IV-1 Fault Clearing Times
Contingency at kV level
Normal Clearing
Delayed Clearing
138 6 cycles 6+13 cycles
230 6 cycles 6+9 cycles
The breaker failure scenario was simulated with the following sequence of events:
1) At the normal clearing time for the primary breakers, the faulted line is tripped at the far end
from the fault by normal breaker opening.
2) The fault remains in place for three-phase stuck-breakers. For single-phase faults the fault is
appropriately adjusted to account for the line trip of step 1). For an IPO breaker, the 3-phase fault
is replaced by a line-to-ground fault (2 phases of the faulted-end breaker clear and one phase
sticks).
10

3) The fault is then cleared by back-up clearing. If the system is shown to be unstable for this
condition, then stability of the system without the PID-206 plant needs to be verified.
All line trips are assumed to be permanent (i.e. no high speed re-closure).
The stability analysis was performed using the PSS/E dynamics program, which only simulates
the positive sequence network. Unbalanced faults involve the positive, negative, and zero
sequence networks. For unbalanced faults, the equivalent fault admittance must be inserted in the
PSS/E positive sequence model between the faulted bus and ground to simulate the effect of the
negative and zero sequence networks. For a single-line-to-ground (SLG) fault, the fault admittance
equals the inverse of the sum of the positive, negative and zero sequence Thevenin impedances at
the faulted bus. Since PSS/E inherently models the positive sequence fault impedance, the sum of
the negative and zero sequence Thevenin impedances needs to be added and entered as the fault
impedance at the faulted bus.
For three-phase faults, a fault admittance of –j2E9 is used (essentially infinite admittance or zero
impedance).
Fault scenarios were formulated by examining the system configuration shown in Figure IV-4.
Table IV-2A and Table IV-2B list all the fault cases that were simulated in this study.
Faults 0 through 7 in Table IV-2A represent normal clearing 3-phase faults in 6 cycles, and faults
1a through 8a in Table IV-2B represent the stuck breaker cases with the appropriate delayed back-
up clearing times. Fault F2c illustrates the benefit of reducing the delayed clearing time from 13
cycles to 10 cycles.
For all cases analyzed, the initial disturbance was applied at t = 0.1 seconds. The breaker clearing
was applied at the appropriate time following this fault inception.
11

12
Hightower138 kV (L-887)
Series Capacitors
16525 16515 16505
16520 16510 16500
S.A.26200
Cleveland138 kV (L-579)
New B1 New B2
New B5
G1
New B3 New B4
East
West
Shepherd138 kV (L-418)
G2
Splendara138 kV (L-871)
Jacinto 138 kV Substation
Peach Creek138 kV (L-524)
New Proposed Switching Station
Transformer #1230/138/13.8
PID 206
13.8 kV
F4, F4a
F6, F6a
F3, F3a
F1, F1a
F2, F2a, f2b,2c
F5, F5a
~ 4 MILES
China230 kV (L-568)
F7
26205
F8a
F0
F0x
Hightower138 kV (L-887)
Series Capacitors
16525 16515 16505
16520 16510 16500
S.A.26200
Cleveland138 kV (L-579)
New B1 New B2
New B5
G1G1
New B3 New B4
East
West
Shepherd138 kV (L-418)
G2G2
Figure IV-4. Bus/Breaker Configuration of the Proposed Jacinto 138 kV Switching Station, PID 206,
and the Existing Jacinto 138/230 kV Substation
Splendara138 kV (L-871)
Jacinto 138 kV Substation
Peach Creek138 kV (L-524)
New Proposed Switching Station
Transformer #1230/138/13.8
PID 206
13.8 kV
F4, F4aF4, F4a
F6, F6aF6, F6a
F3, F3aF3, F3a
F1, F1aF1, F1a
F2, F2a, f2b,2cF2, F2a, f2b,2c
~ 4 MILES
F0F0
F0xF0x
F5, F5aF5, F5a
F8aF8a
26205China
230 kV (L-568)
F7F7

Table IV-2A Fault Cases Simulated in this Study: Three-phase faults with normal clearing
CASE Prior
Outage Element
LOCATION TYPE Clearing
Time (cy)
PRIMARY BRK TRIP # TRIPPED FACILITIES Stable ? Acceptable
Voltages ?
FAULT-0 -- New Jacinto 138 kV 3 PH 6 B1,B2,B5 PID-206 (G1 only)
YES
YES
FAULT 0X -- New Jacinto 138 kV 3 PH 6 B3,B4,B5 PID-206 (G2 only)
YES
YES
FAULT-1 -- New Jacinto – Shepherd 138 kV 3 PH 6 B2 New Jacinto – Shepherd 138 kV
YES
YES
FAULT-2 -- New Jacinto – Jacinto 138 kV 3 PH 6 B4,16520,16525 New Jacinto – Jacinto 138 kV
YES
YES
FAULT-3 -- Jacinto – Peach Creek 138 kV 3 PH 6 16520,16510 Jacinto – Peach Creek 138 kV
YES
YES
FAULT-4 -- Jacinto – Cleveland 138 kV 3 PH 6 16525,16515 Jacinto – Cleveland 138 kV
YES
YES
FAULT-5 -- Jacinto – Splendora 138 kV 3 PH 6 16505,16500 Jacinto – Splendora 138 kV
YES
YES
FAULT-6 -- Jacinto – Hightower138 kV 3 PH 6 16515,16505 Jacinto – Hightower 138 kV
YES
YES
FAULT-7 -- Jacinto – China 230 kV 3 PH 6 16510,16500, 26200
Jacinto 138/230 kV Transfomer #1, Jacinto – China 230 kV
YES
YES
13

14
Table IV-2B Fault Cases Simulated in this Study: Faults with stuck breaker
CLEARING TIME (cycles) CASE LOCATION TYPE
PRIMARY BACK-UP
STUCK BRK #
PRIMARY BRK TRIP #
SECONDARY BRK TRIP TRIPPED FACILITIES Stable ? Acceptable
Voltages ?
FAULT-1a New Jacinto – Shepherd 138 kV 3 PH 6 13 B2 BRK @ Shepherd B1,B5
PID-206 G1 only, New Jacinto – Shepherd 138 kV
YES
YES
FAULT-2a New Jacinto – Jacinto 138 kV 3 PH 6 13 16525 B4, 16520 16515 New Jacinto-Jacinto 138 kV, Jacinto – Cleveland 138 kV
YES
YES
FAULT-2b New Jacinto – Jacinto 138 kV 3 PH 6 13 B4 16525, 16520 B5, B3 PID-206 (G2 only), New Jacinto 138 kV
NO
NO
FAULT-2c New Jacinto – Jacinto 138 kV 3 PH 6 10 B4 16525, 16520 B5, B3 PID-206 (G2 only), New Jacinto 138 kV
YES
YES
FAULT-3a Jacinto – Peach Creek 138 kV 3 PH 6 13 16510 16520 16500,26200
Jacinto – Peach Creek 138 kV, Jacinto 138/230 kV Transformer #1, Jacinto – China 230 kV
YES
YES
FAULT-4a Jacinto – Cleveland 138 kV 3 PH 6 13 16515 16525 16505 Jacinto – Cleveland 138 kV, Jacinto – Hightower 138 kV
YES
YES
FAULT-5a Jacinto – Spendora 138 kV 3 PH 6 13 16500 16505 16510, 26200
Jacinto – Splendora 138 kV, Jacinto 138/230 kV Transformer #1, Jacinto-China 230 kV
YES
YES
FAULT-6a Jacinto – Hightower 138 kV 3 PH 6 13 16505 16500 16515 Jacinto – Spendora 138 kV, Jacinto Hightower 138 kV
YES
YES
FAULT-8a Jacinto 138 kV–side Transformer #1 3 PH 6 13 16510 16500,26200 16520
Jacinto 138/230 kV Transformer #1, Jacinto-Peach Creek 138 kV, (bypass Jacinto-China series caps)
YES
YES

C. Analysis Results
All of the three-phase fault cases with stuck breaker remained stable except for case F2b. After
further investigation, it was observed that by decreasing the delayed clearing time from 13 cycles
to 10 cycles, transient stability was maintained for case F2b (as illustrated in case F2c). For
completeness, three-phase faults with normal clearing were simulated for all cases for which the
system remained stable.
The plots are provided in Appendix A-E.
Based on the results of the various cases and sensitivities thereof, it would be highly
recommended that:
1) a dual transfer-trip protection scheme be installed on all lines coming out of the New
Jacinto substation, namely the New Jacinto – Jacinto 138 kV line and the New Jacinto –
Shepherd 138 kV line. This is to ensure that the PID 206 generators remain in
synchronism with the Entergy system.
2) install out-of-step protection on the proposed PID 206 generators (R vs. X plot from case
F2b is included in Figure IV-5 and IV-6 to assist in setting of out-step relays)
3) breaker failure timers on all the breakers at the New Jacinto 138 kV substation be set at
10 cycles or below. This is to ensure the stability of the PID 206 generators.
4) install breakers with the fastest possible clearing times for the New Jacinto 138 kV
substation. This would further help the PID 206 generators to maintain stability in the
event of a severe fault.
15

APPARENT IMPEDANCE OF THE NEW JACINTO TO SHEPHERD 138 KV
LINE FOR UNSTABLE CASE F2bPRE-FAULT
DURING FAULT
AFTER FAULT CLEARING
APPARENT IMPEDANCE OF THE NEW JACINTO TO SHEPHERD 138 KV
LINE FOR UNSTABLE CASE F2bPRE-FAULT
DURING FAULT
AFTER FAULT CLEARING
Figure IV-5. R vs. X plot of the New Jacinto to Shepherd 138 kV line for unstable case F2b
Figure IV-6. R vs. X plot of the New Jacinto to Shepherd 138 kV line for unstable case F2b
16

In addition to criteria for the stability of the machines, Entergy has evaluation criteria for the
transient voltage dip as follows:
• 3-phase fault or single-line-ground fault with normal clearing resulting in the loss of a
single component (generator, transmission circuit or transformer) or a loss of a single
component without fault:
Not to exceed 20% for more than 20 cycles at any bus
Not to exceed 25% at any load bus
Not to exceed 30% at any non-load bus
• 3-phase faults with normal clearing resulting in the loss of two or more components
(generator, transmission circuit or transformer), and SLG fault with delayed clearing
resulting in the loss of one or more components:
Not to exceed 20% for more than 40 cycles at any bus
Not to exceed 30% at any bus
The duration of the transient voltage dip excludes the duration of the fault. The transient voltage
dip criteria will not be applied to three-phase faults followed by stuck breaker conditions unless
the determined impact is extremely widespread.
The voltages at all buses in the Entergy system (115 kV and above) were monitored during each of
the fault cases as appropriate. No voltage violations were observed for normally cleared three-
phase faults.
The results indicated that there are no widespread voltage dip criteria violations following stuck
breaker faults.
Hence, it can be concluded that the proposed PID-206 unit does not degrade the Entergy system
performance.
17

In summary, when considering the new PID-206 (168 MW) generation at the proposed Jacinto N
138 kV switching station, all the simulated faults are stable (considering a small decrease in
delayed clearing time for one case/line). No violations of the voltage dip criteria were observed.
This meets Entergy’s performance criteria when the PID-206 plant is in-service.
Due to restructuring of the utility industry, there has been a large increase of merchant generation
activity on the Entergy system. These generators are equipped with modern exciters that have a
high gain and a fast response to enhance transient stability. However, these fast response exciters,
if used without stabilizers, can lead to oscillatory instability affecting local or regional reliability.
This problem is exacerbated particularly in areas where there is a large amount of generation with
limited transmission available for exporting power. Stability studies carried out at Entergy have
validated this concern. Furthermore, based on the understanding of operational problems
experienced in the WECC area over the last several years and the opinion of leading experts in the
stability area, Power System Stabilizers (PSS) are an effective and a low cost means of mitigating
dynamic stability problems. In particular, PSS cost can be low if it is included in power plant
procurement specifications.
Therefore, as a pre-emptive measure, Entergy requires all generation intending to interconnect to
its transmission system to install PSS on their respective units. Please refer to Appendix A-I for
Entergy’s Policy Statement on PSS Requirements.
18

APPENDIX A.A DATA PROVIDED BY CUSTOMER
A.A.1 LARGE GENERATING FACILITY DATA
UNIT RATINGS
kVA 101,800 °F Voltage __13.8 kV_____ Power Factor 0.85 Speed (RPM) 57 Connection __Wye_____ Short Circuit Ratio _0.57___ Frequency, Hertz ___60_______ Stator Amperes at Rated kVA 4,259 Field Volts _____129_____ Max Turbine MW 93.520 °F _25_
COMBINED TURBINE-GENERATOR-EXCITER INERTIA DATA Inertia Constant, H = 5.6 kW sec/kVA Moment-of-Inertia, WR2 = n/a lb. ft.2
REACTANCE DATA (PER UNIT-RATED KVA) DIRECT AXIS QUADRATURE AXIS Synchronous – saturated Xdv 1.76 Xqv __1.41Synchronous – unsaturated Xdi 1.98 Xqi __1.81 Transient – saturated X'dv 0.164 X'qv __N/A Transient – unsaturated X'di 0.208 X'qi __0.30Subtransient – saturated X"dv 0.117 X"qv __0.14Subtransient – unsaturated X"di 0.150 X"qi __0.18Negative Sequence – saturated X2v 0.114 Negative Sequence – unsaturated X2i 0.146 Zero Sequence – saturated X0v N/A Zero Sequence – unsaturated X0i 0.074 Leakage Reactance Xlm 0.06-0.10

FIELD TIME CONSTANT DATA (SEC) Open Circuit T'do 12.8 T'qo _3.90__ Three-Phase Short Circuit Transient T'd3 0.84 T'q _0.42 _ Line to Line Short Circuit Transient T'd2 1.70 Line to Neutral Short Circuit Transient T'd1 2.10 Short Circuit Subtransient T"d 0.04 T"q _0.04_ Open Circuit Subtransient T"do 0.05 T"qo _0.05_
ARMATURE TIME CONSTANT DATA (SEC) Three Phase Short Circuit Ta3 _0.310_ Line to Line Short Circuit Ta2 _0.310_ Line to Neutral Short Circuit Ta1 _0.27 _ NOTE: If requested information is not applicable, indicate by marking "N/A."
MW CAPABILITY AND PLANT CONFIGURATION LARGE GENERATING FACILITY DATA
ARMATURE WINDING RESISTANCE DATA (PER UNIT)
Positive R1 _0.00303 Negative R2 _0.0186 Zero R0 _0.0045 Rotor Short Time Thermal Capacity I2
2t = _See plot_ Field Current at Rated kVA, Armature Voltage and PF = 1392 amps Field Current at Rated kVA and Armature Voltage, 0 PF = N/A amps Three Phase Armature Winding Capacitance = 0.40 microfarad Field Winding Resistance = _0.065/0.092 ohms _20/125_ °C Armature Winding Resistance (Per Phase) = 0.0015/0.00197 ohms 20/75 °C

CURVES Provide Saturation, Vee, Reactive Capability, Capacity Temperature Correction curves. Designate normal and emergency Hydrogen Pressure operating range for multiple curves.

GENERATOR STEP-UP TRANSFORMER DATA RATINGS (SEE DATASHEET BELOW)
Capacity -- Self-cooled / Maximum Nameplate 90,000 / 120,000 kVA Voltage Ratio (Generator Side/System side/Tertiary) 13.8 / 138.0 / kV Winding Connections (Low V/High V/Tertiary V (Delta or Wye)) Delta /____Wye_______/_______________ Fixed Taps Available __+/-5% , +/- 2.5% , rated___ Present Tap Setting ________________ IMPEDANCE Positive Z1 (on 90 MVA base) 9 % 38 X/R Zero Z0 % X/R

GSU TRANSFORMER DATA SHEET

GSU TRANSFORMER DATA SHEET (continued)

EXCITATION SYSTEM DATA Identify appropriate IEEE model block diagram of excitation system and power system stabilizer (PSS) for computer representation in power system stability simulations and the corresponding excitation system and PSS constants for use in the model.

EXCITATION SYSTEM DATA (continued)

EXCITATION SYSTEM DATA (continued)

POWER SYSTEM STABILIZER (PSS) DATA
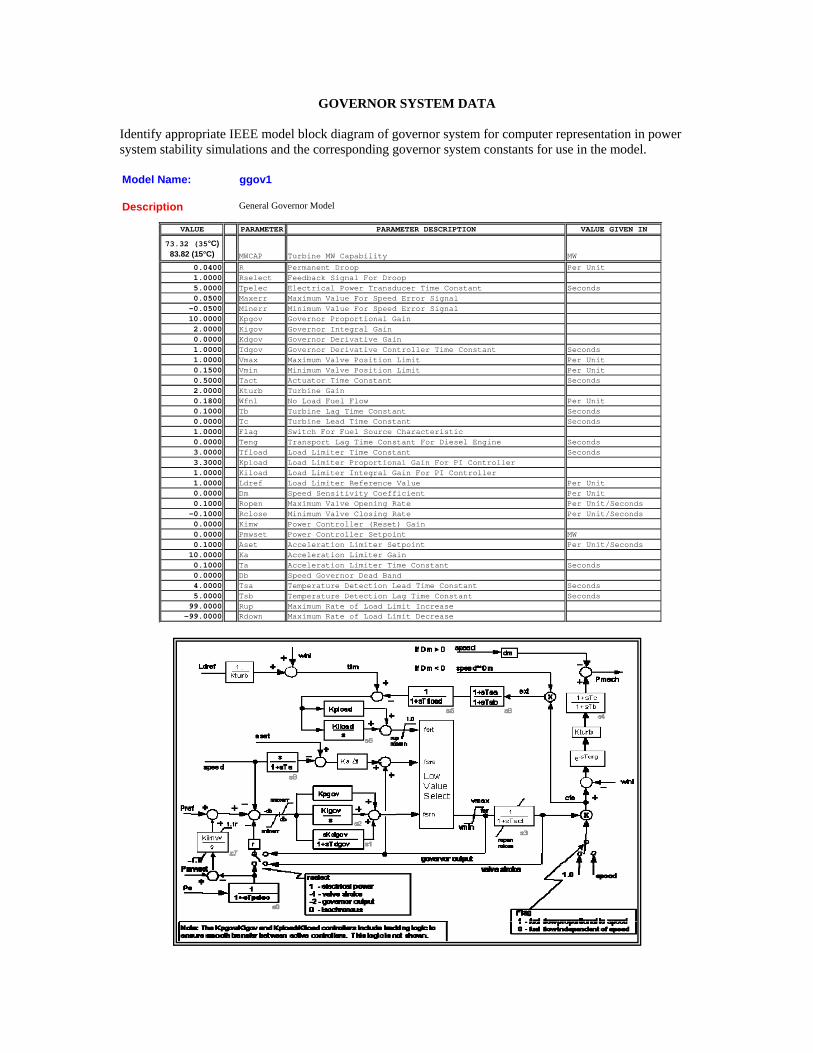
GOVERNOR SYSTEM DATA Identify appropriate IEEE model block diagram of governor system for computer representation in power system stability simulations and the corresponding governor system constants for use in the model.
VALUE PARAMETER VALUE GIVEN IN
73.32 (35°C)83.82 (15°C) MWCAP MW
0.0400 R Per Unit1.0000 Rselect5.0000 Tpelec Seconds0.0500 Maxerr-0.0500 Minerr10.0000 Kpgov2.0000 Kigov0.0000 Kdgov1.0000 Tdgov Seconds1.0000 Vmax Per Unit0.1500 Vmin Per Unit0.5000 Tact Seconds2.0000 Kturb0.1800 Wfnl Per Unit0.1000 Tb Seconds0.0000 Tc Seconds1.0000 Flag0.0000 Teng Seconds3.0000 Tfload Seconds3.3000 Kpload1.0000 Kiload1.0000 Ldref Per Unit0.0000 Dm Per Unit0.1000 Ropen Per Unit/Seconds-0.1000 Rclose Per Unit/Seconds0.0000 Kimw0.0000 Pmwset MW0.1000 Aset Per Unit/Seconds10.0000 Ka0.1000 Ta Seconds0.0000 Db4.0000 Tsa Seconds5.0000 Tsb Seconds99.0000 Rup
-99.0000 RdownMaximum Rate of Load Limit Increase
Power Controller Setpoint
Governor Derivative Controller Time ConstantMaximum Valve Position LimitMinimum Valve Position LimitActuator Time ConstantTurbine Gain
Turbine Lead Time ConstantSwitch For Fuel Source CharacteristicTransport Lag Time Constant For Diesel Engine
Maximum Rate of Load Limit Decrease
Model Name:
Turbine MW Capability
PARAMETER DESCRIPTION
Minimum Value For Speed Error Signal
Feedback Signal For DroopPermanent Droop
Electrical Power Transducer Time Constant
ggov1
Maximum Value For Speed Error Signal
General Governor Model
No Load Fuel FlowTurbine Lag Time Constant
Governor Derivative Gain
Governor Proportional GainGovernor Integral Gain
Load Limiter Time Constant
Minimum Valve Closing RatePower Controller (Reset) Gain
Temperature Detection Lead Time Constant
Load Limiter Proportional Gain For PI Controller
Speed Sensitivity CoefficientMaximum Valve Opening Rate
Load Limiter Integral Gain For PI ControllerLoad Limiter Reference Value
Temperature Detection Lag Time Constant
Acceleration Limiter SetpointAcceleration Limiter GainAcceleration Limiter Time ConstantSpeed Governor Dead Band
Description

A.A.2 DATA USED IN POWERFLOW AND STABILITY MODELS
Powerflow Models The PID-206 plant equipment data are listed in Appendix A-A. No other elements were added to the Entergy system. Powerflow Data ############################################################## <<<<< POWERFLOW MACHINE 1 >>>>><<<<< POWERFLOW MACHINE 1 >>>>> ############################################################## <<<<< MACHINE 1 POWERFLOW DATA >>>>> 0, 100.00 / PSS/E-30.3 TUE, OCT 09 2007 17:11 2005 SERIES, NERC/SDDWG BASE CASE LIBRARY 2005 FALL BASE CASE, TRIAL #6 97901,'G1PID206 ', 13.8000,2, 0.000, 0.000, 151, 104,1.00190, -21.3880, 1 0 / END OF BUS DATA, BEGIN LOAD DATA 0 / END OF LOAD DATA, BEGIN GENERATOR DATA 97901,'1 ', 83.800, -6.835, 71.000, -44.000,1.01000, 97556, 101.800, 0.00000, 0.15000, 0.00000, 0.00000,1.00000,1, 100.0, 83.820, 0.000, 1,1.0000 0 / END OF GENERATOR DATA, BEGIN BRANCH DATA 0 / END OF BRANCH DATA, BEGIN TRANSFORMER DATA 97556, 97901, 0,'1 ',2,2,1, 0.00000, 0.00000,2,' ',1, 1,1.0000 0.00316, 0.12000, 120.00 138.000, 138.000, 0.000, 120.00, 120.00, 120.00, 0, 0,144.9000,131.1000,144.9000,131.1000, 5, 0, 0.00000, 0.00000 13.8000, 13.800 0 / END OF TRANSFORMER DATA, BEGIN AREA DATA 151, 99343, 324.000, 5.000,'EES ' 0 / END OF AREA DATA, BEGIN TWO-TERMINAL DC DATA 0 / END OF TWO-TERMINAL DC DATA, BEGIN VSC DC LINE DATA 0 / END OF VSC DC LINE DATA, BEGIN SWITCHED SHUNT DATA 0 / END OF SWITCHED SHUNT DATA, BEGIN IMPEDANCE CORRECTION DATA 0 / END OF IMPEDANCE CORRECTION DATA, BEGIN MULTI-TERMINAL DC DATA 0 / END OF MULTI-TERMINAL DC DATA, BEGIN MULTI-SECTION LINE DATA 0 / END OF MULTI-SECTION LINE DATA, BEGIN ZONE DATA 104,'GSTNCN ' 0 / END OF ZONE DATA, BEGIN INTER-AREA TRANSFER DATA 0 / END OF INTER-AREA TRANSFER DATA, BEGIN OWNER DATA 1,'APC ' 0 / END OF OWNER DATA, BEGIN FACTS DEVICE DATA 0 / END OF FACTS DEVICE DATA

Powerflow Data (continued) ############################################################## <<<<< POWERFLOW MACHINE 2 >>>>><<<<< POWERFLOW MACHINE 2 >>>>> ############################################################## 0, 100.00 / PSS/E-30.3 TUE, OCT 09 2007 17:12 2005 SERIES, NERC/SDDWG BASE CASE LIBRARY 2005 FALL BASE CASE, TRIAL #6 97902,'G2PID206 ', 13.8000,2, 0.000, 0.000, 151, 104,1.00190, -21.3880, 1 0 / END OF BUS DATA, BEGIN LOAD DATA 0 / END OF LOAD DATA, BEGIN GENERATOR DATA 97902,'1 ', 83.800, -6.835, 71.000, -44.000,1.01000, 97556, 101.800, 0.00000, 0.15000, 0.00000, 0.00000,1.00000,1, 100.0, 83.820, 0.000, 1,1.0000 0 / END OF GENERATOR DATA, BEGIN BRANCH DATA 0 / END OF BRANCH DATA, BEGIN TRANSFORMER DATA 97556, 97902, 0,'1 ',2,2,1, 0.00000, 0.00000,2,' ',1, 1,1.0000 0.00316, 0.12000, 120.00 138.000, 138.000, 0.000, 120.00, 120.00, 120.00, 0, 0,144.9000,131.1000, 1.05000, 0.95000, 5, 0, 0.00000, 0.00000 13.8000, 13.800 0 / END OF TRANSFORMER DATA, BEGIN AREA DATA 151, 99343, 324.000, 5.000,'EES ' 0 / END OF AREA DATA, BEGIN TWO-TERMINAL DC DATA 0 / END OF TWO-TERMINAL DC DATA, BEGIN VSC DC LINE DATA 0 / END OF VSC DC LINE DATA, BEGIN SWITCHED SHUNT DATA 0 / END OF SWITCHED SHUNT DATA, BEGIN IMPEDANCE CORRECTION DATA 0 / END OF IMPEDANCE CORRECTION DATA, BEGIN MULTI-TERMINAL DC DATA 0 / END OF MULTI-TERMINAL DC DATA, BEGIN MULTI-SECTION LINE DATA 0 / END OF MULTI-SECTION LINE DATA, BEGIN ZONE DATA 104,'GSTNCN ' 0 / END OF ZONE DATA, BEGIN INTER-AREA TRANSFER DATA 0 / END OF INTER-AREA TRANSFER DATA, BEGIN OWNER DATA 1,'APC ' 0 / END OF OWNER DATA, BEGIN FACTS DEVICE DATA 0 / END OF FACTS DEVICE DATA

Stability Models The PID-206 plant equipment stability model data are listed in Appendix A-A. The resulting PSS/E model data is a follows: Dynamics Data for Stability Models <<<<< MACHINE 1 >>>>> PLANT MODELS REPORT FOR ALL MODELS BUS 97901 [G1PID206 13.800] MODELS ** GENROU ** BUS X-- NAME --X BASEKV MC C O N S S T A T E S 97901 G1PID206 13.800 1 31587-31600 14663-14668 MBASE Z S O R C E X T R A N GENTAP 101.8 0.00000+J 0.15000 0.00000+J 0.00000 1.00000 T'D0 T''D0 T'Q0 T''Q0 H DAMP XD XQ X'D X'Q X''D XL 12.80 0.050 3.90 0.050 5.60 0.00 1.9800 1.8100 0.2080 0.3000 0.1500 0.0800 S(1.0) S(1.2) 0.1400 0.4194 ** PSS2A ** BUS X-- NAME --X BASEKV MC C O N S S T A T E S V A R S I C O N S 97901 G1PID206 13.800 1 34506-34522 16821-16836 693-696 874-879 IC1 REMBUS1 IC2 REMBUS2 M N 1 0 3 0 5 1 TW1 TW2 T6 TW3 TW4 T7 KS2 KS3 5.000 5.000 0.000 5.000 0.000 5.000 0.445 1.000 T8 T9 KS1 T1 T2 T3 T4 VSTMAX VSTMIN 0.500 0.100 15.000 0.200 0.020 0.200 0.020 0.100 -0.100 ** EXAC2 ** BUS X-- NAME --X BASEKV MC C O N S S T A T E S 97901 G1PID206 13.800 1 63592-63614 25111-25115 TR TB TC KA TA VAMAX VAMIN KB VRMAX VRMIN 0.010 1.000 1.000 1000.0 0.010 7.200 -7.200 1.0 29.1 -29.1 TE KL KH KF TF KC KD KE VLR 1.300 4.000 0.000 0.050 1.000 0.100 0.770 1.000 9.370 E1 S(E1) E2 S(E2) 4.0600 0.0100 3.0400 0.0100 ** GGOV1 ** BUS X-- NAME --X BASEKV MC C O N S S T A T E S V A R S ICONS 97901 G1PID206 13.800 1 80914-80946 31071-31080 3931-3950 1062-1063 R TPELEC MAXERR MINERR KPGOV KIGOV KDGOV TDGOV VMAX VMIN 0.040 5.000 0.050 -0.050 10.000 2.000 0.000 1.000 1.000 0.150 TACT KTURB WFNL TB TC TENG TFLOAD KPLOAD KILOAD LDREF 0.500 2.000 0.180 0.100 0.000 0.000 3.000 3.300 1.000 1.000 DM ROPEN RCLOSE KIMW ASET KA TA TRATE DB 0.000 0.100 -0.100 0.000 0.100 10.000 0.100 83.800 0.000 TSA TSB RUP RDOWN 4.000 5.000 99.000 -99.000

Dynamics Data for Stability Models (continued) <<<<< MACHINE 2 >>>>> PLANT MODELS REPORT FOR ALL MODELS BUS 97902 [G2PID206 13.800] MODELS ** GENROU ** BUS X-- NAME --X BASEKV MC C O N S S T A T E S 97902 G2PID206 13.800 1 31601-31614 14669-14674 MBASE Z S O R C E X T R A N GENTAP 101.8 0.00000+J 0.15000 0.00000+J 0.00000 1.00000 T'D0 T''D0 T'Q0 T''Q0 H DAMP XD XQ X'D X'Q X''D XL 12.80 0.050 3.90 0.050 5.60 0.00 1.9800 1.8100 0.2080 0.3000 0.1500 0.0800 S(1.0) S(1.2) 0.1400 0.4194 ** PSS2A ** BUS X-- NAME --X BASEKV MC C O N S S T A T E S V A R S I C O N S 97902 G2PID206 13.800 1 34523-34539 16837-16852 697-700 880-885 IC1 REMBUS1 IC2 REMBUS2 M N 1 0 3 0 5 1 TW1 TW2 T6 TW3 TW4 T7 KS2 KS3 5.000 5.000 0.000 5.000 0.000 5.000 0.445 1.000 T8 T9 KS1 T1 T2 T3 T4 VSTMAX VSTMIN 0.500 0.100 15.000 0.200 0.020 0.200 0.020 0.100 -0.100 ** EXAC2 ** BUS X-- NAME --X BASEKV MC C O N S S T A T E S 97902 G2PID206 13.800 1 63615-63637 25116-25120 TR TB TC KA TA VAMAX VAMIN KB VRMAX VRMIN 0.010 1.000 1.000 1000.0 0.010 7.200 -7.200 1.0 29.1 -29.1 TE KL KH KF TF KC KD KE VLR 1.300 4.000 0.000 0.050 1.000 0.100 0.770 1.000 9.370 E1 S(E1) E2 S(E2) 4.0600 0.0100 3.0400 0.0100 ** GGOV1 ** BUS X-- NAME --X BASEKV MC C O N S S T A T E S V A R S ICONS 97902 G2PID206 13.800 1 80947-80979 31081-31090 3952-3971 1064-1065 R TPELEC MAXERR MINERR KPGOV KIGOV KDGOV TDGOV VMAX VMIN 0.040 5.000 0.050 -0.050 10.000 2.000 0.000 1.000 1.000 0.150 TACT KTURB WFNL TB TC TENG TFLOAD KPLOAD KILOAD LDREF 0.500 2.000 0.180 0.100 0.000 0.000 3.000 3.300 1.000 1.000 DM ROPEN RCLOSE KIMW ASET KA TA TRATE DB 0.000 0.100 -0.100 0.000 0.100 10.000 0.100 83.800 0.000 TSA TSB RUP RDOWN 4.000 5.000 99.000 -99.000

APPENDIX A.B Stability Issues in the Western Region of the
Entergy System Due to Independent Power Generation
Introduction
The WOTAB (West of the Atchafalaya Basin) Area in defined as Entergy’s systems in Southwestern Louisiana, and Southeastern Texas. The WOTAB area is a major load center for the Entergy System. The load to generation ratio requires a significant amount of power to be imported into the WOTAB area. However, because of the influx of new generating projects proposed for the area, it is likely that by the year 2003 this area may turn into a significant exporter of power. There have been a significant number of requests for interconnection studies to evaluate the potential interconnection of new generating facilities in the WOTAB area. It is anticipated that by 2003 there may be approximately 4000 – 6000 MW of new merchant generation within the WOTAB area. Entergy’s transmission system was planned, designed and built to serve approximately 5000 – 6000 MW of native and network loads in the WOTAB area. The addition of a significant amount of merchant generation will result in the export of power out of the WOTAB area. A high level of export power has the potential to create major problems, such as voltage and dynamic stability. The main objective of this study is to establish an estimated power export limit for the WOTAB area based on stability criteria. Signing an interconnection agreement provides the generator the right to interconnection to the transmission system, but does not provide it any right to move its power onto or over the transmission system. The right to use the transmission system to transmit power can only be obtained by submitting a transmission request for service pursuant to Entergy’s FERC-approved transmission tariff. Solutions to stability problems to increase export limits, such as construction of 500 kV line, have very long lead-times and tend to be very expensive. Entergy believes that it is important to post this study publicly on its OASIS site so that entities that have already executed interconnection agreements, as well as entities that are proposing to site new generation within the WOTAB area, can incorporate this information into their decision-making process.

Analysis In order to establish stability limits from the WOTAB area, all merchant generating]that have signed an interconnection agreement were dispatched at their maximum capability along with the native generation in the area. In order to accommodate this export and simulate a worst case scenario, generation was reduced in the northern part of the Entergy System. In this analysis the export limits were determined without the addition of any Power System Stabilizers (PSSs). However, sensitivity studies were conducted to determine the impact of stabilizers. If voltage stability limits were found to be lower than the dynamic stability limits, they were captured in this analysis. One important assumption made in this study was to ignore thermal limitations. Thermal issues will be addressed as part of Transmission Service Request as they are based on source to sink information and generation dispatch within the WOTAB area. The two cases analyzed in this study are as follows: 1. Base case with no merchant generation 2. Base case with merchant generation Voltage stability analysis was performed for the pre-contingency condition and contingencies on four critical lines: Hartburg-Mt. Olive 500 kV, Richard–Webre 500 kV, Nelson–Richard 500 kV, and Grimes–Crockett 345 kV lines. As part of the voltage stability analysis, PV curves were developed in order to determine the maximum power that can be exported from the WOTAB area without experiencing voltage decline or voltage collapse. Entergy’s guideline on voltage decline states that voltage at any station should not fall below 0.92 pu of nominal system voltage on single contingency. Transient stability analysis was performed by applying a 3 phase to ground fault on the lines mentioned earlier. The fault clearing time was assumed to be 5 cycles for 500 kV and 345 kV lines and 6 cycles for the 230 kV lines. The transient stability plots show the machine angle as a function of time and indicate whether machine is stable and well damped, transiently unstable or dynamically unstable. A three percent damping criteria was used to screen the damping problem. Results Case 1 – Base Case with no Merchant Generation No voltage stability problems were identified in this case. The transient stability plots in Figures 1 and 2 for a three-phase fault on the Hartburg – Mt.Olive 500 kV and Richard – Webre 500 kV lines show that the machines are stable and well damped. Case 2 – Base case with Merchant Generation
A. Voltage Stability Analysis The voltage stability plot or PV Curve for this case is shown in Figure 3. The X-axis of this plot is the power export level from the WOTAB area corresponding to the pre-contingency condition and the contingency of the four critical lines described earlier. The Y-axis represents the voltage at the Cane River 115 kV bus in the North Louisiana area. This station is representative of the voltage collapse occurring in that area. From the PV plot it can be observed that the most limiting contingency from the point of view of export from the area is the Hartburg – Mt. Olive 500 kV line. Based on the voltage decline guideline, the export limit from the area on the contingency of Hartburg-Mt. Olive line is 2100 MW. Figure 3 also shows that voltage collapse will eventually occur at about 3300 MW.
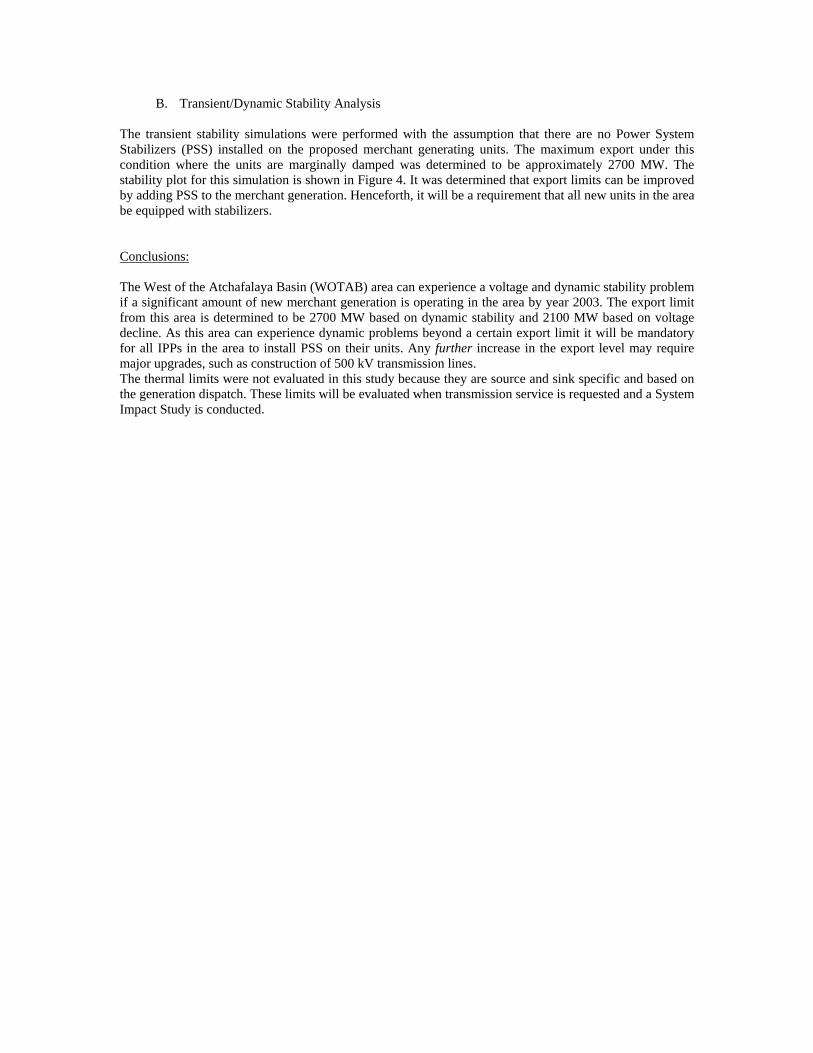
B. Transient/Dynamic Stability Analysis The transient stability simulations were performed with the assumption that there are no Power System Stabilizers (PSS) installed on the proposed merchant generating units. The maximum export under this condition where the units are marginally damped was determined to be approximately 2700 MW. The stability plot for this simulation is shown in Figure 4. It was determined that export limits can be improved by adding PSS to the merchant generation. Henceforth, it will be a requirement that all new units in the area be equipped with stabilizers. Conclusions: The West of the Atchafalaya Basin (WOTAB) area can experience a voltage and dynamic stability problem if a significant amount of new merchant generation is operating in the area by year 2003. The export limit from this area is determined to be 2700 MW based on dynamic stability and 2100 MW based on voltage decline. As this area can experience dynamic problems beyond a certain export limit it will be mandatory for all IPPs in the area to install PSS on their units. Any further increase in the export level may require major upgrades, such as construction of 500 kV transmission lines. The thermal limits were not evaluated in this study because they are source and sink specific and based on the generation dispatch. These limits will be evaluated when transmission service is requested and a System Impact Study is conducted.

APPENDIX A.C POLICY STATEMENT/GUIDELINES FOR POWER
SYSTEM STABILIZER ON THE ENTERGY SYSTEM
Background: A Power System Stabilizer (PSS) is an electronic feedback control that is a part of the excitation system control for generating units. The PSS acts to modulate the generator field voltage to damp the Power System oscillation. Due to restructuring of the utility industry, there has been a significant amount of merchant generation activity on the Entergy system. These generators are typically equipped with modern exciters that have a high gain and a fast response to enhance transient stability. However, these fast response exciters, if used without stabilizers, can lead to oscillatory instability affecting local or regional reliability. This problem is exacerbated particularly in areas where there is a large amount of generation with limited transmission available for exporting power. Stability studies carried out at Entergy have validated this concern. Furthermore, based on the understanding of operational problems experienced in the WSCC area over the last several years and the opinion of leading experts in the stability area, PSS are an effective and a low cost means of mitigating dynamic stability problems. In particular, PSS cost can be low if it is included in power plant procurement specifications. Therefore, as a pre-emptive measure, Entergy requires all new generation (including affiliates and qualifying facilities) intending to interconnect to its transmission system to install PSS on their respective units. The following guidelines shall be followed for PSS installation: • PSS shall be installed on all new synchronous generators (50 MVA and larger) connecting to the
transmission system that were put into service after January 1, 2000. • PSS shall be installed on synchronous generators (50 MVA and larger) installed before January 1,
2000 subject to confirmation by Entergy that these units are good candidates for PSS and installing PSS on these units will enhance stability in the region. The decision to install PSS on a specific unit will be based on the effectiveness of the PSS in controlling oscillations, the suitability of the excitation system, and cost of retrofitting.
• In areas where a dynamic stability problem has not been explicitly identified, all synchronous
generators (50 MVA and larger) will still be required to install stabilizers. However, in such cases the tuning will not be required and the stabilizer may remain disconnected until further advised by Entergy.
• Need for testing and tuning of PSS on units requesting transmission service from areas where stability
problem has not been explicitly identified will be determined on an as-needed basis as part of transmission service study.
• The plants are responsible for testing and tuning of exciter and stabilizer controls for optimum
performance and providing PSS model and data for use with PSS/E stability program.

• PSS equipment shall be tested and calibrated in conjunction with automatic voltage regulation (AVR) testing and calibration at-least every five years in accordance with the NERC Compliance Criteria on Generator Testing. PSS re-calibration must be performed if AVR parameters are modified.
• The PSS equipment to be installed is required to be of the Delta-P-omega type.
References: WOTAB Area Stability Study for the Entergy System WSCC Draft Policy Statement on Power System Stabilizers PSEC Application Notes: Power System Stabilizer helps need plant stability margins for Simple Cycle and Combined Cycle Power Plants

APPENDIX A.D SUBSTATION CONFIGURATION WITH AND WITHOUT PID-206

JACINTO 138/230 KV PRE-PID-206
Hightower138 kV (L-887)
Series Capacitors
16525 16515 16505
16520 16510 16500
S.A.26200
Splendara138 kV (L-871)
Cleveland138 kV (L-579)
Shepherd138 kV (L-418)
Jacinto 138 kV Substation
Peach Creek138 kV (L-524)
Transformer #1230/138/13.8
China230 kV (L-568)26205
Hightower138 kV (L-887)
Series Capacitors
16525 16515 16505
16520 16510 16500
S.A.26200
Splendara138 kV (L-871)
Cleveland138 kV (L-579)
Shepherd138 kV (L-418)
Jacinto 138 kV Substation
Peach Creek138 kV (L-524)
Transformer #1230/138/13.8
China230 kV (L-568)26205

JACINTO 138/230 KV POST-PID-206
Hightower138 kV (L-887)
Series Capacitors
16525 16515 16505
16520 16510 16500
S.A.26200
Splendara138 kV (L-871)
Cleveland138 kV (L-579)
New B1 New B2
New B5
G1
New B3 New B4
East
West
Shepherd138 kV (L-418)
G2
Jacinto 138 kV Substation
Peach Creek138 kV (L-524)
New Proposed Switching Station
Transformer #1230/138/13.8
PID 206
13.8 kV
~ 4 MILES
China230 kV (L-568)26205
Hightower138 kV (L-887)
Series Capacitors
16525 16515 16505
16520 16510 16500
S.A.26200
Splendara138 kV (L-871)
Cleveland138 kV (L-579)
New B1 New B2
New B5
G1G1
New B3 New B4
East
West
Shepherd138 kV (L-418)
G2G2
Jacinto 138 kV Substation
Peach Creek138 kV (L-524)
New Proposed Switching Station
Transformer #1230/138/13.8
PID 206
13.8 kV
~ 4 MILES
China230 kV (L-568)26205

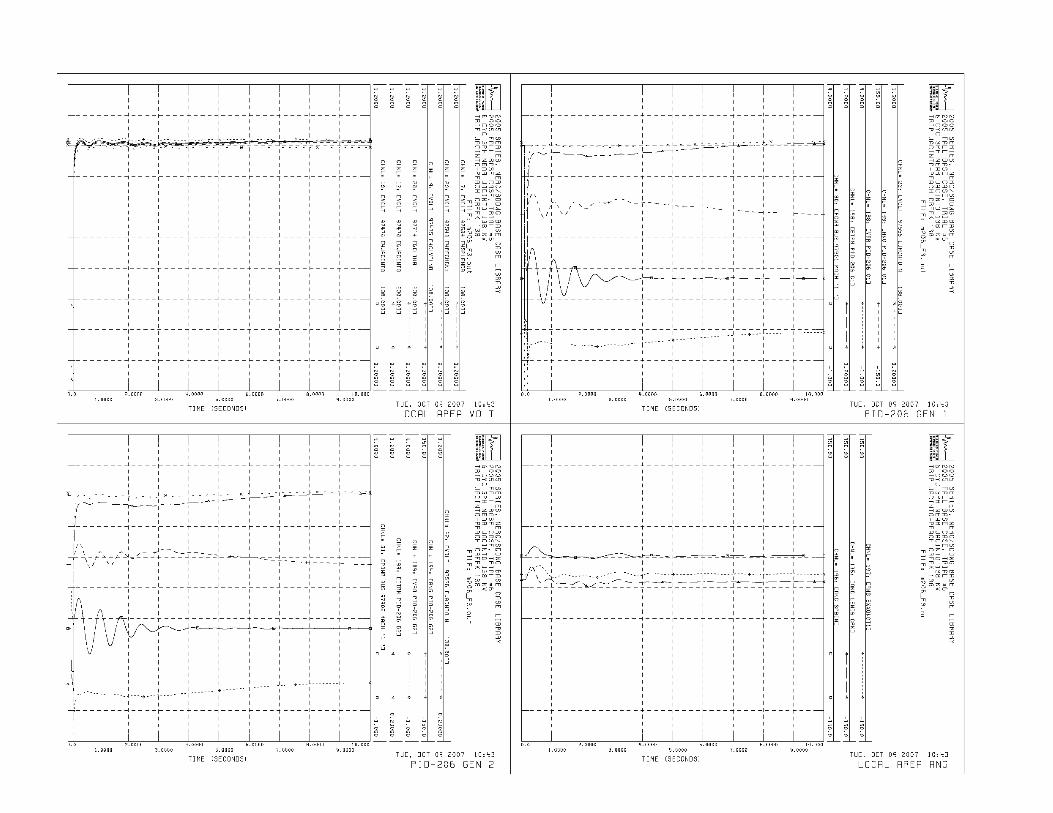
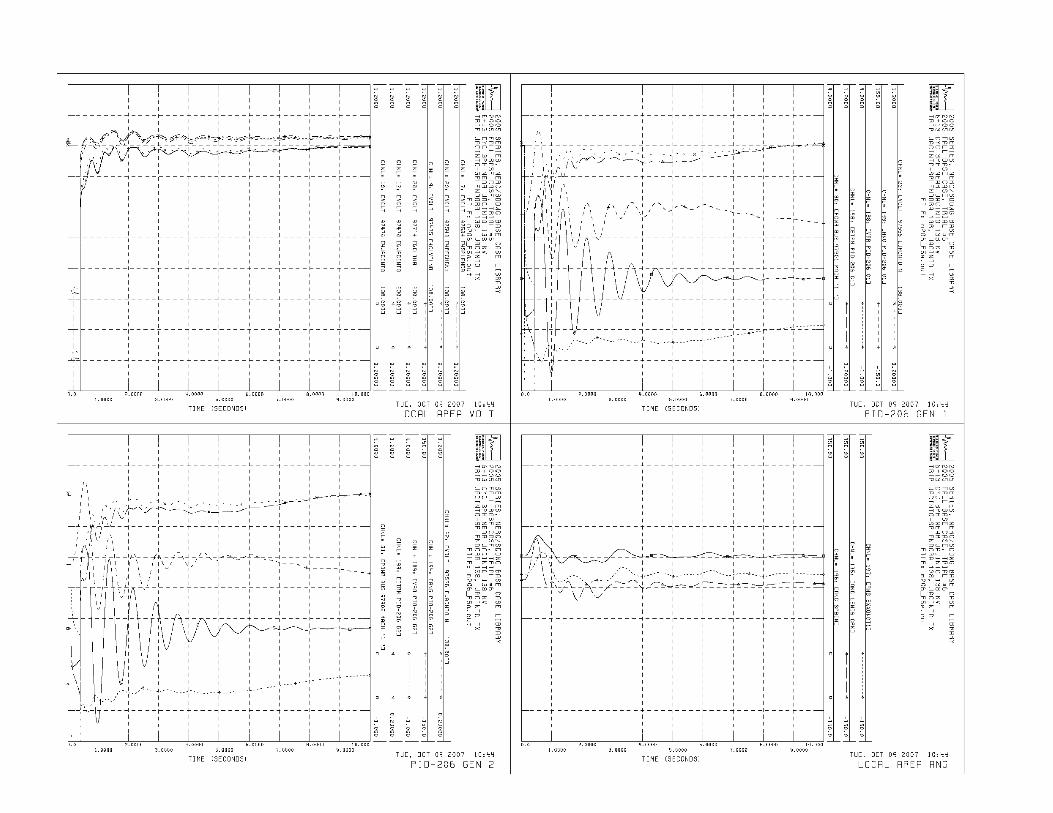
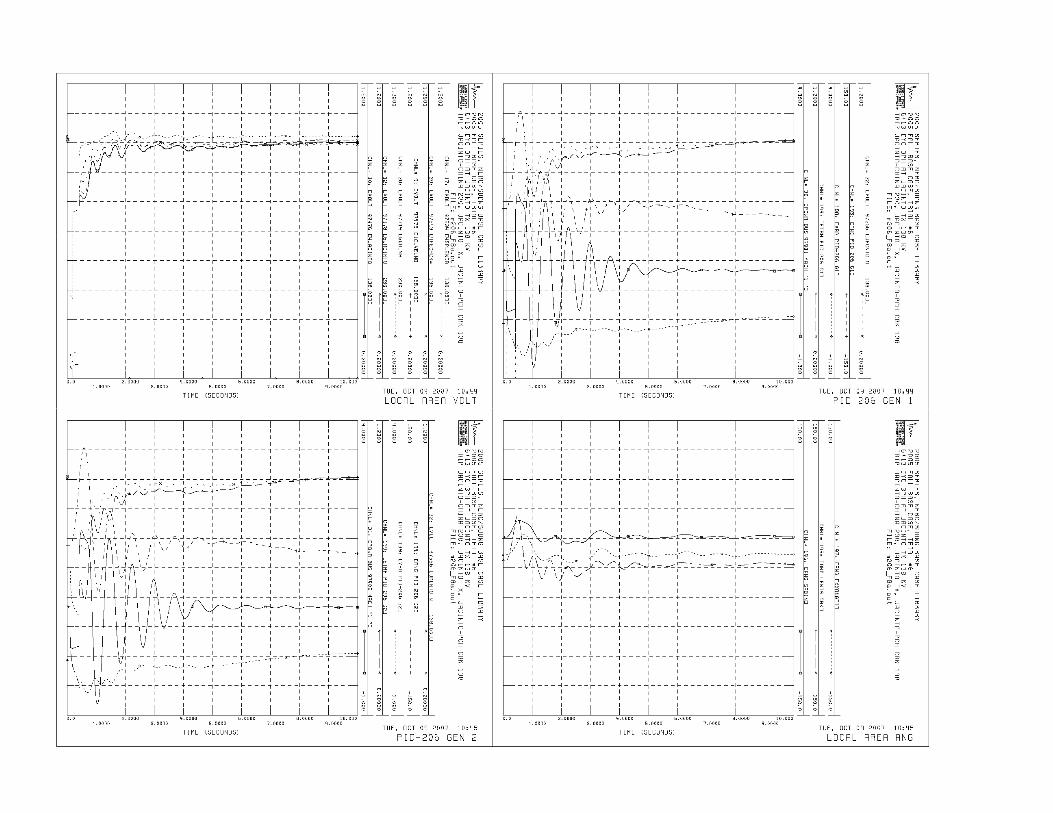
APPENDIX A.E Transient Stability DATA & Plots
Plots illustrating the results from the simulated cases have been provided.

FAULT-0 6 CYC 3PH NEAR JACINTO 138 KV TRIP PID-206 (G1 ONLY)


FAULT-0X 6 CYC 3PH NEAR JACINTO 138 KV TRIP PID-206 (G2 ONLY)


FAULT-1 6 CYC 3PH NEAR JACINTO 138 KV TRIP JACINTO-SHEPHERD 138


FAULT-2 6 CYC 3PH NEAR JACINTO 138 KV TRIP JACINTO-JACINTO 138


FAULT- 3 6 CYC 3PH NEAR JACINTO 138 KV TRIP JACINTO-PEACH CREEK 138

FAULT-4 6 CYC 3PH NEAR JACINTO 138 KV TRIP JACINTO-CLEVELAND 138


FAULT-5 6 CYC 3PH NEAR JACINTO 138 KV TRIP JACINTO-SPLENDORA 138


FAULT- 6 6 CYC 3PH NEAR JACINTO 138 KV TRIP JACINTO-HIGHTOWER 138

FAULT- 7 6 CYC 3PH NEAR JACINTO 230 KV TRIP JACINTO-CHINA 230, JACINTO TX

FAULT- 1a 6+13 CYC 3PH NEAR JACINTO 138 KV TRIP JACINTO-SHEPHERD 138, PID-206(G1 ONLY)

FAULT- 2a 6+13 CYC 3PH NEAR JACINTO 138 KV TRIP JACINTO-CLEVELAND 138, JACINTO-JACINTO N 138


FAULT- 2b 6+13 CYC 3PH NEAR JACINTO 138 KV TRIP JACINTO-JACINTO N 138, PID-206(G2 ONLY)


FAULT- 2c 6+10 CYC 3PH NEAR JACINTO 138 KV TRIP JACINTO-JACINTO N 138, PID-206(G2 ONLY)


FAULT- 3a 6+13 CYC 3PH NEAR JACINTO 138 KV TRIP JACINTO-PEACH CREEK 138, JACINTO TX


FAULT- 4a 6+13 CYC 3PH NEAR JACINTO 138 KV TRIP JACINTO-CLEVELAND 138, JACINTO-HIGHTOWER 138


FAULT- 5a 6+13 CYC 3PH NEAR JACINTO 138 KV TRIP JACINTO-SPLENDORA 138, JACINTO TX

FAULT- 6a 6+13 CYC 3PH NEAR JACINTO 138 KV TRIP JACINTO-HIGHTOWER 138, JACINTO-SPLENDORA 138


FAULT- 8a 6+13 CYC 3PH AT JACINTO TX 138 KV TRIP JACINTO-CHINA 230, JACINTO TX, JACINTO-PCH CRK 138
Related Documents