SYSTEM IMPACT STUDY FINAL REPORT 115 kV CLUSTER STUDY Prepared for: El Paso Electric Company Prepared by: TRC Engineers, LLC 1526 Cole Boulevard Building 3, Suite 150 Lakewood, CO 80401 (303) 395-4018 November 2014

Welcome message from author
This document is posted to help you gain knowledge. Please leave a comment to let me know what you think about it! Share it to your friends and learn new things together.
Transcript

SYSTEM IMPACT STUDY
FINAL REPORT
115 kV CLUSTER STUDY
Prepared for:
El Paso Electric Company
Prepared by:
TRC Engineers, LLC 1526 Cole Boulevard
Building 3, Suite 150
Lakewood, CO 80401
(303) 395-4018
November 2014
115 kV Cluster 2014 System Impact Study TRC November 2014 i
FOREWORD
This report was prepared for the project Interconnection Customer, by System Planning at El Paso
Electric Company. Any correspondence concerning this document, including technical and commercial
questions should be referred to:
David Tovar
Manager – System Planning Department
El Paso Electric Company
100 North Stanton, Loc. 751
El Paso, Texas 79901
Phone: (915) 543-4355
Fax: (915) 521-4763
or
David Gutierrez
Principal Engineer
El Paso Electric Company
100 North Stanton, Loc. 751
El Paso, Texas 79901
Phone: (915) 543-4083
Fax: (915) 521-4763

115 kV Cluster 2014 System Impact Study TRC November 2014 ii
Table of Contents
EXECUTIVE SUMMARY ......................................................................................................................................... 1
1.0 INTRODUCTION .............................................................................................................................................. 4
1.1 PERFORMANCE CRITERIA ................................................................................................................................. 4
2.0 STUDY METHODOLOGY .............................................................................................................................. 6
2.1 ASSUMPTIONS .................................................................................................................................................. 6
2.2 PROCEDURE ..................................................................................................................................................... 6
2.2.1 Development and Description of Cases ................................................................................................. 6
2.2.2 115 kV Cluster Study Generation Modeling .......................................................................................... 6
2.2.3 Contingency List .................................................................................................................................... 7
3.0 STEADY STATE POWER FLOW ANALYSIS ............................................................................................. 8
3.1 PRE-PROJECT POWER FLOW EVALUATION ....................................................................................................... 8
3.1.1 Pre-Project N-0 Flow Violations ........................................................................................................... 8
3.1.2 Pre-Project N-1 Flow Violations ........................................................................................................... 8
3.2 POST-PROJECT POWER FLOW EVALUATION ..................................................................................................... 8
3.2.1 Post-Project N-0 Power Flow Analysis ................................................................................................. 8
3.2.2 Post-Project N-1 Power Flow Analysis ................................................................................................. 8
3.3 POWER FLOW ANALYSIS CONCLUSION ............................................................................................................ 9
4.0 STEADY STATE VOLTAGE ANALYSIS ................................................................................................... 10
5.0 SHORT CIRCUIT ANALYSIS ...................................................................................................................... 11
5.1 SHORT CIRCUIT ANALYSIS MODELING .......................................................................................................... 11
5.2 SHORT CIRCUIT ANALYSIS PROCEDURE ......................................................................................................... 11
5.3 SHORT CIRCUIT ANALYSIS RESULTS AND CONCLUSION ................................................................................ 12
6.0 STABILITY ANALYSIS ................................................................................................................................. 13
6.1 DYNAMIC MODELING .................................................................................................................................... 13
6.2 STABILITY STUDY CASE DEVELOPMENT ........................................................................................................ 13
6.3 STABILITY ANALYSIS RESULTS ...................................................................................................................... 13
6.4 STABILITY ANALYSIS CONCLUSION ............................................................................................................... 14
7.0 COST ESTIMATES, ONE-LINES, & PROJECT SCHEDULE ................................................................. 16
8.0 DISCLAIMER.................................................................................................................................................. 21
9.0 CONCLUSIONS .............................................................................................................................................. 22

115 kV Cluster 2014 System Impact Study TRC November 2014 iii
List of Tables
Table 1-1: EPE and New Mexico Performance Criteria ............................................................................... 5
Table 3-1: Generator Short Circuit Modeling Data ...................................................................................... 8
Table 5-1: Generator Short Circuit Modeling Data .................................................................................... 11
Table 6-1: Stability Post-Project Case Scenarios ........................................................................................ 13
Table 6-2: Transient Stability Analysis Results for both Peak and Off-Peak Cases ................................... 15
Table 7-1: Cost Estimate by Project ........................................................................................................... 16
Table 7-2: EPE Interconnection Facilities Costs for POI Stations ............................................................. 19
Table 7-3: EPE Network Upgrade Costs for the CO70S POI Station ........................................................ 19
Table 7-4: EPE Network Upgrade Costs for the DS90S POI Station ......................................................... 20
List of Figures
Figure 7-1: CO70S POI and CO70S 115 kV Station One line ................................................................... 17
Figure 7-2: DS90S POI and DS90S 115 kV Station One line .................................................................... 18
Appendices
Appendix A ......................................................... 115 kV Cluster System Impact Study Statement of Work
Appendix B .................................................................................................... Power Flow Contingency List
Appendix C .............................................................................................................. Dynamic Modeling Data
Appendix D .............................................................................................................................. Stability Plots
Appendix E .............................................................................................. Worst Condition Analysis Results
Appendix F .......................................................................................................................... Project Schedule

115 kV Cluster 2014 System Impact Study TRC November 2014 1
115 kV Cluster System Impact Study
EXECUTIVE SUMMARY
The study objective was to determine the impact that the proposed 115 kV Cluster Study generation
would have on the El Paso Electric Company (EPE) and Southern New Mexico transmission systems.
The proposed 115 kV Cluster Study generation is comprised of a 90 MW PV solar powered project
(DS90S) interconnected between EPE’s Diablo and Santa Teresa Substations and another 70 MW PV
solar powered project (C070S) interconnected between EPE”s Chaparral and Oro Grande Substations.
The proposed Commercial Operation dates for the two projects included in this System Impact Study
(SIS) are identical, and as follows:
1. October 1, 2016 for First Unit Power Block
a. Total of 5 MW for each project (DS90S & CO70S)
2. December 1, 2016 for Entire Facilities
a. Total of 90 MW for DS90S
b. Total of 70 MW for CO70S
The only interconnection project in the EPE study queue that has an Interconnection Agreement (IA) with
EPE is the Montana Power Station. This project is currently under construction and will consist of four
(4) 105 MW gas powered units, located about 3 miles east of EPE’s Caliente Substation
The Montana Power Station has been included in the base cases for this SIS. The generation from this
project will be delivered to serve EPE native load.
The Study Areas for the analysis were limited to WECC Areas 11 - EPE and 10 - PNM.
Steady State Results
The power flow analysis was conducted for 2016 Light Winter and 2017 Heavy Summer load conditions.
The Arroyo Phase Shifter was set to regulate N-S Flows in all cases (10-25 MW under Heavy loads and
140-150 MW under Light loads).
The analysis showed that with these Network Upgrades in place, the East Cluster generation does not
have an adverse impact on the EPE and Southern New Mexico transmission systems. The power flow
analysis results showed that the addition of 115 kV Cluster generation would not require any Network
Upgrades other than the 115 kV switching stations to allow for the 2 interconnections.
Short Circuit Results
A short circuit analysis was performed to determine if the addition of the 115 kV Cluster Study
generation would cause any of the EPE or Southern New Mexico transmission system’s existing
substation circuit breakers to exceed their interrupting capability ratings.
The results of this short circuit study show that the maximum fault currents after the 115 kV Cluster
generation is placed in service did not exceed the breaker interrupting capability at any substation on the
EPE or Southern New Mexico transmission system.

115 kV Cluster 2014 System Impact Study TRC November 2014 2
Stability Results
Transient System stability was analyzed for faults relevant to the DS90S & CO70S Study Areas under
heavy and light load conditions. The stability results showed that the addition of the new generation
projects does not cause any adverse impacts to the system stability performance in the Study Area.
Cost Estimates and Schedule
Good faith cost estimates are presented. The cost estimates are in 2014 dollars (no escalation applied)
and are based upon typical construction costs for previously performed similar construction. These costs
include all estimated applicable labor and overheads associated with the engineering, design, and
construction of these new EPE facilities. These estimates did not include the Generator Interconnection
Costs1 for any other Interconnection Customer owned equipment or associated design and engineering
except for the Point of Interconnection (POI) facilities.
The estimated total cost for the required upgrades is $5.16 Million for each project (both CO70S and
DS90S) in the 115 kV Cluster. This breaks down to $0.27 Million for the EPE Interconnection Costs2
at the POI and $4.89 Million for Network Upgrade Costs3 for both 115 kV Cluster projects.
Generator Interconnection Costs have not been estimated as part of this study. Table 0-1 details the cost
per year.
Table 0-0-1: Cost Estimate by Project
Project Item
EPE
Interconnection
Network
Upgrade
Cost
Interconnection
plus Network
Upgrades Totals
Cost (in
millions) (in millions)
(in millions)
CO70S CO70S Interconnection
Station Construction $0.27 $4.89 $5.16
Subtotal CO70S $ 5.16 M
DS90S DS90S Interconnection
Station Construction $0.27 $4.89 $5.16
Subtotal DS90S $ 5.16 M
The estimated time frame for Engineering, Procurement, and Construction of Network Upgrades is
approximately 19 months upon notice to proceed with construction from the Interconnection Customers.
1 Generator Interconnection Costs: cost of facilities paid for by Interconnection Customer and owned and
operated by the Interconnection Customer from the generator facilities to the Change of Ownership Point, which
is typically on the first dead-end at the Point of Interconnection substation. Not subject to transmission credits.
2 EPE Interconnection Costs: cost of facilities paid for by Interconnection Customer but owned and operated by
EPE from the Change of Ownership Point to the Point of Interconnection. Not subject to transmission credits.
3 Network Upgrades Costs: cost of facilities from the Point of Interconnection outward, paid for by the
interconnector but owned and operated by EPE. Subject to transmission credits

115 kV Cluster 2014 System Impact Study TRC November 2014 3
Conclusion
This System Impact Study shows that the proposed 115 kV Cluster generation will NOT have an adverse
impact on the EPE and Southern New Mexico transmission systems.

115 kV Cluster 2014 System Impact Study TRC November 2014 4
1.0 INTRODUCTION
EPE requires that a SIS be performed for generation facilities desiring to connect to the El Paso Electric
Transmission System. Since both Interconnection Requests for this 115 kV Cluster Study (2014) have
proposed a 115 kV Point of Interconnect (POI),and thus, this SIS was completed to determine any
possible impacts the combined 160 MW of proposed generation from the two projects would have on
EPE’s Transmission System.
The proposed Commercial Operation dates for these two projects are identical, and as follows:
1. October 1, 2016 for First Unit Power Block
a. Total of 5 MW for each project (DS90S & CO70S)
2. December 1, 2016 for Entire Facilities
a. Total of 90 MW for DS90S
b. Total of 70 MW for CO70S
1.1 Performance Criteria
The Study was performed in accordance with Western Electricity Coordinating Council (WECC), North
American Electric Reliability Corporation (NERC), and EPE standards. The EPE local reliability
standards can be found in Section 4 of EPE’s FERC Form No. 715. The steady state and stability analysis
was performed using GE’s PSLF Version 18.1 power flow software program.
Transformer tap and phase-shifting transformer angle movement, as well as static VAR device switching,
were allowed for the steady state pre-contingency analysis. All regulating equipment such as transformer
controls and switched shunts were fixed at pre-contingency positions when the contingency analysis was
performed. All facility loadings, as well as voltages 69 kV and greater, were monitored within the El
Paso and New Mexico control areas.
Pre-contingency and Post-contingency flows on lines and transformers were required to remain at or
below the normal rating, while post-contingency flows on lines and transformers were required to remain
at or below the emergency rating. Flows above 100% of an element’s pre- or post-contingency rating
were considered violations.
Post-project voltage criteria violations that either exacerbate or improve an existing pre-project violation
were not considered an adverse impact to the system.
The performance criteria utilized in qualifying violations in the study area are shown in Table 1-1.

115 kV Cluster 2014 System Impact Study TRC November 2014 5
Table 1-1: EPE and New Mexico Performance Criteria
* Taiban Mesa and Guadalupe 345 kV bus voltage must be between 0.95 and 1.10 p.u. under normal and
contingency conditions.
** For PNM buses in southern New Mexico the allowable N-1 voltage drop is 7%.
*** Provided operator action can be utilized to adjust voltages back down to 1.05
Area Conditions Loading Limits Voltage (p.u.) Voltage
Drop
Application
EPEC
Normal Normal Rating
0.95 - 1.05 69kV and above
0.95 - 1.10 Artesia 345 kV
0.95 - 1.08 Arroyo 345 kV PST source side
0.90 - 1.05 Alamo, Sierra Blanca and Van
Horn 69kV
Contingency Emergency
Rating
0.925 - 1.05 7% 60 kV to 115 kV
0.95 - 1.07 7% Artesia 345kV
0.95 - 1.08 7% Arroyo 345kV PST source side
0.90 - 1.05 Alamo, Sierra Blanca and Van
Horn 69kV
0.95 - 1.05 7% Hidalgo, Luna, or other 345 kV
buses
PNM
Normal ALIS Normal Rating 0.95-1.05 46 kV and above*
Contingency
N-1
Emergency
Rating
0.925-1.08*** 6 %** 46 kV to 115 kV
0.90 – 1.08*** 6 %** 230 kV and above
Contingency
N-2
Emergency
Rating 0.90-1.08*** 10 % 46 kV and above*
Tri-
State
Normal ALIS Normal Rating 0.95-1.05 All buses
Contingency
N-1
Emergency
Rating
0.90 – 1.10 6 %
Tri-State buses in the PNM
Service Area (list provided by Tri-
State)
0.90-1.10 7 %
Tri-State buses in southern and
northeastern New Mexico (list
provided by Tri-State)
Contingency
N-2
Emergency
Rating
0.90-1.10 10% All buses

115 kV Cluster 2014 System Impact Study TRC November 2014 6
2.0 STUDY METHODOLOGY
2.1 Assumptions
The following assumptions are consistent for all study scenarios unless otherwise noted.
This study assumed that all system expansion projects as planned by area utilities by the year
under analysis are completed, and that any system improvements required by the interconnections
senior to the 115 kV Cluster Study generation are implemented.
This study did not analyze any transmission service from the interconnection point to any specific
point on the grid for the interconnections senior to the 115 kV Cluster Study generation.
2.2 Procedure
The analyses in this study included Steady State, Transient Stability, and Short Circuit Breaker Analysis
as stated in the 115 kV Cluster Study SIS Statement of Work in Appendix A. A description of the
procedures used to complete the analyses is presented below.
2.2.1 Development and Description of Cases
Two benchmark cases without the proposed 115 kV Cluster Study generation were created using 2017
Heavy Summer (Peak) and 2016 Light Winter (Off Peak) load scenarios. The combined 160 MWs of
Solar Cluster generation was then modeled as being dispatched to serve EPE system native load in post
project cases under the same two load scenarios.
The Arroyo Phase Shifter was modeled to provide 10-20 MW N-S flow under peak load conditions and
140-150 MW N-S flow during the off peak load conditions.
The Montana Power Station project was included in both benchmark cases.
This project is currently under construction and will consist of four (4) 105 MW gas powered units
located about 3 miles east of Caliente Substation. The generation from the Montana Power Station
project will be delivered to serve native EPE load.
2.2.2 115 kV Cluster Study Generation Modeling
The 115 kV Cluster generation consists of two (2) Photo Voltaic (PV) Solar installations located on
separate sides of EPE’s service territory.
The first PV installation plans to interconnect at a new 115 kV tap between the Santa Teresa and Diablo
Substations. It would be located about 2 miles southeast of the Santa Teresa Station. The requested
maximum output of this project is 90 MW. This project would be comprised of 24 PV inverters each
producing approximately 4 MW when at full output.
Similarly, the second PV installation plans to interconnect at a new 115 kV tap between the Oro Grande
and Chaparral Substations. It would be located about 10 miles northeast of the Chaparral Station. This
project would use the same 4 MW inverters as the first PV installation, but this second installation would
only consist of 18 inverters to produce a maximum requested output of 70 MW when at full output.

115 kV Cluster 2014 System Impact Study TRC November 2014 7
The PV inverters proposed for both projects are expected to produce 4.141 MW at 0.55 kV. This initial
voltage would be immediately stepped up to a 34.5 kV collector system voltage planned for both PV
installations. A 115/34.5 kV transformer at each of the proposed projects’ new buses would then step up
the collector system voltage to the 115 kV EPE Transmission System voltage.
2.2.3 Contingency List
All outages (69 kV and above with EPE) were modeled in the subsystem files. The list of contingencies
used in this study can be found in Appendix B. Based on engineering judgment, these contingencies were
selected to represent a good cross section of potential contingencies that would stress the EPE and PNM
southern New Mexico systems. This study was performed for N-0 and N-1 conditions.

115 kV Cluster 2014 System Impact Study TRC November 2014 8
3.0 STEADY STATE POWER FLOW ANALYSIS
3.1 Pre-Project Power Flow Evaluation
Peak and off peak base cases were evaluated for thermally overloaded facilities under both normal and
contingency conditions prior to the addition of the 115 kV Cluster generation.
3.1.1 Pre-Project N-0 Flow Violations
Power flow study analysis results showed no overloaded transmission facilities were present in the El
Paso Electric (EPE) and Public Service Company of New Mexico (PNM) areas under non-contingency
system conditions prior to the addition of the East Cluster generation.
3.1.2 Pre-Project N-1 Flow Violations
Power flow contingency analysis results show a few overloads existed in El Paso and New Mexico areas
prior to the addition of the 115 kV Cluster generation. Table 3-1 shows the N-1 pre-project overloads in
the final study cases.
Table 3-1: Generator Short Circuit Modeling Data
From Bus
kV
To Bus
kV
ID
Area
Rating
(MVA)
Contingency
2016lw 2017hs
% of Emergency
Rating
TURQUOIS 115 HIDALGO 115 1 11 140.0 LUNA 345/115 kV
TRAN 103.0 106.0
TURQTAP 69 TYRONE 69 1 11 100.0 MD-TURQUOISE
115 kV 100.9 103.3
LORDSBRG 115 LORDSBRG 69 1 11 134.0 HIDALGO-
TURQUOISE 115 kV 87.7 103.9
3.2 Post-Project Power Flow Evaluation
This section provides a high-level understanding of the 115 kV Cluster impact on the loading of
transmission lines and transformers in the Study Area. The analysis was performed under both normal
and contingency conditions.
3.2.1 Post-Project N-0 Power Flow Analysis
Power flow study results for the EPE and PNM areas showed that the 115 kV Cluster projects did not
cause any power flow violations under non-contingency system conditions.
3.2.2 Post-Project N-1 Power Flow Analysis
The contingency list described in Section 2.2.3 was used to test projects DS90S and CO70S under N-1
conditions. The power flow study results for the EPE and PNM areas showed that projects did not cause
any power flow violations under contingency system conditions.

115 kV Cluster 2014 System Impact Study TRC November 2014 9
3.3 Power Flow Analysis Conclusion
The analysis showed that the addition of the 115kV Cluster generation to the system would not cause any
thermal overloads on the EPE or New Mexico transmission systems.

115 kV Cluster 2014 System Impact Study TRC November 2014 10
4.0 STEADY STATE VOLTAGE ANALYSIS
Bus voltages within the Study Area were evaluated under both normal and contingency conditions, with
and without the 115kV Cluster generation in service. The Performance Criteria shown in Error!
Reference source not found. were considered when analyzing bus voltages for violations.
The voltage analysis results showed that after the addition of the 115kV Cluster generation the Study area
transmission network voltages stayed within criteria limits, and did not significantly change from the pre-
project voltage levels.

115 kV Cluster 2014 System Impact Study TRC November 2014 11
5.0 SHORT CIRCUIT ANALYSIS
A short circuit analysis was performed to determine if the addition of the 115 kV Cluster generation to the
EPE transmission system would cause any of EPE’s transmission system’s existing substation circuit
breakers to exceed their interrupting capability ratings.
5.1 Short Circuit Analysis Modeling
Pre-project and Post-project cases were developed to perform this analysis. As mentioned, any planned
or proposed third party generation listed in EPE’s study queue ahead of 115 kV Cluster generation was
also modeled in the cases. The generator and collector system impedance data used in the study is shown
in Table 5-1.
This analysis evaluated the impact of the DS90S & CO70S generation by comparing the pre- and post-
project fault current levels at selected buses.
Table 5-1: Generator Short Circuit Modeling Data
Project
Total
Output
(MW)
Interconnection Customer
GSU
Unit
ID
Pmax
(MW)
Qmax
(MVAR)
Qmin
(MVAR)
Z sub-
transient
Rating
(MVA)
Voltage
(kV)
Z
Sub-
transient
DS90S 99 1 99 27.8 -27.8 0.000
+j0.9 100 115/34.5
0.00261
+j0.09143
CO70S 74 1 105 20.9 -20.9 0.000
+j0.9 78 115/34.5
0.00299+j0.
0899
5.2 Short Circuit Analysis Procedure
The initial short circuit analysis was performed with all other third-party generation projects ahead of the
115 kV Cluster generation in the study queue in service and 115 kV Cluster generation out of service.
This identified the “base case” fault duties of the circuit breakers. The short circuit analysis was
performed again with 115 kV Cluster generation in service.
Three phase, two phase, and single-phase line-to-ground faults were simulated at selected buses in the
EPE system with terminal voltages at 69 kV and above. EPE also requested faults on all transformer
tertiary buses. ASPEN One Liner and Batch Short Circuit Module were used to perform the short circuit
analysis. The short circuit fault analyses were performed with the following settings:
Transmission line G+jB ignored.
Shunts with positive sequence impedance ignored.
Transformer line shunts ignored
The pre-fault voltage was calculated using a Flat bus voltage of 1.05 per unit.
Fault currents within the EPE System where analyzed before and after the addition of the 115 kV Cluster
projects. These scenarios were compared against the smallest breaker interruption ratings at each
substation to determine whether any breaker was overdutied under pre-project or post-project conditions.

115 kV Cluster 2014 System Impact Study TRC November 2014 12
5.3 Short Circuit Analysis Results and Conclusion
The results of this short circuit study showed that DS90S and CO70S would have only minor impacts to
the fault currents on the EPE and Southern New Mexico system. The study also showed that the fault
currents produced by the Cluster generation will not exceed the interrupting capability of any existing or
proposed circuit breakers on the EPE or Southern New Mexico system.
115 kV Cluster 2014 System Impact Study TRC November 2014 13
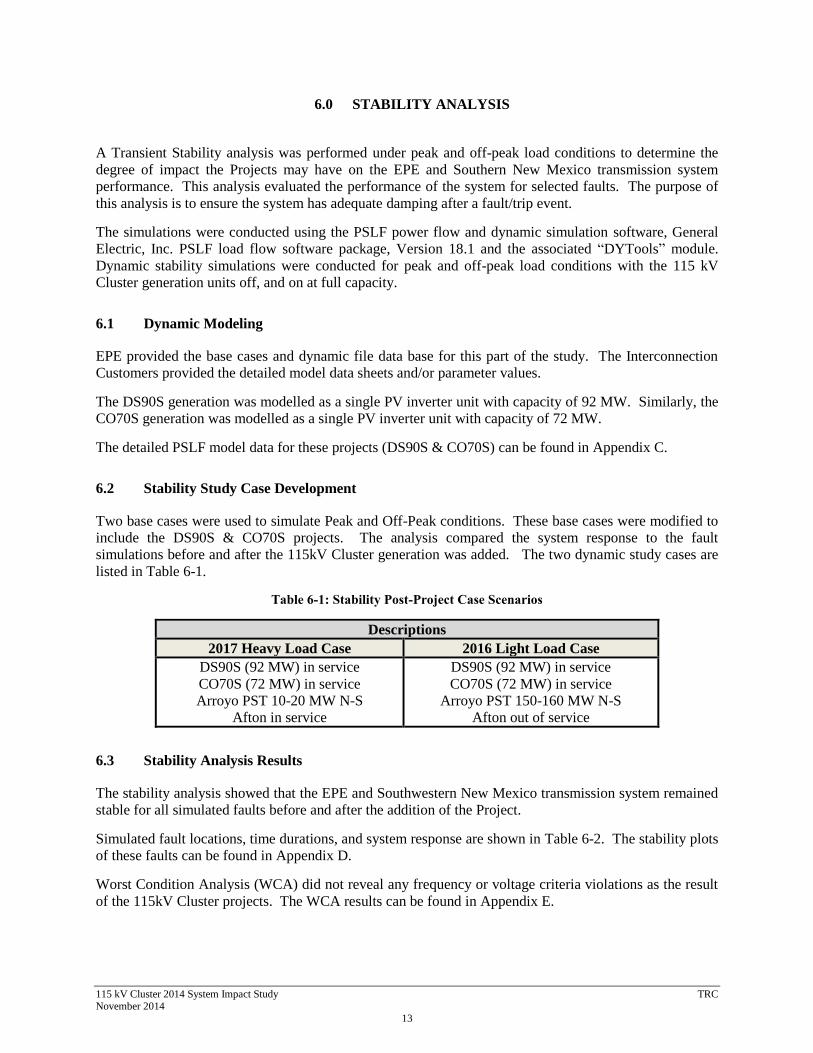
6.0 STABILITY ANALYSIS
A Transient Stability analysis was performed under peak and off-peak load conditions to determine the
degree of impact the Projects may have on the EPE and Southern New Mexico transmission system
performance. This analysis evaluated the performance of the system for selected faults. The purpose of
this analysis is to ensure the system has adequate damping after a fault/trip event.
The simulations were conducted using the PSLF power flow and dynamic simulation software, General
Electric, Inc. PSLF load flow software package, Version 18.1 and the associated “DYTools” module.
Dynamic stability simulations were conducted for peak and off-peak load conditions with the 115 kV
Cluster generation units off, and on at full capacity.
6.1 Dynamic Modeling
EPE provided the base cases and dynamic file data base for this part of the study. The Interconnection
Customers provided the detailed model data sheets and/or parameter values.
The DS90S generation was modelled as a single PV inverter unit with capacity of 92 MW. Similarly, the
CO70S generation was modelled as a single PV inverter unit with capacity of 72 MW.
The detailed PSLF model data for these projects (DS90S & CO70S) can be found in Appendix C.
6.2 Stability Study Case Development
Two base cases were used to simulate Peak and Off-Peak conditions. These base cases were modified to
include the DS90S & CO70S projects. The analysis compared the system response to the fault
simulations before and after the 115kV Cluster generation was added. The two dynamic study cases are
listed in Table 6-1.
Table 6-1: Stability Post-Project Case Scenarios
Descriptions
2017 Heavy Load Case 2016 Light Load Case
DS90S (92 MW) in service
CO70S (72 MW) in service
Arroyo PST 10-20 MW N-S
Afton in service
DS90S (92 MW) in service
CO70S (72 MW) in service
Arroyo PST 150-160 MW N-S
Afton out of service
6.3 Stability Analysis Results
The stability analysis showed that the EPE and Southwestern New Mexico transmission system remained
stable for all simulated faults before and after the addition of the Project.
Simulated fault locations, time durations, and system response are shown in Table 6-2. The stability plots
of these faults can be found in Appendix D.
Worst Condition Analysis (WCA) did not reveal any frequency or voltage criteria violations as the result
of the 115kV Cluster projects. The WCA results can be found in Appendix E.

115 kV Cluster 2014 System Impact Study TRC November 2014 14
6.4 Stability Analysis Conclusion
The study area remains stable and well damped for all the faults analyzed. The addition of the 115 kV
Cluster projects does not pose any concern to system stability performance.

115 kV Cluster 2014 System Impact Study TRC November 2014 15
Table 6-2: Transient Stability Analysis Results for both Peak and Off-Peak Cases
2014 SIS – MO420G 105 MW Output Results
Name Fault
Location Event Description Clearing (cycles)
2016 Light Load 2017Peak Load
Projects
Off
Projects
On
Projects
Off
Projects
On Tran1 Newman Three Phase fault at Newman 345 kV bus. Newman 345/115 kV tran. = 4.0 Stable Stable* Stable Stable* Tran2 Newman Three Phase fault at Newman 115 kV bus. Newman 345/115 kV tran. = 4.0, Stable Stable* Stable Stable* Tran3 Caliente Three Phase fault at Caliente 345 kV bus. Caliente 345/115 kV tran. = 4.0, Stable Stable* Stable Stable*
Line1 Caliente Three Phase fault at Caliente 345 kV bus. Caliente 345 kV = 4.0, Amrad 345 kV = 4.0 Stable Stable* Stable Stable* Line2 Caliente Three Phase fault at Caliente 345 kV bus. Caliente 345 kV = 4.0, Picante 345 kV = 4.0 Stable Stable* Stable Stable* Line3 Picante Three Phase fault at Picante 345 kV bus. Picante 345 kV = 4.0, Caliente 345 kV = 4.0 Stable Stable* Stable Stable* Line4 Newman Three Phase fault at Newman 345 kV bus. Newman 345 kV = 4.0, Picante 345 kV = 4.0 Stable Stable* Stable Stable* Line5 Picante Three Phase fault at Picante 345 kV bus. Picante 345 kV = 4.0, Newman 345 kV = 4.0 Stable Stable* Stable Stable* Line6 Newman Three Phase fault at Newman 345 kV bus. Newman 345 kV = 4.0, Afton 345 kV = 4.0 Stable Stable* Stable Stable* Line7 Afton Three Phase fault at Afton 345 kV bus. Newman 345 kV = 4.0, Afton 345 kV = 4.0 Stable Stable* Stable Stable* Line8 Newman Three Phase fault at Newman 345 kV bus. Newman 345 kV = 4.0, Arroyo 345 kV = 4.0 Stable Stable* Stable Stable* Line9 Diablo Three Phase fault at Diablo 345 kV bus. Diablo 345 kV = 4.0, Luna 345 kV = 4.0 Stable Stable* Stable Stable* Line10 Newman Three Phase fault at Newman 115 kV bus. Newman 115 kV = 4.0, Chaparral 115 kV = 4.0 Stable Stable* Stable Stable* Line11 Chaparral Three Phase fault at Chaparral 115 kV bus. Newman 115 kV = 4.0, Chaparral 115 kV = 4.0 Stable Stable* Stable Stable* Line12 Santa Teresa Three Phase fault at Santa Teresa 115 kV bus. Santa Teresa 115 kV = 4.0, DS90S POI 115 kV = 4.0 Stable Stable* Stable Stable* Line13 DS90S POI Three Phase fault at DS90S POI 115 kV bus. Santa Teresa 115 kV = 4.0, DS90S POI 115 kV = 4.0 Stable Stable* Stable Stable* Line14 NW2 Three Phase fault at NW2 115 kV bus. NW2 115 kV = 4.0, DS90S POI 115 kV = 4.0 Stable Stable* Stable Stable* Line15 DS90S POI Three Phase fault at DS90S POI 115 kV bus. NW2 115 kV = 4.0, DS90S POI 115 kV = 4.0 Stable Stable* Stable Stable* Line16 Chaparral Three Phase fault at Chaparral 115 kV bus. Chaparral 115 kV = 4.0, CO70S POI 115 kV = 4.0 Stable Stable* Stable Stable* Line17 CO70S POI Three Phase fault at CO70S POI 115 kV bus. Chaparral 115 kV = 4.0 CO70S POI 115 kV = 4.0 Stable Stable* Stable Stable* Line18 CO70S POI Three Phase fault at Oro CO70S 115 kV bus. Oro Grande 115 kV = 4.0, CO70S POI 115 kV = 4.0 Stable Stable* Stable Stable* Line19 Oro Grande Three Phase fault at Oro Grande 115 kV bus. Oro Grande 115 kV = 4.0, CO70S POI 115 kV = 4.0 Stable Stable* Stable Stable*
Gen1 DS90S Unit No Fault DS90S unit Trip DS90S unit Trip = 4.0 (loss of project) N/A Stable* N/A Stable* Gen2 CO70S Unit No Fault CO70S unit Trip CO70S unit Trip = 4.0 (loss of project) N/A Stable* N/A Stable*
Note: Stable - System response stable; Stable* - System response stable and Cluster PV generation units stayed in service.

115 kV Cluster 2014 System Impact Study TRC November 2014 16
7.0 COST ESTIMATES, ONE-LINES, & PROJECT SCHEDULE
Good faith cost estimates are presented. The cost estimates are in 2014 dollars (no escalation applied)
and are based upon typical construction costs for previously performed similar construction. These costs
include all estimated applicable labor and overheads associated with the engineering, design, and
construction of these new EPE facilities. These estimates did not include the Generator Interconnection
Costs4 for any other Interconnection Customer owned equipment or associated design and engineering
except for the Point of Interconnection (POI) facilities.
The estimated total cost for the required upgrades is $5.16 Million for each project (both CO70S and
DS90S) in the 115 kV Cluster. This breaks down to $0.27 Million for the EPE Interconnection Costs5
at the POI and $4.89 Million for Network Upgrade Costs6 for both 115 kV Cluster projects.
Generator Interconnection Costs have not been estimated as part of this study. Table 7-1 details the
estimated costs.
Table 7-1: Cost Estimate by Project
Project Item
EPE
Interconnection
Cost
(in millions)
Network
Upgrade
Cost
(in
millions)
Interconnection
plus Network
Upgrades
(in millions)
Totals
CO70S CO70S Interconnection
Station Construction $0.27 $4.89 $5.16
Subtotal CO70S $ 5.16 M
DS90S DS90S Interconnection
Station Construction $0.27 $4.89 $5.16
Subtotal DS90S $ 5.16 M
The one-lines seen in Figure 7-1 and Figure 7-2 show the POI substations equipment with a color coded
cost responsibility breakdown.
4 Generator Interconnection Costs: cost of facilities paid for by Interconnection Customer and owned and
operated by the Interconnection Customer from the generator facilities to the Change of Ownership Point, which
is typically on the first dead-end at the Point of Interconnection substation. Not subject to transmission credits.
5 EPE Interconnection Costs: cost of facilities paid for by Interconnection Customer but owned and operated by
EPE from the Change of Ownership Point to the Point of Interconnection. Not subject to transmission credits.
6 Network Upgrades Costs: cost of facilities from the Point of Interconnection outward, paid for by the
interconnector but owned and operated by EPE. Subject to transmission credits

115 kV Cluster 2014 System Impact Study TRC November 2014 17
Figure 7-1: CO70S POI and CO70S 115 kV Station One line
115 kV
To
Oro Grande
Existing Chaparral to Oro
Grande 115 kV line
To
Chaparral
9.6 miles
24.8 miles
115 kV
M
Color Code Network Upgrades Existing Facilities EPE Interconnection Facilities Located at POI Interconnection Customer Equipment
CO70S
70 MW
CO70S
Substation

115 kV Cluster 2014 System Impact Study TRC November 2014 18
Figure 7-2: DS90S POI and DS90S 115 kV Station One line
115 kV
To
Santa Teresa
Existing Diablo/NW2 to Santa
Teresa 115 kV line
To
Diablo
5.7 miles
2.0 miles
115 kV
M
Color Code Network Upgrades Existing Facilities EPE Interconnection Facilities Located at POI Interconnection Customer Equipment
DS90S
90 MW
DS90S
Substation
1.5 miles

115 kV Cluster 2014 System Impact Study TRC November 2014 19
The substations will be identical for each 115 kV Cluster project, so the installation costs for CO70S and
DS90S are also same. Table 7-2 through
Table 7-4 provide a more detailed breakdown of the POI substation construction costs, which are the
same for each interconnection project. The Project Schedule in Appendix F provides a more detailed
breakdown of the estimated time for Engineering, Procurement, Construction and Commissioning.
Table 7-2: EPE Interconnection Facilities Costs for POI Stations
(CO70S & DS90S Costs are Identical)
Element Description Cost Est.
Millions
DS90S POI
Or
CO70S POI
EPE Interconnection Facilities located at CO70S POI or DS90S
POI
One 115 kV 2000 A disconnect switch w/ grounding
One set of CCVT’s and Structures
Three Lightning arresters and Structures
One Set of 115 kV 3-Phase Metering Units and structures
Relaying, communication, and testing
$0.27
Estimated Time Frame for Engineering, Procurement, Construction,
and Commissioning
19 Months
Table 7-3: EPE Network Upgrade Costs for the CO70S POI Station
Element Description Cost Est.
Millions
CO70S POI
115 kV
Substation
Build a new 115 kV three breaker in a Breaker and a
Half Scheme Substation. The new equipment
required includes:
Three 115 kV 3000 A circuit breakers
Six 115 kV 2000 A disconnect switches
Two 115 kV 2000 A line disconnect switches
w/ grounding
Six sets of CCVT’s and Structures
Six Lightning arresters and Structures
Three sets of Transmission Line Dead-end
Assemblies for Substation Dead-end
One lot 115 kV bus, insulators, and structural
supports
One lot Transmission line relaying, SCADA,
communication, and testing
One lot ground grid, misc. grounding,
concrete, conduit, cable trench, and fencing
Relay Setting Changes will also be needed at
Chaparral and Oro Grande
$4.89
Estimated Time Frame for Engineering,
Procurement, Construction, and Commissioning
24
Months

115 kV Cluster 2014 System Impact Study TRC November 2014 20
Table 7-4: EPE Network Upgrade Costs for the DS90S POI Station
Element Description Cost Est.
Millions
DS90S POI
115 kV
Substation
Build a new 115 kV three breaker in a Breaker and a
Half Scheme Substation. The new equipment
required includes:
Three 115 kV 3000 A circuit breakers
Six 115 kV 2000 A disconnect switches
Two 115 kV 2000 A line disconnect switches
w/ grounding
Six sets of CCVT’s and Structures
Six Lightning arresters and Structures
Three sets of Transmission Line Dead-end
Assemblies for Substation Dead-end
One lot 115 kV bus, insulators, and structural
supports
One lot Transmission line relaying, SCADA,
communication, and testing
One lot ground grid, misc. grounding,
concrete, conduit, cable trench, and fencing
Relay Setting Changes will also be needed at
Diablo and Santa Teresa (and possibly the new
Verde Station)7
$4.89
Estimated Time Frame for Engineering,
Procurement, Construction, and Commissioning
24
Months
7 A new Verde Substation between the Diablo and Santa Teresa stations was scheduled to be in-service in May 2016
but has been delayed until May 2017. The relay setting changes required due to the DS90S project will vary based
on the COD of both the Verde Substation and the DS90S project.

115 kV Cluster 2014 System Impact Study TRC November 2014 21
8.0 DISCLAIMER
If any of the project data provided by Interconnection Customer and used in this study varies significantly
from the actual data of the installed generation equipment for both DS90S & CO70S, the results from this
study will need to be verified with the actual data at the Project Interconnection Customer's expense.
Additionally, any change in the generation in EPE’s Interconnection Queue that is senior to the 115 kV
Cluster generation may require a re-evaluation of this Study.

115 kV Cluster 2014 System Impact Study TRC November 2014 22
9.0 CONCLUSIONS
This 115 kV Cluster System Impact Study, consisting of a Steady State, Short Circuit and Stability
Analysis, for a net 160 MW of generation interconnecting on the EPE transmission systems, has
demonstrated that the 115 kV Cluster generation will NOT have an adverse impact on the EPE and
Southern New Mexico transmission, and no Network Upgrades are required.
The estimated cost for integrating both 115 kV Cluster generation projects onto the EPE and Southern
New Mexico transmission systems is $10.32 Million. This breaks out to $5.16 Million for DS90S and
$5.16 Million for CO70S.
The good faith estimate of the time frame to Engineer, Procure, and Construct all facilities is 19 months
for each POI switching station.

TRC 115 kV Cluster System Impact Study November 2014
Appendix A
Appendix A 115 kV Cluster System Impact Study
Statement of Work


TRC 115 kV Cluster System Impact Study November 2014
Appendix B
Appendix B Contingency List

CONTINGENCY LIST Transmission Lines
1. ALA_5 115.0 to ORO_GRAN 115.0 Circuit 1
2. AMRAD 115.0 to LARGO 115.0 Circuit 1
3. AMRAD 345.0 to ARTESIA 345.0 Circuit 1
4. ANTHONY 115.0 to BORDER 115.0 Circuit 1
5. ANTHONY 115.0 to MONTOYA 115.0 Circuit 1
6. ANTHONY 115.0 to NEWMAN 115.0 Circuit 1
7. ANTHONY 115.0 to SALOPEK 115.0 Circuit 1
8. ASCARATE 115.0 to COPPER 115.0 Circuit 1
9. ASCARATE 115.0 to RIVERENA 115.0 Circuit 1
10. AUSTIN_N 115.0 to MARLOW 115.0 Circuit 1
11. AUSTIN_N 115.0 to MARLOW 115.0 Circuit 2
12. BUTERFLD 115.0 to FT._BLIS 115.0 Circuit 1
13. CALIENTE 115.0 to LANE___# 115.0 Circuit 1
14. CALIENTE 115.0 to VISTA__# 115.0 Circuit 1
15. CALIENTE 345.0 to AMRAD 345.0 Circuit 1
16. CHAPARAL 115.0 to ORO_GRAN 115.0 Circuit 1
17. COPPER 115.0 to LANE___# 115.0 Circuit 1
18. COPPER 115.0 to PENDALE 115.0 Circuit 1
19. COYOTE 115.0 to CALIENTE 115.0 Circuit 1
20. COYOTE 115.0 to RGC_DC 115.0 Circuit 1
21. CROMO 115.0 to RIO_GRAN 115.0 Circuit 1
22. DIABLO 115.0 to RIO_GRAN 115.0 Circuit 1
23. DIABLO 115.0 to RIO_GRAN 115.0 Circuit 2
24. DIABLO 115.0 to INSURG 115.0 Circuit 1
25. DYER 115.0 to AUSTIN_N 115.0 Circuit 1
26. DYER 115.0 to SHEARMAN 115.0 Circuit
27. BIGGS 115.0 to GR 115.0 Circuit 1
28. FT._BLIS 115.0 to AUSTIN_N 115.0 Circuit 1
29. GR 115.0 to VISTA__# 115.0 Circuit 1
30. HATCH 115.0 to JORNADA 115.0 Circuit 1
31. HOLLOMAN 115.0 to LARGO 115.0 Circuit 1
32. HORIZON 115.0 to MONTWOOD 115.0 Circuit 1
33. JORNADA 115.0 to ARROYO 115.0 Circuit 1
34. LANE___# 115.0 to WRANGLER 115.0 Circuit 1
35. LAS_CRUC 115.0 to ARROYO 115.0 Circuit 1
36. LAS_CRUC 115.0 to SALOPEK 115.0 Circuit 1
37. LUNA 345.0 to DIABLO 345.0 Circuit 1
38. LUNA 345.0 to HIDALGO 345.0 Circuit 1
39. LUNA 345.0 to AFTON 345.0 Circuit 1
40. MAR 115.0 to LARGO 115.0 Circuit 1
41. MARLOW 115.0 to TROWBRIG 115.0 Circuit 1
42. MESA___# 115.0 to AUSTIN_N 115.0 Circuit 1
43. MESA___# 115.0 to RIO_GRAN 115.0 Circuit 1
44. MILAGRO 115.0 to NEWMAN 115.0 Circuit 1
45. MILAGRO 115.0 to NEWMAN 115.0 Circuit 2
46. MILAGRO 115.0 to LEO 115.0 Circuit 1
47. NEWMAN 115.0 to BUTERFLD 115.0 Circuit 1
48. NEWMAN 115.0 to CHAPARAL 115.0 Circuit 1
49. NEWMAN 115.0 to CROMO 115.0 Circuit 1
50. NEWMAN 115.0 to SHEARMAN 115.0 Circuit 1
51. NEWMAN 345.0 to ARROYO 345.0 Circuit 1
52. NEWMAN 345.0 to AFTON 345.0 Circuit 1
53. NE1 115.0 to NEWMAN 115.0 Circuit 1
54. PELICANO 115.0 to HORIZON 115.0 Circuit 1
55. PELICANO 115.0 to MONTWOOD 115.0 Circuit 1
56. RIPLEY 115.0 to THORN 115.0 Circuit 1
57. MONTWOOD 115.0 to CALIENTE 115.0 Circuit 1
58. MONTWOOD 115.0 to COYOTE 115.0 Circuit 1
59. ORO_GRAN 115.0 to AMRAD 115.0 Circuit 1
60. RIO_GRAN 115.0 to RIPLEY 115.0 Circuit 1
61. SALOPEK 115.0 to ARROYO 115.0 Circuit 1
62. SANTA_T 115.0 to DIABLO 115.0 Circuit 1
63. SANTA_T 115.0 to MONTOYA 115.0 Circuit 1
64. SANTA_T 115.0 to NW2 115.0 Circuit 1
65. SCOTSDALE 115.0 to VISTA__# 115.0 Circuit 1
66. PENDALE 115.0 to LANE___# 115.0 Circuit 1
67. SOL 115.0 to LANE___# 115.0 Circuit 1
68. SOL 115.0 to VISTA__# 115.0 Circuit 1
69. SPARKS 115.0 to HORIZON 115.0 Circuit 1
70. SUNSET_N 115.0 to RIO_GRAN 115.0 Circuit 1
71. TALAVERA 115.0 to ANTHONY 115.0 Circuit 1
72. THORN 115.0 to MONTOYA 115.0 Circuit 1
73. NW2 115.0 to DIABLO 115.0 Circuit 1
74. WHITE_SA 115.0 to ALA_5 115.0 Circuit 1
75. WRANGLER 115.0 to SPARKS 115.0 Circuit 1
76. WRANGLER 115.0 to SPARKS 115.0 Circuit 2
77. AEP 115.0 to AZTECAS 115.0 Circuit 1
78. AEP 115.0 to REA2 115.0 Circuit 1
79. CHAMIZAL 115.0 to COLEGIO 115.0 Circuit 1
80. CHAMIZAL 115.0 to RIVERENA 115.0 Circuit 1
81. CHAVENA 115.0 to AZTECAS 115.0 Circuit 1
82. COLEGIO 115.0 to CHAVENA 115.0 Circuit 1
83. COLEGIO 115.0 to FTS 115.0 Circuit 1
84. FTS 115.0 to TEC 115.0 Circuit 1
85. INSURG 115.0 to CHAMIZAL 115.0 Circuit 1
86. INSURG 115.0 to CHAVENA 115.0 Circuit 1
87. REA2 115.0 to AZTECAS 115.0 Circuit 1
88. REA2 115.0 to INSURG 115.0 Circuit 1
89. CALIENTE 345.0 to PICANTE 345.0 Circuit 1
90. NEWMAN 115.0 to PIPELINE 115.0 Circuit 1
91. LEO 115.0 to DYER 115.0 Circuit 1
92. PICANTE 345.0 to NEWMAN 345.0 Circuit 1

CONTINGENCY LIST Transmission Lines
93. PICANTE 115.0 to BIGGS 115.0 Circuit 1
94. PICANTE 115.0 to GR 115.0 Circuit 1
95. ANTHONY 115.0 to NW3 115.0 Circuit 1
96. ARROYO 115.0 to COX 115.0 Circuit 1
97. APOLLOSS 115.0 to APOLLO 115.0 Circuit 1
98. HATCH 115.0 to LEASBURG 115.0 Circuit 1
99. LE1 115.0 to APOLLOSS 115.0 Circuit 1
100. LE1 115.0 to JORNADA 115.0 Circuit 1
101. SUNSET_N 115.0 to DURAZNO 115.0 Circuit 1
102. DURAZNO 115.0 to ASCARATE 115.0 Circuit 1
103. NW3 115.0 to MONTOYA 115.0 Circuit 1
104. COX 115.0 to APOLLOSS 115.0 Circuit 1
105. APOLLO 115.0 to JORNADA 115.0 Circuit 1
106. LEASBURG 115.0 to JORNADA 115.0 Circuit 1
107. NE1 115.0 to CROMO 115.0 Circuit 1
108. ANTHONY 115.0 to COX 115.0 Circuit 1
109. COX 115.0 to TALAVERA 115.0 Circuit 1
110. ASCARATE 115.0 to COPPER 115.0 Circuit 2
111. JORNADA 115.0 to AIRPOR 115.0 Circuit 1
112. AFTON 115.0 to AIRPOR 115.0 Circuit 1
113. SOL 115.0 to VISTA__# 115.0 Circuit 2
114. NEWMAN 115.0 to PICANTE 115.0 Circuit 1
115. PIPELINE 115.0 to BIGGS 115.0 Circuit 1
116. HIDALGO 345.0 to GREENLEE 345.0 Circuit 1
117. LUNA 345.0 to LEF 345.0 Circuit 1
118. DONA_ANA 115.0 to LAS_CRUC 115.0 Circuit 1
119. AMRAD 115.0 to ALAMOGCP 115.0 Circuit 1
120. HOLLOMAN 115.0 to ALAMOGCP 115.0 Circuit 1
121. AIRPOR_T 115.0 to AIRPOR 115.0 Circuit 1
122. CABALLOT 115.0 to UVAS 115.0 Circuit 1
123. UVAS 115.0 to MIMBRES 115.0 Circuit 1
124. ORO_GRAN 115.0 to JARILLA1 115.0 Circuit 1
125. WSTAP 115.0 to WHITE_SA 115.0 Circuit 1
126. ASCARATE 115.0 to TROWBRIG 115.0 Circuit 1
127. EPE1 115.0 to COYOTE 115.0 Circuit 1
128. EPE1 115.0 to MONTWOOD 115.0 Circuit 1
129. CALIENTE 115.0 to EPE1 115.0 Circuit 1
130. CALIENTE 115.0 to EPE1 115.0 Circuit 2
131. CALIENTE 115.0 to VISTA__# 115.0 Circuit 2
132. CALIENTE 115.0 to SE2 115.0 Circuit 1
133. CALIENTE 115.0 to SE2 115.0 Circuit 2
134. CALIENTE 345.0 to PICANTE 345.0 Circuit 2
135. MACHO_SPRNGS 345.0 to LUNA 345.0 Circuit 1
136. MACHO_SPRNGS345.0 to SPRINGR 345.0 Circuit 1
137. LE1 115.0 to ARROYO 115.0 Circuit 1
138. SE2 115.0 to LANE___# 115.0 Circuit 1
139. Line SE2 115.0 to LANE___# 115.0 Circuit 2
140. RIPLEY 115.0 to THORN 115.0 Circuit 2
141. PICANTE 345.0 to AMRAD 345.0 Circuit 1
142. WESTMESA 345.0 to ARR___PS 345.0 Circuit 1
143. ORO GRANDE 115.0 TO CO70S 115.0 Circuit 1
144. CHAPARRAL 115.0 TO CO70S 115.0 Circuit 1
145. NW2 115.0 to ROADRUNRTAP 115.0 Circuit 1
146. ROADRUNRTAP 115.0 to DIABLO 115.0 Circuit 1
147. ROADRUNRTAP 115.0 to ROADRUNER 115.0
Circuit 1
148. ART320W 345.0 to ARTESIA 345.0 Circuit 1
149. Line CALIENTE 345.0 to CORONA 345.0 Circuit 1
150. AMRAD 345.0 to AA100W 345.0 Circuit 1
151. AA100W 345.0 to ARTESIA 345.0 Circuit 1
152. CORONA 345.0 to AMRAD 345.0 Circuit 1
153. CORONA 345.0 to AMRAD 345.0 Circuit 2
154. CORONA 345.0 to PICANTE 345.0 Circuit 1
155. CORONA 345.0 to NEWMAN 345.0 Circuit 1
156. WESTMESA 345.0 to WA300POI 345.0 Circuit 1
157. WA300POI 345.0 to ARR___PS 345.0 Circuit 1
158. WA300POI 345.0 to WA300_C 345.0 Circuit 1
159. WA300_C 345.0 to WA300_C2 345.0 Circuit 1
160. IRONSTREET-PRAGER 46 kV (PI)
161. IRONSTREET-PERSON 46 kV (PH)
162. PERSON-TOME 46 kV (PB)
163. PERSON-TOME 46 kV (BN)
164. PERSON-PY47 46 kV (EL)
165. POWERPLANT-ZIA 46 kV (ZS)
166. POWERPLANT-ZIA 46 kV (ZM)
167. PRAGER-KELEHER 46 kV (PY)
168. SANDIA-IDEAL 46 kV (ID)
169. ALGODONE-PACHMANN 115 kV (AL)
170. ALGODONE-NORTON/ZIA1 115 kV (ANZ)
171. ALGODONE-AW CAP 115 kV
172. AW CAP-WILLARD 115 kV
173. AMBROSIA-BLUEWATER 115 (MB)
174. AMBROSIA-GULF PGT 115 kV (MA)
175. AMBROSIA-YAHTAHEY 115 kV (AY)
176. BA-ZIA 115 kV (RS)
177. BA-REEVES 1 115 kV (AB)
178. BA-REEVES 2 115 kV (RB)
179. BA-STA 115 kV (RL)
180. BA-PACHMANN 115 kV (CB)
181. BELEN-WILLARD 115 kV (WL)
182. BELEN-TOME 115 kV (TJ)
183. BELEN-WEST MESA 3 115 kV (WB)
184. BELEN-SOCORRO 115 kV (SOC)
185. CORRALES-IRVING 115 kV (IC)

CONTINGENCY LIST Transmission Lines
186. CORRALES-PACHMANN 115 kV (CY)
187. EMBUDO-SANDIA 2 115 kV (SE)
188. EMBUDO-NORTH(TL)/EB86 (EB) 115 kV
189. EMBUDO-REEVES 1 115 kV (RE)
190. EMBUDO-REEVES 2 115 kV (ER)
191. IRVING-WEST MESA 1 115 kV (WR)
192. IRVING-REEVES 1 115 kV (IR)
193. KIRTLAND-PERSON 115 kV (PS)
194. KIRTLAND-SANDIA 1 115 kV (KS)
195. NORTH-PRAGER 115 kV (PN)
196. NORTH-MISSION 115 kV (MN)
197. NORTH-REEVES 1 115 kV (RN)
198. NORTON-ETA 115 kV (NL)
199. NORTON-ZIA 2 115 kV (NS)
200. NORTON-HERNANDEZ 115 kV (NH)
201. OJO-HERNANDEZ 115 kV (HO)
202. PACHMANN-WEST MESA 3 115 kV (CE)
203. PERSON-SP83/HW43 115 kV (SP)
204. PERSON-WEST MESA 2 115 kV (PM)
205. PERSON-TOME 115 kV (AT)
206. PERSON-WEST MESA 1 115 kV (PW)
207. PRAGER-WEST MESA 2 115 kV (WP)
208. REEVES 2-MISSION 115 kV (NR)
209. REEVES 2-WEST MESA 2 115 kV (NW)
210. SANDIA 1-HW43/EB68 115 kV (EB)
211. SANDIA 2-SP83 115 kV (SP)
212. VALENCIA-ZIA 115 kV (SL)
213. VALENCIA-STORRIE LAKE 115 kV (VS)
214. WEST MESA 115 kV BUS TIE 1-3
215. WEST MESA 1-GULF PGT 115 kV (KM)
216. WEST MESA 115 kV BUS TIE 1-2
217. WEST MESA 3-BLUEWATER 115 kV (BW)
218. YAHTAHEY-PEGS 115 kV (GYTH&WTG)
219. ZIA 115 kV BUS TIE
220. ETA-STA 115 kV (SA)
221. ETA-WTA 115 kV (TE)
222. ETA-TA53 115 kV (LA)
223. STA-WTA 115 kV (SW)
224. TA3-TA53 115 kV (SW)
225. TA3-WTA 115 kV (WT)
226. SPRINGER-TAOS 115 kV
227. SPRINGER-STORRIE LAKE 115 kV
228. TAOS-HERNANDEZ 115 kV
229. GLADSTONE-CLAPHAM 115 kV
230. RIO PUERCO - CORRALES BLUFFS (RR) 115 kV
231. AMBROSIA-WEST MESA 230 kV (WA)
232. AMBROSIA-PEGS 230 kV
233. AMBROSIA-BISTI 230 kV (BI)
234. BA-RIO PUERCO 345 kV
235. WEST MESA-RIO PUERCO 345 kV
236. BA-GAUDALUPE 345 kV (BB)
237. B-A-RIO PUERCO 345 kV
238. SAN JUAN-RIO PUERCO 345 kV
239. BA-NORTON 345 kV (NB)
240. BISTI-PILLAR 230 kV (BP)
241. FOUR CORNERS-WEST MESA 345 kV (FW)
242. GALLEGOS-PILLAR 230 kV (GC)
243. OJO-SAN JUAN 345 kV (OJ)
244. OJO-TAOS 345 kV (OT)
245. PILLAR-FOUR CORNERS 230 kV (AF)
246. SANDIA-WEST MESA 345 kV (WS)
247. SAN JUAN-SHIPROCK 345 kV (SR)
248. SAN JUAN-MCKINLEY 345 kV #1
249. SAN JUAN-MCKINLEY 345 kV #2
250. SAN JUAN-SANJN PS 345 kV (SH)
251. TAIBAN-BLACKWATER 345 kV (TB)
252. WALSENBURG - GLADSTON 230 kV
253. LORDSBURG-MD 69 kV
254. SILVER CITY-TURQUOISE 69 kV
255. SILVER CITY-MD 69 kV
256. ALMAMOGORDO-AMRAD 115 kV
257. ALAMOGORDO-DONA ANA 115 kV
258. ALAMOGORDO-HOLLOMAN 115 kV
259. AMRAD-LARGO/HOLLOMAN 115 kV
260. AMRAD-OROGRANDE 115 kV
261. HIDALGO-LORDSBURG 115 kV
262. HIDALGO-TURQUOISE 115 kV
263. LUNA-MIMBRES 115 kV
264. LUNA-MD 115 kV
265. MD-TURQUOISE 115 kV
266. MIMBRES-PICACHO 115 kV
267. MIMBRES-ELEPHANT BUTTE 115 kV
268. PICACHO-DONA ANA 115 kV
269. PICACHO-ELEPHANT BUTTE 115 kV
270. SANTA TERESA – DS70S 115 kV
271. DS70S-NW2 115 kV
272. LUNA-LEF 345.0 kV

CONTINGENCY LIST Transformers
273. AMRAD 345/115 kV Circuit 1
274. ARROYO 345/115 kV Circuit 1
275. ARROYO 345/115 kV Circuit 2
276. CALIENTE 345/115 kV Circuit 1
277. CALIENTE 345/115 kV Circuit 2
278. DIABLO 345/115 kV Circuit 1
279. DIABLO 345/115 kV Circuit 2
280. DIABLO 345/115 kV Circuit 3
281. NEWMAN 345/115 kV Circuit 1
282. PICANTE 345/115 kV Circuit 1
283. AFTON 345/115 kV Circuit 1
284. HIDALGO 345/115 kV Circuit 1
285. HIDALGO 345/115 kV Circuit 2
286. LUNA 345/115 kV Circuit 1
287. ZIA 115/46 kV TRANSFORMER #1
288. ZIA 115/46 kV TRANSFORMER #2
289. PERSON 115/46 kV TRANSFORMER
290. PRAGER 115/46 kV TRANSFORMER
291. SANDIA 115/46 kV TRANSFORMER #2
292. TOME 115/46 kV TRANSFORMER
293. ZIA 115/46 kV TRANSFORMER #3
294. ZIA 115/46 kV TRANSFORMER #1 & 2
295. SPRINGER-GLADSTONE 115 kV
296. TAOS 345/115 kF TRANSFORMER #3
297. TAOS 345/115 kF TRANSFORMER #4
298. AMBROSIA 230/115 kV TRANSFORMER
299. BA 345/115 TRANSFORMER
300. OJO 345/115 kV TRANSFORMER
301. SANDIA 345/115 kV TRANSFORMER
302. WESTMESA 345/115 kV TRANSFORMER #1
303. WESTMESA 345/115 kV TRANSFORMER #2
304. WESTMESA 230/115 kV TRANSFORMER #1
305. WESTMESA 230/115 kV TRANSFORMER #2
306. NORTON 345/115 kV TRANSFORMER
307. MCKINLEY-YAHTAHEY 345/115 kV
TRANSFORMER
308. SAN JUAN-HOGBACK 230/115 kV
TRANSFORMER

CONTINGENCY LIST Generators
309. AMRAD_A 13.2 Unit ID 1
310. NEWMANG3 13.8 Unit ID 1
311. NEWMN4S1 13.8 Unit ID 1
312. NEWMN5G1 13.8 Unit ID 1
313. NEWMN5G2 13.8 Unit ID 1
314. NEWMN5S1 13.8 Unit ID 1
315. NEWMN6G1 13.8 Unit ID 1
316. NEWMN6G2 13.8 Unit ID 1
317. NEWMN6S1 13.8 Unit ID 1
318. RIOGD_G8 17.5 Unit ID 1
319. RIOGD_G9 13.8 Unit ID 1
320. ST_DIST_PV 24.9 Unit ID 1
321. APT_DIST_PV 24.9 Unit ID 1
322. CHAP_DIST_PV 13.8 Unit ID 1
323. HAT_DIST_PV 24.9 Unit ID 1
324. MOCC_G1 13.8 Unit ID 1
325. MOCC_G2 13.8 Unit ID 1
326. MOCC_G3 13.8 Unit ID 1
327. MOCC_G4 13.8 Unit ID 1
328. MO420G ALL UNITS" 329. CO70S OV 330. DS90S PV

TRC 115 kV Cluster System Impact Study November 2014
Appendix C
Appendix C Dynamic Modeling Data

#New 2014 115 kV Cluster Modelsregc_a 99101 "OT_PV_1 " 0.55 "1 " : #99 mva=74.5700 "lvplsw" 1.000000 "rrpwr" 10.0000 "brkpt" 0.900000 "zerox" 0.400000 "lvpl1" 1.2200 "vtmax" 1.2000 "lvpnt1" 0.800000 "lvpnt0" 0.400000 "qmin" -1.3000 "accel" 0.700000 / "tg" 0.020000 "tfltr" 0.020000 "iqrmax" 100.0000 "iqrmin" -100.0000 "xe" 0.0gencls 99100 "OT_PV_POI " 115.00 "IN" : #9 mva=999.0000 "h" 999.0000 "d" 0.0000 "ra" 0.0000 "lppd" 0.1000 / "rcomp" 0.0000 "xcomp" 0.0000 "accel" 0.0000 reec_b 99101 "OT_PV_1 " 0.55 "1 " : #99 "mvab" 74.5700 "vdip" -99.0000 "vup" 99.0000 "trv" 0.020000 "dbd1" -0.050000 "dbd2" 0.050000 "kqv" 0.0 "iqh1" 1.2500 "iql1" -1.0500 "vref0" 1.000000 / "tp" 0.050000 "qmax" 0.280011 "qmin" -0.280011 "vmax" 1.000000 "vmin" 0.900000 "kqp" 1.000000 "kqi" 0.0 "kvp" 1.000000 "kvi" 0.0 "tiq" 0.020000 / "dpmax" 99.0000 "dpmin" -99.0000 "pmax" 1.000000 "pmin" 0.0 "imax" 1.000000 "tpord" 0.020000 "pfflag" 0.0 "vflag" 0.0 "qflag" 1.000000 "pqflag" 0.0regc_a 99001 "ST_PV_1 " 0.55 "1 " : #99 mva=99.3800 "lvplsw" 1.000000 "rrpwr" 10.0000 "brkpt" 0.900000 "zerox" 0.400000 "lvpl1" 1.2200 "vtmax" 1.2000 "lvpnt1" 0.800000 "lvpnt0" 0.400000 "qmin" -1.3000 "accel" 0.700000 / "tg" 0.020000 "tfltr" 0.020000 "iqrmax" 100.0000 "iqrmin" -100.0000 "xe" 0.0gencls 99900 "ST_PV_POI " 115.00 "IN" : #9 mva=999.0000 "h" 999.0000 "d" 0.0000 "ra" 0.0000 "lppd" 0.1000 / "rcomp" 0.0000 "xcomp" 0.0000 "accel" 0.0000 reec_b 99001 "ST_PV_1 " 0.55 "1 " : #99 "mvab" 99.3800 "vdip" -99.0000 "vup" 99.0000 "trv" 0.020000 "dbd1" -0.050000 "dbd2" 0.050000 "kqv" 0.0 "iqh1" 1.2500 "iql1" -1.0500 "vref0" 1.000000 / "tp" 0.050000 "qmax" 0.395220 "qmin" -0.395220 "vmax" 1.000000 "vmin" 0.900000 "kqp" 1.000000 "kqi" 0.0 "kvp" 1.000000 "kvi" 0.0 "tiq" 0.020000 / "dpmax" 99.0000 "dpmin" -99.0000 "pmax" 1.000000 "pmin" 0.0 "imax" 1.000000 "tpord" 0.020000 "pfflag" 0.0 "vflag" 0.0 "qflag" 1.000000 "pqflag" 0.0
TRC 115 kV Cluster System Impact Study November 2014
Appendix C
1

115 kV Cluster 2014 System Impact Study TRC November 2014 APPENDIX D
Appendix D
Stability Plots

Stability plots are not included in this report because there are 972 pages of plots in this study. Plots for the study will be provided upon request.
115 kV Cluster 2014 System Impact Study TRC November 2014 APPENDIX D

115 kV Cluster 2014 System Impact Study TRC November 2014 APPENDIX E
Appendix E
Worst Condition Analysis Results

Worst Condition Analysis (WCA) results are not included because there are 563 pages of results in this study. WCA results for the study will be provided upon request.
115 kV Cluster 2014 System Impact Study TRC November 2014 APPENDIX E

TRC 115 kV Cluster System Impact Study November 2014
Appendix F
Appendix F Project Schedule

ID Task Name Duration Start Finish Predecessors
1 CO70S and DS90S POI Switching Station 528 days Mon 12/1/14 Wed 12/7/16
2 Preliiminary Engineering 1.6 wks Mon 12/1/14 Wed 12/10/14
3 Permitting 26 wks Thu 12/11/14 Wed 6/10/15 2
4 Engineering and Procurement 52 wks Thu 6/11/15 Wed 6/8/16 3
5 Construction 26 wks Thu 6/9/16 Wed 12/7/16 4
6
7 Chaparrall - Oro Grande Relay Work 105 days Thu 4/14/16 Wed 9/7/16
8 Engineering and Procurement 16 wks Thu 4/14/16 Wed 8/3/16 3FS+44 wks
9 Construction 5 wks Thu 8/4/16 Wed 9/7/16 8
Sep Jan May Sep Jan May Sep Jan4th Quarter 3rd Quarter 2nd Quarter 1st Q
Task
Task Progress
Critical Task
Critical Task Progress
Milestone
Summary
Rolled Up Task
Rolled Up Critical Task
Rolled Up Milestone
Rolled Up Progress
Split
External Tasks
Project Summary
Group By Summary
Inactive Task
Inactive Milestone
Inactive Summary
Manual Task
Duration-only
Manual Summary Rollup
Manual Summary
Start-only
Finish-only
Deadline
Page 1
Project: 115 kV Cluster Project ScheduDate: Thu 11/13/14
Related Documents