Submitted to the Annals of Applied Statistics SYNTHESISING EVIDENCE TO ESTIMATE PANDEMIC (2009) A/H1N1 INFLUENZA SEVERITY IN 2009-2011 * By Anne M. Presanis † , Richard G. Pebody ‡ , Paul J. Birrell † , Brian D. M. Tom † , Helen K. Green ‡ , Hayley Durnall § , Douglas Fleming § and Daniela De Angelis †,‡ Medical Research Council Biostatistics Unit † , Public Health England ‡ and Royal College of General Practitioners § Knowledge of the severity of an influenza outbreak is crucial for informing and monitoring appropriate public health responses, both during and after an epidemic. However, case-fatality, case-intensive care admissiion and case-hospitalisation risks are difficult to mea- sure directly. Bayesian evidence synthesis methods have previously been employed to combine fragmented, under-ascertained and bi- ased surveillance data coherently and consistently, to estimate case- severity risks in the first two waves of the 2009 A/H1N1 influenza pandemic experienced in England. We present in detail the com- plex probabilistic model underlying this evidence synthesis, and ex- tend the analysis to also estimate severity in the third wave of the pandemic strain during the 2010/11 influenza season. We adapt the model to account for changes in the surveillance data available over the three waves. We consider two approaches: (a) a two-stage ap- proach using posterior distributions from the model for the first two waves to inform priors for the third wave model; and (b) a one-stage approach modelling all three waves simultaneously. Both approaches result in the same key conclusions: (1) that the age-distribution of the case-severity risks is “u-”shaped, with children and older adults having the highest severity; (2) that the age-distribution of the infec- tion attack rate changes over waves, school-age children being most affected in the first two waves and the attack rate in adults over 25 increasing from the second to third waves; and (3) that when aver- aged over all age groups, case-severity appears to increase over the three waves. The extent to which the final conclusion is driven by the change in age-distribution of those infected over time is subject to discussion. 1. Introduction. Evidence synthesis (e.g. Spiegelhalter, Abrams and Myles, 2004; Ades and Sutton, 2006) has become an important method in epidemiology, where multiple, disparate, incomplete and often biased sources * This work was supported by the Medical Research Council [Unit Programme Numbers U105260566 and U105261167]; NIHR HTA Project 11/46/03; Public Health England; and the Royal College of General Practitioners. Keywords and phrases: evidence synthesis, Bayesian, influenza, severity 1 arXiv:1408.7025v1 [stat.AP] 29 Aug 2014

Welcome message from author
This document is posted to help you gain knowledge. Please leave a comment to let me know what you think about it! Share it to your friends and learn new things together.
Transcript
Submitted to the Annals of Applied Statistics
SYNTHESISING EVIDENCE TO ESTIMATE PANDEMIC(2009) A/H1N1 INFLUENZA SEVERITY IN 2009-2011∗
By Anne M. Presanis†, Richard G. Pebody‡, Paul J. Birrell†,Brian D. M. Tom†, Helen K. Green‡, Hayley Durnall§, Douglas
Fleming§ and Daniela De Angelis†,‡
Medical Research Council Biostatistics Unit†, Public Health England‡ andRoyal College of General Practitioners§
Knowledge of the severity of an influenza outbreak is crucial forinforming and monitoring appropriate public health responses, bothduring and after an epidemic. However, case-fatality, case-intensivecare admissiion and case-hospitalisation risks are difficult to mea-sure directly. Bayesian evidence synthesis methods have previouslybeen employed to combine fragmented, under-ascertained and bi-ased surveillance data coherently and consistently, to estimate case-severity risks in the first two waves of the 2009 A/H1N1 influenzapandemic experienced in England. We present in detail the com-plex probabilistic model underlying this evidence synthesis, and ex-tend the analysis to also estimate severity in the third wave of thepandemic strain during the 2010/11 influenza season. We adapt themodel to account for changes in the surveillance data available overthe three waves. We consider two approaches: (a) a two-stage ap-proach using posterior distributions from the model for the first twowaves to inform priors for the third wave model; and (b) a one-stageapproach modelling all three waves simultaneously. Both approachesresult in the same key conclusions: (1) that the age-distribution ofthe case-severity risks is “u-”shaped, with children and older adultshaving the highest severity; (2) that the age-distribution of the infec-tion attack rate changes over waves, school-age children being mostaffected in the first two waves and the attack rate in adults over 25increasing from the second to third waves; and (3) that when aver-aged over all age groups, case-severity appears to increase over thethree waves. The extent to which the final conclusion is driven bythe change in age-distribution of those infected over time is subjectto discussion.
1. Introduction. Evidence synthesis (e.g. Spiegelhalter, Abrams andMyles, 2004; Ades and Sutton, 2006) has become an important method inepidemiology, where multiple, disparate, incomplete and often biased sources
∗This work was supported by the Medical Research Council [Unit Programme NumbersU105260566 and U105261167]; NIHR HTA Project 11/46/03; Public Health England; andthe Royal College of General Practitioners.
Keywords and phrases: evidence synthesis, Bayesian, influenza, severity
1
arX
iv:1
408.
7025
v1 [
stat
.AP]
29
Aug
201
4
2 PRESANIS ET AL
of observational (e.g. surveillance or survey) data are available to inform es-timation of relevant quantities, such as prevalence and incidence of infectiousdisease (Welton and Ades, 2005; Goubar et al., 2008; Sweeting et al., 2008;Albert et al., 2011; Presanis et al., 2011a; Birrell et al., 2011). Data maydirectly inform a quantity of interest, θ, or more usually, may indirectlyinform multiple parameters Θ by directly informing some function of Θ,ψ = ψ(Θ). Such a function may represent, for example, the relationshipbetween a biased source of data and the parameter the data should theo-retically measure, so that the bias is explicitly modelled. Evidence synthesismethods combine these heterogeneous types of challenging data in a coher-ent manner, to estimate the “basic” parameters Θ and from these obtain si-multaneously the “functional” parameters Ψ = {ψ1(Θ), . . . , ψm(Θ)}. Thesefunctional parameters include both those directly observed and others thatmay not be observed but are of interest to estimate. This type of estimationtypically necessitates the formulation of complex probabilistic models, oftenin a Bayesian framework.
Knowledge of the severity of an influenza outbreak is crucial for informingand monitoring appropriate public health responses. Severity estimates arenecessary not only during a pandemic to inform immediate public healthresponses, but also afterwards, when a robust reconstruction of what hap-pened during the pandemic is required to evaluate the responses. Moreover,as has happened in past influenza pandemics (Miller et al., 2009), if a pan-demic strain continues to circulate for some years, with unusual patterns ofage-specific mortality, then severity estimates over time, both in terms ofattack rates (the proportion of the population infected) and case-severityrisks (the probability an infection leads to a severe event), are required tounderstand if the strain is likely to continue circulating and if severity ischanging over time.
However, severity is an example epidemic characteristic that is difficultto measure directly. Typically, severity is expressed as the probability thatan infection will result in a severe event, for example death. We refer to thisprobability as the “case-fatality risk” (CFR). Severity may also be quan-tified by “case-hospitalisation” (CHR) and “case-intensive care admission”(CIR) risks, defined similarly as probabilities that an infection results inhospitalisation or intensive care (ICU) admission. Not all influenza infec-tions will be symptomatic, where “symptomatic” may be defined in dif-ferent ways, but is here taken to denote febrile influenza-like illness (ILI).Not all infections will therefore result in symptoms severe enough for a pa-tient to access health-care and hence be detectable in surveillance systems(Reed et al., 2009; Presanis et al., 2011b; Birrell et al., 2011). Symptomatic
SYNTHESISING EVIDENCE TO ESTIMATE INFLUENZA SEVERITY 3
case-severity risks (sCHR, sCIR, sCFR), the probabilities a symptomaticinfection leads to severe events, are therefore also considered as important in-dicators of severity for influenza. Estimation of these probabilities requiresinformation on both the cumulative incidence of (symptomatic) infectionover a period of time of interest (the denominator) and the cumulative inci-dence of severe events (the numerator). However, the denominator, whethersymptomatic or all infection, is challenging to determine, due to the unob-served infections. Population-wide serological testing (testing for antibodiesto influenza infection in blood serum samples) to measure the proportion ofthe population infected is one possibility, but is unlikely to be feasible. Thischallenge is only compounded in a pandemic situation, where resources andtime are even more stretched than usual (e.g. Lipsitch et al., 2009; Garskeet al., 2009).
The most feasible approach to the assessment of severity is therefore viaestimation, combining data from different sources and accounting for theirbiases, due, for example, to under-ascertainment. The majority of methodsadopted to estimate influenza case-severity (e.g. Reed et al., 2009; Garskeet al., 2009; Wilson and Baker, 2009; Pebody et al., 2010; Wielders et al.,2012; Sypsa et al., 2011) have not systematically accounted for all biases.Crucially, they have not made use of all available information in the esti-mation process, nor have they accounted for all uncertainty inherent in thedata. Bayesian evidence synthesis provides a flexible framework in which allavailable relevant data may be coherently amalgamated, together with priorinformation on biases, to estimate case-severity (Presanis et al., 2009; Wuet al., 2010; Lipsitch et al., 2011; Presanis et al., 2011b; Shubin et al., 2013;McDonald et al., 2014).
Until the 2012/13 winter, England experienced three waves of infectionwith the 2009 pandemic A/H1N1 influenza strain: in the summer of 2009;the autumn and winter of 2009-10; and the autumn and winter of 2010-11.The severity of the first two waves, as measured by case-severity risks, waspreviously estimated (Presanis et al., 2011b) by synthesising data either fromsurveillance systems in place to monitor seasonal influenza or from systemsset up specifically in response to the pandemic (Health Protection Agency,2010). In this paper, we present in detail the statistical model used in Pre-sanis et al. (2011b), and extend the approach to estimating severity in thethird wave of infection. After the first two waves, the World Health Orga-nization declared a move to a post-pandemic period (http://www.who.int/mediacentre/news/statements/2010/h1n1_vpc_20100810/en/index.html),at which time many of the surveillance systems that operated during thepandemic situation were either stopped or changed in form. We describe
4 PRESANIS ET AL
how the model of Presanis et al. (2011b) is further developed to account forthese changes in the available data.
The evidence used to estimate severity in the first two waves and thechanges to the surveillance systems between waves are described in section2. A Bayesian approach to evidence synthesis is introduced in section 3. Wethen describe in section 4 a generic model for estimating severity, beforeshowing in section 5.1 how the model was implemented in the first twowaves. We next develop the model to estimate severity in the third wave,presenting two approaches (sections 5.2 and 5.3 respectively). Results aregiven in section 6 and we end with a discussion in section 7.
2. Surveillance data.
2.1. First & Second Waves. During the first two pandemic waves in2009-10, data were available from various surveillance systems at or usedby the UK’s Health Protection Agency (HPA, now Public Health England)that provided evidence on some aspect of the pandemic, at various levels ofseverity. These sources indirectly informed the case-severity risks and full de-tails of each are given in section 1.1 of the supplementary material (Presaniset al., 2014). Briefly, they included:
(i) data on laboratory-confirmed pandemic A/H1N1 cases (i.e. cases whereinfection with the pandemic strain was confirmed virologically, viareal-time polymerase chain reaction (RT-PCR) testing of nasal orthroat swabs) in the first few weeks of the pandemic (Health Pro-tection Agency et al., 2009; Health Protection Agency, 2010). Thedata included dates of illness onset and information on hospital admis-sion if it occurred, from which age group-specific case-hospitalisationrisks amongst confirmed cases could be estimated. Note that theseconfirmed-case-hospitalisation risks are likely to be higher than thecase-hospitalisation risks in all symptomatic cases, since not all symp-tomatic cases will have been confirmed in the first few weeks, and moresevere cases in hospital are more likely to have been detected than lesssevere cases;
(ii) estimates of the number of symptomatic cases by week, age and region,produced by the HPA. These estimates were recognised to be under-estimates, given the data of point (iii);
(iii) serial data on age group-specific proportions of individuals with anti-bodies to the pandemic strain of influenza (“sero-prevalence”), fromrepeated cross-sectional surveys of residual sera from other (unrelated)diagnostic testing (Miller et al., 2010; Hardelid et al., 2011). These data
SYNTHESISING EVIDENCE TO ESTIMATE INFLUENZA SEVERITY 5
indirectly inform the cumulative incidence of infection, i.e. the propor-tion of the population infected over a period of time. Initially thesedata were taken at face value, but concerns about potential samplingbiases led to extra sensitivity analyses (see section 6.1);
(iv) data on laboratory-confirmed cases in hospital (Campbell et al., 2011),including age group and dates of illness onset, hospital admission andICU admission; and
(v) data on the number of deaths amongst persons with confirmed pan-demic A/H1N1 influenza and/or mention of influenza on the deathcertificate, reported to the HPA and/or the Chief Medical Officer(Donaldson et al., 2009; Pebody et al., 2010).
2.2. Third Wave. During the third wave, data sources (i), (ii) and (iv)were no longer available in the same form. Although results from testingof samples from before and after the third wave from data source (iii) arenow available (Hoschler et al., 2012), at the time of the analyses presentedhere, they were not accessible. Full details of each source below are given insection 1.2 of the supplementary material (Presanis et al., 2014).
(vi) Between the second and third waves, the surveillance system for hos-pital admissions of confirmed cases moved to being a sentinel surveil-lance system, the UK Severe Influenza Surveillance Scheme (USISS).The data from this system are available at a coarser level of age ag-gregation and come from a sentinel sample of 23 acute NHS hospitaltrusts in the 2010-11 season, as opposed to the 129 trusts participatingin hospital surveillance during the first two waves.
(vii) Additional data are available on patients present in all ICUs in Eng-land with suspected pandemic A/H1N1 influenza, again at a coarserage aggregation, from the Department of Health (DH, (Department ofHealth, 2011)).
(viii) We also have data on virological positivity (proportion testing posi-tive for the pandemic strain) from a sentinel system, ‘Datamart’, com-prising results of RT-PCR testing from 16 HPA and NHS laboratoriesin England, covering mainly patients hospitalised with respiratory ill-ness.
(ix) In the third wave, the HPA estimates of source (ii) were not avail-able, due to the underlying data being specified at a different level ofdisaggregation. Instead, we use estimates of the number symptomatic(details in section 3.1 of the supplementary material (Presanis et al.,2014)) obtained from an alternative general practice sentinel surveil-lance system (Fleming, 1999).
6 PRESANIS ET AL
2.3. Challenges. Estimating case-severity by dividing the observed num-ber of infections at a severe level over a period of time by the observed (i.e.confirmed) number of infections in the same period is highly likely to result inbiased estimates. This bias is due to both under-ascertainment of infectionsin surveillance systems and differential probabilities of observation by sever-ity of infection (Garske et al., 2009; Presanis et al., 2011b). Any estimationtherefore has to account for these probabilities of observing infections (“de-tection probabilities”). Further challenges are posed by: uncertainty aboutthe representativeness of the surveillance data for the general population(sampling biases); the different degrees of aggregation in each data source;the fact that some of the data sources, such as the sero-prevalence data, onlyinform indirectly the number of infections; and the changes in surveillancesystems over time. A synthesis of all the above data sources to estimatecase-severity therefore requires these challenges to be addressed.
3. Evidence synthesis methods. Evidence synthesis (see e.g. Eddy,Hasselblad and Shachter, 1992; Ades and Sutton, 2006) denotes the idea ofestimating a set of k “basic” parameters Θ = (θ1, θ2, . . . , θk) from a collec-tion of n independent data sources y = (y1, y2, . . . , yn), arising from multiplestudies, perhaps of differing design. Each source yi, i ∈ 1, . . . , n provides ev-idence on a “functional” parameter ψi = fi(Θ). The function fi may eitherbe: equality to a single specific element θj of Θ, so that the data directlyinforms θj ; or a function of one or more components of Θ, so that the dataindirectly inform multiple basic parameters. The collection (ψ1, ψ2, . . . , ψn)is therefore a mixture of basic and functional parameters. The aim is to es-timate the set of basic parameters Θ, from which the functional parameters(ψ1, ψ2, . . . , ψn), as well as any other functions (ψn+1, . . . , ψm) of Θ that areof interest, may be simultaneously derived. Denote the total set of functionsby Ψ.
Inference may be carried out either in a classical setting, maximisingthe likelihood L(y|Θ) =
∏ni=1 Li(yi|Θ), or, as in this paper, in a Bayesian
setting, assigning a prior distribution to the basic parameters, P (Θ), andobtaining the posterior distribution P (Θ|y) ∝ P (Θ)L(y|Θ) typically via asimulation-based algorithm such as Markov chain Monte Carlo (MCMC).The posterior distribution of any of the functional parameters may also bederived.
A Bayesian evidence synthesis meets the challenges of case-severity es-timation by allowing: the relationship between data and parameters to beaccurately formulated, e.g. through the use of bias parameters such as detec-tion probabilities; prior information on such biases to be easily introduced;
SYNTHESISING EVIDENCE TO ESTIMATE INFLUENZA SEVERITY 7
and a natural framework in which to assess the consistency of evidence(Presanis et al., 2013), as part of the inference and model criticism cycleadvocated by Box (1980) and O’Hagan (2003).
4. A general Bayesian model for severity. The following genericsynthesis of evidence to estimate severity was the basis of the estimation ofseverity of the 2009 pandemic A/H1N1 strain of influenza (Presanis et al.,2009, 2011b), both in the USA and in England during the first two waves.
Assume the population of interest is divided into 7 age groups: < 1, 1 −4, 5−14, 15−24, 25−44, 45−64, 65+, indexed by a ∈ 1, . . . , 7. Denote the age-specific population sizes by Nw,a, where w indexes waves of infection (w =1, 2, 3 in the case of England). Consider infections at five increasing severitylevels: all infections (Inf), symptomatic infections (S), hospitalisations (H),ICU admissions (I) and deaths (D). For each wave and age-group, considereach of these sets of infections to be subsets of the set of infections at aless severe level, such that D ⊆ H and I ⊆ H ⊆ S ⊆ Inf . Note that weassume the set of deaths is a subset of the set of hospitalisations, but thatnot all deaths are a subset of the set of ICU admissions. The set of infectionsInf is clearly a subset of the population. For each age group a, denote thecumulative number of new infections during wave w at severity level l (i.e.the size of subset l) by Nw,a,l.
4.1. Parameterisation. Denote by cw,a,l|λ the age- and wave-specific con-ditional probability that a case is at severity level l given the case has al-ready reached a less severe level λ, i.e. l ⊆ λ. For l = S,H, I, let Nw,a,l =cw,a,l|λ ×Nw,a,λ, where λ = Inf, S,H respectively. For all infections, defineNw,a,Inf = cw,a,Inf |Pop×Nw,a. For deaths, define Nw,a,D = cw,a,D|H×Nw,a,H ,i.e. in terms of the conditional probability of dying given hospitalisation. Theconditional probabilities cw,a,Inf |Pop, cw,a,S|Inf , cw,a,H|S , cw,a,I|H and cw,a,D|Hare basic parameters to which we assign prior distributions and the Nw,a,l arefunctional parameters. Note that in the US analysis (Presanis et al., 2009),the Nw,a,l were considered stochastic nodes, realisations of a Binomial distri-bution with probability parameter cw,a,l|λ and an appropriate denominatorNw,a,λ. However, in the UK analysis (Presanis et al., 2011b) and the analy-ses reported below, convergence of the MCMC algorithm was only achievedwhen the corresponding deterministic (mean) assumption was made for theNw,a,l, for reasons that are discussed further in Section 7.
The subsetting assumptions allow the case-hospitalisation, case-ICU ad-mission and case-fatality risks to be defined as functional parameters ex-
8 PRESANIS ET AL
pressed as products of component conditional probabilities:
CHRw,a = cw,a,H|Inf = cw,a,H|S × cw,a,S|InfCIRw,a = cw,a,I|Inf = cw,a,I|H × cw,a,H|S × cw,a,S|Inf(1)
CFRw,a = cw,a,D|Inf = cw,a,D|H × cw,a,H|S × cw,a,S|Inf
Similarly the symptomatic case-ICU admission and symptomatic case-fatalityrisks are defined as
sCHRw,a = cw,a,H|S
sCIRw,a = cw,a,I|S = cw,a,I|H × cw,a,H|S(2)
sCFRw,a = cw,a,D|S = cw,a,D|H × cw,a,H|S .
The conditional probability cw,a,Inf |Pop is commonly referred to as the “in-fection attack rate” (IARw,a) and cw,a,S|Pop = cw,a,S|Inf × cw,a,Inf,Pop isknown as the “symptomatic attack rate”, SARw,a.
Let dw,a,l denote “detection” probabilities, i.e. probabilities that infectionsat severity level l are observed. The full set of wave- and age-specific basicparameters to which we assign a prior distribution is then
θ(w, a) = {IARw,a, cw,a,S|Inf , cw,a,H|S , cw,a,I|H , cw,a,D|H , dw,a,S , dw,a,H , dw,a,I , dw,a,D}
with the total set defined as
Θ =⋃w,a
θ(w, a)
The full set of wave- and age-specific functional parameters is
ψ(w, a) = {SARw,a, CHRw,a, sCHRw,a, CIRw,a, sCIRw,a, CFRw,a, sCFRw,a,Nw,a,Inf , Nw,a,S , Nw,a,H , Nw,a,I , Nw,a,D}
with the total set defined as
Ψ =⋃w,a
ψ(w, a)
4.2. Prior distribution. The prior distributions assigned to the basic pa-rameters, whether diffuse or informative, will depend on the specifics of theseverity model considered, see section 5.
SYNTHESISING EVIDENCE TO ESTIMATE INFLUENZA SEVERITY 9
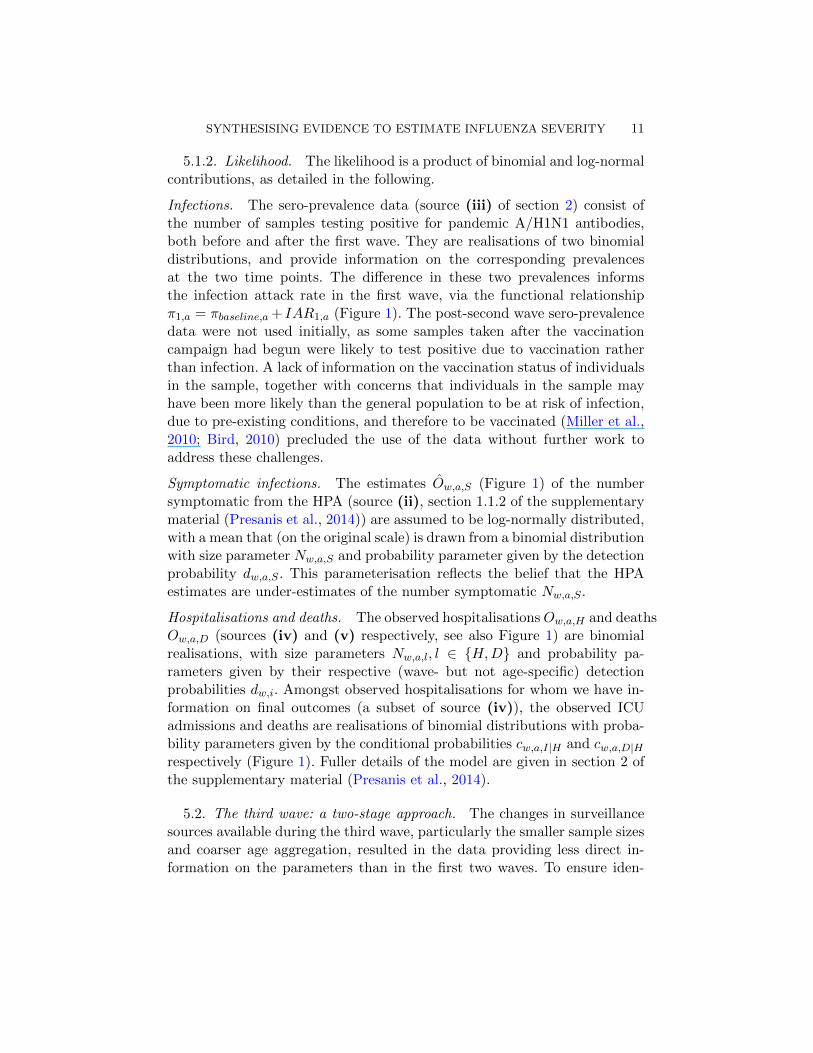
4.3. Data and likelihood. In general, at each severity level l, we observeOw,a,l infections out of the Nw,a,l total infections. Each Ow,a,l is assumed tobe Binomially distributed with size parameter Nw,a,l and detection proba-bility dw,a,l:
Ow,a,l ∼ Bin(Nw,a,l, dw,a,l)
The likelihood would then be
L(y|Θ) =∏w,a,l
(Nw,a,l
Ow,a,l
)dOw,a,l
w,a,l (1− dw,a,l)Nw,a,l−Ow,a,l
The specific models, e.g. as in sections 5.1 and 5.2, may have variationson this likelihood, depending on the data available. For example, data maybe directly available on the number of hospitalisations resulting in ICU ad-mission, in which case these data may contribute to the likelihood in thefollowing form:
Ow,a,I ∼ Bin(Ow,a,H , cw,a,I|H)
4.4. Computation. Once the priors and likelihood are defined, samplesare obtained from the resulting joint posterior distribution by MCMC simu-lation, using OpenBUGS (Lunn et al., 2009). In each model described below,three independent chains were run for 2,000,000 iterations each, with the first500,000 iterations discarded as a burn-in period and the remainder thinnedto every 10th iteration, resulting in 450,000 samples on which to base poste-rior inference. Convergence was established by both visual inspection of thetrace plots and examination of the Brooks-Gelman-Rubin diagnostic plots(Brooks and Gelman, 1998).
5. The severity model in England. The model used in Presaniset al. (2011b) for the first two waves of infection in England is described inthe next section. Two alternative methods of modelling the third wave ofinfection are then given: (a) a two-stage approach where posterior distribu-tions from the second wave model are used to inform prior distributions forsome of the conditional probabilities in the third wave; and (b) a one-stageapproach where all three waves are modelled simultaneously, with the thirdwave conditional probabilities parameterised in terms of the correspondingsecond wave probabilities.
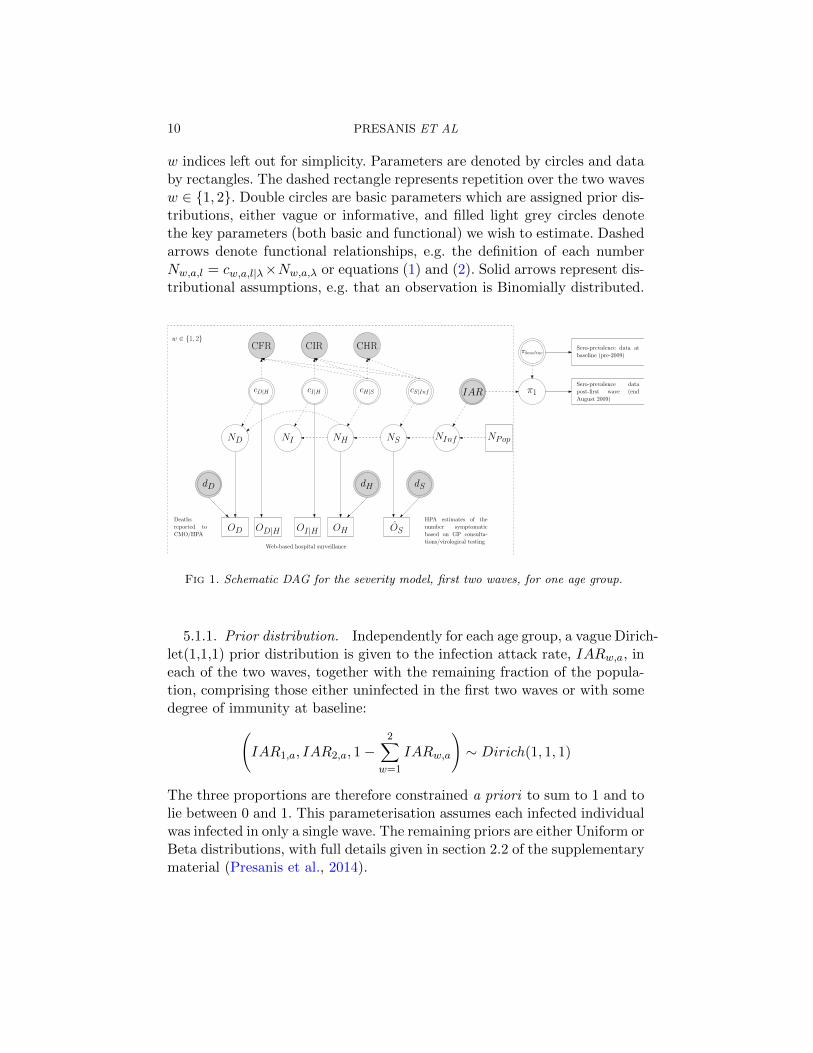
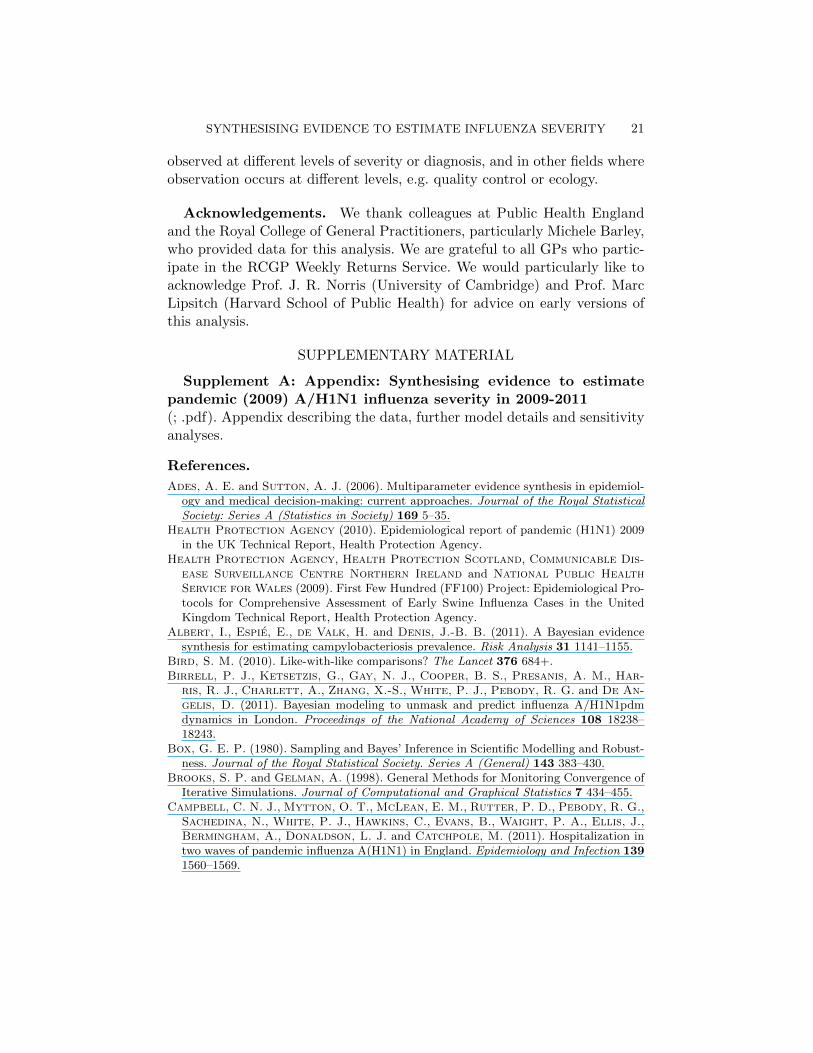
5.1. First & second waves. Figure 1 is a schematic Directed AcyclicGraph (DAG) displaying the relationship between parameters and data inthe model for severity in the first two waves in England (Presanis et al.,2011b). The figure displays one generic example age group, with the a and
10 PRESANIS ET AL
w indices left out for simplicity. Parameters are denoted by circles and databy rectangles. The dashed rectangle represents repetition over the two wavesw ∈ {1, 2}. Double circles are basic parameters which are assigned prior dis-tributions, either vague or informative, and filled light grey circles denotethe key parameters (both basic and functional) we wish to estimate. Dashedarrows denote functional relationships, e.g. the definition of each numberNw,a,l = cw,a,l|λ×Nw,a,λ or equations (1) and (2). Solid arrows represent dis-tributional assumptions, e.g. that an observation is Binomially distributed.
cS|InfcH|ScI|HcD|H
OD
CHRCIRCFR
NInfNSNHNIND
dSdHdD
OH
IAR
NPop
π1
πbaseline
OSOI|HOD|HWeb-based hospital surveillance
Deathsreported toCMO/HPA
HPA estimates of thenumber symptomaticbased on GP consulta-tions/virological testing
w ∈ {1, 2}Sero-prevalence data atbaseline (pre-2009)
Sero-prevalence datapost-first wave (endAugust 2009)
Fig 1. Schematic DAG for the severity model, first two waves, for one age group.
5.1.1. Prior distribution. Independently for each age group, a vague Dirich-let(1,1,1) prior distribution is given to the infection attack rate, IARw,a, ineach of the two waves, together with the remaining fraction of the popula-tion, comprising those either uninfected in the first two waves or with somedegree of immunity at baseline:(
IAR1,a, IAR2,a, 1−2∑
w=1
IARw,a
)∼ Dirich(1, 1, 1)
The three proportions are therefore constrained a priori to sum to 1 and tolie between 0 and 1. This parameterisation assumes each infected individualwas infected in only a single wave. The remaining priors are either Uniform orBeta distributions, with full details given in section 2.2 of the supplementarymaterial (Presanis et al., 2014).
SYNTHESISING EVIDENCE TO ESTIMATE INFLUENZA SEVERITY 11
5.1.2. Likelihood. The likelihood is a product of binomial and log-normalcontributions, as detailed in the following.
Infections. The sero-prevalence data (source (iii) of section 2) consist ofthe number of samples testing positive for pandemic A/H1N1 antibodies,both before and after the first wave. They are realisations of two binomialdistributions, and provide information on the corresponding prevalencesat the two time points. The difference in these two prevalences informsthe infection attack rate in the first wave, via the functional relationshipπ1,a = πbaseline,a + IAR1,a (Figure 1). The post-second wave sero-prevalencedata were not used initially, as some samples taken after the vaccinationcampaign had begun were likely to test positive due to vaccination ratherthan infection. A lack of information on the vaccination status of individualsin the sample, together with concerns that individuals in the sample mayhave been more likely than the general population to be at risk of infection,due to pre-existing conditions, and therefore to be vaccinated (Miller et al.,2010; Bird, 2010) precluded the use of the data without further work toaddress these challenges.
Symptomatic infections. The estimates Ow,a,S (Figure 1) of the numbersymptomatic from the HPA (source (ii), section 1.1.2 of the supplementarymaterial (Presanis et al., 2014)) are assumed to be log-normally distributed,with a mean that (on the original scale) is drawn from a binomial distributionwith size parameter Nw,a,S and probability parameter given by the detectionprobability dw,a,S . This parameterisation reflects the belief that the HPAestimates are under-estimates of the number symptomatic Nw,a,S .
Hospitalisations and deaths. The observed hospitalisationsOw,a,H and deathsOw,a,D (sources (iv) and (v) respectively, see also Figure 1) are binomialrealisations, with size parameters Nw,a,l, l ∈ {H,D} and probability pa-rameters given by their respective (wave- but not age-specific) detectionprobabilities dw,i. Amongst observed hospitalisations for whom we have in-formation on final outcomes (a subset of source (iv)), the observed ICUadmissions and deaths are realisations of binomial distributions with proba-bility parameters given by the conditional probabilities cw,a,I|H and cw,a,D|Hrespectively (Figure 1). Fuller details of the model are given in section 2 ofthe supplementary material (Presanis et al., 2014).
5.2. The third wave: a two-stage approach. The changes in surveillancesources available during the third wave, particularly the smaller sample sizesand coarser age aggregation, resulted in the data providing less direct in-formation on the parameters than in the first two waves. To ensure iden-
12 PRESANIS ET AL
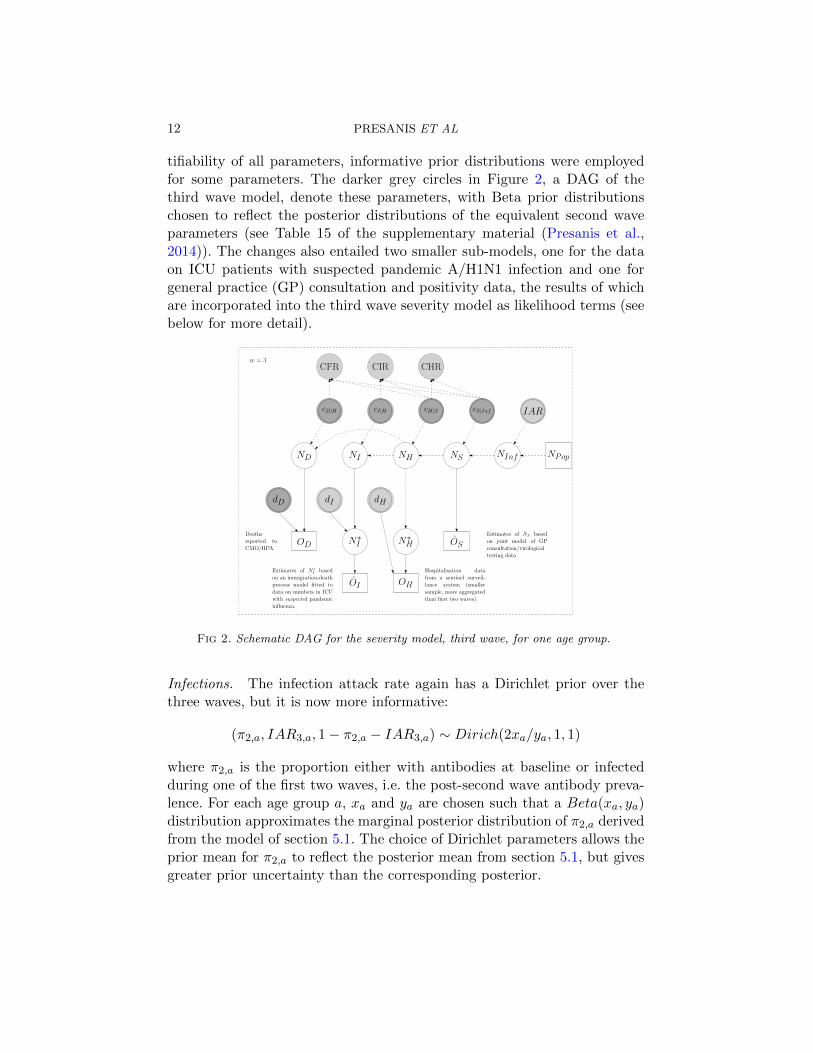
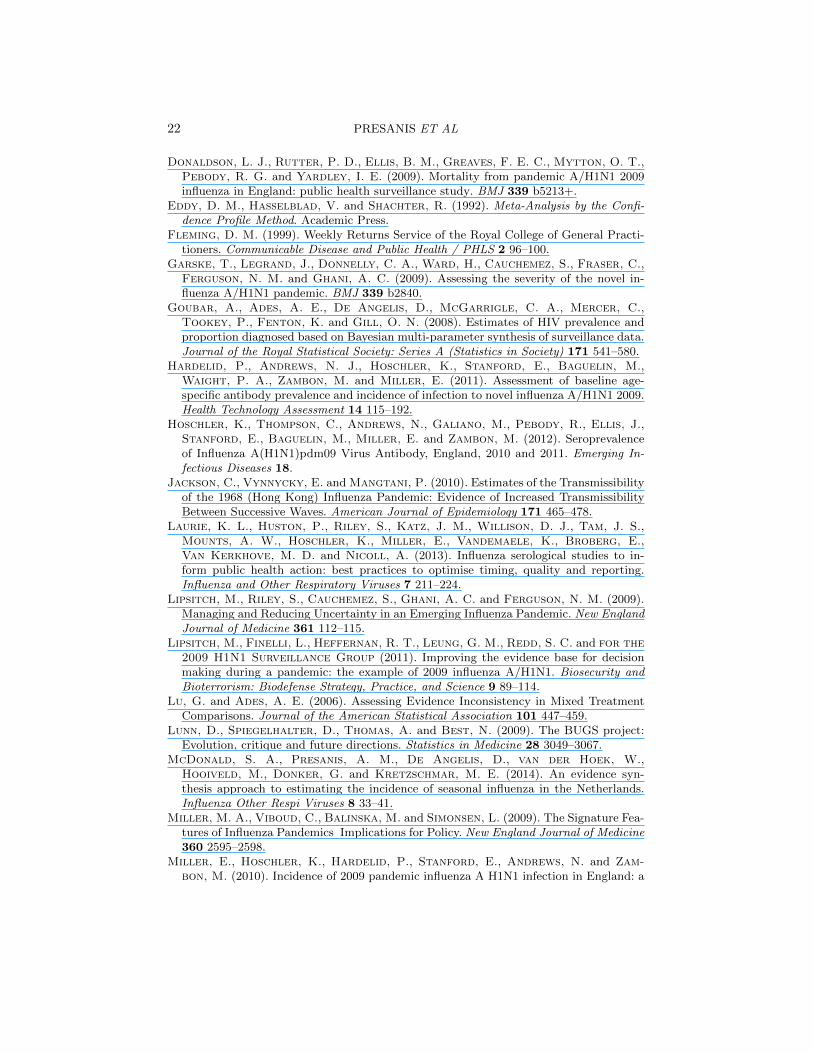
tifiability of all parameters, informative prior distributions were employedfor some parameters. The darker grey circles in Figure 2, a DAG of thethird wave model, denote these parameters, with Beta prior distributionschosen to reflect the posterior distributions of the equivalent second waveparameters (see Table 15 of the supplementary material (Presanis et al.,2014)). The changes also entailed two smaller sub-models, one for the dataon ICU patients with suspected pandemic A/H1N1 infection and one forgeneral practice (GP) consultation and positivity data, the results of whichare incorporated into the third wave severity model as likelihood terms (seebelow for more detail).
cS|InfcH|ScI|HcD|H
OD
CHRCIRCFR
NInfNSNHNIND
dD
IAR
NPop
OS
OI
Deathsreported toCMO/HPA
Estimates of NS basedon joint model of GPconsultation/virologicaltesting data
w = 3
N∗I
dI
Estimates of N ∗I basedon an immigration-deathprocess model fitted todata on numbers in ICUwith suspected pandemicinfluenza.
Hospitalisation datafrom a sentinel surveil-lance system (smallersample, more aggregatedthan first two waves)
OH
dH
N∗H
Fig 2. Schematic DAG for the severity model, third wave, for one age group.
Infections. The infection attack rate again has a Dirichlet prior over thethree waves, but it is now more informative:
(π2,a, IAR3,a, 1− π2,a − IAR3,a) ∼ Dirich(2xa/ya, 1, 1)
where π2,a is the proportion either with antibodies at baseline or infectedduring one of the first two waves, i.e. the post-second wave antibody preva-lence. For each age group a, xa and ya are chosen such that a Beta(xa, ya)distribution approximates the marginal posterior distribution of π2,a derivedfrom the model of section 5.1. The choice of Dirichlet parameters allows theprior mean for π2,a to reflect the posterior mean from section 5.1, but givesgreater prior uncertainty than the corresponding posterior.
SYNTHESISING EVIDENCE TO ESTIMATE INFLUENZA SEVERITY 13
Symptomatic infections. As the HPA did not produce estimates of the num-ber symptomatic during the third wave, data on ILI consultations and vi-rological positivity from an alternative primary care sentinel surveillancesystem (Fleming (1999), see section 1.2.1 of the supplementary material(Presanis et al., 2014)) were used to estimate the number symptomatic,before incorporating this estimate into the severity model. A log-linear re-gression of the ILI consultation data on time and age was fitted jointlywith a logistic regression of the positivity data on time and age (c.f. Birrellet al., 2011). A negative binomial likelihood was assumed for the consul-tation data and a binomial likelihood for the positivity data. The numbersymptomatic due to the pandemic A/H1N1 strain was then estimated asthe sum over weeks of the product of the expected consultation rate and theexpected proportion positive for pandemic A/H1N1, adjusted for the pro-portion of symptomatic patients who contact primary care. The resultingposterior mean (O
′3,a,S) and standard deviation (σ
′3,a,S) of the logarithm of
the number symptomatic are incorporated into the likelihood of the thirdwave severity model as a normal term:
O′3,a,S ∼ N
(log (N3,a,S) , σ
′23,a,S
)(see Section 3.1 of the supplementary material (Presanis et al., 2014) fordetails).
Hospitalisations. The hospitalisation data for the third wave (source (vi),section 1.2.2 of the supplementary material (Presanis et al., 2014)) comefrom a sentinel system. The observed number of hospitalisations thereforeprovides a lower bound for the number of hospitalisations, contributingto the total likelihood as a binomial component with probability param-eter given by the (non-age-specific) detection probability d3,H . Recall thatthese data are available at a coarser age aggregation than in the first twowaves. The size parameter is therefore a functional parameter N∗3,b,H =∑a∈Ab,H
N3,a,H that is a sum over the appropriate age groups a ∈ Ab,H ,where Ab,H are sets describing the mapping from the coarser age groups bto the severity model age groups a.
ICU admissions. The extra information on suspected patients present inICU (source (vii), section 1.2.3 of the supplementary material (Presaniset al., 2014)) are modelled as a bivariate immigration-death process to rep-resent movement in and out of ICU. This process is combined with thepositivity data of source (viii) to estimate the cumulative number of con-firmed pandemic A/H1N1 incident cases admitted to ICU during the thirdwave (section 4 of the supplementary material (Presanis et al., 2014)). The
14 PRESANIS ET AL
resulting posterior mean (standard deviation) of the logarithm of the cumu-lative ICU admissions, O
′3,b,I(σ
′3,b,I), are incorporated in the likelihood for
the third wave severity model as normally distributed:
O′3,b,I ∼ N
(log
(N∗3,b,I
), σ′23,b,I
)where b denotes the age-groups available for the suspected ICU data (twogroups: children and adults). As with the hospitalisation data, the N∗3,b,I =∑a∈Ab,I
N∗3,a,I are sums over the appropriate age groups. The number N∗w,a,Iis still a lower bound for the cumulative number of ICU admissions over thethird wave, since the data of source (vii) cover only a portion of the timeof the third wave: this is expressed as having a binomial distribution withsize parameter Nw,a,I and probability parameter given by the age-constantdetection probability dw,I .
Deaths. Finally, the observed deaths are again binomially distributed, asin the first two waves. Full details of the changes to model the third waveare given in section 3 of the supplementary material (Presanis et al., 2014).
5.3. Modelling all three waves simultaneously. Modelling the three wavesof infection in two stages enables the use of the posterior distributions ofcase-severity in the second wave as prior distributions in the third waveanalysis. However, a two-stage approach does not allow estimation of theposterior probability of a change in severity occurring over waves. To do sorequires modelling all three waves simultaneously, as if we had not seen anyof the data until the end of the third wave.
A joint model for all three waves implies different assumptions from thetwo-stage approach. First, the prior distribution for the infection attack ratesin each wave is assumed again to be diffuse:(
IAR1,a, IAR2,a, IAR3,a, 1−3∑
w=1
IARw,a
)∼ Dirich(1, 1, 1, 1)
Here, the remaining fraction of the population 1−∑3w=1 IARw,a comprises
both those with antibodies at baseline (pre-pandemic) and those remaininguninfected by the end of the third wave.
The proportion symptomatic, cS|Inf , is now constrained to be equal acrossall three waves and all age groups, instead of its third wave prior being in-formed by its second wave posterior distribution. Likewise, the three condi-tional probabilities sCHRw,a = cw,a,H|S , cw,a,I|H and cw,a,D|H for w = 3 areno longer given prior distributions based on second wave posterior distri-butions, but are parameterised in terms of their corresponding second wave
SYNTHESISING EVIDENCE TO ESTIMATE INFLUENZA SEVERITY 15
conditional probabilities:
logit(c3,a,l|λ) ∼ N(logit(c2,a,l|λ), τ2l|λ)(3)
for each (l|λ) ∈ {(H|S), (I|H), (D|H)}τl|λ ∼ Unif[0, 1]
A value of τ = 1 for the standard deviations would imply that the oddsratios of the third compared to the second wave probabilities lie between0.14 and 7.10. A value of τ = 0 would imply an odds ratio of 1, i.e. equalityof the conditional probabilities: c3,a,l|λ = c2,a,l|λ.
All other aspects of the joint model for all three waves are as in the sepa-rate first/second and third wave models of sections 5.1 and 5.2 respectively.
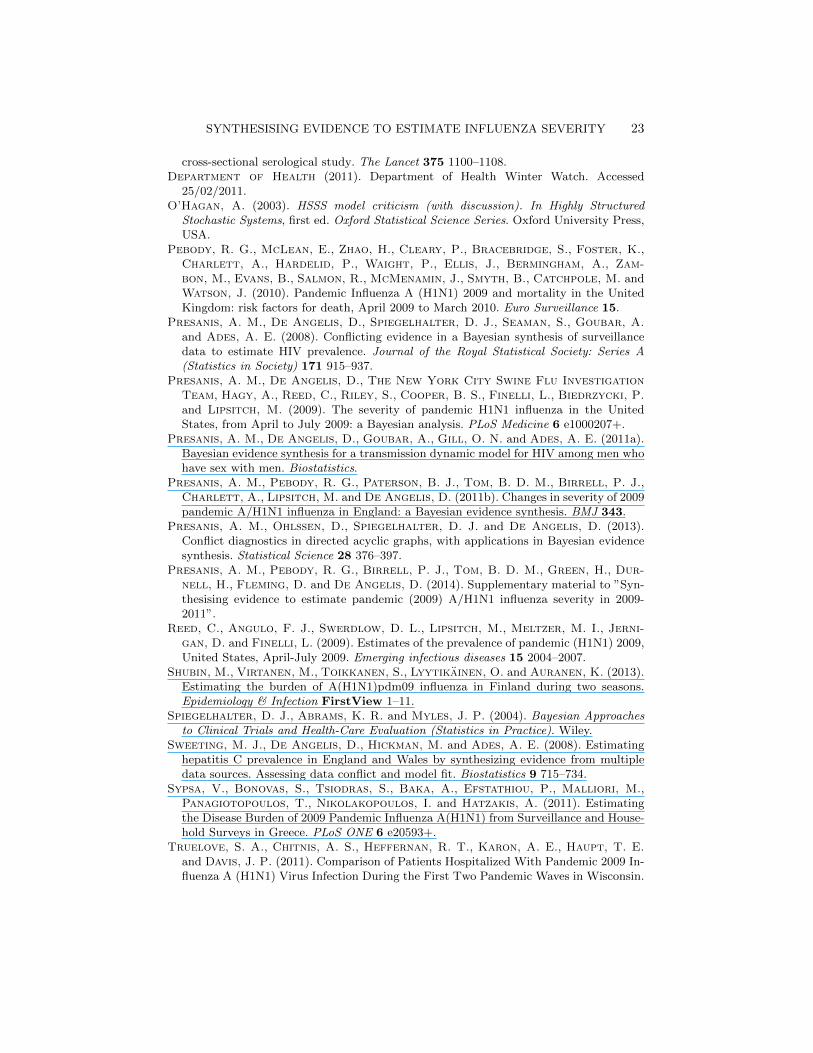
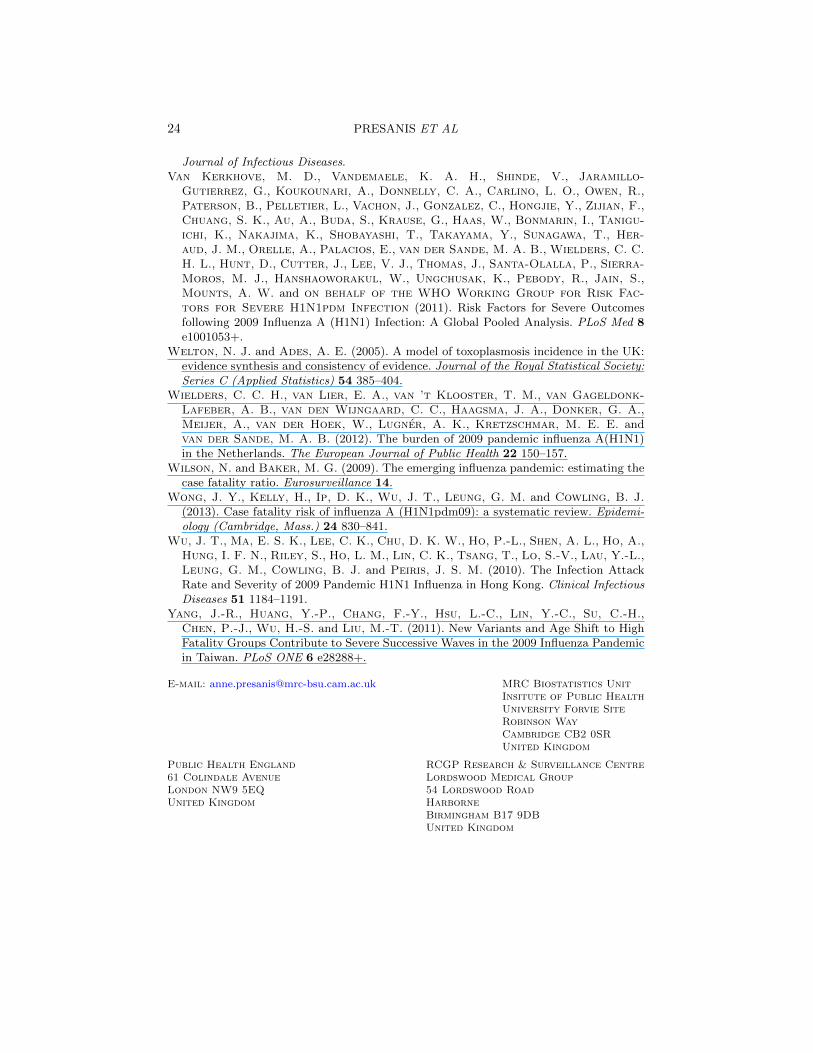
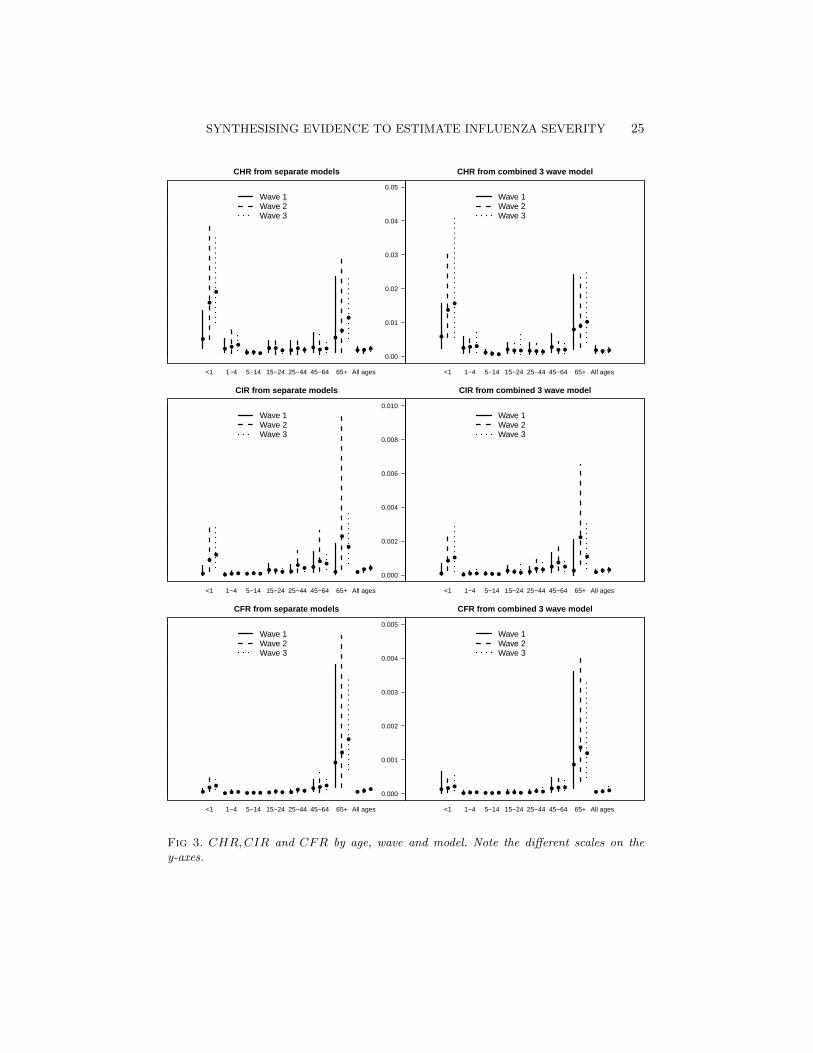
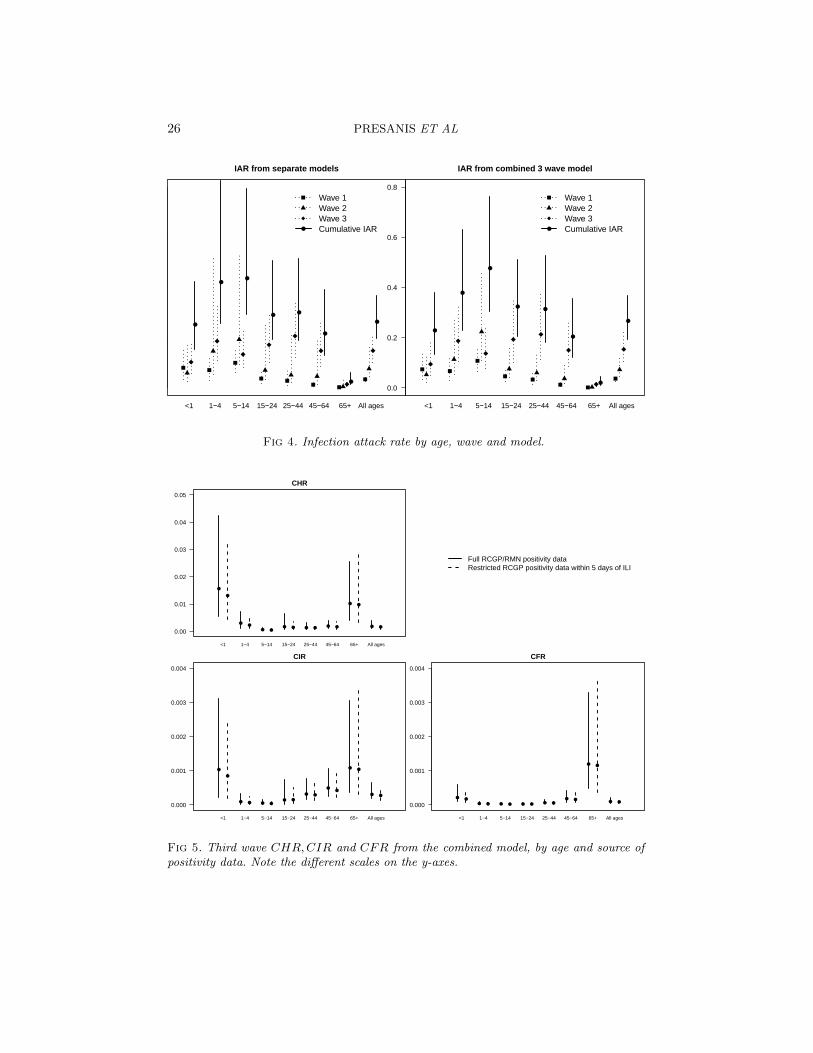
6. Results. Results from the model for the first two waves, given in fullin Presanis et al. (2011b), suggest a mild pandemic, characterised by case-severity risks increasing between the two waves. From the analysis of datafrom the third wave, Figures 3 and 4 show the posterior medians and 95%credible intervals for the case-severity risks and infection attack rates respec-tively, by age, wave and model. Although there are some differences betweenthe two-stage models (left-hand sides of the figures) and the combined three-wave model (right-hand sides), the conclusions are broadly similar. There isa clear “u-”shape to the age-distribution of the case-severity risks (Figure 3)in all three waves, with the youngest and oldest age groups having the high-est probabilities of experiencing severe events, but also the most uncertaintyin the estimates. The age-distribution of the infection attack rates (Figure4), on the other hand, is convex, with school-age children having the highestprobability of being infected in the first two waves, though not the third.
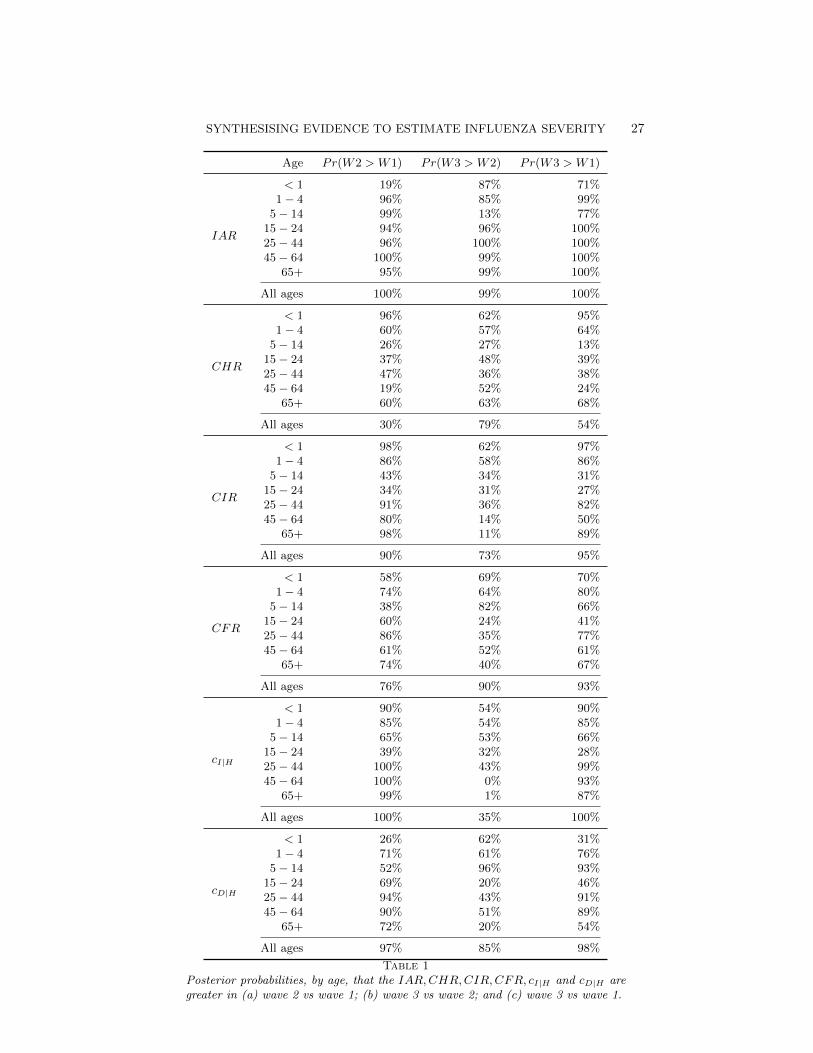
The joint three-wave model allows estimation of the posterior probabili-ties of increases across waves in either the attack rates or the case-severityrisks (Table 1). Across waves, there is some evidence of a shift in theage-distribution of the infection attack rates, with posterior probabilitiesp ≥ 0.85 of an increase from the second to third waves seen in adults and thevery young, but not in school-age children (posterior probability p = 0.13).
At first glance, the estimates averaged over the age groups (Table 1) sug-gest the case-severity risks have increased over all three waves. The poste-rior probabilities of a rise across waves of the CIR and CFR are all greaterthan 73%. However, closer scrutiny of the age-specific estimates shows thisincrease doesn’t occur consistently in every age group and wave. There isstronger evidence of a rise in ICU admission and fatalities from the first tosecond waves than from the second to third. The pattern is less clear in thecase-hospitalisation risks.
16 PRESANIS ET AL
The reason for the pattern of increase in the CIR and CFR over wavesis not immediately apparent without further investigation. Three possiblehypotheses are: (a) that the increase is due to the age-shift in the infectionattack rate away from school-age children towards adults across waves; (b)that the lack of third wave data and consequent parameterisation of some ofthe third wave conditional probabilities in terms of the corresponding secondwave probabilities (equation (4)) results in the attenuated change in severityfrom the second to third wave; and/or (c) that unaccounted differences inthe representativeness of the different surveillance systems used in the thirdwave compared to the first two may have an effect on the estimated severity.These possibilities are not mutually exclusive, and the extent to which theestimated severity is reliant on each is unknown.
6.1. Sensitivity analyses. The potential for unaccounted biases in thesero-prevalence data (sections 2 and 5.1.2), as well as the belief that theHPA case estimates represented under-estimates, prompted several sensitiv-ity analyses to further assess the uncertainty in the infection attack rates inthe first two waves. Sensitivity to the choice of data informing the denom-inators (the infection attack rate IARw,a or the number of symptomaticinfections Nw,a,S) and to the prior distribution of IARw,a was assessed.Specifically, four models with different data informing IARw,a and Nw,a,S
were considered:
1. using the HPA case estimates to inform Nw,a,S , assuming they do sounbiasedly in the first two waves (i.e. with dw,a,S = 1), and using nosero-prevalence data;
2. the model presented here and in Presanis et al. (2011b), assuming theHPA case estimates are biased downwards and using only the baselineand post-first wave sero-prevalence data;
3. as in model 2, but using all the sero-prevalence data (up to post-second wave) of Table 5 of section 1.1.3 of the supplementary material(Presanis et al., 2014), assuming the HPA case estimates are biaseddownwards in both waves; and
4. as in model 3, but assuming the sero-prevalence data are biased up-wards and the HPA case estimates are biased downwards.
Analyses using models 1 and 2 were then repeated using three different priordistributions for the infection attack rate:
a. Dirichlet(2, 2, 6), allowing the total attack rate over the two waves to bea priori 0.4 on average, with 95% prior mass in the interval (0.1−0.7),and with a 1 : 1 ratio between the two waves;
SYNTHESISING EVIDENCE TO ESTIMATE INFLUENZA SEVERITY 17
b. Dirichlet(2.67, 1.33, 6), allowing again a prior total attack rate of 0.4 (0.1−0.7), but with a 2:1 ratio between waves;
c. Dirichlet(1.33, 2.67, 6), allowing a prior total attack rate of 0.4 (0.1−0.7), with a 1 : 2 ratio between waves.
The choice of informative priors is motivated by the total attack rates inprior pandemics, with the prior uncertainty still relatively large. Jackson,Vynnycky and Mangtani (2010) found susceptible attack rates (i.e. propor-tion of susceptibles infected, as opposed to proportion of the total popu-lation) of between 19 and 58% in the first wave of the 1968-69 pandemic,compared to between 15 and 50% in the second, which motivates prior (b).This prior may in fact be sceptical for the 2009 pandemic, as instead of a2 : 1 ratio between waves, the HPA case estimates and the severe data sug-gest the ratio was at least 1 : 1, if not 1 : 2 or greater. However, this ratiomay vary by both age and region, with London in particular experiencing asomewhat different epidemic to the rest of the country (Birrell et al., 2011).Prior (c) therefore allows for the converse, with a greater second wave thanfirst.
The sensitivity analyses to the choice of prior distribution of the in-fection attack rate in the first two waves suggest the key messages fromPresanis et al. (2011b) are robust to the choice of prior distribution. Re-sults were less robust to the choice of denominator data included in themodel. The inclusion of the post-second wave sero-prevalence data suggesteda higher infection attack rate (28.4% (26.0−30.8%)) than the baseline anal-ysis (11.2% (7.4 − 18.9%)), with a corresponding lower case-fatality risk inthe second wave (0.0027% (0.0024− 0.0031%) compared to 0.009% (0.004−0.014%)). Full details of these sensitivity analyses are given in section 5 ofthe supplementary material (Presanis et al., 2014). Recall (section 5.1.2)that the samples tested post-second wave and before and after the thirdwave (Hoschler et al., 2012) may over-represent individuals at higher riskof infection and vaccination. The observed sero-prevalence in these samplesmay therefore suggest a higher infection attack rate than truly occurred.Further work to obtain background information on individuals in the sam-ples, and therefore to account for sampling biases, is underway, promptedin part by the results of these sensitivity analyses.
In the third wave, a sensitivity analysis to the set of virological positivitydata used was performed (sections 1.2.1 and 3.1 of the supplementary mate-rial (Presanis et al., 2014)). The main analysis used the full positivity data,with the results of the Bayesian joint regression model of the positivity andprimary care consultation data (Table 13 of the supplementary material)incorporated into the combined 3-wave model as shown in Figure 2 and sec-
18 PRESANIS ET AL
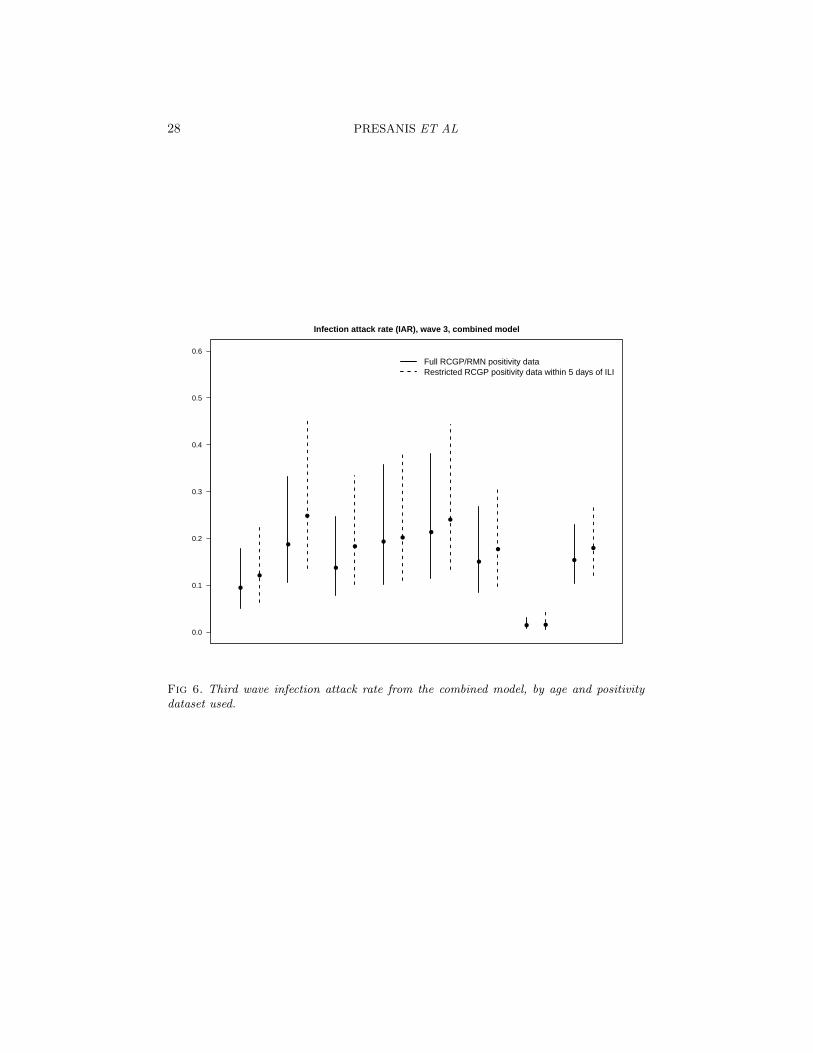
tion 3.1 of the supplementary material. The sensitivity analysis employedinstead a set of virological positivity data restricted to tests made on swabsthat were collected within 5 days of an ILI consultation, with correspondingresults from the joint regression model in Table 14 of the supplementary ma-terial. The results from including the two alternative sets of estimates fromthe joint regression model into the combined 3-wave model are compared inFigures 5 and 6.
The general conclusions about the age-distribution of the case-severityrisks and infection attack rate in the third wave are unchanged by the useof the restricted positivity data. The restricted data do imply a slightlyhigher and more uncertain attack rate in each age group (Figure 6), dueto the higher observed positivity and smaller sample sizes. Correspondingly,the case-severity risks are slightly lower in each age group in the sensitivityanalysis (Figure 5), but the greater uncertainty in the denominator does notseem to translate directly into greater uncertainty in the risks.
7. Discussion. We have extended and further developed a Bayesian ev-idence synthesis model (Presanis et al., 2011b) to characterise and estimatethe severity of the 2009 pandemic A/H1N1 strain of influenza in the threewaves of infection experienced in England. The model has been adaptedto account for changes in the surveillance data available over the course ofthe three waves, considering two approaches: (a) a two-stage approach, usingposterior distributions from the model for the first two waves to inform priordistributions for the third wave analysis; and (b) modelling all three wavessimultaneously, accounting for the reduction in available data by param-eterising the third wave severity parameters in terms of the correspondingsecond wave parameters. Both approaches have resulted in broadly the samethree key conclusions:
1. the age distribution in case-severity risks is “u-”shaped, implying chil-dren aged less than a year and older adults have highest severity, al-though their estimates are also the most uncertain. This pattern isconsistent with the increasing severity with age seen in other countriesduring the 2009 pandemic (Presanis et al., 2009; Wu et al., 2010; Sypsaet al., 2011; Shubin et al., 2013; Wong et al., 2013), where in each ofthese analyses, the authors did not distinguish between children under1 year of age and those aged 1-4. The pattern is also consistent withglobal relative risks by age of severe events compared to the generalpopulation estimated by Van Kerkhove et al. (2011).
2. The age distribution of the infection attack rate changes over waves,with school-age children most affected in the first two waves and an
SYNTHESISING EVIDENCE TO ESTIMATE INFLUENZA SEVERITY 19
increase in the attack rate in adults aged 25 and older from the secondto third waves.
3. When averaged over all ages, severity in those infected appears toincrease over the three waves.
The changing age distribution and apparent increase in severity over wavesis consistent with estimates from the two pandemic waves experienced byother countries (Yang et al., 2011; Truelove et al., 2011; Shubin et al., 2013).
It is important to note that the estimates presented here do not accountfor risk factors for severe influenza, nor for vaccination status nor for otherpreventive measures, such as social distancing, which might have an effecton severity. Both the joint regression model of virological positivity and GPconsultation and the full severity model would require further developmentto account for these factors and to be able to use the second and thirdwave serology data accounting for sampling biases. Assessment of the effecton estimates of assumptions – such as that of no influenza-related deathsoccurring outside of hospital or the parameterisation of the third wave interms of the second wave in the combined analysis – is also key. The possi-ble effect of any differences in representativeness of the various surveillancesystems in the third compared to the first two waves is an issue for fur-ther investigation. The sample sizes and prior distributions chosen do notprovide enough information to enable convergence of the MCMC algorithmfor the severity model when taking the number of infections Nw,a,l to be aBinomial realisation from the number at a less severe level λ. This lack ofconvergence implies there may be too much uncertainty to allow identifi-ability of the model in this case, prompting instead the mean assumptionNw,a,l = cw,a,l|λ × Nw,a,λ. Another area for future investigation is to assesshow informative the priors are required to be or how large sample sizes needto be to enable convergence when the Nw,a,λ are stochastic.
Despite these challenges, our Bayesian evidence synthesis approach hasallowed us to draw important public health conclusions, not only in char-acterising the severity of the 2009 pandemic, but also in shaping futureresearch. The sensitivity analyses showed the severity estimates were ro-bust to prior assumptions about the infection attack rate, but less robustto the choice of data to include in informing the attack rate. Although themagnitude of the severity estimates varied, the conclusions of a “u-”shapedage distribution to severity and an apparent increase in severity over waveswere nevertheless robust. The sensitivity of the results has, furthermore,contributed to the initiation of a project to obtain further data to betterunderstand the potential sampling bias in the sero-prevalence data (Laurieet al., 2013).
20 PRESANIS ET AL
The evidence synthesis framework has also given us the flexibility to ac-count for biases, using prior information on parameters representing thebiases, for example. Bias modelling has been an integral part of the modeldevelopment, inference and criticism cycle, as have the sensitivity analyses.It is important, in any analysis, to understand the contribution of each itemof evidence, whether in the form of model structure, prior distribution ordata, in driving inferences. It is particularly crucial when an analysis relieson informative priors for identifiability, as is the case here. Another key as-pect of model criticism in an evidence synthesis is to assess the consistencyof the various data sources, not only with each other, but also with themodel structure. It is possible, and indeed common, in syntheses of multi-ple sources of evidence to find both that some parameters are only barelyidentified by the data and that other parameters are informed indirectlyby more than one data item. In the latter case, there is clearly potentialfor different sources of data to conflict, providing inconsistent evidence ona particular parameter (Lu and Ades, 2006; Sweeting et al., 2008; Presaniset al., 2008). Such conflicts need to be detected, measured, understood andresolved. Conflict diagnostics, in the form of cross-validatory posterior pre-diction, for the first wave confirm the inconsistency between the serologydata and the HPA estimates of the number symptomatic if taken at facevalue (Presanis et al., 2013). In our main analysis, we addressed the conflictby incorporating a bias parameter for the HPA estimates, whereas in thesensitivity analyses, we also considered a bias parameter for the serologydata. Further preliminary work on measuring conflict seems to confirm thesuggestion of the sensitivity analyses that the severe end data does indeedconflict with the evidence on the attack rates. Given the uncertainties inthe attack rates, understanding and resolving this conflict is an importantnext step. The iterative process of fitting, criticising and further developingan evidence synthesis model to address conflicts, as we have done and arecontinuing to do here, leads automatically to internal consistency. By con-trast, external validation is much more challenging in an evidence synthesisframework. As already noted, due to identifiability issues common to evi-dence syntheses, it is rare to find external data against which to validate -such data are instead used in the synthesis.
Despite these challenges, an evidence synthesis using a complex proba-bilistic model provides a powerful approach to estimating influenza severitywhen the available evidence comes from multiple sources that are incompleteand biased. The embedding of a “pyramid” approach to severity estimationwithin an evidence synthesis framework, as presented here, is easily adaptedto other contexts, both within epidemiology, where many diseases may be
SYNTHESISING EVIDENCE TO ESTIMATE INFLUENZA SEVERITY 21
observed at different levels of severity or diagnosis, and in other fields whereobservation occurs at different levels, e.g. quality control or ecology.
Acknowledgements. We thank colleagues at Public Health Englandand the Royal College of General Practitioners, particularly Michele Barley,who provided data for this analysis. We are grateful to all GPs who partic-ipate in the RCGP Weekly Returns Service. We would particularly like toacknowledge Prof. J. R. Norris (University of Cambridge) and Prof. MarcLipsitch (Harvard School of Public Health) for advice on early versions ofthis analysis.
SUPPLEMENTARY MATERIAL
Supplement A: Appendix: Synthesising evidence to estimatepandemic (2009) A/H1N1 influenza severity in 2009-2011(; .pdf). Appendix describing the data, further model details and sensitivityanalyses.
References.
Ades, A. E. and Sutton, A. J. (2006). Multiparameter evidence synthesis in epidemiol-ogy and medical decision-making: current approaches. Journal of the Royal StatisticalSociety: Series A (Statistics in Society) 169 5–35.
Health Protection Agency (2010). Epidemiological report of pandemic (H1N1) 2009in the UK Technical Report, Health Protection Agency.
Health Protection Agency, Health Protection Scotland, Communicable Dis-ease Surveillance Centre Northern Ireland and National Public HealthService for Wales (2009). First Few Hundred (FF100) Project: Epidemiological Pro-tocols for Comprehensive Assessment of Early Swine Influenza Cases in the UnitedKingdom Technical Report, Health Protection Agency.
Albert, I., Espie, E., de Valk, H. and Denis, J.-B. B. (2011). A Bayesian evidencesynthesis for estimating campylobacteriosis prevalence. Risk Analysis 31 1141–1155.
Bird, S. M. (2010). Like-with-like comparisons? The Lancet 376 684+.Birrell, P. J., Ketsetzis, G., Gay, N. J., Cooper, B. S., Presanis, A. M., Har-
ris, R. J., Charlett, A., Zhang, X.-S., White, P. J., Pebody, R. G. and De An-gelis, D. (2011). Bayesian modeling to unmask and predict influenza A/H1N1pdmdynamics in London. Proceedings of the National Academy of Sciences 108 18238–18243.
Box, G. E. P. (1980). Sampling and Bayes’ Inference in Scientific Modelling and Robust-ness. Journal of the Royal Statistical Society. Series A (General) 143 383–430.
Brooks, S. P. and Gelman, A. (1998). General Methods for Monitoring Convergence ofIterative Simulations. Journal of Computational and Graphical Statistics 7 434–455.
Campbell, C. N. J., Mytton, O. T., McLean, E. M., Rutter, P. D., Pebody, R. G.,Sachedina, N., White, P. J., Hawkins, C., Evans, B., Waight, P. A., Ellis, J.,Bermingham, A., Donaldson, L. J. and Catchpole, M. (2011). Hospitalization intwo waves of pandemic influenza A(H1N1) in England. Epidemiology and Infection 1391560–1569.
22 PRESANIS ET AL
Donaldson, L. J., Rutter, P. D., Ellis, B. M., Greaves, F. E. C., Mytton, O. T.,Pebody, R. G. and Yardley, I. E. (2009). Mortality from pandemic A/H1N1 2009influenza in England: public health surveillance study. BMJ 339 b5213+.
Eddy, D. M., Hasselblad, V. and Shachter, R. (1992). Meta-Analysis by the Confi-dence Profile Method. Academic Press.
Fleming, D. M. (1999). Weekly Returns Service of the Royal College of General Practi-tioners. Communicable Disease and Public Health / PHLS 2 96–100.
Garske, T., Legrand, J., Donnelly, C. A., Ward, H., Cauchemez, S., Fraser, C.,Ferguson, N. M. and Ghani, A. C. (2009). Assessing the severity of the novel in-fluenza A/H1N1 pandemic. BMJ 339 b2840.
Goubar, A., Ades, A. E., De Angelis, D., McGarrigle, C. A., Mercer, C.,Tookey, P., Fenton, K. and Gill, O. N. (2008). Estimates of HIV prevalence andproportion diagnosed based on Bayesian multi-parameter synthesis of surveillance data.Journal of the Royal Statistical Society: Series A (Statistics in Society) 171 541–580.
Hardelid, P., Andrews, N. J., Hoschler, K., Stanford, E., Baguelin, M.,Waight, P. A., Zambon, M. and Miller, E. (2011). Assessment of baseline age-specific antibody prevalence and incidence of infection to novel influenza A/H1N1 2009.Health Technology Assessment 14 115–192.
Hoschler, K., Thompson, C., Andrews, N., Galiano, M., Pebody, R., Ellis, J.,Stanford, E., Baguelin, M., Miller, E. and Zambon, M. (2012). Seroprevalenceof Influenza A(H1N1)pdm09 Virus Antibody, England, 2010 and 2011. Emerging In-fectious Diseases 18.
Jackson, C., Vynnycky, E. and Mangtani, P. (2010). Estimates of the Transmissibilityof the 1968 (Hong Kong) Influenza Pandemic: Evidence of Increased TransmissibilityBetween Successive Waves. American Journal of Epidemiology 171 465–478.
Laurie, K. L., Huston, P., Riley, S., Katz, J. M., Willison, D. J., Tam, J. S.,Mounts, A. W., Hoschler, K., Miller, E., Vandemaele, K., Broberg, E.,Van Kerkhove, M. D. and Nicoll, A. (2013). Influenza serological studies to in-form public health action: best practices to optimise timing, quality and reporting.Influenza and Other Respiratory Viruses 7 211–224.
Lipsitch, M., Riley, S., Cauchemez, S., Ghani, A. C. and Ferguson, N. M. (2009).Managing and Reducing Uncertainty in an Emerging Influenza Pandemic. New EnglandJournal of Medicine 361 112–115.
Lipsitch, M., Finelli, L., Heffernan, R. T., Leung, G. M., Redd, S. C. and for the2009 H1N1 Surveillance Group (2011). Improving the evidence base for decisionmaking during a pandemic: the example of 2009 influenza A/H1N1. Biosecurity andBioterrorism: Biodefense Strategy, Practice, and Science 9 89–114.
Lu, G. and Ades, A. E. (2006). Assessing Evidence Inconsistency in Mixed TreatmentComparisons. Journal of the American Statistical Association 101 447–459.
Lunn, D., Spiegelhalter, D., Thomas, A. and Best, N. (2009). The BUGS project:Evolution, critique and future directions. Statistics in Medicine 28 3049–3067.
McDonald, S. A., Presanis, A. M., De Angelis, D., van der Hoek, W.,Hooiveld, M., Donker, G. and Kretzschmar, M. E. (2014). An evidence syn-thesis approach to estimating the incidence of seasonal influenza in the Netherlands.Influenza Other Respi Viruses 8 33–41.
Miller, M. A., Viboud, C., Balinska, M. and Simonsen, L. (2009). The Signature Fea-tures of Influenza Pandemics Implications for Policy. New England Journal of Medicine360 2595–2598.
Miller, E., Hoschler, K., Hardelid, P., Stanford, E., Andrews, N. and Zam-bon, M. (2010). Incidence of 2009 pandemic influenza A H1N1 infection in England: a
SYNTHESISING EVIDENCE TO ESTIMATE INFLUENZA SEVERITY 23
cross-sectional serological study. The Lancet 375 1100–1108.Department of Health (2011). Department of Health Winter Watch. Accessed
25/02/2011.O’Hagan, A. (2003). HSSS model criticism (with discussion). In Highly Structured
Stochastic Systems, first ed. Oxford Statistical Science Series. Oxford University Press,USA.
Pebody, R. G., McLean, E., Zhao, H., Cleary, P., Bracebridge, S., Foster, K.,Charlett, A., Hardelid, P., Waight, P., Ellis, J., Bermingham, A., Zam-bon, M., Evans, B., Salmon, R., McMenamin, J., Smyth, B., Catchpole, M. andWatson, J. (2010). Pandemic Influenza A (H1N1) 2009 and mortality in the UnitedKingdom: risk factors for death, April 2009 to March 2010. Euro Surveillance 15.
Presanis, A. M., De Angelis, D., Spiegelhalter, D. J., Seaman, S., Goubar, A.and Ades, A. E. (2008). Conflicting evidence in a Bayesian synthesis of surveillancedata to estimate HIV prevalence. Journal of the Royal Statistical Society: Series A(Statistics in Society) 171 915–937.
Presanis, A. M., De Angelis, D., The New York City Swine Flu InvestigationTeam, Hagy, A., Reed, C., Riley, S., Cooper, B. S., Finelli, L., Biedrzycki, P.and Lipsitch, M. (2009). The severity of pandemic H1N1 influenza in the UnitedStates, from April to July 2009: a Bayesian analysis. PLoS Medicine 6 e1000207+.
Presanis, A. M., De Angelis, D., Goubar, A., Gill, O. N. and Ades, A. E. (2011a).Bayesian evidence synthesis for a transmission dynamic model for HIV among men whohave sex with men. Biostatistics.
Presanis, A. M., Pebody, R. G., Paterson, B. J., Tom, B. D. M., Birrell, P. J.,Charlett, A., Lipsitch, M. and De Angelis, D. (2011b). Changes in severity of 2009pandemic A/H1N1 influenza in England: a Bayesian evidence synthesis. BMJ 343.
Presanis, A. M., Ohlssen, D., Spiegelhalter, D. J. and De Angelis, D. (2013).Conflict diagnostics in directed acyclic graphs, with applications in Bayesian evidencesynthesis. Statistical Science 28 376–397.
Presanis, A. M., Pebody, R. G., Birrell, P. J., Tom, B. D. M., Green, H., Dur-nell, H., Fleming, D. and De Angelis, D. (2014). Supplementary material to ”Syn-thesising evidence to estimate pandemic (2009) A/H1N1 influenza severity in 2009-2011”.
Reed, C., Angulo, F. J., Swerdlow, D. L., Lipsitch, M., Meltzer, M. I., Jerni-gan, D. and Finelli, L. (2009). Estimates of the prevalence of pandemic (H1N1) 2009,United States, April-July 2009. Emerging infectious diseases 15 2004–2007.
Shubin, M., Virtanen, M., Toikkanen, S., Lyytikainen, O. and Auranen, K. (2013).Estimating the burden of A(H1N1)pdm09 influenza in Finland during two seasons.Epidemiology & Infection FirstView 1–11.
Spiegelhalter, D. J., Abrams, K. R. and Myles, J. P. (2004). Bayesian Approachesto Clinical Trials and Health-Care Evaluation (Statistics in Practice). Wiley.
Sweeting, M. J., De Angelis, D., Hickman, M. and Ades, A. E. (2008). Estimatinghepatitis C prevalence in England and Wales by synthesizing evidence from multipledata sources. Assessing data conflict and model fit. Biostatistics 9 715–734.
Sypsa, V., Bonovas, S., Tsiodras, S., Baka, A., Efstathiou, P., Malliori, M.,Panagiotopoulos, T., Nikolakopoulos, I. and Hatzakis, A. (2011). Estimatingthe Disease Burden of 2009 Pandemic Influenza A(H1N1) from Surveillance and House-hold Surveys in Greece. PLoS ONE 6 e20593+.
Truelove, S. A., Chitnis, A. S., Heffernan, R. T., Karon, A. E., Haupt, T. E.and Davis, J. P. (2011). Comparison of Patients Hospitalized With Pandemic 2009 In-fluenza A (H1N1) Virus Infection During the First Two Pandemic Waves in Wisconsin.
24 PRESANIS ET AL
Journal of Infectious Diseases.Van Kerkhove, M. D., Vandemaele, K. A. H., Shinde, V., Jaramillo-
Gutierrez, G., Koukounari, A., Donnelly, C. A., Carlino, L. O., Owen, R.,Paterson, B., Pelletier, L., Vachon, J., Gonzalez, C., Hongjie, Y., Zijian, F.,Chuang, S. K., Au, A., Buda, S., Krause, G., Haas, W., Bonmarin, I., Tanigu-ichi, K., Nakajima, K., Shobayashi, T., Takayama, Y., Sunagawa, T., Her-aud, J. M., Orelle, A., Palacios, E., van der Sande, M. A. B., Wielders, C. C.H. L., Hunt, D., Cutter, J., Lee, V. J., Thomas, J., Santa-Olalla, P., Sierra-Moros, M. J., Hanshaoworakul, W., Ungchusak, K., Pebody, R., Jain, S.,Mounts, A. W. and on behalf of the WHO Working Group for Risk Fac-tors for Severe H1N1pdm Infection (2011). Risk Factors for Severe Outcomesfollowing 2009 Influenza A (H1N1) Infection: A Global Pooled Analysis. PLoS Med 8e1001053+.
Welton, N. J. and Ades, A. E. (2005). A model of toxoplasmosis incidence in the UK:evidence synthesis and consistency of evidence. Journal of the Royal Statistical Society:Series C (Applied Statistics) 54 385–404.
Wielders, C. C. H., van Lier, E. A., van ’t Klooster, T. M., van Gageldonk-Lafeber, A. B., van den Wijngaard, C. C., Haagsma, J. A., Donker, G. A.,Meijer, A., van der Hoek, W., Lugner, A. K., Kretzschmar, M. E. E. andvan der Sande, M. A. B. (2012). The burden of 2009 pandemic influenza A(H1N1)in the Netherlands. The European Journal of Public Health 22 150–157.
Wilson, N. and Baker, M. G. (2009). The emerging influenza pandemic: estimating thecase fatality ratio. Eurosurveillance 14.
Wong, J. Y., Kelly, H., Ip, D. K., Wu, J. T., Leung, G. M. and Cowling, B. J.(2013). Case fatality risk of influenza A (H1N1pdm09): a systematic review. Epidemi-ology (Cambridge, Mass.) 24 830–841.
Wu, J. T., Ma, E. S. K., Lee, C. K., Chu, D. K. W., Ho, P.-L., Shen, A. L., Ho, A.,Hung, I. F. N., Riley, S., Ho, L. M., Lin, C. K., Tsang, T., Lo, S.-V., Lau, Y.-L.,Leung, G. M., Cowling, B. J. and Peiris, J. S. M. (2010). The Infection AttackRate and Severity of 2009 Pandemic H1N1 Influenza in Hong Kong. Clinical InfectiousDiseases 51 1184–1191.
Yang, J.-R., Huang, Y.-P., Chang, F.-Y., Hsu, L.-C., Lin, Y.-C., Su, C.-H.,Chen, P.-J., Wu, H.-S. and Liu, M.-T. (2011). New Variants and Age Shift to HighFatality Groups Contribute to Severe Successive Waves in the 2009 Influenza Pandemicin Taiwan. PLoS ONE 6 e28288+.
E-mail: [email protected] MRC Biostatistics UnitInsitute of Public HealthUniversity Forvie SiteRobinson WayCambridge CB2 0SRUnited Kingdom
Public Health England61 Colindale AvenueLondon NW9 5EQUnited Kingdom
RCGP Research & Surveillance CentreLordswood Medical Group54 Lordswood RoadHarborneBirmingham B17 9DBUnited Kingdom
SYNTHESISING EVIDENCE TO ESTIMATE INFLUENZA SEVERITY 25
CHR from separate models
Age group
<1 1−4 5−14 15−24 25−44 45−64 65+ All ages
●
●
●
● ● ●
● ● ●● ● ● ● ● ●
● ● ●
●
●
●
● ● ●
Wave 1Wave 2Wave 3
0.00
0.01
0.02
0.03
0.04
0.05
CHR from combined 3 wave model
Age group
<1 1−4 5−14 15−24 25−44 45−64 65+ All ages
●
●
●
● ● ●
● ● ●● ● ● ● ● ●
●● ●
●●
●
● ● ●
Wave 1Wave 2Wave 3
CIR from separate models
Age group
<1 1−4 5−14 15−24 25−44 45−64 65+ All ages
●
●●
● ● ● ● ● ●● ● ● ●
●● ●
●●
●
●
●
●● ●
Wave 1Wave 2Wave 3
0.000
0.002
0.004
0.006
0.008
0.010
CIR from combined 3 wave model
Age group
<1 1−4 5−14 15−24 25−44 45−64 65+ All ages
●
●●
● ● ● ● ● ●● ● ● ●
● ●●
●●
●
●
●
● ● ●
Wave 1Wave 2Wave 3
CFR from separate models
<1 1−4 5−14 15−24 25−44 45−64 65+ All ages
●● ●
● ● ● ● ● ● ● ● ● ●● ●
● ● ●
●
●
●
● ● ●
Wave 1Wave 2Wave 3
0.000
0.001
0.002
0.003
0.004
0.005
CFR from combined 3 wave model
<1 1−4 5−14 15−24 25−44 45−64 65+ All ages
● ● ●
● ● ● ● ● ● ● ● ● ● ● ●● ● ●
●
●●
● ● ●
Wave 1Wave 2Wave 3
Fig 3. CHR,CIR and CFR by age, wave and model. Note the different scales on they-axes.
26 PRESANIS ET AL
IAR from separate models
<1 1−4 5−14 15−24 25−44 45−64 65+ All ages
●
●●
● ●
●
●
●
●
Wave 1Wave 2Wave 3Cumulative IAR
0.0
0.2
0.4
0.6
0.8
IAR from combined 3 wave model
<1 1−4 5−14 15−24 25−44 45−64 65+ All ages
●
●
●
● ●
●
●
●
●
Wave 1Wave 2Wave 3Cumulative IAR
Fig 4. Infection attack rate by age, wave and model.
0.00
0.01
0.02
0.03
0.04
0.05
CHR
Age group
<1 1−4 5−14 15−24 25−44 45−64 65+ All ages
●
●
● ●● ●
● ● ● ● ● ●
● ●
● ●
Full RCGP/RMN positivity dataRestricted RCGP positivity data within 5 days of ILI
0.000
0.001
0.002
0.003
0.004
CIR
<1 1−4 5−14 15−24 25−44 45−64 65+ All ages
●
●
● ● ● ●● ●
● ●
●●
● ●
● ●
0.000
0.001
0.002
0.003
0.004
CFR
<1 1−4 5−14 15−24 25−44 45−64 65+ All ages
● ●● ● ● ● ● ● ● ●
● ●
● ●
● ●
Fig 5. Third wave CHR,CIR and CFR from the combined model, by age and source ofpositivity data. Note the different scales on the y-axes.
SYNTHESISING EVIDENCE TO ESTIMATE INFLUENZA SEVERITY 27
Age Pr(W2 > W1) Pr(W3 > W2) Pr(W3 > W1)
IAR
< 1 19% 87% 71%1 − 4 96% 85% 99%
5 − 14 99% 13% 77%15 − 24 94% 96% 100%25 − 44 96% 100% 100%45 − 64 100% 99% 100%
65+ 95% 99% 100%
All ages 100% 99% 100%
CHR
< 1 96% 62% 95%1 − 4 60% 57% 64%
5 − 14 26% 27% 13%15 − 24 37% 48% 39%25 − 44 47% 36% 38%45 − 64 19% 52% 24%
65+ 60% 63% 68%
All ages 30% 79% 54%
CIR
< 1 98% 62% 97%1 − 4 86% 58% 86%
5 − 14 43% 34% 31%15 − 24 34% 31% 27%25 − 44 91% 36% 82%45 − 64 80% 14% 50%
65+ 98% 11% 89%
All ages 90% 73% 95%
CFR
< 1 58% 69% 70%1 − 4 74% 64% 80%
5 − 14 38% 82% 66%15 − 24 60% 24% 41%25 − 44 86% 35% 77%45 − 64 61% 52% 61%
65+ 74% 40% 67%
All ages 76% 90% 93%
cI|H
< 1 90% 54% 90%1 − 4 85% 54% 85%
5 − 14 65% 53% 66%15 − 24 39% 32% 28%25 − 44 100% 43% 99%45 − 64 100% 0% 93%
65+ 99% 1% 87%
All ages 100% 35% 100%
cD|H
< 1 26% 62% 31%1 − 4 71% 61% 76%
5 − 14 52% 96% 93%15 − 24 69% 20% 46%25 − 44 94% 43% 91%45 − 64 90% 51% 89%
65+ 72% 20% 54%
All ages 97% 85% 98%
Table 1Posterior probabilities, by age, that the IAR,CHR,CIR,CFR, cI|H and cD|H aregreater in (a) wave 2 vs wave 1; (b) wave 3 vs wave 2; and (c) wave 3 vs wave 1.
28 PRESANIS ET AL
0.0
0.1
0.2
0.3
0.4
0.5
0.6
Infection attack rate (IAR), wave 3, combined model
●
●
●
●
●
●●
●●
●
●
●
● ●
●
●
Full RCGP/RMN positivity dataRestricted RCGP positivity data within 5 days of ILI
Fig 6. Third wave infection attack rate from the combined model, by age and positivitydataset used.
Related Documents


