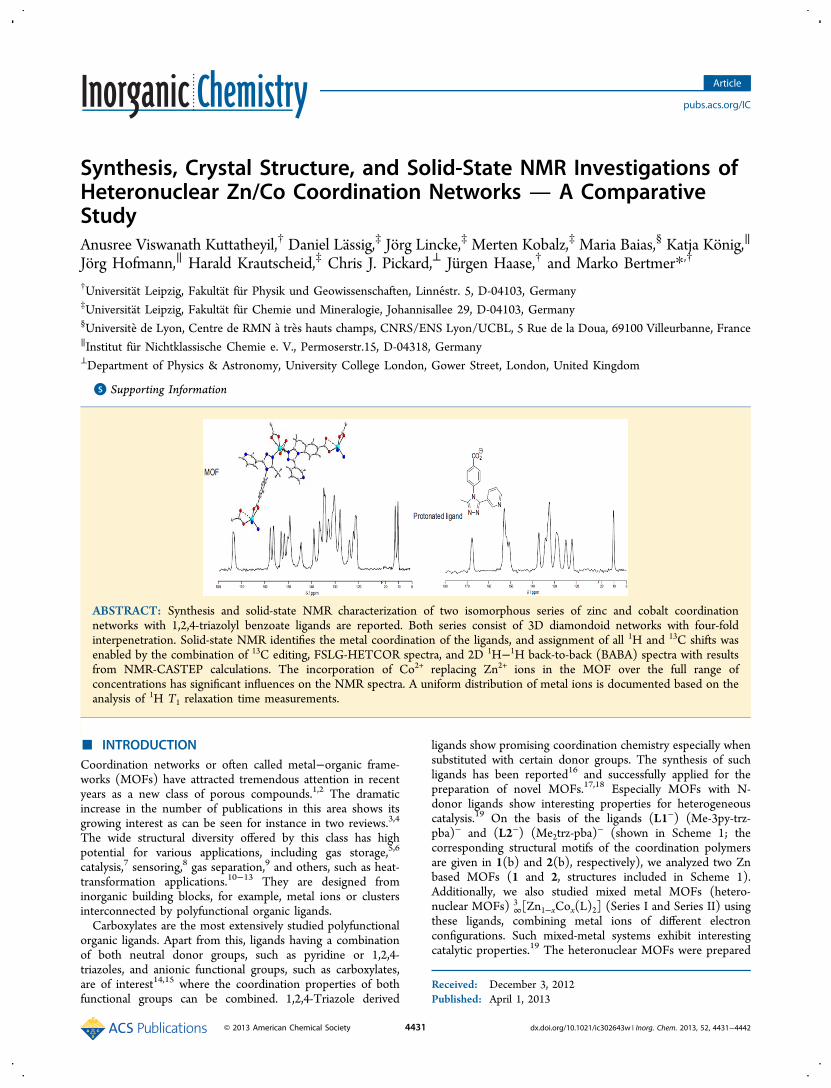
Synthesis, Crystal Structure, and Solid-State NMR Investigations of Heteronuclear Zn/Co Coordination Networks A Comparative Study Anusree Viswanath Kuttatheyil, † Daniel La ̈ ssig, ‡ Jö rg Lincke, ‡ Merten Kobalz, ‡ Maria Baias, § Katja Kö nig, ∥ Jö rg Hofmann, ∥ Harald Krautscheid, ‡ Chris J. Pickard, ⊥ Jü rgen Haase, † and Marko Bertmer* ,† † Universitä t Leipzig, Fakultä t fü r Physik und Geowissenschaften, Linne ́ str. 5, D-04103, Germany ‡ Universitä t Leipzig, Fakultä t fü r Chemie und Mineralogie, Johannisallee 29, D-04103, Germany § Universite ̀ de Lyon, Centre de RMN a ̀ tre ̀ s hauts champs, CNRS/ENS Lyon/UCBL, 5 Rue de la Doua, 69100 Villeurbanne, France ∥ Institut fü r Nichtklassische Chemie e. V., Permoserstr.15, D-04318, Germany ⊥ Department of Physics & Astronomy, University College London, Gower Street, London, United Kingdom * S Supporting Information ABSTRACT: Synthesis and solid-state NMR characterization of two isomorphous series of zinc and cobalt coordination networks with 1,2,4-triazolyl benzoate ligands are reported. Both series consist of 3D diamondoid networks with four-fold interpenetration. Solid-state NMR identifies the metal coordination of the ligands, and assignment of all 1 H and 13 C shifts was enabled by the combination of 13 C editing, FSLG-HETCOR spectra, and 2D 1 H− 1 H back-to-back (BABA) spectra with results from NMR-CASTEP calculations. The incorporation of Co 2+ replacing Zn 2+ ions in the MOF over the full range of concentrations has significant influences on the NMR spectra. A uniform distribution of metal ions is documented based on the analysis of 1 H T 1 relaxation time measurements. ■ INTRODUCTION Coordination networks or often called metal−organic frame- works (MOFs) have attracted tremendous attention in recent years as a new class of porous compounds. 1,2 The dramatic increase in the number of publications in this area shows its growing interest as can be seen for instance in two reviews. 3,4 The wide structural diversity offered by this class has high potential for various applications, including gas storage, 5,6 catalysis, 7 sensoring, 8 gas separation, 9 and others, such as heat- transformation applications. 10−13 They are designed from inorganic building blocks, for example, metal ions or clusters interconnected by polyfunctional organic ligands. Carboxylates are the most extensively studied polyfunctional organic ligands. Apart from this, ligands having a combination of both neutral donor groups, such as pyridine or 1,2,4- triazoles, and anionic functional groups, such as carboxylates, are of interest 14,15 where the coordination properties of both functional groups can be combined. 1,2,4-Triazole derived ligands show promising coordination chemistry especially when substituted with certain donor groups. The synthesis of such ligands has been reported 16 and successfully applied for the preparation of novel MOFs. 17,18 Especially MOFs with N- donor ligands show interesting properties for heterogeneous catalysis. 19 On the basis of the ligands (L1 − ) (Me-3py-trz- pba) − and (L2 − ) (Me 2 trz-pba) − (shown in Scheme 1; the corresponding structural motifs of the coordination polymers are given in 1(b) and 2(b), respectively), we analyzed two Zn based MOFs (1 and 2, structures included in Scheme 1). Additionally, we also studied mixed metal MOFs (hetero- nuclear MOFs) ∞ 3 [Zn 1−x Co x (L) 2 ] (Series I and Series II) using these ligands, combining metal ions of different electron configurations. Such mixed-metal systems exhibit interesting catalytic properties. 19 The heteronuclear MOFs were prepared Received: December 3, 2012 Published: April 1, 2013 Article pubs.acs.org/IC © 2013 American Chemical Society 4431 dx.doi.org/10.1021/ic302643w | Inorg. Chem. 2013, 52, 4431−4442

Welcome message from author
This document is posted to help you gain knowledge. Please leave a comment to let me know what you think about it! Share it to your friends and learn new things together.
Transcript
Synthesis, Crystal Structure, and Solid-State NMR Investigations ofHeteronuclear Zn/Co Coordination Networks A ComparativeStudyAnusree Viswanath Kuttatheyil,† Daniel Lassig,‡ Jorg Lincke,‡ Merten Kobalz,‡ Maria Baias,§ Katja Konig,∥
Jorg Hofmann,∥ Harald Krautscheid,‡ Chris J. Pickard,⊥ Jurgen Haase,† and Marko Bertmer*,†
†Universitat Leipzig, Fakultat fur Physik und Geowissenschaften, Linnestr. 5, D-04103, Germany‡Universitat Leipzig, Fakultat fur Chemie und Mineralogie, Johannisallee 29, D-04103, Germany§Universite de Lyon, Centre de RMN a tres hauts champs, CNRS/ENS Lyon/UCBL, 5 Rue de la Doua, 69100 Villeurbanne, France∥Institut fur Nichtklassische Chemie e. V., Permoserstr.15, D-04318, Germany⊥Department of Physics & Astronomy, University College London, Gower Street, London, United Kingdom
*S Supporting Information
ABSTRACT: Synthesis and solid-state NMR characterization of two isomorphous series of zinc and cobalt coordinationnetworks with 1,2,4-triazolyl benzoate ligands are reported. Both series consist of 3D diamondoid networks with four-foldinterpenetration. Solid-state NMR identifies the metal coordination of the ligands, and assignment of all 1H and 13C shifts wasenabled by the combination of 13C editing, FSLG-HETCOR spectra, and 2D 1H−1H back-to-back (BABA) spectra with resultsfrom NMR-CASTEP calculations. The incorporation of Co2+ replacing Zn2+ ions in the MOF over the full range ofconcentrations has significant influences on the NMR spectra. A uniform distribution of metal ions is documented based on theanalysis of 1H T1 relaxation time measurements.
■ INTRODUCTIONCoordination networks or often called metal−organic frame-works (MOFs) have attracted tremendous attention in recentyears as a new class of porous compounds.1,2 The dramaticincrease in the number of publications in this area shows itsgrowing interest as can be seen for instance in two reviews.3,4
The wide structural diversity offered by this class has highpotential for various applications, including gas storage,5,6
catalysis,7 sensoring,8 gas separation,9 and others, such as heat-transformation applications.10−13 They are designed frominorganic building blocks, for example, metal ions or clustersinterconnected by polyfunctional organic ligands.Carboxylates are the most extensively studied polyfunctional
organic ligands. Apart from this, ligands having a combinationof both neutral donor groups, such as pyridine or 1,2,4-triazoles, and anionic functional groups, such as carboxylates,are of interest14,15 where the coordination properties of bothfunctional groups can be combined. 1,2,4-Triazole derived
ligands show promising coordination chemistry especially whensubstituted with certain donor groups. The synthesis of suchligands has been reported16 and successfully applied for thepreparation of novel MOFs.17,18 Especially MOFs with N-donor ligands show interesting properties for heterogeneouscatalysis.19 On the basis of the ligands (L1−) (Me-3py-trz-pba)− and (L2−) (Me2trz-pba)
− (shown in Scheme 1; thecorresponding structural motifs of the coordination polymersare given in 1(b) and 2(b), respectively), we analyzed two Znbased MOFs (1 and 2, structures included in Scheme 1).Additionally, we also studied mixed metal MOFs (hetero-nuclear MOFs) ∞
3 [Zn1−xCox(L)2] (Series I and Series II) usingthese ligands, combining metal ions of different electronconfigurations. Such mixed-metal systems exhibit interestingcatalytic properties.19 The heteronuclear MOFs were prepared
Received: December 3, 2012Published: April 1, 2013
Article
pubs.acs.org/IC
© 2013 American Chemical Society 4431 dx.doi.org/10.1021/ic302643w | Inorg. Chem. 2013, 52, 4431−4442
by partially substituting the diamagnetic Zn2+ ions with varyingamounts of paramagnetic Co2+ ions in the full range from x =0.02 to x = 1.Various experimental methods can be used for the structural
characterization of porous coordination compounds. A betterunderstanding of the various interactions present in the metal−ligand framework is inevitable to explore its potentialapplicability. Solid-state NMR is a versatile tool for studyingthe different interactions present in porous coordinationframeworks, which is increasingly used for the characterizationof structure and dynamics in these materials.20−24 NMR spectraof solid samples provide information on the detailed localelectronic structure of each nucleus reflected as a chemical shiftwithout the need of long-range order. Therefore, noncrystallinematerials can be characterized with solid-state NMR, which isincreasingly used for the characterization of structure anddynamics in these materials.25−27 Furthermore, using thismethod, it is easy to determine the presence of small mobilemolecules, while X-ray analysis is more complicated orimpossible.28
In this paper, we report on the synthesis and detailedstructural elucidation of two Zn MOFs together with theircorresponding protonated ligands by means of X-ray structureanalysis, 1H and 13C solid-state NMR, and quantum chemicalcalculations. Detailed assignments of NMR resonances weredone, including the changes in individual chemical shifts withrespect to the protonated ligands. Full resonance assignmentswere achieved with frequency switched Lee−Goldburg (FSLG)heteronuclear 1H−13C correlation experiments (HETCOR)29
and 1H−1H homonuclear correlation experiments using theback-to-back (BABA)30 sequence. Our experimental resultswere complemented by DFT calculations of NMR parameters,using the GIPAW method31 implemented in the CASTEPcode,32 which has already been proven to be a reliable tool incharacterizing the NMR properties of crystalline solids.33−40
Heteronuclear MOFs with varying percentages of para-magnetic Co2+ were also investigated with 1H and 13C NMR tostudy the influence of paramagnetic metal ions on the parent
framework. In order to gain information about the distributionof Co2+ in the MOF network, an analysis of 1H T1 relaxationtimes was performed.
■ EXPERIMENTAL SECTIONSynthesis. The synthesis of the respective N-donor ligands was
previously reported by Lassig et al.16 While the synthesis andcharacterization of the coordination polymers ∞
3 [M(Me-3py-trz-pba)2](M = Zn: 1, Zn/Co: Series I) were reported earlier,17 herein, wepresent the structurally related system ∞
3 [Zn(Me2trz-pba)2] (2) withthe dimethylated ligand (Me2trz-pba)
−. Multigram amounts of MOFsof the two isomorphous series were obtained by heating the startingmaterials, that is, Zn(OAc)2·2H2O and the respective protonatedligands H(Me-3py-trz-pba) and H(Me2trz-pba) under reflux in DMFfor 48 h. Afterwards, the reaction mixtures were cooled to roomtemperature, and the solid products were washed with DMF andethanol, yielding fine microcrystalline powders after drying in air. TheIR, thermogravimetric and PXRD data of 1 and 2 are given in theSupporting Information or can be found in the respectivepublication.17
For the preparation of mixed Zn/Co MOFs of type∞3 [Zn1−xCox(Me-3py-trz-pba)2] (Series I), Zn(OAc)2·2H2O waspartially replaced by 5, 10, 20, 25, 30, 40, 50 and 75% of CoCl2·6H2O,respectively. Similarly, for the preparation of mixed Zn/Co MOFs oftype ∞
3 [Zn1−xCox(Me2trz-pba)2]·DMF·1.5·H2O (Series II), Zn-(OAc)2·2H2O was partially replaced by 2, 5, 10, 25, 50 and 75% ofCoCl2·6H2O, respectively. For both series, also samples with onlycobalt as a metal connector were prepared as well.
To determine the actual amounts of zinc and cobalt incorporatedinto the MOFs, atomic absorption spectroscopy (AAS) was carriedout. For this, the samples were first incinerated and afterwardsdissolved in nitric acid. Experiments were performed using a VarianSpectrAA 300 operating at wavelengths of 242.5 and 307.6 nm forcobalt and zinc, respectively. Because of the higher cobalt fraction xCoexperimentally determined by AAS compared to the cobalt amountused in synthesis (cf. Table 1), we conclude that the incorporation ofcobalt is favored over zinc.
Notably, the reported synthesis procedure17 for microcrystallinematerial of 1 proved to be successful only for the incorporation ofsmall percentages of cobalt, as shown in EPR studies.17 Nevertheless,by changing the reported method by the use of DMF instead of
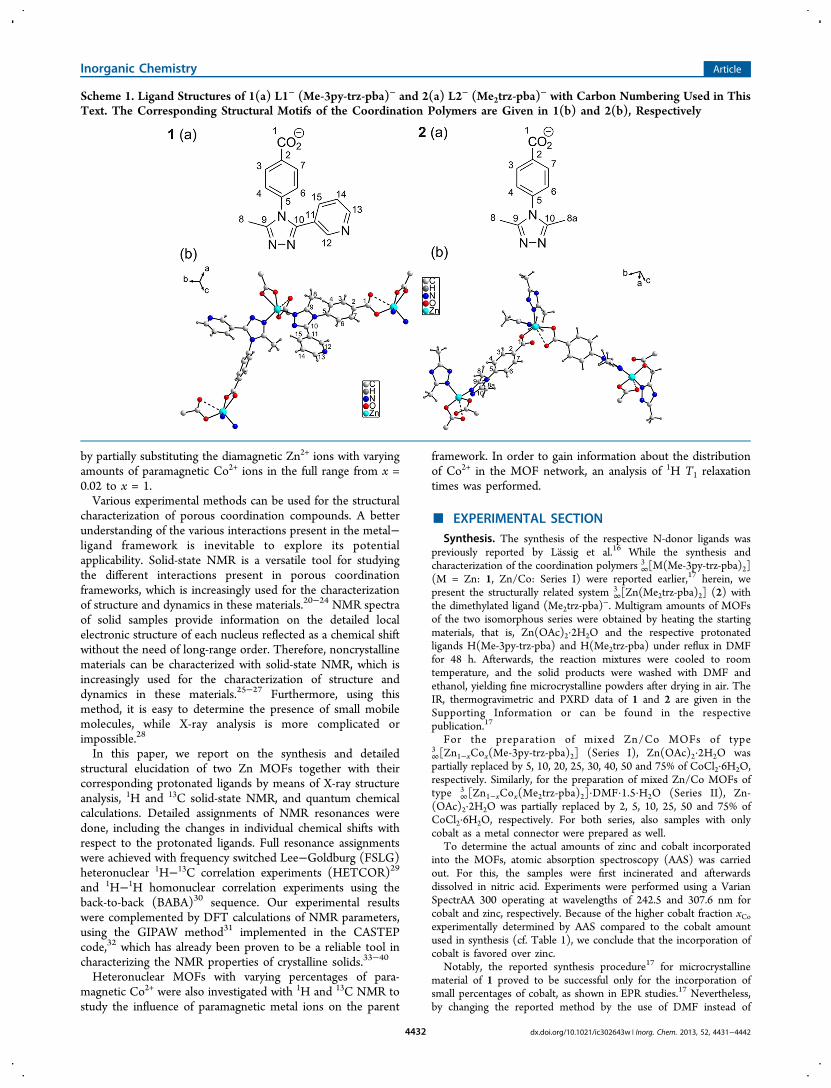
Scheme 1. Ligand Structures of 1(a) L1− (Me-3py-trz-pba)− and 2(a) L2− (Me2trz-pba)− with Carbon Numbering Used in This
Text. The Corresponding Structural Motifs of the Coordination Polymers are Given in 1(b) and 2(b), Respectively
Inorganic Chemistry Article
dx.doi.org/10.1021/ic302643w | Inorg. Chem. 2013, 52, 4431−44424432
ethanol, higher amounts of Co2+ could be incorporated in yieldsranging from 40% to 98%, depending on composition.X-ray Crystallography. The X-ray diffraction (XRD) data were
collected on an IPDS-I (STOE) diffractometer using Mo−Kαradiation (λ = 71.073 pm).41 The structure was solved by directmethods and refined using SHELX-97.42 The coordinates of theframework non-hydrogen atoms were refined using anisotropicdisplacement parameters, whereas the disordered water moleculeswere treated isotropically. The coordinates of hydrogen atoms of theframework were calculated for idealized positions.The PXRD (powder XRD) and TD-PXRD (temperature-depend-
ent powder XRD) measurements were carried out on a STOE STADI-P diffractometer in Debye−Scherrer mode using Cu−Kα1 radiation (λ= 154.060 pm). The samples for these measurements were prepared inglass capillaries (outer diameter, 0.5 mm). The TD-PXRD measure-ments were carried out in steps of 5 °C from room temperature up to500 °C. Thermogravimetry measurements were performed on aNetzsch F1 Jupiter thermobalance.Solid-State NMR. Solid-state NMR measurements were carried
out at two different magnetic fields, 17.6 and 2.35 T. Experiments wereperformed at room temperature using 2.5, 4, and 7 mm MAS probes.
13C Measurements. High-field experiments were done on a BrukerAvance 750 spectrometer operating at a field of 17.6 T and a 13Cresonance frequency of 188.41 MHz. To avoid overlap of spinningsidebands, 13C CPMAS43 spectra were acquired together with theTOSS (TOtal Sideband Suppression) sequence.44 The spinningfrequency was 10 kHz, and contact times of 100 μs and 1 ms wereused to differentiate protonated and nonprotonated carbon signals.For cross-polarization, a ramped pulse45 on the 1H channel wasemployed; 300 and 360 scans were acquired for the protonated ligandsL1− and L2− with recycle delays of 50 and 70 s, respectively. For theMOF samples 1 and 2, 4000 and 1600 scans were collected withrecycle delays of 5 and 10 s, respectively. The decoupling andHartmann-Hahn matching fields were 80 and 65 kHz, respectively.The presence of paramagnetic Co2+ lowers the resolution of carbonspectra severely. Hence, only spectra for samples containing cobalt inlow concentrations (up to 25%) were recorded. The correspondingspectra were recorded with recycle delays of 4 s or less, collecting 4000scans.Spectral editing experiments using nonquaternary suppression
(NQS),46 with two dephasing delays of 37 μs each within an echosequence spanning two rotor periods helped in assignment. Allmeasurements were done with high-power 1H decoupling using twopulse phase modulation (TPPM).47
The 2D FSLG-HETCOR29 experiments of the protonated ligandL1− and MOFs 1 and 2 were done at 10 and 8 kHz MAS and a contacttime of 500 μs with 13 μs as the length of one FSLG block. For L1−
and 1, 80 and 128 t1 increments were collected with 256 scans and 5 sas the recycle delay. For 2, a recycle delay of 4 s and 400 transientswith 128 t1 increments were used. The States-TPPI48 mode for pureabsorption spectra was employed.
Chemical shifts are referenced to TMS using adamantane as asecondary reference with the downfield signal at 38.56 ppm.
1H Measurements. High-field measurements at 17.6 T were done ata frequency of 749.32 MHz. Single pulse excitation experiments wereperformed at various spinning frequencies of 10, 11, 12, 12.5, and 25kHz, in particular for high resolution and to distinguish signals fromspinning sidebands. (π/2) pulse lengths were about 3.6 μs at 12.5 kHzand 1.4 μs at 25 kHz MAS. For the paramagnetic samples, since theuniform excitation of the full spectrum is hard to achieve with a singlepulse, a frequency-stepped acquisition was performed. Therefore, forboth static and MAS experiments (10 kHz spinning frequency), Hahn-echo49 spectra with a 90° pulse length of 3.2 μs were measured at twodifferent excitation frequencies of 104 and −104 kHz from the centerof the main resonance and the full spectrum was obtained by summingup the individual subspectra.
2D 1H−1H BABA30 double quantum experiments were performedusing a 2.5 mm probe at a spinning frequency of 30 and 26 kHz for 1and 2, respectively; 128 points were collected in the indirectdimension with 16 and 64 scans and recycle delays of 1 and 3 s for1 and 2, respectively. During excitation and reconversion, the back-to-back (BABA) scheme was used, which recouples the 1H−1H dipolarcoupling. (π/2) pulses were 1.6 μs, and recoupling over one rotorperiod was used. The z-filter delay was 20 μs. For pure-absorptionspectra, the TPPI scheme was used.50
Static 1H T1 relaxation measurements were performed at a magneticfield of 2.35 T and a frequency of 100.13 MHz using a Tecmag Apollospectrometer. The inversion recovery sequence51 with (π/2) pulselengths of 2.0 and 2.75 μs for 1 and 2, respectively, was used. Thesequence was combined with DEPTH52 detection to remove probebackground signal. The samples were packed in a 7 mm MAS rotorused under nonspinning conditions. The lower magnetic field waschosen for the relaxation measurements since, in this case, uniformexcitation was possible.
All 1H spectra were referenced to TMS using a sample of PDMS assecondary reference (0.07 ppm from TMS).
First-Principles NMR Calculations. Geometry optimizations andchemical shift calculations were carried out within the densityfunctional theory (DFT) framework using the CASTEP (CambridgeSerial Total Energy Package) software.32 CASTEP uses plane-wavebasis sets to describe the wave functions (it thus has an implicittranslational symmetry) and is very well adapted to the description ofsolid crystalline systems. The GIPAW (gauge-including projectoraugmented waves) method,31 used with ultrasoft pseudo-poten-tials,53,54 provides an efficient method for calculating chemical shiftsin crystalline solids.55 The geometry optimization of the X-raydetermined structure and the calculation of NMR parameters werecarried out using generalized gradient approximation (GGA) with thePBE exchange correlation functional56 and Vanderbilt-type pseudo-potentials.54 Only the proton positions were relaxed during thegeometry optimization, keeping both the unit cell and all the otheratoms fixed to their X-ray determined positions. For the geometryoptimization, a plane-wave cutoff energy of 800 eV and a Monkhorst−Pack grid of k-points57 spacing of 0.05 Å−1 in reciprocal space wereused. The NMR calculations were done on the proton-optimizedstructure using a higher cutoff energy of 1000 eV and a k-pointsampling of 0.05 Å−1. The NMR converges slowly because the part ofthe electronic structure on which it depends converges slowly,therefore, a higher cutoff energy was used for the NMR calculations.To compare directly with experimentally measured isotropic chemicalshifts, the calculated chemical shieldings were then converted intocalculated chemical shifts, δcalc, using the relation, δcalc = σref − σcalc.The value of σref was determined with a linear regression betweencalculated and experimental shifts, imposing a slope of unity, whereshifts and shielding were simply sorted by ascending and descendingorder, respectively. This procedure leads to a 13C reference value of169.65 ppm, which was then used to determine the computedchemical shifts.
Table 1. Comparison of xCo Used in Synthesis with ThatDetermined by AAS
AAS AAS
synthesis Series I Series II
0.00 0.00 0.000.02 0.030.05 0.09 0.060.10 0.17 0.130.20 0.250.25 0.29 0.470.30 0.380.50 0.75 0.580.75 0.99 0.991.00 1.00 1.00
Inorganic Chemistry Article
dx.doi.org/10.1021/ic302643w | Inorg. Chem. 2013, 52, 4431−44424433
■ RESULTS AND DISCUSSIONX-ray Diffraction Studies. Whereas the isomorphous Zn
(1) and Zn/Co MOFs of Series I crystallize in thenoncentrosymmetric monoclinic space group Pc (No. 7) withtwo formula units per unit cell, the coordination polymer 2crystallizes in the noncentrosymmetric orthorhombic spacegroup Pca21 (No. 29) with four formula units per unit cell. Theatomic coordinates of 1 can be found in ref 17; those of 2 arereported in Table S 3 (Supporting Information). The formulaunits correspond to the asymmetric units in the crystalstructures and consist of one metal ion, Zn2+ or Co2+, andtwo ligand anions (Me-3py-trz-pba)− or (Me2trz-pba)
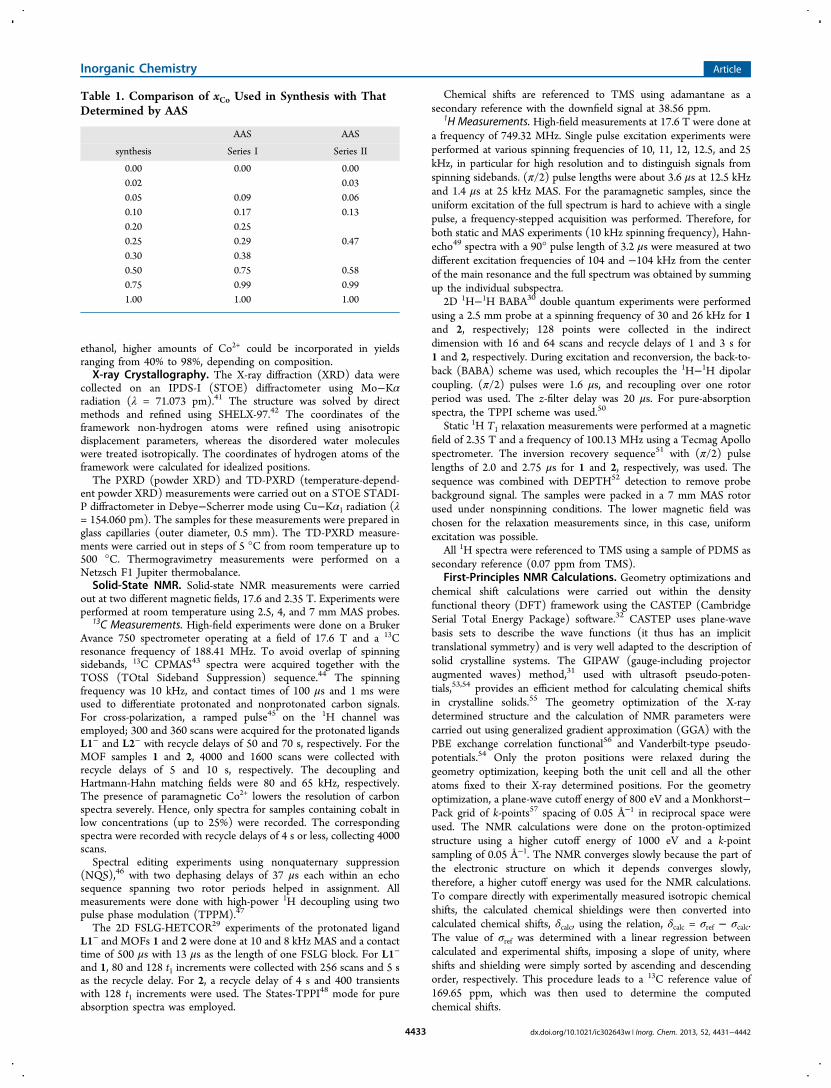
−,respectively. In addition, the asymmetric unit of 2 contains1.5 noncoordinated water molecules and one DMF molecule.The Zn2+ ions in 1 and 2 possess coordination spheres in thetransition from trigonal-bipyramidal to square-pyramidal (seeFigure 1). Selected bond lengths and angles of 1 and 2 are
given in Table S 2 (Supporting Information). The topology ofboth series is the one of the commonly observed diamondoidnetwork (dia, point symbol {66}), which was determined usingthe program TOPOS 4.0.58 The porosity of these compoundsis reduced by four-fold interpenetration (type la).59
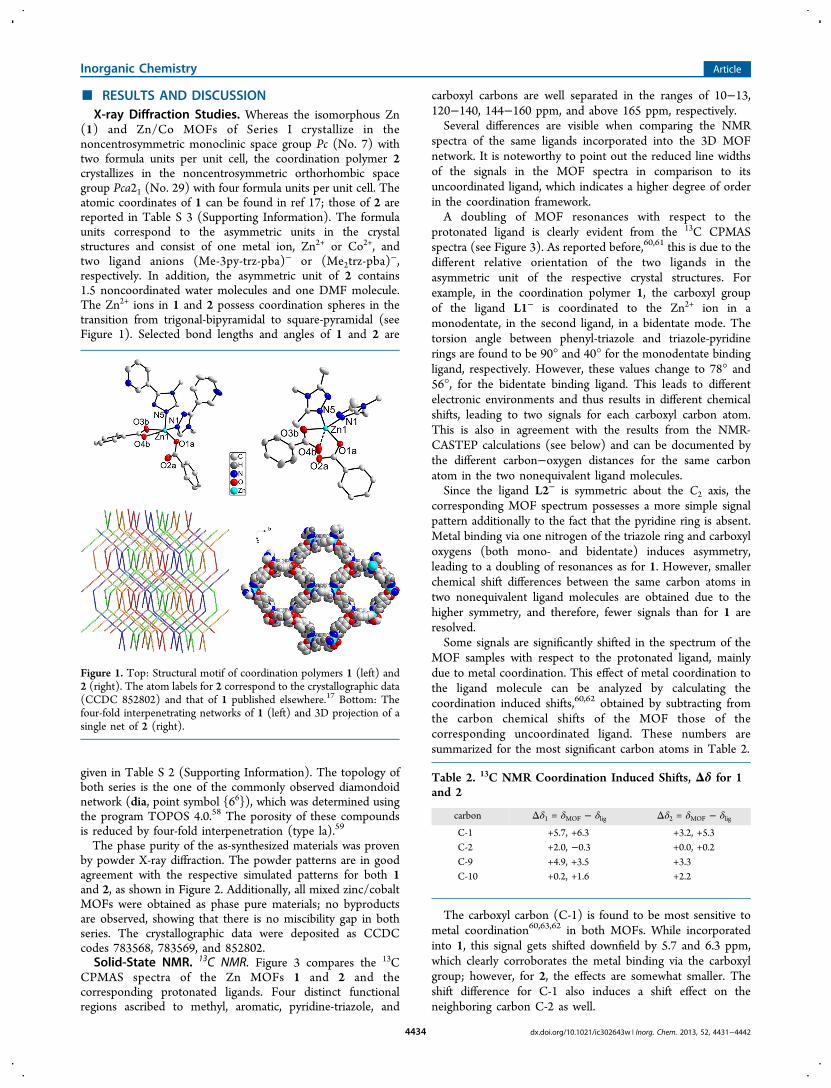
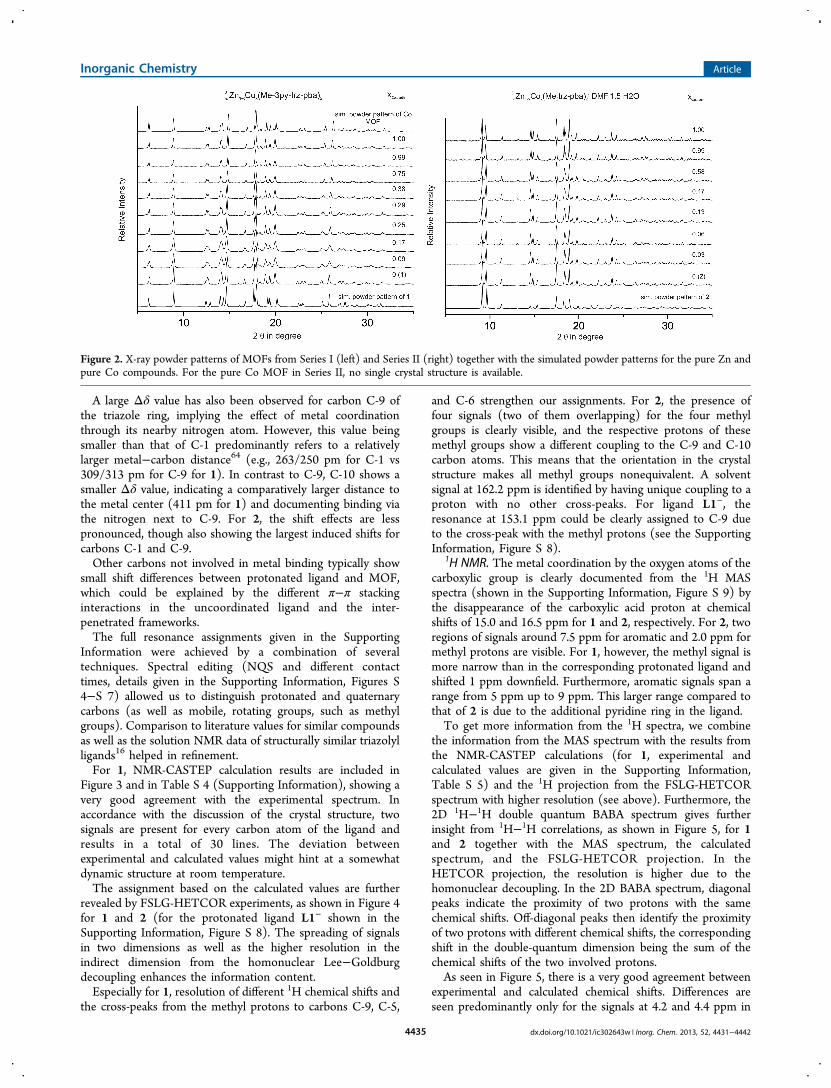
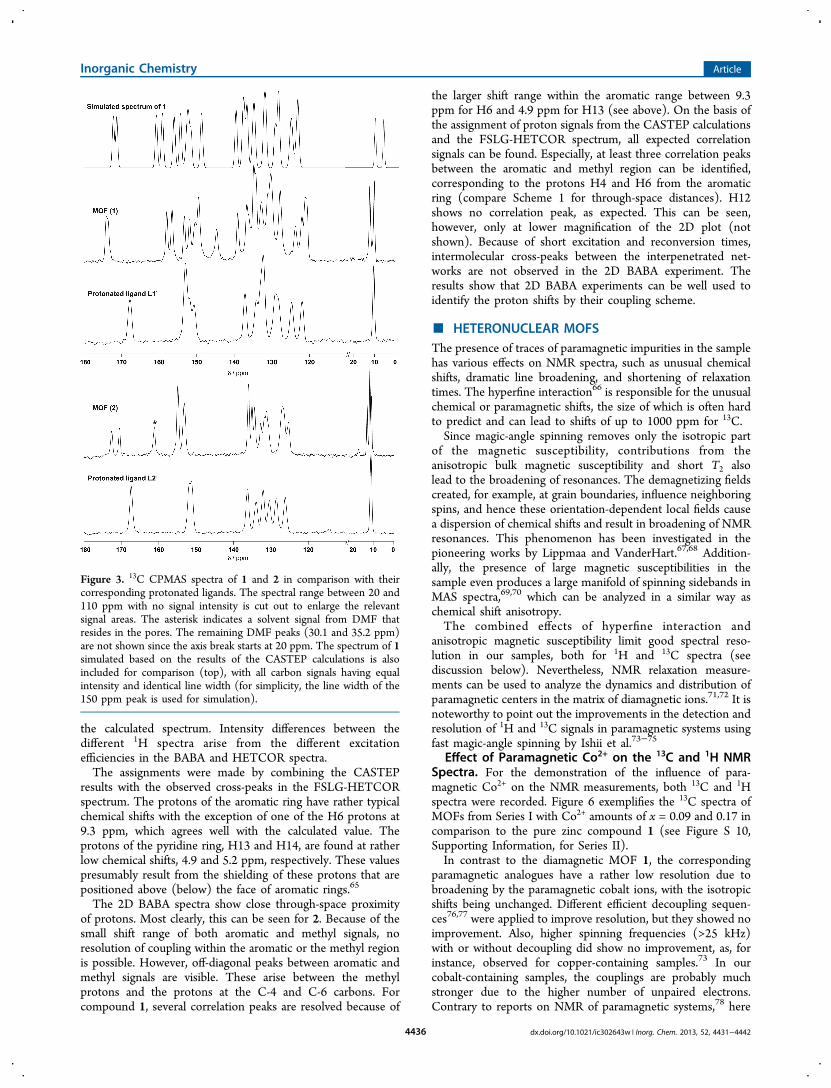
The phase purity of the as-synthesized materials was provenby powder X-ray diffraction. The powder patterns are in goodagreement with the respective simulated patterns for both 1and 2, as shown in Figure 2. Additionally, all mixed zinc/cobaltMOFs were obtained as phase pure materials; no byproductsare observed, showing that there is no miscibility gap in bothseries. The crystallographic data were deposited as CCDCcodes 783568, 783569, and 852802.Solid-State NMR. 13C NMR. Figure 3 compares the 13C
CPMAS spectra of the Zn MOFs 1 and 2 and thecorresponding protonated ligands. Four distinct functionalregions ascribed to methyl, aromatic, pyridine-triazole, and
carboxyl carbons are well separated in the ranges of 10−13,120−140, 144−160 ppm, and above 165 ppm, respectively.Several differences are visible when comparing the NMR
spectra of the same ligands incorporated into the 3D MOFnetwork. It is noteworthy to point out the reduced line widthsof the signals in the MOF spectra in comparison to itsuncoordinated ligand, which indicates a higher degree of orderin the coordination framework.A doubling of MOF resonances with respect to the
protonated ligand is clearly evident from the 13C CPMASspectra (see Figure 3). As reported before,60,61 this is due to thedifferent relative orientation of the two ligands in theasymmetric unit of the respective crystal structures. Forexample, in the coordination polymer 1, the carboxyl groupof the ligand L1− is coordinated to the Zn2+ ion in amonodentate, in the second ligand, in a bidentate mode. Thetorsion angle between phenyl-triazole and triazole-pyridinerings are found to be 90° and 40° for the monodentate bindingligand, respectively. However, these values change to 78° and56°, for the bidentate binding ligand. This leads to differentelectronic environments and thus results in different chemicalshifts, leading to two signals for each carboxyl carbon atom.This is also in agreement with the results from the NMR-CASTEP calculations (see below) and can be documented bythe different carbon−oxygen distances for the same carbonatom in the two nonequivalent ligand molecules.Since the ligand L2− is symmetric about the C2 axis, the
corresponding MOF spectrum possesses a more simple signalpattern additionally to the fact that the pyridine ring is absent.Metal binding via one nitrogen of the triazole ring and carboxyloxygens (both mono- and bidentate) induces asymmetry,leading to a doubling of resonances as for 1. However, smallerchemical shift differences between the same carbon atoms intwo nonequivalent ligand molecules are obtained due to thehigher symmetry, and therefore, fewer signals than for 1 areresolved.Some signals are significantly shifted in the spectrum of the
MOF samples with respect to the protonated ligand, mainlydue to metal coordination. This effect of metal coordination tothe ligand molecule can be analyzed by calculating thecoordination induced shifts,60,62 obtained by subtracting fromthe carbon chemical shifts of the MOF those of thecorresponding uncoordinated ligand. These numbers aresummarized for the most significant carbon atoms in Table 2.
Table 2. 13C NMR Coordination Induced Shifts, Δδ for 1and 2
carbon Δδ1 = δMOF − δlig Δδ2 = δMOF − δlig
C-1 +5.7, +6.3 +3.2, +5.3C-2 +2.0, −0.3 +0.0, +0.2C-9 +4.9, +3.5 +3.3C-10 +0.2, +1.6 +2.2
The carboxyl carbon (C-1) is found to be most sensitive tometal coordination60,63,62 in both MOFs. While incorporatedinto 1, this signal gets shifted downfield by 5.7 and 6.3 ppm,which clearly corroborates the metal binding via the carboxylgroup; however, for 2, the effects are somewhat smaller. Theshift difference for C-1 also induces a shift effect on theneighboring carbon C-2 as well.
Figure 1. Top: Structural motif of coordination polymers 1 (left) and2 (right). The atom labels for 2 correspond to the crystallographic data(CCDC 852802) and that of 1 published elsewhere.17 Bottom: Thefour-fold interpenetrating networks of 1 (left) and 3D projection of asingle net of 2 (right).
Inorganic Chemistry Article
dx.doi.org/10.1021/ic302643w | Inorg. Chem. 2013, 52, 4431−44424434
A large Δδ value has also been observed for carbon C-9 ofthe triazole ring, implying the effect of metal coordinationthrough its nearby nitrogen atom. However, this value beingsmaller than that of C-1 predominantly refers to a relativelylarger metal−carbon distance64 (e.g., 263/250 pm for C-1 vs309/313 pm for C-9 for 1). In contrast to C-9, C-10 shows asmaller Δδ value, indicating a comparatively larger distance tothe metal center (411 pm for 1) and documenting binding viathe nitrogen next to C-9. For 2, the shift effects are lesspronounced, though also showing the largest induced shifts forcarbons C-1 and C-9.Other carbons not involved in metal binding typically show
small shift differences between protonated ligand and MOF,which could be explained by the different π−π stackinginteractions in the uncoordinated ligand and the inter-penetrated frameworks.The full resonance assignments given in the Supporting
Information were achieved by a combination of severaltechniques. Spectral editing (NQS and different contacttimes, details given in the Supporting Information, Figures S4−S 7) allowed us to distinguish protonated and quaternarycarbons (as well as mobile, rotating groups, such as methylgroups). Comparison to literature values for similar compoundsas well as the solution NMR data of structurally similar triazolylligands16 helped in refinement.For 1, NMR-CASTEP calculation results are included in
Figure 3 and in Table S 4 (Supporting Information), showing avery good agreement with the experimental spectrum. Inaccordance with the discussion of the crystal structure, twosignals are present for every carbon atom of the ligand andresults in a total of 30 lines. The deviation betweenexperimental and calculated values might hint at a somewhatdynamic structure at room temperature.The assignment based on the calculated values are further
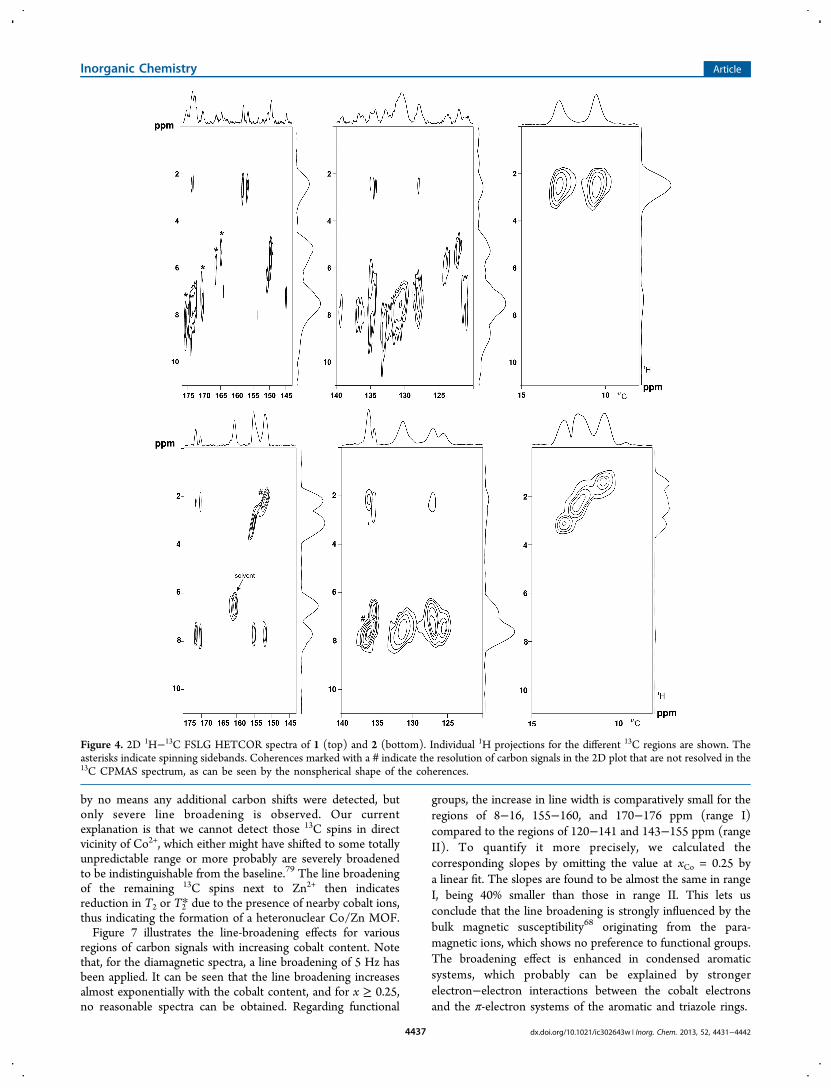
revealed by FSLG-HETCOR experiments, as shown in Figure 4for 1 and 2 (for the protonated ligand L1− shown in theSupporting Information, Figure S 8). The spreading of signalsin two dimensions as well as the higher resolution in theindirect dimension from the homonuclear Lee−Goldburgdecoupling enhances the information content.Especially for 1, resolution of different 1H chemical shifts and
the cross-peaks from the methyl protons to carbons C-9, C-5,
and C-6 strengthen our assignments. For 2, the presence offour signals (two of them overlapping) for the four methylgroups is clearly visible, and the respective protons of thesemethyl groups show a different coupling to the C-9 and C-10carbon atoms. This means that the orientation in the crystalstructure makes all methyl groups nonequivalent. A solventsignal at 162.2 ppm is identified by having unique coupling to aproton with no other cross-peaks. For ligand L1−, theresonance at 153.1 ppm could be clearly assigned to C-9 dueto the cross-peak with the methyl protons (see the SupportingInformation, Figure S 8).
1H NMR. The metal coordination by the oxygen atoms of thecarboxylic group is clearly documented from the 1H MASspectra (shown in the Supporting Information, Figure S 9) bythe disappearance of the carboxylic acid proton at chemicalshifts of 15.0 and 16.5 ppm for 1 and 2, respectively. For 2, tworegions of signals around 7.5 ppm for aromatic and 2.0 ppm formethyl protons are visible. For 1, however, the methyl signal ismore narrow than in the corresponding protonated ligand andshifted 1 ppm downfield. Furthermore, aromatic signals span arange from 5 ppm up to 9 ppm. This larger range compared tothat of 2 is due to the additional pyridine ring in the ligand.To get more information from the 1H spectra, we combine
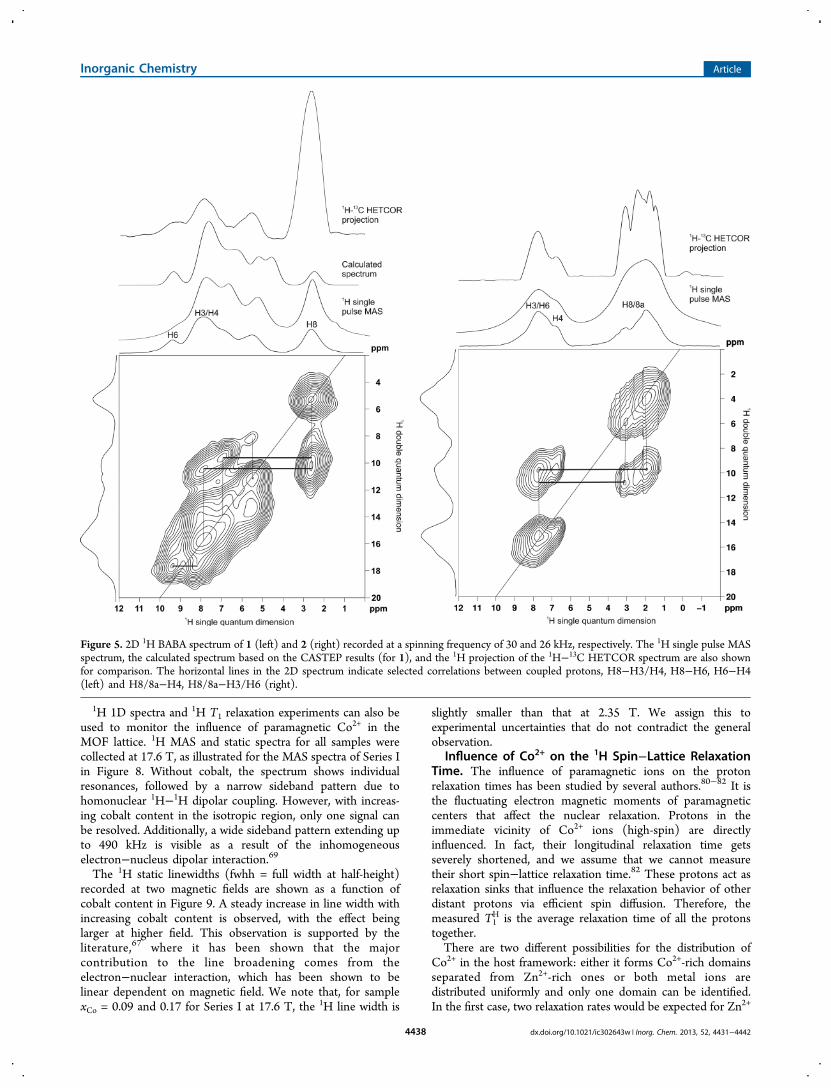
the information from the MAS spectrum with the results fromthe NMR-CASTEP calculations (for 1, experimental andcalculated values are given in the Supporting Information,Table S 5) and the 1H projection from the FSLG-HETCORspectrum with higher resolution (see above). Furthermore, the2D 1H−1H double quantum BABA spectrum gives furtherinsight from 1H−1H correlations, as shown in Figure 5, for 1and 2 together with the MAS spectrum, the calculatedspectrum, and the FSLG-HETCOR projection. In theHETCOR projection, the resolution is higher due to thehomonuclear decoupling. In the 2D BABA spectrum, diagonalpeaks indicate the proximity of two protons with the samechemical shifts. Off-diagonal peaks then identify the proximityof two protons with different chemical shifts, the correspondingshift in the double-quantum dimension being the sum of thechemical shifts of the two involved protons.As seen in Figure 5, there is a very good agreement between
experimental and calculated chemical shifts. Differences areseen predominantly only for the signals at 4.2 and 4.4 ppm in
Figure 2. X-ray powder patterns of MOFs from Series I (left) and Series II (right) together with the simulated powder patterns for the pure Zn andpure Co compounds. For the pure Co MOF in Series II, no single crystal structure is available.
Inorganic Chemistry Article
dx.doi.org/10.1021/ic302643w | Inorg. Chem. 2013, 52, 4431−44424435
the calculated spectrum. Intensity differences between thedifferent 1H spectra arise from the different excitationefficiencies in the BABA and HETCOR spectra.The assignments were made by combining the CASTEP
results with the observed cross-peaks in the FSLG-HETCORspectrum. The protons of the aromatic ring have rather typicalchemical shifts with the exception of one of the H6 protons at9.3 ppm, which agrees well with the calculated value. Theprotons of the pyridine ring, H13 and H14, are found at ratherlow chemical shifts, 4.9 and 5.2 ppm, respectively. These valuespresumably result from the shielding of these protons that arepositioned above (below) the face of aromatic rings.65
The 2D BABA spectra show close through-space proximityof protons. Most clearly, this can be seen for 2. Because of thesmall shift range of both aromatic and methyl signals, noresolution of coupling within the aromatic or the methyl regionis possible. However, off-diagonal peaks between aromatic andmethyl signals are visible. These arise between the methylprotons and the protons at the C-4 and C-6 carbons. Forcompound 1, several correlation peaks are resolved because of
the larger shift range within the aromatic range between 9.3ppm for H6 and 4.9 ppm for H13 (see above). On the basis ofthe assignment of proton signals from the CASTEP calculationsand the FSLG-HETCOR spectrum, all expected correlationsignals can be found. Especially, at least three correlation peaksbetween the aromatic and methyl region can be identified,corresponding to the protons H4 and H6 from the aromaticring (compare Scheme 1 for through-space distances). H12shows no correlation peak, as expected. This can be seen,however, only at lower magnification of the 2D plot (notshown). Because of short excitation and reconversion times,intermolecular cross-peaks between the interpenetrated net-works are not observed in the 2D BABA experiment. Theresults show that 2D BABA experiments can be well used toidentify the proton shifts by their coupling scheme.
■ HETERONUCLEAR MOFSThe presence of traces of paramagnetic impurities in the samplehas various effects on NMR spectra, such as unusual chemicalshifts, dramatic line broadening, and shortening of relaxationtimes. The hyperfine interaction66 is responsible for the unusualchemical or paramagnetic shifts, the size of which is often hardto predict and can lead to shifts of up to 1000 ppm for 13C.Since magic-angle spinning removes only the isotropic part
of the magnetic susceptibility, contributions from theanisotropic bulk magnetic susceptibility and short T2 alsolead to the broadening of resonances. The demagnetizing fieldscreated, for example, at grain boundaries, influence neighboringspins, and hence these orientation-dependent local fields causea dispersion of chemical shifts and result in broadening of NMRresonances. This phenomenon has been investigated in thepioneering works by Lippmaa and VanderHart.67,68 Addition-ally, the presence of large magnetic susceptibilities in thesample even produces a large manifold of spinning sidebands inMAS spectra,69,70 which can be analyzed in a similar way aschemical shift anisotropy.The combined effects of hyperfine interaction and
anisotropic magnetic susceptibility limit good spectral reso-lution in our samples, both for 1H and 13C spectra (seediscussion below). Nevertheless, NMR relaxation measure-ments can be used to analyze the dynamics and distribution ofparamagnetic centers in the matrix of diamagnetic ions.71,72 It isnoteworthy to point out the improvements in the detection andresolution of 1H and 13C signals in paramagnetic systems usingfast magic-angle spinning by Ishii et al.73−75
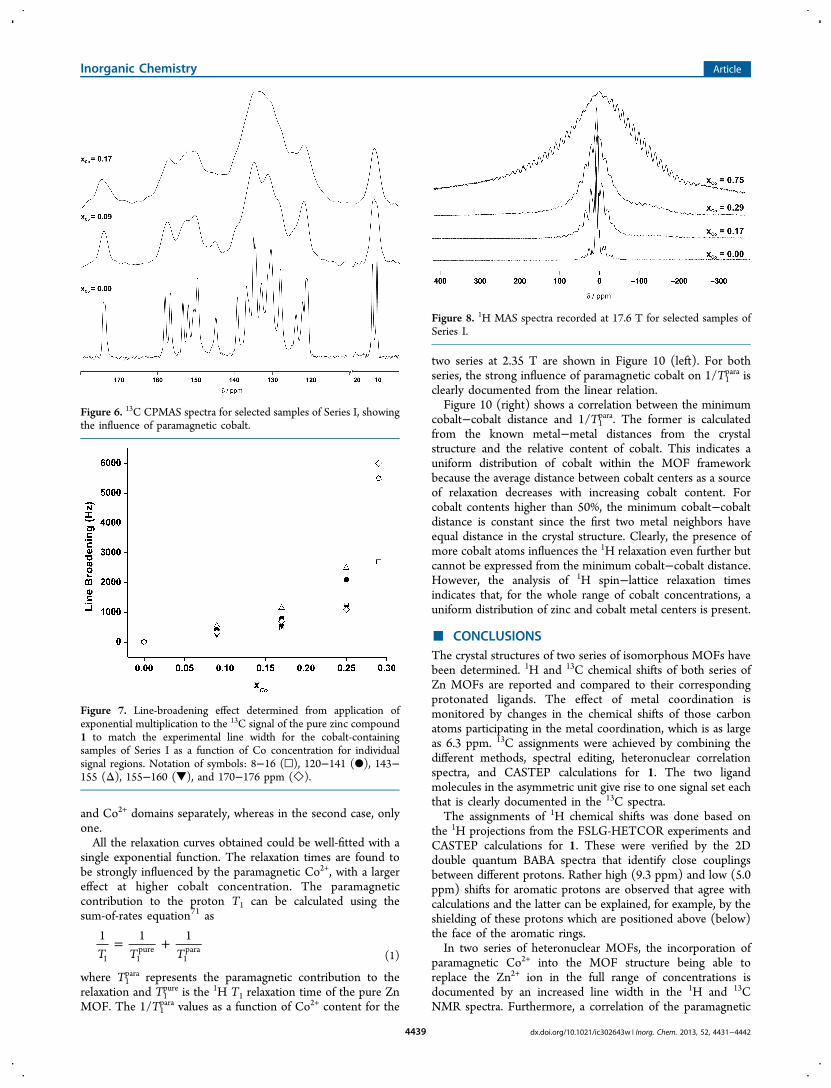
Effect of Paramagnetic Co2+ on the 13C and 1H NMRSpectra. For the demonstration of the influence of para-magnetic Co2+ on the NMR measurements, both 13C and 1Hspectra were recorded. Figure 6 exemplifies the 13C spectra ofMOFs from Series I with Co2+ amounts of x = 0.09 and 0.17 incomparison to the pure zinc compound 1 (see Figure S 10,Supporting Information, for Series II).In contrast to the diamagnetic MOF 1, the corresponding
paramagnetic analogues have a rather low resolution due tobroadening by the paramagnetic cobalt ions, with the isotropicshifts being unchanged. Different efficient decoupling sequen-ces76,77 were applied to improve resolution, but they showed noimprovement. Also, higher spinning frequencies (>25 kHz)with or without decoupling did show no improvement, as, forinstance, observed for copper-containing samples.73 In ourcobalt-containing samples, the couplings are probably muchstronger due to the higher number of unpaired electrons.Contrary to reports on NMR of paramagnetic systems,78 here
Figure 3. 13C CPMAS spectra of 1 and 2 in comparison with theircorresponding protonated ligands. The spectral range between 20 and110 ppm with no signal intensity is cut out to enlarge the relevantsignal areas. The asterisk indicates a solvent signal from DMF thatresides in the pores. The remaining DMF peaks (30.1 and 35.2 ppm)are not shown since the axis break starts at 20 ppm. The spectrum of 1simulated based on the results of the CASTEP calculations is alsoincluded for comparison (top), with all carbon signals having equalintensity and identical line width (for simplicity, the line width of the150 ppm peak is used for simulation).
Inorganic Chemistry Article
dx.doi.org/10.1021/ic302643w | Inorg. Chem. 2013, 52, 4431−44424436
by no means any additional carbon shifts were detected, butonly severe line broadening is observed. Our currentexplanation is that we cannot detect those 13C spins in directvicinity of Co2+, which either might have shifted to some totallyunpredictable range or more probably are severely broadenedto be indistinguishable from the baseline.79 The line broadeningof the remaining 13C spins next to Zn2+ then indicatesreduction in T2 or T2* due to the presence of nearby cobalt ions,thus indicating the formation of a heteronuclear Co/Zn MOF.Figure 7 illustrates the line-broadening effects for various
regions of carbon signals with increasing cobalt content. Notethat, for the diamagnetic spectra, a line broadening of 5 Hz hasbeen applied. It can be seen that the line broadening increasesalmost exponentially with the cobalt content, and for x ≥ 0.25,no reasonable spectra can be obtained. Regarding functional
groups, the increase in line width is comparatively small for theregions of 8−16, 155−160, and 170−176 ppm (range I)compared to the regions of 120−141 and 143−155 ppm (rangeII). To quantify it more precisely, we calculated thecorresponding slopes by omitting the value at xCo = 0.25 bya linear fit. The slopes are found to be almost the same in rangeI, being 40% smaller than those in range II. This lets usconclude that the line broadening is strongly influenced by thebulk magnetic susceptibility68 originating from the para-magnetic ions, which shows no preference to functional groups.The broadening effect is enhanced in condensed aromaticsystems, which probably can be explained by strongerelectron−electron interactions between the cobalt electronsand the π-electron systems of the aromatic and triazole rings.
Figure 4. 2D 1H−13C FSLG HETCOR spectra of 1 (top) and 2 (bottom). Individual 1H projections for the different 13C regions are shown. Theasterisks indicate spinning sidebands. Coherences marked with a # indicate the resolution of carbon signals in the 2D plot that are not resolved in the13C CPMAS spectrum, as can be seen by the nonspherical shape of the coherences.
Inorganic Chemistry Article
dx.doi.org/10.1021/ic302643w | Inorg. Chem. 2013, 52, 4431−44424437
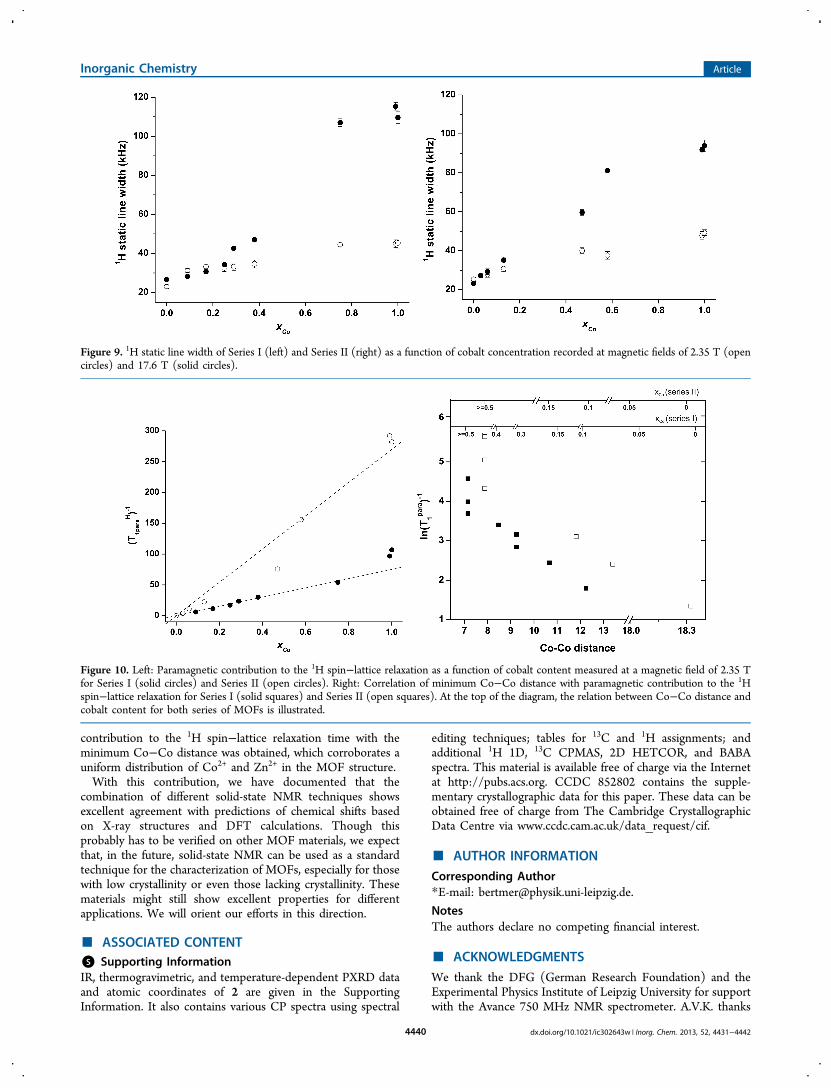
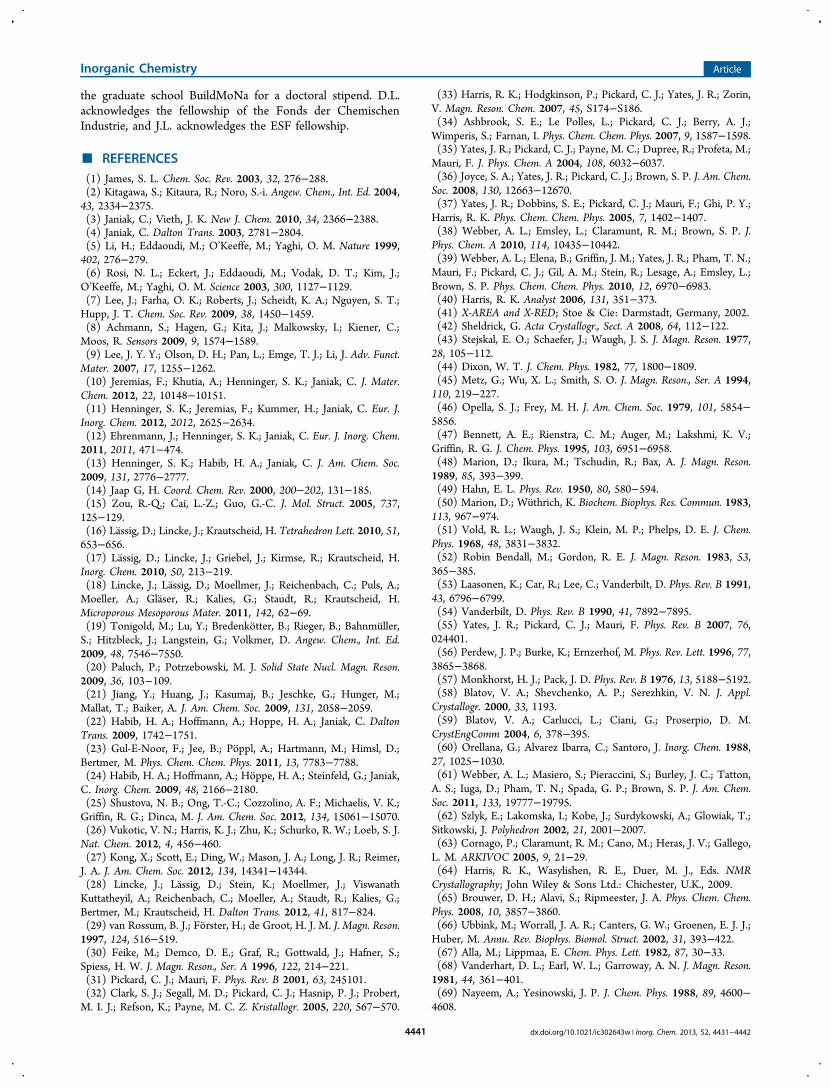
1H 1D spectra and 1H T1 relaxation experiments can also beused to monitor the influence of paramagnetic Co2+ in theMOF lattice. 1H MAS and static spectra for all samples werecollected at 17.6 T, as illustrated for the MAS spectra of Series Iin Figure 8. Without cobalt, the spectrum shows individualresonances, followed by a narrow sideband pattern due tohomonuclear 1H−1H dipolar coupling. However, with increas-ing cobalt content in the isotropic region, only one signal canbe resolved. Additionally, a wide sideband pattern extending upto 490 kHz is visible as a result of the inhomogeneouselectron−nucleus dipolar interaction.69The 1H static linewidths (fwhh = full width at half-height)
recorded at two magnetic fields are shown as a function ofcobalt content in Figure 9. A steady increase in line width withincreasing cobalt content is observed, with the effect beinglarger at higher field. This observation is supported by theliterature,67 where it has been shown that the majorcontribution to the line broadening comes from theelectron−nuclear interaction, which has been shown to belinear dependent on magnetic field. We note that, for samplexCo = 0.09 and 0.17 for Series I at 17.6 T, the 1H line width is
slightly smaller than that at 2.35 T. We assign this toexperimental uncertainties that do not contradict the generalobservation.
Influence of Co2+ on the 1H Spin−Lattice RelaxationTime. The influence of paramagnetic ions on the protonrelaxation times has been studied by several authors.80−82 It isthe fluctuating electron magnetic moments of paramagneticcenters that affect the nuclear relaxation. Protons in theimmediate vicinity of Co2+ ions (high-spin) are directlyinfluenced. In fact, their longitudinal relaxation time getsseverely shortened, and we assume that we cannot measuretheir short spin−lattice relaxation time.82 These protons act asrelaxation sinks that influence the relaxation behavior of otherdistant protons via efficient spin diffusion. Therefore, themeasured T1
H is the average relaxation time of all the protonstogether.There are two different possibilities for the distribution of
Co2+ in the host framework: either it forms Co2+-rich domainsseparated from Zn2+-rich ones or both metal ions aredistributed uniformly and only one domain can be identified.In the first case, two relaxation rates would be expected for Zn2+
Figure 5. 2D 1H BABA spectrum of 1 (left) and 2 (right) recorded at a spinning frequency of 30 and 26 kHz, respectively. The 1H single pulse MASspectrum, the calculated spectrum based on the CASTEP results (for 1), and the 1H projection of the 1H−13C HETCOR spectrum are also shownfor comparison. The horizontal lines in the 2D spectrum indicate selected correlations between coupled protons, H8−H3/H4, H8−H6, H6−H4(left) and H8/8a−H4, H8/8a−H3/H6 (right).
Inorganic Chemistry Article
dx.doi.org/10.1021/ic302643w | Inorg. Chem. 2013, 52, 4431−44424438
and Co2+ domains separately, whereas in the second case, onlyone.All the relaxation curves obtained could be well-fitted with a
single exponential function. The relaxation times are found tobe strongly influenced by the paramagnetic Co2+, with a largereffect at higher cobalt concentration. The paramagneticcontribution to the proton T1 can be calculated using thesum-of-rates equation71 as
= +T T T1 1 1
1 1pure
1para
(1)
where T1para represents the paramagnetic contribution to the
relaxation and T1pure is the 1H T1 relaxation time of the pure Zn
MOF. The 1/T1para values as a function of Co2+ content for the
two series at 2.35 T are shown in Figure 10 (left). For bothseries, the strong influence of paramagnetic cobalt on 1/T1
para isclearly documented from the linear relation.Figure 10 (right) shows a correlation between the minimum
cobalt−cobalt distance and 1/T1para. The former is calculated
from the known metal−metal distances from the crystalstructure and the relative content of cobalt. This indicates auniform distribution of cobalt within the MOF frameworkbecause the average distance between cobalt centers as a sourceof relaxation decreases with increasing cobalt content. Forcobalt contents higher than 50%, the minimum cobalt−cobaltdistance is constant since the first two metal neighbors haveequal distance in the crystal structure. Clearly, the presence ofmore cobalt atoms influences the 1H relaxation even further butcannot be expressed from the minimum cobalt−cobalt distance.However, the analysis of 1H spin−lattice relaxation timesindicates that, for the whole range of cobalt concentrations, auniform distribution of zinc and cobalt metal centers is present.
■ CONCLUSIONSThe crystal structures of two series of isomorphous MOFs havebeen determined. 1H and 13C chemical shifts of both series ofZn MOFs are reported and compared to their correspondingprotonated ligands. The effect of metal coordination ismonitored by changes in the chemical shifts of those carbonatoms participating in the metal coordination, which is as largeas 6.3 ppm. 13C assignments were achieved by combining thedifferent methods, spectral editing, heteronuclear correlationspectra, and CASTEP calculations for 1. The two ligandmolecules in the asymmetric unit give rise to one signal set eachthat is clearly documented in the 13C spectra.The assignments of 1H chemical shifts was done based on
the 1H projections from the FSLG-HETCOR experiments andCASTEP calculations for 1. These were verified by the 2Ddouble quantum BABA spectra that identify close couplingsbetween different protons. Rather high (9.3 ppm) and low (5.0ppm) shifts for aromatic protons are observed that agree withcalculations and the latter can be explained, for example, by theshielding of these protons which are positioned above (below)the face of the aromatic rings.In two series of heteronuclear MOFs, the incorporation of
paramagnetic Co2+ into the MOF structure being able toreplace the Zn2+ ion in the full range of concentrations isdocumented by an increased line width in the 1H and 13CNMR spectra. Furthermore, a correlation of the paramagnetic
Figure 6. 13C CPMAS spectra for selected samples of Series I, showingthe influence of paramagnetic cobalt.
Figure 7. Line-broadening effect determined from application ofexponential multiplication to the 13C signal of the pure zinc compound1 to match the experimental line width for the cobalt-containingsamples of Series I as a function of Co concentration for individualsignal regions. Notation of symbols: 8−16 (□), 120−141 (●), 143−155 (Δ), 155−160 (▼), and 170−176 ppm (◇).
Figure 8. 1H MAS spectra recorded at 17.6 T for selected samples ofSeries I.
Inorganic Chemistry Article
dx.doi.org/10.1021/ic302643w | Inorg. Chem. 2013, 52, 4431−44424439
contribution to the 1H spin−lattice relaxation time with theminimum Co−Co distance was obtained, which corroborates auniform distribution of Co2+ and Zn2+ in the MOF structure.With this contribution, we have documented that the
combination of different solid-state NMR techniques showsexcellent agreement with predictions of chemical shifts basedon X-ray structures and DFT calculations. Though thisprobably has to be verified on other MOF materials, we expectthat, in the future, solid-state NMR can be used as a standardtechnique for the characterization of MOFs, especially for thosewith low crystallinity or even those lacking crystallinity. Thesematerials might still show excellent properties for differentapplications. We will orient our efforts in this direction.
■ ASSOCIATED CONTENT*S Supporting InformationIR, thermogravimetric, and temperature-dependent PXRD dataand atomic coordinates of 2 are given in the SupportingInformation. It also contains various CP spectra using spectral
editing techniques; tables for 13C and 1H assignments; andadditional 1H 1D, 13C CPMAS, 2D HETCOR, and BABAspectra. This material is available free of charge via the Internetat http://pubs.acs.org. CCDC 852802 contains the supple-mentary crystallographic data for this paper. These data can beobtained free of charge from The Cambridge CrystallographicData Centre via www.ccdc.cam.ac.uk/data_request/cif.
■ AUTHOR INFORMATION
Corresponding Author*E-mail: [email protected].
NotesThe authors declare no competing financial interest.
■ ACKNOWLEDGMENTS
We thank the DFG (German Research Foundation) and theExperimental Physics Institute of Leipzig University for supportwith the Avance 750 MHz NMR spectrometer. A.V.K. thanks
Figure 9. 1H static line width of Series I (left) and Series II (right) as a function of cobalt concentration recorded at magnetic fields of 2.35 T (opencircles) and 17.6 T (solid circles).
Figure 10. Left: Paramagnetic contribution to the 1H spin−lattice relaxation as a function of cobalt content measured at a magnetic field of 2.35 Tfor Series I (solid circles) and Series II (open circles). Right: Correlation of minimum Co−Co distance with paramagnetic contribution to the 1Hspin−lattice relaxation for Series I (solid squares) and Series II (open squares). At the top of the diagram, the relation between Co−Co distance andcobalt content for both series of MOFs is illustrated.
Inorganic Chemistry Article
dx.doi.org/10.1021/ic302643w | Inorg. Chem. 2013, 52, 4431−44424440
the graduate school BuildMoNa for a doctoral stipend. D.L.acknowledges the fellowship of the Fonds der ChemischenIndustrie, and J.L. acknowledges the ESF fellowship.
■ REFERENCES(1) James, S. L. Chem. Soc. Rev. 2003, 32, 276−288.(2) Kitagawa, S.; Kitaura, R.; Noro, S.-i. Angew. Chem., Int. Ed. 2004,43, 2334−2375.(3) Janiak, C.; Vieth, J. K. New J. Chem. 2010, 34, 2366−2388.(4) Janiak, C. Dalton Trans. 2003, 2781−2804.(5) Li, H.; Eddaoudi, M.; O’Keeffe, M.; Yaghi, O. M. Nature 1999,402, 276−279.(6) Rosi, N. L.; Eckert, J.; Eddaoudi, M.; Vodak, D. T.; Kim, J.;O’Keeffe, M.; Yaghi, O. M. Science 2003, 300, 1127−1129.(7) Lee, J.; Farha, O. K.; Roberts, J.; Scheidt, K. A.; Nguyen, S. T.;Hupp, J. T. Chem. Soc. Rev. 2009, 38, 1450−1459.(8) Achmann, S.; Hagen, G.; Kita, J.; Malkowsky, I.; Kiener, C.;Moos, R. Sensors 2009, 9, 1574−1589.(9) Lee, J. Y. Y.; Olson, D. H.; Pan, L.; Emge, T. J.; Li, J. Adv. Funct.Mater. 2007, 17, 1255−1262.(10) Jeremias, F.; Khutia, A.; Henninger, S. K.; Janiak, C. J. Mater.Chem. 2012, 22, 10148−10151.(11) Henninger, S. K.; Jeremias, F.; Kummer, H.; Janiak, C. Eur. J.Inorg. Chem. 2012, 2012, 2625−2634.(12) Ehrenmann, J.; Henninger, S. K.; Janiak, C. Eur. J. Inorg. Chem.2011, 2011, 471−474.(13) Henninger, S. K.; Habib, H. A.; Janiak, C. J. Am. Chem. Soc.2009, 131, 2776−2777.(14) Jaap G, H. Coord. Chem. Rev. 2000, 200−202, 131−185.(15) Zou, R.-Q.; Cai, L.-Z.; Guo, G.-C. J. Mol. Struct. 2005, 737,125−129.(16) Lassig, D.; Lincke, J.; Krautscheid, H. Tetrahedron Lett. 2010, 51,653−656.(17) Lassig, D.; Lincke, J.; Griebel, J.; Kirmse, R.; Krautscheid, H.Inorg. Chem. 2010, 50, 213−219.(18) Lincke, J.; Lassig, D.; Moellmer, J.; Reichenbach, C.; Puls, A.;Moeller, A.; Glaser, R.; Kalies, G.; Staudt, R.; Krautscheid, H.Microporous Mesoporous Mater. 2011, 142, 62−69.(19) Tonigold, M.; Lu, Y.; Bredenkotter, B.; Rieger, B.; Bahnmuller,S.; Hitzbleck, J.; Langstein, G.; Volkmer, D. Angew. Chem., Int. Ed.2009, 48, 7546−7550.(20) Paluch, P.; Potrzebowski, M. J. Solid State Nucl. Magn. Reson.2009, 36, 103−109.(21) Jiang, Y.; Huang, J.; Kasumaj, B.; Jeschke, G.; Hunger, M.;Mallat, T.; Baiker, A. J. Am. Chem. Soc. 2009, 131, 2058−2059.(22) Habib, H. A.; Hoffmann, A.; Hoppe, H. A.; Janiak, C. DaltonTrans. 2009, 1742−1751.(23) Gul-E-Noor, F.; Jee, B.; Poppl, A.; Hartmann, M.; Himsl, D.;Bertmer, M. Phys. Chem. Chem. Phys. 2011, 13, 7783−7788.(24) Habib, H. A.; Hoffmann, A.; Hoppe, H. A.; Steinfeld, G.; Janiak,C. Inorg. Chem. 2009, 48, 2166−2180.(25) Shustova, N. B.; Ong, T.-C.; Cozzolino, A. F.; Michaelis, V. K.;Griffin, R. G.; Dinca, M. J. Am. Chem. Soc. 2012, 134, 15061−15070.(26) Vukotic, V. N.; Harris, K. J.; Zhu, K.; Schurko, R. W.; Loeb, S. J.Nat. Chem. 2012, 4, 456−460.(27) Kong, X.; Scott, E.; Ding, W.; Mason, J. A.; Long, J. R.; Reimer,J. A. J. Am. Chem. Soc. 2012, 134, 14341−14344.(28) Lincke, J.; Lassig, D.; Stein, K.; Moellmer, J.; ViswanathKuttatheyil, A.; Reichenbach, C.; Moeller, A.; Staudt, R.; Kalies, G.;Bertmer, M.; Krautscheid, H. Dalton Trans. 2012, 41, 817−824.(29) van Rossum, B. J.; Forster, H.; de Groot, H. J. M. J. Magn. Reson.1997, 124, 516−519.(30) Feike, M.; Demco, D. E.; Graf, R.; Gottwald, J.; Hafner, S.;Spiess, H. W. J. Magn. Reson., Ser. A 1996, 122, 214−221.(31) Pickard, C. J.; Mauri, F. Phys. Rev. B 2001, 63, 245101.(32) Clark, S. J.; Segall, M. D.; Pickard, C. J.; Hasnip, P. J.; Probert,M. I. J.; Refson, K.; Payne, M. C. Z. Kristallogr. 2005, 220, 567−570.
(33) Harris, R. K.; Hodgkinson, P.; Pickard, C. J.; Yates, J. R.; Zorin,V. Magn. Reson. Chem. 2007, 45, S174−S186.(34) Ashbrook, S. E.; Le Polles, L.; Pickard, C. J.; Berry, A. J.;Wimperis, S.; Farnan, I. Phys. Chem. Chem. Phys. 2007, 9, 1587−1598.(35) Yates, J. R.; Pickard, C. J.; Payne, M. C.; Dupree, R.; Profeta, M.;Mauri, F. J. Phys. Chem. A 2004, 108, 6032−6037.(36) Joyce, S. A.; Yates, J. R.; Pickard, C. J.; Brown, S. P. J. Am. Chem.Soc. 2008, 130, 12663−12670.(37) Yates, J. R.; Dobbins, S. E.; Pickard, C. J.; Mauri, F.; Ghi, P. Y.;Harris, R. K. Phys. Chem. Chem. Phys. 2005, 7, 1402−1407.(38) Webber, A. L.; Emsley, L.; Claramunt, R. M.; Brown, S. P. J.Phys. Chem. A 2010, 114, 10435−10442.(39) Webber, A. L.; Elena, B.; Griffin, J. M.; Yates, J. R.; Pham, T. N.;Mauri, F.; Pickard, C. J.; Gil, A. M.; Stein, R.; Lesage, A.; Emsley, L.;Brown, S. P. Phys. Chem. Chem. Phys. 2010, 12, 6970−6983.(40) Harris, R. K. Analyst 2006, 131, 351−373.(41) X-AREA and X-RED; Stoe & Cie: Darmstadt, Germany, 2002.(42) Sheldrick, G. Acta Crystallogr., Sect. A 2008, 64, 112−122.(43) Stejskal, E. O.; Schaefer, J.; Waugh, J. S. J. Magn. Reson. 1977,28, 105−112.(44) Dixon, W. T. J. Chem. Phys. 1982, 77, 1800−1809.(45) Metz, G.; Wu, X. L.; Smith, S. O. J. Magn. Reson., Ser. A 1994,110, 219−227.(46) Opella, S. J.; Frey, M. H. J. Am. Chem. Soc. 1979, 101, 5854−5856.(47) Bennett, A. E.; Rienstra, C. M.; Auger, M.; Lakshmi, K. V.;Griffin, R. G. J. Chem. Phys. 1995, 103, 6951−6958.(48) Marion, D.; Ikura, M.; Tschudin, R.; Bax, A. J. Magn. Reson.1989, 85, 393−399.(49) Hahn, E. L. Phys. Rev. 1950, 80, 580−594.(50) Marion, D.; Wuthrich, K. Biochem. Biophys. Res. Commun. 1983,113, 967−974.(51) Vold, R. L.; Waugh, J. S.; Klein, M. P.; Phelps, D. E. J. Chem.Phys. 1968, 48, 3831−3832.(52) Robin Bendall, M.; Gordon, R. E. J. Magn. Reson. 1983, 53,365−385.(53) Laasonen, K.; Car, R.; Lee, C.; Vanderbilt, D. Phys. Rev. B 1991,43, 6796−6799.(54) Vanderbilt, D. Phys. Rev. B 1990, 41, 7892−7895.(55) Yates, J. R.; Pickard, C. J.; Mauri, F. Phys. Rev. B 2007, 76,024401.(56) Perdew, J. P.; Burke, K.; Ernzerhof, M. Phys. Rev. Lett. 1996, 77,3865−3868.(57) Monkhorst, H. J.; Pack, J. D. Phys. Rev. B 1976, 13, 5188−5192.(58) Blatov, V. A.; Shevchenko, A. P.; Serezhkin, V. N. J. Appl.Crystallogr. 2000, 33, 1193.(59) Blatov, V. A.; Carlucci, L.; Ciani, G.; Proserpio, D. M.CrystEngComm 2004, 6, 378−395.(60) Orellana, G.; Alvarez Ibarra, C.; Santoro, J. Inorg. Chem. 1988,27, 1025−1030.(61) Webber, A. L.; Masiero, S.; Pieraccini, S.; Burley, J. C.; Tatton,A. S.; Iuga, D.; Pham, T. N.; Spada, G. P.; Brown, S. P. J. Am. Chem.Soc. 2011, 133, 19777−19795.(62) Szlyk, E.; Lakomska, I.; Kobe, J.; Surdykowski, A.; Glowiak, T.;Sitkowski, J. Polyhedron 2002, 21, 2001−2007.(63) Cornago, P.; Claramunt, R. M.; Cano, M.; Heras, J. V.; Gallego,L. M. ARKIVOC 2005, 9, 21−29.(64) Harris, R. K., Wasylishen, R. E., Duer, M. J., Eds. NMRCrystallography; John Wiley & Sons Ltd.: Chichester, U.K., 2009.(65) Brouwer, D. H.; Alavi, S.; Ripmeester, J. A. Phys. Chem. Chem.Phys. 2008, 10, 3857−3860.(66) Ubbink, M.; Worrall, J. A. R.; Canters, G. W.; Groenen, E. J. J.;Huber, M. Annu. Rev. Biophys. Biomol. Struct. 2002, 31, 393−422.(67) Alla, M.; Lippmaa, E. Chem. Phys. Lett. 1982, 87, 30−33.(68) Vanderhart, D. L.; Earl, W. L.; Garroway, A. N. J. Magn. Reson.1981, 44, 361−401.(69) Nayeem, A.; Yesinowski, J. P. J. Chem. Phys. 1988, 89, 4600−4608.
Inorganic Chemistry Article
dx.doi.org/10.1021/ic302643w | Inorg. Chem. 2013, 52, 4431−44424441
(70) Oldfield, E.; Kinsey, R. A.; Smith, K. A.; Nichols, J. A.;Kirkpatrick, R. J. J. Magn. Reson. 1983, 51, 325−329.(71) VanderHart, D. L.; Asano, A.; Gilman, J. W. Chem. Mater. 2001,13, 3796−3809.(72) Bertmer, M.; Wang, M. F.; Kruger, M.; Blumich, B.; Litvinov, V.M.; van Es, M. Chem. Mater. 2007, 19, 1089−1097.(73) Ishii, Y.; Wickramasinghe, N. P.; Chimon, S. J. Am. Chem. Soc.2003, 125, 3438−3439.(74) Wickramasinghe, N. P.; Shaibat, M. A.; Jones, C. R.; Casabianca,L. B.; de Dios, A. C.; Harwood, J. S.; Ishii, Y. J. Chem. Phys. 2008, 128,052210−15.(75) Wickramasinghe, N. P.; Shaibat, M. A.; Ishii, Y. J. Phys. Chem. B2007, 111, 9693−9696.(76) Fung, B. M.; Khitrin, A. K.; Ermolaev, K. J. Magn. Reson. 2000,142, 97−101.(77) Detken, A.; Hardy, E. H.; Ernst, M.; Meier, B. H. Chem. Phys.Lett. 2002, 356, 298−304.(78) Ganapathy, S.; Chacko, V. P.; Bryant, R. G.; Etter, M. C. J. Am.Chem. Soc. 1986, 108, 3159−3165.(79) Chacko, V. P.; Ganapathy, S.; Bryant, R. G. J. Am. Chem. Soc.1983, 105, 5491−5492.(80) Bernheim, R. A.; Brown, T. H.; Gutowsky, H. S.; Woessner, D.E. J. Chem. Phys. 1959, 30, 950−956.(81) Blumberg, W. E. Phys. Rev. 1960, 119, 79−84.(82) Bourbigot, S.; VanderHart, D. L.; Gilman, J. W.; Awad, W. H.;Davis, R. D.; Morgan, A. B.; Wilkie, C. A. J. Polym. Sci., Part B: Polym.Phys. 2003, 41, 3188−3213.
Inorganic Chemistry Article
dx.doi.org/10.1021/ic302643w | Inorg. Chem. 2013, 52, 4431−44424442
Related Documents