Synthesis, characterization and performance evaluation of Ni/Al 2 O 3 catalysts for reforming of crude ethanol for hydrogen production Abayomi J. Akande a,b , Raphael O. Idem a, * , Ajay K. Dalai b a Process Systems Engineering Laboratory, Faculty of Engineering, University of Regina, Regina, Sask., Canada S4S 0A2 b Department of Chemical Engineering, University of Saskatchewan, Saskatoon, Sask., Canada S7N 5C5 Received 22 December 2004; received in revised form 16 March 2005; accepted 18 March 2005 Available online 17 May 2005 Abstract The effects of catalyst synthesis method (i.e. precipitation (PT), coprecipitation (CP) and impregnation (IM)), Ni loading and reduction temperature on the characteristics and performance of Ni/Al 2 O 3 catalysts were evaluated for the reforming of crude ethanol for H 2 production. The results showed that in the calcined PT catalysts, no NiAl 2 O 4 species were observed whereas this was a major species in CP and IM catalysts. As a result, PT catalysts were more reducible than CP and IM catalysts. PT catalysts exhibited slightly lower crystallite sizes of NiO species than the corresponding CP catalysts. On the other hand, IM catalysts had extremely large crystallite sizes except IM10 (IM catalyst with 10% Ni loading) which had the smallest crystallite size. A combination of small crystallite size and high reducibility for PT catalysts resulted in higher crude ethanol conversions for the PT catalysts. In contrast, the IM catalysts with larger crystallite sizes and lower reducibility yielded the lowest crude ethanol conversions. Catalysts with 15% Ni loading gave the best crude ethanol conversions for each method of synthesis with PT15 giving the best overall crude ethanol conversion of 85 mol% again because of its smaller crystallite size and higher reducibility. In terms of H 2 yield, CP15 was the optimum catalyst because of its higher H 2 selectivity as compared to PT15 and IM15 catalysts. Coking was observed at the onset of the reaction but stabilized after 180 min TOS. # 2005 Elsevier B.V. All rights reserved. Keywords: Ni–Al 2 O 3 catalysts; Synthesis method; Reducibility; Crude ethanol reforming; Crystallite size; Conversion 1. Introduction The majority of current energy needs are supplied by combustion of non-renewable energy sources such as fossil fuels with the attendant release of large quantities of greenhouse gases (GHG), especially carbon dioxide (CO 2 ) and other harmful emissions to the atmosphere. The gradual depletion of these fossil fuels reserves and efforts to combat pollution and greenhouse gas emissions have generated a considerable interest in using alternative sources of energy [1,2]. On the other hand, strong efforts are being made to commercialize the use of fuel cells such as the proton exchange membrane (PEM) fuel cell for the generation of electric power for both electric vehicles and distributed electric power plants [3,4]. The major reason for the interest is the high energy efficiency of the fuel cell with an overall energy efficiency of about 60%, in some cases [5]. Also, with an equally strong interest in the use of hydrogen (H 2 ) as the fuel, PEM fuel cells are the most certain to meet future ultra low NO x , SO x , CO, CH 4 and CO 2 emissions targets [3]. Thus, H 2 has a significant future potential as an alternative fuel that can solve the problems of CO 2 emissions as well as the emissions of other air contaminants. It is well known that H 2 production can be accomplished by gasification or reforming of fossil fuels [6,7] or biomass [8]. However, if a global cycle of clean and sustainable production of energy is envisaged, a new eco-friendly reservoir of hydrogen is needed. In this context, ethanol (a form of biomass) satisfies most of these requirements since it is easy to produce, and is also safe to handle, transport and store [9,10]. As such, ethanol provides an environmentally responsible energy source that can significantly reduce GHG emissions [2]. It is www.elsevier.com/locate/apcata Applied Catalysis A: General 287 (2005) 159–175 * Corresponding author. Tel.: +1 306 585 4470; fax: +1 306 585 4855. E-mail address: [email protected] (R.O. Idem). 0926-860X/$ – see front matter # 2005 Elsevier B.V. All rights reserved. doi:10.1016/j.apcata.2005.03.046

Welcome message from author
This document is posted to help you gain knowledge. Please leave a comment to let me know what you think about it! Share it to your friends and learn new things together.
Transcript

www.elsevier.com/locate/apcata
Applied Catalysis A: General 287 (2005) 159–175
Synthesis, characterization and performance evaluation of Ni/Al2O3
catalysts for reforming of crude ethanol for hydrogen production
Abayomi J. Akande a,b, Raphael O. Idem a,*, Ajay K. Dalai b
a Process Systems Engineering Laboratory, Faculty of Engineering, University of Regina, Regina, Sask., Canada S4S 0A2b Department of Chemical Engineering, University of Saskatchewan, Saskatoon, Sask., Canada S7N 5C5
Received 22 December 2004; received in revised form 16 March 2005; accepted 18 March 2005
Available online 17 May 2005
Abstract
The effects of catalyst synthesis method (i.e. precipitation (PT), coprecipitation (CP) and impregnation (IM)), Ni loading and reduction
temperature on the characteristics and performance of Ni/Al2O3 catalysts were evaluated for the reforming of crude ethanol for H2 production.
The results showed that in the calcined PT catalysts, no NiAl2O4 species were observed whereas this was a major species in CP and IM
catalysts. As a result, PT catalysts were more reducible than CP and IM catalysts. PT catalysts exhibited slightly lower crystallite sizes of NiO
species than the corresponding CP catalysts. On the other hand, IM catalysts had extremely large crystallite sizes except IM10 (IM catalyst
with 10% Ni loading) which had the smallest crystallite size. A combination of small crystallite size and high reducibility for PT catalysts
resulted in higher crude ethanol conversions for the PT catalysts. In contrast, the IM catalysts with larger crystallite sizes and lower
reducibility yielded the lowest crude ethanol conversions. Catalysts with 15% Ni loading gave the best crude ethanol conversions for each
method of synthesis with PT15 giving the best overall crude ethanol conversion of 85 mol% again because of its smaller crystallite size and
higher reducibility. In terms of H2 yield, CP15 was the optimum catalyst because of its higher H2 selectivity as compared to PT15 and IM15
catalysts. Coking was observed at the onset of the reaction but stabilized after 180 min TOS.
# 2005 Elsevier B.V. All rights reserved.
Keywords: Ni–Al2O3 catalysts; Synthesis method; Reducibility; Crude ethanol reforming; Crystallite size; Conversion
1. Introduction
The majority of current energy needs are supplied by
combustion of non-renewable energy sources such as fossil
fuels with the attendant release of large quantities of
greenhouse gases (GHG), especially carbon dioxide (CO2)
and other harmful emissions to the atmosphere. The gradual
depletion of these fossil fuels reserves and efforts to combat
pollution and greenhouse gas emissions have generated a
considerable interest in using alternative sources of energy
[1,2].
On the other hand, strong efforts are being made to
commercialize the use of fuel cells such as the proton
exchange membrane (PEM) fuel cell for the generation of
electric power for both electric vehicles and distributed
* Corresponding author. Tel.: +1 306 585 4470; fax: +1 306 585 4855.
E-mail address: [email protected] (R.O. Idem).
0926-860X/$ – see front matter # 2005 Elsevier B.V. All rights reserved.
doi:10.1016/j.apcata.2005.03.046
electric power plants [3,4]. The major reason for the interest
is the high energy efficiency of the fuel cell with an overall
energy efficiency of about 60%, in some cases [5]. Also,
with an equally strong interest in the use of hydrogen (H2) as
the fuel, PEM fuel cells are the most certain to meet future
ultra low NOx, SOx, CO, CH4 and CO2 emissions targets [3].
Thus, H2 has a significant future potential as an alternative
fuel that can solve the problems of CO2 emissions as well as
the emissions of other air contaminants. It is well known that
H2 production can be accomplished by gasification or
reforming of fossil fuels [6,7] or biomass [8]. However, if a
global cycle of clean and sustainable production of energy is
envisaged, a new eco-friendly reservoir of hydrogen is
needed. In this context, ethanol (a form of biomass) satisfies
most of these requirements since it is easy to produce, and is
also safe to handle, transport and store [9,10]. As such,
ethanol provides an environmentally responsible energy
source that can significantly reduce GHG emissions [2]. It is
A.J. Akande et al. / Applied Catalysis A: General 287 (2005) 159–175160
also known that the application of ethanol for the production
and use of H2 energy is CO2 neutral [11] as this does not
result into any net emission of CO2. Furthermore, since
ethanol does not contain heteroatoms and metals, its use as
source of energy does not result in emissions of NOx, SOx,
particulates and other toxics. In addition, ethanol is mostly
an oxygenated hydrocarbon, which leads to complete
combustion during its application to produce power. As
such, little or no CO is produced. These attributes have made
H2 obtained from ethanol reforming a very good energy
vector, especially in fuel cells applications. H2 production
from ethanol has advantages when compared with other H2
production techniques, including steam reforming of
methanol and hydrocarbons. Unlike hydrocarbons, ethanol
is easier to reform and is also free of sulfur, which is a
catalyst poison in the reforming of hydrocarbons [9]. Also,
unlike methanol, which is sourced from hydrocarbons [12]
and has a relatively high toxicity, ethanol is completely
biomass based and has low toxicity.
The production of hydrogen by steam reforming of pure
ethanol has been widely investigated. Jordi et al. [13]
performed their investigation on Co/ZnO catalyst using a
water to ethanol molar ratio of 13:1 (20%, v/v, ethanol)
whereas Leclerc et al. [14] reported that water to ethanol
ratios in the range of 20:1 (14%, v/v, ethanol) to 30:1 (10%,
v/v, ethanol) enhanced hydrogen selectivity and inhibited
the production of undesirable products such as methane
(CH4), carbon monoxide (CO), acetaldehyde, ethylene and
carbon. Gavita et al. [15] used water to ethanol molar ratios
of 3:1 and 8.1:1, and obtained their highest ethanol
conversion on Ni/MgO catalyst at water to ethanol molar
ratio of 8.1:1 (28%, v/v, ethanol). Das [16] used a water to
ethanol molar ratio of 6:1 (35%, v/v, ethanol) on Mn
promoted Cu based catalyst to obtain optimum ethanol
conversion, hydrogen yield and selectivity.
In all these cases, water is needed as a co-feed to the
process. Consequently, there is no need to reduce the water
and organic contents of wet or crude ethanol (fermentation
broth produced from a fermentation process) since this
contains approximately 12% (v/v) ethanol, which is within the
range of water to ethanol molar ratio used for literature cited
ethanol reforming processes. The reforming of crude ethanol
is different from the reforming of pure ethanol essentially
because of the presence of other oxygenated hydrocarbons
such as glycerol, lactic acid and maltose. These have not been
reported before to be steam reformed to produce hydrogen. In
the first place, these oxygenated hydrocarbons add to an
increased production of hydrogen by about 7% compared to
steam reforming of pure ethanol. In the second place, the
catalyst activity for ethanol reforming is influenced by the
presence of the oxygenated hydrocarbons. Thirdly, the
reaction temperature needs to be modified in order to
accommodate the reforming of the oxygenated hydrocarbons.
Also, this process would eliminate the large amount of energy
wasted during distillation to remove water from fermentation
broth in order to produce dry or pure ethanol. Haga et al. [2]
suggested that in order to obtain a widespread use of ethanol
for hydrogen production, the economics and energetics of the
ethanol production process have to be greatly improved. Thus,
by circumventing the distillation and drying step, our process
[17] of reforming crude ethanol (i.e. fermentation broth)
provides us with the ability to produce H2 from crude ethanol
solution in a cost-effective manner. However, the reforming of
crude ethanol to produce hydrogen has not been reported in
the literature before, to the best of our knowledge, until we
recently developed the catalytic process for H2 production
from the reforming of crude ethanol based on Cu/Mn/Al2O3
and Ni/Al2O3 catalysts [17].
Because of weight and engineering problems, on-board
reforming to produce H2 no longer appears to be the most
attractive way to deliver H2 to the fuel cell in electric vehicle.
Instead, there are strong efforts to deliver the H2 to the fuel
cell for this application by means of H2 refueling stations.
Several such stations already exist, for example, Hydro-
genics station in Toronto, Canada as well as stations in Perth,
Australia and in Japan [18]. Also, a very important aspect for
the actualization of the PEM fuel cell powered electric
vehicles that would use crude ethanol based H2 is the
development of a stable active catalyst for the process. Such
a catalyst should ensure high selectivity and yield and should
result in a small sized reformer for use in a H2 refueling
station. While there is little information on catalysts
development regarding the steam reforming of pure ethanol,
there is no such information in the case of the reforming of
crude ethanol. In the literature, Al2O3 supported Co, Ni or
Cu catalysts have been employed for pure ethanol
reforming. Also, Idem et al. [17] indicated that Al2O3
supported Ni catalysts or Cu–Mn–Al catalysts are active for
crude ethanol reforming. Ni is reported [19] to ensure C–C
bond breakage in ethanol or other oxygenated hydrocarbons
while Al2O3 ensures good thermal stability. Even though Ni/
Al2O3 catalysts appear to be the more active, the effects of
the catalyst synthesis method, Ni loading and reduction
temperature on the characteristics and performance of the
catalysts have not been reported before for the reforming of
crude ethanol for H2 production. The evaluation of these
effects are presented and discussed in this paper.
2. Experimental
Ni/Al2O3 catalyst was selected based on the fact that Ni
enhances steam-reforming reaction [15,17]. Also, it has
been reported that Ni ensures C–C bond rupture of ethanol or
other oxygenated hydrocarbon components of crude ethanol
[17,19]. On the other hand, Al2O3 was chosen as support
because it ensures thermal stability of the catalyst [19,20].
2.1. Synthesis of catalysts
Three methods of synthesis: coprecipitation, precipita-
tion and impregnation were investigated. The preparation
A.J. Akande et al. / Applied Catalysis A: General 287 (2005) 159–175 161
procedure used for coprecipitation was similar to the one
used by Idem [21]. Briefly, the solution mixture of nickel
nitrate hexahydrate and aluminum nitrate nonahydrate of
appropriate concentration (depending on nickel loading)
was prepared. Precipitation was brought about by adding
this solution in a drop-wise manner with constant stirring to
the solution of sodium carbonate solution (pH ffi 11.5)
maintained at 40 8C in a 3-l flask. The quantity of sodium
carbonate solution used was 1.1 times the stoichiometric
requirement. The resulting slurry (pH ffi 8.0) was vigorously
stirred for another 60 min. The precipitate was filtered and
dried at 80 8C overnight. The dried precipitate was then
washed several times with warm water and finally with cold
water and then dried at 110 8C overnight in air. The dried
sample was then calcined, characterized and used for
performance evaluation for the reforming of crude ethanol.
The precipitation synthesis method involved the pre-
paration of solutions of predetermined amounts of nickel
nitrate hexahydrate (depending on the Ni loading). This
solution was added to another solution containing an
appropriate quantity of sodium carbonate (to induce
complete precipitation of the former), and which also
contained commercial alumina. The commercial alumina
was g-alumina obtained from EM Science, Gibbstown, NJ,
USA. The resulting slurry was vigorously stirred for 24 h to
enhance precipitation of nickel on the g-alumina. The
precipitate was filtered and dried at 80 8C overnight. The
dried precipitate was then washed several times with warm
water and finally with cold water and then dried at 110 8Covernight in air. The dried sample was then calcined,
characterized and used for performance evaluation for the
reforming of crude ethanol.
The impregnation method involved preparation of nickel
solutions of different concentrations dissolved in a solution
of a fixed amount of the same type of commercial alumina
(g-alumina obtained from EM Science, Gibbstown, NJ,
USA) as used in the precipitation method. The resulting
slurry was stirred vigorously for 24 h and then filtered; the
filtered sample was dried at 110 8C overnight in air. The
dried sample was analyzed for elemental composition by
inductively coupled plasma-mass spectroscopy (ICP-MS).
The information obtained was used to prepare a calibration
Table 1
Name and chemical composition of catalysts
Preparation method Catalyst name Ni composition (wt.%
Coprecipitation CP10 10
CP15 15
CP20 20
CP25 25
Precipitation PT10 10
PT15 15
PT20 20
Impregnation IM10 10
IM15 15
IM20 20
curve that was used for preparing catalysts with the desired
Ni loading.
The designations and elemental compositions of the
calcined catalysts are given in Table 1. CP, PT and IM
indicate coprecipitation, precipitation and impregnation
synthesis methods, respectively. The numbers in the
designations in Table 1 represent the loadings while the
symbols represent the synthesis method. For example, CP10
indicates a catalyst with 10% Ni loading prepared by
coprecipitation synthesis method.
2.2. Catalyst characterization
The dried, calcined and reduced catalysts were char-
acterized for BET surface area, pore size and distribution,
and pore volume. The other characterization techniques to
which these catalysts were subjected were temperature
programmed reduction studies using H2 (TPR-H2), thermo-
gravimetric analysis (TGA), powder X-ray diffraction
(XRD) analysis, X-ray line broadening, and temperature
programmed oxidation (TPO). BET surface area, pore
volume and pore size distribution of the catalysts were
measured by N2 adsorption at 77 K using a Micromeritics
adsorption equipment (Model ASAP 2010, manufactured by
Micromeritics Instruments Inc., Norcross, GA, USA) using
N2 gas (99.995% pure; obtained from Praxair, Regina,
Saskatchewan, Canada). TPR-H2 studies were performed
with ChemBET3000, manufactured by Quantachrome
Corporation, FL, USA. This equipment was fitted with a
thermal conductivity detector (TCD), and analysis was done
using 5 mol% H2 in N2 at a heating rate of 10 8C/min from
room temperature to 900 8C. TGA was performed to
measure the weight loss, the rate of weight loss and the
heat effects associated with drying, combustion or decom-
position of catalyst as a function of temperature. The
analysis was performed with TG-DSC-1100 supplied by
Setaram Scientific and Industrial Equipment, NJ, USA. At
different stages of synthesis, the powder XRD patterns of all
the catalysts were obtained with D8 diffractometer with
GADDS equipped with a Cu source both manufactured by
Bruker AXS, USA, in order to identify the component
phases present as a function of synthesis method. This
) Al composition (wt.%) O composition (wt.%)
47.63 42.37
44.98 40.02
42.34 37.66
39.69 35.31
47.63 42.37
44.98 40.02
42.34 37.66
47.63 42.37
44.98 40.02
42.34 37.66
A.J. Akande et al. / Applied Catalysis A: General 287 (2005) 159–175162
applied to dried, calcined and reduced catalyst samples. The
X-ray diffractograms were recorded at 2u angles ranging
from 48 to 1008 at a speed of 58/min. The crystallite sizes of
the samples were also obtained by X-ray line broadening
using the same equipment. After the crude ethanol reforming
reaction, the catalysts were characterized by means of TPO
under an oxidative atmosphere (5% oxygen in helium)
flowing at 30 mL/min at a temperature-programmed rate of
10 8C/min using the Perkin Elmer Pyris Diamond TG/DTA
supplied by Seiko Instruments Inc., USA.
2.3. Catalytic activity tests
2.3.1. The feed material
The feed for this process was crude ethanol (i.e.
fermentation broth) and was obtained from Pound Maker
Agventures, Lanigan, Saskatchewan, Canada. This was
used as received except for the removal of particulate
matter by filtration. However, for the purpose of evaluating
the performance of the catalysts, crude ethanol was defined
as the combination of all the oxygenated hydrocarbon
components present in fermentation broth; namely,
ethanol, lactic acid, glycerol and maltose. We performed
an analysis in our laboratory to both identify and quantify
these components of fermentation broth using a high
performance liquid chromatograph (HPLC) Model Agilent
1100 series supplied by Agilent Technologies, Wilming-
ton, DE, USA. The HPLC was equipped with a
250 mm � 4.1 mm HC-75 column and a refractive index
detector, while 0.05 mM succinic acid was used as the
mobile phase. The result of the analysis is shown in
Table 2. Consequently, the overall molecular formula of
crude ethanol based on the weighted average of these
components is C2.12H6.12O1.23. Based on this composition,
the general equation representing the reforming of crude
ethanol can be represented as in Eq. (1).
C2:12H6:12O1:23 þ 3:01H2O ! 2:12CO2 þ 6:07H2 (1)
2.3.2. Activity tests
The reactor used to obtain experimental data was BTRS
model number 02250192-1 supplied by Autoclave Engi-
neers, Erie, PA, USA. It was made of a stainless steel tube of
8.0 mm internal diameter (D) placed in an electric furnace.
Crude ethanol was delivered to the reactor chamber by
means of a HPLC pump regulated at the desired flow rates.
The reaction temperature was measured with a sliding
Table 2
Crude ethanol composition
Crude ethanol components vol.% mol% on a water free basis
Ethanol 12 88.42
Lactic acid 1 5.71
Glycerol 1 5.87
Maltose 0.001 0.001
Water 86 Not applicable
thermocouple placed inside the bed. The error on
temperature measurement was within �1 8C.
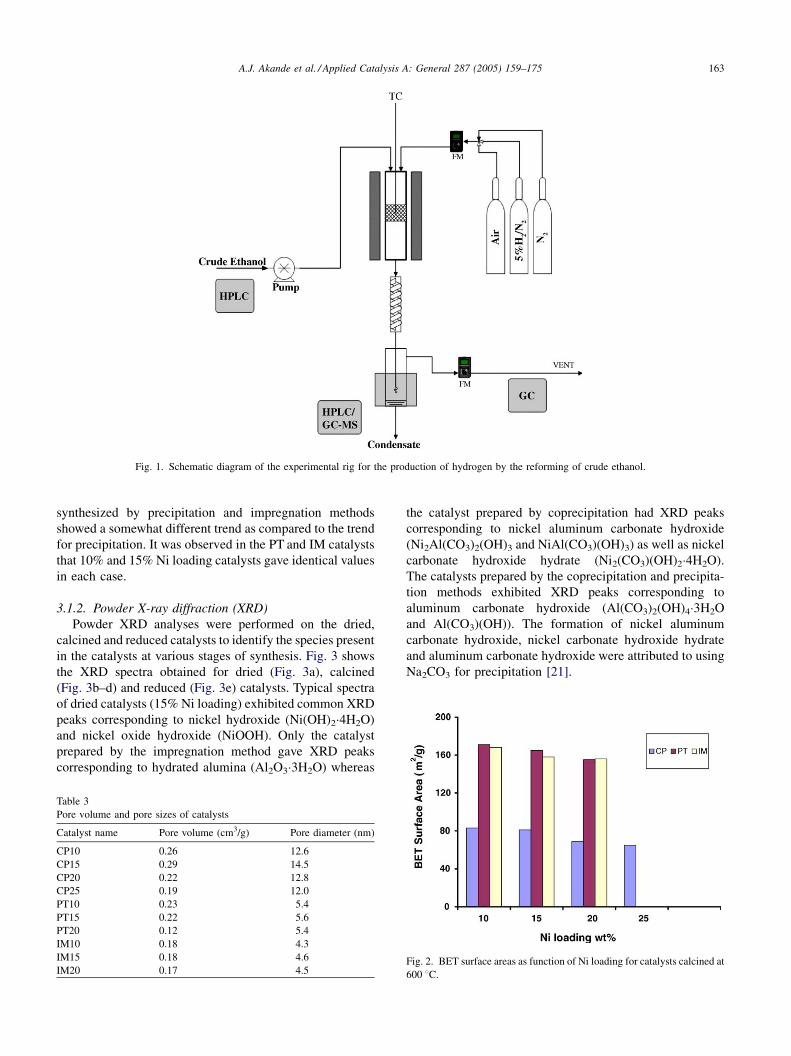
A typical run for the reforming of crude ethanol was
performed as follows: approximately 1 g of the catalyst was
mixed with 2 g of Pyrex glass (i.e. inert material) of the same
average particle size and then loaded into the reactor. The
feed consisting of crude ethanol (comprising of ethanol plus
other organics and water) was then pumped at the desired
flow rate (i.e. space velocity) to the vaporizer maintained at
250 8C before entering the reactor. Prior to reaction the
catalyst was reduced in situ by treatment with 5% H2 in N2
gas (supplied by Praxair, Regina, Saskatchewan, Canada)
flowing at 100 mL/min for 2 h. The reactions were carried
out at atmospheric pressure and reaction temperature of
400 8C. The product mixture during reaction was passed
through a condenser and gas–liquid separator to separate the
gaseous and liquid products for analysis.
2.3.3. Analysis of liquid and gaseous products
The liquid product was analyzed using the same HPLC
described earlier. This liquid product was also analyzed with
GC–MS in order to identify the components for subsequent
HPLC analysis. GC–MS analysis was performed using GC–
MS model HP 6890/5073 supplied by Hewlett-Packard,
Quebec, Canada. An HP–Innowax column (length = 30 m,
internal diameter = 250 mm, thickness = 0.25 mm) packed
with cross-linked poly-ethylene glycol was used in the GC
for the separation of components. The composition of the
output gas stream was analyzed on-line by gas chromato-
graphy (Model HP 6890) using molecular sieve and
Haysep columns, a thermal conductivity detector (TCD)
and helium as carrier gas. The schematic diagram of the
experimental set-up used for the reforming reaction is shown
in Fig. 1.
3. Results and discussion
3.1. Catalyst characteristics
3.1.1. BET surface area, pore size and pore volume
BET surface area, pore volume and pore size studies were
performed on the calcined catalysts. The results are given in
Table 3 for pore volume and average pore size and in Fig. 2
for BET surface area. In the coprecipitation method, the
BET surface area (Fig. 2) decreased in a monotonic fashion
from 83 to 65 m3/g as the Ni loading increased. In contrast,
the pore size and pore volume initially increased with Ni
loading and reached a maximum of 14.5 nm and 0.29 cm3/g,
respectively, and then decreased with further increase in the
Ni loading. Calcined catalysts prepared by precipitation and
impregnation methods exhibited similar trends in surface
area and pore size as those prepared by the coprecipitation
method. However, the pore sizes of the CP catalysts were
much larger than the corresponding PT and IM catalysts. On
the other hand, the pore volume for which the catalysts were
A.J. Akande et al. / Applied Catalysis A: General 287 (2005) 159–175 163
Fig. 1. Schematic diagram of the experimental rig for the production of hydrogen by the reforming of crude ethanol.
synthesized by precipitation and impregnation methods
showed a somewhat different trend as compared to the trend
for precipitation. It was observed in the PT and IM catalysts
that 10% and 15% Ni loading catalysts gave identical values
in each case.
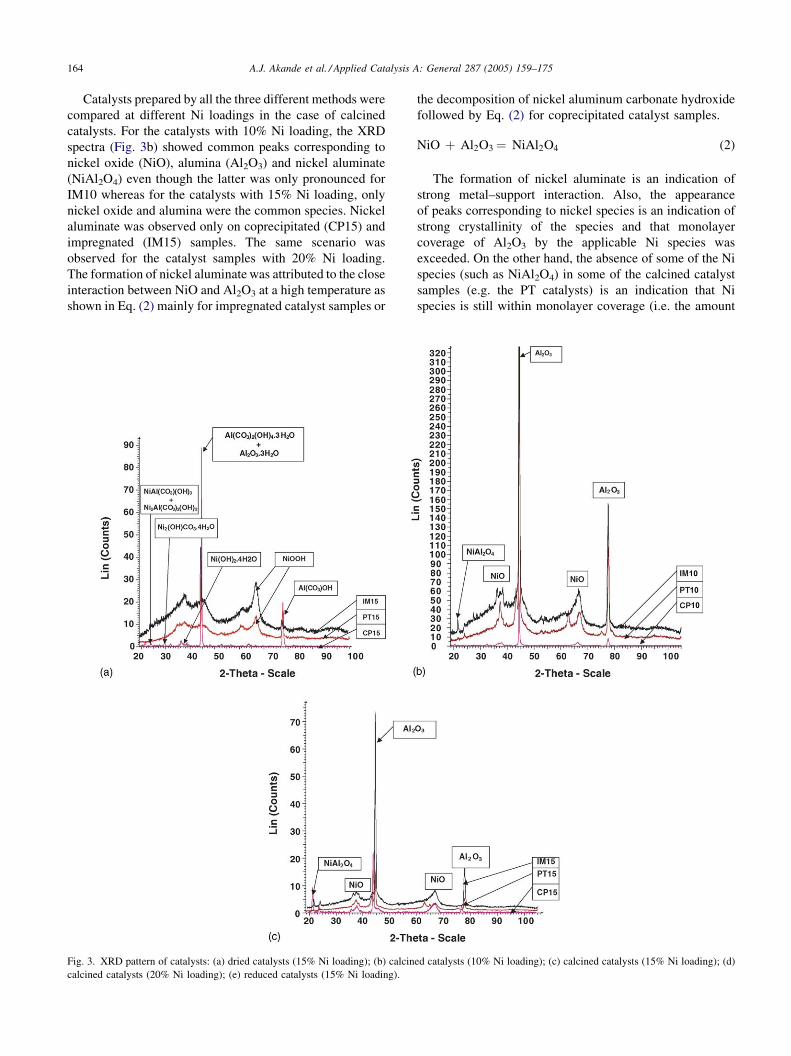
3.1.2. Powder X-ray diffraction (XRD)
Powder XRD analyses were performed on the dried,
calcined and reduced catalysts to identify the species present
in the catalysts at various stages of synthesis. Fig. 3 shows
the XRD spectra obtained for dried (Fig. 3a), calcined
(Fig. 3b–d) and reduced (Fig. 3e) catalysts. Typical spectra
of dried catalysts (15% Ni loading) exhibited common XRD
peaks corresponding to nickel hydroxide (Ni(OH)2�4H2O)
and nickel oxide hydroxide (NiOOH). Only the catalyst
prepared by the impregnation method gave XRD peaks
corresponding to hydrated alumina (Al2O3�3H2O) whereas
Table 3
Pore volume and pore sizes of catalysts
Catalyst name Pore volume (cm3/g) Pore diameter (nm)
CP10 0.26 12.6
CP15 0.29 14.5
CP20 0.22 12.8
CP25 0.19 12.0
PT10 0.23 5.4
PT15 0.22 5.6
PT20 0.12 5.4
IM10 0.18 4.3
IM15 0.18 4.6
IM20 0.17 4.5
the catalyst prepared by coprecipitation had XRD peaks
corresponding to nickel aluminum carbonate hydroxide
(Ni2Al(CO3)2(OH)3 and NiAl(CO3)(OH)3) as well as nickel
carbonate hydroxide hydrate (Ni2(CO3)(OH)2�4H2O).
The catalysts prepared by the coprecipitation and precipita-
tion methods exhibited XRD peaks corresponding to
aluminum carbonate hydroxide (Al(CO3)2(OH)4�3H2O
and Al(CO3)(OH)). The formation of nickel aluminum
carbonate hydroxide, nickel carbonate hydroxide hydrate
and aluminum carbonate hydroxide were attributed to using
Na2CO3 for precipitation [21].
Fig. 2. BET surface areas as function of Ni loading for catalysts calcined at
600 8C.
A.J. Akande et al. / Applied Catalysis A: General 287 (2005) 159–175164
Catalysts prepared by all the three different methods were
compared at different Ni loadings in the case of calcined
catalysts. For the catalysts with 10% Ni loading, the XRD
spectra (Fig. 3b) showed common peaks corresponding to
nickel oxide (NiO), alumina (Al2O3) and nickel aluminate
(NiAl2O4) even though the latter was only pronounced for
IM10 whereas for the catalysts with 15% Ni loading, only
nickel oxide and alumina were the common species. Nickel
aluminate was observed only on coprecipitated (CP15) and
impregnated (IM15) samples. The same scenario was
observed for the catalyst samples with 20% Ni loading.
The formation of nickel aluminate was attributed to the close
interaction between NiO and Al2O3 at a high temperature as
shown in Eq. (2) mainly for impregnated catalyst samples or
Fig. 3. XRD pattern of catalysts: (a) dried catalysts (15% Ni loading); (b) calcin
calcined catalysts (20% Ni loading); (e) reduced catalysts (15% Ni loading).
the decomposition of nickel aluminum carbonate hydroxide
followed by Eq. (2) for coprecipitated catalyst samples.
NiO þ Al2O3 ¼ NiAl2O4 (2)
The formation of nickel aluminate is an indication of
strong metal–support interaction. Also, the appearance
of peaks corresponding to nickel species is an indication of
strong crystallinity of the species and that monolayer
coverage of Al2O3 by the applicable Ni species was
exceeded. On the other hand, the absence of some of the Ni
species (such as NiAl2O4) in some of the calcined catalyst
samples (e.g. the PT catalysts) is an indication that Ni
species is still within monolayer coverage (i.e. the amount
ed catalysts (10% Ni loading); (c) calcined catalysts (15% Ni loading); (d)
A.J. Akande et al. / Applied Catalysis A: General 287 (2005) 159–175 165
Fig. 3. (Continued ).
present is too small and thus cannot be detected by XRD or is
completely absent.
In the case of the reduced catalysts, typical XRD spectra
for catalysts with 15% Ni loading (Fig. 3e) showed common
peaks corresponding to nickel metal (Ni) and aluminum
oxide. The spinel, nickel aluminate, was observed only for
catalysts prepared by coprecipitation and impregnation
methods. This shows that the reduction temperature of
600 8C used for catalyst reduction with H2 was not sufficient
to reduce all the nickel aluminate species to Ni metal and
alumina for these two types of catalysts.
Table 4 shows the results of crystallite size measurements
for NiO species obtained by X-ray line broadening as a
function of preparation method and Ni loading. At 10% Ni
loading all catalysts have relatively small crystallite sizes
with that prepared by impregnation having the smallest
crystallite size. However, with Ni loadings of 15% and 20%,
the catalysts prepared by the impregnation method produced
a dramatic increase in crystallite size (105.8 and 160.2 nm,
respectively). These were much larger than the crystallite
sizes of the corresponding Ni loadings for catalysts prepared
Table 4
Crystallite size of catalysts
Catalysts name Crystallite size (nm)
CP10 26.5
CP15 29.8
CP20 38.5
PT10 21.5
PT15 20.8
PT20 39.6
IM10 15.3
IM15 105.8
IM20 160.2
by coprecipitation and precipitation methods. The overall
large crystallite sizes (especially for Ni loading �15%)
shows the existence of agglomeration of Ni species and that
monolayer coverage was exceeded.
3.1.3. Thermogravimetric analysis
The evaluation of weight loss, rate of weight loss as well
as the heat effects associated with drying or decomposition
of dried catalysts as a function of temperature is important
because it enables us to determine the maximum tempera-
ture after which the catalyst weight loss is negligible (i.e.
complete decomposition). This, in turn, allows us to
establish the minimum temperature at which catalyst
becomes thermally stable, and as such, the minimum
temperature for catalyst calcination.
The TGA profiles for dried catalysts samples are shown
in Fig. 4a–i. The profiles of these dried catalysts, in general,
show an endothermic peak at about 100 8C corresponding to
thermal desorption of H2O and adsorbed CO2 as reported by
Jianjun et al. [22]. The peak at about 250–350 8Ccorresponds to the abstraction of chemically bound water
from nickel hydroxide hydrate (Ni(OH)2�4H2O) and
aluminum hydroxide. It could also correspond to the
thermal decomposition of nickel aluminum carbonate
hydroxide (Ni2Al(CO3)2(OH)3) by removal of CO2. The
endothermic peak at about 500–600 8C corresponds to the
thermal decomposition of nickel hydroxide into NiO and
H2O as reported by Parthasarathi et al. [23] and the thermal
decomposition of nickel aluminum hydroxide into NiAl2O4
and H2O. The nickel hydroxide described in the former case
results from the elimination of H2O and CO2 from
Ni2(OH)CO3�4H2O and by abstraction of H2O from
Ni(OH)2�4H2O. Since the peak that was observed specifi-

A.J. Akande et al. / Applied Catalysis A: General 287 (2005) 159–175166
Fig. 4. TG-DSC profile of CP10 catalyst: (a) dried CP10 catalyst; (b) dried PT10 catalyst; (c) dried IM10 catalyst; (d) dried CP15 catalyst; (e) dried PT15
catalyst; (f) dried IM15 catalyst; (g) dried CP20 catalyst; (h) dried PT20 catalyst; (i) dried IM20 catalyst.

A.J. Akande et al. / Applied Catalysis A: General 287 (2005) 159–175 167
Fig. 5. TPR-H2 profiles of calcined catalysts prepared by: (a) the coprecipitation method; (b) the precipitation method; (c) the impregnation method.
Table 5
Summary of TPR analyses for calcined Ni/Al2O3 catalysts
Catalysts
name
Number
of peaks
Peak temperature
(8C)
Major reducible
species
CP10 3 471, 534, 700 NiO, NiAl2O4
CP15 3 501, 569, 731 NiO, NiAl2O4
CP20 3 514, 572, 738 NiO, NiAl2O4
PT10 2 438, 600 NiO
PT15 3 434, 602, 769 NiO
PT20 2 446, 529 NiO
IM10 3 444, 594, 794 NiO, NiAl2O4
IM15 3 472, 602, 812 NiO, NiAl2O4
IM20 3 488, 612, 830 NiO, NiAl2O3
cally at 600 8C was obtained only in the CP catalysts
and was absent in the PT and IM catalysts, it can be
concluded that the Ni(OH)2 in this case originated from
Ni2(OH)CO3�4H2O whereas the one at about 500 8Coriginated from Ni(OH)2�4H2O. Also, since the peak at
600 8C is specific to the CP catalysts, the results imply that
the decomposition of nickel aluminum hydroxide to yield
NiAl2O4 occurs at this temperature. The TG profiles for
these dried catalyst samples suggest that the calcination
temperature of 600 8C was adequate and was able to
stabilize all the catalysts except in CP20 where a
calcinations temperature of 650 8C would be required for
stabilizing the catalyst.
3.1.4. Temperature programmed reduction (TPR-H2)
The objective of TPR-H2 experiments was to determine
the reducibility as well as the optimum reduction
temperature for the catalysts for the reforming of crude
ethanol. In conjunction with XRD data, it was also useful in
determining the type of species present in the calcined
catalysts. The TPR-H2 profiles of all the catalysts calcined at
600 8C are given in Fig. 5a–c for catalysts prepared by
coprecipitation, precipitation and impregnation, respec-
tively. The peak temperatures and the corresponding species
are summarized in Table 5.
All the reduction peaks between 400 and 602 8Crepresent the reduction of NiO. The oxide of nickel was
produced by the thermal decomposition of various non-
aluminum containing nickel species at appropriate tem-
peratures, as evidenced from XRD and TGA studies. The
presence of these peaks has been reported by Idem et al. [24]
for Co–Ni–ZrO2/sulphated-ZrO2 hybrid catalysts and by
Jae-Hee et al. [25] for Ni/Al2O3 catalyst. The peaks observed
in the temperature range of 750–812 8C represent the
reduction of NiAl2O4 species. The presence of this peak has
been reported by Marino et al. [26], Jae-Hee et al. [25] and
A.J. Akande et al. / Applied Catalysis A: General 287 (2005) 159–175168
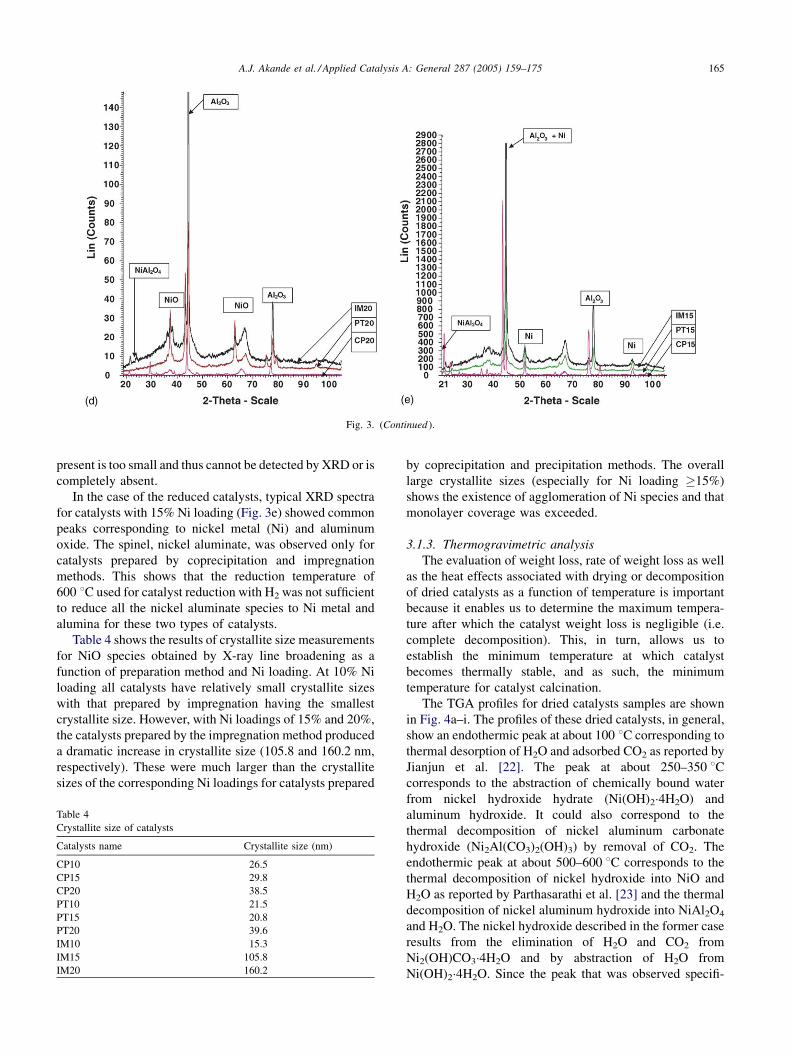
Fig. 6. Conversion of crude ethanol as a function of time-on-stream (TOS)
on catalyst prepared by coprecipitation method at T = 400 8C,
WHSV = 1.68 h�1, reduction temperature = 600 8C and calcination tem-
perature = 600 8C.
Fig. 7. Conversion of crude ethanol as a function of time-on-stream (TOS)
on catalyst prepared by precipitation method at T = 400 8C,
WHSV = 1.68 h�1, reduction temperature = 600 8C and calcination tem-
perature = 600 8C.
Juan-Juan et al. [27] for Ni/Al2O3 and Cu–Ni/Al2O3
catalysts.
The reduction temperature and the peak width are
indications of the ease of reduction and the degree of
interaction between different species, respectively. High
reduction temperature indicates difficulty in reduction
whereas wide peaks indicate a great degree of interaction
between the species and the support. It is seen from TPR-H2
profile that the PT catalysts are almost completely reduced at
600 8C whereas the CP and IM catalysts require a higher
reduction temperature (approximately 800 8C) due to the
presence of the NiAl2O4 species. This implies that PT
catalysts have higher reducibility than the CP and IM
catalysts. It is important to note that the respective major
higher TPR-H2 peak temperatures (about 800 8C) for the IM
and CP catalysts increased with the Ni loading, implying
that reducibility decreased with the Ni loading. In contrast,
the major higher TPR-H2 peak temperature (600 8C) in the
case of PT catalysts shifted to lower temperatures as the Ni
loading increased implying that reducibility increased with
Ni loading. Also, the TPR-H2 peaks for the PT catalysts
were narrower than those for the CP and IM catalysts
implying a higher degree of interaction of Ni species with
Al2O3 for CP and IM catalysts, as evidenced by the presence
of NiAl2O4.
3.2. Catalyst performance evaluation
The catalysts were evaluated for their performance in the
reforming of crude ethanol. The evaluation criteria used
were crude ethanol conversion, H2 selectivity and H2 yield.
Crude ethanol conversion was defined according to Eq. (3)
while H2 yield and selectivity were defined according to
Eqs. (4) and (5), respectively.
Crude conversion ðXÞ
¼ gmol ðorganicsÞ in � gmol ðorganicsÞ out
gmol ðorganicsÞ in(3)
where organics = ethanol + lactic acid + glycerol + maltose.
Hydrogen yield ðYÞ ¼ gmol ðH2Þ out
6:07 � gmol ðorganicsÞ in(4)
Hydrogen selectivity ðSÞ
¼ gmol ðH2Þ out
6:07 � gmol ðorganicsÞ in � conversion ðXÞ (5)
We have also used turnover number (TON) for crude
ethanol conversion as one of the criteria for evaluating the
activity of the catalysts. This is defined as ethanol
conversion per mole of Ni in the catalyst as shown in Eq. (6).
Turnover number for crude ethanol conversion ðTONÞ
¼ crude ethanol conversion
mol of Ni in catalysts(6)
3.2.1. Crude ethanol conversion
This evaluation was carried out on all prepared catalysts
at a weight hourly space velocity (WHSV) of crude ethanol
(i.e. with respect to organics only) of 1.68 h�1 and reaction
temperature of 400 8C. All catalysts were calcined at 600 8Cfor 3 h and reduced at 600 8C for 2 h. Fig. 6 shows the
crude ethanol conversion behavior for catalysts prepared
by the coprecipitation method. It is seen in the figure that
each catalyst showed an initial high activity with a high
initial crude ethanol conversion. This was attributed to
the initial wild activity of the catalysts. The conversion
decreased with time and then stabilized at about 180 min
time-on-stream (TOS). CP15 gave the highest stable
conversion of crude ethanol (79 mol%), followed by
CP25 (59 mol%) while CP10 gave the lowest conversion
(32 mol%) under the same experimental conditions. Fig. 7
A.J. Akande et al. / Applied Catalysis A: General 287 (2005) 159–175 169
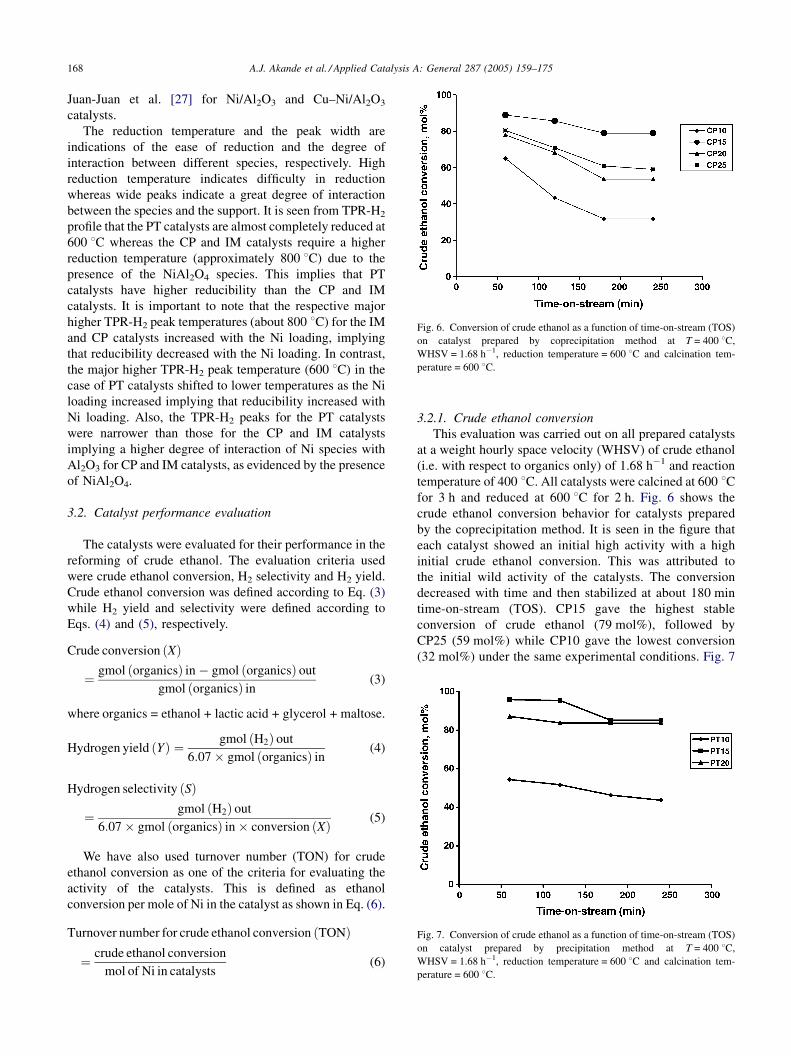
Fig. 8. Conversion of crude ethanol as a function time-on-stream (TOS) on
catalyst prepared by impregnation method at T = 400 8C, WHSV =
1.68 h�1, reduction temperature = 600 8C and calcination tempera-
ture = 600 8C.
Fig. 9. Comparison of stable conversion of crude ethanol on various
catalysts at T = 400 8C, reduction temperature = 600 8C, calcination tem-
perature = 600 8C and WHSV = 1.68 h�1.
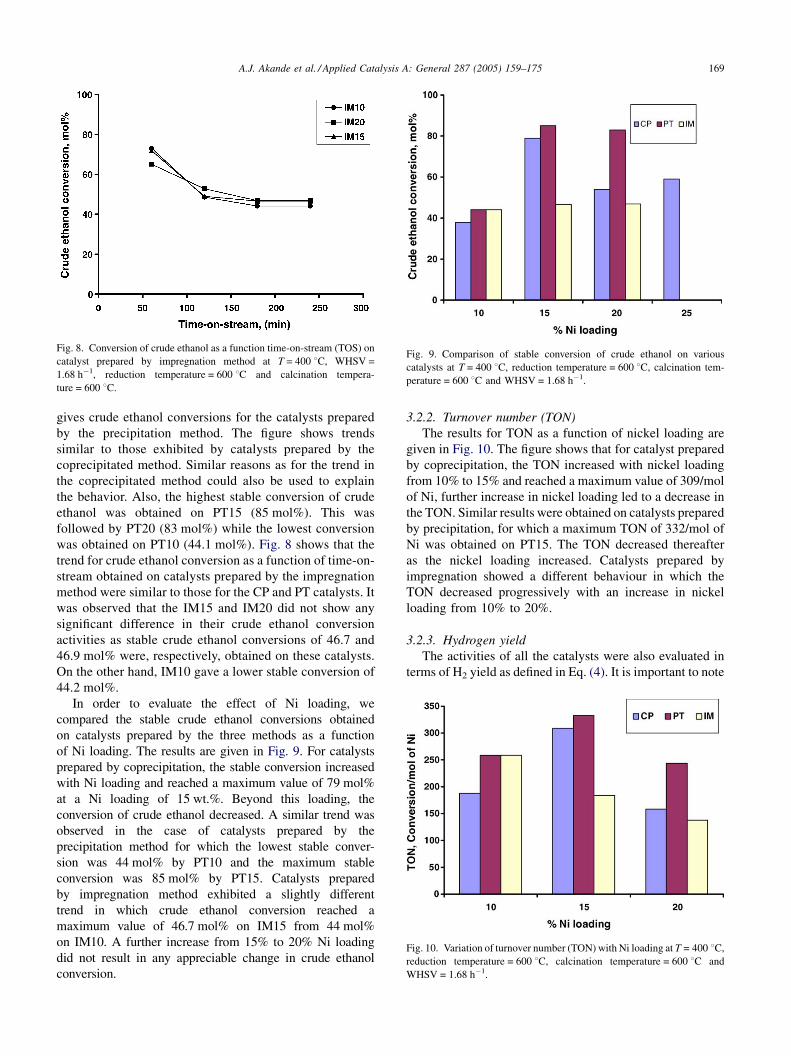
Fig. 10. Variation of turnover number (TON) with Ni loading at T = 400 8C,
reduction temperature = 600 8C, calcination temperature = 600 8C and
WHSV = 1.68 h�1.
gives crude ethanol conversions for the catalysts prepared
by the precipitation method. The figure shows trends
similar to those exhibited by catalysts prepared by the
coprecipitated method. Similar reasons as for the trend in
the coprecipitated method could also be used to explain
the behavior. Also, the highest stable conversion of crude
ethanol was obtained on PT15 (85 mol%). This was
followed by PT20 (83 mol%) while the lowest conversion
was obtained on PT10 (44.1 mol%). Fig. 8 shows that the
trend for crude ethanol conversion as a function of time-on-
stream obtained on catalysts prepared by the impregnation
method were similar to those for the CP and PT catalysts. It
was observed that the IM15 and IM20 did not show any
significant difference in their crude ethanol conversion
activities as stable crude ethanol conversions of 46.7 and
46.9 mol% were, respectively, obtained on these catalysts.
On the other hand, IM10 gave a lower stable conversion of
44.2 mol%.
In order to evaluate the effect of Ni loading, we
compared the stable crude ethanol conversions obtained
on catalysts prepared by the three methods as a function
of Ni loading. The results are given in Fig. 9. For catalysts
prepared by coprecipitation, the stable conversion increased
with Ni loading and reached a maximum value of 79 mol%
at a Ni loading of 15 wt.%. Beyond this loading, the
conversion of crude ethanol decreased. A similar trend was
observed in the case of catalysts prepared by the
precipitation method for which the lowest stable conver-
sion was 44 mol% by PT10 and the maximum stable
conversion was 85 mol% by PT15. Catalysts prepared
by impregnation method exhibited a slightly different
trend in which crude ethanol conversion reached a
maximum value of 46.7 mol% on IM15 from 44 mol%
on IM10. A further increase from 15% to 20% Ni loading
did not result in any appreciable change in crude ethanol
conversion.
3.2.2. Turnover number (TON)
The results for TON as a function of nickel loading are
given in Fig. 10. The figure shows that for catalyst prepared
by coprecipitation, the TON increased with nickel loading
from 10% to 15% and reached a maximum value of 309/mol
of Ni, further increase in nickel loading led to a decrease in
the TON. Similar results were obtained on catalysts prepared
by precipitation, for which a maximum TON of 332/mol of
Ni was obtained on PT15. The TON decreased thereafter
as the nickel loading increased. Catalysts prepared by
impregnation showed a different behaviour in which the
TON decreased progressively with an increase in nickel
loading from 10% to 20%.
3.2.3. Hydrogen yield
The activities of all the catalysts were also evaluated in
terms of H2 yield as defined in Eq. (4). It is important to note
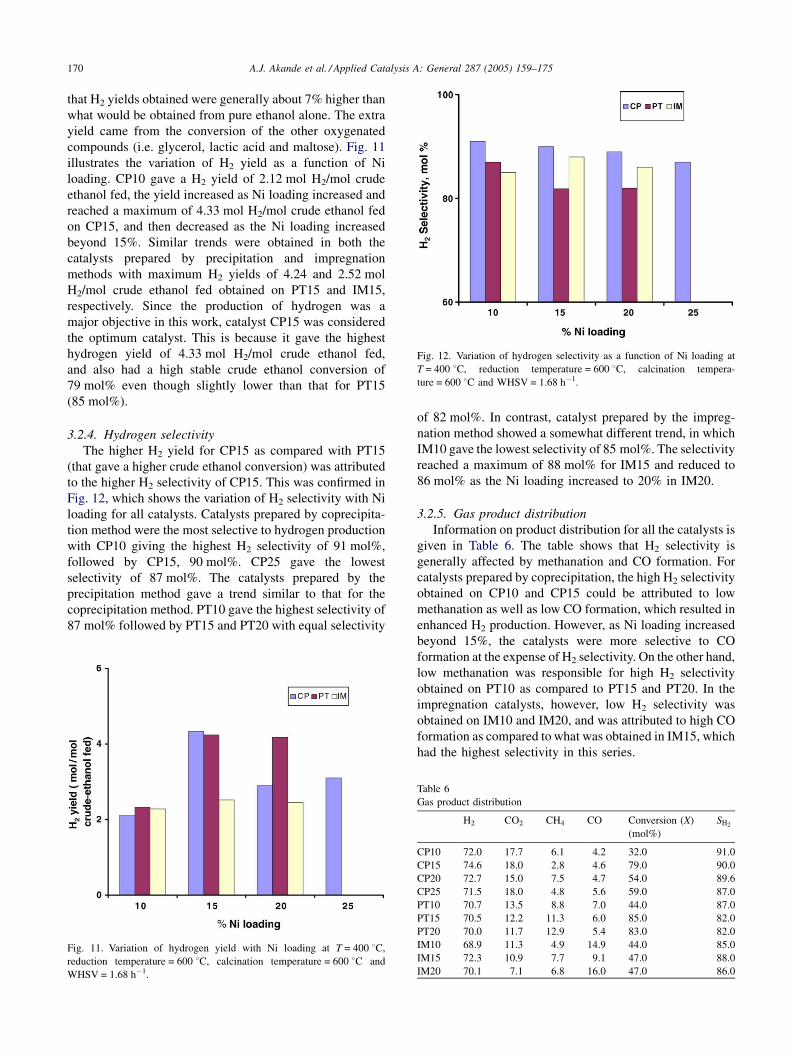
A.J. Akande et al. / Applied Catalysis A: General 287 (2005) 159–175170
Fig. 12. Variation of hydrogen selectivity as a function of Ni loading at
T = 400 8C, reduction temperature = 600 8C, calcination tempera-
ture = 600 8C and WHSV = 1.68 h�1.
that H2 yields obtained were generally about 7% higher than
what would be obtained from pure ethanol alone. The extra
yield came from the conversion of the other oxygenated
compounds (i.e. glycerol, lactic acid and maltose). Fig. 11
illustrates the variation of H2 yield as a function of Ni
loading. CP10 gave a H2 yield of 2.12 mol H2/mol crude
ethanol fed, the yield increased as Ni loading increased and
reached a maximum of 4.33 mol H2/mol crude ethanol fed
on CP15, and then decreased as the Ni loading increased
beyond 15%. Similar trends were obtained in both the
catalysts prepared by precipitation and impregnation
methods with maximum H2 yields of 4.24 and 2.52 mol
H2/mol crude ethanol fed obtained on PT15 and IM15,
respectively. Since the production of hydrogen was a
major objective in this work, catalyst CP15 was considered
the optimum catalyst. This is because it gave the highest
hydrogen yield of 4.33 mol H2/mol crude ethanol fed,
and also had a high stable crude ethanol conversion of
79 mol% even though slightly lower than that for PT15
(85 mol%).
3.2.4. Hydrogen selectivity
The higher H2 yield for CP15 as compared with PT15
(that gave a higher crude ethanol conversion) was attributed
to the higher H2 selectivity of CP15. This was confirmed in
Fig. 12, which shows the variation of H2 selectivity with Ni
loading for all catalysts. Catalysts prepared by coprecipita-
tion method were the most selective to hydrogen production
with CP10 giving the highest H2 selectivity of 91 mol%,
followed by CP15, 90 mol%. CP25 gave the lowest
selectivity of 87 mol%. The catalysts prepared by the
precipitation method gave a trend similar to that for the
coprecipitation method. PT10 gave the highest selectivity of
87 mol% followed by PT15 and PT20 with equal selectivity
Fig. 11. Variation of hydrogen yield with Ni loading at T = 400 8C,
reduction temperature = 600 8C, calcination temperature = 600 8C and
WHSV = 1.68 h�1.
of 82 mol%. In contrast, catalyst prepared by the impreg-
nation method showed a somewhat different trend, in which
IM10 gave the lowest selectivity of 85 mol%. The selectivity
reached a maximum of 88 mol% for IM15 and reduced to
86 mol% as the Ni loading increased to 20% in IM20.
3.2.5. Gas product distribution
Information on product distribution for all the catalysts is
given in Table 6. The table shows that H2 selectivity is
generally affected by methanation and CO formation. For
catalysts prepared by coprecipitation, the high H2 selectivity
obtained on CP10 and CP15 could be attributed to low
methanation as well as low CO formation, which resulted in
enhanced H2 production. However, as Ni loading increased
beyond 15%, the catalysts were more selective to CO
formation at the expense of H2 selectivity. On the other hand,
low methanation was responsible for high H2 selectivity
obtained on PT10 as compared to PT15 and PT20. In the
impregnation catalysts, however, low H2 selectivity was
obtained on IM10 and IM20, and was attributed to high CO
formation as compared to what was obtained in IM15, which
had the highest selectivity in this series.
Table 6
Gas product distribution
H2 CO2 CH4 CO Conversion (X)
(mol%)
SH2
CP10 72.0 17.7 6.1 4.2 32.0 91.0
CP15 74.6 18.0 2.8 4.6 79.0 90.0
CP20 72.7 15.0 7.5 4.7 54.0 89.6
CP25 71.5 18.0 4.8 5.6 59.0 87.0
PT10 70.7 13.5 8.8 7.0 44.0 87.0
PT15 70.5 12.2 11.3 6.0 85.0 82.0
PT20 70.0 11.7 12.9 5.4 83.0 82.0
IM10 68.9 11.3 4.9 14.9 44.0 85.0
IM15 72.3 10.9 7.7 9.1 47.0 88.0
IM20 70.1 7.1 6.8 16.0 47.0 86.0
A.J. Akande et al. / Applied Catalysis A: General 287 (2005) 159–175 171
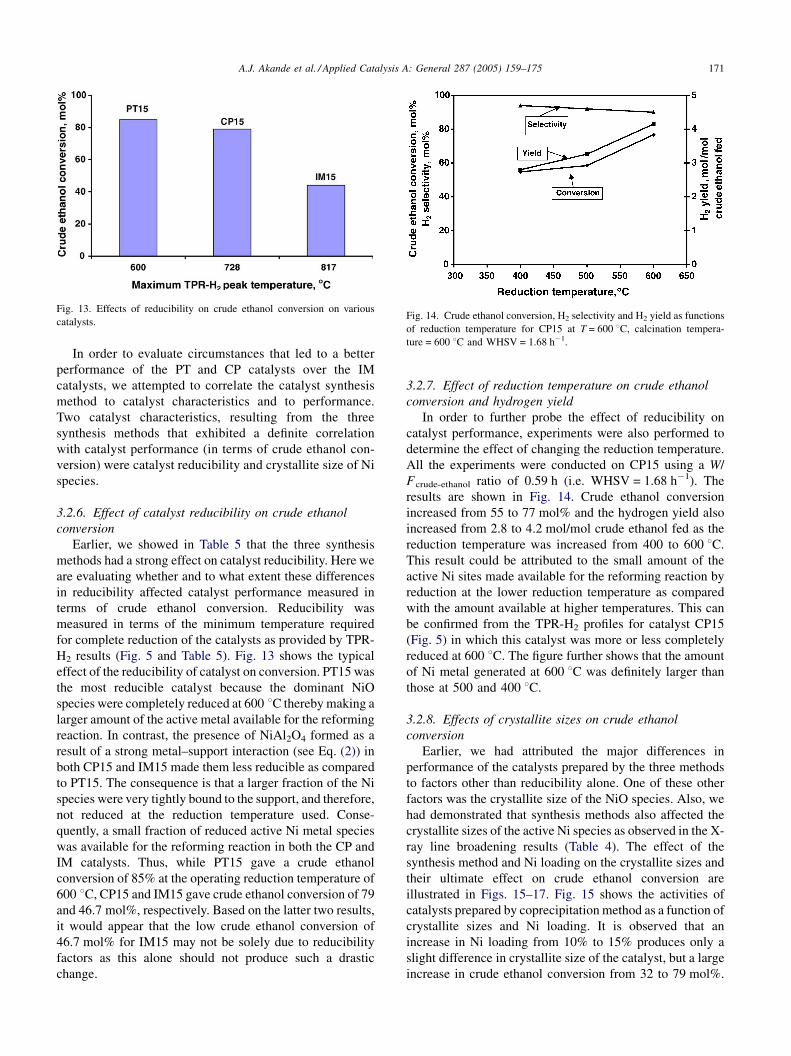
Fig. 13. Effects of reducibility on crude ethanol conversion on various
catalysts.Fig. 14. Crude ethanol conversion, H2 selectivity and H2 yield as functions
of reduction temperature for CP15 at T = 600 8C, calcination tempera-
ture = 600 8C and WHSV = 1.68 h�1.
In order to evaluate circumstances that led to a betterperformance of the PT and CP catalysts over the IM
catalysts, we attempted to correlate the catalyst synthesis
method to catalyst characteristics and to performance.
Two catalyst characteristics, resulting from the three
synthesis methods that exhibited a definite correlation
with catalyst performance (in terms of crude ethanol con-
version) were catalyst reducibility and crystallite size of Ni
species.
3.2.6. Effect of catalyst reducibility on crude ethanol
conversion
Earlier, we showed in Table 5 that the three synthesis
methods had a strong effect on catalyst reducibility. Here we
are evaluating whether and to what extent these differences
in reducibility affected catalyst performance measured in
terms of crude ethanol conversion. Reducibility was
measured in terms of the minimum temperature required
for complete reduction of the catalysts as provided by TPR-
H2 results (Fig. 5 and Table 5). Fig. 13 shows the typical
effect of the reducibility of catalyst on conversion. PT15 was
the most reducible catalyst because the dominant NiO
species were completely reduced at 600 8C thereby making a
larger amount of the active metal available for the reforming
reaction. In contrast, the presence of NiAl2O4 formed as a
result of a strong metal–support interaction (see Eq. (2)) in
both CP15 and IM15 made them less reducible as compared
to PT15. The consequence is that a larger fraction of the Ni
species were very tightly bound to the support, and therefore,
not reduced at the reduction temperature used. Conse-
quently, a small fraction of reduced active Ni metal species
was available for the reforming reaction in both the CP and
IM catalysts. Thus, while PT15 gave a crude ethanol
conversion of 85% at the operating reduction temperature of
600 8C, CP15 and IM15 gave crude ethanol conversion of 79
and 46.7 mol%, respectively. Based on the latter two results,
it would appear that the low crude ethanol conversion of
46.7 mol% for IM15 may not be solely due to reducibility
factors as this alone should not produce such a drastic
change.
3.2.7. Effect of reduction temperature on crude ethanol
conversion and hydrogen yield
In order to further probe the effect of reducibility on
catalyst performance, experiments were also performed to
determine the effect of changing the reduction temperature.
All the experiments were conducted on CP15 using a W/
Fcrude-ethanol ratio of 0.59 h (i.e. WHSV = 1.68 h�1). The
results are shown in Fig. 14. Crude ethanol conversion
increased from 55 to 77 mol% and the hydrogen yield also
increased from 2.8 to 4.2 mol/mol crude ethanol fed as the
reduction temperature was increased from 400 to 600 8C.
This result could be attributed to the small amount of the
active Ni sites made available for the reforming reaction by
reduction at the lower reduction temperature as compared
with the amount available at higher temperatures. This can
be confirmed from the TPR-H2 profiles for catalyst CP15
(Fig. 5) in which this catalyst was more or less completely
reduced at 600 8C. The figure further shows that the amount
of Ni metal generated at 600 8C was definitely larger than
those at 500 and 400 8C.
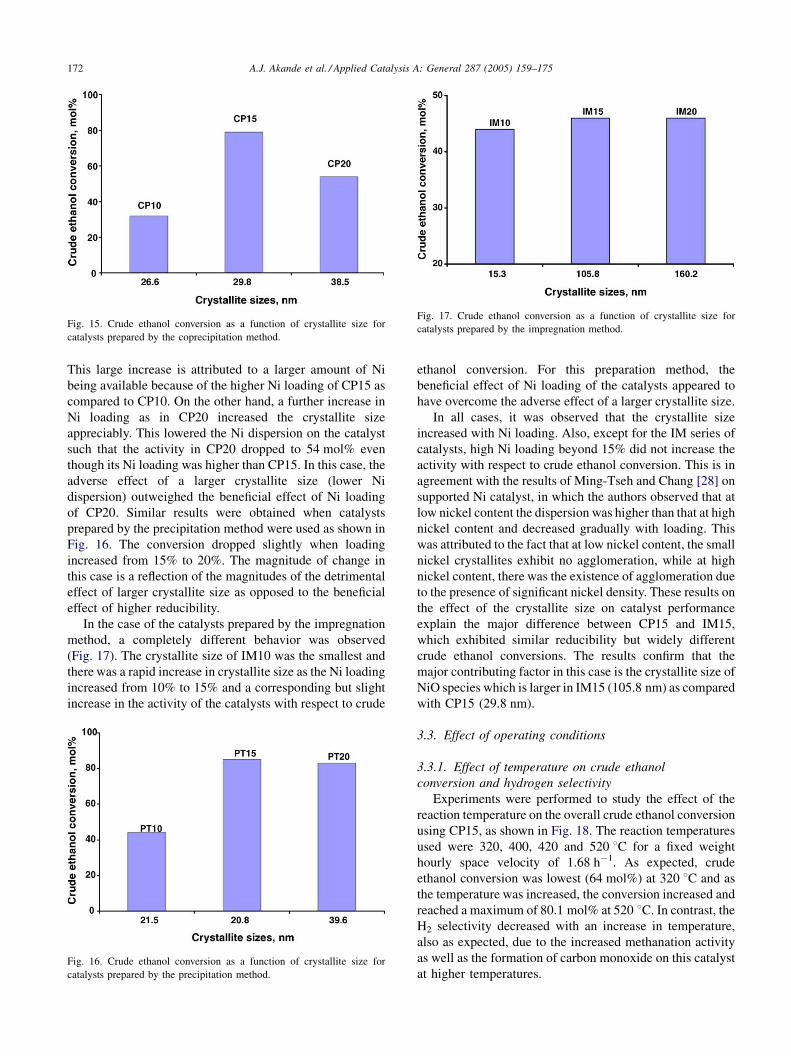
3.2.8. Effects of crystallite sizes on crude ethanol
conversion
Earlier, we had attributed the major differences in
performance of the catalysts prepared by the three methods
to factors other than reducibility alone. One of these other
factors was the crystallite size of the NiO species. Also, we
had demonstrated that synthesis methods also affected the
crystallite sizes of the active Ni species as observed in the X-
ray line broadening results (Table 4). The effect of the
synthesis method and Ni loading on the crystallite sizes and
their ultimate effect on crude ethanol conversion are
illustrated in Figs. 15–17. Fig. 15 shows the activities of
catalysts prepared by coprecipitation method as a function of
crystallite sizes and Ni loading. It is observed that an
increase in Ni loading from 10% to 15% produces only a
slight difference in crystallite size of the catalyst, but a large
increase in crude ethanol conversion from 32 to 79 mol%.
A.J. Akande et al. / Applied Catalysis A: General 287 (2005) 159–175172
Fig. 15. Crude ethanol conversion as a function of crystallite size for
catalysts prepared by the coprecipitation method.
Fig. 17. Crude ethanol conversion as a function of crystallite size for
catalysts prepared by the impregnation method.
This large increase is attributed to a larger amount of Ni
being available because of the higher Ni loading of CP15 as
compared to CP10. On the other hand, a further increase in
Ni loading as in CP20 increased the crystallite size
appreciably. This lowered the Ni dispersion on the catalyst
such that the activity in CP20 dropped to 54 mol% even
though its Ni loading was higher than CP15. In this case, the
adverse effect of a larger crystallite size (lower Ni
dispersion) outweighed the beneficial effect of Ni loading
of CP20. Similar results were obtained when catalysts
prepared by the precipitation method were used as shown in
Fig. 16. The conversion dropped slightly when loading
increased from 15% to 20%. The magnitude of change in
this case is a reflection of the magnitudes of the detrimental
effect of larger crystallite size as opposed to the beneficial
effect of higher reducibility.
In the case of the catalysts prepared by the impregnation
method, a completely different behavior was observed
(Fig. 17). The crystallite size of IM10 was the smallest and
there was a rapid increase in crystallite size as the Ni loading
increased from 10% to 15% and a corresponding but slight
increase in the activity of the catalysts with respect to crude
Fig. 16. Crude ethanol conversion as a function of crystallite size for
catalysts prepared by the precipitation method.
ethanol conversion. For this preparation method, the
beneficial effect of Ni loading of the catalysts appeared to
have overcome the adverse effect of a larger crystallite size.
In all cases, it was observed that the crystallite size
increased with Ni loading. Also, except for the IM series of
catalysts, high Ni loading beyond 15% did not increase the
activity with respect to crude ethanol conversion. This is in
agreement with the results of Ming-Tseh and Chang [28] on
supported Ni catalyst, in which the authors observed that at
low nickel content the dispersion was higher than that at high
nickel content and decreased gradually with loading. This
was attributed to the fact that at low nickel content, the small
nickel crystallites exhibit no agglomeration, while at high
nickel content, there was the existence of agglomeration due
to the presence of significant nickel density. These results on
the effect of the crystallite size on catalyst performance
explain the major difference between CP15 and IM15,
which exhibited similar reducibility but widely different
crude ethanol conversions. The results confirm that the
major contributing factor in this case is the crystallite size of
NiO species which is larger in IM15 (105.8 nm) as compared
with CP15 (29.8 nm).
3.3. Effect of operating conditions
3.3.1. Effect of temperature on crude ethanol
conversion and hydrogen selectivity
Experiments were performed to study the effect of the
reaction temperature on the overall crude ethanol conversion
using CP15, as shown in Fig. 18. The reaction temperatures
used were 320, 400, 420 and 520 8C for a fixed weight
hourly space velocity of 1.68 h�1. As expected, crude
ethanol conversion was lowest (64 mol%) at 320 8C and as
the temperature was increased, the conversion increased and
reached a maximum of 80.1 mol% at 520 8C. In contrast, the
H2 selectivity decreased with an increase in temperature,
also as expected, due to the increased methanation activity
as well as the formation of carbon monoxide on this catalyst
at higher temperatures.
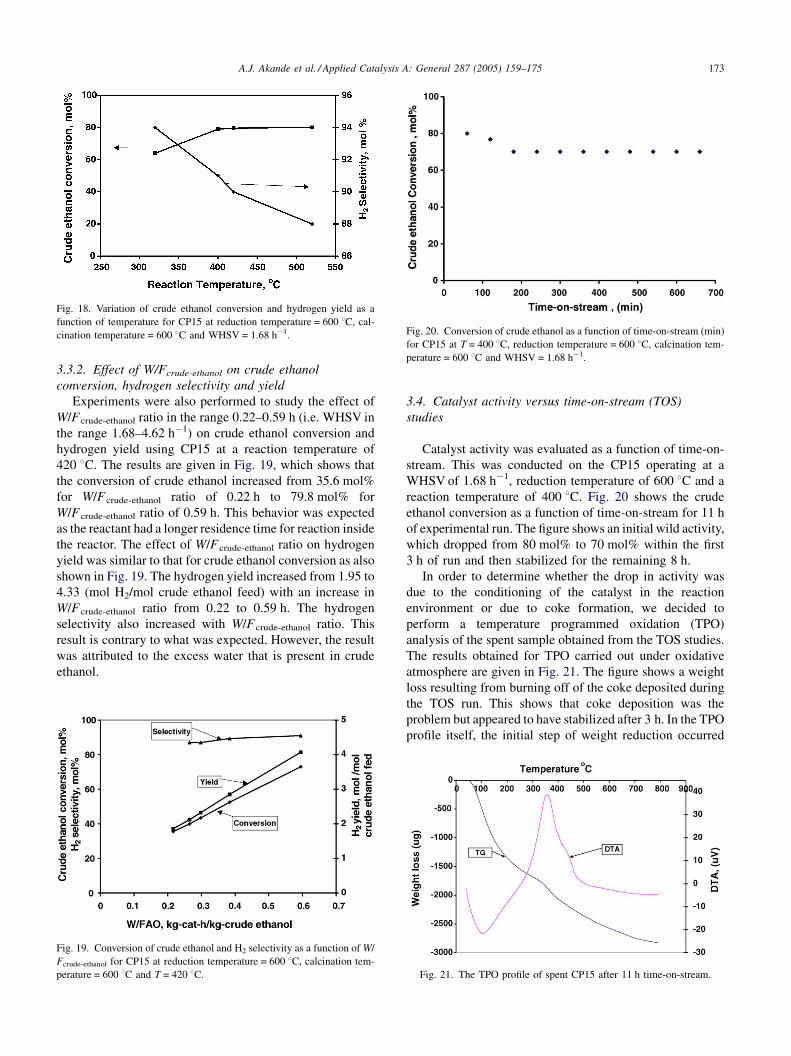
A.J. Akande et al. / Applied Catalysis A: General 287 (2005) 159–175 173
Fig. 18. Variation of crude ethanol conversion and hydrogen yield as a
function of temperature for CP15 at reduction temperature = 600 8C, cal-
cination temperature = 600 8C and WHSV = 1.68 h�1. Fig. 20. Conversion of crude ethanol as a function of time-on-stream (min)
for CP15 at T = 400 8C, reduction temperature = 600 8C, calcination tem-
perature = 600 8C and WHSV = 1.68 h�1.
3.3.2. Effect of W/Fcrude-ethanol on crude ethanol
conversion, hydrogen selectivity and yield
Experiments were also performed to study the effect of
W/Fcrude-ethanol ratio in the range 0.22–0.59 h (i.e. WHSV in
the range 1.68–4.62 h�1) on crude ethanol conversion and
hydrogen yield using CP15 at a reaction temperature of
420 8C. The results are given in Fig. 19, which shows that
the conversion of crude ethanol increased from 35.6 mol%
for W/Fcrude-ethanol ratio of 0.22 h to 79.8 mol% for
W/Fcrude-ethanol ratio of 0.59 h. This behavior was expected
as the reactant had a longer residence time for reaction inside
the reactor. The effect of W/Fcrude-ethanol ratio on hydrogen
yield was similar to that for crude ethanol conversion as also
shown in Fig. 19. The hydrogen yield increased from 1.95 to
4.33 (mol H2/mol crude ethanol feed) with an increase in
W/Fcrude-ethanol ratio from 0.22 to 0.59 h. The hydrogen
selectivity also increased with W/Fcrude-ethanol ratio. This
result is contrary to what was expected. However, the result
was attributed to the excess water that is present in crude
ethanol.
Fig. 19. Conversion of crude ethanol and H2 selectivity as a function of W/
Fcrude-ethanol for CP15 at reduction temperature = 600 8C, calcination tem-
perature = 600 8C and T = 420 8C.
3.4. Catalyst activity versus time-on-stream (TOS)
studies
Catalyst activity was evaluated as a function of time-on-
stream. This was conducted on the CP15 operating at a
WHSV of 1.68 h�1, reduction temperature of 600 8C and a
reaction temperature of 400 8C. Fig. 20 shows the crude
ethanol conversion as a function of time-on-stream for 11 h
of experimental run. The figure shows an initial wild activity,
which dropped from 80 mol% to 70 mol% within the first
3 h of run and then stabilized for the remaining 8 h.
In order to determine whether the drop in activity was
due to the conditioning of the catalyst in the reaction
environment or due to coke formation, we decided to
perform a temperature programmed oxidation (TPO)
analysis of the spent sample obtained from the TOS studies.
The results obtained for TPO carried out under oxidative
atmosphere are given in Fig. 21. The figure shows a weight
loss resulting from burning off of the coke deposited during
the TOS run. This shows that coke deposition was the
problem but appeared to have stabilized after 3 h. In the TPO
profile itself, the initial step of weight reduction occurred
Fig. 21. The TPO profile of spent CP15 after 11 h time-on-stream.
A.J. Akande et al. / Applied Catalysis A: General 287 (2005) 159–175174
over the temperature range of 100–200 8C. This was ascribed
to the removal of easily oxidizable carbonaceous species, as
reported by Das [16] and Jianjun et al. [22]. The oxidation of
coke (carbon deposit) to CO and CO2 occurred mainly at
360 8C. Further work is needed to investigate the catalyst
stability for an economical length of time. This may lead to
catalyst modification for the support and/or active metal.
3.5. Energy conversion efficiency—from crude ethanol
to electrical energy
It is generally accepted that ethanol production is, at best,
energy neutral. It thus becomes important to evaluate
whether there is any benefit in terms of energy efficiency in
further processing ethanol to produce hydrogen. Ethanol is
used here solely for a niche application, which is the
generation of mechanical or electrical energy. Thus, thermal
efficiency alone is not the best way to measure efficiency in
this case. Instead, what is of importance is the quantity of
mechanical or electrical energy output from a unit quantity
of ethanol. Thus, the efficiency of this process should be
evaluated in terms of finding the best way to use ethanol for
mechanical or electrical energy production.There are two
methods to achieve this: (1) direct combustion of pure
ethanol in an internal combustion engine to generate thermal
energy and subsequent conversion of the thermal energy to
produce mechanical energy, and (2) conversion of ethanol to
hydrogen and subsequent use of hydrogen in a fuel cell to
generate mechanical or electrical energy to power an engine.
The following illustrates our calculations on the basis of 1 L
of pure ethanol. As a fuel (in an internal combustion engine)
in an automobile, only about 20% of the chemical energy
stored in ethanol can be converted to useful mechanical
work. On the other hand, if the same amount of ethanol is
converted to hydrogen to run a fuel cell, about 60% of the
stored chemical energy in hydrogen can be converted to
electrical energy (Sorcha [5]).
3.5.1. Case #1: ethanol as direct fuel for energy
production
Chemical=heat energy available in pure ethanol ð�DHÞ
¼ 1000 mL � 0:791 g
mL� 27:76 kJ
g¼ 21958:16 kJ
With about 20% thermal energy to mechanical energy
conversion efficiency, the useful mechanical work output
(based on low heating value of ethanol (LHV)) =
0.2 � 21958.16 kJ = 4391 kJ.
3.5.2. Case #2: crude ethanol as source of energy via
the hydrogen fuel cell
Fermentation broth (from feedstock analysis) contains
12% (v/v) ethanol.
Amount of fermentation broth that will provide 1 L of
ethanol = 1/0.12 = 8.333 L of feedstock.
Based on our results on reforming experiment using
crude ethanol:
� 1
3.2 � 10�3 L (fermentation broth feedstock) produced0.149 mol H2.
� 8
.33 L (fermentation broth feedstock) will produce8:33
13:2 � 10�3� 0:149 ¼ 94:028 mol of H2
Thus; the volume of H2 produced ¼ 94:028 mol
� 22:4 L=mol
¼ 2106:23 L
Heat energy available ðbased on LHV of H2Þ¼10:28 kJ=LH2
� 2106:23 LH2¼ 21652:04 kJ:
With the assumption that the thermal energy carried by the
reactor effluents can be used to heat the feed almost up to the
reaction temperature, we only need to subtract the heat req-
uired for the reforming process from the heat available (i.e.
less the heat required for reaction (�DHrxn = 129 kJ/mol)).
Thus, the net heat = 21652.04 kJ � (129 kJ/mol � 15.13
mol) = 19700.0 kJ.
Assuming about 50% efficiency, the useful electrical
work output = 0.5 � 19700 kJ = 9850 kJ. This is by far
higher than the conversion efficiency obtained from a direct
combustion of ethanol.
4. Conclusions
� The precipitation synthesis method resulted in the
absence of NiAl2O3 species in the catalysts whereas this
species was a major component in catalysts prepared by
the coprecipitation and impregnation synthesis methods.
� A
s a result of the type of species generated by thesynthesis method, the PT catalysts were more reducible
than the CP and IM catalysts.
� C
atalysts prepared by precipitation generally exhibitedlower crystallite sizes of NiO species than the corre-
sponding catalysts prepared by coprecipitation. The
catalysts prepared by impregnation had the largest
crystallite sizes except IM10 which had the smallest
crystallite size.
� A
combination of small crystallite size and higherreducibility for PT catalysts resulted in higher crude
ethanol conversions for the PT catalysts. These conversions
were followed by those of the CP catalysts which had
slightly bigger crystallite sizes but lower reducibility. The
IM catalysts exhibited the lowest crude ethanol conversions
because of larger crystallite sizes and lower reducibility.
� C
atalysts with 15% Ni loading gave the best crude ethanolconversions for each method of synthesis with PT15

A.J. Akande et al. / Applied Catalysis A: General 287 (2005) 159–175 175
(catalyst with 15% Ni loading prepared by precipitation)
giving the best overall crude ethanol conversion of
85 mol%. This was attributed to small crystallite size and
high reducibility of PT15 as compared to CP15 and IM15.
� I
n terms of H2 yield, CP15 gave the highest yield becausethe CP catalysts gave the highest H2 selectivities as
compared to corresponding catalysts prepared by pre-
cipitation and impregnation.
� C
oking was observed at the onset of the reaction butstabilized after 180 min TOS.
Acknowledgements
The financial support provided by the Canadian
Foundation for Innovation and Hydrogen Thermochem
Corporation (HTC), Regina, is gratefully acknowledged.
The authors would also like to acknowledge the support of
PoundMaker Agventure, Lanigan, Saskatchewan, Canada,
for providing crude ethanol for the research.
References
[1] D. Cortright, R.R. Davda, J.A. Dumesic, Lett. Nat. 418 (2002) 964–
967.
[2] F. Haga, T. Nakajima, K. Yamashita, S. Mishima, React. Kinet. Catal.
Lett. 63 (2) (1997) 253–259.
[3] H.F. Creveling, Proceedings of the Annual Automotive Technology
Development Contractors’ Coordination Meeting, October 19–21,
Society of Automotive Engineers, 1992, pp. 485–492.
[4] D.S. Dunnison, J. Wilson, Proceedings of the AIAA 29th Intersoc.
Energy Convers. Eng. Conference, Monterey, CA, 1994, pp. 1260–
1263.
[5] C. Sorcha, Faversham House Group Ltd., Internet publication, http://
www.edie.net/news/Archive/8065.cfm, February 14, 2004.
[6] J.H. Gary, G.E. Handwerk, Petroleum Refining Technology and
Economics, third ed., Marcel Dekker Inc., New York, 1994.
[7] V. Simanzhenkov, R.O. Idem, Crude Oil Chemistry, Marcel Dekker,
New York, 2003.
[8] L. Garcia, R. French, S. Czernik, E. Chornet, Appl. Catal. 201 (2000)
225–239.
[9] S. Cavallaro, S. Freni, Int. J. Hydrogen Energy 21 (6) (1996) 465–469.
[10] N.F. Athanasio, X.E. Verykios, J. Catal. 225 (4) (2004) 39–452.
[11] N.F. Athanasio, D.I. Kondaridesm, Catal. Today 75 (2002) 145–155.
[12] V. Klouz, V. Fierro, P. Denton, H. Katz, J.P. Lisse, S. Bouvot-mauduit,
C. Mirodatos, Power Sources 105 (2002) 26–34.
[13] L. Jordi, N. Homs, J. Sales, P. Ramirez de la Piscina, J. Catal. 209
(2002) 306–317.
[14] S. Leclerc, R.F. Mann, B.A. Peppley, Evaluation of the catalytic
ethanol-steam reforming process as a source of hydrogen-rich gas
for fuel cells, Report prepared for CANMET Energy Technology
Centre (CETC), 1998, ISBN 0-662-27335-4.
[15] V.V. Galvita, G.L. Semin, V.D. Belyaev, V.A. Semikolenov, P. Tsia-
karas, V.A. Sobyanin, Appl. Catal. A: Gen. 220 (2001) 123–127.
[16] N. Das, M.Sc. Thesis, University of Saskatchewan, Saskatoon,
Canada, 2003.
[17] R. Idem, H.H. Ibrahim, P. Tontiwachwuthikul, M. Wilson, in: J. Gale,
Y. Kaya (Eds.), Proceedings of the 6th International Conference on
Greenhouse Gas Control Technologies, Kyoto, Japan, 2002, Perga-
mon, Oxford, UK, 2003, pp. 1825–1828.
[18] W. Iwasaki, Int. J. Hydrogen Energy 28 (2003) 1325–1332.
[19] C.A. Luengo, G. Ciampi, M.O. Cencig, C. Steckelberg, M.A. Larbode,
Int. J. Hydrogen Energy 17 (9) (1992) 667–681.
[20] J.T. Richardson, Principles of Catalyst Development, Plenum Press,
New York, 1989.
[21] R.O. Idem, Ph.D. Thesis, University of Saskatchewan, Saskatoon,
Canada, 1995.
[22] G. Jianjun, H. Lou, H. Zhao, D. Chai, X. Zheng, Appl. Catal. A: Gen.
273 (2004) 75–82.
[23] B. Parathasarathi, M. Rajamathi, M.S. Hegde, P.V. Kamath, Bull.
Mater. Sci. 23 (2) (2000) 141–145.
[24] R.O. Idem, S.P.R. Katikaneni, R. Sethuraman, N.N. Bakhshi, Energy
Fuel 141 (2000) 1072–1082.
[25] E.L. Jae-Hee, J. Oh-shim, J. Kwang, Appl. Catal. A: Gen. 269 (2004)
1–6.
[26] F. Marino, E. Cerrella, S. Duhalde, M. Jobbagy, M. Laborde, Int. J.
Hydrogen Energy 23 (1998) 1095–1101.
[27] J. Juan-Juan, M.C. Roman-Martinez, M.J. Illan-Gomez, Appl. Catal.
A: Gen. 264 (2004) 169–174.
[28] T. Ming-Tseh, F. Chang, Appl. Catal. A: Gen. 203 (2002) 15–22.
Related Documents


