CERAMICS INTERNATIONAL Available online at www.sciencedirect.com Ceramics International 39 (2013) 5007–5012 Synthesis, calcination and characterization of Nanosized ceria powders by self-propagating room temperature method Branko Matovic´ a,n , Jelena Dukic´ a , Biljana Babic´ a , Duˇsan Bucˇevac a , Zorana Dohcˇ evic´ -Mitrovic´ b , Marko Radovic´ b , Snezˇ ana Boˇskovic´ a a Institute for Nuclear sciences ‘‘Vincˇa’’, Materials Science Laboratory, Belgrade University, PO Box 522, 11001 Belgrade, Serbia b Institute of Physics, Centre for Solid State Physics and New Materials, Belgrade University, Pregrevica 118, 11080 Belgrade, Serbia Received 15 November 2012; received in revised form 29 November 2012; accepted 29 November 2012 Available online 7 December 2012 Abstract Nanometric ceria powders with fluorite-type structure were obtained by applying self-propagating room temperature method. The obtained powders were subsequently thermally treated (calcined) at different temperatures for different times. Powder properties such as specific surface area, crystallite size, particle size and lattice parameter have been studied. Roentgen diffraction analysis (XRD), BET and Raman scattering measurements were used to characterize the as-obtained (uncalcined) powder as well as powders calcined at different temperatures. It was found that the average diameter of the as-obtained crystallites is in the range of 3–5 nm whereas the specific surface area is about 70 m 2 /g. The subsequent, 15 min long, calcination of as-obtained powder at different temperatures gradually increased crystallite size up to 60 nm and reduced specific surface down to 6 m 2 /g. Raman spectra of synthesized CeO 2 y depicts a strong red shift of active triply degenerate F 2g mode as well as additional peak at 600 cm 1 . The frequency of F 2g mode increased while its line width decreased with an increase in calcination temperature. Such a behavior is considered to be the result of particle size increase and agglomeration during the calcination. After the heat treatment at 800 1C crystallite size reached value larger than 50 nm. Second order Raman mode, which originates from intrinsic oxygen vacancies, disappeared after calcination. & 2012 Elsevier Ltd and Techna Group S.r.l. All rights reserved. Keywords: A. Calcination; B. X-ray methods; D. CeO 2 1. Introduction Ceria (CeO 2 ) is a technologically very important mate- rial owing to its wide application as a promoter in three- way catalysts (TWCs) for the elimination of toxic auto- exhaust gases [1,2], oxygen sensor [3,4], ultraviolet absor- bent [5] and glass-polishing materials [6,7]. Besides this, ceria is frequently used in fabrication of solid electrolyte for fuel cells [8–11], oxygen permeation membrane systems [12,13] and electrochromic thin-films [14–16]. It is also essential to point out an important role of ceria in the fields such as kinetics of low-temperature water–gas shift reactions [17,18], environmental chemistry and medicine [19,20]. The efficiency of the use of ceria in the above mentioned applications strongly depends on the structural features. For example, an excellent oxygen storage beha- vior and increased oxygen transport capacity [21,22] are the results of capability of ceria to change oxidation state in relative ease way and thus establish a balance between Ce þ 3 and Ce þ 4 anions. The change in oxidation state is followed by formation of oxygen vacancies as charge compensation defects which affects both the local structure and functionality of ceria [23]. Thus, in order to design ceria based materials with high oxygen storage and trans- port capacity it is essential to know how to increase the number of oxygen vacancies and to maintain a fluorite- type crystal structure at the same time. In general, there are two possibilities to obtain ceria-based oxide as an oxygen storage component. One is a promotion of Ce 4 þ reduction into Ce 3 þ [24] and the other is to chemically dope ceria with other transition or rare-earth element [25]. www.elsevier.com/locate/ceramint 0272-8842/$ - see front matter & 2012 Elsevier Ltd and Techna Group S.r.l. All rights reserved. http://dx.doi.org/10.1016/j.ceramint.2012.11.098 n Corresponding author. Tel.: þ381 11 3408 753; fax: þ381 11 3408 224. E-mail address: [email protected] (B. Matovic´ ).

Welcome message from author
This document is posted to help you gain knowledge. Please leave a comment to let me know what you think about it! Share it to your friends and learn new things together.
Transcript
CERAMICSINTERNATIONAL
Available online at www.sciencedirect.com
0272-8842/$ - se
http://dx.doi.or
nCorrespondi
E-mail addr
Ceramics International 39 (2013) 5007–5012
www.elsevier.com/locate/ceramint
Synthesis, calcination and characterization of Nanosized ceria powdersby self-propagating room temperature method
Branko Matovica,n, Jelena Dukica, Biljana Babica, Dusan Bucevaca,Zorana Dohcevic-Mitrovicb, Marko Radovicb, Snezana Boskovica
aInstitute for Nuclear sciences ‘‘Vinca’’, Materials Science Laboratory, Belgrade University, PO Box 522, 11001 Belgrade, SerbiabInstitute of Physics, Centre for Solid State Physics and New Materials, Belgrade University, Pregrevica 118, 11080 Belgrade, Serbia
Received 15 November 2012; received in revised form 29 November 2012; accepted 29 November 2012
Available online 7 December 2012
Abstract
Nanometric ceria powders with fluorite-type structure were obtained by applying self-propagating room temperature method. The
obtained powders were subsequently thermally treated (calcined) at different temperatures for different times. Powder properties such as
specific surface area, crystallite size, particle size and lattice parameter have been studied. Roentgen diffraction analysis (XRD), BET
and Raman scattering measurements were used to characterize the as-obtained (uncalcined) powder as well as powders calcined at
different temperatures.
It was found that the average diameter of the as-obtained crystallites is in the range of 3–5 nm whereas the specific surface area is
about 70 m2/g. The subsequent, 15 min long, calcination of as-obtained powder at different temperatures gradually increased crystallite
size up to �60 nm and reduced specific surface down to 6 m2/g. Raman spectra of synthesized CeO2�y depicts a strong red shift of
active triply degenerate F2 g mode as well as additional peak at 600 cm�1. The frequency of F2 g mode increased while its line width
decreased with an increase in calcination temperature. Such a behavior is considered to be the result of particle size increase and
agglomeration during the calcination. After the heat treatment at 800 1C crystallite size reached value larger than 50 nm. Second order
Raman mode, which originates from intrinsic oxygen vacancies, disappeared after calcination.
& 2012 Elsevier Ltd and Techna Group S.r.l. All rights reserved.
Keywords: A. Calcination; B. X-ray methods; D. CeO2
1. Introduction
Ceria (CeO2) is a technologically very important mate-rial owing to its wide application as a promoter in three-way catalysts (TWCs) for the elimination of toxic auto-exhaust gases [1,2], oxygen sensor [3,4], ultraviolet absor-bent [5] and glass-polishing materials [6,7]. Besides this,ceria is frequently used in fabrication of solid electrolytefor fuel cells [8–11], oxygen permeation membrane systems[12,13] and electrochromic thin-films [14–16]. It is alsoessential to point out an important role of ceria in thefields such as kinetics of low-temperature water–gas shiftreactions [17,18], environmental chemistry and medicine[19,20]. The efficiency of the use of ceria in the above
e front matter & 2012 Elsevier Ltd and Techna Group S.r.l. A
g/10.1016/j.ceramint.2012.11.098
ng author. Tel.: þ381 11 3408 753; fax: þ381 11 3408 224.
ess: [email protected] (B. Matovic).
mentioned applications strongly depends on the structuralfeatures. For example, an excellent oxygen storage beha-vior and increased oxygen transport capacity [21,22] arethe results of capability of ceria to change oxidation statein relative ease way and thus establish a balance betweenCeþ3 and Ceþ4 anions. The change in oxidation state isfollowed by formation of oxygen vacancies as chargecompensation defects which affects both the local structureand functionality of ceria [23]. Thus, in order to designceria based materials with high oxygen storage and trans-port capacity it is essential to know how to increase thenumber of oxygen vacancies and to maintain a fluorite-type crystal structure at the same time. In general, there aretwo possibilities to obtain ceria-based oxide as an oxygenstorage component. One is a promotion of Ce4þ reductioninto Ce3þ [24] and the other is to chemically dope ceriawith other transition or rare-earth element [25].
ll rights reserved.
B. Matovic et al. / Ceramics International 39 (2013) 5007–50125008
Another important application of ceria is its use as modelmaterial for studying plutonia properties. Ceria and plutoniahave quite similar physicochemical properties such as ionicsize in octahedral and cubic coordination, melting point,standard enthalpy of formation and specific heat [26,27].Therefore, the plutonium chemistry could be well simulatedusing ceria instead of highly active PuO2 [28].
Recently, much effort has been devoted to preparingCeO2 nanoparticles and films. The methods include hydro-thermal synthesis [29], sol–gel [30], homogeneous precipi-tation [31,32], different combustion or flame-synthesis[33–35], self propagating room temperature reaction(SPRT) [36], salt assisted aerosol decomposition [37],sonochemical and microwave heating [38], microemulsionmethod [39,40], gas condensation [41], and so on. Powderproduction method strongly affects powder propertieswhich, in turn, affect microstructure and therefore proper-ties of ceria ceramics [13]. For this reason a study on low-cost and time effective method is one of the main emphasisof ongoing research efforts.
In this paper ceria powders were synthesized by apply-ing self-propagating room temperature reaction (SPRT)[42,43] in order to study behavior of nanocrystalline ceriaduring calcination.
20 30 40 50 60 70 80
Inte
nsity
(a.u
.)
2θ Degree
111
200
220
311
222
400 33
1
2
3
4
1
420
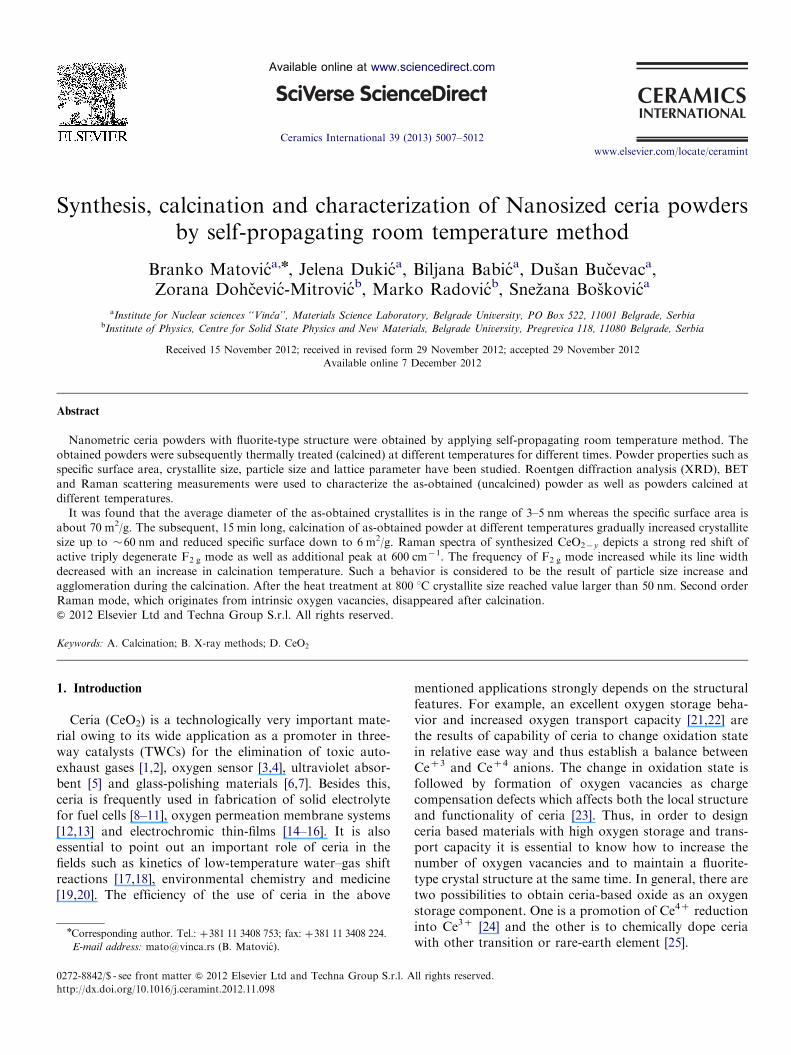
Fig. 1. Room temperature X-ray diffraction patterns of as-obtained
CeO2�d samples (1) and samples calcined at 400 1C (2), 600 1C (3) and
800 1C (4) for 15 min.
2. Experimental
The ceria samples were synthesized by a SPRT methodusing cerium nitrate (Aldrich, USA) and NaOH (p.a. Zorka,Serbia) as starting materials. The compositions of reactingmixtures were calculated according to the nominal composi-tion of the final reaction product. Preparation of CeO2
powder was performed according to the following reaction:
2[Ce(NO3)3 � 6H2O]þ6NaOHþ (1/2�d)O2-2CeO2þ6NaNO3þ9H2O (1)
The calculated fractions of chemicals were hand mixedin an alumina mortar with an alumina pestle for about5 min. The reaction product mixture was rinsed in acentrifuge Centurion 1020D at 3500 rpm to removeNaNO3, which was one of the reaction products [44]. Eachwashing run was 10 min long. This procedure was repeatedthree times with deionised water and two times withethanol.
The calcination of the obtained powder at temperatureranging from 400 to 800 1C was 15 and 120 min long. Allpowders were characterized by means of X-ray diffraction,ellipsometry, Raman spectroscopy as well as nitrogen adsorp-tion. Crystal structure was identified by X-ray diffraction(XRD) using filtered Cu Ka radiation (Siemens D5000).XRD was also used to evaluate the crystallite size and latticeparameters as functions of temperature. Before the measure-ment the angular correction was done by high quality Sistandard. Lattice parameters were refined from the data usingthe least square procedure. Standard deviation was about 1%.
Williamson-Hall plots were used to separate the effect of thesize and strain in the nanocrystals, using equation:
bTotal � cos y¼0.9l/Dþ4Dd/d � sin y (2)
where bTotal is the full width half maximum of the XRDpeak, l is the incident X-ray wave length, y is the diffractionangle, D is crystallite size and Dd is the difference of thed spacing corresponding to a typical peak. By plottingbTotal � cosy versus siny it is possible to obtain D from theintercept and Dd/d from the slope.The Raman spectra were obtained using a U-1000
(Jobin-Ivon) double monochromator in back scatteringgeometry. The Raman spectra were excited by the 514 nmline of an Arþ ion laser and taken at room temperature. Inorder to avoid sample heating, a cylindrical focus was usedand the laser power was kept bellow 10 mW.The adsorption characteristics of the as-obtained and
calcined samples were determined. Adsorption and deso-rption isotherms of N2 were measured at �196 1C usingthe gravimetric McBain method. The specific surface area,SBET, mesoporous surface area including the contributionof external surface, Smeso, micropore volume, Vmic, andpore size distribution for the powders were calculated fromthe isotherms. Pore size distribution was estimated byapplying BJH method [45] to the desorption branch ofisotherms and mesopore surface and micropore volumewere estimated using the high resolution as plot method[45–47]. Micropore surface, Smic, was calculated by sub-tracting Smeso from SBET.
3. Results and discussions
Typical X-ray diffraction patterns of CeO2 calcined atdifferent temperatures are shown in Fig. 1. XRD analysisreveals that all peaks for each sample were significantlybroadened indicating small crystallite size and/or strain. It isespecially true for as-obtained powder which exhibits very
B. Matovic et al. / Ceramics International 39 (2013) 5007–5012 5009
diffuse diffraction lines, in such way that some atomic planesare impossible to indicate (hkl: 200, 400, 311, 420). However,the calcined powders depict somewhat sharper diffractionlines as the result of increased crystalline size. As Fig. 1evidences, the powder calcined at 800 1C is well crystallized.
The lattice parameter, ao (nm) and crystalline size of as-obtained as well as CeO2�d calcined at different temperaturesare presented in Table 1. It was found that the latticeparameter of as-obtained powder as well as powder calcinedat 400 1C is higher than the literature value for bulk materialof 0.5411 nm [48,49]. This behavior can be ascribed to theexistence of the microstrain fields in the crystal lattice ofparticles. It is believed that the fields are the most pronouncedin area close to the particle surface as the concentration ofsurface defects such as vacancy clusters is highest. Thus, theexpansion of the lattice in powders with very small particlesize is due to high specific surface and consequently highconcentration of oxygen vacancies associated with the pre-sence of Ce3þ [50]. However, the unit cell parameter ofpowders calcined at 600 and 800 1C are very close to the valuefor cell parameter of bulk material. There are two reasons forthe decrease in unit cell parameter with an increase ofcalcination temperature. One reason is coarsening of powderand consequent decrease in specific surface, whereas the otherreason is the valance change of cerium from Ce3þ to Ce4þ
due to higher thermodynamic stability of Ce4þ at highertemperature in ambient atmosphere. As Table 1 indicates,microstrain values are in good correlation with values of unitcell parameter and crystallite size.
Face centered cubic lattice of CeO2 (Oh5) allows for only
one Raman active mode with F2g symmetry. The Ramanprofile of this mode for polycrystalline sample can beexpressed as Lorentzian lineshape centered at about464 cm�1 [51], 465 cm�1 [52,53], or 466 cm�1 [51] withfull width at half maximum (FWHM) of 9 cm�1 [54] or10 cm�1 [55]. In CeO2 nanocrystals, F2g mode shifts tolower frequencies and deviation from the Lorentzian line-shape manifest as significant increase of F2g mode FWHMand appearance of asymmetry on the lower energy side.The observed changes of F2g Raman mode profile can bedescribed successfully by taking into account the combinedeffects of strain and phonon confinement together withparticle size distribution [56]. In CeO2�d nanocrystals, theadditional mode appears at about 600 cm�1 which isassigned to intrinsic oxygen vacancies [57].
Table 1
Lattice parameter and crystallite size of as-obtained powder and powders
calcined at different temperatures for 15 min.
Temperature
(1C)
Lattice parameter
(nm)
Crystallite size
(nm)
Strain
(� 10�3)
25* 0.5438 3.2 11.94(1)
400 0.5417 6.2 9.24(1)
600 0.5410 11.5 7.25(9)
800 0.5411 56.6 1.25(1)
nas-obtained (uncalcined) powder.
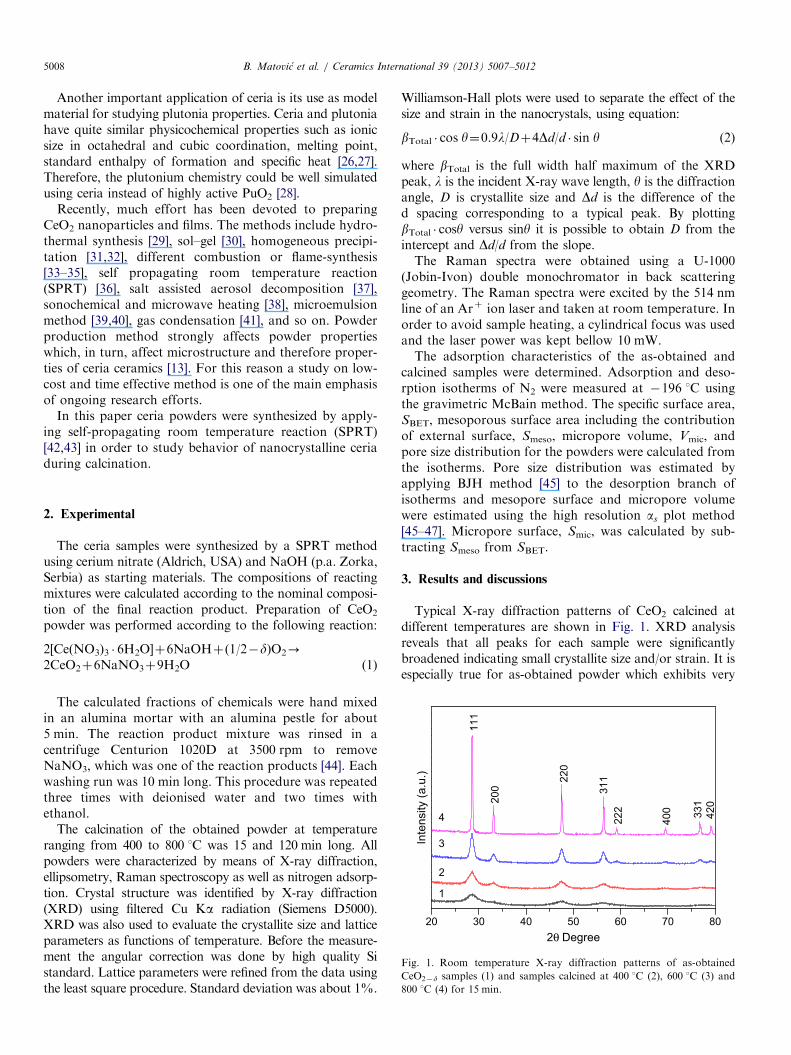
Fig. 2 shows the Raman spectra of samples calcined atdifferent temperatures for 15 min and 120 min togetherwith uncalcined sample as a reference. The F2g mode foruntreated sample is located at 456 cm�1 with FWHM of41 cm�1. Besides the main mode, the oxygen vacancymode at 600 cm�1 can be clearly observed. The increaseof calcination parameters (temperature and time) leads tothe transformations in the Raman spectra which arecharacteristic for the process of crystallite size growth. Inthe sample calcined at 400 1C it is obvious that longercalcination time leads to the change of the F2g modebandwidth. The main F2g mode at 600 1C transforms uponthe calcination into Lorentzian profile whereas oxygenvacancy mode disappears from the spectrum as a conse-quence of improved stoichiometry.Variation in the F2g mode frequency and FWHM with
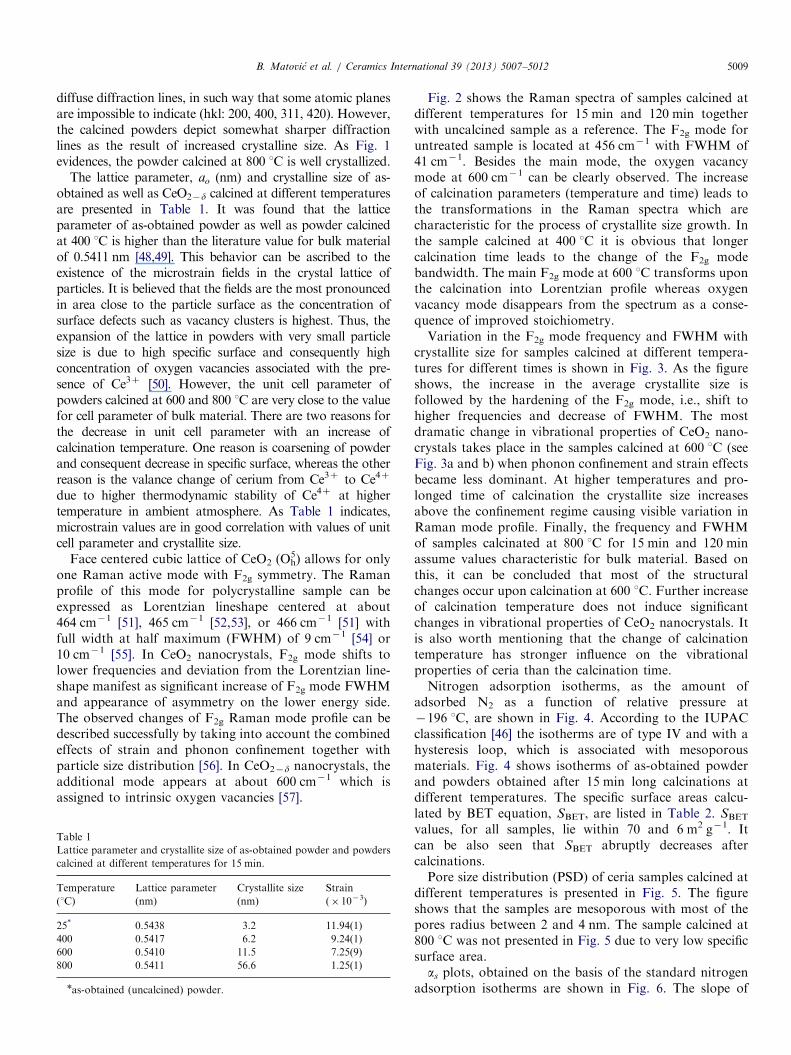
crystallite size for samples calcined at different tempera-tures for different times is shown in Fig. 3. As the figureshows, the increase in the average crystallite size isfollowed by the hardening of the F2g mode, i.e., shift tohigher frequencies and decrease of FWHM. The mostdramatic change in vibrational properties of CeO2 nano-crystals takes place in the samples calcined at 600 1C (seeFig. 3a and b) when phonon confinement and strain effectsbecame less dominant. At higher temperatures and pro-longed time of calcination the crystallite size increasesabove the confinement regime causing visible variation inRaman mode profile. Finally, the frequency and FWHMof samples calcinated at 800 1C for 15 min and 120 minassume values characteristic for bulk material. Based onthis, it can be concluded that most of the structuralchanges occur upon calcination at 600 1C. Further increaseof calcination temperature does not induce significantchanges in vibrational properties of CeO2 nanocrystals. Itis also worth mentioning that the change of calcinationtemperature has stronger influence on the vibrationalproperties of ceria than the calcination time.Nitrogen adsorption isotherms, as the amount of
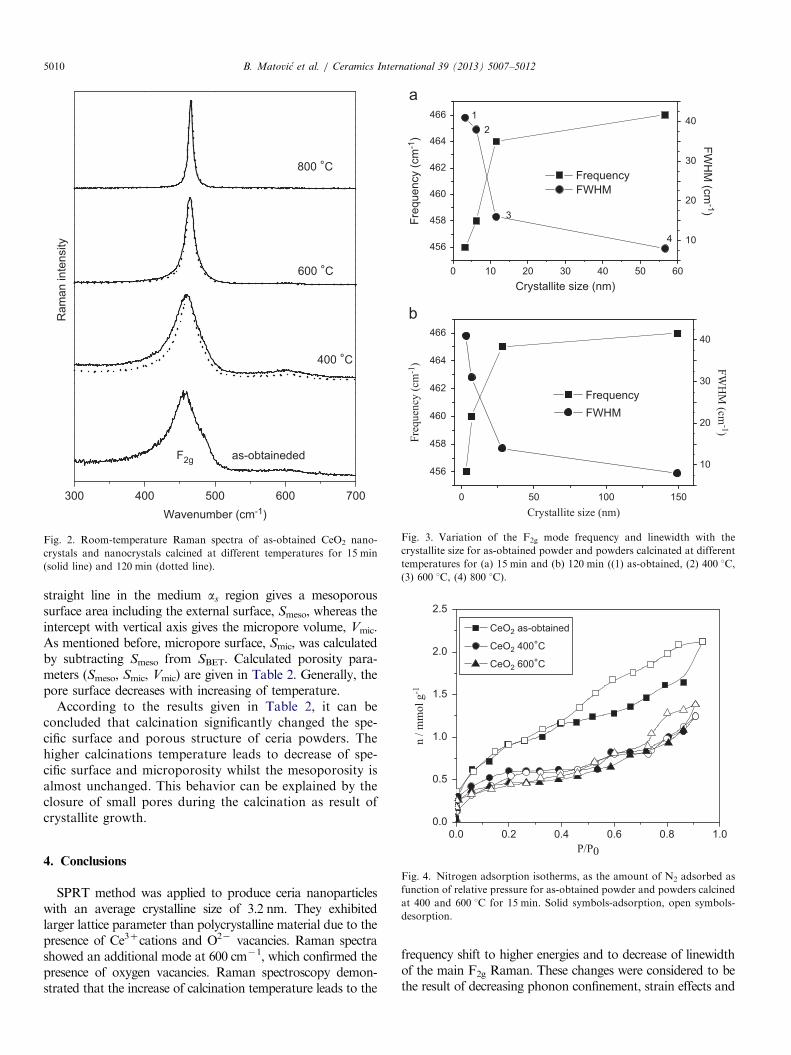
adsorbed N2 as a function of relative pressure at�196 1C, are shown in Fig. 4. According to the IUPACclassification [46] the isotherms are of type IV and with ahysteresis loop, which is associated with mesoporousmaterials. Fig. 4 shows isotherms of as-obtained powderand powders obtained after 15 min long calcinations atdifferent temperatures. The specific surface areas calcu-lated by BET equation, SBET, are listed in Table 2. SBET
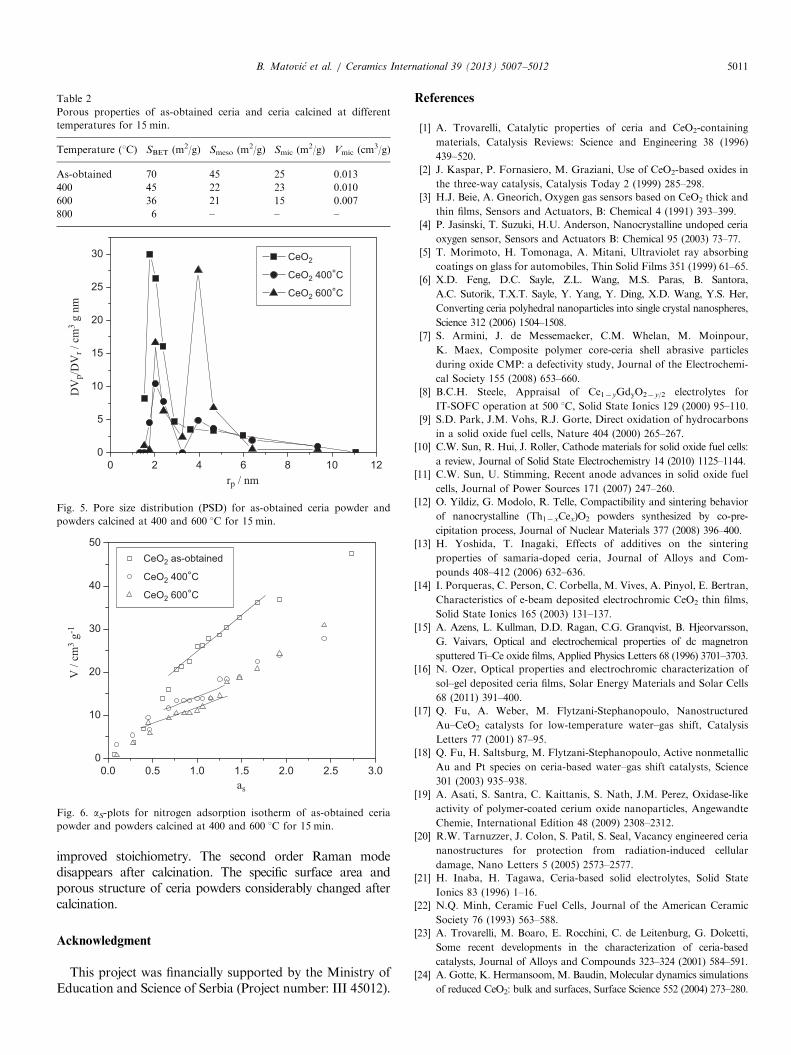
values, for all samples, lie within 70 and 6 m2 g�1. Itcan be also seen that SBET abruptly decreases aftercalcinations.Pore size distribution (PSD) of ceria samples calcined at
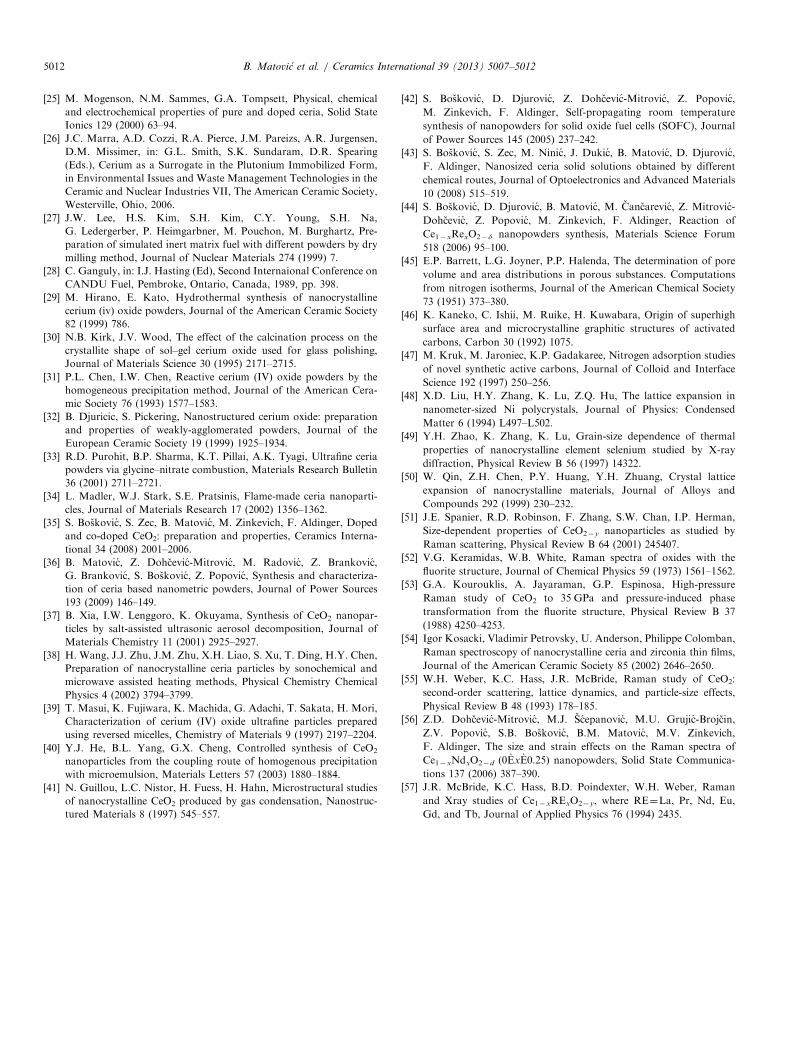
different temperatures is presented in Fig. 5. The figureshows that the samples are mesoporous with most of thepores radius between 2 and 4 nm. The sample calcined at800 1C was not presented in Fig. 5 due to very low specificsurface area.as plots, obtained on the basis of the standard nitrogen
adsorption isotherms are shown in Fig. 6. The slope of
300 400 500 600 700
800 °C
600 °C
Ram
an in
tens
ity
400 °C
Wavenumber (cm-1)
as-obtainededF2g
Fig. 2. Room-temperature Raman spectra of as-obtained CeO2 nano-
crystals and nanocrystals calcined at different temperatures for 15 min
(solid line) and 120 min (dotted line).
0 10 20 30 40 50 60
456
458
460
462
464
466
4
3
21
Frequency
Crystallite size (nm)
Freq
uenc
y (c
m-1
)
10
20
30
40
FWHM
FWH
M (cm
-1)
Frequency FWHM
0 50 100 150
456
458
460
462
464
466
Crystallite size (nm)
Freq
uenc
y (c
m-1
)
10
20
30
40
FWH
M (cm
-1)
Fig. 3. Variation of the F2g mode frequency and linewidth with the
crystallite size for as-obtained powder and powders calcinated at different
temperatures for (a) 15 min and (b) 120 min ((1) as-obtained, (2) 400 1C,
(3) 600 1C, (4) 800 1C).
0.0
0.5
1.0
1.5
2.0
2.5
n / m
mol
g-1
CeO2 as-obtained
CeO2 400°C
CeO2 600°C
B. Matovic et al. / Ceramics International 39 (2013) 5007–50125010
straight line in the medium as region gives a mesoporoussurface area including the external surface, Smeso, whereas theintercept with vertical axis gives the micropore volume, Vmic.As mentioned before, micropore surface, Smic, was calculatedby subtracting Smeso from SBET. Calculated porosity para-meters (Smeso, Smic, Vmic) are given in Table 2. Generally, thepore surface decreases with increasing of temperature.
According to the results given in Table 2, it can beconcluded that calcination significantly changed the spe-cific surface and porous structure of ceria powders. Thehigher calcinations temperature leads to decrease of spe-cific surface and microporosity whilst the mesoporosity isalmost unchanged. This behavior can be explained by theclosure of small pores during the calcination as result ofcrystallite growth.
0.0 0.2 0.4 0.6 0.8 1.0P/P0
Fig. 4. Nitrogen adsorption isotherms, as the amount of N2 adsorbed as
function of relative pressure for as-obtained powder and powders calcined
at 400 and 600 1C for 15 min. Solid symbols-adsorption, open symbols-
desorption.
4. Conclusions
SPRT method was applied to produce ceria nanoparticleswith an average crystalline size of 3.2 nm. They exhibitedlarger lattice parameter than polycrystalline material due to thepresence of Ce3þcations and O2� vacancies. Raman spectrashowed an additional mode at 600 cm�1, which confirmed thepresence of oxygen vacancies. Raman spectroscopy demon-strated that the increase of calcination temperature leads to the
frequency shift to higher energies and to decrease of linewidthof the main F2g Raman. These changes were considered to bethe result of decreasing phonon confinement, strain effects and
0 2 4 6 8 10 120
5
10
15
20
25
30 CeO2
CeO2 400°C
CeO2 600°C
DV
p/D
Vr /
cm
3 g n
m
rp / nm
Fig. 5. Pore size distribution (PSD) for as-obtained ceria powder and
powders calcined at 400 and 600 1C for 15 min.
0.0 0.5 1.0 1.5 2.0 2.5 3.00
10
20
30
40
50
as
CeO2 as-obtained
CeO2 400°C
CeO2 600°C
V /
cm3 g
-1
Fig. 6. aS-plots for nitrogen adsorption isotherm of as-obtained ceria
powder and powders calcined at 400 and 600 1C for 15 min.
Table 2
Porous properties of as-obtained ceria and ceria calcined at different
temperatures for 15 min.
Temperature (1C) SBET (m2/g) Smeso (m2/g) Smic (m2/g) Vmic (cm
3/g)
As-obtained 70 45 25 0.013
400 45 22 23 0.010
600 36 21 15 0.007
800 6 – – –
B. Matovic et al. / Ceramics International 39 (2013) 5007–5012 5011
improved stoichiometry. The second order Raman modedisappears after calcination. The specific surface area andporous structure of ceria powders considerably changed aftercalcination.
Acknowledgment
This project was financially supported by the Ministry ofEducation and Science of Serbia (Project number: III 45012).
References
[1] A. Trovarelli, Catalytic properties of ceria and CeO2-containing
materials, Catalysis Reviews: Science and Engineering 38 (1996)
439–520.
[2] J. Kaspar, P. Fornasiero, M. Graziani, Use of CeO2-based oxides in
the three-way catalysis, Catalysis Today 2 (1999) 285–298.
[3] H.J. Beie, A. Gneorich, Oxygen gas sensors based on CeO2 thick and
thin films, Sensors and Actuators, B: Chemical 4 (1991) 393–399.
[4] P. Jasinski, T. Suzuki, H.U. Anderson, Nanocrystalline undoped ceria
oxygen sensor, Sensors and Actuators B: Chemical 95 (2003) 73–77.
[5] T. Morimoto, H. Tomonaga, A. Mitani, Ultraviolet ray absorbing
coatings on glass for automobiles, Thin Solid Films 351 (1999) 61–65.
[6] X.D. Feng, D.C. Sayle, Z.L. Wang, M.S. Paras, B. Santora,
A.C. Sutorik, T.X.T. Sayle, Y. Yang, Y. Ding, X.D. Wang, Y.S. Her,
Converting ceria polyhedral nanoparticles into single crystal nanospheres,
Science 312 (2006) 1504–1508.
[7] S. Armini, J. de Messemaeker, C.M. Whelan, M. Moinpour,
K. Maex, Composite polymer core-ceria shell abrasive particles
during oxide CMP: a defectivity study, Journal of the Electrochemi-
cal Society 155 (2008) 653–660.
[8] B.C.H. Steele, Appraisal of Ce1�yGdyO2�y/2 electrolytes for
IT-SOFC operation at 500 1C, Solid State Ionics 129 (2000) 95–110.
[9] S.D. Park, J.M. Vohs, R.J. Gorte, Direct oxidation of hydrocarbons
in a solid oxide fuel cells, Nature 404 (2000) 265–267.
[10] C.W. Sun, R. Hui, J. Roller, Cathode materials for solid oxide fuel cells:
a review, Journal of Solid State Electrochemistry 14 (2010) 1125–1144.
[11] C.W. Sun, U. Stimming, Recent anode advances in solid oxide fuel
cells, Journal of Power Sources 171 (2007) 247–260.
[12] O. Yildiz, G. Modolo, R. Telle, Compactibility and sintering behavior
of nanocrystalline (Th1�xCex)O2 powders synthesized by co-pre-
cipitation process, Journal of Nuclear Materials 377 (2008) 396–400.
[13] H. Yoshida, T. Inagaki, Effects of additives on the sintering
properties of samaria-doped ceria, Journal of Alloys and Com-
pounds 408–412 (2006) 632–636.
[14] I. Porqueras, C. Person, C. Corbella, M. Vives, A. Pinyol, E. Bertran,
Characteristics of e-beam deposited electrochromic CeO2 thin films,
Solid State Ionics 165 (2003) 131–137.
[15] A. Azens, L. Kullman, D.D. Ragan, C.G. Granqvist, B. Hjeorvarsson,
G. Vaivars, Optical and electrochemical properties of dc magnetron
sputtered Ti–Ce oxide films, Applied Physics Letters 68 (1996) 3701–3703.
[16] N. Ozer, Optical properties and electrochromic characterization of
sol–gel deposited ceria films, Solar Energy Materials and Solar Cells
68 (2011) 391–400.
[17] Q. Fu, A. Weber, M. Flytzani-Stephanopoulo, Nanostructured
Au–CeO2 catalysts for low-temperature water–gas shift, Catalysis
Letters 77 (2001) 87–95.
[18] Q. Fu, H. Saltsburg, M. Flytzani-Stephanopoulo, Active nonmetallic
Au and Pt species on ceria-based water–gas shift catalysts, Science
301 (2003) 935–938.
[19] A. Asati, S. Santra, C. Kaittanis, S. Nath, J.M. Perez, Oxidase-like
activity of polymer-coated cerium oxide nanoparticles, Angewandte
Chemie, International Edition 48 (2009) 2308–2312.
[20] R.W. Tarnuzzer, J. Colon, S. Patil, S. Seal, Vacancy engineered ceria
nanostructures for protection from radiation-induced cellular
damage, Nano Letters 5 (2005) 2573–2577.
[21] H. Inaba, H. Tagawa, Ceria-based solid electrolytes, Solid State
Ionics 83 (1996) 1–16.
[22] N.Q. Minh, Ceramic Fuel Cells, Journal of the American Ceramic
Society 76 (1993) 563–588.
[23] A. Trovarelli, M. Boaro, E. Rocchini, C. de Leitenburg, G. Dolcetti,
Some recent developments in the characterization of ceria-based
catalysts, Journal of Alloys and Compounds 323–324 (2001) 584–591.
[24] A. Gotte, K. Hermansoom, M. Baudin, Molecular dynamics simulations
of reduced CeO2: bulk and surfaces, Surface Science 552 (2004) 273–280.
B. Matovic et al. / Ceramics International 39 (2013) 5007–50125012
[25] M. Mogenson, N.M. Sammes, G.A. Tompsett, Physical, chemical
and electrochemical properties of pure and doped ceria, Solid State
Ionics 129 (2000) 63–94.
[26] J.C. Marra, A.D. Cozzi, R.A. Pierce, J.M. Pareizs, A.R. Jurgensen,
D.M. Missimer, in: G.L. Smith, S.K. Sundaram, D.R. Spearing
(Eds.), Cerium as a Surrogate in the Plutonium Immobilized Form,
in Environmental Issues and Waste Management Technologies in the
Ceramic and Nuclear Industries VII, The American Ceramic Society,
Westerville, Ohio, 2006.
[27] J.W. Lee, H.S. Kim, S.H. Kim, C.Y. Young, S.H. Na,
G. Ledergerber, P. Heimgarbner, M. Pouchon, M. Burghartz, Pre-
paration of simulated inert matrix fuel with different powders by dry
milling method, Journal of Nuclear Materials 274 (1999) 7.
[28] C. Ganguly, in: I.J. Hasting (Ed), Second Internaional Conference on
CANDU Fuel, Pembroke, Ontario, Canada, 1989, pp. 398.
[29] M. Hirano, E. Kato, Hydrothermal synthesis of nanocrystalline
cerium (iv) oxide powders, Journal of the American Ceramic Society
82 (1999) 786.
[30] N.B. Kirk, J.V. Wood, The effect of the calcination process on the
crystallite shape of sol–gel cerium oxide used for glass polishing,
Journal of Materials Science 30 (1995) 2171–2715.
[31] P.L. Chen, I.W. Chen, Reactive cerium (IV) oxide powders by the
homogeneous precipitation method, Journal of the American Cera-
mic Society 76 (1993) 1577–1583.
[32] B. Djuricic, S. Pickering, Nanostructured cerium oxide: preparation
and properties of weakly-agglomerated powders, Journal of the
European Ceramic Society 19 (1999) 1925–1934.
[33] R.D. Purohit, B.P. Sharma, K.T. Pillai, A.K. Tyagi, Ultrafine ceria
powders via glycine–nitrate combustion, Materials Research Bulletin
36 (2001) 2711–2721.
[34] L. Madler, W.J. Stark, S.E. Pratsinis, Flame-made ceria nanoparti-
cles, Journal of Materials Research 17 (2002) 1356–1362.
[35] S. Boskovic, S. Zec, B. Matovic, M. Zinkevich, F. Aldinger, Doped
and co-doped CeO2: preparation and properties, Ceramics Interna-
tional 34 (2008) 2001–2006.
[36] B. Matovic, Z. Dohcevic-Mitrovic, M. Radovic, Z. Brankovic,
G. Brankovic, S. Boskovic, Z. Popovic, Synthesis and characteriza-
tion of ceria based nanometric powders, Journal of Power Sources
193 (2009) 146–149.
[37] B. Xia, I.W. Lenggoro, K. Okuyama, Synthesis of CeO2 nanopar-
ticles by salt-assisted ultrasonic aerosol decomposition, Journal of
Materials Chemistry 11 (2001) 2925–2927.
[38] H. Wang, J.J. Zhu, J.M. Zhu, X.H. Liao, S. Xu, T. Ding, H.Y. Chen,
Preparation of nanocrystalline ceria particles by sonochemical and
microwave assisted heating methods, Physical Chemistry Chemical
Physics 4 (2002) 3794–3799.
[39] T. Masui, K. Fujiwara, K. Machida, G. Adachi, T. Sakata, H. Mori,
Characterization of cerium (IV) oxide ultrafine particles prepared
using reversed micelles, Chemistry of Materials 9 (1997) 2197–2204.
[40] Y.J. He, B.L. Yang, G.X. Cheng, Controlled synthesis of CeO2
nanoparticles from the coupling route of homogenous precipitation
with microemulsion, Materials Letters 57 (2003) 1880–1884.
[41] N. Guillou, L.C. Nistor, H. Fuess, H. Hahn, Microstructural studies
of nanocrystalline CeO2 produced by gas condensation, Nanostruc-
tured Materials 8 (1997) 545–557.
[42] S. Boskovic, D. Djurovic, Z. Dohcevic-Mitrovic, Z. Popovic,
M. Zinkevich, F. Aldinger, Self-propagating room temperature
synthesis of nanopowders for solid oxide fuel cells (SOFC), Journal
of Power Sources 145 (2005) 237–242.
[43] S. Boskovic, S. Zec, M. Ninic, J. Dukic, B. Matovic, D. Djurovic,
F. Aldinger, Nanosized ceria solid solutions obtained by different
chemical routes, Journal of Optoelectronics and Advanced Materials
10 (2008) 515–519.
[44] S. Boskovic, D. Djurovic, B. Matovic, M. Cancarevic, Z. Mitrovic-
Dohcevic, Z. Popovic, M. Zinkevich, F. Aldinger, Reaction of
Ce1�xRexO2�d nanopowders synthesis, Materials Science Forum
518 (2006) 95–100.
[45] E.P. Barrett, L.G. Joyner, P.P. Halenda, The determination of pore
volume and area distributions in porous substances. Computations
from nitrogen isotherms, Journal of the American Chemical Society
73 (1951) 373–380.
[46] K. Kaneko, C. Ishii, M. Ruike, H. Kuwabara, Origin of superhigh
surface area and microcrystalline graphitic structures of activated
carbons, Carbon 30 (1992) 1075.
[47] M. Kruk, M. Jaroniec, K.P. Gadakaree, Nitrogen adsorption studies
of novel synthetic active carbons, Journal of Colloid and Interface
Science 192 (1997) 250–256.
[48] X.D. Liu, H.Y. Zhang, K. Lu, Z.Q. Hu, The lattice expansion in
nanometer-sized Ni polycrystals, Journal of Physics: Condensed
Matter 6 (1994) L497–L502.
[49] Y.H. Zhao, K. Zhang, K. Lu, Grain-size dependence of thermal
properties of nanocrystalline element selenium studied by X-ray
diffraction, Physical Review B 56 (1997) 14322.
[50] W. Qin, Z.H. Chen, P.Y. Huang, Y.H. Zhuang, Crystal lattice
expansion of nanocrystalline materials, Journal of Alloys and
Compounds 292 (1999) 230–232.
[51] J.E. Spanier, R.D. Robinson, F. Zhang, S.W. Chan, I.P. Herman,
Size-dependent properties of CeO2�y nanoparticles as studied by
Raman scattering, Physical Review B 64 (2001) 245407.
[52] V.G. Keramidas, W.B. White, Raman spectra of oxides with the
fluorite structure, Journal of Chemical Physics 59 (1973) 1561–1562.
[53] G.A. Kourouklis, A. Jayaraman, G.P. Espinosa, High-pressure
Raman study of CeO2 to 35 GPa and pressure-induced phase
transformation from the fluorite structure, Physical Review B 37
(1988) 4250–4253.
[54] Igor Kosacki, Vladimir Petrovsky, U. Anderson, Philippe Colomban,
Raman spectroscopy of nanocrystalline ceria and zirconia thin films,
Journal of the American Ceramic Society 85 (2002) 2646–2650.
[55] W.H. Weber, K.C. Hass, J.R. McBride, Raman study of CeO2:
second-order scattering, lattice dynamics, and particle-size effects,
Physical Review B 48 (1993) 178–185.
[56] Z.D. Dohcevic-Mitrovic, M.J. Scepanovic, M.U. Grujic-Brojcin,
Z.V. Popovic, S.B. Boskovic, B.M. Matovic, M.V. Zinkevich,
F. Aldinger, The size and strain effects on the Raman spectra of
Ce1�xNdxO2�d (0ExE0.25) nanopowders, Solid State Communica-
tions 137 (2006) 387–390.
[57] J.R. McBride, K.C. Hass, B.D. Poindexter, W.H. Weber, Raman
and Xray studies of Ce1�xRExO2�y, where RE¼La, Pr, Nd, Eu,
Gd, and Tb, Journal of Applied Physics 76 (1994) 2435.
Related Documents