Full Terms & Conditions of access and use can be found at http://www.tandfonline.com/action/journalInformation?journalCode=gsch20 Download by: [117.198.107.102] Date: 23 March 2017, At: 12:24 Supramolecular Chemistry ISSN: 1061-0278 (Print) 1029-0478 (Online) Journal homepage: http://www.tandfonline.com/loi/gsch20 Synthesis and spectral investigation of colorimetric receptors for the dual detection of copper and acetate ions: application in molecular logic gates Srikala Pangannaya, Arshiya Kaur, Makesh Mohan, Keyur Raval, Dillip Kumar Chand & Darshak R. Trivedi To cite this article: Srikala Pangannaya, Arshiya Kaur, Makesh Mohan, Keyur Raval, Dillip Kumar Chand & Darshak R. Trivedi (2017) Synthesis and spectral investigation of colorimetric receptors for the dual detection of copper and acetate ions: application in molecular logic gates, Supramolecular Chemistry, 29:8, 561-574, DOI: 10.1080/10610278.2017.1298764 To link to this article: http://dx.doi.org/10.1080/10610278.2017.1298764 View supplementary material Published online: 23 Mar 2017. Submit your article to this journal View related articles View Crossmark data

Welcome message from author
This document is posted to help you gain knowledge. Please leave a comment to let me know what you think about it! Share it to your friends and learn new things together.
Transcript
Full Terms & Conditions of access and use can be found athttp://www.tandfonline.com/action/journalInformation?journalCode=gsch20
Download by: [117.198.107.102] Date: 23 March 2017, At: 12:24
Supramolecular Chemistry
ISSN: 1061-0278 (Print) 1029-0478 (Online) Journal homepage: http://www.tandfonline.com/loi/gsch20
Synthesis and spectral investigation ofcolorimetric receptors for the dual detection ofcopper and acetate ions: application in molecularlogic gates
Srikala Pangannaya, Arshiya Kaur, Makesh Mohan, Keyur Raval, DillipKumar Chand & Darshak R. Trivedi
To cite this article: Srikala Pangannaya, Arshiya Kaur, Makesh Mohan, Keyur Raval, DillipKumar Chand & Darshak R. Trivedi (2017) Synthesis and spectral investigation of colorimetricreceptors for the dual detection of copper and acetate ions: application in molecular logic gates,Supramolecular Chemistry, 29:8, 561-574, DOI: 10.1080/10610278.2017.1298764
To link to this article: http://dx.doi.org/10.1080/10610278.2017.1298764
View supplementary material
Published online: 23 Mar 2017.
Submit your article to this journal
View related articles
View Crossmark data

Supramolecular chemiStry, 2017Vol. 29, No. 8, 561–574http://dx.doi.org/10.1080/10610278.2017.1298764
Synthesis and spectral investigation of colorimetric receptors for the dual detection of copper and acetate ions: application in molecular logic gates
Srikala Pangannayaa, Arshiya Kaurb, Makesh Mohanc, Keyur Ravald, Dillip Kumar Chandb and Darshak R. Trivedia
aSupramolecular chemistry laboratory, National institute of technology Karnataka (NitK), Surathkal, india; bDepartment of chemistry, indian institute of technology madras (iitm), chennai, india; cDepartment of physics, National institute of technology Karnataka (NitK), Surathkal, india; dDepartment of chemical engineering, National institute of technology Karnataka (NitK), Surathkal, india
ABSTRACTColorimetric receptors L1, L2 and L3 possessing –OH functionality as binding site and –NO2 as signalling unit with varied positional substitution of –OMe functionality has been designed and synthesised by simple Schiff base condensation reaction. Receptors L1, L2 and L3 showed selective response towards AcO− ion among other interfering monovalent anions viz., F−, Cl−, Br−, I−, NO3
−, HSO
−
4 and H
2PO
−
4. L2 imparts high selectivity towards AcO− ion assisted by push-pull effect of –
NO2 and –OMe functionality in conjugation with imine linkage. The binding constant for L2–OAc complex was found to be 9.04 × 10⁴ M−2. L2 exhibited a detection limit of 0.61 ppm towards NaOAc. The selectivity of L1 towards Cu2+ ions with a lower detection limit of 1.81 ppm implies the role of electron donating –OMe in favouring the coordinative interaction of hetero atoms of L1 with Cu2+ ions. The selective detection of AcO− and Cu2+ ions is further established with OR and INHIBIT logic gate application of receptors L1, L2 and L3 correspondingly. The colorimetric studies reveal the role of OMe functionality in the selective detection of AcO− and Cu 2+ ions in aqueous media.
1. Introduction
Supramolecular chemistry of host–guest interaction is a vibrant area of research owing to its applicability in bio-chemistry and environmental science (1) .The design and synthesis of new artificial receptors have seen progressive path unveiling their utility in the detection of physiolog-ically important anions and cations (2). Acetate ion has been one of the intriguing targets due to its significance in metabolic processes. The rate of acetate production and
sedimentation has been an indicator of organic decompo-sition in marine sediments. Moreover, utility of acetate ion is realised in the manufacture of paper, plastics, dyes and paints (3). Correspondingly, past few years have witnessed a number of receptors for the detection of biologically and environmentally relevant transition metal cations. Copper being the third most abundant essential trace element is required in optimum amount for regulation
© 2017 informa uK limited, trading as taylor & Francis Group
KEYWORDSSchiff base; substitution effect; colorimetric; dual sensor; logic gate
ARTICLE HISTORYreceived 20 october 2016 accepted 19 February 2017
CONTACT Darshak r. trivedi [email protected] Supplemental data for this paper is available online at http://dx.doi.org/10.1080/10610278.2017.1298764
562 S. PANGANNAYA ET AL.
used as received without further purification. All the sol-vents were purchased from SD Fine, India, were of HPLC grade and used without further distillation.
Melting point was measured on Stuart SMP3 melt-ing-point apparatus in open capillaries. Infrared spectra were recorded on Bruker FTIR spectrometer. UV/Vis spec-troscopy was performed with Thermo Scientific Genysys 10S spectrophotometer in standard 3.0 mL quartz cell with 1 cm path length. The 1H NMR spectra were recorded on Bruker Ascend (400 MHz) instrument using TMS as internal reference and DMSO-d6 as solvent. Resonance multiplici-ties are described as s (singlet), d (doublet), t (triplet) and m (multiplet).
2.2. Synthesis of L1
To 197.44 mg (1.29 mmol) of the 2-hydroxy-5-methoxyben-zaldehyde, 200 mg (1.29 mmol) of 2-amino-5- nitrophenol was added. To this mixture, approximately 10 mL of meth-anol and a drop of glacial acetic acid (catalyst) were added and the reaction mixture was sonicated at room temper-ature for 5 min. The beaker was covered with aluminium foil with pinholes for slow evaporation of solvent. The solid product was recrystallised in methanol in 75% yield. Melting point: 192 °C
1H NMR (DMSO- d6, 400 MHz, ppm): δ 12.35 (OH, s), 10.25 (OH, s), 8.98 (HC=N, s), 7.79–7.77 (Ar CH, d), 7.49–7.29 (Ar CH, s), 6.94–6.91 (Ar CH, d), 6.62–6.61 (Ar CH, d), 6.20(Ar CH, s), 3.76 (OMe, s). 13C NMR (DMSO-d6, 100 MHz, ppm): 56.05, 109.10, 111.43, 115.42, 118.5, 119.8, 121.02, 121.95, 142.92, 146.16, 151.57, 152.34, 155.24, 164.72. FT-IR (cm−1): 3372 (OH), 2998 (Ar C-H), 1607 (CH=N), 1506 (aromatic C=C), 1231 (C–O, stretching). Mass: calculated: 288.07, obtained: 289.08 (M + H)+.
2.3. Synthesis of L2
To 197.44 mg (1.29 mmol) of the 2-hydroxy-4-methoxyben-zaldehyde, 200 mg (1.29 mmol) of 2-amino-5- nitrophenol was added. To this mixture approximately 10 mL of metha-nol and a drop of glacial acetic acid (catalyst) were added and the reaction mixture was sonicated at room temper-ature for 5 min. The beaker was covered with aluminium foil with pinholes for slow evaporation of solvent. The solid product was recrystallised in methanol in 75% yield. Melting point: 195 °C
1H NMR (DMSO- d6, 400 MHz, ppm): δ 13.78 (OH, s), 10.73 (OH, s), 8.94 (HC=N, s), 7.79 (Ar CH, s), 7.77 (Ar CH, s), 7.56 (Ar CH, s), 7.53 (Ar CH, s), 6.56 (Ar CH, s), 6.47 (Ar CH, s), 6.46 (Ar CH, s), 3.82 (OMe, m). 13C NMR (DMSO-d6, 100 MHz, ppm): 56.03, 101.45, 107.82, 111.13, 113.56, 115.70, 120.30, 134.91, 141.81, 145.78, 151.20, 163.45, 165.06, 165.53. FT-IR (cm−1): 3389 (OH), 3082 (Ar C-H), 1585 (CH=N), 1521
of fundamental physiological process (4). Copper ion is known to promote bone development, cellular respiration, nerve function regulation and haemoglobin synthesis (5).
Numerous technologies such as atomic absorption spec-troscopy, X-ray photoelectron spectroscopy, voltammetry, inductively coupled plasma emission or mass spectrometry have been developed for the detection of trace amount of cations and anions (6). In reality, sophisticated instrumenta-tion, time factor and cost are the reasons that strictly limit the usage of these techniques on the real time basis (7). Thus far, numerous colorimetric receptors have been developed by researchers by virtue of the detection of anions and cations at ease without resorting to sophisticated instrumentation (8–14). In this direction, numerous reports are available in the literature wherein researchers have developed artificial receptors which exhibit excellent anion binding property both in solution and solid states (15–21). Simple urea-based cleft-type receptors have been designed and synthesised by researchers involving structural manipulation of receptors appended to a signalling unit which drives selective detec-tion of anions (22). Most of the receptors reported so far for the detection of acetate ions exhibit interference from fluoride and phosphate ions (23–25). Selective detection of anions has been one of the thrust area of research in anion receptor chemistry and development of new design strategies involving effective binding sites and signalling unit is gaining prime importance.
In the last few decades, the colorimetric detection of anions and cations based on molecular devices has been a subject of extensive research interest (26). The integra-tion of molecular logic gates into working automation and arithmetic systems has revealed the clear idea of a molec-ular scale calculator (27–29). Molecular logic gates involve chemical inputs (30) and generate output signals (31) that operate in a wireless mode. This highlights the advantages and potential of logic gate devices in computation on a nanometre scale over the silicon-based devices eventu-ally leading to the possibility to load an array of Boolean functions onto a single molecule.
In this regard, finding the utility of both Cu2+ and AcO− ions, we report three new isomeric receptors with varied positional substitution of –OMe functionality following binding site-signalling unit approach dedicated to bind both anions and cations. Furthermore, the dual ion sensing property could be an impetus to study molecular logic gate applications.
2. Experimental section
2.1. Materials and methods
All the chemicals used in the present study were procured from Sigma-Aldrich, Alfa Aesar or Spectrochem and were
SUPRAMOLECULAR CHEMISTRY 563
(aromatic C = C), 1205 (C–O, stretching). Mass: calculated: 288.07, obtained: 289.08 (M + H)+.
2.4. Synthesis of L3
To 197.44 mg (1.29 mmol) of the 2-hydroxy-3-methoxy-benzaldehyde, 200 mg (1.29 mmol) of 2-amino-5-nitro-phenol was added. To this mixture approximately 10 mL of methanol and a drop of glacial acetic acid (catalyst) was added and the reaction mixture was sonicated at room temperature for 5 min. The beaker was covered with alu-minium foil with pinholes for slow evaporation of solvent. The solid product was recrystallised in methanol in 75% yield. Melting point: 198 °C
1H NMR (DMSO- d6, 400 MHz, ppm): δ 13.26 (OH, s), 10.76 (OH, s), 9.03 (HC=N, s), 7.8–7.6 (Ar CH, d), 7.57 (Ar CH, s), 7.17–6.94 (Ar CH, s), 6.92 (Ar CH, s), 6.90 (Ar CH, s), 3.83 (OMe, m). 13C NMR (DMSO-d6, 100 MHz, ppm): 56.37, 111.23, 115.57, 116.48, 119.02, 119.70, 120.97, 120.97, 124.41, 142.12, 146.33, 148.61, 151.93, 151.54, 165.30. FT-IR (cm−1): 3438 (OH), 2830 (Ar C-H), 1631 (CH=N), 1528 (aromatic C=C), 1256 (C–O, stretching). Mass: calculated: 288.07, obtained: 289.08 (M + H)+.
3. Results and discussion
Receptors L1, L2 and L3 have been synthesised in good yield by simple Schiff base condensation reaction of methoxy substituted salicylaldehyde with 2-amino,5-ni-trophenol using acetic acid as catalyst and methanol as solvent (Scheme 1). TLC has been performed to confirm the product formation and the receptors L1, L2 and L3 have been characterised by standard spectroscopic techniques
such as FT-IR and 1H-NMR in order to confirm the structural aspects.
3.1. UV–vis spectrophotometric studies
Receptors L1, L2 and L3 by virtue of varied positional sub-stitution of –OMe functionality at para, meta and ortho position to the –OH substitution is expected to exhibit sig-nificant colorimetric response in the presence of anions. The presence of –NO2 group as signalling unit is known to produce a colour change visible to the naked eye in the anion binding process.
The anion binding properties of receptors L1, L2 and L3 were investigated by UV–vis spectroscopic studies. In the colorimetric analysis, 1 equiv. of 10−2 M solution of tetrabu-tylammonium (TBA) salts of anions such as F−, Cl−, Br−, I−, NO3
−, HSO−
4 H
2PO
−
4 and AcO− (10−2 M DMSO) were added
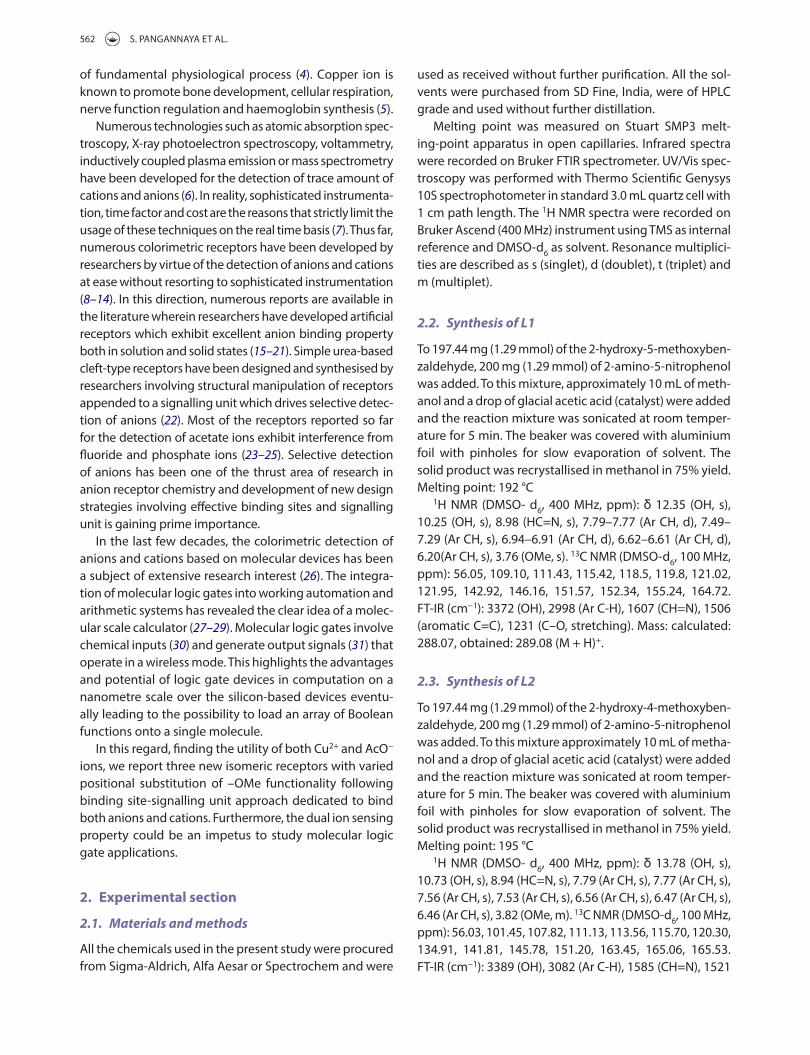
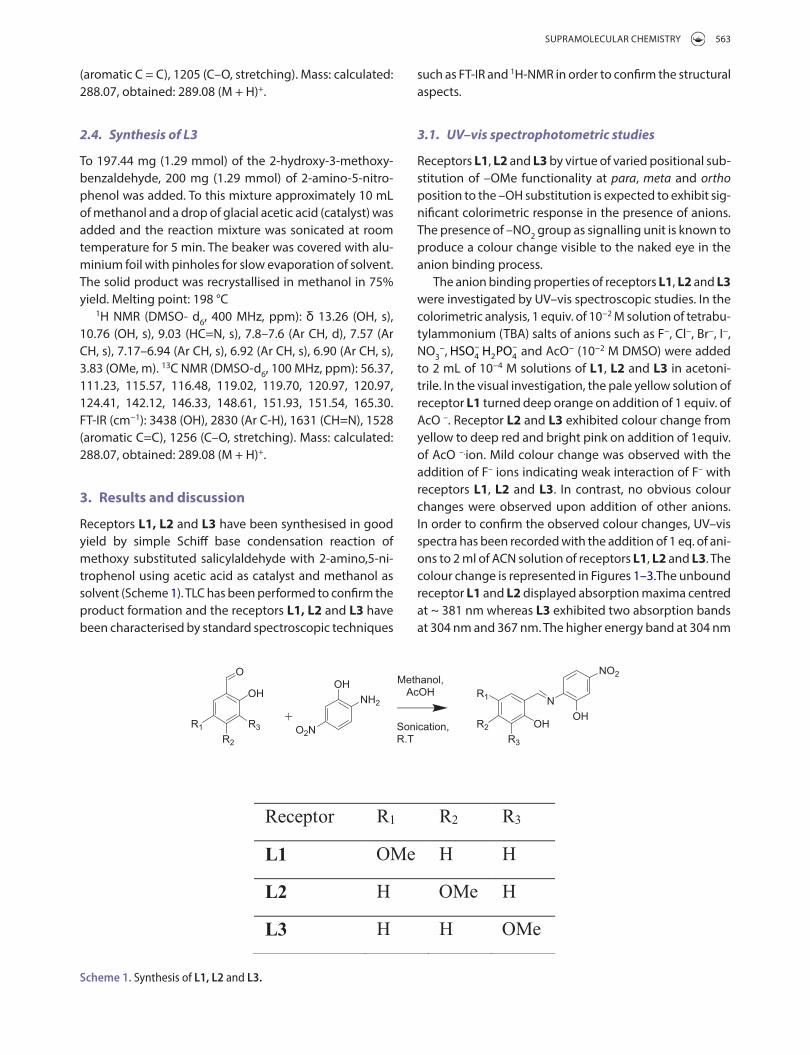
to 2 mL of 10−4 M solutions of L1, L2 and L3 in acetoni-trile. In the visual investigation, the pale yellow solution of receptor L1 turned deep orange on addition of 1 equiv. of AcO –. Receptor L2 and L3 exhibited colour change from yellow to deep red and bright pink on addition of 1equiv. of AcO –.ion. Mild colour change was observed with the addition of F– ions indicating weak interaction of F– with receptors L1, L2 and L3. In contrast, no obvious colour changes were observed upon addition of other anions. In order to confirm the observed colour changes, UV–vis spectra has been recorded with the addition of 1 eq. of ani-ons to 2 ml of ACN solution of receptors L1, L2 and L3. The colour change is represented in Figures 1–3.The unbound receptor L1 and L2 displayed absorption maxima centred at ~ 381 nm whereas L3 exhibited two absorption bands at 304 nm and 367 nm. The higher energy band at 304 nm
Scheme 1. Synthesis of L1, L2 and L3.
564 S. PANGANNAYA ET AL.
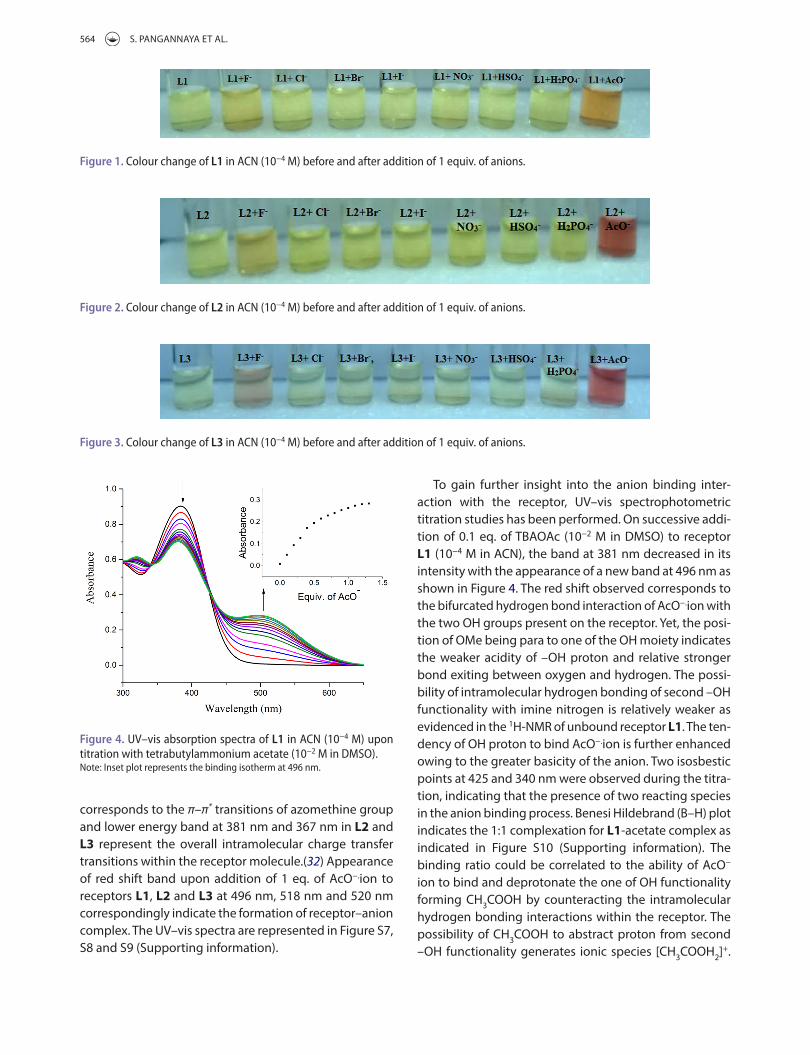
To gain further insight into the anion binding inter-action with the receptor, UV–vis spectrophotometric titration studies has been performed. On successive addi-tion of 0.1 eq. of TBAOAc (10−2 M in DMSO) to receptor L1 (10−4 M in ACN), the band at 381 nm decreased in its intensity with the appearance of a new band at 496 nm as shown in Figure 4. The red shift observed corresponds to the bifurcated hydrogen bond interaction of AcO−.ion with the two OH groups present on the receptor. Yet, the posi-tion of OMe being para to one of the OH moiety indicates the weaker acidity of –OH proton and relative stronger bond exiting between oxygen and hydrogen. The possi-bility of intramolecular hydrogen bonding of second –OH functionality with imine nitrogen is relatively weaker as evidenced in the 1H-NMR of unbound receptor L1. The ten-dency of OH proton to bind AcO−.ion is further enhanced owing to the greater basicity of the anion. Two isosbestic points at 425 and 340 nm were observed during the titra-tion, indicating that the presence of two reacting species in the anion binding process. Benesi Hildebrand (B–H) plot indicates the 1:1 complexation for L1-acetate complex as indicated in Figure S10 (Supporting information). The binding ratio could be correlated to the ability of AcO− ion to bind and deprotonate the one of OH functionality forming CH3COOH by counteracting the intramolecular hydrogen bonding interactions within the receptor. The possibility of CH3COOH to abstract proton from second –OH functionality generates ionic species [CH3COOH2]+.
corresponds to the π–π* transitions of azomethine group and lower energy band at 381 nm and 367 nm in L2 and L3 represent the overall intramolecular charge transfer transitions within the receptor molecule.(32) Appearance of red shift band upon addition of 1 eq. of AcO−.ion to receptors L1, L2 and L3 at 496 nm, 518 nm and 520 nm correspondingly indicate the formation of receptor–anion complex. The UV–vis spectra are represented in Figure S7, S8 and S9 (Supporting information).
Figure 1. colour change of L1 in acN (10−4 m) before and after addition of 1 equiv. of anions.
Figure 2. colour change of L2 in acN (10−4 m) before and after addition of 1 equiv. of anions.
Figure 3. colour change of L3 in acN (10−4 m) before and after addition of 1 equiv. of anions.
Figure 4. uV–vis absorption spectra of L1 in acN (10−4 m) upon titration with tetrabutylammonium acetate (10−2 m in DmSo).Note: inset plot represents the binding isotherm at 496 nm.

SUPRAMOLECULAR CHEMISTRY 565
UV–vis spectra of Receptor L3 exhibited significant col-orimetric response with the incremental addition of 0.1 eq of AcO−.ion. Unlike L1 and L2, the receptor L3 exhibited a varied colour change with a decrease in the bands cen-tred at 304 and 367 nm with the emergence of new red shift band at 520 nm and a blue shift band at 350 nm as shown in Figure 6. The presence of –OMe at meta position relative to the imine linkage and at ortho position to the OH functionality of salicylaldimine represents a unique intramolecular hydrogen bond preferences of the –OH functionalities. The competitive nature of OMe and imine nitrogen to involve in hydrogen bond interaction with the OH functionality leads to downfield shift of –OH proton to δ 13.26 ppm. The relative decrease in the downfield shift of OH proton of L3 in comparison with L2 indicates relative weak nature of intramolecular hydrogen bond interaction facilitating strong binding of anions. As a consequence, NO2 functionality imparts strong influence on the OH linked to imine functionality leading to deprotonation of receptor with CH3COOH and [L3]− as end products. Thus formed CH3COOH can further abstract another proton from hydroxyl functionality generating [CH3COOH2
+] and [L3]2− as final products. Four isosbestic points are observed at 415, 343, 313 and 284 nm indicating the involvement of interacting species in a complex equilibrium process (33) The B–H plot indicates the coexistence of two species with 1:1 and 1:2 binding ratio of L3- AcO− ion complex as rep-resented in Figure S13 and S14 (Supporting information).
Anion recognition has overwhelming applications in the medical, environmental, biological and industrial arenas which typically require aqueous media inorder to mimick the physiological conditions. The design of selec-tive anion receptors that function in aqueous solution has been a key challenge to supramolecular chemists. In this
The above mechanism could be an evidence for the hydro-gen bonding ability of both –OH functionality.
Receptor L2 (10−4 M in ACN) showed remarkable colori-metric response with the incremental addition of 0.1 eq. of AcO−.ion. Successive decrease in the original band centred at 381 nm with the growth of new red shift band at 518 nm is indicative of the strong anion-receptor interaction as shown in Figure 5. The presence of electron donating –OMe functionality para to the imine linkage, allows the –OH functionality to involve in intramolecular hydrogen bond interaction. The presence of intramolecular hydro-gen bond is confirmed from the 1HNMR spectrum which exhibits signal for –OH proton at δ 13.78 ppm (downfield). The presence of electron withdrawing –NO2 functionality imparts the formation of strong intramolecular hydrogen bond of –OH of nitrophenyl group with the imine func-tionality. The conformational change of the receptor L2 in the presence of AcO−.ions is more preferred in the anion binding followed by deprotonation of receptor L2. The preorganisation of receptor allows bifurcated hydrogen bond interaction between AcO− and two OH functional-ities of L2.
The stoichiometry of L2- AcO− complex was deter-mined by B–H plot. The linear plot obtained with the first power and second power of concentration of AcO− ion clearly revealed the existence of at least two species of complexes (1:1 and 1:2 for L2:AcO−. (33) (Figure S11 and S12 (Supporting information)). This could be the proba-ble reason for the appearance of four isobestic points in the titration spectra. Binding ratio indicates the formation of dimer, [(CH3COO)H2
+] and [L2]2−. The presence of four isosbestic points observed at 424, 345, 314 and 286 nm indicates the presence of complex equilibrium process in the formation of L2- AcO− ion complex.
Figure 5. uV–vis absorption spectra of L2 in acN (10−4 m) upon titration with tetrabutylammonium acetate (10−2 m in DmSo).Note: inset plot represents the binding isotherm at 518 nm.
Figure 6. uV–vis absorption spectra of L3 in acN (10−4 m) upon titration with tetrabutylammonium acetate (10−2 m in DmSo).Note: inset plot represents the binding isotherm at 520 nm.

566 S. PANGANNAYA ET AL.
of receptor with Cu2+ ion in 1:1, 1:1 and 1:1 binding ratio, respectively. Titration profile of L1, L2 and L3 with incre-mental addition of Cu2+ ion is shown in Figure S26, S28 and S30 (Supporting information). The corresponding
regard, we have aimed to check the binding ability of L1, L2 and L3 towards sodium salt of AcO− ion in aqueous media. It was observed that addition of 1 equiv. of 10−2 M solution of NaOAc (10−2 M in H2O) changed the pale yel-low colour of the receptor L1 to orange as represented in Figure 7. L2 exhibited significant colour change in the presence of 1 equiv. of 10−2 M solution of NaOAc (10−2 M in H2O) from pale yellow to red as shown in Figure 8. L3 displayed a colour change from pale yellow to bright pink implying the efficiency of the receptor in combating the solvent interferences as given in Figure 9.
The titration of L1 with incremental addition of 0.1 eq. of NaOAc resulted in red shift of the original absorption band to 490 nm with isobestic point at 429 nm as seen in Figure S15(Supporting information). B–H plot revealed the 1:1 binding ratio of L1- AcO− complex as shown in Figure S16 (Supporting information). Titration studies per-formed with incremental addition of 0.1 eq. of NaOAc to L2 indicated red shift of the band to 512 nm with isobes-tic points at 426, 346, 313 and 284 nm as given in Figure S17(Supporting information). B–H plot indicated the for-mation of 1:1 and 1:2 complex in the binding process as represented in Figure S18 and S19 (Supporting informa-tion). Titration studies with the successive addition of AcO− ion to solution of L3 indicated shift in absorption band to 519 nm with isobestic points at 415, 343, 314 and 271 nm reflective of the complex formation. Titration profile is shown in Figure S20 (Supporting information). B–H plot indicated the formation of 1:1 and 1:2 complex as shown in Figure S21 and S22 (Supporting information). L1, L2 and L3 could be considered as synthetic anion receptor that can operate effectively in water, surpassing solvent interferences.
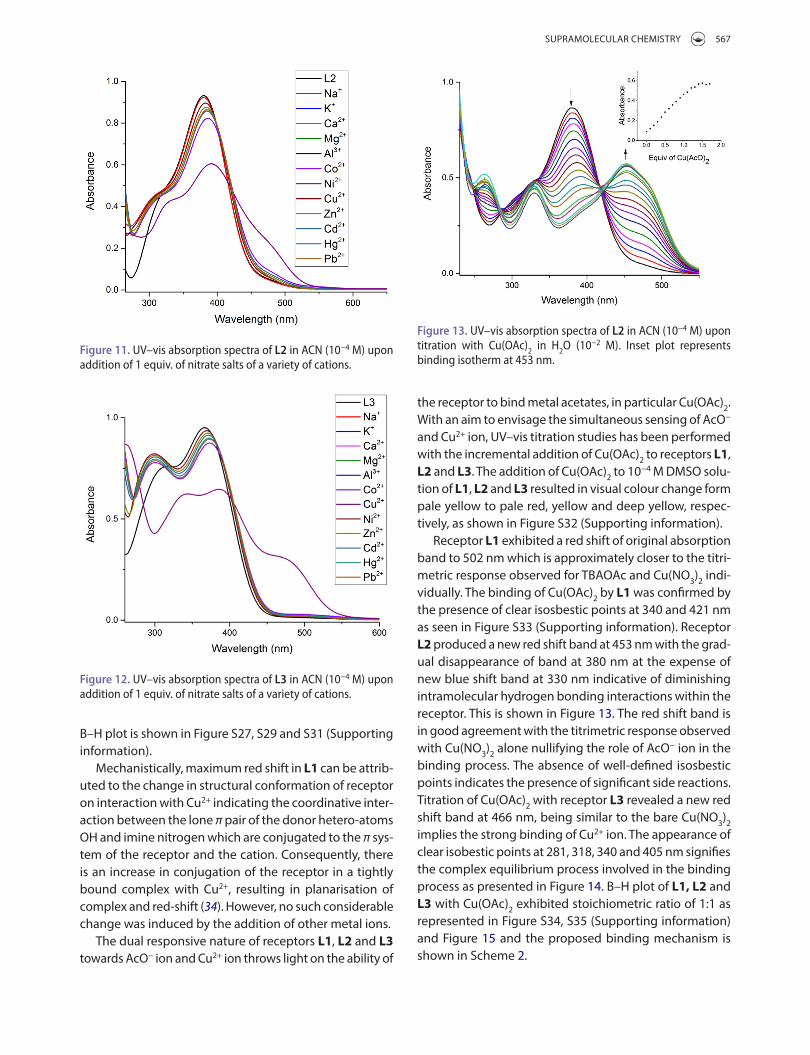
The presence of hetero atoms in the receptors L1, L2 and L3 has been the driving force to check the cation sens-ing ability. Upon addition of 1 eq. of nitrate salt of cations (Na+, K+,Ca2+,Mg2+, Al3+, Co2+,Ni2+, Cu2+, Zn2+, Cd2+, Hg2+ and Pb2+) to L1, L2 and L3, significant colour change was observed in the presence of Cu2+ ion. The colour change is shown in Figure S23, S24 and S25 (Supporting infor-mation). In naked-eye inspection, the receptor L1 turns from pale yellow to pale orange on addition of 1 eq. of Cu2+ ion. L2 and L3 exhibited a colour change from pale yellow to orange-yellow on addition of 1 eq. of Cu2+ ion. In contrast, no significant changes were witnessed upon addition of other cations. In order to confirm the observed colour changes, UV–vis spectra have been recorded with the addition of 1 eq. of cations to 2 ml of ACN solution of receptors L1, L2 and L3. The UV–vis spectra are repre-sented in Figures 10–12.
The photophysical properties of L1, L2 and L3 have been studied to confirm the binding process. The red shift of band to 490, 477 and 467 nm indicates complexation
Figure 7. colour change of L1 in acetonitrile (10−4 m) before and after addition of 1 equiv. of NaF and Naoac.
Figure 8. colour change of L2 in acetonitrile (10−4 m) before and after addition of 1 equiv. of NaF and Naoac.
Figure 9. colour change of L3 in acetonitrile (10−4 m) before and after addition of 1 equiv. of NaF and Naoac.
Figure 10. uV–vis absorption spectra of L1 in acN (10−4 m) upon addition of 1 equiv. of nitrate salts of a variety of cations.
SUPRAMOLECULAR CHEMISTRY 567
the receptor to bind metal acetates, in particular Cu(OAc)2. With an aim to envisage the simultaneous sensing of AcO− and Cu2+ ion, UV–vis titration studies has been performed with the incremental addition of Cu(OAc)2 to receptors L1, L2 and L3. The addition of Cu(OAc)2 to 10−4 M DMSO solu-tion of L1, L2 and L3 resulted in visual colour change form pale yellow to pale red, yellow and deep yellow, respec-tively, as shown in Figure S32 (Supporting information).
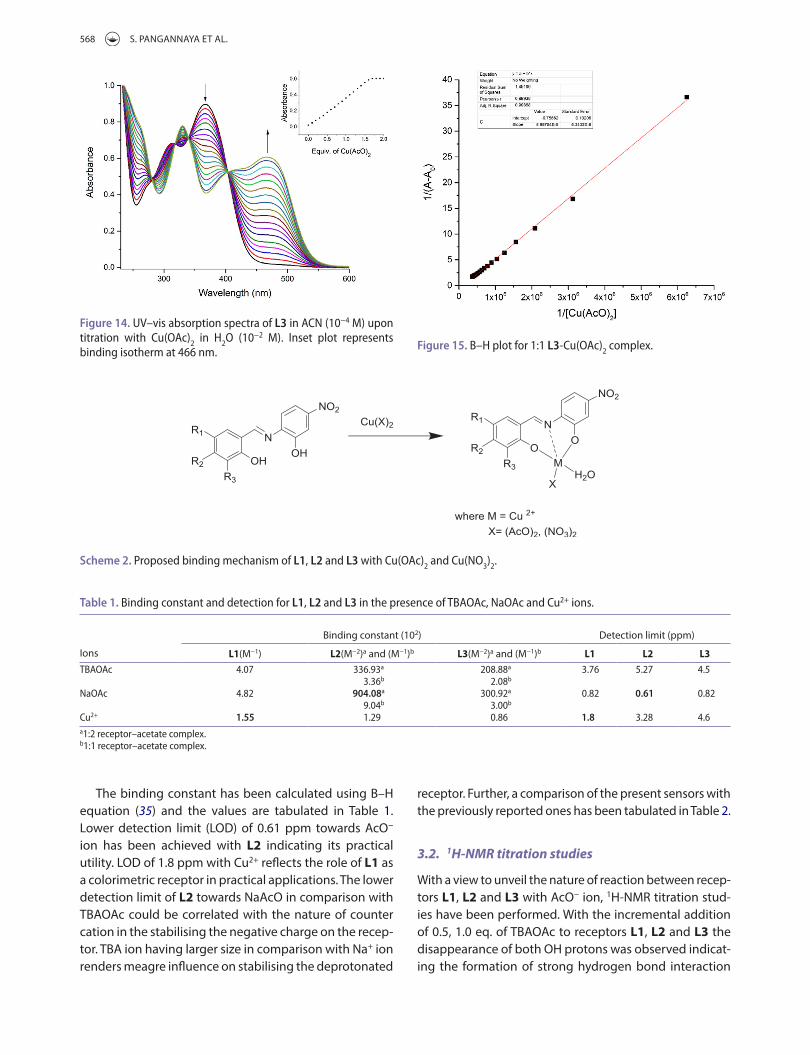
Receptor L1 exhibited a red shift of original absorption band to 502 nm which is approximately closer to the titri-metric response observed for TBAOAc and Cu(NO3)2 indi-vidually. The binding of Cu(OAc)2 by L1 was confirmed by the presence of clear isosbestic points at 340 and 421 nm as seen in Figure S33 (Supporting information). Receptor L2 produced a new red shift band at 453 nm with the grad-ual disappearance of band at 380 nm at the expense of new blue shift band at 330 nm indicative of diminishing intramolecular hydrogen bonding interactions within the receptor. This is shown in Figure 13. The red shift band is in good agreement with the titrimetric response observed with Cu(NO3)2 alone nullifying the role of AcO− ion in the binding process. The absence of well-defined isosbestic points indicates the presence of significant side reactions. Titration of Cu(OAc)2 with receptor L3 revealed a new red shift band at 466 nm, being similar to the bare Cu(NO3)2 implies the strong binding of Cu2+ ion. The appearance of clear isobestic points at 281, 318, 340 and 405 nm signifies the complex equilibrium process involved in the binding process as presented in Figure 14. B–H plot of L1, L2 and L3 with Cu(OAc)2 exhibited stoichiometric ratio of 1:1 as represented in Figure S34, S35 (Supporting information) and Figure 15 and the proposed binding mechanism is shown in Scheme 2.
B–H plot is shown in Figure S27, S29 and S31 (Supporting information).
Mechanistically, maximum red shift in L1 can be attrib-uted to the change in structural conformation of receptor on interaction with Cu2+ indicating the coordinative inter-action between the lone π pair of the donor hetero-atoms OH and imine nitrogen which are conjugated to the π sys-tem of the receptor and the cation. Consequently, there is an increase in conjugation of the receptor in a tightly bound complex with Cu2+, resulting in planarisation of complex and red-shift (34). However, no such considerable change was induced by the addition of other metal ions.
The dual responsive nature of receptors L1, L2 and L3 towards AcO− ion and Cu2+ ion throws light on the ability of
Figure 11. uV–vis absorption spectra of L2 in acN (10−4 m) upon addition of 1 equiv. of nitrate salts of a variety of cations.
Figure 12. uV–vis absorption spectra of L3 in acN (10−4 m) upon addition of 1 equiv. of nitrate salts of a variety of cations.
Figure 13. uV–vis absorption spectra of L2 in acN (10−4 m) upon titration with cu(oac)2 in h2o (10−2 m). inset plot represents binding isotherm at 453 nm.
568 S. PANGANNAYA ET AL.
receptor. Further, a comparison of the present sensors with the previously reported ones has been tabulated in Table 2.
3.2. 1H-NMR titration studies
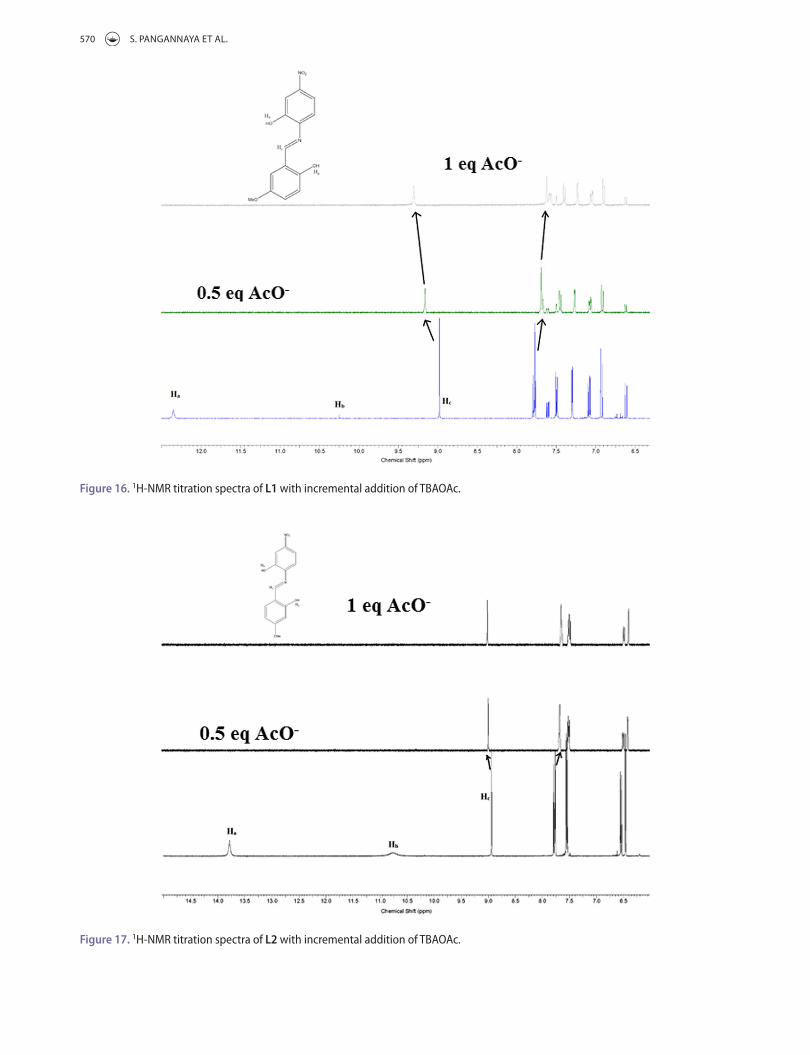
With a view to unveil the nature of reaction between recep-tors L1, L2 and L3 with AcO− ion, 1H-NMR titration stud-ies have been performed. With the incremental addition of 0.5, 1.0 eq. of TBAOAc to receptors L1, L2 and L3 the disappearance of both OH protons was observed indicat-ing the formation of strong hydrogen bond interaction
The binding constant has been calculated using B–H equation (35) and the values are tabulated in Table 1. Lower detection limit (LOD) of 0.61 ppm towards AcO− ion has been achieved with L2 indicating its practical utility. LOD of 1.8 ppm with Cu2+ reflects the role of L1 as a colorimetric receptor in practical applications. The lower detection limit of L2 towards NaAcO in comparison with TBAOAc could be correlated with the nature of counter cation in the stabilising the negative charge on the recep-tor. TBA ion having larger size in comparison with Na+ ion renders meagre influence on stabilising the deprotonated
Figure 15. B–h plot for 1:1 L3-cu(oac)2 complex.
Figure 14. uV–vis absorption spectra of L3 in acN (10−4 m) upon titration with cu(oac)2 in h2o (10−2 m). inset plot represents binding isotherm at 466 nm.
Scheme 2. proposed binding mechanism of L1, L2 and L3 with cu(oac)2 and cu(No3)2.
Table 1. Binding constant and detection for L1, L2 and L3 in the presence of tBaoac, Naoac and cu2+ ions.
a1:2 receptor–acetate complex.b1:1 receptor–acetate complex.
Ions
Binding constant (102) Detection limit (ppm)
L1(M−1) L2(M−2)a and (M−1)b L3(M−2)a and (M−1)b L1 L2 L3tBaoac 4.07 336.93a 208.88a 3.76 5.27 4.5
3.36b 2.08b
Naoac 4.82 904.08a 300.92a 0.82 0.61 0.829.04b 3.00b
cu2+ 1.55 1.29 0.86 1.8 3.28 4.6
SUPRAMOLECULAR CHEMISTRY 569
mechanism has been proposed based on the above con-siderations and represented in Scheme 3.
The various possibilities involved in the intramolecular hydrogen bond interactions (42) in L1, L2 and L3 is pro-vided in Scheme S4 (Supporting information). The binding mechanism has been proposed based on the UV–vis titra-tion and 1H-NMR titration studies. L1 exhibits hydrogen bonding interaction with AcO− ion through –OH func-tionalities followed by single step deprotonation process
between AcO− and receptor (34, 40). The aromatic proton signals underwent an upfield shift indicating the presence of through-bond effect which tends to increase the elec-tron density on the aromatic ring. Correspondingly, L1, L2 and L3 exhibited a distinct downfield shift for imine proton from δ 8.96, 8.94, 9.04 to 9.3 ppm, representing the through-space interactions which polarise the C–H bonds in proximity of OH- AcO− complex (41). The titration profile for L1, L2 and L3 is provided in Figures 16–18. The binding
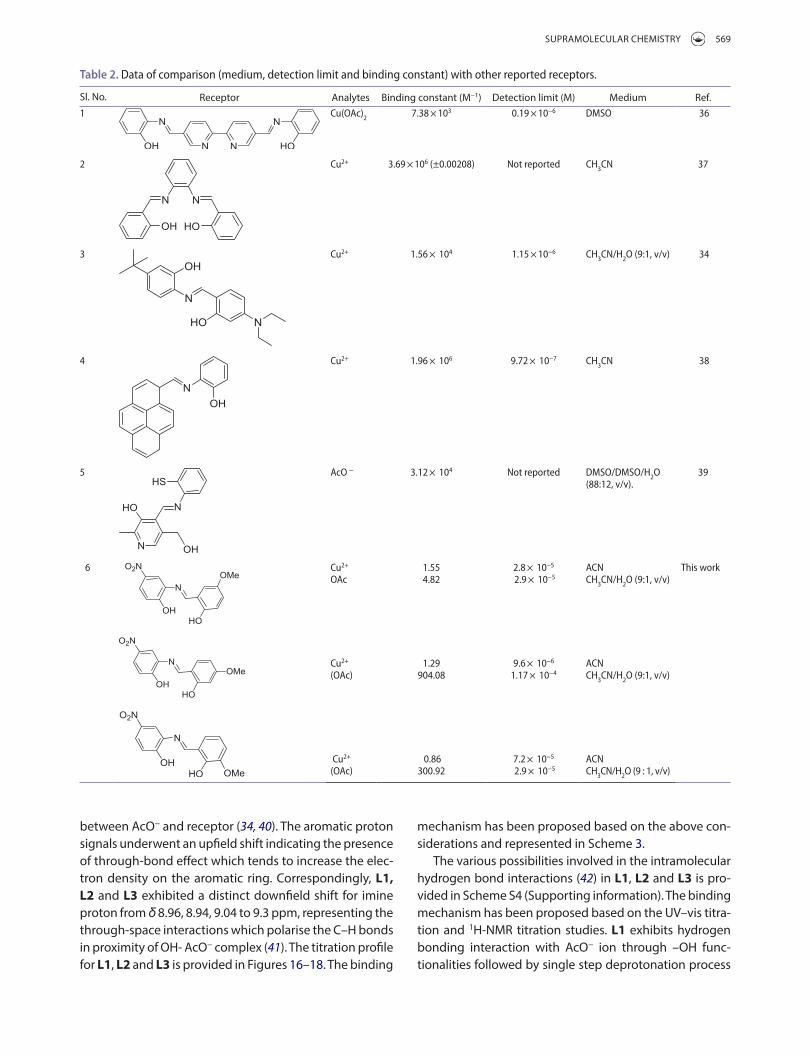
Table 2. Data of comparison (medium, detection limit and binding constant) with other reported receptors.
Sl. No. Receptor Analytes Binding constant (M−1) Detection limit (M) Medium Ref.1 cu(oac)2 7.38 × 10³ 0.19 × 10⁻⁶ DmSo 36
2 cu2+ 3.69 × 10⁶ (±0.00208) Not reported ch3cN 37
3 cu2+ 1.56 × 10⁴ 1.15 × 10⁻⁶ ch3cN/h2o (9:1, v/v) 34
4 cu2+ 1.96 × 10⁶ 9.72 × 10⁻⁷ ch3cN 38
5 aco ‒ 3.12 × 10⁴ Not reported DmSo/DmSo/h2o (88:12, v/v).
39
6 cu2+
oac
cu2+ (oac)
cu2+ (oac)
1.55 4.82
1.29 904.08
0.86 300.92
2.8 × 10⁻⁵
2.9 × 10⁻⁵
9.6 × 10⁻⁶
1.17 × 10⁻⁴
7.2 × 10⁻⁵
2.9 × 10⁻⁵
acN ch3cN/h2o (9:1, v/v)
acN ch3cN/h2o (9:1, v/v)
acN ch3cN/h2o (9 : 1, v/v)
this work
570 S. PANGANNAYA ET AL.
Figure 16. 1h-Nmr titration spectra of L1 with incremental addition of tBaoac.
Figure 17. 1h-Nmr titration spectra of L2 with incremental addition of tBaoac.

SUPRAMOLECULAR CHEMISTRY 571
Figure 18. 1h-Nmr titration spectra of L3 with incremental addition of tBaoac.
Scheme 3. proposed binding mechanism of receptors L1, L2 and L3 with aco – ion.

572 S. PANGANNAYA ET AL.
response of absorbance at 477 and 518 nm. It is clear from the truth table that output 2 gives a value 1 upon binding of AcO− ion alone. INHIBIT response of the gate could be realised with addition of Cu(OAc)2 ion to receptor L2 and L3. The observed output value of 1 corresponds to the wavelength shift of receptor L2 and L3 to 477 and 467 nm found in the presence of Cu(NO3)2. The output value 0 sig-nifies the absence of AcO− ion in the signalling process.
Conclusions
In conclusion, we have presented a series of simple col-orimetric receptors L1, L2 and L3 synthesised by Schiff base condensation reaction and characterised by stand-ard spectroscopic techniques. UV–vis and 1H-NMR titration studies confirm the hydrogen bond interaction between phenolic proton and acetate ion which is mirrored in the higher binding constant of the order 9.04 × 10⁴ M−2 for NaOAc and 1.55 x 10² M−1 for Cu2+ ion. Selectivity of L1 for Cu2+ ion and L2 for AcO− ions with spectroscopic detection
forming CH3COOH. L2 and L3 undergo two step deproto-nation process yielding [(CH3COO)2H2]+ species confirming the binding ratio of 1:2 for L2 / L3: AcO− ion complex.
3.3. Logic gate applications
There is substantial interest in emerging molecular systems that imitates the behaviour of digital logic gates (43–46). The introduction of different inputs and their rule as logic gates is represented in the form of truth table. Receptor L1, L2 and L3 was explored for the design and construc-tion of Boolean logic gates by the introduction of Cu2+ and AcO− ionic inputs. These inputs and the corresponding optical outputs were coded with binary digits (01), which represents the ‘on’ and ‘off’ states. The ionic inputs for Cu2+ and AcO− in the truth table were regarded as ‘0’ when they are absent and ‘1’ if they are present. Receptor L1 exhibited a system response as that of a two input OR gate, while that of L2 and L3 exhibited an INHIBIT logic gate response.
Absorbance value at 496 nm regarded as the output signal upon the action of the Cu2+ and AcO− ionic input. Receptor L1 mimics the function of an OR gate which is one of the basic logic gates that implement logical disjunction. The truth table of Cu2+ and AcO− ionic interaction with the L1 clearly demonstrate the OR logical behaviour as given in Table 3. It is seen that the output of this molecular gate shoots to logic high state 1, if any of the input is 1. (Figure 19)
The inhibit gate consisting of integration of two NOR gate is important because of its non-commutative behav-iour wherein the output signal is inhibited by one powerful input. In the present study, Cu2+ mainly decides the state of the signal output. Realisation of INHIBIT logical behaviour of receptor L2 and L3 for Cu2+ and AcO− ions is as given in the truth table (Tables 4 and 5). The circuit is realised with two 2 input NOR gate wherein one of the input of NOR gate is set to 0 as shown in the circuit diagram Figures 20 and 21. L2 and L3 take in two inputs and exhibits two different
Table 3. truth table of cu2+ and aco− ionic interaction with the L1.
Input Input Output
Cu2+ AcO− 496 nm0 0 00 1 11 0 11 1 1
Table 4. truth table of cu2+ and aco− ionic interaction with the L2.
Input Input Output Output
Cu2+ AcO− 477 nm 518 nm0 0 0 00 1 0 11 0 1 01 1 1 0
Figure 19. representation of or logic gate for receptor L1.
Figure 20. representation of iNhiBit logic gate for receptor L2.
Figure 21. representation of iNhiBit logic gate for receptor L3.
Table 5. truth table of cu2+ and aco− ionic interaction with the L3.
Input Input Output Output
Cu2+ AcO− 467 nm 520 nm0 0 0 00 1 0 11 0 1 01 1 1 0
SUPRAMOLECULAR CHEMISTRY 573
(10) Hsieh, Y.C.; Chir, J.L.; Wu, H.H.; Chang, P.S.; Wu, A.T. Carbohydr. Res 2009, 344, 2236.
(11) Wang, X.; Zhao, J.; Guo, C.; Pei, M.; Zhang, G. Sensor Actuat B- Chem 2014, 193, 157.
(12) Ye, H.; Ge, F.; Chen, X.C.; Li, Y.; Zhang, H.; Zhao, B.X.; Miao, J.Y. Sensor Actuat B-Chem 2013, 182, 273.
(13) Huang, J.; Ma, X.; Liu, B.; Cai, L.; Li, Q.; Zhang, Y.; Jiang, K.; Yin, S. J. Lumin 2013, 141, 130.
(14) Yin, S.; Leen, V.; Snick, S.V.; Boens, N.; Dehaen, W. Chem. Commun 2010, 46, 6329–6331.
(15) (a) Custelcean, R.; Moyer, B.A.; Hay, B.P. Chem. Commun. 2005, 5971; (b) Hay, B.P.; Firman, T.K.; Moyer, B.A. J. Am. Chem. Soc. 2005, 1810, 127.
(16) Busschaert, N.; Wenzel, M.; Light, M.E.; Iglesias-Hernandez, P.; Perez-Tomas, R.; Gale, P.A. J. Am. Chem. Soc. 2011, 133, 14136.
(17) Custelcean, R.; Bosano, J.; Bonnesen, P.V.; Kertesz, V.; Hay, B.P. Angew. Chem., Int. Ed. 2009, 48, 4025.
(18) Ravikumar, I.; Lakshminarayanan, P.S.; Arunachalam, M.; Suresh, E.; Ghosh, P. Dalton Trans. 2009, 4160.
(19) Dey, S.K.; Das, G. Dalton Trans. 2011, 40, 12048.(20) dos Santos, C.M.G.; Boyle, E.M.; De Solis, S.; Kruger, P.E.;
Gunnlaugsson, T. Chem. Commun. 2011, 12176.(21) Stanley, C.E.; Clarke, N.; Anderson, K.M.; Elder, J.A.; Lenthall,
J.T.; Steed, J.W. Chem. Commun. 2006, 3199.(22) Basaran, I.; Wang, X.; Alamgir, A.; Wang, J.; Haque, S.A.;
Zhang, Y.; Powell, D.R.; Leszczynski, J.; Hossain, MdA Tetrahedron Lett. 2015, 56, 657–661.
(23) Sharma, D.; Mistry, A.R.; Bera, R.K.; Sahoo, S.K. Supramol. Chem. 25 (4), 2013, 212-220
(24) Sharma, D.; Bera, R.K.; Sahoo, S.K. Spectrochim. Acta Part A: Mol. Biomol. Spectrosc. 2013, 105, 477–482.
(25) Sharma, D.; Moirangthem, A.; Roy, S.M.; Kumar, A.S.K.; Nandre, J.P.; Patil, U.D.; J. Photochem. Photobio. B 148, 2015, 37-42
(26) Raymo, F.M. Adv. Mater. 2002, 14, 401–414.(27) Balzani, V.; Credi, A.; Venturi, M. ChemPhysChem 2003, 4,
49–59.(28) Callan, J.F.; de Silva, A.P.; Magri, D.C. Tetrahedron. 2005, 61,
8551–8588.(29) Saghatelian, A.; Völcker, N.H.; Guckian, K.M.; Lin, V.S.-Y.;
Ghadiri, M.R. J. Am. Chem. Soc. 2003, 125, 346–347.(30) Lin, J.-H.; Tseng, W.-L. Analyst. 2014, 139, 1436–1441.(31) Margulies, D.; Melman, G.; Shanzer, A. J. Am. Chem. Soc.
2006, 128, 4865–4871.(32) Gabr, A.A. Spectrochim. Acta A 1990, 46, 1751–1757.(33) Thiampanya, P.; Muangsin, N.; Pulpoka, B. Org. Lett. 2012,
14 (16), 4050–4053.(34) Yadav, U.N.; Pant, P.; Sahoo, S.K.; Shankarling, G.S. RSC Adv.
2014, 4, 42647–42653.(35) Benesi, H.; Hildebrand, H. J. Am. Chem. Soc. 1948, 71, 2703–
2707.(36) Suganya, S.; Zob, H.J.; Park, J.S.; Velmathi, S. J. Mol. Recognit.
2014, 27, 689–695.(37) Udhayakumari, D.; Saravanamoorthy, S.; Velmathi, S.
Materials Science and Engineering: C 2012, 32 (7), 1878–1882.
(38) Shellaiah,M.; Wu, Y.-H.; Singh,A.; Ramakrishnam Raju , M.V.; Lin,H.-C. J. Mater. Chem. A, 2013, 1, 1310–1318.
(39) Sharma, D.; Ashok Kumar, S.K.; Sahoo, S. K. Tetrahedron Letts 2014, 55, 927–930.
(40) Farinha, A.S.F.; Tomé, A.C.; Cavaleiro, J.A.S. Tetrahedron 2010, 66, 7595–7599.
limit of 1.81 and 0.61 ppm, respectively, implies the practi-cal utility of receptors. The receptors L1, L2 and L3 prove their efficacy in the detection of AcO− and Cu2+ ions signi-fying their role as dual sensor. Binding studies performed with Cu(OAc)2 reflects the utility of receptor L1 as ‘OR’ gate, L2 and L3 as ‘INHIBIT’ molecular logic gates.
Acknowledgements
Authors express their gratitude to the Director and the HOD (Department of Chemistry) NITK Surathkal for the providing the research infrastructure. DRT thanks DST (SB/FT/CS-137/2012) for the financial support of this work. SP is thankful to NITK for the Research fellowship. We thank IITM, Chennai and MIT Mani-pal for the mass and NMR analysis.
Disclosure statement
No potential conflict of interest was reported by the authors.
Funding
This work was supported by Science and Engineering Research Board [SB/FT/CS-137/2012].
Supplemental Material
The underlying research materials for this articles can be accessed at http://dx.doi.org/10.1080/10610278.2017.1298764.
References
(1) Suganya, S.; Zo, H.J.; Park, J.S.; Velmathi, S. Ind. Eng. Chem. Res. 2014, 53, 9561–9569.
(2) Schneider, H.J.; Yatsimirsky A.K. Chem. Soc. Rev. 2008, 37, 263–277.
(3) (a) Schmidtchen, F.P.; Berger, M. Chem. Rev. 1997, 97, 1609–1646; (b) Mànez, R.M; Sacenón, F. Chem. Rev. 2003, 103, 4419–4476; (c) Gunnlaugsson, T.; Glynn, M.; Tocci, G.M.; Kruger, P.E.; Pfeffer, F.M. Coord. Chem. Rev. 2006, 250, 3094–3117; (d) Suksai, C.; Tuntulani, T. Chem. Soc. Rev. 2003, 32, 192–202; (e) Gunnlaugsson, T.; Davis, A.P.; O’Brien, J.E.; Glynn, M. Org. Lett. 2002, 4, 2449–2452.
(4) Kumari, N.; Dey, N.; Bhattacharya, S. RSC Adv. 2014, 4, 4230–4238.
(5) Patil, S.R.; Nandre, J.P.; Jadhav, D.; Bothra, S.; Sahoo, S.K.; Devi, M.; Pradeep, C.P.; Mahulikar, P.P.; Patil, U.D. Dalton Trans. 2014, 43, 13299–13306.
(6) Deraeve, C.; Boldron, C.; Maraval, A.; Mazarguil, H.; Gornitzka, H.; Vendier, L.; Pitié, M.; Meunier, B.; Chem.–Eur. J. 2008, 14, 682–696.
(7) Sha, J.; Tong, C.; Zhang, H.; Feng, L.; Liu, B.; Lü, C. Dyes Pigm. 2015, 113, 102–109.
(8) Yang, L.; Song, Q.; Damit-Og, K.; Cao, H. Sens. Actuators B 2013, 176 (181), 185.
(9) He, X.; Zhang, J.; Liu, X.; Dong, L.; Li, D.; Qiu, H.; Yin, S. Sensor Actuat B-Chem 2014, 192, 29.

574 S. PANGANNAYA ET AL.
(45) (a) Kaur, N.; Alreja, P. Tetrahedron Lett. 2015, 56, 182–186; (b) Szacilowski,K.; Infochemistry. Wiley: Chichester, 2012; (c) de Silva, A.P. Royal Society of Chemistry. Cambridge, 2013; (d) de Silva,A.P.; McClenaghan, N.D. Chem.–Eur. J. 2002, 8, 4935–4945; (e) Rurack, K.; Trieflinger, C.; Koval’chuck, J.; Daub, J. . J Chem. Eur. J. 2007, 13, 8998–9003.
(46) Wang, L.; Li, B.; Zhang, L.; Luo, Y. Dalton Trans. 2013, 42, 459–465.
(41) Boiocchi, M.; Del Boca, L.; Gómez, D.E.; Fabbrizzi, L.; Licchelli, M.; Monzani, E. J. Am. Chem. Soc. 2004, 126, 16507–16514.
(42) Makal, A.; Schilf, W.; Bohdan Kamie′nski, B.; Anna Szady- Chelmieniecka, A.; Eugeniusz Grech, E.; Wo′zniak, K. Dalton Trans. 2011, 40, 421.
(43) (a) Kuwar, A.; Patil, R.; Singh, A.; Sahoo, S.K.; Marek, J.; Singh, N. J. Mater. Chem. C 2015, 3, 453–460. (b) Margulies, D.; Felder, C.E.; Melman, G.; Shanzer, A. J. Am. Chem. Soc. 2007, 129, 347–354.
(44) Magri, D.C.; Brown, G.J.; McClean, G.D.; de Silva, A.P. J. Am. Chem. Soc. 2006, 128, 4950–4951.
Related Documents


