Citation: Alvarez-Bustos, D.; Sanchez-Minero, F.; Santes, V.; Romero-Ibarra, I.C.; de los Reyes Heredia, J.A.; Rios-Escobedo, R.; Tzompantzi-Morales, F.; Santolalla-Vargas, C.E. Synthesis and Evaluation of FeSX/TiO 2 for the Photocatalytic Degradation of Phenol under Visible-Light Region. Catalysts 2022, 12, 457. https://doi.org/ 10.3390/catal12050457 Academic Editors: Hugo de Lasa and Salvador Escobedo Received: 27 February 2022 Accepted: 11 April 2022 Published: 20 April 2022 Publisher’s Note: MDPI stays neutral with regard to jurisdictional claims in published maps and institutional affil- iations. Copyright: © 2022 by the authors. Licensee MDPI, Basel, Switzerland. This article is an open access article distributed under the terms and conditions of the Creative Commons Attribution (CC BY) license (https:// creativecommons.org/licenses/by/ 4.0/). catalysts Article Synthesis and Evaluation of FeSX/TiO 2 for the Photocatalytic Degradation of Phenol under Visible-Light Region Diego Alvarez-Bustos 1 , Felipe Sanchez-Minero 1 , Victor Santes 2 , Issis Claudette Romero-Ibarra 3 , José Antonio de los Reyes Heredia 4 , Reyna Rios-Escobedo 5 , Francisco Tzompantzi-Morales 5 and Carlos Eduardo Santolalla-Vargas 2, * 1 Departamento de Ingeniería Química Petrolera, Instituto Politécnico Nacional, Zacatenco, Ciudad de Mexico C.P. 07738, Mexico; [email protected] (D.A.-B.); [email protected] (F.S.-M.) 2 Departamento de Biociencias e Ingeniería, Centro Interdisciplinario de Investigaciones y Estudios sobre el Medio Ambiente y Desarrollo (CIIEMAD), Instituto Politécnico Nacional, Ciudad de Mexico C.P. 07340, Mexico; [email protected] 3 Unidad Profesional Interdisciplinaria en Ingeniería y Tecnologías Avanzadas—Instituto Politécnico Nacional, Av. IPN No. 2580, Gustavo A. Madero, Ciudad de Mexico C.P. 07340, Mexico; [email protected] 4 División de Ciencias Básicas e Ingeniería, Universidad Autónoma Metropolitana-Iztapalapa, Av. San Rafael Atlixco 186, Col. Vicentina, Ciudad de Mexico C.P. 09340, Mexico; [email protected] 5 Departamento de Ingeniería Química, Área de Catálisis, Universidad Autónoma Metropolitana-Iztapalapa, Av. San Rafael Atlixco 189, Col. Vicentina, Ciudad de Mexico C.P. 09340, Mexico; [email protected] (R.R.-E.); [email protected] (F.T.-M.) * Correspondence: [email protected] Abstract: In the present work, phenol was used as a model molecule to the photocatalytic evaluation of TiO 2 impregnated with iron sulphide and chlorine on a visible-light reactor. The iron–chlorine catalyst was prepared by incipient impregnation with the metal precursors, Fe (NO 3 ) 3 and NaCl on previously calcined TiO 2 . The catalyst was sulphurized with H2S at 300 ◦ C for 1 h. The cata- lysts were prepared at different chlorine concentrations using HYDRA chemical equilibrium dia- grams to obtain different fractions of FeCl + . The oxide catalysts were characterized with diffuse reflectance (DRS UV–Vis) and temperature programmed reduction analysis (TPR). Sulphurized cat- alysts were characterized with Raman spectrometry and X-ray photoelectron spectrometry (XPS). The FeS–2Cl/TiO 2 catalyst presented 8.35 times higher photodegradation than TiO 2 and 6.4 times higher compared to the FeS–0.25Cl/TiO 2 catalyst. DRS and XPS showed similar results of band gap, proving that the catalyst remain stable after sulphurisation. The TPR results of FeS–2Cl/TiO 2 showed an increment of 86.29% in Fe 2+ /Fe 3+ compared to FeS–0.25Cl/TiO 2 . XPS and Raman results for oxide and sulphated iron species relation suggested that FeS–2Cl/TiO 2 decreased 4.45% compared to FeS–0.25Cl/TiO 2 catalyst. XPS semiquantitative for S/Fe results showed that the FeS–2Cl/TiO 2 catalyst increased 73.17% in comparison to FeS–0.25Cl/TiO 2 . These results suggested the increment of sulphurisation degree for FeS–2Cl/TiO 2 . In this regard, the catalyst characterization results showed that the presence of FeCl + (0.85 fractions) in solution before impregnation promoted the active sulphide species maintaining the band gap and improved the degradation of phenol on visible light. Keywords: degradation; photocatalysis; phenol; impregnation 1. Introduction In industrial wastewater, the main parameters treatment are high loads of dissolved organic compounds. These pollutants are difficult to remove with the processes commonly used to treat domestic wastewater [1,2]. The Political Constitution of the United States of Mexico confers inalienable rights of ownership over all national waters to the nation [3], pro- viding the foundation for water protection and management laws for hydraulic resources to be exploited [3]. The current legal framework governing water pollution control is set forth in two laws: the General Law of Ecological Balance and Environmental Protection, Catalysts 2022, 12, 457. https://doi.org/10.3390/catal12050457 https://www.mdpi.com/journal/catalysts

Welcome message from author
This document is posted to help you gain knowledge. Please leave a comment to let me know what you think about it! Share it to your friends and learn new things together.
Transcript

Citation: Alvarez-Bustos, D.;
Sanchez-Minero, F.; Santes, V.;
Romero-Ibarra, I.C.; de los Reyes
Heredia, J.A.; Rios-Escobedo, R.;
Tzompantzi-Morales, F.;
Santolalla-Vargas, C.E. Synthesis and
Evaluation of FeSX/TiO2 for the
Photocatalytic Degradation of Phenol
under Visible-Light Region. Catalysts
2022, 12, 457. https://doi.org/
10.3390/catal12050457
Academic Editors: Hugo de Lasa
and Salvador Escobedo
Received: 27 February 2022
Accepted: 11 April 2022
Published: 20 April 2022
Publisher’s Note: MDPI stays neutral
with regard to jurisdictional claims in
published maps and institutional affil-
iations.
Copyright: © 2022 by the authors.
Licensee MDPI, Basel, Switzerland.
This article is an open access article
distributed under the terms and
conditions of the Creative Commons
Attribution (CC BY) license (https://
creativecommons.org/licenses/by/
4.0/).
catalysts
Article
Synthesis and Evaluation of FeSX/TiO2 for the PhotocatalyticDegradation of Phenol under Visible-Light RegionDiego Alvarez-Bustos 1 , Felipe Sanchez-Minero 1, Victor Santes 2 , Issis Claudette Romero-Ibarra 3,José Antonio de los Reyes Heredia 4, Reyna Rios-Escobedo 5 , Francisco Tzompantzi-Morales 5
and Carlos Eduardo Santolalla-Vargas 2,*
1 Departamento de Ingeniería Química Petrolera, Instituto Politécnico Nacional, Zacatenco,Ciudad de Mexico C.P. 07738, Mexico; [email protected] (D.A.-B.); [email protected] (F.S.-M.)
2 Departamento de Biociencias e Ingeniería, Centro Interdisciplinario de Investigaciones y Estudios sobre elMedio Ambiente y Desarrollo (CIIEMAD), Instituto Politécnico Nacional,Ciudad de Mexico C.P. 07340, Mexico; [email protected]
3 Unidad Profesional Interdisciplinaria en Ingeniería y Tecnologías Avanzadas—Instituto Politécnico Nacional,Av. IPN No. 2580, Gustavo A. Madero, Ciudad de Mexico C.P. 07340, Mexico; [email protected]
4 División de Ciencias Básicas e Ingeniería, Universidad Autónoma Metropolitana-Iztapalapa, Av. San RafaelAtlixco 186, Col. Vicentina, Ciudad de Mexico C.P. 09340, Mexico; [email protected]
5 Departamento de Ingeniería Química, Área de Catálisis, Universidad Autónoma Metropolitana-Iztapalapa,Av. San Rafael Atlixco 189, Col. Vicentina, Ciudad de Mexico C.P. 09340, Mexico;[email protected] (R.R.-E.); [email protected] (F.T.-M.)
* Correspondence: [email protected]
Abstract: In the present work, phenol was used as a model molecule to the photocatalytic evaluationof TiO2 impregnated with iron sulphide and chlorine on a visible-light reactor. The iron–chlorinecatalyst was prepared by incipient impregnation with the metal precursors, Fe (NO3)3 and NaClon previously calcined TiO2. The catalyst was sulphurized with H2S at 300 ◦C for 1 h. The cata-lysts were prepared at different chlorine concentrations using HYDRA chemical equilibrium dia-grams to obtain different fractions of FeCl+. The oxide catalysts were characterized with diffusereflectance (DRS UV–Vis) and temperature programmed reduction analysis (TPR). Sulphurized cat-alysts were characterized with Raman spectrometry and X-ray photoelectron spectrometry (XPS).The FeS–2Cl/TiO2 catalyst presented 8.35 times higher photodegradation than TiO2 and 6.4 timeshigher compared to the FeS–0.25Cl/TiO2 catalyst. DRS and XPS showed similar results of band gap,proving that the catalyst remain stable after sulphurisation. The TPR results of FeS–2Cl/TiO2 showedan increment of 86.29% in Fe2+/Fe3+ compared to FeS–0.25Cl/TiO2. XPS and Raman results foroxide and sulphated iron species relation suggested that FeS–2Cl/TiO2 decreased 4.45% comparedto FeS–0.25Cl/TiO2 catalyst. XPS semiquantitative for S/Fe results showed that the FeS–2Cl/TiO2
catalyst increased 73.17% in comparison to FeS–0.25Cl/TiO2. These results suggested the increment ofsulphurisation degree for FeS–2Cl/TiO2. In this regard, the catalyst characterization results showedthat the presence of FeCl+ (0.85 fractions) in solution before impregnation promoted the activesulphide species maintaining the band gap and improved the degradation of phenol on visible light.
Keywords: degradation; photocatalysis; phenol; impregnation
1. Introduction
In industrial wastewater, the main parameters treatment are high loads of dissolvedorganic compounds. These pollutants are difficult to remove with the processes commonlyused to treat domestic wastewater [1,2]. The Political Constitution of the United States ofMexico confers inalienable rights of ownership over all national waters to the nation [3], pro-viding the foundation for water protection and management laws for hydraulic resourcesto be exploited [3]. The current legal framework governing water pollution control is setforth in two laws: the General Law of Ecological Balance and Environmental Protection,
Catalysts 2022, 12, 457. https://doi.org/10.3390/catal12050457 https://www.mdpi.com/journal/catalysts

Catalysts 2022, 12, 457 2 of 22
which establishes general criteria pertaining to water pollution prevention and control; andthe National Waters Law, which provides a comprehensive legal regime that supports thebroader provisions set out in the Ecology Law [3].
Phenolic compounds exist in water bodies due to the discharge of polluted wastewaterfrom industrial, agricultural, and domestic activities into water bodies [4]. These com-pounds are known for being toxic and inflict severe and long-lasting effects on humans andanimals, acting as carcinogens and causing damage to the red blood cells and the liver evenin low concentrations [4]. The interaction of phenolic compounds with organic materialin water can produce substituted compounds or other moieties, which may be as toxicas the original phenolic compounds [4]. Specific emphasis is placed on the techniquesof their removal from water with attention paid to conventional and advanced methods.Among these methods are ozonation, adsorption, extraction, photocatalytic degradation, bi-ological, electro-Fenton, adsorption and ion exchange and membrane-based separation [4].In this regard, emerging technologies are based on efficiently degrading the dissolvedsolids present in wastewater, some of the most used technologies are advanced oxidationprocesses (AOP).
AOP is a highly effective novel method speeding up the oxidation process. AOPcan combine with ozone (O3), catalyst, or ultraviolet (UV) irradiation to offer a powerfultreatment of wastewater [5]. Several AOP’s such as O3, O3/H2O2, UV, UV/O3, UV/H2O2,O3/UV/H2O2, Fe2+/H2O2 and photocatalysis processes had been investigated for theoxidation of phenol in an aqueous medium [6]. Among all, the Fenton process showedthe fastest removal rate for phenol in wastewater; the lower costs were observed forozonation, and single ozonation provides the best results for phenol degradation in ozonecombinations [5].
One of the techniques that has gained a lot of attention due to its potential for scale-upis heterogeneous photocatalysis [7]; this technique consists of a semiconductor material,which is irradiated with photons of appropriate energy, undergoing excitation of theelectrons located in its valence band to its conduction band [8]. This allows for the for-mation of a redox couple that interacts with the adsorbed species and can lead to theoxidation of pollutants (phenol) [8]. The main sub-products related to photocatalyticphenol degradation include hydroquinone, used in the treatment of ephelides (freckles),melasma, post-inflammatory hyperpigmentation and actinic lentigo; benzoquinone, usedas a fungicide, a photographic reagent and in the manufacture of dyes and other chemicals;catechol, used as an astringent and as an antiseptic in photography and in the electro-plating and processing of other chemicals; and oxalic acid, used as a deoxidising agentto clean radiators and to remove ink stains. These high-value-added sub-products makephotocatalytic degradation a profitable technique for phenol treatment. The photocatalyticproperties of metal oxide catalysts are due to the fact that excitation of electrons from thevalence to the conduction band of the catalyst occurs upon its irradiation with light of theappropriate wavelength [4]. The promotion of the electrons (e-) creates positive charges orholes (h+) on the valence band, and an accumulation of electrons on the conduction bandof the catalyst the generation of these charge carriers (e- and h+) initiates the photocatalyticdegradation process [9]. The valence band holes attack and the oxidized surface absorbswater molecules to form hydroxyl radicals (OH *) [10]. Conduction band electrons reduceoxygen molecules and produce oxygen radicals or superoxide radicals (O2 *) [10]. Highlyreactive radicals attack and convert the pollutants to harmless products such as carbondioxide and water [10,11]. The photocatalytic degradation of phenolic compounds fromwastewater has been demonstrated by many researchers using various catalysts includingTiO2/reduced graphene [12,13], ZnO [14], Fe2O3 decorated on carbon nanotubes [15] andCuO [16].
Several reports have shown that photocatalytic degradation techniques have beenutilized effectively to degrade phenol from the water [13]. The results confirmed that usingzeolite as support for FeO enhancement promotes efficient photocatalytic degradation [17].The improved photocatalytic activity of the FeO–zeolite composite was attributed to the fact

Catalysts 2022, 12, 457 3 of 22
that the zeolite prevented agglomeration of the FeO nanoparticles and minimized the chargecarrier recombination rate [17]. F. Shahrezaei, A. Akhbari, and A. Rostami. [18] exploredthe photocatalytic degradation ability of TiO2 in the degradation of phenolic compoundspresent in wastewater from a refinery [18]. The highest degradation efficiency of thephenol and its derivatives was identified at an optimum temperature of 318 K, pH 3 and100 mg/L catalyst concentration [18]. A 90% degradation efficiency of phenol was achievedwithin 2 h at these optimum conditions. Guangping Zeng, Qiaoling Zhang, Youzhi Liu,Shaochuang Zhang, and Jing Guo [19] explored the photocatalytic degradation of Toluenewith FeO–TiO2, showing an improvement of 58% in the degradation rates compared toTiO2 P25 [19]. Increasing the concentration from 0.5% to 5.0% of Fe3+ results in a reductionin the band gap energy from 3.06 eV in undoped Fe to 2.86 eV and 2.26 eV. Fe3+ not onlybroadens the photo response range but also effectively suppresses the recombination of theelectron and hole [19]. As a result, the catalytic activity was enhanced. The degradationrate of 1.0% Fe–TiO2 to toluene of 105 ppm reached 95.7% after 4 h under UV light [19].The chlorine doping effect was explored by Zhen Cao, Tingting Zhang, Pin Ren, DingCao, Yanjun Lin, Liren Wang, Bing Zhang, and Xu Xiang [20]. The investigation reportedthat chloride ions adsorbed onto the TiO2 surface, introducing a negative surface chargethat enhances the electrostatic adsorption of cationic dyes, and greatly improves the self-sensitizing degradation performance of the dyes [20]. Chloride ions replace lattice oxygenatoms in TiO2, inducing lattice oxygen vacancies that reduce the apparent bandgap ofthe TiO2 particles, enhancing its absorption of visible light and further increasing thephotocatalytic activity of the composite-coated fabric [20]. Y. Niu, M. Xing, J. Zhang, andB. Tian [21] reported the beneficial co-effects between S doping and Fe(III) on phenolphotodegradation; doping decreased the bandgap energy due to the formation of impuritylevels and suppressed the recombination of electrons and holes by trapping electrons,leading to higher the photoactivity of Fe single-bond S-co doped TiO2 compared to that ofundoped and S-doped TiO2.
Within this scenario, the purpose of the present investigation was to study the influenceof chlorine and sulphur on an FeO–TiO2 catalyst prepared by incipient impregnation. Inthis regard, the chlorine will modify the iron sphere coordination in order to form FeClspecies complexes in the impregnation solution. The FeCl species complexes could improvethe formation of the FeS phase in the FeO–TiO2 catalysts after sulfurization activation. Theaqueous impregnation solutions of the FeCl species complexes, dried solids and sulphatedcatalysts were characterized by different physicochemical techniques such as DRS UV–Vis,TPR, Raman and XPS. The oxide and sulphated catalyst activity were evaluated by UV–Visand TOC techniques on a visible-light reactor.
2. Results2.1. Solution AnalysisHYDRA Formulation
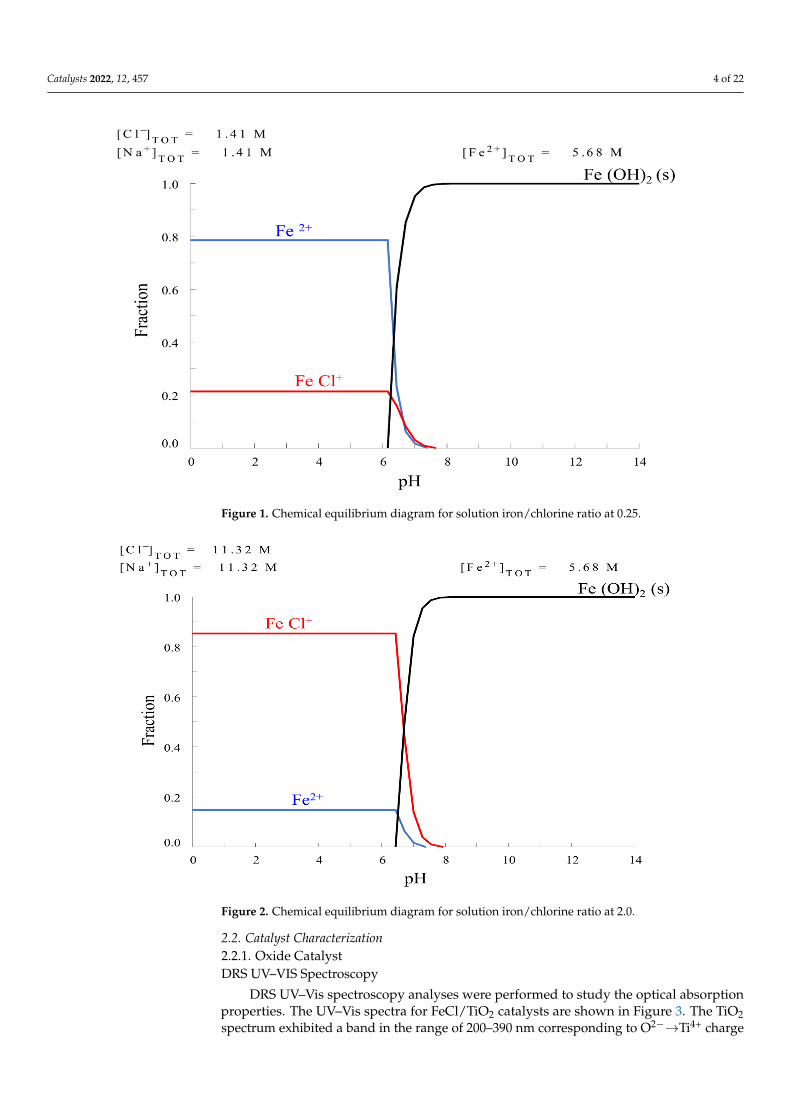
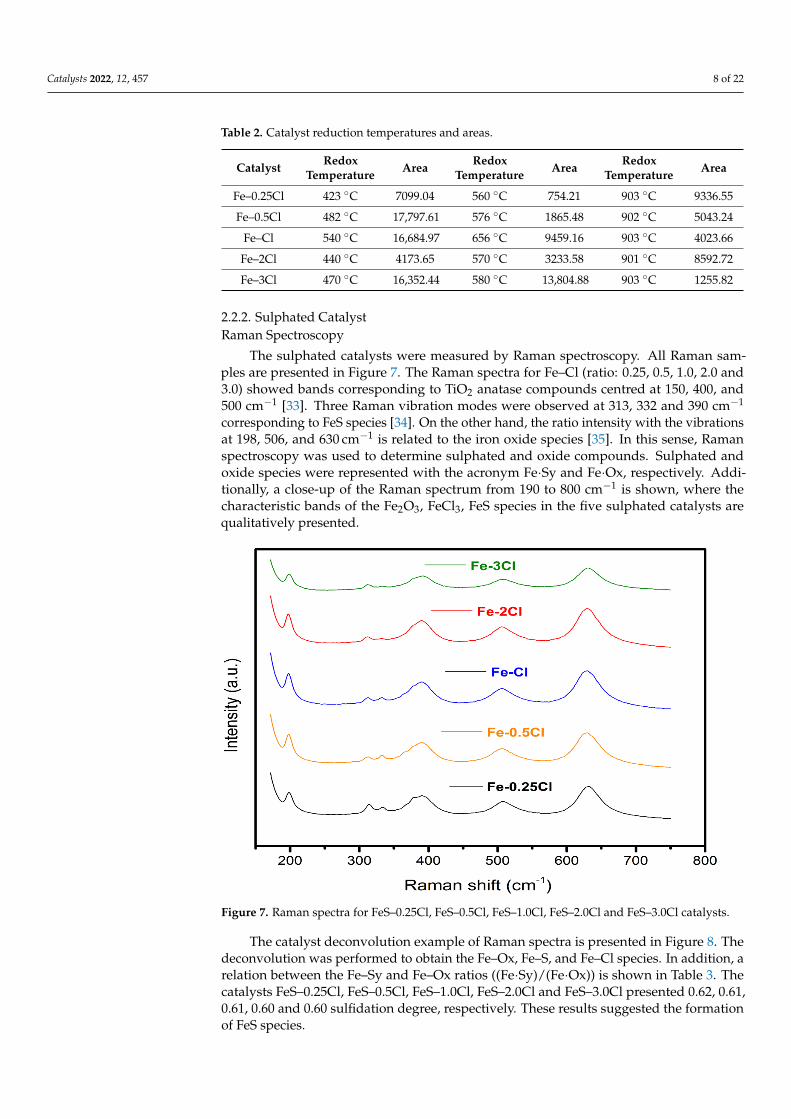
The impregnation solutions were carried out with the HYDRA-Medusa [22] chemicalequilibrium diagrams program to obtain different fractions of FeCl+. Several diagramswere constructed considering the concentration variation derived from metal precursorsalts and pH adjusters. The ionic strength effect was considered due to the high ionicconcentration in experimental solutions [23,24]. All calculations were carried out at astandard temperature (298 K) and fixed molar concentrations of Fe and Cl. In this regard,five mixed solutions were formulated with iron solution concentration at 5.68 M anddifferent ratios iron/chlorine (ratio: 0.25, 0.5, 1, 2 and 3). The photocatalysts will be referredto by the acronyms: Fe–0.25Cl, Fe–0.5Cl, Fe–Cl, Fe–2Cl and Fe–3Cl. Figure 1 shows thepresence of the FeCl+ species with the lowest ratio, 0.25; ratio 2.0 showed the highestfraction of the FeCl+ species, as shown in Figure 2.
Catalysts 2022, 12, 457 4 of 22
Catalysts 2022, 12, x FOR PEER REVIEW 4 of 22
the FeCl+ species with the lowest ratio, 0.25; ratio 2.0 showed the highest fraction of the FeCl+ species, as shown in Figure 2.
Figure 1. Chemical equilibrium diagram for solution iron/chlorine ratio at 0.25.
Figure 2. Chemical equilibrium diagram for solution iron/chlorine ratio at 2.0.
2.2. Catalyst Characterization 2.2.1. Oxide Catalyst DRS UV–VIS Spectroscopy
DRS UV–Vis spectroscopy analyses were performed to study the optical absorption properties. The UV–Vis spectra for FeCl/TiO2 catalysts are shown in Figure 3. The TiO2 spectrum exhibited a band in the range of 200–390 nm corresponding to O2−→Ti4+ charge transfer [25]. For the Fe catalysts, three regions can be distinguished in the ranges 200–
Figure 1. Chemical equilibrium diagram for solution iron/chlorine ratio at 0.25.
Catalysts 2022, 12, x FOR PEER REVIEW 4 of 22
the FeCl+ species with the lowest ratio, 0.25; ratio 2.0 showed the highest fraction of the FeCl+ species, as shown in Figure 2.
Figure 1. Chemical equilibrium diagram for solution iron/chlorine ratio at 0.25.
Figure 2. Chemical equilibrium diagram for solution iron/chlorine ratio at 2.0.
2.2. Catalyst Characterization 2.2.1. Oxide Catalyst DRS UV–VIS Spectroscopy
DRS UV–Vis spectroscopy analyses were performed to study the optical absorption properties. The UV–Vis spectra for FeCl/TiO2 catalysts are shown in Figure 3. The TiO2 spectrum exhibited a band in the range of 200–390 nm corresponding to O2−→Ti4+ charge transfer [25]. For the Fe catalysts, three regions can be distinguished in the ranges 200–
Figure 2. Chemical equilibrium diagram for solution iron/chlorine ratio at 2.0.
2.2. Catalyst Characterization2.2.1. Oxide CatalystDRS UV–VIS Spectroscopy
DRS UV–Vis spectroscopy analyses were performed to study the optical absorptionproperties. The UV–Vis spectra for FeCl/TiO2 catalysts are shown in Figure 3. The TiO2spectrum exhibited a band in the range of 200–390 nm corresponding to O2−→Ti4+ charge

Catalysts 2022, 12, 457 5 of 22
transfer [25]. For the Fe catalysts, three regions can be distinguished in the ranges 200–300,300–400 and 400–650 nm. The band at approximately 200–300 nm is associated withcharge transfer O→Fe3+, which indicates that Fe3+ could be incorporated as isolatedcations [26]. The band between 300 and 400 nm corresponds to isolated Fe3+ ions intetrahedral coordination [26]. Additionally, the band about 400–650 nm indicated thepresence of Fe2O3 or Fe3O4 in octahedral coordination [27]. The absorption edges forthe FeCl3-TiO2 and Fe2O3-TiO2 catalysts compounds shifted to the visible region as aresult of electronic interactions. A displacement over bands was presented as the chlorineconcentration increased. The band at approximately 750–900 nm confirmed that the Fe2O3nanoparticles present on the catalysts exhibit absorption in the visible-light range. Theseresults could suggest the feasibility of utilization of visible light for photo-catalysis [28].Additionally, this result could be indicated the modification of Fe sphere coordination andeffective surface hybridization between the species between FeCl3, Fe2O3, and TiO2 [25].Additionally, the TiO2 spectra showed that the structure of the TiO2 support is not affectedby iron–chlorine impregnation [29].
Catalysts 2022, 12, x FOR PEER REVIEW 5 of 22
300, 300–400 and 400–650 nm. The band at approximately 200–300 nm is associated with charge transfer O→Fe3+, which indicates that Fe3+ could be incorporated as isolated cations [26]. The band between 300 and 400 nm corresponds to isolated Fe3+ ions in tetrahedral coordination [26]. Additionally, the band about 400–650 nm indicated the presence of Fe2O3 or Fe3O4 in octahedral coordination [27]. The absorption edges for the FeCl3-TiO2 and Fe2O3-TiO2 catalysts compounds shifted to the visible region as a result of electronic interactions. A displacement over bands was presented as the chlorine concentration in-creased. The band at approximately 750–900 nm confirmed that the Fe2O3 nanoparticles present on the catalysts exhibit absorption in the visible-light range. These results could suggest the feasibility of utilization of visible light for photo-catalysis [28]. Additionally, this result could be indicated the modification of Fe sphere coordination and effective sur-face hybridization between the species between FeCl3, Fe2O3, and TiO2 [25]. Additionally, the TiO2 spectra showed that the structure of the TiO2 support is not affected by iron–chlorine impregnation [29].
Figure 3. DRS UV–Vis for Fe–0.25Cl, Fe–0.5Cl, Fe–1.0Cl, Fe–2.0Cl and Fe–3.0Cl oxide catalyst.
After recalculating the spectra with the Kubelka–Munk function, the tangent to the Tauc curve was used to determine the bandgap energy [25]. The bandgap energy of the catalyst Fe–2Cl is presented in Figure 4. The bandgap energy calculations of the catalysts by the Kubelka–Munk formula is as follows:
A = −lg(R)
F(R) = (1 − R)2/2R
E = 1240/λ
where A is the absorbance, R is the reflectivity, E is the bandgap energy, and λ is the optical wavelength. The bandgap energy diagram of the sample was obtained by using (F(R) * E)1/2 as the longitudinal coordinate and E as the transverse coordinate [25]. As in the method described by Tauc, the linear fit of the fundamental peak was applied. Addi-tionally, a linear fit used as an abscissa is applied for the slope below the fundamental
Figure 3. DRS UV–Vis for Fe–0.25Cl, Fe–0.5Cl, Fe–1.0Cl, Fe–2.0Cl and Fe–3.0Cl oxide catalyst.
After recalculating the spectra with the Kubelka–Munk function, the tangent to theTauc curve was used to determine the bandgap energy [25]. The bandgap energy of thecatalyst Fe–2Cl is presented in Figure 4. The bandgap energy calculations of the catalystsby the Kubelka–Munk formula is as follows:
A = −lg(R)
F(R) = (1 − R)2/2R
E = 1240/λ
where A is the absorbance, R is the reflectivity, E is the bandgap energy, and λ is the opticalwavelength. The bandgap energy diagram of the sample was obtained by using (F(R) * E)1/2
as the longitudinal coordinate and E as the transverse coordinate [25]. As in the methoddescribed by Tauc, the linear fit of the fundamental peak was applied. Additionally, alinear fit used as an abscissa is applied for the slope below the fundamental absorption [30].The results of the bandgaps are presented in Table 1. The TiO2 presented 3.3 eV while the

Catalysts 2022, 12, 457 6 of 22
catalysts with iron and chlorine presented 2.9 a 3.01 eV. In contrast, the incorporation ofiron species improves metal character. The results showed that the addition of chlorinereduces the band gap energy more compared to TiO2. However, the incremental chlorineconcentration does not continue reducing the bandgap compared to other chlorine-dopedcatalysts. The bandgap variation could be related with the formation of Fe2+ species on thecatalyst. Fe2+ species are directly related to chlorine addition.
Catalysts 2022, 12, x FOR PEER REVIEW 6 of 22
absorption [30]. The results of the bandgaps are presented in Table 1. The TiO2 presented 3.3 eV while the catalysts with iron and chlorine presented 2.9 a 3.01 eV. In contrast, the incorporation of iron species improves metal character. The results showed that the addi-tion of chlorine reduces the band gap energy more compared to TiO2. However, the incre-mental chlorine concentration does not continue reducing the bandgap compared to other chlorine-doped catalysts. The bandgap variation could be related with the formation of Fe2+ species on the catalyst. Fe2+ species are directly related to chlorine addition.
Figure 4. (A) Diffuse reflectance spectroscopy, F(R) versus wavelength, and (B) Tauc Plot Eg = 3.10 eV for Fe–2Cl catalyst.
Table 1. Band Gap of catalyst.
Catalyst Band Gap TiO2 3.3
Fe–0.25Cl 3.06 Fe–0.5Cl 3.0
Fe–Cl 3.12 Fe–2Cl 3.16 Fe–3Cl 3.08
Temperature-Programmed Reduction Analysis TPR profiles are presented in Figure 5. TPR characterization was used to observe the
reduction temperatures states of the photocatalysts. TPR profiles for the catalysts pre-sented a principal peak between 400 and 600 °C related to Fe3+ to Fe2+. Additionally, the catalysts exhibited a displacement corresponding to the increase in chlorine species con-centration on the reduction temperature of Fe3+ to Fe2+. In addition, the increase in chlorine concentration showed a lower reduction temperature of Fe2+ to Fe0 above 600 °C. The de-convolution peaks for one catalyst are shown in Figure 6. The Fe–2Cl material exhibited a maximum peak at 600 °C and a shoulder at 440 °C corresponding to the reduction in Fe3+ species. Additionally, the Fe–2Cl catalyst presented a shoulder with a maximum peak at 674 °C corresponding to the reduction of Fe3+ to Fe2+ and Fe0 species [31]. The last peak
Figure 4. (A) Diffuse reflectance spectroscopy, F(R) versus wavelength, and (B) Tauc Plot Eg = 3.10 eVfor Fe–2Cl catalyst.
Table 1. Band Gap of catalyst.
Catalyst Band Gap
TiO2 3.3
Fe–0.25Cl 3.06
Fe–0.5Cl 3.0
Fe–Cl 3.12
Fe–2Cl 3.16
Fe–3Cl 3.08
Temperature-Programmed Reduction Analysis
TPR profiles are presented in Figure 5. TPR characterization was used to observe thereduction temperatures states of the photocatalysts. TPR profiles for the catalysts presenteda principal peak between 400 and 600 ◦C related to Fe3+ to Fe2+. Additionally, the catalystsexhibited a displacement corresponding to the increase in chlorine species concentration onthe reduction temperature of Fe3+ to Fe2+. In addition, the increase in chlorine concentrationshowed a lower reduction temperature of Fe2+ to Fe0 above 600 ◦C. The deconvolutionpeaks for one catalyst are shown in Figure 6. The Fe–2Cl material exhibited a maximumpeak at 600 ◦C and a shoulder at 440 ◦C corresponding to the reduction in Fe3+ species.Additionally, the Fe–2Cl catalyst presented a shoulder with a maximum peak at 674 ◦Ccorresponding to the reduction of Fe3+ to Fe2+ and Fe0 species [31]. The last peak with

Catalysts 2022, 12, 457 7 of 22
a maximum observed at 901 ◦C is attributed to Fe species with a strong metal–supportinteraction [32]. The areas of the observed peaks were performed through deconvolutions.
Catalysts 2022, 12, x FOR PEER REVIEW 7 of 22
with a maximum observed at 901 °C is attributed to Fe species with a strong metal–sup-port interaction [32]. The areas of the observed peaks were performed through deconvo-lutions.
Figure 5. Temperature-programmed profiles for Fe–0.25Cl, Fe–0.5Cl, Fe–1.0Cl, Fe–2.0Cl and Fe–3.0Cl oxide catalyst.
Figure 6. Temperature-programmed deconvolution for Fe–2Cl oxide catalyst.
The deconvolution results of the TPR analysis of the oxide catalysts are presented in Table 2. Table 2 shows the reduction temperatures for the photocatalysts and the Fe spe-cies areas. The first iron reduction temperature between 400 and 550 °C presented shifted as the chlorine concentration increased. In addition, the second iron reduction tempera-ture between 550 and 650 °C showed a shift in equilibrium for the catalyst Fe–2Cl and Fe–3Cl. Additionally, these results suggested an increase in Fe2+ species for Fe–2Cl at a lower reduction temperature and, consecutively, there was a weaker metal–support interaction in comparison with the Fe–Cl (ratio: 0.5, 1.0, 3.0).
Figure 5. Temperature-programmed profiles for Fe–0.25Cl, Fe–0.5Cl, Fe–1.0Cl, Fe–2.0Cl and Fe–3.0Cloxide catalyst.
Catalysts 2022, 12, x FOR PEER REVIEW 7 of 22
with a maximum observed at 901 °C is attributed to Fe species with a strong metal–sup-port interaction [32]. The areas of the observed peaks were performed through deconvo-lutions.
Figure 5. Temperature-programmed profiles for Fe–0.25Cl, Fe–0.5Cl, Fe–1.0Cl, Fe–2.0Cl and Fe–3.0Cl oxide catalyst.
Figure 6. Temperature-programmed deconvolution for Fe–2Cl oxide catalyst.
The deconvolution results of the TPR analysis of the oxide catalysts are presented in Table 2. Table 2 shows the reduction temperatures for the photocatalysts and the Fe spe-cies areas. The first iron reduction temperature between 400 and 550 °C presented shifted as the chlorine concentration increased. In addition, the second iron reduction tempera-ture between 550 and 650 °C showed a shift in equilibrium for the catalyst Fe–2Cl and Fe–3Cl. Additionally, these results suggested an increase in Fe2+ species for Fe–2Cl at a lower reduction temperature and, consecutively, there was a weaker metal–support interaction in comparison with the Fe–Cl (ratio: 0.5, 1.0, 3.0).
Figure 6. Temperature-programmed deconvolution for Fe–2Cl oxide catalyst.
The deconvolution results of the TPR analysis of the oxide catalysts are presentedin Table 2. Table 2 shows the reduction temperatures for the photocatalysts and the Fespecies areas. The first iron reduction temperature between 400 and 550 ◦C presentedshifted as the chlorine concentration increased. In addition, the second iron reductiontemperature between 550 and 650 ◦C showed a shift in equilibrium for the catalyst Fe–2Cland Fe–3Cl. Additionally, these results suggested an increase in Fe2+ species for Fe–2Clat a lower reduction temperature and, consecutively, there was a weaker metal–supportinteraction in comparison with the Fe–Cl (ratio: 0.5, 1.0, 3.0).
Catalysts 2022, 12, 457 8 of 22
Table 2. Catalyst reduction temperatures and areas.
Catalyst RedoxTemperature Area Redox
Temperature Area RedoxTemperature Area
Fe–0.25Cl 423 ◦C 7099.04 560 ◦C 754.21 903 ◦C 9336.55
Fe–0.5Cl 482 ◦C 17,797.61 576 ◦C 1865.48 902 ◦C 5043.24
Fe–Cl 540 ◦C 16,684.97 656 ◦C 9459.16 903 ◦C 4023.66
Fe–2Cl 440 ◦C 4173.65 570 ◦C 3233.58 901 ◦C 8592.72
Fe–3Cl 470 ◦C 16,352.44 580 ◦C 13,804.88 903 ◦C 1255.82
2.2.2. Sulphated CatalystRaman Spectroscopy
The sulphated catalysts were measured by Raman spectroscopy. All Raman sam-ples are presented in Figure 7. The Raman spectra for Fe–Cl (ratio: 0.25, 0.5, 1.0, 2.0 and3.0) showed bands corresponding to TiO2 anatase compounds centred at 150, 400, and500 cm−1 [33]. Three Raman vibration modes were observed at 313, 332 and 390 cm−1
corresponding to FeS species [34]. On the other hand, the ratio intensity with the vibrationsat 198, 506, and 630 cm−1 is related to the iron oxide species [35]. In this sense, Ramanspectroscopy was used to determine sulphated and oxide compounds. Sulphated andoxide species were represented with the acronym Fe·Sy and Fe·Ox, respectively. Addi-tionally, a close-up of the Raman spectrum from 190 to 800 cm−1 is shown, where thecharacteristic bands of the Fe2O3, FeCl3, FeS species in the five sulphated catalysts arequalitatively presented.
Catalysts 2022, 12, x FOR PEER REVIEW 8 of 22
Table 2. Catalyst reduction temperatures and areas.
Catalyst Redox Temperature
Area Redox Temperature
Area Redox Temperature
Area
Fe–0.25Cl 423 °C 7099.04 560 °C 754.21 903 °C 9336.55 Fe–0.5Cl 482 °C 17,797.61 576 °C 1865.48 902 °C 5043.24
Fe–Cl 540 °C 16,684.97 656 °C 9459.16 903 °C 4023.66 Fe–2Cl 440 °C 4173.65 570 °C 3233.58 901 °C 8592.72 Fe–3Cl 470 °C 16,352.44 580 °C 13,804.88 903 °C 1255.82
2.2.2. Sulphated Catalyst Raman Spectroscopy
The sulphated catalysts were measured by Raman spectroscopy. All Raman samples are presented in Figure 7. The Raman spectra for Fe–Cl (ratio: 0.25, 0.5, 1.0, 2.0 and 3.0) showed bands corresponding to TiO2 anatase compounds centred at 150, 400, and 500 cm−1 [33]. Three Raman vibration modes were observed at 313, 332 and 390 cm−1 corresponding to FeS species [34]. On the other hand, the ratio intensity with the vibrations at 198, 506, and 630 cm−1 is related to the iron oxide species [35]. In this sense, Raman spectroscopy was used to determine sulphated and oxide compounds. Sulphated and oxide species were represented with the acronym Fe∙Sy and Fe∙Ox, respectively. Additionally, a close-up of the Raman spectrum from 190 to 800 cm−1 is shown, where the characteristic bands of the Fe2O3, FeCl3, FeS species in the five sulphated catalysts are qualitatively presented.
Figure 7. Raman spectra for FeS–0.25Cl, FeS–0.5Cl, FeS–1.0Cl, FeS–2.0Cl and FeS–3.0Cl catalysts.
The catalyst deconvolution example of Raman spectra is presented in Figure 8. The deconvolution was performed to obtain the Fe–Ox, Fe–S, and Fe–Cl species. In addition, a relation between the Fe–Sy and Fe–Ox ratios ((Fe∙Sy)/(Fe∙Ox)) is shown in Table 3. The catalysts FeS–0.25Cl, FeS–0.5Cl, FeS–1.0Cl, FeS–2.0Cl and FeS–3.0Cl presented 0.62, 0.61, 0.61, 0.60 and 0.60 sulfidation degree, respectively. These results suggested the formation of FeS species.
Figure 7. Raman spectra for FeS–0.25Cl, FeS–0.5Cl, FeS–1.0Cl, FeS–2.0Cl and FeS–3.0Cl catalysts.
The catalyst deconvolution example of Raman spectra is presented in Figure 8. Thedeconvolution was performed to obtain the Fe–Ox, Fe–S, and Fe–Cl species. In addition, arelation between the Fe–Sy and Fe–Ox ratios ((Fe·Sy)/(Fe·Ox)) is shown in Table 3. Thecatalysts FeS–0.25Cl, FeS–0.5Cl, FeS–1.0Cl, FeS–2.0Cl and FeS–3.0Cl presented 0.62, 0.61,0.61, 0.60 and 0.60 sulfidation degree, respectively. These results suggested the formationof FeS species.

Catalysts 2022, 12, 457 9 of 22Catalysts 2022, 12, x FOR PEER REVIEW 9 of 22
Figure 8. Deconvolutions of Raman spectra of the sulphur catalyst (FeS–2Cl).
Table 3. Sulfide-Oxide ratio from Raman spectra.
Catalyst Fe∙Sy Fe∙Ox 𝐅𝐞 ∙ 𝐒𝐲𝐅𝐞 ∙ 𝐎𝐱
FeS–0.25Cl 2900.29 1745.30 0.6243 FeS–0.5Cl 3175.45 1992.05 0.6145
FeS–Cl 3486.89 2218.10 0.6112 FeS–2Cl 3390.54 2172.28 0.6095 FeS–3Cl 2038.7 1366.44 0.6050
X-ray Photoelectron Spectroscopy (XPS) The chemical states of the iron-sulphide species were examined by XPS analysis. The
XPS spectrum for FeS–2Cl catalyst is presented in Figures 9 and 10.
Figure 9. XPS spectrum for FeS–2Cl catalyst.
Figure 8. Deconvolutions of Raman spectra of the sulphur catalyst (FeS–2Cl).
Table 3. Sulfide-Oxide ratio from Raman spectra.
Catalyst Fe·Sy Fe·Ox Fe·SyFe·Ox
FeS–0.25Cl 2900.29 1745.30 0.6243
FeS–0.5Cl 3175.45 1992.05 0.6145
FeS–Cl 3486.89 2218.10 0.6112
FeS–2Cl 3390.54 2172.28 0.6095
FeS–3Cl 2038.7 1366.44 0.6050
X-ray Photoelectron Spectroscopy (XPS)
The chemical states of the iron-sulphide species were examined by XPS analysis. TheXPS spectrum for FeS–2Cl catalyst is presented in Figures 9 and 10.
Catalysts 2022, 12, x FOR PEER REVIEW 9 of 22
Figure 8. Deconvolutions of Raman spectra of the sulphur catalyst (FeS–2Cl).
Table 3. Sulfide-Oxide ratio from Raman spectra.
Catalyst Fe∙Sy Fe∙Ox 𝐅𝐞 ∙ 𝐒𝐲𝐅𝐞 ∙ 𝐎𝐱
FeS–0.25Cl 2900.29 1745.30 0.6243 FeS–0.5Cl 3175.45 1992.05 0.6145
FeS–Cl 3486.89 2218.10 0.6112 FeS–2Cl 3390.54 2172.28 0.6095 FeS–3Cl 2038.7 1366.44 0.6050
X-ray Photoelectron Spectroscopy (XPS) The chemical states of the iron-sulphide species were examined by XPS analysis. The
XPS spectrum for FeS–2Cl catalyst is presented in Figures 9 and 10.
Figure 9. XPS spectrum for FeS–2Cl catalyst.
Figure 9. XPS spectrum for FeS–2Cl catalyst.

Catalysts 2022, 12, 457 10 of 22
Catalysts 2022, 12, x FOR PEER REVIEW 10 of 22
Figure 9 shows the binding spectra of Fe 2p centred at 708.08 eV, Cl 2p centred at 199.08 eV and S 2p centred at 161.08 eV for FeS–2Cl catalyst, respectively.
Figure 10 shows the high-resolution spectra for Fe, Cl, S, and Ti. The Fe 2p1/2 and Fe 2p3/2 peaks were centred, respectively, at 708.28 eV and 722.18 eV and the separation (Δ = 2p1/2-2p3/2) was 13.9 eV, which are attributed to Fe2+ states from the FeS phase [36] (Figure 10A).
The FeS–0.25Cl, FeS–0.5Cl and FeS–Cl catalysts show the characteristic peaks of Fe3+ iron oxides (710.5 eV, 723.4 eV) [36], with displacement due to Fe–Cl interactions [37]. However, the FeS–3Cl catalyst shows the characteristic Fe3+ oxide bands and a peak with a smaller Fe2+ distinctive band area corresponding to FeS.
The FeS–2Cl catalyst presented peaks at 722.1 eV and 708.2 eV, corresponding to Fe2+ of FeS [36,37]. The two peaks at 198.53 eV and 199.88 eV are observed in the Cl 2p, as shown in Figure 10B. These peaks are due to the 2p3/2 and 2p1/2 electrons of the ionic chlorine (Cl−) [37]. Additionally, Cl 2p presented the binding energy of chlorine at 198.53 eV, which was attributed to FeCl3 [38].
Photocatalysts showed the characteristic peaks of the Cl- species corresponding to the Fe–Cl bond. In addition, photocatalysts FeS–0.5Cl, FeS–Cl, and FeS–2Cl exhibited an additional peak of a smaller area corresponding to the C–Cl bonds [37].
Two peaks at 168.28 eV and 161.98 eV can be attributed to S 2p 3/2 and S 2p 1/2, respectively. These peaks are related to FeS (Figure 10C) [36].
The Fe with chlorine at different ratios showed characteristic peaks of the S 2p species corresponding to the FeS bond. Additionally, the spectra showed a shift due to the effect of Cl on the catalysts [37].
The binding energy of Ti 2p1/2 and Ti 2p3/2 was observed to be approximately 464.23 eV and 458.38 eV, respectively. In addition, the splitting data between the Ti 2p 1/2 and Ti 2p 3/2 core levels are 5.85 eV, indicating a normal Ti4+ state in the TiO2 anatase [39]. These results showed that the TiO2 anatase phase had been successfully introduced into FeS nanostructures (Figure 10D) [36].
Figure 10. XPS spectrum for catalyst FeS–2Cl. (A) Fe 2p, (B) Cl 2p, (C) S 2p and (D) Ti 2p.
Figure 9 shows the binding spectra of Fe 2p centred at 708.08 eV, Cl 2p centred at199.08 eV and S 2p centred at 161.08 eV for FeS–2Cl catalyst, respectively.
Figure 10 shows the high-resolution spectra for Fe, Cl, S, and Ti. The Fe 2p1/2 andFe 2p3/2 peaks were centred, respectively, at 708.28 eV and 722.18 eV and the separation(∆ = 2p1/2− 2p3/2) was 13.9 eV, which are attributed to Fe2+ states from the FeS phase [36](Figure 10A).
The FeS–0.25Cl, FeS–0.5Cl and FeS–Cl catalysts show the characteristic peaks of Fe3+
iron oxides (710.5 eV, 723.4 eV) [36], with displacement due to Fe–Cl interactions [37].However, the FeS–3Cl catalyst shows the characteristic Fe3+ oxide bands and a peak with asmaller Fe2+ distinctive band area corresponding to FeS.
The FeS–2Cl catalyst presented peaks at 722.1 eV and 708.2 eV, corresponding to Fe2+
of FeS [36,37]. The two peaks at 198.53 eV and 199.88 eV are observed in the Cl 2p, as shownin Figure 10B. These peaks are due to the 2p3/2 and 2p1/2 electrons of the ionic chlorine(Cl−) [37]. Additionally, Cl 2p presented the binding energy of chlorine at 198.53 eV, whichwas attributed to FeCl3 [38].
Photocatalysts showed the characteristic peaks of the Cl- species corresponding tothe Fe–Cl bond. In addition, photocatalysts FeS–0.5Cl, FeS–Cl, and FeS–2Cl exhibited anadditional peak of a smaller area corresponding to the C–Cl bonds [37].
Two peaks at 168.28 eV and 161.98 eV can be attributed to S 2p 3/2 and S 2p 1/2,respectively. These peaks are related to FeS (Figure 10C) [36].
The Fe with chlorine at different ratios showed characteristic peaks of the S 2p speciescorresponding to the FeS bond. Additionally, the spectra showed a shift due to the effect ofCl on the catalysts [37].
The binding energy of Ti 2p1/2 and Ti 2p3/2 was observed to be approximately464.23 eV and 458.38 eV, respectively. In addition, the splitting data between theTi 2p1/2 and Ti 2p3/2 core levels are 5.85 eV, indicating a normal Ti4+ state in the TiO2

Catalysts 2022, 12, 457 11 of 22
anatase [39]. These results showed that the TiO2 anatase phase had been successfullyintroduced into FeS nanostructures (Figure 10D) [36].
The Band Gap calculus was realized with the O 1s spectra region (Figure 11). The O1 s spectra shows the presence of two types of oxygen on the surface of the intercalationcompounds. The peak at the binding energy of 529 eV and 530 eV may be due to oxygenbound to Fe (Fe–O) [38]. Oxygen in the form of water in the intercalation compounds isshown at the peak binding energy of 531 eV [37].
Catalysts 2022, 12, x FOR PEER REVIEW 11 of 22
Figure 10. XPS spectrum for catalyst FeS–2Cl. (A) Fe 2p, (B) Cl 2p, (C) S 2p and (D) Ti 2p.
The Band Gap calculus was realized with the O 1s spectra region (Figure 11). The O 1 s spectra shows the presence of two types of oxygen on the surface of the intercalation compounds. The peak at the binding energy of 529 eV and 530 eV may be due to oxygen bound to Fe (Fe–O) [38]. Oxygen in the form of water in the intercalation compounds is shown at the peak binding energy of 531 eV [37].
The energy loss spectra of O 1 s were used to determine the bandgap. The bandgap denotes the energy separation between the peak energy and the threshold of inelastic losses corresponding to electronic band-to-band transitions and excitation of plasma waves below the Fermi level with electrons in the VB [40]. The start of the energy loss spectrum is obtained by linear extrapolation from the maximum negative slope segment to the background level [41]. The method of the energy loss peak was used for the corre-sponding O 1 s spectrum. The Eg value of a large bandgap can be determined. Therefore, the procedure to obtain Eg includes a linear curve fit of the measured loss spectrum near the onset of inelastic losses [40]. The determination of the Eg for the materials with a large bandgap using the peak energy loss of the O 1s spectrum has been widely reported. In this context, XPS is useful to analyse the inelastic collisions that occur during photoexci-tation and electron photoemission of materials.
Figure 12 shows the plots of the high-resolution scan of the O 1s core level for the catalysts FeS–0.5Cl, FeS–Cl, and FeS–2Cl.
Figure 11. XPS O 1s diagram of all sulphur catalysts.
Table 4 presents the photocatalysts conduction band results that were calculated from XPS diagrams [42–44]. The results will be discussed in Section 3.
Table 4. Band gap, valence band and conduction band sulphide catalyst.
XPS Band Gap Valence Band Conduction Band FeS–0.25Cl 2.90 2.27 −0.63 FeS–0.5Cl 2.82 3.13 −0.31
FeS–Cl 3.10 2.99 −0.11 FeS–2Cl 3.05 1.97 −1.08 FeS–3Cl 2.95 3.05 0.10
Figure 11. XPS O 1s diagram of all sulphur catalysts.
The energy loss spectra of O 1s were used to determine the bandgap. The bandgapdenotes the energy separation between the peak energy and the threshold of inelasticlosses corresponding to electronic band-to-band transitions and excitation of plasma wavesbelow the Fermi level with electrons in the VB [40]. The start of the energy loss spectrumis obtained by linear extrapolation from the maximum negative slope segment to thebackground level [41]. The method of the energy loss peak was used for the correspondingO 1s spectrum. The Eg value of a large bandgap can be determined. Therefore, theprocedure to obtain Eg includes a linear curve fit of the measured loss spectrum near theonset of inelastic losses [40]. The determination of the Eg for the materials with a largebandgap using the peak energy loss of the O 1s spectrum has been widely reported. In thiscontext, XPS is useful to analyse the inelastic collisions that occur during photoexcitationand electron photoemission of materials.
Figure 12 shows the plots of the high-resolution scan of the O 1s core level for thecatalysts FeS–0.5Cl, FeS–Cl, and FeS–2Cl.
Table 4 presents the photocatalysts conduction band results that were calculated fromXPS diagrams [42–44]. The results will be discussed in Section 3.
Table 4. Band gap, valence band and conduction band sulphide catalyst.
XPS Band Gap Valence Band Conduction Band
FeS–0.25Cl 2.90 2.27 −0.63
FeS–0.5Cl 2.82 3.13 −0.31
FeS–Cl 3.10 2.99 −0.11
FeS–2Cl 3.05 1.97 −1.08
FeS–3Cl 2.95 3.05 0.10

Catalysts 2022, 12, 457 12 of 22
Catalysts 2022, 12, x FOR PEER REVIEW 12 of 22
Table 5 the FeS–0.25Cl, FeS–0.5Cl, FeS–1.0Cl, FeS–2.0Cl and FeS–3.0Cl presented 0.64, 0.64, 0.63, 0.61 and 0.60 sulfidation–oxide ratio. These results suggested a higher concen-tration of FeSy species in comparison with FeOx for the photocatalysts. This result is in agreement with Raman results.
Figure 12. XPS O 1s band gap diagram, sulphur catalysts.
Table 5. Oxide and sulphide areas from Fe 2p XPS spectra.
XPS Fe3+ (Oxide) Fe2+ (Sulphide) Relation 𝐒𝐲 𝐎𝐱 FeS–0.25Cl 6911.51 11,746.8 0.6464 FeS–0.5Cl 13,946.1 42,509.4 0.6404
FeS–Cl 6307.06 8236.48 0.6351 FeS–2Cl 3246.41 5244.27 0.6176 FeS–3Cl 5483.04 8358.71 0.6038
2.3. Photocatalytic Activity Figure 13 shows the photocatalytic activity for oxide and sulphide catalysts on the
visible-light region. Additionally, Table 6 presents the results of degradations for dark, photolysis, oxide and sulphide catalysts. Reaction in dark condition presented an absorp-tion of 3.8%. Reaction without catalyst (photolysis) and TiO2 presented degradation of 5.77, and 7.77%, respectively. The Fe–0.25Cl, Fe–2Cl and Fe–3Cl oxide catalysts presented 12.5, 28.9 and 26.7% of phenol degradation, respectively. The Fe–0.25Cl, Fe–2Cl and Fe–3Cl sulphide catalysts presented 29.2%, 48.5% and 42.4% of phenol degradation, respec-tively. The degradation for sulphated catalysts increased until 50% after 6 h. These results suggest an increase of 40% c.a. on catalytic activity for sulphated catalysts than oxide cat-alysts.
The photocatalytic activity presented non-linear degradation. This degradation could be related to the formation of intermediate products, a variation in air flux, and catalyst distribution over the reactor.
Table 6. Degradation results on visible-light region.
Oxide % Degradation Sulphide % Degradation Dark 3.8 Dark 3.8
Figure 12. XPS O 1s band gap diagram, sulphur catalysts.
Table 5 the FeS–0.25Cl, FeS–0.5Cl, FeS–1.0Cl, FeS–2.0Cl and FeS–3.0Cl presented0.64, 0.64, 0.63, 0.61 and 0.60 sulfidation–oxide ratio. These results suggested a higherconcentration of FeSy species in comparison with FeOx for the photocatalysts. This resultis in agreement with Raman results.
Table 5. Oxide and sulphide areas from Fe 2p XPS spectra.
XPS Fe3+ (Oxide) Fe2+ (Sulphide) Relation SyOx
FeS–0.25Cl 6911.51 11,746.8 0.6464
FeS–0.5Cl 13,946.1 42,509.4 0.6404
FeS–Cl 6307.06 8236.48 0.6351
FeS–2Cl 3246.41 5244.27 0.6176
FeS–3Cl 5483.04 8358.71 0.6038
2.3. Photocatalytic Activity
Figure 13 shows the photocatalytic activity for oxide and sulphide catalysts on thevisible-light region. Additionally, Table 6 presents the results of degradations for dark,photolysis, oxide and sulphide catalysts. Reaction in dark condition presented an absorp-tion of 3.8%. Reaction without catalyst (photolysis) and TiO2 presented degradation of5.77, and 7.77%, respectively. The Fe–0.25Cl, Fe–2Cl and Fe–3Cl oxide catalysts presented12.5, 28.9 and 26.7% of phenol degradation, respectively. The Fe–0.25Cl, Fe–2Cl and Fe–3Clsulphide catalysts presented 29.2%, 48.5% and 42.4% of phenol degradation, respectively.The degradation for sulphated catalysts increased until 50% after 6 h. These results suggestan increase of 40% c.a. on catalytic activity for sulphated catalysts than oxide catalysts.
The photocatalytic activity presented non-linear degradation. This degradation couldbe related to the formation of intermediate products, a variation in air flux, and catalystdistribution over the reactor.
Total Organic Carbon (TOC) Analysis
The TOC results for sulphated catalysts are presented in Figure 14. The mineralizationpercentage for FeS–0.25Cl, FeS–0.5Cl, FeS–2Cl and FeS–3Cl catalysts presented 11.0%, 10.0%,40.0% and 23.0%, respectively. The highest mineralization was exhibited for FeS–2Cl while

Catalysts 2022, 12, 457 13 of 22
the lowest mineralization values were showed for FeS–0.25Cl, and FeS–0.5Cl sulphatedcatalysts. These results are in agreement with photocatalytic activity results.
Catalysts 2022, 12, x FOR PEER REVIEW 13 of 22
Photolysis 5.77 Photolysis 5.77 TiO2 5.85 TiO2 7.87
Fe–0.25Cl 12.5 FeS–0.25Cl 29.2 Fe–0.5Cl 18.9 FeS–0.5Cl 26.4
Fe–Cl 16.6 FeS–Cl 31.7 Fe–2Cl 28.9 FeS–2Cl 48.5 Fe–3Cl 26.7 FeS–3Cl 42.4
Figure 13. Phenol degradation with oxide and sulphide catalyst.
Total Organic Carbon (TOC) Analysis The TOC results for sulphated catalysts are presented in Figure 14. The mineraliza-
tion percentage for FeS–0.25Cl, FeS–0.5Cl, FeS–2Cl and FeS–3Cl catalysts presented 11.0%, 10.0%, 40.0% and 23.0%, respectively. The highest mineralization was exhibited for FeS–2Cl while the lowest mineralization values were showed for FeS–0.25Cl, and FeS–0.5Cl sulphated catalysts. These results are in agreement with photocatalytic activity results.
Figure 14. TOC results for FeS–0.25Cl, FeS–0.5Cl, FeS–2Cl and FeS–3Cl catalysts in visible-light region.
3. Discussion
Figure 13. Phenol degradation with oxide and sulphide catalyst.
Table 6. Degradation results on visible-light region.
Oxide % Degradation Sulphide % Degradation
Dark 3.8 Dark 3.8
Photolysis 5.77 Photolysis 5.77
TiO2 5.85 TiO2 7.87
Fe–0.25Cl 12.5 FeS–0.25Cl 29.2
Fe–0.5Cl 18.9 FeS–0.5Cl 26.4
Fe–Cl 16.6 FeS–Cl 31.7
Fe–2Cl 28.9 FeS–2Cl 48.5
Fe–3Cl 26.7 FeS–3Cl 42.4
Catalysts 2022, 12, x FOR PEER REVIEW 13 of 22
Photolysis 5.77 Photolysis 5.77 TiO2 5.85 TiO2 7.87
Fe–0.25Cl 12.5 FeS–0.25Cl 29.2 Fe–0.5Cl 18.9 FeS–0.5Cl 26.4
Fe–Cl 16.6 FeS–Cl 31.7 Fe–2Cl 28.9 FeS–2Cl 48.5 Fe–3Cl 26.7 FeS–3Cl 42.4
Figure 13. Phenol degradation with oxide and sulphide catalyst.
Total Organic Carbon (TOC) Analysis The TOC results for sulphated catalysts are presented in Figure 14. The mineraliza-
tion percentage for FeS–0.25Cl, FeS–0.5Cl, FeS–2Cl and FeS–3Cl catalysts presented 11.0%, 10.0%, 40.0% and 23.0%, respectively. The highest mineralization was exhibited for FeS–2Cl while the lowest mineralization values were showed for FeS–0.25Cl, and FeS–0.5Cl sulphated catalysts. These results are in agreement with photocatalytic activity results.
Figure 14. TOC results for FeS–0.25Cl, FeS–0.5Cl, FeS–2Cl and FeS–3Cl catalysts in visible-light region.
3. Discussion
Figure 14. TOC results for FeS–0.25Cl, FeS–0.5Cl, FeS–2Cl and FeS–3Cl catalysts in visible-light region.

Catalysts 2022, 12, 457 14 of 22
3. Discussion
Table 7 shows HYDRA-Medusa diagrams that presented the chemical equilibriumdiagrams for the solution impregnation ratio iron/chlorine. In this sense, the catalystsFe–0.25Cl, Fe–0.5Cl and Fe–1.0Cl presented 0.21, 0.41 and 0.70 FeCl fractions species, re-spectively. Additionally, the Fe–0.25Cl, Fe–0.5Cl and Fe–1.0Cl catalysts exhibited lowerdegradation. The Fe–2.0Cl and Fe–3.0Cl showed 0.85 FeCl fraction. Besides, the Fe–2.0Cland Fe–3.0Cl catalysts displayed a higher photocatalytic activity than Fe–0.25Cl, Fe–0.5Cland Fe–1.0Cl materials. At these ratios, 2.0 and 3.0, the area chemical equilibrium be-tween FeCl species located in the interface region and OH groups of the titania support.K. Bourikas, C. Kordulis, and A. Lycourghiotis [45] extensively discussed the adsorptionbetween supports and positive species complexes such as FeCl+, so it will be not consideredin this paper.
Table 7. Chlorine fraction and degradation in the visible-light region.
Catalyst Fe–Cl Fraction Degradation
Fe–0.25Cl 0.21 12.53
Fe–0.5Cl 0.41 18.95
Fe–1.0Cl 0.70 16.64
Fe–2.0Cl 0.85 28.90
Fe–3.0Cl 0.85 26.70
DRS UV–Vis spectra showed a relation between the bandgap for oxide catalysts andthe chlorine concentration presented on Figure 15. On the one hand, the bandgap ofFe–0.25Cl catalyst was 3.01 and the percentage degradation was about 29.0%. On the otherhand, the addition of chlorine species increases the bandgap making suitable for visible-light activation. In this regard, the Fe–2Cl catalyst showed a bandgap value of 3.10 withhigher degradation and mineralization percentage than Fe–0.25Cl. However, the excessconcentrations of chlorine (Fe–3.0Cl) reduced the bandgap and decreased the degradation–mineralization ratio. According to above, the results suggested that chlorine additionincreases the absorbance spectrum for visible-light activation increasing the photocatalyticactivity. However, chlorine in the excess condition reduced the bandgap and mineralization.
Catalysts 2022, 12, x FOR PEER REVIEW 14 of 22
Table 7 shows HYDRA-Medusa diagrams that presented the chemical equilibrium diagrams for the solution impregnation ratio iron/chlorine. In this sense, the catalysts Fe–0.25Cl, Fe–0.5Cl and Fe–1.0 Cl presented 0.21, 0.41 and 0.70 FeCl fractions species, respec-tively. Additionally, the Fe–0.25Cl, Fe–0.5Cl and Fe–1.0 Cl catalysts exhibited lower deg-radation. The Fe–2.0 Cl and Fe–3.0 Cl showed 0.85 FeCl fraction. Besides, the Fe–2.0Cl and Fe–3.0 Cl catalysts displayed a higher photocatalytic activity than Fe–0.25Cl, Fe–0.5Cl and Fe–1.0Cl materials. At these ratios, 2.0 and 3.0, the area chemical equilibrium between FeCl species located in the interface region and OH groups of the titania support. K. Bou-rikas, C. Kordulis, and A. Lycourghiotis [45] extensively discussed the adsorption be-tween supports and positive species complexes such as FeCl+, so it will be not considered in this paper.
Table 7. Chlorine fraction and degradation in the visible-light region.
Catalyst Fe–Cl Fraction Degradation Fe–0.25Cl 0.21 12.53 Fe–0.5Cl 0.41 18.95 Fe–1.0Cl 0.70 16.64 Fe–2.0Cl 0.85 28.90 Fe–3.0Cl 0.85 26.70
DRS UV–Vis spectra showed a relation between the bandgap for oxide catalysts and the chlorine concentration presented on Figure 15. On the one hand, the bandgap of Fe–0.25Cl catalyst was 3.01 and the percentage degradation was about 29.0%. On the other hand, the addition of chlorine species increases the bandgap making suitable for visible-light activation. In this regard, the Fe–2Cl catalyst showed a bandgap value of 3.10 with higher degradation and mineralization percentage than Fe–0.25Cl. However, the excess concentrations of chlorine (Fe–3.0Cl) reduced the bandgap and decreased the degrada-tion–mineralization ratio. According to above, the results suggested that chlorine addition increases the absorbance spectrum for visible-light activation increasing the photocata-lytic activity. However, chlorine in the excess condition reduced the bandgap and miner-alization.
Figure 15. Oxide band gap vs. degradation and mineralization ratio.
Table 8 presents the Fe2+/Fe3+ ratio observed in TPR. The Fe2+/Fe3+ ratio showed that the degradation and mineralization incremented simultaneously until Fe2+/Fe3+ ratio at 0.77 (Figure 16). The Fe2+/Fe3+ at 0.84 exhibited a decrement of phenol degradation and
Figure 15. Oxide band gap vs. degradation and mineralization ratio.

Catalysts 2022, 12, 457 15 of 22
Table 8 presents the Fe2+/Fe3+ ratio observed in TPR. The Fe2+/Fe3+ ratio showed thatthe degradation and mineralization incremented simultaneously until Fe2+/Fe3+ ratio at0.77 (Figure 16). The Fe2+/Fe3+ at 0.84 exhibited a decrement of phenol degradation andmineralization. In this regard, the TPR results suggested that the addition of chlorine in theFe photocatalyst increased the Fe2+ species and decreased redox temperature. In addition,the Fe2+ species promotes photoactivity and mineralization ratios.
Table 8. Catalyst temperatures and reduction areas.
Catalyst Fe3+ Reduction Area Fe2+ Reduction Area Fe2+/Fe3+ Ratio
Fe–0.25Cl 423 ◦C 7099.04 705 ◦C 754.21 0.10
Fe–0.5Cl 482 ◦C 17,797.61 707 ◦C 1865.48 0.10
Fe–Cl 540 ◦C 16,684.97 711 ◦C 9459.16 0.56
Fe–2Cl 600 ◦C 4173.65 674 ◦C 3233.58 0.77
Fe–3Cl 590 ◦C 16,352.44 671 ◦C 13,804.88 0.84
Catalysts 2022, 12, x FOR PEER REVIEW 15 of 22
mineralization. In this regard, the TPR results suggested that the addition of chlorine in the Fe photocatalyst increased the Fe2+ species and decreased redox temperature. In addi-tion, the Fe2+ species promotes photoactivity and mineralization ratios.
Table 8. Catalyst temperatures and reduction areas.
Catalyst Fe3+ Reduc-tion
Area Fe2+ Reduc-tion
Area Fe2+/Fe3+ Ratio
Fe–0.25Cl 423 °C 7099.04 705 °C 754.21 0.10 Fe–0.5Cl 482 °C 17,797.61 707 °C 1865.48 0.10
Fe–Cl 540 °C 16,684.97 711 °C 9459.16 0.56 Fe–2Cl 600 °C 4173.65 674 °C 3233.58 0.77 Fe–3Cl 590 °C 16,352.44 671 °C 13,804.88 0.84
Figure 16. Fe2+/Fe3+ ratio vs. degradation and mineralization.
Figure 17 shows Fe2+ reduction temperature vs. degradation and mineralization ac-tivity. The Fe2+ reduction temperature at 670 °C presented 40% and 50% of phenol miner-alization and degradation, respectively. The Fe2+ reduction temperature at 710 C presented 10% and 20% of phenol mineralization and degradation, respectively. This result suggests that the temperature reduction in Fe2+ influenced on photocatalytic activity. The reduction in Fe2+ at a lower temperature is related to the moderate-strength metal–support interac-tion. The temperature shift in Fe2+ reduction could be related to an increment of sulfuriza-tion degree.
The diagrams HYDRA-MEDUSA and Raman results suggested that the formation of Fe–Cl species was replaced by sulphide species after the sulfurization process [46]. This behaviour could possibly br attributed to the formation of chlorine–sulphur bonds. In ad-dition, chlorine–sulphur bounds are known to be unstable at ambient conditions [46]. The sulphide–oxide ratio is seen in Table 9 and Figure 18. The sulphide–oxide ratio results showed that the sulphurisation degree was similar for all catalysts.
Table 9. Oxide–sulphide relation.
Catalyst 𝐒𝐲𝐎𝐱
Raman
𝐒𝐲 𝐎𝐱 XPS
% Degradation % Mineraliza-tion
FeS–0.25Cl 0.6243 0.6464 29.23 11 FeS–0.5Cl 0.6145 0.6404 26.49 10
Figure 16. Fe2+/Fe3+ ratio vs. degradation and mineralization.
Figure 17 shows Fe2+ reduction temperature vs. degradation and mineralizationactivity. The Fe2+ reduction temperature at 670 ◦C presented 40% and 50% of phenolmineralization and degradation, respectively. The Fe2+ reduction temperature at 710 Cpresented 10% and 20% of phenol mineralization and degradation, respectively. This resultsuggests that the temperature reduction in Fe2+ influenced on photocatalytic activity. Thereduction in Fe2+ at a lower temperature is related to the moderate-strength metal–supportinteraction. The temperature shift in Fe2+ reduction could be related to an increment ofsulfurization degree.
The diagrams HYDRA-MEDUSA and Raman results suggested that the formation ofFe–Cl species was replaced by sulphide species after the sulfurization process [46]. Thisbehaviour could possibly br attributed to the formation of chlorine–sulphur bonds. Inaddition, chlorine–sulphur bounds are known to be unstable at ambient conditions [46].The sulphide–oxide ratio is seen in Table 9 and Figure 18. The sulphide–oxide ratio resultsshowed that the sulphurisation degree was similar for all catalysts.

Catalysts 2022, 12, 457 16 of 22
Catalysts 2022, 12, x FOR PEER REVIEW 16 of 22
FeS–Cl 0.6112 0.6351 31.73 15 FeS–2Cl 0.6095 0.6176 48.93 40 FeS–3Cl 0.6050 0.6038 42.49 23
Figure 17. Fe2+ temperature reduction vs. degradation and mineralization percentage.
Figure 18. Sulphur–oxide versus degradation ratio.
In addition, the difference in photoactivity could be attributed to the formation of FeS species. In this sense, X-ray photoelectron spectra (XPS) at a low resolution were used to calculate the S and Fe ratios (Table 10 and Figure 19). The S/Fe ratio results indicated that species S promotes photoreactions and mineralization rates. Fe–Sy species presented higher activity than Fe–Ox species.
Table 10. S/Fe ratio.
XPS FeS–0.25Cl FeS–0.5Cl FeS–Cl FeS–2Cl FeS–3Cl S2p/Fe2p Ratio 0.2878 0.091 0.6617 1.073 0.3658
XPS diagrams were used to calculate bandgap after sulphurisation (Table 11 and Fig-ure 20). The presence of S in the catalysts showed a 3% decrease in the bandgap. However, this slight decrease in bandgap was not attributed to photoactivity. An increase in activity
Figure 17. Fe2+ temperature reduction vs. degradation and mineralization percentage.
Table 9. Oxide–sulphide relation.
CatalystSyOx
Raman
SyOx
XPS% Degradation % Mineralization
FeS–0.25Cl 0.6243 0.6464 29.23 11
FeS–0.5Cl 0.6145 0.6404 26.49 10
FeS–Cl 0.6112 0.6351 31.73 15
FeS–2Cl 0.6095 0.6176 48.93 40
FeS–3Cl 0.6050 0.6038 42.49 23
Catalysts 2022, 12, x FOR PEER REVIEW 16 of 22
FeS–Cl 0.6112 0.6351 31.73 15 FeS–2Cl 0.6095 0.6176 48.93 40 FeS–3Cl 0.6050 0.6038 42.49 23
Figure 17. Fe2+ temperature reduction vs. degradation and mineralization percentage.
Figure 18. Sulphur–oxide versus degradation ratio.
In addition, the difference in photoactivity could be attributed to the formation of FeS species. In this sense, X-ray photoelectron spectra (XPS) at a low resolution were used to calculate the S and Fe ratios (Table 10 and Figure 19). The S/Fe ratio results indicated that species S promotes photoreactions and mineralization rates. Fe–Sy species presented higher activity than Fe–Ox species.
Table 10. S/Fe ratio.
XPS FeS–0.25Cl FeS–0.5Cl FeS–Cl FeS–2Cl FeS–3Cl S2p/Fe2p Ratio 0.2878 0.091 0.6617 1.073 0.3658
XPS diagrams were used to calculate bandgap after sulphurisation (Table 11 and Fig-ure 20). The presence of S in the catalysts showed a 3% decrease in the bandgap. However, this slight decrease in bandgap was not attributed to photoactivity. An increase in activity
Figure 18. Sulphur–oxide versus degradation ratio.
In addition, the difference in photoactivity could be attributed to the formation ofFeS species. In this sense, X-ray photoelectron spectra (XPS) at a low resolution were usedto calculate the S and Fe ratios (Table 10 and Figure 19). The S/Fe ratio results indicatedthat species S promotes photoreactions and mineralization rates. Fe–Sy species presentedhigher activity than Fe–Ox species.

Catalysts 2022, 12, 457 17 of 22
Table 10. S/Fe ratio.
XPS FeS–0.25Cl FeS–0.5Cl FeS–Cl FeS–2Cl FeS–3Cl
S2p/Fe2p Ratio 0.2878 0.091 0.6617 1.073 0.3658
Catalysts 2022, 12, x FOR PEER REVIEW 17 of 22
can be attributed to the formation of FeS that provides reducing properties, promoting electron exchange. The bandgap of (3.05 eV) at equilibrium conditions (FeS–2Cl) achieved the highest degradation and mineralization rates.
The results suggested that the addition of chlorine on catalysts promotes the creation of Fe2+ species. In addition, Fe2+ species increase FeS formation rising phenol degradation and mineralization.
Figure 19. S2p/Fe2p vs. Degradation and Mineralization.
Table 11. Oxide-band-gap to sulphide-band-gap ratio.
Catalyst Band Gap 𝐎𝐱 Catalyst Band
Gap 𝐒𝐲 𝐁𝐠 𝐒𝐲 𝐁𝐠 𝐎𝐱
% Degrada-tion
% Minerali-zation
Fe–0.25Cl 3.01 FeS–0.25Cl 2.90 0.96 29.23 11.0 Fe–0.5Cl 2.90 FeS–0.5Cl 2.82 0.97 26.49 10.0
Fe–Cl 3.15 FeS–Cl 3.10 0.98 31.73 15.0 Fe–2Cl 3.10 FeS–2Cl 3.05 0.98 48.93 40.0 Fe–3Cl 3.02 FeS–3Cl 2.95 0.97 42.49 23.0
Figure 20. Sulphide band gap vs. degradation and mineralization ratio.
Figure 19. S2p/Fe2p vs. Degradation and Mineralization.
XPS diagrams were used to calculate bandgap after sulphurisation (Table 11 andFigure 20). The presence of S in the catalysts showed a 3% decrease in the bandgap.However, this slight decrease in bandgap was not attributed to photoactivity. An increasein activity can be attributed to the formation of FeS that provides reducing properties,promoting electron exchange. The bandgap of (3.05 eV) at equilibrium conditions (FeS–2Cl)achieved the highest degradation and mineralization rates.
Table 11. Oxide-band-gap to sulphide-band-gap ratio.
Catalyst Band Gap Ox Catalyst Band Gap SyBg SyBg Ox
%Degradation
%Mineralization
Fe–0.25Cl 3.01 FeS–0.25Cl 2.90 0.96 29.23 11.0
Fe–0.5Cl 2.90 FeS–0.5Cl 2.82 0.97 26.49 10.0
Fe–Cl 3.15 FeS–Cl 3.10 0.98 31.73 15.0
Fe–2Cl 3.10 FeS–2Cl 3.05 0.98 48.93 40.0
Fe–3Cl 3.02 FeS–3Cl 2.95 0.97 42.49 23.0
The results suggested that the addition of chlorine on catalysts promotes the creationof Fe2+ species. In addition, Fe2+ species increase FeS formation rising phenol degradationand mineralization.
According to Dehua Xia, Yan Li, Guocheng Huang, Chi Ching Fong, Taicheng An,Guiying Li, Ho Yin Yip, Hunjun Zhao, Anhuai Lu, and Po Keung Wong, the conductionband (CB) of Fe2O3 is more favourable than that of FeS2. Moreover, this has a more negativevalence band (VB) than FeS2. These suggestions led to the discovery that photogeneratedelectrons transfer from the CB of FeS2 to the CB of Fe2O3 and, finally, to the VB of theFeS2 [47]. The energy band configuration of the photocatalyst system could significantlypromote the separation efficiency of photogenerated electron-hole pairs [42,48]. Addition-ally, some reports suggested that calcination at high temperatures and with a fast-heatingrate could produce oxygen or sulphur vacancies in the mineral structure [49,50].

Catalysts 2022, 12, 457 18 of 22
Catalysts 2022, 12, x FOR PEER REVIEW 17 of 22
can be attributed to the formation of FeS that provides reducing properties, promoting electron exchange. The bandgap of (3.05 eV) at equilibrium conditions (FeS–2Cl) achieved the highest degradation and mineralization rates.
The results suggested that the addition of chlorine on catalysts promotes the creation of Fe2+ species. In addition, Fe2+ species increase FeS formation rising phenol degradation and mineralization.
Figure 19. S2p/Fe2p vs. Degradation and Mineralization.
Table 11. Oxide-band-gap to sulphide-band-gap ratio.
Catalyst Band Gap 𝐎𝐱 Catalyst Band
Gap 𝐒𝐲 𝐁𝐠 𝐒𝐲 𝐁𝐠 𝐎𝐱
% Degrada-tion
% Minerali-zation
Fe–0.25Cl 3.01 FeS–0.25Cl 2.90 0.96 29.23 11.0 Fe–0.5Cl 2.90 FeS–0.5Cl 2.82 0.97 26.49 10.0
Fe–Cl 3.15 FeS–Cl 3.10 0.98 31.73 15.0 Fe–2Cl 3.10 FeS–2Cl 3.05 0.98 48.93 40.0 Fe–3Cl 3.02 FeS–3Cl 2.95 0.97 42.49 23.0
Figure 20. Sulphide band gap vs. degradation and mineralization ratio. Figure 20. Sulphide band gap vs. degradation and mineralization ratio.
Figure 21 shows a proposed schematic diagram of the energy band configuration,obtained from conduction band and valence band values from XPS diagrams. PotentialOH * and O * values were presented by Dehua Xia, Yan Li, Guocheng Huang, Chi ChingFong, Taicheng An, Guiying Li, Ho Yin Yip, Hunjun Zhao, Anhuai Lu, and Po Keung Wong.2015 [47]. Figure 21 shows the position of the valence and conduction band of FeS–Clcatalysts. The conduction band was obtained throughout XPS diagrams using the positionof the Fermi level [44]. The valence band position was estimated by adding the band gapenergy obtained from XPS O1s diagram. The Eg is the minimum energy required to excitean electron from the valence band to the conduction band. On the other hand, FeOx andFeSy phases are present in the sulfided materials. However, only one valence band andconduction band are shown for each one. In this regard, the FeSy–FeOx composite is a newmaterial chemically linked with novelty physical and chemical properties. The band gap,the valence band and the conduction band can be tuned by modifying S/Fe composition.The reduction potential of the photogenerated electrons for the most active compositeFeS–2Cl is more negative. Therefore, there was a larger energy available to performthe O2/*O2
− production. The proposed results suggested that the potential formationof superoxide and peroxide ions produced a higher photocatalytic and mineralizationratio. Additionally, the possible formation of hydroxide and peroxide ions reduced thedegradation–mineralization ratio.
Catalysts 2022, 12, x FOR PEER REVIEW 18 of 22
According to Dehua Xia, Yan Li, Guocheng Huang, Chi Ching Fong, Taicheng An, Guiying Li, Ho Yin Yip, Hunjun Zhao, Anhuai Lu, and Po Keung Wong, the conduction band (CB) of Fe2O3 is more favourable than that of FeS2. Moreover, this has a more nega-tive valence band (VB) than FeS2. These suggestions led to the discovery that photogener-ated electrons transfer from the CB of FeS2 to the CB of Fe2O3 and, finally, to the VB of the FeS2 [47]. The energy band configuration of the photocatalyst system could significantly promote the separation efficiency of photogenerated electron-hole pairs [42,48]. Addition-ally, some reports suggested that calcination at high temperatures and with a fast-heating rate could produce oxygen or sulphur vacancies in the mineral structure [49,50].
Figure 21 shows a proposed schematic diagram of the energy band configuration, obtained from conduction band and valence band values from XPS diagrams. Potential OH * and O * values were presented by Dehua Xia, Yan Li, Guocheng Huang, Chi Ching Fong, Taicheng An, Guiying Li, Ho Yin Yip, Hunjun Zhao, Anhuai Lu, and Po Keung Wong. 2015 [47]. Figure 21 shows the position of the valence and conduction band of FeS–Cl catalysts. The conduction band was obtained throughout XPS diagrams using the po-sition of the Fermi level [44]. The valence band position was estimated by adding the band gap energy obtained from XPS O1s diagram. The Eg is the minimum energy required to excite an electron from the valence band to the conduction band. On the other hand, FeOx and FeSy phases are present in the sulfided materials. However, only one valence band and conduction band are shown for each one. In this regard, the FeSy–FeOx composite is a new material chemically linked with novelty physical and chemical properties. The band gap, the valence band and the conduction band can be tuned by modifying S/Fe compo-sition. The reduction potential of the photogenerated electrons for the most active compo-site FeS–2Cl is more negative. Therefore, there was a larger energy available to perform the O2/*O2− production. The proposed results suggested that the potential formation of superoxide and peroxide ions produced a higher photocatalytic and mineralization ratio. Additionally, the possible formation of hydroxide and peroxide ions reduced the degra-dation–mineralization ratio.
Figure 21. Proposed schematic diagram of the energy band configuration of sulphide catalyst het-erojunction.
4. Materials and Methods
Figure 21. Proposed schematic diagram of the energy band configuration of sulphide catalystheterojunction.

Catalysts 2022, 12, 457 19 of 22
4. Materials and Methods
HYDRA program was used to calculate the fraction Fe and Cl species in solution. Theiron and chlorine solutions were obtained from the salts FeN3O9 and NaCl, respectively.The iron solution at 5.68 M was modified with chlorine solution at different molar ratioFe/Cl: 0.25, 0.5, 1.0, 2.0, 3.0. The synthesis of the catalysts was carried out by incipientimpregnation. FeN3O9 salt was fixed at 0.82 gr corresponding to 10.0% w per 1.0 gr ofcatalyst. NaCl salt weight was modified according with the concentration desired. Theionized water volume was added in FeN3O9 and NaCl salts according to support totalvolume (0.35 mL per gram of support). This mixed solution was calcinated on a VULCAN3-1750 furnace. Furnace conditions were:
• Ramp 1, drying: 5 ◦C per minute until reaching 120 ◦C and remained at that tempera-ture for 3 h.
• Ramp 2, calcination: 10 ◦C per minute until reaching 300 ◦C and remained at thattemperature for 5 h.
• Ramp 3, cooling: 5 ◦C per minute until reaching 50 ◦C and remained at that tempera-ture for 3 h.
These catalysts were sulphated at 300 ◦C for 1 h and named by the acronyms: TiO2S,FeS–0.25Cl/TiO2, FeS–0.5Cl/TiO2, FeS–Cl/TiO2, FeS–2Cl/TiO2, FeS–3Cl/TiO2.
Characterization of the Synthesized Photocatalysts
Raman spectrometry characterizations were performed with a Thermo ScientificDXR2 equipment with microscope. The sample was placed in the sampler of the equipmentwhere it was analysed with the OMNIC program from 0 to 3500 Raman length, a generalsweep was performed and a sweep to the bands of interest. Repetitions per catalyst wereperformed and an average of analysis was worked on for the appropriate study.
Diffuse reflectance technique (DRS UV–Vis) was obtained with a Cary-100 spectropho-tometer using an optical length of 0.2 cm and a diffuse reflectance integrating sphere in therange of 190 to 400 nm, using barium sulphate (BaSO4) as a reference.
Temperature-programmed reduction (TPR) experiments for solids were carried outon an AMI-90 apparatus (Altamira) equipped with a thermal conductivity detector (TCD).About 50 mg of a sample was placed in a quartz sample cell (U-shaped) for each anal-ysis. The samples were pre-treated in situ at 373 K for 1 h under Air flow to removefissured impurities. The reduction step was performed under a stream of (10 vol.%) H2/Ar(50 cm3 min−1), with a heating rate of 10 K min−1 up to 1073 K. A thermal conductivitydetector was used to determine variations in the hydrogen composition of the outputstream. A moisture trap was used to avoid interferences in the measurements.
X-ray photoelectron spectrometry (XPS) equipment was used for the determination ofoxidation states of components. Abundance and semi-quantitative analysis of components:Fe, S, Cl, Ti, O. Level binding energy: 2p3/2, 2p1/2 of Fe; 2p3/2, 2p1/2 of S; 2p3/2, 2p1/2 ofCl; 2p3/2, 2p1/2 of Ti; 1s of O. High resolution determination of Fe 2p in the region 730 to700 eV; S 2p in the region 170 to 150 eV; Cl 2p in the region 204 to 194 eV; Ti 2p in the region470 to 450 eV; O 1s in the region 540 to 520 eV. High resolution determination of C1s asa reference.
The photocatalytic visible-light reactions were carried out in a 0.75 L double jacketedPyrex® batch reactor with a white LED lamp (λ = 450 nm and 550 nm, 78.5 W m−2). Thelamp was placed vertically at the top of the reactor, and airflow was added throughoutthe reaction. The phenolic solution was kept for 30 min under stirring (600 rpm) andin the dark for adequate dissolution of the contaminant. Subsequently, the catalyst wasinjected and kept for another 30 min under the same conditions to establish the adsorptionpre-equilibrium; then, the lamp was switched on for six h. The samples were analysed in aUV–Vis Lambda 20 spectrometer and a Shimadzu TOC-Lcph/n total organic carbon (TOC)instrument for degradation, and mineralization rates, respectively. The amounts of catalystand phenol were 1 g L−1 and 40 mg L−1, respectively.

Catalysts 2022, 12, 457 20 of 22
5. Conclusions
In summary, a novel material was developed for the photocatalytic degradation ofphenol on visible-light irradiation. Sulphur addition increased photoactivity over 40%compared to oxide catalysts. The results indicated that adding chlorine to photocatalystspromotes the reduction state Fe3+ to Fe2+, thus improving the formation of FeS species aftersulphurisation having greater photocatalytic activity. However, excess chlorine conditionsreduce sulphur species, reducing degradation and mineralization. For visible-light studies,sulphide species (Fe–Sy) maintain the bandgap and promote the formation of superoxideand peroxide ions, producing higher degradation and mineralization rates. In addition,oxide species (Fe–Ox) promote hydroxide and peroxide ions, producing high degradationslevels but lower mineralization rates.
Author Contributions: D.A.-B.: Validation, Writing—original draft, Methodology, Investigation,Data curation, Formal analysis, Conceptualization. F.S.-M.: Resources, Supervision, Conceptualiza-tion, Project administration. V.S.: Supervision, Project administration, Conceptualization. I.C.R.-I.:Supervision, Visualization, Data curation, Project administration. J.A.d.l.R.H.: Resources, Fundingacquisition, Visualization. R.R.-E.: Data curation, Project administration, Resources. F.T.-M.: Re-sources, Project administration, Visualization. C.E.S.-V.: Resources, Funding acquisition, Supervision,Writing—review & editing, Conceptualization. All authors have read and agreed to the publishedversion of the manuscript.
Funding: This research was funded by Conacyt project “Desarollo de innovaciones tecnológicas parauna agricultura mexicana libre de Agroainsumos tóxicos” #316022, Proyect SIP-IPN #20221110 and#20220568.
Conflicts of Interest: The authors declare no conflict of interest.
References1. Humayun, M.; Raziq, F.; Khan, A.; Luo, W. Modification strategies of TiO2 for potential applications in photocatalysis: A critical
review. Green Chem. Lett. Rev. 2018, 11, 86–102. [CrossRef]2. Stagi, L.; Carbonaro, C.M.; Corpino, R.; Chiriu, D.; Ricci, P.C. Light induced TiO2 phase transformation: Correlation with
luminescent surface defects. Phys. Status Solidi (B) 2015, 252, 124–129. [CrossRef]3. Moose. Summary of Environmental Law in Mexico. Available online: https://moose.cec.org/moose/lawdatabase/mxdoc.cfm?
varlan=english&topic=9 (accessed on 3 June 2003).4. Anku, W.W.; Mamo, M.A.; Govender, P.P. Phenolic Compounds in Water: Sources, Reactivity, Toxicity and Treatment Methods.
In Phenolic Compounds—Natural Sources, Importance and Applications; IntechOpen: London, UK, 2017; Available online: https://www.intechopen.com/chapters/53973 (accessed on 10 April 2022).
5. Ghime, D.; Ghosh, P. Advanced Oxidation Processes: A Powerful Treatment Option for the Removal of Recalcitrant OrganicCompounds. In Advanced Oxidation Processes-Applications, Trends, and Prospects; IntechOpen: London, UK, 2020; pp. 1–12.
6. Esplugas, S.; Giménez, J.; Contreras, S.; Pascual, E.; Rodríguez, M. Comparison of different advanced oxidation processes forphenol degradation. Water Res. 2002, 36, 1034–1042. [CrossRef]
7. Herrmann, J.M.; Duchamp, C.; Karkmaz, M.; Hoai, B.T.; Lachheb, H.; Puzenat, E.; Guillard, C. Environmental green chemistry asdefined by photocatalysis. J. Hazard. Mater. 2007, 146, 624–629. [CrossRef] [PubMed]
8. Hoffmann, M.R.; Martin, S.T.; Choi, W.; Bahnemann, D.W. Environmental Applications of Semiconductor Photocatalysis. Chem.Rev. 1995, 95, 69–96. [CrossRef]
9. Maeda, K. Photocatalytic water splitting using semiconductor particles: History and recent developments. J. Photochem. Photobiol.C Photochem. Rev. 2011, 12, 237–268. [CrossRef]
10. Dursun, G.; Çiçek, H.; Dursun, A.Y. Adsorption of phenol from aqueous solution by using carbonised beet pulp. J. Hazard. Mater.2005, 125, 175–182. [CrossRef]
11. Ugurlu, M.; Gurses, A.; Yalcin, M.; Dogar, C. Removal of phenolic and lignin compounds from bleached kraft mill effluent by flyash and sepiolite. Adsorption 2005, 11, 87–97. [CrossRef]
12. Al-Kandari, H.; Abdullah, A.; Mohamed, A.; Al-Kandari, S. Enhanced photocatalytic degrada tion of a phenolic compounds’mixture using a highly efficient TiO2/reduced graphene oxide nanocomposite. J. Mater. Sci. 2016, 51, 8331–8345. [CrossRef]
13. Zhu, Y.; Liu, Y.; Ai, Q.; Gao, G.; Yuan, L.; Fang, Q.; Tian, X.; Zhang, X.; Egap, E.; Ajayan, P.M.; et al. In Situ Synthesis of Lead-FreeHalide Perovskite–COF Nanocomposites as Photocatalysts for Photoinduced Polymerization in Both Organic and AqueousPhases. ACS Mater. Lett. 2022, 4, 464–471. [CrossRef]
14. Abdollahi, Y.; Abdullah, A.H.; Zainal, Z.; Yusof, N.A. Photocatalytic degradation of p-Cresol by zinc oxide under UV irradiation.Int. J. Mol. Sci. 2012, 13, 302–315. [CrossRef] [PubMed]
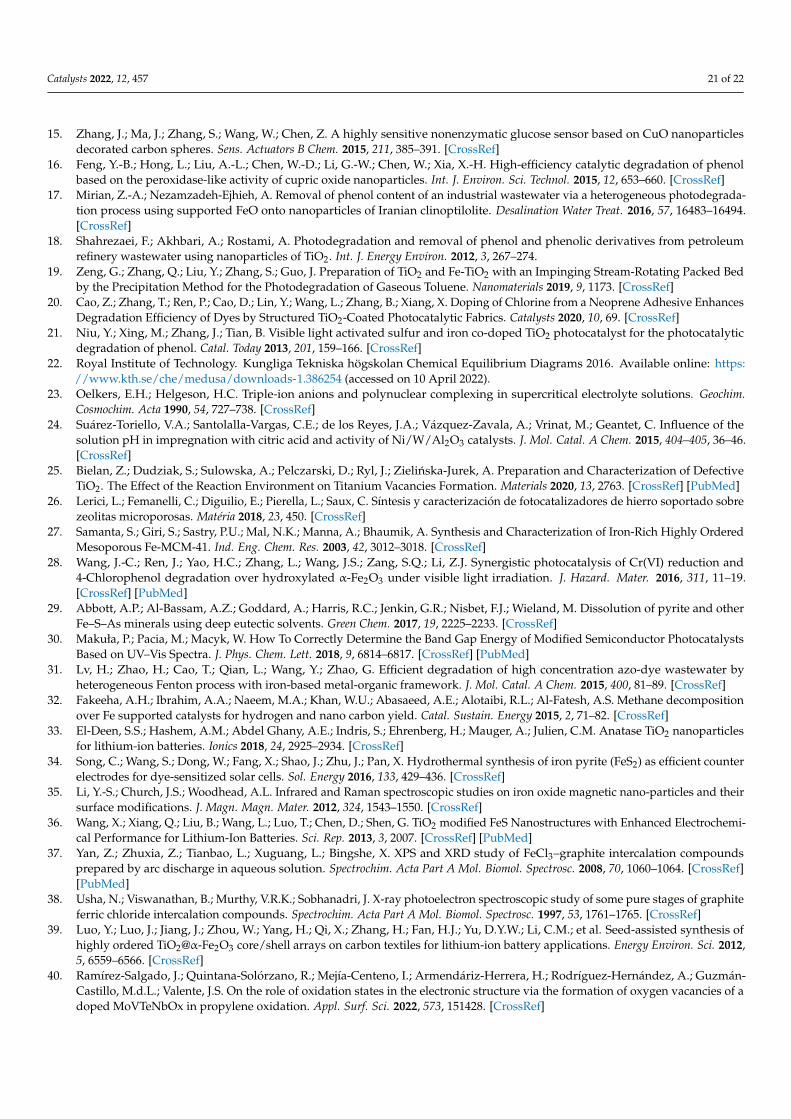
Catalysts 2022, 12, 457 21 of 22
15. Zhang, J.; Ma, J.; Zhang, S.; Wang, W.; Chen, Z. A highly sensitive nonenzymatic glucose sensor based on CuO nanoparticlesdecorated carbon spheres. Sens. Actuators B Chem. 2015, 211, 385–391. [CrossRef]
16. Feng, Y.-B.; Hong, L.; Liu, A.-L.; Chen, W.-D.; Li, G.-W.; Chen, W.; Xia, X.-H. High-efficiency catalytic degradation of phenolbased on the peroxidase-like activity of cupric oxide nanoparticles. Int. J. Environ. Sci. Technol. 2015, 12, 653–660. [CrossRef]
17. Mirian, Z.-A.; Nezamzadeh-Ejhieh, A. Removal of phenol content of an industrial wastewater via a heterogeneous photodegrada-tion process using supported FeO onto nanoparticles of Iranian clinoptilolite. Desalination Water Treat. 2016, 57, 16483–16494.[CrossRef]
18. Shahrezaei, F.; Akhbari, A.; Rostami, A. Photodegradation and removal of phenol and phenolic derivatives from petroleumrefinery wastewater using nanoparticles of TiO2. Int. J. Energy Environ. 2012, 3, 267–274.
19. Zeng, G.; Zhang, Q.; Liu, Y.; Zhang, S.; Guo, J. Preparation of TiO2 and Fe-TiO2 with an Impinging Stream-Rotating Packed Bedby the Precipitation Method for the Photodegradation of Gaseous Toluene. Nanomaterials 2019, 9, 1173. [CrossRef]
20. Cao, Z.; Zhang, T.; Ren, P.; Cao, D.; Lin, Y.; Wang, L.; Zhang, B.; Xiang, X. Doping of Chlorine from a Neoprene Adhesive EnhancesDegradation Efficiency of Dyes by Structured TiO2-Coated Photocatalytic Fabrics. Catalysts 2020, 10, 69. [CrossRef]
21. Niu, Y.; Xing, M.; Zhang, J.; Tian, B. Visible light activated sulfur and iron co-doped TiO2 photocatalyst for the photocatalyticdegradation of phenol. Catal. Today 2013, 201, 159–166. [CrossRef]
22. Royal Institute of Technology. Kungliga Tekniska högskolan Chemical Equilibrium Diagrams 2016. Available online: https://www.kth.se/che/medusa/downloads-1.386254 (accessed on 10 April 2022).
23. Oelkers, E.H.; Helgeson, H.C. Triple-ion anions and polynuclear complexing in supercritical electrolyte solutions. Geochim.Cosmochim. Acta 1990, 54, 727–738. [CrossRef]
24. Suárez-Toriello, V.A.; Santolalla-Vargas, C.E.; de los Reyes, J.A.; Vázquez-Zavala, A.; Vrinat, M.; Geantet, C. Influence of thesolution pH in impregnation with citric acid and activity of Ni/W/Al2O3 catalysts. J. Mol. Catal. A Chem. 2015, 404–405, 36–46.[CrossRef]
25. Bielan, Z.; Dudziak, S.; Sulowska, A.; Pelczarski, D.; Ryl, J.; Zielinska-Jurek, A. Preparation and Characterization of DefectiveTiO2. The Effect of the Reaction Environment on Titanium Vacancies Formation. Materials 2020, 13, 2763. [CrossRef] [PubMed]
26. Lerici, L.; Femanelli, C.; Diguilio, E.; Pierella, L.; Saux, C. Síntesis y caracterización de fotocatalizadores de hierro soportado sobrezeolitas microporosas. Matéria 2018, 23, 450. [CrossRef]
27. Samanta, S.; Giri, S.; Sastry, P.U.; Mal, N.K.; Manna, A.; Bhaumik, A. Synthesis and Characterization of Iron-Rich Highly OrderedMesoporous Fe-MCM-41. Ind. Eng. Chem. Res. 2003, 42, 3012–3018. [CrossRef]
28. Wang, J.-C.; Ren, J.; Yao, H.C.; Zhang, L.; Wang, J.S.; Zang, S.Q.; Li, Z.J. Synergistic photocatalysis of Cr(VI) reduction and4-Chlorophenol degradation over hydroxylated α-Fe2O3 under visible light irradiation. J. Hazard. Mater. 2016, 311, 11–19.[CrossRef] [PubMed]
29. Abbott, A.P.; Al-Bassam, A.Z.; Goddard, A.; Harris, R.C.; Jenkin, G.R.; Nisbet, F.J.; Wieland, M. Dissolution of pyrite and otherFe–S–As minerals using deep eutectic solvents. Green Chem. 2017, 19, 2225–2233. [CrossRef]
30. Makuła, P.; Pacia, M.; Macyk, W. How To Correctly Determine the Band Gap Energy of Modified Semiconductor PhotocatalystsBased on UV–Vis Spectra. J. Phys. Chem. Lett. 2018, 9, 6814–6817. [CrossRef] [PubMed]
31. Lv, H.; Zhao, H.; Cao, T.; Qian, L.; Wang, Y.; Zhao, G. Efficient degradation of high concentration azo-dye wastewater byheterogeneous Fenton process with iron-based metal-organic framework. J. Mol. Catal. A Chem. 2015, 400, 81–89. [CrossRef]
32. Fakeeha, A.H.; Ibrahim, A.A.; Naeem, M.A.; Khan, W.U.; Abasaeed, A.E.; Alotaibi, R.L.; Al-Fatesh, A.S. Methane decompositionover Fe supported catalysts for hydrogen and nano carbon yield. Catal. Sustain. Energy 2015, 2, 71–82. [CrossRef]
33. El-Deen, S.S.; Hashem, A.M.; Abdel Ghany, A.E.; Indris, S.; Ehrenberg, H.; Mauger, A.; Julien, C.M. Anatase TiO2 nanoparticlesfor lithium-ion batteries. Ionics 2018, 24, 2925–2934. [CrossRef]
34. Song, C.; Wang, S.; Dong, W.; Fang, X.; Shao, J.; Zhu, J.; Pan, X. Hydrothermal synthesis of iron pyrite (FeS2) as efficient counterelectrodes for dye-sensitized solar cells. Sol. Energy 2016, 133, 429–436. [CrossRef]
35. Li, Y.-S.; Church, J.S.; Woodhead, A.L. Infrared and Raman spectroscopic studies on iron oxide magnetic nano-particles and theirsurface modifications. J. Magn. Magn. Mater. 2012, 324, 1543–1550. [CrossRef]
36. Wang, X.; Xiang, Q.; Liu, B.; Wang, L.; Luo, T.; Chen, D.; Shen, G. TiO2 modified FeS Nanostructures with Enhanced Electrochemi-cal Performance for Lithium-Ion Batteries. Sci. Rep. 2013, 3, 2007. [CrossRef] [PubMed]
37. Yan, Z.; Zhuxia, Z.; Tianbao, L.; Xuguang, L.; Bingshe, X. XPS and XRD study of FeCl3–graphite intercalation compoundsprepared by arc discharge in aqueous solution. Spectrochim. Acta Part A Mol. Biomol. Spectrosc. 2008, 70, 1060–1064. [CrossRef][PubMed]
38. Usha, N.; Viswanathan, B.; Murthy, V.R.K.; Sobhanadri, J. X-ray photoelectron spectroscopic study of some pure stages of graphiteferric chloride intercalation compounds. Spectrochim. Acta Part A Mol. Biomol. Spectrosc. 1997, 53, 1761–1765. [CrossRef]
39. Luo, Y.; Luo, J.; Jiang, J.; Zhou, W.; Yang, H.; Qi, X.; Zhang, H.; Fan, H.J.; Yu, D.Y.W.; Li, C.M.; et al. Seed-assisted synthesis ofhighly ordered TiO2@α-Fe2O3 core/shell arrays on carbon textiles for lithium-ion battery applications. Energy Environ. Sci. 2012,5, 6559–6566. [CrossRef]
40. Ramírez-Salgado, J.; Quintana-Solórzano, R.; Mejía-Centeno, I.; Armendáriz-Herrera, H.; Rodríguez-Hernández, A.; Guzmán-Castillo, M.d.L.; Valente, J.S. On the role of oxidation states in the electronic structure via the formation of oxygen vacancies of adoped MoVTeNbOx in propylene oxidation. Appl. Surf. Sci. 2022, 573, 151428. [CrossRef]

Catalysts 2022, 12, 457 22 of 22
41. Miyazaki, S.; Nishimura, H.; Fukuda, M.; Ley, L.; Ristein, J. Structure and electronic states of ultrathin SiO2 thermally grown onSi(100) and Si(111) surfaces. Appl. Surf. Sci. 1997, 113–114, 585–589. [CrossRef]
42. Scanlon, D.O.; Dunnill, C.W.; Buckeridge, J.; Shevlin, S.A.; Logsdail, A.J.; Woodley, S.M.; Catlow, C.R.A.; Powell, M.J.;Palgrave, R.G.; Parkin, I.P.; et al. Band alignment of rutile and anatase TiO2. Nat. Mater. 2013, 12, 798–801. [CrossRef]
43. Grant, R.W.; Kraut, E.A.; Kowalczyk, S.P.; Waldrop, J.R. Measurement of potential at semiconductor interfaces by electronspectroscopy. J. Vac. Sci. Technol. B Microelectron. Process. Phenom. 1983, 1, 320–327. [CrossRef]
44. Kraut, E.A.; Grant, R.W.; Waldrop, J.R.; Kowalczyk, S.P. Precise Determination of the Valence-Band Edge in X-ray PhotoemissionSpectra: Application to Measurement of Semiconductor Interface Potentials. Phys. Rev. Lett. 1980, 44, 1620–1623. [CrossRef]
45. Bourikas, K.; Kordulis, C.; Lycourghiotis, A. The Role of the Liquid-Solid Interface in the Preparation of Supported Catalysts.Catal. Rev. 2006, 48, 363–444. [CrossRef]
46. Lindquist, B.A.; Dunning, T.H. The nature of the SO bond of chlorinated sulfur–oxygen compounds. Theor. Chem. Acc. 2014,133, 1443. [CrossRef]
47. Xia, D.; Li, Y.; Huang, G.; Fong, C.C.; An, T.; Li, G.; Yip, H.Y.; Zhao, H.; Lu, A.; Wong, P.K. Visible-light-driven inactivation ofEscherichia coli K-12 over thermal treated natural pyrrhotite. Appl. Catal. B Environ. 2015, 176–177, 749–756. [CrossRef]
48. Zhou, P.; Yu, J.; Jaroniec, M. All-Solid-State Z-Scheme Photocatalytic Systems. Adv. Mater. 2014, 26, 4920–4935. [CrossRef]49. Warschkow, O.; Ellis, D.; Hwang, J.; Mansourian-Hadavi, N.; Mason, T. Defects and Charge Transport near the Hematite (0001)
Surface: An Atomistic Study of Oxygen Vacancies. J. Am. Ceram. Soc. 2002, 85, 213–220. [CrossRef]50. Birkholz, M.; Fiechter, S.; Hartmann, A.; Tributsch, H. Sulfur deficiency in iron pyrite FeS2−x and its consequences for band-
structure models. Phys. Rev. B 1991, 43, 11926–11936. [CrossRef]
Related Documents