Synthesis and Characterization of Short Grewia optiva Fiber-Based Polymer Composites Amar S. Singha, Vijay Kumar Thakur Material Science Laboratory, National Institute of Technology, Hamirpur, Himachal Pradesh 177005, India Natural fibers, such as Flax, Sisal, Hibiscus Sabdariffa, and Grewia optiva (GO) possess good reinforcing capability when properly compounded with polymers. These fibers are relatively inexpensive, easily available from renewable resources, and possess favorable val- ues of specific strength and specific modulus. The me- chanical performance of natural fiber-reinforced poly- mers (FRPs) is often limited owing to a weak fiber- matrix interface. In contrast, urea–formaldehyde (UF) resins are well known to have a strong adhesion to most cellulose-containing materials. This article deals with the synthesis of short G. optiva fiber-reinforced UF polymer matrix-based composites. G. optiva fiber- reinforced UF composites processed by compression molding have been studied by evaluating their mechan- ical, physical, and chemical properties. This work reveals that mechanical properties such as: tensile strength, compressive strength, flexural strength, and wear resistance of the UF matrix increase up to 30% fiber loading and then decreases for higher loading when fibers are incorporated into the polymer matrix. Morphological and thermal studies of the matrix, fiber, and short FRP composites have also been carried out. The swelling, moisture absorbance, chemical resist- ance, and water uptake behavior of these composites have also been carried out at different intervals. The results obtained lay emphasis on the utilization of these fibers, as potential reinforcing materials in bio- based polymer composites. POLYM. COMPOS., 31:459– 470, 2010. ª 2009 Society of Plastics Engineers INTRODUCTION Fiber-reinforced polymer (FRP) composites constitute an important proportion of the engineered materials mar- ket ranging from everyday products to sophisticated niche applications [1]. These materials are able to meet diverse design requirements with their good mechanical proper- ties, simplicity in fabrication, economy, and significant weight savings as well as high strength-to-weight ratio compared with the conventional materials. Synthetic fibers such as glass, aramid, carbon fibers, etc. have been exten- sively used over the last decades as reinforcements of polymeric matrices [2–4]. They are incorporated into mat- rices with the main objective of improving the mechanical properties of the polymer reducing the cost of the final products. These synthetic fibers differ in price and me- chanical properties, generally in an inverse manner: the more expensive the fiber, the better the mechanical prop- erties. Recently, the increasing environmental conscious- ness throughout the universe has enforced the researchers from various fields to produce new polymeric materials and processes that improve the ecological quality of a number of products [5–8]. In particular, in the past few years, the synthesis of polymers starting from renewable resources is an object of significant research efforts because of the increasing environmental concerns. The chemistry of the renewable resources applied to the pro- duction of new feasible ecofriendly polymer products is an issue of this research. This issue has captured the global attention of researchers. The growth of natural FRPs has been recently a subject of interest for both sci- entists and technologists [9–11]. Recent developments in the fields of natural fibers have shown that it is possible to obtain an ecofriendly polymeric material that possesses sufficient properties [12–15]. These natural fibers have a number of advantages over synthetic fibers. When com- pared with traditional synthetic fibers, these natural fibers, which have low density, impart the polymer composite various benefits such as lowering of toxicity, low machine wear, less fuel consumption, and a high degree of flexibility [12, 16–18]. These unique properties make the FRP com- posite best material for fabrication of different components in aerospace, automobile, sports, defense, marine industries, etc. [13–15, 19, 20]. In fact, natural fibers have been found to improve the mechanical properties of the reinforced poly- mer matrix and, furthermore, reduce the total weight because of their low density [21, 22]. Polymer composites are the materials which are obtained by embedding fibers in a polymeric matrix to improve its mechanical, thermomechanical, electrical, sound-damping properties, etc. Several methods, such as filament winding process, pultrusion method, vacuum bag- Correspondence to: Amar Singha; e-mail: [email protected] Contract grant sponsor: Ministry of Human Resource Development (MHRD), New Delhi. DOI 10.1002/pc.20825 Published online in Wiley InterScience (www.interscience.wiley.com). V V C 2009 Society of Plastics Engineers POLYMERCOMPOSITES—-2010

Welcome message from author
This document is posted to help you gain knowledge. Please leave a comment to let me know what you think about it! Share it to your friends and learn new things together.
Transcript
Synthesis and Characterization of Short Grewiaoptiva Fiber-Based Polymer Composites
Amar S. Singha, Vijay Kumar ThakurMaterial Science Laboratory, National Institute of Technology, Hamirpur, Himachal Pradesh 177005, India
Natural fibers, such as Flax, Sisal, Hibiscus Sabdariffa,and Grewia optiva (GO) possess good reinforcingcapability when properly compounded with polymers.These fibers are relatively inexpensive, easily availablefrom renewable resources, and possess favorable val-ues of specific strength and specific modulus. The me-chanical performance of natural fiber-reinforced poly-mers (FRPs) is often limited owing to a weak fiber-matrix interface. In contrast, urea–formaldehyde (UF)resins are well known to have a strong adhesion tomost cellulose-containing materials. This article dealswith the synthesis of short G. optiva fiber-reinforcedUF polymer matrix-based composites. G. optiva fiber-reinforced UF composites processed by compressionmolding have been studied by evaluating their mechan-ical, physical, and chemical properties. This workreveals that mechanical properties such as: tensilestrength, compressive strength, flexural strength, andwear resistance of the UF matrix increase up to 30%fiber loading and then decreases for higher loadingwhen fibers are incorporated into the polymer matrix.Morphological and thermal studies of the matrix, fiber,and short FRP composites have also been carried out.The swelling, moisture absorbance, chemical resist-ance, and water uptake behavior of these compositeshave also been carried out at different intervals. Theresults obtained lay emphasis on the utilization ofthese fibers, as potential reinforcing materials in bio-based polymer composites. POLYM. COMPOS., 31:459–470, 2010. ª 2009 Society of Plastics Engineers
INTRODUCTION
Fiber-reinforced polymer (FRP) composites constitute
an important proportion of the engineered materials mar-
ket ranging from everyday products to sophisticated niche
applications [1]. These materials are able to meet diverse
design requirements with their good mechanical proper-
ties, simplicity in fabrication, economy, and significant
weight savings as well as high strength-to-weight ratio
compared with the conventional materials. Synthetic fibers
such as glass, aramid, carbon fibers, etc. have been exten-
sively used over the last decades as reinforcements of
polymeric matrices [2–4]. They are incorporated into mat-
rices with the main objective of improving the mechanical
properties of the polymer reducing the cost of the final
products. These synthetic fibers differ in price and me-
chanical properties, generally in an inverse manner: the
more expensive the fiber, the better the mechanical prop-
erties. Recently, the increasing environmental conscious-
ness throughout the universe has enforced the researchers
from various fields to produce new polymeric materials
and processes that improve the ecological quality of a
number of products [5–8]. In particular, in the past few
years, the synthesis of polymers starting from renewable
resources is an object of significant research efforts
because of the increasing environmental concerns. The
chemistry of the renewable resources applied to the pro-
duction of new feasible ecofriendly polymer products is
an issue of this research. This issue has captured the
global attention of researchers. The growth of natural
FRPs has been recently a subject of interest for both sci-
entists and technologists [9–11]. Recent developments in
the fields of natural fibers have shown that it is possible
to obtain an ecofriendly polymeric material that possesses
sufficient properties [12–15]. These natural fibers have a
number of advantages over synthetic fibers. When com-
pared with traditional synthetic fibers, these natural fibers,
which have low density, impart the polymer composite
various benefits such as lowering of toxicity, low machine
wear, less fuel consumption, and a high degree of flexibility
[12, 16–18]. These unique properties make the FRP com-
posite best material for fabrication of different components
in aerospace, automobile, sports, defense, marine industries,
etc. [13–15, 19, 20]. In fact, natural fibers have been found
to improve the mechanical properties of the reinforced poly-
mer matrix and, furthermore, reduce the total weight
because of their low density [21, 22].
Polymer composites are the materials which are
obtained by embedding fibers in a polymeric matrix to
improve its mechanical, thermomechanical, electrical,
sound-damping properties, etc. Several methods, such as
filament winding process, pultrusion method, vacuum bag-
Correspondence to: Amar Singha; e-mail: [email protected]
Contract grant sponsor: Ministry of Human Resource Development
(MHRD), New Delhi.
DOI 10.1002/pc.20825
Published online in Wiley InterScience (www.interscience.wiley.com).
VVC 2009 Society of Plastics Engineers
POLYMER COMPOSITES—-2010
ging technique, autoclave technique, compression mold-
ing, resin transfer molding, etc. have been developed to
manufacture FRP products [21–25]. Among these, com-
pression molding is a very good technique [10, 11, 16].
Among various types of natural biomaterial, GrewiaOptiva fibers have high potential as a reinforcing material
in polymer composites. Traditionally, this fibrous material
belonging to Himalayan region has been used by the local
people for making low cost articles like socks, boots,
mats, ropes, bags, etc. since ancient time. While going
through the annals of literature, not much information is
available on the application of this fiber as reinforcing
material in the polymer composites [5–12, 16–18]. Keep-
ing in view the easy availability of this biomass, sincere
efforts have been made by our research group to substi-
tute the synthetic fibers by natural fibers as reinforcing
material for the synthesis of urea–formaldehyde (UF) ma-
trix-based polymer composites. The basic objectives of
this study were:
c Effective utilization of G. optiva fibers in the fabrication
of fiber-reinforced green polymer composites.
c Development of a novel and simple methodology for
fabrication of these FRP composites.
c To study the effect of fiber loading on the various
mechanical properties of the polymer matrix and the
polymer composites.
c To analyze the influence of fiber content and surface
chemistry on the mechanical properties of UF polymer
and its respective composites.
c To study the interaction between the UF resin and the G.optiva fibers using scanning electron microscopy (SEM).
c To analyze the thermal behavior of fiber, polymer ma-
trix, and FRP composites.
c To study the physical and chemical properties of poly-
mer matrix and FRP composites.
EXPERIMENTAL METHODOLOGY
Material and Methods
Urea, formaldehyde solution, and sodium hydroxide
supplied by Qualigens Chemicals were used as received.
UF was used as matrix polymer. The lignocellulosic G.optiva fibers of dimensions 3 mm were used as reinforce-
ment for the synthesis of FRP composites.
Synthesis of Urea–Formaldehyde Resin
Urea and formaldehyde were synthesized by the stand-
ard method used in the laboratory [23]. Urea and formal-
dehyde were taken in different molar ratio (1.0:1.0,
1.0:1.5, 1.0:2.0, 1.0:2.5, and 1.0:3.0) by weight, in the
reaction kettle and mixed with the help of mechanical
stirrer. The reaction was carried out in an alkaline me-
dium. Because the reaction is exothermic, proper care
was taken to maintain the temperature between 50 and
608C, for initial 2 h. Then temperature was increased to
80–858C at pH 5.5–6 and the mixture was heated at this
temperature, till the resinification started. UF resin formed
as a result of resinification is a colorless to milky viscous
liquid, with faint formaldehyde odor. After the completion
of resinification, the resin was cooled and ammonium
chloride was added in pinch to increase the bonding
between the molecules. The resin synthesized was then
transferred to a specially made mould. Resin sheets of
size 150 mm 3 150 mm 3 5.0 mm were prepared by a
closed mold method as described elsewhere [6]. The mold
was then closed and kept under pressure (4.0 MPa) until
the resin was set into a hard mass. All the specimens
were postcured at 1208C for 7 h.
Synthesis of Polymer Composites
G. optiva fibers collected from local resources were
initially thoroughly washed with detergent powder. These
fibers after washing with detergent powder were soaked
in hot distilled water for 7 h, air dried for 60 h, followed
by oven drying at 105–1108C for 12 h. The above fibers
were then chopped into dimensions of 3 mm. In compari-
son to raw fibers, the dried fibers have been found to
increase the mechanical properties of polymer composites.
This behavior can be attributed to the reduction of humid-
ity. The presence of moisture contents (MCs) in the natu-
ral fibers affects the chemical reaction between the ligno-
cellulosic fiber and polymer matrix resulting in poor
fiber-matrix adhesion. Water absorbed has OH2 anions
which act as dipoles and prevents close contact between
the fiber and the matrix [10, 16]. The reduction of these
anions at the fiber surface increases interface compatibil-
ity, and increase the efficiency of the stress transfer from
the matrix to the fibers and hence increase in mechanical
properties. Therefore, to prevent voids and a poor fiber-
matrix bonding, it is necessary to dry the fibers [10–12,
16–18].
The dried G. optiva fibers of dimension 3 mm were
mixed thoroughly with UF (1:2.5) resin, using a mechani-
cal stirrer with different loadings (10, 20, 30, and 40%) in
terms of weight. Then, the above mixture was poured into
specially made moulds. The surfaces of molds were
coated on inside with oleic acid to avoid adhesion of the
mixture and to allow easy removal of the composites. The
mixture was then spread equally on the surface of the
mold. Composite sheets of size 150 mm 3 150 mm 35.0 mm were prepared by compression molding technique
[12, 16–18]. Compression molding was performed in a
hot press using a mold preheated to 1108C. The material
first placed in a hot open mold was left for about 5 min,
and then the mold was closed. Composite sheets were
prepared by hot pressing the mold at 1308C for 30 min.
The pressure applied ranges from 3 to 4 MPa depending
on the loading of reinforcing material. All the specimens
were then postcured at 1208C for 12 h. During the fiber-
composite fabrication process, the resin undergoes poly-
460 POLYMER COMPOSITES—-2010 DOI 10.1002/pc
merization reaction with itself and chemical reaction with
cellulosic under various environmental conditions, which
comprise temperature, MC, relative humidity (RH), water
vapor pressure, etc. These variables could significantly
affect the resin curing along with bonding behavior and
consequently affect the final performance of polymer
composites. The longer curing time is required for com-
plete conversion of resin into an insoluble three-dimen-
sional network along with the formation of mechanical
bonds between the fiber and resin matrix.
Mechanical Testing
Tensile, compressive, flexural, and wear tests were per-
formed on specimens cut from the above synthesized
polymer composite material. Testing of samples for ten-
sile, compressive, and flexural strengths was done on
Computerized Universal Testing Machine (HOUNSFIELD
H25KS). Wear testing was done on a Wear & Friction
Monitor (DUCOM- TR-20L). Seven specimens of each
sample were used for the measurement of the above men-
tioned mechanical properties at ambient laboratory envi-
ronment and average results have been reported.
Tensile Test
The tensile strength test was conducted on Computer-
ized Universal Testing Machine (HOUNSFIELD H25KS).
The specimens of dimension 100 mm 3 10 mm 3 5 mm
were used for analysis. The span length was fixed at 60
mm, and the test was conducted at the constant strain rate
of 10 mm/min in accordance with ASTM D 3039
method.
Compressive Test
The compression test was also conducted on Compu-
terized Universal Testing Machine (HOUNSFIELD H25
KS) in accordance with ASTM D 3410 method. The
specimens of dimension 100 mm 3 10 mm 3 5 mm
were used for analysis. The test was conducted at the con-
stant strain rate of 10 mm/min, whereas the total com-
pression range was 7.5 mm.
Flexural Test
The three-point bend flexural test was conducted in ac-
cordance with ASTM D 790 method. For flexural analy-
sis, the specimens of dimension 100 mm 3 10 mm 3 5
mm were used. Span length was fixed at 50 mm, and
the test was conducted at the constant strain rate of 2.54
mm/min.
Wear Test
The wear test of the sample was conducted on Wear &
Friction Monitor (DUCOM- TR-20L). Wear resistance of
composites was carried-out as per ASTM D 3702 method.
The wear of the sample was determined in terms of
weight loss.
Morphological and Thermal Analysis of Samples
To evaluate the changes in the composite surface mor-
phology, fibers and matrix were analyzed by SEM. The
excitation energy used was 5 keV. To achieve good elec-
tric conductivity, all samples were first carbon sputtered
followed by sputtering a gold palladium mixture before
examination. SEM micrographs of the samples show the
morphology of the biocomposites prepared. These micro-
graphs clearly show the difference between unloaded and
loaded UF matrix. Thermal analysis of natural and syn-
thetic polymers gives us good account of thermal stability
of materials. Thermogravimetric analysis (TGA), differen-
tial thermal analysis (DTA), and derivative thermogravi-
metric analysis (DTG) studies of samples were carried out
in nitrogen atmosphere on a thermal analyzer (Perkin
Elmer) at a heating rate of 108C/min. TGA is used to
characterize the decomposition and thermal stability of
materials under a variety of conditions and to examine
the kinetics of the physicochemical processes occurring in
the sample. Basically, in this method, a change in thermal
stability is examined in terms of percentage weight loss
as a function of temperature. The mass change character-
istics of a material are strongly dependent on the experi-
mental conditions, such as sample mass, volume and
physical form, the shape and nature of the sample holder,
the nature and pressure of the atmosphere in the sample
chamber, and the scanning rate all have important influen-
ces on the characteristics of the recorded TG curve. At
the same time, DTA involves comparing the precise tem-
perature difference between a sample and an inert refer-
ence material, while heating both. In thermal analysis
from time to time, overlapping reactions are difficult to
resolve, and in some cases, resolution can be improved by
hindering escape of evolved gas from the sample by plac-
ing a loosely fitting lid on the crucible, changing the
packing or form of the sample, choosing a different cruci-
ble, or by varying the heating rate. Altering the experi-
mental conditions may change the relative rates of the
overlapping reactions and led to the better resolution. Of-
ten, it is undesirable to alter optimized experimental con-
ditions and in this case overlapping reactions may be
more clearly resolved by plotting the derivative TG curve.
In DTG the mass change with respect to temperature (dm/dT) is plotted against temperature. A point of inflection in
the mass change step becomes a minimum in the deriva-
tive curve and for an interval of constant mass dm/dT is
zero, a peak in the DTG curve occurs when the rate of
mass change is a maximum. DTG peaks are characterized
by the peak maximum (Tmax) and the peak on set temper-
ature (Te). The area under a DTG curve is proportional to
the mass change, and the height of the peak at any tem-
perature gives the rate of the mass change at that temper-
DOI 10.1002/pc POLYMER COMPOSITES—-2010 461
ature. Although a DTG curve contains no more informa-
tion than the original TG curve, DTG curves are fre-
quently preferred when comparing results with DTA
curves because of the visual similarity.
Swelling, Moisture Absorbance, and Chemical Resistance
The effect of environmental conditions on the compo-
sites has been a subject of much debate and many studies
have been reported in the literature. The commercial via-
bility of the newly fabricated fiber-reinforced resin ma-
trix-based composites lies in their physical and chemical
properties. Therefore, a comprehensive study on swelling
behavior in different solvents, moisture absorbance (Mabs)
at different humidity levels, and chemical resistance
behavior against 1 N HCl and 1 N NaOH of UF compo-
sites has been carried out.
Swelling Behavior. Swelling behavior of the composite
samples was evaluated by studying the swelling in differ-
ent solvents such as methanol, isobutanol, carbon tetra-
chloride, and water. For the swelling test, the specimens
were dried in an oven for a specified time at a particular
temperature and then cooled in a dessicator. The initial
samples of known weight (Wi) were immersed in 100 ml
of different solvents at room temperature for 15 days. The
samples were filtered and the excess solvent was removed
with the help of filter paper, patted dry with a lint free
cloth, and then final weight (Wf) was noted. The percent
swelling was calculated from the increase in initial weight
in the following manner
Percent swelling PSð Þ ¼ Wf �Wi
Wi
3 100
Moisture Absorbance. Mabs studies onto different sam-
ples were carried out at various humidity levels (varying
from 20 to 100%). Mabs was found out by placing the
known weight (Wi) of dry samples in a humidity chamber
(Swastika make), which was set at a particular humidity
level for about 12 h, and then the final weight (Wf) of the
samples exposed at a particular RH was taken. The per-
cent Mabs was then calculated in the following manner:
%Moisture absorbance %Mabsð Þ ¼ Wf �Wi
Wi
3 100
Chemical Resistance. For the chemical resistance test,
the dried specimens were immersed in 100 ml of 1 N
NaOH and 1 N HCl for different intervals of time (24–
144 h). After this, the samples were filtered out, dried,
and weighed. The percent chemical resistance (Pcr) was
calculated in term of weight loss in the following manner:
Percent chemical resistance Pcrð Þ ¼ Ti �Waci
Ti3 100
where Ti is the initial weight and Waci is the weight after
certain interval.
RESULTS AND DISCUSSION
Evaluation of mechanical properties of polymeric com-
posites materials is one of the most important parameter
which decides their application in various fields. The me-
chanical properties, such as tension, compression, stress–
strain, phase composition of fiber composites have been
studied. These properties depend upon the nature of the
matrix material, nature of the fiber-matrix interfaces, dis-
tribution and orientation of the reinforcing fibers, and of
the interphase region. Hence, the optimization of the
fiber-matrix adhesion is most essential for better physical
and mechanical properties of these natural FRP compo-
sites. To achieve good fiber reinforcement, the interfacial
strength between the fiber and matrix is the most essential
factor [10–12, 16–18]. For a composite to be an effective
load-bearing system, both natural fibers and matrix must
cooperate. This cooperation between the fibers and the
matrix will not exist without the presence of the interface.
The interfacial strength depends on the surface topology
of the fiber. The interface acts as a ‘‘binder’’ and transfers
load between the matrix and the reinforcing fibers. The
interfacial area plays a major role in determining the
strength of composite material because each fiber forms
an individual interface with the matrix. Interfacial bond-
ing is a result of good wetting of the fibers by the poly-
mer matrix as well as the formation of a chemical bond
between the fiber surface and the matrix [10–12, 16–18,
20, 24]. Hence, the interface plays a key role in control-
ling the mechanical properties of cellulosic FRP compos-
ite. The adhesion between cellulosic fiber and polymer
matrix is usually the strongest in polar polymers capable
of forming hydrogen bonds with hydroxyl groups avail-
able on the fiber surface.
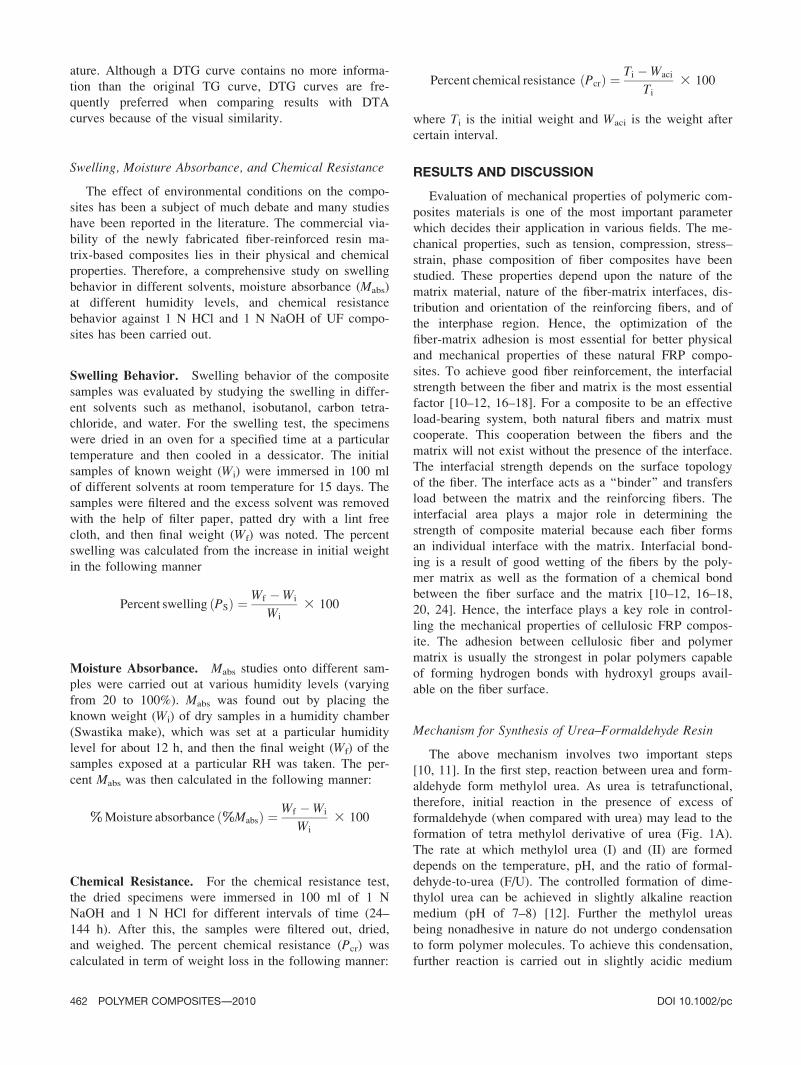
Mechanism for Synthesis of Urea–Formaldehyde Resin
The above mechanism involves two important steps
[10, 11]. In the first step, reaction between urea and form-
aldehyde form methylol urea. As urea is tetrafunctional,
therefore, initial reaction in the presence of excess of
formaldehyde (when compared with urea) may lead to the
formation of tetra methylol derivative of urea (Fig. 1A).
The rate at which methylol urea (I) and (II) are formed
depends on the temperature, pH, and the ratio of formal-
dehyde-to-urea (F/U). The controlled formation of dime-
thylol urea can be achieved in slightly alkaline reaction
medium (pH of 7–8) [12]. Further the methylol ureas
being nonadhesive in nature do not undergo condensation
to form polymer molecules. To achieve this condensation,
further reaction is carried out in slightly acidic medium
462 POLYMER COMPOSITES—-2010 DOI 10.1002/pc
(pH 5.5–6) at a temperature of 80–908C. The above con-
densation results in the formation of crosslinked polymer
structures (Fig. 1B). After sufficient crosslinking has
taken place, the reaction is stopped by neutralization of
the reaction medium by adjusting the pH level at 7.5–8.
This step is very important because if the reaction is
allowed to continue for a long time, then excessive cross-
linking will lead to the gelatization of the resin.
Optimization of Urea–Formaldehyde Resin
Optimization of UF resin was done by taking into
accounts the mechanical properties such as tensile
strength, compressive strength, flexural strength, wear
resistance, etc.
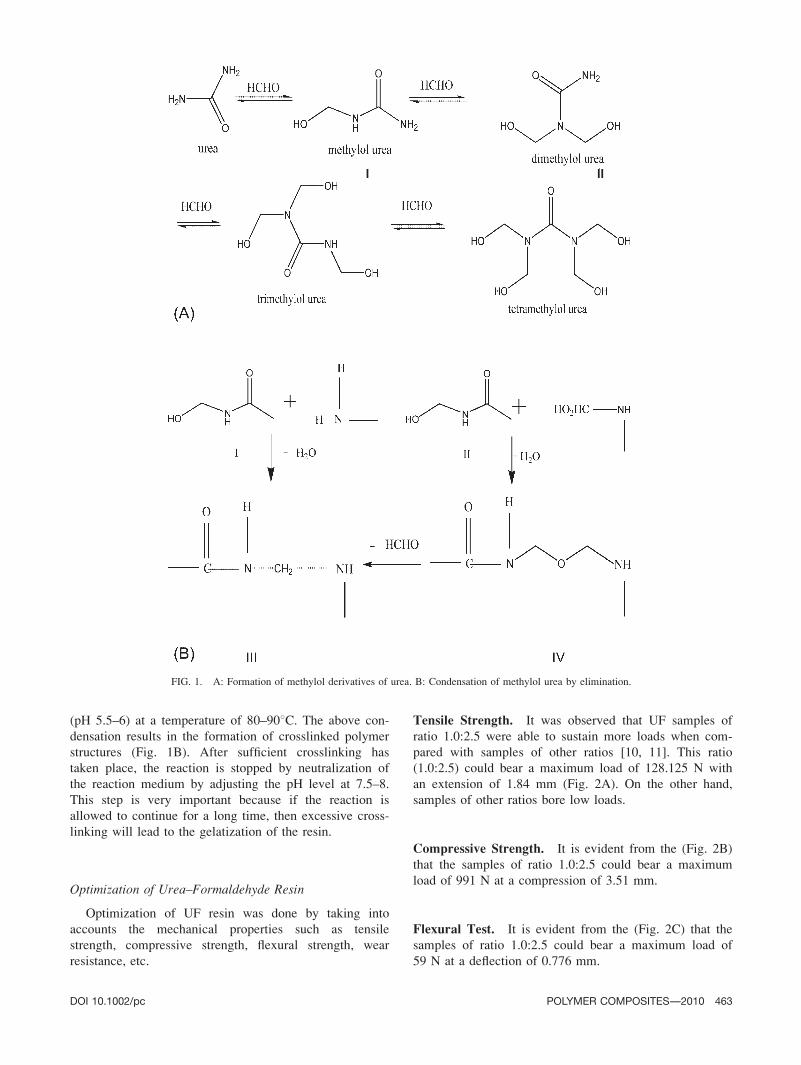
Tensile Strength. It was observed that UF samples of
ratio 1.0:2.5 were able to sustain more loads when com-
pared with samples of other ratios [10, 11]. This ratio
(1.0:2.5) could bear a maximum load of 128.125 N with
an extension of 1.84 mm (Fig. 2A). On the other hand,
samples of other ratios bore low loads.
Compressive Strength. It is evident from the (Fig. 2B)
that the samples of ratio 1.0:2.5 could bear a maximum
load of 991 N at a compression of 3.51 mm.
Flexural Test. It is evident from the (Fig. 2C) that the
samples of ratio 1.0:2.5 could bear a maximum load of
59 N at a deflection of 0.776 mm.
FIG. 1. A: Formation of methylol derivatives of urea. B: Condensation of methylol urea by elimination.
DOI 10.1002/pc POLYMER COMPOSITES—-2010 463
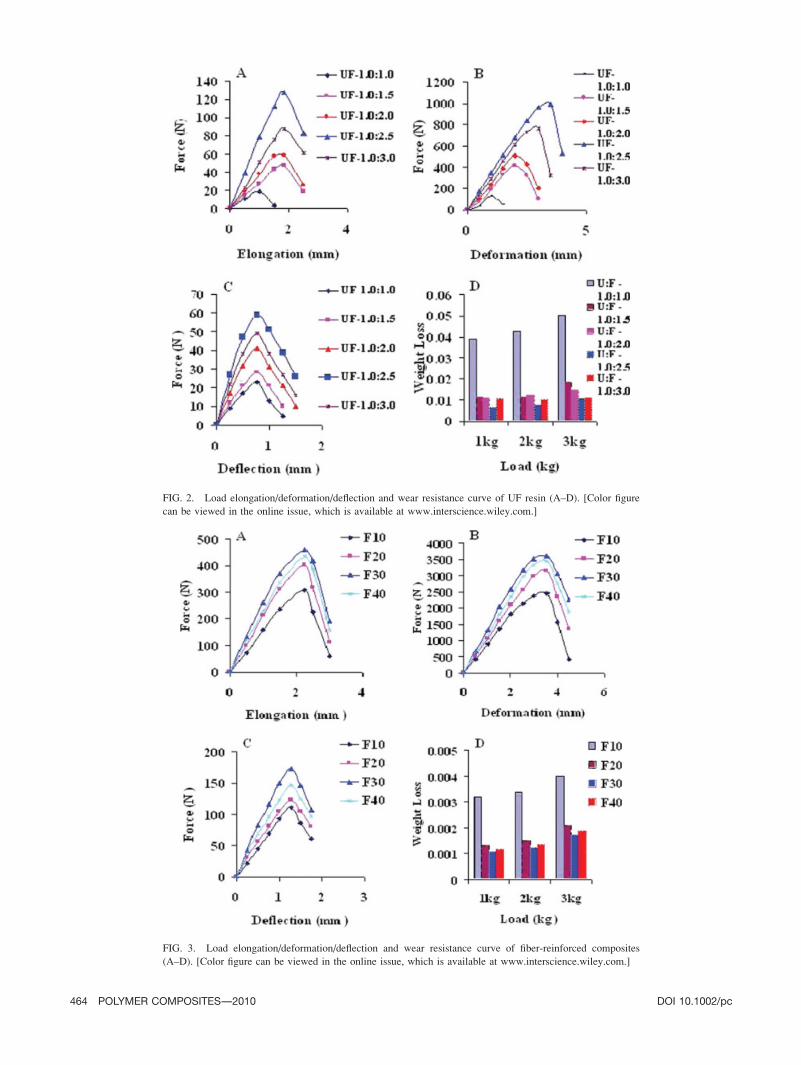
FIG. 2. Load elongation/deformation/deflection and wear resistance curve of UF resin (A–D). [Color figure
can be viewed in the online issue, which is available at www.interscience.wiley.com.]
FIG. 3. Load elongation/deformation/deflection and wear resistance curve of fiber-reinforced composites
(A–D). [Color figure can be viewed in the online issue, which is available at www.interscience.wiley.com.]
464 POLYMER COMPOSITES—-2010 DOI 10.1002/pc
Wear Resistance. It was observed that wear rate of
samples of ratio 1.0:2.5 was less when compared with
any other samples (Fig. 2D).
The wear resistance results also support the tensile,
compressive, and flexural results, as brittle materials have
higher wear rate and lower tensile, compressive, and flex-
ural strength. The samples with lower amount of formal-
dehyde have higher concentration of dimethylol urea,
which makes it amorphous in nature but as the ratio of
formalin increases the concentration of dimethylol urea
decrease because of the formation of ether linkage and
two/three-dimensional crosslinking. The ratio (1.0:2.5) of
urea and formaldehyde showing optimum mechanical
properties was taken for further preparation of cellulosic
fiber-reinforced UF composites.
Mechanical Properties of UF Matrix-Based Composites
Tensile Strength. It was observed that tensile strength
of composites increases on reinforcement with G. optivafiber. Composites with 30 wt% loading bear maximum
load followed by 40, 20, and 10% loadings (Fig. 3A). It
was observed that polymer composites with 30, 40, 20,
and10% loading bore loads of 497.0, 435.0, 411.53, and
341.49 N, respectively.
Compressive Strength. The compressive properties of
the composites as a function of load and deformation are
presented in Fig. 3B. From the graph, it is evident that
first compressive force increased with the increase in fiber
content up to 30% and then decreased with further
increase in fiber content. It is clear from the figure that
composites with 30, 40, 20, and 10% loading bore loads
of 3900.00, 3700.0, 3543.5, and 2753.5 N, respectively.
Flexural Strength. Similar trends as obtained in tensile
and compressive strength tests were also observed for
flexural strength results. The flexural properties of sam-
ples as a function of force (in terms of load) and deflec-
tion are shown in Fig. 3C. It is clear from the figure that
composites with 30, 40, 20, and 10% loading bear a load
of 197.0, 177.0, 146.0, and 131.0 N, respectively.
Wear Test. It is evident from Fig. 3D that the wear rate
of UF matrix decreased appreciably as reinforcement with
G. optiva fibers, whereas maximum wear resistance
behavior was shown by a composite with 30% loading,
followed by 40, 20, and 10% fiber loading.
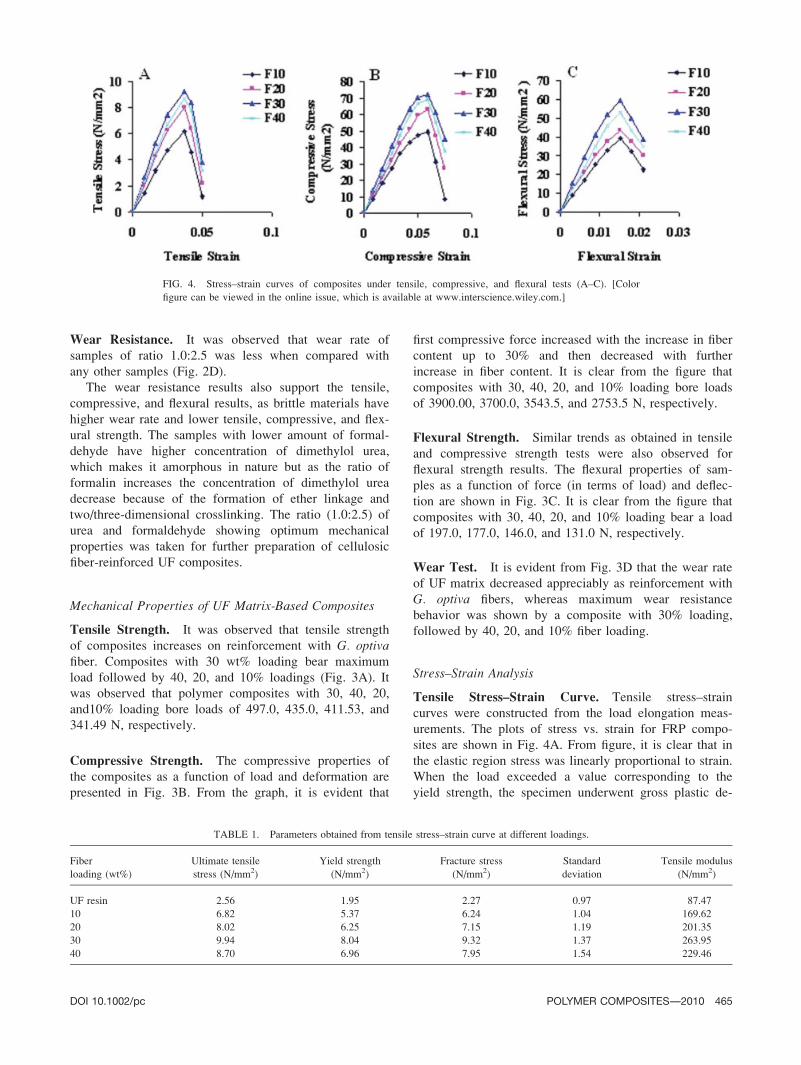
Stress–Strain Analysis
Tensile Stress–Strain Curve. Tensile stress–strain
curves were constructed from the load elongation meas-
urements. The plots of stress vs. strain for FRP compo-
sites are shown in Fig. 4A. From figure, it is clear that in
the elastic region stress was linearly proportional to strain.
When the load exceeded a value corresponding to the
yield strength, the specimen underwent gross plastic de-
FIG. 4. Stress–strain curves of composites under tensile, compressive, and flexural tests (A–C). [Color
figure can be viewed in the online issue, which is available at www.interscience.wiley.com.]
TABLE 1. Parameters obtained from tensile stress–strain curve at different loadings.
Fiber
loading (wt%)
Ultimate tensile
stress (N/mm2)
Yield strength
(N/mm2)
Fracture stress
(N/mm2)
Standard
deviation
Tensile modulus
(N/mm2)
UF resin 2.56 1.95 2.27 0.97 87.47
10 6.82 5.37 6.24 1.04 169.62
20 8.02 6.25 7.15 1.19 201.35
30 9.94 8.04 9.32 1.37 263.95
40 8.70 6.96 7.95 1.54 229.46
DOI 10.1002/pc POLYMER COMPOSITES—-2010 465
formation. It was permanently deformed if the load was
released to zero. Different parameters derived from the
stress–strain curve are shown in Table 1.
Compressive Stress–Strain Curve. Compressive
stress–strain curves also were constructed from the load
deformation measurements. The plots of compressive
stress vs. strain for polymer composites are shown in Fig.
4B. Different parameters derived from the stress–strain
curve are shown in Table 2.
Flexural Stress–Strain Curve. Plots of flexural stress
vs. strain for FRP composites are shown in Fig. 4C. Dif-
ferent parameters derived from the stress–strain curve are
shown in Table 3. The deviations from linearity in case
of tensile/compressive and flexural stress–strain curves are
an indication of the beginning of initial matrix cracking.
The first major change in slope in the curves under ten-
sile/compression/flexural tests is the sign of a major crack
in the matrix or the beginning of fiber failure. From the
foregoing results, it is clear that to achieve good fiber
reinforcement, interfacial bonding between the fiber and
polymer matrix is the most essential factor. Aqueous UF
resins can penetrate into the cell wall of cellulosic G.optiva fiber and the amorphous region of cellulose fibers.
Furthermore, UF resins can, at least theoretically, react
with primary OH groups in cellulose and form covalent
bonds by condensation [10]. Whether covalent or hydro-
gen bonds dominate after conditions pertaining to UF
molding compounds is not fully understood. However,
resin penetration will give mechanical interlocking and
thus provide high interfacial strength. Supplementary
from the results, it can be concluded that the tensile
strength of G. optiva/UF composites is mainly dependent
on the strength and modulus of fibers, the strength and
chemical stability of the matrix, and the effectiveness of
the bonding strength between polymer matrix and fibers in
transferring stress across the interface [10, 11, 16, 25]. The
ultimate compressive strength of the composite mainly
depends on the strength of polymeric resin, whereas the
compressive modulus of the composite depends on its rein-
forcement. In general, composite specimens under com-
pression test fail by shear or kinking mechanism [26]. Fur-
ther flexural strength and modulus are controlled by disper-
sion extent. The lower the dispersion extent the higher is
flexural strength. The dispersion extent of fibers determines
how many fibers are neighbored or dispersed. The flexural
strength depends on the fiber types at the compressive side
and dispersion extent of fibers. However, the flexural mod-
ulus depends only on the composite rigidity of the com-
pressive side, but rarely the dispersion extent of fibers.
Normally, the flexural modulus is very sensitive to the ma-
trix properties and matrix/fiber interfacial bonding [27]. It
can be concluded that the flexural properties depend on the
compressive stress at the top region to bear applied load
directly and the tensile stress at the bottom region.
It has been observed that mechanical properties of G.optiva/UF composites increase up to 30% fiber loading
and then decrease. This behavior of polymer composites
can be explained because of fiber–fiber contact at higher
fiber loading. The mechanical strength of UF composites
levels off at high fiber loading. Hence, lower results are
obtained for 40% loading. Because of poor bonding
between fiber and matrix at low % of fiber loading, G.optiva fibers were not capable of transferring load to one
another and hence stress accumulated at certain points of
the composite, which led to lower mechanical properties.
Further during the preparation of polymer composites
with 30% fiber loading, G. optiva fibers acted as carrier
of load and transferred stress from the matrix along the
reinforcement, which resulted in composites with good
mechanical properties.
TABLE 2. Parameters obtained from compressive stress–strain curve at different loading.
Fiber loading
(wt%)
Ultimate compressive
stress (N/mm2)
Yield strength
(N/mm2)
Fracture
stress (N/mm2)
Standard
deviation
Compressive
modulus (N/mm2)
UF resin 19.82 18.07 19.27 1.07 340.00
10 55.07 46.39 53.79 1.48 901.38
20 70.87 62.7 67.48 1.57 1146.00
30 78.00 70.37 75.94 1.29 1287.00
40 74.00 64.28 70.39 1.35 1215.00
TABLE 3. Parameters from flexural stress–strain curve for different % age loading.
Fiber loading
(wt%)
Ultimate flexural
stress (N/mm2)
Yield strength
(N/mm2)
Fracture stress
(N/mm2)
Standard
deviation
Flexural
modulus (N/mm2)
UF resin 17.7 11.35 15.17 1.15 1900.77
10 39.3 29.98 36.13 1.05 2578.74
20 43.8 31.22 39.67 1.26 2874.01
30 59.1 48.87 57.53 1.28 3877.95
40 53.1 45.38 51.07 1.32 3484.25
466 POLYMER COMPOSITES—-2010 DOI 10.1002/pc
Swelling, Moisture Absorbance, and Chemical ResistanceBehavior of Polymer Composites
Polymer composites with different loadings show dif-
ferent swelling behavior in different solvents (Table 4)
The swelling behavior of composites in different solvents
follows the trend: H2O [ CH3OH [ C4H9OH [ CCl4.
The swelling behavior of polymer composites increases
with increase in percent loadings because of greater
affinity of water for OH groups present in the FRP
composites.
The Mabs behavior at different humidity levels as a
function of fiber loading has been depicted in Table 5. It
has been found that Mabs increases with increase in hu-
midity level ranging from 20 to 100%.
In case of chemical resistance behavior, it has been
observed that resistance toward chemicals decreases with
the increase in % loading (Table 6). This may be because
of increase in fiber content in the composite, which is vul-
nerable to the chemical attack resulting in decreased re-
sistance toward the chemicals.
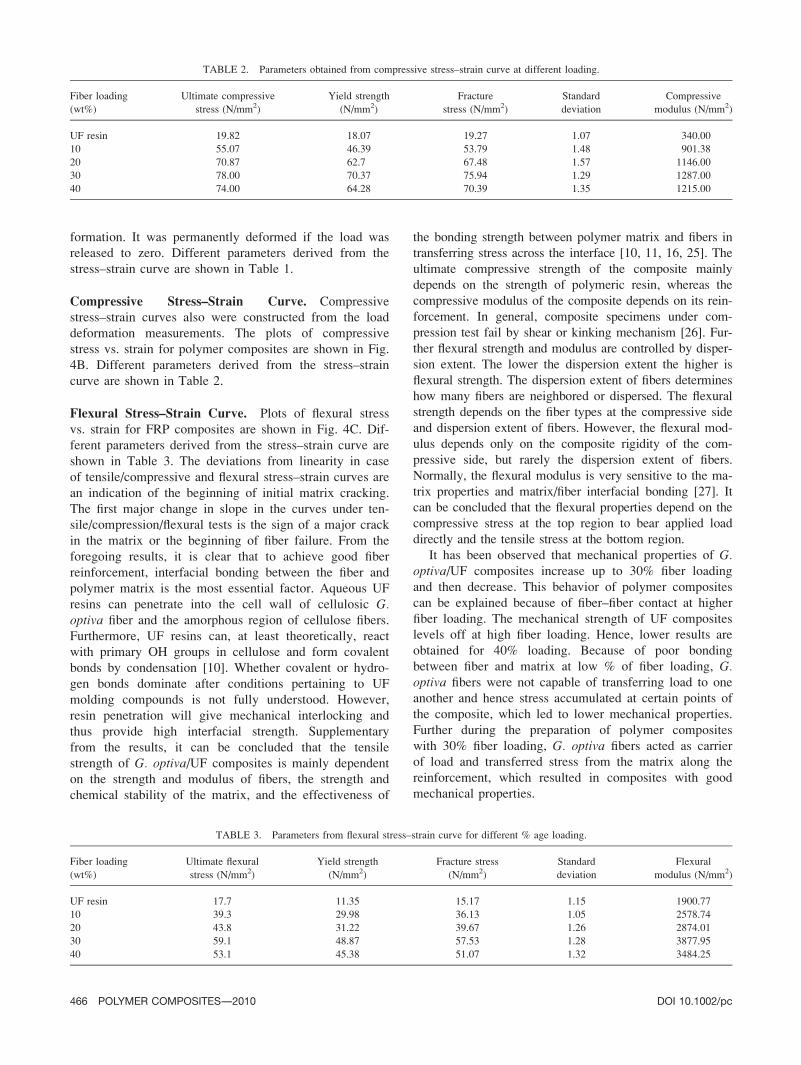
Morphological Study of Biocomposites
Morphological results clearly show the difference in
the morphology of the polymer composites when com-
pared with that of fiber and the polymer matrix separately
(Fig. 5A–F). Morphological results clearly show that
when polymer resin matrix was reinforced with the differ-
ent loadings of fiber, morphological changes took place,
depending on the bonding between the varying loading of
fiber and the polymer resin matrix. In case of lower fiber
loading (10 or 20%), the content of polymeric resin being
higher, there was lower bonding between the matrix and
the reinforcement (Fig. 5C and D), and hence mechanical
properties had lower values when compared with 30%
fiber loading. In case of 30% fiber loading, there was inti-
mate mixing of the reinforcement with the resin matrix
(Fig. 5E), and hence resulting polymer composite materi-
als had higher mechanical properties. However, at higher
fiber content (beyond 30%), agglomeration of fibers took
place, which resulted in decreased mechanical properties
(Fig. 5F).
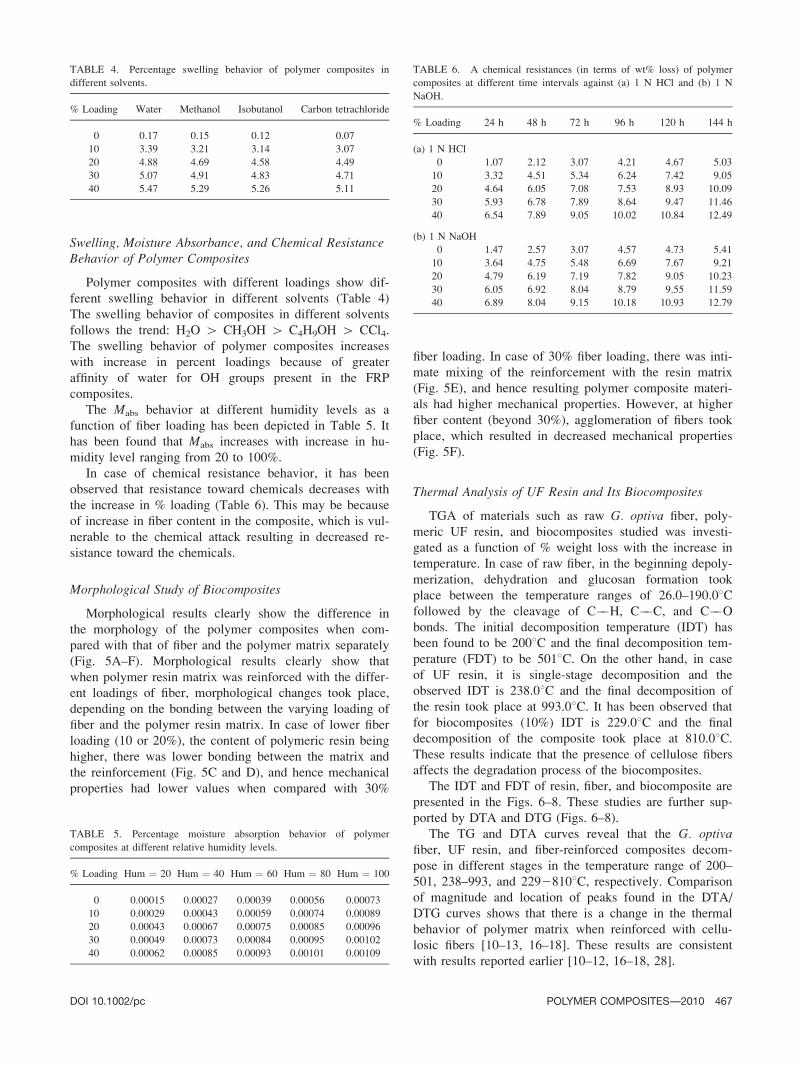
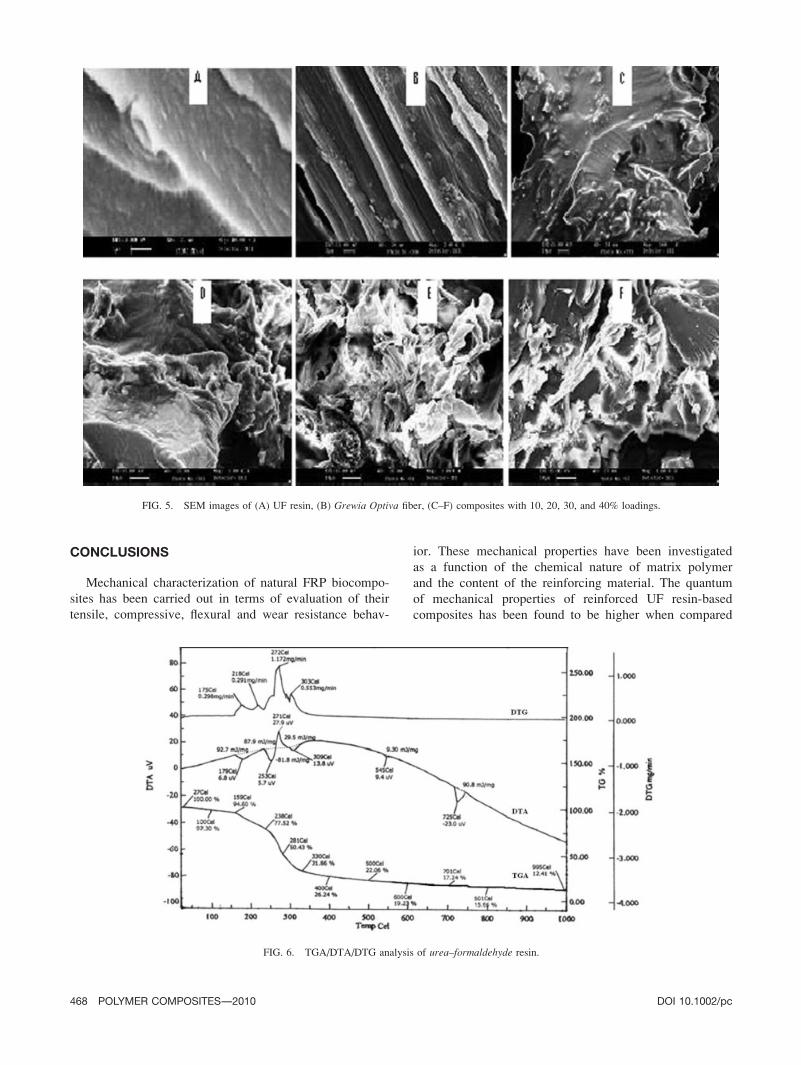
Thermal Analysis of UF Resin and Its Biocomposites
TGA of materials such as raw G. optiva fiber, poly-
meric UF resin, and biocomposites studied was investi-
gated as a function of % weight loss with the increase in
temperature. In case of raw fiber, in the beginning depoly-
merization, dehydration and glucosan formation took
place between the temperature ranges of 26.0–190.08Cfollowed by the cleavage of C��H, C��C, and C��O
bonds. The initial decomposition temperature (IDT) has
been found to be 2008C and the final decomposition tem-
perature (FDT) to be 5018C. On the other hand, in case
of UF resin, it is single-stage decomposition and the
observed IDT is 238.08C and the final decomposition of
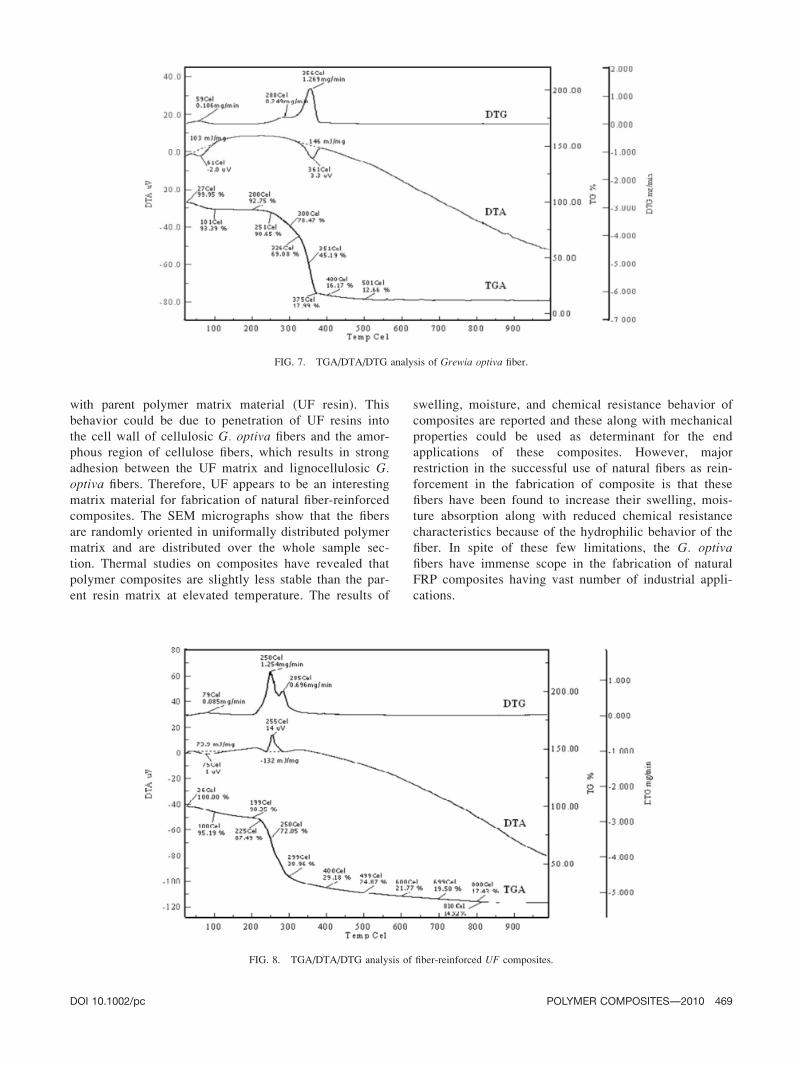
the resin took place at 993.08C. It has been observed that
for biocomposites (10%) IDT is 229.08C and the final
decomposition of the composite took place at 810.08C.These results indicate that the presence of cellulose fibers
affects the degradation process of the biocomposites.
The IDT and FDT of resin, fiber, and biocomposite are
presented in the Figs. 6–8. These studies are further sup-
ported by DTA and DTG (Figs. 6–8).
The TG and DTA curves reveal that the G. optivafiber, UF resin, and fiber-reinforced composites decom-
pose in different stages in the temperature range of 200–
501, 238–993, and 22928108C, respectively. Comparison
of magnitude and location of peaks found in the DTA/
DTG curves shows that there is a change in the thermal
behavior of polymer matrix when reinforced with cellu-
losic fibers [10–13, 16–18]. These results are consistent
with results reported earlier [10–12, 16–18, 28].
TABLE 4. Percentage swelling behavior of polymer composites in
different solvents.
% Loading Water Methanol Isobutanol Carbon tetrachloride
0 0.17 0.15 0.12 0.07
10 3.39 3.21 3.14 3.07
20 4.88 4.69 4.58 4.49
30 5.07 4.91 4.83 4.71
40 5.47 5.29 5.26 5.11
TABLE 5. Percentage moisture absorption behavior of polymer
composites at different relative humidity levels.
% Loading Hum ¼ 20 Hum ¼ 40 Hum ¼ 60 Hum ¼ 80 Hum ¼ 100
0 0.00015 0.00027 0.00039 0.00056 0.00073
10 0.00029 0.00043 0.00059 0.00074 0.00089
20 0.00043 0.00067 0.00075 0.00085 0.00096
30 0.00049 0.00073 0.00084 0.00095 0.00102
40 0.00062 0.00085 0.00093 0.00101 0.00109
TABLE 6. A chemical resistances (in terms of wt% loss) of polymer
composites at different time intervals against (a) 1 N HCl and (b) 1 N
NaOH.
% Loading 24 h 48 h 72 h 96 h 120 h 144 h
(a) 1 N HCl
0 1.07 2.12 3.07 4.21 4.67 5.03
10 3.32 4.51 5.34 6.24 7.42 9.05
20 4.64 6.05 7.08 7.53 8.93 10.09
30 5.93 6.78 7.89 8.64 9.47 11.46
40 6.54 7.89 9.05 10.02 10.84 12.49
(b) 1 N NaOH
0 1.47 2.57 3.07 4.57 4.73 5.41
10 3.64 4.75 5.48 6.69 7.67 9.21
20 4.79 6.19 7.19 7.82 9.05 10.23
30 6.05 6.92 8.04 8.79 9.55 11.59
40 6.89 8.04 9.15 10.18 10.93 12.79
DOI 10.1002/pc POLYMER COMPOSITES—-2010 467
CONCLUSIONS
Mechanical characterization of natural FRP biocompo-
sites has been carried out in terms of evaluation of their
tensile, compressive, flexural and wear resistance behav-
ior. These mechanical properties have been investigated
as a function of the chemical nature of matrix polymer
and the content of the reinforcing material. The quantum
of mechanical properties of reinforced UF resin-based
composites has been found to be higher when compared
FIG. 5. SEM images of (A) UF resin, (B) Grewia Optiva fiber, (C–F) composites with 10, 20, 30, and 40% loadings.
FIG. 6. TGA/DTA/DTG analysis of urea–formaldehyde resin.
468 POLYMER COMPOSITES—-2010 DOI 10.1002/pc
with parent polymer matrix material (UF resin). This
behavior could be due to penetration of UF resins into
the cell wall of cellulosic G. optiva fibers and the amor-
phous region of cellulose fibers, which results in strong
adhesion between the UF matrix and lignocellulosic G.optiva fibers. Therefore, UF appears to be an interesting
matrix material for fabrication of natural fiber-reinforced
composites. The SEM micrographs show that the fibers
are randomly oriented in uniformally distributed polymer
matrix and are distributed over the whole sample sec-
tion. Thermal studies on composites have revealed that
polymer composites are slightly less stable than the par-
ent resin matrix at elevated temperature. The results of
swelling, moisture, and chemical resistance behavior of
composites are reported and these along with mechanical
properties could be used as determinant for the end
applications of these composites. However, major
restriction in the successful use of natural fibers as rein-
forcement in the fabrication of composite is that these
fibers have been found to increase their swelling, mois-
ture absorption along with reduced chemical resistance
characteristics because of the hydrophilic behavior of the
fiber. In spite of these few limitations, the G. optivafibers have immense scope in the fabrication of natural
FRP composites having vast number of industrial appli-
cations.
FIG. 7. TGA/DTA/DTG analysis of Grewia optiva fiber.
FIG. 8. TGA/DTA/DTG analysis of fiber-reinforced UF composites.
DOI 10.1002/pc POLYMER COMPOSITES—-2010 469
ACKNOWLEDGMENTS
The authors are thankful to Director, National Institute
of Technology, Hamirpur, Himachal Pradesh, India for
providing the basic laboratory facilities. They are also
highly grateful to unknown potential reviewer for health-
ier comments in improving the quality of present research
paper.
REFERENCES
1. J. Chu and J.L. Sullivan, Polym. Compos., 17(4), 556 (1996).
2. P.O. Hagstrand, Polym. Compos., 22(4), 568 (2001).
3. W. Thielemans and R.P. Wool, Polym. Comp., 26(5), 695(2005).
4. J. Andersons, E. Sparnins, and R. Joffe, Polym. Comp., 27,221 (2006).
5. B.N. Misra, I. Kaur, A. Gupta, V. John, and A.S. Singha,
Polym. Compos., 4, 411 (1996).
6. A.S. Singha, A. Shama, and B.N. Mishra, J. Polym. Mater.,25(1), 91 (2008).
7. A.S. Singha, A. Shama, and V.K. Thakur, Bull. Mater. Sci.,31(1), 7 (2008).
8. B.N. Mishra, R.K. Sharma, and A.S. Singha, J. Appl. Polym.Sci., 27, 1321 (1982).
9. G.S. Chauhan, S.S. Bhatt, I. Kaur, A.S. Singha, and B.S.
Kaith, J. Polym. Degrad. Stab., 69, 61 (2002).
10. A.S. Singha and V.K. Thakur, Int. J. Plast. Technol., 11,835 (2007).
11. A.S. Singha and V.K. Thakur, E-J. Chem., 5(4), 782 (2008).
12. A.S. Singha and V.K. Thakur, Bull. Mater. Sci., 31(5), 1
(2008).
13. A.S. Singha and V.K. Thakur, Int. J. Polym. Mater., 57(12),1059 (2008).
14. B.N. Mishra, R. Dogra, I.K. Mehta, and A.S. Singha, Die.Angew. Makromol. Chem., 83, 90 (1980).
15. A.S. Singha, B.S. Kaith, and B.D. Sarwade, Hungar. J. Ind.Chem., VESZPREM 30, 289 (2002).
16. A.S. Singha and V.K. Thakur, Iran. Polym. J., 17(7), 541(2008).
17. A.S. Singha and V.K. Thakur, E-J. Chem., 5(5), 1055
(2008).
18. A.S. Singha and V.K. Thakur, BioResources, 3(4), 1173
(2008).
19. C.A. Boynard and J.R.M. d’Almeida, Polym. Plast. Technol.Eng., 39, 489 (2000).
20. A.K. Bledzki and J. Gassan, Prog. Polym. Sci., 24, 221
(1999).
21. N.E. Marcovich, M.M. Reboredo, and M.I. Aranguren, Ther-mochim. Acta., 372, 45 (2001).
22. Y. Li, Y.W. Mai, and L. Ye, Compos. Sci. Technol., 60,2037 (2000).
23. B.V. Voorn, H.H.G. Smit, R.J. Sinke, and B. Klerk, Compo-sites A, 32, 1271 (2001).
24. B.S. Kaith, A.S. Singha, S. Kumar, and S. Kalia, Int. J.Polym. Mater., 57(1), 54 (2008).
25. Z. Gao and K.L. Reinfshinder, J. Compos. Technol. Res.,14, 201 (1992).
26. L.A. Carlsson and R.B. Pipes, Experimental Characteriza-tion of Advanced Composite Material, Hall, New York, 69
(1987).
27. B.J. Jang, J.Y. Liau, L.R. Hwang, and W.K. Shih, J. Reinf.Plast. Compos., 9, 314 (1990).
28. N. Sgriccia and M.C. Hawley, Compos. Sci. Technol., 67,1986 (2007).
470 POLYMER COMPOSITES—-2010 DOI 10.1002/pc
Related Documents