This article appeared in a journal published by Elsevier. The attached copy is furnished to the author for internal non-commercial research and education use, including for instruction at the authors institution and sharing with colleagues. Other uses, including reproduction and distribution, or selling or licensing copies, or posting to personal, institutional or third party websites are prohibited. In most cases authors are permitted to post their version of the article (e.g. in Word or Tex form) to their personal website or institutional repository. Authors requiring further information regarding Elsevier’s archiving and manuscript policies are encouraged to visit: http://www.elsevier.com/authorsrights

Welcome message from author
This document is posted to help you gain knowledge. Please leave a comment to let me know what you think about it! Share it to your friends and learn new things together.
Transcript
This article appeared in a journal published by Elsevier. The attachedcopy is furnished to the author for internal non-commercial researchand education use, including for instruction at the authors institution
and sharing with colleagues.
Other uses, including reproduction and distribution, or selling orlicensing copies, or posting to personal, institutional or third party
websites are prohibited.
In most cases authors are permitted to post their version of thearticle (e.g. in Word or Tex form) to their personal website orinstitutional repository. Authors requiring further information
regarding Elsevier’s archiving and manuscript policies areencouraged to visit:
http://www.elsevier.com/authorsrights
Author's personal copy
Synthesis and characterization of perovskite-type SrxY1�xFeO3�d
(0.63rxo1.0) and Sr0.75Y0.25Fe1�yMyO3�d (M¼Cr, Mn, Ni),(y¼0.2, 0.33, 0.5)
J.J. Biendicho a,b, S. Shafeie a, L. Frenck a,c, D. Gavrilova d, S. Bohme a,e, A.M. Bettanini a,f, P. Svedlindh g,S. Hull b, Z. Zhao h, S.Ya. Istomin a,d,n, J. Grins a, G. Svensson a
a Department of Materials and Environmental Chemistry, Stockholm University, S-106 91 Stockholm, Swedenb The ISIS Facility, STFC Rutherford Appleton Laboratory, Didcot, OX11 0QX Oxfordshire, United Kingdomc Universite Pierre et Marie Curie, 75005 Paris, Franced M.V. Lomonosov Moscow State University, 119991 Moscow, Russiae Technische Universitat Chemnitz, Institut fur Chemie, Straße der Nationen 62, D-09111 Chemnitz, Germanyf Department of Molecular Sciences and Nanosystems, University Ca’ Foscari of Venice, 30123 Venice, Italyg Department of Engineering Sciences, Uppsala University, Box 534, SE-751 21 Uppsala, Swedenh School of Industrial Engineering and Management, Royal Institute of Technology, SE-100 44 Stockholm, Sweden
a r t i c l e i n f o
Article history:
Received 3 October 2012
Received in revised form
3 January 2013
Accepted 7 January 2013Available online 15 January 2013
Keywords:
Perovskites
Neutron diffraction
Electron diffraction
High-temperature conductivity
Thermal expansion
Magnetic susceptibility
a b s t r a c t
Oxygen-deficient ferrates with the cubic perovskite structure SrxY1�xFeO3�d were prepared in air
(0.71rxr0.91) as well as in N2 (x¼0.75 and 0.79) at 1573 K. The oxygen content of the compounds
prepared in air increases with increasing strontium content from 3�d¼2.79(2) for x¼0.75 to
3�d¼2.83(2) for x¼0.91. Refinement of the crystal structure of Sr0.75Y0.25FeO2.79 using TOF neutron
powder diffraction (NPD) data shows high anisotropic atomic displacement parameter (ADP) for the
oxygen atom resulting from a substantial cation and anion disorder. Electron diffraction (ED) and high-
resolution electron microscopy (HREM) studies of Sr0.75Y0.25FeO2.79 reveal a modulation along /1 0 0Sp
with G7 �0.4/1 0 0Sp indicating a local ordering of oxygen vacancies. Magnetic susceptibility
measurements at 5–390 K show spin-glass behaviour with dominating antiferromagnetic coupling
between the magnetic moments of Fe cations. Among the studied compositions, Sr0.75Y0.25FeO2.79
shows the lowest thermal expansion coefficient (TEC) of 10.5 ppm/K in air at 298–673 K. At 773–
1173 K TEC increases up to 17.2 ppm/K due to substantial reduction of oxygen content. The latter also
results in a dramatic decrease of the electrical conductivity in air above 673 K. Partial substitution of Fe
by Cr, Mn and Ni according to the formula Sr0.75Y0.25Fe1�yMyO3�d (y¼0.2, 0.33, 0.5) leads to cubic
perovskites for all substituents with y¼0.2. Their TECs are higher in comparison with un-doped
Sr0.75Y0.25FeO2.79. Only M¼Ni has increased electrical conductivity compared to un-doped Sr0.75Y0.25-
FeO2.79.
& 2013 Elsevier Inc. All rights reserved.
1. Introduction
Perovskite-related oxides ABO3�y with d-electron-rich transi-tion metal B-cations like Mn, Fe, Co and Ni are considered asmaterials for oxygen reduction in various high-temperatureelectrochemical devices such as cathodes in solid oxide fuel cells(SOFCs). Manganates like Sr substituted LaMnO3 (LSM) combinereasonable conductivity with thermodynamic stability. Theyare therefore standard cathode materials in SOFCs with YSZ(Zr1�xYxO2�x/2) electrolyte operated at high temperature [1].
Perovskites with Fe and Co, which exhibit high oxide-ion con-ductivity due to a lower B–O bonding energy and easy transitionbetween different coordination polyhedra, are less stable. How-ever, they combine high electronic with high oxide-ion conduc-tivity and can be used as cathode materials in intermediate-temperature SOFC (IT-SOFC) due to changes in the mechanism ofoxygen reduction in comparison with LSM which exhibits negli-gible oxide-ion conductivity [2]. Cobaltates, like strontium-dopedLaCoO3 (LSC), show superior oxide-ion and electronic conductiv-ity but suffer from high TEC (420 ppm/K) due to a temperature-induced spin transition between low and high spin states of Co3þ
[3,4]. Perovskite-like ferrates exhibit one order of magnitudelower conductivity at high temperatures in comparison with thecobaltates. Thus, the conductivities of La0.8Sr0.2FeO3�y and
Contents lists available at SciVerse ScienceDirect
journal homepage: www.elsevier.com/locate/jssc
Journal of Solid State Chemistry
0022-4596/$ - see front matter & 2013 Elsevier Inc. All rights reserved.
http://dx.doi.org/10.1016/j.jssc.2013.01.008
n Corresponding author. Fax: þ7 495 9394788.
E-mail address: [email protected] (S.Ya. Istomin).
Journal of Solid State Chemistry 200 (2013) 30–38
Author's personal copy
Pr0.8Sr0.2FeO3�y at 1073 K are �110 S/cm [5] and 78 S/cm [6],respectively, which are much lower in comparison withLa0.8Sr0.2CoO3�y (1300 S/cm at 1073 K [7]) and Pr0.85Sr0.15CoO3�y
(�1100 S/cm at 973 K [8]), however, high enough for use ascathode materials in SOFCs. The much lower price for Fe oxidesthan for Co, Mn and Ni ones, makes ferrates prospective cathodematerials in SOFCs [9]. Recently cubic perovskite Sr0.9K0.1FeO3�d
was successfully prepared and tested as cathode material inIT-SOFC [10,11].
SrxM1�xFeO3�d (M—trivalent cation like Y or rare-earthcation) are known to exhibit various perovskite-related structuresdepending on the preparation conditions, like temperature andoxygen partial pressure. This result can be explained by theeasiness in oxidating Fe3þ to Fe4þ during a synthesis in oxidizingatmosphere. Thus Yo et al. reported a study of SrxY1�xFeO3�d,x¼0.25, 0.5 and 0.75 prepared in air at 1473 K [12]. A cubicperovskite with a¼3.872 A was found for x¼0.75, while orthor-hombically distorted GdFeO3-type perovskite phases werereported for x¼0.25 and 0.5. Breard et al. [13] found a smallerunit cell parameter (aE3.837 A) for Sr0.8Y0.2FeO3�d prepared at1473 K under vacuum. In Ref. [14] no single-phase sample wasobtained for Sr0.75Y0.25FeO3�d synthesised in air at 1373 K, whileAbakumov et al. succeeded in preparing a single-phase ferrateSr0.75Y0.25Fe3þO2.625 in vacuum at 1373 K [15]. Their X-raypowder diffraction (XRPD) study indicated the formation ofideal cubic perovskite phase, while electron diffraction revealeda tetragonal perovskite-related structure with aE2O2� aper,cE4� aper. This crystal structure contains ordered A-cationsand oxygen-vacancies and is closely related to that of Sr0.75Y0.25-
CoO2.62 (314-phase below) [16,17]. Cubic perovskitesSr0.67R0.33FeO3�d, R¼Ce, Pr, Nd, Sm, Eu, Gd, Dy, Er, Yb, and Ywere prepared by Battle et al. [18] in air at 1573 K, with unit celldimensions slightly varying depending on the cooling conditions.For R¼Y a cubic perovskite phase with a¼3.866 A (oxygencontent 3�d¼2.77) was reported when the sample had beenslowly cooled down to room temperature, whilst a slightly largerunit cell a¼3.872 A (oxygen content 3�d¼2.69) was reported fora quenched sample. This is in contrast to what observed by Azadet al. [19] who reported a tetragonal perovskite phase Sr0.67Y0.33-
FeO2.662 (aEaper, cE3� aper) with layered ordering of Sr2þ andY3þ in a sample made in air at 1233 K followed by annealing inoxygen at 673 K.
To our knowledge, high-temperature properties of ferratesSrxY1�xFeO3�d, which are important for their use as cathodematerials in IT-SOFC like thermal expansion and electrical con-ductivity, have not been reported so far. In this work we presentthe synthesis, crystal structure study, thermal expansion behaviourand high-temperature electrical conductivity of perovskite-typeoxides SrxY1�xFeO3�d (0.63rxr1.0) and Sr0.75Y0.25Fe1�yMyO3�d
(M¼Cr, Mn, Ni), (y¼0.2, 0.33, 0.5) prepared both in air and N2.We also report additional characterization of the prepared com-pounds like their magnetic properties.
2. Experimental
Samples of SrxY1�xFeO3�d, 0.63rxo1.0 were prepared byheating stoichiometric amounts of pre-dried SrCO3 (MallinckrodtChemical Works, 99.6%), Y2O3 (Davison Chemical Co., 99.9%) andFe2O3 (ABCR GmbH, 99.8%). Appropriate amounts of mixedpowder were ball-milled in a 45 ml plastic container with 10 mliso-propanol, using Si3N4 milling balls (weight ratio powder/balls¼1:2), for 50 min at 300 rpm. The milled powders weredried and ground in a mortar. Syntheses were carried out in air byheating pelletized samples to 1573 K at a rate of 300 K/h, heldthere for 12 h, and then cooled to 573 K at a rate of 300 K/h.
A separate batch of pellets was also prepared in N2 following thesame heating procedure.
Samples of Sr0.75Y0.25Fe1�xMxO3�d (M¼Ni, Cr, Mn), (x¼0.2,0.33, 0.5) were prepared from stoichiometric amounts of SrCO3,Y2O3, Fe2O3 and the appropriate oxide (NiO 99% pure; MnO2
99.5% pure or Cr2O3 99.999% pure) ball-milled by the proceduredescribed above. Pelletized samples were placed in a platinumcrucible and heated in air at the rate of 250 K/h to 1573 K. Thesamples were annealed at 1573 K for 12 h and cooled down toambient temperature at 300 K/h. For the synthesis in N2, pellets ofintimately mixed initial reagents, obtained by the same proceduregiven above, were placed on a platinum foil inside an aluminaboat and heated in flowing N2 at the rate of 300 K/h to 1573 K.Before achieving final annealing temperature, the system wasevacuated twice at 1373 K to remove any products of the reaction(such as carbon dioxide) and refilled with N2. Thereafter, thetemperature was raised to 1573 K and the samples were annealedfor a further 12 h and then cooled down to 973 K at 200 K/h,whereupon the furnace power was shut down and the samplesleft to cool down to room temperature.
Phase purity was checked by XRPD using a PANalytical X’PertPRO MPD diffractometer equipped with a PIXCEL detector, CuKa1radiation, variable slits with a constant 20�12 mm2 area illumi-nated, step size 0.01671, in the 2y range 10–901, with a totalmeasuring time of 1 h. In order to obtain accurate unit cellparameters, Si was added as an internal standard. Unit cellparameters were determined using the Rietveld method usingthe FullProf program [20].
Time-of-flight (TOF) NPD data for Sr0.75Y0.25FeO2.79 werecollected at room temperature using the GEM diffractometer[21] at the ISIS pulsed spallation neutron source, RutherfordAppleton Laboratory, UK. Approximately 8 g of sample wereloaded into a thin-walled cylindrical vanadium can and mountedon an automatic sample changer. Prior to data analysis, data werenormalised using an incoherent scattering pattern from a vana-dium sample. Refinement the crystal structure was performed bythe General Structure Analysis System, GSAS [22].
ED and HREM studies were made with a JEOL JEM2100Ftransmission electron microscope (TEM) with a Schottky-typefield emission gun, equipped with a double tilt sample holder,operating at 200 kV.
Cerimetric [23,24] potentiometric titration was used to deter-mine the oxygen content. In this method Fe4þ presented in thesample is comproportionated in acidic solution with an excess ofFe2þ . The remaining Fe2þ is titrated by solution of Ce4þ withknown concentration. For the titration about 25 mg of samplewas dissolved in 50 ml of 1–2.5 M aqueous solution of HCl,containing 40 mg of (NH4)2Fe(SO4)2 �6H2O. Unreacted Fe2þ wastitrated with a 0.025 M solution of (NH4)4Ce(SO4)4 �2H2O. Theconcentration of the HCl solution used was found to be crucial.At low concentrations of HCl it was difficult to dissolve thesamples, while at high concentrations fast oxidation of Fe2þ byO2 from air was observed. The accuracy of the determination ofthe fraction of Fe4þ was estimated to be 71%. The cation com-positions of the samples were checked using a JEOL JSM 74001-FSEM, operated at an accelerating voltage of 20 kV, equipped withan Oxford INCA energy dispersive X-ray (EDX) spectrometer.About 10 EDX point analysis were made on polished samplesurfaces of each sample using a fixed oxygen stoichiometry usedfor the inter-element corrections.
The oxygen content was determined by a standard combustionmethod using a LECO TC444 apparatus. In this method a sample isfused in a high-purity graphite crucible at temperatures up to3273 K in an inert gas. Oxygen is detected by infrared (IR)spectroscopy either in the form of CO2, CO or both, released asproducts of chemical interaction between oxide and graphite.
J.J. Biendicho et al. / Journal of Solid State Chemistry 200 (2013) 30–38 31
Author's personal copy
The accuracy of the results was checked by oxygen contentdetermination of a standard with known oxygen content.
Thermogravimetric (TG) analyses were made using aPerkinElmer TGA7 instrument. Thermal expansion was measuredwith a Netzsch TMA 402 dilatometer in air at 313–1173 K andusing a heating rate of 5 K/min. For the thermal expansionmeasurements, the powder samples were pressed into pelletswith 8 mm diameter and 5–7 mm height and annealed at 1573 Kfor 12 h.
The conductivity measurements were performed in air in thetemperature range 373–1073 K using the Van der Pauw setup in aProboStat (Norecs) cell using ceramic disks of 20 mm diameterand 1–2 mm thickness. The AC impedance data in the frequencyrange 0.01 to 105 Hz was collected using a Solatron 1260impedance analyser. Conductivity values (1/O) for all samples asa function of temperature were obtained from the low frequencyregion o1 Hz or DC conductivity plateaux in the Y0 spectrum.
AC and DC magnetization measurements were performed ina Quantum Design MPMS-XL SQUID magnetometer. The tem-perature dependence of the magnetization (M) was studiedbetween 5 K and 390 K, following two different protocols; zero-field-cooled (ZFC) and field-cooled (FC). The ZFC magnetizationwas obtained by cooling the sample to 5 K in zero field, turning ona weak magnetic field H¼4 kA/m and measuring the magnetiza-tion as the sample warmed up. The FC magnetization wassubsequently obtained by measuring the magnetization, in thesame applied field, as the sample cooled down to 5 K.
3. Results
3.1. Crystal structure of SrxY1�xFeO3�d, 0.63rxo1.0
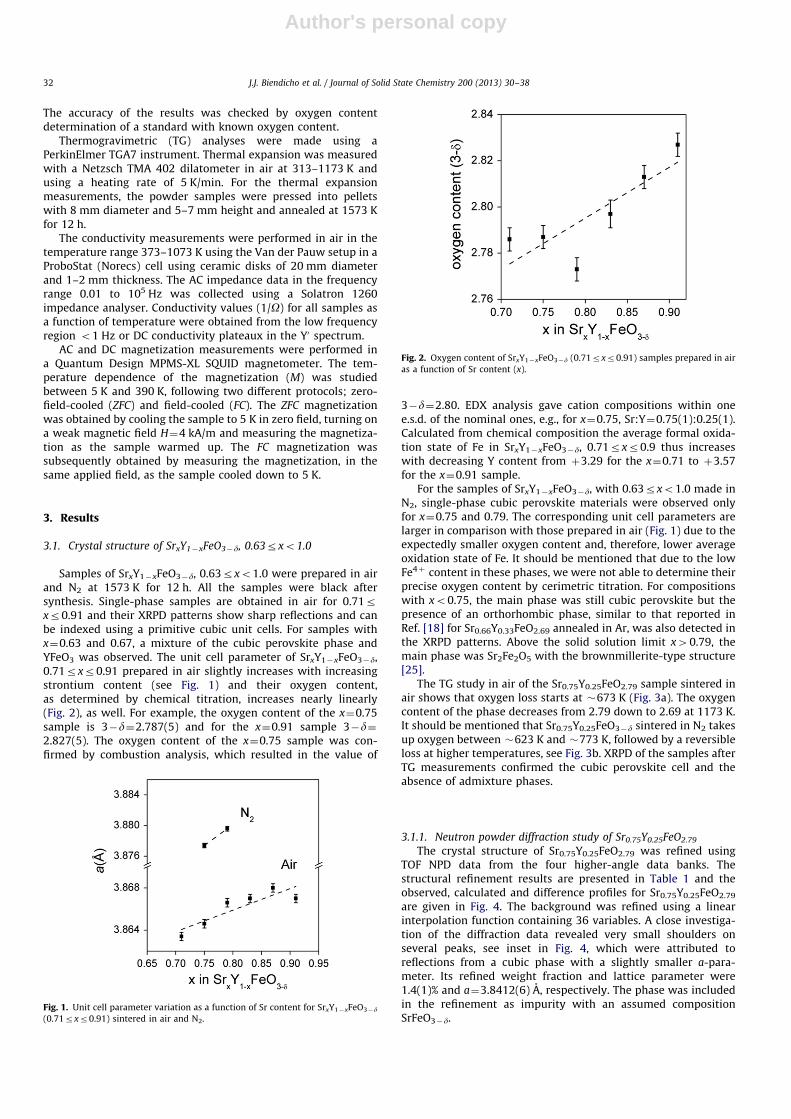
Samples of SrxY1�xFeO3�d, 0.63rxo1.0 were prepared in airand N2 at 1573 K for 12 h. All the samples were black aftersynthesis. Single-phase samples are obtained in air for 0.71rxr0.91 and their XRPD patterns show sharp reflections and canbe indexed using a primitive cubic unit cells. For samples withx¼0.63 and 0.67, a mixture of the cubic perovskite phase andYFeO3 was observed. The unit cell parameter of SrxY1�xFeO3�d,0.71rxr0.91 prepared in air slightly increases with increasingstrontium content (see Fig. 1) and their oxygen content,as determined by chemical titration, increases nearly linearly(Fig. 2), as well. For example, the oxygen content of the x¼0.75sample is 3�d¼2.787(5) and for the x¼0.91 sample 3�d¼2.827(5). The oxygen content of the x¼0.75 sample was con-firmed by combustion analysis, which resulted in the value of
3�d¼2.80. EDX analysis gave cation compositions within onee.s.d. of the nominal ones, e.g., for x¼0.75, Sr:Y¼0.75(1):0.25(1).Calculated from chemical composition the average formal oxida-tion state of Fe in SrxY1�xFeO3�d, 0.71rxr0.9 thus increaseswith decreasing Y content from þ3.29 for the x¼0.71 to þ3.57for the x¼0.91 sample.
For the samples of SrxY1�xFeO3�d, with 0.63rxo1.0 made inN2, single-phase cubic perovskite materials were observed onlyfor x¼0.75 and 0.79. The corresponding unit cell parameters arelarger in comparison with those prepared in air (Fig. 1) due to theexpectedly smaller oxygen content and, therefore, lower averageoxidation state of Fe. It should be mentioned that due to the lowFe4þ content in these phases, we were not able to determine theirprecise oxygen content by cerimetric titration. For compositionswith xo0.75, the main phase was still cubic perovskite but thepresence of an orthorhombic phase, similar to that reported inRef. [18] for Sr0.66Y0.33FeO2.69 annealed in Ar, was also detected inthe XRPD patterns. Above the solid solution limit x40.79, themain phase was Sr2Fe2O5 with the brownmillerite-type structure[25].
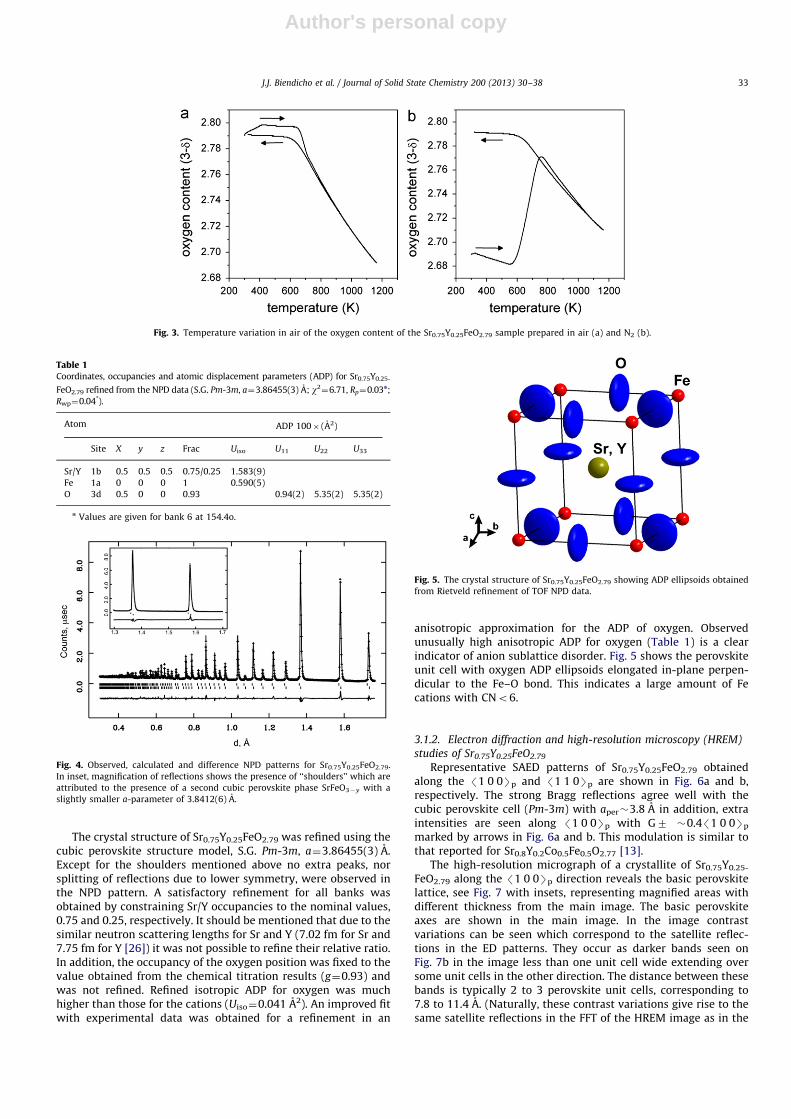
The TG study in air of the Sr0.75Y0.25FeO2.79 sample sintered inair shows that oxygen loss starts at �673 K (Fig. 3a). The oxygencontent of the phase decreases from 2.79 down to 2.69 at 1173 K.It should be mentioned that Sr0.75Y0.25FeO3�d sintered in N2 takesup oxygen between �623 K and �773 K, followed by a reversibleloss at higher temperatures, see Fig. 3b. XRPD of the samples afterTG measurements confirmed the cubic perovskite cell and theabsence of admixture phases.
3.1.1. Neutron powder diffraction study of Sr0.75Y0.25FeO2.79
The crystal structure of Sr0.75Y0.25FeO2.79 was refined usingTOF NPD data from the four higher-angle data banks. Thestructural refinement results are presented in Table 1 and theobserved, calculated and difference profiles for Sr0.75Y0.25FeO2.79
are given in Fig. 4. The background was refined using a linearinterpolation function containing 36 variables. A close investiga-tion of the diffraction data revealed very small shoulders onseveral peaks, see inset in Fig. 4, which were attributed toreflections from a cubic phase with a slightly smaller a-para-meter. Its refined weight fraction and lattice parameter were1.4(1)% and a¼3.8412(6) A, respectively. The phase was includedin the refinement as impurity with an assumed compositionSrFeO3�d.
Fig. 1. Unit cell parameter variation as a function of Sr content for SrxY1�xFeO3�d
(0.71rxr0.91) sintered in air and N2.
Fig. 2. Oxygen content of SrxY1�xFeO3�d (0.71rxr0.91) samples prepared in air
as a function of Sr content (x).
J.J. Biendicho et al. / Journal of Solid State Chemistry 200 (2013) 30–3832
Author's personal copy
The crystal structure of Sr0.75Y0.25FeO2.79 was refined using thecubic perovskite structure model, S.G. Pm-3m, a¼3.86455(3) A.Except for the shoulders mentioned above no extra peaks, norsplitting of reflections due to lower symmetry, were observed inthe NPD pattern. A satisfactory refinement for all banks wasobtained by constraining Sr/Y occupancies to the nominal values,0.75 and 0.25, respectively. It should be mentioned that due to thesimilar neutron scattering lengths for Sr and Y (7.02 fm for Sr and7.75 fm for Y [26]) it was not possible to refine their relative ratio.In addition, the occupancy of the oxygen position was fixed to thevalue obtained from the chemical titration results (g¼0.93) andwas not refined. Refined isotropic ADP for oxygen was muchhigher than those for the cations (Uiso¼0.041 A2). An improved fitwith experimental data was obtained for a refinement in an
anisotropic approximation for the ADP of oxygen. Observedunusually high anisotropic ADP for oxygen (Table 1) is a clearindicator of anion sublattice disorder. Fig. 5 shows the perovskiteunit cell with oxygen ADP ellipsoids elongated in-plane perpen-dicular to the Fe–O bond. This indicates a large amount of Fecations with CNo6.
3.1.2. Electron diffraction and high-resolution microscopy (HREM)
studies of Sr0.75Y0.25FeO2.79
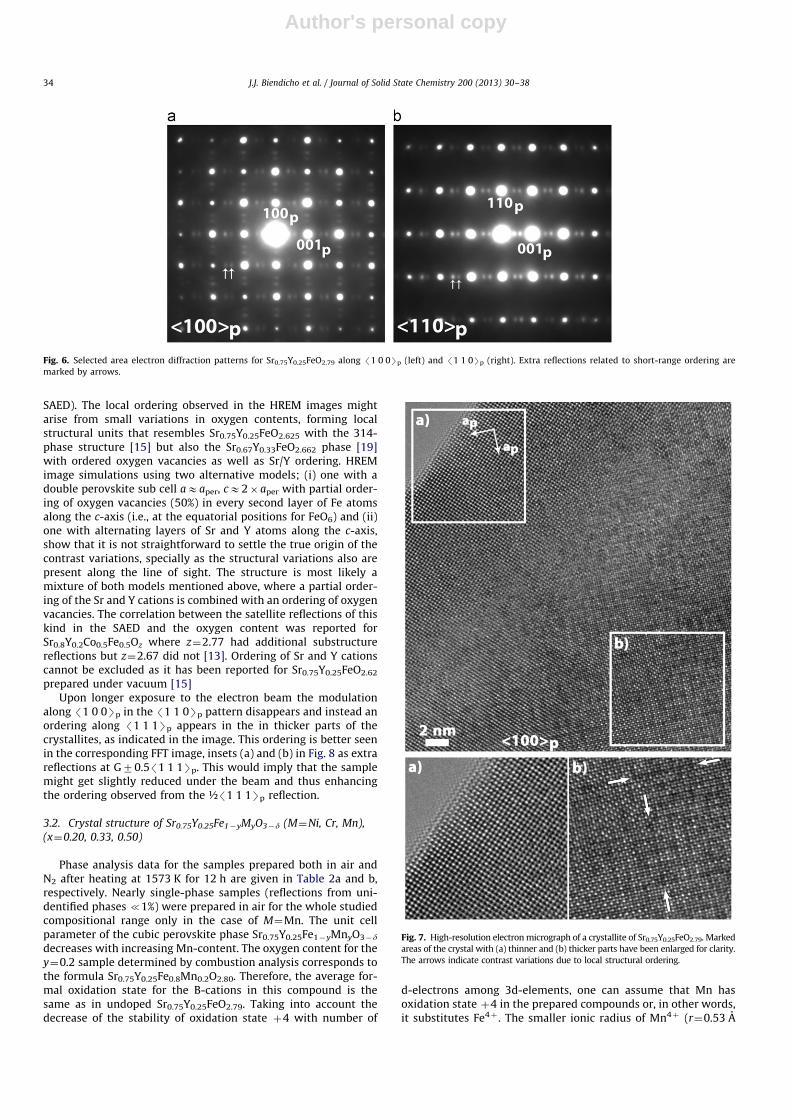
Representative SAED patterns of Sr0.75Y0.25FeO2.79 obtainedalong the /1 0 0Sp and /1 1 0Sp are shown in Fig. 6a and b,respectively. The strong Bragg reflections agree well with thecubic perovskite cell (Pm-3m) with aper�3.8 A in addition, extraintensities are seen along /1 0 0Sp with G7 �0.4/1 0 0Sp
marked by arrows in Fig. 6a and b. This modulation is similar tothat reported for Sr0.8Y0.2Co0.5Fe0.5O2.77 [13].
The high-resolution micrograph of a crystallite of Sr0.75Y0.25-
FeO2.79 along the /1 0 0Sp direction reveals the basic perovskitelattice, see Fig. 7 with insets, representing magnified areas withdifferent thickness from the main image. The basic perovskiteaxes are shown in the main image. In the image contrastvariations can be seen which correspond to the satellite reflec-tions in the ED patterns. They occur as darker bands seen onFig. 7b in the image less than one unit cell wide extending oversome unit cells in the other direction. The distance between thesebands is typically 2 to 3 perovskite unit cells, corresponding to7.8 to 11.4 A. (Naturally, these contrast variations give rise to thesame satellite reflections in the FFT of the HREM image as in the
Fig. 3. Temperature variation in air of the oxygen content of the Sr0.75Y0.25FeO2.79 sample prepared in air (a) and N2 (b).
Table 1Coordinates, occupancies and atomic displacement parameters (ADP) for Sr0.75Y0.25-
FeO2.79 refined from the NPD data (S.G. Pm-3m, a¼3.86455(3) A; w2¼6.71, Rp¼0.03n;
Rwp¼0.04*).
Atom ADP 100� (A2)
Site X y z Frac Uiso U11 U22 U33
Sr/Y 1b 0.5 0.5 0.5 0.75/0.25 1.583(9)
Fe 1a 0 0 0 1 0.590(5)
O 3d 0.5 0 0 0.93 0.94(2) 5.35(2) 5.35(2)
n Values are given for bank 6 at 154.4o.
Fig. 4. Observed, calculated and difference NPD patterns for Sr0.75Y0.25FeO2.79.
In inset, magnification of reflections shows the presence of ‘‘shoulders’’ which are
attributed to the presence of a second cubic perovskite phase SrFeO3�y with a
slightly smaller a-parameter of 3.8412(6) A.
Fig. 5. The crystal structure of Sr0.75Y0.25FeO2.79 showing ADP ellipsoids obtained
from Rietveld refinement of TOF NPD data.
J.J. Biendicho et al. / Journal of Solid State Chemistry 200 (2013) 30–38 33
Author's personal copy
SAED). The local ordering observed in the HREM images mightarise from small variations in oxygen contents, forming localstructural units that resembles Sr0.75Y0.25FeO2.625 with the 314-phase structure [15] but also the Sr0.67Y0.33FeO2.662 phase [19]with ordered oxygen vacancies as well as Sr/Y ordering. HREMimage simulations using two alternative models; (i) one with adouble perovskite sub cell aEaper, cE2� aper with partial order-ing of oxygen vacancies (50%) in every second layer of Fe atomsalong the c-axis (i.e., at the equatorial positions for FeO6) and (ii)one with alternating layers of Sr and Y atoms along the c-axis,show that it is not straightforward to settle the true origin of thecontrast variations, specially as the structural variations also arepresent along the line of sight. The structure is most likely amixture of both models mentioned above, where a partial order-ing of the Sr and Y cations is combined with an ordering of oxygenvacancies. The correlation between the satellite reflections of thiskind in the SAED and the oxygen content was reported forSr0.8Y0.2Co0.5Fe0.5Oz where z¼2.77 had additional substructurereflections but z¼2.67 did not [13]. Ordering of Sr and Y cationscannot be excluded as it has been reported for Sr0.75Y0.25FeO2.62
prepared under vacuum [15]Upon longer exposure to the electron beam the modulation
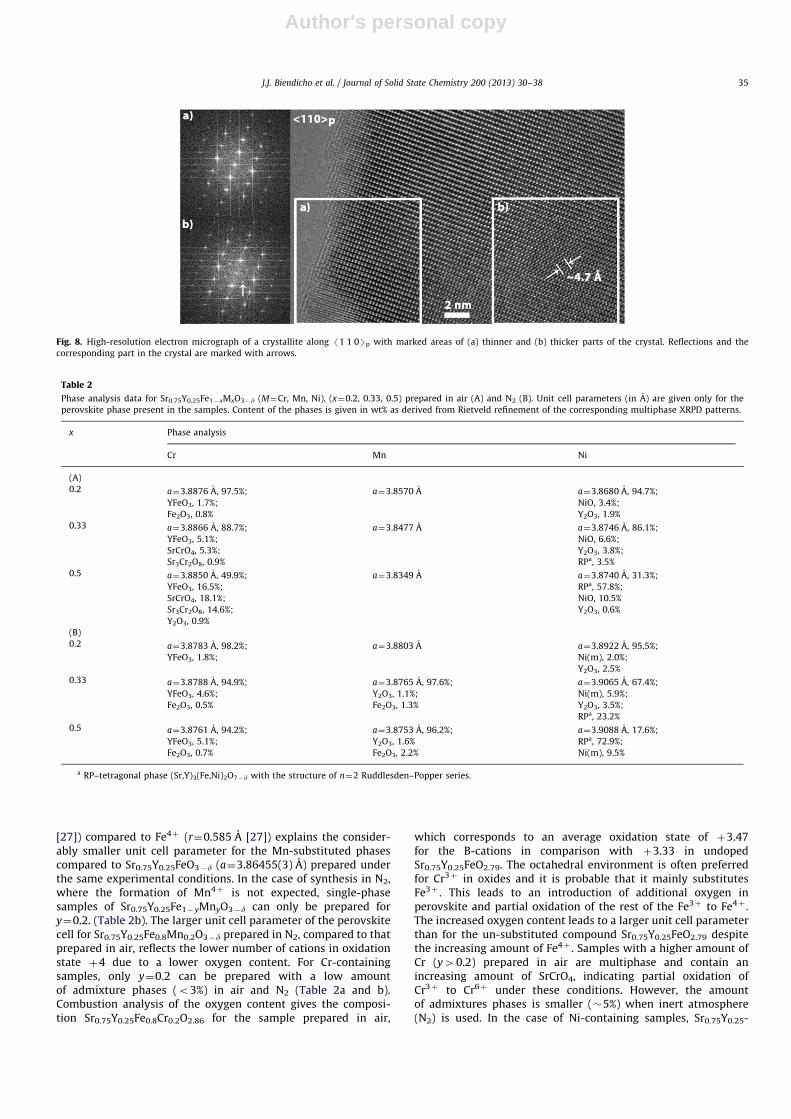
along /1 0 0Sp in the /1 1 0Sp pattern disappears and instead anordering along /1 1 1Sp appears in the in thicker parts of thecrystallites, as indicated in the image. This ordering is better seenin the corresponding FFT image, insets (a) and (b) in Fig. 8 as extrareflections at G70.5/1 1 1Sp. This would imply that the samplemight get slightly reduced under the beam and thus enhancingthe ordering observed from the ½/1 1 1Sp reflection.
3.2. Crystal structure of Sr0.75Y0.25Fe1�yMyO3�d (M¼Ni, Cr, Mn),
(x¼0.20, 0.33, 0.50)
Phase analysis data for the samples prepared both in air andN2 after heating at 1573 K for 12 h are given in Table 2a and b,respectively. Nearly single-phase samples (reflections from uni-dentified phases {1%) were prepared in air for the whole studiedcompositional range only in the case of M¼Mn. The unit cellparameter of the cubic perovskite phase Sr0.75Y0.25Fe1�yMnyO3�d
decreases with increasing Mn-content. The oxygen content for they¼0.2 sample determined by combustion analysis corresponds tothe formula Sr0.75Y0.25Fe0.8Mn0.2O2.80. Therefore, the average for-mal oxidation state for the B-cations in this compound is thesame as in undoped Sr0.75Y0.25FeO2.79. Taking into account thedecrease of the stability of oxidation state þ4 with number of
d-electrons among 3d-elements, one can assume that Mn hasoxidation state þ4 in the prepared compounds or, in other words,it substitutes Fe4þ . The smaller ionic radius of Mn4þ (r¼0.53 A
Fig. 6. Selected area electron diffraction patterns for Sr0.75Y0.25FeO2.79 along /1 0 0Sp (left) and /1 1 0Sp (right). Extra reflections related to short-range ordering are
marked by arrows.
Fig. 7. High-resolution electron micrograph of a crystallite of Sr0.75Y0.25FeO2.79. Marked
areas of the crystal with (a) thinner and (b) thicker parts have been enlarged for clarity.
The arrows indicate contrast variations due to local structural ordering.
J.J. Biendicho et al. / Journal of Solid State Chemistry 200 (2013) 30–3834
Author's personal copy
[27]) compared to Fe4þ (r¼0.585 A [27]) explains the consider-ably smaller unit cell parameter for the Mn-substituted phasescompared to Sr0.75Y0.25FeO3�d (a¼3.86455(3) A) prepared underthe same experimental conditions. In the case of synthesis in N2,where the formation of Mn4þ is not expected, single-phasesamples of Sr0.75Y0.25Fe1�yMnyO3�d can only be prepared fory¼0.2. (Table 2b). The larger unit cell parameter of the perovskitecell for Sr0.75Y0.25Fe0.8Mn0.2O3�d prepared in N2, compared to thatprepared in air, reflects the lower number of cations in oxidationstate þ4 due to a lower oxygen content. For Cr-containingsamples, only y¼0.2 can be prepared with a low amountof admixture phases (o3%) in air and N2 (Table 2a and b).Combustion analysis of the oxygen content gives the composi-tion Sr0.75Y0.25Fe0.8Cr0.2O2.86 for the sample prepared in air,
which corresponds to an average oxidation state of þ3.47for the B-cations in comparison with þ3.33 in undopedSr0.75Y0.25FeO2.79. The octahedral environment is often preferredfor Cr3þ in oxides and it is probable that it mainly substitutesFe3þ . This leads to an introduction of additional oxygen inperovskite and partial oxidation of the rest of the Fe3þ to Fe4þ .The increased oxygen content leads to a larger unit cell parameterthan for the un-substituted compound Sr0.75Y0.25FeO2.79 despitethe increasing amount of Fe4þ . Samples with a higher amount ofCr (y40.2) prepared in air are multiphase and contain anincreasing amount of SrCrO4, indicating partial oxidation ofCr3þ to Cr6þ under these conditions. However, the amountof admixtures phases is smaller (�5%) when inert atmosphere(N2) is used. In the case of Ni-containing samples, Sr0.75Y0.25-
Fig. 8. High-resolution electron micrograph of a crystallite along /1 1 0Sp with marked areas of (a) thinner and (b) thicker parts of the crystal. Reflections and the
corresponding part in the crystal are marked with arrows.
Table 2
Phase analysis data for Sr0.75Y0.25Fe1�xMxO3�d (M¼Cr, Mn, Ni), (x¼0.2, 0.33, 0.5) prepared in air (A) and N2 (B). Unit cell parameters (in A) are given only for the
perovskite phase present in the samples. Content of the phases is given in wt% as derived from Rietveld refinement of the corresponding multiphase XRPD patterns.
x Phase analysis
Cr Mn Ni
(A)
0.2 a¼3.8876 A, 97.5%; a¼3.8570 A a¼3.8680 A, 94.7%;
YFeO3, 1.7%; NiO, 3.4%;
Fe2O3, 0.8% Y2O3, 1.9%
0.33 a¼3.8866 A, 88.7%; a¼3.8477 A a¼3.8746 A, 86.1%;
YFeO3, 5.1%; NiO, 6.6%;
SrCrO4, 5.3%; Y2O3, 3.8%;
Sr3Cr2O8, 0.9% RPa, 3.5%
0.5 a¼3.8850 A, 49.9%; a¼3.8349 A a¼3.8740 A, 31.3%;
YFeO3, 16.5%; RPa, 57.8%;
SrCrO4, 18.1%; NiO, 10.5%
Sr3Cr2O8, 14.6%; Y2O3, 0.6%
Y2O3, 0.9%
(B)
0.2 a¼3.8783 A, 98.2%;
YFeO3, 1.8%;
a¼3.8803 A a¼3.8922 A, 95.5%;
Ni(m), 2.0%;
Y2O3, 2.5%
0.33 a¼3.8788 A, 94.9%; a¼3.8765 A, 97.6%; a¼3.9065 A, 67.4%;
YFeO3, 4.6%; Y2O3, 1.1%; Ni(m), 5.9%;
Fe2O3, 0.5% Fe2O3, 1.3% Y2O3, 3.5%;
RPa, 23.2%
0.5 a¼3.8761 A, 94.2%; a¼3.8753 A, 96.2%; a¼3.9088 A, 17.6%;
YFeO3, 5.1%; Y2O3, 1.6% RPa, 72.9%;
Fe2O3, 0.7% Fe2O3, 2.2% Ni(m), 9.5%
a RP–tetragonal phase (Sr,Y)3(Fe,Ni)2O7�d with the structure of n¼2 Ruddlesden–Popper series.
J.J. Biendicho et al. / Journal of Solid State Chemistry 200 (2013) 30–38 35
Author's personal copy
Fe1�yNiyO3�@, only the samples with y¼0.2 contained less than5% of admixture phases when synthesised in air or N2 (Tables 2aand b). The additional phase is NiO or Ni, indicating that the Nicontent of the perovskite phase is slightly lower than nominalone. The larger unit cell parameter of the perovskite phase in theNi-substituted samples in comparison with undoped Sr0.75Y0.25-FeO2.79 is likely due to the presence of the large Ni2þ cation(rNi2þ
¼0.70 A instead of 0.645 A for Fe3þ (HS)) [27]). Ni-containing samples with y¼0.5, prepared in air as well as N2,contained as a main phase a tetragonal n¼2 member ofRuddlesden–Popper (RP) series Anþ1BnO3nþ1 similar to Sr2.25-Y0.75Co1.25Ni0.75O6.84 [28], see Table 2b. The unit cell parametersof this (Sr,Y)3(Fe,Ni)2O7�d compound depend strongly on theannealing atmosphere used: i.e., a¼3.8374 A, c¼19.787 A forthe y¼0.5 sample prepared in air and a¼3.8621 A, c¼19.637 Afor the one made in N2. The higher amount of this phase in they¼0.5 sample prepared in N2, most probably is an effect of thelower oxidation state of the B-cations. A study of the compositionand crystal structure of this RP phase is in progress and will bereported elsewhere.
3.3. High-temperature conductivity of SrxY1�xFeO3�d, x¼0.75, 0.83,
0.91 and Sr0.75Y0.25Fe0.8M0.2O3�d (M¼Cr, Mn, Ni)
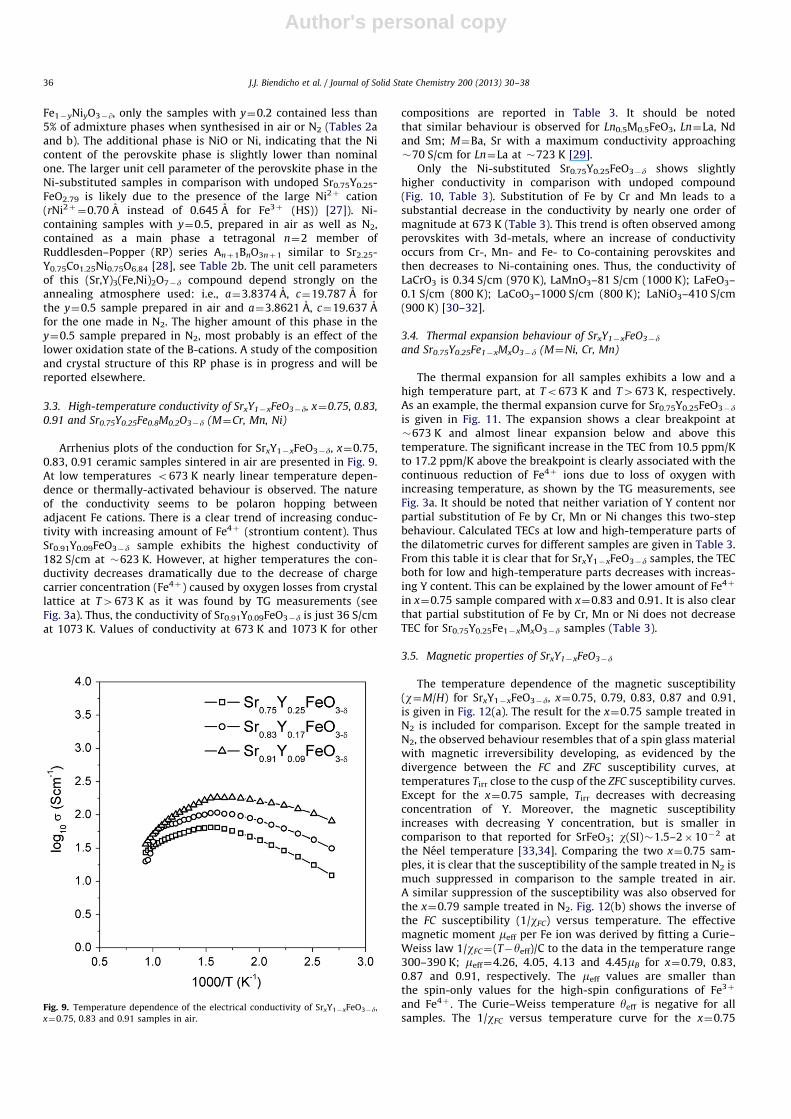
Arrhenius plots of the conduction for SrxY1�xFeO3�d, x¼0.75,0.83, 0.91 ceramic samples sintered in air are presented in Fig. 9.At low temperatures o673 K nearly linear temperature depen-dence or thermally-activated behaviour is observed. The natureof the conductivity seems to be polaron hopping betweenadjacent Fe cations. There is a clear trend of increasing conduc-tivity with increasing amount of Fe4þ (strontium content). ThusSr0.91Y0.09FeO3�d sample exhibits the highest conductivity of182 S/cm at �623 K. However, at higher temperatures the con-ductivity decreases dramatically due to the decrease of chargecarrier concentration (Fe4þ) caused by oxygen losses from crystallattice at T4673 K as it was found by TG measurements (seeFig. 3a). Thus, the conductivity of Sr0.91Y0.09FeO3�d is just 36 S/cmat 1073 K. Values of conductivity at 673 K and 1073 K for other
compositions are reported in Table 3. It should be notedthat similar behaviour is observed for Ln0.5M0.5FeO3, Ln¼La, Ndand Sm; M¼Ba, Sr with a maximum conductivity approaching�70 S/cm for Ln¼La at �723 K [29].
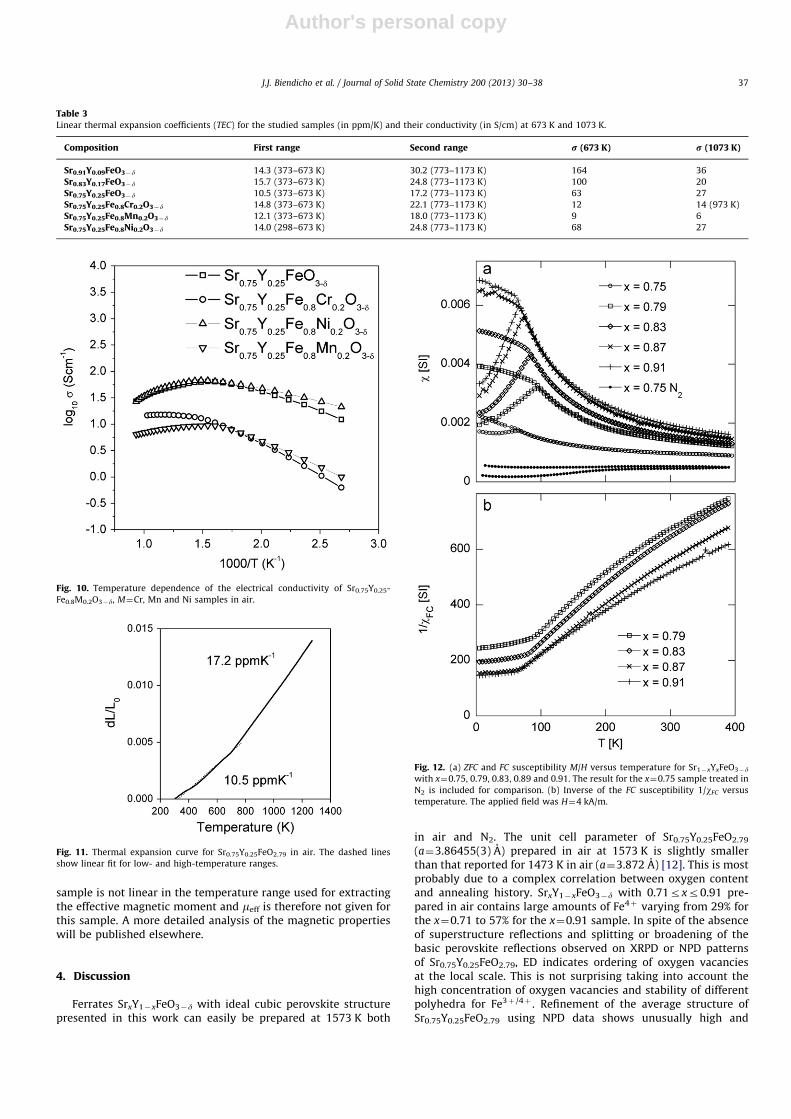
Only the Ni-substituted Sr0.75Y0.25FeO3�d shows slightlyhigher conductivity in comparison with undoped compound(Fig. 10, Table 3). Substitution of Fe by Cr and Mn leads to asubstantial decrease in the conductivity by nearly one order ofmagnitude at 673 K (Table 3). This trend is often observed amongperovskites with 3d-metals, where an increase of conductivityoccurs from Cr-, Mn- and Fe- to Co-containing perovskites andthen decreases to Ni-containing ones. Thus, the conductivity ofLaCrO3 is 0.34 S/cm (970 K), LaMnO3–81 S/cm (1000 K); LaFeO3–0.1 S/cm (800 K); LaCoO3–1000 S/cm (800 K); LaNiO3–410 S/cm(900 K) [30–32].
3.4. Thermal expansion behaviour of SrxY1�xFeO3�d
and Sr0.75Y0.25Fe1�xMxO3�d (M¼Ni, Cr, Mn)
The thermal expansion for all samples exhibits a low and ahigh temperature part, at To673 K and T4673 K, respectively.As an example, the thermal expansion curve for Sr0.75Y0.25FeO3�d
is given in Fig. 11. The expansion shows a clear breakpoint at�673 K and almost linear expansion below and above thistemperature. The significant increase in the TEC from 10.5 ppm/Kto 17.2 ppm/K above the breakpoint is clearly associated with thecontinuous reduction of Fe4þ ions due to loss of oxygen withincreasing temperature, as shown by the TG measurements, seeFig. 3a. It should be noted that neither variation of Y content norpartial substitution of Fe by Cr, Mn or Ni changes this two-stepbehaviour. Calculated TECs at low and high-temperature parts ofthe dilatometric curves for different samples are given in Table 3.From this table it is clear that for SrxY1�xFeO3�d samples, the TECboth for low and high-temperature parts decreases with increas-ing Y content. This can be explained by the lower amount of Fe4þ
in x¼0.75 sample compared with x¼0.83 and 0.91. It is also clearthat partial substitution of Fe by Cr, Mn or Ni does not decreaseTEC for Sr0.75Y0.25Fe1�xMxO3�d samples (Table 3).
3.5. Magnetic properties of SrxY1�xFeO3�d
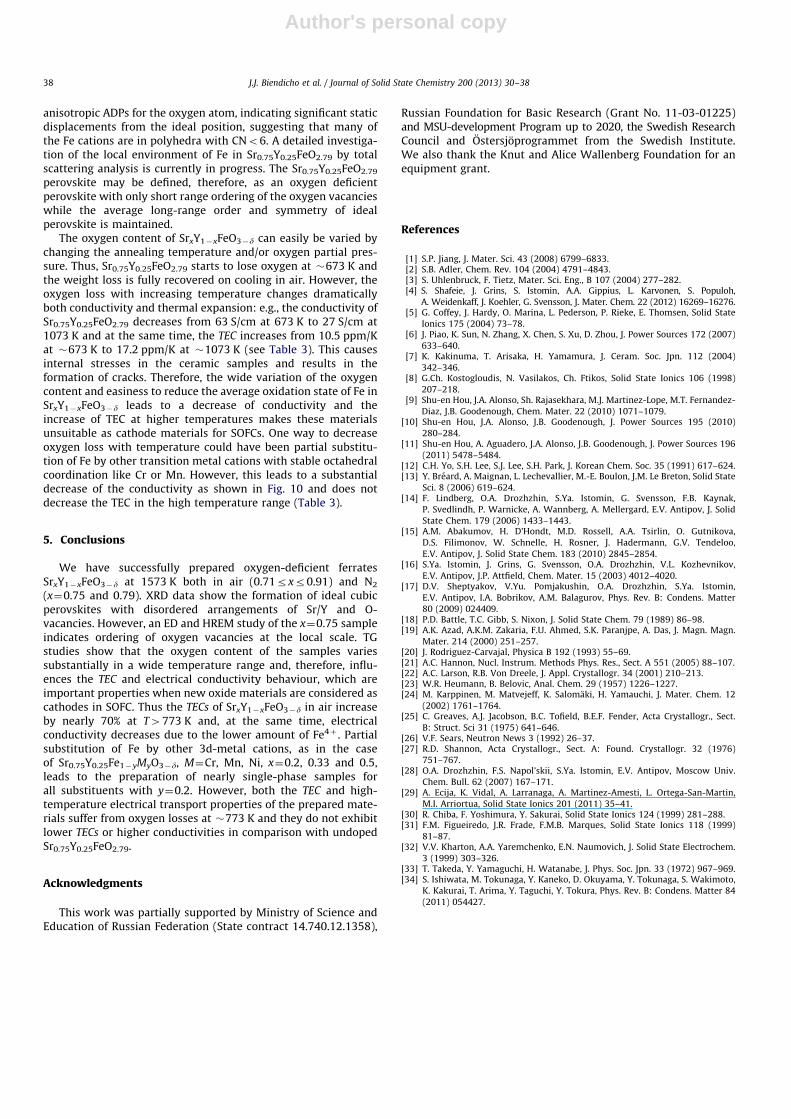
The temperature dependence of the magnetic susceptibility(w¼M/H) for SrxY1�xFeO3�d, x¼0.75, 0.79, 0.83, 0.87 and 0.91,is given in Fig. 12(a). The result for the x¼0.75 sample treated inN2 is included for comparison. Except for the sample treated inN2, the observed behaviour resembles that of a spin glass materialwith magnetic irreversibility developing, as evidenced by thedivergence between the FC and ZFC susceptibility curves, attemperatures Tirr close to the cusp of the ZFC susceptibility curves.Except for the x¼0.75 sample, Tirr decreases with decreasingconcentration of Y. Moreover, the magnetic susceptibilityincreases with decreasing Y concentration, but is smaller incomparison to that reported for SrFeO3; w(SI)�1.5–2�10�2 atthe Neel temperature [33,34]. Comparing the two x¼0.75 sam-ples, it is clear that the susceptibility of the sample treated in N2 ismuch suppressed in comparison to the sample treated in air.A similar suppression of the susceptibility was also observed forthe x¼0.79 sample treated in N2. Fig. 12(b) shows the inverse ofthe FC susceptibility (1/wFC) versus temperature. The effectivemagnetic moment meff per Fe ion was derived by fitting a Curie–Weiss law 1/wFC¼(T�yeff)/C to the data in the temperature range300–390 K; meff¼4.26, 4.05, 4.13 and 4.45mB for x¼0.79, 0.83,0.87 and 0.91, respectively. The meff values are smaller thanthe spin-only values for the high-spin configurations of Fe3þ
and Fe4þ . The Curie–Weiss temperature yeff is negative for allsamples. The 1/wFC versus temperature curve for the x¼0.75
Fig. 9. Temperature dependence of the electrical conductivity of SrxY1�xFeO3�d,
x¼0.75, 0.83 and 0.91 samples in air.
J.J. Biendicho et al. / Journal of Solid State Chemistry 200 (2013) 30–3836
Author's personal copy
sample is not linear in the temperature range used for extractingthe effective magnetic moment and meff is therefore not given forthis sample. A more detailed analysis of the magnetic propertieswill be published elsewhere.
4. Discussion
Ferrates SrxY1�xFeO3�d with ideal cubic perovskite structurepresented in this work can easily be prepared at 1573 K both
in air and N2. The unit cell parameter of Sr0.75Y0.25FeO2.79
(a¼3.86455(3) A) prepared in air at 1573 K is slightly smallerthan that reported for 1473 K in air (a¼3.872 A) [12]. This is mostprobably due to a complex correlation between oxygen contentand annealing history. SrxY1�xFeO3�d with 0.71rxr0.91 pre-pared in air contains large amounts of Fe4þ varying from 29% forthe x¼0.71 to 57% for the x¼0.91 sample. In spite of the absenceof superstructure reflections and splitting or broadening of thebasic perovskite reflections observed on XRPD or NPD patternsof Sr0.75Y0.25FeO2.79, ED indicates ordering of oxygen vacanciesat the local scale. This is not surprising taking into account thehigh concentration of oxygen vacancies and stability of differentpolyhedra for Fe3þ /4þ . Refinement of the average structure ofSr0.75Y0.25FeO2.79 using NPD data shows unusually high and
Table 3Linear thermal expansion coefficients (TEC) for the studied samples (in ppm/K) and their conductivity (in S/cm) at 673 K and 1073 K.
Composition First range Second range r (673 K) r (1073 K)
Sr0.91Y0.09FeO3�d 14.3 (373–673 K) 30.2 (773–1173 K) 164 36
Sr0.83Y0.17FeO3�d 15.7 (373–673 K) 24.8 (773–1173 K) 100 20
Sr0.75Y0.25FeO3�d 10.5 (373–673 K) 17.2 (773–1173 K) 63 27
Sr0.75Y0.25Fe0.8Cr0.2O3�d 14.8 (373–673 K) 22.1 (773–1173 K) 12 14 (973 K)
Sr0.75Y0.25Fe0.8Mn0.2O3�d 12.1 (373–673 K) 18.0 (773–1173 K) 9 6
Sr0.75Y0.25Fe0.8Ni0.2O3�d 14.0 (298–673 K) 24.8 (773–1173 K) 68 27
Fig. 10. Temperature dependence of the electrical conductivity of Sr0.75Y0.25-
Fe0.8M0.2O3�d, M¼Cr, Mn and Ni samples in air.
Fig. 11. Thermal expansion curve for Sr0.75Y0.25FeO2.79 in air. The dashed lines
show linear fit for low- and high-temperature ranges.
Fig. 12. (a) ZFC and FC susceptibility M/H versus temperature for Sr1�xYxFeO3�d
with x¼0.75, 0.79, 0.83, 0.89 and 0.91. The result for the x¼0.75 sample treated in
N2 is included for comparison. (b) Inverse of the FC susceptibility 1/wFC versus
temperature. The applied field was H¼4 kA/m.
J.J. Biendicho et al. / Journal of Solid State Chemistry 200 (2013) 30–38 37
Author's personal copy
anisotropic ADPs for the oxygen atom, indicating significant staticdisplacements from the ideal position, suggesting that many ofthe Fe cations are in polyhedra with CNo6. A detailed investiga-tion of the local environment of Fe in Sr0.75Y0.25FeO2.79 by totalscattering analysis is currently in progress. The Sr0.75Y0.25FeO2.79
perovskite may be defined, therefore, as an oxygen deficientperovskite with only short range ordering of the oxygen vacancieswhile the average long-range order and symmetry of idealperovskite is maintained.
The oxygen content of SrxY1�xFeO3�d can easily be varied bychanging the annealing temperature and/or oxygen partial pres-sure. Thus, Sr0.75Y0.25FeO2.79 starts to lose oxygen at �673 K andthe weight loss is fully recovered on cooling in air. However, theoxygen loss with increasing temperature changes dramaticallyboth conductivity and thermal expansion: e.g., the conductivity ofSr0.75Y0.25FeO2.79 decreases from 63 S/cm at 673 K to 27 S/cm at1073 K and at the same time, the TEC increases from 10.5 ppm/Kat �673 K to 17.2 ppm/K at �1073 K (see Table 3). This causesinternal stresses in the ceramic samples and results in theformation of cracks. Therefore, the wide variation of the oxygencontent and easiness to reduce the average oxidation state of Fe inSrxY1�xFeO3�d leads to a decrease of conductivity and theincrease of TEC at higher temperatures makes these materialsunsuitable as cathode materials for SOFCs. One way to decreaseoxygen loss with temperature could have been partial substitu-tion of Fe by other transition metal cations with stable octahedralcoordination like Cr or Mn. However, this leads to a substantialdecrease of the conductivity as shown in Fig. 10 and does notdecrease the TEC in the high temperature range (Table 3).
5. Conclusions
We have successfully prepared oxygen-deficient ferratesSrxY1�xFeO3�d at 1573 K both in air (0.71rxr0.91) and N2
(x¼0.75 and 0.79). XRD data show the formation of ideal cubicperovskites with disordered arrangements of Sr/Y and O-vacancies. However, an ED and HREM study of the x¼0.75 sampleindicates ordering of oxygen vacancies at the local scale. TGstudies show that the oxygen content of the samples variessubstantially in a wide temperature range and, therefore, influ-ences the TEC and electrical conductivity behaviour, which areimportant properties when new oxide materials are considered ascathodes in SOFC. Thus the TECs of SrxY1�xFeO3�d in air increaseby nearly 70% at T4773 K and, at the same time, electricalconductivity decreases due to the lower amount of Fe4þ . Partialsubstitution of Fe by other 3d-metal cations, as in the caseof Sr0.75Y0.25Fe1�yMyO3�d, M¼Cr, Mn, Ni, x¼0.2, 0.33 and 0.5,leads to the preparation of nearly single-phase samples forall substituents with y¼0.2. However, both the TEC and high-temperature electrical transport properties of the prepared mate-rials suffer from oxygen losses at �773 K and they do not exhibitlower TECs or higher conductivities in comparison with undopedSr0.75Y0.25FeO2.79.
Acknowledgments
This work was partially supported by Ministry of Science andEducation of Russian Federation (State contract 14.740.12.1358),
Russian Foundation for Basic Research (Grant No. 11-03-01225)and MSU-development Program up to 2020, the Swedish ResearchCouncil and Ostersjoprogrammet from the Swedish Institute.We also thank the Knut and Alice Wallenberg Foundation for anequipment grant.
References
[1] S.P. Jiang, J. Mater. Sci. 43 (2008) 6799–6833.[2] S.B. Adler, Chem. Rev. 104 (2004) 4791–4843.[3] S. Uhlenbruck, F. Tietz, Mater. Sci. Eng., B 107 (2004) 277–282.[4] S. Shafeie, J. Grins, S. Istomin, A.A. Gippius, L. Karvonen, S. Populoh,
A. Weidenkaff, J. Koehler, G. Svensson, J. Mater. Chem. 22 (2012) 16269–16276.[5] G. Coffey, J. Hardy, O. Marina, L. Pederson, P. Rieke, E. Thomsen, Solid State
Ionics 175 (2004) 73–78.[6] J. Piao, K. Sun, N. Zhang, X. Chen, S. Xu, D. Zhou, J. Power Sources 172 (2007)
633–640.[7] K. Kakinuma, T. Arisaka, H. Yamamura, J. Ceram. Soc. Jpn. 112 (2004)
342–346.[8] G.Ch. Kostogloudis, N. Vasilakos, Ch. Ftikos, Solid State Ionics 106 (1998)
207–218.[9] Shu-en Hou, J.A. Alonso, Sh. Rajasekhara, M.J. Martinez-Lope, M.T. Fernandez-
Diaz, J.B. Goodenough, Chem. Mater. 22 (2010) 1071–1079.[10] Shu-en Hou, J.A. Alonso, J.B. Goodenough, J. Power Sources 195 (2010)
280–284.[11] Shu-en Hou, A. Aguadero, J.A. Alonso, J.B. Goodenough, J. Power Sources 196
(2011) 5478–5484.[12] C.H. Yo, S.H. Lee, S.J. Lee, S.H. Park, J. Korean Chem. Soc. 35 (1991) 617–624.[13] Y. Breard, A. Maignan, L. Lechevallier, M.-E. Boulon, J.M. Le Breton, Solid State
Sci. 8 (2006) 619–624.[14] F. Lindberg, O.A. Drozhzhin, S.Ya. Istomin, G. Svensson, F.B. Kaynak,
P. Svedlindh, P. Warnicke, A. Wannberg, A. Mellergard, E.V. Antipov, J. SolidState Chem. 179 (2006) 1433–1443.
[15] A.M. Abakumov, H. D’Hondt, M.D. Rossell, A.A. Tsirlin, O. Gutnikova,D.S. Filimonov, W. Schnelle, H. Rosner, J. Hadermann, G.V. Tendeloo,
E.V. Antipov, J. Solid State Chem. 183 (2010) 2845–2854.[16] S.Ya. Istomin, J. Grins, G. Svensson, O.A. Drozhzhin, V.L. Kozhevnikov,
E.V. Antipov, J.P. Attfield, Chem. Mater. 15 (2003) 4012–4020.[17] D.V. Sheptyakov, V.Yu. Pomjakushin, O.A. Drozhzhin, S.Ya. Istomin,
E.V. Antipov, I.A. Bobrikov, A.M. Balagurov, Phys. Rev. B: Condens. Matter80 (2009) 024409.
[18] P.D. Battle, T.C. Gibb, S. Nixon, J. Solid State Chem. 79 (1989) 86–98.[19] A.K. Azad, A.K.M. Zakaria, F.U. Ahmed, S.K. Paranjpe, A. Das, J. Magn. Magn.
Mater. 214 (2000) 251–257.[20] J. Rodriguez-Carvajal, Physica B 192 (1993) 55–69.[21] A.C. Hannon, Nucl. Instrum. Methods Phys. Res., Sect. A 551 (2005) 88–107.[22] A.C. Larson, R.B. Von Dreele, J. Appl. Crystallogr. 34 (2001) 210–213.[23] W.R. Heumann, B. Belovic, Anal. Chem. 29 (1957) 1226–1227.[24] M. Karppinen, M. Matvejeff, K. Salomaki, H. Yamauchi, J. Mater. Chem. 12
(2002) 1761–1764.[25] C. Greaves, A.J. Jacobson, B.C. Tofield, B.E.F. Fender, Acta Crystallogr., Sect.
B: Struct. Sci 31 (1975) 641–646.[26] V.F. Sears, Neutron News 3 (1992) 26–37.[27] R.D. Shannon, Acta Crystallogr., Sect. A: Found. Crystallogr. 32 (1976)
751–767.[28] O.A. Drozhzhin, F.S. Napol’skii, S.Ya. Istomin, E.V. Antipov, Moscow Univ.
Chem. Bull. 62 (2007) 167–171.[29] A. Ecija, K. Vidal, A. Larranaga, A. Martinez-Amesti, L. Ortega-San-Martin,
M.I. Arriortua, Solid State Ionics 201 (2011) 35–41.[30] R. Chiba, F. Yoshimura, Y. Sakurai, Solid State Ionics 124 (1999) 281–288.[31] F.M. Figueiredo, J.R. Frade, F.M.B. Marques, Solid State Ionics 118 (1999)
81–87.[32] V.V. Kharton, A.A. Yaremchenko, E.N. Naumovich, J. Solid State Electrochem.
3 (1999) 303–326.[33] T. Takeda, Y. Yamaguchi, H. Watanabe, J. Phys. Soc. Jpn. 33 (1972) 967–969.[34] S. Ishiwata, M. Tokunaga, Y. Kaneko, D. Okuyama, Y. Tokunaga, S. Wakimoto,
K. Kakurai, T. Arima, Y. Taguchi, Y. Tokura, Phys. Rev. B: Condens. Matter 84
(2011) 054427.
J.J. Biendicho et al. / Journal of Solid State Chemistry 200 (2013) 30–3838
Related Documents