This article appeared in a journal published by Elsevier. The attached copy is furnished to the author for internal non-commercial research and education use, including for instruction at the authors institution and sharing with colleagues. Other uses, including reproduction and distribution, or selling or licensing copies, or posting to personal, institutional or third party websites are prohibited. In most cases authors are permitted to post their version of the article (e.g. in Word or Tex form) to their personal website or institutional repository. Authors requiring further information regarding Elsevier’s archiving and manuscript policies are encouraged to visit: http://www.elsevier.com/authorsrights

Welcome message from author
This document is posted to help you gain knowledge. Please leave a comment to let me know what you think about it! Share it to your friends and learn new things together.
Transcript

This article appeared in a journal published by Elsevier. The attachedcopy is furnished to the author for internal non-commercial researchand education use, including for instruction at the authors institution
and sharing with colleagues.
Other uses, including reproduction and distribution, or selling orlicensing copies, or posting to personal, institutional or third party
websites are prohibited.
In most cases authors are permitted to post their version of thearticle (e.g. in Word or Tex form) to their personal website orinstitutional repository. Authors requiring further information
regarding Elsevier’s archiving and manuscript policies areencouraged to visit:
http://www.elsevier.com/authorsrights

Author's personal copy
Synthesis and characterization of novel Fe@ZnO nanosystem
Pooja Dhiman a,⇑, Jagdish Chand a, Amit Kumar c, R.K. Kotnala d, Khalid Mujasam Batoo b, M. Singh a
a Department of Physics, Himachal Pradesh University, Shimla 5, Indiab King Abdullah Institute for Nanotechnology, King Saud University, PO Box 2455, Riyadh 11451, Saudi Arabiac Department of Chemistry, Himachal Pradesh University, Shimla 5, Indiad National Physical Laboratory, Pusa Road, New Delhi 110 012, India
a r t i c l e i n f o
Article history:Received 1 April 2013Received in revised form 29 April 2013Accepted 2 May 2013Available online 11 May 2013
Keywords:SemiconductorsSinteringTEMPhoto degradationFerromagnetism
a b s t r a c t
Novel Fe@ZnO nanosystem has been synthesized by sol–gel route. We report the structural, optical, mag-netic properties and photo catalytic efficiency of FexZn1�xO (x = 0.01, 0.03, 0.05) nanoparticles. The micro-structure and magnetic properties have been investigated by means of X-ray diffraction and VSMrespectively. XRD, TEM and SAED analysis confirm the phase purity and site substitution by Fe. Photo cat-alytic efficiency of pure ZnO for the removal of Methylene Blue dye (pollutant) has been improved withthe addition of Fe. All samples are found to be ferromagnetic at room temperature. Subtle enhancementin saturation magnetization is found with Fe doping in ZnO matrix. The variation of magnetization withtemperature has been studied at an applied field of 1000 Oe. Optical band gap studies by UV–Vis studiesshow initially red shift and then blue shift with Fe doping. The mechanism responsible for observedresults have been discussed minutely in this paper.
� 2013 Elsevier B.V. All rights reserved.
1. Introduction
Diluted magnetic semiconductors is a well known source ofspintronics, optoelectronics and microwave devices because ofthe possibility of manipulating charge and spin degrees of freedomin the single material [1,2]. With theoretical predictions by Dietl,TM doped ZnO has emerged as most promising host material forthe spintronic applications [3]. The basic criteria to choose a DMSfor these types of applications require the existence of ferromagne-tism above room temperature. But this ferromagnetism should beintrinsic i.e., not because of magnetic element cluster formation orsome secondary phases. With the Dietl. ’s work, TM doped ZnO hasbecome an wide area of research for researchers. A lot of work hasbeen done on ZnO with transition metals doping like Ni, Co, Cu, Cr,as well as Fe. However the Fe:ZnO system is widely studied systemwith most controversial results. There are lot of reports on themagnetic properties of Fe doped ZnO system. Some authors havereported the secondary phases or cluster formation might beresponsible for the room temperature ferromagnetism in the Fe:Z-nO system, while others have studied intrinsic ferromagnetism [4–6]. Some reports also claim the paramagnetic nature of these sam-ples [7,8]. These contradictions and controversies give an indica-tion that the room temperature ferromagnetism is highlysensitive property which depends on the preparation techniques
as well as the preparation and environment conditions. Fe dopedZnO system has been widely investigated in the bulk, nano as wellas in thin films form [9–14]. In the recent work, correlation be-tween structural and magnetic properties has been well studiedfor Fe rich ZnO [15]. Besides the magnetic properties, ZnO is opto-electronic and photo catalytic material. Because of its photocata-lytic and antibacterial properties, semiconductor nanoparticlesfind applications in food packaging, self-cleaning and antifoulingmaterials, and water purification membranes [16]. People havewidely studied the optical and photocatalytic properties of bareZnO [17,18]. However there are also reports on the transition metaldoped ZnO system [19–21]. It is well known fact that TM dopingresults in the defect chemistry variation which is basics of photo-catalytic activity of any catalyst.
On this basis, we have attempted to synthesize Fe doped ZnOnanoparticles by sol–gel process and to characterize these samplesfor structural, optical, photocatalytic as well for magnetic proper-ties. Fe doped ZnO prepared by this technique has proved to be abetter phocatalytic, optical as well as magnetic material which al-lows its use in current technology.
2. Experimental
2.1. Growth procedure
Nanocrystalline powders of Fe doped ZnO with 1%, 3%, 5% Fe have been synthe-sized by sol–gel process. Zinc Nitrate (Merck, P98%) and Iron Nitrate (Merck,P99%) have been taken as raw materials and dissolved into distilled water by vig-
0925-8388/$ - see front matter � 2013 Elsevier B.V. All rights reserved.http://dx.doi.org/10.1016/j.jallcom.2013.05.015
⇑ Corresponding author. Tel.: +91 9418461190.E-mail address: [email protected] (P. Dhiman).
Journal of Alloys and Compounds 578 (2013) 235–241
Contents lists available at SciVerse ScienceDirect
Journal of Alloys and Compounds
journal homepage: www.elsevier .com/locate / ja lcom
Author's personal copy
orous stirring for 1 h. This solution is then poured into the citric acid solution in dis-tilled water. The resulting solution was allowed to stir for 1 h. pH of the solutionwas maintained at 7 by the drop wise addition of liquid ammonia. After thatsolution was heated at 353 K unless it is converted into the reticular substance. Thissubstance is further heated in the muffle furnace at 873 K for 6 h 278.8 K/min and of274 K/min were the heating and cooling rate during the sample preparation.
2.2. Characterization
The obtained powder was used for further characterization. The crystallo-graphic interpretations were performed by X-ray diffractometer (XRD, XPERTPRODiffractometer) using Cu Ka wavelength (k = 1.54059 angstrom(Å)) and scanningin 2h range from 20� to 80�. Simulation of crystal structure based on the measuredX-ray diffraction (XRD) data was performed using Rietveld crystal structure refine-ment software FULLPROF 2007. Micro-structural features at high magnificationsand selected area electron diffraction patterns were recorded using a transmissionelectron microscope (HRTEM) (JEOL, USA) operated at the electron acceleratingvoltage of 200 keV. Experiment to study the optical properties was done on SYS-TRONICS double beam spectrophotometer 2202 by making the suspension of2 mg of prepared sample in distilled water. 2 mg of sample was dispersed and ultr-asonicated in distilled water. The UV–Vis spectra were obtained using double beamspectrophotometer. The photocatalytic efficiency of the samples was analyzed fordegradation of Methylene Blue (MB) (Merck, 98.9%) as a pollutant in presence ofnatural sunlight in a slurry type batch reactor. The slurry consisting of MB dyeand catalyst suspension was stirred magnetically for half hour. For this 0.25 mg/ml photocatalyst was added to aqueous solution of dye (1.5 � 10�5 M). Beforeexposing the solutions to sunlight, they were kept in dark for 1 h to establishadsorption–desorption equilibrium. After intervals of time aliquot of 3 ml was ta-ken out and centrifuged to remove catalyst form suspension. The absorption ofMB was then recorded using double beam spectrophotometer at 662 nm. The aver-age intensity of sunlight was recorded as 30 � 103 ± 100 lx using Lux-meter. Allexperiments were performed three times and average values were reported. Mag-netization studies were carried out using vibrating sample magnetometer (‘‘Micro-sense’’ EV7, USA) up to field of 10,000 Oe.
3. Results and discussion
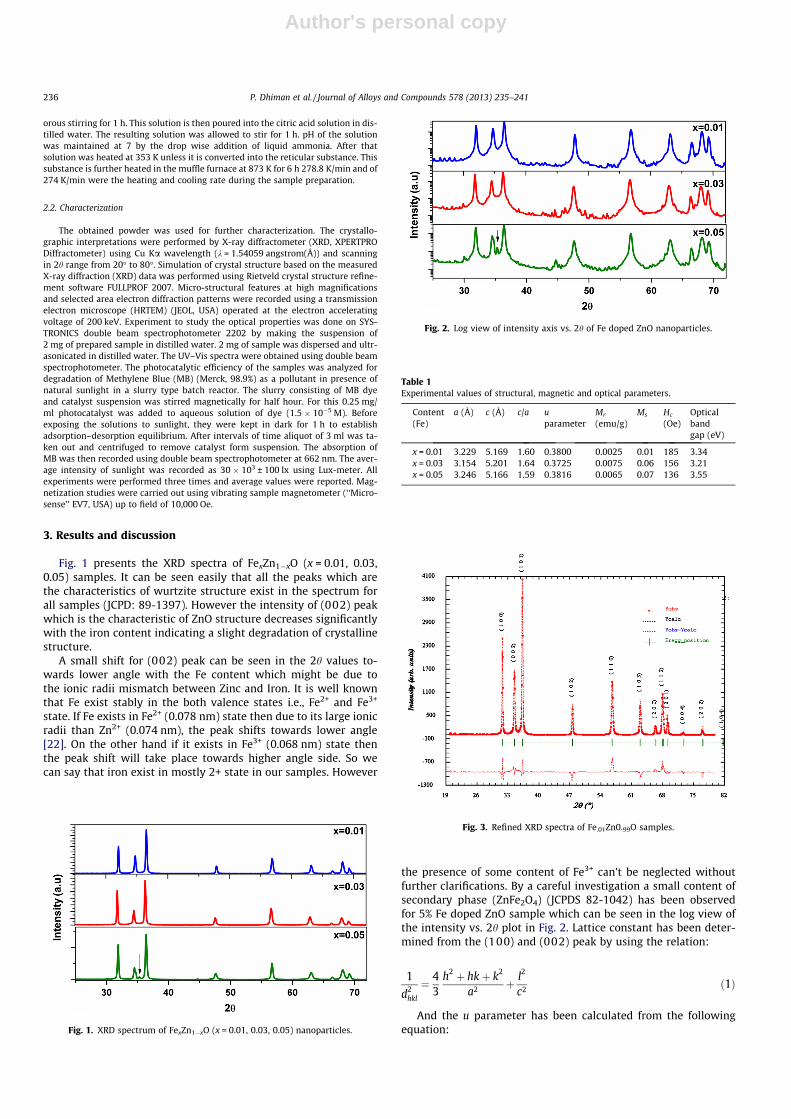
Fig. 1 presents the XRD spectra of FexZn1�xO (x = 0.01, 0.03,0.05) samples. It can be seen easily that all the peaks which arethe characteristics of wurtzite structure exist in the spectrum forall samples (JCPD: 89-1397). However the intensity of (002) peakwhich is the characteristic of ZnO structure decreases significantlywith the iron content indicating a slight degradation of crystallinestructure.
A small shift for (002) peak can be seen in the 2h values to-wards lower angle with the Fe content which might be due tothe ionic radii mismatch between Zinc and Iron. It is well knownthat Fe exist stably in the both valence states i.e., Fe2+ and Fe3+
state. If Fe exists in Fe2+ (0.078 nm) state then due to its large ionicradii than Zn2+ (0.074 nm), the peak shifts towards lower angle[22]. On the other hand if it exists in Fe3+ (0.068 nm) state thenthe peak shift will take place towards higher angle side. So wecan say that iron exist in mostly 2+ state in our samples. However
the presence of some content of Fe3+ can’t be neglected withoutfurther clarifications. By a careful investigation a small content ofsecondary phase (ZnFe2O4) (JCPDS 82-1042) has been observedfor 5% Fe doped ZnO sample which can be seen in the log view ofthe intensity vs. 2h plot in Fig. 2. Lattice constant has been deter-mined from the (100) and (002) peak by using the relation:
1
d2hkl
¼ 43
h2 þ hkþ k2
a2 þ l2
c2 ð1Þ
And the u parameter has been calculated from the followingequation:Fig. 1. XRD spectrum of FexZn1�xO (x = 0.01, 0.03, 0.05) nanoparticles.
Fig. 2. Log view of intensity axis vs. 2h of Fe doped ZnO nanoparticles.
Table 1Experimental values of structural, magnetic and optical parameters.
Content(Fe)
a (Å) c (Å) c/a uparameter
Mr
(emu/g)Ms Hc
(Oe)Opticalbandgap (eV)
x = 0.01 3.229 5.169 1.60 0.3800 0.0025 0.01 185 3.34x = 0.03 3.154 5.201 1.64 0.3725 0.0075 0.06 156 3.21x = 0.05 3.246 5.166 1.59 0.3816 0.0065 0.07 136 3.55
Fig. 3. Refined XRD spectra of Fe.01Zn0.99O samples.
236 P. Dhiman et al. / Journal of Alloys and Compounds 578 (2013) 235–241
Author's personal copy
u ¼ 13
� �a2
c2
� �þ 1
4ð2Þ
Since there is a large correlation between the u parameter andthe c/a ratio, as c/a ratio tends to increase, u parameter decreases.This happens in a manner so that the four tetrahedral distances inZnO matrix remains nearly constant through a distortion of tetra-hedral angles due to long range polar interactions. The c/a ratiofirstly increases up to 3% Fe content then again decreases whichmight be due to the formation of minor secondary phase forFe0.05 Zn0.95O sample (Table 1). Reitveld refinement of Fe.01Zn0.99-
O sample is given the Fig. 3 which is the proof of wurtzite struc-ture formation. The observed lattice parameters are well inagreement with the manually calculated parameters. The ob-tained Bragg RB and RF factors are 4.96% and 8.32% respectively(v2 � 1.59).
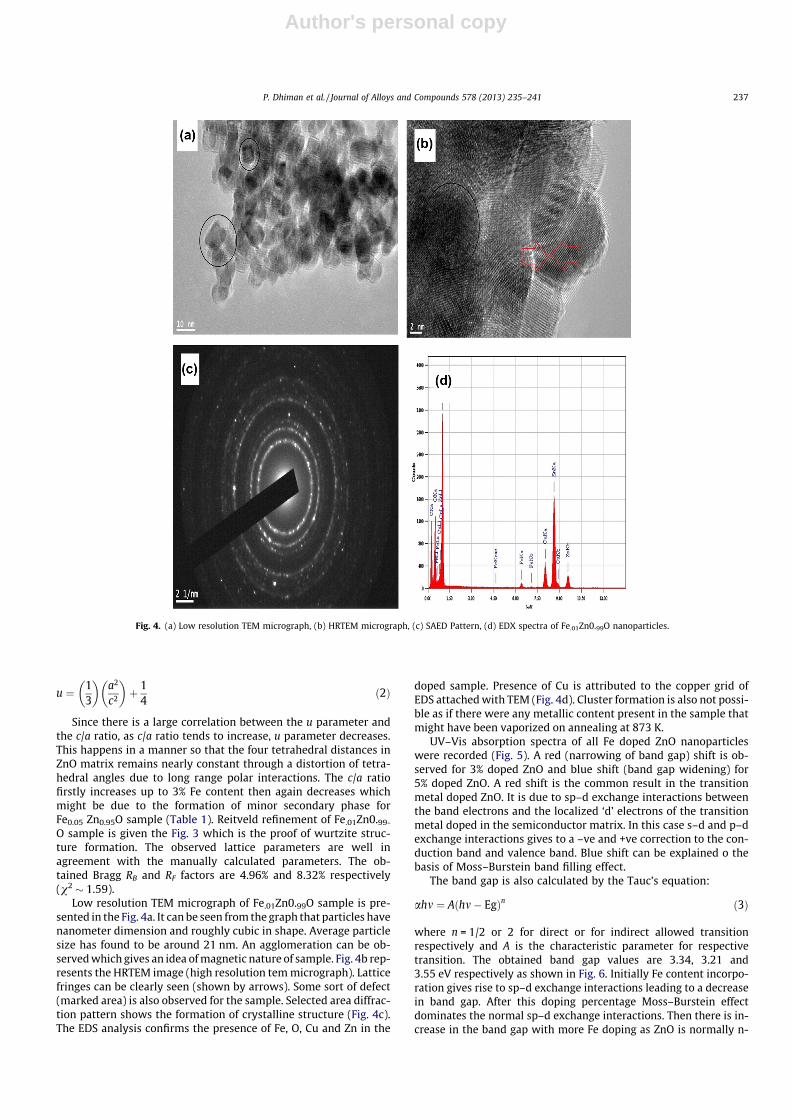
Low resolution TEM micrograph of Fe.01Zn0.99O sample is pre-sented in the Fig. 4a. It can be seen from the graph that particles havenanometer dimension and roughly cubic in shape. Average particlesize has found to be around 21 nm. An agglomeration can be ob-served which gives an idea of magnetic nature of sample. Fig. 4b rep-resents the HRTEM image (high resolution tem micrograph). Latticefringes can be clearly seen (shown by arrows). Some sort of defect(marked area) is also observed for the sample. Selected area diffrac-tion pattern shows the formation of crystalline structure (Fig. 4c).The EDS analysis confirms the presence of Fe, O, Cu and Zn in the
doped sample. Presence of Cu is attributed to the copper grid ofEDS attached with TEM (Fig. 4d). Cluster formation is also not possi-ble as if there were any metallic content present in the sample thatmight have been vaporized on annealing at 873 K.
UV–Vis absorption spectra of all Fe doped ZnO nanoparticleswere recorded (Fig. 5). A red (narrowing of band gap) shift is ob-served for 3% doped ZnO and blue shift (band gap widening) for5% doped ZnO. A red shift is the common result in the transitionmetal doped ZnO. It is due to sp–d exchange interactions betweenthe band electrons and the localized ‘d’ electrons of the transitionmetal doped in the semiconductor matrix. In this case s–d and p–dexchange interactions gives to a –ve and +ve correction to the con-duction band and valence band. Blue shift can be explained o thebasis of Moss–Burstein band filling effect.
The band gap is also calculated by the Tauc’s equation:
ahm ¼ Aðhm� EgÞn ð3Þ
where n = 1/2 or 2 for direct or for indirect allowed transitionrespectively and A is the characteristic parameter for respectivetransition. The obtained band gap values are 3.34, 3.21 and3.55 eV respectively as shown in Fig. 6. Initially Fe content incorpo-ration gives rise to sp–d exchange interactions leading to a decreasein band gap. After this doping percentage Moss–Burstein effectdominates the normal sp–d exchange interactions. Then there is in-crease in the band gap with more Fe doping as ZnO is normally n-
Fig. 4. (a) Low resolution TEM micrograph, (b) HRTEM micrograph, (c) SAED Pattern, (d) EDX spectra of Fe.01Zn0.99O nanoparticles.
P. Dhiman et al. / Journal of Alloys and Compounds 578 (2013) 235–241 237

Author's personal copy
type material stable at room temperature and Fermi level lies insidethe conduction band when doped with greater Fe. Since no state isempty inside the conduction band so the absorption edge shifts to-wards higher energy side thereby giving rise increase in band gap.
Photo catalytic activity of prepared samples is studied on Meth-ylene Blue dye which is the main component of industrial wastematerial. In order to decrease damage caused by organic dye pollu-
tion to environment and humans, the use of photocatalyst to de-grade organic compounds in contaminated air or water or toconvert them into harmless chemicals has been extensivelystudied.
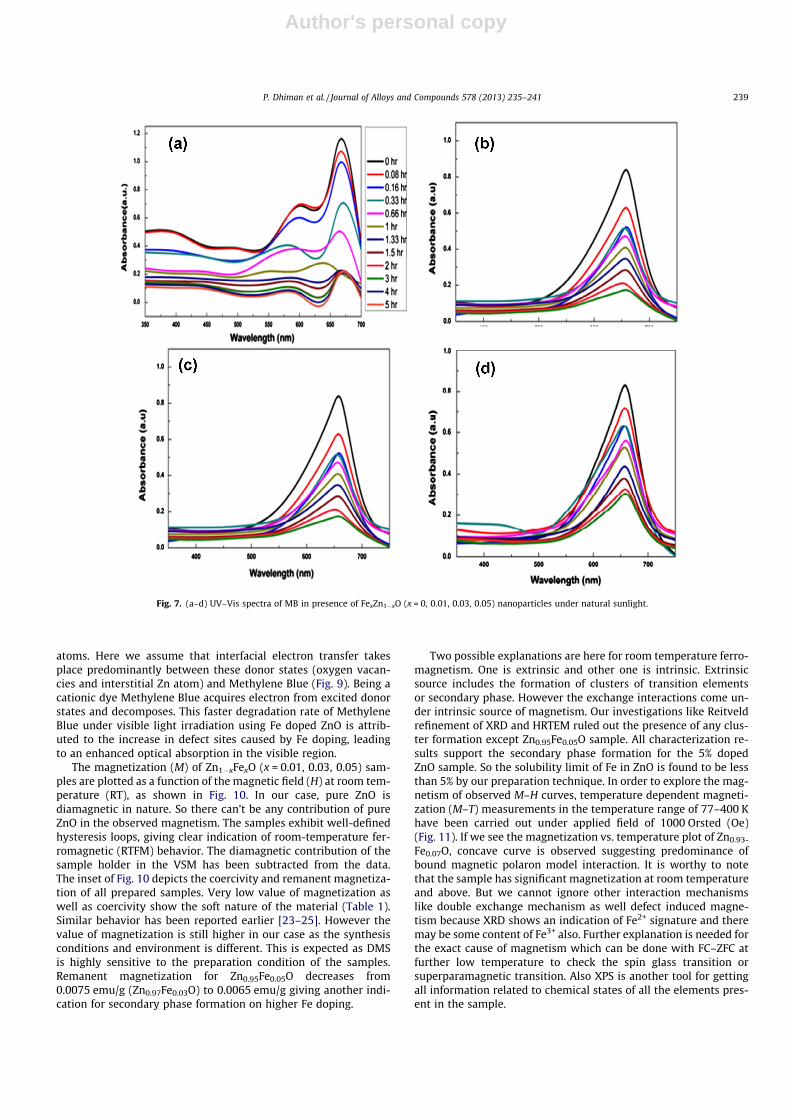
Analysis has been done by the use of natural solar light and UV–Vis spectrophotometer. All observed spectra are presented in Fig. 7.The percentage degradation has been determined by the followingrelation:
% Degradation ¼ C0 � Ct
C0� 100 ð4Þ
Where C0 is initial concentration of dye before illumination, Ct isconcentration of dye at time t. Percentage degradation curves areshown in Fig. 8.
After the photodegradation of Methylene Blue was studiedusing UV–Vis spectrophotometer, it was observed that 75.6% ofdye was removed after 5hrs of illumination for bare ZnO, but thispercentage increases to 80.2% and 92.5% for the 1% Fe and 3% Fedoped ZnO sample respectfully for the same time of illumination.For 5% Fe doped ZnO sample only 65% dye removal is achievedwhich may be attributed to the formation of secondary phase aswell as defect chemistry variation as supported by band gap calcu-lation also. We can conclude that Fe doped ZnO nanoparticles havegreater photocatalytic activity for the removal of harmful dyesthan ZnO. Photocatalytic activity of undoped ZnO is attributed bothto the donor states caused by the large number of defect sites suchas oxygen vacancies and interstitial zinc atom and to the acceptorstates which arise from zinc vacancies and interstitial oxygen
Fig. 5. (a–c) UV–Vis spectra of FexZn1�xO (x = 0, 0.01, 0.03, 0.05) nanoparticles.
Fig. 6. Determination of band gap energy for FexZn1�xO (x = 0, 0.01, 0.03, 0.05)nanoparticles.
238 P. Dhiman et al. / Journal of Alloys and Compounds 578 (2013) 235–241
Author's personal copy
atoms. Here we assume that interfacial electron transfer takesplace predominantly between these donor states (oxygen vacan-cies and interstitial Zn atom) and Methylene Blue (Fig. 9). Being acationic dye Methylene Blue acquires electron from excited donorstates and decomposes. This faster degradation rate of MethyleneBlue under visible light irradiation using Fe doped ZnO is attrib-uted to the increase in defect sites caused by Fe doping, leadingto an enhanced optical absorption in the visible region.
The magnetization (M) of Zn1�xFexO (x = 0.01, 0.03, 0.05) sam-ples are plotted as a function of the magnetic field (H) at room tem-perature (RT), as shown in Fig. 10. In our case, pure ZnO isdiamagnetic in nature. So there can’t be any contribution of pureZnO in the observed magnetism. The samples exhibit well-definedhysteresis loops, giving clear indication of room-temperature fer-romagnetic (RTFM) behavior. The diamagnetic contribution of thesample holder in the VSM has been subtracted from the data.The inset of Fig. 10 depicts the coercivity and remanent magnetiza-tion of all prepared samples. Very low value of magnetization aswell as coercivity show the soft nature of the material (Table 1).Similar behavior has been reported earlier [23–25]. However thevalue of magnetization is still higher in our case as the synthesisconditions and environment is different. This is expected as DMSis highly sensitive to the preparation condition of the samples.Remanent magnetization for Zn0.95Fe0.05O decreases from0.0075 emu/g (Zn0.97Fe0.03O) to 0.0065 emu/g giving another indi-cation for secondary phase formation on higher Fe doping.
Two possible explanations are here for room temperature ferro-magnetism. One is extrinsic and other one is intrinsic. Extrinsicsource includes the formation of clusters of transition elementsor secondary phase. However the exchange interactions come un-der intrinsic source of magnetism. Our investigations like Reitveldrefinement of XRD and HRTEM ruled out the presence of any clus-ter formation except Zn0.95Fe0.05O sample. All characterization re-sults support the secondary phase formation for the 5% dopedZnO sample. So the solubility limit of Fe in ZnO is found to be lessthan 5% by our preparation technique. In order to explore the mag-netism of observed M–H curves, temperature dependent magneti-zation (M–T) measurements in the temperature range of 77–400 Khave been carried out under applied field of 1000 Orsted (Oe)(Fig. 11). If we see the magnetization vs. temperature plot of Zn0.93-
Fe0.07O, concave curve is observed suggesting predominance ofbound magnetic polaron model interaction. It is worthy to notethat the sample has significant magnetization at room temperatureand above. But we cannot ignore other interaction mechanismslike double exchange mechanism as well defect induced magne-tism because XRD shows an indication of Fe2+ signature and theremay be some content of Fe3+ also. Further explanation is needed forthe exact cause of magnetism which can be done with FC–ZFC atfurther low temperature to check the spin glass transition orsuperparamagnetic transition. Also XPS is another tool for gettingall information related to chemical states of all the elements pres-ent in the sample.
Fig. 7. (a–d) UV–Vis spectra of MB in presence of FexZn1�xO (x = 0, 0.01, 0.03, 0.05) nanoparticles under natural sunlight.
P. Dhiman et al. / Journal of Alloys and Compounds 578 (2013) 235–241 239

Author's personal copy
Fig. 8. (a–d) of decomposition of MB in presence of (a) ZnO nanoparticles, (b) Fe0.01Zn0.99O nanoparticles, (c) Fe0.03Zn0.097O nanoparticles and (d) Fe0.05Zn0.095O nanoparticlesafter intervals upon irradiation of natural sunlight.
Fig. 9. Mechanism involved for the dye removal.
240 P. Dhiman et al. / Journal of Alloys and Compounds 578 (2013) 235–241

Author's personal copy
4. Conclusions
In this work, Fe doped ZnO nanparticles has been obtained bysol–gel synthesis route. However single phase has appeared up to3% Fe doping. Secondary phase formation for higher Fe content hasbeen supported by all characterization techniques. We have inves-
tigated the photocatalytic activity of bare as well as Fe doped ZnOnanoparticles and the relationship between photocatalytic activi-ties for dye degradation and band gap. The addition of Fe in ZnOsystem has shown to play a crucial role in enhancing photocata-lytic efficiency and magnetic properties. Magnetization measure-ments indicated the presence of ferromagnetic state for allprepared samples suitable for spintronic devices.
Acknowledgements
National Physical Laboratory (NPL), New Delhi is highlyacknowledged for magnetic measurements. One of the authorsPooja Dhiman wishes to acknowledge University Grant Commis-sion, India, for financial assistance under Senior Research Fellow-ship (SRF) scheme. The authors would also like to thanks USICfacility, Himachal Pradesh University Shimla for providing researchfacilities. King Abdullah Institute for Nanotechnology, Riyadh, isalso acknowledged for TEM measurements.
References
[1] T. Dietl, Acta Phys. Pol. A 100 (2001) 139.[2] S.J. Pearton, C.R. Abernathy, D.P. Norton, A.F. Hebard, Y.D. Park, L.A. Boatner,
J.D. Budai, Mater. Sci. Eng. R40 (2003) 137.[3] T. Deitl, H. Ohno, F. Matsukura, J. Cibert, D. Ferrand, Science 287 (2000) 019.[4] M.D. Carvalho, L.P. Ferreira, R.P. Borges, M. Godinho, J. Solid State Chem. 185
(2012) 160.[5] V.K. Sharma, G.D. Varma, Adv. Mat. Lett. 3 (2) (2012) 126.[6] R. Janisch, P. Gopal, N.A. Spaldin, J. Phys.: Condens. Matter. 17 (2005) R657.[7] J. Wang, J. Wan, K. Chen, Mater. Lett. 64 (2010) 2373.[8] S. Kumar, Y.J. Kim, B.H. Koo, S.K. Sharma, J.M. Vargas, M. Knobel, S. Gautam,
K.H. Chae, D.K. Kim, Y.K. Kim, C.G. Lee, J. Appl. Phys. 105 (2009) 07C520.[9] Xu Linhua, Li Xiangyin, J. Cryst. Growth 312 (2010) 851.
[10] R. Saleh, S.P. Prakoso, A. Fishli, J. Magn. Magn. Mater. 324 (2012) 665.[11] S.I. Park, G.Y. Ahn, C.S. Kim, J. Appl. Phys. 101 (2007) 09H113.[12] S.K. Mandal, A.K. Das, T.K. Nath, Appl. Phys. Lett. 89 (2006) 144105.[13] D.Y. Inamdar, A.K. Pathak, I. Dubenko, N. Ali, S. Mahamuni, J. Phys. Chem. C 115
(2011) 23671.[14] P.K. Sharma, R.K. Dutta, A.C. Pandey, S. Layek, H.C. Verma, J. Magn. Magn.
Mater. 321 (2009) 2587.[15] R. Saleh, N.F. Djaja, S.P. Prakoso, J. Alloys Comp. 546 (2013) 48.[16] S. Kango, S. Kalia, A. Celli, J. Njuguna, Y. Habibi, R. Kumar, Prog. Polym. Sci.
(article in press). <http://dx.doi.org/10.1016/j.progpolymsci.2013.02.003>.[17] H.B. Lu, H. Li, L. Liao, Y. Tian, M. Shuai, J.C. Li, M.F. Hu, Q. Fu, B.P. Zhu,
Nanotechnology 19 (2008) 045605 (7pp).[18] Mu Yao Guo, Alan Man Ching Ng, Fangzhou Liu, Aleksandra B. Djurisic, Wai Kin
Chan, Huimin Su, Kam Sing Wong, J. Phys. Chem. C 115 (2011) 11095.[19] Ruh Ullah, Joydeep Dutta, J. Hazard. Mater. 156 (2008) 194.[20] Shashi Kant, Amit Kumar, Adv. Mat. Lett. 3 (4) (2012) 350.[21] Xiaoqing Qiu, Liping Li, Jing Zheng, Junjie Liu, Xuefei Sun, Guangshe Li, J. Phys.
Chem. C 112 (2008) 12242.[22] Z.C. Chen, L.J. Zhuge, X.M. Wu, Y.D. Meng, Thin Solid Films 515 (2007) 5462.[23] H. Liu, J. Yang, Y. Zhang, L. Yang, J. Phys.: Condens. Matter. 21 (2009) 145803.[24] G.Y. Ahn, S.I. Park, B.W. Lee, C.S. Kin, IEEE Trans. Magn. 41 (2005) 10.[25] H. Liu, J. Yang, Z. Hua, Y. Liu, L. Yang, Y. Zhang, J. Cao, J. Mater. Chem. Phys. 125
(2011) 656.
Fig. 10. Magnetic hysteresis (M–H) loops of FexZn1�xO (x = 0, 0.01, 0.03, 0.05)nanoparticles.
Fig. 11. Magnetization vs. temperature at an applied field of 1000 Oe.
P. Dhiman et al. / Journal of Alloys and Compounds 578 (2013) 235–241 241
Related Documents