Int. J. Curr.Res.Chem.Pharma.Sci. 2(7): (2015):54–67 © 2015, IJCRCPS. All Rights Reserved 54 INTERNATIONAL JOURNAL OF CURRENT RESEARCH IN CHEMISTRY AND PHARMACEUTICAL SCIENCES (p-ISSN: 2348-5213: e-ISSN: 2348-5221) www.ijcrcps.com Research Article SYNTHESIS AND CHARACTERIZATION OF A PROTON PUMP INHIBITOR WITH BIVALENT METAL IONS Y. M. ISSA A , W. H. HEGAZY B W. N. EL-SAYED B , H. I. AHMED B a Department of Chemistry, Faculty of Science, Cairo University, Giza, Egypt b Department of Chemistry, Faculty of Science, Suez University, Suez, Egypt *Corresponding Author Abstract The synthesis and characterization of solid complexes for pantoprazole sodium sesquihydrate with Co(II) and Ni(II) metals in molar ratios M:L = 1:2 was studied. The complexes are stable solid and soluble only in DMF and DMSO. The metal complexes were characterized by elemental analysis, molar conductivity measurements, magnetic susceptibility, UV spectroscopy, IR, Mass spectra and analysis. Keywords: Bivalent metal complex, Pantoprazole, proton pump inhibitor, thermal analysis. 1. Introduction Pantoprazole sodium sesquihydrate is benzimidazole derivatives which have biological activity to inhibits gastric acid secretion (1) . Pantoprazole act as good ligand as it have several coordination mode (2,3) . Many drugs enhance its pharmacological and toxicological properties by their complexation with metal ions (4-9) . Ni(II) and Co(II) pantoprazole complexes was prepared and characterized by elemental analysis, IR, mass spectrometry, Electrical conductivity, magnetic suscebtibility, UV spectroscopy and thermal analysis. 2. Experimental 2.1 Preparation of the complexes The complexes were prepared according to the procedure: (0.5 mmol) pantoprazole ligand is dissolved in 10 cm 3 H 2 O then (0.25 mmol) of the dissolved bivalent metal in 10 cm 3 H 2 O is added drop wise with stirring to the ligand solution. The formed precipitate was filtered, washed with hot water and dried. Synthesized solid complex was characterized by elemental analysis, IR, mass spectrometry, molar conductivity, magnetic susceptibility, UV spectroscopy and thermal analysis. 2.2 Physical measurements The electronic absorption spectra were obtained by 10 -5 M DMF solution in 1 cm quartz cell using Shimadzu- 1601PC UV-Visible automatic recording spectrophotometer. The CHNS elemental analysis was estimated using Thermo Flash Eager 300. The infrared spectra were analyzed (KBr disc) in the 400-4000 cm -1 range using perkin Elmer 1650 FT-IR instrument. TG were obtained using a Shimazdu DTG – 60H in a dynamic air atmosphere (30 cm 3 min -1 ) at a heating rate of 10 o C min -1 . The molar conductivity of the dissolved complexes were carried out at room temperature on freshly prepared 10 -3 M DMF solutions using Jenco Model 1671 Dual Display Bench Top instrument pH/ORP (redox)/conductive. Magnetic susceptibility measurements were carried out using the modified Gouy method (10) on MSB-MK1 balance at room temperature using mercury(II) tetrathiocyanatecobaltate(II). The effective magnetic moment μ eff , per metal atom was calculated from the expression μ eff =2.83√x.T B.M., where x is the molar susceptibility corrected using Pascal's constant for the diamagnetism of all atoms in the complexes. The mass spectra were done by AMD

Welcome message from author
This document is posted to help you gain knowledge. Please leave a comment to let me know what you think about it! Share it to your friends and learn new things together.
Transcript

Int. J. Curr.Res.Chem.Pharma.Sci. 2(7): (2015):54–67
© 2015, IJCRCPS. All Rights Reserved 54
INTERNATIONAL JOURNAL OF CURRENT RESEARCH INCHEMISTRY AND PHARMACEUTICAL SCIENCES
(p-ISSN: 2348-5213: e-ISSN: 2348-5221)www.ijcrcps.com
Research Article
SYNTHESIS AND CHARACTERIZATION OF A PROTON PUMP INHIBITOR WITHBIVALENT METAL IONS
Y. M. ISSAA, W. H. HEGAZYB W. N. EL-SAYEDB, H. I. AHMEDB
aDepartment of Chemistry, Faculty of Science, Cairo University, Giza, EgyptbDepartment of Chemistry, Faculty of Science, Suez University, Suez, Egypt
*Corresponding Author
Abstract
The synthesis and characterization of solid complexes for pantoprazole sodium sesquihydrate with Co(II) and Ni(II) metals in molarratios M:L = 1:2 was studied. The complexes are stable solid and soluble only in DMF and DMSO. The metal complexes werecharacterized by elemental analysis, molar conductivity measurements, magnetic susceptibility, UV spectroscopy, IR, Massspectra and analysis.
Keywords: Bivalent metal complex, Pantoprazole, proton pump inhibitor, thermal analysis.
1. Introduction
Pantoprazole sodium sesquihydrate is benzimidazolederivatives which have biological activity to inhibitsgastric acid secretion(1). Pantoprazole act as good ligandas it have several coordination mode(2,3). Many drugsenhance its pharmacological and toxicological propertiesby their complexation with metal ions(4-9). Ni(II) andCo(II) pantoprazole complexes was prepared andcharacterized by elemental analysis, IR, massspectrometry, Electrical conductivity, magneticsuscebtibility, UV spectroscopy and thermal analysis.
2. Experimental
2.1 Preparation of the complexes
The complexes were prepared according to theprocedure: (0.5 mmol) pantoprazole ligand is dissolvedin 10 cm3 H2O then (0.25 mmol) of the dissolved bivalentmetal in 10 cm3 H2O is added drop wise with stirring tothe ligand solution. The formed precipitate was filtered,washed with hot water and dried. Synthesized solidcomplex was characterized by elemental analysis, IR,mass spectrometry, molar conductivity, magneticsusceptibility, UV spectroscopy and thermal analysis.
2.2 Physical measurements
The electronic absorption spectra were obtained by 10-5
M DMF solution in 1 cm quartz cell using Shimadzu-1601PC UV-Visible automatic recordingspectrophotometer. The CHNS elemental analysis wasestimated using Thermo Flash Eager 300. The infraredspectra were analyzed (KBr disc) in the 400-4000 cm-1
range using perkin Elmer 1650 FT-IR instrument. TGwere obtained using a Shimazdu DTG – 60H in adynamic air atmosphere (30 cm3 min-1) at a heating rateof 10 oC min-1. The molar conductivity of the dissolvedcomplexes were carried out at room temperature onfreshly prepared 10-3 M DMF solutions using JencoModel 1671 Dual Display Bench Top instrument pH/ORP(redox)/conductive. Magnetic susceptibilitymeasurements were carried out using the modified Gouymethod(10) on MSB-MK1 balance at room temperatureusing mercury(II) tetrathiocyanatecobaltate(II). Theeffective magnetic moment μeff, per metal atom wascalculated from the expression μeff =2.83√x.T B.M.,where x is the molar susceptibility corrected usingPascal's constant for the diamagnetism of all atoms inthe complexes. The mass spectra were done by AMD
Int. J. Curr.Res.Chem.Pharma.Sci. 2(7): (2015):54–67
© 2015, IJCRCPS. All Rights Reserved 55
Intectra Gmb HDP10. Data system EI/8 Kvspectrometer.
2.3 Kinetic parameters
In order to assess the influence of the structural
properties of the ligand and the type of metal onthermal behavior of the complexes, the order n andthe heat of activation E at the various decompositionstages were determined from TG and DTGthermograms using the Coats-Redfern equations inthe following form(11)
(1)
(2)
Where, α is fraction of weight loss ,T is temperature(°K) , n is order of reaction , A is pre-exponentialfactor, R is molar gas constant , Ea is activationenergy , β is heating rate.
The correlation factor r is computed using the leastsquares method for equations (1) and (2). Linearcurves were drawn for values equal 0.5, 1, 1.5, 2, 2.5
and 3. The value of n which gave the best linear plotwas chosen as the order parameter for thedecomposition stage of interest and the heat ofactivation was calculated from its slope.
The activation entropy ΔS, the activation enthalpy ΔHand the free energy of activation ΔG were calculatedusing the following equations:
(3)
(4)
(5)
Where, K and h are the Boltzman's and plank's constants.
Results and Discussion
3.1 Elemental analysisThe results of elemental analysis of the solidcomplexes of pantoprazole are recorded in Table (1).
It is clear that the formula of the divalent Co and Nicomplexes can be represented as [ML2(H2O)2].H2O.
Table.1: Analytical data and magnetic moments of the PNZ and its complexes
Compound Chemical formula % Found (calcd.) eff.
(298K)(B.M)
C H N S M
PNZ C16H14F2N3O4S.Na.1.5H2O 43.2(44.4)
3(3.24)
9.4(9.7)
6.5(7.4)
-- --
Co-PNZ [Co(PNZ)2(H2O)2].H2O 43.5(43.75)
3.8(3.87)
9.2(9.57)
7.1(7.29)
6.4(6.7)
4.96
Ni-PNZ [Ni(PNZ)2(H2O)2].H2O 43(43.76)
3.5(3.87)
9.3(9.57)
6.9(7.29)
6.5(6.68)
4
Int. J. Curr.Res.Chem.Pharma.Sci. 2(7): (2015):54–67
© 2015, IJCRCPS. All Rights Reserved 56
3.2 Molar conductivity measurements
The chelates were dissolved in DMF and the molarconductivities of 10−3 M of their solutions at 25±2 °Cwere measured. Table (2) shows the molar
conductance values of the complexes. It is concludedfrom the results that the chelates have molarconductance values of 6-18.8 Ω-1cm2mol-1 indicatingthat these chelates are non-electrolytes.
Table. 2: Physical data of the PNZ ligand and its complexes.
Compound Chemical formula M. Wt. %Yeild
Color (Ω-1cm2mol-1) M.p.(°C )
PNZ C16H14F2N3O4S.Na.1.5H2O 432.38 Off white 137Co-PNZ [Co(PNZ)2(H2O)2]H2O 877.66 64.9 pink 7.2 210Ni-PNZ [Ni(PNZ)2(H2O)2]H2O 877.46 56 Faint green 9.8 180
3. 3 Magnetic susceptibility and electronic spectrameasurements
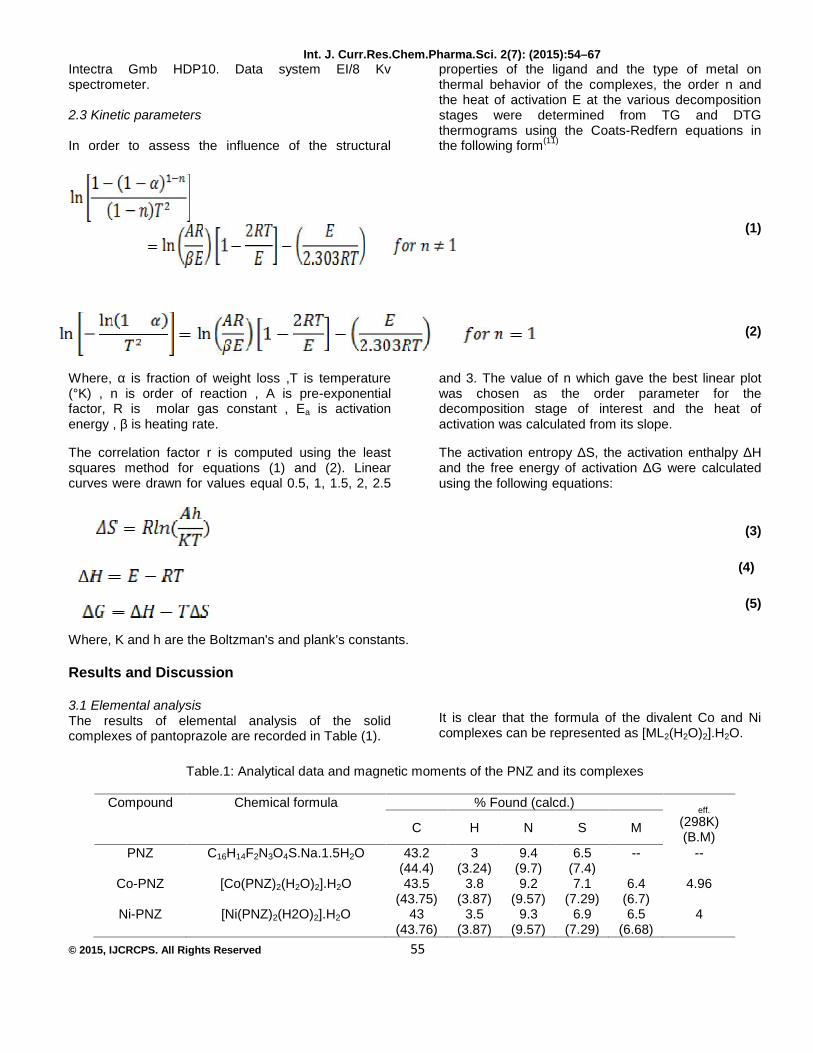
The UV-Visible spectra of the ligand and its complexeswere recorded in DMF at room temperature showed in(Figs. 1-3). The electronic spectrum of ligand showedonly one intense band at 34246 cm-1, which wasassigned to n→π* transition of the C=N chromophore.The electronic spectrum of the Co(II) complex givestwo bands at 18484 and 20000 cm−1 wave numberregions. These bands are assigned to the transitions4T1g(F)→4T2g(F) and 4T1g(F)→4T2g(P), respectively,suggesting that there is an octahedral geometry
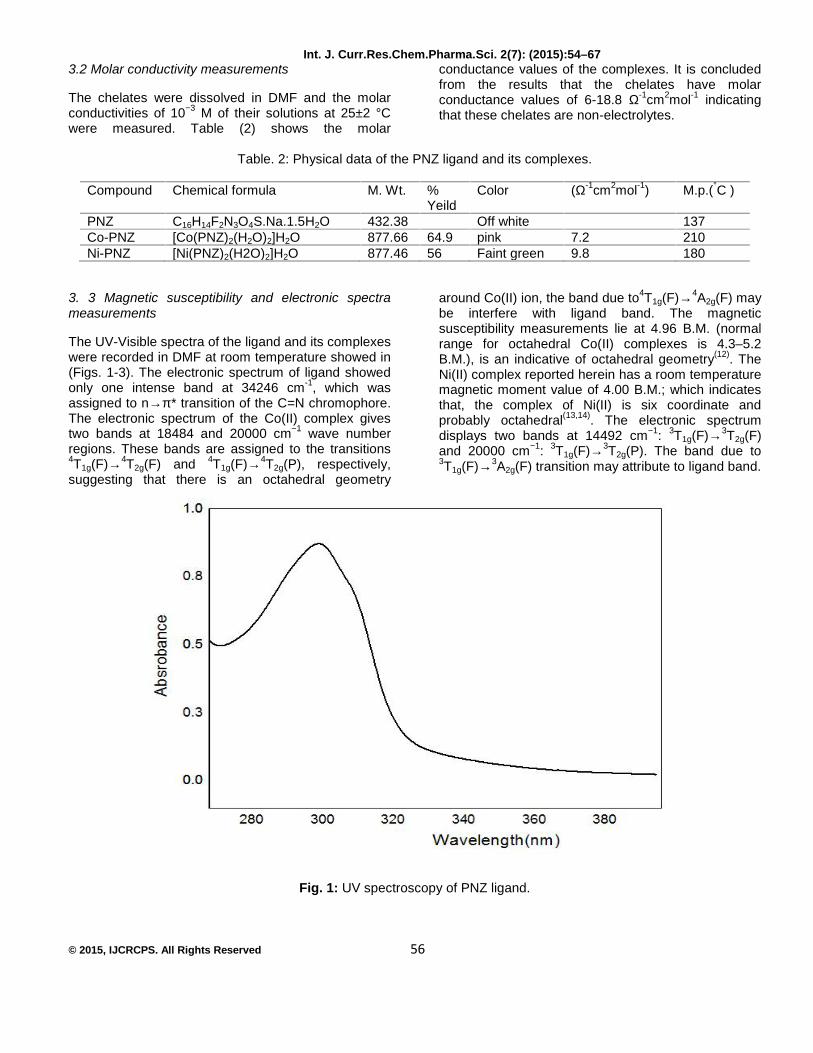
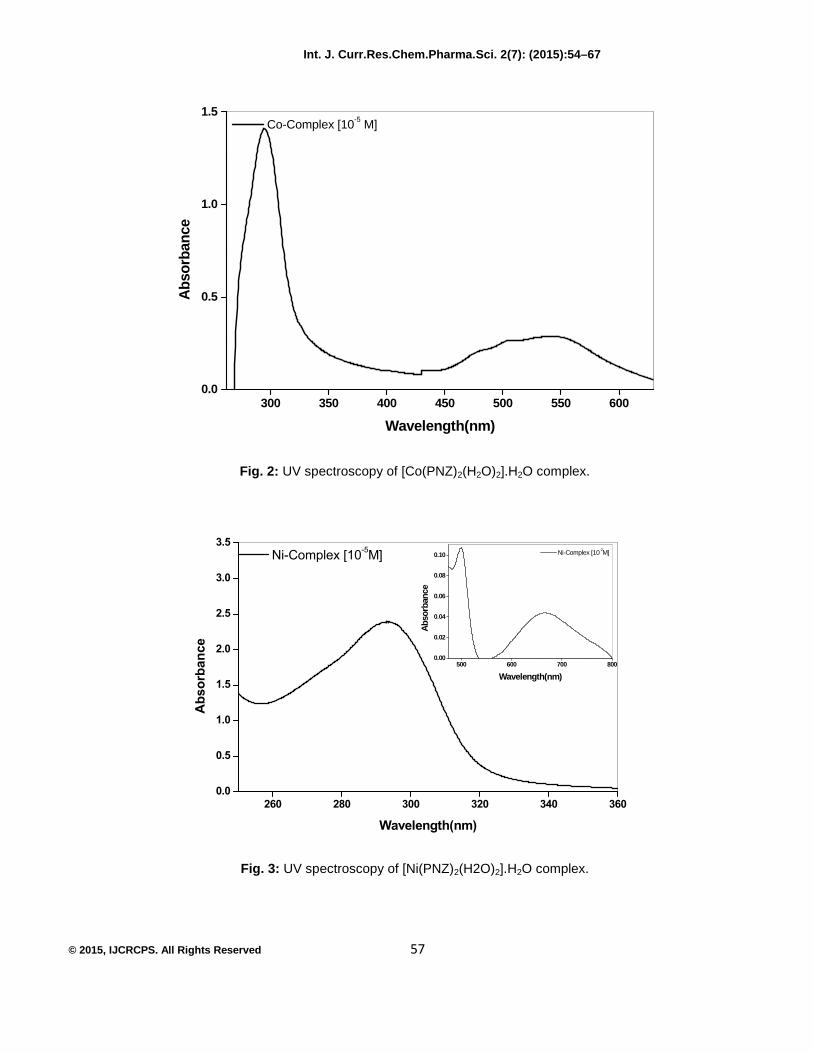
around Co(II) ion, the band due to4T1g(F)→4A2g(F) maybe interfere with ligand band. The magneticsusceptibility measurements lie at 4.96 B.M. (normalrange for octahedral Co(II) complexes is 4.3–5.2B.M.), is an indicative of octahedral geometry(12). TheNi(II) complex reported herein has a room temperaturemagnetic moment value of 4.00 B.M.; which indicatesthat, the complex of Ni(II) is six coordinate andprobably octahedral(13,14). The electronic spectrumdisplays two bands at 14492 cm−1: 3T1g(F)→3T2g(F)and 20000 cm−1: 3T1g(F)→3T2g(P). The band due to3T1g(F)→3A2g(F) transition may attribute to ligand band.
Fig. 1: UV spectroscopy of PNZ ligand.
Int. J. Curr.Res.Chem.Pharma.Sci. 2(7): (2015):54–67
© 2015, IJCRCPS. All Rights Reserved 57
300 350 400 450 500 550 6000.0
0.5
1.0
1.5 Co-Complex [10-5 M]
Abso
rban
ce
Wavelength(nm)
Fig. 2: UV spectroscopy of [Co(PNZ)2(H2O)2].H2O complex.
260 280 300 320 340 3600.0
0.5
1.0
1.5
2.0
2.5
3.0
3.5
500 600 700 8000.00
0.02
0.04
0.06
0.08
0.10 Ni-Complex [10-2M]
Abso
rban
ce
Wavelength(nm)
Ni-Complex [10-5M]
Absorbance
Wavelength(nm)
Fig. 3: UV spectroscopy of [Ni(PNZ)2(H2O)2].H2O complex.
Int. J. Curr.Res.Chem.Pharma.Sci. 2(7): (2015):54–67
© 2015, IJCRCPS. All Rights Reserved 58
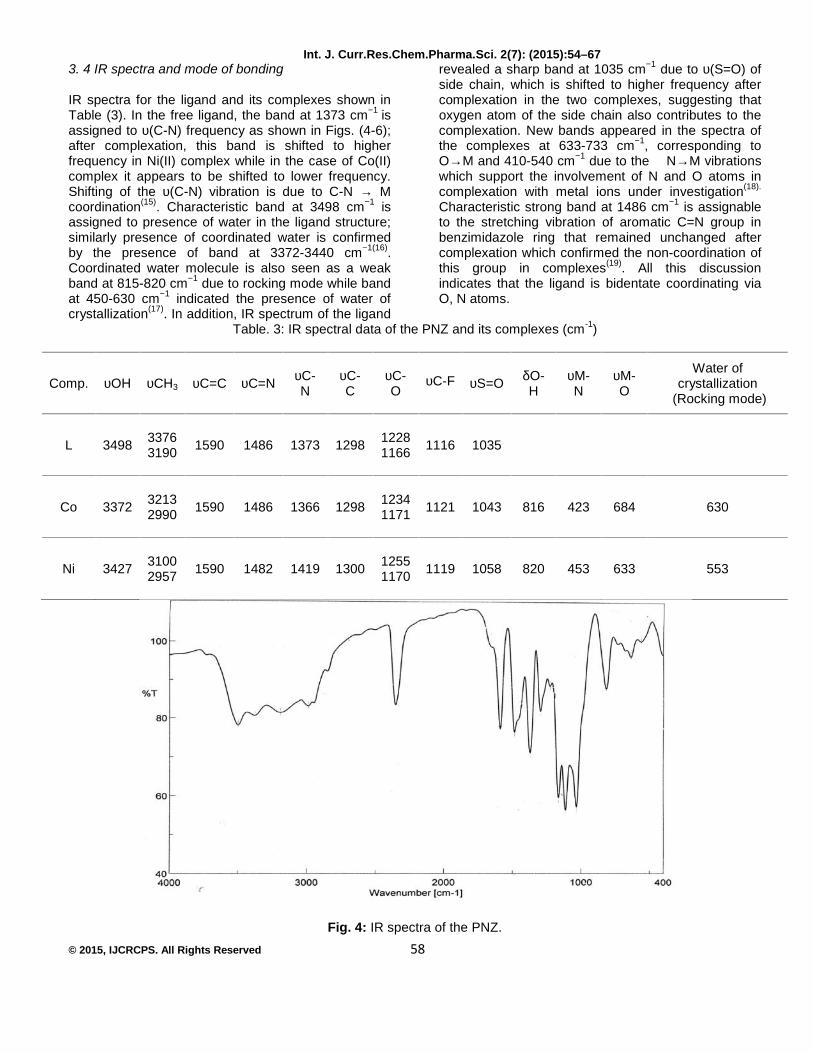
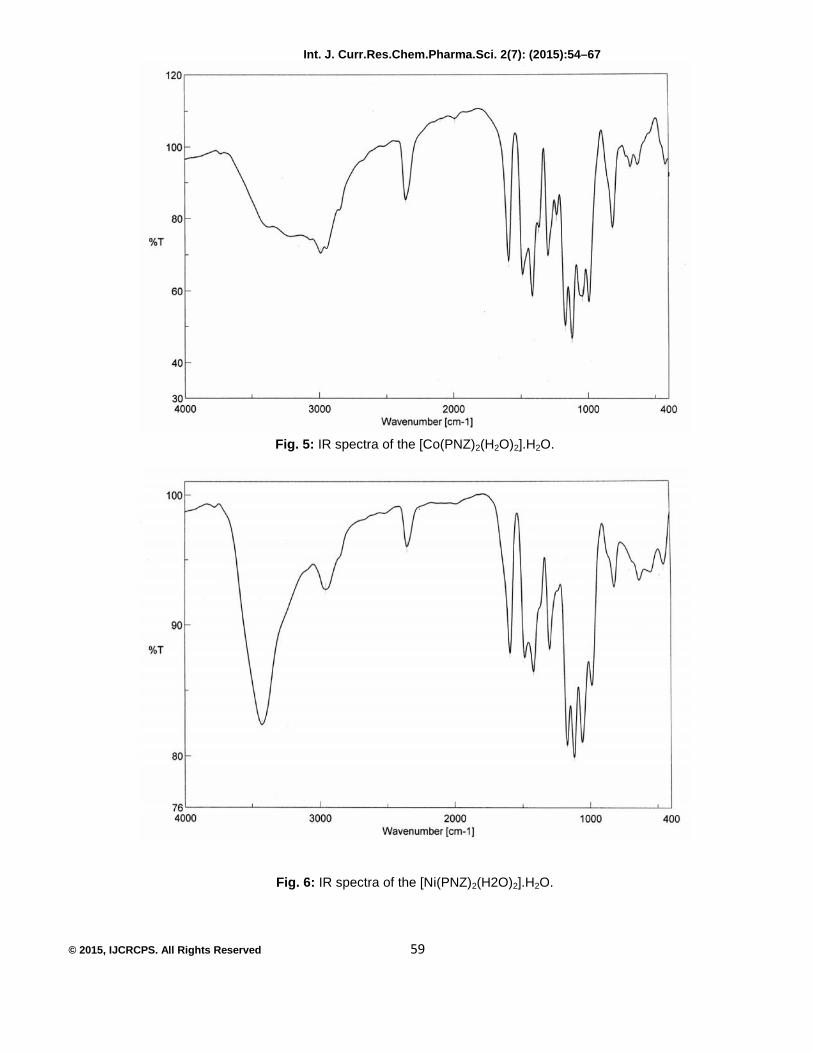
3. 4 IR spectra and mode of bonding
IR spectra for the ligand and its complexes shown inTable (3). In the free ligand, the band at 1373 cm−1 isassigned to υ(C-N) frequency as shown in Figs. (4-6);after complexation, this band is shifted to higherfrequency in Ni(II) complex while in the case of Co(II)complex it appears to be shifted to lower frequency.Shifting of the υ(C-N) vibration is due to C-N → Mcoordination(15). Characteristic band at 3498 cm−1 isassigned to presence of water in the ligand structure;similarly presence of coordinated water is confirmedby the presence of band at 3372-3440 cm−1(16).Coordinated water molecule is also seen as a weakband at 815-820 cm−1 due to rocking mode while bandat 450-630 cm−1 indicated the presence of water ofcrystallization(17). In addition, IR spectrum of the ligand
revealed a sharp band at 1035 cm−1 due to υ(S=O) ofside chain, which is shifted to higher frequency aftercomplexation in the two complexes, suggesting thatoxygen atom of the side chain also contributes to thecomplexation. New bands appeared in the spectra ofthe complexes at 633-733 cm−1, corresponding toO→M and 410-540 cm−1 due to the N→M vibrationswhich support the involvement of N and O atoms incomplexation with metal ions under investigation(18).
Characteristic strong band at 1486 cm−1 is assignableto the stretching vibration of aromatic C=N group inbenzimidazole ring that remained unchanged aftercomplexation which confirmed the non-coordination ofthis group in complexes(19). All this discussionindicates that the ligand is bidentate coordinating viaO, N atoms.
Table. 3: IR spectral data of the PNZ and its complexes (cm-1)
Comp. υOH υCH3 υC=C υC=N υC-N
υC-C
υC-O
υC-F υS=O δO-H
υM-N
υM-O
Water ofcrystallization
(Rocking mode)
L 3498 33763190 1590 1486 1373 1298 1228
1166 1116 1035
Co 3372 32132990 1590 1486 1366 1298 1234
1171 1121 1043 816 423 684 630
Ni 3427 31002957 1590 1482 1419 1300 1255
1170 1119 1058 820 453 633 553
Fig. 4: IR spectra of the PNZ.
Int. J. Curr.Res.Chem.Pharma.Sci. 2(7): (2015):54–67
© 2015, IJCRCPS. All Rights Reserved 59
Fig. 5: IR spectra of the [Co(PNZ)2(H2O)2].H2O.
Fig. 6: IR spectra of the [Ni(PNZ)2(H2O)2].H2O.
Int. J. Curr.Res.Chem.Pharma.Sci. 2(7): (2015):54–67
© 2015, IJCRCPS. All Rights Reserved 60
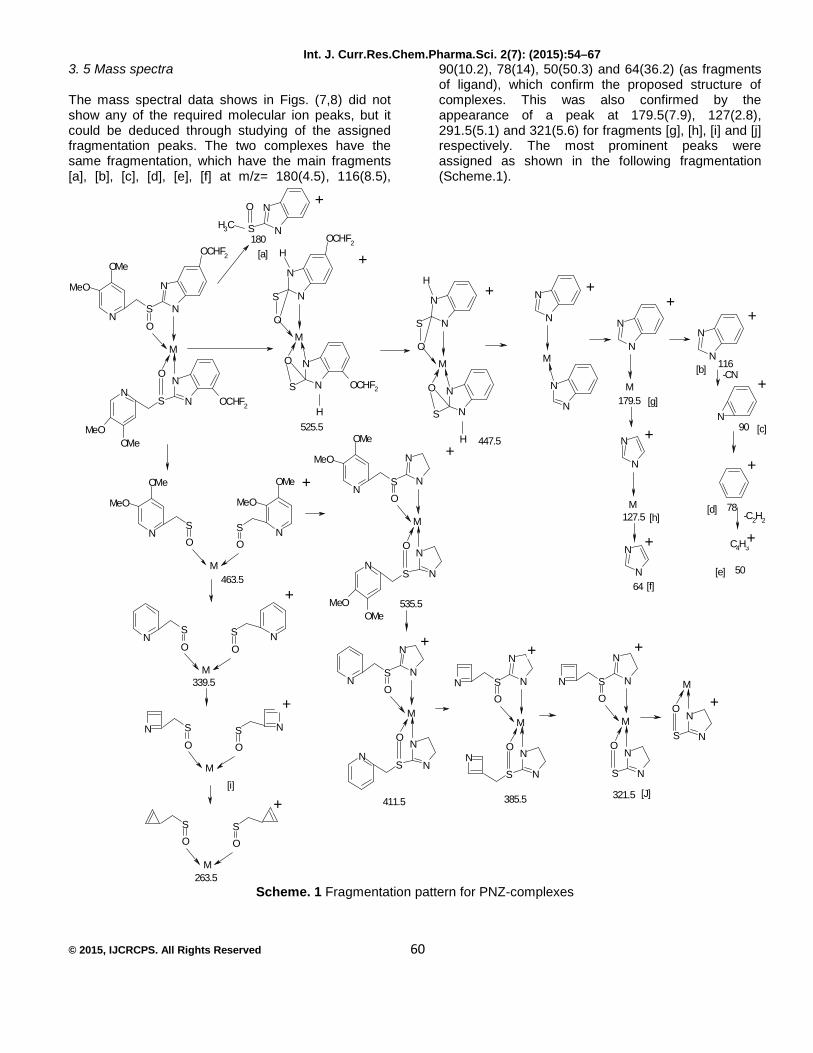
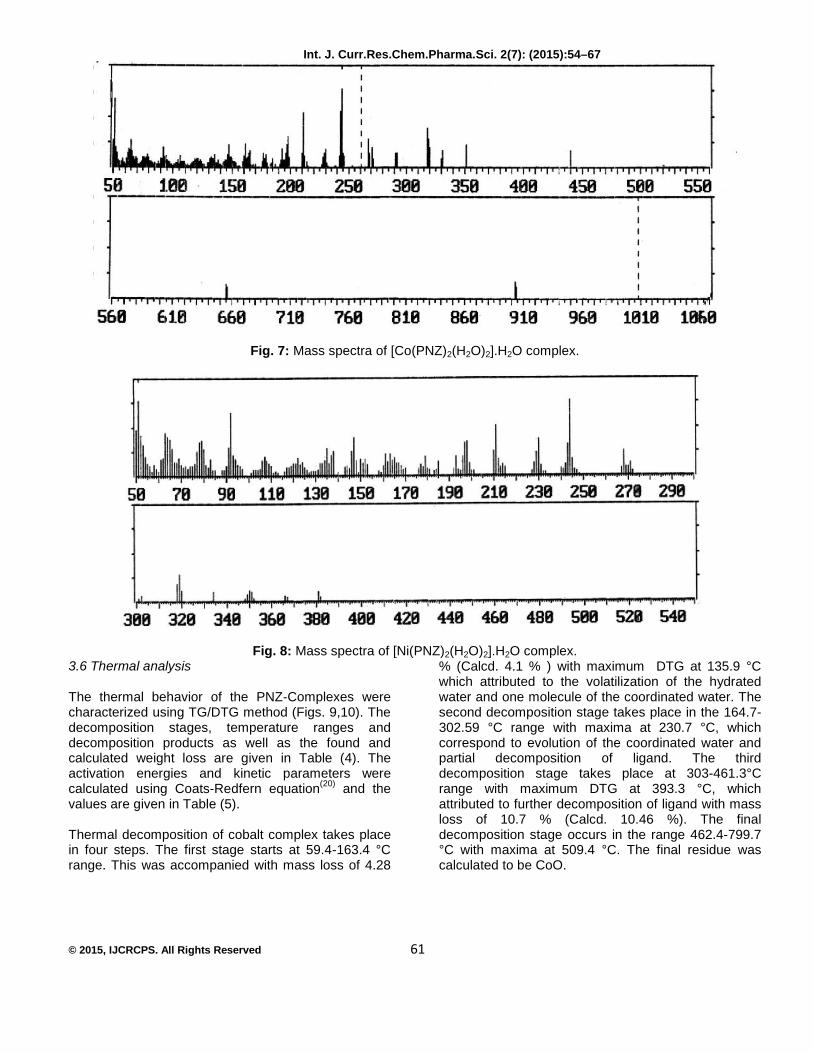
3. 5 Mass spectra
The mass spectral data shows in Figs. (7,8) did notshow any of the required molecular ion peaks, but itcould be deduced through studying of the assignedfragmentation peaks. The two complexes have thesame fragmentation, which have the main fragments[a], [b], [c], [d], [e], [f] at m/z= 180(4.5), 116(8.5),
90(10.2), 78(14), 50(50.3) and 64(36.2) (as fragmentsof ligand), which confirm the proposed structure ofcomplexes. This was also confirmed by theappearance of a peak at 179.5(7.9), 127(2.8),291.5(5.1) and 321(5.6) for fragments [g], [h], [i] and [j]respectively. The most prominent peaks wereassigned as shown in the following fragmentation(Scheme.1).
NS
O
N
N
OCHF2
OMe
MeO
M
NS
MeOOMe
O
N
N
OCHF2
M
O
S N
N
OCHF2
S
N
N
OCHF2
O
H
NSO
OMe
MeO
N
OMe
MeO
SO
M
H
NSO
N
N
OMe
MeO
M
NS
MeOOMe
ON
N
M
O
S N
N
S
N
N
O
H
H
M
N
N
N
N
M
N
NN
N
M
N
N
N
N
N
-CN
-C2H2
C4H3
NSO
N
N
M
NS
ON
N
SO
N
N
M
O N
NSN
N SO
N
N
M
ON
N
N
S
NS
ONS
O
M
S
OSO
M
N N
SO
SO
M
M
ON
NS
N
NS
O
CH3
+
+ ++
+
+
+
++
+
+
+
+
+ + +
++
+
525.5447.5
179.5
116
90
78
50
127.5
463.5
339.5
535.5
+
263.5
411.5 385.5 321.5
+
180[a]
[b]
[c]
[d]
[e]64
[g]
[h]
[i][J]
[f]
Scheme. 1 Fragmentation pattern for PNZ-complexes
Int. J. Curr.Res.Chem.Pharma.Sci. 2(7): (2015):54–67
© 2015, IJCRCPS. All Rights Reserved 61
Fig. 7: Mass spectra of [Co(PNZ)2(H2O)2].H2O complex.
Fig. 8: Mass spectra of [Ni(PNZ)2(H2O)2].H2O complex.3.6 Thermal analysis
The thermal behavior of the PNZ-Complexes werecharacterized using TG/DTG method (Figs. 9,10). Thedecomposition stages, temperature ranges anddecomposition products as well as the found andcalculated weight loss are given in Table (4). Theactivation energies and kinetic parameters werecalculated using Coats-Redfern equation(20) and thevalues are given in Table (5).
Thermal decomposition of cobalt complex takes placein four steps. The first stage starts at 59.4-163.4 °Crange. This was accompanied with mass loss of 4.28
% (Calcd. 4.1 % ) with maximum DTG at 135.9 °Cwhich attributed to the volatilization of the hydratedwater and one molecule of the coordinated water. Thesecond decomposition stage takes place in the 164.7-302.59 °C range with maxima at 230.7 °C, whichcorrespond to evolution of the coordinated water andpartial decomposition of ligand. The thirddecomposition stage takes place at 303-461.3°Crange with maximum DTG at 393.3 °C, whichattributed to further decomposition of ligand with massloss of 10.7 % (Calcd. 10.46 %). The finaldecomposition stage occurs in the range 462.4-799.7°C with maxima at 509.4 °C. The final residue wascalculated to be CoO.

Int. J. Curr.Res.Chem.Pharma.Sci. 2(7): (2015):54–67
© 2015, IJCRCPS. All Rights Reserved 62
Fig. 9: TG and DTG of the [Co(PNZ)2(H2O)2].H2O complex.
Fig. 10: TG and DTG of the [Ni(PNZ)2(H2O)2].H2O complex.
Int. J. Curr.Res.Chem.Pharma.Sci. 2(7): (2015):54–67
© 2015, IJCRCPS. All Rights Reserved 63
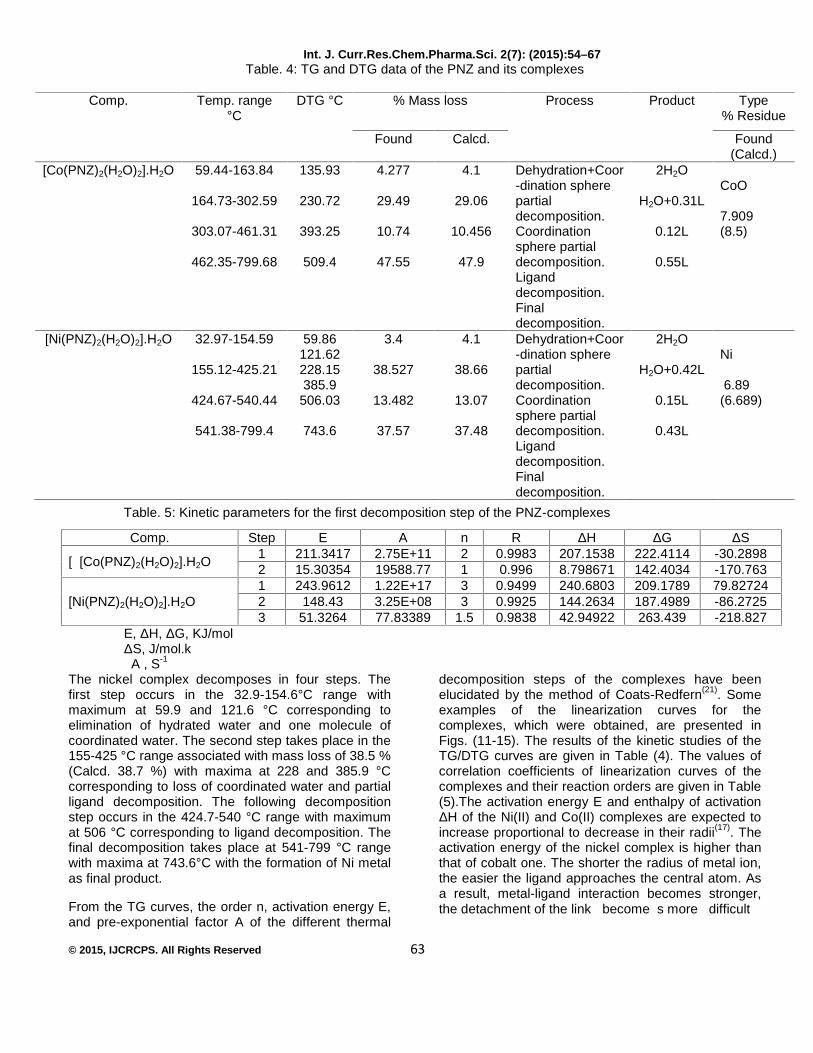
Table. 4: TG and DTG data of the PNZ and its complexes
Table. 5: Kinetic parameters for the first decomposition step of the PNZ-complexes
Comp. Step E A n R ΔH ΔG ΔS
[ [Co(PNZ)2(H2O)2].H2O1 211.3417 2.75E+11 2 0.9983 207.1538 222.4114 -30.28982 15.30354 19588.77 1 0.996 8.798671 142.4034 -170.763
[Ni(PNZ)2(H2O)2].H2O1 243.9612 1.22E+17 3 0.9499 240.6803 209.1789 79.827242 148.43 3.25E+08 3 0.9925 144.2634 187.4989 -86.27253 51.3264 77.83389 1.5 0.9838 42.94922 263.439 -218.827
E, ΔH, ΔG, KJ/molΔS, J/mol.k
A , S-1
The nickel complex decomposes in four steps. Thefirst step occurs in the 32.9-154.6°C range withmaximum at 59.9 and 121.6 °C corresponding toelimination of hydrated water and one molecule ofcoordinated water. The second step takes place in the155-425 °C range associated with mass loss of 38.5 %(Calcd. 38.7 %) with maxima at 228 and 385.9 °Ccorresponding to loss of coordinated water and partialligand decomposition. The following decompositionstep occurs in the 424.7-540 °C range with maximumat 506 °C corresponding to ligand decomposition. Thefinal decomposition takes place at 541-799 °C rangewith maxima at 743.6°C with the formation of Ni metalas final product.
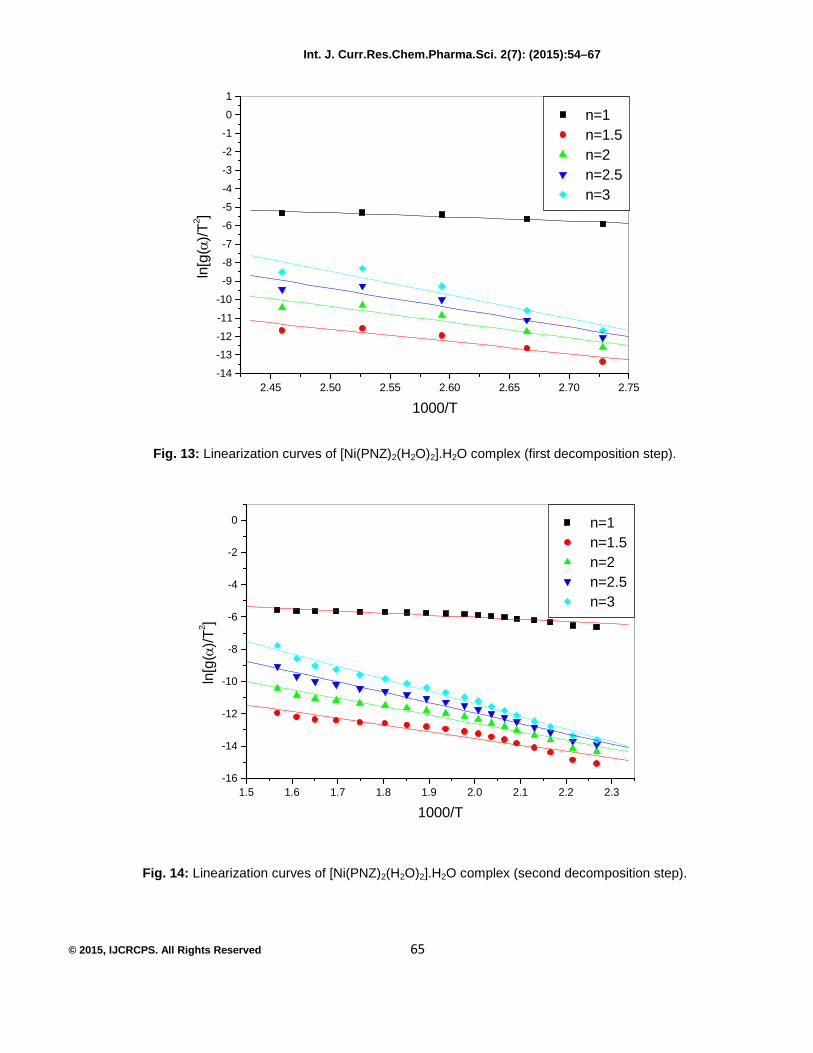
From the TG curves, the order n, activation energy E,and pre-exponential factor A of the different thermal
decomposition steps of the complexes have beenelucidated by the method of Coats-Redfern(21). Someexamples of the linearization curves for thecomplexes, which were obtained, are presented inFigs. (11-15). The results of the kinetic studies of theTG/DTG curves are given in Table (4). The values ofcorrelation coefficients of linearization curves of thecomplexes and their reaction orders are given in Table(5).The activation energy E and enthalpy of activationΔH of the Ni(II) and Co(II) complexes are expected toincrease proportional to decrease in their radii(17). Theactivation energy of the nickel complex is higher thanthat of cobalt one. The shorter the radius of metal ion,the easier the ligand approaches the central atom. Asa result, metal-ligand interaction becomes stronger,the detachment of the link become s more difficult
Comp. Temp. range°C
DTG °C % Mass loss Process Product Type% Residue
Found Calcd. Found(Calcd.)
[Co(PNZ)2(H2O)2].H2O 59.44-163.84
164.73-302.59
303.07-461.31
462.35-799.68
135.93
230.72
393.25
509.4
4.277
29.49
10.74
47.55
4.1
29.06
10.456
47.9
Dehydration+Coor-dination spherepartialdecomposition.Coordinationsphere partialdecomposition.Liganddecomposition.Finaldecomposition.
2H2O
H2O+0.31L
0.12L
0.55L
CoO
7.909(8.5)
[Ni(PNZ)2(H2O)2].H2O 32.97-154.59
155.12-425.21
424.67-540.44
541.38-799.4
59.86121.62228.15385.9
506.03
743.6
3.4
38.527
13.482
37.57
4.1
38.66
13.07
37.48
Dehydration+Coor-dination spherepartialdecomposition.Coordinationsphere partialdecomposition.Liganddecomposition.Finaldecomposition.
2H2O
H2O+0.42L
0.15L
0.43L
Ni
6.89(6.689)

Int. J. Curr.Res.Chem.Pharma.Sci. 2(7): (2015):54–67
© 2015, IJCRCPS. All Rights Reserved 64
and E values increase(18,19). The negative values of theentropies in the decomposition reactions of thecomplexes Table (5) indicate that the reactions are
slower than normal(20-22) and the activated complexeshave more ordered structure than the reactants(23-24).
1.85 1.90 1.95 2.00 2.05 2.10 2.15 2.20 2.25 2.30-16
-14
-12
-10
-8
-6
-4
-2
0 n=1 n=1.5 n=2 n=2.5 n=3
ln[g
()/T
2 ]
1000/T
Fig. 11: Linearization curves of [Co(PNZ)2(H2O)2].H2O complex (first decomposition step).
1.05 1.10 1.15 1.20 1.25 1.30 1.35 1.40
-14-13-12-11-10
-9-8-7-6-5-4-3-2-101
n=1 n=1.5 n=2 n=2.5 n=3
ln[g
()/T
2 ]
1000/T
Fig. 12: Linearization curves of [Co(PNZ)2(H2O)2].H2O complex (second decomposition step).
Int. J. Curr.Res.Chem.Pharma.Sci. 2(7): (2015):54–67
© 2015, IJCRCPS. All Rights Reserved 65
2.45 2.50 2.55 2.60 2.65 2.70 2.75-14
-13-12
-11
-10
-9-8
-7
-6
-5-4
-3
-2
-10
1
n=1 n=1.5 n=2 n=2.5 n=3
ln[g
()/T
2 ]
1000/T
Fig. 13: Linearization curves of [Ni(PNZ)2(H2O)2].H2O complex (first decomposition step).
1.5 1.6 1.7 1.8 1.9 2.0 2.1 2.2 2.3-16
-14
-12
-10
-8
-6
-4
-2
0 n=1 n=1.5 n=2 n=2.5 n=3
ln[g
()/T
2 ]
1000/T
Fig. 14: Linearization curves of [Ni(PNZ)2(H2O)2].H2O complex (second decomposition step).
Int. J. Curr.Res.Chem.Pharma.Sci. 2(7): (2015):54–67
© 2015, IJCRCPS. All Rights Reserved 66
1.08 1.10 1.12 1.14 1.16 1.18 1.20 1.22 1.24 1.26 1.28-14
-13-12
-11
-10
-9-8
-7
-6
-5-4
-3
-2
-10
1
n=1 n=1.5 n=2 n=2.5 n=3
ln[g
()/T
2 ]
1000/T
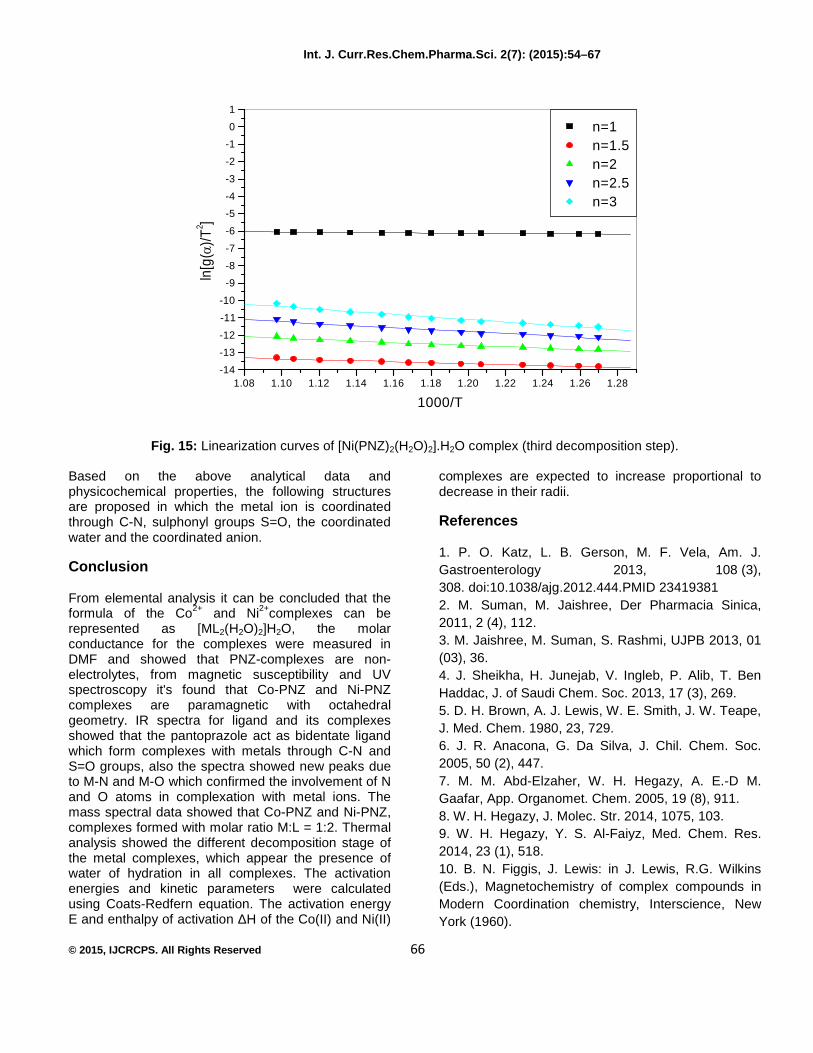
Fig. 15: Linearization curves of [Ni(PNZ)2(H2O)2].H2O complex (third decomposition step).
Based on the above analytical data andphysicochemical properties, the following structuresare proposed in which the metal ion is coordinatedthrough C-N, sulphonyl groups S=O, the coordinatedwater and the coordinated anion.
Conclusion
From elemental analysis it can be concluded that theformula of the Co2+ and Ni2+complexes can berepresented as [ML2(H2O)2]H2O, the molarconductance for the complexes were measured inDMF and showed that PNZ-complexes are non-electrolytes, from magnetic susceptibility and UVspectroscopy it's found that Co-PNZ and Ni-PNZcomplexes are paramagnetic with octahedralgeometry. IR spectra for ligand and its complexesshowed that the pantoprazole act as bidentate ligandwhich form complexes with metals through C-N andS=O groups, also the spectra showed new peaks dueto M-N and M-O which confirmed the involvement of Nand O atoms in complexation with metal ions. Themass spectral data showed that Co-PNZ and Ni-PNZ,complexes formed with molar ratio M:L = 1:2. Thermalanalysis showed the different decomposition stage ofthe metal complexes, which appear the presence ofwater of hydration in all complexes. The activationenergies and kinetic parameters were calculatedusing Coats-Redfern equation. The activation energyE and enthalpy of activation ΔH of the Co(II) and Ni(II)
complexes are expected to increase proportional todecrease in their radii.
References
1. P. O. Katz, L. B. Gerson, M. F. Vela, Am. J.Gastroenterology 2013, 108 (3),308. doi:10.1038/ajg.2012.444.PMID 234193812. M. Suman, M. Jaishree, Der Pharmacia Sinica,2011, 2 (4), 112.3. M. Jaishree, M. Suman, S. Rashmi, UJPB 2013, 01(03), 36.4. J. Sheikha, H. Junejab, V. Ingleb, P. Alib, T. BenHaddac, J. of Saudi Chem. Soc. 2013, 17 (3), 269.5. D. H. Brown, A. J. Lewis, W. E. Smith, J. W. Teape,J. Med. Chem. 1980, 23, 729.6. J. R. Anacona, G. Da Silva, J. Chil. Chem. Soc.2005, 50 (2), 447.7. M. M. Abd-Elzaher, W. H. Hegazy, A. E.-D M.Gaafar, App. Organomet. Chem. 2005, 19 (8), 911.8. W. H. Hegazy, J. Molec. Str. 2014, 1075, 103.9. W. H. Hegazy, Y. S. Al-Faiyz, Med. Chem. Res.2014, 23 (1), 518.10. B. N. Figgis, J. Lewis: in J. Lewis, R.G. Wilkins(Eds.), Magnetochemistry of complex compounds inModern Coordination chemistry, Interscience, NewYork (1960).
Int. J. Curr.Res.Chem.Pharma.Sci. 2(7): (2015):54–67
© 2015, IJCRCPS. All Rights Reserved 67
11. A. W. Coats, J. P. Redfern, Nature 1964, 68, 201.
12. F. A. Cotton, G. Wilkinson, C. A. Murillo, M.Bochmann, Advanced Inorganic Chemistry, Sixth ed.,Wiley, New York (1999).13. M. K. Koley, S. C. Sivasubramanian, B. Varghese,P. T. Manoharan, A. P. Koley, Inorg. Chim. Acta2008, 361, 1485.14. G. G. Mohamed, N. E. A. El-Gamel, F. A. Nour El-Dien, Synth. React. Inorg. Met.-Org. Chem. 2001, 31,347.15. J. Kohout, M. Hvastijova, J. Kozisek, J. G. Diaz, M.Valko, L. Jager, I. Svoboda, Inorg. Chim. Acta 1999,287, 186.16. S. Y. Uçan, M. Uçan, B. Mercimek, Synth. React.Inorg. Met.-Org. Chem. 2005, 35, 417.
17. N. Sari, P. Gurkan, S. Arslan, Transit. Met. Chem.2003, 28, 468.18. B. S. Shyamala, P. V. A. Lakshmi, V. J. Raju, J.Sci. Res. 2010, 2, 525.19. R. M. Silverstein, F. X. Webster, Spectrometricidentification of organic compounds, Wiley India, Delhi,2007, 102.20. S. A. Sallam, Trans. Met. Chem. 2006, 31, 46.21. H. S. Sangari, .S. Sodhi, Thermochim. Acta 1990,171, 49.22. E. Styczen, Z. Warnke, D. Wyrzykowski, ThermoChim. Acta 2007, 454, 84.23. V. Indria, G. Parameswaran, J. Therm. Anal. 1993,39, 1417.24. A. A. Frost, R. G. Pearson, Kinetics andMechanism, Wiley, New York (1961).
Related Documents