SYNTHESES and CHARACTERIZATIONS of BIOINSPIRED COMPOSITES with REGENERATION CAPABILITY By Decheng Hou A thesis submitted to Johns Hopkins University in conformity with the requirements for the degree of Master of Science in Engineering. Baltimore, Maryland January 2020 © 2020 Decheng Hou All rights reserved

Welcome message from author
This document is posted to help you gain knowledge. Please leave a comment to let me know what you think about it! Share it to your friends and learn new things together.
Transcript
SYNTHESES and CHARACTERIZATIONS of
BIOINSPIRED COMPOSITES with REGENERATION
CAPABILITY
By
Decheng Hou
A thesis submitted to Johns Hopkins University in conformity with the
requirements for the degree of Master of Science in Engineering.
Baltimore, Maryland
January 2020
© 2020 Decheng Hou
All rights reserved
ii
Abstract
The objective of this research is to investigate synthetic pathways for bioinspired
materials with regeneration ability. This study is a part of a larger study on bioinspired
composites motivated by current challenges of synthetic structural materials, such as
fixed mechanical properties and degradation over time. To address these challenges, we
are inspired by natural materials such as bones and coral reefs that can adapt to their
environment and regenerate.
Built upon previous findings that negatively charged scaffolds serve as templates
for mineral formation from the medium with ions by attracting positive mineral ions,
we hypothesized that if we use a scaffold with negatively charged surfaces, the damage
of the mineralized scaffold will expose underlying negative charges so that it can
provide “signals” for inducing mineral deposition, thus repairing the damaged mineral
layer.
To test the hypothesis, we utilized piezoelectric materials that convert mechanical
loading into electrical charges as scaffolds. After forming minerals by immersing into
a simulated body fluid (SBF) that mimics the ionic concentrations of human blood, we

iii
damaged the parts of the minerals and re-immersed samples into the SBF. Then, we
compared the thickness profiles of the minerals before and after re-immersing by using
an optical profiler. We also studied the effects of different piezoelectric scaffolds such
as Polyvinylidene fluoride and piezoelectric composite.
We found that the damaged areas were regenerated with minerals while more
studies are needed for a quantitative understanding of the mechanism. We envision that
our findings can contribute to developing novel synthetic materials with regeneration
capability with applications including coatings for bone-implants and remineralization
of teeth.
Primary Reader and Advisor: Sung Hoon Kang
Secondary Reader: Gist Croft
iv
Acknowledgments
I am very grateful to my advisor, Professor Sung Hoon Kang, for showing me the
field of bioinspired material, and for his guidance in this project and my master’s study.
I am also very grateful to Prof. Santiago Orrego, Mr. Zhezhi Chen, and Ms. Urszula
Krekora, who also had significant contributions to this project. Working in such a
diverse team broadened my thoughts and opened my mind, which is a precious research
experience in my life.
I also would like to offer my sincere thanks to Mr. Boliang Wu, Mr. Shichen Xu,
Mr. Junjie Pan, Mr. Ian McLane, Ms. Valerie Rennoll, Mr. Lichen Fang, and Dr. Ozan
Erol, who generously offered their supports and suggestions to help me complete this
project.
v
Contents
Abstract .................................................................................................. ii
Acknowledgments ................................................................................. iv
List of Tables ........................................................................................ vii
List of Figures .....................................................................................viii
1 Introduction ........................................................................................ 1
1.1 Motivation for Materials with Regeneration Capability ................ 1
1.2 Previous Study on Bioinspired Materials with Regeneration
Ability ................................................................................................ 4
1.3 Bioinspired Mineralization ........................................................... 5
1.4 Our Hypothesis ............................................................................ 6
1.5 Outline of Thesis .......................................................................... 7
2 Synthesis Mechanism of Bioinspired Composite ............................... 8
2.1 Charge-Induced Mineralization in Simulated Body Fluid ............. 8
2.2 Piezoelectric Materials ............................................................... 10
2.3 Synthesis Method ....................................................................... 11
2.4 Conclusion ................................................................................. 14
vi
3 Factors and Conditions Studied for Mineralization ....................... 15
3.1 Piezo-Coefficient ....................................................................... 15
3.1.1 Measurement Method ........................................................ 16
3.1.2 Equipment and Setting ...................................................... 17
3.1.3 Testing Results .................................................................. 19
3.2 Different Concentrated Simulated Body Fluids .......................... 19
3.3 pH Value .................................................................................... 22
3.4 Conclusion ................................................................................. 23
4 Characterizations of Bioinspired Composites ................................. 25
4.1 Surface Morphology................................................................... 25
4.2 Chemical Composition Analysis ................................................ 27
4.3 Testing Regeneration of Damaged Areas ................................... 30
4.4 Conclusion ................................................................................. 32
5 Conclusion and Future Work ........................................................... 33
5.1 Summary of Current Work ......................................................... 33
5.2 Future Work ............................................................................... 34
5.3 Perspectives of Our Bioinspired Composite ............................... 35
Bibliography ......................................................................................... 36
Biography ............................................................................................. 42
vii
List of Tables
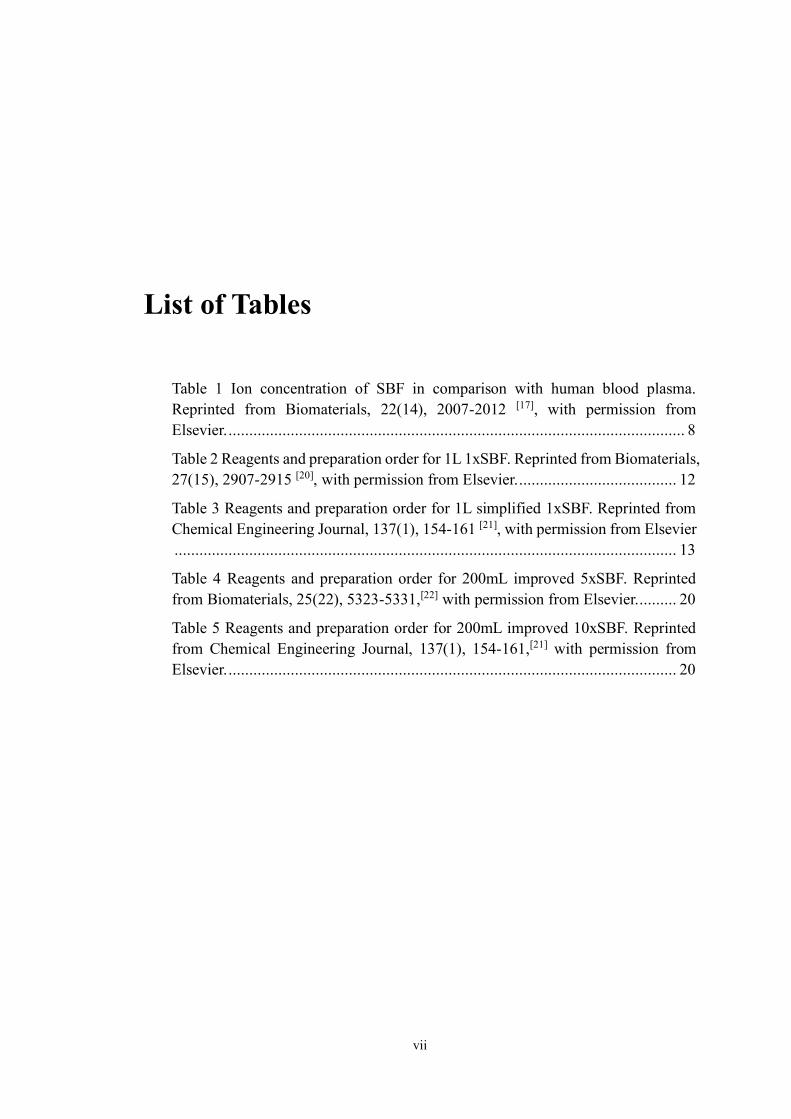
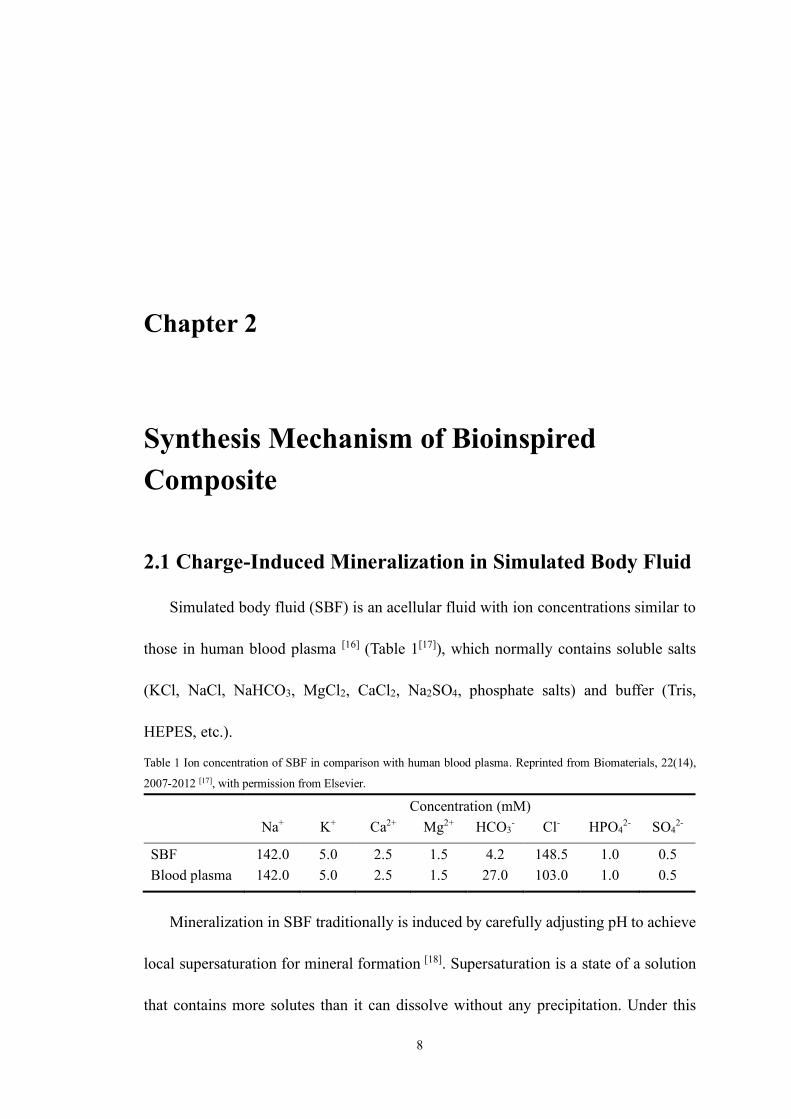
Table 1 Ion concentration of SBF in comparison with human blood plasma.
Reprinted from Biomaterials, 22(14), 2007-2012 [17], with permission from
Elsevier. .............................................................................................................. 8
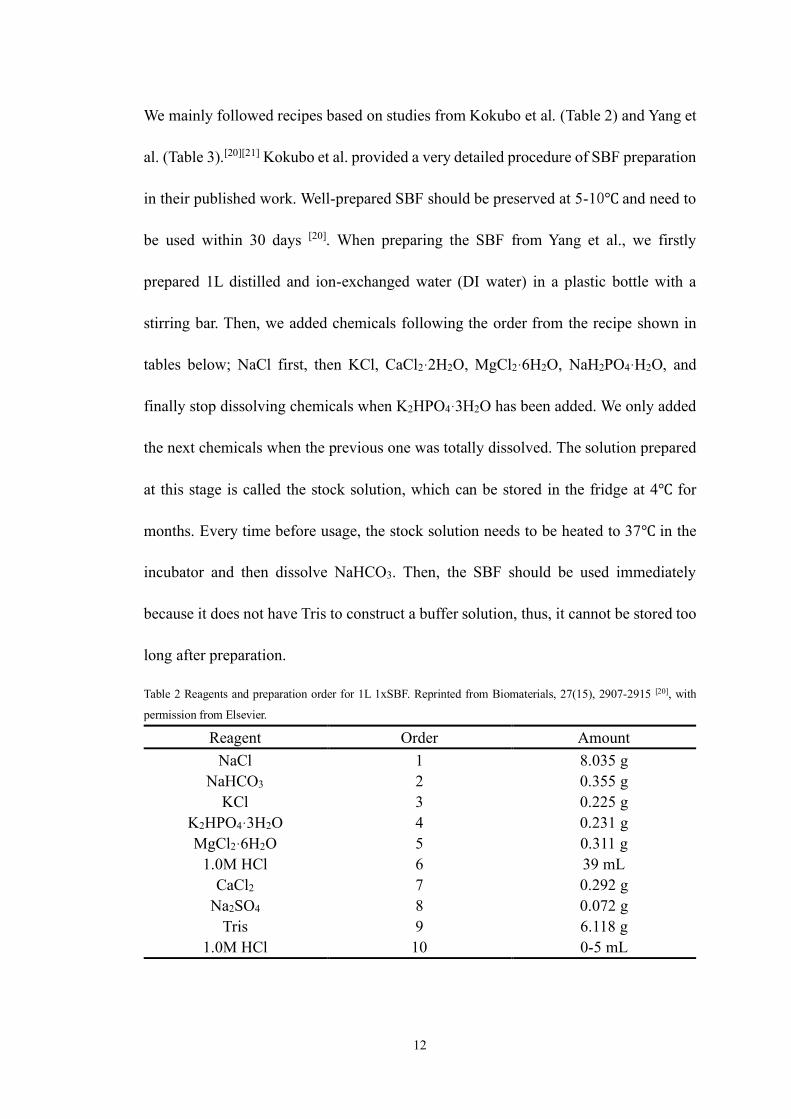
Table 2 Reagents and preparation order for 1L 1xSBF. Reprinted from Biomaterials,
27(15), 2907-2915 [20], with permission from Elsevier. ...................................... 12
Table 3 Reagents and preparation order for 1L simplified 1xSBF. Reprinted from
Chemical Engineering Journal, 137(1), 154-161 [21], with permission from Elsevier
......................................................................................................................... 13
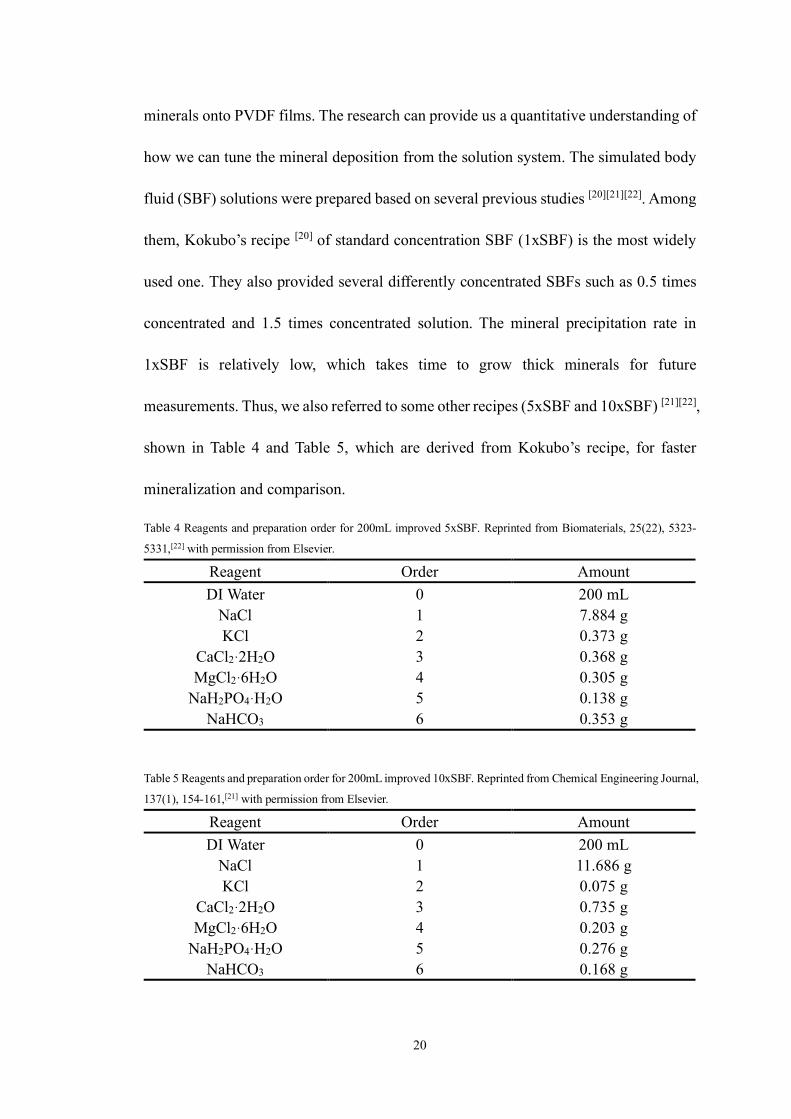
Table 4 Reagents and preparation order for 200mL improved 5xSBF. Reprinted
from Biomaterials, 25(22), 5323-5331,[22] with permission from Elsevier. ......... 20
Table 5 Reagents and preparation order for 200mL improved 10xSBF. Reprinted
from Chemical Engineering Journal, 137(1), 154-161,[21] with permission from
Elsevier. ............................................................................................................ 20
viii
List of Figures
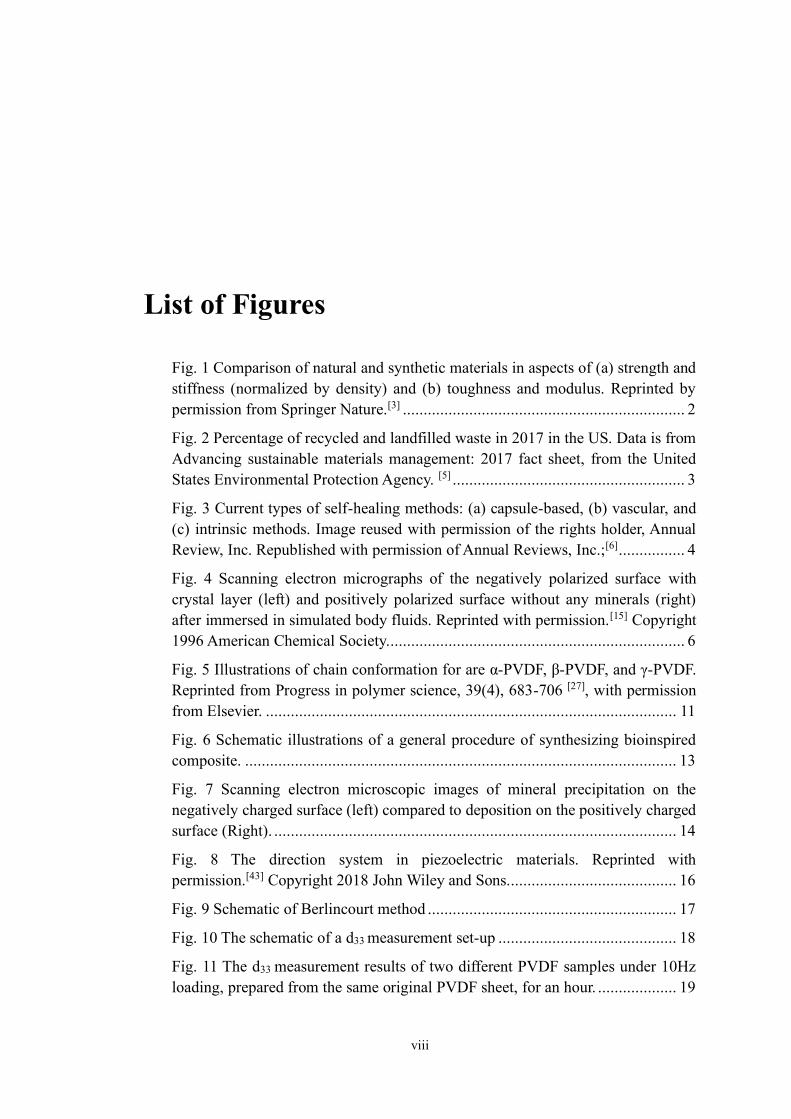
Fig. 1 Comparison of natural and synthetic materials in aspects of (a) strength and
stiffness (normalized by density) and (b) toughness and modulus. Reprinted by
permission from Springer Nature.[3] .................................................................... 2
Fig. 2 Percentage of recycled and landfilled waste in 2017 in the US. Data is from
Advancing sustainable materials management: 2017 fact sheet, from the United
States Environmental Protection Agency. [5] ........................................................ 3
Fig. 3 Current types of self-healing methods: (a) capsule-based, (b) vascular, and
(c) intrinsic methods. Image reused with permission of the rights holder, Annual
Review, Inc. Republished with permission of Annual Reviews, Inc.;[6] ................ 4
Fig. 4 Scanning electron micrographs of the negatively polarized surface with
crystal layer (left) and positively polarized surface without any minerals (right)
after immersed in simulated body fluids. Reprinted with permission.[15] Copyright
1996 American Chemical Society. ....................................................................... 6
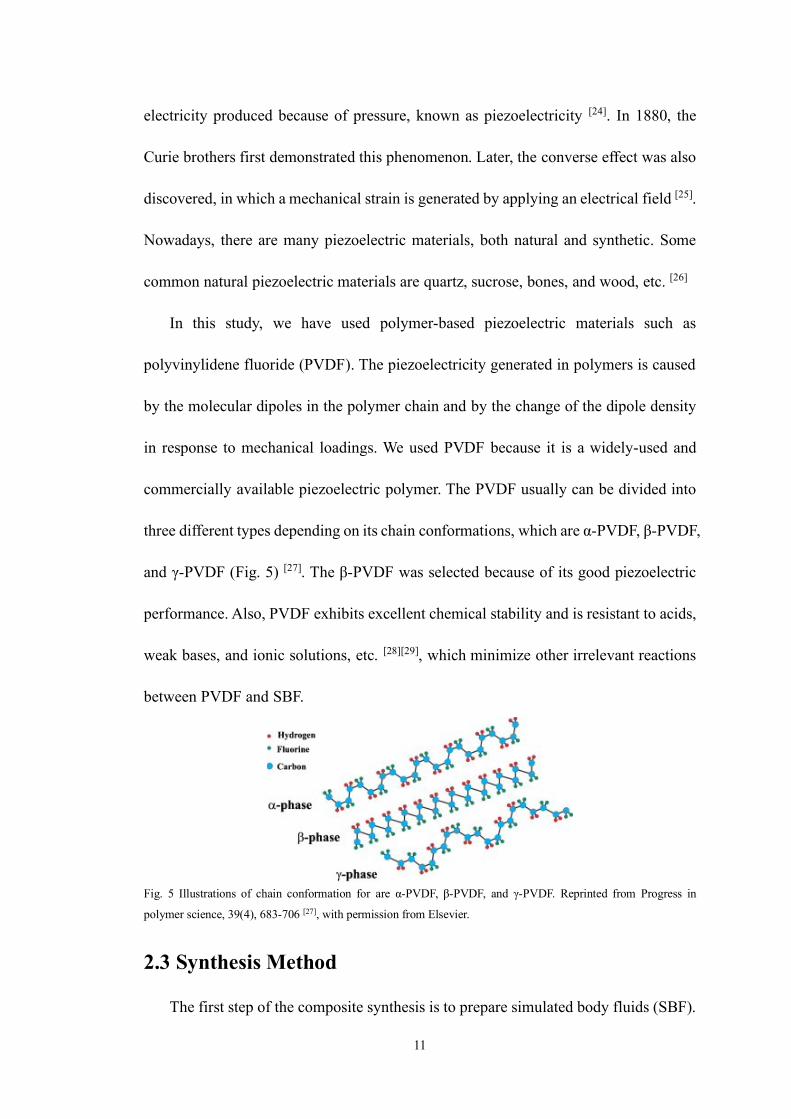
Fig. 5 Illustrations of chain conformation for are α-PVDF, β-PVDF, and γ-PVDF.
Reprinted from Progress in polymer science, 39(4), 683-706 [27], with permission
from Elsevier. ................................................................................................... 11
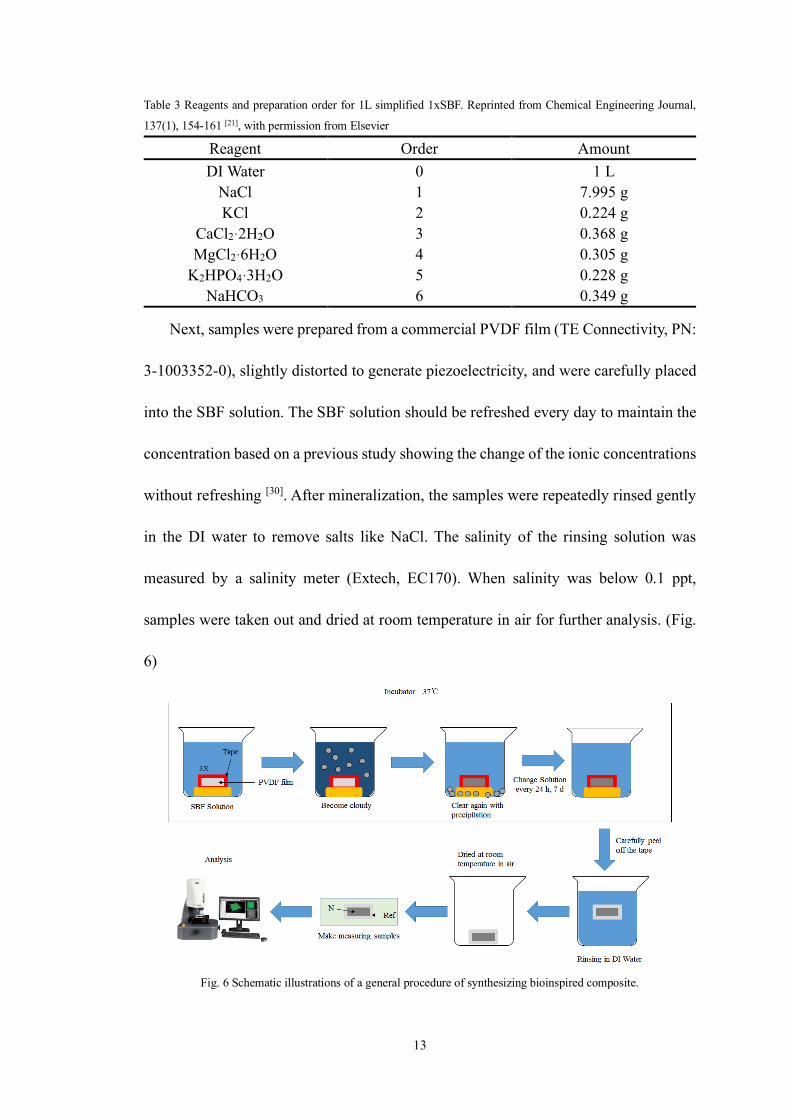
Fig. 6 Schematic illustrations of a general procedure of synthesizing bioinspired
composite. ........................................................................................................ 13
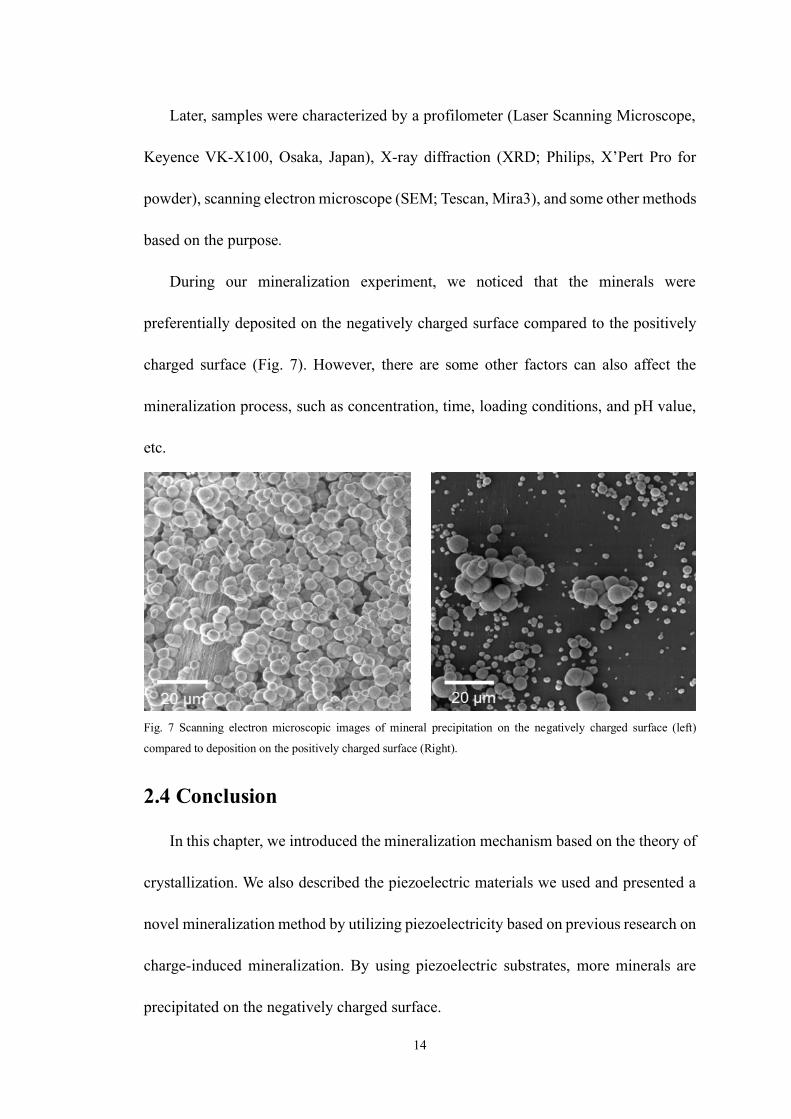
Fig. 7 Scanning electron microscopic images of mineral precipitation on the
negatively charged surface (left) compared to deposition on the positively charged
surface (Right). ................................................................................................. 14
Fig. 8 The direction system in piezoelectric materials. Reprinted with
permission.[43] Copyright 2018 John Wiley and Sons......................................... 16
Fig. 9 Schematic of Berlincourt method ............................................................ 17
Fig. 10 The schematic of a d33 measurement set-up ........................................... 18
Fig. 11 The d33 measurement results of two different PVDF samples under 10Hz
loading, prepared from the same original PVDF sheet, for an hour. ................... 19
ix
Fig. 13 Mineral layer thickness on the same substrate soaked in different
concentrated simulated body fluids for the same period..................................... 21
Fig. 14 pH variation in 12 hours and illustrations of typical phenomena at different
stages. Temperature and relative humidity are consistent. .................................. 23
Fig. 15 Common morphologies of calcium phosphate researchers have discovered.
These shapes are (a) irregular spheres, (b) spheres, (c) flowers, (d) porous spheres,
(e) bowknots, (f) dumbbells, (g) needles, (h) sheets, (i) self-assembled nanorods,
(j) rosettes, and (k) flakes. Reprinted from Acta biomaterialia, 9(8), 7591-7621,[36]
with permission from Elsevier. .......................................................................... 26
Fig. 16 (a) Dense spherical mineral layer observed in previous studies from
Kokubo et al. and Li et al.; (b) Dense spherical mineral layer observed in our study
share the same morphology; (c) Flaky-shape mineral layer shown in previous
research from Kobayashi et al. and Li et al; (d) Flaky-shape mineral layer shown
in our study also has been discovered. Reprinted from Biomaterials, 27(15), 2907-
2915,[20] with permission from Elsevier. ............................................................ 27
Fig. 17 XRD analysis of deposited minerals on PVDF substrate........................ 28
Fig. 18 EDS analysis of chemical elements in the deposited mineral layer formed
from 1x, 5x, 10x simulated body fluids separately. ............................................ 29
Fig. 19 Schematic of testing regeneration of damaged areas. ............................. 30
Fig. 20 An overview of the sample after damage (Top) and after healing (Bottom).
......................................................................................................................... 31
Fig. 21 Thickness measurement of the damaged area and non-damage area after
damage (Black) and after healing (Red) ............................................................ 32
1
Chapter 1
Introduction
1.1 Motivation for Materials with Regeneration Capability
Material property control is a crucial and essential topic in material science since
human beings started using tools from ancient times. Some scholars say that the history
of human beings is a history of material science because the advances of technologies
that push our society forward are correlated with the discoveries of new materials.
Ferguson [1] pointed out that human historical epochs are defined by classical materials
used by civilizations such as the Stone, Copper, Bronze, and Iron Ages, and thus the
levels of innovation and standards of living are related with the available material
technologies. Cohen et al. [2] also mentioned in his book, Materials and Man’s Needs,
that the increasing extravagance in the use of materials is one of the hallmarks of
modern industrialized society, and he also stated that “Materials by themselves do
nothing; yet without materials can do nothing”. It can be seen that there is a strong
2
connection between human society and material science and studying material
properties and synthesizing new materials are always important topics in human history.
While there have been tremendous progresses in materials research, there are still
challenges to realize some of the desirable characteristics of natural materials in
synthetic materials. There are many methods to design and process materials to achieve
required material properties, such as post-processing, synthesis of composite or
compounds, etc. However, man-made materials cannot totally take the place of natural
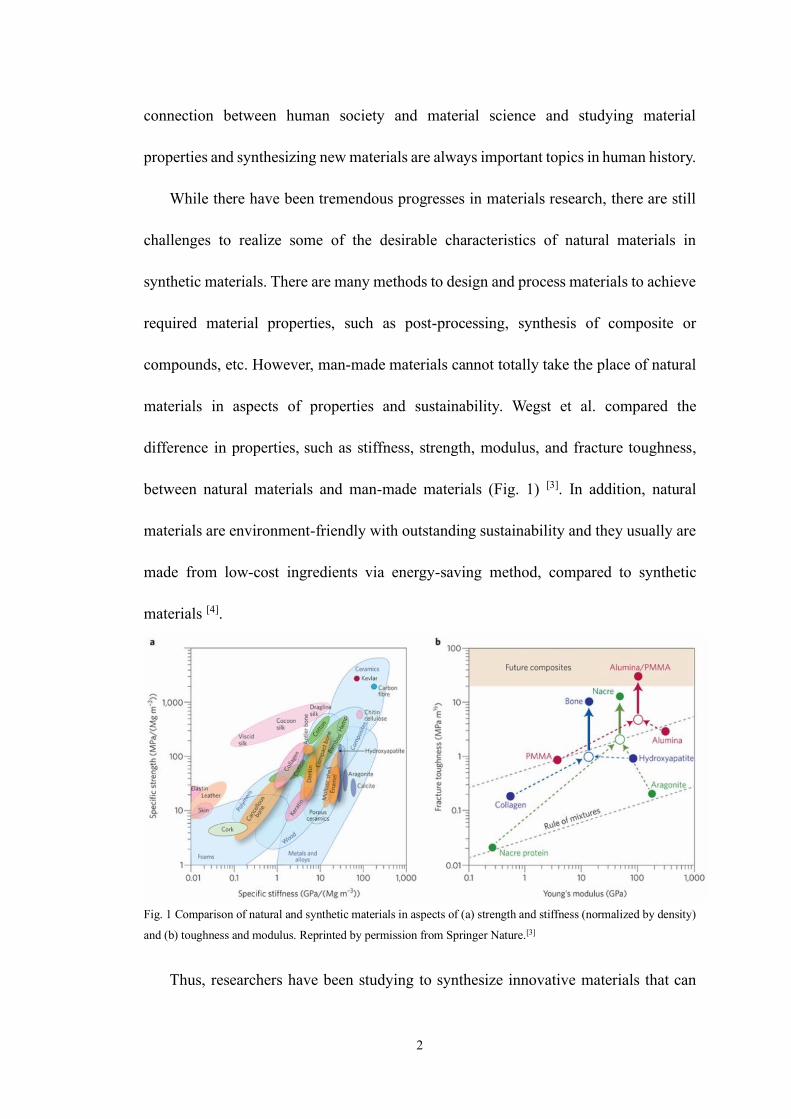
materials in aspects of properties and sustainability. Wegst et al. compared the
difference in properties, such as stiffness, strength, modulus, and fracture toughness,
between natural materials and man-made materials (Fig. 1) [3]. In addition, natural
materials are environment-friendly with outstanding sustainability and they usually are
made from low-cost ingredients via energy-saving method, compared to synthetic
materials [4].
Fig. 1 Comparison of natural and synthetic materials in aspects of (a) strength and stiffness (normalized by density)
and (b) toughness and modulus. Reprinted by permission from Springer Nature.[3]
Thus, researchers have been studying to synthesize innovative materials that can
3
mimic natural materials like bones, silk, nacre, etc., not only to achieve unique material
properties, but more importantly, to extend the lifecycle of synthesized materials and to
explore new recycling methods for the future. The world-wide problem of lack of
resources has been received public attention recently due to a large quantity of waste
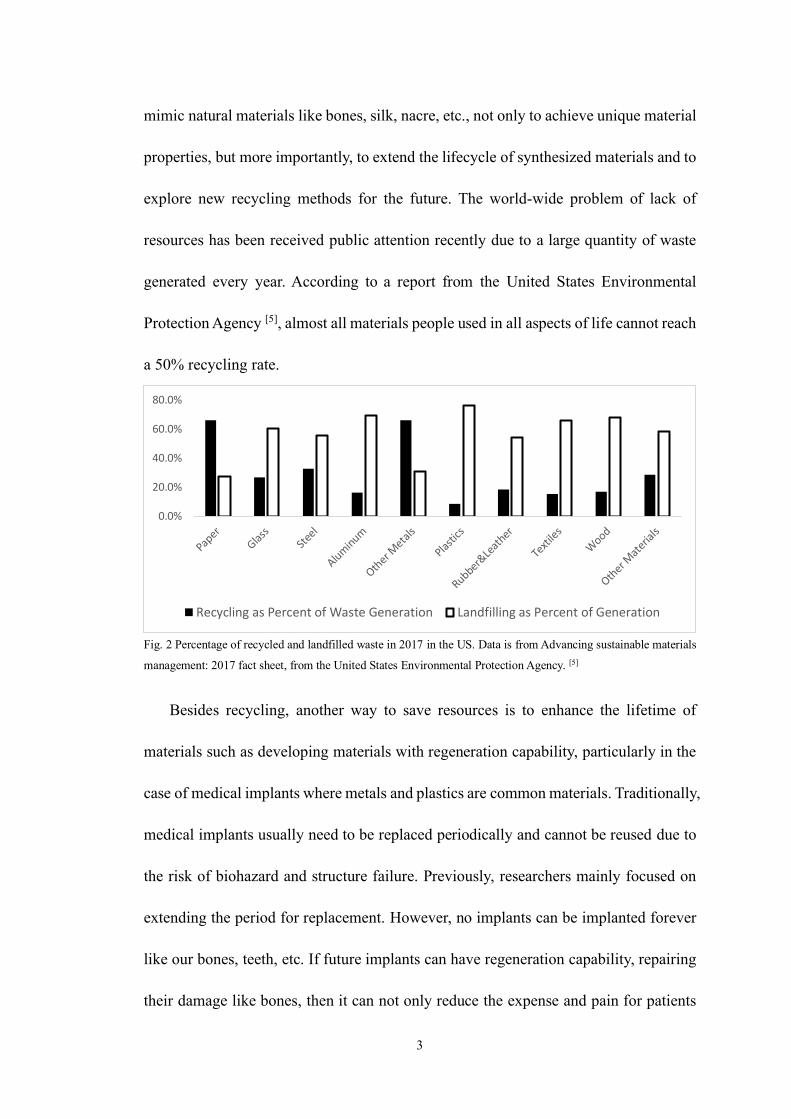
generated every year. According to a report from the United States Environmental
Protection Agency [5], almost all materials people used in all aspects of life cannot reach
a 50% recycling rate.
Fig. 2 Percentage of recycled and landfilled waste in 2017 in the US. Data is from Advancing sustainable materials
management: 2017 fact sheet, from the United States Environmental Protection Agency. [5]
Besides recycling, another way to save resources is to enhance the lifetime of
materials such as developing materials with regeneration capability, particularly in the
case of medical implants where metals and plastics are common materials. Traditionally,
medical implants usually need to be replaced periodically and cannot be reused due to
the risk of biohazard and structure failure. Previously, researchers mainly focused on
extending the period for replacement. However, no implants can be implanted forever
like our bones, teeth, etc. If future implants can have regeneration capability, repairing
their damage like bones, then it can not only reduce the expense and pain for patients
0.0%
20.0%
40.0%
60.0%
80.0%
Recycling as Percent of Waste Generation Landfilling as Percent of Generation
4
but also can be inspiring for people to explore novel methods in resource-saving and
environmental protection.
1.2 Previous Study on Bioinspired Materials with
Regeneration Ability
We are intrigued by properties of bones and consider bone as a model
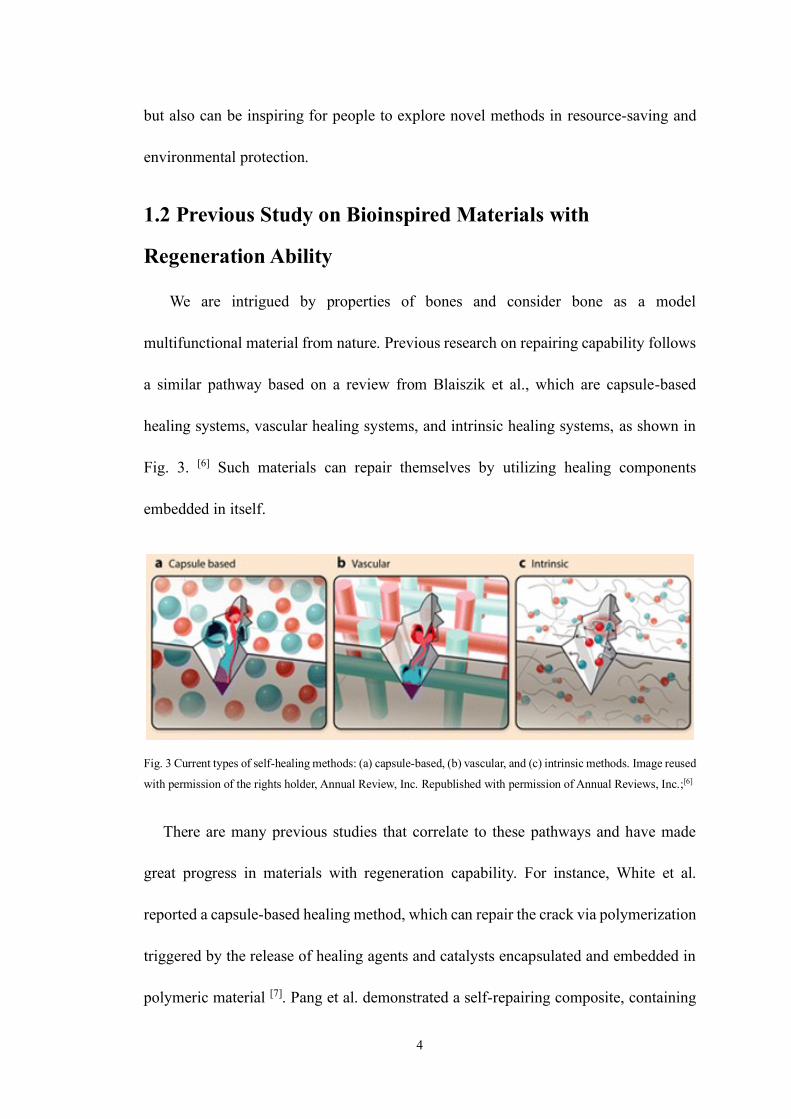
multifunctional material from nature. Previous research on repairing capability follows
a similar pathway based on a review from Blaiszik et al., which are capsule-based
healing systems, vascular healing systems, and intrinsic healing systems, as shown in
Fig. 3. [6] Such materials can repair themselves by utilizing healing components
embedded in itself.
Fig. 3 Current types of self-healing methods: (a) capsule-based, (b) vascular, and (c) intrinsic methods. Image reused
with permission of the rights holder, Annual Review, Inc. Republished with permission of Annual Reviews, Inc.;[6]
There are many previous studies that correlate to these pathways and have made
great progress in materials with regeneration capability. For instance, White et al.
reported a capsule-based healing method, which can repair the crack via polymerization
triggered by the release of healing agents and catalysts encapsulated and embedded in
polymeric material [7]. Pang et al. demonstrated a self-repairing composite, containing
5
healing agents in composite’s hollow vascular structure. The healing agents can
infiltrate the damaged area and ameliorate its effect when it happens and breaks the
vessel, similar to blood bleeding [8]. Chen et al. developed a polymeric material that can
reconnect its fractured part by a simple heating and cooling method [9]. More recently,
Li et al. reported a self-healing polymeric material that can self-repair at room
temperature without any stimulus based on the re-formation of chemical bonds [10].
However, many of these previous healing mechanisms require an internal source of
healing materials, which will be depleted and healing agents could be toxic. They also
need special conditions for regeneration, which sometimes lead to a lack of
biocompatibility for applications in medical implants. Our goal is to develop bone-
inspired materials with regeneration capability, which are able to repair themselves by
utilizing available raw materials around the damaged area.
1.3 Bioinspired Mineralization
Bone consists of about 40% inorganic components (primarily hydroxyapatite), 30%
organic component (mostly collagen), and 25% water by volume [11]. Bassett et al.
considered the collagen and apatite are the sources of piezoelectricity in bone and they
may have special significance [12]. Noris-Suarez et al. reported that electrochemical
action produced by piezoelectric dipoles generated from bone tissue can be the source
of initial hydroxyapatite growth on the collagen substrate [13]. The further assumption
stated that the electric fields formed by piezoelectricity from bone attract charged ions
and macromolecules in the surrounding fluids, enhancing bone formation [14]. We are
6
inspired by the findings that bones are formed by mineralization of ions from body
fluids onto charged scaffolds and they have signaling pathways to control the
mineralization process.
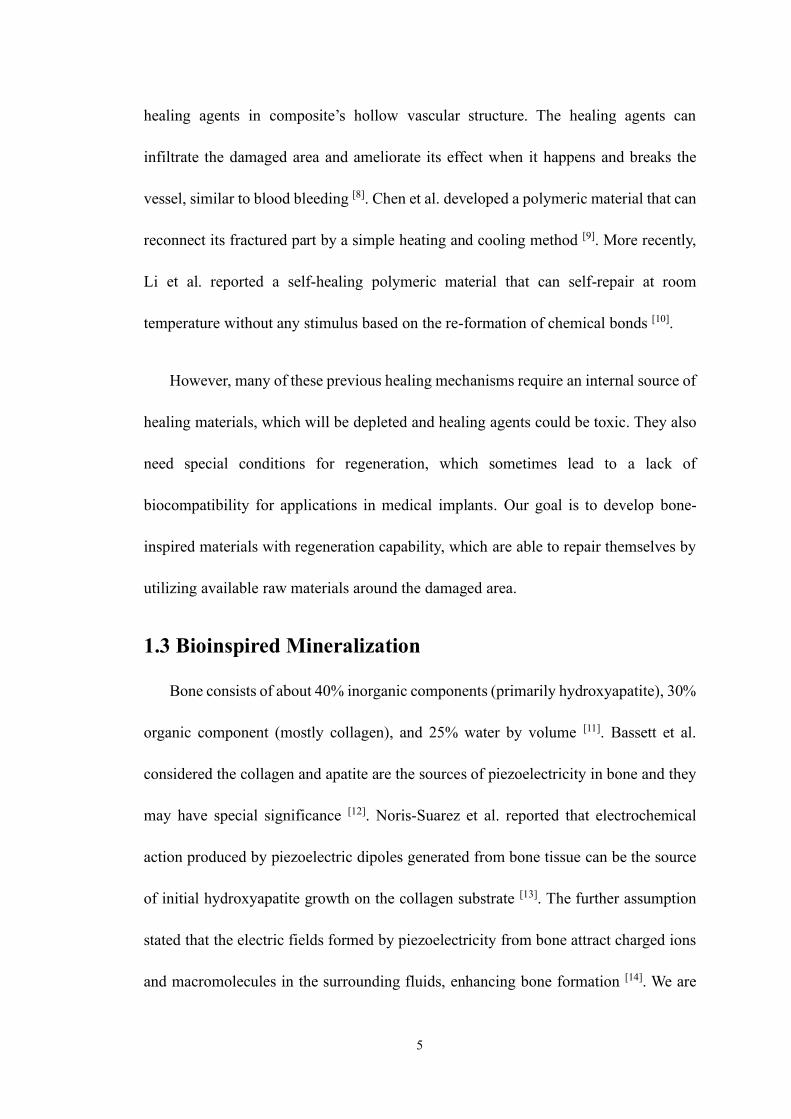
Previous studies showed that minerals such as hydroxyapatite were preferentially
deposited onto negatively charged surfaces from simulated body fluids (SBF), which is
similar to those in human blood plasma. For example, Yamashita et al. reported rapid
bone-like crystal growth on negatively polarized hydroxyapatite surfaces immersed in
simulated body fluids (SBF) while they observed no crystal growth on positively
polarized surfaces (Fig. 4) [15].
Fig. 4 Scanning electron micrographs of the negatively polarized surface with crystal layer (left) and positively
polarized surface without any minerals (right) after immersed in simulated body fluids. Reprinted with permission.[15]
Copyright 1996 American Chemical Society.
1.4 Our Hypothesis
Built upon previous findings that negatively charged scaffolds serve as templates
for mineral formation from the medium with ions by attracting positive mineral ions,
we hypothesized that if we use a scaffold with negatively charged surfaces, the damage
of the mineralized scaffold will expose underlying negative charges so that it can
7
provide “signals” for inducing mineral deposition, thus repairing the damaged mineral
layer.
In addition, as piezoelectric materials generate charges, the use of a piezoelectric
matrix can also provide excellent opportunities to understand the conditions, structures,
chemical components, and regeneration capability based on mineral synthesis from
simulated body fluids (SBF).
1.5 Outline of Thesis
The first chapter talked about the motivation for studying materials with
regeneration capability, previous studies on regeneration mechanisms, studies on
bioinspired mineralization, and our hypothesis. The second chapter will introduce our
analysis about the mineralization mechanism based on the theory of crystallization, a
brief introduction about the piezoelectric materials we used, and a general procedure
for bioinspired composite synthesis. The third chapter will mainly focus on the factors
and conditions we studied in the mineralization process. The fourth chapter will show
our chemical analysis on our bioinspired composite and our current progress studying
its self-regeneration capability. The fifth chapter will be conclusions, future work, and
prospective applications of this project.
8
Chapter 2
Synthesis Mechanism of Bioinspired
Composite
2.1 Charge-Induced Mineralization in Simulated Body Fluid
Simulated body fluid (SBF) is an acellular fluid with ion concentrations similar to
those in human blood plasma [16] (Table 1[17]), which normally contains soluble salts
(KCl, NaCl, NaHCO3, MgCl2, CaCl2, Na2SO4, phosphate salts) and buffer (Tris,
HEPES, etc.).
Table 1 Ion concentration of SBF in comparison with human blood plasma. Reprinted from Biomaterials, 22(14),
2007-2012 [17], with permission from Elsevier.
Concentration (mM)
Na+ K+ Ca2+ Mg2+ HCO3- Cl- HPO4
2- SO42-
SBF 142.0 5.0 2.5 1.5 4.2 148.5 1.0 0.5
Blood plasma 142.0 5.0 2.5 1.5 27.0 103.0 1.0 0.5
Mineralization in SBF traditionally is induced by carefully adjusting pH to achieve
local supersaturation for mineral formation [18]. Supersaturation is a state of a solution
that contains more solutes than it can dissolve without any precipitation. Under this
9
condition, when the solution slowly proceeds to the state of homogeneous nucleation
but only a few nuclei start to grow, the starting crystallization will decrease the local
ion concentration and bring the solution back into the region of supersaturation. Then,
existing crystals will grow, but no new nuclei will form, which results in a slow but
stable precipitation process. In 1990, Kokubo et al. first reported mineral formation on
the surface of a glass-ceramic composite based on this method [19]. Since then, many
researchers have used SBF to study mineralization for biomaterials in vitro and many
revised versions of SBF have been created [20][21][22]. Despite the different versions of
SBF, the precipitated mineral is commonly a form of calcium phosphate, which has
been used as the coating layer for bone implants because calcium phosphate is one of
the components of bones and it can be accepted by cells to reduce immunoreactions
when implanted into the human body. Take hydroxyapatite, for example, the typical
chemical reaction of precipitation in simulated body fluid is:
5𝐶𝑎2+ + 3𝑃𝑂43− + 𝑂𝐻− = 𝐶𝑎5(𝑃𝑂4)3(𝑂𝐻)
Generally, in the mineralization process, there are two crucial stages, which are
nucleation and the growth of crystal nuclei. Nucleation is a phenomenon that tiny seed
crystals start to form inside the solution. The rate of nucleation, 𝐽𝑁, is related to molar
activation energy, ∆𝑔𝑛 [23]:
𝐽𝑁 ∝ 𝑒−∆𝑔𝑛𝑘𝑇
where k is Boltzmann constant, and T is the temperature. The molar activation energy,
∆𝑔𝑛, is influenced by interfacial energy per area, 𝜎, and local supersaturation factor,
𝑆𝑅:
10
∆𝑔𝑛 ∝𝜎3
(𝑙𝑛𝑆𝑅)2
And, in the case of hydroxyapatite precipitation,
𝑆𝑅 =[𝐶𝑎2+]5[𝑃𝑂4
3−]3[𝑂𝐻−]
𝐾𝑆𝑃
where 𝐾𝑆𝑃 is solubility product constant, and [𝐶𝑎2+], [𝑃𝑂43−], [𝑂𝐻−] are molarity of
ions or chemical groups. After nucleation, the formed nuclei begin to grow and
accumulate on the substrate surface. The rate of crystal growth can be expressed in the
form of power law [23]:
𝐽𝐺 = 𝑘(𝑆𝑅 − 1)𝑥
where 𝐽𝐺 is rate of nucleation, 𝑆𝑅 is relative supersaturation ratio, 𝑘 is the rate
constant, x is decided by step mechanism.
Based on the fundamental crystallization theory, we can speculate that the negative
charges influence the crystallization of minerals in following aspects. Firstly, the
negative charges increase the local relative supersaturation (SR) of minerals by
attracting calcium ions. The increase of SR will result in the decrease of molar activation
energy and then increase the nucleation rate. The increase of SR will also lead to the
increase of the crystal growth rate JG. When crystal grows thicker, the influence of
charges will decline, decreasing the crystallization rate.
2.2 Piezoelectric Materials
Due to the application of mechanical stresses, an electric charge can build up in a
number of solid materials, including select ceramics, crystals and some biological
materials like DNA, bone and certain proteins. The resulting effect is a type of
11
electricity produced because of pressure, known as piezoelectricity [24]. In 1880, the
Curie brothers first demonstrated this phenomenon. Later, the converse effect was also
discovered, in which a mechanical strain is generated by applying an electrical field [25].
Nowadays, there are many piezoelectric materials, both natural and synthetic. Some
common natural piezoelectric materials are quartz, sucrose, bones, and wood, etc. [26]
In this study, we have used polymer-based piezoelectric materials such as
polyvinylidene fluoride (PVDF). The piezoelectricity generated in polymers is caused
by the molecular dipoles in the polymer chain and by the change of the dipole density
in response to mechanical loadings. We used PVDF because it is a widely-used and
commercially available piezoelectric polymer. The PVDF usually can be divided into
three different types depending on its chain conformations, which are α-PVDF, β-PVDF,
and γ-PVDF (Fig. 5) [27]. The β-PVDF was selected because of its good piezoelectric
performance. Also, PVDF exhibits excellent chemical stability and is resistant to acids,
weak bases, and ionic solutions, etc. [28][29], which minimize other irrelevant reactions
between PVDF and SBF.
Fig. 5 Illustrations of chain conformation for are α-PVDF, β-PVDF, and γ-PVDF. Reprinted from Progress in
polymer science, 39(4), 683-706 [27], with permission from Elsevier.
2.3 Synthesis Method
The first step of the composite synthesis is to prepare simulated body fluids (SBF).
12
We mainly followed recipes based on studies from Kokubo et al. (Table 2) and Yang et
al. (Table 3).[20][21] Kokubo et al. provided a very detailed procedure of SBF preparation
in their published work. Well-prepared SBF should be preserved at 5-10℃ and need to
be used within 30 days [20]. When preparing the SBF from Yang et al., we firstly
prepared 1L distilled and ion-exchanged water (DI water) in a plastic bottle with a
stirring bar. Then, we added chemicals following the order from the recipe shown in
tables below; NaCl first, then KCl, CaCl2·2H2O, MgCl2·6H2O, NaH2PO4·H2O, and
finally stop dissolving chemicals when K2HPO4·3H2O has been added. We only added
the next chemicals when the previous one was totally dissolved. The solution prepared
at this stage is called the stock solution, which can be stored in the fridge at 4℃ for
months. Every time before usage, the stock solution needs to be heated to 37℃ in the
incubator and then dissolve NaHCO3. Then, the SBF should be used immediately
because it does not have Tris to construct a buffer solution, thus, it cannot be stored too
long after preparation.
Table 2 Reagents and preparation order for 1L 1xSBF. Reprinted from Biomaterials, 27(15), 2907-2915 [20], with
permission from Elsevier.
Reagent Order Amount
NaCl 1 8.035 g
NaHCO3 2 0.355 g
KCl 3 0.225 g
K2HPO4·3H2O 4 0.231 g
MgCl2·6H2O 5 0.311 g
1.0M HCl 6 39 mL
CaCl2 7 0.292 g
Na2SO4 8 0.072 g
Tris 9 6.118 g
1.0M HCl 10 0-5 mL
13
Table 3 Reagents and preparation order for 1L simplified 1xSBF. Reprinted from Chemical Engineering Journal,
137(1), 154-161 [21], with permission from Elsevier
Reagent Order Amount
DI Water 0 1 L
NaCl 1 7.995 g
KCl 2 0.224 g
CaCl2·2H2O 3 0.368 g
MgCl2·6H2O 4 0.305 g
K2HPO4·3H2O 5 0.228 g
NaHCO3 6 0.349 g
Next, samples were prepared from a commercial PVDF film (TE Connectivity, PN:
3-1003352-0), slightly distorted to generate piezoelectricity, and were carefully placed
into the SBF solution. The SBF solution should be refreshed every day to maintain the
concentration based on a previous study showing the change of the ionic concentrations
without refreshing [30]. After mineralization, the samples were repeatedly rinsed gently
in the DI water to remove salts like NaCl. The salinity of the rinsing solution was
measured by a salinity meter (Extech, EC170). When salinity was below 0.1 ppt,
samples were taken out and dried at room temperature in air for further analysis. (Fig.
6)
Fig. 6 Schematic illustrations of a general procedure of synthesizing bioinspired composite.
14
Later, samples were characterized by a profilometer (Laser Scanning Microscope,
Keyence VK-X100, Osaka, Japan), X-ray diffraction (XRD; Philips, X’Pert Pro for
powder), scanning electron microscope (SEM; Tescan, Mira3), and some other methods
based on the purpose.
During our mineralization experiment, we noticed that the minerals were
preferentially deposited on the negatively charged surface compared to the positively
charged surface (Fig. 7). However, there are some other factors can also affect the
mineralization process, such as concentration, time, loading conditions, and pH value,
etc.
Fig. 7 Scanning electron microscopic images of mineral precipitation on the negatively charged surface (left)
compared to deposition on the positively charged surface (Right).
2.4 Conclusion
In this chapter, we introduced the mineralization mechanism based on the theory of
crystallization. We also described the piezoelectric materials we used and presented a
novel mineralization method by utilizing piezoelectricity based on previous research on
charge-induced mineralization. By using piezoelectric substrates, more minerals are
precipitated on the negatively charged surface.
15
Chapter 3
Factors and Conditions Studied for
Mineralization
3.1 Piezo-Coefficient
The piezocoefficient dij is the ratio of the charge per unit flowing along the j-
direction to the stress applied in the i-direction and a typical unit is pC/N [42]. There are
different piezo-coefficients based on directions of polarization and applied mechanical
forces to assess piezoelectricity in different situations. Usually, the piezoelectric
coefficients are defined with double subscripts, with the first subscript indicating the
direction of the electric field associated with the applied voltage/produced charge and
the second subscript indicating the direction of the mechanical stress/strain [31].
Direction X, Y, or Z is represented by the subscript 1, 2, or 3, respectively, and shear on
one of these axes is represented by the subscript 4, 5, or 6, respectively.[24] (Fig. 8)
16
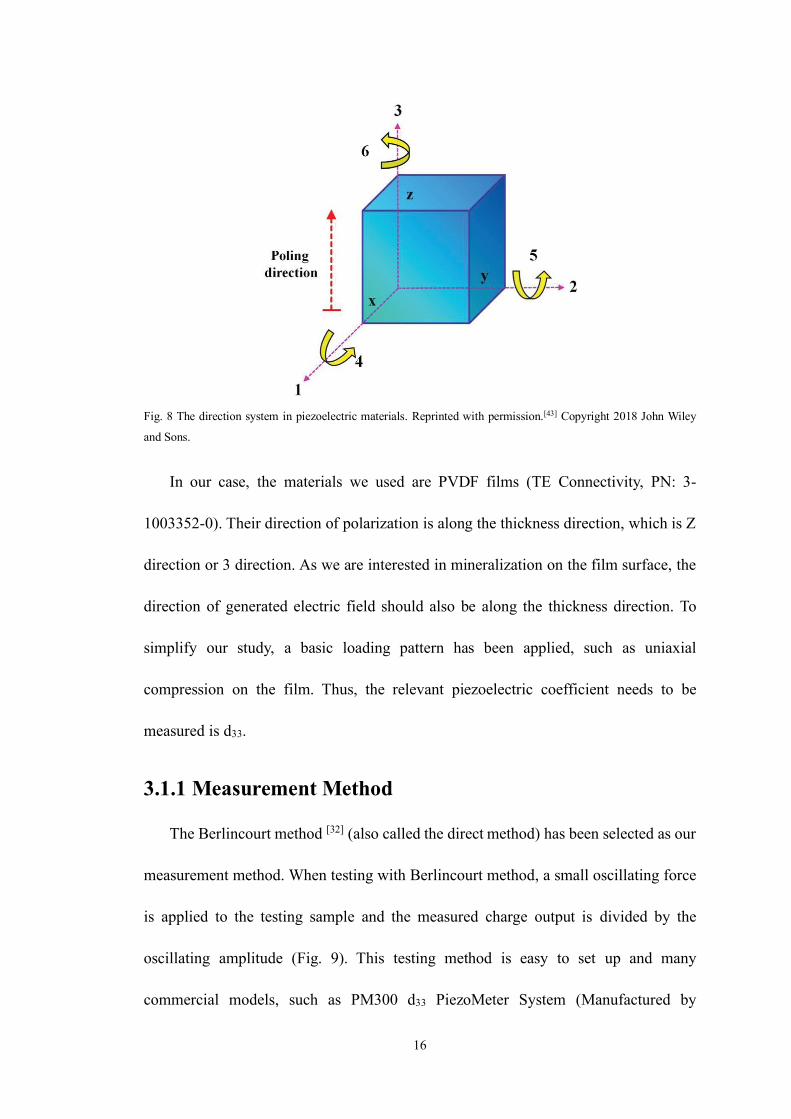
Fig. 8 The direction system in piezoelectric materials. Reprinted with permission.[43] Copyright 2018 John Wiley
and Sons.
In our case, the materials we used are PVDF films (TE Connectivity, PN: 3-
1003352-0). Their direction of polarization is along the thickness direction, which is Z
direction or 3 direction. As we are interested in mineralization on the film surface, the
direction of generated electric field should also be along the thickness direction. To
simplify our study, a basic loading pattern has been applied, such as uniaxial
compression on the film. Thus, the relevant piezoelectric coefficient needs to be
measured is d33.
3.1.1 Measurement Method
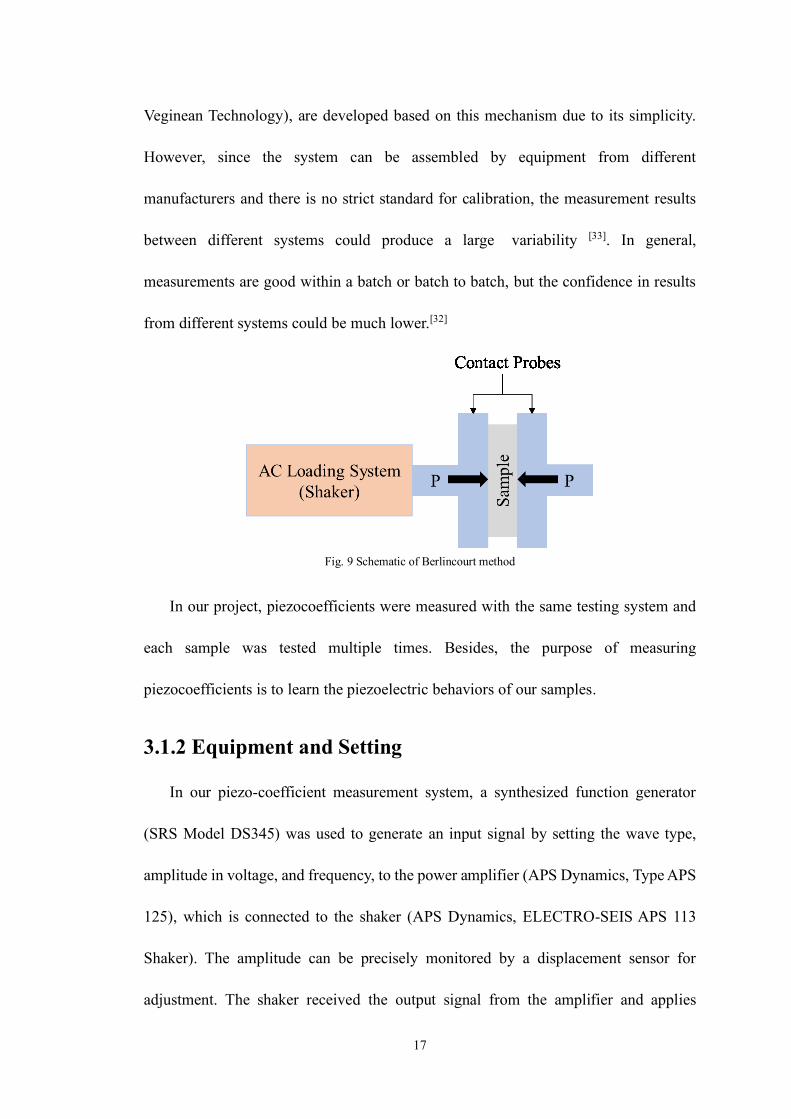
The Berlincourt method [32] (also called the direct method) has been selected as our
measurement method. When testing with Berlincourt method, a small oscillating force
is applied to the testing sample and the measured charge output is divided by the
oscillating amplitude (Fig. 9). This testing method is easy to set up and many
commercial models, such as PM300 d33 PiezoMeter System (Manufactured by
17
Veginean Technology), are developed based on this mechanism due to its simplicity.
However, since the system can be assembled by equipment from different
manufacturers and there is no strict standard for calibration, the measurement results
between different systems could produce a large variability [33]. In general,
measurements are good within a batch or batch to batch, but the confidence in results
from different systems could be much lower.[32]
Fig. 9 Schematic of Berlincourt method
In our project, piezocoefficients were measured with the same testing system and
each sample was tested multiple times. Besides, the purpose of measuring
piezocoefficients is to learn the piezoelectric behaviors of our samples.
3.1.2 Equipment and Setting
In our piezo-coefficient measurement system, a synthesized function generator
(SRS Model DS345) was used to generate an input signal by setting the wave type,
amplitude in voltage, and frequency, to the power amplifier (APS Dynamics, Type APS
125), which is connected to the shaker (APS Dynamics, ELECTRO-SEIS APS 113
Shaker). The amplitude can be precisely monitored by a displacement sensor for
adjustment. The shaker received the output signal from the amplifier and applies
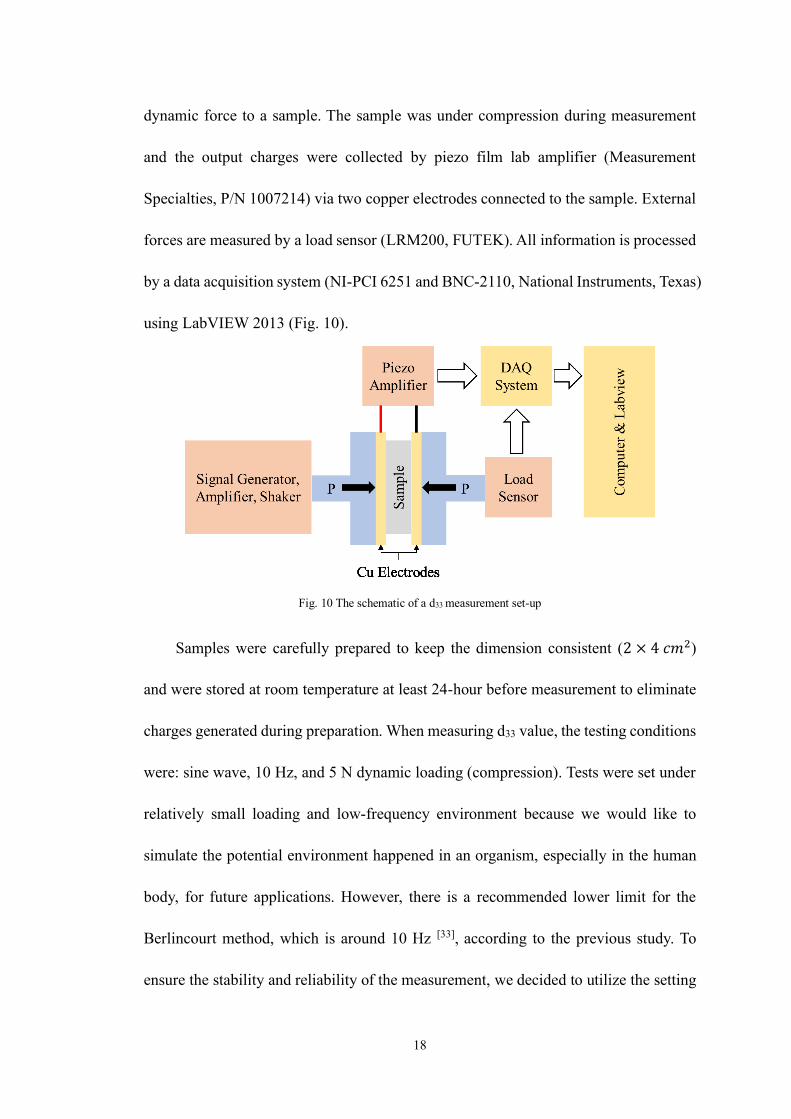
18
dynamic force to a sample. The sample was under compression during measurement
and the output charges were collected by piezo film lab amplifier (Measurement
Specialties, P/N 1007214) via two copper electrodes connected to the sample. External
forces are measured by a load sensor (LRM200, FUTEK). All information is processed
by a data acquisition system (NI-PCI 6251 and BNC-2110, National Instruments, Texas)
using LabVIEW 2013 (Fig. 10).
Fig. 10 The schematic of a d33 measurement set-up
Samples were carefully prepared to keep the dimension consistent (2 × 4 𝑐𝑚2)
and were stored at room temperature at least 24-hour before measurement to eliminate
charges generated during preparation. When measuring d33 value, the testing conditions
were: sine wave, 10 Hz, and 5 N dynamic loading (compression). Tests were set under
relatively small loading and low-frequency environment because we would like to
simulate the potential environment happened in an organism, especially in the human
body, for future applications. However, there is a recommended lower limit for the
Berlincourt method, which is around 10 Hz [33], according to the previous study. To
ensure the stability and reliability of the measurement, we decided to utilize the setting
19
above and the d33 value of each sample was recorded for an hour.
3.1.3 Testing Results
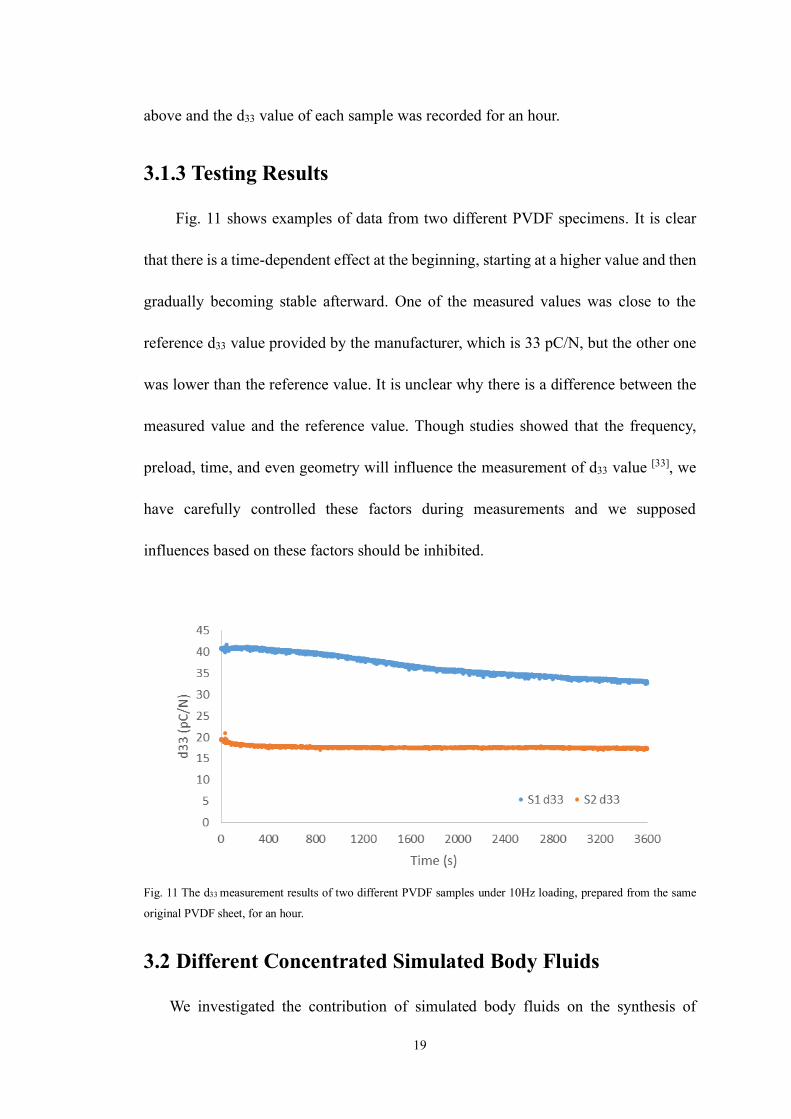
Fig. 11 shows examples of data from two different PVDF specimens. It is clear
that there is a time-dependent effect at the beginning, starting at a higher value and then
gradually becoming stable afterward. One of the measured values was close to the
reference d33 value provided by the manufacturer, which is 33 pC/N, but the other one
was lower than the reference value. It is unclear why there is a difference between the
measured value and the reference value. Though studies showed that the frequency,
preload, time, and even geometry will influence the measurement of d33 value [33], we
have carefully controlled these factors during measurements and we supposed
influences based on these factors should be inhibited.
Fig. 11 The d33 measurement results of two different PVDF samples under 10Hz loading, prepared from the same
original PVDF sheet, for an hour.
3.2 Different Concentrated Simulated Body Fluids
We investigated the contribution of simulated body fluids on the synthesis of
20
minerals onto PVDF films. The research can provide us a quantitative understanding of
how we can tune the mineral deposition from the solution system. The simulated body
fluid (SBF) solutions were prepared based on several previous studies [20][21][22]. Among
them, Kokubo’s recipe [20] of standard concentration SBF (1xSBF) is the most widely
used one. They also provided several differently concentrated SBFs such as 0.5 times
concentrated and 1.5 times concentrated solution. The mineral precipitation rate in
1xSBF is relatively low, which takes time to grow thick minerals for future
measurements. Thus, we also referred to some other recipes (5xSBF and 10xSBF) [21][22],
shown in Table 4 and Table 5, which are derived from Kokubo’s recipe, for faster
mineralization and comparison.
Table 4 Reagents and preparation order for 200mL improved 5xSBF. Reprinted from Biomaterials, 25(22), 5323-
5331,[22] with permission from Elsevier.
Reagent Order Amount
DI Water 0 200 mL
NaCl 1 7.884 g
KCl 2 0.373 g
CaCl2·2H2O 3 0.368 g
MgCl2·6H2O 4 0.305 g
NaH2PO4·H2O 5 0.138 g
NaHCO3 6 0.353 g
Table 5 Reagents and preparation order for 200mL improved 10xSBF. Reprinted from Chemical Engineering Journal,
137(1), 154-161,[21] with permission from Elsevier.
Reagent Order Amount
DI Water 0 200 mL
NaCl 1 11.686 g
KCl 2 0.075 g
CaCl2·2H2O 3 0.735 g
MgCl2·6H2O 4 0.203 g
NaH2PO4·H2O 5 0.276 g
NaHCO3 6 0.168 g
21
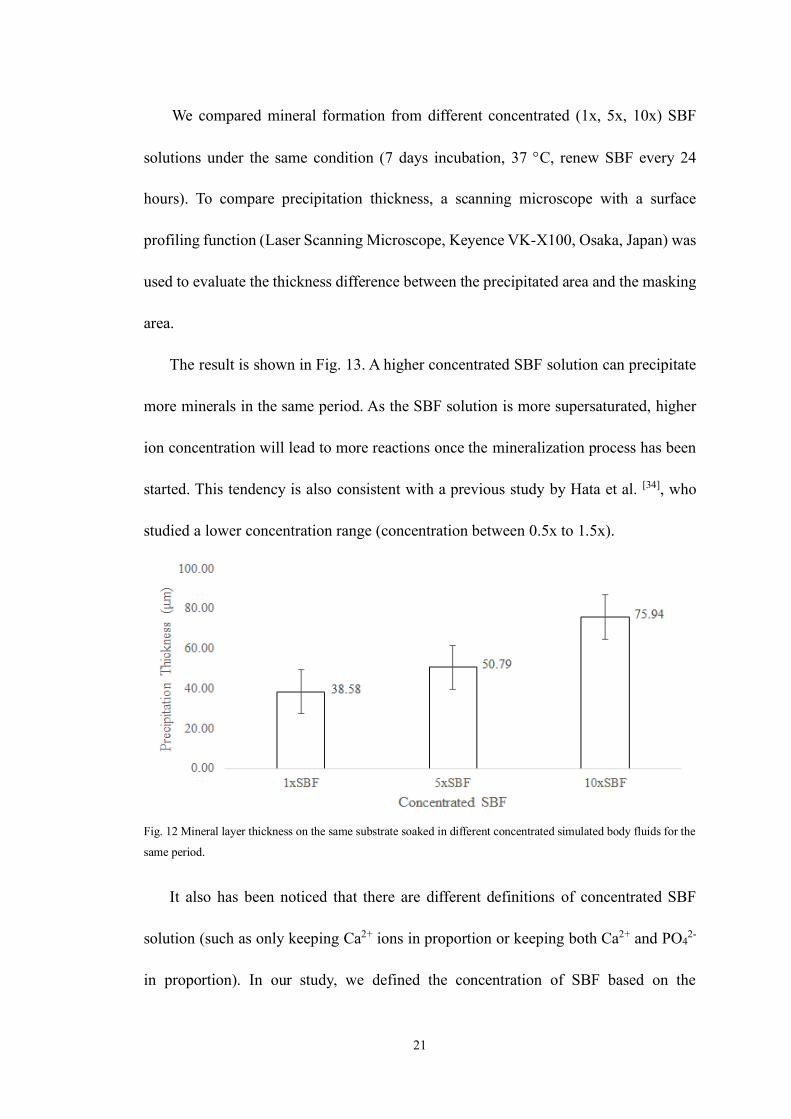
We compared mineral formation from different concentrated (1x, 5x, 10x) SBF
solutions under the same condition (7 days incubation, 37 C, renew SBF every 24
hours). To compare precipitation thickness, a scanning microscope with a surface
profiling function (Laser Scanning Microscope, Keyence VK-X100, Osaka, Japan) was
used to evaluate the thickness difference between the precipitated area and the masking
area.
The result is shown in Fig. 13. A higher concentrated SBF solution can precipitate
more minerals in the same period. As the SBF solution is more supersaturated, higher
ion concentration will lead to more reactions once the mineralization process has been
started. This tendency is also consistent with a previous study by Hata et al. [34], who
studied a lower concentration range (concentration between 0.5x to 1.5x).
Fig. 12 Mineral layer thickness on the same substrate soaked in different concentrated simulated body fluids for the
same period.
It also has been noticed that there are different definitions of concentrated SBF
solution (such as only keeping Ca2+ ions in proportion or keeping both Ca2+ and PO42-
in proportion). In our study, we defined the concentration of SBF based on the
22
concentration of Ca2+ because CaCl2·2H2O can release all Ca2+ in solution. Compared
to Ca2+, there are multiple balances related to PO42-, which is difficult to confirm the
final concentration of PO42- without any instrument.
3.3 pH Value
We also monitored the pH variation with the time for mineralization in highly
concentrated SBF solutions such as 10x SBF. As we mentioned previously, some
revised recipes of SBF we used did not include chemicals like Tris to construct a buffer
system in the solution. With the buffer system constructed, the pH of the solution can
be kept in a certain range [35]. In SBF, a stable pH value means the supersaturated status
can be maintained so the SBF can keep functioning. Thus, there is no need to refresh
the solution in the incubator. However, many of our highly concentrated SBF were not
buffer solution systems. Thus, we need to study how long the highly concentrated SBF
can function to decide the necessity and time point of refreshing.
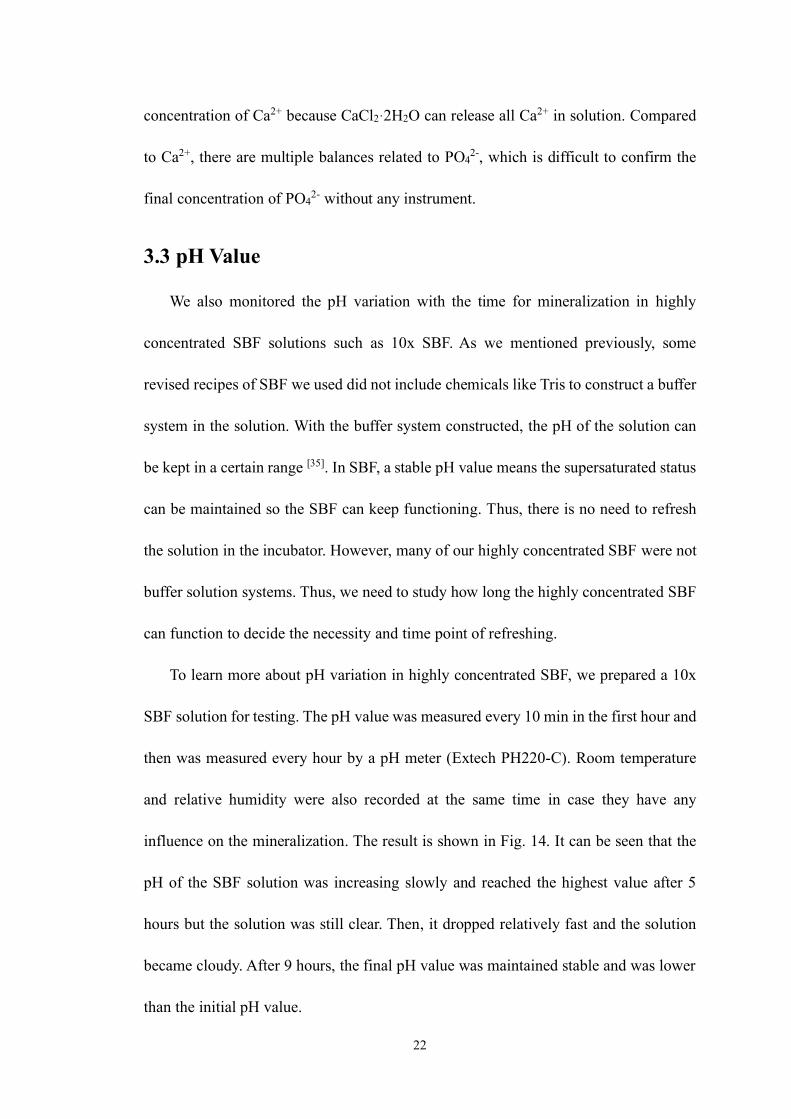
To learn more about pH variation in highly concentrated SBF, we prepared a 10x
SBF solution for testing. The pH value was measured every 10 min in the first hour and
then was measured every hour by a pH meter (Extech PH220-C). Room temperature
and relative humidity were also recorded at the same time in case they have any
influence on the mineralization. The result is shown in Fig. 14. It can be seen that the
pH of the SBF solution was increasing slowly and reached the highest value after 5
hours but the solution was still clear. Then, it dropped relatively fast and the solution
became cloudy. After 9 hours, the final pH value was maintained stable and was lower
than the initial pH value.
23
Fig. 13 pH variation in 12 hours and illustrations of typical phenomena at different stages. Temperature and relative
humidity are consistent.
The experiment showed that the 10x SBF without buffer system lost its
functionality in less than a day. The final pH value was below the pH right after
preparation, which indicates that the status of this solution system may no longer be
supersaturated. If we would like to conduct experiments by using the SBF without
buffer, the simplest way is to refresh the solution daily. Or, we could search for other
chemicals that can build a buffer system suitable for maintaining the pH around this
level.
3.4 Conclusion
In this chapter, we studied factors and conditions involved in the mineralization
process from simulated body fluids. We compared our measurement results of our
piezoelectric samples to the reference value provided by the manufacturer. We also
compared the precipitated mineral thickness produced from different recipes of
simulated body fluids in previous studies. The result demonstrated that more minerals

24
can be deposited from higher concentrated minerals. However, the pH varies
dramatically in the highly concentrated SBF solution because it usually does not contain
any chemicals to build a buffer system, which requires a daily refresh of the solution if
used for an experiment lasting longer than one day.
25
Chapter 4
Characterizations of Bioinspired
Composites
4.1 Surface Morphology
When studying factors that influence composite synthesis, we noticed several
different types of morphologies of deposited minerals on the surface. Previous studies
from Sadat-Shojai [36] and Dorozhkin [37] et al. showed that calcium phosphates can
form many unique types of morphologies under specific methods of synthesis.
Currently well-known and discovered shapes are irregular spheres (Fig. 15a), spheres
(Fig. 15b), flowers (Fig. 15c), porous spheres (Fig. 15d), bowknots (Fig. 15e),
dumbbells (Fig. 15f), needles (Fig. 15g), sheets (Fig. 15h), self-assembled nanorods
(Fig. 15i), rosettes (Fig. 15j), and flakes (Fig. 15k), as shown in Fig. 15. Among these
morphologies, irregular spheres (Fig. 15a), spheres (Fig. 15b), flowers (Fig. 15c),
dumbbells (Fig. 15f), needles (Fig. 15g), sheets (Fig. 15h), self-assembled nanorods
(Fig. 15i), and flakes (Fig. 15k), are common shapes formed when synthesizing by
26
conventional chemical precipitation method based on reactions between reagents
containing calcium and phosphate in solvents.
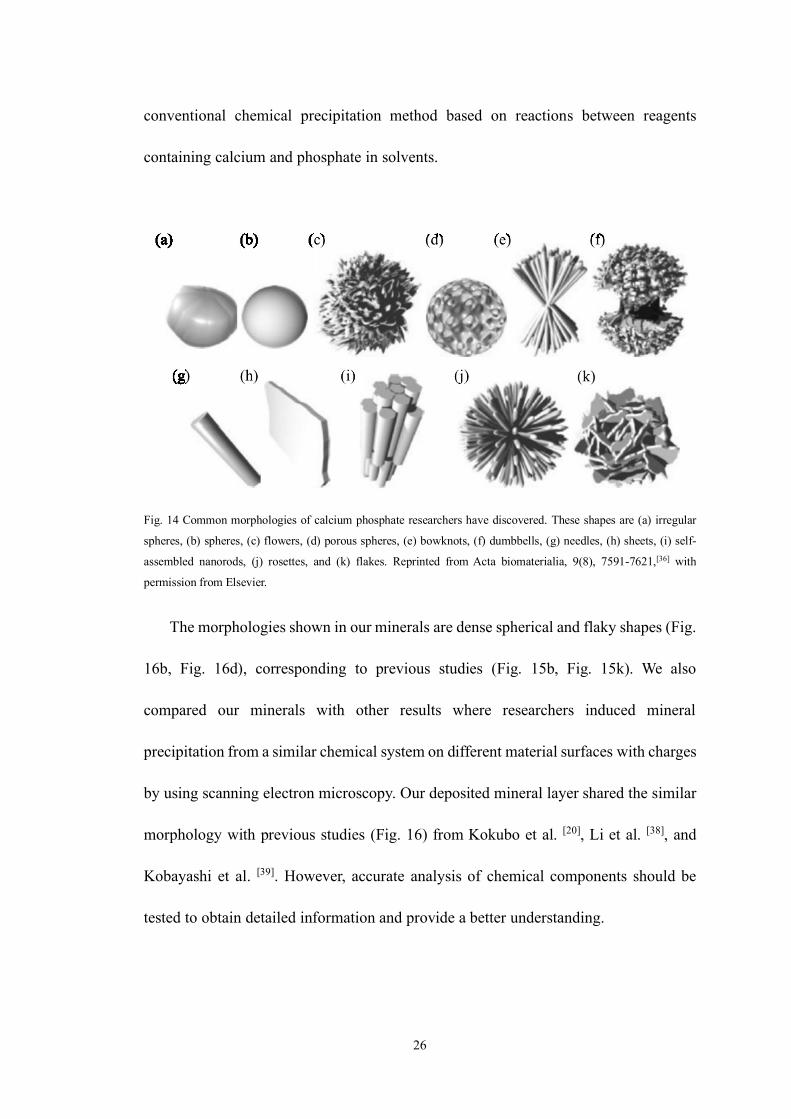
Fig. 14 Common morphologies of calcium phosphate researchers have discovered. These shapes are (a) irregular
spheres, (b) spheres, (c) flowers, (d) porous spheres, (e) bowknots, (f) dumbbells, (g) needles, (h) sheets, (i) self-
assembled nanorods, (j) rosettes, and (k) flakes. Reprinted from Acta biomaterialia, 9(8), 7591-7621,[36] with
permission from Elsevier.
The morphologies shown in our minerals are dense spherical and flaky shapes (Fig.
16b, Fig. 16d), corresponding to previous studies (Fig. 15b, Fig. 15k). We also
compared our minerals with other results where researchers induced mineral
precipitation from a similar chemical system on different material surfaces with charges
by using scanning electron microscopy. Our deposited mineral layer shared the similar
morphology with previous studies (Fig. 16) from Kokubo et al. [20], Li et al. [38], and
Kobayashi et al. [39]. However, accurate analysis of chemical components should be
tested to obtain detailed information and provide a better understanding.
27
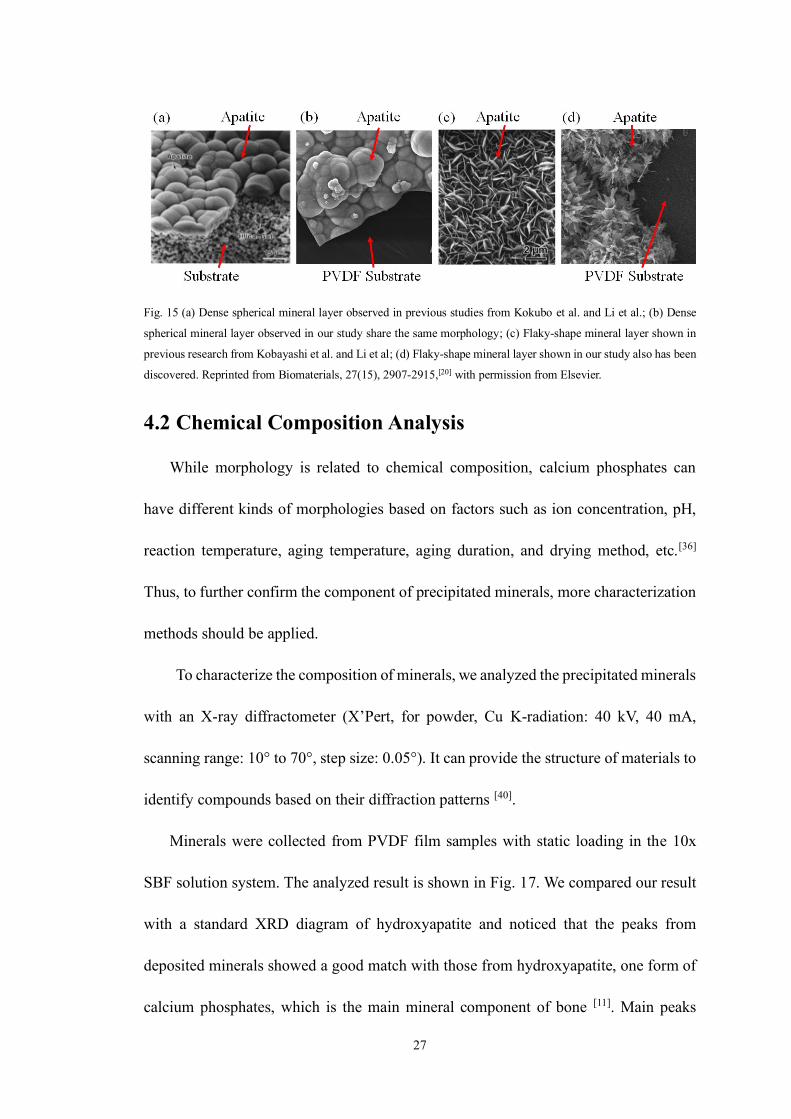
Fig. 15 (a) Dense spherical mineral layer observed in previous studies from Kokubo et al. and Li et al.; (b) Dense
spherical mineral layer observed in our study share the same morphology; (c) Flaky-shape mineral layer shown in
previous research from Kobayashi et al. and Li et al; (d) Flaky-shape mineral layer shown in our study also has been
discovered. Reprinted from Biomaterials, 27(15), 2907-2915,[20] with permission from Elsevier.
4.2 Chemical Composition Analysis
While morphology is related to chemical composition, calcium phosphates can
have different kinds of morphologies based on factors such as ion concentration, pH,
reaction temperature, aging temperature, aging duration, and drying method, etc.[36]
Thus, to further confirm the component of precipitated minerals, more characterization
methods should be applied.
To characterize the composition of minerals, we analyzed the precipitated minerals
with an X-ray diffractometer (X’Pert, for powder, Cu K-radiation: 40 kV, 40 mA,
scanning range: 10° to 70°, step size: 0.05°). It can provide the structure of materials to
identify compounds based on their diffraction patterns [40].
Minerals were collected from PVDF film samples with static loading in the 10x
SBF solution system. The analyzed result is shown in Fig. 17. We compared our result
with a standard XRD diagram of hydroxyapatite and noticed that the peaks from
deposited minerals showed a good match with those from hydroxyapatite, one form of
calcium phosphates, which is the main mineral component of bone [11]. Main peaks
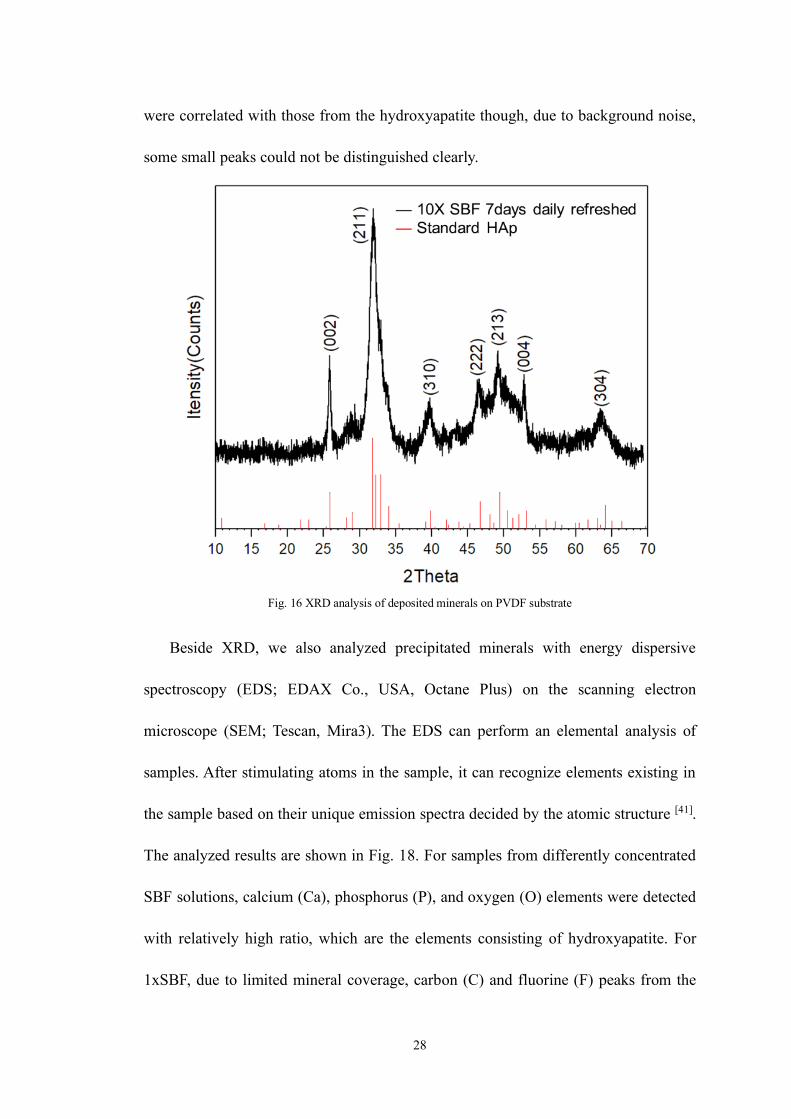
28
were correlated with those from the hydroxyapatite though, due to background noise,
some small peaks could not be distinguished clearly.
Fig. 16 XRD analysis of deposited minerals on PVDF substrate
Beside XRD, we also analyzed precipitated minerals with energy dispersive
spectroscopy (EDS; EDAX Co., USA, Octane Plus) on the scanning electron
microscope (SEM; Tescan, Mira3). The EDS can perform an elemental analysis of
samples. After stimulating atoms in the sample, it can recognize elements existing in
the sample based on their unique emission spectra decided by the atomic structure [41].
The analyzed results are shown in Fig. 18. For samples from differently concentrated
SBF solutions, calcium (Ca), phosphorus (P), and oxygen (O) elements were detected
with relatively high ratio, which are the elements consisting of hydroxyapatite. For
1xSBF, due to limited mineral coverage, carbon (C) and fluorine (F) peaks from the
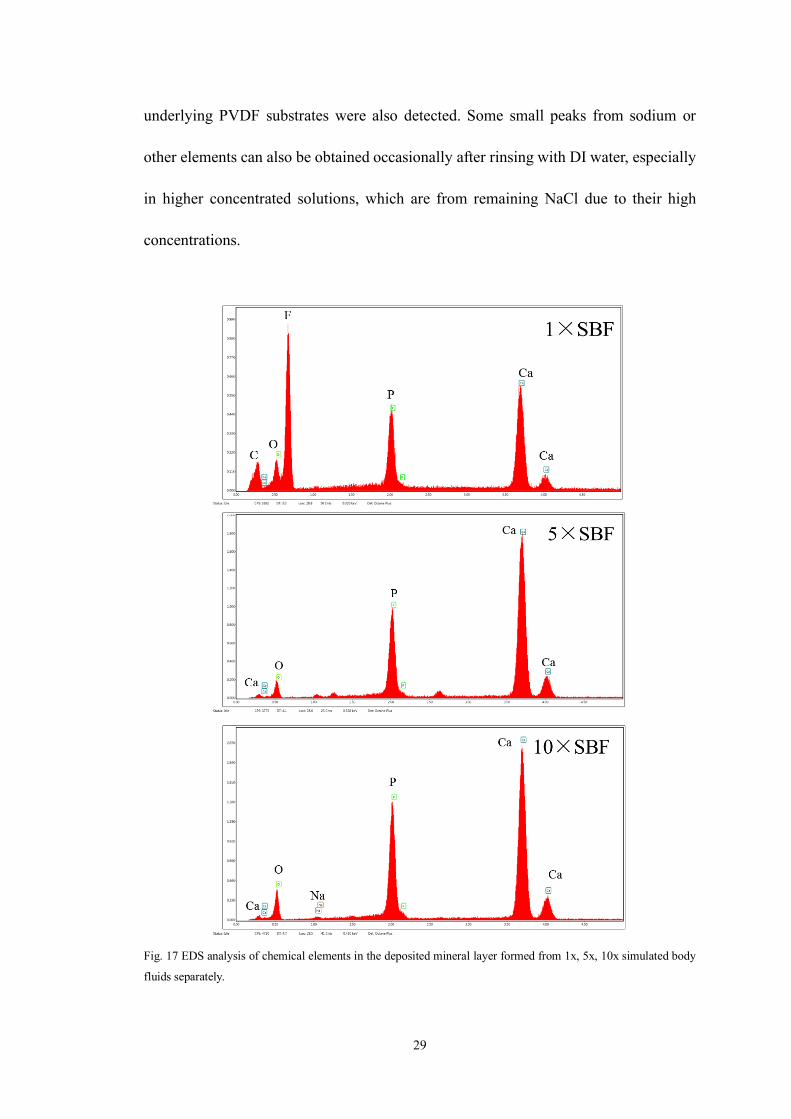
29
underlying PVDF substrates were also detected. Some small peaks from sodium or
other elements can also be obtained occasionally after rinsing with DI water, especially
in higher concentrated solutions, which are from remaining NaCl due to their high
concentrations.
Fig. 17 EDS analysis of chemical elements in the deposited mineral layer formed from 1x, 5x, 10x simulated body
fluids separately.
30
4.3 Testing Regeneration of Damaged Areas
We also tested the regeneration capability of the composite when damages appeared.
As the damaged regions expose the negative charges on the surface, the material system
might be able to repair damages by precipitating minerals on the damaged sites from
the SBF.
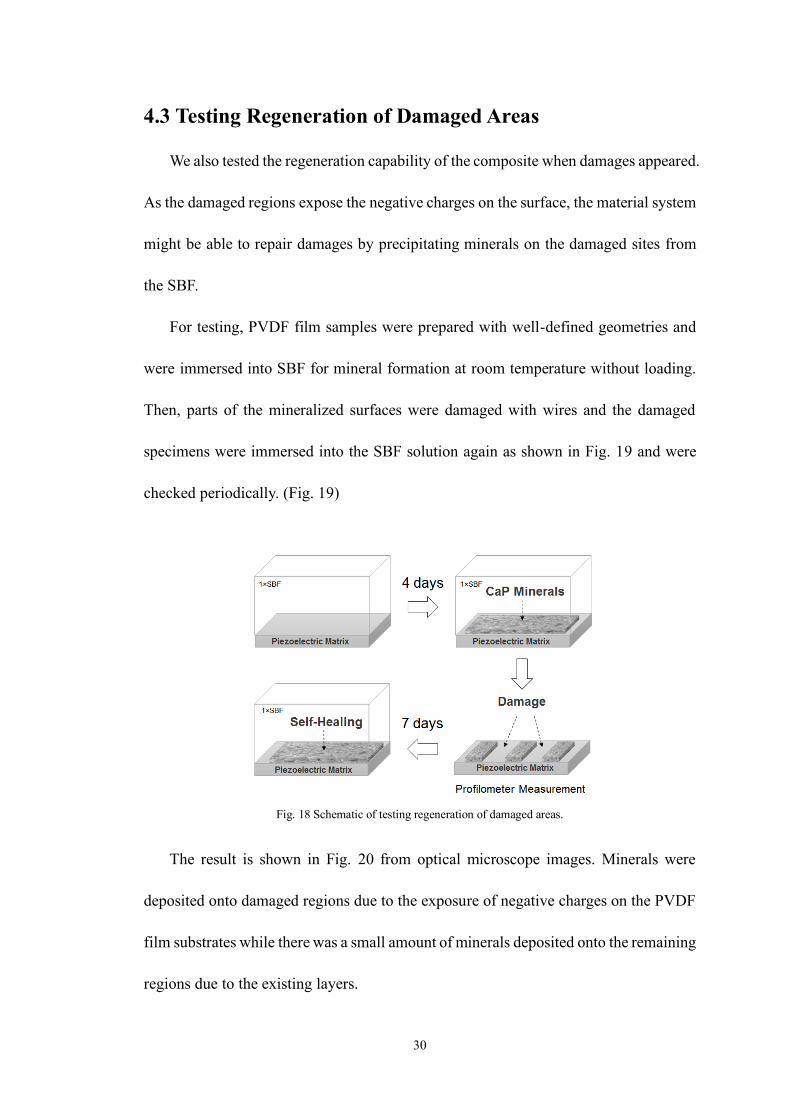
For testing, PVDF film samples were prepared with well-defined geometries and
were immersed into SBF for mineral formation at room temperature without loading.
Then, parts of the mineralized surfaces were damaged with wires and the damaged
specimens were immersed into the SBF solution again as shown in Fig. 19 and were
checked periodically. (Fig. 19)
Fig. 18 Schematic of testing regeneration of damaged areas.
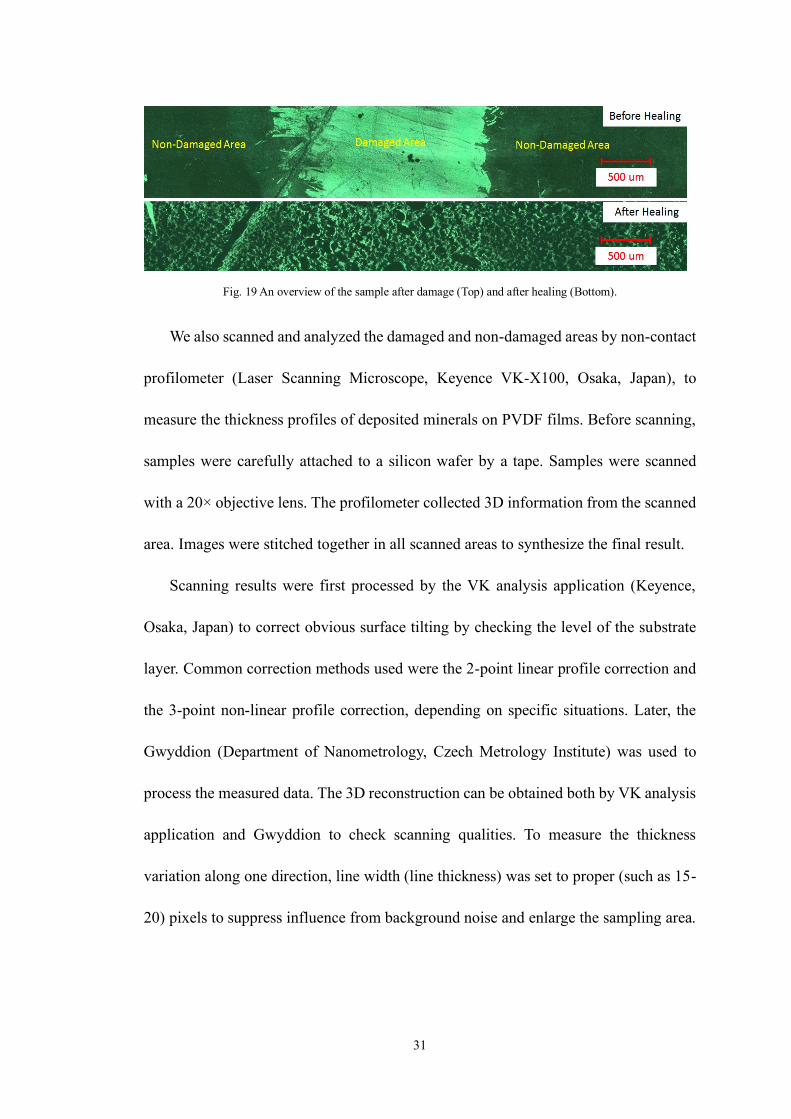
The result is shown in Fig. 20 from optical microscope images. Minerals were
deposited onto damaged regions due to the exposure of negative charges on the PVDF
film substrates while there was a small amount of minerals deposited onto the remaining
regions due to the existing layers.
31
Fig. 19 An overview of the sample after damage (Top) and after healing (Bottom).
We also scanned and analyzed the damaged and non-damaged areas by non-contact
profilometer (Laser Scanning Microscope, Keyence VK-X100, Osaka, Japan), to
measure the thickness profiles of deposited minerals on PVDF films. Before scanning,
samples were carefully attached to a silicon wafer by a tape. Samples were scanned
with a 20× objective lens. The profilometer collected 3D information from the scanned
area. Images were stitched together in all scanned areas to synthesize the final result.
Scanning results were first processed by the VK analysis application (Keyence,
Osaka, Japan) to correct obvious surface tilting by checking the level of the substrate
layer. Common correction methods used were the 2-point linear profile correction and
the 3-point non-linear profile correction, depending on specific situations. Later, the
Gwyddion (Department of Nanometrology, Czech Metrology Institute) was used to
process the measured data. The 3D reconstruction can be obtained both by VK analysis
application and Gwyddion to check scanning qualities. To measure the thickness
variation along one direction, line width (line thickness) was set to proper (such as 15-
20) pixels to suppress influence from background noise and enlarge the sampling area.
32
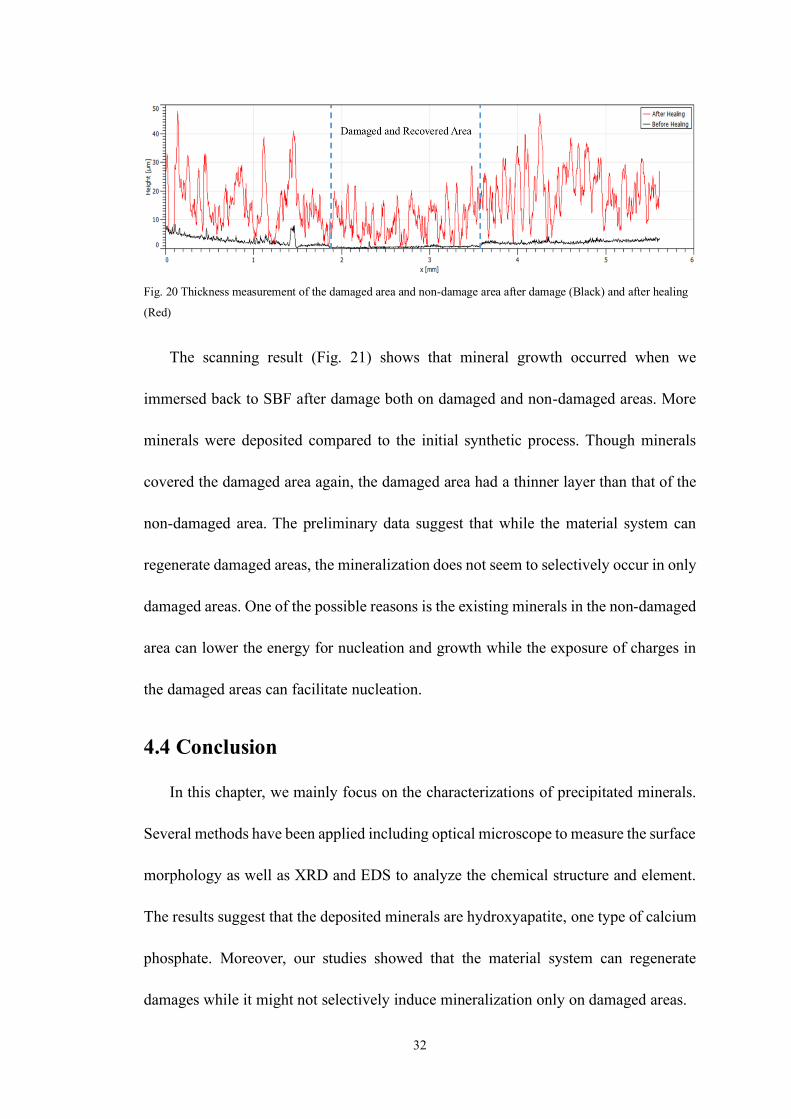
Fig. 20 Thickness measurement of the damaged area and non-damage area after damage (Black) and after healing
(Red)
The scanning result (Fig. 21) shows that mineral growth occurred when we
immersed back to SBF after damage both on damaged and non-damaged areas. More
minerals were deposited compared to the initial synthetic process. Though minerals
covered the damaged area again, the damaged area had a thinner layer than that of the
non-damaged area. The preliminary data suggest that while the material system can
regenerate damaged areas, the mineralization does not seem to selectively occur in only
damaged areas. One of the possible reasons is the existing minerals in the non-damaged
area can lower the energy for nucleation and growth while the exposure of charges in
the damaged areas can facilitate nucleation.
4.4 Conclusion
In this chapter, we mainly focus on the characterizations of precipitated minerals.
Several methods have been applied including optical microscope to measure the surface
morphology as well as XRD and EDS to analyze the chemical structure and element.
The results suggest that the deposited minerals are hydroxyapatite, one type of calcium
phosphate. Moreover, our studies showed that the material system can regenerate
damages while it might not selectively induce mineralization only on damaged areas.
33
Chapter 5
Conclusion and Future Work
5.1 Summary of Current Work
Based on previous findings that negatively charged scaffolds serve as templates for
mineral formation from the medium with ions by attracting positive mineral ions, we
demonstrated the regeneration capability of our bioinspired composites after a series of
studies related to inducing mineralization from simulated body fluids (SBF) on the
surface of PVDF film.
Firstly, we studied the piezoelectricity of PVDF film under compression,
mimicking a mechanical situation when damage was applied. The PVDF samples we
prepared showed their d33 values at a range around 20pC/N to 35pC/N, which is close
to the reference value provided by the manufacturer, 33pC/N. We then studied the
influence of SBF on mineral deposition thickness with 1xSBF, 5xSBF, and 10xSBF.
Our results showed that more minerals can be deposited from highly concentrated SBF.
We examined the precipitated minerals mainly by XRD and EDS, and the analysis
34
results indicated that the deposited minerals are hydroxyapatite, one form of calcium
phosphate, which is the main inorganic materials in bones. We finally explored the
regeneration capability of our bioinspired composite and noticed that the damaged
mineral layer on the negatively charged surface of PVDF film was recovered after re-
immersing into simulated body fluids. The result seems to be consistent with our
hypothesis that the damage of the mineralized scaffold will expose underlying negative
charges so that it can provide “signals” for inducing mineral deposition, thus repairing
the damaged mineral layer.
5.2 Future Work
There are still many aspects to study in the future. In terms of the mechanism, we
still do not have a straightforward method to observe and monitor the beginning of
mineral deposition for verifying our mechanism based on nucleation and growth. In the
future, a cryo-SEM could be used to observe frozen samples at different time points
from the mineralization process, followed by EDS analysis on the frozen cross-section
of the solution, to obtain the distribution of chemical elements in SBF.
Besides, when studying regeneration capability, we also noticed that there is a
mineral growth in the non-damaged area, and it seems that there still has a thickness
difference after recovery. More quantitative studies should be conducted to measure the
thickness increase per day and analyze the deposition rate on the damaged and non-
damaged area from the beginning of regeneration.
In the future, it is also necessary to combine biocompatibility with previously
studied materials with regeneration capability for future medical implants because some
35
of these materials can have unique performance during regeneration, such as preventing
crack expansion, the high recovery rate in mechanical properties, etc.
5.3 Perspectives of Our Bioinspired Composite
We envision that the findings from our research can contribute to new strategies for
various areas including coatings for medical implants, teeth/bone remineralization, and
scaffolds. Since our regeneration strategy is based on a biocompatible environment, the
recovery process does not contain cytotoxic materials and does not require extreme
conditions where an organism cannot survive. Another benefit is that materials with
regeneration ability can lower the cost and risk for maintenance and simplify the
repairing process, especially for medical implants. Moreover, since bioinspired
composites with regeneration ability do not rely on a biological process, they could be
suitable for many uses.
36
Bibliography
[1] Ferguson, C. (2006). Historical Introduction to the Development of
Material Science and Engineering as a teaching discipline. available from
the UKCME at http://www. materials. ac. uk/pub/Materials-History-lntro.
pdf.
[2] Cohen, M. (1974). Materials and Man's Needs. Summary Report of the
Committee on the Survey of Materials Science and Engineering,
Washington: National Academy of Science.
[3] Wegst, U. G., Bai, H., Saiz, E., Tomsia, A. P., & Ritchie, R. O. (2015).
Bioinspired structural materials. Nature materials, 14(1), 23.
[4] Patrick, J. F., Robb, M. J., Sottos, N. R., Moore, J. S., & White, S. R. (2016).
Polymers with autonomous life-cycle control. Nature, 540(7633), 363-370.
[5] EPA, U. (2019). Advancing sustainable materials management: 2017 fact
sheet.
[6] Blaiszik, B. J., Kramer, S. L., Olugebefola, S. C., Moore, J. S., Sottos, N.
37
R., & White, S. R. (2010). Self-healing polymers and composites. Annual
review of materials research, 40, 179-211.
[7] White, S. R., Sottos, N. R., Geubelle, P. H., Moore, J. S., Kessler, M.,
Sriram, S. R., ... & Viswanathan, S. (2001). Autonomic healing of polymer
composites. Nature, 409(6822), 794.
[8] Pang, J. W. C., & Bond, I. P. (2005). ‘Bleeding composites’—damage
detection and self-repair using a biomimetic approach. Composites Part A:
Applied Science and Manufacturing, 36(2), 183-188.
[9] Chen, X., Dam, M. A., Ono, K., Mal, A., Shen, H., Nutt, S. R., ... & Wudl,
F. (2002). A thermally re-mendable cross-linked polymeric material.
Science, 295(5560), 1698-1702.
[10] Li, C. H., Wang, C., Keplinger, C., Zuo, J. L., Jin, L., Sun, Y., ... & You,
X. Z. (2016). A highly stretchable autonomous self-healing elastomer.
Nature chemistry, 8(6), 618.
[11] Feng, X. (2009). Chemical and biochemical basis of cell-bone matrix
interaction in health and disease. Current chemical biology, 3(2), 189-196
[12] Bassett, C. A. L. (1967). Biologic significance of piezoelectricity.
Calcified tissue research, 1(1), 252-272.
[13] Noris-Suárez, K., Lira-Olivares, J., Ferreira, A. M., Feijoo, J. L., Suárez,
N., Hernández, M. C., & Barrios, E. (2007). In vitro deposition of
hydroxyapatite on cortical bone collagen stimulated by deformation-
induced piezoelectricity. Biomacromolecules, 8(3), 941-948.
38
[14] Rajabi, A. H., Jaffe, M., & Arinzeh, T. L. (2015). Piezoelectric materials
for tissue regeneration: A review. Acta biomaterialia, 24, 12-23.
[15] Yamashita, K., Oikawa, N., & Umegaki, T. (1996). Acceleration and
deceleration of bone-like crystal growth on ceramic hydroxyapatite by
electric poling. Chemistry of materials, 8(12), 2697-2700.
[16] An, J., Leeuwenburgh, S., Wolke, J., & Jansen, J. (2016). Mineralization
processes in hard tissue: bone. In Biomineralization and Biomaterials (pp.
129-146). Woodhead Publishing.
[17] Liu, X., Ding, C., & Wang, Z. (2001). Apatite formed on the surface of
plasma-sprayed wollastonite coating immersed in simulated body fluid.
Biomaterials, 22(14), 2007-2012.
[18] Navarro, M., & Serra, T. (2016). Biomimetic mineralization of ceramics
and glasses. In Biomineralization and Biomaterials (pp. 315-338).
Woodhead Publishing.
[19] Kokubo, T., Kushitani, H., Sakka, S., Kitsugi, T., & Yamamuro, T. (1990).
Solutions able to reproduce in vivo surface‐structure changes in bioactive
glass‐ceramic A‐W3. Journal of biomedical materials research, 24(6), 721-
734.
[20] Kokubo, T., & Takadama, H. (2006). How useful is SBF in predicting in
vivo bone bioactivity?. Biomaterials, 27(15), 2907-2915.
[21] Yang, F., Wolke, J. G. C., & Jansen, J. A. (2008). Biomimetic calcium
phosphate coating on electrospun poly (ɛ-caprolactone) scaffolds for bone
39
tissue engineering. Chemical Engineering Journal, 137(1), 154-161.
[22] Chou, Y. F., Chiou, W. A., Xu, Y., Dunn, J. C., & Wu, B. M. (2004). The
effect of pH on the structural evolution of accelerated biomimetic apatite.
Biomaterials, 25(22), 5323-5331.
[23] Dove, P. M., De Yoreo, J. J., & Weiner, S. (2003). Biomineralization,
Mineralogical Society of America. Washington, DC.
[24] APC International, Ltd. (2002). Piezoelectric ceramics: principles and
applications. APC International.
[25] Jaffe, B. (2012). Piezoelectric ceramics (Vol. 3). Elsevier.
[26] Tong, C. (2019). Introduction to Materials for Advanced Energy Systems.
Springer.
[27] Martins, P., Lopes, A. C., & Lanceros-Mendez, S. (2014). Electroactive
phases of poly (vinylidene fluoride): Determination, processing and
applications. Progress in polymer science, 39(4), 683-706.
[28] Liu, F., Abed, M. M., & Li, K. (2011). Preparation and characterization of
poly (vinylidene fluoride)(PVDF) based ultrafiltration membranes using
nano γ-Al2O3. Journal of membrane science, 366(1-2), 97-103.
[29] Safarpour, M., Khataee, A., & Vatanpour, V. (2014). Preparation of a novel
polyvinylidene fluoride (PVDF) ultrafiltration membrane modified with
reduced graphene oxide/titanium dioxide (TiO2) nanocomposite with
enhanced hydrophilicity and antifouling properties. Industrial &
Engineering Chemistry Research, 53(34), 13370-13382.
40
[30] Barooghi, B., Sheikhi, M., & Amiri, A. (2018). Effect of nano-
hydroxyapatite and duty cycle on the structure and corrosion performance
of plasma electrolyte oxidation coatings in simulated body fluid on Ti–6Al–
4 V. Proceedings of the Institution of Mechanical Engineers, Part C: Journal
of Mechanical Engineering Science, 232(23), 4229-4236.
[31] N. Soin, S.C. Anand, T.H. Shah, 12 - Energy harvesting and storage
textiles, Editor(s): A. Richard Horrocks, Subhash C. Anand, Handbook of
Technical Textiles (Second Edition), Woodhead Publishing, 2016, Pages
357-396, ISBN 9781782424659, https://doi.org/10.1016/B978-1-78242-
465-9.00012-4.
[32] Stewart, M., & Cain, M. G. (2014). Direct piezoelectric measurement: The
berlincourt method. In Characterisation of Ferroelectric Bulk Materials and
Thin Films (pp. 37-64). Springer, Dordrecht.
[33] Stewart, M., Battrick, W., & Cain, M. G. (2001). Measuring piezoelectric
d33 coefficents using the direct method.
[34] Hata, K., Kokubo, T., Nakamura, T., & Yamamuro, T. (1995). Growth of
a bonelike apatite layer on a substrate by a biomimetic process. Journal of
the American Ceramic Society, 78(4), 1049-1053.
[35] Stoll, V. S., & Blanchard, J. S. (1990). [4] Buffers: Principles and practice.
In Methods in enzymology (Vol. 182, pp. 24-38). Academic Press.
[36] Sadat-Shojai, M., Khorasani, M. T., Dinpanah-Khoshdargi, E., & Jamshidi,
A. (2013). Synthesis methods for nanosized hydroxyapatite with diverse
41
structures. Acta biomaterialia, 9(8), 7591-7621.
[37] Dorozhkin, S. V. (2016). Calcium orthophosphates (CaPO 4): occurrence
and properties. Progress in Biomaterials, 5(1), 9-70.
[38] Kobayashi, T., Ono, S., Hirakura, S., Oaki, Y., & Imai, H. (2012).
Morphological variation of hydroxyapatite grown in aqueous solution
based on simulated body fluid. CrystEngComm, 14(3), 1143-1149.
[39] Li, N. B., Xu, W. H., Zhao, J. H., Xiao, G. Y., & Lu, Y. P. (2018). The
significant influence of ionic concentrations and immersion temperatures
on deposition behaviors of hydroxyapatite on alkali-and heat-treated
titanium in simulated body fluid. Thin Solid Films, 646, 163-172.
[40] Hanawalt, J. D., Rinn, H. W., & Frevel, L. K. (1938). Chemical analysis
by X-ray diffraction. Industrial & Engineering Chemistry Analytical
Edition, 10(9), 457-512.
[41] Ebnesajjad, S., & Ebnesajjad, C. (2013). Surface treatment of materials
for adhesive bonding. William Andrew.
[42] Moheimani, S. R., & Fleming, A. J. (2006). Fundamentals of
piezoelectricity. Piezoelectric transducers for vibration control and
damping, 9-35.
[43] Mishra, S., Unnikrishnan, L., Nayak, S. K., & Mohanty, S. (2019).
Advances in piezoelectric polymer composites for energy harvesting
applications: A systematic review. Macromolecular Materials and
Engineering, 304(1), 1800463.
42
Biography
Decheng Hou was born in 1994 in the People’s Republic of China.
Decheng did his undergraduate work at Tsinghua University, Beijing, China, where
he majored in Mechanical Engineering. During his undergraduate studies, he spent a
year designing a V-type mixer for Material Science Laboratory, a month in Pohang
University of Science and Technology learning microfabrication and lab-on-a-chip for
cells, and another year in biofabrication of a contractile and highly elastic vessel-like
structure as his graduation project. He also joined Zhangli Peng’s group at the
University of Notre Dame as a research assistant in the International Student Research
Experience (iSURE) Program in the summer of 2016, studying multiscale modeling of
cells.
In 2017, Decheng began his master at Johns Hopkins University. He was a teaching
assistant for Profs. Steven P. Marra’s Thermal Dynamic Lab class and Sung H. Kang’s
Fabricatology class, and a research assistant in the Hopkins Extreme Materials Institute
(HEMI).
Related Documents